march 2016 torrance real estate market trends update
TRANSCRIPT

Table of
Contents
Key Statistics for March
Sales 2016 Residential Sales Stats Year-to-Year Total Sales by Map Area Median 2016 Median Sales Stats Year-to-Year Median Sales by Map Area Listings 2016 Active Listings by Map Area 2016 Total Active Listings vs. Total Sales Year-to-Year Active Listings by Map Area Inventory 2016 Months of Inventory by Map Area Year-to-Year Months of Inventory
Summary
About Hady Chahine Contact Information

Key Statistics for March
Back to Table of Contents
= trending positive = trending positive
= trending negative = trending negative
Month-to-Month Comparison Feb 2016 Mar 2016 Delta (qty) Delta (%) Increase Decrease
Total Sales 60 89 29 48.3%
Median Sales Price 621,250 675,000 53,750 8.7%
Median Days to Sell 37 35 -2 -5.4%
Listings 192 177 -15 -7.8%
Sales/Listing Ratio 31.3% 50.3% 19.0% 60.7%
Months of Inventory 3.0 2.0 -1.0 -33.3%
Monthly Comparison Year-to-Year Mar 2015 Mar 2016 Delta Delta Increase Decrease
Total Sales 79 89 10 12.7%
Median Sales Price 620,000 675,000 55,000 8.9%
Median Days to Sell 37 35 -2 -5.4%
Listings 194 177 -17 -8.8%
Months of Inventory 2.0 2.0 0 0.0%
Back to Table of Contents
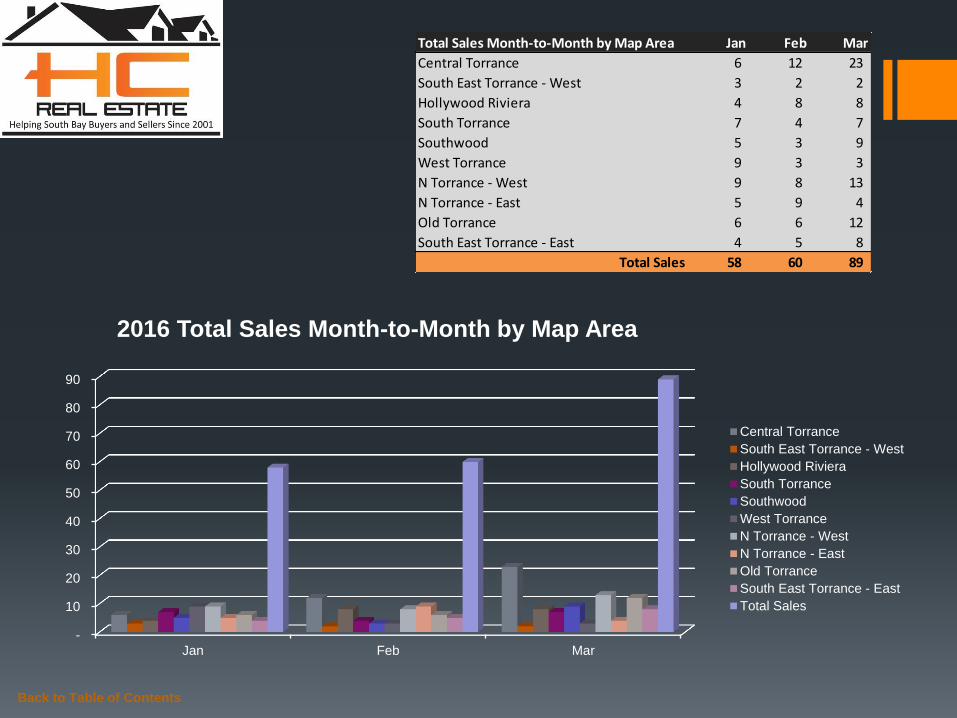
Total Sales Month-to-Month by Map Area Jan Feb Mar
Central Torrance 6 12 23
South East Torrance - West 3 2 2
Hollywood Riviera 4 8 8
South Torrance 7 4 7
Southwood 5 3 9
West Torrance 9 3 3
N Torrance - West 9 8 13
N Torrance - East 5 9 4
Old Torrance 6 6 12
South East Torrance - East 4 5 8
Total Sales 58 60 89
-
10
20
30
40
50
60
70
80
90
Jan Feb Mar
2016 Total Sales Month-to-Month by Map Area
Central Torrance
South East Torrance - West
Hollywood Riviera
South Torrance
Southwood
West Torrance
N Torrance - West
N Torrance - East
Old Torrance
South East Torrance - East
Total Sales

Back to Table of Contents
Total Sales Year-to-Year by Map Area 2014 2015 2016
Central Torrance 10 12 23
South East Torrance - West 6 9 2
Hollywood Riviera 6 13 8
South Torrance 7 1 7
Southwood 4 3 9
West Torrance 7 3 3
N Torrance - West 12 11 13
N Torrance - East 8 8 4
Old Torrance 7 12 12
South East Torrance - East 11 7 8
Total Sales 78 79 89
-
10
20
30
40
50
60
70
80
90
2014 2015 2016
Total Sales Year-to-Year by Map Area: March
Central Torrance
South East Torrance - West
Hollywood Riviera
South Torrance
Southwood
West Torrance
N Torrance - West
N Torrance - East
Old Torrance
South East Torrance - East
Total Sales

Back to Table of Contents
Median Sales Price Month-to-Month by Map Area Jan Feb Mar
Central Torrance 592,500 565,000 645,000
South East Torrance - West 911,700 766,000 397,450
Hollywood Riviera 1,222,500 1,002,500 873,000
South Torrance 730,000 742,500 920,000
Southwood 770,000 755,000 850,000
West Torrance 959,900 1,050,000 940,000
N Torrance - West 565,000 599,000 629,990
N Torrance - East 632,000 555,000 625,000
Old Torrance 592,500 612,450 579,450
South East Torrance - East 730,000 600,000 667,500
Market Median Sales Price 692,500 621,250 675,000
-
200,000
400,000
600,000
800,000
1,000,000
1,200,000
1,400,000
Jan Feb Mar
2016 Median Sales Price Month-to-Month by Map Area
Central Torrance
South East Torrance - West
Hollywood Riviera
South Torrance
Southwood
West Torrance
N Torrance - West
N Torrance - East
Old Torrance
South East Torrance - East
Market Median Sales Price

Back to Table of Contents
Median Sales Price Year-to-Year by Map Area 2014 2015 2016
Central Torrance 492,450 736,500 645,000
South East Torrance - West 771,500 445,000 397,450
Hollywood Riviera 1,099,663 995,000 873,000
South Torrance 775,000 683,550 920,000
Southwood 554,450 765,000 850,000
West Torrance 696,000 1,002,000 940,000
N Torrance - West 558,500 607,500 629,990
N Torrance - East 535,250 527,500 625,000
Old Torrance 438,000 532,000 579,450
South East Torrance - East 650,000 615,000 667,500
Market Median Sales Price 592,250 620,000 675,000
-
200,000
400,000
600,000
800,000
1,000,000
1,200,000
2014 2015 2016
Median Sales Price Year-to-Year by Map Area: March
Central Torrance
South East Torrance - West
Hollywood Riviera
South Torrance
Southwood
West Torrance
N Torrance - West
N Torrance - East
Old Torrance
South East Torrance - East
Market Median Sales Price

Back to Table of Contents
Active Listings vs. Total Sales by Map Area Jan Feb Mar Apr May Jun Jul Aug Sep Oct Nov Dec
Central Torrance 24 25 23
South East Torrance - West 12 18 14
Hollywood Riviera 18 22 14
South Torrance 10 15 17
Southwood 11 14 12
West Torrance 4 10 14
N Torrance - West 27 33 23
N Torrance - East 13 18 17
Old Torrance 20 24 28
South East Torrance - East 12 13 15
Total Active Listings 151 192 177
-
5
10
15
20
25
30
35
Jan Feb Mar Apr May Jun Jul Aug Sep Oct Nov Dec
2016 Active Listings by Map Area
Central Torrance
South East Torrance - West
Hollywood Riviera
South Torrance
Southwood
West Torrance
N Torrance - West
N Torrance - East
Old Torrance
South East Torrance - East

Back to Table of Contents
Active Listings vs. Total Sales by Map Area Jan Feb Mar Apr May Jun Jul Aug Sep Oct Nov Dec
Central Torrance 24 25 23
South East Torrance - West 12 18 14
Hollywood Riviera 18 22 14
South Torrance 10 15 17
Southwood 11 14 12
West Torrance 4 10 14
N Torrance - West 27 33 23
N Torrance - East 13 18 17
Old Torrance 20 24 28
South East Torrance - East 12 13 15
Total Active Listings 151 192 177
Total Sales 58 60 89
Sales/Listings Ratio 38.4% 31.3% 50.3%
-
20
40
60
80
100
120
140
160
180
200
Jan Feb Mar Apr May Jun Jul Aug Sep Oct Nov Dec
2016 Total Active Listings vs. Total Sales
Total Active Listings Total Sales

Back to Table of Contents
Active Listings Year-to-Year by Map Area 2014 2015 2016
Central Torrance 36 34 23
South East Torrance - West 9 13 14
Hollywood Riviera 21 19 14
South Torrance 19 21 17
Southwood 7 11 12
West Torrance 13 11 14
N Torrance - West 29 25 23
N Torrance - East 12 15 17
Old Torrance 22 25 28
South East Torrance - East 17 20 15
Total Active Listings 185 194 177
-
20
40
60
80
100
120
140
160
180
200
2014 2015 2016
Active Listings Year-to-Year by Map Area: March
Central Torrance
South East Torrance - West
Hollywood Riviera
South Torrance
Southwood
West Torrance
N Torrance - West
N Torrance - East
Old Torrance
South East Torrance - East
Total Active Listings

Back to Table of Contents
Months of Inventory by Map Area Jan Feb Mar Apr May Jun Jul Aug Sep Oct Nov Dec
Central Torrance 4.0 2.0 1.0
South East Torrance - West 4.0 9.0 7.0
Hollywood Riviera 5.0 3.0 2.0
South Torrance 1.0 4.0 2.0
Southwood 2.0 5.0 1.0
West Torrance - 3.0 5.0
N Torrance - West 3.0 4.0 2.0
N Torrance - East 3.0 2.0 4.0
Old Torrance 3.0 4.0 2.0
South East Torrance - East 3.0 3.0 2.0
-
1.0
2.0
3.0
4.0
5.0
6.0
7.0
8.0
9.0
Jan Feb Mar Apr May Jun Jul Aug Sep Oct Nov Dec
2016 Months of Inventory by Map Area
Central Torrance
South East Torrance - West
Hollywood Riviera
South Torrance
Southwood
West Torrance
N Torrance - West
N Torrance - East
Old Torrance
South East Torrance - East

Back to Table of Contents
Months of Inventory Year-to-Year Jan Feb Mar Apr May Jun Jul Aug Sep Oct Nov Dec
2014 3.0 2.0 2.0 3.0 2.0 4.0 2.0 2.0 3.0 2.0 3.0 2.0
2015 4.0 3.0 2.0 2.0 2.0 2.0 2.0 2.0 3.0 3.0 3.0 1.0
2016 3.0 3.0 2.0
-
0.5
1.0
1.5
2.0
2.5
3.0
3.5
4.0
Jan Feb Mar Apr May Jun Jul Aug Sep Oct Nov Dec
Months of Inventory Year-to-Year
2014
2015
2016
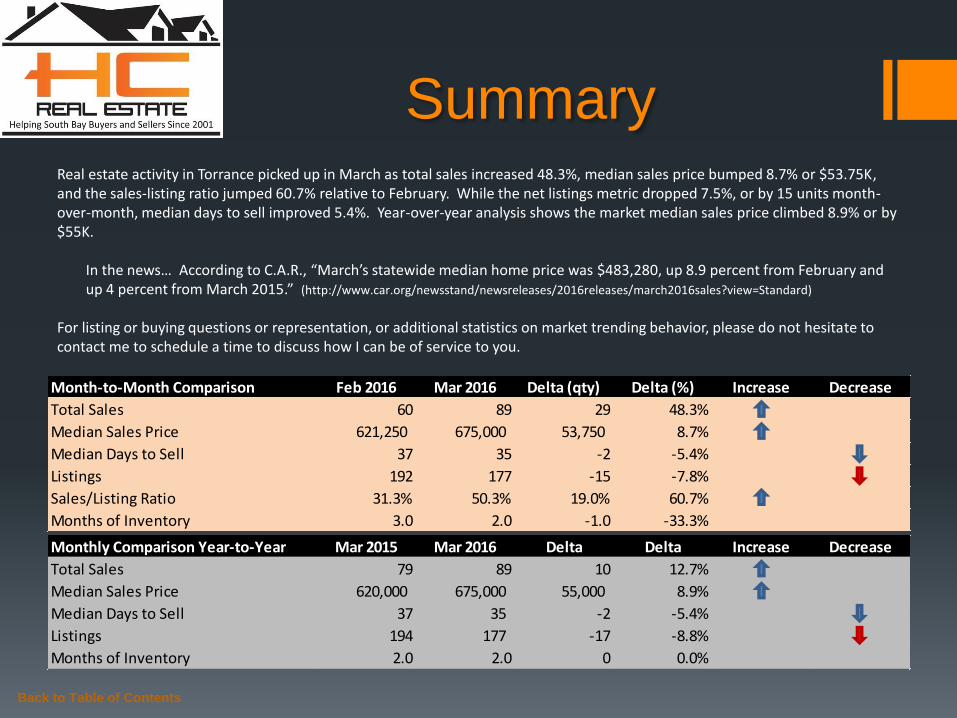
Summary Real estate activity in Torrance picked up in March as total sales increased 48.3%, median sales price bumped 8.7% or $53.75K, and the sales-listing ratio jumped 60.7% relative to February. While the net listings metric dropped 7.5%, or by 15 units month-over-month, median days to sell improved 5.4%. Year-over-year analysis shows the market median sales price climbed 8.9% or by $55K.
In the news… According to C.A.R., “March’s statewide median home price was $483,280, up 8.9 percent from February and up 4 percent from March 2015.” (http://www.car.org/newsstand/newsreleases/2016releases/march2016sales?view=Standard)
For listing or buying questions or representation, or additional statistics on market trending behavior, please do not hesitate to contact me to schedule a time to discuss how I can be of service to you.
Back to Table of Contents
Monthly Comparison Year-to-Year Mar 2015 Mar 2016 Delta Delta Increase Decrease
Total Sales 79 89 10 12.7%
Median Sales Price 620,000 675,000 55,000 8.9%
Median Days to Sell 37 35 -2 -5.4%
Listings 194 177 -17 -8.8%
Months of Inventory 2.0 2.0 0 0.0%
Month-to-Month Comparison Feb 2016 Mar 2016 Delta (qty) Delta (%) Increase Decrease
Total Sales 60 89 29 48.3%
Median Sales Price 621,250 675,000 53,750 8.7%
Median Days to Sell 37 35 -2 -5.4%
Listings 192 177 -15 -7.8%
Sales/Listing Ratio 31.3% 50.3% 19.0% 60.7%
Months of Inventory 3.0 2.0 -1.0 -33.3%

Back to Table of Contents
Serving South Bay Home Buyers and Sellers Since 2001
RE/MAX Top 4 Team in California – 2012
RE/MAX 100% Club - 2011
Shorewood Realtors Top 5% in Overall Sales 2001-2006, 2008-2010
About
Hady Chahine…

The information being provided by CARETS (CLAW, CRISNet MLS, DAMLS, CRMLS, i-Tech MLS, and/or VCRDS) is for the visitor’s personal, non-commercial use and may not be used for
any purpose other than to identify prospective properties visitor may be interested in purchasing. Any information relating to a property referenced on this web site comes from the Internet
Data Exchange (IDX) program of CARETS. This web site may reference real estate listing(s) held by a brokerage firm other than the broker and/or agent who owns this web site. The accuracy
of all information, regardless of source, including but not limited to square footages and lot sizes, is deemed reliable but not guaranteed and should be personally verified through personal
inspection by and/or with the appropriate professionals.
Back to Table of Contents
Listings MLS BLOG Website
Hady Chahine
• 310-404-5361