n a tional b ank of e national bank of ethiopia
TRANSCRIPT

National Bank of Ethiopia
Quarterly Bulletin First Quarter 2018/19
Fiscal Year Series
Volume 35 No. 1
Addis Ababa2019
National Bank of Ethiopia Q
uarterly Bulletin Volume 35, N
o. 1
39

National Bank of Ethiopia Quarterly Bulletin
NatioNal BaNk of Ethiopia
Quarterly Bulletin
Volume 35, No. 1first Quarter 2018/19fiscal Year Series
addis ababa 2019

National Bank of Ethiopia Quarterly Bulletin
table of Contents pages
Ethiopia: Macroeconomic and Social Indicators-------------------------------------------------------------------i
i. overview------------------------------------------------------------------------------------------------------------1
1.1: International Economic Developments -------------------------------------------------------------------1
1.2: Macroeconomic Developments in Ethiopia--------------------------------------------------------------1
ii. Energy production and processing------------------------------------------------------------------------4
2.1: Import of Petroleum Products---------------------------------------------------------------------------------4
2.2: Electric Power Generation--------------------------------------------------------------------------------------7
iii. Quarterly price Developments---------------------------------------------------------------------------- 9
3.1: Developments in National CPI------------------------------------------------------------------------------- 9
3.2: Developments in Regional CPI ------------------------------------------------------------------------------ 11
iV. Monetary Developments----------------------------------------------------------------------------------- 13
4.1: Money Supply and Credit---------------------------------------------------------------------------------------13
4.2: Developments in Reserve Money and Monetary Ratio-------------------------------------------------15
4.3: Interest Rate Developments -----------------------------------------------------------------------------------17
4.4: Developments in the Financial Sector----------------------------------------------------------------------- 19
4.5: Activities of the Banking System------------------------------------------------------------------------------21
4.5.1: Resource Mobilization-----------------------------------------------------------------------------------21
4.5.1.1: Deposit Mobilization --------------------------------------------------------------------------------------22
4.5.1.2: Collection of Loans -----------------------------------------------------------------------------------------23
4.5.1.3: Borrowing -----------------------------------------------------------------------------------------------------23
4.5.2: Disbursement of Fresh Loans ---------------------------------------------------------------------------23
4.5.3: Outstanding Credit ---------------------------------------------------------------------------------------24
4.6: Financial Activities of NBE --------------------------------------------------------------------------------------25
4.7: Developments in Financial Markets ----------------------------------------------------------------------26
4.7.1: Treasury Bills Market -------------------------------------------------------------------------------------26
4.7.2: Inter-bank Money Market ------------------------------------------------------------------------------27
4.7.3: Corporate Bond Market----------------------------------------------------------------------------------27

National Bank of Ethiopia Quarterly Bulletin
V. External Sector Developments ---------------------------------------------------------------------------29
5.1: Balance of Payments -------------------------------------------------------------------------------29
5.2: Balance of Trade--------------------------------------------------------------------------------------31
5.2.1: Exports -------------------------------------------------------------------------------------------------- 31
5.2.2: Imports --------------------------------------------------------------------------------------------------34
5.2.3: Direction of Trade ------------------------------------------------------------------------------------36
5.2.3.1: Exports of goods ------------------------------------------------------------------------36
5.2.3.2: Imports of goods--------------------------------------------------------------------------36
5.3: Services and Transfers ----------------------------------------------------------------------------37
5.4: Current Account---------------------------------------------------------------------------------------39
5.5: Capital Account----------------------------------------------------------------------------------------39
5.6: Changes in Reserve Position ------------------------------------------------------------------39
5.7: Developments in Foreign Exchange Market-------------------------------------------39
5.7.1: Exchange Rate Movements -------------------------------------------------------39
5.7.2: Movements in the Real Effective Exchange Rate -----------------------43
5.7.3: Volume of Transactions --------------------------------------------------------------44
Vi. federal Government finance----------------------------------------------------------------------------45
6.1: Revenue and Grants-------------------------------------------------------------------------------------46
6.2: Expenditure------------------------------------------------------------------------------------------------48
6.3: Deficit Financing----------------------------------------------------------------------------------------49
Vii. Developments in investment--------------------------------------------------------------------------50
Viii. international Economic Developments ---------------------------------------------------------53
8.1: Overview of the World Economy -------------------------------------------------------------------53
8.2: Inflation Developments--------------------------------------------------------------------------------53
8.3: Commodity Price ---------------------------------------------------------------------------------------53
8.4: Exchange Rate Developments --------------------------------------------------------------------54
8.5: Impact of Global Economic Development on Ethiopian Economy-------------------54
StatiStiCal taBlES--------------------------------------------------------------------------------------------55
National Bank of Ethiopia Quarterly Bulletin
First Quarter 2018/19 i
Eth
iopi
a: M
aCR
oEC
oN
oM
iC a
ND
So
Cia
l iN
DiC
ato
RS
indi
cato
rs19
99/0
020
00/0
120
01/0
220
02/0
320
03/0
420
04/0
520
05/0
620
06/0
720
07/0
820
08/0
920
09/1
020
10/1
1 2
011/
12 2
012/
13 2
013/
14 2
014/
15 2
015/
16 2
016/
1720
17/1
8
(199
2)(1
993)
(199
4)(1
995)
(199
6)(1
997)
(199
8)(1
999)
(200
0)(2
001)
(200
2)(2
003)
(200
4)(2
005)
(200
6)(2
007)
(200
8)(2
009)
(201
0)
1. C
ount
ry p
rofil
e
L
and
Are
a (t
otal
, In
Sq.K
m)
1.14
mill
ion
1.14
mill
ion
1.14
mill
ion
1.14
mill
ion
1.14
mill
ion
1.14
mill
ion
1.14
mill
ion
1.14
mill
ion
1.14
mill
ion
1.14
mill
ion
1.1
4mill
ion
1.1
4 m
illio
n 1
.14
mill
ion
1.1
4 m
illio
n 1
.14
mill
ion
1.1
4 m
illio
n 1
.14
mill
ion
1.1
4 m
illio
n 1.
14 m
illio
n
Ara
ble
Land
( %
of t
otal
are
a )
45.0
45.0
45.0
45.0
45.0
45.0
45.0
45.0
45.0
45.0
45.
00
45.
00
45.
00
NA
N
A
NA
N
A
NA
N
A
Irrig
ated
Lan
d ( %
of t
otal
are
a )
3.0
3.0
3.0
3.0
3.0
3.0
3.0
3.0
3.0
3.0
NA
N
A
NA
N
A
NA
N
A
NA
N
A
NA
Pop
ulat
ion
Den
sity
( pe
rson
per
sq.
km )*
85.6
88.1
90.7
93.2
95.8
99.7
101.
299
.610
2.1
104.
7 1
07.4
0 1
10.1
4 1
12.9
4 1
15.7
6 1
18.6
1 1
21.5
0
2. S
ocia
l ind
icat
ors
Po
pula
tion
tota
l, in
mill
ions
(Mid
-Yea
r pop
ulat
ion)
60.0
061
.60
63.2
064
.80
66.5
068
.30
70.0
072
.40
74.9
076
.8 7
8.80
8
0.70
8
2.7
84.
8 8
7.0
89.
1 9
1.2
93.
4 9
5.5
(o
/w U
rban
Pou
latio
n, in
%)
14.9
15.1
15.3
315
.515
.815
.97
16.2
116
.45
1716
.14
16.
30
16.
10
16.
3 1
8.6
19.
0 1
9.5
19.
9 2
0.3
20.
8
W
orki
ng A
ge P
opul
atio
n ( I
n M
illio
ns )
Urb
an5.
66.
16.
46.
57
6.95
7.6
7.6
8.0
8.4
8.9
2 9
.43
10.
0 1
0.5
11.
1 1
1.6
12.
2 1
2.8
9
Rur
al
28.0
028
.829
.830
.54
31.4
32.6
33.2
32.9
31.3
33.0
33.
89
34.
83
35.
8 3
6.8
37.
7 3
8.7
39.
7 4
0.8
49
Tot
al
33.8
34.9
36.2
37.0
438
.439
.640
.740
.639
.341
.4 4
2.82
4
4.26
4
5.7
47.
3 4
8.8
50.
4 5
2.0
53.
6 5
7
A
ge D
epen
denc
y Ra
tio87
.887
.286
.086
.685
.284
.784
.384
.393
93 9
3.00
9
3.00
9
3.0
75.
0 7
5.0
75.
0 7
5.0
75.
0 6
9
L
ife E
xpec
tanc
y at
Birt
h ( M
ale
- Fem
ale
)50
.9-5
3.0
53.4
-55.
453
.4-5
5.4
53.4
-55.
453
-55
53.4
2-55
.42
55.6
-57.
955
.6-5
7.9
53.4
-55.
453
.4-5
5.4
53.
4-55
.4
58.
4-60
.4
53.
4-55
.4
60.
2-64
.2
60.
2-64
.2
60.
2-64
.2
60.
2-64
.2
60.
2-64
.2
62.
4-66
.6
C
rude
Birt
h Ra
te44
.2:1
,000
39.9
:1,0
0039
.9:1
,000
39.9
:1,0
0039
.9:1
,000
35.7
:1,0
0036
.9:1
,000
36.9
:1,0
0035
.7:1
,000
35.7
:100
0 3
5.7:
1000
3
3.6:
1000
3
3.6:
1000
3
0.3:
1000
3
0.3:
1000
3
0.3:
1000
3
0.3:
1000
3
0.3:
1000
2
7.0:
1000
C
rude
Dea
th R
ate
15:1
,000
12.6
:1,0
0012
.6:1
,000
12.6
:100
012
.6:1
000
12.6
:100
010
.8:1
,000
10.8
:1,0
0010
.8:1
,000
NA
NA
9
.2:1
,000
9
.2:1
,000
7
.2:1
000
7.2
:100
0 7
.2:1
000
7.2
:100
0 7
.2:1
000
6.3
:100
0
N
atur
al R
ate
of P
opul
atio
n In
crea
se (
In %
)2.
92.
72.
72.
72.
72.
72.
72.
72.
72.
7 2
.60
2.4
0 2
.40
2.3
1 2
.31
2.3
1 2
.31
2.3
1 2
.07
To
tal F
ertil
ity R
ate
6.5c
lild:
W5.
8chi
ld:W
5.8c
hild
:W5.
8chi
ld:W
5.8c
hild
:W5.
4chi
ld:W
5.4c
hild
:W5.
4chi
ld:W
5.4c
hild
:W5.
4chi
ld:W
5 c
hild
:W
4.8
child
:W
4.8
child
:W
3.9
4chi
l:W
3.9
4chi
l:W
3.9
4chi
l:W
3.9
4chi
l:W
3.9
4chi
l:W
3.4
5chi
l:W
P
eopl
e : H
ospi
tal B
eds
5,27
3:1
6,08
6.4:
157
40.4
:164
79.2
:157
21.4
:152
73.5
:150
28:1
5293
:156
98:1
5082
:1 7
815:
1 N
A
NA
2
516:
1 N
A
NA
28
50:1
2980
:136
17:1
P
eopl
e : P
hysi
cian
150
,273
.2:1
47,8
36.0
:135
604:
134
005.
136
954:
129
777:
135
493:
149
888:
136
374:
136
175:
1 5
6013
:1
536
42:1
2
8847
:1
321
32:1
2
0970
:1
171
60:1
1
4045
:1
227
66:1
2
6635
:1
P
eopl
e : N
urse
19,
458.
5:1
8,46
1.0:
152
36.0
:148
79:1
4621
:139
56.8
:142
06:1
4601
:145
24:1
3870
:1 3
012:
1 2
762:
1 2
299:
1 1
884:
1 1
995:
1 19
99:0
1:00
1999
:111
94:1
1780
:1
In
fant
Mor
talit
y Ra
te11
0:1,
000
97:1
,000
97:1
,001
97:1
,002
97:1
,003
80:1
,000
80:1
,000
80:1
,000
77:1
,000
77:1
,000
77:
1,00
0 7
3:10
00
59:
1000
6
2.2:
1000
6
2.4:
1000
6
2.4:
1000
6
2.4:
1000
6
2.4:
100
53.
3:10
00
A
cces
s to
Saf
e W
ater
( In
%)
Cou
ntry
Leve
l 30
.00
27.9
028
.4N
A35
.945
.647
.352
.559
.566
.2 6
8.50
7
3.30
5
8.3
68.
5 7
6.7
84.
0 6
1.0
66.
0 7
1.0
Urb
an P
opul
atio
n 72
.00
91.7
075
.7N
AN
.A82
NA
82.0
86.2
88.6
91.
50
92.
50
78.
7 8
1.3
84.
2 9
1.0
52.
5 5
5.0
60.
0
Rur
al P
opul
atio
n 24
.00
17.1
019
.9N
A25
.238
.442
.246
.453
.961
.5 6
5.80
7
1.30
5
5.2
66.
5 7
5.5
82.
0 6
3.1
68.
0 7
4.0
S
tude
nt-T
each
er R
atio
Prim
ary
( 1-8
)56
:161
:163
:164
:165
:166
:162
:159
:157
:154
:1 5
1:1
51:
1 5
0:1
49:
1 4
7:1
46:
1 4
6:1
43:1
43:1
Sec
onda
ry (
9-12
)43
:152
:154
:145
:148
:151
:157
:148
:143
:141
:1 3
6:1
31:
1 2
9:1
28.
7:1
27.
8:1
26.
4:1
26.
5:1
26:1
26:1
Tech
nica
l & V
ocat
iona
l 7.
6:1
9:1
17:1
25:1
22:1
21:1
20:1
27:1
25:1
34:1
NA
2
9:1
24.
7:1
18.
6:1
16.
5:1
16.
5፡1
12.
.6:1
11
:515
:1
S
tude
nt-S
choo
l Rat
io
Prim
ary
( 1-8
)56
3:1
617.
5:1
674.
0:1
701:
172
4:1
690:
165
4:1
677:
165
7:1
619:
1 5
73:1
5
90:1
5
76:1
5
71:1
5
71:1
7
44.9
፡1
573
:1
580:
156
7:1
Sec
onda
ry (
9-12
)98
2:1
1,53
1.2:
116
81.0
:112
22:1
1312
:113
50:1
1425
:114
40:1
1381
:113
45:1
127
0:1
116
0:1
103
3:1
994
:1
857
:1
369
:1
767
.2:1
75
4:1
741:
1
Tech
nica
l & V
ocat
iona
l 26
7:1
264.
9:1
271.
0:1
353:
155
2:1
534:
146
8:1
493:
150
1:1
673:
1 7
88:1
7
35:1
6
54:1
5
44:1
5
45:1
3
83:1
33
1:1
329:
131
8:1
3. M
acro
econ
omic
indi
cato
rs
3.1
Real
sec
tor D
evel
opm
ent2
G
DP
at C
urre
nt M
arke
t Pric
e (In
Mn.
Birr
) 6
5,98
6.0
67,
351.
0 6
5,89
5.0
72,
703.
0 8
5,80
0.0
105
,415
.0
130
,334
.0
170
,281
.0
245
,836
.0
332
,060
.0
379
,135
.00
515
,078
.5
747
,326
.5
866
,921
.1
1,0
60,8
25.4
1
,297
,961
.4
1,5
28,0
44.2
1,80
6,65
6.0
2,2
02,3
73.0
N
omin
al G
DP
Gro
wth
Rat
e (In
%)
9.0
2
.1
(2.2
) 1
0.3
18.
0 2
2.9
23.
6 3
0.6
44.
4 3
5.1
14.
18
35.
9 4
5.1
15.
3 2
2.4
22.
4 1
8.2
17.
9 2
0.2
Av
erag
e M
argi
nal E
xcha
nge
Rate
(Birr
per
USD
) 8
.140
0 8
.330
0 8
.540
0 8
.580
0 8
.630
0 8
.651
8 8
.681
0 8
.794
3 9
.240
0 1
0.42
00
12.
89
16.
1 1
7.3
18.
3 1
9.1
20.
1 2
1.1
22.
4 2
6.1
G
DP
at C
urre
nt M
arke
t Pric
e (IN
Mn.
USD
) 8
,106
.4
8,0
85.4
7
,716
.0
8,4
73.5
9
,942
.1
12,
184.
2 1
5,01
3.7
19,
362.
7 2
6,60
5.6
31,
867.
6 2
9,41
3.11
3
1,95
7.1
43,
314.
2 4
7,42
4.6
55,
628.
0 6
4,57
5.2
72,
419.
2 8
0,60
5.0
84,
356.
0
N
omin
al G
DP
per C
apita
(In
USD
) 1
35.1
1
31.3
1
22.1
1
30.8
1
49.5
1
78.4
2
14.5
2
67.4
3
55.2
4
15
373
.26
396
.1
523
.5
559
.1
639
.6
725
.0
794
.0
863
.0
883
.0
Re
al G
DP
per C
apita
( In
Birr
) 3
,313
.8
3,4
95.7
3
,458
.8
3,3
00.5
3
,652
.6
3,9
76.7
4
,300
.5
4,6
34.2
4
,962
.8
5,2
66.1
5
,776
.60
5,8
95.0
0 6
,947
.5
7,2
99.1
7
,625
.2
8,5
71.2
8
,864
.0
18,
257.
5 1
9,21
7.5
Re
al G
DP
per C
apita
Gro
wth
Rat
e (In
%)
4.8
5
.5
(1.1
) (4
.6)
10.
7 8
.9
8.1
7
.8
7.1
6
.1
9.6
9 9
.00
6.1
5
.1
4.5
1
2.4
3.4
8
.0
5.3
G
DP
Defl
ator
(% c
hang
e) 6
.9
(5.8
) (3
.6)
12.
8 3
.9
9.9
1
1.6
17.
2 3
0.3
24.
2 1
.70
20.
08
33.
5 4
.9
11.
0 1
0.8
9.5
6
.3
12.
5
Re
al G
DP
at c
onst
ant b
asic
pric
e (In
Mn.
Birr
) 1
84,6
25.4
1
98,3
20.9
2
01,5
61.3
1
97,3
31.5
2
20,4
77.2
2
48,3
54.8
2
77,0
13.3
3
09,6
86.8
3
44,3
31.9
3
78,9
07.4
4
18,9
46.9
5 4
75,6
47.5
0 5
17,0
26.5
5
68,4
32.3
6
26,9
77.4
6
92,2
21.7
7
47,3
09.2
1,57
7,10
7.0
1,7
19,4
91.3
Re
al G
DP
at c
onst
ant m
arke
t pric
e (In
Mn.
Birr
) 1
98,8
27.1
2
15,3
32.6
2
18,5
94.3
2
13,8
70.3
2
42,8
97.6
2
71,6
05.2
3
01,0
32.7
3
35,5
19.0
3
71,7
16.7
4
04,4
37.0
4
55,1
96.0
2 5
15,0
78.5
0 5
59,6
21.6
6
18,8
42.2
6
82,3
58.5
7
53,2
29.7
8
10,1
87.2
1,69
9,19
3.6
1,8
34,0
66.5
Re
al G
DP
Gro
wth
Rat
e (In
%)
3.4
7
.4
1.6
(2
.1)
11.
7 1
2.6
11.
5 1
1.8
11.
2 1
0.0
10.
57
11.
40
8.7
9
.9
10.
3 1
0.4
8.0
1
0.9
7.7
Ag
ricul
ture
& A
llied
Act
ivtie
s(In
Bill
ion
Birr
) 1
02.1
1
11.9
1
09.8
9
8.3
115
.0
130
.5
144
.8
158
.5
170
.3
181
.2
195
.00
212
.50
222
.9
238
.8
251
.8
267
.8
274
.0
573
.1
600
.9
In
dust
rial S
ecto
r (In
Bill
ion
Birr
) 1
7.7
18.
6 2
0.2
21.
4 2
3.7
25.
9 2
8.4
30.
6 3
3.9
37.
3 4
1.99
4
9.80
5
9.6
73.
9 8
6.5
103
.7
125
.0
404
.3
464
.4
Se
rvic
e Se
ctor
(In B
illio
n Bi
rr)
69.
4 7
2.9
75.
3 7
9.4
84.
2 9
4.6
107
.6
124
.1
144
.1
163
.9
185
.10
216
.60
237
.4
258
.8
292
.5
325
.0
353
.0
620
.2
673
.9
A
gric
ultu
re &
Alli
ed A
ctiv
ties (
% o
f GD
P) 5
5.3
56.
4 5
3.7
49.
4 5
1.6
51.
9 5
1.5
50.
5 4
8.8
47.
3 4
6.13
4
4.37
4
3.1
42.
0 4
0.2
38.
7 3
6.7
36.
3 3
4.9
I
ndus
tria
l Sec
tor (
% o
f GD
P )
9.7
9
.5
10.
0 1
1.0
10.
9 1
0.6
10.
4 1
0.2
10.
1 1
0.1
10.
17
10.
40
11.
5 1
3.0
13.
8 1
5.0
16.
7 2
5.6
27.
0
S
ervi
ce S
ecto
r ( %
of G
DP
) 3
7.0
36.
3 3
6.3
39.
6 3
7.5
37.
5 3
8.0
39.
3 4
1.0
42.
6 4
3.70
4
5.23
4
5.9
45.
5 4
6.6
47.
0 4
7.3
39.
3 3
9.2
Pr
ivat
e Co
nsum
ptio
n Ex
pend
iture
45,
611.
0 4
7,98
1.0
49,
319.
0 5
6,76
5.0
60,
866.
0 8
1,44
5.0
102
,537
.0
130
,118
.0
197
,461
.0
268
,002
.0
309
,132
.00
373
,088
.50
541
,536
.3
636
,901
.3
744
,978
.0
896
,208
.0
1,0
37,2
77.0
1,14
7,62
8.0
1,4
41,5
81.0

National Bank of Ethiopia Quarterly Bulletin
G
over
nmen
t Con
sum
ptio
n Ex
pend
iture
12,
615.
0 1
0,54
3.0
10,
448.
0 1
0,42
2.0
11,
973.
0 1
3,97
1.0
17,
016.
0 1
9,12
3.0
25,
782.
0 3
1,54
4.0
34,
801.
00
53,
147.
10
62,
044.
5 7
7,63
6.9
98,
121.
0 1
16,9
95.0
1
48,8
37.0
2
22,8
65.0
2
25,5
23.0
In
vest
men
t 1
4,64
7.0
15,
870.
7 1
7,39
5.0
17,
669.
0 2
4,90
2.0
27,
409.
0 3
5,95
2.0
41,
227.
0 6
0,15
6.0
82,
560.
0 1
02,4
03.0
0 1
65,3
80.0
0 2
77,2
43.7
2
95,4
56.4
4
02,9
22.0
5
11,6
18.0
5
88,7
05.0
7
04,5
96.0
7
51,6
26.0
Ex
port
s 8
,010
.0
8,1
46.0
8
,389
.0
9,7
79.0
1
2,91
3.6
16,
076.
9 1
8,20
5.4
21,
854.
2 2
8,31
7.0
35,
233.
0 5
2,16
8.00
8
5,94
9.80
1
02,8
87.0
1
08,2
27.1
1
23,4
96.0
1
21,5
32.2
1
22,3
66.0
1
39,8
05.0
1
84,2
82.0
Im
port
s 1
5,95
2.8
16,
108.
4 1
7,70
6.8
20,
131.
3 2
7,36
6.8
37,
776.
3 4
8,09
2.4
55,
088.
7 7
6,56
4.0
96,
285.
0 1
26,3
19.0
0 1
62,4
86.8
0 2
36,3
84.7
2
51,3
00.6
3
08,6
91.3
3
93,1
89.0
4
24,5
28.0
4
28,4
00.0
5
02,1
13.0
Re
sour
ce B
alan
ce-7
,942
.8-7
,962
.4-9
,317
.8-1
0,35
2.3
-14,
453.
2-2
1,69
9.4
-29,
887.
0-3
3,23
4.4
-48,
247.
0-6
1,05
2.0
(74,
151.
00)
(76,
537.
00)
(133
,498
.0)
(143
,073
.5)
(185
,195
.3)
(271
,656
.0)
(302
,163
.0)
(288
,595
.0)
(317
,831
.0)
G
ross
Priv
ate
Cons
umpt
ion
(% o
f GD
P) 6
9.1
71.
2 7
4.8
78.
1 7
0.9
77.
3 7
8.7
76.
4 8
0.3
80.
7 8
1.54
7
2.43
7
2.5
73.
5 7
0.2
69.
0 6
7.9
63.
5 6
5.5
G
ross
Gov
ernm
ent C
osum
ptio
n (%
of G
DP)
19.
1 1
5.7
15.
9 1
4.3
14.
0 1
3.3
13.
1 1
1.2
10.
5 9
.5
9.1
8 1
0.32
8
.3
9.0
9
.2
9.0
9
.7
12.
3 1
0.2
G
ross
Dom
estic
Fix
ed In
vest
men
t (%
of G
DP)
22.
2 2
3.6
26.
4 2
4.3
29.
0 2
6.0
27.
6 2
4.2
24.
5 2
4.9
27.
01
32.
11
37.
1 3
4.1
38.
0 3
9.4
38.
5 3
9.0
34.
1
Res
ourc
e Ba
lanc
e (%
of G
DP)
-12.
0-1
1.8
-14.
1-1
4.2
-16.
8-2
0.6
-22.
9-1
9.5
-19.
6-1
8.4
(19.
56)
(14.
86)
(17.
9) (1
6.5)
(17.
5) (2
0.9)
(19.
8) (1
6.0)
(14.
4)
3.2
Mon
etor
y in
dict
ors
N
arro
w M
oney
Sup
ply
(M1)
( In
Mn.
Birr
)13
,050
.213
,745
.815
,182
.416
,446
.719
,065
.921
,289
.823
,811
.929
,773
.436
,875
.542
,112
.752
,434
.6 7
6,17
1.00
9
4,84
9.88
11
4,74
5.69
1
34,0
63.7
8 1
54,7
06.3
4 1
78,6
09.6
6 2
16,7
94.6
0 2
81,1
54.7
0
B
road
Mon
ey S
uppl
y (M
2) (
In M
n. B
irr )
22,1
77.8
24,5
16.2
27,3
22.0
30,0
90.1
34,6
55.9
40,2
12.1
46,3
77.4
56,8
60.3
69,9
18.2
82,5
09.8
104,
432.
4 1
45,3
76.9
7 1
89,3
98.7
8 23
5,31
3.59
2
97,7
46.5
9 3
71,3
28.9
1 4
45,2
66.2
5 5
73,4
08.6
0 7
40,5
72.5
0
N
et F
orei
gn A
sset
s ( I
n M
n. B
irr )
4,77
0.6
4,80
0.0
7,82
2.5
11,0
49.2
11,7
66.9
13,8
68.0
12,1
09.6
13,9
27.3
12,1
40.6
17,9
76.8
27,1
89.8
55,
534.
68
39,
787.
69
45,
648.
53
45,
972.
30
37,
570.
95
21,
524.
19
38,
034.
79
39,
376.
20
R
eser
ve R
equi
rem
ent (
CBs
)92
4.1
1,08
1.8
1,16
3.9
1,32
0.3
1549
.35
1,82
8.4
2,12
0.9
2,59
2.5
9,11
2.9
11,1
83.3
14,3
68.0
20,
495.
20
18,
080.
56
11,
708.
82
14,
479.
39
18,
250.
35
21,
745.
43
28,
280.
80
36,
385.
80
In
tere
st R
ate
( In
% )
Min
imum
Dep
osit
Rate
6
63
33
33
44
4.0
4.0
5.0
0 5
.00
5.0
0 5
.00
5.0
0 5
.00
5.0
0 7
.00
Lend
ing
Rate
10
.5-1
3.5
10.5
-15.
08.
0-10
.58.
0-10
.58.
0-10
.57-
147-
147-
148-
158-
16.5
12.2
5 1
1.88
1
1.88
1
1.88
1
1.88
1
1.88
1
2.75
1
2.75
1
3.50
Tota
l Net
Dom
estic
Cre
dit (
in m
n. B
irr)
26,
271.
0 2
7,55
1.6
27,
550.
2 2
8,20
2.3
3113
8.78
140
305.
849
295.
961
585.
080
772.
689
,203
.010
4,41
3.5
135
,553
.87
189
,080
.81
233,
404.
32 3
00,0
26.5
8 3
93,4
21.7
3 4
90,2
30.3
5 6
31,1
56.2
0 7
84,6
33.1
0
Gov
ernm
ent
14,7
75.7
15,1
71.0
15,
985.
1 1
7,22
9.8
1919
9.15
421
663.
825
266.
430
290.
234
169.
232
,786
.533
,013
.1 2
8,65
1.65
2
1,55
7.41
2
1,96
5.52
2
6,92
9.74
3
0,73
5.25
4
7,54
8.36
8
5,44
1.85
10
2,00
2.80
O
ther
Sec
tors
11,4
95.3
12,3
80.6
11,
565.
1 1
0,97
2.6
1193
9.62
718
642.
024
029.
631
294.
846
603.
456
,416
.571
,400
.4 1
06,9
02.2
2 1
67,5
23.4
0 21
1,43
8.80
2
73,0
96.8
4 3
62,6
86.4
8 4
42,6
81.9
9 54
5,71
4.40
682,
630.
30
3.3
ave
rage
ann
ual i
nflat
ion
rate
(Cpi
gro
wth
ra
te)3
C
ount
ry L
evel
-
Gen
eral
infla
tion
5.4
-0.3
-10.
610
.97.
36.
110
.615
.825
.336
.42.
818
.134
.113
.58.
17.
79.
77.
213
.1
-
Food
infla
tion
7.6
-1.7
-19.
121
.511
.57.
413
.017
.534
.944
.2-5
.415
.742
.912
.65.
97.
411
.27.
416
.5
-N
on-fo
od in
flatio
n (c
ore
infla
tion)
2.5
1.4
0.3
0.2
2.2
4.4
7.1
13.5
12.5
23.8
18.2
21.8
22.4
14.8
10.6
88.
11.
19.
2
Add
is A
baba
-
Gen
eral
infla
tion
4.2
-1.4
-5.5
4.6
5.6
7.2
8.4
19.2
20.8
29.4
10.1
19.4
24.8
12.6
8.5
7.6
10.3
3.0
8.3
-
Food
infla
tion
7.2
-7.8
-10.
79.
48.
65.
713
.025
.432
.141
.54.
114
.830
.613
.14.
612
.216
.61.
38.
8
-N
on-F
ood
infla
tion
(cor
e in
flatio
n)0.
65.
6-0
.80.
93.
07.
64.
614
.012
.719
.216
.023
.521
.111
.911
.44.
45.
84.
37.
9
3.4
Exte
rnal
tra
de(in
Mn.
USD
)
Exp
ort o
f goo
ds &
ser
vice
s98
497
9.1
982.
711
50.6
1520
.618
95.8
2149
.524
98.1
3127
.933
99.5
4,0
50.3
3 5
,343
.12
5,9
93.4
1 5
,978
.47
6,4
51.6
2 6
,057
.81
6,0
77.3
6
,257
.2
7,0
99.7
Im
port
of g
oods
& s
ervi
ces
1,95
9.8
1,93
6.4
2,0
73.1
2
,408
.7
3,2
59.8
4
,439
.6
5,6
02.7
6
,254
.2
8,3
26.9
9
,292
.3
9,8
58.4
0 1
0,16
0.72
1
3,80
5.17
1
3,86
4.19
1
6,19
7.24
1
9,84
8.9
20,
556.
2 1
9,71
0.0
19,
653.
4
Net
trad
e in
goo
ds &
serv
ices
-975
.8-9
57.3
-1,0
90.4
-1,2
58.1
-1,7
39.3
-2,5
43.8
-3,4
53.2
-3,7
56.1
-5,1
99.0
-5,8
92.8
-5,8
08.4
-4,8
17.6
-7,8
11.8
-7,8
85.7
-9,7
45.6
-13,
791.
1-1
4,47
8.9
-13,
452.
9-1
2,55
3.7
Cur
rent
acc
ount
bal
ance
incl
udin
g offi
cial
tr
ansf
ers
(334
.8)
(242
.4)
(361
.0)
-93.
8-4
01.5
-771
.3-1
,470
.9-9
91.3
-1,4
92.4
-1,6
34.7
-1,1
93.2
-201
.9-2
,778
.0-2
,780
.3-4
,168
.1-7
,401
.6-6
,659
.3-6
,539
.2-5
,227
.3
Cap
ital a
ccou
nt b
alan
ce15
1.7
258.
650
9.0
368.
638
6.7
491.
961
4.3
760.
41,
031.
516
48 2
,421
.02
2,9
95.9
3 2
,283
.28
3,2
91.2
3 4
,134
.57
8,2
85.6
1 6
,577
.7
6,8
95.1
6
,397
.3
Ove
rall
bala
nce
of p
aym
ents
(393
.7)
(70.
5)30
0.2
1381
.894
676
389.
5463
487
66.4
0934
667
3729
.98
-251
.693
9401
18.7
316
.68
1,3
84.2
0 (9
72.7
9) (6
.52)
(96.
89)
(521
.41)
-830
.965
8.6
-201
.6
3.5
Gov
ernm
ent f
inan
ce (i
n M
n .B
irr4 )
To
tal R
even
ue (i
nclu
ding
gra
nts)
11,2
22.0
12,8
05.0
12,8
33.0
15,7
03.0
17,9
18.0
20,1
47.0
23,2
25.0
29,3
81.0
39,7
05.0
40,4
21.9
66,
237.
44
85,
611.
00
115
,658
.50
137,
192.
00
158
,076
.52
199
,639
.11
243
,671
.56
269
,105
.94
287
,562
.14
To
tal R
even
ue (e
xclu
ding
gra
nts)
9,49
8.0
10,1
77.0
10,4
09.0
11,1
49.0
13,9
17.0
15,5
82.0
19,4
93.0
21,7
97.0
29,7
94.0
31,9
24.0
53,
861.
34
69,
120.
00
102
,863
.65
124,
077.
00
146
,172
.77
186
,618
.69
230
,657
.28
256
,629
.04
269
,648
.19
o/
w Ta
x-Re
venu
e6,
782.
074
40.0
7,92
6.0
8243
.010
,906
.012
398.
014
122.
017
354.
023
801.
023
216.
2 4
3,31
5.36
5
8,98
1.00
8
5,73
9.86
10
7,01
0.30
1
33,1
18.2
6 1
65,3
12.4
7 1
89,7
17.1
8 2
10,1
35.8
5 2
35,2
29.4
8
Tax-
Reve
nue
as %
of G
DP
10.3
11.0
12.0
11.3
12.7
11.8
10.8
10.2
9.7
7.0
11.
42
11.
45
11.
47
12.
50
12.
71
13.
37
12.
40
11.
6 1
2.2
To
tal E
xpen
ditu
res
17,1
83.6
1578
6.4
17,6
51.0
2051
7.0
20,5
20.0
2480
3.0
2932
5.0
3560
7.0
4691
5.0
4387
5.2
71,
334.
79
93,
831.
00
124
,416
.72
153,
929.
00
185
,471
.78
230
,521
.18
272
,930
.09
329
,286
.84
354
,205
.32
Cur
rent
Exp
endi
ture
s13
,741
.610
,379
.010
,550
.013
,549
.011
,977
.013
,235
.015
,234
.017
,165
.022
,794
.026
315.
5 3
2,01
2.38
4
0,53
5.00
5
1,44
5.45
6
2,74
5.80
7
8,08
6.90
1
13,3
75.5
0 1
31,9
02.7
8 1
76,7
03.0
0 2
10,4
70.2
1
Cap
ital E
xpen
ditu
res
3,44
2.0
5,00
3.4
6,13
0.0
6,31
3.0
8,27
1.0
11,3
43.0
14,0
42.0
18,3
98.0
24,1
21.0
17,5
59.7
39,
322.
41
53,
297.
00
72,
971.
26
91,
182.
90
107
,384
.88
117
,145
.68
141
,027
.31
152
,583
.83
143
,735
.10
Equ
ity C
ontr
ibut
ion
( Sin
king
Fun
d )
Spe
cial
Pro
gram
s-
404.
097
165
527
222
4.0
50.0
44.0
0.0
0.0
0.0
- -
- -
- -
- -
Tot
al E
xpen
ditu
res a
s % o
f GD
P26
.023
.426
.828
.223
.923
.522
.520
.919
.113
.218
.8 1
8.2
16.
6 1
8.1
17.
7 1
7.8
17.
9 1
8.2
16.
1
C
urre
nt S
urpl
us/D
efici
t-4
,243
.6-2
02.0
-141
.0-2
,400
.01,
940.
06,
652.
74,
259.
04,
632.
07,
000.
05,
608.
534
,225
.1 4
5,07
6.5
64,
213.
0 7
4,44
7.0
79,
989.
6 8
6,26
3.6
111
,768
.8
92,
402.
9 7
7,09
1.9
O
vera
ll Bu
dget
Defi
cit (
incl
udin
g gr
ants
)-5
,961
.6-2
,981
.4-4
,818
.04,
815.
0-2
,602
.0-4
,655
.0-6
,100
.0-6
226.
0-7
210.
0-3
453.
3-5
,097
.4 (8
,220
.2)
(8,7
58.2
) (1
6,73
6.0)
(27,
395.
3) (3
0,88
2.1)
(29,
258.
5) (6
0,18
0.9)
(66,
643.
2)
Defi
cit a
s % o
f GD
P-9
.0-4
.4-7
.36.
6-3
.0-4
.4-4
.7-3
.7-2
.9-1
.0-1
.3-1
.6-1
.2-2
.0-2
.6-2
.4-1
.9-3
.3-3
.0
O
vera
ll Bu
dget
Defi
cit (
exc
ludi
ng g
rant
s )
-7,6
85.6
-5,6
09.4
-7,2
42.0
-9,3
68.0
-6,6
03.0
-9,2
20.0
-9,8
32.0
-13,
810.
0-1
7,12
1.0
-119
51.1
-174
73.5
(24,
711.
5) (2
1,55
3.1)
(29,
851.
0) (3
9,29
9.0)
(43,
902.
5) (4
2,27
2.8)
(72,
657.
8) (8
4,55
7.1)
Defi
cit a
s % o
f GD
P-1
1.6
-8.3
-11.
0-1
2.9
-7.7
-8.7
-7.5
-8.1
-7.0
-3.6
-4.6
-4.8
-2.9
-3.5
-3.8
-3.5
-2.8
-4.0
-3.8
indi
cato
rs19
99/0
020
00/0
120
01/0
220
02/0
320
03/0
420
04/0
520
05/0
620
06/0
720
07/0
820
08/0
920
09/1
020
10/1
1 2
011/
12 2
012/
13 2
013/
14 2
014/
15 2
015/
16 2
016/
1720
17/1
8
(199
2)(1
993)
(199
4)(1
995)
(199
6)(1
997)
(199
8)(1
999)
(200
0)(2
001)
(200
2)(2
003)
(200
4)(2
005)
(200
6)(2
007)
(200
8)(2
009)
(201
0)
iiFirst Quarter 2018/19
National Bank of Ethiopia Quarterly Bulletin
3.6
Exch
ange
Rat
e (B
irr/
USD
)
In
ter-
Bank
For
ex M
arke
t Rat
e5
*
Per
iod
wei
ghte
d Av
erag
e8.
208.
428.
543
8.58
18.
635
8.65
28.
681
8.79
49.
244
10.4
205
12.8
909
16.1
178
17.2
536
18.1
947
19.0
748
20.
0956
2
1.10
59
22.
4137
2
6.10
82
* End
per
iod
8.22
8.46
8.56
68.
600
8.63
08.
660
8..6
99.
030
9.61
011
.300
913
.532
116
.908
117
.730
518
.642
619
.577
1 2
0.56
59
21.
8004
2
3.10
81
27.
3761
3.7
trea
sury
Bill
Mar
ket (
in M
n .B
irr)
T
-Bill
s D
eman
ded
( Tot
al )
18,3
22.8
18,2
05.5
26,0
89.1
38,6
33.6
61,1
43.2
56,8
96.2
60,6
03.5
78,9
22.0
59,8
88.5
46,7
67.2
51,
258.
02
55,
760.
03
77,
194.
80
109,
184.
60
113
,527
.98
136
,536
.80
161
,575
.24
225
,321
.24
323
,991
.24
T
-Bill
s So
ld13
,311
.29,
322.
916
,453
.229
,668
.051
,645
.041
,065
.047
,793
.563
,315
.047
,716
.527
,839
.8 4
1,73
6.42
5
2,31
6.03
7
4,69
4.80
109,
184.
60
95,
314.
98
110
,593
.30
161
,475
.24
225
,321
.24
323
,991
.24
A
vera
ge W
eigh
ted
Yiel
d (in
%)
3.3
2.8
2.0
1.3
0.5
0.09
50.
038
0.53
00.
677
0.74
3 0
.79
1.1
3 1
.87
1.8
9 1
.60
1.4
3 1
.44
1.4
2 1
.42
T
-Bill
s O
utst
andi
ng b
y ho
lder
1,95
1.5
3,37
2.5
4,47
8.2
9,10
0.0
1248
565
9511
638.
511
546
8239
.577
83.1
11,
566.
20
10,
706.
62
20,
011.
86
26,
044.
90
32,
286.
86
41,
704.
80
57,
252.
56
73,
271.
56
111
,213
.56
Ban
ks80
4.7
1,92
4.0
3,42
5.5
8,09
4.3
1141
862
9510
612.
391
3527
3916
72 4
,400
.00
900
.00
2,3
83.5
0 3
,436
.00
- -
- -
-
Non
-Ban
ks1,
146.
81,
448.
51,
052.
71,
005.
710
6730
010
26.2
2411
5500
.561
11.1
7,1
66.2
0 9
,896
.62
17,
628.
40
22,
608.
90
32,
286.
86
41,
704.
80
57,
252.
56
73,
271.
56
111
,213
.56
3.8
inte
r Ban
k M
oney
Mar
ket R
ate5
118
7.5
7.5
7.5
_
_7.
58.
5
_
_
_
_
_
_
_
_
_
3.9
fina
ncia
l ins
titu
tion
s
N
umbe
r of C
omm
erci
al B
anks
88
88
99
1011
1112
14.
00
17.
00
17.
00
18.
00
18.
00
18.
00
18.
00
18.
00
18.
00
(
o/w
Priv
ate
bank
s )7
77
77
78
99
10 1
2.00
1
4.00
1
6.00
1
6.00
1
6.00
1
6.00
1
6.00
1
6.00
1
6.00
N
umbe
r of B
ank
Bran
ches
267
283
295
339
358
389
421
487
562
636
681
.00
970
.00
1,2
89.0
0 1
,724
.00
2,2
08.0
0 2
,693
.00
3,3
01.0
0 4
,257
.00
4,7
57.0
0
P
opul
atio
n : B
ank
Bran
ch22
4719
:121
7668
:121
4237
:119
1150
:118
5754
.2:1
1757
78.4
:116
6,27
0.8:
114
8,66
5.3:
113
3,27
4:1
120,
754.
7:1
115
,712
.2:1
8
3,19
5.9:
1 6
4,15
8.3:
1 4
9674
.8:1
4
1,08
8 3
3,44
8.00
2
7,93
2.00
2
2164
:1
202
86.5
:1
N
umbe
r of
Insu
ranc
e Co
mpa
nies
99
99
99
99
1012
12.
00
14.
00
15.
00
16.
00
17.
00
17.
00
17.
00
17.
00
17.
00
(
o/w
Priv
ate
Insu
ranc
e Co
mpa
nies
)8
88
88
88
89
11 1
1.00
1
3.00
1
4.00
1
5.00
1
6.00
1
6.00
1
6.00
1
6.00
1
6.00
N
umbe
r of I
nsur
ance
Bra
nche
s91
9510
110
512
113
313
914
617
219
4 2
07.0
0 2
21.0
0 2
43.0
0 2
73.0
0 3
32.0
0 3
77
426
4
92.0
0 5
32.0
0
P
opul
atio
n : I
nsur
ance
Bra
nch
6593
41:1
6484
21:1
6257
43:1
6171
43:1
5495
87:1
5135
34:1
5035
97:1
4958
90:1
4354
65:1
3958
76:1
383
844:
1 3
6606
3:1
3
4032
9:1
3144
28.9
:1
264
918.
8:1
238
928:
1 2
1644
3:1
191
772:
1 1
8139
6:1
N
umbe
r of D
evel
opm
ent B
anks
11
11
11
11
11
1.0
0 1
.00
1.0
0 1
.00
1.0
0 1
.00
1.0
0 1
.00
1.0
0
N
umbe
r of D
evel
opm
ent B
ank
Bran
ches
3232
3232
3232
3232
3232
32.
00
32.
00
32.
00
32.
00
32.
00
32
110
1
10.0
0 1
07.0
0
N
umbe
r of M
icro
-fina
ncia
l Ins
titut
ions
1619
2122
2226
2728
2830
30.
00
31.
00
31.
00
31.
00
31.
00
35.
00
35.
00
35.
00
38.
00
Sour
ce :
Min
istr
ies
of a
gric
ultu
re, f
inan
ce a
nd E
cono
mic
Dev
elop
men
t, h
ealt
h, a
nd E
duca
tion
; Nat
iona
l Ban
k of
Eth
iopi
a; C
ente
ral S
tati
stic
al a
utho
rity
, … e
tcN
ote:
- =*p
opul
atio
n is
est
imat
ed u
sing
com
pone
nt m
etho
d af
ter 2
006/
2007
1. E
xclu
ding
man
pow
er o
ut s
ide
the
Min
istr
y of
Hea
lth.
2. T
he G
DP
data
ser
ies
is re
vise
d on
bas
is o
f 20
10/1
1=10
0 ba
se y
ear
3. I
nflat
ion
data
is c
alcu
late
d us
ing
the
new
bas
e ye
ar (D
ecem
ber 2
011=
100)
4. F
igur
es fo
r go
vern
men
t fina
nce
are
prel
imin
ary
estim
ates
from
199
9/00
onw
ards
. 5.
In
ter-
bank
mon
ey m
arke
t was
firs
t int
rodu
ced
in A
ug.1
998
and
Inte
r-ba
nk fo
rex
mar
ket s
tart
ed a
s of
Sep
tem
ber 1
998,
and
the
daily
tras
actio
ns in
trod
uced
beg
inni
ng fr
om o
ctob
er 2
4, 2
001.
*Mid
yea
r pop
ulat
ion
was
obt
aine
d fr
om M
oFED
indi
cato
rs19
99/0
020
00/0
120
01/0
220
02/0
320
03/0
420
04/0
520
05/0
620
06/0
720
07/0
820
08/0
920
09/1
020
10/1
1 2
011/
12 2
012/
13 2
013/
14 2
014/
15 2
015/
16 2
016/
1720
17/1
8
(199
2)(1
993)
(199
4)(1
995)
(199
6)(1
997)
(199
8)(1
999)
(200
0)(2
001)
(200
2)(2
003)
(200
4)(2
005)
(200
6)(2
007)
(200
8)(2
009)
(201
0)
First Quarter 2018/19 iii


First Quarter 2018/19
National Bank of Ethiopia Quarterly Bulletin
First Quarter 2018/19 1
i. oVERViEW
1.1. international Economic Developments
In the first quarter of 2018/19, global survey indicators continue to signal a steady growth momentum. Surveys suggest global activity momentum might moderate somewhat.
The global composite output Purchasing Managers’ Index (PMI) excluding the euro area declined somewhat below its long-term average in August. On the other hand, consumer confidence indicators remain positive, despite the recent declines.
In the United States, activity is expected to remain strong this year. Tight labour market conditions, with historically low unemployment levels, stable participation and an upward trend on wage growth, should support household incomes and spending, while solid corporate profits and favorable financial conditions should bolster investment. Annual headline consumer price index (CPI) inflation reached its highest level since 2012, rising to 2.9 percent in June, while increasing to 2.3 percent when food and energy are excluded.
In Japan, the economic expansion is projected to decelerate gradually. While activity should benefit from accommodative monetary policy, declining fiscal support and increasingly binding capacity constraints are expected to weigh on growth. Wages are rising moderately amid a tightening labour market, which should support household spending. Annual headline CPI inflation remained stable at 0.7 percent in June, yet underlying inflation remained low, with CPI excluding food and energy stood at 0 percent. However, inflation is projected to remain below the 2 percent target.
In the United Kingdom, moderate growth is expected due to lagging domestic demand. In addition, uncertainty associated with Brexit negotiations is expected to affect investment in U.K. in the short term.
In China, economic activity is decelerating. Mainly the slowing housing market and the lagged effects of earlier financial tightening are expected to affect growth. Higher tariffs imposed by the United States are expected to affect trade performance and growth. On the other hand, monetary accommodation and some fiscal support expected to sustain activity
growth in the near term. In the medium term, it is assumed that continued progress on structural reforms would lead to an orderly slowdown and some rebalancing of the Chinese economy.
Economic activity is projected to strengthen moderately in the large commodity-exporting countries. The outlook for Russia is supported by the rise in oil prices this year, relatively low inflation and improving business and consumer confidence. The recently imposed US sanctions and increased political uncertainties are expected to affect the economy in the near term. However, in medium term, economic activity is expected to expand moderately.
In Brazil, the short-term outlook is affected by political uncertainties and the disruptions from strikes. However, further ahead an improved labour market and continuing monetary accommodation should support consumption, as inflationary pressures remain contained.
1.2. Macroeconomic Developments in Ethiopia
a. inflation
During the first quarter of 2018/19, headline inflation scaled down to 3.0 percent from 4.0 percent and 3.8 percent recorded in the preceding quarter and same period last year respectively. The decline in quarterly headline inflation was attributed largely to the deceleration in food & non-alcoholic beverages inflation by 1.7 percentage points and 0.2 percentage points. Likewise, headline inflation declined 0.8 percentage points annually owing to the slight reduction in both food & non-alcoholic beverages inflation (0.8 percentage points) and non-food inflation (0.8 percentage points).
B. Monetary Developments
In the first quarter of 2018/19, broad money supply (M2) reached Birr 752.1 billion, showing a 24.9 percent growth over the corresponding quarter of last fiscal year. The increase in broad money was ascribed to 21.6 percent growth in domestic credit and 22.5 percent expansion in NFA. The growth in domestic credit was driven by 22.1 percent upsurge in credit to non-central government and 7.3 percent credit to central government. Government’s measure to raise CBE’s capital by issuing non-interest bearing bond

First Quarter 2018/192
National Bank of Ethiopia Quarterly Bulletin
attributed to the expansion of credit to the central government.
At the end of first quarter of 2018/19, reserve money reached Birr 174.8 billion, depicting 15 percent growth over last year same quarter. Component wise, both currencies in circulation and bank deposits at NBE rose by 16.8 and 12.1 percent, respectively.
C. interest rate
During the first quarter of 2018/19, average interest rate on savings deposit increased 2.63 percentage point while average lending rate rose 0.75 percentage point. Similarly, weighted average time deposit rate increased by 2.57 percentage points while weighted average yield on T-bills slightly declined by 0.02 percentage point. Hence, taking September 2018 headline inflation rate of 12 percent, all deposit rates and T-bill yields remained negative in real terms while average real lending rate was positive.
D. financial Sector Developments
1. Banks
As at end September 2017, the number of banks operating in Ethiopia remained 18, of which 16 were private banks. These banks opened 229 new branches during the review quarter thereby raising the total number of bank branches to 4,986. Therefore, currently one branch on average serves 19,788.41 people. Of the total bank branches, about 34.6 percent were located in Addis Ababa. The share of public banks in total bank branches was 30.6 percent while that of private banks stood at 69.4 percent.
At the end of first quarter of 2018/19, the total capital of the banking system reached Birr 89 billion, depicting 11 percent annual growth. Of the total capital, private banks accounted for 39.8 percent while that of Commercial Bank of Ethiopia and Development Bank of Ethiopia was 51.5 percent and 8.7 percent, respectively, thereby putting the total capital share of the two public banks at 60.2 percent.
Meanwhile, the banking sector disbursed about Birr 30.1 billion in new loans, registering a 31.8 percent annual increase. Of the total new loans disbursement, the share of public banks was 44.2 percent and that of private banks 55.8 percent.
1 Total population is 98,665,000 as CSA estimation for 2019.
The major beneficiary of bank loans was industry accounting for 28.8 percent followed by domestic trade (18.3 percent), international trade (14.6 percent), housing & construction (12.9 percent), and agriculture (10 percent). The remaining balance was taken up by other economic sectors.
In the meantime, the loan collection of the banking sector reached Birr 29.6 billion, about 24.4 percent higher than last year same period. Of the total loan collection, 60.6 percent was by private banks and 39.4 percent by public banks.
Total outstanding credit of the banking system (excluding credit to government) increased to Birr 405.7 billion, showing 22.9 percent annual growth. About 99.8 percent of the private banks and 48.1 percent of public banks loans went to finance the private sector.
2. insurance Sector
At the same time, the number of insurance companies stood at 17, of which 16 were private and one public. Their branches increased to542 from 504 a year ago. Of the total branches, about 53.9 percent were located in Addis Ababa. The total capital of insurance companies reached Birr 6.4billion, of which 75.6 percent was that of private insurance companies.
3. Microfinance institutions
There were 38 micro-finance institutions (MFIs) operating in the country. These MFIs mobilized Birr 32,4 billion in saving deposit which was 20.8 percent higher than last year same period. Total outstanding credit of the MFIs increased 34.3 percent to Birr 46.8 billion signifying the growing role of the institutions in poverty reduction and wealth creation among low income groups both in rural and urban areas. Their total asset also grew by 24.7 percent to reach Birr 67 billion at the end of September, 2018.
E. External Sector and foreign Exchange Developments
1. External Sector Development
During the first quarter of 2018/19, total merchandise export earnings (including electricity) amounted to USD 628 million depicting 7.4 percent decline vis-à-vis the same quarter of last year. This was due to lower earnings from export of coffee (5.2 percent),
First Quarter 2018/19 3
National Bank of Ethiopia Quarterly Bulletin
oilseeds (22.4 percent), pulses (5.3 percent), fruits & vegetables (5.1), flower (2.9 percent), gold (45.2 percent), live-animals (51.4 percent) and electricity (25.2 percent). The slowdown in export revenue was attributed to lower export volume, prices or both.
In the meantime, total merchandise import bills declined 8.7 percent to USD 3.7 billion compared with the same quarter last year on account of lower imported capital goods (20.4 percent), consumer (6.1 percent), semi-finished (22,5 percent) and miscellaneous goods (30.5 percent). In contrast, the values of imported fuel surged 43.7 percent and that of raw materials 60.7 percent.
As a point of reference for international oil price, the average price of Brent crude oil increased by 46 percent and reached USD 75.5 per barrel during the first quarter of 2018/19 vis-à-vis USD 51.7 a year ago.
As a result, domestic retail prices were adjusted upwards and the average retail prices of fuel in Addis Ababa rose by 11.8 percent to Birr 17.71 per liter from Birr 16 per liter a year ago owing to rise in jet fuel price by 63 percent. The prices of other types of petroleum products, however, were kept constant. Similarly, average retail prices slightly improved by 0.1 percent relative to the previous quarter due to improvement in retail prices of jet fuel while that of other types of petroleum products remained unchanged.
During the first quarter of 2018/19, total transfer receipts increased by 7.4 percent to about USD 1.8 billion. This growth was attributed to 11.7 percent increase in private transfers. Private individual transfers rose by 28.9 percent whereas NGO transfers declined by 51.7 percent.
Hence, the current account balance (including official transfers) registered USD 1.04 billion deficit during the first quarter of 2018/19, compared with USD 1.6 billion deficit a year ago. In contrast, capital
account surplus reached USD 963.3 million about, 27.7 percent lower than last year same period. This performance was attributed to (68.1 percent) slowdown in net official long term capital and 23 percent in FDI inflows.
As a result, the overall balance of payments recorded USD 69.1 million deficit compared to USD 321 million deficit registered a year earlier.
2. Exchange Rate Development
The weighted average official exchange rate depreciated by 18 percent during the first quarter of 2018/19 vis-à-vis the corresponding quarter of last year and reached Birr 27.4295/USD.
In contrast, the REERI appreciated by 4.8 percent in the same period, mainly due to rising domestic inflation and strengthening of USD relative to currencies of major trading partners. However, NEER depreciated by 3 percent during the same period.
f. federal Government fiscal operations
Total revenue and grants of the Federal government increased by 9.6 percent annually in the first quarter of 2018/19 and amounted to Birr 52.5 billion while its expenditure increased 1.8 percent to Birr 69.2 billion.
As a result, the overall fiscal deficit (including grants) narrowed to Birr 16.7 billion from about Birr 20 billion deficit last year same period.
G. investment
During the first quarter of 2018/19, a total of 544 investment projects having investment capital of Birr 5.9 billion became operational. Both the number of investment projects and investment capital grew by significant percent over the previous year same period, though they declined by 22 and 54.7 percent, respectively compared with the previous quarter.

First Quarter 2018/194
National Bank of Ethiopia Quarterly Bulletin
ii. ENERGY pRoDUCtioN aND pRoCESSiNG
table 2.1: Volume of petroleum products imported
(In Metric Ton)
petroleum products
2017/18 2018/19 percentage ChangeQtr. i Qtr. iV Qtr. i
a Share (in %) B Share (in %) C
Share
(in %)C/a C/B
Regular Gasoline (MGR) 106,706 12.1 120,356 11.9 120,070 13.2 12.5 (0.2)
Jet Fuel 165,269 18.7 188,432 18.7 205,742 22.7 24.5 9.2
Fuel Oil 21,005 2.4 21,995 2.2 11,146 1.2 (46.9) (49.3)
Gas Oil (ADO) 591,077 66.9 678,880 67.2 570,182 62.9 (3.5) (16.0)
total 884,058 100.0 1,009,662 100.0 907,140 100.0 2.6 (10.2)
Source: Ethiopian Petroleum Enterprise
and 24.5 percent in jet fuel while fuel oil and gas oil decline by 46.9 and 3.5 percent, respectively.
Of the total petroleum imports, gas oil accounted for 62.9 percent, followed by jet fuel (22.7 percent), regular gasoline (13.2 percent) and fuel oil (1.2 percent) (Table 2.1).
-
100,000
200,000
300,000
400,000
500,000
600,000
700,000
800,000
I II III IV I II III IV I II III IV I II III IV I II III IV I
2013/14 2014/15 2015/16 2016/17 2017/18 2018/19
In M
etric
Ton
Quarter
MGR
Jet Fuel
Fuel Oil
Gas Oil
fig.2.1: trends in the Volume of petroleum products imported
Source: Ethiopian Petroleum Enterprise
2.1. import of petroleum products
The volume of petroleum products imported during the first quarter of 2018/19 amounted to 907.1 thousand metric tons, about 2.6 percent higher than last year same quarter. This was attributed to 12.5 percent increase in import of regular gasoline

First Quarter 2018/19 5
National Bank of Ethiopia Quarterly Bulletin
Petroleum import bill reached Birr 17.3 billion, showing a 69.2 percent growth over last year same quarter owing to a surge in international oil price and import volume. With the exception of fuel oil, all petroleum products saw higher import bill during the review quarter, where jet fuel import showed a 108.4 percent hike followed by regular gasoline (72.7 percent) and gas oil (59.7 percent).
Compared with the previous quarter, the values of petroleum import depicted a 6.8 percent decline as a result of 46.3 and 13 percent contraction in fuel oil and gas oil imports, respectively. The price of jet fuel and regular gasoline, however, increased by 10.5 and 2.9 percent (Table 2.2).
table 2.2: Value of petroleum products imported
(In ‘000Birr)
petroleum products
2017/18 2018/19 percentage ChangeQtr. i Qtr. iV Qtr. i
a Share (in %) B Share (in
%) C Share (in %) C/a C/B
Regular Gasoline (MGR) 1,439,863.4 14.1 2,416,393.1 13.0 2,486,744.5 14.4 72.7 2.9
Jet Fuel 1,946,721.3 19.1 3,670,725.3 19.8 4,057,132.0 23.5 108.4 10.5
Fuel Oil 202,620.8 2.0 305,294.8 1.6 163,887.3 0.9 -19.1 -46.3
Gas Oil (ADO) 6,628,347.0 64.9 12,159,334.8 65.5 10,584,147.2 61.2 59.7 -13.0
total 10,217,552.5 100.0 18,551,748.0 100.0 17,291,910.9 100.0 69.2 -6.8
Source: Ethiopian Petroleum Enterprise
fig.2.2: trends in the Value of petroleum products imported
-
2,000,000
4,000,000
6,000,000
8,000,000
10,000,000
12,000,000
14,000,000
I II III IV I II III IV I II III IV I II III IV I II III IV I
2013/14 2014/15 2015/16 2016/17 2017/18 2018/19
In '0
00 B
irr
Quarter
MGR
Jet Fuel
Fuel Oil
Gas Oil
Source: Ethiopian Petroleum Enterprise

First Quarter 2018/196
National Bank of Ethiopia Quarterly Bulletin
The average FOB price of petroleum products went up by 38.2 percent over last year same quarter due to higher FOB prices of fuel oil (46.2 percent), jet fuel (40.6 percent), gas oil (39.3 percent) and regular gasoline (30.7 percent) (Table 2.3).
table 2.3: foB price of petroleum products imported
(In USD/ Metric Ton)
petroleum products
2017/18 2018/19 percentage ChangeQtr. i Qtr. iV Qtr. i
a B C C/a C/B
Regular Gasoline (MGR)
551.8 708.2 721.2 30.7 1.8
Jet Fuel 493.2 682.0 693.7 40.6 1.7
Fuel Oil 303.6 419.7 443.9 46.2 5.8
Gas Oil (ADO) 466.8 634.5 650.3 39.3 2.5
average 453.8 611.1 627.3 38.2 2.7
Brent Crude Oil (USD/Barrel)
51.7 74.5 75.5 46.0 1.3
Source: Ethiopian Petroleum Enterprise
0.0
200.0
400.0
600.0
800.0
1000.0
1200.0
I II III IV I II III IV I II III IV I II III IV I II III IV I II III IV I
2012/13 2013/14 2014/15 2015/16 2016/17 2017/18 2017/18
USD
per M
etric
Ton
Quarter
MGR
Jet Fuel
Fuel Oil
Gas Oil
fig.2.3: trends in the foB price of imported petroleum products
Source: Ethiopian Petroleum Enterprise
During the first quarter of 2018/19, the average price of Brent crude oil, which is used as a point of reference for international oil price, surged by 46 percent and reached USD 75.5 per barrel compared with USD 51.7 a year ago. It also rose 1.3 percent against the previous quarter (Table 2.3).
In line with movements in international oil prices and domestic macroeconomic considerations, retail prices of petroleum products were adjusted upwards against last year same quarter. Thus, average retail price of fuel in Addis Ababa rose by 11.8 percent to Birr 17.9 per liter from Birr 16 a year ago owing to rise in price of jet fuel by (63 percent). While the price of other types of petroleum product kept constant. Similarly, with the exception of jet fuel, retail prices of all petroleum products were kept constant compared with the previous quarter (Table 2.4).

First Quarter 2018/19 7
National Bank of Ethiopia Quarterly Bulletin
table 2.4: addis ababa average Retail prices of fuel
(Birr/Liter)
petroleum products
2017/18 2018/19percentage Change
Qtr. i Qtr. iV Qtr. i
a B C C/a C/B
Regular Gasoline (MGR) 18.77 18.77 18.77 0.0 0.0
Fuel Oil 13.69 13.69 13.69 0.0 0.0
Gas Oil (ADO) 16.35 16.35 16.35 0.0 0.0
Kerosene 16.35 16.35 16.35 0.0 0.0
Jet fuel 15.04 24.37 24.50 63.0 0.6
average 16.04 17.91 17.93 11.8 0.1
Source: Ministry of Trade
fig.2.4: trends of addis ababa average Retail prices
0
10
20
30
40
50
60
I II III IV I II III IV I II III IV I II III IV I II III IV I II III IV I II III IV I II III IV I
2010/11 2011/12 2012/13 2013/14 2014/15 2015/16 2016/17 2017/182018/19
MGR Fuel Oil Gas Oil Kerosene Jet Fuel
Source: Ministry of Trade
2.2. Electric power Generation
Electric power generated during the first quarter of 2018/19 was 1.8 billion KWH, about 47.6 percent lower than a year ago. This was owing to 46.4 percent decline in production from hydropower and 69.9 percent in wind sources. Electric power generated from thermal power was not reported during the review quarter.
Of the total energy generated, about 98.1 percent
was from hydropower and 1.9 percent from wind (Table 2.5).
By system of generation, virtually all the power was generated through inter connected system (ICS)2 while self-contained system (SCS)3 had minimal share.
2 The generated power from different power stations stored in substations before distribution3 Power stations distribute the generated power independently
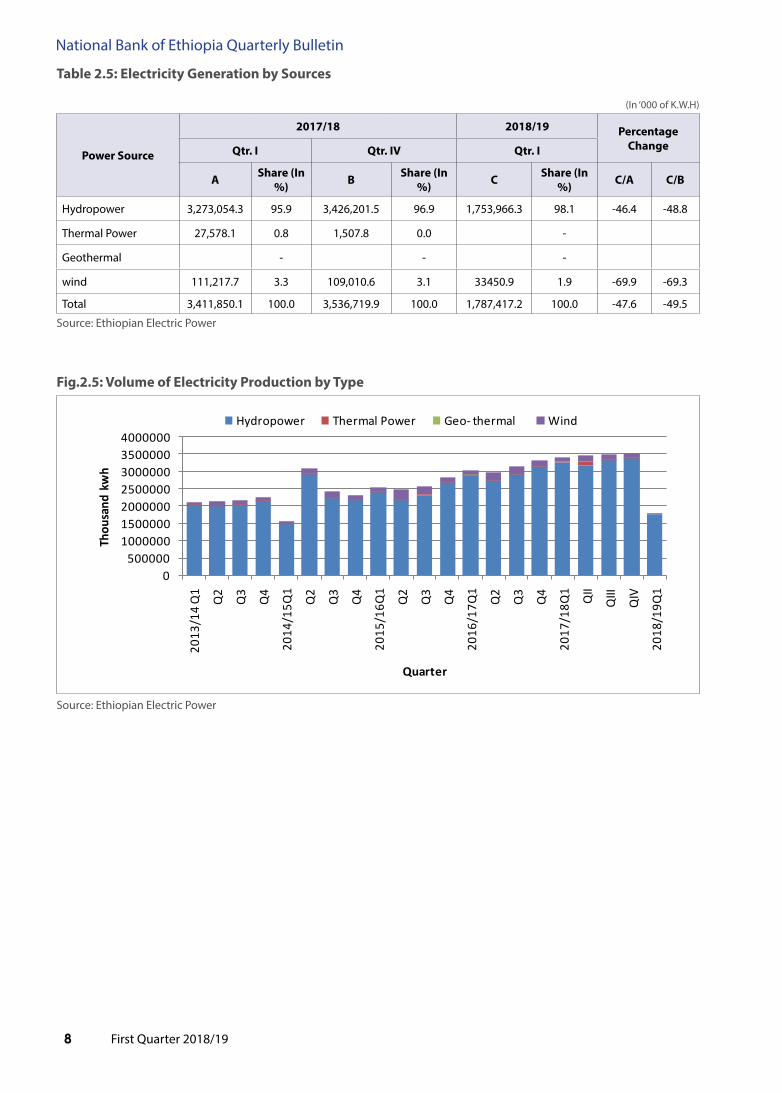
First Quarter 2018/198
National Bank of Ethiopia Quarterly Bulletin
table 2.5: Electricity Generation by Sources
(In ‘000 of K.W.H)
power Source
2017/18 2018/19 percentage ChangeQtr. i Qtr. iV Qtr. i
a Share (in %) B Share (in
%) C Share (in %) C/a C/B
Hydropower 3,273,054.3 95.9 3,426,201.5 96.9 1,753,966.3 98.1 -46.4 -48.8
Thermal Power 27,578.1 0.8 1,507.8 0.0 -
Geothermal - - -
wind 111,217.7 3.3 109,010.6 3.1 33450.9 1.9 -69.9 -69.3
Total 3,411,850.1 100.0 3,536,719.9 100.0 1,787,417.2 100.0 -47.6 -49.5
Source: Ethiopian Electric Power
fig.2.5: Volume of Electricity production by type
0500000
1000000150000020000002500000300000035000004000000
2013
/14
Q1
Q2
Q3
Q4
2014
/15Q
1
Q2
Q3
Q4
2015
/16Q
1
Q2
Q3
Q4
2016
/17Q
1
Q2
Q3
Q4
2017
/18Q
1
QII
QIII
QIV
2018
/19Q
1
Thou
sand
kw
h
Quarter
Hydropower Thermal Power Geo- thermal Wind
Source: Ethiopian Electric Power

First Quarter 2018/19 9
National Bank of Ethiopia Quarterly Bulletin
iii. QUaRtERlY pRiCE DEVElopMENtS
both food & non-alcoholic beverages inflation and non-food inflation. Milk, cheese & eggs, oils & fats, fruits & vegetables, sugar jam, honey & chocolate and non-alcoholic beverages saw inflationary pressure on annual terms, while vegetables, sugar jam, honey and chocolate as well as non-alcoholic beverages contributed to the quarterly inflation. In a nutshell, food & non-alcoholic beverages and non-food inflations contributed 2.0 and 1.0 percent, respectively, to the headline inflation in the review period (Table 3.1 and Fig 3.1).
Source: CSA
table 3.1: Quarterly National General Consumer prices (%) (Dec2011=100)
items
Weights in %
2017/18 2018/19 Change in %age points Contributions in (%) to
Qi QiV Qi
a B C C-a C-B
headline inflation
Change over Qi-2017/18
headline inflation
Change over QiV-2017/18
Qi. 2018/19 headline inflation
absolute Relative
Headline 100 3.8 4.0 3.0 -0.8 -1.0 -0.8 -1.0 3.0 100
Food & Non-alcoholic beverage
53 4.5 5.4 3.7 -0.8 -1.7 -0.4 -0.9 2.0 67.2
Non-food 47 3.0 2.4 2.2 -0.8 -0.2 -0.4 -0.1 1.0 32.8
Source: CSA and NBE Staff Computation
3.1 Developments in National Cpi
During the first quarter of 2018/19, headline inflation scaled down to 3.0 percent from 4.0 percent and 3.8 percent in the preceding quarter and same period last year, respectively. The decline in quarterly headline inflation was attributed largely to the 1.7 percentage point deceleration in food & non-alcoholic beverages inflation and 0.2 percentage points marginal drop in non-food inflation. Likewise, the headline inflation declined slightly on annual terms owing to the 0.8 percentage points drop in

First Quarter 2018/1910
National Bank of Ethiopia Quarterly Bulletin
fig.3.2: Contribution of food and Non-food inflations to headline inflation in first Quarter- 2018/19
Source: NBE Staff Computation
table 3.2: Quarterly National food & non-alcoholic beverages Cpi inflation Dec2011=100)
items Weights
2017/18 2018/19 Change in %age points Contribution to
Qi QiV Qi
a B C C-a C-B
headline inflation Change over Qi-2017/18
headline inflation Change over QiV-2017/18
food & Non-alcoholic beverages inflation 52.8 4.5 5.4 3.7 -0.8 -1.7 -0.42 -0.91
Bread & Cereals 18.5 11.3 8.3 5.1 -6.2 -3.2 -1.14 -0.59
Meat 4.3 4.5 10.3 3.5 -1.0 -6.8 -0.04 -0.29
Milk, cheese & egg 2.2 -0.3 7.2 3.9 4.2 -3.3 0.09 -0.07
Oils & Fats 3.7 -1.6 5.6 -0.1 1.6 -5.6 0.06 -0.21
Fruit 0.3 11.4 0.6 -0.3 -11.7 -0.9 -0.03 0.00
Vegetables 13.5 -1.6 0.3 2.3 3.9 2.0 0.53 0.27
Sugar jam, honey, chocolate 1.0 0.8 0.6 1.8 1.0 1.2 0.01 0.01
Food products n.e.c 4.7 5.7 5.2 3.5 -2.2 -1.7 -0.10 -0.08
Non-alcoholic beverages 4.6 5.2 4.8 7.1 1.9 2.3 0.09 0.11
Source: CSA and NBE Staff Computation

First Quarter 2018/19 11
National Bank of Ethiopia Quarterly Bulletin
table 3.3: Quarterly National Non-food Cpi inflations (Dec2011=100)
items Weights
2017/18 2018/19 Change in %age points Contribution to
Qi QiV Qi
a B C C-a C-B
headline inflation Change over Qi-2017/18
headline inflation Change over QiV-2017/18
Non-food inflation 47.2 3.0 2.4 2.2 -0.8 -0.2 -0.38 -0.09
Alcoholic Beverages and tobacco 4.9 13.5 -4.4 3.3 -10.2 7.7 -0.49 0.37
Clothing and Footwear 6.6 2.1 4.9 2.7 0.5 -2.2 0.03 -0.15
Housing, Water, Electricity, Gas and other Fuel 16.3 1.4 1.3 0.5 -0.9 -0.7 -0.14 -0.12
Furnishings, Household Equipment and Routine maintenance of houses 5.4 2.5 6.1 4.9 2.4 -1.3 0.13 -0.07
Health 1.1 -5.1 1.9 3.9 9.0 2.0 0.10 0.02
Transport 2.8 2.3 4.1 -0.7 -3.0 -4.9 -0.08 -0.14
Communication 1.1 -0.4 0.4 0.2 0.6 -0.2 0.01 0.00
Recreation and culture 0.6 1.6 2.9 2.7 1.1 -0.2 0.01 0.00
Education 0.4 0.0 0.0 -0.1 -0.1 -0.1 0.00 0.00
Restaurant & hotel 5.5 4.6 4.2 3.5 -1.1 -0.7 -0.06 -0.04
Miscellaneous Goods 2.6 0.7 5.1 2.7 2.1 -2.4 0.05 -0.06
Source: CSA and NBE Staff Computation
3.2 Developments in Regional Cpi
In the first quarter of 2018/19, the regional average headline inflation climbed to 3.7 percent from 3.1 percent in the preceding quarter. It was also slightly higher than the 3.6 percent regional average headline inflation of last year same quarter.
Headline inflation higher than the regional average headline inflation was seen in Somali, Dire Dawa, Tigray, Benishangul Gumuz, Gambella and Addis Ababa reginal states. While Somali region experienced the highest headline inflation (7.0 percent), Harari enjoyed the lowest headline inflation (-0.9 percent), resulting in a 7.9 percentage point margin between the headline inflations of the two regional states.
The deviation4 in the regional headline inflation rates from the average, as represented by standard deviation, fell to 2.3 percent from the 2.5 percent in the preceding quarter (Table 3.4).
Similarity, the regional average food & non-alcoholic beverages inflation rose to 5.7 percent from 4.9 percent last year same quarter. Among the regional states, Somali, Tigray, Harari, Dire Dawa, Benishangul and Gambella registered food & non-alcoholic beverages inflation higher than the
4 The standard deviation shows how much dispersion exists from the average value.
regional average. Food & non-alcoholic beverages inflation was the highest in Somali (8.4 percent) and the lowest in Oromia (1.8 percent), depicting a 6.6 percentage point margin between the two regions. The variation in food & non-alcoholic beverages inflation measured by standard deviation declined to 2.1 percent from 2.8 percent recorded in the preceding quarter (Table 3.4).
On the other hand, the regional average non-food inflation at 1.4 percent was lower than the 2.3 percent registered a year ago. Dire Dawa, Somali, Tigray, Addis Ababa, Oromia, SNNP and Benishangul saw non-food inflation higher than the regional average.
Non-food inflation was the highest in Dire Dawa (5.7 percent) and the lowest in Harari (-9.4 percent), indicating a 15.1 percentage point margin between the two regions.
The variation in non-food inflation measured by the standard deviation increased to 4.0 percent in the review from 3.0 percent a year earlier (Table 3.4).

First Quarter 2018/1912
National Bank of Ethiopia Quarterly Bulletinta
ble
3.4:
ann
ualiz
ed R
egio
nal G
ener
al, f
ood
& n
on-a
lcoh
olic
bev
erag
es a
nd N
on-f
ood
infla
tion
Regi
ons
2017
/18
2018
/19
ann
ual C
hang
e Q
uart
erly
Cha
nge
Qi
QiV
Qi
aB
CC-
aC-
B
Gen
eral
food
&
Non
-al
coho
lic
beve
rage
s
Non
-fo
odG
ener
al
food
&
Non
-al
coho
lic
beve
rage
s
Non
-fo
odG
ener
al
food
&
Non
-al
coho
lic
beve
rage
s
Non
-fo
odG
ener
al
food
&
Non
-al
coho
lic
beve
rage
s
Non
-fo
odG
ener
alfo
od &
Non
-al
coho
lic
beve
rage
s
Non
-fo
od
SNN
P3.
02.
43.
73.
44.
22.
62.
63.
31.
9-0
.50.
9-1
.8-0
.8-0
.9-0
.7
Har
ari
0.8
5.6
-4.4
2.2
6.2
-1.6
-0.9
7.3
-9.4
-1.8
1.7
-5.0
-3.1
1.1
-7.8
Oro
mia
3.0
4.2
3.7
3.3
3.9
2.5
2.2
1.8
2.6
-0.8
-2.3
-1.1
-1.1
-2.1
0.1
Tigr
ay5.
44.
66.
15.
57.
63.
45.
47.
92.
90.
03.
3-3
.2-0
.10.
3-0
.5
Gam
bella
5.0
6.1
2.9
7.6
10.1
3.0
4.5
6.4
0.9
-0.5
0.3
-2.0
-3.1
-3.7
-2.1
Addi
s A
baba
2.1
4.4
0.4
3.8
4.6
3.2
3.9
5.4
2.8
1.8
1.1
2.4
0.1
0.8
-0.4
Dire
Daw
a0.
73.
5-1
.11.
33.
4-0
.16.
37.
35.
75.
73.
76.
95.
03.
95.
8
Bens
hang
ul G
umuz
8.3
11.8
3.4
3.9
3.4
4.6
4.5
6.7
1.5
-3.8
-5.1
-1.9
0.6
3.3
-3.1
Som
ali
0.8
-1.8
3.6
-0.5
5.8
-6.7
7.0
8.4
5.4
6.2
10.3
1.9
7.5
2.6
12.1
Afa
r3.
85.
62.
0-0
.9-0
.6-1
.22.
03.
80.
1-1
.8-1
.8-2
.02.
94.
41.
3
Am
hara
6.7
7.9
5.3
5.0
7.2
2.8
3.1
4.8
1.2
-3.6
-3.2
-4.1
-1.9
-2.4
-1.6
Regi
ons
Aver
age
3.6
4.9
2.3
3.1
5.1
1.1
3.7
5.7
1.4
Stan
dard
dev
iatio
n2.
53.
43.
02.
52.
83.
32.
32.
14.
0
Coeffi
cien
t of v
aria
tion
0.7
0.7
1.3
0.8
0.6
2.9
0.6
0.4
2.8
Sou
rce:
CSA
and
NBE
Sta
ff Co
mpu
tatio
n

First Quarter 2018/19 13
National Bank of Ethiopia Quarterly Bulletin
iV. MoNEtaRY DEVElopMENtS
Source: Staff Computation, NBE
4.1. Money Supply and Credit
In the first quarter of 2018/19 fiscal year, broad mon-ey supply (M2) stood at Birr 752.1 billion showing a 24.9 percent annual growth, which was attributed to
22.5 percent expansion in domestic credit and 21.6 percent increase in external assets (net) (Table 4.1).
table 4.1: Components of Broad Money
(In Millions of Birr)
particularsQtr. i Qtr. iV Qtr. i
percentage Change
Contributions of Each Component to Broad
Money Growth
(Sep. 17) (Jun. 18) (Sep. 18) C/a C/Bannual
a B C
1. External Assets (net) 30,984.6 39,376.2 37,942.3 22.5 -3.6 4.6
2. Domestic Credit 655,286.8 784,633.1 796,994.9 21.6 1.6 94.6
Claims on Central Gov’t (net) 96,221.3 102,002.8 103,205.5 7.3 1.2 4.7
Claims on Non-Central Gov’t 559,065.5 682,630.3 693,789.3 22.1 1.6 82.5
Financial Institutions 27,226.0 47,292.7 46,992.7 72.6 -0.6 13.2
Others 531,839.5 635,337.6 646,796.6 21.6 1.8 76.7
3. Other Items (net) 83,966.4 83,436.4 82,805.7 -1.4 -0.8 -0.8
4. Broad Money (M2) 602,305.0 740,572.9 752,131.4 24.9 1.6 100.0Source: Staff Computation, NBE
fig.iV.1: Major Determinants of Monetary Expansion
(Quarterly Change in Percent)

First Quarter 2018/1914
National Bank of Ethiopia Quarterly Bulletin
fig.iV.2: Composition of Domestic Credit (Quarterly Change in Percent)
Source: Staff computation, NBE
Component wise, quasi-money supply exhibited an annual expansion of 30.3 percent while narrow money supply grew by 16.0 percent presumably due to customers’ diversion of their demand deposits to quasi money deposits to gain better interest rate. Double digit inflation rate might also have contributed towards this effect. Year-on-year basis, narrow money contributed 38.5 percent to the
growth of broad money, while that of quasi money
was 61.5 percent (Table 4.2).
The surge in quasi-money was attributed to
expanding bank branch network and NBE’s policy to
increase the minimum deposit interest rate from 5
percent to 7 percent.
table 4.2: Components of Broad Money
(In millions of Birr, unless specified)
particulars
Qtr. i Qtr. iV Qtr. i percentage Change
Contributions of Each Component to Broad Money
Growth
(Sep. 17) (Jun. 18) (Sep. 18) C/a C/B annual
a B C
1. Narrow Money Supply 229,515.0 281,154.7 266,262.2 16.0 -5.3 24.5
Currency outside banks 73,927.0 86,417.3 83,380.0 12.8 -3.5 6.3
Demand Deposits (net) 155,587.9 194,737.4 182,882.2 17.5 -6.1 18.2
2. Quasi-Money 372,790.0 459,418.2 485,869.2 30.3 5.8 75.5
Savings Deposits 306,899.4 382,549.4 407,170.8 32.7 6.4 66.9
Time Deposits 65,890.6 76,868.8 78,698.5 19.4 2.4 8.5
3. Broad Money Supply 602,305.0 740,572.9 752,131.4 24.9 1.6 100.0
Source: Staff Computation, NBE

First Quarter 2018/19 15
National Bank of Ethiopia Quarterly Bulletin
fig.iV.3: Composition of Monetary Stock
Source: Staff computation, NBE
4.2. Developments in Reserve Money and Mone tary Ratio
During the review quarter, reserve money reached Birr 174.8 billion, showing a 25.5 percent year-on-year growth. Excess reserves of commercial banks’ decreased by 15.2 percent.
The money multiplier, measured by the ratio of
broad money to reserve money and narrow money to reserve money tended to rise year-on-year where the ratio of broad money to reserve money increased by 8.6 percent. Commercial banks’ strong performance in mobilizing time and saving deposit has contributed to higher money multiplier (Table 4.3).table 4.3: Monetary aggregates and Ratios
(In millions of Birr unless otherwise indicated)
particulars
Qtr. i Qtr. iV Qtr. ipercentage Change
(Sep. 17) (Jun. 18) (Sep. 18)
a B C C/a C/B
1. Reserve Requirement (CB’s) 29,781.3 36,385.8 37,381.3 25.5 2.7
2. actual Reserve (CB’s) 60,648.2 63,117.8 63,566.3 4.8 0.7
3. Excess Reserve (CB’s) 30,866.9 26,732.0 26,185.0 -15.2 -2.0
4. Reserve Money 152,004.9 174,175.4 174,816.5 15.0 0.4
. Currency in Circulation 94,962.7 112,911.0 110,876.5 16.8 -1.8
. Banks deposits at NBE 57,042.2 61,264.5 63,940.0 12.1 4.4
5. Money Multiplier (Ratio):
. Narrow Money to Reserve Money 1.5 1.6 1.5 0.9 -5.6
. Broad Money to Reserve Money 4.0 4.3 4.3 8.6 1.2
6. other Monetary Ratios (%):
. Currency to Narrow Money 41.4 40.2 41.6 0.6 3.7
. Currency to Broad Money 15.8 15.2 14.7 -6.5 -3.3
. Narrow Money to Broad Money 38.1 38.0 35.4 -7.1 -6.8
. Quasi Money to Broad Money 61.9 62.0 64.6 4.4 4.1
Source: Staff Computation, NBE

First Quarter 2018/1916
National Bank of Ethiopia Quarterly Bulletin
fig.iV.4: Quarterly Growth of Reserve Money and its Components
Source: Staff Computation NBE
fig.5: Monetary aggregates
0.0
10,000.0
20,000.0
30,000.0
40,000.0
50,000.0
60,000.0
70,000.0
In m
illio
ns o
f Birr
Required Reserve Actual Reserve Excess Reserve
Source: Staff Computation NBE
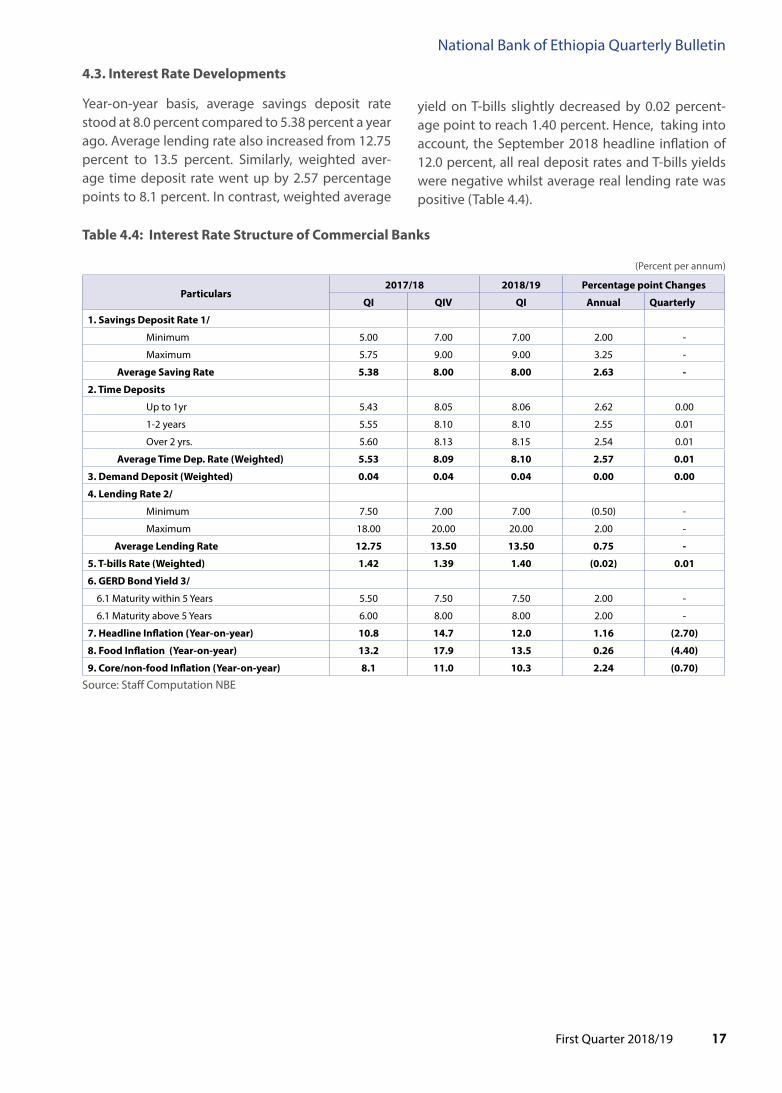
First Quarter 2018/19 17
National Bank of Ethiopia Quarterly Bulletin
4.3. interest Rate Developments
Year-on-year basis, average savings deposit rate stood at 8.0 percent compared to 5.38 percent a year ago. Average lending rate also increased from 12.75 percent to 13.5 percent. Similarly, weighted aver-age time deposit rate went up by 2.57 percentage points to 8.1 percent. In contrast, weighted average
yield on T-bills slightly decreased by 0.02 percent-age point to reach 1.40 percent. Hence, taking into account, the September 2018 headline inflation of 12.0 percent, all real deposit rates and T-bills yields were negative whilst average real lending rate was positive (Table 4.4).
table 4.4: interest Rate Structure of Commercial Banks
(Percent per annum)
particulars 2017/18 2018/19 percentage point Changes
Qi QiV Qi annual Quarterly
1. Savings Deposit Rate 1/
Minimum 5.00 7.00 7.00 2.00 -
Maximum 5.75 9.00 9.00 3.25 -
average Saving Rate 5.38 8.00 8.00 2.63 -
2. time Deposits
Up to 1yr 5.43 8.05 8.06 2.62 0.00
1-2 years 5.55 8.10 8.10 2.55 0.01
Over 2 yrs. 5.60 8.13 8.15 2.54 0.01
average time Dep. Rate (Weighted) 5.53 8.09 8.10 2.57 0.01
3. Demand Deposit (Weighted) 0.04 0.04 0.04 0.00 0.00
4. lending Rate 2/
Minimum 7.50 7.00 7.00 (0.50) -
Maximum 18.00 20.00 20.00 2.00 -
average lending Rate 12.75 13.50 13.50 0.75 -
5. t-bills Rate (Weighted) 1.42 1.39 1.40 (0.02) 0.01
6. GERD Bond Yield 3/
6.1 Maturity within 5 Years 5.50 7.50 7.50 2.00 -
6.1 Maturity above 5 Years 6.00 8.00 8.00 2.00 -
7. headline inflation (Year-on-year) 10.8 14.7 12.0 1.16 (2.70)
8. food inflation (Year-on-year) 13.2 17.9 13.5 0.26 (4.40)
9. Core/non-food inflation (Year-on-year) 8.1 11.0 10.3 2.24 (0.70)
Source: Staff Computation NBE

First Quarter 2018/1918
National Bank of Ethiopia Quarterly Bulletin
fig.iV.6: interest Rate Structure of Commercial Banks
(In percent per annum)
Source: NBE and Commercial Banks
fig.iV.7: average lending Rate, average Saving Deposit Rate, 91-day t-bills Yield & Core inflation Rate
(in percent per annum)
*While the inflation rate (core) is depicted on the right axis lending rate, 91 day T-bills yield and average saving deposit rate is
depicted on the left axis
Source: Staff computation, NBE
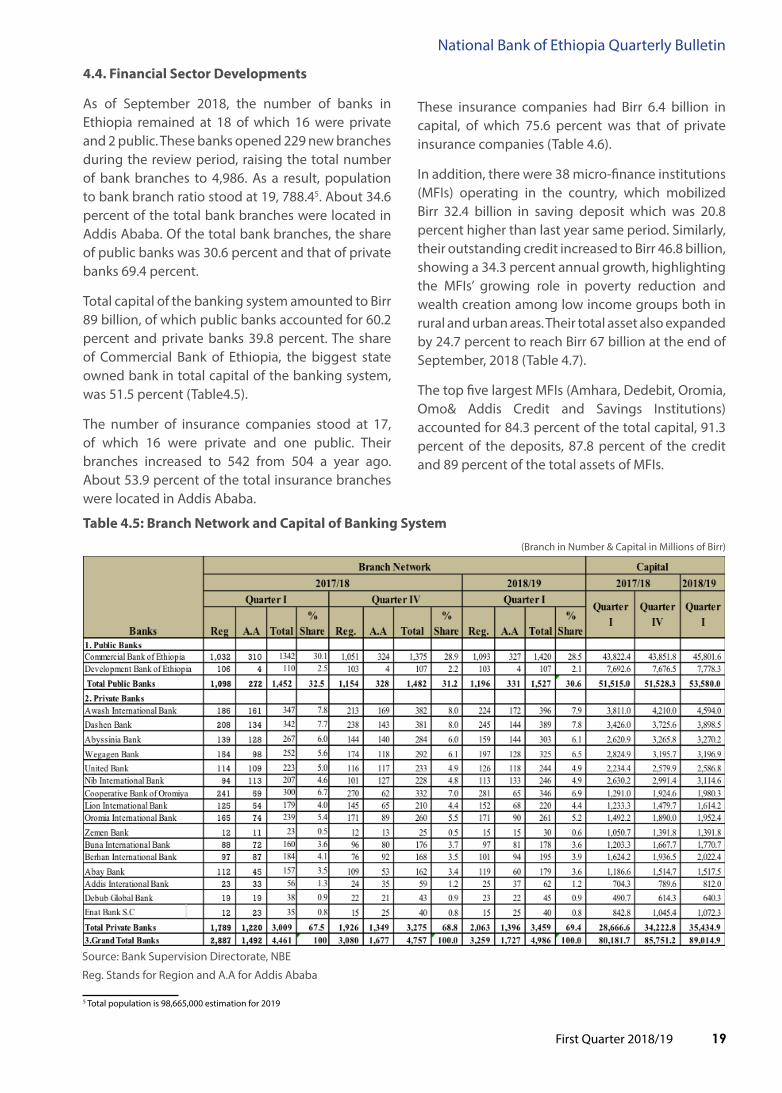
First Quarter 2018/19 19
National Bank of Ethiopia Quarterly Bulletin
4.4. financial Sector Developments
As of September 2018, the number of banks in Ethiopia remained at 18 of which 16 were private and 2 public. These banks opened 229 new branches during the review period, raising the total number of bank branches to 4,986. As a result, population to bank branch ratio stood at 19, 788.45. About 34.6 percent of the total bank branches were located in Addis Ababa. Of the total bank branches, the share of public banks was 30.6 percent and that of private banks 69.4 percent.
Total capital of the banking system amounted to Birr 89 billion, of which public banks accounted for 60.2 percent and private banks 39.8 percent. The share of Commercial Bank of Ethiopia, the biggest state owned bank in total capital of the banking system, was 51.5 percent (Table4.5).
The number of insurance companies stood at 17, of which 16 were private and one public. Their branches increased to 542 from 504 a year ago. About 53.9 percent of the total insurance branches were located in Addis Ababa.
5 Total population is 98,665,000 estimation for 2019
These insurance companies had Birr 6.4 billion in capital, of which 75.6 percent was that of private insurance companies (Table 4.6).
In addition, there were 38 micro-finance institutions (MFIs) operating in the country, which mobilized Birr 32.4 billion in saving deposit which was 20.8 percent higher than last year same period. Similarly, their outstanding credit increased to Birr 46.8 billion, showing a 34.3 percent annual growth, highlighting the MFIs’ growing role in poverty reduction and wealth creation among low income groups both in rural and urban areas. Their total asset also expanded by 24.7 percent to reach Birr 67 billion at the end of September, 2018 (Table 4.7).
The top five largest MFIs (Amhara, Dedebit, Oromia, Omo& Addis Credit and Savings Institutions) accounted for 84.3 percent of the total capital, 91.3 percent of the deposits, 87.8 percent of the credit and 89 percent of the total assets of MFIs.
table 4.5: Branch Network and Capital of Banking System
(Branch in Number & Capital in Millions of Birr)
Source: Bank Supervision Directorate, NBE
Reg. Stands for Region and A.A for Addis Ababa
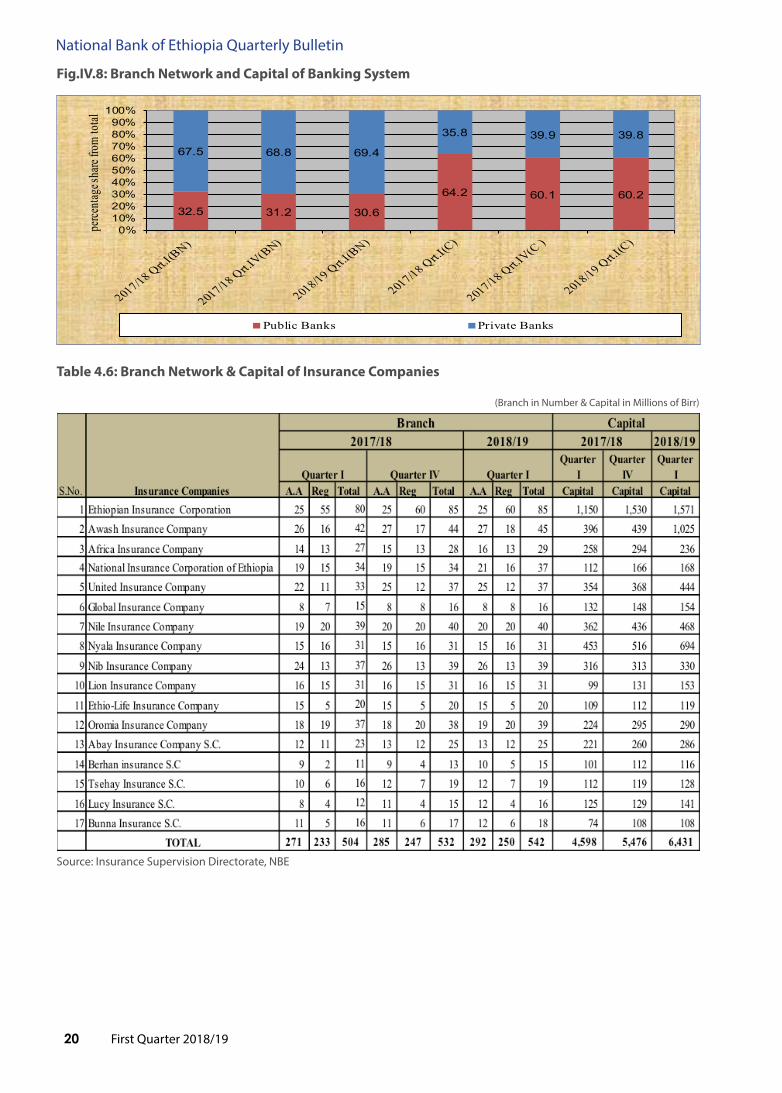
First Quarter 2018/1920
National Bank of Ethiopia Quarterly Bulletin
32.5 31.2 30.6
64.2 60.1 60.2
67.5 68.8 69.4
35.8 39.9 39.8
0%10%20%30%40%50%60%70%80%90%
100%
perce
ntag
e sha
re fro
m to
tal
Public Banks Private Banks
fig.iV.8: Branch Network and Capital of Banking System
table 4.6: Branch Network & Capital of insurance Companies
(Branch in Number & Capital in Millions of Birr)
Source: Insurance Supervision Directorate, NBE

First Quarter 2018/19 21
National Bank of Ethiopia Quarterly Bulletin
table 4.7: Microfinance institutions performance as of September 30, 2018
(In Thousands of Birr)
Source: Microfinance Supervision Directorate, NBE
4.5. activities of the Banking System
4.5.1. Resource Mobilization
Total resources mobilized by the banking system (the sum of net change in deposit, loans collected and net change in borrowings) showed a 5.8 percent slowdown over the same quarter of last year (Table 4.8).
table 4.8: Summary of Resource Mobilization & Disbursement of the Banking System
(In Millions of Birr)
Source: Commercial Banks and staff computation
Notes: *Excludes bonds and treasury bills holding of commercial banks and Development Bank of Ethiopia (DBE)

First Quarter 2018/1922
National Bank of Ethiopia Quarterly Bulletin
fig.iV.9: trends in Resource Mobilization and Disbursement of loans
(20,000.0)
-
20,000.0
40,000.0
60,000.0
80,000.0
100,000.0
120,000.0
I II III IV I II III IV I II III IV I II III IV I II III IV I II III IV I II III IV I II III IV I II III IV I II III IV I II III IV I II III IV I
06/07 07/08 08/09 09/10 10/11 11/12 12/13 13/14 14/15 15/16 16/17 17/18 18/19
In Mi
llions
of B
irr
Total Mobilization Net Deposit Collection of Loans Disbursement of Loans
Source: Staff computation, NBE
4.5.1.1. Deposit Mobilization
At the end of September 2018, total deposit liabilities of the banking system reached Birr 750.4 billion, indicating a 25.3 percent annual growth, which signified strong expansion of bank branches and improved access to finance, growing saving culture of the society and an increase in per capita income.
Demand deposits accounted for 35.2 percent of total deposits and reached Birr 264.3 billion showing a 17.1 percent annual growth. Similarly, saving deposits went up 32.7 percent and its share in total deposits reached 54.3 percent. Time deposits, which constituted 10.5 percent of the total deposit liabilities, increased 19.4 percent over the same period of last year. The share of public banks in total deposits outstanding was 61.3 percent and that of private banks 38.7 percent (Table 4.9).
table 4.9: Stock of Deposits Mobilized by the Banking System
(In Millions of Birr)
-5.0
0.0
5.0
10.0
15.0
20.0
I II III IV I II III IV I II III IV I II III IV I II III IV I II III IV I II III IV I II III IV I II III IV I II III IV I II III IV I II III IV I
06/07 07/08 08/09 09/10 10/11 11/12 12/13 13/14 14/15 15/16 16/17 17/18 18/19
In p
erce
nt
Publlic Banks Private Banks All Banks
Quarter I Quarter IV Quarter I2017/18 2017/18 2018/19
A B CDemand Deposit 225,669.64 37.7 270,670.0 37.1 264,303.7 35.2 17.1 (2.4)Saving Deposit 306,938.10 51.3 382,583.5 52.4 407,208.2 54.3 32.7 6.4 Time Deposit 66,015.34 11.0 77,004.3 10.5 78,845.3 10.5 19.4 2.4 Total 598,623.07 100.0 730,257.7 100.0 750,357.3 100.0 25.3 2.8 Share of Public Banks 64.2 62.2 61.3 Share of Private Banks 35.8 37.8 38.7
C/A C/B
% Share
Deposit by types %
Share%
Share
Source: Commercial Banks and DBE
fig.iV.10: Quarterly Growth of Banks Deposit liabilities by ownership
Source: Staff Computation, NBE

First Quarter 2018/19 23
National Bank of Ethiopia Quarterly Bulletin
4.5.1.2. Collection of loans
During the review period, banks collected loans to the tune of Birr 29.6 billion, about 24.4 percent higher than a year earlier (Table 4.8). Of the total loans collected, the share of private banks was 60.6 percent and that of public banks 39.4 percent. About 89.5percent of the loan was collected from private enterprises (Table 4.12).
4.5.1.3. Borrowing
Total outstanding borrowing of the banking system stood at Birr 66.4 billion, showing a 64percent annual increase. Of the total borrowing, Birr 58.2billion (88 percent) was from domestic and Birr 8.1 billion (12 percent) from external sources (Table 4.10).
table 4.10: public outstanding Borrowing of the Banking System by Sources
(In Millions of Birr)
2018/19Quarter I Quarter IV Quarter I
A B C C/B C/ADomestic Borrowing 35,365.3 58,125.10 58,247.5 0.2 64.7 Foreign Borrowing 5,096.4 6,849.05 8,111.9 18.4 59.2 Total 40,461.7 64,974.2 66,359.4 2.1 64.0
Banks Percentage change 2017/18
Source: Commercial Banks and Development Bank of Ethiopia
- 10,000.00 20,000.00 30,000.00 40,000.00 50,000.00 60,000.00 70,000.00
QI QII
QIII
QIV QI QII
QIII
QIV QI QII
QIII
QIV QI QII
QIII
QIV QI QII
QIII
QIV QI QII
QIII
QIV QI QII
QIII
QIV QI QII
QIII
QIV QI QII
QIII
QIV QI QII
QIII
QIV QI QII
QIII
QIV QI QII
QIII
QIV QI
06/07 07/08 08/09 09/10 10/11 11/12 12/13 13/14 14/15 15/16 16/17 17/18 18/19
Value
in M
illion
Birr
Years/Quarters
Total Public Banks Private Banks
4.5.2. Disbursement of fresh loans
During the review quarter, banks disbursed Birr 30 billion in fresh loans, showing a 31.8 percent year-on-year growth. Of the total new loans disbursed, public banks accounted for 44.2 percent and private banks 55.8 percent (Table 4.12).
The major beneficiary of bank loans was industry which took Birr 8.6 billion (28.8 percent) followed by domestic trade (Birr 5.5 billion or 18.3 percent), international trade (Birr 4.4 billion or 14.6 percent), housing & construction (Birr 3.9 billion or 12.9 percent), and agriculture (Birr 3 billion or 10 percent). The remaining share was taken up by other economic sectors (Table4.11).
fig.iV.11: trends in fresh loan Disbursement by ownership
Source: Commercial Banks and Development Bank of Ethiopia
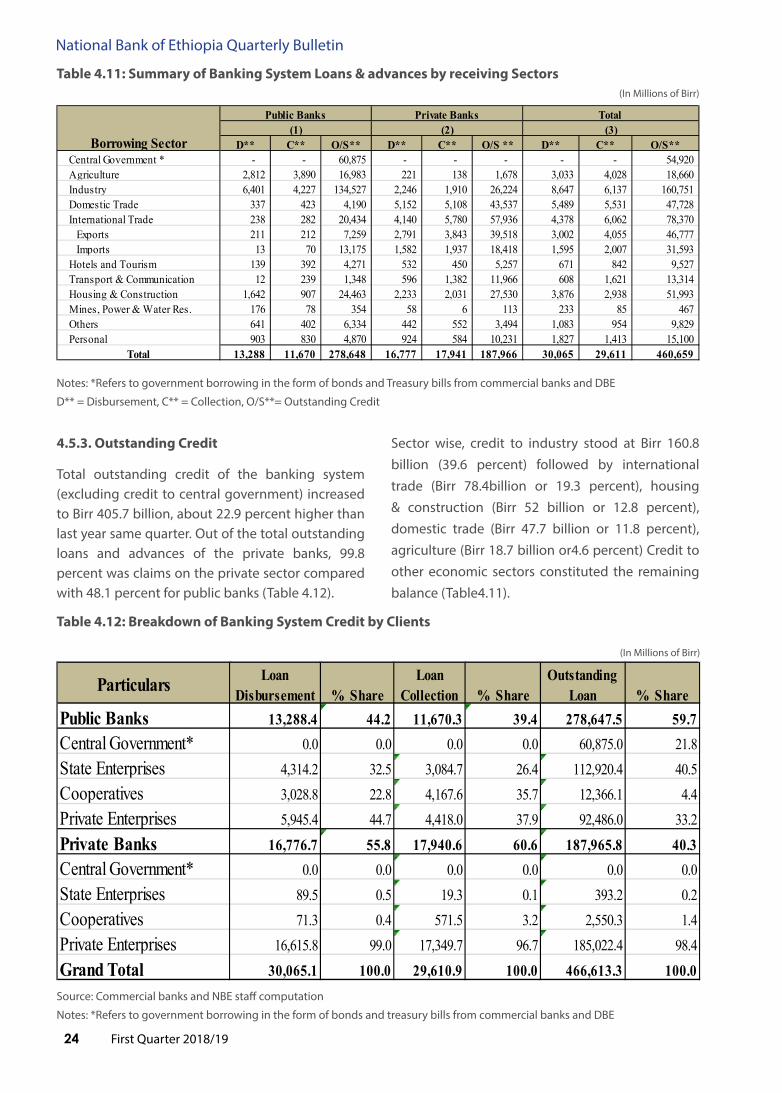
First Quarter 2018/1924
National Bank of Ethiopia Quarterly Bulletin
D** C** O/S** D** C** O/S ** D** C** O/S** Central Government * - - 60,875 - - - - - 54,920 Agriculture 2,812 3,890 16,983 221 138 1,678 3,033 4,028 18,660 Industry 6,401 4,227 134,527 2,246 1,910 26,224 8,647 6,137 160,751 Domestic Trade 337 423 4,190 5,152 5,108 43,537 5,489 5,531 47,728 International Trade 238 282 20,434 4,140 5,780 57,936 4,378 6,062 78,370 Exports 211 212 7,259 2,791 3,843 39,518 3,002 4,055 46,777 Imports 13 70 13,175 1,582 1,937 18,418 1,595 2,007 31,593 Hotels and Tourism 139 392 4,271 532 450 5,257 671 842 9,527 Transport & Communication 12 239 1,348 596 1,382 11,966 608 1,621 13,314 Housing & Construction 1,642 907 24,463 2,233 2,031 27,530 3,876 2,938 51,993 Mines, Power & Water Res. 176 78 354 58 6 113 233 85 467 Others 641 402 6,334 442 552 3,494 1,083 954 9,829 Personal 903 830 4,870 924 584 10,231 1,827 1,413 15,100
Total 13,288 11,670 278,648 16,777 17,941 187,966 30,065 29,611 460,659
Borrowing Sector
Public Banks Private Banks Total (1) (2) (3)
table 4.11: Summary of Banking System loans & advances by receiving Sectors (In Millions of Birr)
Notes: *Refers to government borrowing in the form of bonds and Treasury bills from commercial banks and DBE
D** = Disbursement, C** = Collection, O/S**= Outstanding Credit
4.5.3. outstanding Credit
Total outstanding credit of the banking system (excluding credit to central government) increased to Birr 405.7 billion, about 22.9 percent higher than last year same quarter. Out of the total outstanding loans and advances of the private banks, 99.8 percent was claims on the private sector compared with 48.1 percent for public banks (Table 4.12).
Particulars Loan Disbursement % Share
Loan Collection % Share
Outstanding Loan % Share
Public Banks 13,288.4 44.2 11,670.3 39.4 278,647.5 59.7Central Government* 0.0 0.0 0.0 0.0 60,875.0 21.8State Enterprises 4,314.2 32.5 3,084.7 26.4 112,920.4 40.5Cooperatives 3,028.8 22.8 4,167.6 35.7 12,366.1 4.4Private Enterprises 5,945.4 44.7 4,418.0 37.9 92,486.0 33.2Private Banks 16,776.7 55.8 17,940.6 60.6 187,965.8 40.3Central Government* 0.0 0.0 0.0 0.0 0.0 0.0State Enterprises 89.5 0.5 19.3 0.1 393.2 0.2Cooperatives 71.3 0.4 571.5 3.2 2,550.3 1.4Private Enterprises 16,615.8 99.0 17,349.7 96.7 185,022.4 98.4Grand Total 30,065.1 100.0 29,610.9 100.0 466,613.3 100.0
Sector wise, credit to industry stood at Birr 160.8 billion (39.6 percent) followed by international trade (Birr 78.4billion or 19.3 percent), housing & construction (Birr 52 billion or 12.8 percent), domestic trade (Birr 47.7 billion or 11.8 percent), agriculture (Birr 18.7 billion or4.6 percent) Credit to other economic sectors constituted the remaining balance (Table4.11).
table 4.12: Breakdown of Banking System Credit by Clients
(In Millions of Birr)
Source: Commercial banks and NBE staff computation
Notes: *Refers to government borrowing in the form of bonds and treasury bills from commercial banks and DBE

First Quarter 2018/19 25
National Bank of Ethiopia Quarterly Bulletin
fig.iV.12: Share of public and private Banks in Credit outstanding
0.010.020.030.040.050.060.070.080.0
QI QII
QIII
QIV QI QII
QIII
QIV QI QII
QIII
QIV QI QII
QIII
QIV QI QII
QIII
QIV QI QII
QIII
QIV QI QII
QIII
QIV QI QII
QIII
QIV QI QII
QIII
QIV QI QII
QIII
QIV QI QII
QIII
QIV QI QII
QIII
QIV QI
06/07 07/08 08/09 09/10 10/11 11/12 12/13 13/14 14/15 15/16 16/17 17/18 18/19
Value
in P
ercen
t
Years/QuartersTotal Public Total Private
Source: Staff computation, NBE
4.6. financial activities of NBE
Gross claims of NBE on the central government reached Birr 166.7 billion by end of September 2018, about 10.7 percent higher than that of a year earlier. Of the claims, direct advances accounted for 95.5
(In Millions of Birr)2018/19
Qtr.I Qtr.IV Qtr.IA B C C/A C/B
1.Loans and Advances 177,858.85 207,421.56 213,678.01 20.1 3.01.1. To Central Government 150,632.85 160,128.85 166,685.30 10.7 4.1
Direct Advances 142,764.95 152,264.95 159,264.95 11.6 4.6 Bonds 7,867.90 7,863.90 7,420.35 -5.7 -5.6
1.2.To Development Bank of Ethiopia 27,226.00 47,292.71 46,992.71 72.6 -0.62.Deposit Liabilities 76,678.53 81,596.47 83,694.85 9.2 2.6
2.1. Government 19,337.75 19,921.99 19,601.81 1.4 -1.6 2.2. Financial Institutions 57,340.77 61,674.48 64,093.04 11.8 3.9
O/W: -Banks 57,306.53 61,652.84 64,070.67 11.8 3.9 -Insurance companies 34.2 21.6 22.4 -34.7 3.33.Net Claims of NBE(1-2) 101,180.3 125,825.1 129,983.2 28.5 3.3
% Change Particulars
Table 4 .13: Financial Activities of NBE during the First Quarter of 2018/19
2017/18
percent and bonds 4.5 percent. Direct advance to the central government increased by11.6 percent. Similarly, financial institutions’ deposit at NBE went up by 11.8 percent (Table 4.13).
Source: NBE

First Quarter 2018/1926
National Bank of Ethiopia Quarterly Bulletin
4.7. Developments in financial Markets
4.7.1. treasury Bills Market
During the first quarter of 2018/19, the amount of T-bills supplied to the weekly auction market reached Birr 83.4 billion, reflecting a 33.5 percent growth over the same period of last year. The demand for T-bills also increased by 33.85 percent and reached Birr 91.14 billion (Table 4.13). All the T-bills sold went to non-bank institutions. The total
outstanding T-bills at the end of the review quarter stood at Birr 119.14 billion, about 50.7 percent higher than a year ago.
The annual average weighted yield of T-bills during the review quarter was 1.40 percent slightly lower than 1.42 percent during the corresponding period of last year (Table 4.13).
table 4.13: Results of treasury Bills auction (In Millions)
particulars
2017/18 2018/19
% Change Quarter i Quarter iV Quarter i
a B C C/a C/BNumber of Bidders 47.00 46.00 46.00 -2.13 0.00 Public 47.00 46.00 46.00 -2.13 0.00 Private - - - 0.00 0.00Number of Bids received 50.00 46.00 49.00 -2.00 6.52 Public 50.00 46.00 49.00 -2.00 6.52 Private - - -
amount Demanded (Mn. Birr) 68,092.56 97,941.56 91,142.56 33.85 -6.94 28-day bill 240.00 240.00 240.00 0.00 0.00 91-day bill 64,586.56 80,016.56 87,636.56 35.69 9.52 182-day bill 516.00 685.00 516.00 0.00 -24.67 364-day bill 2,750.00 17,000.00 2,750.00 - -83.82amount Supplied (Mn. Birr) 62,480.56 76,692.56 83,412.56 33.50 8.76 28-day bill 240.00 260.00 260.00 8.33 0.00 91-day bill 58,974.56 75,747.56 80,016.56 35.68 5.64 182-day bill 516.00 685.00 386.00 -25.19 -43.65 364-day bill 2,750.00 - 2,750.00 -
amount Sold (Mn. Birr) 68,092.56 97,941.56 91,142.56 33.85 -6.94 Banks - - -
Non-Banks 68,092.56 97,941.56 91,142.56 33.85 -6.94average Weighted price for Successful bids (%) 99.10 99.11 99.11 0.00 -0.01
28-day bill 99.94 99.94 99.94 0.01 0.00
91-day bill 99.70 99.70 99.70 0.00 0.00
182-day bill 99.69 99.72 99.69 0.00 -0.04
364-day bill 97.10 97.10 97.10 0.00
average Weighted Yield for Successful bids (%) 1.42 1.39 1.40 -1.13 0.78 28-day bill 0.85 0.81 0.78 -7.70 -3.57
91-day bill 1.20 1.203 1.20 0.07 0.02
182-day bill 0.63 0.56 0.63 0.01 12.87
364-day bill 3.00 3.00 3.00 0.00
outstanding bills at the end of period (Mn.Br.) 79,083.56 111,213.56 119,142.56 50.65 7.13 Banks - - -
Non-Banks 79,083.56 111,213.56 119,142.56 50.65 7.13Source: Staff Computation, NBE

First Quarter 2018/19 27
National Bank of Ethiopia Quarterly Bulletin
fig.iV.13: Developments in t-Bills Market (In Millions of Birr)
Source: Staff Computation, NBE
fig.iV.14: Developments in average Weighted Yields of t-bills with Different Maturities
Source: Staff Computation, NBE
4.7.2. inter- Bank Money Market
There had been no inter-bank money market transaction during the quarter under review. (Table 4.12)
4.7.3. Corporate Bond Market
In Ethiopia, the big players in the nascent bond market are few public institutions and regional governments where the Commercial Bank of
Ethiopia was the sole buyer of the corporate bonds (CBE). CBE purchased corporate bonds worth Birr 2.6 billion surged by Railways Corporation. Hence, the stock of corporate bonds held by CBE at the end of September 30, 2018 stood at Birr 293.25 billion, of which 84.62 percent was claims on public enterprises and the remaining balance on regional governments (Table 4.15). Of the total outstanding bonds issued by public enterprises, EEPCOs’ share was 87.2 percent and it accounted for 73.8 percent of the total outstanding corporate bonds held by CBE.
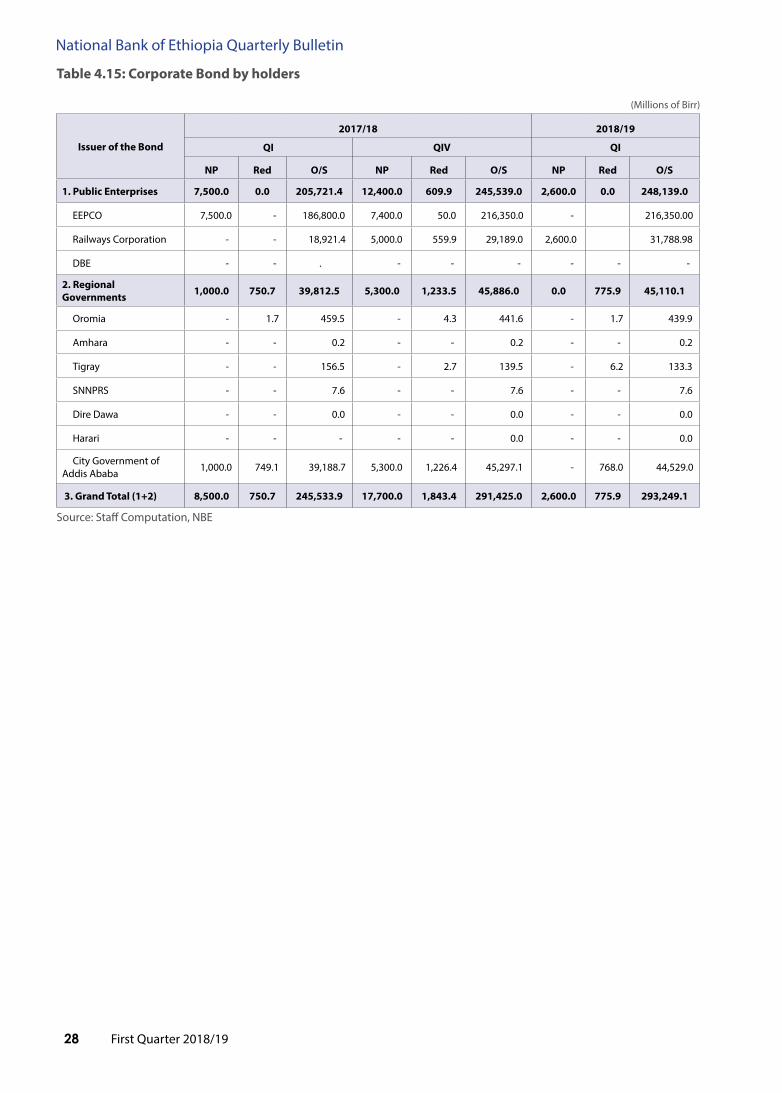
First Quarter 2018/1928
National Bank of Ethiopia Quarterly Bulletin
table 4.15: Corporate Bond by holders
(Millions of Birr)
issuer of the Bond
2017/18 2018/19
Qi QiV Qi
Np Red o/S Np Red o/S Np Red o/S
1. public Enterprises 7,500.0 0.0 205,721.4 12,400.0 609.9 245,539.0 2,600.0 0.0 248,139.0
EEPCO 7,500.0 - 186,800.0 7,400.0 50.0 216,350.0 - 216,350.00
Railways Corporation - - 18,921.4 5,000.0 559.9 29,189.0 2,600.0 31,788.98
DBE - - . - - - - - -
2. Regional Governments 1,000.0 750.7 39,812.5 5,300.0 1,233.5 45,886.0 0.0 775.9 45,110.1
Oromia - 1.7 459.5 - 4.3 441.6 - 1.7 439.9
Amhara - - 0.2 - - 0.2 - - 0.2
Tigray - - 156.5 - 2.7 139.5 - 6.2 133.3
SNNPRS - - 7.6 - - 7.6 - - 7.6
Dire Dawa - - 0.0 - - 0.0 - - 0.0
Harari - - - - - 0.0 - - 0.0
City Government of Addis Ababa 1,000.0 749.1 39,188.7 5,300.0 1,226.4 45,297.1 - 768.0 44,529.0
3. Grand total (1+2) 8,500.0 750.7 245,533.9 17,700.0 1,843.4 291,425.0 2,600.0 775.9 293,249.1
Source: Staff Computation, NBE
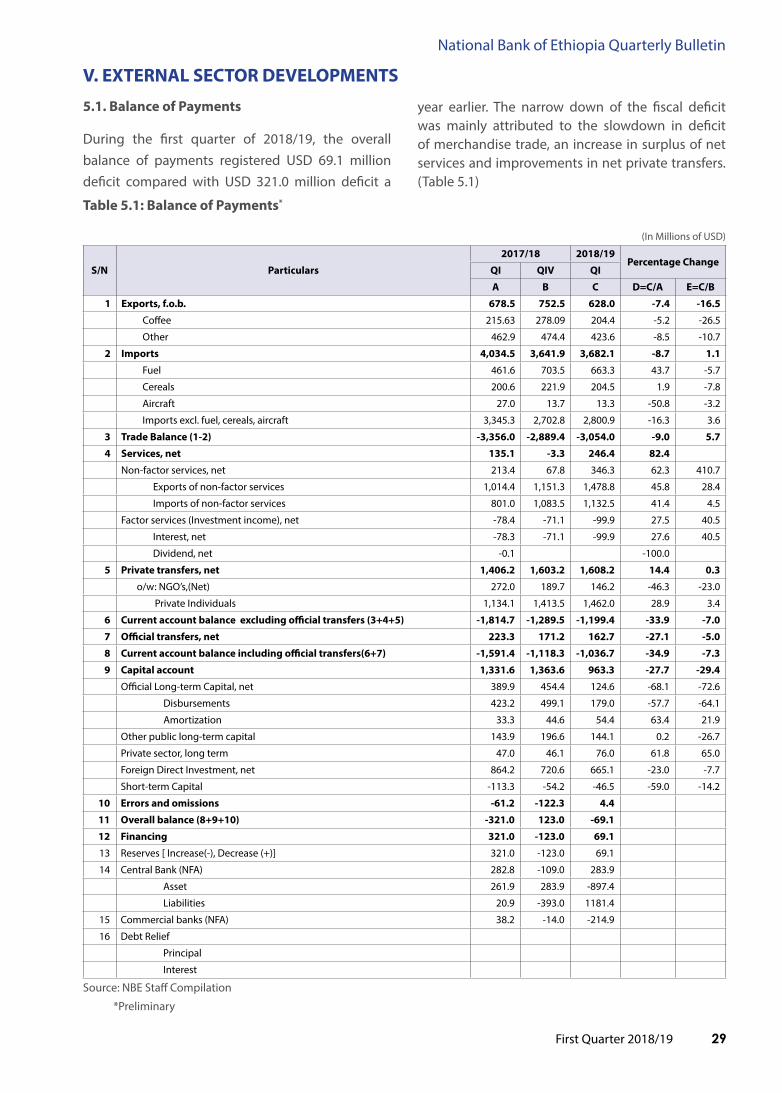
First Quarter 2018/19 29
National Bank of Ethiopia Quarterly Bulletin
V. EXtERNal SECtoR DEVElopMENtS
5.1. Balance of payments
During the first quarter of 2018/19, the overall balance of payments registered USD 69.1 million deficit compared with USD 321.0 million deficit a
year earlier. The narrow down of the fiscal deficit was mainly attributed to the slowdown in deficit of merchandise trade, an increase in surplus of net services and improvements in net private transfers. (Table 5.1)
table 5.1: Balance of payments*
(In Millions of USD)
S/N particulars
2017/18 2018/19percentage Change
Qi QiV Qi
a B C D=C/a E=C/B
1 Exports, f.o.b. 678.5 752.5 628.0 -7.4 -16.5
Coffee 215.63 278.09 204.4 -5.2 -26.5
Other 462.9 474.4 423.6 -8.5 -10.7
2 imports 4,034.5 3,641.9 3,682.1 -8.7 1.1
Fuel 461.6 703.5 663.3 43.7 -5.7
Cereals 200.6 221.9 204.5 1.9 -7.8
Aircraft 27.0 13.7 13.3 -50.8 -3.2
Imports excl. fuel, cereals, aircraft 3,345.3 2,702.8 2,800.9 -16.3 3.6
3 trade Balance (1-2) -3,356.0 -2,889.4 -3,054.0 -9.0 5.7
4 Services, net 135.1 -3.3 246.4 82.4
Non-factor services, net 213.4 67.8 346.3 62.3 410.7
Exports of non-factor services 1,014.4 1,151.3 1,478.8 45.8 28.4
Imports of non-factor services 801.0 1,083.5 1,132.5 41.4 4.5
Factor services (Investment income), net -78.4 -71.1 -99.9 27.5 40.5
Interest, net -78.3 -71.1 -99.9 27.6 40.5
Dividend, net -0.1 -100.0
5 private transfers, net 1,406.2 1,603.2 1,608.2 14.4 0.3
o/w: NGO’s,(Net) 272.0 189.7 146.2 -46.3 -23.0
Private Individuals 1,134.1 1,413.5 1,462.0 28.9 3.4
6 Current account balance excluding official transfers (3+4+5) -1,814.7 -1,289.5 -1,199.4 -33.9 -7.0
7 official transfers, net 223.3 171.2 162.7 -27.1 -5.0
8 Current account balance including official transfers(6+7) -1,591.4 -1,118.3 -1,036.7 -34.9 -7.3
9 Capital account 1,331.6 1,363.6 963.3 -27.7 -29.4
Official Long-term Capital, net 389.9 454.4 124.6 -68.1 -72.6
Disbursements 423.2 499.1 179.0 -57.7 -64.1
Amortization 33.3 44.6 54.4 63.4 21.9
Other public long-term capital 143.9 196.6 144.1 0.2 -26.7
Private sector, long term 47.0 46.1 76.0 61.8 65.0
Foreign Direct Investment, net 864.2 720.6 665.1 -23.0 -7.7
Short-term Capital -113.3 -54.2 -46.5 -59.0 -14.2
10 Errors and omissions -61.2 -122.3 4.4
11 overall balance (8+9+10) -321.0 123.0 -69.1
12 financing 321.0 -123.0 69.1
13 Reserves [ Increase(-), Decrease (+)] 321.0 -123.0 69.1
14 Central Bank (NFA) 282.8 -109.0 283.9
Asset 261.9 283.9 -897.4
Liabilities 20.9 -393.0 1181.4
15 Commercial banks (NFA) 38.2 -14.0 -214.9
16 Debt Relief
Principal
Interest
Source: NBE Staff Compilation
*Preliminary

First Quarter 2018/1930
National Bank of Ethiopia Quarterly Bulletin
Total current account receipts during the review quarter amounted to USD 3,919.1 million, about 16.3 percent higher than a year earlier. This growth in receipts was attributed to 46.6 percent increase in proceeds from services and 11.7 percent rise in private transfers. Export proceeds and public transfers, however, slowed down by 7.4 percent and 19.9 percent, respectively.
Meanwhile, total current account payments slightly declined to USD 4,955.9 million due to a 8.7 percent decrease in import payments and 92.4 percent drops in payments for private transfers. Thus, the current account exhibited USD 1,036.7 million in deficit compared with USD 1,591.4 million a year ago showing a 34.9 percent improvement (Table 5.2).
table 5.2: Current Receipts and payments
(In millions of USD)
S/N particulars
2017/18 2018/19percentage Change
Qi QiV Qi
a B C D=C/a E=C/B
1 Current Receipts 3,370.0 3,705.5 3,919.1 16.3 5.8
Export Proceeds 678.48 752.5 628.0 -7.4 -16.5
Service Proceeds 1,022.56 1,163.8 1,498.6 46.6 28.8
Private Transfers 1,442.42 1,612.3 1,611.0 11.7 -0.1
Public Transfers 226.56 176.8 181.6 -19.9 2.7
2 Current payments 4,961.4 4,823.8 4,955.9 -0.1 2.7
Import Payments 4,034.48 3,641.9 3,682.1 -8.7 1.1
Service Payments 887.48 1,167.1 1,252.2 41.1 7.3
Private Transfers 36.23 9.1 2.8 -92.4 -69.6
Public Transfers 3.23 5.6 18.9 483.3 234.7
3 Net(1-2) -1,591.4 -1,118.3 -1,036.7 -34.9 -7.3
Source: NBE Staff Compilation
fig.V.1: trends in Current Receipts and payments
Source: NBE Staff Compilation
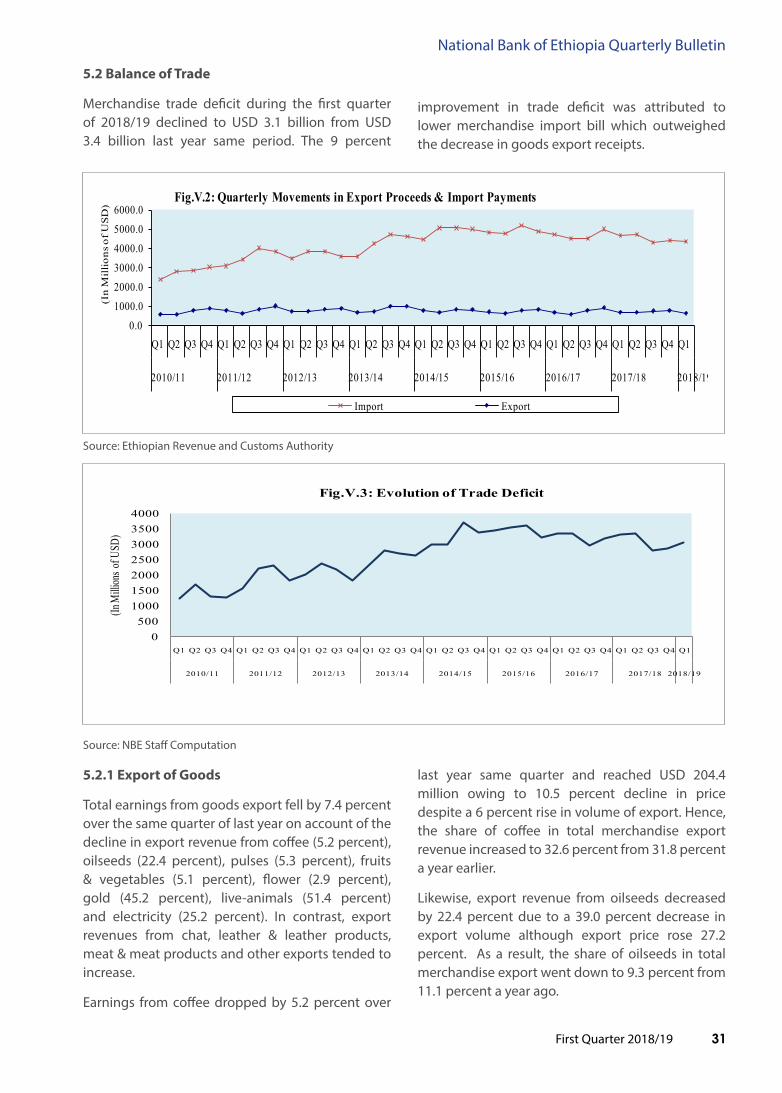
First Quarter 2018/19 31
National Bank of Ethiopia Quarterly Bulletin
5.2 Balance of trade
Merchandise trade deficit during the first quarter of 2018/19 declined to USD 3.1 billion from USD 3.4 billion last year same period. The 9 percent
0.0
1000.0
2000.0
3000.0
4000.0
5000.0
6000.0
Q1 Q2 Q3 Q4 Q1 Q2 Q3 Q4 Q1 Q2 Q3 Q4 Q1 Q2 Q3 Q4 Q1 Q2 Q3 Q4 Q1 Q2 Q3 Q4 Q1 Q2 Q3 Q4 Q1 Q2 Q3 Q4 Q1
2010/11 2011/12 2012/13 2013/14 2014/15 2015/16 2016/17 2017/18 2018/19
(In
Mill
ions
of U
SD)
Fig.V.2: Quarterly Movements in Export Proceeds & Import Payments
Import Export
improvement in trade deficit was attributed to lower merchandise import bill which outweighed the decrease in goods export receipts.
Source: Ethiopian Revenue and Customs Authority
Source: NBE Staff Computation
0500
1000150020002500300035004000
Q1 Q2 Q3 Q4 Q1 Q2 Q3 Q4 Q1 Q2 Q3 Q4 Q1 Q2 Q3 Q4 Q1 Q2 Q3 Q4 Q1 Q2 Q3 Q4 Q1 Q2 Q3 Q4 Q1 Q2 Q3 Q4 Q1
2010/11 2011/12 2012/13 2013/14 2014/15 2015/16 2016/17 2017/18 2018/19
(In M
illion
s of U
SD)
Fig.V.3: Evolution of Trade Deficit
5.2.1 Export of Goods
Total earnings from goods export fell by 7.4 percent over the same quarter of last year on account of the decline in export revenue from coffee (5.2 percent), oilseeds (22.4 percent), pulses (5.3 percent), fruits & vegetables (5.1 percent), flower (2.9 percent), gold (45.2 percent), live-animals (51.4 percent) and electricity (25.2 percent). In contrast, export revenues from chat, leather & leather products, meat & meat products and other exports tended to increase.
Earnings from coffee dropped by 5.2 percent over
last year same quarter and reached USD 204.4 million owing to 10.5 percent decline in price despite a 6 percent rise in volume of export. Hence, the share of coffee in total merchandise export revenue increased to 32.6 percent from 31.8 percent a year earlier.
Likewise, export revenue from oilseeds decreased by 22.4 percent due to a 39.0 percent decrease in export volume although export price rose 27.2 percent. As a result, the share of oilseeds in total merchandise export went down to 9.3 percent from 11.1 percent a year ago.

First Quarter 2018/1932
National Bank of Ethiopia Quarterly Bulletin
Export revenue from pulses slowed down by 5.3 percent over last year same quarter, on account of 5.8 percent fall in international price despite marginal (0.5 percent) growth in volume. Thus, the share of pulses in total export earnings reached 6.9 percent share slightly higher than last year.
Export proceeds from live-animals plummeted 51.4 percent as a result of a 52.7 percent drops in export volume despite a 2.7 percent increase in price. Therefore, the share of live animals in total merchandise export earnings decreased to 2.3 percent from 4.4 percent a year ago.
Similarly, export earnings from gold declined by 45.2 percent due to a 43.2 percent decrease in export volume and 3.5 percent in price. As result, the share of gold in total merchandise export went down to 2.5 percent from 4.2 percent last year same quarter.
Likewise, export revenue from flower fell by 2.9 percent over the same quarter of last year due to a 2.0 percent slowdown in volume and a 0.9 percent decrease in price. Thus, the share of flower in total export earnings increased to 8.4 percent from 8.0 percent.
Export receipts from fruits & vegetables reached USD 14.8 million, about 5.1 percent lower than last year same quarter as export volume declined 11.1 percent despite 6.8 percent rise in international price. Hence, the share of fruits & vegetables in total
export earnings increased to 2.4 percent from 2.3 percent a year ago.
Export earnings from electricity showed a 25.2 percent annual fall as a result of a 27.8 percent decrease in volume although prices went up 3.7 percent. Thus, the share of electricity in total merchandise export revenue decreased to 2.7 percent from 3.3 percent last year same quarter.
In contrast, export revenue from chat surged 23.8 percent owing to a 26.9 percent growth in export volume despite a 2.4 percent fall in international price. Hence, the share of chat in total merchandise export earnings rose to 12.5 percent from 9.4 percent a year earlier.
Similarly, receipts from leather & leather products showed a marginal increase of 0.4 percent owing to a 3 percent rise in international price despite a 2.5 percent drop in export volume. Consequently, the share of leather & leather products in total merchandise export went up from 4.9 percent to 5.3 percent during the review quarter.
Revenue from meat & meat products’ export also depicted slight improvements as export volume increased in spite of a decline in price. As a result, the share of meat & meat products in total merchandise exports stood at 3.9 percent compared with 3.6 percent a year earlier (Tables 5.3, 5.4 and 5.5).
table 5.3: Values of Major Export items
(In millions of USD)
particulars
2017/18 2018/19percentage Change
Qi QiV Qi
a %share B %share C %share C/a C/B
Coffee 215.6 31.8 278.1 37.0 204.4 32.6 -5.2 -26.5
Oilseeds 75.0 11.1 69.8 9.3 58.2 9.3 -22.4 -16.6
Leather and Leather products 33.1 4.9 34.8 4.6 33.3 5.3 0.4 -4.4
Pulses 45.9 6.8 70.1 9.3 43.5 6.9 -5.3 -37.9
Meat & Meat Products 24.2 3.6 31.2 4.2 24.2 3.9 0.02 -22.5
Fruits & Vegetables 15.6 2.3 16.0 2.1 14.8 2.4 -5.1 -7.5
Live Animals 30.1 4.4 15.1 2.0 14.6 2.3 -51.4 -3.2
Chat 63.6 9.4 70.3 9.3 78.8 12.5 23.8 12.1
Gold 28.6 4.2 6.7 0.9 15.7 2.5 -45.2 134.3
Flower 54.5 8.0 59.3 7.9 52.9 8.4 -2.9 -10.8
Electricity 22.3 3.3 28.6 3.8 16.7 2.7 -25.2 -41.8
Others 69.9 10.3 72.5 9.6 70.9 11.3 1.4 -2.1
Total Export 678.5 100 752.5 100 628.0 100 -7.4 -16.5
Total Export excluding electricity 656.2 723.9 611.4 -6.8 -15.5
Source: Ethiopian Revenues and Customs Authority, Ethiopian Electric Utility & Ethiopian Electric Power

First Quarter 2018/19 33
National Bank of Ethiopia Quarterly Bulletin
04080
120160200240280320360400
QI
QII
QIII
QIV Q
I
QII
QIII
QIV Q
I
QII
QIII
QIV Q
I
QII
QIII
QIV Q
I
QII
QIII
QIV Q
I
QII
QIII
QIV Q
I
QII
QIII
QIV Q
I
2011/12 2012/13 2013/14 2014/15 2015/16 2016/17 2017/18 2018/19
Mill
of U
SD
Fig.V.4: Export Value of Selected Commodities
Coffee Oil SeedsLeather and Leather Products Pulses Flower Gold Chat
table 5.4: Volume of Major Export items
(In millions of Kg)
particulars
2017/18 2018/19percentage Change
Qi QiV Qi
a B C C/a C/B
Coffee 55.9 78.8 59.2 6.0 -24.9
Oilseeds 69.5 55.9 42.4 -39.0 -24.2
Leather and Leather products 1.6 1.7 1.5 -2.5 -8.5
Pulses 68.8 110.4 69.1 0.5 -37.4
Meat & Meat Products 4.7 6.1 4.7 0.1 -22.7
Fruits & Vegetables 46.8 50.6 41.6 -11.1 -17.8
Live Animals 15.2 7.9 7.2 -52.7 -9.7
Chat 11.2 12.6 14.2 26.9 12.8
Gold(in mill of grams) 0.8 0.2 0.5 -43.2 171.9
Flower 12.4 13.6 12.1 -2.0 -10.5
Electricity(in mill of kwh) 407.1 513.5 293.8 -27.8 -42.8
Source: Ethiopian Revenues and Customs Authority, Ethiopian Electric Utility and Ethiopian Electric Power
0
50
100
150
200
250
QI QII
QIII
QIV QI QII
QIII
QIV QI QII
QIII
QIV QI QII
QIII
QIV QI QII
QIII
QIV QI QII
QIII
QIV QI QII
QIII
QIV QI
2011/12 2012/13 2013/14 2014/15 2015/16 2016/17 2017/18 2018/19
(Mill
K.g)
Fig.V.5: Export Volume of Selected Commodities
Coffee Oil SeedsLeather and Leather Products Pulses Flower Chat
Source: NBE Staff Computation

First Quarter 2018/1934
National Bank of Ethiopia Quarterly Bulletin
table 5.5: Unit Value of Major Export items
(In USD/kg)
particulars
2017/18 2018/19percentage Change
Qi QiV Qia B C C/a C/B
Coffee 3.9 3.5 3.5 -10.5 -2.1Oilseeds 1.1 1.2 1.4 27.2 10.0
Leather and Leather products 21.0 20.7 21.6 3.0 4.5
Pulses 0.7 0.6 0.6 -5.8 -0.8Meat & Meat Products 5.2 5.1 5.1 -0.1 0.2Fruits & Vegetables 0.3 0.3 0.4 6.8 12.5Live Animals 2.0 1.9 2.0 2.7 7.1Chat 5.7 5.6 5.5 -2.4 -0.6Gold (USD/gm) 34.6 38.7 33.3 -3.5 -13.9Flower 4.4 4.4 4.4 -0.9 -0.3Electricity 0.1 0.1 0.1 3.7 1.7
Source: Ethiopian Revenues and Customs Authority, Ethiopian Electric Utility and Ethiopian Electric Power
05
10152025303540455055
QI QII QIIIQIV QI QII QIIIQIV QI QII QIIIQIV QI QII QIIIQIV QI QII QIIIQIV QI QII QIIIQIV QI QII QIIIQIV QI
2011/12 2012/13 2013/14 2014/15 2015/16 2016/17 2017/18 2018/19
USD/
K.g,
USD/
gr.(G
old)
Fig.V.6: Unit Value of Selected Export Commodities
Coffee Oil Seeds Leather and Leather Products Pulses Flower Gold Chat
Source: NBE Staff Computation
5.2.2 import of Goods
In the first quarter of 2018/19, total merchandise import stood at USD 3.7 billion, about 8.7 percent lower a year ago. This was due to slow down in import values of capital, consumer, semi-finished and miscellaneous goods.
Import bill of capital goods decreased by 20.4 percent due to a decline in imports of industrial and transport capital goods by 12.1 percent and 54.9 percent, respectively. Import of Agricultural capital goods, however, surged by 63.5 percent. Hence, the share of capital goods in total goods imports went down to 32.5 percent from 37.2 percent a year earlier.
Likewise, import payments for consumer goods decreased by 6.1 percent over the same quarter of last year due to a 25.8 percent drop in import payments for durable consumer goods in spite of a 3.4 percent increase in payments for non-durable consumer goods. Thus, the share of consumer goods in total import bill increased to 31.2 percent from 30.3 percent last year same quarter.
Similarly, import of semi-finished goods dropped by 22.5 percent and its share in total imports fell to 15.0 percent from 17.7 percent a year ago.
On the other hand, import value of fuel surged by 43.7 percent and its share in total imports rose to 18.0 percent from 11.4 percent a year earlier.

First Quarter 2018/19 35
National Bank of Ethiopia Quarterly Bulletin
Likewise, import value of raw materials grew by 60.7 percent over the same quarter of last year and their share in total merchandise import rose to 1.4 percent from 0.8 percent during the same period.
Meanwhile, total franco-valuta import declined by 14.8 percent and stood at USD 1.1 billion and accounted for 29.6 percent of the total imports.
table 5.6: Values of Major import items (In millions Of USD)
particular
2017/18 2018/19
percentage ChangesQtr. i Share (%)
Qtr. iV Share (%)
Qtr. i Share (%)
a B C C/a C/B
Raw Materials 31.4 0.8 39.5 1.1 50.4 1.4 60.7 27.6
Semi-finished Goods 714.7 17.7 708.5 19.5 554.1 15.0 -22.5 -21.8
Fertilizers 5.7 0.1 266.7 7.3 7.6 0.2 33.4 -97.1
fuel 461.6 11.4 703.5 19.3 663.3 18.0 43.7 -5.7
Petroleum Products 439.5 10.9 680.8 18.7 630.3 17.1 43.4 -7.4
Others 22.1 0.5 22.7 0.6 33.1 0.9 49.8 45.7
Capital Goods 1,502.8 37.2 1,003.6 27.6 1,195.8 32.5 -20.4 19.2
Transport 310.8 7.7 148.4 4.1 140.1 3.8 -54.9 -5.6
Agricultural 10.1 0.2 9.4 0.3 16.4 0.4 63.5 74.5
Industrial 1,182.0 29.3 845.8 23.2 1,039.2 28.2 -12.1 22.9
Consumer Goods 1,223.3 30.3 1,127.4 31.0 1,148.4 31.2 -6.1 1.9
Durables 397.7 9.9 248.7 6.8 295.0 8.0 -25.8 18.6
Non-durables 825.7 20.5 878.7 24.1 853.4 23.2 3.4 -2.9
Miscellaneous 100.7 2.5 59.3 1.6 70.0 1.9 -30.5 18.0
total imports 4,034.5 100 3,641.9 100 3,682.1 100 -8.7 1.1
Source: ERCA
table 5.7: the Value of franco Valuta import
(In millions of USD
Commodity Group
2017/18 2018/19percentage Change
Qtr. i Qtr. iV Qtr. i
a B C C/a C/B
Beverages 1.0 0.2 0.1 -93.8 -65.8
Chemicals 2.5 10.4 6.1 143.8 -41.0
Clothing 15.1 10.1 12.5 -17.2 23.6
Food and live animals 94.3 144.6 84.6 -10.3 -41.5
Textiles 5.2 7.8 8.6 65.5 10.5
Tobacco 0.0 0.0 0.0 79.5 535.7
Soap & polish 0.2 0.5 0.5 194.2 -1.2
Fertilizer 43.2 152.3 60.6 40.1 -60.2
Paper & paper manufacturing 0.6 1.9 1.8 184.2 -4.2
Metal & metal manufacturing 119.1 92.7 86.4 -27.5 -6.8
Medical and pharmaceuticals products 11.1 8.1 14.0 26.1 73.1
Rubber products 9.5 8.7 14.2 49.6 63.8
Petroleum Crude - - - 0.0 0.0
Petroleum product 49.8 6.2 7.4 -85.0 19.3
Glass & glass ware 7.2 3.9 3.6 -49.2 -6.2
Electrical material 95.9 70.3 96.4 0.5 37.1
Machine 456.9 355.4 408.0 -10.7 14.8
Road & motor vehicles 42.8 41.9 53.7 25.3 28.1
Tele apparatus 4.2 1.4 1.2 -72.2 -16.2
Cement 0.08 0.08 0.08 0.0 0.0
Others 321.2 233.1 230.6 -28.2 -1.1
total 1,279.9 1,149.5 1,090.4 -14.8 -5.1
Source: ERCA

First Quarter 2018/1936
National Bank of Ethiopia Quarterly Bulletin
5.2.3 Direction of trade
5.2.3.1 Export of Goods
The major destinations for Ethiopian exports were Asia, Europe and Africa. Asia accounted for 37.4 percent of the total exports during the review quarter. Saudi Arabia was the largest market accounting for 18 percent of Ethiopia’s exports to Asia, followed by China, Mainland (17.2 percent), United Arab Emirates (12.0 percent), Japan (11.3 percent), Israel (7.9 percent), South Korea (5.3 percent), Yemen (4.8 percent), Indonesia (3.4 percent), India (3.2 percent) and Taiwan (2.2 percent). All these countries accounted for 85.3 percent of Ethiopia’s total export to Asia.
Europe accounted for 27.3 percent of Ethiopia’s total exports with the Netherlands taking a 26.3 percent share, followed by Germany (20.7 percent), Belgium (11.5 percent), Switzerland (9.2 percent), Italy (7.4 percent), United Kingdom (6.1 percent), France (3.5 percent) and Spain (3.0 percent). These countries together had a 87.7 percent share in Ethiopia’s total exports to Europe.
Moreover, about 22.7 percent of Ethiopia’s export earnings originated from Africa, mainly Somalia (49.0 percent), Djibouti (25.8 percent), Sudan (10.2 percent) and Kenya (4.3 percent) which altogether accounted for 89.3 percent of the total exports to Africa.
The share of America in Ethiopia’s total export earning was 11 percent, of which 73.3 percent was from exports to the United States and 6.3 percent to Canada.
fig.V.7: Export By Destination
Source: NBE Staff Compilation
5.2.3.2 import of Goods
During the first quarter of 2018/19, Asia accounted for 67 percent of the total Ethiopian imports. The major imports from Asia originated from China (43.9 percent), Kuwait (20.9 percent), India (10.8 percent), U.A.E (4.2 percent), Malaysia (3.4 percent), Japan (3.3 percent), Thailand (2.92 percent), Indonesia (2.9 percent), South Korea (1.9 percent) and Saudi-Arabia (1.7 percent) whose combined share was 95.8 percent.
Imports from Europe constituted 23.3 percent of Ethiopia’s total imports with the major exporting countries being Turkey (18.7 percent), United Kingdom (13.6 percent), Italy (10.7 percent), Germany (9.3 percent), Rumania (8.5 percent), Russia (6.5 percent), France (5.0 percent), Belgium (4.5 percent), Ukraine (4.4 percent) and the Netherlands (3.5 percent). These countries jointly accounted for 84.8 percent of Ethiopia’s total imports from Europe.
Imports from America made up 6.1 percent of the Ethiopia’s imports, of which the share of United States was 73.5 percent followed by Brazil (18.5 percent) and Canada (5.4 percent).
Africa accounted for 3.5 percent of Ethiopia’s total merchandise imports with the major countries of origin being Egypt (41.9 percent), South Africa (36.8 percent), Kenya (8.5 percent), Sudan (7.8 percent) and Nigeria (1.1 percent), which altogether constituted 96 percent of the total imports from the continent.
fig.V.8: import by origin
Source: NBE Staff Compilation
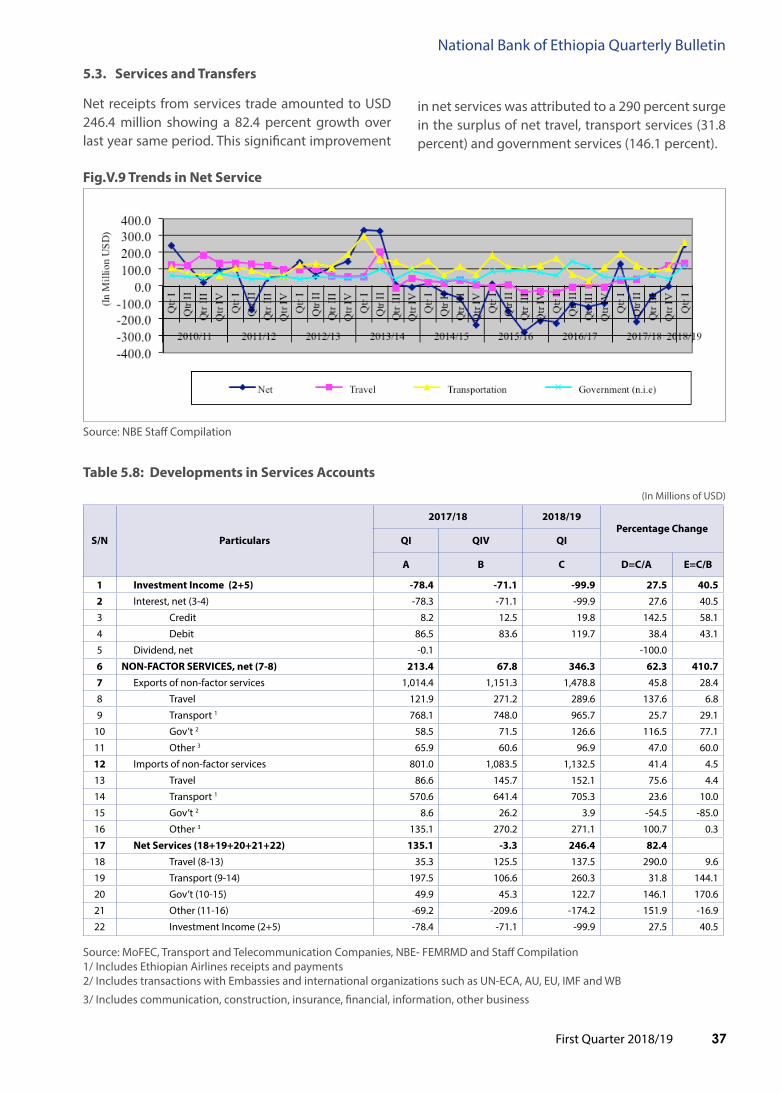
First Quarter 2018/19 37
National Bank of Ethiopia Quarterly Bulletin
5.3. Services and transfers
Net receipts from services trade amounted to USD 246.4 million showing a 82.4 percent growth over last year same period. This significant improvement
in net services was attributed to a 290 percent surge in the surplus of net travel, transport services (31.8 percent) and government services (146.1 percent).
fig.V.9 trends in Net Service
Source: NBE Staff Compilation
table 5.8: Developments in Services accounts
(In Millions of USD)
S/N particulars
2017/18 2018/19percentage Change
Qi QiV Qi
a B C D=C/a E=C/B
1 investment income (2+5) -78.4 -71.1 -99.9 27.5 40.52 Interest, net (3-4) -78.3 -71.1 -99.9 27.6 40.5
3 Credit 8.2 12.5 19.8 142.5 58.1
4 Debit 86.5 83.6 119.7 38.4 43.1
5 Dividend, net -0.1 -100.0
6 NoN-faCtoR SERViCES, net (7-8) 213.4 67.8 346.3 62.3 410.77 Exports of non-factor services 1,014.4 1,151.3 1,478.8 45.8 28.4
8 Travel 121.9 271.2 289.6 137.6 6.8
9 Transport 1 768.1 748.0 965.7 25.7 29.1
10 Gov’t 2 58.5 71.5 126.6 116.5 77.1
11 Other 3 65.9 60.6 96.9 47.0 60.0
12 Imports of non-factor services 801.0 1,083.5 1,132.5 41.4 4.5
13 Travel 86.6 145.7 152.1 75.6 4.4
14 Transport 1 570.6 641.4 705.3 23.6 10.0
15 Gov’t 2 8.6 26.2 3.9 -54.5 -85.0
16 Other 3 135.1 270.2 271.1 100.7 0.3
17 Net Services (18+19+20+21+22) 135.1 -3.3 246.4 82.418 Travel (8-13) 35.3 125.5 137.5 290.0 9.6
19 Transport (9-14) 197.5 106.6 260.3 31.8 144.1
20 Gov’t (10-15) 49.9 45.3 122.7 146.1 170.6
21 Other (11-16) -69.2 -209.6 -174.2 151.9 -16.9
22 Investment Income (2+5) -78.4 -71.1 -99.9 27.5 40.5
Source: MoFEC, Transport and Telecommunication Companies, NBE- FEMRMD and Staff Compilation1/ Includes Ethiopian Airlines receipts and payments2/ Includes transactions with Embassies and international organizations such as UN-ECA, AU, EU, IMF and WB
3/ Includes communication, construction, insurance, financial, information, other business

First Quarter 2018/1938
National Bank of Ethiopia Quarterly Bulletin
During the review period, total transfer receipts increased by 7.4 percent and reached USD 1,792.5 million. This growth was attributed to a 11.7 percent increase in private transfers. Private individual transfers rose by 28.9 percent, while NGO transfers declined by 51.7 percent.
On the other hand, total transfer payments dropped by 45.2 percent due to a 92.4 percent decrease in private transfer payments (Table 5.9).
table 5.9: Developments in transfer accounts
(In Millions of USD)
S/N particulars
2017/18 2018/19percentage Change
Qi% Share
QiV % Share
Qi % Sharea B C D=C/a E=C/B
1 private transfers, net (2-5) 1,406.2 86.3 1,603.2 90.4 1,608.2 90.8 14.4 0.3
2 Credit (3+4) 1,442.4 86.4 1,612.3 90.1 1,611.0 89.9 11.7 -0.1
3 NGO’s 308.3 18.5 198.8 11.1 148.9 8.3 -51.7 -25.1
4 Private individuals 1,134.1 68.0 1,413.5 79.0 1,462.0 81.6 28.9 3.4
5 Debit 36.2 91.8 9.1 61.7 2.8 12.8 -92.4 -69.6
6 official transfers, net (7-8) 223.3 13.7 171.2 9.6 162.7 9.2 -27.1 -5.0
7 Credit 226.6 13.6 176.8 9.9 181.6 10.1 -19.9 2.7
8 Debit 3.2 8.2 5.6 38.3 18.9 87.2 483.3 234.7
9 Total Receipts 1,669.0 100.0 1,789.1 100.0 1,792.5 100.0 7.4 0.2
10 Total Payments 39.5 100.0 14.7 100.0 21.6 100.0 -45.2 46.8
11 Net transfers 1,629.5 100.0 1,774.4 100.0 1,770.9 100.0 8.7 -0.2
Source: NBE Staff Computation
fig.V. 10: trends in private and official transfers
Source: NBE Staff Compilation

First Quarter 2018/19 39
National Bank of Ethiopia Quarterly Bulletin
commercial banks increased by USD 214.9 million. Thus, gross international reserves as of September 30, 2018 were sufficient to cover 2.6 months of payments for import of goods and non- factor services of next fiscal year.
5.7. Developments in the foreign Exchange Market
5.7.1 Exchange Rate Movements
Weighted average official exchange rate of Birr, in the inter-bank forex market at the end of September 2018, reached Birr 27.4295/USD depicting 18 percent annual depreciation. The end period exchange rate of the Birr was 27.5889/USD. The Birr last ground against USD by 18 percent due to NBE’s decision to devalue the Birr by 15 percent against USD on October 11, 2017.
table 5.10: Developments in inter-bank Market forex traded and Exchange Rates (USD/EtB)
period
End period Weighted Rate
official Market
average Weighted rate amount traded in Millions of USD
total among CBs
2017/18 27.2621 26.1082 12.5 0.0
Qtr. i C 23.3854 23.2488 3.10 0.00
July 23.1956 23.1539 1.05 0.00
August 23.2972 23.2486 1.15 0.00
September 23.3854 23.3438 0.90 0.00
Qtr. iV B 27.2621 27.2493 3.05 0.00
April 27.2454 27.2428 1.00 0.00
May 27.2511 27.2484 1.05 0.00
June 27.2621 27.2568 1.00 0.00
2018/19
Qtr. i a 27.5889 27.4295 3.10 0.00
July 27.3703 27.3186 1.10 0.00
August 27.4849 27.4302 1.10 0.00
September 27.5889 27.5398 0.90 0.00
percentage Changesa/B 1.20 0.66 1.64
a/C 17.97 17.98 0.00
Source: National Bank of Ethiopia
5.4. Current account Balance
During the review quarter, current account balance (including official transfers) narrowed to USD 1,036.7 million deficit compared with USD 1,591.4 million deficit a year ago. (Table 5.1)
5.5. Capital account
In the review period, capital account recorded USD 963.3 million surpluses, about 27.7 percent lower than that of a year earlier. This was attributed to a 68.1 percent decrease in net official long term capital and 23.0 percent drop in foreign direct investment (Table 5.1).
5.6. Changes in Reserve position
Net foreign assets of the National Bank of Ethiopia declined by USD 283.9 million, while that of
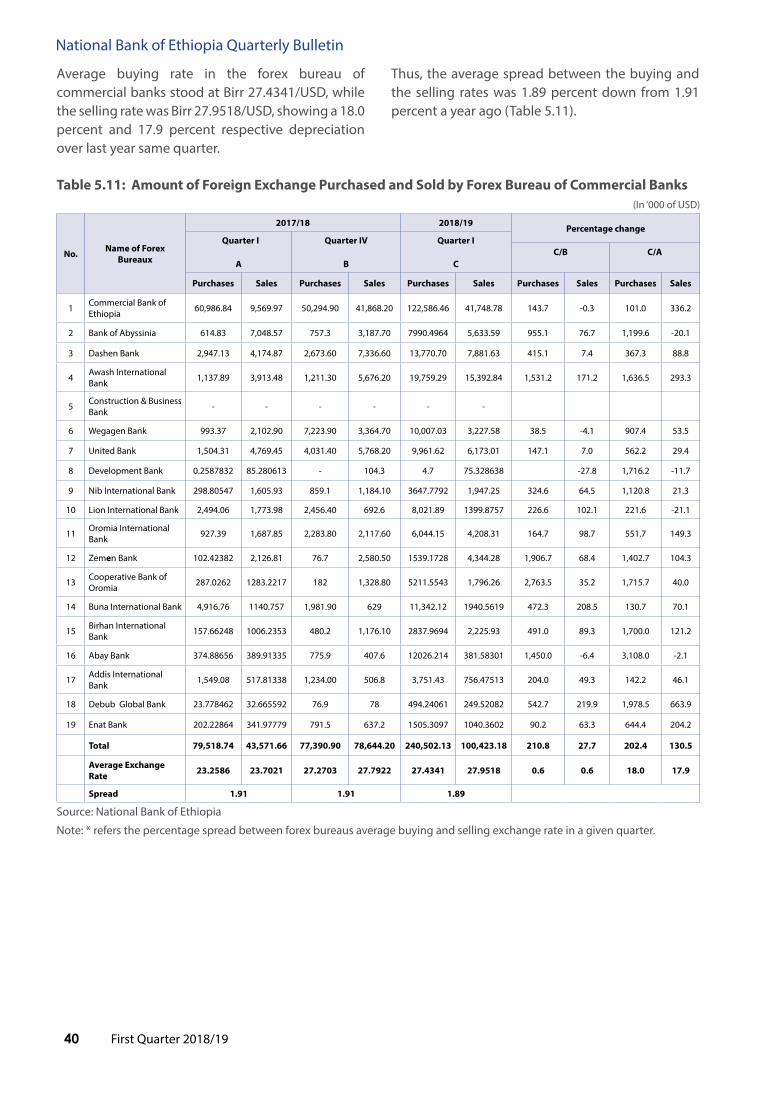
First Quarter 2018/1940
National Bank of Ethiopia Quarterly Bulletin
Average buying rate in the forex bureau of commercial banks stood at Birr 27.4341/USD, while the selling rate was Birr 27.9518/USD, showing a 18.0 percent and 17.9 percent respective depreciation over last year same quarter.
Thus, the average spread between the buying and the selling rates was 1.89 percent down from 1.91 percent a year ago (Table 5.11).
table 5.11: amount of foreign Exchange purchased and Sold by forex Bureau of Commercial Banks (In ‘000 of USD)
No. Name of forex Bureaux
2017/18 2018/19 percentage change Quarter i
a
Quarter iV
B
Quarter i
CC/B C/a
purchases Sales purchases Sales purchases Sales purchases Sales purchases Sales
1 Commercial Bank of Ethiopia 60,986.84 9,569.97 50,294.90 41,868.20 122,586.46 41,748.78 143.7 -0.3 101.0 336.2
2 Bank of Abyssinia 614.83 7,048.57 757.3 3,187.70 7990.4964 5,633.59 955.1 76.7 1,199.6 -20.1
3 Dashen Bank 2,947.13 4,174.87 2,673.60 7,336.60 13,770.70 7,881.63 415.1 7.4 367.3 88.8
4 Awash International Bank 1,137.89 3,913.48 1,211.30 5,676.20 19,759.29 15,392.84 1,531.2 171.2 1,636.5 293.3
5 Construction & Business Bank - - - - - -
6 Wegagen Bank 993.37 2,102.90 7,223.90 3,364.70 10,007.03 3,227.58 38.5 -4.1 907.4 53.5
7 United Bank 1,504.31 4,769.45 4,031.40 5,768.20 9,961.62 6,173.01 147.1 7.0 562.2 29.4
8 Development Bank 0.2587832 85.280613 - 104.3 4.7 75.328638 -27.8 1,716.2 -11.7
9 Nib International Bank 298.80547 1,605.93 859.1 1,184.10 3647.7792 1,947.25 324.6 64.5 1,120.8 21.3
10 Lion International Bank 2,494.06 1,773.98 2,456.40 692.6 8,021.89 1399.8757 226.6 102.1 221.6 -21.1
11 Oromia International Bank 927.39 1,687.85 2,283.80 2,117.60 6,044.15 4,208.31 164.7 98.7 551.7 149.3
12 Zemen Bank 102.42382 2,126.81 76.7 2,580.50 1539.1728 4,344.28 1,906.7 68.4 1,402.7 104.3
13 Cooperative Bank of Oromia 287.0262 1283.2217 182 1,328.80 5211.5543 1,796.26 2,763.5 35.2 1,715.7 40.0
14 Buna International Bank 4,916.76 1140.757 1,981.90 629 11,342.12 1940.5619 472.3 208.5 130.7 70.1
15 Birhan International Bank 157.66248 1006.2353 480.2 1,176.10 2837.9694 2,225.93 491.0 89.3 1,700.0 121.2
16 Abay Bank 374.88656 389.91335 775.9 407.6 12026.214 381.58301 1,450.0 -6.4 3,108.0 -2.1
17 Addis International Bank 1,549.08 517.81338 1,234.00 506.8 3,751.43 756.47513 204.0 49.3 142.2 46.1
18 Debub Global Bank 23.778462 32.665592 76.9 78 494.24061 249.52082 542.7 219.9 1,978.5 663.9
19 Enat Bank 202.22864 341.97779 791.5 637.2 1505.3097 1040.3602 90.2 63.3 644.4 204.2
total 79,518.74 43,571.66 77,390.90 78,644.20 240,502.13 100,423.18 210.8 27.7 202.4 130.5
average Exchange Rate 23.2586 23.7021 27.2703 27.7922 27.4341 27.9518 0.6 0.6 18.0 17.9
Spread 1.91 1.91 1.89
Source: National Bank of Ethiopia
Note: * refers the percentage spread between forex bureaus average buying and selling exchange rate in a given quarter.

First Quarter 2018/19 41
National Bank of Ethiopia Quarterly Bulletin
Source: NBE Staff Compilation
1.71.71.81.81.91.92.02.02.12.12.2
0
10
20
30
40
50
60
QI
QII
QIII
QIV
Q
IQ
IIQ
IIIQ
IV QI
QII
QIII
QIV Q
IQ
IIQ
IIIQ
IV QI
QII
QIII
QIV Q
IQ
IIQ
IIIQ
IV QI
QII
QIII
QIV Q
I
2011/12 2012/13 2013/14 2014/15 2015/16 2016/17 2017/182018/19
Perc
ent
Birr
per
USD
Selling Rate Buying Rate Spread
fig.V.11: average Buying, Selling Rates and Spread of forex Bureau of Commercial Banks
In the official forex market, US dollar has appreciated both on annual and quarterly basis against major currencies except Swiss Franc. This was mainly driven by relatively wider U.S. interest rate differentials compared to other major economies. On quarterly basis, USD appreciated against
Pound Sterling (4.4 percent), Euro (2.6 percent), Japanese Yen (2.2 percent) and SDR (2.1 percent), while it depreciated against Swiss Franc by 0.04 percent. Likewise, on annual terms, USD strengthened against Swiss Franc (2.1 percent), Euro (0.9 percent), SDR (0.6 percent), Pound Sterling (0.4 percent) and Japanese Yen (0.4 percent) (Table 5.12).
table 5.12: average official Exchange Rates (USD per Major international Currencies)
period
EURo JapaNESE YEN SDR poUNDStEliNG SWiSS fRaNk
Buying SellingMid- Rate Buying Selling
Mid- Rate Buying Selling
Mid- Rate Buying Selling
Mid- Rate Buying Selling
Mid- Rate
2017/18
Qi C 1.1739 1.1739 1.1739 0.0090 0.0090 0.0090 1.4084 1.4084 1.4084 1.3085 1.3085 1.3085 1.0383 1.0384 1.0383
July 1.1492 1.1492 1.1492 0.0089 0.0089 0.0089 1.3940 1.3940 1.3940 1.2980 1.2980 1.2980 1.0411 1.0411 1.0411
August 1.1798 1.1800 1.1799 0.0091 0.0091 0.0091 1.4105 1.4106 1.4105 1.2967 1.2968 1.2967 1.0351 1.0356 1.0354
September 1.1925 1.1925 1.1925 0.0090 0.0090 0.0090 1.4206 1.4206 1.4206 1.3307 1.3307 1.3307 1.0386 1.0386 1.0386
QiV B 1.1937 1.1937 1.1937 0.0092 0.0092 0.0092 1.4308 1.4308 1.4308 1.3625 1.3625 1.3625 1.0160 1.0160 1.0160
April 1.2291 1.2291 1.2291 0.0093 0.0093 0.0093 1.4521 1.4521 1.4521 1.4093 1.4093 1.4093 1.0348 1.0348 1.0348
May 1.1836 1.1836 1.1836 0.0091 0.0091 0.0091 1.4259 1.4259 1.4259 1.3486 1.3486 1.3486 1.0023 1.0023 1.0023
June 1.1685 1.1685 1.1685 0.0091 0.0091 0.0091 1.4145 1.4145 1.4145 1.3296 1.3296 1.3296 1.0108 1.0108 1.0108
2018/19
Qi a 1.1630 1.1630 1.1630 0.0090 0.0090 0.0090 1.4007 1.4007 1.4007 1.3032 1.3032 1.3032 1.0164 1.0164 1.0164
July 1.1676 1.1676 1.1676 0.0090 0.0090 0.0090 1.4055 1.4055 1.4055 1.3167 1.3167 1.3167 1.0049 1.0049 1.0049
August 1.1551 1.1551 1.1551 0.0090 0.0090 0.0090 1.3958 1.3958 1.3958 1.2884 1.2884 1.2884 1.0106 1.0106 1.0106
September 1.1664 1.1664 1.1664 0.0089 0.0089 0.0089 1.4007 1.4007 1.4007 1.3044 1.3044 1.3044 1.0338 1.0338 1.0338
percentage Changes
a/B -2.57 -2.57 -2.57 -2.16 -2.16 -2.16 -2.11 -2.11 -2.11 -4.36 -4.36 -4.36 0.04 0.04 0.04
a/C -0.92 -0.93 -0.92 -0.39 -0.39 -0.39 -0.55 -0.55 -0.55 -0.41 -0.41 -0.41 -2.10 -2.12 -2.11
Source: National Bank of Ethiopia
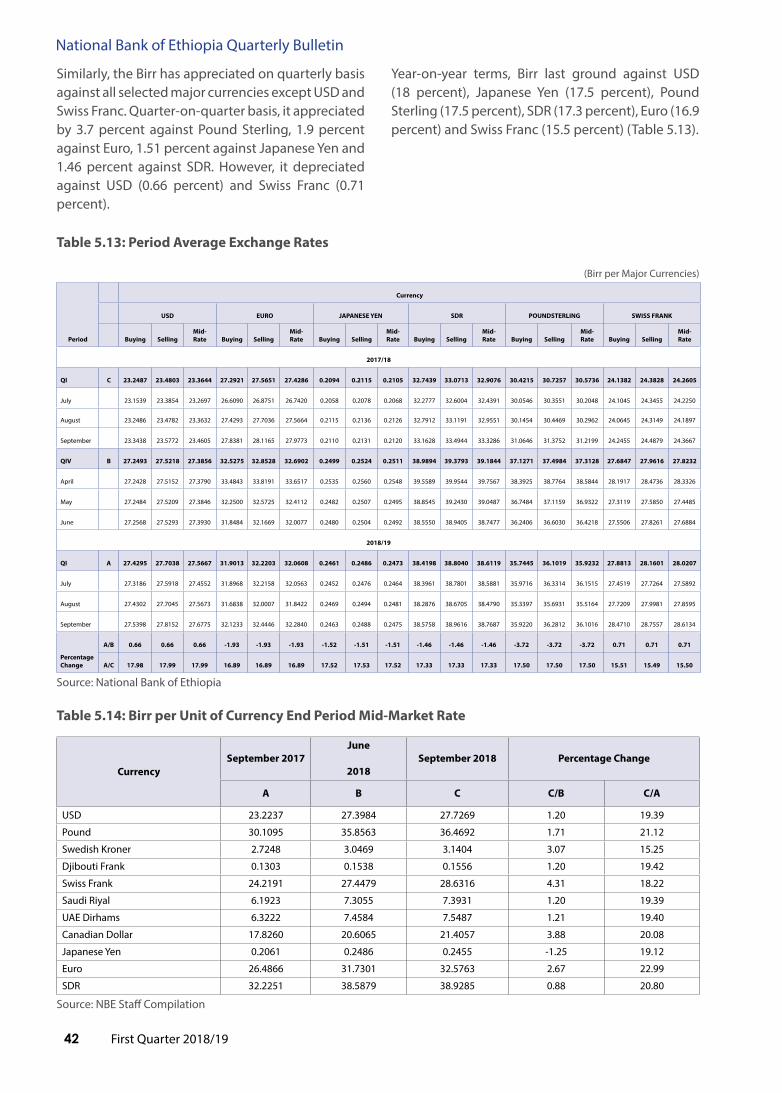
First Quarter 2018/1942
National Bank of Ethiopia Quarterly Bulletin
Similarly, the Birr has appreciated on quarterly basis against all selected major currencies except USD and Swiss Franc. Quarter-on-quarter basis, it appreciated by 3.7 percent against Pound Sterling, 1.9 percent against Euro, 1.51 percent against Japanese Yen and 1.46 percent against SDR. However, it depreciated against USD (0.66 percent) and Swiss Franc (0.71 percent).
Year-on-year terms, Birr last ground against USD (18 percent), Japanese Yen (17.5 percent), Pound Sterling (17.5 percent), SDR (17.3 percent), Euro (16.9 percent) and Swiss Franc (15.5 percent) (Table 5.13).
table 5.13: period average Exchange Rates
(Birr per Major Currencies)
period
Currency
USD EURo JapaNESE YEN SDR poUNDStERliNG SWiSS fRaNk
Buying SellingMid-Rate Buying Selling
Mid-Rate Buying Selling
Mid-Rate Buying Selling
Mid-Rate Buying Selling
Mid-Rate Buying Selling
Mid-Rate
2017/18
Qi C 23.2487 23.4803 23.3644 27.2921 27.5651 27.4286 0.2094 0.2115 0.2105 32.7439 33.0713 32.9076 30.4215 30.7257 30.5736 24.1382 24.3828 24.2605
July 23.1539 23.3854 23.2697 26.6090 26.8751 26.7420 0.2058 0.2078 0.2068 32.2777 32.6004 32.4391 30.0546 30.3551 30.2048 24.1045 24.3455 24.2250
August 23.2486 23.4782 23.3632 27.4293 27.7036 27.5664 0.2115 0.2136 0.2126 32.7912 33.1191 32.9551 30.1454 30.4469 30.2962 24.0645 24.3149 24.1897
September 23.3438 23.5772 23.4605 27.8381 28.1165 27.9773 0.2110 0.2131 0.2120 33.1628 33.4944 33.3286 31.0646 31.3752 31.2199 24.2455 24.4879 24.3667
QiV B 27.2493 27.5218 27.3856 32.5275 32.8528 32.6902 0.2499 0.2524 0.2511 38.9894 39.3793 39.1844 37.1271 37.4984 37.3128 27.6847 27.9616 27.8232
April 27.2428 27.5152 27.3790 33.4843 33.8191 33.6517 0.2535 0.2560 0.2548 39.5589 39.9544 39.7567 38.3925 38.7764 38.5844 28.1917 28.4736 28.3326
May 27.2484 27.5209 27.3846 32.2500 32.5725 32.4112 0.2482 0.2507 0.2495 38.8545 39.2430 39.0487 36.7484 37.1159 36.9322 27.3119 27.5850 27.4485
June 27.2568 27.5293 27.3930 31.8484 32.1669 32.0077 0.2480 0.2504 0.2492 38.5550 38.9405 38.7477 36.2406 36.6030 36.4218 27.5506 27.8261 27.6884
2018/19
Qi a 27.4295 27.7038 27.5667 31.9013 32.2203 32.0608 0.2461 0.2486 0.2473 38.4198 38.8040 38.6119 35.7445 36.1019 35.9232 27.8813 28.1601 28.0207
July 27.3186 27.5918 27.4552 31.8968 32.2158 32.0563 0.2452 0.2476 0.2464 38.3961 38.7801 38.5881 35.9716 36.3314 36.1515 27.4519 27.7264 27.5892
August 27.4302 27.7045 27.5673 31.6838 32.0007 31.8422 0.2469 0.2494 0.2481 38.2876 38.6705 38.4790 35.3397 35.6931 35.5164 27.7209 27.9981 27.8595
September 27.5398 27.8152 27.6775 32.1233 32.4446 32.2840 0.2463 0.2488 0.2475 38.5758 38.9616 38.7687 35.9220 36.2812 36.1016 28.4710 28.7557 28.6134
percentage Change
a/B 0.66 0.66 0.66 -1.93 -1.93 -1.93 -1.52 -1.51 -1.51 -1.46 -1.46 -1.46 -3.72 -3.72 -3.72 0.71 0.71 0.71
a/C 17.98 17.99 17.99 16.89 16.89 16.89 17.52 17.53 17.52 17.33 17.33 17.33 17.50 17.50 17.50 15.51 15.49 15.50
Source: National Bank of Ethiopia
table 5.14: Birr per Unit of Currency End period Mid-Market Rate
CurrencySeptember 2017
June
2018September 2018 percentage Change
a B C C/B C/a
USD 23.2237 27.3984 27.7269 1.20 19.39
Pound 30.1095 35.8563 36.4692 1.71 21.12
Swedish Kroner 2.7248 3.0469 3.1404 3.07 15.25
Djibouti Frank 0.1303 0.1538 0.1556 1.20 19.42
Swiss Frank 24.2191 27.4479 28.6316 4.31 18.22
Saudi Riyal 6.1923 7.3055 7.3931 1.20 19.39
UAE Dirhams 6.3222 7.4584 7.5487 1.21 19.40
Canadian Dollar 17.8260 20.6065 21.4057 3.88 20.08
Japanese Yen 0.2061 0.2486 0.2455 -1.25 19.12
Euro 26.4866 31.7301 32.5763 2.67 22.99
SDR 32.2251 38.5879 38.9285 0.88 20.80
Source: NBE Staff Compilation

First Quarter 2018/19 43
National Bank of Ethiopia Quarterly Bulletin
5.7.2. Movements in the Real Effective Exchange Rate
0
50
100
150
200
250
QI QII
QIII
QIV QI QI
IQI
IIQI
V QI QII
QIII
QIV QI QII
QIII
QIV QI QII
QIII
QIV QI QII
QII
QIV QI QII
QIII
QIV QI QII
QIII
QIV QI
2010/11 2011/12 2012/13 2013/14 2014/15 201516 2016/17 2017/182018/19
NEERI REERI
fig.V.12: Movements in the Real and Nominal Effective Exchange Rate
Source: NBE Staff Compilation
During the first quarter of 2018/19, REERI of the Birr showed a depreciation of 1.5 percent mainly due to the 15 percent devaluation of Birr a year ago. On quarterly basis, however, it appreciated by 4.8 percent, mainly owing a rising domestic inflation and strengthening of the USD relative to other major currencies.
Likewise, NEERI depreciated by 3.0 percent over last year same quarter, as a result of a relative weakening of the Birr against USD. However, the NEERI depicted a 5.4 percent appreciation on quarterly terms owing to USD appreciation against some major currencies (Table 5.15).
table 5.15: trends in the Real and Nominal Effective Exchange Rates
item
2017/18 2018/19percentage Change
Qi QiV Qi
a B C C/B C/a
REERI 172.1 161.8 169.5 4.8 -1.5
NEERI 40.5 37.2 39.3 5.4 -3.0
Source: NBE Staff Compilation NB: REERI = Real Effective Exchange Rate Index, NEERI = Nominal Effective Exchange Rate Index
· A decrease in the REERI and NEERI implies depreciation and vice versa.

First Quarter 2018/1944
National Bank of Ethiopia Quarterly Bulletin
5.7.3 Volume of transactions
In the first quarter of 2018/19, foreign exchange traded in the inter-bank foreign exchange market reached USD 3.1 million, 1.6 percent higher than that of preceding quarter, but the same compared
0102030405060708090
QI
QII
QIII
QIV Q
IQ
IIQ
IIIQ
IV QI
QII
QIII
QIV Q
IQ
IIQ
IIIQ
IV QI
QII
QIII
QIV Q
IQ
IIQ
IIIQ
IV QI
QII
QIII
QIV Q
I
2011/12 2012/13 2013/14 2014/15 2015/16 2016/17 2017/182018/19
(In M
ill. U
SD) Total Amount Traded
to same period last year. The total amount traded in the inter-bank market during the review period was supplied exclusively by NBE in order to stabilize the foreign exchange markets (Table 5:10).
fig.V.13: foreign Exchange trade in the interbank foreign Exchange Market
Source: NBE Staff Compilation
In the same period, forex bureaux of commercial banks purchased USD 240.5 million and sold USD 100.4 million. Hence, the amount of forex purchased and sold increased significantly by 202.4 percent and 130.5 percent relative to last year same quarter. This surge in transaction was related to the government‘s request to citizens to use commercial banks to convert their foreign exchange (Table 5.11).
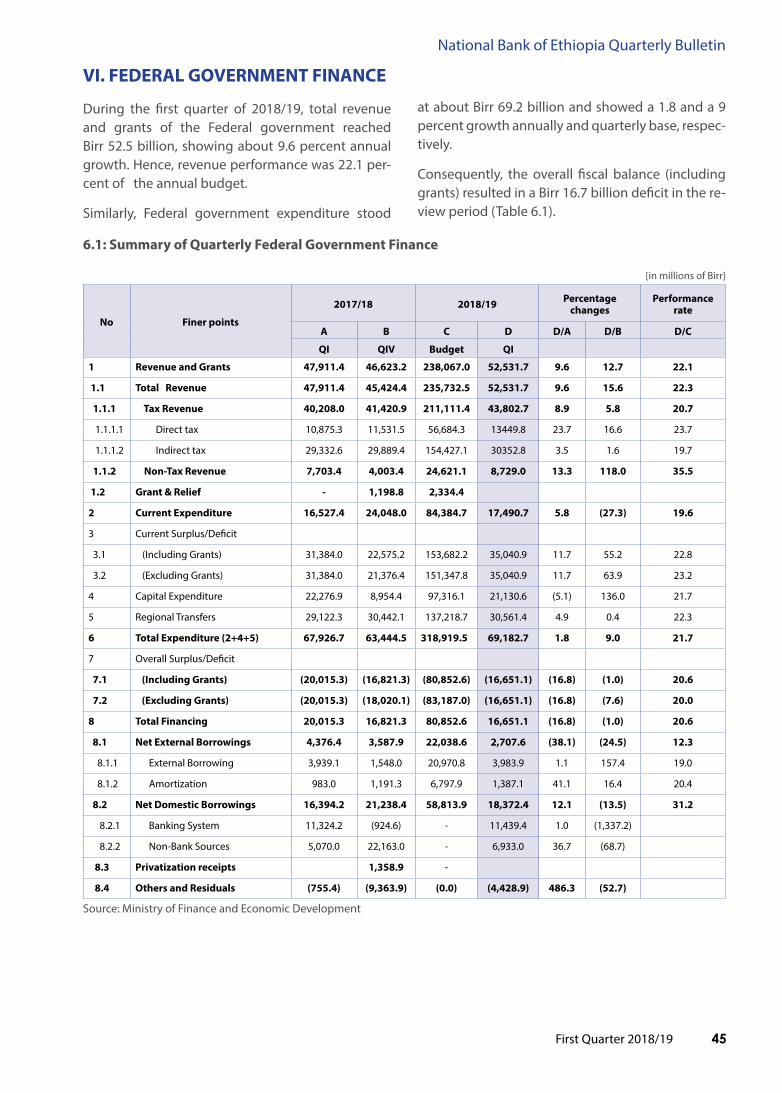
First Quarter 2018/19 45
National Bank of Ethiopia Quarterly Bulletin
Vi. fEDERal GoVERNMENt fiNaNCE
During the first quarter of 2018/19, total revenue and grants of the Federal government reached Birr 52.5 billion, showing about 9.6 percent annual growth. Hence, revenue performance was 22.1 per-cent of the annual budget.
Similarly, Federal government expenditure stood
6.1: Summary of Quarterly federal Government finance
[in millions of Birr]
No finer points
2017/18 2018/19 percentage changes
performance rate
a B C D D/a D/B D/C
Qi QiV Budget Qi
1 Revenue and Grants 47,911.4 46,623.2 238,067.0 52,531.7 9.6 12.7 22.1
1.1 total Revenue 47,911.4 45,424.4 235,732.5 52,531.7 9.6 15.6 22.3
1.1.1 tax Revenue 40,208.0 41,420.9 211,111.4 43,802.7 8.9 5.8 20.7
1.1.1.1 Direct tax 10,875.3 11,531.5 56,684.3 13449.8 23.7 16.6 23.7
1.1.1.2 Indirect tax 29,332.6 29,889.4 154,427.1 30352.8 3.5 1.6 19.7
1.1.2 Non-tax Revenue 7,703.4 4,003.4 24,621.1 8,729.0 13.3 118.0 35.5
1.2 Grant & Relief - 1,198.8 2,334.4
2 Current Expenditure 16,527.4 24,048.0 84,384.7 17,490.7 5.8 (27.3) 19.6
3 Current Surplus/Deficit
3.1 (Including Grants) 31,384.0 22,575.2 153,682.2 35,040.9 11.7 55.2 22.8
3.2 (Excluding Grants) 31,384.0 21,376.4 151,347.8 35,040.9 11.7 63.9 23.2
4 Capital Expenditure 22,276.9 8,954.4 97,316.1 21,130.6 (5.1) 136.0 21.7
5 Regional Transfers 29,122.3 30,442.1 137,218.7 30,561.4 4.9 0.4 22.3
6 total Expenditure (2+4+5) 67,926.7 63,444.5 318,919.5 69,182.7 1.8 9.0 21.7
7 Overall Surplus/Deficit
7.1 (including Grants) (20,015.3) (16,821.3) (80,852.6) (16,651.1) (16.8) (1.0) 20.6
7.2 (Excluding Grants) (20,015.3) (18,020.1) (83,187.0) (16,651.1) (16.8) (7.6) 20.0
8 total financing 20,015.3 16,821.3 80,852.6 16,651.1 (16.8) (1.0) 20.6
8.1 Net External Borrowings 4,376.4 3,587.9 22,038.6 2,707.6 (38.1) (24.5) 12.3
8.1.1 External Borrowing 3,939.1 1,548.0 20,970.8 3,983.9 1.1 157.4 19.0
8.1.2 Amortization 983.0 1,191.3 6,797.9 1,387.1 41.1 16.4 20.4
8.2 Net Domestic Borrowings 16,394.2 21,238.4 58,813.9 18,372.4 12.1 (13.5) 31.2
8.2.1 Banking System 11,324.2 (924.6) - 11,439.4 1.0 (1,337.2)
8.2.2 Non-Bank Sources 5,070.0 22,163.0 - 6,933.0 36.7 (68.7)
8.3 privatization receipts 1,358.9 -
8.4 others and Residuals (755.4) (9,363.9) (0.0) (4,428.9) 486.3 (52.7)
Source: Ministry of Finance and Economic Development
at about Birr 69.2 billion and showed a 1.8 and a 9 percent growth annually and quarterly base, respec-tively.
Consequently, the overall fiscal balance (including grants) resulted in a Birr 16.7 billion deficit in the re-view period (Table 6.1).

First Quarter 2018/1946
National Bank of Ethiopia Quarterly Bulletin
6.1. Revenue and Grants
As indicated above, the federal government collected Birr 52.5 billion revenue, all from domestic sources, during the review quarter. Birr 43.8 billion or 83.4 percent of the total domestic revenue was collected through taxes and Birr 8.7 billion or 16.6
percent from non-taxes. During the review period,
there were no grants and relief (Table 6.2). Total
revenue performance was 22.1 percent of the
annual budget.
table 6.2: Summary of federal Government Revenue by Component
(In Millions of Birr)
No particulars
2017/18 2018/19 percentage Change
performance Rate
Qi QiV Budget Qi
a B C D [D/a] [D/B] [D/C]
1 total Revenue and Grants 47,911.4 46,623.2 38,067.0 2,531.7 9.6 12.7 22.1
1.1 total Domestic Revenue 47,911.4 45,424.4 235,732.5 52,531.7 9.6 15.6 22.3
1.1.1 tax Revenue 40,208.0 41,420.9 211,111.4 43,802.7 8.9 5.8 20.7
1.1.1.1 Direct tax Revenue 10,875.3 11,531.5 56,684.3 13,449.8 23.7 16.6 23.7
1.1.1.1.1 income taxes 9,320.8 9,222.7 50,761.3 11,953.4 28.2 29.6 23.5
1.1.1.1.1.1 - Personal 1,866.0 2,148.5 8,821.4 2,325.5 24.6 8.2 26.4
1.1.1.1.1.2 - Business 7,454.8 7,074.1 41,939.9 9,627.9 29.2 36.1 23.0
1.1.1.1.2 Others1 1,554.6 2,308.9 5,923.0 1,496.4 (3.7) (35.2) 25.3
1.1.1.2 indirect taxes 29,332.6 29,889.4 154,427.1 30,352.8 3.5 1.6 19.7
1.1.1.2.1 Domestic Taxes 10,391.8 14,356.8 62,593.6 12,168.5 17.1 (15.2) 19.4
1.1.1.2.2 Foreign Trade Taxes 18,940.9 15,532.6 91,833.5 18,184.3 (4.0) 17.1 19.8
1.1.1.2.2.1 - Import 18,940.9 15,532.6 91,833.5 18,184.3 (4.0) 17.1 19.8
1.1.2 Non-tax Revenue 7,703.4 4,003.4 24,621.1 8,729.0 13.3 118.0 35.5
1.1.3 privatization 1,358.9
1.2 Grants and Relief 1,198.8 2,334.4
Source: Ministry of Finance and Economic Development
1/ includes Withholding tax on import, tax on dividend, royalty and interest income

First Quarter 2018/19 47
National Bank of Ethiopia Quarterly Bulletin
fig.Vi.1: Quarterly Developments in Major Components of Domestic Revenue of the federal Government
fig.Vi.2: Domestic Revenue by Major Components during the first Quarter of 2018/19
Total tax revenues in the review period reached Birr 43.8 billion and showed 8.9 percent annual growth as both revenues from direct taxes and indirect tax-es tended to increase.
Direct tax revenue originated mainly from income tax (personal and business income tax) and stood at Birr 13.4 billion showing 23.7 percent yearly growth.

First Quarter 2018/1948
National Bank of Ethiopia Quarterly Bulletin
6.2 Expenditure
Total Federal government expenditure, including regional transfers was Birr 69.2 billion in the review quarter depicting a 1.8 percent annual increase mainly due to higher current expenditure and re-gional transfers (Table 6.3).
Its performance was 21.7 percent of the annual bud-get. Current expenditure increased by 5.8 percent owing to mainly on higher debt service and general service expenses. Meanwhile, capital expenditure reached Birr 21.1 billion and showed a 5.1 percent decline relative to a year ago. Regional transfers also went up by 5 percent to Birr 30.6 billion compared to Birr 29.1 billion last year same quarter.
tale 6.3: Summary of federal Government Expenditure by components
(In Millions of Birr)
No particulars
2017/18 2018/19
percentage Change performance Rate
Qi QiV Budget Qi
[a] [B] [C] [D] [D/a] [D/B] [D/C]
1 total Expenditure 67,926.7 63,444.5 318,919.5 69,182.7 1.8 9.0 21.7
1.1 Current Expenditure 16,527.4 24,048.0 84,384.7 17,490.7 5.8 (27.3) 20.7
1.1.1 General Services 6,444.8 6,690.3 28,890.8 6,905.7 7.2 3.2 23.9
1.1.2 Economic Services 907.8 1,181.97 5,325.9 847.0 (6.7) (28.3) 15.9
1.1.3 Social Services 6,946.1 8,195.58 27,260.8 6,695.0 (3.6) (18.3) 24.6
1.1.4 Others expenditure - 4318.4 7685.4 192.4 - (95.5) 2.5
1.1.5 Debt Service 2,228.8 3,661.70 15,221.9 2,850.7 27.9 (22.1) 18.7
1.2 Capital Expenditure 22,276.9 8,954.4 97,316.1 21,130.6 (5.1) 136.0 21.7
1.2.1 Economic Development 13,320.7 8,198.63 67,862.4 14,616.1 9.7 78.3 21.5
1.2.2 Social Development 7,446.8 376.86 22,861.6 6,071.0 (18.5) 1,510.9 26.6
1.2.3 General Development 1,509.4 378.94 6,592.1 443.5 (70.6) 17.0 6.7
1.3 Regional transfers 29,122.3 30,442.1 137,218.7 30,561.4 4.9 0.4 22.3
Source: Ministry of Finance and Economic Development
fig.Vi.3: Major Components of federal Governments Expenditure during the first Quarter of 2018/19
Current Expenditure 25.3%
Capital Expenditure30.5%
Regional Transfer44.2%

First Quarter 2018/19 49
National Bank of Ethiopia Quarterly Bulletin
fig.Vi.4: Quarterly Development in federal Government Expenditure by Components
6.3 Deficit financing
Fiscal balance of the Federal government showed Birr 16.7 billion in deficit compared with Birr 20.0 billion deficit a year ago. The deficit was financed from external & domestic borrowing (Table 6.1).
fig.Vi.5: federal Government finance during first Quarter of f.Y 2018/19
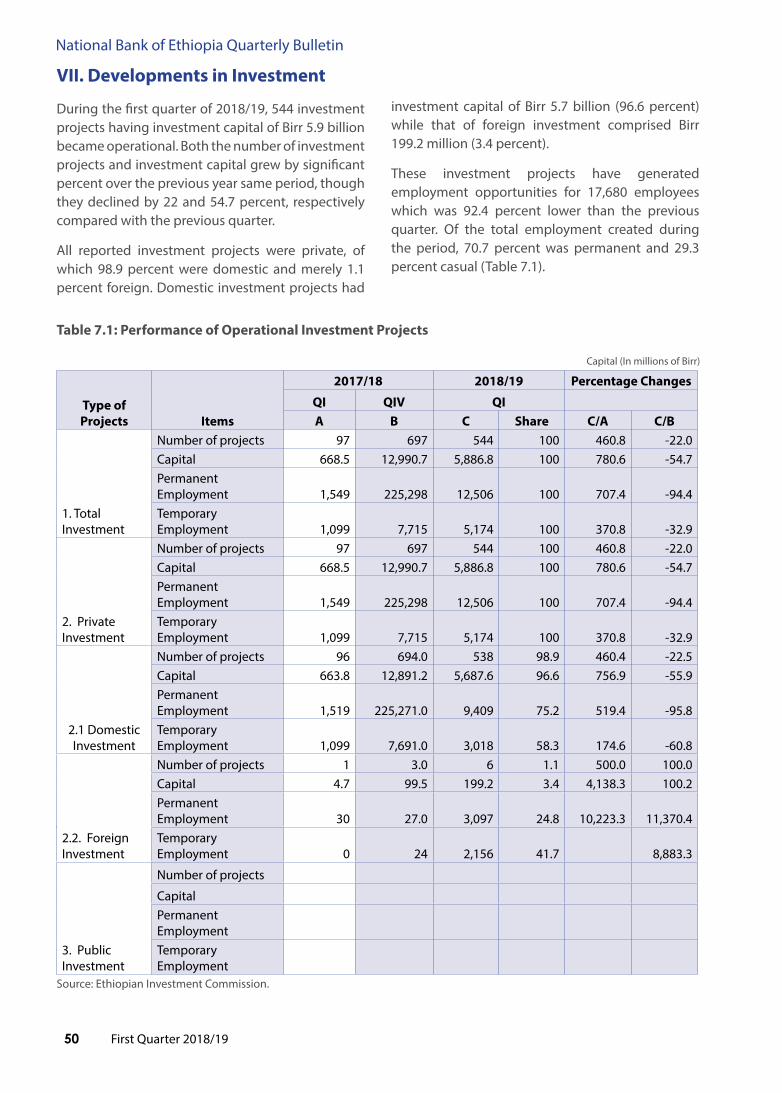
First Quarter 2018/1950
National Bank of Ethiopia Quarterly Bulletin
Vii. Developments in investment
During the first quarter of 2018/19, 544 investment projects having investment capital of Birr 5.9 billion became operational. Both the number of investment projects and investment capital grew by significant percent over the previous year same period, though they declined by 22 and 54.7 percent, respectively compared with the previous quarter.
All reported investment projects were private, of which 98.9 percent were domestic and merely 1.1 percent foreign. Domestic investment projects had
investment capital of Birr 5.7 billion (96.6 percent) while that of foreign investment comprised Birr 199.2 million (3.4 percent).
These investment projects have generated employment opportunities for 17,680 employees which was 92.4 percent lower than the previous quarter. Of the total employment created during the period, 70.7 percent was permanent and 29.3 percent casual (Table 7.1).
table 7.1: performance of operational investment projects
Capital (In millions of Birr)
type of projects items
2017/18 2018/19 percentage Changes
Qi QiV Qia B C Share C/a C/B
1. Total Investment
Number of projects 97 697 544 100 460.8 -22.0Capital 668.5 12,990.7 5,886.8 100 780.6 -54.7Permanent Employment 1,549 225,298 12,506 100 707.4 -94.4Temporary Employment 1,099 7,715 5,174 100 370.8 -32.9
2. Private Investment
Number of projects 97 697 544 100 460.8 -22.0Capital 668.5 12,990.7 5,886.8 100 780.6 -54.7Permanent Employment 1,549 225,298 12,506 100 707.4 -94.4Temporary Employment 1,099 7,715 5,174 100 370.8 -32.9
2.1 Domestic Investment
Number of projects 96 694.0 538 98.9 460.4 -22.5Capital 663.8 12,891.2 5,687.6 96.6 756.9 -55.9Permanent Employment 1,519 225,271.0 9,409 75.2 519.4 -95.8Temporary Employment 1,099 7,691.0 3,018 58.3 174.6 -60.8
2.2. Foreign Investment
Number of projects 1 3.0 6 1.1 500.0 100.0Capital 4.7 99.5 199.2 3.4 4,138.3 100.2Permanent Employment 30 27.0 3,097 24.8 10,223.3 11,370.4Temporary Employment 0 24 2,156 41.7 8,883.3
3. Public Investment
Number of projects
CapitalPermanent EmploymentTemporary Employment
Source: Ethiopian Investment Commission.

First Quarter 2018/19 51
National Bank of Ethiopia Quarterly Bulletin
As for sectoral distribution, Manufacturing constituted the lion’s share by accounting for 42.6 percent of total investment projects. Real estate, renting & business activities on its part had a 31.1 percent share followed by construction (22.4 percent), Agriculture, hunting & forestry (1.5 percent), health & social work, education and Tour operation, transport, & communication (0.6 percent each), Hotels and restaurants(0.4 percent), Minining & quarrying and Other community, social and personal service activities (0.2 percent each).
Out of the total Birr 5,886.8 million capitals invested, manufacturing sector received 58.4 percent
followed by construction (21.1 percent), real estate, renting & business activities (18.3 percent) and Agriculture, hunting and forestry (one percent).
With regard to job opportunity, 67 percent of the permanent employment was created by manufacturing followed by construction (23.5 percent), real estate, renting & business activities (8.3 percent). Similarly, manufacturing sector was the leading sector by employing 68.7 percent of temporary labor force followed by construction (18.7 percent), real estate, renting & business activities (7.9 percent) and Agriculture, hunting and forestry (4.3 percent) (Table 7.2).
table 7.2: investment Distribution by Sector during the first Quarter of 2018/19
Sectors No. of proj.
Share (%)
Capital
(in Million Birr)
Share (%)
perm. Emp.
Share (%)
temp. Emp.
Share (%)
Agriculture, hunting and forestry 8 1.5 58.2 1.0 50 0 225 4.3
Construction 122 22.4 1,243.6 21.1 2,940 23.5 965 18.7
Education 3 0.6 13.1 0.2 18 0.1 20 0.4
Electricity, gas, steam and water supply
Health and social work 3 0.6 22.3 0.4 25 0.2
Hotels and restaurants 2 0.4 21.1 18 0.1
Manufacturing 232 42.6 3,435.7 58.4 8,377 67.0 3,556 68.7
Mining and quarrying 1 0.2 3.0 0.1 0.0
Other community, social and personal service activities
1 0.2 2.0 0.0 12 0.1
Real estate, renting and business activities
169 31.1 1,076.8 18.3 1,036 8.3 408 7.9
Tour operation, transport, and communication
3 0.6 10.9 0.2 30 0.2
Wholesale, retail trade & repair service
others
Grand total 544 100 5,886.8 100 12,506 100 5,174 100
Source: Ethiopian Investment Commission.
During the review period, investment projects became operational merely in four regions. About 98 percent of the total projects with 96.8 percent of total investment capital went to Addis Ababa,
and 1.7 percent of the projects having 0.6 percent of total capital to Tigray followed by Amhara and Oromia. This pattern was similar to the regions’ job creation (Table 7.3).
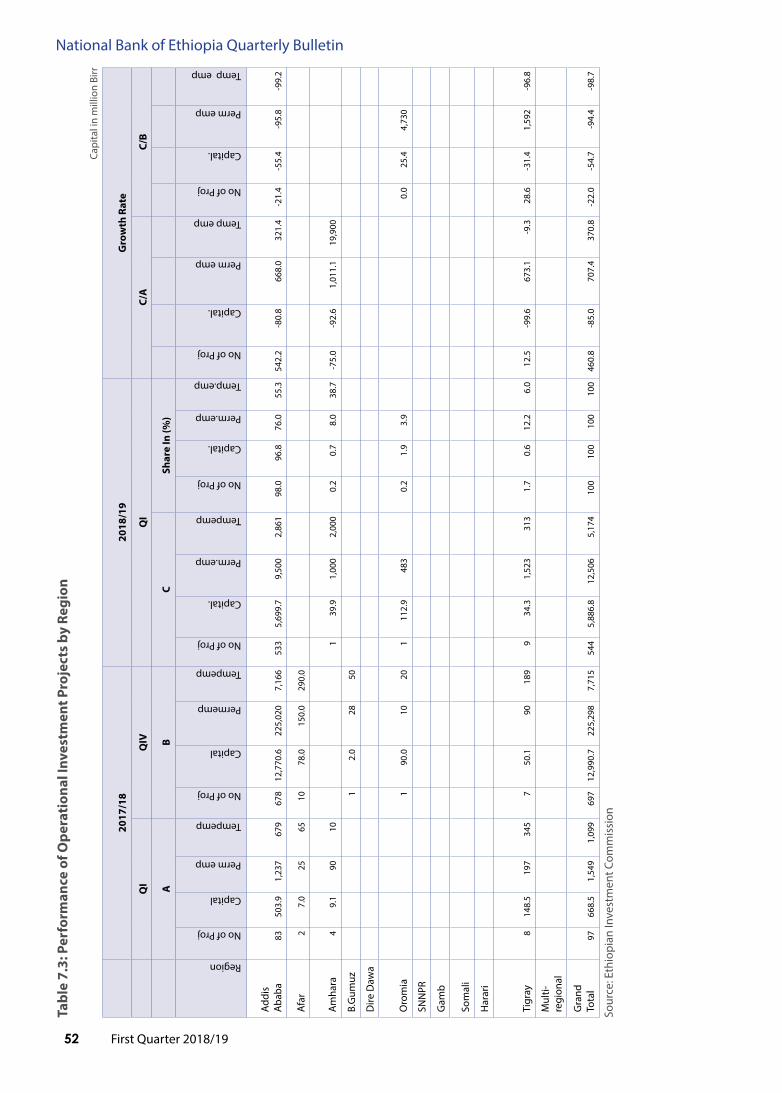
First Quarter 2018/1952
National Bank of Ethiopia Quarterly Bulletinta
ble
7.3:
per
form
ance
of o
pera
tion
al in
vest
men
t pro
ject
s by
Reg
ion
Capi
tal i
n m
illio
n Bi
rr
20
17/1
820
18/1
9G
row
th R
ate
Q
iQ
iVQ
iC/
aC/
B
a
BC
Shar
e in
(%)
Region
No of Proj
Capital
Perm emp
Tempemp
No of Proj
Capital
Permemp
Tempemp
No of Proj
Capital.
Perm.emp
Tempemp
No of Proj
Capital.
Perm.emp
Temp.emp
No of Proj
Capital.
Perm emp
Temp emp
No of Proj
Capital.
Perm emp
Temp emp
Addi
s A
baba
8350
3.9
1,23
767
967
812
,770
.622
5,02
07,
166
533
5,69
9.7
9,50
02,
861
98.0
96.8
76.0
55.3
542.
2-8
0.8
668.
032
1.4
-21.
4-5
5.4
-95.
8-9
9.2
Afa
r2
7.0
2565
1078
.015
0.0
290.
0
Am
hara
49.
190
101
39.9
1,00
02,
000
0.2
0.7
8.0
38.7
-75.
0-9
2.6
1,01
1.1
19,9
00
B.G
umuz
12.
028
50
Dire
Daw
a
Oro
mia
190
.010
201
112.
948
30.
21.
93.
90.
025
.44,
730
SNN
PR
Gam
b
Som
ali
Har
ari
Tigr
ay8
148.
519
734
57
50.1
9018
99
34.3
1,52
331
31.
70.
612
.26.
012
.5-9
9.6
673.
1-9
.328
.6-3
1.4
1,59
2-9
6.8
Mul
ti-re
gion
al
Gra
nd
Tota
l97
668.
51,
549
1,09
969
712
,990
.722
5,29
87,
715
544
5,88
6.8
12,5
065,
174
100
100
100
100
460.
8-8
5.0
707.
437
0.8
-22.
0-5
4.7
-94.
4-9
8.7
Sour
ce: E
thio
pian
Inve
stm
ent C
omm
issi
on
First Quarter 2018/19 53
National Bank of Ethiopia Quarterly Bulletin
Viii. iNtERNatioNal ECoNoMiC DEVElopMENtS
8.1 overview of the World Economy6
In the first quarter of 2018/19, global survey indicators continue to signal a steady growth momentum. Surveys suggest global activity momentum might moderate somewhat.
The global composite output Purchasing Managers’ Index (PMI) excluding the euro area declined somewhat below its long-term average in August. On the other hand, consumer confidence indicators remain positive, despite the recent declines.
In the United States activity is expected to remain strong this year. Tight labour market conditions, with historically low unemployment levels, stable participation and an upward trend on wage growth, should support household incomes and spending, while solid corporate profits and favorable financial conditions should bolster investment.
In Japan, the economic expansion is projected to decelerate gradually. While activity should benefit from accommodative monetary policy, declining fiscal support and increasingly binding capacity constraints are expected to weigh on growth. Wages are rising moderately amid a tightening labour market, which should support household spending.
In the United Kingdom, moderate growth is expected due to lagging domestic demand. In addition, uncertainty associated with Brexit negotiations is expected to affect investment in U.K. in the short term.
In China economic activity is decelerating. Mainly the slowing housing market and the lagged effects of earlier financial tightening are expected to affect growth. Higher tariffs imposed by the United States are expected to affect trade performance and growth. On the other hand, monetary accommodation and some fiscal support expected to sustain activity growth in the near term. In the medium term, it is assumed that continued progress on structural reforms would lead to an orderly slowdown and some rebalancing of the Chinese economy.
Economic activity is projected to strengthen moderately in the large commodity-exporting countries. The outlook for Russia is supported 6 Sections 8.1 – 8.4 are excerpted from European Central Bank monthly bulletin of 6/2018.
by the rise in oil prices this year, relatively low inflation and improving business and consumer confidence. The recently imposed US sanctions and increased political uncertainties are expected to affect the economy in the near term. However, in medium term, economic activity is expected to expand moderately. In Brazil, the short-term outlook is affected by political uncertainties and the disruptions from strikes. However, further ahead an improved labour market and continuing monetary accommodation should support consumption, as inflationary pressures remain contained.
8.2. inflation Developments
The past increase in oil prices has put upward pressure on global consumer price inflation. In the OECD area, consumer price index (CPI) inflation rose to 2.9 percent in July. Excluding food and energy, inflation increased slightly to 2.1 percent, extending a very moderate upward trend observed over the past year. In the future, global inflationary pressures are expected to remain contained.
In United States, annual headline consumer price index (CPI) inflation reached its highest level since 2012, rising to 2.9 percent in June, while increasing to 2.3 percent when food and energy are excluded.
In Euro area annual HICP inflation rose to 2 percent in June, up from 1.9 percent in May. This increase reflected higher contributions from energy, food and non-energy industrial goods inflations, which offset a lower contribution from services price inflation.
In Japan, annual headline CPI inflation remained stable at 0.7 percent in June, yet underlying inflation remained low, with CPI excluding food and energy stood at 0 percent. However, inflation is projected to remain below the Bank of Japan’s 2 percent inflation target.
8.3 Commodity price
The price of oil has risen again, reaching USD 80 per barrel on 12 September. The latest increase reflected market reaction to lower-than-expected crude oil inventories in the United States, which suggested a faster tightening of the market than had been expected.

First Quarter 2018/1954
National Bank of Ethiopia Quarterly Bulletin
8.4 Exchange Rate Developments
In foreign exchange markets, the euro broadly strengthened in trade-weighted terms. Over the review period, the nominal effective exchange rate of the euro, measured against the currencies of 38 of the euro area’s most important trading partners, appreciated by 3.3 percent. The euro strengthened in effective terms despite depreciating vis-à-vis the US dollar and the Swiss franc. In bilateral terms, the euro weakened against the US dollar (by 1.2 percent), against the Swiss franc (by 2.7 percent), but remained unchanged against the Japanese yen. By contrast, the euro broadly appreciated vis-à-vis the currencies of most emerging economies, including the Chinese renminbi (by 5.4 percent) and, the Turkish lira, the Brazilian real and the Russian rouble.
8.5. impact of Global Economic Development on Ethiopian Economy
During the first quarter of F.Y. 2018/19, global economic activities indicators pointed to a steady growth momentum. The global composite output Purchasing Managers’ Index (PMI) excluding the euro area declined somewhat below its long-term average in August.
Global headline inflation, meanwhile, has picked up supported by the increase in oil prices. This together with the depreciation of NEER made the REER to depreciate by 1.5 percent despite higher domestic prices. On the other hand, the increase in energy prices could increase the country’s import bills to have depressing effect on the current account deficit.

First Quarter 2018/19 55
National Bank of Ethiopia Quarterly Bulletin
StatiStiCal taBlES
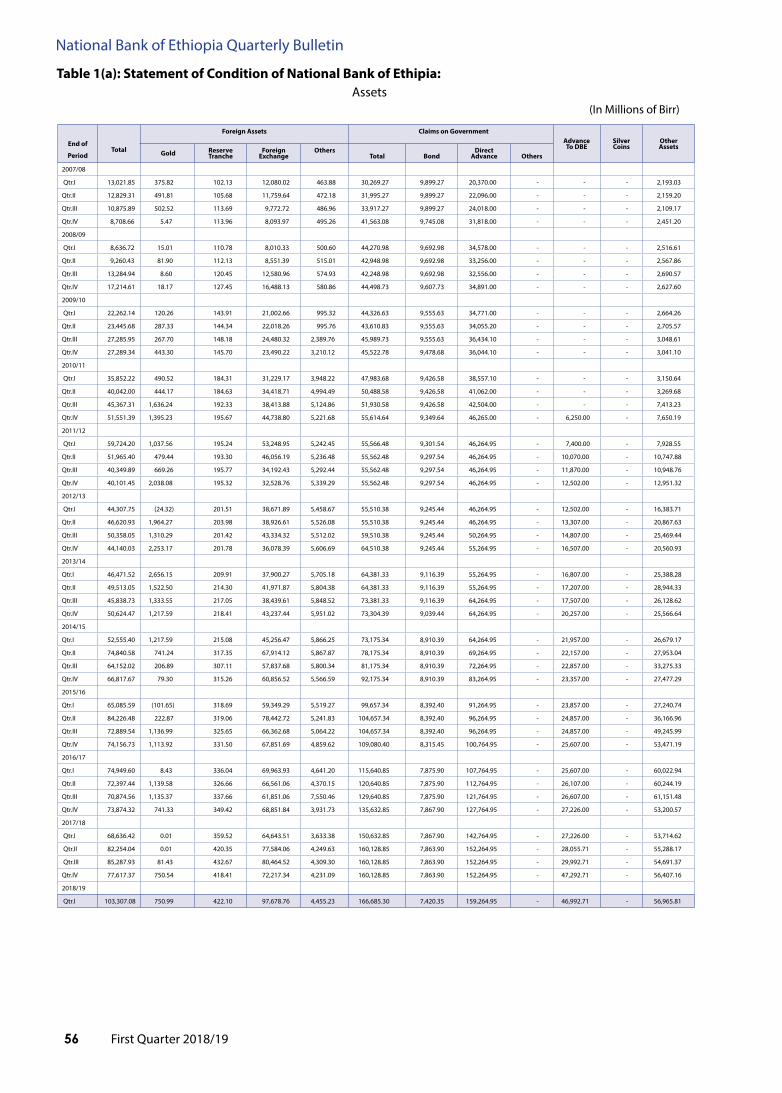
First Quarter 2018/1956
National Bank of Ethiopia Quarterly Bulletin
table 1(a): Statement of Condition of National Bank of Ethipia: Assets
(In Millions of Birr)
End of
period
total
foreign assets
Claims on Government advanceto DBE
SilverCoins
other assets
Gold Reservetranche
foreign Exchange
others
total
Bond
Directadvance
others
2007/08
Qtr.I 13,021.85 375.82 102.13 12,080.02 463.88 30,269.27 9,899.27 20,370.00 - - - 2,193.03
Qtr.II 12,829.31 491.81 105.68 11,759.64 472.18 31,995.27 9,899.27 22,096.00 - - - 2,159.20
Qtr.III 10,875.89 502.52 113.69 9,772.72 486.96 33,917.27 9,899.27 24,018.00 - - - 2,109.17
Qtr.IV 8,708.66 5.47 113.96 8,093.97 495.26 41,563.08 9,745.08 31,818.00 - - - 2,451.20
2008/09
Qtr.I 8,636.72 15.01 110.78 8,010.33 500.60 44,270.98 9,692.98 34,578.00 - - - 2,516.61
Qtr.II 9,260.43 81.90 112.13 8,551.39 515.01 42,948.98 9,692.98 33,256.00 - - - 2,567.86
Qtr.III 13,284.94 8.60 120.45 12,580.96 574.93 42,248.98 9,692.98 32,556.00 - - - 2,690.57
Qtr.IV 17,214.61 18.17 127.45 16,488.13 580.86 44,498.73 9,607.73 34,891.00 - - - 2,627.60
2009/10
Qtr.I 22,262.14 120.26 143.91 21,002.66 995.32 44,326.63 9,555.63 34,771.00 - - - 2,664.26
Qtr.II 23,445.68 287.33 144.34 22,018.26 995.76 43,610.83 9,555.63 34,055.20 - - - 2,705.57
Qtr.III 27,285.95 267.70 148.18 24,480.32 2,389.76 45,989.73 9,555.63 36,434.10 - - - 3,048.61
Qtr.IV 27,289.34 443.30 145.70 23,490.22 3,210.12 45,522.78 9,478.68 36,044.10 - - - 3,041.10
2010/11
Qtr.I 35,852.22 490.52 184.31 31,229.17 3,948.22 47,983.68 9,426.58 38,557.10 - - - 3,150.64
Qtr.II 40,042.00 444.17 184.63 34,418.71 4,994.49 50,488.58 9,426.58 41,062.00 - - - 3,269.68
Qtr.III 45,367.31 1,636.24 192.33 38,413.88 5,124.86 51,930.58 9,426.58 42,504.00 - - - 7,413.23
Qtr.IV 51,551.39 1,395.23 195.67 44,738.80 5,221.68 55,614.64 9,349.64 46,265.00 - 6,250.00 - 7,650.19
2011/12
Qtr.I 59,724.20 1,037.56 195.24 53,248.95 5,242.45 55,566.48 9,301.54 46,264.95 - 7,400.00 - 7,928.55
Qtr.II 51,965.40 479.44 193.30 46,056.19 5,236.48 55,562.48 9,297.54 46,264.95 - 10,070.00 - 10,747.88
Qtr.III 40,349.89 669.26 195.77 34,192.43 5,292.44 55,562.48 9,297.54 46,264.95 - 11,870.00 - 10,948.76
Qtr.IV 40,101.45 2,038.08 195.32 32,528.76 5,339.29 55,562.48 9,297.54 46,264.95 - 12,502.00 - 12,951.32
2012/13
Qtr.I 44,307.75 (24.32) 201.51 38,671.89 5,458.67 55,510.38 9,245.44 46,264.95 - 12,502.00 - 16,383.71
Qtr.II 46,620.93 1,964.27 203.98 38,926.61 5,526.08 55,510.38 9,245.44 46,264.95 - 13,307.00 - 20,867.63
Qtr.III 50,358.05 1,310.29 201.42 43,334.32 5,512.02 59,510.38 9,245.44 50,264.95 - 14,807.00 - 25,469.44
Qtr.IV 44,140.03 2,253.17 201.78 36,078.39 5,606.69 64,510.38 9,245.44 55,264.95 - 16,507.00 - 20,560.93
2013/14
Qtr.I 46,471.52 2,656.15 209.91 37,900.27 5,705.18 64,381.33 9,116.39 55,264.95 - 16,807.00 - 25,388.28
Qtr.II 49,513.05 1,522.50 214.30 41,971.87 5,804.38 64,381.33 9,116.39 55,264.95 - 17,207.00 - 28,944.33
Qtr.III 45,838.73 1,333.55 217.05 38,439.61 5,848.52 73,381.33 9,116.39 64,264.95 - 17,507.00 - 26,128.62
Qtr.IV 50,624.47 1,217.59 218.41 43,237.44 5,951.02 73,304.39 9,039.44 64,264.95 - 20,257.00 - 25,566.64
2014/15
Qtr.I 52,555.40 1,217.59 215.08 45,256.47 5,866.25 73,175.34 8,910.39 64,264.95 - 21,957.00 - 26,679.17
Qtr.II 74,840.58 741.24 317.35 67,914.12 5,867.87 78,175.34 8,910.39 69,264.95 - 22,157.00 - 27,953.04
Qtr.III 64,152.02 206.89 307.11 57,837.68 5,800.34 81,175.34 8,910.39 72,264.95 - 22,857.00 - 33,275.33
Qtr.IV 66,817.67 79.30 315.26 60,856.52 5,566.59 92,175.34 8,910.39 83,264.95 - 23,357.00 - 27,477.29
2015/16
Qtr.I 65,085.59 (101.65) 318.69 59,349.29 5,519.27 99,657.34 8,392.40 91,264.95 - 23,857.00 - 27,240.74
Qtr.II 84,226.48 222.87 319.06 78,442.72 5,241.83 104,657.34 8,392.40 96,264.95 - 24,857.00 - 36,166.96
Qtr.III 72,889.54 1,136.99 325.65 66,362.68 5,064.22 104,657.34 8,392.40 96,264.95 - 24,857.00 - 49,245.99
Qtr.IV 74,156.73 1,113.92 331.50 67,851.69 4,859.62 109,080.40 8,315.45 100,764.95 - 25,607.00 - 53,471.19
2016/17
Qtr.I 74,949.60 8.43 336.04 69,963.93 4,641.20 115,640.85 7,875.90 107,764.95 - 25,607.00 - 60,022.94
Qtr.II 72,397.44 1,139.58 326.66 66,561.06 4,370.15 120,640.85 7,875.90 112,764.95 - 26,107.00 - 60,244.19
Qtr.III 70,874.56 1,135.37 337.66 61,851.06 7,550.46 129,640.85 7,875.90 121,764.95 - 26,607.00 - 61,151.48
Qtr.IV 73,874.32 741.33 349.42 68,851.84 3,931.73 135,632.85 7,867.90 127,764.95 - 27,226.00 - 53,200.57
2017/18
Qtr.I 68,636.42 0.01 359.52 64,643.51 3,633.38 150,632.85 7,867.90 142,764.95 - 27,226.00 - 53,714.62
Qtr.II 82,254.04 0.01 420.35 77,584.06 4,249.63 160,128.85 7,863.90 152,264.95 - 28,055.71 - 55,288.17
Qtr.III 85,287.93 81.43 432.67 80,464.52 4,309.30 160,128.85 7,863.90 152,264.95 - 29,992.71 - 54,691.37
Qtr.IV 77,617.37 750.54 418.41 72,217.34 4,231.09 160,128.85 7,863.90 152,264.95 - 47,292.71 - 56,407.16
2018/19
Qtr.I 103,307.08 750.99 422.10 97,678.76 4,455.23 166,685.30 7,420.35 159,264.95 - 46,992.71 - 56,965.81

First Quarter 2018/19 57
National Bank of Ethiopia Quarterly Bulletin
table 1(b): Statement of Condition of National Bank of Ethipia: Liabilities
(In Millions of Birr)
End ofperiod
total
liab.=assets
Currency (Notes +
Coins)
Deposits foreign liabilitiesCapital
accountotherliab.
total Gov't Banker total fundCredit others
2007/08
Qtr.I 45,484.15 14,847.95 20,238.35 8,032.28 12,206.08 2,674.04 - 2,674.04 3,115.04 4,608.76
Qtr.II 46,983.78 16,355.52 19,216.37 6,740.91 12,475.46 2,761.94 - 2,761.94 3,116.72 5,533.24
Qtr.III 46,902.32 18,958.53 16,917.68 5,966.52 10,951.16 3,621.19 - 3,621.19 2,129.14 5,275.79
Qtr.IV 52,722.94 20,216.39 21,492.02 6,157.32 15,334.70 2,768.01 - 2,768.01 2,124.40 6,122.12
2008/09
Qtr.I 55,424.30 19,640.12 23,365.96 7,222.97 16,143.00 3,660.06 - 3,660.06 3,592.76 5,165.40
Qtr.II 54,777.27 20,870.35 25,148.92 6,215.84 18,933.09 3,123.02 - 3,123.02 2,088.31 3,546.68
Qtr.III 58,224.49 23,303.92 24,710.29 6,682.81 18,027.48 3,713.38 556.02 3,157.36 2,101.15 4,395.76
Qtr.IV 64,340.94 23,836.35 27,942.19 6,671.53 21,270.67 5,380.94 588.35 4,792.59 2,094.84 5,086.60
2009/10
Qtr.I 69,253.03 22,773.23 31,494.51 7,373.32 24,121.19 8,049.53 2,127.19 5,922.33 1,588.53 5,347.24
Qtr.II 69,762.08 25,663.17 28,307.16 7,785.92 20,521.24 8,693.10 2,132.24 6,560.86 1,576.74 5,521.92
Qtr.III 76,324.29 27,277.96 30,107.70 7,036.56 23,071.13 10,995.53 2,188.91 8,806.62 1,576.18 6,366.93
Qtr.IV 75,853.22 28,802.93 26,803.98 6,182.46 20,621.52 11,906.03 2,152.27 9,753.76 1,574.95 6,765.34
2010/11
Qtr.I 86,986.54 29,711.72 31,872.51 8,265.64 23,606.88 12,848.92 2,722.65 10,126.26 2,809.67 9,743.72
Qtr.II 93,800.26 33,949.03 32,141.88 9,369.75 22,772.12 15,062.65 4,769.71 10,292.95 2,757.53 9,889.18
Qtr.III 104,711.13 37,456.68 37,453.93 11,276.68 26,177.25 15,282.84 4,972.05 10,310.80 2,757.53 11,760.16
Qtr.IV 121,066.21 39,100.58 40,233.45 10,290.93 29,942.52 18,695.39 5,058.24 13,637.15 2,749.74 20,287.05
2011/12
Qtr.I 130,619.23 38,732.57 48,523.29 19,133.30 29,389.99 20,368.49 5,047.27 15,321.22 8,848.06 14,146.82
Qtr.II 128,345.76 42,048.13 43,045.28 17,307.05 25,738.23 17,289.74 4,996.96 12,292.78 8,848.06 17,114.54
Qtr.III 118,731.13 44,710.64 29,832.27 11,962.11 17,870.17 15,825.84 5,060.88 10,764.96 8,831.80 19,530.58
Qtr.IV 121,117.25 45,785.24 30,405.78 10,218.40 20,187.38 18,847.12 5,049.31 13,797.81 4,841.48 21,237.65
2012/13
Qtr.I 128,703.84 46,183.34 38,073.19 17,980.48 20,092.72 19,311.91 5,209.14 14,102.77 4,841.92 20,293.48
Qtr.II 136,305.95 50,971.94 36,872.57 12,778.13 24,094.44 20,263.30 5,273.03 14,990.27 4,833.78 23,364.36
Qtr.III 150,144.87 54,292.91 34,503.60 17,952.55 16,551.06 20,750.51 5,181.16 15,569.34 4,833.78 35,764.07
Qtr.IV 145,718.34 54,917.74 29,031.39 9,133.04 19,898.35 19,494.41 5,297.81 14,196.60 4,834.47 37,440.33
2013/14
Qtr.I 153,048.13 50,571.65 37,323.17 16,548.01 20,775.16 23,064.82 5,426.52 17,638.30 4,842.06 37,246.44
Qtr.II 160,045.71 53,864.09 32,759.15 14,339.95 18,419.21 28,216.04 5,456.21 22,759.83 4,842.06 40,364.38
Qtr.III 162,855.69 61,372.47 35,971.75 12,807.36 23,164.39 22,394.73 5,468.90 16,925.83 4,842.06 38,274.68
Qtr.IV 169,752.50 64,355.05 33,760.96 8,793.48 24,967.48 23,910.57 5,685.44 18,225.13 4,849.06 42,876.86
2014/15
Qtr.I 174,366.91 63,714.21 37,053.76 14,407.98 22,645.78 25,489.57 5,577.32 19,912.25 4,849.07 43,260.30
Qtr.II 203,125.95 70,709.06 33,899.35 13,882.20 20,017.15 46,447.12 5,577.32 40,869.81 4,849.07 47,221.36
Qtr.III 201,459.69 74,337.79 42,291.49 21,308.75 20,982.74 36,511.44 5,490.54 31,020.90 4,849.07 43,469.91
Qtr.IV 209,827.30 75,240.70 42,325.60 15,098.54 27,227.06 36,844.30 5,034.04 31,810.26 4,849.07 50,567.64
2015/16
Qtr.I 215,840.68 74,745.66 48,887.10 31,740.19 17,146.91 36,004.39 4,988.41 31,015.98 4,849.20 51,354.33
Qtr.II 249,907.78 77,830.00 49,034.83 25,739.39 23,295.44 61,731.80 4,662.00 57,069.80 4,849.20 56,461.95
Qtr.III 251,649.87 80,258.93 45,004.03 20,077.26 24,926.76 59,027.31 4,479.63 54,547.68 4,849.20 62,510.41
Qtr.IV 262,315.31 82,592.70 50,614.34 14,042.32 36,572.02 63,650.30 4,271.47 59,378.84 4,849.20 60,608.76
2016/17
Qtr.I 276,220.38 85,811.90 54,484.65 18,220.23 36,264.42 71,483.16 4,027.65 67,455.51 4,849.20 59,591.48
Qtr.II 279,389.48 90,247.04 53,908.66 15,628.13 38,280.53 66,855.56 3,645.20 63,210.36 4,849.20 63,529.02
Qtr.III 288,273.88 92,212.49 66,239.19 19,084.80 47,154.39 56,579.86 3,434.90 53,144.96 4,849.20 68,393.15
Qtr.IV 289,933.74 94,245.51 66,754.22 14,741.81 52,012.41 49,897.29 3,296.00 46,601.29 4,849.20 74,187.52
2017/18
Qtr.I 300,209.88 94,962.74 76,379.95 19,337.75 57,042.20 50,984.56 3,036.68 47,947.88 4,849.20 73,033.43
Qtr.II 325,726.77 105,936.80 61,913.44 16,680.94 45,232.50 70,862.22 3,239.47 67,622.75 4,849.20 82,165.11
Qtr.III 330,100.86 112,438.63 68,720.48 18,874.93 49,845.54 59,522.34 2,907.62 56,614.71 4,849.20 84,570.22
Qtr.IV 341,446.08 112,910.96 81,186.45 19,921.99 61,264.46 48,857.99 2,502.21 46,355.78 4,849.20 93,641.49
2018/19
Qtr.I 373,950.89 110,876.51 83,541.82 19,601.81 63,940.01 82,036.37 2,107.92 79,928.45 4,849.20 92,646.99
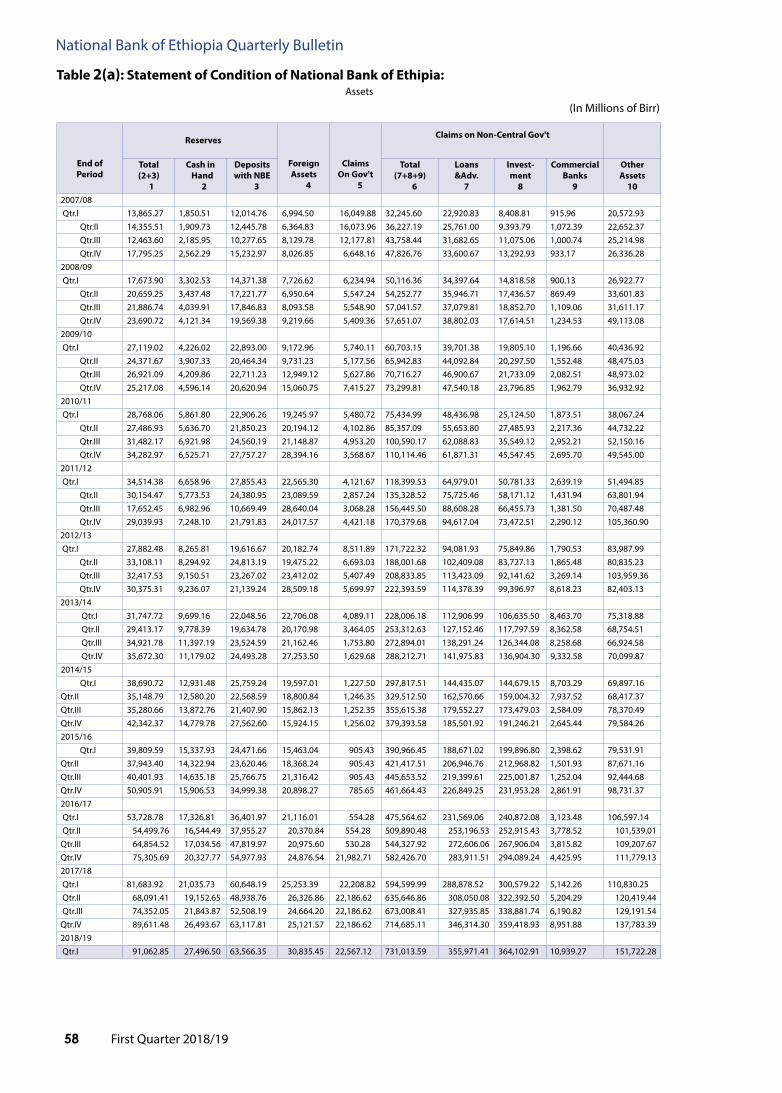
First Quarter 2018/1958
National Bank of Ethiopia Quarterly Bulletin
table 2(a): Statement of Condition of National Bank of Ethipia: Assets
(In Millions of Birr)
End ofperiod
Reserves
foreignassets
4
Claims
on Gov't 5
Claims on Non-Central Gov't
total(2+3)
1
Cash in hand
2
Depositswith NBE
3
total(7+8+9)
6
loans&adv.
7
invest-ment
8
CommercialBanks
9
otherassets
102007/08 Qtr.I 13,865.27 1,850.51 12,014.76 6,994.50 16,049.88 32,245.60 22,920.83 8,408.81 915.96 20,572.93 Qtr.II 14,355.51 1,909.73 12,445.78 6,364.83 16,073.96 36,227.19 25,761.00 9,393.79 1,072.39 22,652.37 Qtr.III 12,463.60 2,185.95 10,277.65 8,129.78 12,177.81 43,758.44 31,682.65 11,075.06 1,000.74 25,214.98 Qtr.IV 17,795.25 2,562.29 15,232.97 8,026.85 6,648.16 47,826.76 33,600.67 13,292.93 933.17 26,336.28 2008/09 Qtr.I 17,673.90 3,302.53 14,371.38 7,726.62 6,234.94 50,116.36 34,397.64 14,818.58 900.13 26,922.77 Qtr.II 20,659.25 3,437.48 17,221.77 6,950.64 5,547.24 54,252.77 35,946.71 17,436.57 869.49 33,601.83 Qtr.III 21,886.74 4,039.91 17,846.83 8,093.58 5,548.90 57,041.57 37,079.81 18,852.70 1,109.06 31,611.17 Qtr.IV 23,690.72 4,121.34 19,569.38 9,219.66 5,409.36 57,651.07 38,802.03 17,614.51 1,234.53 49,113.08 2009/10 Qtr.I 27,119.02 4,226.02 22,893.00 9,172.96 5,740.11 60,703.15 39,701.38 19,805.10 1,196.66 40,436.92 Qtr.II 24,371.67 3,907.33 20,464.34 9,731.23 5,177.56 65,942.83 44,092.84 20,297.50 1,552.48 48,475.03 Qtr.III 26,921.09 4,209.86 22,711.23 12,949.12 5,627.86 70,716.27 46,900.67 21,733.09 2,082.51 48,973.02 Qtr.IV 25,217.08 4,596.14 20,620.94 15,060.75 7,415.27 73,299.81 47,540.18 23,796.85 1,962.79 36,932.92 2010/11 Qtr.I 28,768.06 5,861.80 22,906.26 19,245.97 5,480.72 75,434.99 48,436.98 25,124.50 1,873.51 38,067.24 Qtr.II 27,486.93 5,636.70 21,850.23 20,194.12 4,102.86 85,357.09 55,653.80 27,485.93 2,217.36 44,732.22 Qtr.III 31,482.17 6,921.98 24,560.19 21,148.87 4,953.20 100,590.17 62,088.83 35,549.12 2,952.21 52,150.16 Qtr.IV 34,282.97 6,525.71 27,757.27 28,394.16 3,568.67 110,114.46 61,871.31 45,547.45 2,695.70 49,545.00 2011/12 Qtr.I 34,514.38 6,658.96 27,855.43 22,565.30 4,121.67 118,399.53 64,979.01 50,781.33 2,639.19 51,494.85 Qtr.II 30,154.47 5,773.53 24,380.95 23,089.59 2,857.24 135,328.52 75,725.46 58,171.12 1,431.94 63,801.94 Qtr.III 17,652.45 6,982.96 10,669.49 28,640.04 3,068.28 156,445.50 88,608.28 66,455.73 1,381.50 70,487.48 Qtr.IV 29,039.93 7,248.10 21,791.83 24,017.57 4,421.18 170,379.68 94,617.04 73,472.51 2,290.12 105,360.90 2012/13 Qtr.I 27,882.48 8,265.81 19,616.67 20,182.74 8,511.89 171,722.32 94,081.93 75,849.86 1,790.53 83,987.99 Qtr.II 33,108.11 8,294.92 24,813.19 19,475.22 6,693.03 188,001.68 102,409.08 83,727.13 1,865.48 80,835.23 Qtr.III 32,417.53 9,150.51 23,267.02 23,412.02 5,407.49 208,833.85 113,423.09 92,141.62 3,269.14 103,959.36 Qtr.IV 30,375.31 9,236.07 21,139.24 28,509.18 5,699.97 222,393.59 114,378.39 99,396.97 8,618.23 82,403.13 2013/14 Qtr.I 31,747.72 9,699.16 22,048.56 22,706.08 4,089.11 228,006.18 112,906.99 106,635.50 8,463.70 75,318.88 Qtr.II 29,413.17 9,778.39 19,634.78 20,170.98 3,464.05 253,312.63 127,152.46 117,797.59 8,362.58 68,754.51 Qtr.III 34,921.78 11,397.19 23,524.59 21,162.46 1,753.80 272,894.01 138,291.24 126,344.08 8,258.68 66,924.58 Qtr.IV 35,672.30 11,179.02 24,493.28 27,253.50 1,629.68 288,212.71 141,975.83 136,904.30 9,332.58 70,099.87 2014/15 Qtr.I 38,690.72 12,931.48 25,759.24 19,597.01 1,227.50 297,817.51 144,435.07 144,679.15 8,703.29 69,897.16 Qtr.II 35,148.79 12,580.20 22,568.59 18,800.84 1,246.35 329,512.50 162,570.66 159,004.32 7,937.52 68,417.37 Qtr.III 35,280.66 13,872.76 21,407.90 15,862.13 1,252.35 355,615.38 179,552.27 173,479.03 2,584.09 78,370.49 Qtr.IV 42,342.37 14,779.78 27,562.60 15,924.15 1,256.02 379,393.58 185,501.92 191,246.21 2,645.44 79,584.26 2015/16 Qtr.I 39,809.59 15,337.93 24,471.66 15,463.04 905.43 390,966.45 188,671.02 199,896.80 2,398.62 79,531.91 Qtr.II 37,943.40 14,322.94 23,620.46 18,368.24 905.43 421,417.51 206,946.76 212,968.82 1,501.93 87,671.16 Qtr.III 40,401.93 14,635.18 25,766.75 21,316.42 905.43 445,653.52 219,399.61 225,001.87 1,252.04 92,444.68 Qtr.IV 50,905.91 15,906.53 34,999.38 20,898.27 785.65 461,664.43 226,849.25 231,953.28 2,861.91 98,731.37 2016/17 Qtr.I 53,728.78 17,326.81 36,401.97 21,116.01 554.28 475,564.62 231,569.06 240,872.08 3,123.48 106,597.14 Qtr.II 54,499.76 16,544.49 37,955.27 20,370.84 554.28 509,890.48 253,196.53 252,915.43 3,778.52 101,539.01 Qtr.III 64,854.52 17,034.56 47,819.97 20,975.60 530.28 544,327.92 272,606.06 267,906.04 3,815.82 109,207.67 Qtr.IV 75,305.69 20,327.77 54,977.93 24,876.54 21,982.71 582,426.70 283,911.51 294,089.24 4,425.95 111,779.13 2017/18 Qtr.I 81,683.92 21,035.73 60,648.19 25,253.39 22,208.82 594,599.99 288,878.52 300,579.22 5,142.26 110,830.25 Qtr.II 68,091.41 19,152.65 48,938.76 26,326.86 22,186.62 635,646.86 308,050.08 322,392.50 5,204.29 120,419.44 Qtr.III 74,352.05 21,843.87 52,508.19 24,664.20 22,186.62 673,008.41 327,935.85 338,881.74 6,190.82 129,191.54 Qtr.IV 89,611.48 26,493.67 63,117.81 25,121.57 22,186.62 714,685.11 346,314.30 359,418.93 8,951.88 137,783.39 2018/19 Qtr.I 91,062.85 27,496.50 63,566.35 30,835.45 22,567.12 731,013.59 355,971.41 364,102.91 10,939.27 151,722.28

First Quarter 2018/19 59
National Bank of Ethiopia Quarterly Bulletin
table 2(b): Statement of Condition of National Bank of Ethipia: Liabilities
(In Millions of Birr)
End ofperiod
total (liab.=assets)
Non-Central Gov't DepositsGov't
Depos.
foreign
liab.
Capital account otherliab.total
(3+4+5)
Demand
time
Savingtotal
(9+10+11)Capital
legal
Reserve
others
1 2 3 4 5 6 7 8 9 10 11 12
2007/08
Qtr.I 89728.2 45987.1 17473.8 3519.0 24994.4 8168.9 2113.1 7946.8 6022.7 695.1 1229.0 25512.3
Qtr.II 95673.9 47523.9 17472.9 3750.4 26300.7 9083.0 2221.8 8502.6 6230.9 715.9 1555.8 28342.6
Qtr.III 101744.6 49881.9 18402.8 3649.3 27829.8 9410.2 2384.4 9480.3 6372.3 755.1 2352.8 30587.9
Qtr.IV 106633.3 51175.4 18343.6 3354.1 29477.6 8978.3 2301.9 8692.7 6650.6 1160.1 882.0 35485.1
2008/09
Qtr.I 108674.6 56010.6 21545.8 3001.2 31463.7 8410.6 2315.5 9645.2 6733.5 1230.0 1681.7 32292.7
Qtr.II 121011.7 59279.8 23758.2 2977.8 32543.8 10336.0 2854.6 10537.1 7140.8 1251.8 2144.5 38004.2
Qtr.III 124182.0 62157.9 24447.5 3051.3 34659.0 11766.0 2801.5 11577.3 7188.2 1251.9 3137.2 35879.2
Qtr.IV 145083.9 64134.2 23737.1 3248.4 37148.7 10450.1 3076.5 10286.3 7289.9 1817.1 1179.3 57136.9
2009/10
Qtr.I 143172.1 69799.5 26482.9 3502.1 39814.5 10193.0 3856.6 11615.7 7351.5 1865.0 2399.3 47707.3
Qtr.II 153698.3 70853.0 25540.1 3498.8 41814.1 12446.7 3690.8 12382.9 7779.3 1999.4 2604.2 54325.0
Qtr.III 165187.4 76069.0 28137.8 3568.7 44362.5 14542.9 3960.9 13733.7 7988.5 1999.4 3745.8 56880.9
Qtr.IV 157925.8 81081.4 29083.6 3956.2 48041.6 13742.5 3254.3 12410.9 8104.2 2627.1 1679.6 47436.8
2010/11
Qtr.I 166997.0 85850.7 30488.1 3901.3 51461.4 13830.7 4246.1 16074.7 8251.8 2800.1 5022.8 46994.8
Qtr.II 181873.2 90753.8 33017.7 3860.1 53876.0 17847.5 4942.6 15372.0 8814.8 2875.6 3681.6 52957.3
Qtr.III 210324.6 101160.6 36557.4 4462.7 60140.4 22023.3 5595.2 17203.7 8993.7 2875.6 5334.4 64341.7
Qtr.IV 225905.3 114155.4 44949.5 4666.4 64539.6 20240.7 5715.5 15598.3 9352.3 3720.0 2526.0 70195.3
2011/12
Qtr.I 231095.7 119908.9 47241.2 4679.9 67987.8 20211.7 6441.2 18039.7 9463.9 3874.0 4701.8 66494.3
Qtr.II 255231.8 120849.5 44105.8 5165.3 71578.4 27669.1 8419.7 20118.9 10273.8 4083.0 5762.2 78174.6
Qtr.III 276293.8 135663.6 49133.4 10136.4 76393.8 30994.8 7392.2 23505.5 10588.9 4083.0 8833.7 78737.7
Qtr.IV 333219.2 152894.7 58345.8 12061.1 82487.8 28207.9 5484.2 26333.7 10766.2 4341.9 11225.7 120298.7
2012/13
Qtr.I 312287.4 154727.0 55112.8 12112.5 87501.8 29561.0 5874.0 22096.5 10848.5 5848.5 5399.6 100028.9
Qtr.II 328113.3 163882.2 57818.5 12930.1 93133.7 35693.3 6078.3 23819.5 11410.2 6095.9 6313.4 98640.0
Qtr.III 374030.3 181078.6 66836.5 13515.7 100726.5 34173.1 6038.1 26732.9 11848.3 6095.8 8788.7 126007.5
Qtr.IV 369381.2 189762.8 69253.3 14278.7 106230.8 39111.8 7515.2 23668.9 16207.7 3737.1 3724.1 109322.4
2013/14
Qtr.I 361868.0 196547.0 67873.9 15611.6 113061.5 30347.6 7787.7 27244.9 16648.3 4289.3 6307.3 99940.8
Qtr.II 375115.3 208389.3 69703.1 15928.7 122757.5 35196.6 7933.5 29890.4 18021.3 4432.1 7436.9 93705.5
Qtr.III 397656.6 223632.1 71185.4 17192.6 135254.1 41483.1 7843.1 34089.2 19040.2 4452.9 10596.1 90609.0
Qtr.IV 422868.0 244630.1 80947.3 17872.3 145810.5 39210.8 7995.1 28116.6 19412.6 4874.1 3829.9 102915.4
2014/15
Qtr.I 427229.9 253720.4 79404.6 18878.4 155437.5 34524.9 7599.6 33579.7 19576.2 6809.3 7194.2 97805.3
Qtr.II 453125.9 267761.4 82145.6 21324.7 164291.1 41958.4 7784.8 35980.6 20786.7 7102.8 8091.1 99640.7
Qtr.III 486381.0 288748.6 87992.9 37731.1 163024.6 39876.9 7985.8 41100.7 21089.1 7150.1 12861.6 108668.9
Qtr.IV 518500.4 310905.5 94282.9 41990.6 174632.0 47597.6 8326.6 46346.0 21607.2 7657.4 17081.4 105324.8
2015/16
Qtr.I 526676.4 321277.1 94511.0 44846.8 181919.2 44750.6 8351.7 40988.3 21854.9 10061.0 9072.4 111308.7
Qtr.II 566305.7 333108.0 95784.9 45039.0 192284.2 54814.9 9418.3 44605.5 22365.6 10260.6 11979.3 124359.0
Qtr.III 600722.0 346500.8 97666.7 47318.8 201515.3 55903.5 10021.1 50099.9 23925.7 10503.5 15670.6 138196.7
Qtr.IV 632985.6 378580.1 111923.5 49622.3 217034.3 48275.4 9880.5 54282.7 24742.0 11066.2 18474.5 141967.0
2016/17
Qtr.I 657560.8 395284.0 114563.3 52113.6 228607.1 48122.1 10224.6 48306.1 25430.7 13555.8 9319.6 155624.1
Qtr.II 686854.4 422592.7 122551.6 56019.1 244021.9 59973.0 9442.5 53837.7 25907.5 14058.7 13871.5 141008.4
Qtr.III 739896.0 459035.8 134885.3 59330.9 264819.7 59514.1 9775.1 58827.9 28022.7 14160.6 16644.6 152743.1
Qtr.IV 816370.8 499497.5 142883.0 63182.7 293431.7 57431.9 10818.8 91591.8 60893.9 9875.3 20822.6 157030.8
2017/18
Qtr.I 834576.4 528378.0 155588.0 65890.6 306899.4 57282.7 11920.7 82506.0 61439.6 11571.2 9495.3 154489.1
Qtr.II 872671.2 557368.9 161094.7 71726.8 324547.4 65662.5 15190.8 82934.7 62190.7 12080.5 8663.5 151514.2
Qtr.III 923402.8 605324.7 178222.2 74478.4 352624.1 66838.2 14436.5 88987.8 63762.9 12299.1 12925.8 147815.7
Qtr.IV 989388.2 654155.6 194737.4 76868.8 382549.4 60390.6 14504.8 95507.0 66196.6 12595.7 16714.7 164830.1
2018/19
Qtr.I 1027201.3 668751.4 182882.2 78698.5 407170.8 66445.1 14163.9 94700.6 67062.6 14917.5 12720.5 183140.3

First Quarter 2018/1960
National Bank of Ethiopia Quarterly Bulletin
table 3(a): Consolidated Statement of Condition of Development Bank of Ethipia: Assets
(In Millions of Birr)
End ofperiod
Cash &Banks foreign
assets
Claims on CentralGov't
Claims on Non-Central Gov't other assets total
assetstotal public Enterprise
Cooper-atives
private &individuals
2007/08
Qtr.I 481.15 184.54 80.84 4,893.32 431.94 153.96 4,307.41 824.36 6,464.22
Qtr.II 565.81 157.13 253.93 5,061.27 316.45 227.85 4,516.97 828.84 6,866.96
Qtr.III 444.82 143.95 253.93 5,248.60 397.64 228.90 4,622.06 764.01 6,855.30
Qtr.IV 293.85 194.84 253.93 5,389.25 518.92 200.61 4,669.72 838.10 6,969.97
2008/09
Qtr.I 639.13 226.80 253.93 5,579.55 527.45 178.53 4,873.57 688.57 7,387.97
Qtr.II 320.37 243.70 237.52 5,976.99 535.00 215.62 5,226.37 864.87 7,643.45
Qtr.III 174.66 248.80 219.42 6,246.95 539.70 222.66 5,484.59 834.94 7,724.78
Qtr.IV 137.89 374.59 219.42 6,435.92 546.22 193.14 5,696.57 743.24 7,911.07
2009/10
Qtr.I 205.29 549.70 219.42 7,135.13 597.47 164.88 6,372.78 720.57 8,830.11
Qtr.II 303.62 595.20 218.83 7,671.64 582.63 246.00 6,843.01 1,103.73 9,893.01
Qtr.III 219.98 1,513.01 203.02 8,068.25 609.20 235.01 7,224.04 1,147.57 11,151.83
Qtr.IV 422.78 1,023.91 184.92 8,787.24 699.57 202.47 7,885.20 919.24 11,338.08
2010/11
Qtr.I 505.43 1,058.79 184.92 8,952.77 703.88 143.97 8,104.93 1,140.16 11,842.07
Qtr.II 200.52 1,031.98 184.92 9,516.13 711.06 226.46 8,578.61 736.37 11,669.91
Qtr.III 810.38 1,175.29 176.42 10,355.88 928.65 202.34 9,224.88 995.52 13,513.49
Qtr.IV 810.38 1,175.29 176.42 10,355.88 928.65 202.34 9,224.88 995.52 13,513.49
2011/12
Qtr.I 810.38 1,175.29 176.42 10,355.88 928.65 202.34 9,224.88 995.52 13,513.49
Qtr.II 810.38 1,175.29 176.42 10,355.88 928.65 202.34 9,224.88 995.52 13,513.49
Qtr.III 810.38 1,175.29 176.42 10,355.88 928.65 202.34 9,224.88 995.52 13,513.49
Qtr.IV 810.38 1,175.29 176.42 10,355.88 928.65 202.34 9,224.88 995.52 13,513.49
2012/13
Qtr.I 710.96 1,122.00 7,866.42 15,323.90 1,385.16 102.91 13,835.83 1,867.93 26,891.21
Qtr.II 400.61 794.52 7,832.51 16,707.86 1,770.72 147.06 14,790.08 1,341.19 27,076.70
Qtr.III 281.13 190.20 8,814.41 17,657.91 1,910.88 196.39 15,550.65 856.25 27,799.89
Qtr.IV 379.77 457.00 9,819.44 17,928.90 1,660.21 87.79 16,180.91 1,374.79 29,959.90
2013/14
Qtr.I 1,948.03 350.90 8,425.93 18,556.52 1,791.63 78.99 16,685.89 1,723.32 31,004.70
Qtr.II 380.83 1,575.49 9,664.19 20,103.24 1,880.18 152.18 18,070.87 1,905.11 33,628.87
Qtr.III 535.83 1,888.62 9,807.16 18,542.19 1,930.05 108.33 16,503.81 2,545.42 33,319.20
Qtr.IV 1,156.66 1,890.59 11,337.60 21,443.02 2,003.46 63.56 19,376.00 1,971.93 37,799.81
2014/15
Qtr.I 1,175.45 1,511.30 13,148.05 20,197.59 1,996.89 54.11 18,146.59 2,550.90 38,583.28
Qtr.II 544.45 1,744.17 13,141.88 21,381.44 2,019.13 184.95 19,177.37 2,648.93 39,460.87
Qtr.III 1,143.62 1,803.01 13,112.08 22,224.86 2,002.19 165.61 20,057.07 2,719.16 41,002.74
Qtr.IV 1,173.92 1,635.37 13,289.06 25,677.84 2,675.48 130.93 22,871.43 2,343.58 44,119.75
2015/16
Qtr.I 1,175.45 1,511.30 13,148.05 20,197.59 1,996.89 54.11 18,146.59 2,550.90 38,583.28
Qtr.II 544.45 1,744.17 13,141.88 21,381.44 2,019.13 184.95 19,177.37 2,648.93 39,460.87
Qtr.III 1,143.62 1,803.01 13,112.08 22,224.86 2,002.19 165.61 20,057.07 2,719.16 41,002.74
Qtr.IV 1,173.92 1,635.37 13,289.06 25,677.84 2,675.48 130.93 22,871.43 2,343.58 44,119.75
2016/17
Qtr.I 2,434.51 2,430.84 15,836.85 29,770.27 2,838.72 104.12 26,827.43 3,846.72 54,319.19
Qtr.II 1,585.15 2,065.49 15,836.85 30,986.45 3,007.68 106.31 27,872.46 3,940.08 54,414.01
Qtr.III 1,462.81 2,849.59 15,816.87 31,734.09 2,765.88 107.49 28,860.71 4,032.03 55,895.39
Qtr.IV 1,232.72 3,225.53 15,816.87 31,590.85 2,632.74 108.69 28,849.42 5,223.28 57,089.25
2017/18
Qtr.I 824.85 2,902.01 15,816.87 32,396.06 2,605.80 127.06 29,663.20 5,273.55 57,213.34
Qtr.II 888.91 3,223.37 15,816.87 35,413.14 3,992.24 116.26 31,304.64 4,229.09 59,571.38
Qtr.III 1,049.8 4,813.1 15,796.9 37,322.9 4,081.2 108.8 33,132.8 6,278.0 65,260.8
Qtr.IV 2,703.06 4,387.68 32,797.34 39,155.36 4,113.94 438.25 34,603.17 4,804.21 83,847.64
2018/19
Qtr.I 956.91 4,783.60 32,796.90 40,801.82 4,158.57 487.14 36,156.11 4,950.16 84,289.39

First Quarter 2018/19 61
National Bank of Ethiopia Quarterly Bulletin
table 3(b): Consolidated Statement of Condition of Development Bank of Ethipia: Liablities
(In Millions of Birr)
End ofperiod
totalassets=liab.
Demand Deposits
time &Savings
Deposits
Capitalaccounts
Credit from Banks CreditfromGov't
foreignadvance& loan
otherliability
itemstotal N.B.E others
2007/08
Qtr.I 6464.2 16.5 477.5 1867.2 1888.3 381.4 1506.9 0.7 434.3 1779.7
Qtr.II 6867.0 37.1 400.4 1883.0 2087.5 381.4 1706.1 0.7 457.1 2001.1
Qtr.III 6855.3 46.5 369.3 1916.2 2091.1 381.4 1709.7 0.7 505.4 1926.2
Qtr.IV 6970.0 126.0 374.5 1910.0 2102.2 381.4 1720.8 0.0 506.1 1951.1
2008/09
Qtr.I 7388.0 187.0 379.1 1915.9 2338.6 381.4 1957.2 0.0 523.0 2044.5
Qtr.II 7643.5 141.7 381.3 1943.5 2340.0 381.4 1958.7 0.0 523.0 2314.0
Qtr.III 7724.8 102.0 385.1 1948.8 2341.2 381.4 1959.8 0.0 647.3 2300.4
Qtr.IV 7911.1 124.7 369.4 1934.2 2341.6 381.4 1960.2 0.0 647.3 2493.9
2009/10
Qtr.I 8830.1 123.4 372.5 2014.7 2571.3 424.3 2147.0 0.0 887.9 2860.3
Qtr.II 9893.0 75.2 368.9 1943.1 3028.7 424.3 2604.4 0.0 900.5 3576.6
Qtr.III 11151.8 85.6 369.1 2084.5 4228.3 424.3 3804.0 884.5 3499.9
Qtr.IV 11338.1 179.0 376.2 2124.7 4618.9 381.4 4237.5 0.0 978.7 3060.7
2010/11
Qtr.I 11842.1 141.5 382.4 2357.4 4799.2 381.4 4417.9 0.0 985.0 3176.6
Qtr.II 11669.9 235.2 384.0 2223.6 4951.9 381.4 4570.5 0.0 909.0 2966.2
Qtr.III 13513.5 414.9 373.3 2224.9 6403.1 381.4 6021.7 0.0 997.7 3099.7
Qtr.IV 13513.5 414.9 373.3 2224.9 6403.1 381.4 6021.7 0.0 997.7 3099.7
2011/12
Qtr.I 13513.5 414.9 373.3 2224.9 6403.1 381.4 6021.7 0.0 997.7 3099.7
Qtr.II 13513.5 414.9 373.3 2224.9 6403.1 381.4 6021.7 0.0 997.7 3099.7
Qtr.III 13513.5 414.9 373.3 2224.9 6403.1 381.4 6021.7 0.0 997.7 3099.7
Qtr.IV 13513.5 414.9 373.3 2224.9 6403.1 381.4 6021.7 0.0 997.7 3099.7
2012/13
Qtr.I 26891.2 374.8 384.1 2739.0 17154.1 642.5 16511.7 0.0 1209.7 5029.5
Qtr.II 27076.7 376.3 384.4 2856.4 16348.8 644.0 15704.8 0.0 1539.1 5571.7
Qtr.III 27799.9 355.7 375.8 3157.2 18741.4 740.0 18001.5 0.0 1771.2 4360.5
Qtr.IV 29959.9 347.3 380.8 3150.3 20889.9 610.1 20279.8 0.0 2301.2 2677.8
2013/14
Qtr.I 31004.7 299.0 390.5 3390.9 21434.5 17667.5 3767.0 0.0 2371.6 2922.9
Qtr.II 33628.9 248.0 377.3 3620.2 21340.4 17792.1 3548.2 0.0 2928.6 5114.4
Qtr.III 33319.2 348.3 378.0 3763.5 21746.5 18101.6 3645.0 0.0 3105.7 3977.5
Qtr.IV 37799.8 634.9 376.9 3567.6 27234.6 20851.6 6383.1 0.0 3409.4 2576.3
2014/15
Qtr.I 38583.3 656.7 380.5 3895.2 25430.9 22551.6 2879.4 0.0 3621.7 4598.2
Qtr.II 39460.9 298.6 377.5 4086.6 25618.8 22751.2 2867.6 0.0 3770.0 5309.4
Qtr.III 41002.7 300.4 376.1 4082.9 26599.7 23451.6 3148.2 0.0 3880.6 5762.9
Qtr.IV 44119.7 427.2 376.4 4255.6 27411.0 23951.6 3459.4 0.0 4031.0 7618.5
2014/15
Qtr.I 47977.8 445.9 375.4 7688.5 27369.2 23857.0 3512.2 0.0 4018.5 8080.3
Qtr.II 50132.2 436.7 375.3 7792.1 28428.5 24857.0 3571.5 0.0 4627.5 8472.2
Qtr.III 51587.2 1006.5 376.3 7858.8 28464.9 24935.9 3529.0 0.0 4727.4 9153.3
Qtr.IV 52696.4 1040.1 376.6 7968.7 29328.4 29251.5 76.9 0.0 4726.8 9255.8
2016/17
Qtr.I 54319.2 1251.8 381.9 7834.4 31771.8 31711.6 60.2 0.0 4795.7 8283.6
Qtr.II 54414.0 903.6 380.5 7876.9 33091.6 33033.9 57.7 0.0 4816.9 7344.5
Qtr.III 55895.4 868.2 120.0 7960.9 34190.1 34131.5 58.6 0.0 4826.3 7929.9
Qtr.IV 57089.2 948.4 122.2 7918.9 34984.4 34309.7 674.7 0.0 4822.2 8293.1
2017/18
Qrt.I 57213.3 915.8 126.0 8032.8 35365.3 35304.9 60.4 0.0 5096.4 7677.0
Qtr.II 59571.4 1130.5 125.9 7999.9 37888.6 37832.6 56.0 0.0 5226.4 7200.1
Qtr.III 65260.8 1102.0 125.9 8048.3 40102.1 40043.1 59.0 0.0 6292.0 9590.4
Qtr.IV 83847.6 1081.5 125.3 8043.8 58125.1 58064.1 61.0 0.0 6849.1 9622.9
2018/19
Qtr.I 84289.4 867.5 129.4 7461.4 58247.5 58185.1 62.4 0.0 8111.8 9471.7

First Quarter 2018/1962
National Bank of Ethiopia Quarterly Bulletin
table 4: Money Supply and its Determinants
(In Millions of Birr)
End ofperiod
Money and Quasi-Money Domestic Credit
Net foreign assetsotheritems
NetCurrencyoutside
Banks
NetDemandDeposit
MoneySupply (1+2)
Quasi-Money
totalVolume
(3+4)
totalCredit (7+10)
Net Claims on Gov't Claims on
Non-CenGov'ttotal
(8+9)Nat.
BankComm.Banks
total
(13+12)
Nat.Bank
Comm.Banks
1 2 3 4 5 6 7 8 9 10 11 12 13 14
2007/08
Qtr.I 12997.4 16968.5 29966.0 28513.4 58479.4 61447.7 30118.0 22237.0 7881.0 31329.6 15229.2 10347.8 4881.4 18197.5
Qtr.II 14445.8 16652.0 31097.8 30051.0 61148.8 67400.1 32245.3 25254.4 6991.0 35154.8 14210.4 10067.4 4143.0 20461.7
Qtr.III 16772.6 17462.8 34235.3 31479.1 65714.4 73476.1 30718.4 27950.8 2767.6 42757.7 13000.1 7254.7 5745.4 20761.7
Qtr.IV 17654.1 17696.3 35350.4 32831.8 68182.1 79969.3 33075.7 35405.8 -2330.1 46893.6 11665.6 5940.7 5725.0 23452.7
2008/09
Qtr.I 16337.6 20633.9 36971.5 34464.8 71436.3 84088.6 34872.4 37048.0 -2175.7 49216.2 10387.8 4976.7 5411.1 23040.0
Qtr.II 17432.9 22949.2 40382.1 35521.6 75903.7 85327.7 31944.4 36733.1 -4788.8 53383.3 10233.5 6137.4 4096.0 19657.4
Qtr.III 19264.0 23589.2 42853.2 37710.3 80563.5 85281.6 29349.1 35566.2 -6217.1 55932.5 14863.6 9571.6 5292.0 19581.6
Qtr.IV 19715.0 22397.6 42112.7 40397.1 82509.8 89203.0 32786.5 37827.2 -5040.7 56416.5 17976.8 11833.7 6143.1 24670.1
2009/10
Qtr.I 18547.2 25572.4 44119.7 43316.6 87436.2 92006.9 32500.4 36953.3 -4452.9 59506.5 19529.0 14212.6 5316.3 24099.6
Qtr.II 21755.8 24372.3 46128.1 45312.9 91441.0 92946.2 28555.8 35824.9 -7269.1 64390.3 20793.0 14752.6 6040.4 22298.2
Qtr.III 23068.1 26271.8 49339.9 47931.1 97271.0 98671.9 30038.2 38953.2 -8915.0 68633.8 25278.6 16290.4 8988.2 26679.5
Qtr.IV 24206.8 27728.0 51934.8 51997.8 103932.6 104350.1 33013.1 39340.3 -6327.2 71337.0 27189.8 15383.3 11806.5 27607.3
2010/11
Qtr.I 23849.9 29249.4 53099.3 55362.7 108462.0 104929.6 31368.1 39718.0 -8349.9 73561.5 38003.2 23003.3 14999.9 34470.8
Qrt II 28312.3 31751.8 60064.2 57736.1 117800.2 110514.0 27374.2 41118.8 -13744.6 83139.7 40230.9 24979.3 15251.5 32944.6
Qtr.III 30534.7 35172.0 65706.7 64603.1 130309.8 121221.7 23583.8 40653.9 -17070.1 97638.0 45638.1 30084.5 15553.6 36550.1
Qtr.IV 32574.9 43596.1 76171.0 69206.0 145377.0 142320.4 28651.7 45323.7 -16672.1 113668.8 55534.7 32856.0 22678.7 52478.1
2011/12
Qtr.I 32073.6 46068.6 78142.2 72667.7 150809.9 143503.5 20343.1 36433.2 -16090.1 123160.3 55479.8 39355.7 16124.1 48173.4
Qtr.II 36274.6 42880.0 79154.6 76743.7 155898.2 157410.2 13443.6 38255.4 -24811.8 143966.6 49345.6 34675.7 14669.9 50857.5
Qtr.III 37727.7 47246.4 84974.1 86530.1 171504.3 182607.9 15673.9 43600.4 -27926.5 166934.0 45771.8 24524.1 21247.8 56875.5
Qtr.IV 38537.1 56312.7 94849.9 94548.9 189398.8 202149.0 21557.4 45344.1 -23786.7 180591.6 39787.7 21254.3 18533.4 52537.9
2012/13
Qtr.I 37917.5 54544.8 92462.3 99614.2 192076.5 198914.6 16480.8 37529.9 -21049.1 182433.8 39304.6 24995.8 14308.8 46142.7
Qtr.II 42677.0 57524.7 100201.7 106063.7 206265.4 213175.2 13732.0 42732.3 -29000.2 199443.2 39754.6 26357.6 13396.9 46664.4
Qtr.III 45142.4 66203.3 111345.7 114242.2 225587.9 233163.9 12792.2 41557.8 -28765.7 220371.7 46981.5 29607.5 17373.9 54557.5
Qtr.IV 45681.7 69052.4 114734.1 120509.5 235243.6 252247.9 21965.5 55377.3 -33411.8 230282.4 45639.6 24645.6 20994.0 62643.9
2013/14
Qtr.I 40872.5 67625.2 108497.7 128673.1 237170.8 257924.3 21574.8 47833.3 -26258.5 236349.5 38325.1 23406.7 14918.4 59078.5
Qtr.II 44085.7 69579.6 113665.3 138686.2 252351.5 280465.9 18308.9 50041.4 -31732.5 262157.1 33534.5 21297.0 12237.5 61648.9
Qtr.III 49975.3 71046.9 121022.2 152446.7 273468.9 302987.0 20844.6 60574.0 -39729.3 282142.3 36763.3 23444.0 13319.3 66281.3
Qtr.IV 53176.0 80887.8 134063.8 163682.8 297746.6 326066.9 26929.7 64510.9 -37581.2 299137.1 45972.3 26713.9 19258.4 74292.6
2014/15
Qtr.I 50782.7 79355.5 130138.2 174315.9 304454.1 336541.2 25470.0 58767.4 -33297.4 311071.2 39063.2 27065.8 11997.4 71150.4
Qtr.II 58128.9 82081.5 140210.4 185615.8 325826.2 367313.1 23581.1 64293.1 -40712.0 343732.0 39409.4 28393.5 11016.0 80896.4
Qtr.III 60465.0 87943.8 148408.8 200755.7 349164.5 397130.3 21242.0 59866.6 -38624.6 375888.3 35516.9 27640.6 7876.3 83482.7
Qtr.IV 60460.9 94245.4 154706.3 216622.6 371328.9 430840.4 30735.3 77076.8 -46341.6 400105.1 37570.9 29973.4 7597.6 97082.4
2015/16
Qtr.I 59407.7 94503.3 153911.1 226766.0 380677.1 436496.8 24072.0 67917.1 -43845.1 412424.8 36192.5 29081.2 7111.3 92012.2
Qtr.II 63507.1 95784.8 159291.9 237323.2 396615.0 469781.0 25008.5 78918.0 -53909.5 444772.6 31444.6 22494.7 8949.9 104610.6
Qtr.III 65623.8 97666.6 163290.4 248834.1 412124.5 498840.5 29582.0 84580.1 -54998.1 469258.5 25157.5 13862.2 11295.3 111873.5
Qtr.IV 66686.2 111923.5 178609.7 266656.6 445266.3 531957.9 47548.4 95038.1 -47489.7 484409.5 21524.2 10506.4 11017.8 108215.8
2016/17
Qtr.I 68485.1 114563.3 183048.4 280720.7 463769.0 547901.0 49852.8 97420.6 -47567.8 498048.1 14357.8 3466.4 10891.4 98489.8
Qtr.II 73702.5 122551.6 196254.2 300041.1 496295.2 577812.9 45594.0 105012.7 -59418.8 532219.0 16470.2 5541.9 10928.4 97987.9
Qtr.III 75177.9 134885.3 210063.2 324150.6 534213.8 618691.4 51572.3 110556.0 -58983.8 567119.1 25495.2 14294.7 11200.5 109972.8
Qtr.IV 73917.7 142883.0 216800.8 356614.4 573415.2 690,668.6 85441.8 120891.0 -35449.2 605226.7 38034.8 23,977.0 14057.8 155288.2
2017/18
Qtr.I 73927.0 155588.0 229515.0 372790.0 602305.0 712905 96221.3 131295.1 -35073.8 616683.7 30984.6 17651.9 13332.7 141584.6
Qtr.II 86784.2 161094.7 247878.9 396274.2 644153.1 758,470.3 99972.0 143447.9 -43475.9 658498.3 22527.9 11,391.8 11136.1 136845.1
Qtr.III 90594.8 178222.2 268817.0 427102.4 695919.4 793412.6 96602.3 141253.9 -44651.6 696810.3 35993.3 25765.6 10227.7 133486.5
Qtr.IV 86417.3 194737.4 281154.7 459418.2 740572.9 855028.8 102002.8 140206.9 -38204.0 753025.9 39376.2 28759.4 10616.8 153832.1
2018/19
Qtr.I 83380.0 182882.2 266262.2 485869.2 752131.4 870272.6 103205.5 147083.5 -43878.0 767067.0 37942.3 21270.7 16671.6 156083.4
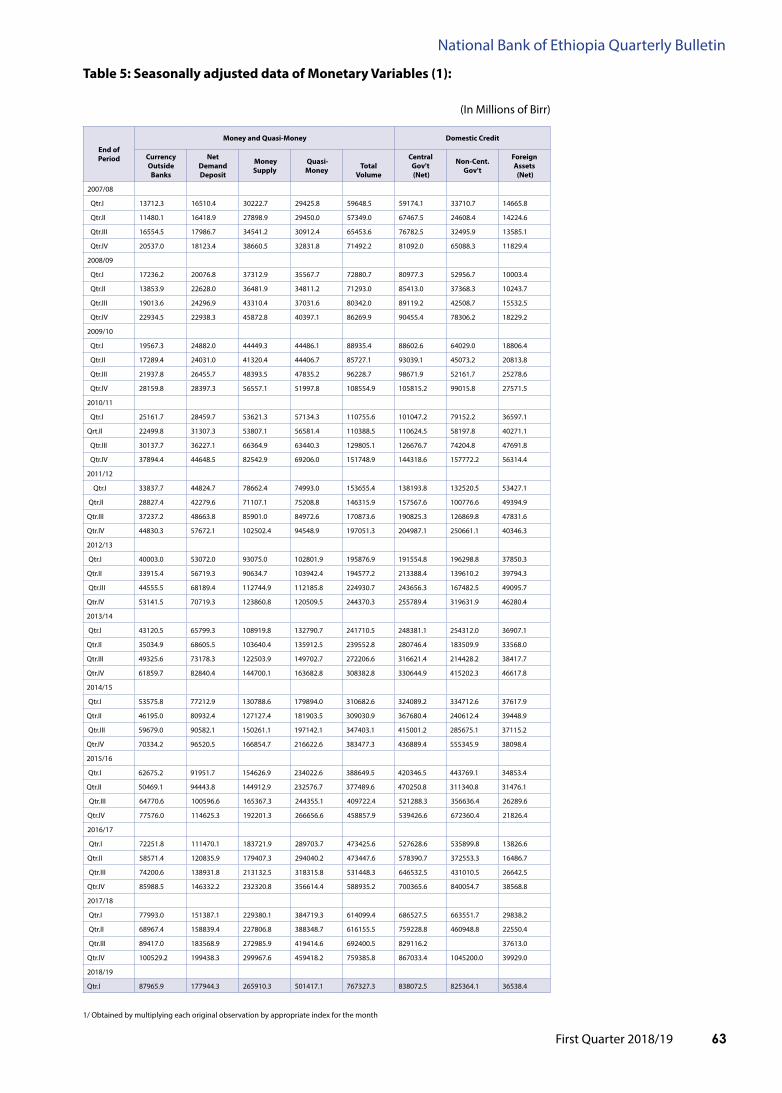
First Quarter 2018/19 63
National Bank of Ethiopia Quarterly Bulletin
table 5: Seasonally adjusted data of Monetary Variables (1):
(In Millions of Birr)
End of period
Money and Quasi-Money Domestic Credit
Currencyoutside
Banks
NetDemandDeposit
MoneySupply
Quasi-Money
total
Volume
CentralGov't (Net)
Non-Cent.Gov't
foreignassets (Net)
2007/08
Qtr.I 13712.3 16510.4 30222.7 29425.8 59648.5 59174.1 33710.7 14665.8
Qtr.II 11480.1 16418.9 27898.9 29450.0 57349.0 67467.5 24608.4 14224.6
Qtr.III 16554.5 17986.7 34541.2 30912.4 65453.6 76782.5 32495.9 13585.1
Qtr.IV 20537.0 18123.4 38660.5 32831.8 71492.2 81092.0 65088.3 11829.4
2008/09
Qtr.I 17236.2 20076.8 37312.9 35567.7 72880.7 80977.3 52956.7 10003.4
Qtr.II 13853.9 22628.0 36481.9 34811.2 71293.0 85413.0 37368.3 10243.7
Qtr.III 19013.6 24296.9 43310.4 37031.6 80342.0 89119.2 42508.7 15532.5
Qtr.IV 22934.5 22938.3 45872.8 40397.1 86269.9 90455.4 78306.2 18229.2
2009/10
Qtr.I 19567.3 24882.0 44449.3 44486.1 88935.4 88602.6 64029.0 18806.4
Qtr.II 17289.4 24031.0 41320.4 44406.7 85727.1 93039.1 45073.2 20813.8
Qtr.III 21937.8 26455.7 48393.5 47835.2 96228.7 98671.9 52161.7 25278.6
Qtr.IV 28159.8 28397.3 56557.1 51997.8 108554.9 105815.2 99015.8 27571.5
2010/11
Qtr.I 25161.7 28459.7 53621.3 57134.3 110755.6 101047.2 79152.2 36597.1
Qrt.II 22499.8 31307.3 53807.1 56581.4 110388.5 110624.5 58197.8 40271.1
Qtr.III 30137.7 36227.1 66364.9 63440.3 129805.1 126676.7 74204.8 47691.8
Qtr.IV 37894.4 44648.5 82542.9 69206.0 151748.9 144318.6 157772.2 56314.4
2011/12
Qtr.I 33837.7 44824.7 78662.4 74993.0 153655.4 138193.8 132520.5 53427.1
Qtr.II 28827.4 42279.6 71107.1 75208.8 146315.9 157567.6 100776.6 49394.9
Qtr.III 37237.2 48663.8 85901.0 84972.6 170873.6 190825.3 126869.8 47831.6
Qtr.IV 44830.3 57672.1 102502.4 94548.9 197051.3 204987.1 250661.1 40346.3
2012/13
Qtr.I 40003.0 53072.0 93075.0 102801.9 195876.9 191554.8 196298.8 37850.3
Qtr.II 33915.4 56719.3 90634.7 103942.4 194577.2 213388.4 139610.2 39794.3
Qtr.III 44555.5 68189.4 112744.9 112185.8 224930.7 243656.3 167482.5 49095.7
Qtr.IV 53141.5 70719.3 123860.8 120509.5 244370.3 255789.4 319631.9 46280.4
2013/14
Qtr.I 43120.5 65799.3 108919.8 132790.7 241710.5 248381.1 254312.0 36907.1
Qtr.II 35034.9 68605.5 103640.4 135912.5 239552.8 280746.4 183509.9 33568.0
Qtr.III 49325.6 73178.3 122503.9 149702.7 272206.6 316621.4 214428.2 38417.7
Qtr.IV 61859.7 82840.4 144700.1 163682.8 308382.8 330644.9 415202.3 46617.8
2014/15
Qtr.I 53575.8 77212.9 130788.6 179894.0 310682.6 324089.2 334712.6 37617.9
Qtr.II 46195.0 80932.4 127127.4 181903.5 309030.9 367680.4 240612.4 39448.9
Qtr.III 59679.0 90582.1 150261.1 197142.1 347403.1 415001.2 285675.1 37115.2
Qtr.IV 70334.2 96520.5 166854.7 216622.6 383477.3 436889.4 555345.9 38098.4
2015/16
Qtr.I 62675.2 91951.7 154626.9 234022.6 388649.5 420346.5 443769.1 34853.4
Qtr.II 50469.1 94443.8 144912.9 232576.7 377489.6 470250.8 311340.8 31476.1
Qtr.III 64770.6 100596.6 165367.3 244355.1 409722.4 521288.3 356636.4 26289.6
Qtr.IV 77576.0 114625.3 192201.3 266656.6 458857.9 539426.6 672360.4 21826.4
2016/17
Qtr.I 72251.8 111470.1 183721.9 289703.7 473425.6 527628.6 535899.8 13826.6
Qtr.II 58571.4 120835.9 179407.3 294040.2 473447.6 578390.7 372553.3 16486.7
Qtr.III 74200.6 138931.8 213132.5 318315.8 531448.3 646532.5 431010.5 26642.5
Qtr.IV 85988.5 146332.2 232320.8 356614.4 588935.2 700365.6 840054.7 38568.8
2017/18
Qtr.I 77993.0 151387.1 229380.1 384719.3 614099.4 686527.5 663551.7 29838.2
Qtr.II 68967.4 158839.4 227806.8 388348.7 616155.5 759228.8 460948.8 22550.4
Qtr.III 89417.0 183568.9 272985.9 419414.6 692400.5 829116.2 37613.0
Qtr.IV 100529.2 199438.3 299967.6 459418.2 759385.8 867033.4 1045200.0 39929.0
2018/19
Qtr.I 87965.9 177944.3 265910.3 501417.1 767327.3 838072.5 825364.1 36538.4
1/ Obtained by multiplying each original observation by appropriate index for the month

First Quarter 2018/1964
National Bank of Ethiopia Quarterly Bulletin
table 6: international Reserves and Net foreign assets of National Bank & Commercial Banks:
(In Millions of Birr)
End ofperiod
Gross Reserve
foreign liabilities Net foreign assetsNational Bank of Ethiopia
international Reserves Comm.Banks
Reserve
GrossReserves
NBEtotal
Gold
foreign
Exc.
others
Reservetranche
posi.
totalliab.
Comm.Banks
NBE
total
NBE
Comm.Banks
1=2+6 2=3 to 5 3 4 5 6 7=8+9 8 9 10=11+12 11=2-9 12=6-8
2007/08
Qtr.I 20016.3 13021.8 375.8 12080.0 463.9 102.1 6994.5 4787.1 2113.1 2674.0 15229.2 10347.8 4881.4
Qtr.II 19194.1 12829.3 491.8 11759.6 472.2 105.7 6364.8 4983.7 2221.8 2761.9 14210.4 10067.4 4143.0
Qtr.III 19005.7 10875.9 502.5 9772.7 487.0 113.7 8129.8 6005.6 2384.4 3621.2 13000.1 7254.7 5745.4
Qtr.IV 16735.5 8708.7 5.5 8094.0 495.3 114.0 8026.8 5069.9 2301.9 2768.0 11665.6 5940.7 5725.0
2008/09
Qtr.I 16363.3 8636.7 15.0 8010.3 500.6 110.8 7726.6 5975.6 2315.5 3660.1 10387.8 4976.7 5411.1
Qtr.II 16211.1 9260.4 81.9 8551.4 515.0 112.1 6950.6 5977.6 2854.6 3123.0 10233.5 6137.4 4096.0
Qtr.III 21378.5 13284.9 8.6 12581.0 574.9 120.4 8093.6 6514.9 2801.5 3713.4 14863.6 9571.6 5292.0
Qtr.IV 26434.3 17214.6 18.2 16488.1 580.9 127.5 9219.7 8457.5 3076.5 5380.9 17976.8 11833.7 6143.1
2009/10
Qtr.I 31435.1 22262.1 120.3 21002.7 995.3 143.9 9173.0 11906.1 3856.6 8049.5 19529.0 14212.6 5316.3
Qtr.II 33176.9 23445.7 287.3 22018.3 995.8 144.3 9731.2 12383.9 3690.8 8693.1 20793.0 14752.6 6040.4
Qtr.III 40235.1 27286.0 267.7 24480.3 2389.8 148.2 12949.1 14956.5 3960.9 10995.5 25278.6 16290.4 8988.2
Qtr.IV 42350.1 27289.3 443.3 23490.2 3210.1 145.7 15060.8 15160.3 3254.3 11906.0 27189.8 15383.3 11806.5
2010/11
Qtr.I 55098.2 35852.2 490.5 31229.2 3948.2 184.3 19246.0 17095.0 4246.1 12848.9 38003.2 23003.3 14999.9
Qrt.II 60236.1 40042.0 444.2 34418.7 4994.5 184.6 20194.1 20005.2 4942.6 15062.7 40230.9 24979.3 15251.5
Qtr.III 66516.2 45367.3 1636.2 38413.9 5124.9 192.3 21148.9 20878.1 5595.2 15282.8 45638.1 30084.5 15553.6
Qtr.IV 79945.5 51551.4 1395.2 44738.8 5221.7 195.7 28394.2 24410.9 5715.5 18695.4 55534.7 32856.0 22678.7
2011/12
Qtr.I 82289.5 59724.2 1037.6 53248.9 5242.4 195.2 22565.3 26809.7 6441.2 20368.5 55479.8 39355.7 16124.1
Qtr.II 75055.0 51965.4 479.4 46056.2 5236.5 193.3 23089.6 25709.4 8419.7 17289.7 49345.6 34675.7 14669.9
Qtr.III 68989.9 40349.9 669.3 34192.4 5292.4 195.8 28640.0 23218.1 7392.2 15825.8 45771.8 24524.1 21247.8
Qtr.IV 64119.0 40101.4 2038.1 32528.8 5339.3 195.3 24017.6 24331.3 5484.2 18847.1 39787.7 21254.3 18533.4
2012/13
Qtr.I 64490.5 44307.7 -24.3 38671.9 5458.7 201.5 20182.7 25185.9 5874.0 19311.9 39304.6 24995.8 14308.8
Qtr.II 66096.2 46620.9 1964.3 38926.6 5526.1 204.0 19475.2 26341.6 6078.3 20263.3 39754.6 26357.6 13396.9
Qtr.III 73770.1 50358.0 1310.3 43334.3 5512.0 201.4 23412.0 26788.6 6038.1 20750.5 46981.5 29607.5 17373.9
Qtr.IV 72649.2 44140.0 2253.2 36078.4 5606.7 201.8 28509.2 27009.6 7515.2 19494.4 45639.6 24645.6 20994.0
2013/14
Qtr.I 69177.6 46471.5 2656.2 37900.3 5705.2 209.9 22706.1 30852.5 7787.7 23064.8 38325.1 23406.7 14918.4
Qtr.II 69684.0 49513.1 1522.5 41971.9 5804.4 214.3 20171.0 36149.5 7933.5 28216.0 33534.5 21297.0 12237.5
Qtr.III 67001.2 45838.7 1333.6 38439.6 5848.5 217.0 21162.5 30237.9 7843.1 22394.7 36763.3 23444.0 13319.3
Qtr.IV 77878.0 50624.5 1217.6 43237.4 5951.0 218.4 27253.5 31905.7 7995.1 23910.6 45972.3 26713.9 19258.4
2014/15
Qtr.I 72152.4 52555.4 1217.6 45256.5 5866.3 215.1 19597.0 33089.2 7599.6 25489.6 39063.2 27065.8 11997.4
Qtr.II 93641.4 74840.6 741.2 67914.1 5867.9 317.4 18800.8 54232.0 7784.8 46447.1 39409.4 28393.5 11016.0
Qtr.III 80014.2 64152.0 206.9 57837.7 5800.3 307.1 15862.1 44497.2 7985.8 36511.4 35516.9 27640.6 7876.3
Qtr.IV 82741.8 66817.7 79.3 60856.5 5566.6 315.3 15924.1 45170.9 8326.6 36844.3 37570.9 29973.4 7597.6
2015/16
Qtr.I 80548.6 65085.6 -101.7 59349.3 5519.3 318.7 15463.0 44356.1 8351.7 36004.4 36192.5 29081.2 7111.3
Qtr.II 102594.7 84226.5 222.9 78442.7 5241.8 319.1 18368.2 71150.1 9418.3 61731.8 31444.6 22494.7 8949.9
Qtr.III 94206.0 72889.5 1137.0 66362.7 5064.2 325.7 21316.4 69048.4 10021.1 59027.3 25157.5 13862.2 11295.3
Qtr.IV 95055.0 74156.7 1113.9 67851.7 4859.6 331.5 20898.3 73530.8 9880.5 63650.3 21524.2 10506.4 11017.8
2016/17
Qtr.I 96065.6 74949.6 8.4 69963.9 4641.2 336.0 21116.0 81707.8 10224.6 71483.2 14357.8 3466.4 10891.4
Qtr.III 92768.3 72397.4 1139.6 66561.1 4370.1 326.7 20370.8 76298.0 9442.5 66855.6 16470.2 5541.9 10928.4
Qtr.III 91850.2 70874.6 1135.4 61851.1 7550.5 337.7 20975.6 66355.0 9775.1 56579.9 25495.2 14294.7 11200.5
Qtr.IV 98750.9 73874.3 741.3 68851.8 3931.7 349.4 24876.5 60716.1 10818.8 49897.3 38034.8 23977.0 14057.8
2017/18
Qtr.I 93889.8 68636.4 0.0 64643.5 3633.4 359.5 25253.4 62905.2 11920.7 50984.6 30984.6 17651.9 13332.7
Qtr.II 108580.9 82254.0 0.0 77584.1 4249.6 420.4 26326.9 86053.0 15190.8 70862.2 22527.9 11391.8 11136.1
Qtr.III 109952.1 85287.9 81.4 80464.5 4309.3 432.7 24664.2 73958.8 14436.5 59522.3 35993.3 25765.6 10227.7
Qtr.IV 102738.9 77617.4 750.5 72217.3 4231.1 418.4 25121.6 63362.7 14504.8 48858.0 39376.2 28759.4 10616.8
2017/18
Qtr.I 134142.5 103307.1 751.0 97678.8 4455.2 422.1 30835.4 96200.3 14163.9 82036.4 37942.3 21270.7 16671.6

First Quarter 2018/19 65
National Bank of Ethiopia Quarterly Bulletin
table 7: Domestic Credit by Sector:
(In Millions of Birr)
End ofperiod
GrossDomestic
Credit
Claims on Central Gov't Claims on Non-Central Gov't
total
NBE
Comm.Banks
total
loans &advances
invest-ments
1=2+5 2=3+4 3 4 5=6+7 6 7
2007/08
Qtr.I 77648.8 46319.1 30269.3 16049.9 31329.6 22920.8 8408.8
Qtr.II 83224.0 48069.2 31995.3 16074.0 35154.8 25761.0 9393.8
Qtr.III 88852.8 46095.1 33917.3 12177.8 42757.7 31682.6 11075.1
Qtr.IV 95104.8 48211.2 41563.1 6648.2 46893.6 33600.7 13292.9
2008/09
Qtr.I 99722.1 50505.9 44271.0 6234.9 49216.2 34397.6 14818.6
Qtr.II 101879.5 48496.2 42949.0 5547.2 53383.3 35946.7 17436.6
Qtr.III 103730.4 47797.9 42249.0 5548.9 55932.5 37079.8 18852.7
Qtr.IV 106324.6 49908.1 44498.7 5409.4 56416.5 38802.0 17614.5
2009/10
Qtr.I 109573.2 50066.7 44326.6 5740.1 59506.5 39701.4 19805.1
Qtr.II 113178.7 48788.4 43610.8 5177.6 64390.3 44092.8 20297.5
Qtr.III 120251.3 51617.6 45989.7 5627.9 68633.8 46900.7 21733.1
Qtr.IV 124275.1 52938.0 45522.8 7415.3 71337.0 47540.2 23796.9
2010/11
Qtr.I 127025.9 53464.4 47983.7 5480.7 73561.5 48437.0 25124.5
Qrt.II 137731.2 54591.4 50488.6 4102.9 83139.7 55653.8 27485.9
Qtr.III 154521.7 56883.8 51930.6 4953.2 97638.0 62088.8 35549.1
Qtr.IV 172852.1 59183.3 55614.6 3568.7 113668.8 68121.3 45547.5
2011/12
Qtr.I 182848.5 59688.2 55566.5 4121.7 123160.3 72379.0 50781.3
Qtr.II 202386.3 58419.7 55562.5 2857.2 143966.6 85795.5 58171.1
Qrt.III 225564.8 58630.8 55562.5 3068.3 166934.0 100478.3 66455.7
Qtr.IV 240575.2 59983.7 55562.5 4421.2 180591.6 107119.0 73472.5
2012/13
Qtr.I 246456.1 64022.3 55510.4 8511.9 182433.8 106583.9 75849.9
Qtr.II 261646.6 62203.4 55510.4 6693.0 199443.2 115716.1 83727.1
Qtr.III 285289.6 64917.9 59510.4 5407.5 220371.7 128230.1 92141.6
Qtr.IV 300492.7 70210.4 64510.4 5700.0 230282.4 130885.4 99397.0
2013/14
Qtr.I 304819.9 68470.4 64381.3 4089.1 236349.5 129714.0 106635.5
Qtr.II 330002.4 67845.4 64381.3 3464.0 262157.1 144359.5 117797.6
Qtr.III 357277.5 75135.1 73381.3 1753.8 282142.3 155798.2 126344.1
Qtr.IV 374071.2 74934.1 73304.4 1629.7 299137.1 162232.8 136904.3
2014/15
Qtr.I 385474.1 74402.8 73175.3 1227.5 311071.2 166392.1 144679.2
Qtr.II 423153.7 79421.7 78175.3 1246.3 343732.0 184727.7 159004.3
Qtr.III 458316.0 82427.7 81175.3 1252.3 375888.3 202409.3 173479.0
Qtr.IV 493536.5 93431.4 92175.3 1256.0 400105.1 208858.9 191246.2
2015/16
Qtr.I 512987.6 100562.8 99657.3 905.4 412424.8 212528.0 199896.8
Qtr.II 550335.4 105562.8 104657.3 905.4 444772.6 231803.8 212968.8
Qtr.III 574821.3 105562.8 104657.3 905.4 469258.5 244256.6 225001.9
Qtr.IV 594275.6 109866.0 109080.4 785.7 484409.5 252456.2 231953.3
2016/17
Qtr.I 614243.3 116195.1 115640.8 554.3 498048.1 257176.1 240872.1
Qtr.II 653414.1 121195.1 120640.8 554.3 532219.0 279303.5 252915.4
Qtr.III 697290.2 130171.1 129640.8 530.3 567119.1 299213.1 267906.0
Qtr.IV 762842.3 157615.6 135632.8 21982.7 605226.7 311137.5 294089.2
2017/18
Qtr.I 789525.4 172841.7 150632.8 22208.8 616683.7 316104.5 300579.2
Qtr.II 840813.7 182315.5 160128.8 22186.6 658498.3 336105.8 322392.5
Qtr.III 879125.8 182315.5 160128.8 22186.6 696810.3 357928.6 338881.7
Qtr.IV 935341.4 182315.5 160128.8 22186.6 753025.9 393607.0 359418.9
2017/18
Qtr.I 956319.4 189252.4 166685.3 22567.1 767067.0 402964.1 364102.9
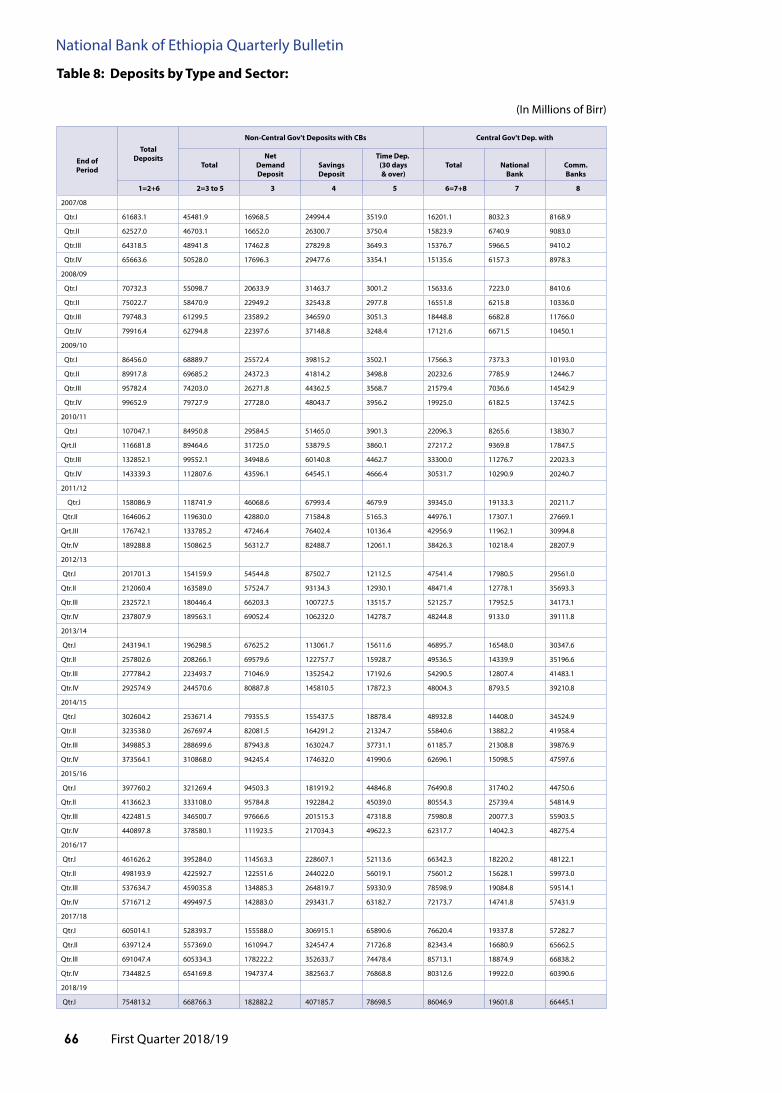
First Quarter 2018/1966
National Bank of Ethiopia Quarterly Bulletin
table 8: Deposits by type and Sector:
(In Millions of Birr)
End ofperiod
total
Deposits
Non-Central Gov't Deposits with CBs Central Gov't Dep. with
total
NetDemandDeposit
SavingsDeposit
time Dep. (30 days & over)
total
National
Bank
Comm.Banks
1=2+6 2=3 to 5 3 4 5 6=7+8 7 8
2007/08
Qtr.I 61683.1 45481.9 16968.5 24994.4 3519.0 16201.1 8032.3 8168.9
Qtr.II 62527.0 46703.1 16652.0 26300.7 3750.4 15823.9 6740.9 9083.0
Qtr.III 64318.5 48941.8 17462.8 27829.8 3649.3 15376.7 5966.5 9410.2
Qtr.IV 65663.6 50528.0 17696.3 29477.6 3354.1 15135.6 6157.3 8978.3
2008/09
Qtr.I 70732.3 55098.7 20633.9 31463.7 3001.2 15633.6 7223.0 8410.6
Qtr.II 75022.7 58470.9 22949.2 32543.8 2977.8 16551.8 6215.8 10336.0
Qtr.III 79748.3 61299.5 23589.2 34659.0 3051.3 18448.8 6682.8 11766.0
Qtr.IV 79916.4 62794.8 22397.6 37148.8 3248.4 17121.6 6671.5 10450.1
2009/10
Qtr.I 86456.0 68889.7 25572.4 39815.2 3502.1 17566.3 7373.3 10193.0
Qtr.II 89917.8 69685.2 24372.3 41814.2 3498.8 20232.6 7785.9 12446.7
Qtr.III 95782.4 74203.0 26271.8 44362.5 3568.7 21579.4 7036.6 14542.9
Qtr.IV 99652.9 79727.9 27728.0 48043.7 3956.2 19925.0 6182.5 13742.5
2010/11
Qtr.I 107047.1 84950.8 29584.5 51465.0 3901.3 22096.3 8265.6 13830.7
Qrt.II 116681.8 89464.6 31725.0 53879.5 3860.1 27217.2 9369.8 17847.5
Qtr.III 132852.1 99552.1 34948.6 60140.8 4462.7 33300.0 11276.7 22023.3
Qtr.IV 143339.3 112807.6 43596.1 64545.1 4666.4 30531.7 10290.9 20240.7
2011/12
Qtr.I 158086.9 118741.9 46068.6 67993.4 4679.9 39345.0 19133.3 20211.7
Qtr.II 164606.2 119630.0 42880.0 71584.8 5165.3 44976.1 17307.1 27669.1
Qrt.III 176742.1 133785.2 47246.4 76402.4 10136.4 42956.9 11962.1 30994.8
Qtr.IV 189288.8 150862.5 56312.7 82488.7 12061.1 38426.3 10218.4 28207.9
2012/13
Qtr.I 201701.3 154159.9 54544.8 87502.7 12112.5 47541.4 17980.5 29561.0
Qtr.II 212060.4 163589.0 57524.7 93134.3 12930.1 48471.4 12778.1 35693.3
Qtr.III 232572.1 180446.4 66203.3 100727.5 13515.7 52125.7 17952.5 34173.1
Qtr.IV 237807.9 189563.1 69052.4 106232.0 14278.7 48244.8 9133.0 39111.8
2013/14
Qtr.I 243194.1 196298.5 67625.2 113061.7 15611.6 46895.7 16548.0 30347.6
Qtr.II 257802.6 208266.1 69579.6 122757.7 15928.7 49536.5 14339.9 35196.6
Qtr.III 277784.2 223493.7 71046.9 135254.2 17192.6 54290.5 12807.4 41483.1
Qtr.IV 292574.9 244570.6 80887.8 145810.5 17872.3 48004.3 8793.5 39210.8
2014/15
Qtr.I 302604.2 253671.4 79355.5 155437.5 18878.4 48932.8 14408.0 34524.9
Qtr.II 323538.0 267697.4 82081.5 164291.2 21324.7 55840.6 13882.2 41958.4
Qtr.III 349885.3 288699.6 87943.8 163024.7 37731.1 61185.7 21308.8 39876.9
Qtr.IV 373564.1 310868.0 94245.4 174632.0 41990.6 62696.1 15098.5 47597.6
2015/16
Qtr.I 397760.2 321269.4 94503.3 181919.2 44846.8 76490.8 31740.2 44750.6
Qtr.II 413662.3 333108.0 95784.8 192284.2 45039.0 80554.3 25739.4 54814.9
Qtr.III 422481.5 346500.7 97666.6 201515.3 47318.8 75980.8 20077.3 55903.5
Qtr.IV 440897.8 378580.1 111923.5 217034.3 49622.3 62317.7 14042.3 48275.4
2016/17
Qtr.I 461626.2 395284.0 114563.3 228607.1 52113.6 66342.3 18220.2 48122.1
Qtr.II 498193.9 422592.7 122551.6 244022.0 56019.1 75601.2 15628.1 59973.0
Qtr.III 537634.7 459035.8 134885.3 264819.7 59330.9 78598.9 19084.8 59514.1
Qtr.IV 571671.2 499497.5 142883.0 293431.7 63182.7 72173.7 14741.8 57431.9
2017/18
Qtr.I 605014.1 528393.7 155588.0 306915.1 65890.6 76620.4 19337.8 57282.7
Qtr.II 639712.4 557369.0 161094.7 324547.4 71726.8 82343.4 16680.9 65662.5
Qtr.III 691047.4 605334.3 178222.2 352633.7 74478.4 85713.1 18874.9 66838.2
Qtr.IV 734482.5 654169.8 194737.4 382563.7 76868.8 80312.6 19922.0 60390.6
2018/19
Qtr.I 754813.2 668766.3 182882.2 407185.7 78698.5 86046.9 19601.8 66445.1

First Quarter 2018/19 67
National Bank of Ethiopia Quarterly Bulletin
table 9: Reserve and liquidity position of the Commercial Banks, and turnover of Deposits
(In Millions of Birr)
End ofperiod
ReserveRequir-ments
actualRese.
ExcessRese.
foreignassets
foreign liabilities actualReserve+Net for.assets
liqui-dity
Ratio
Ratio: loansadv.to
Dep.
Debit Bal-ance
turn-over ofDeposit
total
Shortterm
longterm
1 2 3=2-1 4 5=6+7 6 7 7=2+4-5 8 9 10 11
2007/08
Qtr.I 5365.1 13865.3 8500.2 6994.5 2113.1 2113.1 0.0 18746.7 41.2 42.7 76830.1 2.3
Qtr.II 5578.6 14355.5 8776.9 6364.8 2221.8 2221.8 0.0 18498.6 39.6 46.2 82185.6 2.5
Qtr.III 5835.2 12463.6 6628.4 8129.8 2384.4 2384.4 0.0 18209.0 37.2 54.3 90495.3 2.8
Qtr.IV 8925.9 17795.3 8869.3 8026.8 2301.9 2301.9 0.0 23520.2 46.5 56.5 90493.5 2.8
2008/09
Qtr.I 9526.4 17673.9 8147.5 7726.6 2315.5 2315.5 0.0 23085.0 41.9 54.2 93429.4 2.6
Qtr.II 10321.0 20659.3 10338.2 6950.6 2854.6 2854.6 0.0 24755.3 42.3 52.2 102944.0 2.6
Qtr.III 10959.8 21886.7 10926.9 8093.6 2801.5 2801.5 0.0 27178.8 44.3 50.7 105249.6 2.5
Qtr.IV 10986.7 23690.7 12704.0 9219.7 3076.5 3076.5 0.0 29833.9 47.5 53.0 124300.7 3.1
2009/10
Qtr.I 11399.0 27119.0 15720.0 9173.0 3856.6 3856.6 0.0 32435.4 48.6 51.3 119082.5 2.9
Qtr.II 11983.8 24371.7 12387.9 9731.2 3690.8 3690.8 0.0 30412.1 44.6 53.6 131681.5 3.0
Qtr.III 12695.8 26921.1 14225.3 12949.1 3960.9 3960.9 0.0 35909.3 50.5 54.0 140393.6 3.0
Qtr.IV 13973.2 25217.1 11243.9 15060.8 3254.3 3254.3 0.0 37023.5 47.1 52.6 135342.1 2.7
2010/11
Qtr.I 14425.7 28768.1 14342.4 19246.0 4246.1 4246.1 0.0 43768.0 52.2 50.0 142217.2 2.9
Qrt.II 15192.5 27486.9 12294.5 20194.1 4942.6 4942.6 0.0 42738.5 49.3 51.1 157805.6 2.9
Qtr.III 17642.8 31482.2 13839.4 21148.9 5595.2 5595.2 0.0 47035.8 48.7 51.8 182812.2 2.7
Qtr.IV 19025.6 34283.0 15257.4 28394.2 5715.5 5715.5 0.0 56961.7 53.0 51.3 195452.3 2.8
2011/12
Qtr.I 20126.7 34514.4 14387.7 22565.3 6441.2 6441.2 0.0 50638.5 43.7 52.7 -9492.7 -0.1
Qtr.II 21519.9 30154.5 8634.5 23089.6 8419.7 8419.7 0.0 44824.4 37.9 55.2 -2172.3 0.0
Qrt.III 23815.7 17652.5 -6163.2 28640.0 7392.2 7392.2 0.0 38900.2 29.9 60.5 17694.8 0.2
Qtr.IV 25253.9 29039.9 3786.0 24017.6 5484.2 5484.2 0.0 47573.3 33.7 61.6 4861.5 0.1
2012/13
Qtr.I 26887.0 27882.5 995.4 20182.7 5874.0 5874.0 0.0 42191.2 27.9 59.2 1243.9 0.0
Qtr.II 28886.9 33108.1 4221.3 19475.2 6078.3 6078.3 0.0 46505.0 29.5 58.1 -393.1 0.0
Qtr.III 31682.7 32417.5 734.9 23412.0 6038.1 6038.1 0.0 49791.5 28.6 59.2 9287.2 0.1
Qtr.IV 33194.0 30375.3 -2818.7 28509.2 7515.2 7515.2 0.0 51369.3 27.8 59.2 17366.3 0.1
2013/14
Qtr.I 11141.6 31747.7 20606.1 22706.1 7787.7 7787.7 0.0 46666.1 23.8 57.7 9229.0 0.1
Qtr.II 11623.5 29413.2 17789.7 20171.0 7933.5 7933.5 0.0 41650.7 20.9 59.2 5710.6 0.0
Qtr.III 12841.0 34921.8 22080.7 21162.5 7843.1 7843.1 0.0 48241.1 22.3 59.3 175.8 0.0
Qtr.IV 13653.8 35672.3 22018.5 27253.5 7995.1 7995.1 0.0 54930.7 23.4 58.5 4339.8 0.0
2014/15
Qtr.I 14375.9 38690.7 24314.8 19597.0 7599.6 7599.6 0.0 50688.1 19.9 57.3 2953.3 0.0
Qtr.II 14936.1 35148.8 20212.7 18800.8 7784.8 7784.8 0.0 46164.8 17.8 59.3 6009.6 0.0
Qtr.III 16089.2 35280.7 19191.4 15862.1 7985.8 7985.8 0.0 43157.0 15.5 61.6 18712.0 0.1
Qtr.IV 17277.4 42342.4 25064.9 15924.1 8326.6 8326.6 0.0 49939.9 16.8 60.2 15260.5 0.1
2015/16
Qtr.I 18154.8 39809.6 21654.8 15463.0 8351.7 8351.7 0.0 46920.9 14.7 58.0 12689.1 0.1
Qtr.II 18915.6 37943.4 19027.8 18368.2 9418.3 9418.3 0.0 46893.3 14.4 59.7 21979.3 0.1
Qtr.III 19737.1 40401.9 20664.9 21316.4 10021.1 10021.1 0.0 51697.2 15.4 60.8 21123.2 0.1
Qtr.IV 21091.1 50905.9 29814.8 20898.3 9880.5 9880.5 0.0 61923.7 17.3 59.0 11999.0 0.1
2016/17
Qtr.I 21608.0 53728.8 32120.8 21116.0 10224.6 10224.6 0.0 64620.2 16.6 59.1 9035.9 0.1
Qtr.II 23442.0 54499.8 31057.7 20370.8 9442.5 9442.5 0.0 65428.1 15.9 57.1 1283.9 0.0
Qtr.III 25206.4 64854.5 39648.1 20975.6 9775.1 9775.1 0.0 76055.0 17.2 57.4 6627.2 0.0
Qtr.IV 26950.8 75305.7 48354.8 24876.5 10818.8 10818.8 0.0 89363.5 18.7 56.1 1282.9 0.0
2017/18
Qtr.I 28587.0 81683.9 53096.9 25253.4 11920.7 11920.7 0.0 95016.7 18.3 54.9 -15668.4 -0.1
Qtr.II 30398.5 68091.4 37692.9 26326.9 15190.8 15190.8 0.0 79227.5 14.7 54.2 -443.6 0.0
Qtr.III 32735.9 74352.1 41616.1 24664.2 14436.5 14436.5 0.0 84579.8 14.4 53.8 -1452.4 0.0
Qtr.IV 34423.8 89611.5 55187.7 25121.6 14504.8 14504.8 0.0 100228.3 16.0 55.1 -7299.4 0.0
2018/19
Qtr.I 36595.3 91062.9 54467.6 30835.4 14163.9 14163.9 0.0 107734.4 16.1 54.4 -7494.4 0.0
1. Actual Reserve: Reserves with the National Bank of Ethiopia Plus Cash in Hand (Local Currency) 2. Liquidity Ratio: Actual Reserves + Foreign Asset, net of short term liabilities, divided by Demand Deposits, net.3. Ratio of Loans and Advances to Deposits: Gross Commercial Bank Loans and discounts plus credit to Central Government divided by Gross Demand Deposits (of private and others) + Demand Deposits of domestic banks + Time and Savings Deposits + Government Deposits with commercial banks.4. Debit Balance: Total Debit Balance less debit against the deposits of the commercial banks.5. Turnover of Deposits: Debit Balances divided by Gross Demand Deposits of private and others + Government Deposits.

First Quarter 2018/1968
National Bank of Ethiopia Quarterly Bulletin
table 10: Circulating Notes and Coins by Denomination
(In Millions of Birr)
End ofperiod
Value ofNotes &
Coins
Denomination of Notes: Birr
Denominations of Coins: Cents
total Value
(Notes)
1
5
10
50
100
total Value
(Coins)
1
5
10
25
50
100
(coin)
2007/08
Qtr.I 15130.3 14953.0 414.2 122.2 1809.0 2612.7 9994.9 177.3 0.8 28.3 65.6 32.1 50.7
Qtr.II 17852.4 17673.6 454.4 189.8 2415.8 2974.2 11639.3 178.7 0.8 28.5 66.2 32.1 51.1
Qtr.III 19492.3 19309.5 437.6 210.3 2697.2 3519.6 12444.9 182.8 0.8 28.9 66.6 33.4 53.1
Qtr.IV 19780.8 19591.5 414.9 188.2 2574.3 3459.4 12954.8 189.2 0.8 29.8 68.0 34.9 55.7
2008/09
Qtr.I 20388.5 20191.0 417.0 162.8 2456.7 3554.5 13600.0 197.5 0.8 30.4 69.6 37.8 58.9
Qtr.II 22129.9 21926.0 441.7 259.8 2514.7 3757.7 14952.0 203.9 0.8 31.3 71.5 39.4 60.8
Qtr.III 24028.8 23818.7 459.8 268.9 2581.7 3931.9 16576.4 210.1 0.8 32.2 73.0 41.3 62.8
Qtr.IV 24133.9 23918.2 449.0 245.7 2227.0 3897.3 17099.3 215.7 0.8 33.2 74.3 42.8 64.7
2009/10
Qtr.I 23036.3 22815.5 426.3 231.8 2023.7 3521.7 16612.0 220.7 0.9 33.9 75.6 44.1 66.2
Qtr.II 26011.3 25786.8 458.5 258.6 2023.7 3724.2 19321.9 224.5 0.9 34.3 76.8 45.2 67.3
Qtr.III 28333.2 28103.5 466.2 364.7 2943.1 3723.9 20605.6 229.6 0.9 34.8 78.9 45.9 69.2
Qtr.IV 28812.7 28576.9 462.6 356.9 2842.9 3383.9 21530.6 235.8 0.9 35.4 80.6 46.6 72.3
2010/11
Qtr.I 30620.0 30277.1 482.3 366.6 2618.5 3493.4 23316.4 342.9 1.0 36.2 83.5 52.0 127.7 42.5
Qrt.II 34074.7 33731.2 404.1 223.3 3124.9 4082.8 25896.0 343.5 1.0 36.2 83.6 50.9 122.9 49.0
Qtr.III 37477.8 37199.9 471.9 310.0 4012.5 4601.5 27803.9 278.0 1.0 36.3 83.9 26.1 73.1 57.6
Qtr.IV 39144.3 38848.3 482.9 293.4 3425.0 4283.8 30363.2 296.0 0.8 37.0 86.0 30.1 76.3 65.9
2011/12
Qtr.I 38781.8 38475.2 486.5 287.1 3526.7 4612.6 29562.4 306.6 0.8 37.2 86.8 31.0 77.6 73.2
Qtr.II 42056.0 41736.3 496.5 287.4 3563.9 5885.1 31503.3 319.7 0.8 37.2 87.0 32.4 81.3 80.9
Qrt.III 44718.0 44390.7 661.5 659.5 4605.1 7134.5 31330.1 327.3 0.8 37.2 87.7 33.9 84.5 83.1
Qtr.IV 45802.1 45468.4 626.3 514.8 1144.0 2482.0 40701.3 333.7 0.8 37.3 88.4 35.2 86.4 85.6
2012/13
Qtr.I 46238.6 45991.0 677.6 626.9 1545.6 3113.7 40027.1 247.6 0.8 27.3 69.6 6.9 55.8 87.3
Qtr II 50982.9 50727.7 700.2 465.3 2533.4 5065.1 41963.6 255.3 0.8 28.2 70.7 8.9 58.6 88.1
Qtr II 54337.6 54065.5 614.7 513.6 3368.2 6488.9 43080.0 272.2 0.8 28.5 73.8 14.2 66.9 88.0
Qtr.IV 54993.7 54632.8 659.6 533.0 3430.7 6602.4 43407.0 360.9 0.8 34.2 84.0 57.7 96.0 88.3
2013/14
Qtr.I 50591.9 50222.6 683.6 589.5 3222.9 6397.1 39329.5 369.3 0.8 34.2 84.9 59.0 98.1 92.2
Qtr.II 52495.9 52121.9 692.6 609.2 3321.6 6475.1 41023.4 374.0 0.8 34.4 85.3 59.6 99.1 94.9
Qtr.III 64642.3 64230.3 659.9 867.2 2421.4 6669.2 53612.6 412.0 0.8 39.3 94.9 61.9 100.1 114.9
Qtr.IV 64472.9 64048.1 634.9 906.9 2368.8 6773.2 53364.4 424.8 0.8 39.5 95.4 62.8 101.4 124.8
2014/15
Qtr.I 63846.6 63406.6 618.3 964.8 2339.5 6555.3 52928.7 440.1 0.8 39.7 95.9 63.9 102.9 136.8
Qtr.II 70841.5 70384.8 602.5 1097.3 2550.7 7607.6 58526.7 456.6 0.8 39.9 96.2 64.5 104.0 151.2
Qtr.III 74470.2 73989.1 589.0 1161.0 2695.0 7767.3 61776.9 481.1 0.8 40.0 96.7 65.6 105.9 172.1
Qtr.IV 75358.8 74846.9 557.8 1177.8 2675.6 7459.8 62975.8 511.9 0.8 40.1 97.1 66.4 107.3 200.1
2015/16
Qtr.I 74863.5 74313.7 538.9 1209.0 2725.7 7304.0 62536.1 549.8 0.8 40.3 97.6 67.1 108.6 235.4
Qtr.II 77947.8 77357.4 507.3 1306.8 2885.2 7573.2 65084.8 590.5 0.8 40.5 97.9 67.8 109.8 273.7
Qtr.III 80376.2 79731.9 479.6 1325.7 2807.1 7367.4 67752.0 644.4 0.8 40.6 98.3 68.3 110.7 325.6
Qtr.IV 82,765.0 82,067.9 455.8 1,337.4 2,766.9 7,906.8 69,600.9 697.1 0.8 40.7 98.4 68.7 111.5 376.9
2016/17
Qtr.I 85,984.2 85,243.1 439.3 1,355.6 2,793.4 8,911.7 71,743.1 741.0 0.8 40.9 98.7 69.4 112.5 418.7
Qtr.II 90,418.9 89,629.2 425.9 1,456.3 2,925.0 9,417.7 75,404.3 789.6 0.8 41.0 98.9 69.9 113.5 465.6
Qtr.III 92,383.1 91,541.2 411.7 1,461.3 2,982.7 9,615.2 77,070.3 841.8 0.8 41.1 99.1 70.6 114.7 515.5
Qtr.IV 94,415.6 93,527.6 403.8 1,418.7 3,010.1 9,722.2 78,972.8 888.0 0.8 41.2 99.4 71.4 115.8 559.3
2017/18
Qtr.I 95,132.8 94,206.5 396.4 1,396.7 3,025.7 9,678.2 79,709.5 926.3 0.8 41.3 99.6 72.0 116.8 595.8
Qtr.II 106,106.9 105,137.4 393.8 1,506.7 3,423.5 10,701.5 89,111.8 969.5 0.8 41.3 99.7 72.4 117.7 637.6
Qtr.III 112,608.7 111,589.8 388.2 1,507.8 3,487.4 11,017.1 95,189.3 1,018.9 0.8 41.4 99.8 72.7 118.6 685.5
QtrIV 113,081.0 112,020.6 384.1 1,467.8 3,512.8 11,143.4 95,512.5 1,060.4 0.8 41.4 99.8 73.0 118.9 726.5
2018/19
Qtr.I 111,045.7 109,958.3 380.4 1,464.1 3,497.5 10,696.4 93,919.9 1,087.3 0.8 41.4 99.8 73.2 119.9 752.2
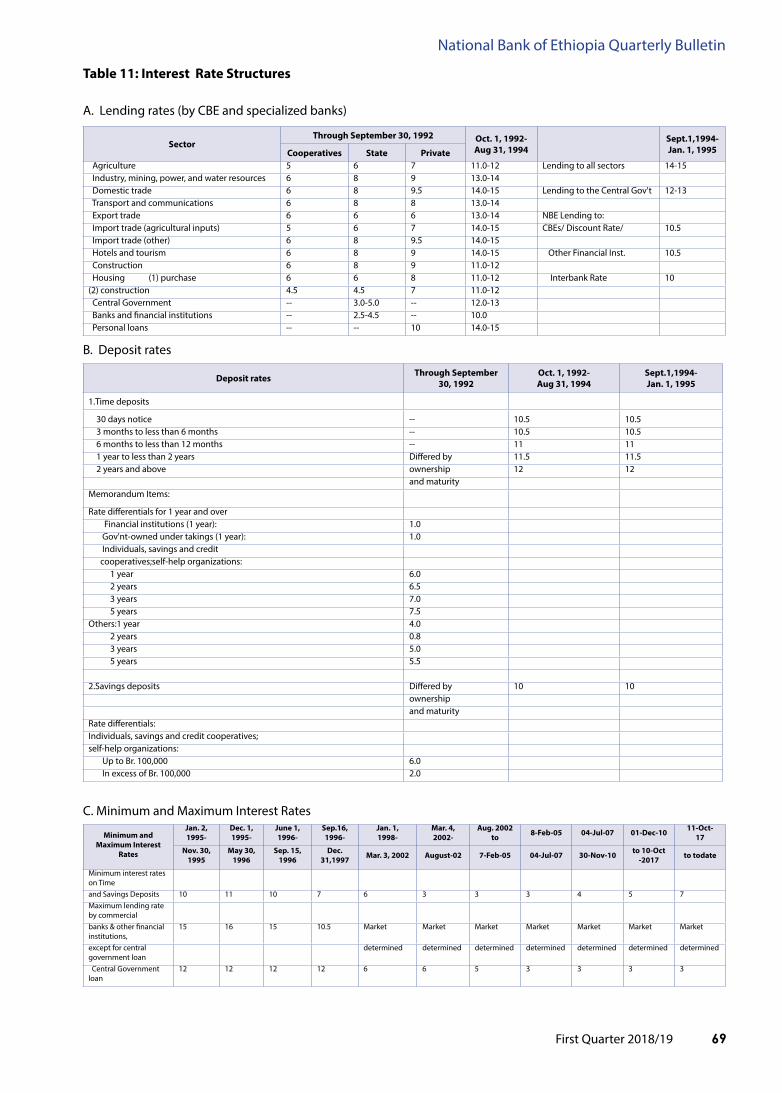
First Quarter 2018/19 69
National Bank of Ethiopia Quarterly Bulletin
table 11: interest Rate Structures
A. Lending rates (by CBE and specialized banks)
Sectorthrough September 30, 1992 oct. 1, 1992-
aug 31, 1994Sept.1,1994-Jan. 1, 1995Cooperatives State private
Agriculture 5 6 7 11.0-12 Lending to all sectors 14-15 Industry, mining, power, and water resources 6 8 9 13.0-14 Domestic trade 6 8 9.5 14.0-15 Lending to the Central Gov't 12-13 Transport and communications 6 8 8 13.0-14 Export trade 6 6 6 13.0-14 NBE Lending to: Import trade (agricultural inputs) 5 6 7 14.0-15 CBEs/ Discount Rate/ 10.5 Import trade (other) 6 8 9.5 14.0-15 Hotels and tourism 6 8 9 14.0-15 Other Financial Inst. 10.5 Construction 6 8 9 11.0-12 Housing (1) purchase 6 6 8 11.0-12 Interbank Rate 10(2) construction 4.5 4.5 7 11.0-12 Central Government -- 3.0-5.0 -- 12.0-13 Banks and financial institutions -- 2.5-4.5 -- 10.0 Personal loans -- -- 10 14.0-15
Deposit rates through September 30, 1992
oct. 1, 1992-aug 31, 1994
Sept.1,1994-Jan. 1, 1995
1.Time deposits
30 days notice -- 10.5 10.5 3 months to less than 6 months -- 10.5 10.5 6 months to less than 12 months -- 11 11 1 year to less than 2 years Differed by 11.5 11.5 2 years and above ownership 12 12
and maturityMemorandum Items:
Rate differentials for 1 year and over Financial institutions (1 year): 1.0 Gov'nt-owned under takings (1 year): 1.0 Individuals, savings and credit cooperatives;self-help organizations: 1 year 6.0 2 years 6.5 3 years 7.0 5 years 7.5Others:1 year 4.0 2 years 0.8 3 years 5.0 5 years 5.5
2.Savings deposits Differed by 10 10ownership and maturity
Rate differentials:Individuals, savings and credit cooperatives;self-help organizations: Up to Br. 100,000 6.0 In excess of Br. 100,000 2.0
B. Deposit rates
C. Minimum and Maximum Interest Rates
Minimum and Maximum interest
Rates
Jan. 2, 1995-
Dec. 1, 1995-
June 1, 1996-
Sep.16,1996-
Jan. 1,1998-
Mar. 4,2002-
aug. 2002 to 8-feb-05 04-Jul-07 01-Dec-10 11-oct-
17
Nov. 30, 1995
May 30, 1996
Sep. 15, 1996
Dec. 31,1997 Mar. 3, 2002 august-02 7-feb-05 04-Jul-07 30-Nov-10 to 10-oct
-2017 to todate
Minimum interest rates on Timeand Savings Deposits 10 11 10 7 6 3 3 3 4 5 7Maximum lending rate by commercialbanks & other financial institutions,
15 16 15 10.5 Market Market Market Market Market Market Market
except for central government loan
determined determined determined determined determined determined determined
Central Government loan
12 12 12 12 6 6 5 3 3 3 3

First Quarter 2018/1970
National Bank of Ethiopia Quarterly Bulletin
table 12: Government internal Debt by holder
(In Millions of Birr)
End ofperiod
totalGov't
indebt-edness
National Bank of EthiopiaCommercial Banks others
NBEtotal
Direct
advance
Gov't Bonds
Noninterestbearing
interestbearing
Comm.Bankstotal
Gov't
Bonds
treasury
Bills
others
total
Gov't
Bonds
treasury
Bills
1=2+6+9 2=3 to 5 3 4 5 6=7+8 7 8 9=10+11 10 11
2007/08
Qtr.I 48586.6 30269.3 20370.0 9417.1 482.2 16049.9 4070.5 11979.4 2267.4 282.4 1985.0
Qtr.II 50558.8 31995.3 22096.0 9417.1 482.2 16074.0 4059.4 12014.6 2489.5 274.5 2215.0
Qtr.III 50549.4 33917.3 24018.0 9417.1 482.2 12177.8 4058.3 8119.5 4454.3 430.3 4024.0
Qtr.IV 54229.6 41563.1 31818.0 9270.9 474.2 6648.2 3914.0 2734.1 6018.3 430.3 5588.0
2008/09
Qtr.I 56674.5 44271.0 34578.0 9270.9 422.1 6234.9 3891.8 2343.1 6168.5 430.3 5738.2
Qtr.II 54951.3 42949.0 33256.0 9270.9 422.1 5547.2 3879.3 1668.0 6455.1 413.9 6041.2
Qtr.III 54449.5 42249.0 32556.0 9270.9 422.1 5548.9 3878.2 1670.7 6651.6 370.6 6281.0
Qtr.IV 56589.9 44498.7 34891.0 9193.6 414.1 5409.4 3741.6 1667.7 6681.8 370.6 6311.2
2009/10
Qtr.I 56667.5 44326.6 34771.0 9193.6 362.0 5740.1 3469.4 2270.7 6600.8 370.6 6230.2
Qtr.II 55892.6 43610.8 34055.2 9193.6 362.0 5177.6 3456.8 1720.7 7104.2 354.2 6750.0
Qtr.III 58880.0 45989.7 36434.1 9193.6 362.0 5627.9 3456.8 2171.0 7262.4 310.9 6951.5
Qtr.IV 59921.2 45522.8 36044.1 9124.7 354.0 7415.3 3319.4 4095.8 6983.1 310.9 6672.2
2010/11
Qtr.I 60527.5 47983.7 38557.1 9124.7 301.9 5480.7 3047.2 2433.5 7063.1 310.9 6752.2
Qtr.II 61613.2 50488.6 41062.0 9124.7 301.9 4102.9 2784.7 1318.2 7021.7 269.3 6752.4
Qtr.III 64015.5 51930.6 42504.0 9124.7 301.9 4953.2 2784.5 2168.7 7131.7 269.3 6862.4
Qtr.IV 69415.2 55614.6 46265.0 9055.7 293.9 3568.7 2670.3 898.4 10231.9 269.3 9962.6
2011/12
Qtr.I 71052.0 55566.5 46264.9 9055.7 245.8 4121.7 2424.6 1697.1 11363.8 251.2 11112.6
Qrt.II 71122.3 55562.5 46264.9 9055.7 241.8 2857.2 2423.2 434.0 12702.6 251.2 12451.4
Qrt.III 75502.2 55562.5 46264.9 9055.7 241.8 3068.3 2419.2 649.1 16871.4 200.0 16671.4
Qtr.IV 77812.0 55562.5 46264.9 9055.7 241.8 4421.2 2419.2 2002.0 17828.4 200.0 17628.4
2012/13
Qtr.I 82079.1 55510.4 46264.9 9055.7 189.7 8511.9 2455.9 6056.0 18056.8 200.0 17856.8
Qtr.II 81380.8 55510.4 46264.9 9055.7 189.7 6693.0 2397.6 4295.5 19177.4 200.0 18977.4
Qtr.III 85794.0 59510.4 50264.9 9055.7 189.7 5407.5 2419.7 2987.7 20876.1 200.0 20676.1
Qtr.IV 93019.2 64510.4 55264.9 9055.7 189.7 5700.0 2380.4 3319.6 22808.9 200.0 22608.9
2013/14
Qtr.I 91279.3 64381.3 55264.9 8986.8 129.6 4089.1 1753.9 2335.2 22808.9 200.0 22608.9
Qtr.II 90654.2 64381.3 55264.9 8986.8 129.6 3464.0 1753.8 1710.2 22808.9 200.0 22608.9
Qtr.III 97944.0 73381.3 64264.9 8986.8 129.6 1753.8 1753.8 0.0 22808.9 200.0 22608.9
Qtr.IV 107318.5 73304.4 64264.9 8917.8 121.6 1629.7 1629.7 0.0 32384.5 97.6 32286.9
2014/15
Qtr.I 109794.8 73175.3 64264.9 8848.9 61.5 1227.5 1227.5 0.0 35392.0 97.6 35294.4
Qtr.II 116383.3 78175.3 69264.9 8848.9 61.5 1246.3 1246.3 0.0 36961.7 54.3 36907.4
Qtr.III 121824.8 81175.3 72264.9 8848.9 61.5 1252.3 1252.3 0.0 39397.2 54.3 39342.9
Qtr.IV 135190.4 92175.3 83264.9 8848.9 61.5 1256.0 1256.0 0.0 41759.1 54.3 41704.8
2015/16
Qtr.I 144937.8 99657.3 91264.9 8344.4 48.0 905.4 905.4 0.0 44375.1 54.3 44320.8
Qtr.II 154426.6 104657.3 96264.9 8344.4 48.0 905.4 905.4 0.0 48863.9 54.3 48809.6
Qtr.III 159157.7 104657.3 96264.9 8344.4 48.0 905.4 905.4 0.0 53595.0 72.4 53522.6
Qtr.IV 163461.0 109080.4 100764.9 8275.5 40.0 785.7 785.7 0.0 53595.0 72.4 53522.6
2016/17
Qtr.I 161914.2 107764.9 107764.9 0.0 0.0 554.3 554.3 0.0 53595.0 72.4 53522.6
Qtr.II 171344.9 120640.8 112764.9 7839.9 36.0 554.3 554.3 0.0 50149.8 36.2 50113.6
Qtr.III 184406.9 129640.8 121764.9 7839.9 36.0 530.3 530.3 0.0 54235.8 36.2 54199.6
Qtr.IV 230923.3 135632.8 127764.9 7839.9 28.0 21982.7 21982.7 0.0 73307.8 36.2 73271.6
2017/18
Qtr.I 251943.3 150632.8 142764.9 7839.9 28.0 22208.8 22208.8 0.0 79101.7 18.1 79083.6
Qtr.II 264416.1 160128.8 152264.9 7839.9 24.0 22186.6 22186.6 0.0 82100.7 18.1 82082.6
Qtr.III 270410.1 160128.8 152264.9 7839.9 24.0 22186.6 22186.6 0.0 88094.7 18.1 88076.6
Qtr.IV 286601.1 160128.8 152264.9 7839.9 24.0 22186.6 22186.6 0.0 104285.7 18.1 104267.6
2018/19
Qtr.I 306121.1 166685.3 159264.9 7404.4 16.0 22567.1 22567.1 0.0 116868.7 18.1 116850.6
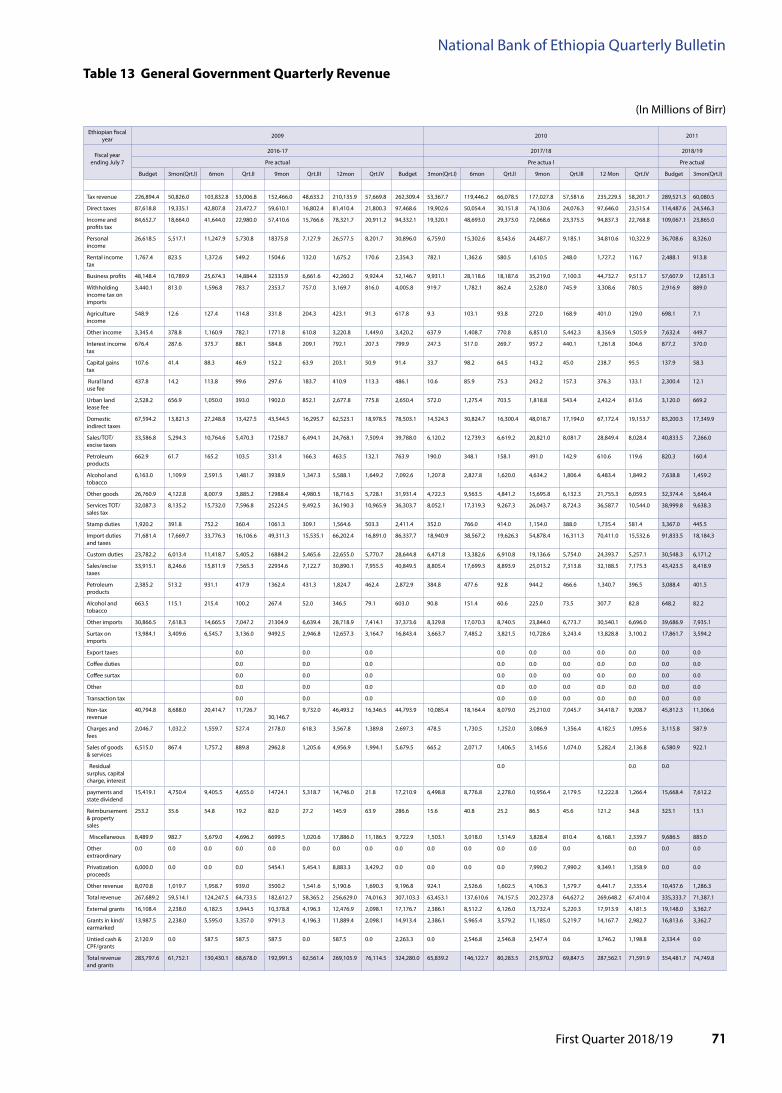
First Quarter 2018/19 71
National Bank of Ethiopia Quarterly Bulletin
table 13 General Government Quarterly Revenue
(In Millions of Birr)
Ethiopian fiscal year 2009 2010 2011
Fiscal year ending July 7
2016-17 2017/18 2018/19
Pre actual Pre actua l Pre actual
Budget 3mon(Qrt.I) 6mon Qrt.II 9mon Qrt.III 12mon Qrt.IV Budget 3mon(Qrt.I) 6mon Qrt.II 9mon Qrt.III 12 Mon Qrt.IV Budget 3mon(Qrt.I)
Tax revenue 226,894.4 50,826.0 103,832.8 53,006.8 152,466.0 48,633.2 210,135.9 57,669.8 262,309.4 53,367.7 119,446.2 66,078.5 177,027.8 57,581.6 235,229.5 58,201.7 289,521.3 60,080.5
Direct taxes 87,618.8 19,335.1 42,807.8 23,472.7 59,610.1 16,802.4 81,410.4 21,800.3 97,468.6 19,902.6 50,054.4 30,151.8 74,130.6 24,076.3 97,646.0 23,515.4 114,487.6 24,546.3
Income and profits tax
84,652.7 18,664.0 41,644.0 22,980.0 57,410.6 15,766.6 78,321.7 20,911.2 94,332.1 19,320.1 48,693.0 29,373.0 72,068.6 23,375.5 94,837.3 22,768.8 109,067.1 23,865.0
Personal income
26,618.5 5,517.1 11,247.9 5,730.8 18375.8 7,127.9 26,577.5 8,201.7 30,896.0 6,759.0 15,302.6 8,543.6 24,487.7 9,185.1 34,810.6 10,322.9 36,708.6 8,326.0
Rental income tax
1,767.4 823.5 1,372.6 549.2 1504.6 132.0 1,675.2 170.6 2,354.3 782.1 1,362.6 580.5 1,610.5 248.0 1,727.2 116.7 2,488.1 913.8
Business profits 48,148.4 10,789.9 25,674.3 14,884.4 32335.9 6,661.6 42,260.2 9,924.4 52,146.7 9,931.1 28,118.6 18,187.6 35,219.0 7,100.3 44,732.7 9,513.7 57,607.9 12,851.3
Withholding income tax on imports
3,440.1 813.0 1,596.8 783.7 2353.7 757.0 3,169.7 816.0 4,005.8 919.7 1,782.1 862.4 2,528.0 745.9 3,308.6 780.5 2,916.9 889.0
Agriculture income
548.9 12.6 127.4 114.8 331.8 204.3 423.1 91.3 617.8 9.3 103.1 93.8 272.0 168.9 401.0 129.0 698.1 7.1
Other income 3,345.4 378.8 1,160.9 782.1 1771.8 610.8 3,220.8 1,449.0 3,420.2 637.9 1,408.7 770.8 6,851.0 5,442.3 8,356.9 1,505.9 7,632.4 449.7
Interest income tax
676.4 287.6 375.7 88.1 584.8 209.1 792.1 207.3 799.9 247.3 517.0 269.7 957.2 440.1 1,261.8 304.6 877.2 370.0
Capital gains tax
107.6 41.4 88.3 46.9 152.2 63.9 203.1 50.9 91.4 33.7 98.2 64.5 143.2 45.0 238.7 95.5 137.9 58.3
Rural land use fee
437.8 14.2 113.8 99.6 297.6 183.7 410.9 113.3 486.1 10.6 85.9 75.3 243.2 157.3 376.3 133.1 2,300.4 12.1
Urban land lease fee
2,528.2 656.9 1,050.0 393.0 1902.0 852.1 2,677.8 775.8 2,650.4 572.0 1,275.4 703.5 1,818.8 543.4 2,432.4 613.6 3,120.0 669.2
Domestic indirect taxes
67,594.2 13,821.3 27,248.8 13,427.5 43,544.5 16,295.7 62,523.1 18,978.5 78,503.1 14,524.3 30,824.7 16,300.4 48,018.7 17,194.0 67,172.4 19,153.7 83,200.3 17,349.9
Sales/TOT/excise taxes
33,586.8 5,294.3 10,764.6 5,470.3 17258.7 6,494.1 24,768.1 7,509.4 39,788.0 6,120.2 12,739.3 6,619.2 20,821.0 8,081.7 28,849.4 8,028.4 40,833.5 7,266.0
Petroleum products
662.9 61.7 165.2 103.5 331.4 166.3 463.5 132.1 763.9 190.0 348.1 158.1 491.0 142.9 610.6 119.6 820.3 160.4
Alcohol and tobacco
6,163.0 1,109.9 2,591.5 1,481.7 3938.9 1,347.3 5,588.1 1,649.2 7,092.6 1,207.8 2,827.8 1,620.0 4,634.2 1,806.4 6,483.4 1,849.2 7,638.8 1,459.2
Other goods 26,760.9 4,122.8 8,007.9 3,885.2 12988.4 4,980.5 18,716.5 5,728.1 31,931.4 4,722.3 9,563.5 4,841.2 15,695.8 6,132.3 21,755.3 6,059.5 32,374.4 5,646.4
Services TOT/ sales tax
32,087.3 8,135.2 15,732.0 7,596.8 25224.5 9,492.5 36,190.3 10,965.9 36,303.7 8,052.1 17,319.3 9,267.3 26,043.7 8,724.3 36,587.7 10,544.0 38,999.8 9,638.3
Stamp duties 1,920.2 391.8 752.2 360.4 1061.3 309.1 1,564.6 503.3 2,411.4 352.0 766.0 414.0 1,154.0 388.0 1,735.4 581.4 3,367.0 445.5
Import duties and taxes
71,681.4 17,669.7 33,776.3 16,106.6 49,311.3 15,535.1 66,202.4 16,891.0 86,337.7 18,940.9 38,567.2 19,626.3 54,878.4 16,311.3 70,411.0 15,532.6 91,833.5 18,184.3
Custom duties 23,782.2 6,013.4 11,418.7 5,405.2 16884.2 5,465.6 22,655.0 5,770.7 28,644.8 6,471.8 13,382.6 6,910.8 19,136.6 5,754.0 24,393.7 5,257.1 30,548.3 6,171.2
Sales/excise taxes
33,915.1 8,246.6 15,811.9 7,565.3 22934.6 7,122.7 30,890.1 7,955.5 40,849.5 8,805.4 17,699.3 8,893.9 25,013.2 7,313.8 32,188.5 7,175.3 43,423.5 8,418.9
Petroleum products
2,385.2 513.2 931.1 417.9 1362.4 431.3 1,824.7 462.4 2,872.9 384.8 477.6 92.8 944.2 466.6 1,340.7 396.5 3,088.4 401.5
Alcohol and tobacco
663.5 115.1 215.4 100.2 267.4 52.0 346.5 79.1 603.0 90.8 151.4 60.6 225.0 73.5 307.7 82.8 648.2 82.2
Other imports 30,866.5 7,618.3 14,665.5 7,047.2 21304.9 6,639.4 28,718.9 7,414.1 37,373.6 8,329.8 17,070.3 8,740.5 23,844.0 6,773.7 30,540.1 6,696.0 39,686.9 7,935.1
Surtax on imports
13,984.1 3,409.6 6,545.7 3,136.0 9492.5 2,946.8 12,657.3 3,164.7 16,843.4 3,663.7 7,485.2 3,821.5 10,728.6 3,243.4 13,828.8 3,100.2 17,861.7 3,594.2
Export taxes 0.0 0.0 0.0 0.0 0.0 0.0 0.0 0.0 0.0 0.0
Coffee duties 0.0 0.0 0.0 0.0 0.0 0.0 0.0 0.0 0.0 0.0
Coffee surtax 0.0 0.0 0.0 0.0 0.0 0.0 0.0 0.0 0.0 0.0
Other 0.0 0.0 0.0 0.0 0.0 0.0 0.0 0.0 0.0 0.0
Transaction tax 0.0 0.0 0.0 0.0 0.0 0.0 0.0 0.0 0.0 0.0
Non-tax revenue
40,794.8 8,688.0 20,414.7 11,726.7 30,146.7
9,732.0 46,493.2 16,346.5 44,793.9 10,085.4 18,164.4 8,079.0 25,210.0 7,045.7 34,418.7 9,208.7 45,812.3 11,306.6
Charges and fees
2,046.7 1,032.2 1,559.7 527.4 2178.0 618.3 3,567.8 1,389.8 2,697.3 478.5 1,730.5 1,252.0 3,086.9 1,356.4 4,182.5 1,095.6 3,115.8 587.9
Sales of goods & services
6,515.0 867.4 1,757.2 889.8 2962.8 1,205.6 4,956.9 1,994.1 5,679.5 665.2 2,071.7 1,406.5 3,145.6 1,074.0 5,282.4 2,136.8 6,580.9 922.1
Residual surplus, capital charge, interest
0.0 0.0 0.0
payments and state dividend
15,419.1 4,750.4 9,405.5 4,655.0 14724.1 5,318.7 14,746.0 21.8 17,210.9 6,498.8 8,776.8 2,278.0 10,956.4 2,179.5 12,222.8 1,266.4 15,668.4 7,612.2
Reimbursement & property sales
253.2 35.6 54.8 19.2 82.0 27.2 145.9 63.9 286.6 15.6 40.8 25.2 86.5 45.6 121.2 34.8 323.1 13.1
Miscellaneous 8,489.9 982.7 5,679.0 4,696.2 6699.5 1,020.6 17,886.0 11,186.5 9,722.9 1,503.1 3,018.0 1,514.9 3,828.4 810.4 6,168.1 2,339.7 9,686.5 885.0
Other extraordinary
0.0 0.0 0.0 0.0 0.0 0.0 0.0 0.0 0.0 0.0 0.0 0.0 0.0 0.0 0.0 0.0 0.0
Privatization proceeds
6,000.0 0.0 0.0 0.0 5454.1 5,454.1 8,883.3 3,429.2 0.0 0.0 0.0 0.0 7,990.2 7,990.2 9,349.1 1,358.9 0.0 0.0
Other revenue 8,070.8 1,019.7 1,958.7 939.0 3500.2 1,541.6 5,190.6 1,690.3 9,196.8 924.1 2,526.6 1,602.5 4,106.3 1,579.7 6,441.7 2,335.4 10,437.6 1,286.3
Total revenue 267,689.2 59,514.1 124,247.5 64,733.5 182,612.7 58,365.2 256,629.0 74,016.3 307,103.3 63,453.1 137,610.6 74,157.5 202,237.8 64,627.2 269,648.2 67,410.4 335,333.7 71,387.1
External grants 16,108.4 2,238.0 6,182.5 3,944.5 10,378.8 4,196.3 12,476.9 2,098.1 17,176.7 2,386.1 8,512.2 6,126.0 13,732.4 5,220.3 17,913.9 4,181.5 19,148.0 3,362.7
Grants in kind/earmarked
13,987.5 2,238.0 5,595.0 3,357.0 9791.3 4,196.3 11,889.4 2,098.1 14,913.4 2,386.1 5,965.4 3,579.2 11,185.0 5,219.7 14,167.7 2,982.7 16,813.6 3,362.7
Untied cash & CPF/grants
2,120.9 0.0 587.5 587.5 587.5 0.0 587.5 0.0 2,263.3 0.0 2,546.8 2,546.8 2,547.4 0.6 3,746.2 1,198.8 2,334.4 0.0
Total revenue and grants
283,797.6 61,752.1 130,430.1 68,678.0 192,991.5 62,561.4 269,105.9 76,114.5 324,280.0 65,839.2 146,122.7 80,283.5 215,970.2 69,847.5 287,562.1 71,591.9 354,481.7 74,749.8
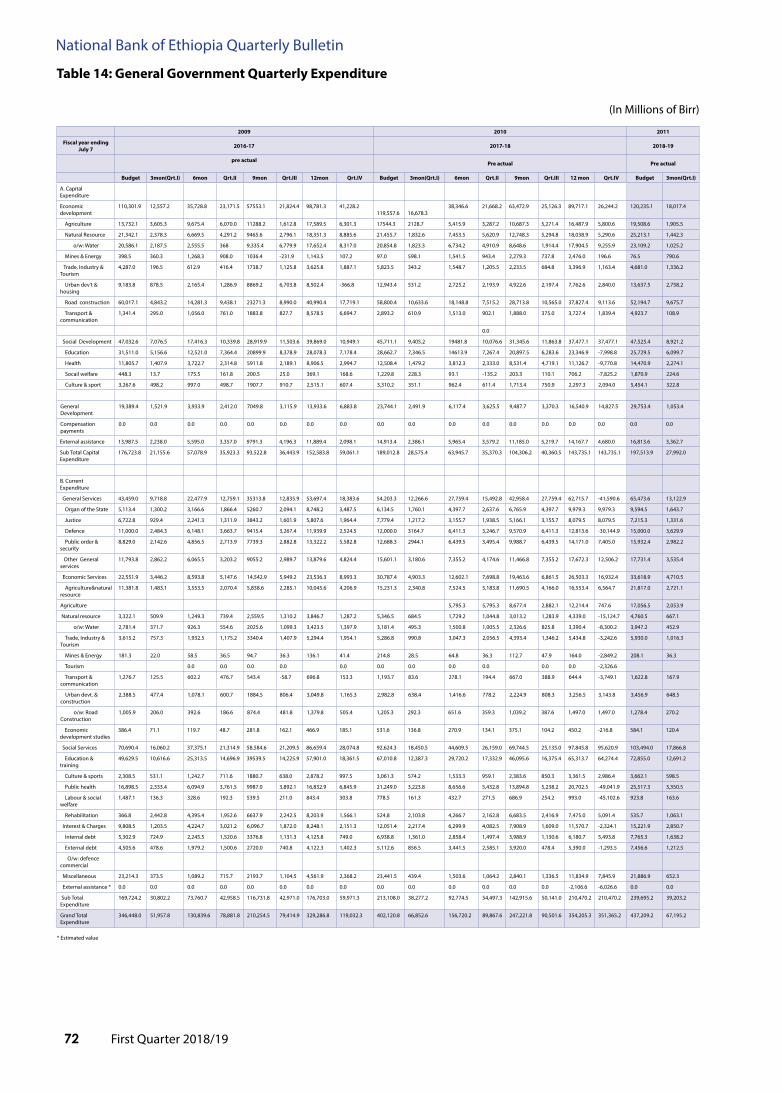
First Quarter 2018/1972
National Bank of Ethiopia Quarterly Bulletin
table 14: General Government Quarterly Expenditure
(In Millions of Birr)
2009 2010 2011
fiscal year ending July 7 2016-17 2017-18 2018-19
pre actual pre actual pre actual
Budget 3mon(Qrt.i) 6mon Qrt.ii 9mon Qrt.iii 12mon Qrt.iV Budget 3mon(Qrt.i) 6mon Qrt.ii 9mon Qrt.iii 12 mon Qrt.iV Budget 3mon(Qrt.i)
A. Capital Expenditure
Economic development
110,301.9 12,557.2 35,728.8 23,171.5 57553.1 21,824.4 98,781.3 41,228.2 119,557.6
16,678.3
38,346.6 21,668.2 63,472.9 25,126.3 89,717.1 26,244.2 120,235.1 18,017.4
Agriculture 13,732.1 3,605.3 9,675.4 6,070.0 11288.2 1,612.8 17,589.5 6,301.3 17544.3 2128.7 5,415.9 3,287.2 10,687.3 5,271.4 16,487.9 5,800.6 19,508.6 1,905.5
Natural Resource 21,342.1 2,378.3 6,669.5 4,291.2 9465.6 2,796.1 18,351.3 8,885.6 21,455.7 1,832.6 7,453.5 5,620.9 12,748.3 5,294.8 18,038.9 5,290.6 25,213.1 1,442.3
o/w: Water 20,586.1 2,187.5 2,555.5 368 9,335.4 6,779.9 17,652.4 8,317.0 20,854.8 1,823.3 6,734.2 4,910.9 8,648.6 1,914.4 17,904.5 9,255.9 23,109.2 1,025.2
Mines & Energy 398.5 360.3 1,268.3 908.0 1036.4 -231.9 1,143.5 107.2 97.0 598.1 1,541.5 943.4 2,279.3 737.8 2,476.0 196.6 76.5 790.6
Trade, Industry & Tourism
4,287.0 196.5 612.9 416.4 1738.7 1,125.8 3,625.8 1,887.1 5,823.5 343.2 1,548.7 1,205.5 2,233.5 684.8 3,396.9 1,163.4 4,681.0 1,336.2
Urban dev't & housing
9,183.8 878.5 2,165.4 1,286.9 8869.2 6,703.8 8,502.4 -366.8 12,943.4 531.2 2,725.2 2,193.9 4,922.6 2,197.4 7,762.6 2,840.0 13,637.5 2,758.2
Road construction 60,017.1 4,843.2 14,281.3 9,438.1 23271.3 8,990.0 40,990.4 17,719.1 58,800.4 10,633.6 18,148.8 7,515.2 28,713.8 10,565.0 37,827.4 9,113.6 52,194.7 9,675.7
Transport & communication
1,341.4 295.0 1,056.0 761.0 1883.8 827.7 8,578.5 6,694.7 2,893.2 610.9 1,513.0 902.1 1,888.0 375.0 3,727.4 1,839.4 4,923.7 108.9
0.0
Social Development 47,032.6 7,076.5 17,416.3 10,339.8 28,919.9 11,503.6 39,869.0 10,949.1 45,711.1 9,405.2 19481.8 10,076.6 31,345.6 11,863.8 37,477.1 37,477.1 47,525.4 8,921.2
Education 31,511.0 5,156.6 12,521.0 7,364.4 20899.9 8,378.9 28,078.3 7,178.4 28,662.7 7,346.5 14613.9 7,267.4 20,897.5 6,283.6 23,346.9 -7,998.8 25,729.5 6,099.7
Health 11,805.7 1,407.9 3,722.7 2,314.8 5911.8 2,189.1 8,906.5 2,994.7 12,508.4 1,479.2 3,812.3 2,333.0 8,531.4 4,719.1 11,126.7 -9,770.8 14,470.9 2,274.1
Socail welfare 448.3 13.7 175.5 161.8 200.5 25.0 369.1 168.6 1,229.8 228.3 93.1 -135.2 203.3 110.1 706.2 -7,825.2 1,870.9 224.6
Culture & sport 3,267.6 498.2 997.0 498.7 1907.7 910.7 2,515.1 607.4 3,310.2 351.1 962.4 611.4 1,713.4 750.9 2,297.3 2,094.0 5,454.1 322.8
General Development
19,389.4 1,521.9 3,933.9 2,412.0 7049.8 3,115.9 13,933.6 6,883.8 23,744.1 2,491.9 6,117.4 3,625.5 9,487.7 3,370.3 16,540.9 14,827.5 29,753.4 1,053.4
Compensation payments
0.0 0.0 0.0 0.0 0.0 0.0 0.0 0.0 0.0 0.0 0.0 0.0 0.0 0.0 0.0 0.0 0.0 0.0
External assistance 13,987.5 2,238.0 5,595.0 3,357.0 9791.3 4,196.3 11,889.4 2,098.1 14,913.4 2,386.1 5,965.4 3,579.2 11,185.0 5,219.7 14,167.7 4,680.0 16,813.6 3,362.7
Sub Total Capital Expenditure
176,723.8 21,155.6 57,078.9 35,923.3 93,522.8 36,443.9 152,583.8 59,061.1 189,012.8 28,575.4 63,945.7 35,370.3 104,306.2 40,360.5 143,735.1 143,735.1 197,513.9 27,992.0
B. Current Expenditure
General Services 43,459.0 9,718.8 22,477.9 12,759.1 35313.8 12,835.9 53,697.4 18,383.6 54,203.3 12,266.6 27,759.4 15,492.8 42,958.4 27,759.4 62,715.7 -41,590.6 65,473.6 13,122.9
Organ of the State 5,113.4 1,300.2 3,166.6 1,866.4 5260.7 2,094.1 8,748.2 3,487.5 6,134.5 1,760.1 4,397.7 2,637.6 6,765.9 4,397.7 9,979.3 9,979.3 9,594.5 1,643.7
Justice 6,722.8 929.4 2,241.3 1,311.9 3843.2 1,601.9 5,807.6 1,964.4 7,779.4 1,217.2 3,155.7 1,938.5 5,166.1 3,155.7 8,079.5 8,079.5 7,215.3 1,331.6
Defence 11,000.0 2,484.3 6,148.1 3,663.7 9415.4 3,267.4 11,939.9 2,524.5 12,000.0 3164.7 6,411.3 3,246.7 9,570.9 6,411.3 12,813.6 -30,144.9 15,000.0 3,629.9
Public order & security
8,829.0 2,142.6 4,856.5 2,713.9 7739.3 2,882.8 13,322.2 5,582.8 12,688.3 2944.1 6,439.5 3,495.4 9,988.7 6,439.5 14,171.0 7,405.0 15,932.4 2,982.2
Other General services
11,793.8 2,862.2 6,065.5 3,203.2 9055.2 2,989.7 13,879.6 4,824.4 15,601.1 3,180.6 7,355.2 4,174.6 11,466.8 7,355.2 17,672.3 12,506.2 17,731.4 3,535.4
Economic Services 22,551.9 3,446.2 8,593.8 5,147.6 14,542.9 5,949.2 23,536.3 8,993.3 30,787.4 4,903.3 12,602.1 7,698.8 19,463.6 6,861.5 26,503.3 16,932.4 33,618.9 4,710.5
Agriculture&natural resource
11,381.8 1,483.1 3,553.5 2,070.4 5,838.6 2,285.1 10,045.6 4,206.9 15,231.3 2,340.8 7,524.5 5,183.8 11,690.5 4,166.0 16,553.4 6,564.7 21,817.0 2,721.1
Agriculture 5,795.3 5,795.3 8,677.4 2,882.1 12,214.4 747.6 17,056.5 2,053.9
Natural resource 3,322.1 509.9 1,249.3 739.4 2,559.5 1,310.2 3,846.7 1,287.2 5,346.5 684.5 1,729.2 1,044.8 3,013.2 1,283.9 4,339.0 -15,124.7 4,760.5 667.1
o/w: Water 2,781.4 371.7 926.3 554.6 2025.6 1,099.3 3,423.5 1,397.9 3,181.4 495.3 1,500.8 1,005.5 2,326.6 825.8 3,390.4 -8,300.2 3,947.2 452.9
Trade, Industry & Tourism
3,615.2 757.3 1,932.5 1,175.2 3340.4 1,407.9 5,294.4 1,954.1 5,286.8 990.8 3,047.3 2,056.5 4,393.4 1,346.2 5,434.8 -3,242.6 5,930.0 1,016.3
Mines & Energy 181.3 22.0 58.5 36.5 94.7 36.3 136.1 41.4 214.8 28.5 64.8 36.3 112.7 47.9 164.0 -2,849.2 208.1 36.3
Tourism 0.0 0.0 0.0 0.0 0.0 0.0 0.0 0.0 0.0 0.0 0.0 -2,326.6
Transport & communication
1,276.7 125.5 602.2 476.7 543.4 -58.7 696.8 153.3 1,193.7 83.6 278.1 194.4 667.0 388.9 644.4 -3,749.1 1,622.8 167.9
Urban devt. & construction
2,388.5 477.4 1,078.1 600.7 1884.5 806.4 3,049.8 1,165.3 2,982.8 638.4 1,416.6 778.2 2,224.9 808.3 3,256.5 3,143.8 3,456.9 648.5
o/w: Road Construction
1,005.9 206.0 392.6 186.6 874.4 481.8 1,379.8 505.4 1,205.3 292.3 651.6 359.3 1,039.2 387.6 1,497.0 1,497.0 1,278.4 270.2
Economic development studies
386.4 71.1 119.7 48.7 281.8 162.1 466.9 185.1 531.6 136.8 270.9 134.1 375.1 104.2 450.2 -216.8 584.1 120.4
Social Services 70,690.4 16,060.2 37,375.1 21,314.9 58,584.6 21,209.5 86,659.4 28,074.8 92,624.3 18,450.5 44,609.5 26,159.0 69,744.5 25,135.0 97,845.8 95,620.9 103,494.0 17,866.8
Education & training
49,629.5 10,616.6 25,313.5 14,696.9 39539.5 14,225.9 57,901.0 18,361.5 67,010.8 12,387.3 29,720.2 17,332.9 46,095.6 16,375.4 65,313.7 64,274.4 72,855.0 12,691.2
Culture & sports 2,308.5 531.1 1,242.7 711.6 1880.7 638.0 2,878.2 997.5 3,061.3 574.2 1,533.3 959.1 2,383.6 850.3 3,361.5 2,986.4 3,662.1 598.5
Public health 16,898.5 2,333.4 6,094.9 3,761.5 9987.0 3,892.1 16,832.9 6,845.9 21,249.0 3,223.8 8,656.6 5,432.8 13,894.8 5,238.2 20,702.5 -49,041.9 25,517.3 3,350.5
Labour & social welfare
1,487.1 136.3 328.6 192.3 539.5 211.0 843.4 303.8 778.5 161.3 432.7 271.5 686.9 254.2 993.0 -45,102.6 923.8 163.6
Rehabilitation 366.8 2,442.8 4,395.4 1,952.6 6637.9 2,242.5 8,203.9 1,566.1 524.8 2,103.8 4,266.7 2,162.8 6,683.5 2,416.9 7,475.0 5,091.4 535.7 1,063.1
Interest & Charges 9,808.5 1,203.5 4,224.7 3,021.2 6,096.7 1,872.0 8,248.1 2,151.3 12,051.4 2,217.4 6,299.9 4,082.5 7,908.9 1,609.0 11,570.7 -2,324.1 15,221.9 2,850.7
Internal debt 5,302.9 724.9 2,245.5 1,520.6 3376.8 1,131.3 4,125.8 749.0 6,938.8 1,361.0 2,858.4 1,497.4 3,988.9 1,130.6 6,180.7 5,493.8 7,765.3 1,638.2
External debt 4,505.6 478.6 1,979.2 1,500.6 2720.0 740.8 4,122.3 1,402.3 5,112.6 856.5 3,441.5 2,585.1 3,920.0 478.4 5,390.0 -1,293.5 7,456.6 1,212.5
O/w: defence commercial
Miscellaneous 23,214.3 373.5 1,089.2 715.7 2193.7 1,104.5 4,561.9 2,368.2 23,441.5 439.4 1,503.6 1,064.2 2,840.1 1,336.5 11,834.9 7,845.9 21,886.9 652.3
External assistance * 0.0 0.0 0.0 0.0 0.0 0.0 0.0 0.0 0.0 0.0 0.0 0.0 0.0 0.0 -2,106.6 -6,026.6 0.0 0.0
Sub Total Expenditure
169,724.2 30,802.2 73,760.7 42,958.5 116,731.8 42,971.0 176,703.0 59,971.3 213,108.0 38,277.2 92,774.5 54,497.3 142,915.6 50,141.0 210,470.2 210,470.2 239,695.2 39,203.2
Grand Total Expenditure
346,448.0 51,957.8 130,839.6 78,881.8 210,254.5 79,414.9 329,286.8 119,032.3 402,120.8 66,852.6 156,720.2 89,867.6 247,221.8 90,501.6 354,205.3 351,365.2 437,209.2 67,195.2
* Estimated value
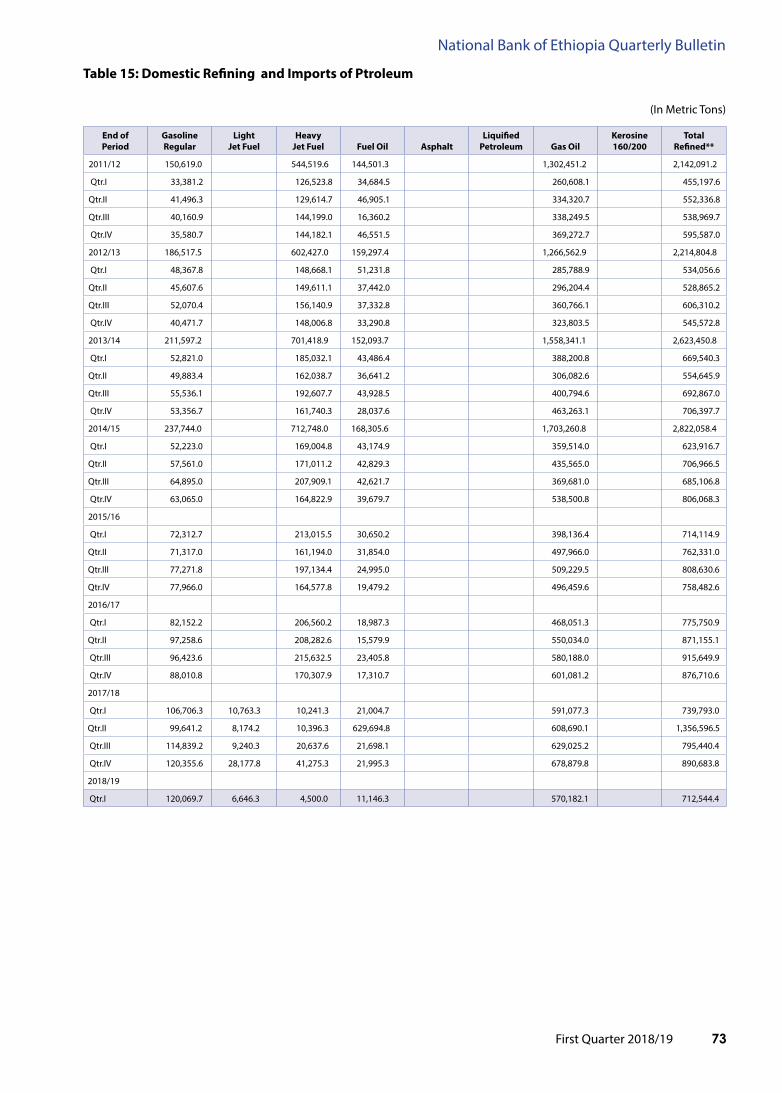
First Quarter 2018/19 73
National Bank of Ethiopia Quarterly Bulletin
table 15: Domestic Refining and imports of ptroleum
(In Metric Tons)
End of period
GasolineRegular
lightJet fuel
heavyJet fuel
fuel oil
asphalt
liquifiedpetroleum
Gas oil
kerosine 160/200
totalRefined**
2011/12 150,619.0 544,519.6 144,501.3 1,302,451.2 2,142,091.2
Qtr.I 33,381.2 126,523.8 34,684.5 260,608.1 455,197.6
Qtr.II 41,496.3 129,614.7 46,905.1 334,320.7 552,336.8
Qtr.III 40,160.9 144,199.0 16,360.2 338,249.5 538,969.7
Qtr.IV 35,580.7 144,182.1 46,551.5 369,272.7 595,587.0
2012/13 186,517.5 602,427.0 159,297.4 1,266,562.9 2,214,804.8
Qtr.I 48,367.8 148,668.1 51,231.8 285,788.9 534,056.6
Qtr.II 45,607.6 149,611.1 37,442.0 296,204.4 528,865.2
Qtr.III 52,070.4 156,140.9 37,332.8 360,766.1 606,310.2
Qtr.IV 40,471.7 148,006.8 33,290.8 323,803.5 545,572.8
2013/14 211,597.2 701,418.9 152,093.7 1,558,341.1 2,623,450.8
Qtr.I 52,821.0 185,032.1 43,486.4 388,200.8 669,540.3
Qtr.II 49,883.4 162,038.7 36,641.2 306,082.6 554,645.9
Qtr.III 55,536.1 192,607.7 43,928.5 400,794.6 692,867.0
Qtr.IV 53,356.7 161,740.3 28,037.6 463,263.1 706,397.7
2014/15 237,744.0 712,748.0 168,305.6 1,703,260.8 2,822,058.4
Qtr.I 52,223.0 169,004.8 43,174.9 359,514.0 623,916.7
Qtr.II 57,561.0 171,011.2 42,829.3 435,565.0 706,966.5
Qtr.III 64,895.0 207,909.1 42,621.7 369,681.0 685,106.8
Qtr.IV 63,065.0 164,822.9 39,679.7 538,500.8 806,068.3
2015/16
Qtr.I 72,312.7 213,015.5 30,650.2 398,136.4 714,114.9
Qtr.II 71,317.0 161,194.0 31,854.0 497,966.0 762,331.0
Qtr.III 77,271.8 197,134.4 24,995.0 509,229.5 808,630.6
Qtr.IV 77,966.0 164,577.8 19,479.2 496,459.6 758,482.6
2016/17
Qtr.I 82,152.2 206,560.2 18,987.3 468,051.3 775,750.9
Qtr.II 97,258.6 208,282.6 15,579.9 550,034.0 871,155.1
Qtr.III 96,423.6 215,632.5 23,405.8 580,188.0 915,649.9
Qtr.IV 88,010.8 170,307.9 17,310.7 601,081.2 876,710.6
2017/18
Qtr.I 106,706.3 10,763.3 10,241.3 21,004.7 591,077.3 739,793.0
Qtr.II 99,641.2 8,174.2 10,396.3 629,694.8 608,690.1 1,356,596.5
Qtr.III 114,839.2 9,240.3 20,637.6 21,698.1 629,025.2 795,440.4
Qtr.IV 120,355.6 28,177.8 41,275.3 21,995.3 678,879.8 890,683.8
2018/19
Qtr.I 120,069.7 6,646.3 4,500.0 11,146.3 570,182.1 712,544.4

First Quarter 2018/1974
National Bank of Ethiopia Quarterly Bulletin
annex 16: GDp By Economic activity at Constant prices
(In Metric Tons)
Sectors/Year1997 1998 1999 2000 2001 2002 2003 2004 2005 2006 2007 2008 2009 2010
2004/05 2005/06 2006/07 2007/08 2008/09 2009/10 2010/11 2011/12. 2012/13 2013/14 2014/15 2015/16 2016/17 2017/18
Agriculture, Hunting and Forestry
130,614.3
145,042.0
158,645.8
170,428.1
181,074.4
194,869.2
212,252.7
222,664.5
238,438.0
251,340.0
267,269.0
542,700.2
579,022.9
599,331.5
Crop 83,361.1 95,838.1 106,406.4 114,904.0 122,343.4 133,039.9 146,760.0 154,081.7 166,698.9 177,663.1 190,421.6 346,293.6 374,649.8 392,291.8
Animal Farming and Hunting
30,872.0
32,385.2
34,936.0
37,494.4
40,136.6
42,619.2
45,806.1
48,287.7
50,777.2
51,834.8
54,250.1
146,959.5
153,170.4
154,037.9
Forestry 16,381.2 16,818.7 17,303.4 18,029.7 18,594.5 19,210.0 19,686.6 20,295.1 20,961.9 21,842.1 22,597.2 49,447.1 51,202.7 53,001.7
Fishing 120.3 110.4 118.9 159.3 201.5 204.9 217.0 263.2 314.1 416.3 543.8 1,381.9 1,389.4 1,546.7
Mining and Quarrying
2,412.6
2,585.5
2,187.2
2,655.5
2,994.8
4,317.5
6,809.7
7,675.1
8,156.9
7,898.4
5,876.4
6,116.8
4,296.9
3,402.8
Manufacturing 10,140.9 11,176.0 12,091.7 13,302.1 14,487.3 16,127.1 18,968.0 21,207.1 24,798.2 28,923.9 34,194.6 89,246.7 111,249.6 117,410.7
Large and Medium Scale Manufacturing
6,152.4
6,992.2
7,655.2
8,617.9
9,504.4
10,797.1
12,323.8
14,283.8
17,740.9
21,566.2
26,558.6
61,687.4
73,528.2
77,966.5
Small Scale and Cottage Industries
3,988.5
4,183.8
4,436.5
4,684.3
4,982.8
5,329.9
6,644.2
6,923.3
7,057.3
7,357.7
7,636.0
27,559.2
37,721.5
39,444.2
Electricity and Water
3,302.7
3,595.0
4,084.3
4,282.3
4,496.6
4,608.7
4,902.4
5,566.1
6,124.2
6,538.2
6,831.9
11,015.5
11,552.5
11,928.9
Construction 10,022.8
11,074.4
12,282.1
13,675.2
15,271.9
16,935.0
19,100.4
25,108.0
34,831.6
43,146.7
56,772.6
237,545.0
286,749.6
331,691.4
Whole Sale and Retail Trade
34,482.7
40,529.6
47,343.9
54,847.5
61,280.3
66,974.3
70,907.5
79,785.5
87,831.4
103,350.2
116,095.3
202,241.5
215,351.1
241,936.3
Hotels and Restaurants
4,724.2
5,646.8
7,197.7
8,876.1
10,993.6
13,663.7
17,029.3
18,740.8
22,326.5
28,267.0
36,630.6
41,601.3
41,625.2
44,335.3
Transport and Communications
11,292.7
11,935.3
13,048.7
14,545.3
15,842.3
18,130.2
19,890.5
22,391.7
26,087.9
29,395.7
33,312.8
70,453.3
81,097.4
86,310.3
Financial Intermediation
4,375.6
5,631.9
6,481.9
8,304.6
9,672.7
9,645.6
11,927.7
14,744.4
12,944.2
14,793.3
15,896.1
39,768.8
47,061.1
52,114.6
Real Estate, Renting and Business Activities
16,779.4
19,215.0
22,138.9
25,965.8
30,089.8
36,096.7
44,064.4
45,749.9
47,529.0
49,383.9
51,432.5
67,062.9
70,005.2
74,364.3
Public Administration and Defense
9,242.8
9,831.9
10,991.7
12,368.4
14,639.8
15,944.3
25,735.8
26,529.0
28,554.4
31,701.1
33,613.2
62,259.3
70,488.5
76,754.1
Education 4,820.1
5,235.0
6,347.1
7,284.0
8,230.3
9,626.5
10,772.2
11,252.5
12,386.7
12,706.6
13,875.9
42,385.6
41,031.1
42,520.8
Health and Social Work
1,732.1
1,902.4
2,202.2
2,544.2
3,063.7
3,493.6
4,132.3
4,520.0
5,075.4
6,053.5
6,840.7
15,669.5
16,767.9
18,153.4
Other Community , Social & Personal Services
7,342.9
8,016.1
8,696.7
9,713.7
10,330.6
11,164.0
11,035.9
12,404.2
14,686.9
15,248.3
15,811.7
18,371.3
19,198.4
20,177.9
Private Households with Employed Persons
841.0
896.3
932.0
981.1
1,018.2
1,066.9
1,121.0
1,301.5
1,407.7
1,469.7
1,533.7
16,063.8
16,633.3
17,276.1
Total 251,406.0 281,527.3 313,858.9 348,952.3 382,669.6 421,801.1 478,866.9 519,903.4 571,493.3 630,632.7 696,530.8 1,463,883.8 1,613,519.9 1,739,254.9
Less : FISIM 1,155.6 16,216.0 1,841.1 2,393.7 2,693.7 2,898.1 3,219.3 2,876.9 3,061.0 3,655.4 4,309.1 14,485.8 17,038.3 19,763.6
Gross Value Added at Constant Basic Prices
248,354.8 277,013.3 309,686.8 344,331.9 378,907.4 418,947.0 475,647.5 517,026.5 568,432.3 626,977.4 692,221.7 1,449,397.5 1,596,481.6 1,719,491.3
Taxes on Products 23,444.0 24,071.6 25,803.6 27,238.6 24,975.4 36,321.6 39,431.0 42,595.0 50,409.9 55,381.1 61,008.0 118,700.0 120,645.6 114,575.2
GDP at Constant Market Prices
271,798.7
301,085.0
335,490.3
371,570.5
403,882.7
455,268.5
515,078.5
559,621.6
618,842.2
682,358.5
753,229.7
1,568,097.5
1,717,127.2
1,834,066.5
Source:MoFED
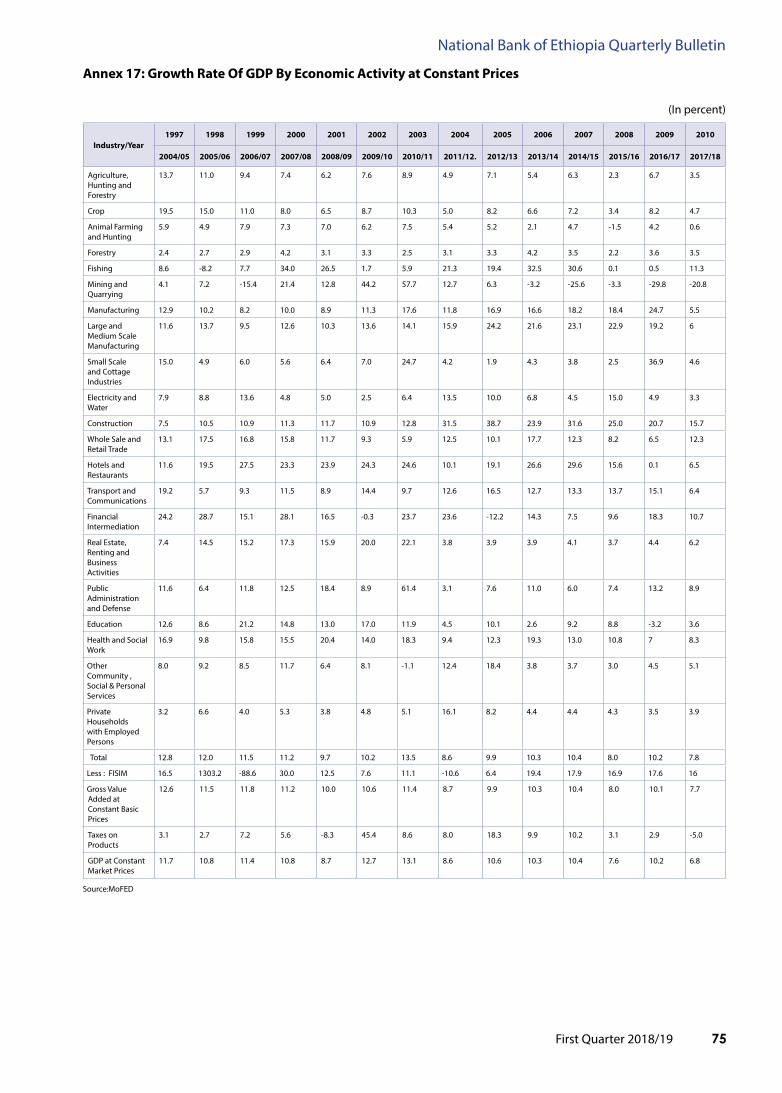
First Quarter 2018/19 75
National Bank of Ethiopia Quarterly Bulletin
annex 17: Growth Rate of GDp By Economic activity at Constant prices
(In percent)
industry/Year1997 1998 1999 2000 2001 2002 2003 2004 2005 2006 2007 2008 2009 2010
2004/05 2005/06 2006/07 2007/08 2008/09 2009/10 2010/11 2011/12. 2012/13 2013/14 2014/15 2015/16 2016/17 2017/18
Agriculture, Hunting and Forestry
13.7 11.0 9.4 7.4 6.2 7.6 8.9 4.9 7.1 5.4 6.3 2.3 6.7 3.5
Crop 19.5 15.0 11.0 8.0 6.5 8.7 10.3 5.0 8.2 6.6 7.2 3.4 8.2 4.7
Animal Farming and Hunting
5.9 4.9 7.9 7.3 7.0 6.2 7.5 5.4 5.2 2.1 4.7 -1.5 4.2 0.6
Forestry 2.4 2.7 2.9 4.2 3.1 3.3 2.5 3.1 3.3 4.2 3.5 2.2 3.6 3.5
Fishing 8.6 -8.2 7.7 34.0 26.5 1.7 5.9 21.3 19.4 32.5 30.6 0.1 0.5 11.3
Mining and Quarrying
4.1 7.2 -15.4 21.4 12.8 44.2 57.7 12.7 6.3 -3.2 -25.6 -3.3 -29.8 -20.8
Manufacturing 12.9 10.2 8.2 10.0 8.9 11.3 17.6 11.8 16.9 16.6 18.2 18.4 24.7 5.5
Large and Medium Scale Manufacturing
11.6 13.7 9.5 12.6 10.3 13.6 14.1 15.9 24.2 21.6 23.1 22.9 19.2 6
Small Scale and Cottage Industries
15.0 4.9 6.0 5.6 6.4 7.0 24.7 4.2 1.9 4.3 3.8 2.5 36.9 4.6
Electricity and Water
7.9 8.8 13.6 4.8 5.0 2.5 6.4 13.5 10.0 6.8 4.5 15.0 4.9 3.3
Construction 7.5 10.5 10.9 11.3 11.7 10.9 12.8 31.5 38.7 23.9 31.6 25.0 20.7 15.7
Whole Sale and Retail Trade
13.1 17.5 16.8 15.8 11.7 9.3 5.9 12.5 10.1 17.7 12.3 8.2 6.5 12.3
Hotels and Restaurants
11.6 19.5 27.5 23.3 23.9 24.3 24.6 10.1 19.1 26.6 29.6 15.6 0.1 6.5
Transport and Communications
19.2 5.7 9.3 11.5 8.9 14.4 9.7 12.6 16.5 12.7 13.3 13.7 15.1 6.4
Financial Intermediation
24.2 28.7 15.1 28.1 16.5 -0.3 23.7 23.6 -12.2 14.3 7.5 9.6 18.3 10.7
Real Estate, Renting and Business Activities
7.4 14.5 15.2 17.3 15.9 20.0 22.1 3.8 3.9 3.9 4.1 3.7 4.4 6.2
Public Administration and Defense
11.6 6.4 11.8 12.5 18.4 8.9 61.4 3.1 7.6 11.0 6.0 7.4 13.2 8.9
Education 12.6 8.6 21.2 14.8 13.0 17.0 11.9 4.5 10.1 2.6 9.2 8.8 -3.2 3.6
Health and Social Work
16.9 9.8 15.8 15.5 20.4 14.0 18.3 9.4 12.3 19.3 13.0 10.8 7 8.3
Other Community , Social & Personal Services
8.0 9.2 8.5 11.7 6.4 8.1 -1.1 12.4 18.4 3.8 3.7 3.0 4.5 5.1
Private Households with Employed Persons
3.2 6.6 4.0 5.3 3.8 4.8 5.1 16.1 8.2 4.4 4.4 4.3 3.5 3.9
Total 12.8 12.0 11.5 11.2 9.7 10.2 13.5 8.6 9.9 10.3 10.4 8.0 10.2 7.8
Less : FISIM 16.5 1303.2 -88.6 30.0 12.5 7.6 11.1 -10.6 6.4 19.4 17.9 16.9 17.6 16
Gross Value Added at Constant Basic Prices
12.6 11.5 11.8 11.2 10.0 10.6 11.4 8.7 9.9 10.3 10.4 8.0 10.1 7.7
Taxes on Products
3.1 2.7 7.2 5.6 -8.3 45.4 8.6 8.0 18.3 9.9 10.2 3.1 2.9 -5.0
GDP at Constant Market Prices
11.7 10.8 11.4 10.8 8.7 12.7 13.1 8.6 10.6 10.3 10.4 7.6 10.2 6.8
Source:MoFED

First Quarter 2018/1976
National Bank of Ethiopia Quarterly Bulletin
table 18: GDp by Economic By Economic activity at Constant prices
(In million Birr)
Industry/Year1997 1998 1999 2000 2001 2002 2003 2004 2005 2006 2007 2008 2009 2010
2004/05 2005/06 2006/07 2007/08 2008/09 2009/10 2010/11 20011/12 2012/13 2013/14 2014/15 2015/16 2016/17 2017/18
Agriculture, Hunting and Forestry
44,144
56,370
73,206
112,997
154,995
159,821
212,253
330,842
356,828
407,834
466,780
542,700
616,843
684,644
Crop 27,840 36,107 49,326 81,604 113,959 111,292 146,760 240,112 244,048 279,058 317,142 346,294 393,324 427,193
Animal Farming and Hunting
10,053
13,033
15,531
20,622
27,868
32,817
45,806
66,437
82,351
92,037
107,089
146,960
164,730
191,867
Forestry 6,707
7,462
8,988
12,695
15,475
16,801
19,687
24,293
30,429
36,739
42,550
49,447
58,788
65,584
Fishing 55 69 81 116 151 198 217 455 685 796 1,225 1,382 2,259 2,351
Mining and Quarrying
485
586
551
799
1,101
2,147
6,810
9,301
9,687
8,665
6,036
6,117
4,840
4,054
Manufacturing 5,007 5,917 7,630 9,892 12,631 14,778 18,968 25,559 32,095 42,341 57,170 89,247 113,387 128,200
Large and Medium Scale Manufacturing
3,439
4,181
5,599
7,359
8,844
1,038
12,324
17,161
23,032
32,093
46,438
61,687
74,763
84,791
Small Scale and Cottage Industries
1,571
1,759
2,096
2,634
3,823
4,448
6,644
8,398
9,063
10,247
10,732
27,559
38,624
43,410
Electricity and Water
2,047
2,429
3,289
3,651
3,899
4,608
4,902
6,187
7,355
8,234
8,087
11,016
13,714
15,026
Construction 5,250 6,593 8,829 11,431 15,312 15,130 19,100 29,771 45,744 83,665 140,246 237,545 300,209 452,978
Whole Sale and Retail Trade
12,641
16,678
22,961
33,125
50,478
56,713
70,908
102,632
113,402
146,757
181,227
202,242
225,076
275,513
Hotels and Restaurants
1,677
2,251
3,457
5,137
8,099
11,618
17,029
23,795
32,077
44,461
60,294
41,601
44,922
53,441
Transport and Communications
5,486
5,518
6,374
7,513
10,264
12,850
19,891
29,721
38,340
45,776
53,555
70,453
77,659
82,947
Financial Intermediation
2,254
3,048
3,684
5,014
7,965
8,163
11,928
18,919
26,536
32,219
43,504
39,769
51,810
69,359
Real Estate, Renting and Business Activities
6,494
7,911
11,608
17,338
21,077
31,423
44,064
51,656
59,192
65,179
69,009
67,063
70,793
79,553
Public Administration and Defense
5,146
5,980
6,964
9,191
11,332
13,395
25,736
29,274
34,582
40,353
50,328
62,259
80,817
94,614
Education 3,021 3,837 4,886 6,264 7,475 8,943 10,772 13,283 16,814 22,334 27,501 42,386 61,123 75,776
Health and Social Work
1,111
1,277
1,556
2,068
2,503
2,967
4,132
4,999
6,363
8,279
10,824
15,669
18,770
24,101
Other Community , Social & Personal Services
2,692
3,299
4,218
5,898
8,510
9,453
11,036
16,229
22,448
24,939
28,215
18,371
20,568
23,634
Private Households with Employed Persons
283
375
433
592
788
852
1,121
1,686
2,073
2,640
3,365
16,064
19,879
25,428
Total 96,978 120,819 158,212 229,133 313,270 351,145 478,867 694,309 804,221 984,472 1,207,368 1,463,883 1,722,669 2,091,618
Less : FISIM 595 878 1,046 1,449 2,218 2,453 3,219 3,864 7,918 9,745 14,535 14,486 18,870 26,829
Gross Value Added at Current Basic Prices
96,391
119,934
157,170
227,703
311,043
348,686
475,648
690,444
796,303
974,727
1,192,833
1,449,397
1,703,798
2,064,789
Taxes on Products
8,467
9,698
12,186
16,785
19,139
28,412
39,431
56,882
70,618
86,098
105,129
118,700
128,756
137,584
GDP at Current Market Prices
105,415
130,334
170,281
245,836
332,060
379,135
515,079
747,326
866,921
1,060,825
1,297,961
1,568,098
1,832,554
2,202,373
Source: MoFED

First Quarter 2018/19 77
National Bank of Ethiopia Quarterly Bulletin
tabl
e 19
: Gro
wth
Rat
es o
f GD
p by
Eco
nom
ic a
ctiv
ity
at C
urre
nt p
rice
s (%
)
(In
mill
ion
Birr
)
Se
ctor
s/Ye
ar
1997
1998
1999
2000
2001
2002
2003
2004
2005
2006
2007
2008
2009
2010
2004
/05
2005
/06
2006
/07
2007
/08
2008
/09
2009
/10
2010
/11
2001
1/12
2012
/13
2013
/14
2014
/15
2015
/16
2016
/17
2017
/18
Agric
ultu
re, H
untin
g an
d Fo
rest
ry30
.827
.729
.954
.437
.23.
132
.855
.97.
914
.314
.512
.113
.711
.0
Crop
38.3
29.7
36.6
65.4
39.6
-2.3
31.9
63.6
1.6
14.3
13.6
11.9
13.6
8.6
Ani
mal
Far
min
g an
d H
untin
g25
.929
.719
.232
.835
.117
.839
.645
.024
.011
.816
.411
.112
.116
.5
Fore
stry
8.4
11.3
20.5
41.2
21.9
8.6
17.2
23.4
25.3
20.7
15.8
16.1
18.9
11.6
Fish
ing
33.8
24.5
17.4
43.3
30.5
31.3
9.6
109.
550
.816
.253
.812
.863
.54.
1
Min
ing
and
Qua
rryi
ng18
.420
.8-6
.044
.937
.994
.921
7.2
36.6
4.2
-10.
5-3
0.3
-2.3
-20.
9-1
6.3
Man
ufac
turin
g11
.118
.229
.029
.627
.717
.028
.434
.725
.631
.935
.07.
027
.013
.1
Larg
e an
d M
ediu
m S
cale
Man
ufac
turin
g6.
621
.633
.931
.420
.2-8
8.3
1087
.539
.334
.239
.344
.76.
321
.213
.4
Smal
l Sca
le a
nd C
otta
ge In
dust
ries
20.4
12.0
19.2
25.7
45.1
16.4
49.4
26.4
7.9
13.1
4.7
10.4
40.1
12.4
Elec
tric
ity a
nd W
ater
7.7
18.7
35.4
11.0
6.8
18.2
6.4
26.2
18.9
12.0
-1.8
4.3
24.5
9.6
Cons
truc
tion
19.1
25.6
33.9
29.5
33.9
-1.2
26.2
55.9
53.7
82.9
67.6
60.3
26.4
50.9
Who
le S
ale
and
Reta
il Tr
ade
20.8
31.9
37.7
44.3
52.4
12.4
25.0
44.7
10.5
29.4
23.5
8.1
11.3
22.4
Hot
els
and
Rest
aura
nts
17.4
34.2
53.6
48.6
57.7
43.5
46.6
39.7
34.8
38.6
35.6
22.9
8.0
19.0
Tran
spor
t and
Com
mun
icat
ions
36.2
0.6
15.5
17.9
36.6
25.2
54.8
49.4
29.0
19.4
17.0
22.4
10.2
6.8
Fina
ncia
l Int
erm
edia
tion
56.0
35.2
20.8
36.1
58.9
2.5
46.1
58.6
40.3
21.4
35.0
21.7
30.3
33.9
Real
Est
ate,
Ren
ting
and
Busi
ness
Act
iviti
es10
.821
.846
.749
.421
.649
.140
.217
.214
.610
.15.
95.
15.
612
.4
Publ
ic A
dmin
istr
atio
n an
d D
efen
se14
.316
.216
.532
.023
.318
.292
.113
.718
.116
.724
.720
.829
.817
.1
Educ
atio
n15
.727
.027
.428
.219
.319
.620
.523
.326
.632
.823
.119
.844
.224
.0
Hea
lth a
nd S
ocia
l Wor
k22
.314
.921
.932
.921
.018
.539
.321
.027
.330
.130
.721
.319
.828
.4
Oth
er C
omm
unity
, So
cial
& P
erso
nal S
ervi
ces
15.4
22.5
27.9
39.8
44.3
11.1
16.7
47.1
38.3
11.1
13.1
9.9
12.0
14.9
Priv
ate
Hou
seho
lds
with
Em
ploy
ed P
erso
ns6.
532
.215
.736
.533
.18.
131
.650
.423
.027
.327
.54.
823
.727
.9
Tot
al
24
25
31
45
37
12
36
45.0
15.8
22.4
22.6
18.2
17.7
21.4
Less
: F
ISIM
15
47
19
38
53
11
31
20.0
104.
923
.149
.224
.630
.342
.2
Gro
ss V
alue
Add
ed a
t Cur
rent
Bas
ic P
rices
24
24
31
45
37
12
36
45.2
15.3
22.4
22.4
18.2
17.6
21.2
Taxe
s on
Pro
duct
s13
15
26
38
14
48
39
44
.324
.121
.922
.112
.812
.96.
9
GD
P at
Cur
rent
Mar
ket P
rices
23
24
31
44
35
14
36
45.1
16.0
22.4
22.4
17.7
16.9
20.2
Sour
ce: M
oFED

First Quarter 2018/1978
National Bank of Ethiopia Quarterly Bulletin
annex 20: Value of aggregate output, Consumption, investment and Savings at Current prices
(In Millions of Birr)
Description / Year
1997 1998 1999 2000 2001 2002 2003 2004 2005 2006 2007 2008 2009 2010
2004/05 2005/06 2006/07 2007/08 2008 /09 2009 /10 2010 /11 2011 /12 2012/13 2013/14 2014/15 2015/16 2016/17 2017/18
Gross Value Added at Current Basic Prices
96,391.0
119,934.0
157,170.0
227,703.0
311,073.0
348,686.0
475,647.5
690,444.5
796,303.1
974,727.0
1,192,833.0
1,449,397.0
1,703,798.0
2,064,789.0
Taxes on Products, net
8,467.0
9,698.0
12,186.0
16,785.0
19,139.0
28,412.0
39,431.0
56,882.0
70,618.0
86,098.0
105,129.0
118,700.0
128,755.0
137,583.0
GDP at Current Market Prices
105,415.0
130,334.0
170,281.0
245,836.0
332,060.0
379,135.0
515,078.5
747,326.5
866,921.1
1,060,825.0
1,297,962.0
1,568,097.0
1,832,554.0
2,202,373.0
Incomes from ROW, net
180.1
399.4
696.7
723.7
(57.1)
(614.6)
(1,120.2)
(1,659.8)
(1,942.8)
(2,914.6)
(5,275.1)
(5,122.0)
(10,884.1)
(14,349.1)
Gross National Income at Current Basic Prices
96,498.0
119,925.0
157,434.0
228,020.0
310,714.0
347,973.0
474,527.4
688,784.7
794,360.3
971,813.0
1,187,558.0
1,444,275.0
1,692,914.1
2,050,440.2
Gross National Income at Current Market Prices
105,522.0
130,324.0
170,544.0
246,152.0
331,731.0
378,422.0
513,958.4
745,666.7
864,978.3
1,057,911.0
1,292,686.0
1,562,975.0
1,821,669.6
2,188,023.6
Current Transfers from ROW, net
15,334.7
18,162.9
25,444.4
34,194.0
44,191.0
59,485.0
74,261.2
86,849.9
93,355.1
106,357.3
128,401.0
155,964.0
154,959.0
188,527.0
Gross National Disposable Income
120,857.0
148,487.0
195,989.0
280,346.0
375,922.0
437,907.0
588,219.5
832,516.6
958,333.4
1,164,268.0
1,421,087.0
1,718,939.0
1,976,629.0
2,376,551.0
Government Final Consumption Expenditure
13,971.0
17,016.0
19,123.0
25,782.0
31,544.0
34,801.0
53,147.1
62,044.5
77,636.9
98,121.0
116,995.0
174,599.0
203,608.0
225,523.0
Private Final Consumption Expenditure
81,445.0
102,537.0
130,118.0
197,461.0
268,002.0
309,132.0
373,088.5
541,536.3
636,901.3
744,978.0
896,208.0
1,042,265.0
1,219,366.0
1,441,581.0
Gross Capital Formation (Investment)
27,409.0
35,952.0
41,227.0
60,156.0
82,560.0
102,403.0
165,379.7
277,243.0
295,456.4
402,922.0
511,618.0
585,665.0
704,596.0
751,626.0
Exports of Goods and Services
16,076.9
18,205.4
21,854.2
28,317.0
35,233.0
52,168.0
85,950.4
102,886.6
108,227.1
123,496.0
121,532.2
122,501.0
139,830.0
184,282.0
Imports of Goods and Services
37,776.3
48,092.4
55,088.7
76,564.0
96,285.0
126,319.0
162,487.1
236,383.9
251,300.6
308,691.3
393,189.0
424,750.0
430,233.0
502,113.0
Resource Balance
(21,699.4)
(29,887.0)
(33,234.4)
(48,247.0)
(61,052.0)
(74,151.0)
(76,536.7)
(133,497.3)
(143,073.5)
(185,195.3)
(271,656.0)
(302,249.0)
(290,403.0)
(317,831.0)
Gross Domestic Savings
9,999.0
10,781.0
21,040.0
22,593.0
32,514.0
35,202.0
88,843.0
143,745.7
152,382.9
217,726.0
284,759.0
351,233.0
409,580.0
535,269.0
Gross National Savings
25,441.0
28,934.0
46,748.0
57,103.0
76,376.0
93,973.0
161,984.0
228,935.8
243,795.2
321,169.0
407,884.0
502,076.0
553,655.0
709,447.0
Mid-year Population (In Million)
68.3
70.0
72.4
74.9
76.8
78.8
80.7
82.7
84.8
87.0 89.1
91.2 93.4 95.5
Per Capita Nominal GDP (In Birr)
1,475.0
1,783.0
2,302.0
3,282.0
4,318.0
4,803.0
6,384.1
9,031.8
10,218.7
12,200.3
14,571.0
17,192.0
19,630.0
23,061.0
Per Capita Real GDP (In Birr)
3,636.2
3,957.3
4,277.4
4,597.2
4,933.7
5,316.6
6,384.1
6,763.3
7,294.5
7,847.6
8,455.8
17,192.0
18,345.8
19,217.5
Average Exchange Rate (Birr/USD)
8.7
8.7
8.8
9.2
10.4
12.9
16.1
17.2
18.3
19.1 20.1
21.1 22.4 26.1
Real GDP (In USD)
11,201.2
12,390.0
13,108.2
15,279.6
16,665.6
18,754.4
29,543.3
30,007.3
31,095.9
32,877.7
34,438.9
74,297.0
76,411.2
70,296.7
Nominal GDP (In USD)(Million)
12,184.2
15,013.7
19,362.7
26,605.6
31,867.6
29,413.1
29,543.3
40,072.2
43,561.4
51,113.1
59,344.9
74,297.0
81,760.0
84,356.0
Per Capita Nominal GDP (In USD)
171.0
205.0
262.0
355.0
414.0
373.0
396.1
523.5
559.1
639.6
725.0
815.0
876.0
883.0
Per Capita Real GDP (In USD)
164.0
177.0
181.1
204.0
217.0
238.0
396.1
392.0
399.1
411.4
420.7
815.0
818.7
735.8
GDP Deflator 38.8
43.3
50.8
66.2
82.2
83.3
100.0
133.5
140.1
155.5
172.3
100.0
107.0
120.0
Source: MoFED

First Quarter 2018/19 79
National Bank of Ethiopia Quarterly Bulletin
annex 21: Growth Rates of aggregate output, Consumption, investment and Savings
Source: MOFED
Description / Year
1997 1998 1999 2000 2001 2002 2003 2004 2005 2006 2007 2008 2009 2010
2004/05 2005/06 2006/07 2007/08 2008 /09 2009 /10 2010/11 2011 /12 2012/13 2013/14 2014/15 2015/16 2016/17 2017/18
GDP at Current Basic Prices 23.8 24.4 31.0 44.9 36.6 12.1 36.4 45.2 15.3 22.4 22.4 18.2 17.9 21.2
Taxes on Products, net 13.3 14.5 25.7 37.7 14.0 48.5 38.8 44.3 24.1 21.9 22.1 12.8 8.5 6.9
GDP at Current Market Prices 22.9 23.6 30.6 44.4 35.1 14.2 35.9 45.1 16.0 22.4 22.4 17.7 16.9 20.2
Incomes from ROW, net -132.1 121.7 74.4 3.9 -107.9 976.5 82.3 -48.2 -17.1 -50.0 -81.0 -1.5 -112.5 -31.8
Gross National Income at Current Basic Price 24.4 24.3 31.3 44.8 36.3 12.0 36.4 45.2 15.3 22.3 22.2 18.2 17.2 21.1
Gross National Income at Current Market Price 23.5 23.5 30.9 44.3 34.8 14.1 35.8 45.1 16.0 22.3 22.2 17.8 16.6 20.1
Current Transfers from ROW, net 62.5 18.4 40.1 34.4 29.2 34.6 24.8 17.0 7.5 13.9 20.7 23.4 -0.6 21.7
Gross National Disposable Income 27.4 22.9 32.0 43.0 34.1 16.5 34.3 41.5 15.1 21.5 22.1 18.3 15.0 20.2
Government Final Consumption Expenditure 16.7 21.8 12.4 34.8 22.3 10.3 52.7 16.7 25.1 26.4 19.2 27.2 16.6 10.8
Private Final Consumption Expenditure 33.8 26.9 51.8 35.7 15.3 20.7 45.1 17.6 17.0 20.3 15.7 17.0 18.2
Gross Capital Formation (Investment) 10.1 31.2 14.7 45.9 37.2 24.0 61.5 67.6 6.6 36.4 27.0 15.1 20.3 6.7
Exports of Goods and Services 24.5 13.2 20.0 29.6 24.4 48.1 64.8 19.7 5.2 14.1 -1.6 0.7 14.1 31.8
Imports of Goods and Services 38.0 27.3 14.5 39.0 25.8 31.2 28.6 45.5 6.3 22.8 27.4 8.0 1.3 16.7
Resource Balance 50.1 37.7 11.2 45.2 26.5 21.5 3.2 -74.4 -7.2 -29.4 -46.7 -11.2 3.9 -9.4
Gross Domestic Savings -22.9 7.8 95.2 7.4 43.9 8.3 152.4 61.8 6.0 43.0 30.8 20.1 16.6 30.7
Gross National Savings 15.3 13.7 61.6 22.2 33.8 23.0 72.4 41.3 6.5 31.8 27.0 21.4 16.9 28.1
Mid-year Population (in Million) 2.7 2.5 3.4 3.5 2.5 2.6 2.4 2.5 2.5 2.6 2.4 2.4 2.4 2.2
Per Capita GDP (Birr) (Nominal) 20.1 20.9 29.1 42.6 31.6 11.2 32.9 41.5 13.1 19.4 19.4 15.0 14.2 17.5
Per Capita GDP (Birr) (Real) 9.7 8.8 8.1 7.5 7.3 7.8 10.9 5.9 7.9 7.6 7.7 4.8 6.7 4.8
Average Exchange Rate (Birr/USD) 0.3 0.3 1.3 5.1 12.8 23.7 24.9 7.0 6.1 4.3 5.4 5.0 6.2 16.5
Real GDP (USD) 12.3 10.6 5.8 16.6 9.1 12.5 57.6 1.6 3.6 5.7 4.7 2.8 2.8 -8.0
GDP at Current Market Prices(USD) 22.6 23.2 29.0 37.4 19.8 -7.7 8.6 35.6 9.5 17.3 16.1 12.1 10.0 3.2
Per Capita GDP (USD) (Nominal) 20.4 19.9 27.8 35.5 16.6 -9.9 6.2 32.2 6.8 14.4 13.4 9.5 7.8 0.8
Per Capita GDP (USD) (Real) 9.3 7.9 2.3 12.7 6.4 9.7 53.8 -1.0 1.8 3.1 2.3 -0.1 0.5 -10.1
Percentage Change in GDP Deflator 9.9 11.6 17.3 30.4 24.3 1.3 20.1 33.5 4.9 11.0 6.4 0.0 6.3 12.5

First Quarter 2018/1980
National Bank of Ethiopia Quarterly Bulletin
Table 22(A): National Non-Food Consumer Price Index, December 2011=100
period General index
food and Non-alcoholic
Beverages
alcoholic Beverages
and tobacco
Clothing & foot-wear
housing, Water,
Electricity, Gas and
other fuels
furnishings, household Equipment
and Routine Maintenance of the house
health transport Communication Recreation and Culture Education Restaurants
and hotelsMiscellaneous
GoodsNon-food
index
2007/08Q.I 41.5 39.7 39.2 33.5 47.6 38.1 57.9 49.7 49.7 46.5 46.5 41.5 43.2 43.3Q.II 43.1 42.0 39.5 34.7 48.5 40.0 58.6 49.7 49.7 47.7 47.7 41.6 43.8 44.2Q.III 46.4 46.0 42.9 36.3 51.6 43.9 60.4 53.4 53.4 49.2 49.2 43.9 45.7 46.9Q.IV 54.2 57.5 47.0 38.5 56.6 47.8 63.2 55.5 55.5 50.6 50.6 47.8 48.6 50.7
2008/09Q.I 64.4 73.7 57.2 41.4 60.4 51.1 65.8 55.6 55.6 53.5 53.5 52.6 51.6 54.5Q.II 62.3 67.5 58.8 44.5 62.4 53.0 67.3 58.9 58.9 55.8 55.8 54.8 52.4 56.7Q.III 60.2 62.6 61.7 47.4 62.3 54.9 68.9 53.4 53.4 57.4 57.4 56.7 54.0 57.5Q.IV 61.4 63.2 63.7 49.9 63.9 57.2 72.9 55.2 55.2 59.9 59.9 58.3 57.2 59.6
2009/10Q.I 63.6 64.2 65.2 52.9 67.8 60.1 75.4 61.3 61.3 63.1 63.1 60.9 60.6 63.0Q.II 64.5 62.8 66.1 55.8 71.7 62.7 77.9 66.2 66.2 64.6 64.6 63.7 63.4 66.2Q.III 65.8 62.7 68.5 59.7 74.3 66.4 82.4 68.2 68.2 66.4 66.4 65.3 65.9 69.0Q.IV 67.0 63.0 71.7 62.1 76.4 69.1 84.8 70.8 70.8 68.3 68.3 67.1 67.3 71.2
2010/11Q.I 68.5 63.9 72.61864193 65.0 78.8 71.6 84.9 71.0 71.0 71.6 71.6 68.5 69.1 73.3Q.II 72.8 67.0 80.1 70.4 84.1 77.7 89.0 77.5 77.5 82.4 82.4 73.3 75.6 79.0Q.III 79.0 73.5 83.2 77.5 91.0 81.5 91.3 88.5 88.5 84.7 84.7 75.9 80.7 84.9Q.IV 89.0 87.9 91.6 83.4 94.5 86.7 93.9 100.7 100.7 87.1 87.1 84.4 84.6 90.2
2011/12Q.I 94.6 95.6 98.2 87.2 95.6 92.1 96.1 101.0 101.0 92.5 92.5 91.7 90.8 93.5Q.II 98.8 100.2 99.5 95.0 97.6 97.1 98.6 98.4 98.4 97.8 97.8 97.3 97.5 97.3Q.III 105.1 106.4 105.8 103.6 104.3 103.8 100.9 100.5 100.0 101.6 100.0 102.9 102.6 103.6Q.IV 111.3 115.4 104.7 109.1 106.8 108.5 102.8 101.1 100.0 103.6 103.1 108.9 105.0 106.6
2012/13Q.I 114.8 118.9 103.9 112.5 113.2 110.8 105.3 100.7 100.0 106.7 101.9 114.5 108.2 110.3Q.II 115.7 116.8 108.8 113.4 117.9 116.6 124.8 102.2 100.1 107.0 101.9 119.0 110.5 114.4Q.III 116.0 116.0 113.3 116.6 118.0 118.3 126.1 99.1 100.0 106.7 103.3 121.9 113.8 115.9Q.IV 118.5 118.7 113.1 119.9 120.5 122.2 130.0 98.5 100.0 108.2 105.0 126.0 115.3 118.3
2013/14Q.I 123.5 124.4 115.0 124.4 126.2 124.2 127.8 98.1 100.0 118.3 105.0 131.5 122.4 122.4Q.II 125.0 124.8 123.0 127.8 128.2 126.4 137.9 100.2 100.0 121.7 105.0 134.9 119.0 125.3Q.III 125.5 122.1 131.0 130.3 133.7 130.7 142.3 102.1 100.0 119.6 105.0 136.1 119.2 129.2Q.IV 129.0 126.9 131.3 132.9 136.9 133.1 147.0 102.9 100.0 115.9 105.2 138.7 119.4 131.4
2014/15Q.I 131.4 130.4 135.9 135.6 137.0 134.3 146.3 102.7 100.2 117.4 106.2 139.0 120.6 132.5Q.II 132.7 130.6 137.9 140.3 139.7 136.5 148.7 103.0 100.0 119.0 105.4 141.2 122.4 135.0Q.III 135.7 133.1 148.6 144.1 143.7 139.2 153.9 99.9 100.5 119.7 105.5 144.0 124.1 138.7Q.IV 141.6 141.1 154.0 145.4 149.3 142.1 152.8 98.3 102.1 120.4 105.6 147.6 125.6 142.1
2015/16Q.I 147.1 149.9 149.7 148.2 151.0 144.6 155.4 100.1 104.8 128.4 110.7 152.0 126.8 143.9Q.II 146.8 148.0 151.3 149.1 151.1 147.4 163.1 101.9 102.2 135.4 120.8 157.0 127.9 145.6Q.III 147.8 145.8 162.1 150.7 157.0 152.1 166.4 100.8 101.2 139.8 120.9 160.1 129.1 150.0Q.IV 152.4 151.3 151.9 152.2 167.1 153.6 172.8 100.6 102.4 141.7 121.0 164.1 130.9 153.5
2016/17QI 156.3 157.2 146.3 152.3 172.1 154.9 168.2 101.7 100.5 143.9 121.1 168.7 131.8 155.4QII 156.3 155.2 155.6 152.8 172.5 157.2 175.3 103.0 100.8 151.0 121.1 171.3 132.4 157.5QIII 158.4 156.7 166.8 156.0 173.8 159.2 181.6 107.6 102.2 152.9 121.1 170.8 136.1 160.4QIV 165.6 170.0 152.8 156.6 174.0 167.3 181.3 113.8 109.4 157.6 121.2 176.9 139.2 161.5
2017/18QI 172.3 177.6 173.5 160.0 176.4 171.5 172.0 116.4 108.9 160.2 121.2 185.1 140.1 166.3QII 176.8 181.9 180.7 164.8 180.3 177.8 179.8 119.5 109.2 160.7 121.2 191.0 144.4 171.1QIII 181.9 187.5 189.9 172.5 180.2 187.5 187.5 117.4 109.4 165.2 121.2 199.2 150.3 175.6QIV 189.2 197.6 181.5 180.8 182.4 198.9 191.0 122.2 109.8 169.9 121.2 207.4 157.9 179.8
2018/19QI 194.9 204.9 187.5 185.7 183.5 208.6 198.4 121.3 110.0 174.5 121.147583 214.8 162.2 183.8

First Quarter 2018/19 81
National Bank of Ethiopia Quarterly Bulletin
table 22 (B): National food Consumer price index, December 2011=100
peri
od
food
& N
on-a
lcoh
olic
Be
vera
ges
Brea
d an
d Ce
real
s
Mea
t
Milk
, Che
ese
& E
gg
oils
& f
ats
fru
its
Vege
tabl
es
Suga
r, ja
m, h
oney
, ch
ocol
ate
and
conf
ecti
oner
y
food
pro
duct
s
Non
-alc
ohol
ic B
ever
ages
2007/08
Q.I 39.7 38.3 42.9 39.0 40.1 37.3 37.3 40.8 74.8 26.6
Q.II 42.0 41.0 43.9 40.3 44.6 40.9 40.9 39.8 77.4 28.4
Q.III 46.0 45.5 46.7 44.3 49.9 47.9 47.9 44.6 75.3 29.9
Q.IV 57.5 60.5 51.5 50.2 56.5 58.5 58.5 49.8 87.0 32.1
2008/09
Q.I 73.7 85.6 56.6 55.3 56.3 70.2 70.2 60.5 98.1 32.8
Q.II 67.5 80.6 57.1 57.1 53.9 65.2 65.2 64.1 75.8 33.0
Q.III 62.6 74.0 57.0 59.5 51.1 66.3 66.3 73.8 49.4 33.9
Q.IV 63.2 73.5 59.8 63.7 51.9 70.1 70.1 76.9 39.1 35.0
2009/10
Q.I 64.2 75.7 61.2 65.5 51.5 66.2 66.2 78.3 40.8 38.0
Q.II 62.8 73.1 61.4 66.8 51.3 64.8 64.8 80.0 46.3 41.8
QIII 62.7 71.7 63.2 69.5 52.0 65.8 65.8 84.1 52.8 42.6
QIV 63.0 70.1 65.6 70.2 54.9 65.2 65.2 86.3 69.9 42.3
2010/11
QI 63.9 69.0 67.9 73.2 58.5 68.0 68.0 85.7 79.4 47.3
Q.II 67.0 68.2 68.7 78.3 70.5 75.3 75.3 90.0 71.6 57.6
Q.III 73.5 71.5 63.0 85.5 77.5 85.0 85.0 87.5 74.6 77.3
Q.IV 87.9 83.1 71.0 91.8 105.7 93.4 93.4 91.6 107.5 90.9
2011/12
Q.I 95.6 92.3 88.8 95.7 106.0 90.9 90.9 93.5 122.5 91.9
Q.II 100.2 98.4 96.5 98.5 101.1 97.6 97.6 97.8 122.8 97.2
Q.III 106.4 104.3 107.9 110.0 104.6 104.1 111.8 101.0 107.4 97.9
Q.IV 115.4 113.8 127.9 119.8 112.9 105.0 122.9 104.3 116.9 90.3
2012/13
Q.I 118.9 121.0 137.3 120.8 109.0 117.4 123.6 105.3 120.1 88.2
Q.II 116.8 118.8 138.4 126.0 105.7 132.7 120.3 107.3 116.6 84.7
Q.III 116.0 116.4 142.5 131.6 106.3 128.6 120.3 111.3 113.9 80.2
Q.IV 118.7 121.4 145.7 132.9 109.7 123.1 121.3 111.8 117.5 78.7
2013/14
Q.I 124.4 130.5 151.0 136.2 108.5 121.3 127.8 113.5 120.0 79.4
Q.II 124.8 134.1 153.5 138.2 108.0 124.8 123.3 112.7 121.0 79.0
Q.III 122.1 120.0 155.3 143.4 111.1 127.8 130.6 111.6 119.0 79.1
Q.IV 126.9 125.3 159.2 145.5 116.1 124.1 130.1 113.2 129.4 94.3
2014/15
Q.I 130.4 130.7 161.1 150.4 123.9 129.6 127.5 112.8 140.1 99.3
Q.II 130.6 126.1 161.2 152.4 127.2 133.7 133.7 115.2 135.5 101.7
Q.III 133.1 121.6 164.8 160.9 134.2 143.7 144.5 114.7 142.2 95.9
Q.IV 141.1 126.0 171.3 175.4 144.4 141.3 153.6 116.8 172.4 91.1
2015/16
Q.I 149.9 133.0 179.7 176.6 146.6 148.4 157.3 116.5 226.6 87.2
QII 148.0 132.7 182.0 180.8 141.8 160.0 157.2 117.5 208.0 85.1
QIII 145.8 135.1 183.5 189.9 137.6 165.2 157.2 124.7 174.3 81.1
QIV 151.3 138.5 190.6 196.2 142.0 160.7 167.8 128.1 175.3 84.1
2016/17
Q.I 157.2 145.3 199.1 195.1 142.4 165.1 174.1 132.3 180.2 92.3
Q.II 155.2 144.8 198.9 197.7 141.4 166.6 162.9 144.4 181.9 99.3
Q.III 156.7 141.6 200.9 203.6 147.4 173.0 170.2 144.9 181.4 98.2
Q.IV 170.0 157.4 217.0 215.3 155.2 180.8 186.1 141.7 198.5 96.7
2017/18
QI 177.6 175.2 226.9 214.7 152.7 201.4 183.1 142.8 209.9 101.8
QII 181.9 179.1 233.1 220.7 149.9 214.6 189.8 142.2 209.4 109.2
QIII 187.5 174.4 241.6 230.9 153.2 225.1 204.8 141.9 236.6 105.1
QIV 197.7 188.9 266.6 247.5 161.9 226.4 205.4 142.8 249.0 110.22018/19
QI 204.9 198.5 275.9 257.0 161.8 225.8 210.1 145.4 257.7 118.0
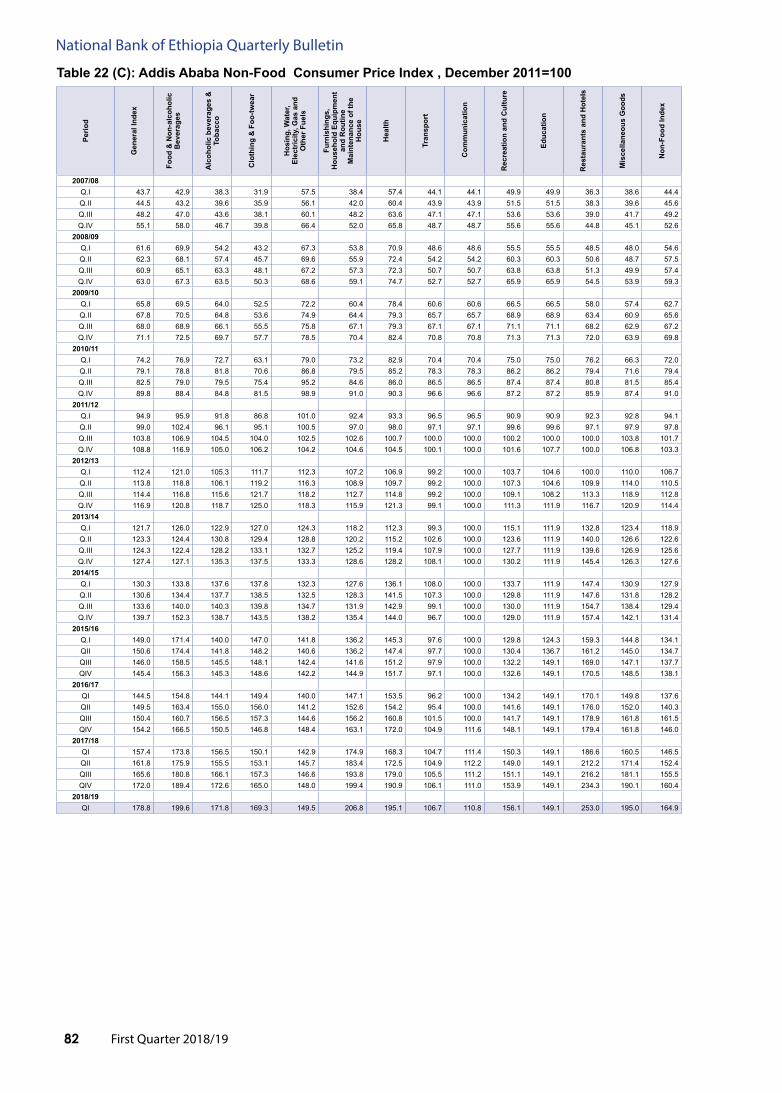
First Quarter 2018/1982
National Bank of Ethiopia Quarterly Bulletin
Table 22 (C): Addis Ababa Non-Food Consumer Price Index , December 2011=100Pe
riod
Gen
eral
Inde
x
Food
& N
on-a
lcoh
olic
B
ever
ages
Alc
ohol
ic b
ever
ages
&
Toba
cco
Clo
thin
g &
Foo
-twea
r
Hos
ing,
Wat
er,
Elec
tric
ity, G
as a
nd
Oth
er F
uels
Furn
ishi
ngs,
H
ouse
hold
Equ
ipm
ent
and
Rou
tine
Mai
nten
ance
of t
he
Hou
se
Hea
lth
Tran
spor
t
Com
mun
icat
ion
Rec
reat
ion
and
Cul
ture
Educ
atio
n
Res
taur
ants
and
Hot
els
Mis
cella
neou
s G
oods
Non
-Foo
d In
dex
2007/08 Q.I 43.7 42.9 38.3 31.9 57.5 38.4 57.4 44.1 44.1 49.9 49.9 36.3 38.6 44.4Q.II 44.5 43.2 39.6 35.9 56.1 42.0 60.4 43.9 43.9 51.5 51.5 38.3 39.6 45.6Q.III 48.2 47.0 43.6 38.1 60.1 48.2 63.6 47.1 47.1 53.6 53.6 39.0 41.7 49.2Q.IV 55.1 58.0 46.7 39.8 66.4 52.0 65.8 48.7 48.7 55.6 55.6 44.8 45.1 52.6
2008/09 Q.I 61.6 69.9 54.2 43.2 67.3 53.8 70.9 48.6 48.6 55.5 55.5 48.5 48.0 54.6Q.II 62.3 68.1 57.4 45.7 69.6 55.9 72.4 54.2 54.2 60.3 60.3 50.6 48.7 57.5Q.III 60.9 65.1 63.3 48.1 67.2 57.3 72.3 50.7 50.7 63.8 63.8 51.3 49.9 57.4Q.IV 63.0 67.3 63.5 50.3 68.6 59.1 74.7 52.7 52.7 65.9 65.9 54.5 53.9 59.3
2009/10 Q.I 65.8 69.5 64.0 52.5 72.2 60.4 78.4 60.6 60.6 66.5 66.5 58.0 57.4 62.7Q.II 67.8 70.5 64.8 53.6 74.9 64.4 79.3 65.7 65.7 68.9 68.9 63.4 60.9 65.6Q.III 68.0 68.9 66.1 55.5 75.8 67.1 79.3 67.1 67.1 71.1 71.1 68.2 62.9 67.2Q.IV 71.1 72.5 69.7 57.7 78.5 70.4 82.4 70.8 70.8 71.3 71.3 72.0 63.9 69.8
2010/11 Q.I 74.2 76.9 72.7 63.1 79.0 73.2 82.9 70.4 70.4 75.0 75.0 76.2 66.3 72.0Q.II 79.1 78.8 81.8 70.6 86.8 79.5 85.2 78.3 78.3 86.2 86.2 79.4 71.6 79.4Q.III 82.5 79.0 79.5 75.4 95.2 84.6 86.0 86.5 86.5 87.4 87.4 80.8 81.5 85.4Q.IV 89.8 88.4 84.8 81.5 98.9 91.0 90.3 96.6 96.6 87.2 87.2 85.9 87.4 91.0
2011/12 Q.I 94.9 95.9 91.8 86.8 101.0 92.4 93.3 96.5 96.5 90.9 90.9 92.3 92.8 94.1Q.II 99.0 102.4 96.1 95.1 100.5 97.0 98.0 97.1 97.1 99.6 99.6 97.1 97.9 97.8Q.III 103.8 106.9 104.5 104.0 102.5 102.6 100.7 100.0 100.0 100.2 100.0 100.0 103.8 101.7Q.IV 108.8 116.9 105.0 106.2 104.2 104.6 104.5 100.1 100.0 101.6 107.7 100.0 106.8 103.3
2012/13 Q.I 112.4 121.0 105.3 111.7 112.3 107.2 106.9 99.2 100.0 103.7 104.6 100.0 110.0 106.7Q.II 113.8 118.8 106.1 119.2 116.3 108.9 109.7 99.2 100.0 107.3 104.6 109.9 114.0 110.5Q.III 114.4 116.8 115.6 121.7 118.2 112.7 114.8 99.2 100.0 109.1 108.2 113.3 118.9 112.8Q.IV 116.9 120.8 118.7 125.0 118.3 115.9 121.3 99.1 100.0 111.3 111.9 116.7 120.9 114.4
2013/14 Q.I 121.7 126.0 122.9 127.0 124.3 118.2 112.3 99.3 100.0 115.1 111.9 132.8 123.4 118.9Q.II 123.3 124.4 130.8 129.4 128.8 120.2 115.2 102.6 100.0 123.6 111.9 140.0 126.6 122.6Q.III 124.3 122.4 128.2 133.1 132.7 125.2 119.4 107.9 100.0 127.7 111.9 139.6 126.9 125.6Q.IV 127.4 127.1 135.3 137.5 133.3 128.6 128.2 108.1 100.0 130.2 111.9 145.4 126.3 127.6
2014/15 Q.I 130.3 133.8 137.6 137.8 132.3 127.6 136.1 108.0 100.0 133.7 111.9 147.4 130.9 127.9Q.II 130.6 134.4 137.7 138.5 132.5 128.3 141.5 107.3 100.0 129.8 111.9 147.6 131.8 128.2Q.III 133.6 140.0 140.3 139.8 134.7 131.9 142.9 99.1 100.0 130.0 111.9 154.7 138.4 129.4Q.IV 139.7 152.3 138.7 143.5 138.2 135.4 144.0 96.7 100.0 129.0 111.9 157.4 142.1 131.4
2015/16 Q.I 149.0 171.4 140.0 147.0 141.8 136.2 145.3 97.6 100.0 129.8 124.3 159.3 144.8 134.1QII 150.6 174.4 141.8 148.2 140.6 136.2 147.4 97.7 100.0 130.4 136.7 161.2 145.0 134.7QIII 146.0 158.5 145.5 148.1 142.4 141.6 151.2 97.9 100.0 132.2 149.1 169.0 147.1 137.7QIV 145.4 156.3 145.3 148.6 142.2 144.9 151.7 97.1 100.0 132.6 149.1 170.5 148.5 138.1
2016/17 QI 144.5 154.8 144.1 149.4 140.0 147.1 153.5 96.2 100.0 134.2 149.1 170.1 149.8 137.6QII 149.5 163.4 155.0 156.0 141.2 152.6 154.2 95.4 100.0 141.6 149.1 176.0 152.0 140.3QIII 150.4 160.7 156.5 157.3 144.6 156.2 160.8 101.5 100.0 141.7 149.1 178.9 161.8 161.5QIV 154.2 166.5 150.5 146.8 148.4 163.1 172.0 104.9 111.6 148.1 149.1 179.4 161.8 146.0
2017/18 QI 157.4 173.8 156.5 150.1 142.9 174.9 168.3 104.7 111.4 150.3 149.1 186.6 160.5 146.5QII 161.8 175.9 155.5 153.1 145.7 183.4 172.5 104.9 112.2 149.0 149.1 212.2 171.4 152.4QIII 165.6 180.8 166.1 157.3 146.6 193.8 179.0 105.5 111.2 151.1 149.1 216.2 181.1 155.5QIV 172.0 189.4 172.6 165.0 148.0 199.4 190.9 106.1 111.0 153.9 149.1 234.3 190.1 160.4
2018/19 QI 178.8 199.6 171.8 169.3 149.5 206.8 195.1 106.7 110.8 156.1 149.1 253.0 195.0 164.9

First Quarter 2018/19 83
National Bank of Ethiopia Quarterly Bulletin
Table 22(D): Addis Ababa Food Consumer Price Index , December 2011=100
December 2011 = 100
peri
od
food
& N
on-a
lcoh
olic
Be
vera
ges
Brea
d an
d Ce
real
s
Mea
t
Milk
, Che
ese
& E
gg
oils
& f
ats
fru
its
Vege
tabl
es
Suga
r, ja
m, h
oney
, ch
ocol
ate
and
conf
ecti
oner
y
food
pro
duct
s
Non
-alc
ohol
ic B
ever
ages
2007/08 47.8 50.1 45.3 42.0 47.2 53.0 53.0 48.9 85.7 28.0
Q.I 42.9 42.7 42.7 39.3 40.1 39.5 39.5 46.5 90.3 24.8
Q.II 43.2 43.7 43.3 39.9 43.2 44.6 44.6 44.5 78.9 27.6
Q.III 47.0 48.1 44.4 41.6 48.0 60.7 60.7 51.3 79.3 29.2
Q.IV 58.0 65.8 50.8 47.1 57.7 67.0 67.0 53.3 94.4 30.6
2008/09 67.6 84.0 58.6 59.1 54.0 73.3 73.3 73.8 67.5 29.9
Q.I 69.9 84.6 58.4 56.0 56.3 70.7 70.7 65.3 100.8 30.4
Q.II 68.1 85.8 58.9 58.8 53.8 67.2 67.2 64.8 76.9 29.8
Q.III 65.1 82.1 57.2 59.2 51.1 73.5 73.5 79.6 51.8 29.6
Q.IV 67.3 83.6 59.9 62.4 55.0 81.8 81.8 85.6 40.4 29.8
2009/10 70.4 84.8 64.5 68.6 54.8 71.4 71.4 93.2 58.7 39.6
Q.I 69.5 87.4 62.8 68.7 54.5 71.2 71.2 87.4 42.1 36.3
Q.II 70.5 86.9 62.8 68.1 54.1 68.8 68.8 95.8 57.0 41.5
Q.III 68.9 81.9 63.7 67.5 54.9 69.6 69.6 94.0 56.9 41.0
QIV 72.5 82.8 68.7 70.2 55.8 76.1 76.1 95.4 78.8 39.6
2010/11 80.8 83.4 72.9 75.9 76.5 98.1 98.1 99.2 86.3 64.9
Q.I 76.9 82.3 71.8 72.4 59.1 90.7 90.7 101.6 88.5 44.1
Q.II 78.8 82.2 72.8 74.3 69.8 95.6 95.6 106.1 69.9 56.3
Q.III 79.0 80.2 72.4 77.0 74.6 101.5 101.5 93.6 76.1 72.5
Q.IV 88.4 89.0 74.7 80.2 102.3 104.4 104.4 95.6 110.6 86.7
2011/12 105.5 103.6 104.9 100.2 105.2 100.9 106.2 98.2 121.1 96.0
Q.I 95.9 94.5 88.3 88.2 106.0 91.0 91.0 96.1 129.2 90.0
Q.II 102.4 99.5 97.5 97.7 101.9 96.5 96.5 97.6 120.4 98.1
Q.III 106.9 104.1 106.1 105.0 103.8 106.6 114.0 98.9 115.3 99.6
Q.IV 116.9 116.4 127.7 109.9 109.1 109.5 123.4 100.2 119.7 96.2
2012/13 119.3 128.1 133.8 127.0 108.7 130.1 119.9 100.1 97.2 89.8
Q.I 121.0 125.5 132.0 119.2 107.1 120.8 129.4 100.2 111.5 93.9
Q.II 118.8 129.6 128.5 126.5 106.7 123.0 120.3 100.1 96.4 91.7
Q.III 116.8 127.5 136.3 130.5 108.7 135.4 107.7 100.1 91.8 88.5
Q.IV 120.8 129.6 138.2 131.8 112.2 141.3 122.2 100.2 89.2 84.8
2013/14 125.0 131.6 144.2 135.8 112.6 141.6 127.2 102.0 102.7 90.6
Q.I 126.0 133.7 140.8 135.0 112.2 140.6 136.3 100.2 96.0 86.6
Q.II 124.4 137.9 140.7 135.4 111.6 133.8 119.8 100.3 102.1 87.4
Q.III 122.4 126.8 144.3 134.6 111.7 145.3 126.9 100.6 92.4 89.1
Q.IV 127.1 128.2 151.0 138.0 114.9 146.8 125.9 106.7 120.3 99.4
2014/15 140.1 132.6 151.6 152.5 135.2 156.9 147.6 106.3 170.1 103.4
Q.I 133.8 133.6 151.5 142.5 122.4 141.9 129.9 106.6 160.8 101.1
Q.II 134.4 133.9 146.2 149.1 129.2 141.6 140.5 106.7 130.8 105.4
Q.III 140.0 129.7 151.3 151.9 137.5 173.6 155.8 104.8 152.2 105.1
Q.IV 152.3 133.4 157.5 166.5 151.9 170.6 164.1 107.3 236.8 101.8
2015/16 165.2 140.1 178.0 179.2 147.6 174.9 177.9 109.5 305.0 96.7
Q.I 171.4 137.1 174.6 177.4 152.1 171.5 178.4 107.8 399.1 98.2
Q.II 174.4 137.7 179.2 179.8 151.9 169.1 183.9 108.0 410.7 97.8
QIII 158.5 142.9 179.2 179.9 145.2 176.0 176.0 108.0 212.4 96.1
QIV 156.3 142.5 178.9 180.0 141.0 183.1 173.3 114.3 197.6 94.8
2016/17 161.4 158.9 186.3 187.9 141.2 188.7 184.6 125.9 136.1 103.8
QI 154.8 144.4 178.2 179.9 136.9 191.3 171.8 121.3 178.4 95.3
QII 163.4 166.2 187.6 187.6 140.4 163.0 181.7 124.5 140.9 108.0
QIII 160.7 159.8 181.7 192.3 141.5 194.5 187.6 129.2 117.5 108.0
QIV 166.5 165.3 197.7 192.0 146.1 205.9 197.3 128.5 107.5 104.0
2017/18
QI 173.8 179.9 212.9 197.6 150.7 231.7 192.0 129.5 107.6 111.6
QII 175.9 185.2 213.5 198.9 150.1 217.3 185.2 129.5 128.6 117.7
QIII 180.8 182.1 217.8 207.5 150.2 241.8 184.8 129.8 193.0 116.8
QIV 189.4 191.6 234.6 225.0 161.9 242.1 187.0 130.1 198.9 117.52018/19
QI 199.6 203.3 241.5 231.2 164.4 229.0 210.7 130.2 200.7 121.1
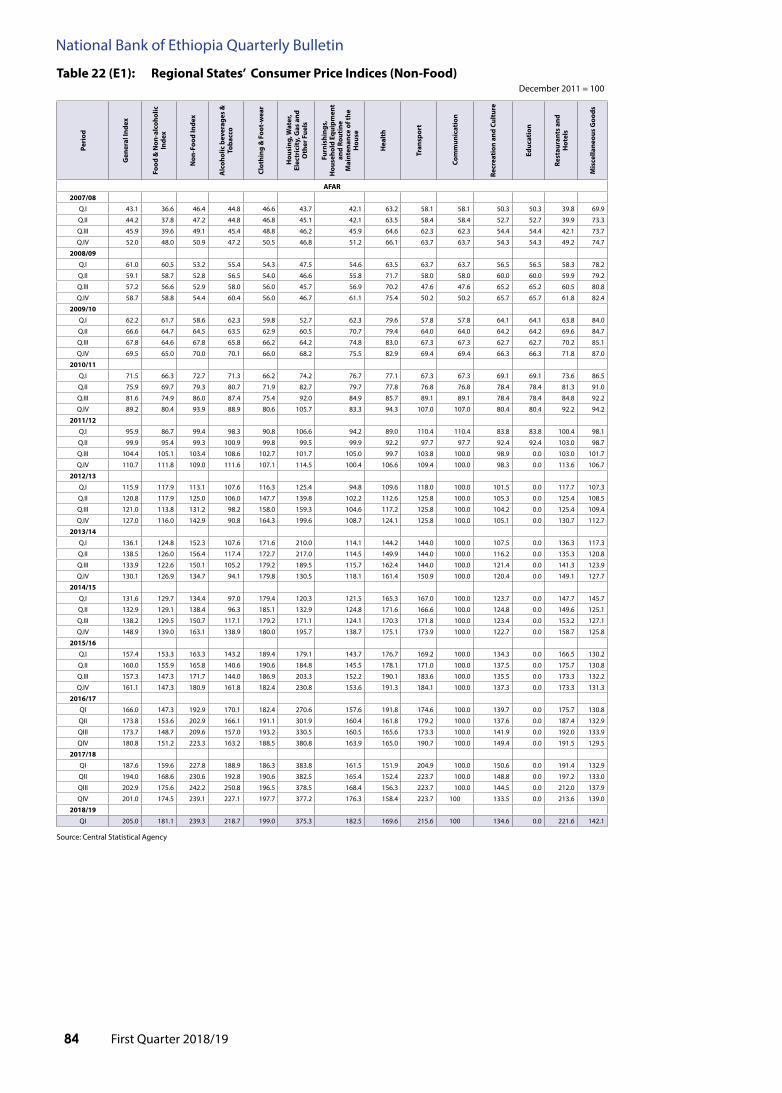
First Quarter 2018/1984
National Bank of Ethiopia Quarterly Bulletin
table 22 (E1): Regional States’ Consumer price indices (Non-food)December 2011 = 100
Source: Central Statistical Agency
peri
od
Gen
eral
inde
x
food
& N
on-a
lcoh
olic
in
dex
Non
-foo
d in
dex
alc
ohol
ic b
ever
ages
&
toba
cco
Clot
hing
& f
oot-
wea
r
hou
sing
, Wat
er,
Elec
tric
ity,
Gas
and
o
ther
fue
ls
furn
ishi
ngs,
h
ouse
hold
Equ
ipm
ent
and
Rout
ine
Mai
nten
ance
of t
he
hou
se
hea
lth
tran
spor
t
Com
mun
icat
ion
Recr
eati
on a
nd C
ultu
re
Educ
atio
n
Rest
aura
nts
and
hot
els
Mis
cella
neou
s G
oods
afaR
2007/08
Q.I 43.1 36.6 46.4 44.8 46.6 43.7 42.1 63.2 58.1 58.1 50.3 50.3 39.8 69.9
Q.II 44.2 37.8 47.2 44.8 46.8 45.1 42.1 63.5 58.4 58.4 52.7 52.7 39.9 73.3
Q.III 45.9 39.6 49.1 45.4 48.8 46.2 45.9 64.6 62.3 62.3 54.4 54.4 42.1 73.7
Q.IV 52.0 48.0 50.9 47.2 50.5 46.8 51.2 66.1 63.7 63.7 54.3 54.3 49.2 74.7
2008/09
Q.I 61.0 60.5 53.2 55.4 54.3 47.5 54.6 63.5 63.7 63.7 56.5 56.5 58.3 78.2
Q.II 59.1 58.7 52.8 56.5 54.0 46.6 55.8 71.7 58.0 58.0 60.0 60.0 59.9 79.2
Q.III 57.2 56.6 52.9 58.0 56.0 45.7 56.9 70.2 47.6 47.6 65.2 65.2 60.5 80.8
Q.IV 58.7 58.8 54.4 60.4 56.0 46.7 61.1 75.4 50.2 50.2 65.7 65.7 61.8 82.4
2009/10
Q.I 62.2 61.7 58.6 62.3 59.8 52.7 62.3 79.6 57.8 57.8 64.1 64.1 63.8 84.0
Q.II 66.6 64.7 64.5 63.5 62.9 60.5 70.7 79.4 64.0 64.0 64.2 64.2 69.6 84.7
Q.III 67.8 64.6 67.8 65.8 66.2 64.2 74.8 83.0 67.3 67.3 62.7 62.7 70.2 85.1
Q.IV 69.5 65.0 70.0 70.1 66.0 68.2 75.5 82.9 69.4 69.4 66.3 66.3 71.8 87.0
2010/11
Q.I 71.5 66.3 72.7 71.3 66.2 74.2 76.7 77.1 67.3 67.3 69.1 69.1 73.6 86.5
Q.II 75.9 69.7 79.3 80.7 71.9 82.7 79.7 77.8 76.8 76.8 78.4 78.4 81.3 91.0
Q.III 81.6 74.9 86.0 87.4 75.4 92.0 84.9 85.7 89.1 89.1 78.4 78.4 84.8 92.2
Q.IV 89.2 80.4 93.9 88.9 80.6 105.7 83.3 94.3 107.0 107.0 80.4 80.4 92.2 94.2
2011/12
Q.I 95.9 86.7 99.4 98.3 90.8 106.6 94.2 89.0 110.4 110.4 83.8 83.8 100.4 98.1
Q.II 99.9 95.4 99.3 100.9 99.8 99.5 99.9 92.2 97.7 97.7 92.4 92.4 103.0 98.7
Q.III 104.4 105.1 103.4 108.6 102.7 101.7 105.0 99.7 103.8 100.0 98.9 0.0 103.0 101.7
Q.IV 110.7 111.8 109.0 111.6 107.1 114.5 100.4 106.6 109.4 100.0 98.3 0.0 113.6 106.7
2012/13
Q.I 115.9 117.9 113.1 107.6 116.3 125.4 94.8 109.6 118.0 100.0 101.5 0.0 117.7 107.3
Q.II 120.8 117.9 125.0 106.0 147.7 139.8 102.2 112.6 125.8 100.0 105.3 0.0 125.4 108.5
Q.III 121.0 113.8 131.2 98.2 158.0 159.3 104.6 117.2 125.8 100.0 104.2 0.0 125.4 109.4
Q.IV 127.0 116.0 142.9 90.8 164.3 199.6 108.7 124.1 125.8 100.0 105.1 0.0 130.7 112.7
2013/14
Q.I 136.1 124.8 152.3 107.6 171.6 210.0 114.1 144.2 144.0 100.0 107.5 0.0 136.3 117.3
Q.II 138.5 126.0 156.4 117.4 172.7 217.0 114.5 149.9 144.0 100.0 116.2 0.0 135.3 120.8
Q.III 133.9 122.6 150.1 105.2 179.2 189.5 115.7 162.4 144.0 100.0 121.4 0.0 141.3 123.9
Q.IV 130.1 126.9 134.7 94.1 179.8 130.5 118.1 161.4 150.9 100.0 120.4 0.0 149.1 127.7
2014/15
Q.I 131.6 129.7 134.4 97.0 179.4 120.3 121.5 165.3 167.0 100.0 123.7 0.0 147.7 145.7
Q.II 132.9 129.1 138.4 96.3 185.1 132.9 124.8 171.6 166.6 100.0 124.8 0.0 149.6 125.1
Q.III 138.2 129.5 150.7 117.1 179.2 171.1 124.1 170.3 171.8 100.0 123.4 0.0 153.2 127.1
Q.IV 148.9 139.0 163.1 138.9 180.0 195.7 138.7 175.1 173.9 100.0 122.7 0.0 158.7 125.8
2015/16
Q.I 157.4 153.3 163.3 143.2 189.4 179.1 143.7 176.7 169.2 100.0 134.3 0.0 166.5 130.2
Q.II 160.0 155.9 165.8 140.6 190.6 184.8 145.5 178.1 171.0 100.0 137.5 0.0 175.7 130.8
Q.III 157.3 147.3 171.7 144.0 186.9 203.3 152.2 190.1 183.6 100.0 135.5 0.0 173.3 132.2
Q.IV 161.1 147.3 180.9 161.8 182.4 230.8 153.6 191.3 184.1 100.0 137.3 0.0 173.3 131.3
2016/17
QI 166.0 147.3 192.9 170.1 182.4 270.6 157.6 191.8 174.6 100.0 139.7 0.0 175.7 130.8
QII 173.8 153.6 202.9 166.1 191.1 301.9 160.4 161.8 179.2 100.0 137.6 0.0 187.4 132.9
QIII 173.7 148.7 209.6 157.0 193.2 330.5 160.5 165.6 173.3 100.0 141.9 0.0 192.0 133.9
QIV 180.8 151.2 223.3 163.2 188.5 380.8 163.9 165.0 190.7 100.0 149.4 0.0 191.5 129.5
2017/18
QI 187.6 159.6 227.8 188.9 186.3 383.8 161.5 151.9 204.9 100.0 150.6 0.0 191.4 132.9
QII 194.0 168.6 230.6 192.8 190.6 382.5 165.4 152.4 223.7 100.0 148.8 0.0 197.2 133.0
QIII 202.9 175.6 242.2 250.8 196.5 378.5 168.4 156.3 223.7 100.0 144.5 0.0 212.0 137.9
QIV 201.0 174.5 239.1 227.1 197.7 377.2 176.3 158.4 223.7 100 133.5 0.0 213.6 139.0
2018/19
QI 205.0 181.1 239.3 218.7 199.0 375.3 182.5 169.6 215.6 100 134.6 0.0 221.6 142.1
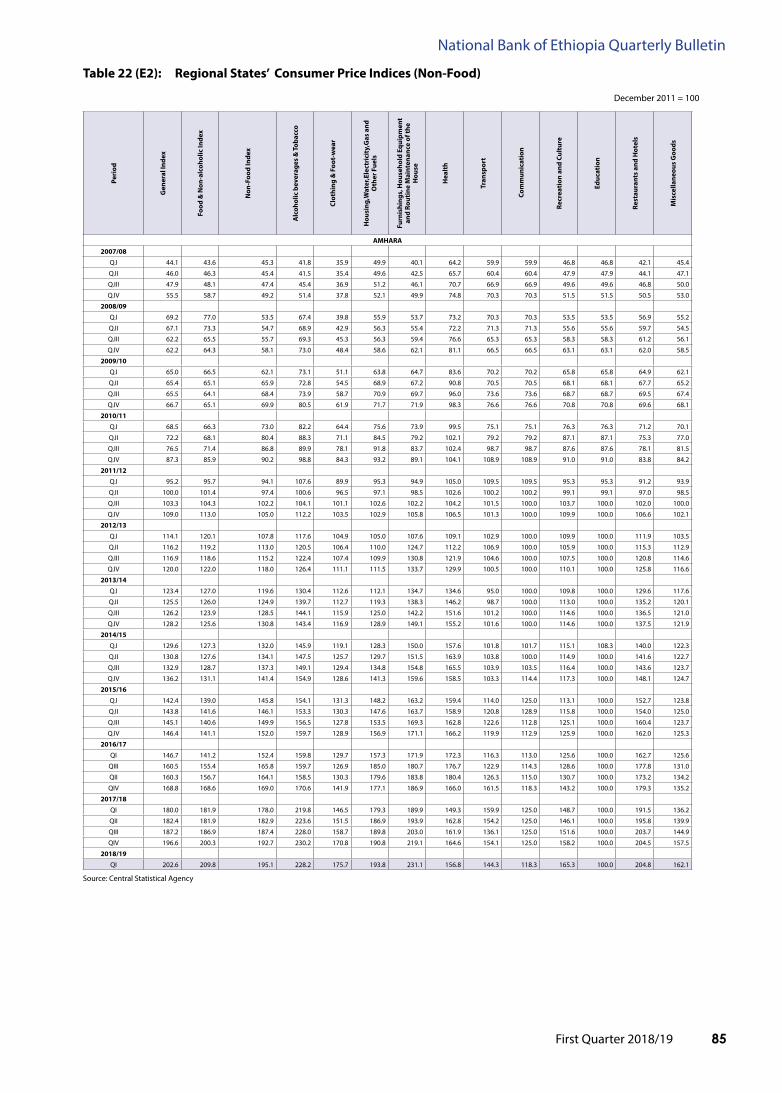
First Quarter 2018/19 85
National Bank of Ethiopia Quarterly Bulletin
table 22 (E2): Regional States’ Consumer price indices (Non-food)
December 2011 = 100
Source: Central Statistical Agency
peri
od
Gen
eral
inde
x
food
& N
on-a
lcoh
olic
inde
x
Non
-foo
d in
dex
alc
ohol
ic b
ever
ages
& t
obac
co
Clot
hing
& f
oot-
wea
r
hou
sing
,Wat
er,E
lect
rici
ty,G
as a
nd
oth
er f
uels
furn
ishi
ngs,
hou
seho
ld E
quip
men
t an
d Ro
utin
e M
aint
enan
ce o
f the
h
ouse
hea
lth
tran
spor
t
Com
mun
icat
ion
Recr
eati
on a
nd C
ultu
re
Educ
atio
n
Rest
aura
nts
and
hot
els
Mis
cella
neou
s G
oods
aMhaRa
2007/08
Q.I 44.1 43.6 45.3 41.8 35.9 49.9 40.1 64.2 59.9 59.9 46.8 46.8 42.1 45.4
Q.II 46.0 46.3 45.4 41.5 35.4 49.6 42.5 65.7 60.4 60.4 47.9 47.9 44.1 47.1
Q.III 47.9 48.1 47.4 45.4 36.9 51.2 46.1 70.7 66.9 66.9 49.6 49.6 46.8 50.0
Q.IV 55.5 58.7 49.2 51.4 37.8 52.1 49.9 74.8 70.3 70.3 51.5 51.5 50.5 53.0
2008/09
Q.I 69.2 77.0 53.5 67.4 39.8 55.9 53.7 73.2 70.3 70.3 53.5 53.5 56.9 55.2
Q.II 67.1 73.3 54.7 68.9 42.9 56.3 55.4 72.2 71.3 71.3 55.6 55.6 59.7 54.5
Q.III 62.2 65.5 55.7 69.3 45.3 56.3 59.4 76.6 65.3 65.3 58.3 58.3 61.2 56.1
Q.IV 62.2 64.3 58.1 73.0 48.4 58.6 62.1 81.1 66.5 66.5 63.1 63.1 62.0 58.5
2009/10
Q.I 65.0 66.5 62.1 73.1 51.1 63.8 64.7 83.6 70.2 70.2 65.8 65.8 64.9 62.1
Q.II 65.4 65.1 65.9 72.8 54.5 68.9 67.2 90.8 70.5 70.5 68.1 68.1 67.7 65.2
Q.III 65.5 64.1 68.4 73.9 58.7 70.9 69.7 96.0 73.6 73.6 68.7 68.7 69.5 67.4
Q.IV 66.7 65.1 69.9 80.5 61.9 71.7 71.9 98.3 76.6 76.6 70.8 70.8 69.6 68.1
2010/11
Q.I 68.5 66.3 73.0 82.2 64.4 75.6 73.9 99.5 75.1 75.1 76.3 76.3 71.2 70.1
Q.II 72.2 68.1 80.4 88.3 71.1 84.5 79.2 102.1 79.2 79.2 87.1 87.1 75.3 77.0
Q.III 76.5 71.4 86.8 89.9 78.1 91.8 83.7 102.4 98.7 98.7 87.6 87.6 78.1 81.5
Q.IV 87.3 85.9 90.2 98.8 84.3 93.2 89.1 104.1 108.9 108.9 91.0 91.0 83.8 84.2
2011/12
Q.I 95.2 95.7 94.1 107.6 89.9 95.3 94.9 105.0 109.5 109.5 95.3 95.3 91.2 93.9
Q.II 100.0 101.4 97.4 100.6 96.5 97.1 98.5 102.6 100.2 100.2 99.1 99.1 97.0 98.5
Q.III 103.3 104.3 102.2 104.1 101.1 102.6 102.2 104.2 101.5 100.0 103.7 100.0 102.0 100.0
Q.IV 109.0 113.0 105.0 112.2 103.5 102.9 105.8 106.5 101.3 100.0 109.9 100.0 106.6 102.1
2012/13
Q.I 114.1 120.1 107.8 117.6 104.9 105.0 107.6 109.1 102.9 100.0 109.9 100.0 111.9 103.5
Q.II 116.2 119.2 113.0 120.5 106.4 110.0 124.7 112.2 106.9 100.0 105.9 100.0 115.3 112.9
Q.III 116.9 118.6 115.2 122.4 107.4 109.9 130.8 121.9 104.6 100.0 107.5 100.0 120.8 114.6
Q.IV 120.0 122.0 118.0 126.4 111.1 111.5 133.7 129.9 100.5 100.0 110.1 100.0 125.8 116.6
2013/14
Q.I 123.4 127.0 119.6 130.4 112.6 112.1 134.7 134.6 95.0 100.0 109.8 100.0 129.6 117.6
Q.II 125.5 126.0 124.9 139.7 112.7 119.3 138.3 146.2 98.7 100.0 113.0 100.0 135.2 120.1
Q.III 126.2 123.9 128.5 144.1 115.9 125.0 142.2 151.6 101.2 100.0 114.6 100.0 136.5 121.0
Q.IV 128.2 125.6 130.8 143.4 116.9 128.9 149.1 155.2 101.6 100.0 114.6 100.0 137.5 121.9
2014/15
Q.I 129.6 127.3 132.0 145.9 119.1 128.3 150.0 157.6 101.8 101.7 115.1 108.3 140.0 122.3
Q.II 130.8 127.6 134.1 147.5 125.7 129.7 151.5 163.9 103.8 100.0 114.9 100.0 141.6 122.7
Q.III 132.9 128.7 137.3 149.1 129.4 134.8 154.8 165.5 103.9 103.5 116.4 100.0 143.6 123.7
Q.IV 136.2 131.1 141.4 154.9 128.6 141.3 159.6 158.5 103.3 114.4 117.3 100.0 148.1 124.7
2015/16
Q.I 142.4 139.0 145.8 154.1 131.3 148.2 163.2 159.4 114.0 125.0 113.1 100.0 152.7 123.8
Q.II 143.8 141.6 146.1 153.3 130.3 147.6 163.7 158.9 120.8 128.9 115.8 100.0 154.0 125.0
Q.III 145.1 140.6 149.9 156.5 127.8 153.5 169.3 162.8 122.6 112.8 125.1 100.0 160.4 123.7
Q.IV 146.4 141.1 152.0 159.7 128.9 156.9 171.1 166.2 119.9 112.9 125.9 100.0 162.0 125.3
2016/17
QI 146.7 141.2 152.4 159.8 129.7 157.3 171.9 172.3 116.3 113.0 125.6 100.0 162.7 125.6
QIII 160.5 155.4 165.8 159.7 126.9 185.0 180.7 176.7 122.9 114.3 128.6 100.0 177.8 131.0
QII 160.3 156.7 164.1 158.5 130.3 179.6 183.8 180.4 126.3 115.0 130.7 100.0 173.2 134.2
QIV 168.8 168.6 169.0 170.6 141.9 177.1 186.9 166.0 161.5 118.3 143.2 100.0 179.3 135.2
2017/18
QI 180.0 181.9 178.0 219.8 146.5 179.3 189.9 149.3 159.9 125.0 148.7 100.0 191.5 136.2
QII 182.4 181.9 182.9 223.6 151.5 186.9 193.9 162.8 154.2 125.0 146.1 100.0 195.8 139.9
QIII 187.2 186.9 187.4 228.0 158.7 189.8 203.0 161.9 136.1 125.0 151.6 100.0 203.7 144.9
QIV 196.6 200.3 192.7 230.2 170.8 190.8 219.1 164.6 154.1 125.0 158.2 100.0 204.5 157.5
2018/19
QI 202.6 209.8 195.1 228.2 175.7 193.8 231.1 156.8 144.3 118.3 165.3 100.0 204.8 162.1
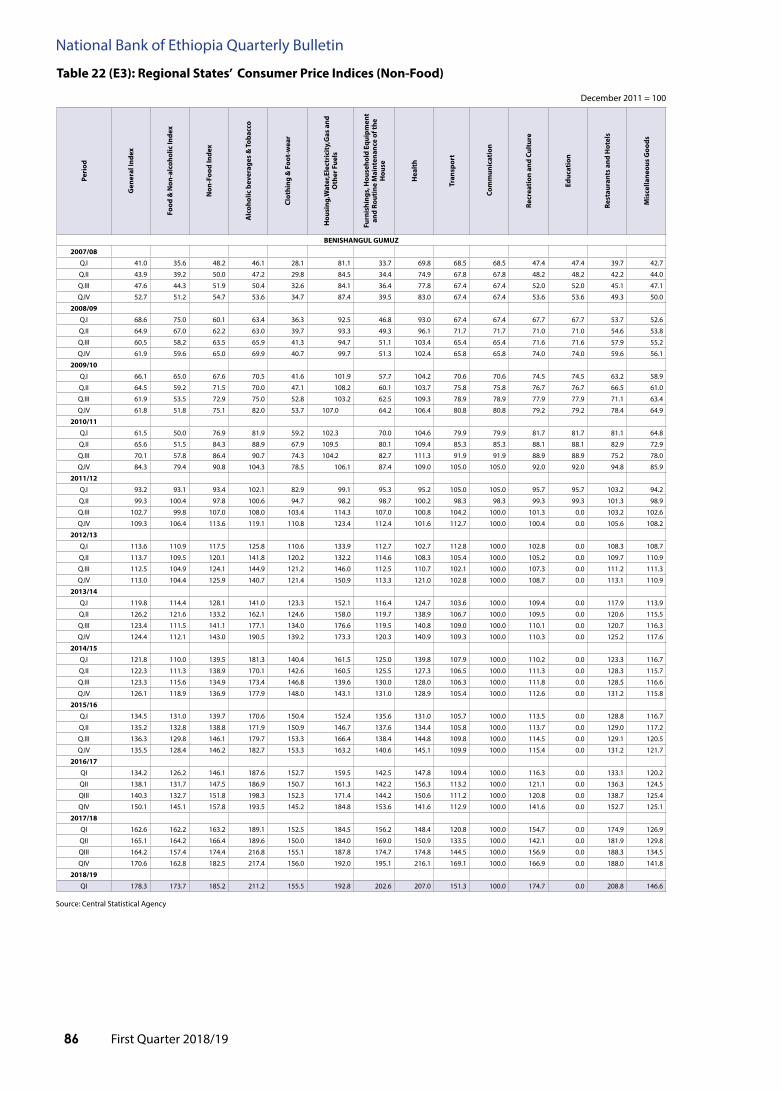
First Quarter 2018/1986
National Bank of Ethiopia Quarterly Bulletin
table 22 (E3): Regional States’ Consumer price indices (Non-food)
December 2011 = 100
Source: Central Statistical Agency
peri
od
Gen
eral
inde
x
food
& N
on-a
lcoh
olic
inde
x
Non
-foo
d in
dex
alc
ohol
ic b
ever
ages
& t
obac
co
Clot
hing
& f
oot-
wea
r
hou
sing
,Wat
er,E
lect
rici
ty,G
as a
nd
oth
er f
uels
furn
ishi
ngs,
hou
seho
ld E
quip
men
t an
d Ro
utin
e M
aint
enan
ce o
f the
h
ouse
hea
lth
tran
spor
t
Com
mun
icat
ion
Recr
eati
on a
nd C
ultu
re
Educ
atio
n
Rest
aura
nts
and
hot
els
Mis
cella
neou
s G
oods
BENiShaNGUl GUMUZ
2007/08
Q.I 41.0 35.6 48.2 46.1 28.1 81.1 33.7 69.8 68.5 68.5 47.4 47.4 39.7 42.7
Q.II 43.9 39.2 50.0 47.2 29.8 84.5 34.4 74.9 67.8 67.8 48.2 48.2 42.2 44.0
Q.III 47.6 44.3 51.9 50.4 32.6 84.1 36.4 77.8 67.4 67.4 52.0 52.0 45.1 47.1
Q.IV 52.7 51.2 54.7 53.6 34.7 87.4 39.5 83.0 67.4 67.4 53.6 53.6 49.3 50.0
2008/09
Q.I 68.6 75.0 60.1 63.4 36.3 92.5 46.8 93.0 67.4 67.4 67.7 67.7 53.7 52.6
Q.II 64.9 67.0 62.2 63.0 39.7 93.3 49.3 96.1 71.7 71.7 71.0 71.0 54.6 53.8
Q.III 60.5 58.2 63.5 65.9 41.3 94.7 51.1 103.4 65.4 65.4 71.6 71.6 57.9 55.2
Q.IV 61.9 59.6 65.0 69.9 40.7 99.7 51.3 102.4 65.8 65.8 74.0 74.0 59.6 56.1
2009/10
Q.I 66.1 65.0 67.6 70.5 41.6 101.9 57.7 104.2 70.6 70.6 74.5 74.5 63.2 58.9
Q.II 64.5 59.2 71.5 70.0 47.1 108.2 60.1 103.7 75.8 75.8 76.7 76.7 66.5 61.0
Q.III 61.9 53.5 72.9 75.0 52.8 103.2 62.5 109.3 78.9 78.9 77.9 77.9 71.1 63.4
Q.IV 61.8 51.8 75.1 82.0 53.7 107.0 64.2 106.4 80.8 80.8 79.2 79.2 78.4 64.9
2010/11
Q.I 61.5 50.0 76.9 81.9 59.2 102.3 70.0 104.6 79.9 79.9 81.7 81.7 81.1 64.8
Q.II 65.6 51.5 84.3 88.9 67.9 109.5 80.1 109.4 85.3 85.3 88.1 88.1 82.9 72.9
Q.III 70.1 57.8 86.4 90.7 74.3 104.2 82.7 111.3 91.9 91.9 88.9 88.9 75.2 78.0
Q.IV 84.3 79.4 90.8 104.3 78.5 106.1 87.4 109.0 105.0 105.0 92.0 92.0 94.8 85.9
2011/12
Q.I 93.2 93.1 93.4 102.1 82.9 99.1 95.3 95.2 105.0 105.0 95.7 95.7 103.2 94.2
Q.II 99.3 100.4 97.8 100.6 94.7 98.2 98.7 100.2 98.3 98.3 99.3 99.3 101.3 98.9
Q.III 102.7 99.8 107.0 108.0 103.4 114.3 107.0 100.8 104.2 100.0 101.3 0.0 103.2 102.6
Q.IV 109.3 106.4 113.6 119.1 110.8 123.4 112.4 101.6 112.7 100.0 100.4 0.0 105.6 108.2
2012/13
Q.I 113.6 110.9 117.5 125.8 110.6 133.9 112.7 102.7 112.8 100.0 102.8 0.0 108.3 108.7
Q.II 113.7 109.5 120.1 141.8 120.2 132.2 114.6 108.3 105.4 100.0 105.2 0.0 109.7 110.9
Q.III 112.5 104.9 124.1 144.9 121.2 146.0 112.5 110.7 102.1 100.0 107.3 0.0 111.2 111.3
Q.IV 113.0 104.4 125.9 140.7 121.4 150.9 113.3 121.0 102.8 100.0 108.7 0.0 113.1 110.9
2013/14
Q.I 119.8 114.4 128.1 141.0 123.3 152.1 116.4 124.7 103.6 100.0 109.4 0.0 117.9 113.9
Q.II 126.2 121.6 133.2 162.1 124.6 158.0 119.7 138.9 106.7 100.0 109.5 0.0 120.6 115.5
Q.III 123.4 111.5 141.1 177.1 134.0 176.6 119.5 140.8 109.0 100.0 110.1 0.0 120.7 116.3
Q.IV 124.4 112.1 143.0 190.5 139.2 173.3 120.3 140.9 109.3 100.0 110.3 0.0 125.2 117.6
2014/15
Q.I 121.8 110.0 139.5 181.3 140.4 161.5 125.0 139.8 107.9 100.0 110.2 0.0 123.3 116.7
Q.II 122.3 111.3 138.9 170.1 142.6 160.5 125.5 127.3 106.5 100.0 111.3 0.0 128.3 115.7
Q.III 123.3 115.6 134.9 173.4 146.8 139.6 130.0 128.0 106.3 100.0 111.8 0.0 128.5 116.6
Q.IV 126.1 118.9 136.9 177.9 148.0 143.1 131.0 128.9 105.4 100.0 112.6 0.0 131.2 115.8
2015/16
Q.I 134.5 131.0 139.7 170.6 150.4 152.4 135.6 131.0 105.7 100.0 113.5 0.0 128.8 116.7
Q.II 135.2 132.8 138.8 171.9 150.9 146.7 137.6 134.4 105.8 100.0 113.7 0.0 129.0 117.2
Q.III 136.3 129.8 146.1 179.7 153.3 166.4 138.4 144.8 109.8 100.0 114.5 0.0 129.1 120.5
Q.IV 135.5 128.4 146.2 182.7 153.3 163.2 140.6 145.1 109.9 100.0 115.4 0.0 131.2 121.7
2016/17
QI 134.2 126.2 146.1 187.6 152.7 159.5 142.5 147.8 109.4 100.0 116.3 0.0 133.1 120.2
QII 138.1 131.7 147.5 186.9 150.7 161.3 142.2 156.3 113.2 100.0 121.1 0.0 136.3 124.5
QIII 140.3 132.7 151.8 198.3 152.3 171.4 144.2 150.6 111.2 100.0 120.8 0.0 138.7 125.4
QIV 150.1 145.1 157.8 193.5 145.2 184.8 153.6 141.6 112.9 100.0 141.6 0.0 152.7 125.1
2017/18
QI 162.6 162.2 163.2 189.1 152.5 184.5 156.2 148.4 120.8 100.0 154.7 0.0 174.9 126.9
QII 165.1 164.2 166.4 189.6 150.0 184.0 169.0 150.9 133.5 100.0 142.1 0.0 181.9 129.8
QIII 164.2 157.4 174.4 216.8 155.1 187.8 174.7 174.8 144.5 100.0 156.9 0.0 188.3 134.5
QIV 170.6 162.8 182.5 217.4 156.0 192.0 195.1 216.1 169.1 100.0 166.9 0.0 188.0 141.8
2018/19
QI 178.3 173.7 185.2 211.2 155.5 192.8 202.6 207.0 151.3 100.0 174.7 0.0 208.8 146.6

First Quarter 2018/19 87
National Bank of Ethiopia Quarterly Bulletin
table 22 (E4): Regional States’ Consumer price indices (Non-food)
December 2011 = 100
Source: Central Statistical Agency
peri
od
Gen
eral
inde
x
food
& N
on-a
lcoh
olic
inde
x
Non
-foo
d in
dex
alc
ohol
ic b
ever
ages
&
toba
cco
Clot
hing
& f
oot-
wea
r
hou
sing
, Wat
er, E
lect
rici
ty,
Gas
and
oth
er f
uels
furn
ishi
ngs,
hou
seho
ld
Equi
pmen
t and
Rou
tine
M
aint
enan
ce o
f the
hou
se
hea
lth
tran
spor
t
Com
mun
icat
ion
Recr
eati
on a
nd C
ultu
re
Educ
atio
n
Rest
aura
nts
and
hot
els
Mis
cella
neou
s G
oods
DiRE DaWa
2007/08
Q.I 46.0 40.5 54.4 40.4 50.7 56.6 46.5 44.9 76.7 76.7 60.1 60.1 32.7 66.6
Q.II 47.4 41.5 56.5 41.0 52.9 57.5 51.8 50.7 76.7 76.7 61.3 61.3 37.0 67.2
Q.III 51.4 46.6 58.6 42.5 54.9 58.2 55.9 53.7 80.0 80.0 64.5 64.5 36.7 69.1
Q.IV 58.1 55.6 61.9 43.9 57.9 63.8 58.9 53.9 80.4 80.4 66.1 66.1 37.7 69.1
2008/09
Q.I 66.8 68.2 64.8 51.8 58.1 68.8 61.7 59.3 78.4 78.4 69.3 69.3 46.3 71.5
Q.II 67.8 68.4 66.8 52.5 62.9 68.7 65.8 60.6 76.2 76.2 72.9 72.9 58.2 72.3
Q.III 67.4 67.3 67.7 53.0 65.3 67.6 68.8 61.9 74.2 74.2 75.6 75.6 59.9 73.0
Q.IV 68.6 67.4 70.4 55.3 67.8 70.4 73.9 61.6 75.5 75.5 75.9 75.9 66.1 75.9
2009/10
Q.I 70.1 68.6 72.3 57.5 69.3 73.7 73.9 63.4 77.0 77.0 76.8 76.8 65.0 79.2
Q.II 70.5 67.3 75.4 60.0 73.6 74.8 78.9 65.5 79.0 79.0 85.0 85.0 64.0 80.3
Q.III 71.9 68.5 77.0 60.2 75.0 75.2 83.4 67.1 80.3 80.3 85.8 85.8 67.8 82.8
Q.IV 72.9 69.7 77.9 65.5 72.9 76.5 87.0 66.0 80.8 80.8 86.4 86.4 69.8 84.6
2010/11
Q.I 74.0 69.6 80.7 70.5 75.5 79.6 93.1 69.0 81.1 81.1 82.0 82.0 67.5 86.8
Q.II 79.0 73.5 87.4 75.1 80.5 88.4 100.2 69.3 85.0 85.0 94.1 94.1 76.5 87.8
Q.III 82.6 77.2 90.9 85.5 87.2 95.6 94.8 72.1 89.4 89.4 91.9 91.9 81.3 89.1
Q.IV 91.7 90.0 94.2 87.5 90.3 100.4 92.9 80.1 104.5 104.5 88.0 88.0 93.05114638 90.7
2011/12
Q.I 97.3 98.1 96.2 98.8 93.4 101.8 96.1 76.5 100.8 100.8 88.3 88.3 103.5390947 93.7
Q.II 99.6 100.4 98.4 100.8 96.2 100.3 98.5 88.3 100.2 100.2 99.5 99.5 100.3762493 98.3
Q.III 103.6 103.1 104.0 98.8 109.5 103.6 101.1 99.9 103.9 100.0 99.5 100.0 114.8065848 104.4
Q.IV 107.0 108.6 105.6 86.9 117.0 107.6 103.5 100.2 111.8 100.0 101.3 100.0 129.4831501 107.0
2012/13
Q.I 109.3 112.3 106.9 75.8 120.0 117.4 107.4 99.7 111.8 100.0 101.2 100.0 134.4056178 107.2
Q.II 113.8 112.1 115.1 103.3 132.2 118.1 107.8 102.2 114.2 100.0 103.9 100.0 135.4456624 107.5
Q.III 115.0 109.6 119.4 110.9 133.8 121.7 112.4 109.8 121.3 100.0 102.7 100.0 139.2705834 108.8
Q.IV 115.2 113.0 117.1 75.3 142.2 136.0 113.5 110.9 122.5 100.0 106.7 100.0 147.3758518 111.5
2013/14
Q.I 123.9 122.1 125.5 79.2 143.4 164.6 114.9 113.9 120.6 100.0 107.6 100.0 142.7333333 115.3
Q.II 134.7 121.8 145.3060448 121.8 156.1 187.8 117.5 116.8 122.5 100.0 113.2 100.0 156.3920107 119.1
Q.III 135.2 117.4 149.7666667 141.7 158.6 179.0 128.8 117.2 119.3 100.0 115.6 100.0 161.0333333 127.0
Q.IV 136.1 117.7 151.2666667 149.0 158.1 177.5 131.3 118.1 117.9 100.0 115.7 100.0 161.3 127.9
2014/15
Q.I 142.6 127.0 155.3666667 153.9 160.5 181.2 133.3 125.1 121.9 100.0 123.2 100.0 168.7 132.6
Q.II 141.4 129.4 151.2 140.6 161.8 181.5 134.6 125.3 126.2 100.0 123.2 100.0 155.0 134.8
Q.III 147.8 129.4 162.9 183.0 169.0 182.2 136.4 120.6 121.2 100.0 123.6 100.0 159.3 141.7
Q.IV 156.3 130.9 177.2 246.6 168.6 183.2 138.4 119.8 117.9 100.0 125.7 100.0 150.6 144.0
2015/16
Q.I 152.7 130.4 171.0 192.6 181.6 188.3 146.3 120.7 117.3 100.0 130.9 100.0 175.2 146.6
Q.II 153.5 129.7 173.0 196.8 183.6 187.1 146.1 120.7 117.3 100.0 130.9 100.0 184.8 145.7
Q.III 151.5 132.0 167.5 168.3 192.0 184.3 146.4 120.6 115.6 100.0 130.9 100.0 193.5 147.1
Q.IV 157.7 134.4 176.8 206.1 192.5 185.4 143.9 119.9 115.6 100.0 130.9 100.0 194.0 150.1
2016/17
QI 165.3 133.5 191.3 267.1 190.4 185.3 145.2 122.0 115.6 100.0 130.9 100.0 193.7 155.3
QII 168.2 146.5 186.2 216.3 205.0 190.0 153.8 123.3 122.5 100.0 131.8 100.0 210.3 168.3
QIII 175.2 143.8 201.0 274.3 210.4 193.1 157.9 121.5 124.3 100.0 135.5 100.0 205.0 171.7
QIV 174.9 151.1 194.4 240.8 211.4 193.9 153.2 123.5 115.6 115.0 133.8 100.0 214.5 172.5
2017/18
QI 176.1 156.5 192.2 192.2 217.5 221.8 192.4 162.7 134.4 117.9 115.0 130.9 100.0 224.8
QII 184.0 162.1 201.9 256.9 226.4 188.9 168.4 129.7 125.5 115.0 136.1 100.0 223.9 181.3
QIII 189.0 167.3 206.8 260.1 233.0 188.8 189.5 124.0 139.0 115.0 183.3 100.0 227.0 186.3
QIV 191.4 172.9 206.5 217.2 264.2 191.5 230.0 127.2 138.3 115.0 187.9 100.0 245.7 190.9
2018/19
QI 203.5 185.5 218.3 227.6 288.6 192.7 252.1 140.1 137.8 115.0 190.3 100.0 278.7 199.8
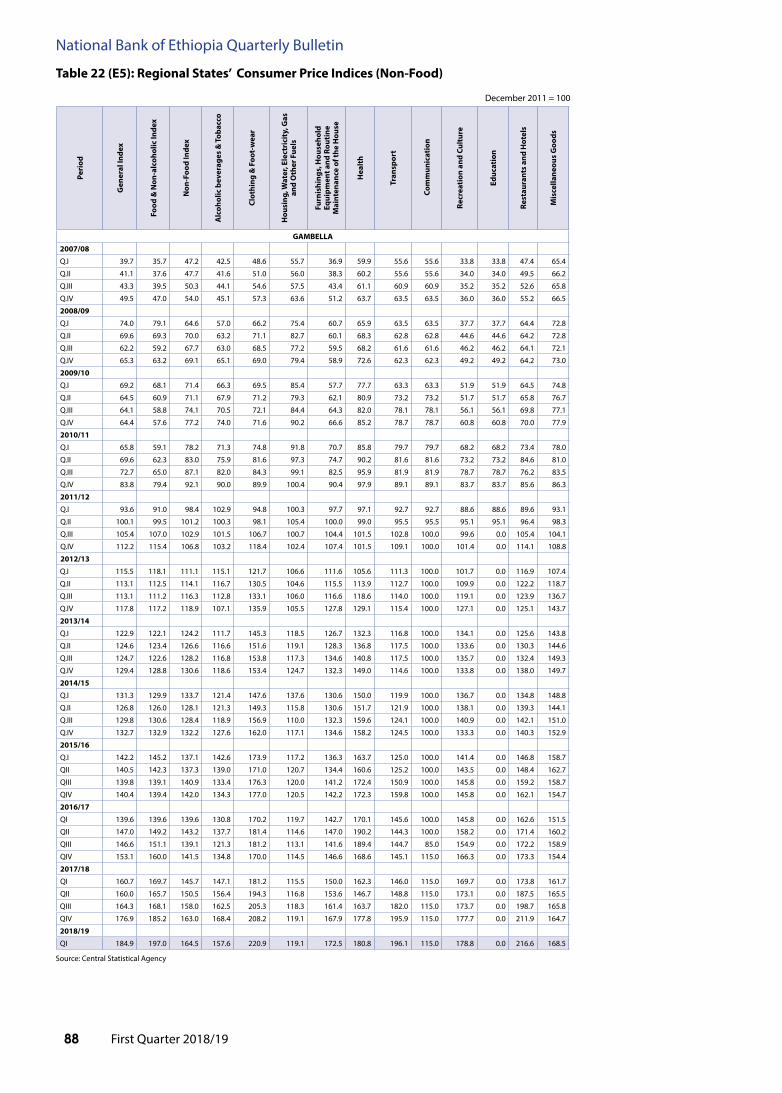
First Quarter 2018/1988
National Bank of Ethiopia Quarterly Bulletin
table 22 (E5): Regional States’ Consumer price indices (Non-food)
December 2011 = 100
Source: Central Statistical Agency
peri
od
Gen
eral
inde
x
food
& N
on-a
lcoh
olic
inde
x
Non
-foo
d in
dex
alc
ohol
ic b
ever
ages
& t
obac
co
Clot
hing
& f
oot-
wea
r
hou
sing
, Wat
er, E
lect
rici
ty, G
as
and
oth
er f
uels
furn
ishi
ngs,
hou
seho
ld
Equi
pmen
t and
Rou
tine
M
aint
enan
ce o
f the
hou
se
hea
lth
tran
spor
t
Com
mun
icat
ion
Recr
eati
on a
nd C
ultu
re
Educ
atio
n
Rest
aura
nts
and
hot
els
Mis
cella
neou
s G
oods
GaMBElla
2007/08
Q.I 39.7 35.7 47.2 42.5 48.6 55.7 36.9 59.9 55.6 55.6 33.8 33.8 47.4 65.4
Q.II 41.1 37.6 47.7 41.6 51.0 56.0 38.3 60.2 55.6 55.6 34.0 34.0 49.5 66.2
Q.III 43.3 39.5 50.3 44.1 54.6 57.5 43.4 61.1 60.9 60.9 35.2 35.2 52.6 65.8
Q.IV 49.5 47.0 54.0 45.1 57.3 63.6 51.2 63.7 63.5 63.5 36.0 36.0 55.2 66.5
2008/09
Q.I 74.0 79.1 64.6 57.0 66.2 75.4 60.7 65.9 63.5 63.5 37.7 37.7 64.4 72.8
Q.II 69.6 69.3 70.0 63.2 71.1 82.7 60.1 68.3 62.8 62.8 44.6 44.6 64.2 72.8
Q.III 62.2 59.2 67.7 63.0 68.5 77.2 59.5 68.2 61.6 61.6 46.2 46.2 64.1 72.1
Q.IV 65.3 63.2 69.1 65.1 69.0 79.4 58.9 72.6 62.3 62.3 49.2 49.2 64.2 73.0
2009/10
Q.I 69.2 68.1 71.4 66.3 69.5 85.4 57.7 77.7 63.3 63.3 51.9 51.9 64.5 74.8
Q.II 64.5 60.9 71.1 67.9 71.2 79.3 62.1 80.9 73.2 73.2 51.7 51.7 65.8 76.7
Q.III 64.1 58.8 74.1 70.5 72.1 84.4 64.3 82.0 78.1 78.1 56.1 56.1 69.8 77.1
Q.IV 64.4 57.6 77.2 74.0 71.6 90.2 66.6 85.2 78.7 78.7 60.8 60.8 70.0 77.9
2010/11
Q.I 65.8 59.1 78.2 71.3 74.8 91.8 70.7 85.8 79.7 79.7 68.2 68.2 73.4 78.0
Q.II 69.6 62.3 83.0 75.9 81.6 97.3 74.7 90.2 81.6 81.6 73.2 73.2 84.6 81.0
Q.III 72.7 65.0 87.1 82.0 84.3 99.1 82.5 95.9 81.9 81.9 78.7 78.7 76.2 83.5
Q.IV 83.8 79.4 92.1 90.0 89.9 100.4 90.4 97.9 89.1 89.1 83.7 83.7 85.6 86.3
2011/12
Q.I 93.6 91.0 98.4 102.9 94.8 100.3 97.7 97.1 92.7 92.7 88.6 88.6 89.6 93.1
Q.II 100.1 99.5 101.2 100.3 98.1 105.4 100.0 99.0 95.5 95.5 95.1 95.1 96.4 98.3
Q.III 105.4 107.0 102.9 101.5 106.7 100.7 104.4 101.5 102.8 100.0 99.6 0.0 105.4 104.1
Q.IV 112.2 115.4 106.8 103.2 118.4 102.4 107.4 101.5 109.1 100.0 101.4 0.0 114.1 108.8
2012/13
Q.I 115.5 118.1 111.1 115.1 121.7 106.6 111.6 105.6 111.3 100.0 101.7 0.0 116.9 107.4
Q.II 113.1 112.5 114.1 116.7 130.5 104.6 115.5 113.9 112.7 100.0 109.9 0.0 122.2 118.7
Q.III 113.1 111.2 116.3 112.8 133.1 106.0 116.6 118.6 114.0 100.0 119.1 0.0 123.9 136.7
Q.IV 117.8 117.2 118.9 107.1 135.9 105.5 127.8 129.1 115.4 100.0 127.1 0.0 125.1 143.7
2013/14
Q.I 122.9 122.1 124.2 111.7 145.3 118.5 126.7 132.3 116.8 100.0 134.1 0.0 125.6 143.8
Q.II 124.6 123.4 126.6 116.6 151.6 119.1 128.3 136.8 117.5 100.0 133.6 0.0 130.3 144.6
Q.III 124.7 122.6 128.2 116.8 153.8 117.3 134.6 140.8 117.5 100.0 135.7 0.0 132.4 149.3
Q.IV 129.4 128.8 130.6 118.6 153.4 124.7 132.3 149.0 114.6 100.0 133.8 0.0 138.0 149.7
2014/15
Q.I 131.3 129.9 133.7 121.4 147.6 137.6 130.6 150.0 119.9 100.0 136.7 0.0 134.8 148.8
Q.II 126.8 126.0 128.1 121.3 149.3 115.8 130.6 151.7 121.9 100.0 138.1 0.0 139.3 144.1
Q.III 129.8 130.6 128.4 118.9 156.9 110.0 132.3 159.6 124.1 100.0 140.9 0.0 142.1 151.0
Q.IV 132.7 132.9 132.2 127.6 162.0 117.1 134.6 158.2 124.5 100.0 133.3 0.0 140.3 152.9
2015/16
Q.I 142.2 145.2 137.1 142.6 173.9 117.2 136.3 163.7 125.0 100.0 141.4 0.0 146.8 158.7
QII 140.5 142.3 137.3 139.0 171.0 120.7 134.4 160.6 125.2 100.0 143.5 0.0 148.4 162.7
QIII 139.8 139.1 140.9 133.4 176.3 120.0 141.2 172.4 150.9 100.0 145.8 0.0 159.2 158.7
QIV 140.4 139.4 142.0 134.3 177.0 120.5 142.2 172.3 159.8 100.0 145.8 0.0 162.1 154.7
2016/17
QI 139.6 139.6 139.6 130.8 170.2 119.7 142.7 170.1 145.6 100.0 145.8 0.0 162.6 151.5
QII 147.0 149.2 143.2 137.7 181.4 114.6 147.0 190.2 144.3 100.0 158.2 0.0 171.4 160.2
QIII 146.6 151.1 139.1 121.3 181.2 113.1 141.6 189.4 144.7 85.0 154.9 0.0 172.2 158.9
QIV 153.1 160.0 141.5 134.8 170.0 114.5 146.6 168.6 145.1 115.0 166.3 0.0 173.3 154.4
2017/18
QI 160.7 169.7 145.7 147.1 181.2 115.5 150.0 162.3 146.0 115.0 169.7 0.0 173.8 161.7
QII 160.0 165.7 150.5 156.4 194.3 116.8 153.6 146.7 148.8 115.0 173.1 0.0 187.5 165.5
QIII 164.3 168.1 158.0 162.5 205.3 118.3 161.4 163.7 182.0 115.0 173.7 0.0 198.7 165.8
QIV 176.9 185.2 163.0 168.4 208.2 119.1 167.9 177.8 195.9 115.0 177.7 0.0 211.9 164.7
2018/19
QI 184.9 197.0 164.5 157.6 220.9 119.1 172.5 180.8 196.1 115.0 178.8 0.0 216.6 168.5

First Quarter 2018/19 89
National Bank of Ethiopia Quarterly Bulletin
table 22 (E6): Regional States’ Consumer price indices (Non-food)
December 2011 = 100
Source: Central Statistical Agency
peri
od
Gen
eral
inde
x
food
& N
on-a
lcoh
olic
inde
x
Non
-foo
d in
dex
alc
ohol
ic b
ever
ages
& t
obac
co
Clot
hing
& f
oot-
wea
r
hou
sing
,Wat
er,E
lect
rici
ty,G
as
and
oth
er f
uels
furn
ishi
ngs,
hou
seho
ld
Equi
pmen
t and
Rou
tine
M
aint
enan
ce o
f the
hou
se
hea
lth
tran
spor
t
Com
mun
icat
ion
Recr
eati
on a
nd C
ultu
re
Educ
atio
n
Rest
aura
nts
and
hot
els
Mis
cella
neou
s G
oods
haRaRi
2007/08
Q.I 38.3 32.3 45.7 39.2 40.4 54.6 50.1 35.3 60.6 60.6 51.4 51.4 36.9 38.9
Q.II 39.2 33.2 46.6 39.6 44.2 54.0 51.9 35.8 60.6 60.6 51.7 51.7 37.5 39.7
Q.III 42.0 36.1 49.4 39.3 46.5 58.1 54.4 35.1 69.1 69.1 51.3 51.3 40.7 40.1
Q.IV 51.1 47.7 54.8 41.7 50.9 67.5 59.4 33.6 73.4 73.4 54.0 54.0 47.1 43.0
2008/09
Q.I 60.4 60.0 58.6 52.1 56.8 70.1 62.5 34.6 79.0 79.0 56.0 56.0 55.8 45.8
Q.II 60.8 59.1 60.8 54.5 59.4 72.8 65.0 37.6 79.1 79.1 58.8 58.8 59.4 47.7
Q.III 60.2 57.3 61.2 65.6 63.6 69.7 68.0 37.7 71.9 71.9 60.6 60.6 59.4 48.0
Q.IV 61.6 58.3 62.8 69.6 66.3 69.5 71.7 37.1 72.3 72.3 64.0 64.0 59.9 48.4
2009/10
Q.I 63.2 58.7 66.2 70.6 69.3 73.0 75.1 70.8 77.6 77.6 67.7 67.7 61.3 49.6
Q.II 63.9 58.9 67.5 72.3 71.1 71.4 80.3 88.2 79.3 79.3 71.8 71.8 61.9 49.9
Q.III 65.7 61.1 68.6 73.3 70.9 74.0 82.3 89.1 77.5 77.5 72.3 72.3 63.9 50.6
Q.IV 66.9 61.9 70.6 73.1 72.4 77.8 83.0 88.7 77.7 77.7 77.0 77.0 66.5 50.3
2010/11
Q.I 69.1 64.2 72.4 76.7 75.5 79.6 83.9 89.6 77.5 77.5 79.5 79.5 69.3 50.9
Q.II 74.0 68.5 78.2 84.4 81.6 86.9 87.7 92.2 86.0 86.0 84.3 84.3 71.4 53.5
Q.III 79.8 75.3 81.9 87.7 83.1 95.2 85.1 101.7 86.3 86.3 88.0 88.0 72.6 64.2
Q.IV 86.6 82.0 88.3 91.8 87.1 104.0 94.1 97.9 91.3 91.3 93.4 93.4 79.8 80.6
2011/12
Q.I 91.2 88.0 89.9 98.5 91.3 100.5 97.2 100.3 99.1 99.1 95.9 95.9 96.1 88.3
Q.II 94.8 92.0 94.4 98.5 97.1 100.3 99.4 100.3 99.6 99.6 99.0 99.0 98.3 100.0
Q.III 102.3 102.8 102.0 103.0 103.0 100.2 103.7 108.1 100.0 100.0 94.3 100.0 102.7 105.8
Q.IV 107.9 114.0 102.3 101.3 105.4 100.5 106.0 102.2 103.0 100.0 92.3 100.0 111.0 106.3
2012/13
Q.I 109.0 117.8 100.8 94.6 108.7 100.1 105.4 101.4 105.2 100.0 95.9 100.0 118.4 111.2
Q.II 110.9 119.4 103.2 97.6 115.6 100.2 111.3 112.0 111.1 100.0 97.4 100.0 118.3 110.9
Q.III 113.3 116.0 110.7 117.4 120.8 100.0 114.7 121.7 111.1 100.0 100.2 100.0 121.3 112.4
Q.IV 110.8 122.9 99.7 81.0 125.4 99.8 120.0 146.0 107.1 100.0 105.4 100.0 122.8 114.3
2013/14
Q.I 118.5 132.3 105.8 95.7 126.4 101.9 123.5 111.0 107.1 100.0 114.0 100.0 132.2 116.2
Q.II 121.0 131.6 111.3 103.7 130.1 108.8 125.8 105.4 107.1 100.0 117.4 100.0 133.3 118.7
Q.III 126.2 129.1 123.6 133.9 133.4 113.2 127.2 105.4 109.3 100.0 117.4 100.0 136.3 123.7
Q.IV 125.5 133.0 118.6 115.1 136.2 114.9 133.9 98.4 105.8 100.0 116.8 100.0 139.8 124.0
2014/15
Q.I 128.6 142.4 116.0 105.9 136.0 115.9 135.9 105.4 107.1 100.0 113.1 100.0 138.3 124.7
Q.II 129.4 144.1 116.0 106.8 137.7 114.2 134.7 91.3 107.1 100.0 113.5 100.0 143.0 126.9
Q.III 135.8 144.8 127.5 144.1 143.7 109.5 133.5 84.3 107.1 100.0 113.8 100.0 147.2 128.1
Q.IV 136.6 151.2 123.2 131.6 144.9 107.7 137.8 84.3 107.1 100.0 116.0 100.0 146.6 130.6
2015/16
Q.I 136.2 152.1 121.6 121.7 147.9 107.7 145.9 84.3 107.1 100.0 153.3 100.0 153.3 133.4
Q.II 137.7 153.9 122.8 123.9 148.6 107.8 148.8 95.5 107.1 100.0 141.0 100.0 156.3 135.0
QIII 147.4 155.1 140.4 175.2 148.0 107.6 152.9 114.2 107.1 100.0 137.7 100.0 150.1 149.1
QIV 156.9 156.6 157.2 227.0 149.7 105.0 154.9 117.3 107.1 100.0 161.1 100.0 149.9 148.0
2016/17
QI 164.1 155.7 171.9 271.7 151.3 102.5 156.5 126.7 107.1 100.0 185.3 100.0 150.5 148.1
QIII 151.5 169.1 135.3 159.8 166.2 99.8 159.6 110.0 107.1 100.0 188.5 100.0 154.1 143.1
QII 163.5 165.8 161.3 227.1 160.5 111.1 161.7 110.5 107.1 100.0 190.0 100.0 162.3 144.0
QIV 160.3 175.8 146.0 174.8 163.2 117.9 165.1 81.9 88.9 100.0 201.8 115.0 155.8 142.6
2017/18
QI 161.6 185.6 139.5 156.7 164.2 117.9 160.3 80.3 88.9 115.0 194.1 100.0 152.7 143.0
QII 164.9 186.4 145.1 167.2 168.8 118.2 174.9 84.3 88.4 115.0 202.0 100.0 156.9 147.7
QIII 179.6 183.1 176.4 247.8 176.9 117.9 188.5 87.5 95.9 153.3 207.2 100.0 186.2 151.4
QIV 183.6 194.5 173.6 221.8 188.3 118.0 210.9 84.2 106.9 230.0 208.9 100.0 192.3 160.3
2018/19
QI 181.9 208.7 157.2 168.7 185.9 117.9 231.6 89.5 99.4 230.0 209.2 100.0 190.0 166.9

First Quarter 2018/1990
National Bank of Ethiopia Quarterly Bulletin
table 22 (E7): Regional States’ Consumer price indices (Non-food)
December 2011 = 100
Source: Central Statistical Agency
peri
od
Gen
eral
inde
x
food
& N
on-a
lcoh
olic
inde
x
Non
-foo
d in
dex
alc
ohol
ic b
ever
ages
& t
obac
co
Clot
hing
& f
oot-
wea
r
hou
sing
, Wat
er,
Elec
tric
ity,
Gas
an
d o
ther
fue
ls
furn
ishi
ngs,
hou
seho
ld
Equi
pmen
t and
Rou
tine
M
aint
enan
ce o
f the
hou
se
hea
lth
tran
spor
t
Com
mun
icat
ion
Recr
eati
on a
nd C
ultu
re
Educ
atio
n
Rest
aura
nts
and
hot
els
Mis
cella
neou
s G
oods
oRoMia
2007/08
Q.I 38.8 37.8 40.5 39.0 32.8 47.5 37.5 50.2 50.0 50.0 40.4 40.4 40.9 40.0
Q.II 40.8 40.4 41.4 39.3 34.4 47.7 38.9 51.6 50.7 50.7 42.1 42.1 41.2 40.1
Q.III 44.9 45.2 44.4 42.9 36.0 51.8 43.2 54.5 52.5 52.5 43.5 43.5 43.7 41.8
Q.IV 54.2 57.5 48.8 48.0 38.3 57.7 46.8 57.7 54.1 54.1 44.9 44.9 47.7 45.8
2008/09
Q.I 65.8 73.3 53.0 57.3 40.9 61.7 49.6 62.1 54.2 54.2 48.9 48.9 51.5 49.5
Q.II 61.9 65.9 55.1 59.5 43.7 63.6 51.3 64.5 57.1 57.1 50.1 50.1 53.6 50.5
Q.III 59.9 61.8 56.8 63.8 47.1 64.7 52.9 65.9 50.0 50.0 50.3 50.3 56.8 52.0
Q.IV 61.1 62.5 58.8 65.3 49.5 66.5 54.6 70.7 52.2 52.2 52.1 52.1 59.0 55.4
2009/10
Q.I 62.3 62.8 61.6 66.1 52.6 69.2 57.7 72.5 56.9 56.9 55.5 55.5 61.1 58.8
Q.II 61.6 60.2 63.9 66.9 55.3 72.4 59.9 73.8 61.9 61.9 56.9 56.9 63.8 59.3
Q.III 63.3 60.9 67.4 69.1 59.8 76.2 64.1 78.4 65.4 65.4 60.5 60.5 64.5 61.9
Q.IV 64.3 61.2 69.6 71.0 61.9 78.6 67.2 80.9 66.4 66.4 62.3 62.3 67.2 64.3
2010/11
Q.I 65.9 62.2 72.0 72.3 64.4 81.6 69.5 81.4 67.2 67.2 64.7 64.7 68.4 66.5
Q.II 70.1 66.1 76.8 80.6 68.4 85.0 76.9 85.8 73.4 73.4 77.8 77.8 74.3 72.8
Q.III 77.3 73.8 83.2 84.5 76.7 92.1 79.4 89.1 88.5 88.5 81.2 81.2 76.9 77.8
Q.IV 88.0 88.0 88.2 92.1 81.5 95.8 85.1 90.7 102.6 102.6 83.4 83.4 84.8 81.5
2011/12
Q.I 93.7 95.1 91.5 96.1 84.2 96.4 91.4 94.6 103.4 103.4 90.4 90.4 91.7 87.5
Q.II 98.4 99.6 96.2 98.8 93.0 97.6 96.5 97.7 99.0 99.0 96.4 96.4 97.6 96.6
Q.III 106.1 107.6 104.3 107.1 104.4 105.6 105.6 99.5 100.5 100.0 99.1 100.0 101.9 102.7
Q.IV 112.8 116.5 108.5 102.0 112.1 110.8 111.3 101.3 101.1 100.0 99.9 100.0 112.2 104.6
2012/13
Q.I 114.0 117.0 110.5 95.4 114.4 115.0 111.8 102.4 100.3 100.0 102.7 100.0 118.5 109.8
Q.II 113.7 114.9 112.3 102.5 110.0 116.2 115.9 115.6 101.2 100.0 93.5 100.0 122.1 112.0
Q.III 114.1 114.5 113.7 107.9 114.6 116.9 116.3 120.5 93.7 100.0 89.6 100.0 122.8 114.0
Q.IV 115.8 116.0 115.6 103.3 116.8 120.3 119.4 125.1 94.0 100.0 89.4 100.0 126.8 114.4
2013/14
Q.I 120.6 121.3 119.8 103.5 123.6 126.5 122.1 119.5 93.8 100.0 111.7 100.0 131.8 117.0
Q.II 122.7 124.6 120.6 112.3 128.9 121.1 123.7 132.3 94.0 100.0 116.5 100.0 132.6 118.1
Q.III 123.0 121.0 125.2 123.5 130.9 128.0 128.4 136.0 95.8 100.0 110.6 100.0 133.8 117.9
Q.IV 127.3 126.2 128.6 120.3 133.8 135.8 130.2 141.7 96.5 100.0 100.7 100.0 137.8 118.7
2014/15
Q.I 131.9 133.3 130.4 127.8 137.8 135.2 132.6 137.5 96.5 100.0 99.9 100.0 139.0 119.5
Q.II 133.9 134.3 133.7 132.7 142.9 139.6 135.3 138.1 96.1 100.0 100.9 100.0 139.6 121.1
Q.III 139.5 139.8 139.5 147.9 146.9 147.3 138.5 143.5 94.8 100.0 102.5 100.0 143.3 122.7
Q.IV 147.2 150.6 143.6 149.6 149.4 155.8 140.9 143.0 94.0 100.0 103.6 100.0 147.5 124.4
2015/16
Q.I 153.5 161.8 144.0 144.5 152.0 154.5 143.2 148.3 94.1 102.4 123.8 100.0 152.4 125.4
Q.II 155.4 164.5 145.6 143.8 153.1 155.6 144.2 150.7 94.1 102.4 127.2 100.0 154.3 125.6
QIII 150.6 154.7 149.0 148.7 153.5 153.1 147.8 163.0 94.0 100.0 132.3 100.0 158.3 127.8
QIV 150.6 153.9 151.3 152.3 153.8 153.1 150.1 160.5 94.5 100.0 134.4 100.0 159.5 128.6
2016/17
QI 151.6 154.0 151.5 155.1 155.6 157.0 151.3 159.9 94.1 100.0 136.5 100.0 160.1 128.8
QII 154.8 156.0 153.4 144.9 157.3 167.3 153.1 168.6 94.6 100.0 148.6 100.0 171.9 131.7
QIII 157.5 155.6 159.6 157.0 161.4 177.6 153.7 176.3 95.7 100.0 148.6 100.0 174.4 135.7
QIV 164.2 166.7 161.4 142.7 159.9 182.9 159.9 176.9 96.4 104.3 152.8 100.0 181.1 140.6
2017/18
QI 169.1 173.7 142.3 163.9 148.0 161.3 188.0 163.8 163.1 99.3 104.3 154.7 100.0 176.7
QII 174.4 179.4 146.1 168.8 151.7 166.0 193.4 171.6 168.7 104.7 104.3 157.6 100.0 179.1
QIII 180.4 186.8 151.2 173.1 164.6 173.8 190.7 181.2 175.5 104.2 104.3 162.2 100.0 189.1
QIV 186.3 194.0 157.7 177.4 152.9 179.6 195.6 190.2 178.1 106.7 104.3 166.3 100.0 203.9
2018/19
QI 190.3 197.6 162.1 182.1 158.6 185.4 195.5 201.1 191.3 107.7 105.0 171.1 100.0 215.8

First Quarter 2018/19 91
National Bank of Ethiopia Quarterly Bulletin
table 22 (E8): Regional States’ Consumer price indices (Non-food)
December 2011 = 100
Source: Central Statistical Agency
peri
od
Gen
eral
inde
x
food
& N
on-a
lcoh
olic
inde
x
Non
-foo
d in
dex
alc
ohol
ic b
ever
ages
& t
obac
co
Clot
hing
& f
oot-
wea
r
hou
sing
, Wat
er, E
lect
rici
ty, G
as
and
oth
er f
uels
furn
ishi
ngs,
hou
seho
ld
Equi
pmen
t and
Rou
tine
M
aint
enan
ce o
f the
hou
se
hea
lth
tran
spor
t
Com
mun
icat
ion
Recr
eati
on a
nd C
ultu
re
Educ
atio
n
Rest
aura
nts
and
hot
els
Mis
cella
neou
s G
oods
SNNpR
2007/08
Q.I 38.1 37.0 39.9 38.7 34.0 40.4 37.9 62.8 54.9 54.9 58.7 58.7 44.1 45.4
Q.II 39.9 38.6 41.9 39.2 35.6 43.5 40.3 60.9 54.3 54.3 58.8 58.8 39.0 46.4
Q.III 43.9 43.4 44.6 43.1 37.2 46.8 43.0 62.2 63.4 63.4 59.9 59.9 41.1 47.7
Q.IV 53.9 56.7 49.6 46.8 40.2 53.8 48.3 65.6 67.2 67.2 60.9 60.9 44.6 49.4
2008/09
Q.I 65.0 71.9 54.4 56.9 43.9 57.6 51.8 65.5 67.2 67.2 62.2 62.2 48.1 51.7
Q.II 60.5 62.6 57.2 58.3 47.6 60.6 54.3 67.0 68.7 68.7 66.3 66.3 49.5 52.9
Q.III 58.1 58.4 57.5 58.7 50.9 58.9 55.9 69.4 62.5 62.5 71.8 71.8 51.0 54.3
Q.IV 60.0 60.6 59.1 61.1 53.1 59.6 59.6 73.1 63.9 63.9 73.6 73.6 52.0 56.0
2009/10
Q.I 61.9 61.2 62.8 62.8 56.4 64.3 62.5 74.5 68.9 68.9 77.7 77.7 54.2 59.4
Q.II 63.3 60.9 67.0 64.0 59.4 69.8 64.9 76.9 74.3 74.3 79.8 79.8 57.2 67.9
Q.III 64.1 60.6 69.4 67.5 63.3 71.5 68.6 82.0 77.3 77.3 77.3 77.3 58.7 72.5
Q.IV 64.1 58.9 72.0 74.3 65.8 74.0 71.3 85.5 79.1 79.1 79.1 79.1 60.9 73.1
2010/11
Q.I 65.0 59.1 74.2 72.2 69.7 75.8 74.5 83.9 78.9 78.9 82.6 82.6 61.9 74.0
Q.II 69.3 63.0 79.1 81.1 74.9 81.3 78.4 88.8 83.7 83.7 89.0 89.0 67.1 80.0
Q.III 78.0 73.5 84.8 83.3 81.3 88.6 84.5 90.6 90.0 90.0 90.0 90.0 70.7 84.6
Q.IV 91.0 91.5 90.3 94.7 88.1 93.0 88.3 94.5 102.7 102.7 91.4 91.4 82.8 89.5
2011/12
Q.I 99.0 98.0 100.6 106.5 91.4 92.3 92.8 97.1 413.3 413.3 95.7 95.7 90.0 93.6
Q.II 99.2 100.5 97.2 103.3 97.0 96.5 97.8 98.6 99.7 99.7 99.1 99.1 96.5 97.5
Q.III 107.1 109.3 104.0 105.8 103.7 104.8 102.5 100.3 99.4 100.0 105.1 100.0 104.9 103.1
Q.IV 113.9 120.1 105.6 106.6 108.1 104.4 106.6 103.2 99.7 100.0 106.8 100.0 111.1 105.6
2012/13
Q.I 118.6 123.1 112.7 112.3 114.6 115.0 111.4 108.7 97.6 100.1 112.8 100.0 115.9 107.1
Q.II 120.8 121.7 119.6 114.5 120.3 124.4 113.9 168.7 101.3 100.3 117.8 100.0 118.4 102.2
Q.III 121.6 122.6 120.2 118.4 123.1 122.8 115.7 153.2 104.7 100.2 122.2 100.0 119.6 109.3
Q.IV 124.0 125.5 122.0 122.6 127.0 123.4 118.2 150.1 106.1 100.0 124.0 101.0 123.2 112.2
2013/14
Q.I 129.4 130.6 127.9 125.5 130.6 133.2 120.3 153.3 111.0 100.0 125.2 101.0 126.9 113.5
Q.II 130.6 129.7 131.8 126.5 132.8 140.3 121.2 160.4 108.8 100.0 127.3 101.0 128.9 114.6
Q.III 132.4 131.2 134.1 128.9 135.4 142.9 124.9 165.2 105.2 100.0 124.2 101.0 131.0 115.5
Q.IV 135.1 134.5 136.0 133.6 143.3 128.4 166.5 107.6 100.0 126.4 101.0 132.4 116.0 116.0
2014/15
Q.I 135.6 134.9 136.3 136.7 141.8 129.2 170.1 104.1 100.0 134.4 101.0 134.5 116.4 116.4
Q.II 135.2 134.0 136.1 137.3 145.3 139.0 131.2 172.1 106.8 100.0 140.3 101.0 135.2 118.3
Q.III 137.9 138.0 137.8 142.1 149.2 140.2 131.9 180.1 100.0 100.0 137.3 101.0 136.2 118.9
Q.IV 142.0 149.2 136.6 145.6 150.0 135.7 133.2 182.7 94.9 100.3 136.6 101.0 138.1 119.5
2015/16
Q.I 144.4 152.3 138.4 144.8 150.1 137.9 136.0 180.2 99.2 101.2 149.9 101.0 145.6 120.3
Q.II 143.1 150.3 137.8 146.1 150.8 135.0 136.7 182.2 99.8 101.3 148.7 101.0 148.3 120.9
QIII 145.1 148.1 142.9 150.2 153.4 143.2 140.5 187.7 101.9 100.0 143.1 101.0 149.8 121.7
QIV 145.4 148.9 142.7 150.5 153.7 142.4 140.9 189.4 102.5 96.6 144.3 101.0 150.3 122.9
2016/17
QII 154.0 162.6 147.6 159.7 157.2 145.3 146.1 205.9 114.2 89.0 155.5 101.0 160.4 124.0
QIII 159.3 172.5 149.5 171.1 162.6 140.9 149.3 213.5 132.6 98.1 155.3 101.0 165.1 126.4
QIV 168.9 193.0 151.1 147.2 165.3 142.5 168.4 226.6 136.0 102.7 166.6 101.0 174.4 129.3
2017/18
QI 174.1 197.5 156.6 173.7 169.0 143.1 172.4 226.8 147.2 102.7 169.2 101.0 184.9 130.5
QII 177.3 201.0 159.7 176.8 174.0 143.8 177.4 241.5 157.2 103.4 169.2 101.0 190.5 133.2
QIII 185.1 211.9 165.1 185.0 183.4 145.2 187.5 258.0 157.6 105.0 172.1 101.0 203.5 139.8
QIV 191.4 220.9 169.5 190.0 191.8 146.0 199.2 258.9 163.5 105.0 176.0 101.0 210.6 146.6
2018/19
QI 196.3 228.2 172.7 196.5 195.4 146.1 208.3 264.4 165.2 111.1 180.3 101.0 216.1 150.8
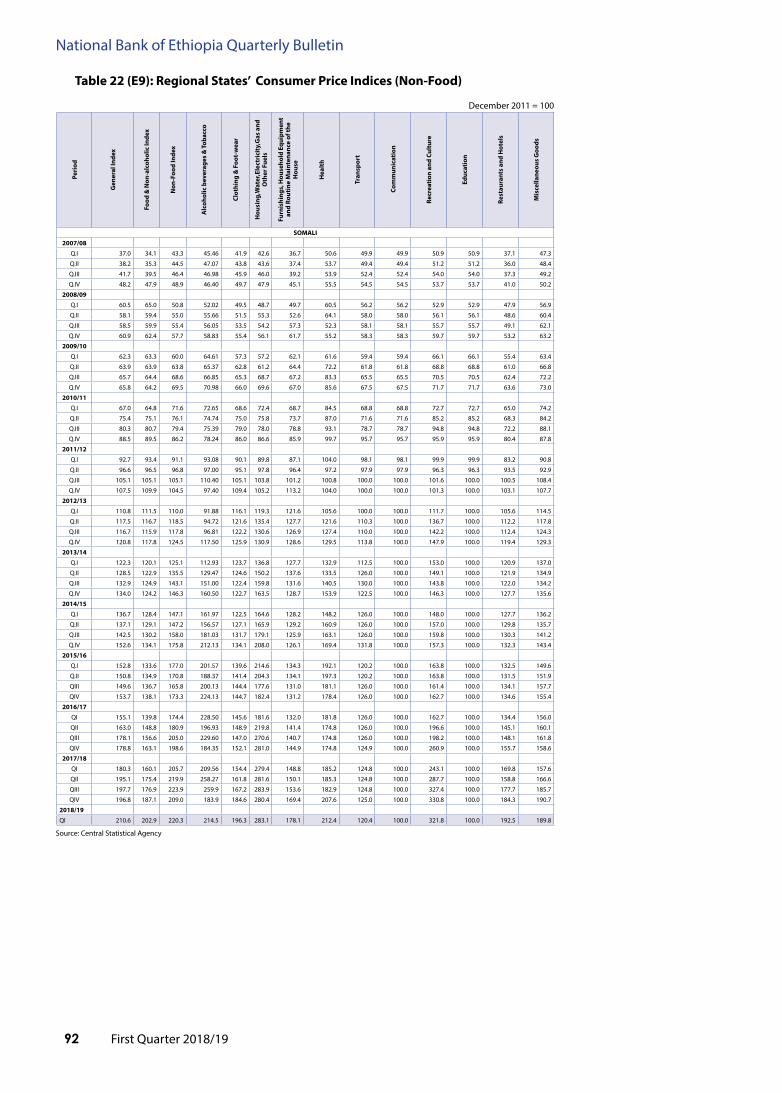
First Quarter 2018/1992
National Bank of Ethiopia Quarterly Bulletin
table 22 (E9): Regional States’ Consumer price indices (Non-food)
December 2011 = 100
Source: Central Statistical Agency
peri
od
Gen
eral
inde
x
food
& N
on-a
lcoh
olic
inde
x
Non
-foo
d in
dex
alc
ohol
ic b
ever
ages
& t
obac
co
Clot
hing
& f
oot-
wea
r
hou
sing
,Wat
er,E
lect
rici
ty,G
as a
nd
oth
er f
uels
furn
ishi
ngs,
hou
seho
ld E
quip
men
t an
d Ro
utin
e M
aint
enan
ce o
f the
h
ouse
hea
lth
tran
spor
t
Com
mun
icat
ion
Recr
eati
on a
nd C
ultu
re
Educ
atio
n
Rest
aura
nts
and
hot
els
Mis
cella
neou
s G
oods
SoMali
2007/08
Q.I 37.0 34.1 43.3 45.46 41.9 42.6 36.7 50.6 49.9 49.9 50.9 50.9 37.1 47.3
Q.II 38.2 35.3 44.5 47.07 43.8 43.6 37.4 53.7 49.4 49.4 51.2 51.2 36.0 48.4
Q.III 41.7 39.5 46.4 46.98 45.9 46.0 39.2 53.9 52.4 52.4 54.0 54.0 37.3 49.2
Q.IV 48.2 47.9 48.9 46.40 49.7 47.9 45.1 55.5 54.5 54.5 53.7 53.7 41.0 50.2
2008/09
Q.I 60.5 65.0 50.8 52.02 49.5 48.7 49.7 60.5 56.2 56.2 52.9 52.9 47.9 56.9
Q.II 58.1 59.4 55.0 55.66 51.5 55.3 52.6 64.1 58.0 58.0 56.1 56.1 48.6 60.4
Q.III 58.5 59.9 55.4 56.05 53.5 54.2 57.3 52.3 58.1 58.1 55.7 55.7 49.1 62.1
Q.IV 60.9 62.4 57.7 58.83 55.4 56.1 61.7 55.2 58.3 58.3 59.7 59.7 53.2 63.2
2009/10
Q.I 62.3 63.3 60.0 64.61 57.3 57.2 62.1 61.6 59.4 59.4 66.1 66.1 55.4 63.4
Q.II 63.9 63.9 63.8 65.37 62.8 61.2 64.4 72.2 61.8 61.8 68.8 68.8 61.0 66.8
Q.III 65.7 64.4 68.6 66.85 65.3 68.7 67.2 83.3 65.5 65.5 70.5 70.5 62.4 72.2
Q.IV 65.8 64.2 69.5 70.98 66.0 69.6 67.0 85.6 67.5 67.5 71.7 71.7 63.6 73.0
2010/11
Q.I 67.0 64.8 71.6 72.65 68.6 72.4 68.7 84.5 68.8 68.8 72.7 72.7 65.0 74.2
Q.II 75.4 75.1 76.1 74.74 75.0 75.8 73.7 87.0 71.6 71.6 85.2 85.2 68.3 84.2
Q.III 80.3 80.7 79.4 75.39 79.0 78.0 78.8 93.1 78.7 78.7 94.8 94.8 72.2 88.1
Q.IV 88.5 89.5 86.2 78.24 86.0 86.6 85.9 99.7 95.7 95.7 95.9 95.9 80.4 87.8
2011/12
Q.I 92.7 93.4 91.1 93.08 90.1 89.8 87.1 104.0 98.1 98.1 99.9 99.9 83.2 90.8
Q.II 96.6 96.5 96.8 97.00 95.1 97.8 96.4 97.2 97.9 97.9 96.3 96.3 93.5 92.9
Q.III 105.1 105.1 105.1 110.40 105.1 103.8 101.2 100.8 100.0 100.0 101.6 100.0 100.5 108.4
Q.IV 107.5 109.9 104.5 97.40 109.4 105.2 113.2 104.0 100.0 100.0 101.3 100.0 103.1 107.7
2012/13
Q.I 110.8 111.5 110.0 91.88 116.1 119.3 121.6 105.6 100.0 100.0 111.7 100.0 105.6 114.5
Q.II 117.5 116.7 118.5 94.72 121.6 135.4 127.7 121.6 110.3 100.0 136.7 100.0 112.2 117.8
Q.III 116.7 115.9 117.8 96.81 122.2 130.6 126.9 127.4 110.0 100.0 142.2 100.0 112.4 124.3
Q.IV 120.8 117.8 124.5 117.50 125.9 130.9 128.6 129.5 113.8 100.0 147.9 100.0 119.4 129.3
2013/14
Q.I 122.3 120.1 125.1 112.93 123.7 136.8 127.7 132.9 112.5 100.0 153.0 100.0 120.9 137.0
Q.II 128.5 122.9 135.5 129.47 124.6 150.2 137.6 133.5 126.0 100.0 149.1 100.0 121.9 134.9
Q.III 132.9 124.9 143.1 151.00 122.4 159.8 131.6 140.5 130.0 100.0 143.8 100.0 122.0 134.2
Q.IV 134.0 124.2 146.3 160.50 122.7 163.5 128.7 153.9 122.5 100.0 146.3 100.0 127.7 135.6
2014/15
Q.I 136.7 128.4 147.1 161.97 122.5 164.6 128.2 148.2 126.0 100.0 148.0 100.0 127.7 136.2
Q.II 137.1 129.1 147.2 156.57 127.1 165.9 129.2 160.9 126.0 100.0 157.0 100.0 129.8 135.7
Q.III 142.5 130.2 158.0 181.03 131.7 179.1 125.9 163.1 126.0 100.0 159.8 100.0 130.3 141.2
Q.IV 152.6 134.1 175.8 212.13 134.1 208.0 126.1 169.4 131.8 100.0 157.3 100.0 132.3 143.4
2015/16
Q.I 152.8 133.6 177.0 201.57 139.6 214.6 134.3 192.1 120.2 100.0 163.8 100.0 132.5 149.6
Q.II 150.8 134.9 170.8 188.37 141.4 204.3 134.1 197.3 120.2 100.0 163.8 100.0 131.5 151.9
QIII 149.6 136.7 165.8 200.13 144.4 177.6 131.0 181.1 126.0 100.0 161.4 100.0 134.1 157.7
QIV 153.7 138.1 173.3 224.13 144.7 182.4 131.2 178.4 126.0 100.0 162.7 100.0 134.6 155.4
2016/17
QI 155.1 139.8 174.4 228.50 145.6 181.6 132.0 181.8 126.0 100.0 162.7 100.0 134.4 156.0
QII 163.0 148.8 180.9 196.93 148.9 219.8 141.4 174.8 126.0 100.0 196.6 100.0 145.1 160.1
QIII 178.1 156.6 205.0 229.60 147.0 270.6 140.7 174.8 126.0 100.0 198.2 100.0 148.1 161.8
QIV 178.8 163.1 198.6 184.35 152.1 281.0 144.9 174.8 124.9 100.0 260.9 100.0 155.7 158.6
2017/18
QI 180.3 160.1 205.7 209.56 154.4 279.4 148.8 185.2 124.8 100.0 243.1 100.0 169.8 157.6
QII 195.1 175.4 219.9 258.27 161.8 281.6 150.1 185.3 124.8 100.0 287.7 100.0 158.8 166.6
QIII 197.7 176.9 223.9 259.9 167.2 283.9 153.6 182.9 124.8 100.0 327.4 100.0 177.7 185.7
QIV 196.8 187.1 209.0 183.9 184.6 280.4 169.4 207.6 125.0 100.0 330.8 100.0 184.3 190.7
2018/19
QI 210.6 202.9 220.3 214.5 196.3 283.1 178.1 212.4 120.4 100.0 321.8 100.0 192.5 189.8

First Quarter 2018/19 93
National Bank of Ethiopia Quarterly Bulletin
table 22 (E10): Regional States’ Consumer price indices (Non-food)
December 2011 = 100P
erio
d
Gen
eral
In
dex
Food
& N
on-a
lcoh
olic
In
dex
Non
-Foo
d I
nd
ex
Alc
ohol
ic b
ever
ages
& T
obac
co
Clo
thin
g &
Foo
t-w
ear
Hou
sin
g,W
ater
,Ele
ctri
city
,Gas
an
d O
ther
Fu
els
Furn
ish
ings
, Hou
seh
old
E
qu
ipm
ent a
nd
Rou
tin
e M
ain
ten
ance
of
the
Hou
se
Hea
lth
Tra
nsp
ort
Com
mu
nic
atio
n
Rec
reat
ion
an
d C
ult
ure
Ed
uca
tion
Res
tau
ran
ts a
nd
Hot
els
Mis
cell
aneo
us
Goo
ds
TIGRAY
2007/08 Q.I 44.8 46.4 42.5 33.9 30.8 56.4 38.2 70.1 53.3 53.3 54.2 54.2 38.8 42.6Q.II 47.3 49.6 43.9 32.8 31.3 60.2 40.4 67.5 52.0 52.0 55.6 55.6 42.4 41.8Q.III 50.1 53.6 44.8 35.7 31.6 59.9 42.9 67.0 56.8 56.8 55.6 55.6 44.3 43.6Q.IV 59.3 66.6 48.4 40.5 34.8 64.1 47.8 68.3 58.9 58.9 57.0 57.0 48.1 45.3
2008/09 Q.I 74.8 89.5 53.2 50.3 39.1 70.7 50.9 68.0 58.9 58.9 58.7 58.7 54.1 47.8Q.II 72.8 84.3 55.9 49.1 42.6 74.1 53.0 67.8 61.2 61.2 60.0 60.0 55.6 48.9Q.III 67.9 75.9 56.1 49.9 44.6 72.8 53.3 69.7 53.2 53.2 58.8 58.8 57.1 50.5Q.IV 68.0 74.1 59.0 55.5 47.0 75.0 56.6 71.9 53.1 53.1 62.5 62.5 57.6 56.8
2009/10 Q.I 70.2 74.9 63.3 62.5 51.1 79.0 60.0 73.2 62.4 62.4 67.2 67.2 62.7 62.6Q.II 71.5 75.4 65.8 62.9 54.2 81.1 63.4 76.7 68.7 68.7 64.7 64.7 64.6 64.7Q.III 71.1 73.5 67.7 66.9 55.9 81.4 67.9 82.1 72.1 72.1 67.3 67.3 66.2 65.4Q.IV 73.3 75.8 69.7 66.7 59.0 83.3 69.1 85.7 74.8 74.8 70.2 70.2 68.0 65.7
2010/11 Q.I 73.5 75.8 70.2 69.0 61.8 80.6 69.7 83.4 74.3 74.3 74.7 74.7 68.8 67.1Q.II 74.7 74.3 75.2 70.4 68.1 83.5 72.9 88.6 80.3 80.3 82.9 82.9 71.6 76.3Q.III 77.9 76.6 79.7 70.2 73.4 88.1 77.0 89.8 88.2 88.2 84.3 84.3 74.1 78.9Q.IV 87.8 88.8 86.4 77.2 82.2 93.1 82.0 95.2 102.5 102.5 91.3 91.3 85.4 83.6
2011/12 Q.I 95.3 98.1 91.2 91.3 87.3 97.3 87.4 92.1 102.9 102.9 94.3 94.3 94.2 88.9Q.II 100.1 101.7 97.8 97.5 96.3 100.4 95.4 99.8 98.9 98.9 100.3 100.3 99.0 97.8Q.III 104.8 106.0 103.7 99.4 103.7 102.9 102.8 108.9 100.0 100.0 103.8 100.0 110.3 103.7Q.IV 111.4 115.6 107.2 101.4 110.3 105.2 107.6 105.3 102.7 100.0 104.9 100.0 114.3 107.9
2012/13 Q.I 118.7 122.9 114.5 103.6 115.7 117.9 113.0 111.3 103.5 100.0 110.9 100.0 125.5 109.4Q.II 119.5 119.8 119.3 106.1 121.3 123.3 113.5 110.7 103.4 100.0 141.1 100.0 135.8 110.2Q.III 119.5 118.2 120.8 113.9 126.4 123.4 111.6 108.1 103.4 100.0 140.9 100.0 136.9 113.4Q.IV 125.5 124.3 126.7 116.6 133.5 132.0 126.3 115.9 98.6 100.0 144.5 100.0 138.0 115.0
2013/14 Q.I 132.5 136.2 128.8 120.7 137.4 132.2 126.8 112.5 94.6 100.0 148.7 100.0 144.5 119.2Q.II 131.3 131.9 130.6 122.2 141.2 133.1 129.4 116.7 105.8 100.0 146.2 100.0 143.5 119.2Q.III 130.1 124.6 135.4 121.8 144.4 144.0 136.4 123.1 104.8 100.0 147.8 100.0 145.6 118.0Q.IV 130.5 128.1 132.9 128.7 145.3 135.3 130.3 128.2 107.8 100.0 145.2 103.3 147.9 114.1
2014/15 Q.I 133.3 130.4 136.1 134.6 148.5 149.2 129.9 126.6 109.2 100.0 145.3 106.0 130.7 119.8Q.II 139.2 131.3 147.0 137.6 151.9 173.5 133.1 136.5 110.3 100.0 149.4 107.4 145.9 123.6Q.III 136.4 127.2 145.4 139.8 155.5 162.1 137.6 149.0 109.2 100.0 151.8 109.2 147.5 123.8Q.IV 140.5 129.2 151.5 137.8 154.7 181.1 143.5 136.1 106.7 100.0 154.3 111.1 148.6 125.5
2015/16 Q.I 145.7 139.6 151.6 131.7 162.0 178.3 140.8 133.9 106.7 102.9 156.7 112.5 149.9 128.4Q.II 147.2 143.3 151.1 132.5 161.9 176.5 139.2 135.6 107.3 104.1 158.1 112.9 150.3 128.6QIII 151.6 146.7 156.4 138.7 165.7 189.2 144.2 139.6 106.1 105.7 163.3 114.7 151.6 124.7QIV 156.3 146.4 166.0 144.0 164.5 220.1 146.5 138.1 105.7 106.4 168.6 115.5 151.2 125.3
2016/17 QI 158.7 145.7 171.4 143.0 164.4 238.4 146.2 139.8 105.9 105.9 169.0 115.9 151.6 126.7QII 174.4 156.9 191.6 138.9 173.8 293.8 161.8 159.9 103.9 105.7 200.3 119.0 149.3 129.9QIII 168.2 153.9 182.3 143.3 170.7 258.5 166.6 157.4 107.6 106.1 214.3 119.6 148.0 132.0QIV 165.8 163.9 167.8 110.9 160.7 216.0 175.1 114.6 109.7 124.9 190.1 120.0 152.5 136.0
2017/18 QI 174.8 171.4 178.0 149.5 170.4 222.7 177.0 122.1 112.2 105.9 189.9 120.8 184.4 134.4QII 179.6 177.6 181.6 163.9 176.6 221.4 182.9 117.7 114.8 105.9 189.1 120.8 190.4 138.7QIII 179.0 174.6 183.4 142.6 185.4 218.8 195.4 125.2 114.9 105.9 190.8 120.8 191.6 144.3QIV 188.8 187.9 189.6 149.9 196.8 218.5 209.5 122.9 117.6 105.9 197.9 120.8 201.7 150.7
2018/19 QI 198.9 202.8 195.1 187.6 196.5 222.7 211.3 129.3 117.8 105.9 200.8 119.6 209.8 154.2

First Quarter 2018/1994
National Bank of Ethiopia Quarterly Bulletin
table 22 (f1): Regional States’ Consumer price index (food)
December 2011 = 100
Source: Central Statistical Agency
peri
od
food
& N
on-a
lcoh
olic
Be
vera
ges
Brea
d an
d Ce
real
s
Mea
t
Milk
, Che
ese
& E
gg
oils
& f
ats
fru
its
Vege
tabl
es
Suga
r, ja
m, h
oney
, ch
ocol
ate
and
conf
ecti
oner
y (N
D)
food
pro
duct
s
Non
-alc
ohol
ic B
ever
ages
afaR
2007/08
Q.I 36.6 33.7 39.5 41.2 56.0 42.4 42.4 42.5 83.6 26.1
Q.II 37.8 34.7 41.2 42.7 61.7 45.7 45.7 40.4 81.4 26.4
Q.III 39.6 37.0 43.6 41.7 68.1 55.5 55.5 41.8 76.8 27.7
Q.IV 48.0 51.5 48.5 51.0 77.7 56.8 56.8 47.5 87.3 30.3
2008/09
Q.I 60.5 70.8 53.8 58.0 79.2 72.1 72.1 53.0 99.0 35.6
Q.II 58.7 68.7 51.2 55.9 74.5 69.0 69.0 56.3 75.4 36.4
Q.III 56.6 65.1 51.4 57.5 75.3 69.7 69.7 65.7 53.1 35.9
Q.IV 58.8 67.2 63.7 56.1 73.6 83.2 83.2 73.8 38.4 41.7
2009/10
Q.I 61.7 70.3 59.7 63.3 72.7 79.2 79.2 80.2 39.4 43.2
Q.II 64.7 71.0 60.2 74.0 71.6 73.6 73.6 83.5 48.2 45.3
Q.III 64.6 69.5 65.9 72.6 74.1 68.8 68.8 89.3 49.4 49.9
Q.IV 65.0 68.0 69.5 72.6 80.7 79.6 79.6 91.6 69.5 49.6
2010/11
Q.I 66.3 69.5 76.5 72.9 81.4 93.4 93.4 87.2 74.0 48.9
Q.II 69.7 67.6 81.5 76.1 94.6 96.0 96.0 91.5 63.4 57.9
Q.III 74.9 72.6 80.7 87.4 101.8 95.2 95.2 84.8 60.6 72.7
Q.IV 80.4 83.6 89.7 79.7 104.4 103.2 103.2 89.0 98.7 77.8
2011/12
Q.I 86.7 90.6 102.3 81.2 99.7 104.9 104.9 95.4 121.3 79.4
Q.II 95.4 99.8 101.6 99.3 100.1 99.9 99.9 104.5 118.3 88.8
Q.III 105.1 104.3 110.9 102.1 100.0 102.9 115.4 104.3 109.7 104.2
Q.IV 111.8 108.7 140.2 109.2 101.7 102.7 138.0 112.0 123.3 97.6
2012/13
Q.I 117.9 114.3 159.9 123.7 102.2 109.4 142.6 118.2 111.6 100.2
Q.II 117.9 115.2 154.4 133.7 101.6 111.6 128.2 112.9 106.3 96.1
Q.III 113.8 110.8 165.4 132.5 101.1 117.5 107.0 117.5 110.2 90.5
Q.IV 116.0 113.8 187.6 133.1 105.3 130.5 119.2 119.6 94.5 87.4
2013/14
Q.I 124.8 122.8 186.2 139.7 104.2 129.5 158.4 120.9 96.3 85.1
Q.II 126.0 131.4 185.4 145.4 104.2 129.3 117.9 119.5 104.4 85.4
Q.III 122.6 122.3 189.1 143.0 105.8 138.8 119.9 120.9 101.4 91.7
Q.IV 126.9 120.9 197.0 144.4 112.2 140.9 136.9 118.2 125.2 101.8
2014/15
Q.I 129.7 120.9 195.0 141.3 119.4 154.2 137.2 132.9 161.8 104.9
Q.II 129.1 118.7 201.3 140.5 110.8 151.3 146.6 148.3 144.1 108.9
Q.III 129.5 119.5 204.9 142.8 121.8 155.4 144.3 143.4 141.0 103.7
Q.IV 139.0 117.5 206.7 155.1 136.5 159.7 157.9 134.3 241.0 103.2
2015/16
Q.I 153.3 123.3 214.5 156.2 147.3 177.0 186.7 121.5 384.7 102.1
Q.II 155.9 124.6 204.4 156.2 143.3 171.2 195.4 119.5 412.6 102.7
Q.III 147.3 126.9 207.7 161.6 133.8 178.8 197.9 114.1 243.5 100.5
Q.IV 147.3 129.0 208.9 164.5 129.6 179.9 192.8 117.1 227.3 101.2
2016/17
QI 147.3 131.8 211.3 166.8 128.1 184.9 187.7 118.9 206.7 100.9
QII 153.6 135.3 244.0 189.5 141.9 181.1 198.8 130.1 149.6 107.0
QIII 148.7 130.7 235.7 183.1 153.0 183.8 187.8 141.2 126.1 106.8
QIV 151.2 137.1 267.7 169.5 169.9 191.8 196.3 143.3 129.3 107.4
2017/18
QI 159.6 154.5 285.6 169.2 171.3 209.5 204.5 144.1 124.3 109.3
QII 168.6 166.0 306.0 169.9 165.2 229.5 206.6 161.4 155.6 120.3
QIII 175.6 167.4 296.6 175.6 168.4 252.7 200.4 175.7 241.8 119.2
QIV 174.5 159.9 316.2 201.4 145.9 241.8 200.7 136.4 221.1 121.7
2018/19
QI 181.1 169.7 322.1 199.1 157.1 246.1 237.6 113.8 206.9 125.6

First Quarter 2018/19 95
National Bank of Ethiopia Quarterly Bulletin
table 22 (f2): Regional States’ Consumer price index (food)
December 2011 = 100pe
riod
food
& N
on-a
lcoh
olic
Be
vera
ges
Brea
d an
d Ce
real
s
Mea
t
Milk
, Che
ese
& E
gg
oils
& f
ats
fru
its
Vege
tabl
es
Suga
r, ja
m, h
oney
, cho
cola
te
and
conf
ecti
oner
y (N
D)
food
pro
duct
s
Non
-alc
ohol
ic B
ever
ages
aMhaRa
2007/08
Q.I 43.6 42.6 40.4 40.6 42.5 37.3 37.3 44.6 74.8 24.0
Q.II 46.3 45.7 42.8 42.1 47.2 42.9 42.9 42.9 75.6 28.3
Q.III 48.1 48.6 45.4 42.5 52.0 46.5 46.5 47.1 69.9 31.1
Q.IV 58.7 62.2 47.6 47.9 59.0 49.0 49.0 55.6 83.7 31.6
2008/09
Q.I 77.0 87.2 50.6 58.7 58.9 57.7 57.7 69.5 94.6 31.4
Q.II 73.3 86.0 52.9 59.8 57.2 53.6 53.6 77.3 74.8 32.5
Q.III 65.5 79.6 54.2 62.4 55.4 61.8 61.8 90.3 48.0 32.2
Q.IV 64.3 78.7 58.6 65.6 56.2 69.8 69.8 92.1 36.9 32.5
2009/10
Q.I 66.5 80.6 57.8 68.5 55.6 66.7 66.7 92.8 41.1 35.1
Q.II 65.1 78.8 59.8 71.0 52.4 62.6 62.6 94.9 45.7 43.2
Q.III 64.1 74.7 63.3 72.2 53.3 67.3 67.3 95.7 50.5 46.1
Q.IV 65.1 74.3 64.8 73.2 48.8 68.9 68.9 97.9 67.0 45.5
2010/11
Q.I 66.3 73.5 65.5 74.4 60.9 76.0 76.0 96.6 76.1 46.5
Q.II 68.1 72.1 66.7 81.0 72.9 86.2 86.2 98.2 73.4 52.2
Q.III 71.4 74.4 62.7 82.9 79.2 91.7 91.7 95.0 75.4 69.1
Q.IV 85.9 83.1 72.1 88.1 108.7 92.6 92.6 99.1 107.9 89.7
2011/12
Q.I 95.7 91.1 87.3 93.1 112.1 90.8 90.8 98.1 126.5 92.4
Q.II 101.4 98.7 96.4 98.5 103.7 94.4 94.4 99.4 127.8 97.9
Q.III 104.3 104.8 106.0 104.5 102.2 106.5 105.2 99.9 102.9 101.6
Q.IV 113.0 114.7 124.8 110.2 108.7 108.6 109.6 100.3 118.3 95.3
2012/13
Q.I 120.1 122.7 135.6 113.2 108.3 114.3 113.6 99.7 135.7 89.8
Q.II 119.2 123.7 136.5 130.8 105.7 135.1 106.8 99.5 138.5 86.6
Q.III 118.6 122.0 139.3 137.9 105.3 138.5 104.9 99.4 139.6 83.4
Q.IV 122.0 126.8 141.3 142.3 110.7 137.8 104.7 99.4 148.9 81.5
2013/14
Q.I 127.0 135.1 145.4 143.6 110.4 144.2 109.4 99.4 153.2 81.5
Q.II 126.0 137.6 145.0 146.4 109.9 152.1 103.2 99.3 151.5 82.7
Q.III 123.9 123.5 147.7 147.3 109.5 151.6 112.3 100.0 150.1 82.5
Q.IV 125.6 126.2 147.9 149.2 114.0 152.6 107.6 100.6 156.9 90.5
2014/15
Q.I 127.3 131.3 150.5 154.7 120.3 160.1 105.7 99.7 152.5 98.1
Q.II 127.6 128.9 149.6 155.4 122.6 152.4 110.0 99.9 150.3 101.8
Q.III 128.7 124.3 154.4 161.4 132.9 164.4 115.6 100.5 149.3 102.0
Q.IV 131.1 128.0 159.8 176.8 143.2 169.3 113.5 100.3 153.6 97.1
2015/16
Q.I 139.0 134.8 163.9 174.4 153.1 181.3 129.9 100.3 158.6 94.8
Q.II 141.6 137.3 165.5 172.8 152.6 187.8 135.2 100.3 160.6 93.9
Q.III 140.6 138.8 167.0 177.0 144.1 192.7 131.1 100.2 160.5 91.8
Q.IV 141.1 139.7 168.6 180.6 141.6 194.4 131.4 108.4 160.8 90.4
2016/17
QI 141.2 139.3 169.1 185.0 139.4 198.3 131.5 116.7 161.8 90.4
QII 155.4 143.2 192.6 197.9 140.7 211.2 134.1 118.2 215.9 102.0
QIII 156.7 141.8 195.6 204.4 145.0 217.8 133.4 125.2 221.3 104.3
QIV 168.6 154.5 218.3 224.9 148.3 231.5 131.1 125.0 256.7 101.4
2017/18
QI 181.9 175.5 223.4 229.1 147.6 266.5 135.4 125.0 285.7 104.7
QII 181.9 176.8 228.2 237.4 150.2 267.0 136.9 125.1 274.3 107.6
QIII 186.9 178.5 239.6 260.5 154.9 277.8 137.0 123.7 288.2 111.6
QIV 200.3 191.6 273.4 269.4 165.4 288.8 136.2 126.1 320.1 111.1
2018/19 QI 209.8 205.1 281.5 278.8 166.3 292.9 143.9 125.9 332.1 115.4

First Quarter 2018/1996
National Bank of Ethiopia Quarterly Bulletin
table 22 (f3): Regional States’ Consumer price index (food)
December 2011 = 100
peri
od
food
& N
on-a
lcoh
olic
Be
vera
ges
Brea
d an
d Ce
real
s
Mea
t
Milk
, Che
ese
& E
gg
oils
& f
ats
fru
its
Vege
tabl
es
Suga
r, ja
m, h
oney
, ch
ocol
ate
and
conf
ecti
oner
y (N
D)
food
pro
duct
s
Non
-alc
ohol
ic B
ever
ages
BENiShaNGUl GUMUZ
2007/08
Q.I 35.6 35.5 49.9 34.6 33.5 39.7 39.7 43.3 65.2 24.4
Q.II 39.2 38.8 48.7 35.1 35.8 39.7 39.7 41.9 81.1 24.9
Q.III 44.3 45.6 50.4 36.0 39.9 44.7 44.7 47.4 83.2 25.8
Q.IV 51.2 55.3 57.0 38.9 44.4 45.9 45.9 49.7 82.7 27.0
2008/09
Q.I 75.0 85.7 67.5 49.2 45.9 58.2 58.2 62.5 99.3 28.2
Q.II 67.0 81.3 69.4 52.1 47.9 62.3 62.3 68.1 76.2 27.0
Q.III 58.2 72.5 67.3 54.4 45.9 62.6 62.6 77.2 61.3 25.1
Q.IV 59.6 73.8 66.7 55.7 51.0 60.8 60.8 80.6 47.1 26.6
2009/10
Q.I 65.0 78.3 70.9 60.8 47.8 61.4 61.4 81.3 44.1 31.9
Q.II 59.2 70.4 64.1 63.3 46.4 58.9 58.9 83.8 47.8 41.7
Q.III 53.5 61.7 62.7 69.7 49.1 57.9 57.9 88.7 60.5 39.5
Q.IV 51.8 55.5 68.6 67.2 52.3 61.8 61.8 90.9 81.3 39.2
2010/11
Q.I 50.0 53.2 69.0 70.6 49.8 68.7 68.7 88.1 69.1 45.7
Q.II 51.5 51.4 76.5 73.6 52.4 67.7 67.7 92.4 73.3 55.3
Q.III 57.8 57.3 68.0 75.8 78.7 78.9 78.9 84.6 74.6 68.5
Q.IV 79.4 74.7 77.0 80.4 99.5 89.9 89.9 96.6 107.5 96.2
2011/12
Q.I 93.1 91.7 91.8 86.3 87.6 85.5 85.5 94.8 114.6 102.1
Q.II 100.4 99.3 97.8 96.1 99.9 91.7 91.7 98.5 144.5 101.6
Q.III 99.8 95.2 102.2 101.1 103.6 129.7 106.5 100.6 110.4 81.4
Q.IV 106.4 102.3 118.8 105.7 103.2 169.7 107.9 106.5 128.7 77.0
2012/13
Q.I 110.9 105.6 131.9 107.9 107.3 170.1 115.6 110.1 127.4 77.1
Q.II 109.5 106.8 133.0 116.5 112.2 179.8 103.6 110.2 130.0 76.5
Q.III 104.9 98.8 139.7 137.4 118.2 178.6 92.3 108.3 129.1 74.4
Q.IV 104.4 100.0 134.0 145.8 110.9 169.9 93.1 105.6 128.9 73.7
2013/14
Q.I 114.4 122.1 137.6 148.8 109.6 151.1 102.8 105.3 122.3 72.7
Q.II 121.6 139.1 141.6 144.1 110.4 177.1 98.8 105.3 129.3 77.6
Q.III 111.5 110.9 136.8 142.6 113.7 199.6 101.4 102.5 127.6 81.7
Q.IV 112.1 106.5 141.0 149.3 111.4 164.9 104.2 106.6 132.9 90.6
2014/15
Q.I 110.0 104.6 141.6 130.6 108.6 138.9 102.1 100.5 129.3 93.0
Q.II 111.3 98.8 138.9 136.9 113.1 162.6 110.0 99.1 138.6 97.5
Q.III 115.6 101.3 145.5 138.0 113.3 172.1 123.3 102.6 145.9 82.7
Q.IV 118.9 95.5 155.7 142.8 119.8 169.0 125.8 100.0 177.8 80.3
2015/16
Q.I 131.0 102.7 167.7 142.9 114.9 169.9 139.6 102.7 227.9 80.3
Q.II 132.8 101.4 167.7 140.7 113.5 205.7 146.5 104.2 234.6 78.6
Q.III 129.8 103.8 174.8 129.4 111.0 217.3 137.4 105.3 215.1 76.6
Q.IV 128.4 103.8 172.4 130.5 112.5 201.8 136.6 106.8 206.4 76.7
2016/17
QI 126.2 101.2 175.3 131.6 113.7 209.3 133.6 112.7 196.6 76.7
QII 131.7 104.1 182.4 159.5 115.1 226.9 133.1 112.3 211.5 95.8
QIII 132.7 102.1 183.0 164.3 124.6 228.3 135.3 119.2 227.6 79.3
QIV 145.1 118.1 204.6 172.8 124.8 229.4 148.8 120.6 233.5 83.0
2017/18
QI 162.2 155.4 220.5 173.9 122.9 212.6 151.7 121.5 241.8 84.7
QII 164.2 163.4 223.1 210.3 124.2 237.7 147.5 123.1 227.4 90.0
QIII 157.4 142.2 235.1 194.2 127.5 190.3 151.3 124.2 225.2 86.9
QIV 162.8 148.1 251.0 201.5 130.0 279.6 142.4 121.8 247.1 92.6
2018/19
QI 173.7 154.5 270.6 207.7 122.3 251.3 164.7 122.3 255.7 105.4

First Quarter 2018/19 97
National Bank of Ethiopia Quarterly Bulletin
table 22 (f4): Regional States’ Consumer price index (food)
December 2011 = 100pe
riod
food
& N
on-a
lcoh
olic
Be
vera
ges
Brea
d an
d Ce
real
s
Mea
t
Milk
, Che
ese
& E
gg
oils
& f
ats
fru
its
Vege
tabl
es
Suga
r, ja
m, h
oney
, ch
ocol
ate
and
conf
ecti
oner
y (N
D)
food
pro
duct
s
Non
-alc
ohol
ic B
ever
ages
DiRE DaWa
2007/08
Q.I 40.5 39.5 45.3 34.7 41.9 38.1 38.1 71.1 93.4 33.5
Q.II 41.5 40.2 46.0 36.1 48.8 39.9 39.9 71.5 86.2 34.8
Q.III 46.6 47.7 47.3 39.2 55.9 60.7 60.7 78.8 87.5 36.2
Q.IV 55.6 61.5 53.1 49.6 62.8 69.8 69.8 86.1 108.2 37.6
2008/09
Q.I 68.2 81.6 57.3 54.5 66.4 68.9 68.9 90.0 114.4 39.9
Q.II 68.4 86.2 57.4 59.2 62.4 63.4 63.4 90.9 90.2 43.3
Q.III 67.3 83.8 57.3 60.7 62.4 75.0 75.0 92.5 67.4 44.9
Q.IV 67.4 83.5 59.2 65.3 62.1 73.7 73.7 93.9 45.1 43.5
2009/10
Q.I 68.6 84.1 63.1 68.0 60.9 75.6 75.6 93.9 48.6 45.3
Q.II 67.3 81.7 58.9 72.8 60.2 57.3 57.3 94.2 52.3 51.0
Q.III 68.5 80.9 61.7 72.8 62.0 67.6 67.6 94.5 56.2 53.9
Q.IV 69.7 79.2 69.8 65.4 64.4 78.7 78.7 94.5 83.7 53.8
2010/11
Q.I 69.6 78.8 71.8 66.8 66.5 91.4 91.4 94.5 85.3 47.9
Q.II 73.5 79.9 72.6 73.0 78.9 102.5 102.5 95.7 74.6 48.9
Q.III 77.2 81.7 63.2 80.1 85.9 110.2 110.2 95.6 71.9 61.2
Q.IV 90.0 91.1 71.1 87.2 104.5 109.3 109.3 98.0 121.7 79.1
2011/12
Q.I 98.1 96.6 92.4 95.7 104.5 108.0 108.0 97.3 148.4 89.0
Q.II 100.4 100.6 100.2 94.7 96.7 101.4 101.4 100.2 133.8 94.7
Q.III 103.1 99.9 101.8 110.2 97.4 103.4 114.6 100.5 107.9 103.3
Q.IV 108.6 104.2 128.1 117.9 89.5 104.0 129.4 101.4 114.6 117.0
2012/13
Q.I 112.3 108.8 149.3 128.7 84.1 113.2 128.6 102.5 124.6 125.5
Q.II 112.1 110.7 147.8 129.3 86.0 123.8 117.5 101.4 126.2 129.7
Q.III 109.6 109.6 150.6 129.9 90.2 129.5 101.2 101.0 129.8 129.0
Q.IV 113.0 109.7 150.1 120.6 90.3 135.4 122.1 103.3 141.2 127.0
2013/14
Q.I 122.1 116.6 151.2 130.5 86.5 131.3 151.9 104.4 147.8 133.1
Q.II 121.8 122.9 149.8 126.7 89.6 128.5 125.9 106.8 147.9 137.3
Q.III 117.4 116.8 149.0 129.6 85.2 134.7 121.9 106.6 148.1 132.1
Q.IV 117.7 115.8 153.8 136.2 86.5 136.2 123.2 106.9 150.0 132.0
2014/15
Q.I 127.0 121.7 152.0 148.5 114.6 130.0 141.7 107.0 146.9 135.6
Q.II 129.4 124.0 163.6 149.0 114.7 142.1 144.7 113.6 148.1 135.2
Q.III 129.4 122.4 173.2 150.1 114.9 153.5 150.9 107.3 150.5 129.3
Q.IV 130.9 123.2 185.8 172.4 91.4 149.6 164.3 107.3 149.2 128.1
2015/16
Q.I 130.4 123.7 200.1 182.2 91.2 155.7 154.6 108.5 150.4 126.3
Q.II 129.7 123.2 200.0 173.1 91.2 154.9 154.6 110.6 149.9 127.1
Q.III 132.9 124.0 202.8 175.3 91.3 164.6 170.1 113.4 151.0 123.4
Q.IV 133.6 125.9 204.6 176.2 91.3 168.0 167.9 113.3 150.1 122.8
2016/17
QI 133.4 127.6 205.9 177.9 91.2 169.3 156.9 120.0 152.7 123.8
QII 146.5 130.7 228.2 199.6 101.4 163.7 196.3 134.0 194.8 139.4
QIII 143.8 127.8 228.0 198.8 101.6 182.9 178.6 141.4 217.7 143.6
QIV 151.1 131.8 234.8 197.5 102.3 198.7 194.3 144.3 271.4 147.6
2017/18
QI 156.5 138.0 244.1 208.8 102.4 238.0 187.0 146.3 304.4 157.5
QII 162.1 146.1 249.8 203.3 102.3 235.6 196.6 148.6 298.9 161.4
QIII 167.3 148.6 255.1 209.3 102.5 246.9 208.1 166.3 313.5 162.9
QIV 172.9 157.2 297.1 219.8 93.1 238.3 226.6 128.2 303.0 164.1
2018/19
QI 185.5 171.3 313.7 244.2 88.7 253.8 248.3 129.2 305.0 167.4
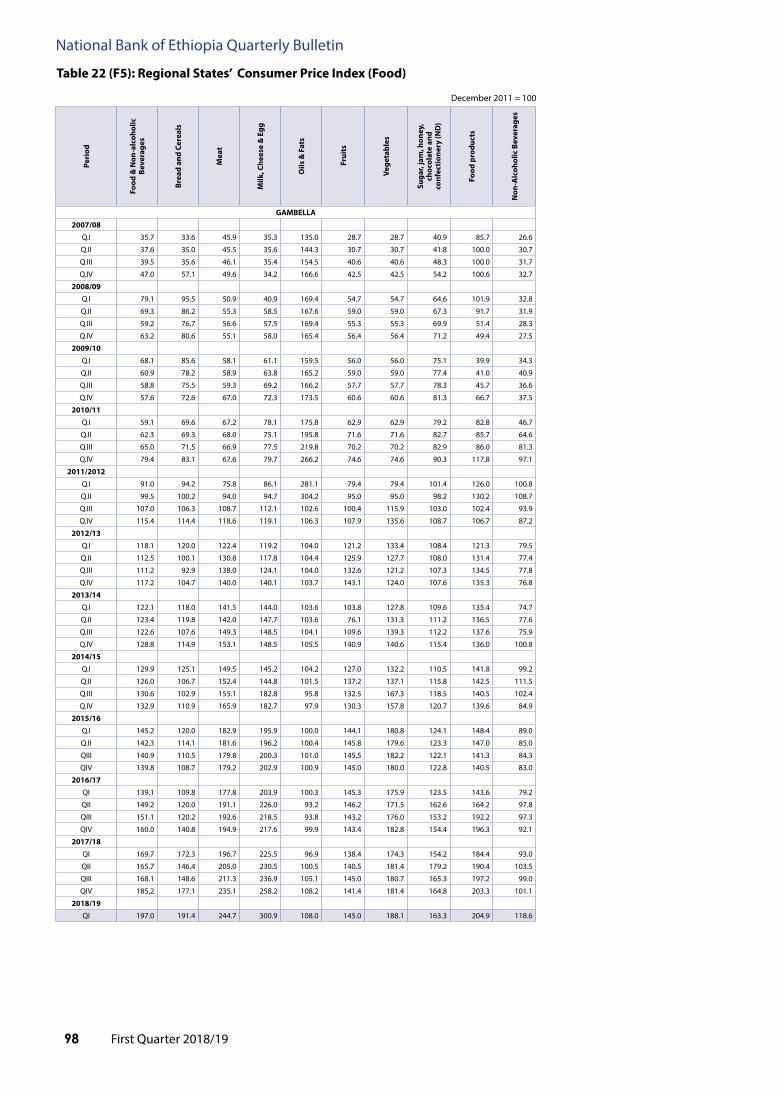
First Quarter 2018/1998
National Bank of Ethiopia Quarterly Bulletin
table 22 (f5): Regional States’ Consumer price index (food)
December 2011 = 100pe
riod
food
& N
on-a
lcoh
olic
Be
vera
ges
Brea
d an
d Ce
real
s
Mea
t
Milk
, Che
ese
& E
gg
oils
& f
ats
fru
its
Vege
tabl
es
Suga
r, ja
m, h
oney
, ch
ocol
ate
and
conf
ecti
oner
y (N
D)
food
pro
duct
s
Non
-alc
ohol
ic B
ever
ages
GaMBElla
2007/08
Q.I 35.7 33.6 45.9 35.3 135.0 28.7 28.7 40.9 85.7 26.6
Q.II 37.6 35.0 45.5 35.6 144.3 30.7 30.7 41.8 100.0 30.7
Q.III 39.5 35.6 46.1 35.4 154.5 40.6 40.6 48.3 100.0 31.7
Q.IV 47.0 57.1 49.6 34.2 166.6 42.5 42.5 54.2 100.6 32.7
2008/09
Q.I 79.1 95.5 50.9 40.9 169.4 54.7 54.7 64.6 101.9 32.8
Q.II 69.3 86.2 55.3 58.5 167.6 59.0 59.0 67.3 91.7 31.9
Q.III 59.2 76.7 56.6 57.5 169.4 55.3 55.3 69.9 51.4 28.3
Q.IV 63.2 80.6 55.1 58.0 165.4 56.4 56.4 71.2 49.4 27.5
2009/10
Q.I 68.1 85.6 58.1 61.1 159.5 56.0 56.0 75.1 39.9 34.3
Q.II 60.9 78.2 58.9 63.8 165.2 59.0 59.0 77.4 41.0 40.9
Q.III 58.8 75.5 59.3 69.2 166.2 57.7 57.7 78.3 45.7 36.6
Q.IV 57.6 72.6 67.0 72.3 173.5 60.6 60.6 81.3 66.7 37.5
2010/11
Q.I 59.1 69.6 67.2 78.1 175.8 62.9 62.9 79.2 82.8 46.7
Q.II 62.3 69.3 68.0 75.1 195.8 71.6 71.6 82.7 85.7 64.6
Q.III 65.0 71.5 66.9 77.5 219.8 70.2 70.2 82.9 86.0 81.3
Q.IV 79.4 83.1 67.6 79.7 266.2 74.6 74.6 90.3 117.8 97.1
2011/2012
Q.I 91.0 94.2 75.8 86.1 281.1 79.4 79.4 101.4 126.0 100.8
Q.II 99.5 100.2 94.0 94.7 304.2 95.0 95.0 98.2 130.2 108.7
Q.III 107.0 106.3 108.7 112.1 102.6 100.4 115.9 103.0 102.4 93.9
Q.IV 115.4 114.4 118.6 119.1 106.3 107.9 135.6 108.7 106.7 87.2
2012/13
Q.I 118.1 120.0 122.4 119.2 104.0 121.2 133.4 108.4 121.3 79.5
Q.II 112.5 100.1 130.8 117.8 104.4 125.9 127.7 108.0 131.4 77.4
Q.III 111.2 92.9 138.0 124.1 104.0 132.6 121.2 107.3 134.5 77.8
Q.IV 117.2 104.7 140.0 140.1 103.7 143.1 124.0 107.6 135.3 76.8
2013/14
Q.I 122.1 118.0 141.5 144.0 103.6 103.8 127.8 109.6 135.4 74.7
Q.II 123.4 119.8 142.0 147.7 103.6 76.1 131.3 111.2 136.5 77.6
Q.III 122.6 107.6 149.3 148.5 104.1 109.6 139.3 112.2 137.6 75.9
Q.IV 128.8 114.9 153.1 148.5 105.5 140.9 140.6 115.4 136.0 100.8
2014/15
Q.I 129.9 125.1 149.5 145.2 104.2 127.0 132.2 110.5 141.8 99.2
Q.II 126.0 106.7 152.4 144.8 101.5 137.2 137.1 115.8 142.5 111.5
Q.III 130.6 102.9 155.1 182.8 95.8 132.5 167.3 118.5 140.5 102.4
Q.IV 132.9 110.9 165.9 182.7 97.9 130.3 157.8 120.7 139.6 84.9
2015/16
Q.I 145.2 120.0 182.9 195.9 100.0 144.1 180.8 124.1 148.4 89.0
Q.II 142.3 114.1 181.6 196.2 100.4 145.8 179.6 123.3 147.0 85.0
QIII 140.9 110.5 179.8 200.3 101.0 145.5 182.2 122.1 141.3 84.3
QIV 139.8 108.7 179.2 202.9 100.9 145.0 180.0 122.8 140.5 83.0
2016/17
QI 139.1 109.8 177.8 203.9 100.3 145.3 175.9 123.5 143.6 79.2
QII 149.2 120.0 191.1 226.0 93.2 146.2 171.5 162.6 164.2 97.8
QIII 151.1 120.2 192.6 218.5 93.8 143.2 176.0 153.2 192.2 97.3
QIV 160.0 140.8 194.9 217.6 99.9 143.4 182.8 154.4 196.3 92.1
2017/18
QI 169.7 172.3 196.7 225.5 96.9 138.4 174.3 154.2 184.4 93.0
QII 165.7 146.4 205.0 230.5 100.5 140.5 181.4 179.2 190.4 103.5
QIII 168.1 148.6 211.3 236.9 105.1 145.0 180.7 165.3 197.2 99.0
QIV 185.2 177.1 235.1 258.2 108.2 141.4 181.4 164.8 203.3 101.1
2018/19
QI 197.0 191.4 244.7 300.9 108.0 145.0 188.1 163.3 204.9 118.6

First Quarter 2018/19 99
National Bank of Ethiopia Quarterly Bulletin
table 22 (f6): Regional States’ Consumer price index (food)
December 2011 = 100pe
riod
food
& N
on-a
lcoh
olic
Be
vera
ges
Brea
d an
d Ce
real
s
Mea
t
Milk
, Che
ese
& E
gg
oils
& f
ats
fru
its
Vege
tabl
es
Suga
r, ja
m, h
oney
, ch
ocol
ate
and
conf
ecti
oner
y (N
D)
food
pro
duct
s
Non
-alc
ohol
ic B
ever
ages
haRaRi
2007/08
Q.I 32.3 39.5 41.5 43.9 51.2 54.9 54.9 74.0 91.5 12.6
Q.II 33.2 40.7 40.5 43.7 56.1 56.6 56.6 74.8 86.0 13.2
Q.III 36.1 45.9 41.9 44.8 64.6 83.2 83.2 78.7 93.7 14.0
Q.IV 47.7 64.4 48.2 54.6 73.7 70.9 70.9 85.6 108.5 25.5
2008/09
Q.I 60.0 91.6 55.1 67.3 78.3 83.3 83.3 90.0 120.8 27.8
Q.II 59.1 92.0 55.0 61.5 72.8 75.7 75.7 92.8 98.3 28.3
Q.III 57.3 87.8 52.5 51.6 72.8 78.5 78.5 94.4 74.6 29.6
Q.IV 58.3 85.6 53.8 59.7 69.0 76.6 76.6 94.8 53.0 32.8
2009/10
Q.I 58.7 85.1 56.4 61.7 66.8 71.4 71.4 95.4 49.8 33.5
Q.II 58.9 81.9 56.6 61.8 68.0 69.4 69.4 94.4 49.7 36.8
Q.III 61.1 80.6 57.8 61.0 72.4 74.1 74.1 94.8 57.6 42.4
Q.IV 61.9 78.0 59.7 62.1 75.9 81.1 81.1 95.4 71.4 43.3
2010/11
Q.I 64.2 78.3 66.0 67.6 77.1 99.6 99.6 95.0 72.2 44.0
Q.II 68.5 78.2 70.4 69.7 89.3 111.6 111.6 95.8 67.2 50.1
Q.III 75.3 78.4 62.5 74.1 103.2 125.0 125.0 96.9 73.2 66.4
Q.IV 82.0 90.5 81.8 91.5 130.4 115.5 115.5 99.2 109.0 66.4
2011/12
Q.I 88.0 94.0 95.9 101.0 98.3 111.3 111.3 99.4 135.5 72.2
Q.II 92.0 99.9 98.6 101.2 100.2 102.5 102.5 99.8 137.7 78.4
Q.III 102.8 101.6 100.1 101.0 100.9 111.2 114.2 100.4 101.9 101.3
Q.IV 114.0 107.3 128.5 103.7 130.3 108.2 134.6 101.2 117.1 105.6
2012/13
Q.I 117.8 115.1 141.7 106.5 99.8 117.8 130.8 101.7 124.1 114.7
Q.II 119.4 118.1 144.4 114.0 98.7 109.1 127.1 101.2 113.9 115.3
Q.III 116.0 115.6 143.7 118.6 93.9 117.0 109.6 100.5 116.8 108.3
Q.IV 122.9 118.1 165.2 120.1 94.0 118.1 141.5 101.7 116.0 100.2
2013/14
Q.I 132.3 125.4 176.4 129.4 94.7 121.2 170.3 101.5 117.2 110.2
Q.II 131.6 132.9 168.5 120.6 94.8 107.6 146.3 100.7 115.3 104.0
Q.III 129.1 127.1 169.9 129.3 94.5 120.6 142.5 100.6 118.6 100.7
Q.IV 133.0 128.0 179.7 135.3 94.9 139.3 159.4 100.9 115.6 100.0
2014/15
Q.I 142.4 138.0 194.2 144.7 96.0 131.1 176.6 100.5 112.5 103.8
Q.II 144.1 142.3 187.7 137.9 96.1 128.2 182.4 101.4 117.6 100.7
Q.III 144.8 141.3 187.8 143.3 96.5 178.0 183.9 101.0 134.3 91.5
Q.IV 151.2 145.7 205.2 146.8 97.6 170.8 190.7 99.9 167.8 88.2
2015/16
Q.I 152.1 144.4 206.3 155.6 96.7 142.1 185.0 99.0 214.2 85.1
Q.II 153.9 146.1 206.4 156.3 97.6 137.1 190.8 99.9 216.5 85.8
QIII 155.1 142.1 208.1 165.2 98.4 137.7 209.6 99.4 224.1 85.83333333
QIV 156.6 144.0 207.6 165.1 98.4 146.5 214.8 108.2333333 218.4666667 83.9
2016/17
QI 155.7 143.8 206.7 165.4 98.4 151.3 207.7 116.6 211.9 83.7
QII 169.1 150.0 244.0 200.9 96.4 153.4 241.1 124.0 167.1 118.4
QIII 165.8 139.5 253.1 202.5 97.8 164.8 237.6 122.0 193.2 123.8
QIV 175.8 152.5 267.2 207.8 117.7 184.2 229.1 130.1 215.6 114.0
2017/18
QI 185.6 166.7 258.1 219.6 126.7 198.6 236.2 136.0 224.6 124.7
QII 186.4 174.6 253.9 217.0 105.2 201.4 239.3 130.7 191.8 121.4
QIII 184.1 168.7 248.3 249.5 104.3 219.3 223.0 125.4 209.7 117.9
QIV 194.5 179.2 282.4 238.6 105.4 215.9 237.0 128.0 217.6 123.7
2018/19
QI 208.7 192.8 299.3 265.2 107.4 188.9 269.2 126.9 212.0 122.8

First Quarter 2018/19100
National Bank of Ethiopia Quarterly Bulletin
table 22 (f7): Regional States’ Consumer price index (food)December 2011 = 100
peri
od
food
& N
on-a
lcoh
olic
Be
vera
ges
Brea
d an
d Ce
real
s
Mea
t
Milk
, Che
ese
& E
gg
oils
& f
ats
fru
its
Vege
tabl
es
Suga
r, ja
m, h
oney
, ch
ocol
ate
and
conf
ecti
oner
y (N
D)
food
pro
duct
s
Non
-alc
ohol
ic B
ever
ages
oRoMia
2007/08
Q.I 37.8 37.0 44.7 39.7 37.4 35.0 35.0 40.1 77.8 27.1
Q.II 40.4 40.0 44.7 40.8 42.2 39.1 39.1 39.3 79.9 28.5
Q.III 45.2 45.5 48.6 46.3 46.0 49.4 49.4 43.9 81.7 29.3
Q.IV 57.5 60.8 54.8 52.3 52.0 54.9 54.9 48.2 93.0 31.6
2008/09
Q.I 73.3 85.7 60.5 56.3 52.1 54.2 54.2 59.2 103.7 32.0
Q.II 65.9 79.2 60.6 58.0 49.1 53.2 53.2 61.8 77.9 33.0
Q.III 61.8 72.8 60.7 59.7 45.5 63.8 63.8 72.3 51.6 34.9
Q.IV 62.5 71.4 62.5 64.8 44.5 69.8 69.8 76.5 41.9 35.9
2009/10
Q.I 62.8 73.7 63.9 65.6 45.6 59.5 59.5 78.2 43.1 37.8
Q.II 60.2 70.5 63.3 65.6 46.0 58.9 58.9 78.3 48.4 41.4
Q.III 60.9 70.6 64.9 68.6 46.3 64.4 64.4 85.5 56.8 42.4
Q.IV 61.2 68.3 67.0 70.3 49.7 67.3 67.3 87.6 73.8 41.8
2010/11
Q.I 62.2 67.6 70.3 74.2 54.1 70.0 70.0 85.2 83.5 47.8
Q.II 66.1 67.1 70.1 78.3 66.5 83.3 83.3 88.8 74.5 59.0
Q.III 73.8 70.2 63.2 87.0 72.4 98.6 98.6 85.7 77.2 77.3
Q.IV 88.0 82.5 70.6 94.4 101.9 101.8 101.8 88.9 111.9 86.3
2011/12
Q.I 95.1 91.5 89.2 98.3 105.9 90.2 90.2 90.7 124.4 85.4
Q.II 99.6 98.3 95.6 99.3 100.8 94.8 94.8 97.2 123.4 94.3
Q.III 107.6 104.6 109.7 113.3 105.0 103.6 112.3 100.4 111.3 93.3
Q.IV 116.5 112.4 132.5 128.6 114.1 101.7 126.8 100.1 117.1 84.6
2012/13
Q.I 117.0 118.5 141.4 126.9 110.5 120.3 124.6 103.5 105.5 85.1
Q.II 114.9 118.2 143.6 128.4 105.5 138.4 114.6 108.2 97.9 81.7
Q.III 114.5 114.9 149.0 135.2 105.6 129.3 114.7 117.2 91.0 77.9
Q.IV 116.0 117.1 149.2 136.1 109.6 126.7 118.5 116.4 91.1 75.9
2013/14
Q.I 121.3 127.0 156.5 139.8 108.3 132.8 121.8 124.6 92.4 75.4
Q.II 124.6 134.4 159.5 140.3 107.2 130.7 118.4 123.4 94.3 76.3
Q.III 121.0 117.2 161.7 146.9 112.1 136.7 124.1 121.4 90.8 77.5
Q.IV 126.2 123.1 165.8 152.5 118.7 127.8 128.1 123.8 107.7 91.2
2014/15
Q.I 133.3 130.1 170.9 155.8 131.6 137.4 126.6 122.4 137.8 93.9
Q.II 134.3 127.8 172.3 158.0 134.7 135.0 134.5 127.4 126.8 95.9
Q.III 139.8 122.6 176.5 169.1 140.6 140.3 151.4 124.1 138.4 88.5
Q.IV 150.6 127.2 183.9 188.1 153.9 139.9 160.0 129.7 193.6 81.7
2015/16
Q.I 161.8 134.5 194.7 189.3 154.9 149.6 159.7 126.7 296.2 79.1
Q.II 164.5 134.7 197.9 189.8 154.2 153.6 163.2 127.7 318.8 79.4
QIII 154.7 135.1 199.6 196.8 148.1 159.5 158.0 127.4 202.6 78.1
QIV 153.9 135.5 200.0 199.7 147.2 159.9 156.3 129.7 188.0 77.0
2016/17
QI 154.0 135.4 200.1 203.6 146.3 161.5 159.1 134.6 175.4 75.2
QII 156.0 146.0 210.7 206.4 152.4 159.2 160.7 159.1 137.4 98.9
QIII 155.6 139.5 213.5 212.5 156.9 165.8 165.0 153.0 127.1 95.8
QIV 166.7 154.4 227.1 228.5 164.0 174.5 187.3 147.2 128.3 92.6
2017/18
QI 173.7 172.2 239.5 227.6 160.4 197.8 183.2 148.9 127.9 97.3
QII 179.4 182.0 246.7 230.0 155.8 215.0 186.3 141.0 138.2 106.3
QIII 186.8 173.6 261.2 242.2 158.9 223.0 199.3 134.7 198.9 99.3
QIV 194.0 187.5 278.8 264.2 166.7 226.4 202.4 134.5 195.5 105.0
2018/19
QI 197.6 195.2 285.0 272.2 167.3 232.1 196.3 125.7 202.5 112.2
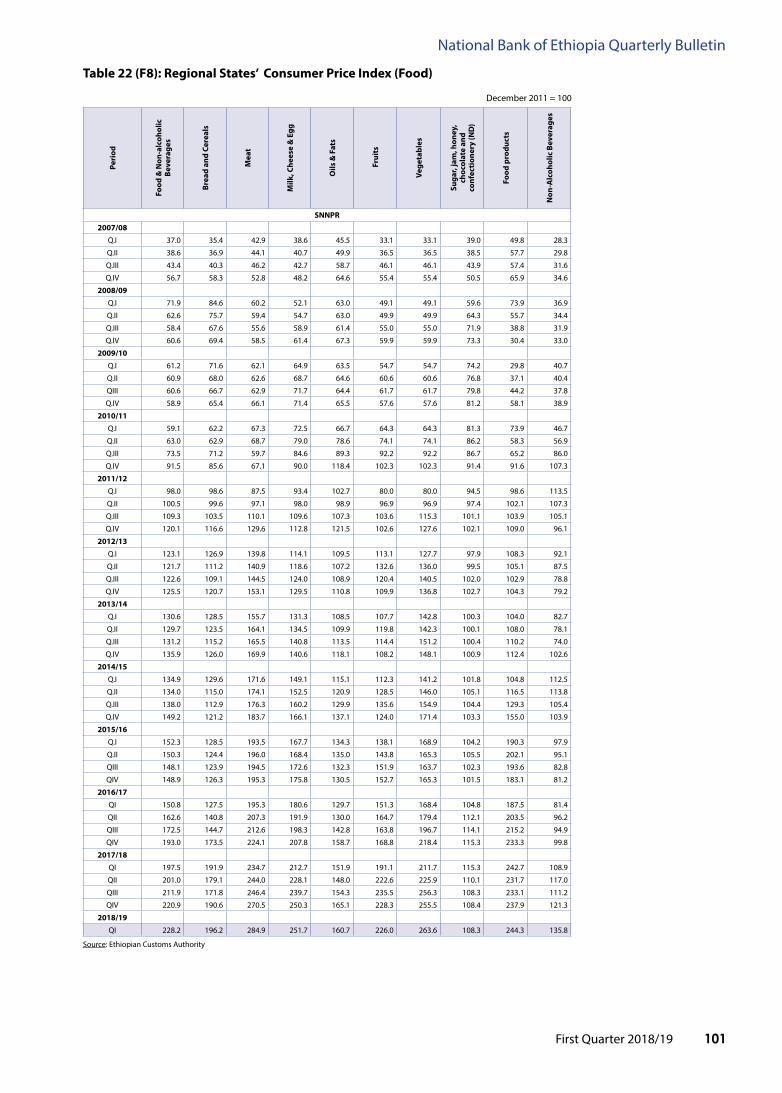
First Quarter 2018/19 101
National Bank of Ethiopia Quarterly Bulletin
table 22 (f8): Regional States’ Consumer price index (food)
December 2011 = 100
Source: Ethiopian Customs Authority
peri
od
food
& N
on-a
lcoh
olic
Be
vera
ges
Brea
d an
d Ce
real
s
Mea
t
Milk
, Che
ese
& E
gg
oils
& f
ats
fru
its
Vege
tabl
es
Suga
r, ja
m, h
oney
, ch
ocol
ate
and
conf
ecti
oner
y (N
D)
food
pro
duct
s
Non
-alc
ohol
ic B
ever
ages
SNNpR
2007/08
Q.I 37.0 35.4 42.9 38.6 45.5 33.1 33.1 39.0 49.8 28.3
Q.II 38.6 36.9 44.1 40.7 49.9 36.5 36.5 38.5 57.7 29.8
Q.III 43.4 40.3 46.2 42.7 58.7 46.1 46.1 43.9 57.4 31.6
Q.IV 56.7 58.3 52.8 48.2 64.6 55.4 55.4 50.5 65.9 34.6
2008/09
Q.I 71.9 84.6 60.2 52.1 63.0 49.1 49.1 59.6 73.9 36.9
Q.II 62.6 75.7 59.4 54.7 63.0 49.9 49.9 64.3 55.7 34.4
Q.III 58.4 67.6 55.6 58.9 61.4 55.0 55.0 71.9 38.8 31.9
Q.IV 60.6 69.4 58.5 61.4 67.3 59.9 59.9 73.3 30.4 33.0
2009/10
Q.I 61.2 71.6 62.1 64.9 63.5 54.7 54.7 74.2 29.8 40.7
Q.II 60.9 68.0 62.6 68.7 64.6 60.6 60.6 76.8 37.1 40.4
QIII 60.6 66.7 62.9 71.7 64.4 61.7 61.7 79.8 44.2 37.8
Q.IV 58.9 65.4 66.1 71.4 65.5 57.6 57.6 81.2 58.1 38.9
2010/11
Q.I 59.1 62.2 67.3 72.5 66.7 64.3 64.3 81.3 73.9 46.7
Q.II 63.0 62.9 68.7 79.0 78.6 74.1 74.1 86.2 58.3 56.9
Q.III 73.5 71.2 59.7 84.6 89.3 92.2 92.2 86.7 65.2 86.0
Q.IV 91.5 85.6 67.1 90.0 118.4 102.3 102.3 91.4 91.6 107.3
2011/12
Q.I 98.0 98.6 87.5 93.4 102.7 80.0 80.0 94.5 98.6 113.5
Q.II 100.5 99.6 97.1 98.0 98.9 96.9 96.9 97.4 102.1 107.3
Q.III 109.3 103.5 110.1 109.6 107.3 103.6 115.3 101.1 103.9 105.1
Q.IV 120.1 116.6 129.6 112.8 121.5 102.6 127.6 102.1 109.0 96.1
2012/13
Q.I 123.1 126.9 139.8 114.1 109.5 113.1 127.7 97.9 108.3 92.1
Q.II 121.7 111.2 140.9 118.6 107.2 132.6 136.0 99.5 105.1 87.5
Q.III 122.6 109.1 144.5 124.0 108.9 120.4 140.5 102.0 102.9 78.8
Q.IV 125.5 120.7 153.1 129.5 110.8 109.9 136.8 102.7 104.3 79.2
2013/14
Q.I 130.6 128.5 155.7 131.3 108.5 107.7 142.8 100.3 104.0 82.7
Q.II 129.7 123.5 164.1 134.5 109.9 119.8 142.3 100.1 108.0 78.1
Q.III 131.2 115.2 165.5 140.8 113.5 114.4 151.2 100.4 110.2 74.0
Q.IV 135.9 126.0 169.9 140.6 118.1 108.2 148.1 100.9 112.4 102.6
2014/15
Q.I 134.9 129.6 171.6 149.1 115.1 112.3 141.2 101.8 104.8 112.5
Q.II 134.0 115.0 174.1 152.5 120.9 128.5 146.0 105.1 116.5 113.8
Q.III 138.0 112.9 176.3 160.2 129.9 135.6 154.9 104.4 129.3 105.4
Q.IV 149.2 121.2 183.7 166.1 137.1 124.0 171.4 103.3 155.0 103.9
2015/16
Q.I 152.3 128.5 193.5 167.7 134.3 138.1 168.9 104.2 190.3 97.9
Q.II 150.3 124.4 196.0 168.4 135.0 143.8 165.3 105.5 202.1 95.1
QIII 148.1 123.9 194.5 172.6 132.3 151.9 163.7 102.3 193.6 82.8
QIV 148.9 126.3 195.3 175.8 130.5 152.7 165.3 101.5 183.1 81.2
2016/17
QI 150.8 127.5 195.3 180.6 129.7 151.3 168.4 104.8 187.5 81.4
QII 162.6 140.8 207.3 191.9 130.0 164.7 179.4 112.1 203.5 96.2
QIII 172.5 144.7 212.6 198.3 142.8 163.8 196.7 114.1 215.2 94.9
QIV 193.0 173.5 224.1 207.8 158.7 168.8 218.4 115.3 233.3 99.8
2017/18
QI 197.5 191.9 234.7 212.7 151.9 191.1 211.7 115.3 242.7 108.9
QII 201.0 179.1 244.0 228.1 148.0 222.6 225.9 110.1 231.7 117.0
QIII 211.9 171.8 246.4 239.7 154.3 235.5 256.3 108.3 233.1 111.2
QIV 220.9 190.6 270.5 250.3 165.1 228.3 255.5 108.4 237.9 121.3
2018/19
QI 228.2 196.2 284.9 251.7 160.7 226.0 263.6 108.3 244.3 135.8

First Quarter 2018/19102
National Bank of Ethiopia Quarterly Bulletin
table 22 (f9): Regional States’ Consumer price index (food)
December 2011 = 100
Per
iod
Food
& N
on-a
lcoh
olic
B
ever
ages
Bre
ad a
nd
Cer
eals
Mea
t
Mil
k, C
hee
se &
Egg
Oil
s &
Fat
s
Fru
its
Veg
etab
les
Su
gar,
jam
, hon
ey,
choc
olat
e an
d
con
fect
ion
ery
(ND
)
Food
pro
du
cts
Non
-Alc
ohol
ic B
ever
ages
SOMALI
2007/08 Q.I 34.1 34.9 30.6 29.6 37.6 40.4 40.4 30.6 72.7 37.3Q.II 35.3 36.8 34.8 30.3 45.6 40.4 40.4 29.2 66.7 36.3Q.III 39.5 40.6 35.4 35.0 50.0 56.0 56.0 32.9 57.0 42.7Q.IV 47.9 51.3 38.2 42.2 58.3 64.0 64.0 38.4 65.3 46.9
2008/09 Q.I 65.0 78.9 44.4 51.2 63.7 71.1 71.1 43.8 79.4 42.8Q.II 59.4 71.6 43.4 52.3 60.6 66.5 66.5 50.0 60.0 44.6Q.III 59.9 69.4 46.1 58.7 59.0 69.9 69.9 50.0 53.7 58.3Q.IV 62.4 69.8 50.2 66.3 58.7 75.0 75.0 50.1 44.2 64.1
2009/10 Q.I 63.3 71.0 51.3 64.9 57.0 71.8 71.8 50.3 36.4 62.3Q.II 63.9 72.2 55.1 64.9 58.4 68.0 68.0 50.2 40.0 62.8Q.III 64.4 73.8 55.1 69.6 60.0 63.3 63.3 50.4 40.6 71.0Q.IV 64.2 72.7 61.1 59.5 63.0 71.2 71.2 52.8 52.9 68.5
2010/11 Q.I 64.8 67.9 68.0 64.1 65.4 83.2 83.2 60.4 71.5 69.3Q.II 75.1 69.3 73.6 78.1 77.0 98.3 98.3 72.7 58.4 106.3Q.III 80.7 75.1 63.7 85.0 89.9 99.0 99.0 78.2 61.0 111.9Q.IV 89.5 83.8 74.8 89.7 98.2 114.0 114.0 83.0 86.3 108.0
2011/12 Q.I 93.4 94.1 93.5 89.7 105.5 106.4 106.4 94.7 114.5 81.1Q.II 96.5 97.9 94.4 91.4 98.3 101.2 101.2 98.8 109.7 90.4Q.III 105.1 104.1 110.4 106.1 100.9 126.5 112.5 102.8 110.0 118.7Q.IV 109.9 104.9 127.3 106.5 100.5 119.0 133.7 115.8 119.4 123.0
2012/13 Q.I 111.5 105.2 137.0 108.5 102.0 127.3 136.1 114.9 119.1 161.1Q.II 116.7 111.7 136.2 121.3 100.5 139.2 125.7 115.3 126.4 183.2Q.III 115.9 110.4 144.9 124.0 101.2 145.5 105.4 115.5 127.4 181.0Q.IV 117.8 111.9 150.3 116.5 100.6 130.3 134.4 118.3 133.9 192.2
2013/14 Q.I 120.1 115.1 157.9 118.2 96.5 154.9 157.7 113.4 139.5 200.2Q.II 122.9 122.4 151.0 125.8 98.0 160.2 131.6 111.7 145.4 191.0Q.III 124.9 123.2 141.5 133.3 97.7 178.1 139.0 110.2 155.3 203.8Q.IV 124.2 123.5 146.3 123.5 97.6 183.7 144.6 110.8 156.1 208.8
2014/15 Q.I 128.4 128.0 151.9 131.3 104.9 224.5 152.9 110.7 154.2 203.7Q.II 129.1 130.0 152.2 128.8 106.5 182.9 151.6 110.7 157.7 209.2Q.III 130.2 127.1 156.7 135.4 106.1 210.9 158.2 114.4 156.8 214.4Q.IV 134.1 129.9 154.3 147.7 107.2 227.2 166.6 114.1 163.8 217.9
2015/16 Q.I 133.6 129.3 165.3 142.0 109.5 202.5 153.1 117.7 164.8 223.4Q.II 134.9 131.8 160.1 147.0 109.4 208.5 147.9 117.9 160.8 221.8QIII 136.7 131.9 155.8 155.3 107.1 253.4 160.7 119.8 154.5 213.6QIV 138.1 132.9 160.2 158.9 105.9 257.6 160.6 120.7 160.4 213.4
2016/17 QI 139.8 134.1 163.7 165.3 105.4 256.7 154.3 122.3 160.4 213.4QII 148.8 132.4 179.9 177.3 109.2 210.8 176.9 151.9 176.6 218.3QIII 156.6 138.5 173.6 190.4 129.2 235.3 171.1 159.6 187.4 222.3QIV 163.1 146.0 220.9 194.4 140.0 256.3 185.7 154.8 206.9 206.7
2017/18 QI 160.1 147.0 217.6 173.3 141.9 240.9 191.7 153.5 208.3 200.7QII 175.4 165.6 244.6 182.0 146.6 233.7 225.1 165.9 220.3 210.1QIII 176.9 168.5 249.8 176.9 146.0 274.9 198.3 175.8 227.6 209.6QIV 187.1 184.9 259.5 176.8 158.7 267.2 197.9 182.1 245.2 209.2
2018/19 QI 202.9 190.6 292.4 209.5 161.0 228.7 220.2 208.3 265.3 224.7
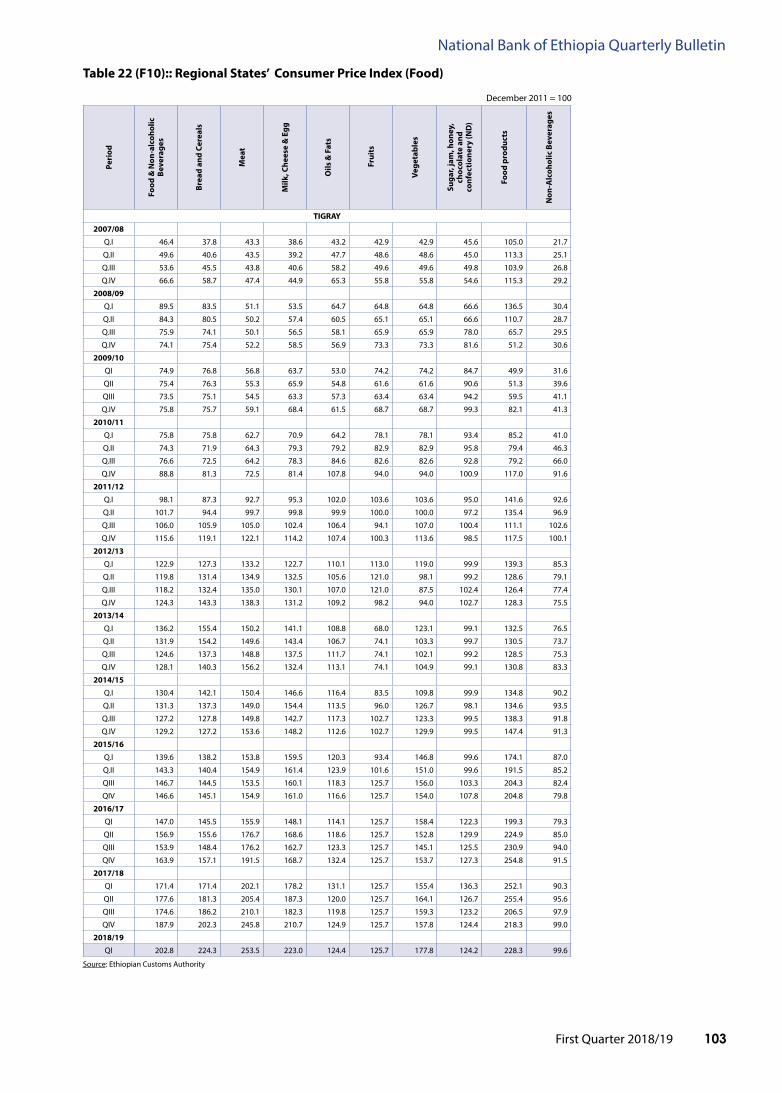
First Quarter 2018/19 103
National Bank of Ethiopia Quarterly Bulletin
table 22 (f10):: Regional States’ Consumer price index (food)
December 2011 = 100
Source: Ethiopian Customs Authority
peri
od
food
& N
on-a
lcoh
olic
Be
vera
ges
Brea
d an
d Ce
real
s
Mea
t
Milk
, Che
ese
& E
gg
oils
& f
ats
fru
its
Vege
tabl
es
Suga
r, ja
m, h
oney
, ch
ocol
ate
and
conf
ecti
oner
y (N
D)
food
pro
duct
s
Non
-alc
ohol
ic B
ever
ages
tiGRaY
2007/08
Q.I 46.4 37.8 43.3 38.6 43.2 42.9 42.9 45.6 105.0 21.7
Q.II 49.6 40.6 43.5 39.2 47.7 48.6 48.6 45.0 113.3 25.1
Q.III 53.6 45.5 43.8 40.6 58.2 49.6 49.6 49.8 103.9 26.8
Q.IV 66.6 58.7 47.4 44.9 65.3 55.8 55.8 54.6 115.3 29.2
2008/09
Q.I 89.5 83.5 51.1 53.5 64.7 64.8 64.8 66.6 136.5 30.4
Q.II 84.3 80.5 50.2 57.4 60.5 65.1 65.1 66.6 110.7 28.7
Q.III 75.9 74.1 50.1 56.5 58.1 65.9 65.9 78.0 65.7 29.5
Q.IV 74.1 75.4 52.2 58.5 56.9 73.3 73.3 81.6 51.2 30.6
2009/10
QI 74.9 76.8 56.8 63.7 53.0 74.2 74.2 84.7 49.9 31.6
QII 75.4 76.3 55.3 65.9 54.8 61.6 61.6 90.6 51.3 39.6
QIII 73.5 75.1 54.5 63.3 57.3 63.4 63.4 94.2 59.5 41.1
Q.IV 75.8 75.7 59.1 68.4 61.5 68.7 68.7 99.3 82.1 41.3
2010/11
Q.I 75.8 75.8 62.7 70.9 64.2 78.1 78.1 93.4 85.2 41.0
Q.II 74.3 71.9 64.3 79.3 79.2 82.9 82.9 95.8 79.4 46.3
Q.III 76.6 72.5 64.2 78.3 84.6 82.6 82.6 92.8 79.2 66.0
Q.IV 88.8 81.3 72.5 81.4 107.8 94.0 94.0 100.9 117.0 91.6
2011/12
Q.I 98.1 87.3 92.7 95.3 102.0 103.6 103.6 95.0 141.6 92.6
Q.II 101.7 94.4 99.7 99.8 99.9 100.0 100.0 97.2 135.4 96.9
Q.III 106.0 105.9 105.0 102.4 106.4 94.1 107.0 100.4 111.1 102.6
Q.IV 115.6 119.1 122.1 114.2 107.4 100.3 113.6 98.5 117.5 100.1
2012/13
Q.I 122.9 127.3 133.2 122.7 110.1 113.0 119.0 99.9 139.3 85.3
Q.II 119.8 131.4 134.9 132.5 105.6 121.0 98.1 99.2 128.6 79.1
Q.III 118.2 132.4 135.0 130.1 107.0 121.0 87.5 102.4 126.4 77.4
Q.IV 124.3 143.3 138.3 131.2 109.2 98.2 94.0 102.7 128.3 75.5
2013/14
Q.I 136.2 155.4 150.2 141.1 108.8 68.0 123.1 99.1 132.5 76.5
Q.II 131.9 154.2 149.6 143.4 106.7 74.1 103.3 99.7 130.5 73.7
Q.III 124.6 137.3 148.8 137.5 111.7 74.1 102.1 99.2 128.5 75.3
Q.IV 128.1 140.3 156.2 132.4 113.1 74.1 104.9 99.1 130.8 83.3
2014/15
Q.I 130.4 142.1 150.4 146.6 116.4 83.5 109.8 99.9 134.8 90.2
Q.II 131.3 137.3 149.0 154.4 113.5 96.0 126.7 98.1 134.6 93.5
Q.III 127.2 127.8 149.8 142.7 117.3 102.7 123.3 99.5 138.3 91.8
Q.IV 129.2 127.2 153.6 148.2 112.6 102.7 129.9 99.5 147.4 91.3
2015/16
Q.I 139.6 138.2 153.8 159.5 120.3 93.4 146.8 99.6 174.1 87.0
Q.II 143.3 140.4 154.9 161.4 123.9 101.6 151.0 99.6 191.5 85.2
QIII 146.7 144.5 153.5 160.1 118.3 125.7 156.0 103.3 204.3 82.4
QIV 146.6 145.1 154.9 161.0 116.6 125.7 154.0 107.8 204.8 79.8
2016/17
QI 147.0 145.5 155.9 148.1 114.1 125.7 158.4 122.3 199.3 79.3
QII 156.9 155.6 176.7 168.6 118.6 125.7 152.8 129.9 224.9 85.0
QIII 153.9 148.4 176.2 162.7 123.3 125.7 145.1 125.5 230.9 94.0
QIV 163.9 157.1 191.5 168.7 132.4 125.7 153.7 127.3 254.8 91.5
2017/18
QI 171.4 171.4 202.1 178.2 131.1 125.7 155.4 136.3 252.1 90.3
QII 177.6 181.3 205.4 187.3 120.0 125.7 164.1 126.7 255.4 95.6
QIII 174.6 186.2 210.1 182.3 119.8 125.7 159.3 123.2 206.5 97.9
QIV 187.9 202.3 245.8 210.7 124.9 125.7 157.8 124.4 218.3 99.0
2018/19
QI 202.8 224.3 253.5 223.0 124.4 125.7 177.8 124.2 228.3 99.6

First Quarter 2018/19104
National Bank of Ethiopia Quarterly Bulletin
table 23 a1: Ethiopia: Direction of External trade: EXpoRtIn thousands of Birr
Source: Ethiopian Customs Authority.Note1: Data for the year 2013 and 2014 is based on updated data from Ethiopian Revenue and Customs Authority Note2: The data for Czechoslovakia before 2013 represents the sum of Czech republic and Slovakia
Country of Destination 2010 2011 2012 2013 2014 2015 2016 2017Djibouti 849,144.8 1,172,260.1 2,313,228.9 1,380,433.1 3,747,193.9 1,941,788.5 2,350,936.7 3,014,309.0 Egypt 585,058.5 764,013.2 768,260.3 818,229.2 1,012,133.0 684,520.9 315,108.1 202,450.4 Ghana 2,094.8 1,117.1 9,582.3 4,292.2 136.8 6,863.1 832.1 696.9 Kenya 54,434.1 176,485.4 190,932.3 269,555.1 431,754.9 656,490.8 625,147.6 1,190,543.3 Libia 1,834.5 2,297.5 68,040.2 - 4,163.4 - - - Morocco 10,976.1 28,363.6 11,632.6 15,895.1 3,746.1 2,040.4 6,841.3 10,061.0 Nigeria 2,215.0 2,990.0 10,297.6 2,735.2 47,617.8 63,719.5 90,565.5 328,428.3 Ruwanda 569.9 1,114.0 993.9 9,793.9 28,670.2 42,368.3 57,909.1 94,341.6 Somali Land - - - - - - - - Somalia 3,139,271.5 4,061,406.4 5,989,640.7 5,798,201.3 6,371,904.9 6,240,561.4 5,827,108.7 5,964,650.4 South Africa 1,030,363.9 89,326.4 194,964.0 218,061.1 257,504.8 226,770.4 260,057.5 426,332.0 Sudan 2,053,243.9 2,983,061.3 2,008,904.2 1,707,190.9 1,629,734.3 1,595,427.4 993,600.1 1,896,197.0 Tanzania 5,959.6 3,084.1 969.4 1,045.6 15,211.2 255.9 401.9 363.6 Uganda 24,333.6 14,963.0 7,044.1 2,765.9 10,051.8 4,295.5 5,913.3 4,864.9 Zambia 369.2 20.4 119.4 503.8 110.0 2,398.8 10,974.8 14,555.0 Zembabwe 1,147.8 3,549.5 788.6 3,632.8 4,272.4 6,716.0 4,025.0 2,602.9 Others 146,791.5 171,537.0 289,802.8 514,287.0 792,557.5 341,524.6 477,440.0 1,351,269.1
total 7,907,808.6 9,475,589.2
11,865,201.5 10,746,622.1 14,328,992.6 11,815,745.3 11,026,861.7 14,501,665.3 %Share of Continent 23.0 18.8 21.1 19.4 22.1 20.0 18.4 21.4
Austria 365.7 1,297.4 1,644.6 1,735.5 4,310.4 2,931.2 22,747.8 22,995.8 Belgium 766,865.8 1,129,952.5 1,206,977.6 1,025,131.4 1,087,850.9 1,182,982.5 1,436,499.1 1,965,237.5 Bulgaria 9,100.7 17,775.7 40,564.4 82,919.2 99,420.1 86,949.0 43,611.4 42,637.1 Cyprus 1,208.7 29.6 2,392.2 3,217.3 5,007.8 640.5 151.2 1,175.9 Czech Republic 5,564.4 3,925.4 7,320.4 5,569.1 13,779.0 21,577.7 22,939.8 18,599.1 Slovakia - - - 1,897.5 4,395.7 1,466.6 4,072.5 7,076.4 Denmark 18,362.4 14,816.2 35,758.1 32,455.9 17,723.0 20,802.4 30,025.0 28,201.3 Finland 38,401.9 157,776.1 87,678.9 51,661.1 80,304.0 90,939.5 90,178.8 123,908.3 France 505,675.0 823,513.2 812,971.3 530,534.4 877,613.3 682,717.6 807,422.0 827,504.6 Germany 3,676,129.0 5,412,655.7 5,190,387.9 3,730,991.2 3,754,508.5 4,271,155.2 3,486,254.3 3,943,246.8 Greece 104,335.8 161,358.8 136,034.9 260,072.5 235,797.7 214,131.5 209,499.8 235,931.1 Hungary 4,664.1 6,030.5 29,465.0 34,564.1 18,858.6 15,129.0 18,955.3 16,005.0 Ireland 225.2 4,981.1 1,335.4 4,968.8 4,393.8 11,865.0 10,363.8 15,763.6 Italy 767,672.2 1,830,342.8 1,265,069.2 1,127,453.5 1,244,816.9 1,071,373.1 1,101,650.8 1,347,709.3 Netherlands 2,325,158.7 3,589,200.5 3,513,356.8 3,160,616.3 3,899,530.0 3,910,613.0 3,911,035.2 4,177,990.4 Norway 83,421.5 114,266.4 152,810.3 141,325.7 202,256.0 193,648.3 190,592.2 184,970.7 Poland 20,903.7 10,005.3 2,097.0 17,660.3 23,192.2 18,930.3 9,048.4 13,435.8 Portugal 13,224.5 10,264.5 58,441.4 58,595.2 107,108.4 70,872.1 127,631.2 156,689.8 Rumania 26,297.6 64,555.6 79,944.9 62,136.7 63,661.9 35,255.4 12,665.6 23,638.2 Spain 82,768.8 202,110.6 278,937.8 188,107.6 157,484.0 312,381.6 266,256.9 262,739.3 Sweden 345,076.1 631,746.6 435,154.5 264,471.8 307,877.4 333,582.0 266,867.3 263,089.4 Switzerland 4,876,617.7 8,672,031.8 9,644,798.9 9,439,555.7 7,895,981.9 6,490,540.8 5,266,886.0 4,714,821.8 Turkey 448,459.6 793,508.0 918,743.3 1,460,875.2 1,267,997.9 854,569.2 463,675.1 659,682.4 Ukraine 1,647.3 549.2 3,605.7 1,288.6 1,569.6 9,366.3 14,853.7 24,420.6 United Kingdom 790,362.3 1,036,992.2 804,000.1 916,862.0 888,555.1 806,313.4 1,069,053.4 1,290,346.0 Russia 87,990.9 170,085.7 210,565.2 289,418.9 405,160.0 283,476.8 289,381.7 386,108.6 Yugoslavia - - - - - - - - Others 32,888.7 129,769.9 228,751.3 106,316.3 121,332.5 270,792.0 639,646.5 1,181,451.6
total 15,033,388.3 24,988,711.1
25,148,807.1 23,000,401.7 22,790,486.7 21,265,002.1 19,811,964.8 21,935,376.3 %Share of Continent 43.8 49.7 44.7 41.4 35.2 36.0 33.1 32.4
Brazil - - - 50.0 - 8,764.8 9,178.4 9,179.6 Canada 115,069.8 173,658.6 167,388.9 166,782.8 214,767.3 216,338.4 268,404.1 270,038.6 Cuba - - - 325.5 15,043.2 - - - Mexico 15,924.2 41,359.7 21,189.4 15,661.3 12,529.3 37,776.3 40,458.2 63,779.1 United States 1,387,899.5 1,571,684.8 1,741,318.4 2,223,193.5 2,413,259.7 3,913,895.0 3,733,304.1 4,317,231.5 Others 40,185.0 165,850.0 147,274.5 66,745.5 886,388.5 189,789.5 231,818.7 458,804.3
total 1,559,078.4 1,952,553.1 2,076,859.0 2,472,758.7 3,541,988.1 4,366,563.9 4,283,163.5 5,119,033.1 %Share of Continent 4.5 3.9 3.7 4.5 5.5 7.4 7.2 7.6
China, Mainland 3,330,807.6 4,764,263.2 5,167,985.4 5,682,920.3 8,071,388.2 6,145,483.9 7,498,265.1 5,111,009.8 China, Taiwan 34,908.6 34,265.7 44,820.6 114,825.8 86,264.9 134,753.6 242,155.2 324,580.5 Hong Kong 98,715.7 378,664.7 523,566.5 655,428.0 342,188.3 434,907.0 390,835.7 419,795.4 India 401,662.3 553,031.3 667,923.1 659,101.4 947,722.2 1,323,550.6 1,440,185.8 1,168,606.9 Indonesia 131,343.7 219,306.2 260,365.2 442,638.8 579,643.5 419,364.5 581,396.8 575,381.8 Israel 752,915.3 1,079,551.0 1,112,383.2 1,822,061.3 2,016,939.4 1,697,745.0 1,366,387.4 1,487,480.1 Japan 535,178.4 596,903.3 1,260,749.0 1,423,109.6 1,884,123.0 1,388,756.3 1,541,929.9 2,233,317.5 N.Korea, Pdrk 16,724.9 54,732.0 24,451.6 40,602.6 223.3 10,146.1 31,494.6 17,897.9 S.Korea 132,137.3 235,899.3 336,747.5 428,910.5 660,360.4 902,688.1 1,114,526.1 1,224,971.5 Kuwait 9,424.2 45,894.4 38,566.8 53,491.8 54,954.6 59,591.3 28,418.5 36,687.4 Lebanon 10,467.2 79,992.5 41,232.7 104,309.0 90,398.2 15,787.8 16,460.4 30,659.0 Malaysia 9,871.6 5,929.0 12,398.4 57,837.7 45,580.5 5,556.5 107,335.2 78,417.2 Pakistan 333,743.0 192,626.5 768,074.1 896,279.3 678,817.2 855,052.2 1,441,769.4 1,084,808.0 Saudi Arabia 2,057,646.6 2,837,432.3 3,085,698.2 3,075,268.7 3,836,761.6 4,028,128.5 3,981,781.2 4,400,225.0 Singapore 90,801.2 46,255.1 27,476.5 14,236.7 22,061.2 204,215.6 128,152.6 93,295.4 Yemen 263,614.8 342,272.8 379,117.3 571,866.5 734,790.4 439,271.6 362,192.6 456,992.0 Thailand 35,140.8 155,088.6 140,299.9 147,971.0 111,444.1 105,215.7 94,324.3 87,940.9 UAE 1,119,157.4 1,284,684.7 1,340,649.8 1,395,130.2 1,931,357.2 1,791,062.6 1,982,406.3 2,694,755.9 Others 370,393.0 846,426.7 1,644,761.6 1,320,681.0 1,550,549.5 1,160,854.1 1,879,038.7 3,985,634.2
total 9,737,177.2 13,654,330.2
16,785,231.9 18,906,670.1 23,645,567.4 21,122,130.8 24,229,055.8 25,512,456.4 %Share of Continent 28.3 27.1 29.8 34.1 36.5 35.8 40.5 37.7
Australia 100,714.1 199,586.8 332,554.2 246,875.7 379,097.3 417,653.3 330,080.8 473,534.0 Others 15,655.1 55,913.1 67,670.3 127,756.1 77,090.7 84,325.8 157,422.4 112,992.7
total 116,369.2 255,499.9 400,224.5 374,631.7 455,711.7 501,979.2 487,503.3 586,526.7 %Share of Continent 0.3 0.5 0.7 0.7 0.7 0.8 0.8 0.9
Unspecified - - - -
Grand total 34,353,821.8 50,326,683.5
56,276,324.1 55,501,084.2 64,762,746.5 59,071,421.3 59,838,549.1 67,655,057.8

First Quarter 2018/19 105
National Bank of Ethiopia Quarterly Bulletin
table 23 a2: Ethiopia: Direction of External trade: iMpoRtIn thousands of Birr
Continents Country 2010 2011 2012 2013 2014 2015 2016 2017
Africa Djibouti 152.1 4,634.1 1,880.1 19,785.9 7,252.7 4,050,783.9 13.9 1,374.8
Egypt 1,351,284.9 3,202.1 1,777,945.9 1,990,237.8 3,593,112.7 11,128.5 4,071,335.1 4,346,257.9
Ghana 3,387.4 546,341.8 2,384.4 5,687.9 1,666.1 738,056.4 2,514.6 9,412.4
Kenya 427,681.5 290,467.0 678,285.5 551,882.2 801,793.8 738,056.4 676,008.7 835,401.2
Libya 263,603.2 290,467.0 - 263,165.0 - - 2.3 0.7
Nigeria 656.3 134.8 12,412.0 82,933.2 62,055.7 220,674.6 45,219.0 940,652.6
Ruanda 0.6 - 28.8 378.2 59.7 32.9 68,067.4 731.4
Sudan 1,562,899.0 2,452,191.1 1,161,127.1 136,245.1 4,366,290.2 2,192,155.2 1,549,332.4 2,467,773.4
Tanzania 14,984.1 7,469.7 30,576.6 2,930.4 127,120.4 132,600.2 103,133.2 44,692.5
Uganda 8,266.7 4,869.5 1,561.2 5,177.3 3,125.9 7,381.5 6,962.2 5,846.1
Zambia 395.8 378.6 56.6 1,028.0 89,519.4 482.3 11,160.1 9,857.4
Others 2,571,172.1 3,324,070.6 5,564,554.6 2,636,616.0 4,880,495.6 8,224,429.0 8,258,583.7 13,223,694.2
total 6,204,483.8 6,924,226.3 9,230,813.0 5,696,067.2 13,932,492.0 15,584,248.5 14,792,332.6 21,885,694.7
Europe Austria 274,769.7 196,218.2 586,106.3 560,571.4 572,382.6 1,027,145.6 1,604,322.8 1,485,372.3
Belgium 1,237,381.5 1,446,630.4 2,645,543.2 1,798,980.7 4,218,543.5 5,435,019.7 5,044,164.5 4,151,772.7
Bulgaria 794,573.9 405,830.6 86,186.4 338,016.0 143,721.4 1,537,581.6 683,870.1 905,021.2
Cyprus 76,735.5 89,509.1 88,807.2 234,484.2 150,578.9 115,078.1 117,156.1 137,993.8
Czechoslovakia (former
name) 50,204.8 191,298.4 90,640.3 118,980.3 1,130,726.8 276,843.1 531,941.0 561,777.1
Czech republic 1,012,206.1 236,047.0 441,959.6 531,412.2
Slovakia 118,520.7 40,796.1 89,981.4 30,364.9
Denmark 253,713.0 470,115.2 488,523.0 305,449.6 824,909.0 694,246.2 715,981.1 537,217.7
Finland 82,697.1 103,977.0 320,249.9 189,685.0 177,056.2 155,906.3 350,087.1 808,559.9
France 1,405,956.8 2,313,930.4 3,614,646.3 2,480,592.3 2,351,867.2 3,823,770.8 4,684,217.9 4,431,486.0
Germany 2,709,739.9 2,898,011.6 3,199,430.5 4,229,516.1 7,249,151.5 6,806,205.2 7,859,546.7 5,771,781.8
Greece 96,373.3 180,894.2 140,476.2 143,842.2 350,442.3 405,742.7 528,971.4 419,409.9
Hungary 47,255.7 86,698.4 212,739.3 154,821.1 294,461.0 490,887.6 530,673.3 325,514.2
Ireland 369,445.2 384,656.8 362,766.1 497,656.2 573,979.2 716,987.1 775,362.0 914,646.1
Italy 5,423,537.9 5,999,479.7 8,468,614.5 8,475,248.1 9,854,864.6 10,476,893.6 15,784,350.7 15,601,881.7
Netherlands 1,136,416.0 1,404,726.9 1,630,693.2 3,813,241.8 2,492,065.9 4,604,402.8 3,982,518.3 5,161,373.9
Norway 36,995.9 34,421.8 47,457.5 71,440.7 58,782.9 79,266.8 162,289.4 84,019.0
Poland 88,240.1 100,915.1 273,902.6 254,707.4 579,322.1 735,144.5 2,284,185.2 874,973.5
Portugal 107,604.0 39,090.7 77,822.2 136,508.8 215,656.2 318,933.8 243,435.8 332,054.0
Rumania 246,874.1 21,137.4 26,566.6 138,938.5 1,685,883.2 443,410.0 4,500,592.8 2,236,388.5
Spain 1,247,190.3 1,446,618.8 2,106,719.9 1,962,063.7 2,678,244.8 2,783,107.6 2,871,957.4 3,311,894.0
Sweden 921,184.7 1,265,562.3 1,139,661.0 1,323,169.7 844,072.1 13,232,214.3 9,427,026.6 1,154,426.4
Switzerland 480,341.9 474,076.0 621,634.5 783,765.0 904,299.4 1,194,286.5 1,223,807.0 1,465,077.7
Turkey 3,212,576.1 5,842,462.2 6,526,492.5 8,409,563.5 8,629,004.2 10,918,514.7 12,682,665.1 14,296,491.7
United kingdom 1,219,805.9 1,830,282.8 1,514,325.3 2,006,481.9 3,592,921.5 3,863,439.0 4,557,294.9 4,709,876.8
Russia 1,301,202.6 4,546,375.5 2,329,520.8 222,543.3 2,575,137.1 1,745,182.4 3,579,267.5 1,245,806.0
Yugoslavia 15,263.3 1,055.7 4.8 8.3 54.9 - 0.0 0.3
Other 1,491,376.0 3,090,900.4 7,016,703.0 4,415,093.2 5,846,854.7 4,458,373.1 5,279,114.8 3,938,166.3
total 24,327,455.4 34,864,875.6 43,616,233.1 43,065,369.1 57,994,983.5 76,615,426.4 90,536,740.4 74,862,982.4
America Brazil 1,777,894.9 1,319,826.6 2,478,504.6 1,895,842.2 1,496,396.6 1,083,673.4 1,475,502.6 4,488,842.1
Canada 188,981.3 362,112.3 266,442.2 535,973.0 1,196,802.2 753,274.2 1,451,315.7 1,353,867.2
Cuba 4,401.7 927.4 306.3 3,419.1 1,558.3 3,976.4 1,294.5 15,130.0
Mexico 22,287.0 30,857.6 37,034.6 57,572.7 180,610.0 159,440.1 126,433.0 249,402.2
United states 6,307,462.0 6,964,847.9 6,741,540.1 9,427,071.5 15,380,630.1 18,383,911.5 28,006,664.4 30,200,872.0
Others 89,336.7 807,104.4 1,991,585.8 177,236.2 226,806.2 684,766.3 303,572.4 201,799.7
total 8,390,363.6 9,485,676.2 11,515,413.5 12,097,114.8 18,482,803.4 21,069,041.8 31,364,782.7 36,509,913.2 Asia China, mainland 20,602,808.4 24,964,592.5 38,886,267.6 50,218,738.1 100,672,421.4 127,862,137.6 112,557,147.3 107,569,979.9
China, Taiwan 376,922.5 494,760.7 1,070,584.7 1,106,850.9 1,333,948.4 1,427,654.5 1,106,997.8 1,297,890.5
Hong Kong 54,097.6 24,128.9 58,718.2 54,377.6 80,091.6 276,928.2 1,370,238.4 2,768,923.7
India 8,485,196.5 12,394,362.3 17,878,819.6 21,273,934.9 21,787,752.1 24,344,942.9 28,557,164.8 24,233,274.2
Israel 157,777.6 273,165.9 567,716.2 298,154.8 507,607.3 614,145.1 548,689.5 1,792,675.0
Japan 6,609,442.1 7,450,651.8 8,341,760.9 9,462,530.3 12,180,142.5 15,185,118.0 14,472,925.3 14,722,312.6
N.korea, pdrk 57,079.2 216,777.9 268,093.4 185,433.0 103,493.8 107,552.8 91,536.9 531,235.1
S.korea 1,297,821.7 2,686,000.2 3,835,763.8 3,118,319.6 4,771,125.3 4,962,100.1 3,961,888.7 5,588,986.2
Kuwait 43,653.2 3,749,483.5 12,995,081.0 4,762,763.2 13,571,707.6 13,326,143.0 13,519,748.9 22,424,256.5
Lebanon 19,775.1 28,525.2 51,159.7 42,125.5 80,978.2 167,754.4 106,810.2 842,739.1
Malaysia 3,130,091.0 4,397,300.9 3,014,971.9 2,718,544.1 2,864,220.8 3,588,092.8 6,251,135.7 7,515,151.6
Pakistan 717,542.9 1,824,377.7 878,501.4 964,168.7 1,175,982.7 1,011,155.3 746,091.4 1,937,665.6
Saudi arabia 14,585,404.2 15,067,036.6 28,393,519.1 16,170,927.0 24,724,120.4 10,284,257.6 6,497,893.0 12,937,477.5
Singapore 73,829.9 68,565.3 93,538.1 88,852.5 236,105.2 323,455.3 516,905.1 446,466.6
Yemen 115,687.0 217,722.0 469,194.0 214,434.9 661,267.0 132,071.4 91,481.4 434,498.0
Thailand 1,695,555.9 2,157,711.7 2,455,430.1 3,140,867.6 4,079,354.5 3,079,839.3 2,977,140.6 4,782,068.8
Others 24,577,996.2 22,785,237.8 27,142,763.8 26,822,535.1 23,474,859.5 23,206,536.4 25,379,978.4 35,454,493.4
total 82,600,681.2 98,800,401.1 146,401,883.6 140,643,557.9 212,305,178.3 229,899,884.7 218,753,773.5 245,280,094.4
Oceania Australia 308,547.5 312,015.7 243,040.2 287,605.2 140,252.3 215,659.7 327,371.5 471,334.6
Unspecified 57,613.8 47,482.6 116,775.0 58,518.3 220,646.7 120,412.3 136,368.6 -
Grand total 121,889,145.28 150,434,677.44 211,124,145.40 201,848,232.54 303,076,356.23 343,504,673.4 355,911,369.3 379,130,652.5

First Quarter 2018/19106
National Bank of Ethiopia Quarterly Bulletin
table 23 B: Direction of trade*
Source: Ethiopian Revenues and Customs Authority * Data on import of petroleum products are obtained from Ethiopian Petroleum Enterprise ** All import data are updated based on revised data from the Ethiopian Revenues and Customs Authority, while export data includes electricity export
Continents Country of origin
`2016/17 `2017/18 2018/19 percentage Change QiV Qi Qii Qiii QiV Qi
Export import Export import Export import Export import Export import Export import Export import
o p Q R S U U V G h a B C=a/G D=B/h
africa:
Djibouti 31.27 - 29.6 0.0 32.8 0.0 26.8 0.1 38.1 0.1 36.9 0.2 (3.4) 46.7
Egypt 2.45 51.3 1.75 44.8 0.66 51.3 4.5 58.5 3.3 139.1 1.7 53.5 (47.3) (61.5)
Ghana 0.00 0.2 0.03 0.0 0.02 0.1 0.1 0.0 0.6 0.0 1.2 0.0 96.5 4,502.8
Kenya 25.70 10.3 15.45 9.2 8.91 8.4 9.1 9.1 7.8 7.3 6.2 10.8 (21.2) 48.5
Libia - - - - - - - - - - - -
Morocco 0.07 141.5 0.13 0.0 0.06 75.8 0.1 105.5 0.1 107.8 0.0 0.7 (52.9) (99.3)
Nigeria 10.39 1.9 1.48 32.2 9.43 3.7 2.1 1.4 1.3 0.7 2.5 1.4 85.8 96.6
Ruwanda 2.19 0.0 0.47 0.0 1.74 0.0 1.0 0.0 2.6 0.0 1.1 0.0 (58.5) 3,824.2
Somali Land - 0.5 - 0.3 - 0.2 - 0.0 - 0.3 - 0.1 (79.1)
Somalia 63.53 - 63.46 - 55.95 - 43.7 - 65.4 - 70.0 - 6.9
South Africa 3.07 61.8 1.54 59.3 1.00 51.2 2.7 56.0 3.3 120.9 2.0 46.9 (41.0) (61.2)
Sudan 28.98 30.4 19.81 8.2 18.41 23.8 28.5 27.6 32.5 34.1 14.6 9.9 (55.0) (71.0)
Tanzania - 0.0 0.00 0.2 0.01 0.6 0.1 0.8 - 0.0 0.2 0.8 2,323.7
Uganda 0.06 0.0 0.11 0.1 0.14 0.1 0.1 0.0 0.1 0.0 0.1 0.2 (7.1) 314.2
Zambia 0.15 0.3 0.12 0.0 0.11 0.1 0.2 0.0 1.6 0.0 0.9 0.0 (41.0) 1,576.1
Zembabwe 0.01 0.0 0.05 0.0 0.06 0.0 0.0 0.0 0.0 0.0 0.1 0.0 255.2 (49.6)
Others 17.71 2.0 9.68 1.1 10.22 22.3 25.8 1.2 6.3 1.8 5.4 3.2 (15.1) 76.4
total 183.21 300.1 143.73 155.5 139.51 237.7 144.7 260.3 163.2 412.1 142.9 127.7 (12.5) (69.0)
%Share of Continent 20.23 7.4 21.18 3.9 20.84 6.0 19.6 7.3 21.69 11.32 22.75 3.47 4.86 (69.36)
Europe:
Austria 0.02 10.1 1.74 18.5 0.01 23.4 0.1 13.5 0.1 10.6 0.0 9.3 (62.7) (11.6)
Belgium 31.79 46.3 22.69 42.7 15.02 32.9 14.6 14.7 20.4 24.2 19.7 38.9 (3.8) 60.9
Bulgaria 0.41 1.2 0.29 25.0 0.88 1.6 0.9 1.0 1.0 0.5 0.9 16.2 (14.2) 3,026.8
Cyprus 0.05 2.1 0.17 1.4 - 1.0 0.2 1.5 0.3 1.3 0.2 1.1 (35.2) (15.6)
Czech Republic 0.13 8.5 0.07 4.5 0.13 2.6 0.0 4.9 0.1 4.0 0.0 7.2 (58.0) 78.0
Slovakia 0.10 0.2 0.10 0.3 0.02 0.4 0.0 3.6 0.0 0.6 0.0 0.3 (4.0) (48.0)
Denmark 0.31 4.9 0.43 9.0 0.21 4.6 0.1 4.2 0.6 6.1 0.1 7.6 (90.5) 24.6
Finland 2.54 7.8 0.37 6.1 0.64 5.0 0.8 1.5 1.5 2.8 1.6 4.8 7.3 72.1
France 12.03 45.7 9.87 46.1 5.26 43.3 7.2 54.0 9.2 38.8 6.0 43.2 (34.5) 11.2
Germany 61.76 52.1 43.38 69.3 39.31 59.6 40.7 71.5 57.3 77.6 35.5 79.6 (38.1) 2.6
Greece 4.17 4.1 3.55 3.5 1.85 5.5 3.7 2.1 1.6 1.2 0.8 1.9 (48.6) 55.6
Hungary 0.14 2.8 0.15 4.8 0.11 2.2 0.0 5.2 0.1 2.7 0.4 3.9 256.5 41.7
Ireland 0.43 16.4 0.02 8.3 0.11 5.5 0.1 7.5 0.0 7.5 0.2 14.9 796.4 98.2
Italy 20.36 209.9 14.59 143.9 8.22 167.2 10.9 110.2 23.1 95.0 12.6 91.8 (45.4) (3.3)
Netherlands 52.34 147.4 47.56 29.9 40.17 24.0 53.6 26.2 50.1 151.3 45.1 30.3 (10.0) (80.0)
Norway 2.45 1.0 1.73 0.9 1.18 0.7 1.3 1.4 1.7 0.2 1.5 0.7 (8.8) 218.9
Poland 0.39 11.5 0.11 5.2 0.01 10.4 0.1 6.4 0.3 6.5 0.3 10.3 10.4 57.5
Portugal 1.23 4.3 1.43 3.6 1.22 2.8 1.7 2.5 2.7 2.9 1.2 2.6 (54.1) (10.3)
Rumania 0.38 0.9 0.05 46.0 0.13 10.1 0.2 1.7 0.1 33.0 0.0 73.3 (97.9) 122.3
Spain 3.08 40.3 4.22 42.1 3.23 22.0 2.4 12.7 4.3 10.2 5.2 15.8 19.5 53.9
Sweden 2.36 8.9 3.94 12.5 1.81 13.3 1.6 10.1 2.2 5.6 1.5 6.8 (30.6) 20.5
Switzerland 64.56 7.1 28.92 25.5 15.02 15.0 46.3 5.9 6.9 9.7 15.8 19.5 127.5 101.2
Turkey 9.13 147.2 7.89 176.4 14.03 133.6 18.2 157.2 7.5 124.3 2.6 160.9 (65.0) 29.4
Ukraine 0.27 26.3 0.34 37.5 0.51 39.4 0.1 14.8 0.5 33.6 0.3 38.3 (34.1) 13.8
United Kingdom 16.75 54.2 15.13 85.0 8.25 31.8 8.6 63.2 12.9 52.9 10.5 116.5 (18.8) 120.3
Russia 5.07 11.9 5.48 2.6 5.83 33.3 3.1 35.2 3.8 21.1 1.7 56.1 (55.3) 166.4
Yugoslavia - 0.0 - - - 0.0 - - - - - -
Others 5.18 6.3 0.82 3.2 3.48 25.5 0.9 15.3 2.1 3.3 8.1 7.7 283.5 134.8
total 297.43 879.3 215.05 853.7 170.43 716.6 217.6 648.1 210.6 727.6 171.4 859.3 (18.6) 18.1
%Share of Continent 32.85 21.6 31.70 21.4 25.46 18.1 29.4 18.3 27.98 19.98 27.30 23.34 (2.44) 16.80
america:
Brazil 0.00 16.7 0.07 58.0 - 54.0 - 16.7 0.0 11.6 0.0 41.8 (53.8) 261.3
Canada 3.51 14.6 4.33 15.8 3.10 16.7 3.8 17.8 6.2 23.3 4.4 12.1 (29.8) (47.9)
Cuba - 0.5 - 0.1 - 0.0 - 0.0 - 0.0 - 0.0 #DIV/0! (78.6)
Mexico 0.94 3.2 0.41 5.3 0.84 1.2 1.0 1.2 1.6 1.4 1.0 3.7 (34.1) 173.4
United States 77.34 247.4 60.79 301.1 35.82 438.9 65.0 247.0 92.3 209.6 50.6 166.1 (45.2) (20.8)
Others 2.98 1.9 0.37 1.9 3.16 2.6 0.7 3.2 2.2 2.4 13.0 2.3 494.2 (2.5)
total 84.77 284.4 65.98 382.1 42.92 513.4 70.5 285.9 102.3 248.2 69.0 226.0 (32.6) (8.9)
%Share of Continent 9.36 7.0 9.72 9.6 6.41 13.0 9.5 8.1 13.60 6.82 10.98 6.14 (19.27) (9.94)
asia:
China, Mainland 65.89 1,326.1 54.32 829.6 89.47 1,090.2 63.4 1,066.8 33.3 859.2 40.6 1,083.1 21.8 26.1
China, Taiwan 5.77 14.8 3.57 17.0 1.87 11.6 1.3 8.9 5.2 8.8 5.2 12.5 (0.4) 42.2
Hong Kong 6.54 1.8 4.65 104.1 4.34 2.2 3.5 0.7 4.8 24.9 3.1 2.8 (35.9) (88.7)
India 10.11 263.4 9.73 240.6 11.23 258.7 29.3 238.8 12.9 252.3 7.5 266.2 (42.1) 5.5
Indonesia 7.08 73.6 13.25 53.0 8.01 62.0 8.4 57.0 8.3 63.9 7.9 71.5 (4.6) 11.9
Israel 19.56 12.2 17.88 53.2 25.26 7.1 31.8 3.3 22.2 4.2 18.6 7.3 (15.9) 72.0
Japan 43.27 159.0 17.50 115.5 25.15 169.0 16.7 135.1 30.9 98.1 26.6 80.5 (13.8) (18.0)
N.Korea, Pdrk 0.32 0.9 0.19 18.4 0.13 0.7 0.2 0.6 0.0 0.4 0.2 0.3 4,470.9 (25.5)
S.Korea 18.31 49.8 12.37 107.8 10.27 41.1 10.7 40.2 13.4 46.9 12.5 46.2 (7.1) (1.5)
Kuwait 0.64 111.3 0.64 125.6 0.68 422.9 0.4 329.2 1.9 354.3 0.6 514.6 (69.1) 45.2
Lebanon 0.74 1.3 0.50 34.6 0.48 0.2 0.8 0.3 0.2 0.4 0.8 0.4 264.2 0.4
Malaysia 0.43 88.6 0.04 67.3 0.06 92.4 0.5 84.1 0.5 83.6 0.0 84.3 (93.7) 0.8
Pakistan 1.47 10.0 3.56 55.6 6.10 10.3 4.1 23.2 2.2 30.9 2.7 24.7 23.4 (20.2)
Saudi Arabia 61.23 150.8 39.06 141.2 56.57 93.8 51.2 32.9 42.5 88.9 42.2 41.4 (0.7) (53.4)
Singapore 2.29 6.2 2.56 3.6 6.57 6.2 2.6 3.9 2.7 3.1 1.2 4.0 (54.9) 29.7
Yemen 6.68 1.1 17.44 16.0 7.19 0.2 9.4 0.1 12.1 0.4 11.3 0.6 (6.9) 48.7
Thailand 1.28 44.9 1.13 59.9 1.40 64.9 1.6 26.8 1.5 25.8 1.1 72.0 (28.0) 179.1
UAE 35.92 90.6 30.81 52.0 22.52 64.6 24.2 195.3 33.5 221.4 28.2 102.4 (15.9) (53.8)
Others 41.77 189.7 16.37 498.0 35.72 93.9 44.2 102.2 40.6 84.4 25.0 51.5 (38.5) (39.0)
total 329.32 2,596.1 245.59 2,593.1 313.37 2,492.0 304.3 2,349.4 268.7 2,252.0 235.1 2,466.2 (12.5) 9.5
%Share of Continent 36.37 63.8 36.20 65.0 46.81 62.9 41.2 66.3 35.71 61.83 37.44 66.98 4.83 8.32
oceania:
Australia 9.52 7.8 5.57 4.5 3.25 2.7 1.8 0.8 4.1 1.2 7.3 2.2 79.2 89.7
Others 1.27 1.3 2.56 1.8 0.01 1.2 0.5 1.0 3.6 0.8 2.4 0.7 (33.4) (9.8)
Total 10.79 9.0 8.14 6.4 3.26 4.0 2.3 1.8 7.6 2.0 9.7 2.9 26.5 48.5
% Share Of Continent 1.19 0.2 1.20 0.2 0.49 0.1 0.3 0.0 1.01 0.05 1.54 0.08 51.55 46.88
Unspecified Unspecified - - - - - - - - - -
Grand total Grand total 905.5 4,069.0 678.5 3,990.8 669.5 3,963.7 739.3 3,545.5 752.5 3,641.9 628.0 3,682.1 (16.5) 1.1

First Quarter 2018/19 107
National Bank of Ethiopia Quarterly Bulletin
table 24: Volume of Exports, by major commodity groups(In metric tone)
Source: Ethiopian Revenue and Customs Authority, Ethiopian Electric Power (EEP) and Ethiopian Electric Utility (EEU)
table 24 continued:
Source: Ethiopian Revenue and Customs Authority, Ethiopian Electric Power (EEP) and Ethiopian Electric Utility (EEU)
PeriodCereals
and Flour
Natural Gum Civet Hop Animal Fodder
Natural Honey Marble Flower Beverage Spices others Electricity(in
‘1000’ kwh) others* Re-Exports Grand Total*
2013/14
Qtr I 798.7 868.9 - - - 149.9 - 9,122.6 739.7 4,173.4 26,276.4 231,466.1 227,486.9 - 473,315.4
Qtr II 544.4 1,119.3 - - - 204.7 - 10,208.7 681.5 5,194.0 31,560.3 180,250.5 167,731.1 - 415,252.9
Qtr III 1,510.2 785.6 - - - 207.3 - 12,670.2 387.4 6,663.8 47,816.9 154,391.3 193,582.5 - 564,581.0
Qtr IV 16,794.7 629.2 - - - 180.5 - 12,719.0 393.2 5,230.0 65,437.2 216,445.6 243,120.7 - 558,834.9
2014/15
Qtr I 20,858.8 771.6 - - - 137.5 - 10,011.2 687.0 4,473.9 58,000.6 276,751.7 285,642.7 - 551,181.3
Qtr II 4,762.0 725.6 - - - 277.4 - 10,745.3 736.5 5,172.3 52,670.6 177,651.9 187,661.6 - 445,888.6
Qtr III 6,371.3 899.6 - - - 165.4 - 12,210.0 650.0 4,809.6 63,125.8 180,315.0 222,371.1 - 543,788.7
Qtr IV 7,179.9 1,075.9 - - - 100.9 - 13,364.2 916.5 4,690.7 52,407.4 100,549.2 150,380.1 - 452,218.5
2015/16
Qtr I 3,078.6 510.0 - - - 250.0 - 12,506.6 1,177.3 2,397.0 42,680.0 90,814.7 65,804.0 - 332,720.8
Qtr II 1,960.2 606.5 - - - 97.3 - 12,124.5 911.4 3,130.1 36,187.0 78,550.6 58,107.4 - 342,023.7
Qtr III 4,816.3 628.9 - - - 176.6 - 13,522.0 978.8 4,220.0 49,792.4 80,427.7 77,266.5 - 495,004.5
Qtr IV 1,548.4 605.5 - - - 68.7 - 12,476.0 1,146.1 3,627.7 55,732.5 252,509.6 78,246.4 - 437,412.3
2016/17
Qtr I 564.6 574.0 - - - 147.1 - 11,639.6 716.8 2,592.1 59,770.4 324,347.3 79,507.1 - 343,541.7
Qtr II 2,079.4 581.0 - - - 63.4 - 10,694.7 727.2 2,084.0 75,453.8 237,278.9 95,057.9 379,233.8
Qtr III 11,860.4 811.5 - - - 182.0 - 13,087.4 1,626.9 4,003.3 53,496.2 304,156,870.4 88,974.8 479,745.5
Qtr IV 14,504.4 1,966.6 - - - 392.5 - 35,421.8 3,070.9 8,679.4 188,720.3 304,718,496.6 263,539.8 1,202,521.0
2017/18
Qtr I 6,652.9 497.6 - - - 125.3 - 12,373.4 848.7 2,930.8 12,378.2 407,081.0 6,053.6 295,001.7
Qtr II 1,912.9 1,105.0 - - - 66.2 - 10,726.6 1,088.1 2,673.6 15,441.8 263,647.3 39,730.5 390,866.2
Qtr III 2,499.6 431.6 - - - 62.8 - 13,450.8 744.6 2,562.9 20,014.2 331,984.7 5,891.5 387,781.0
Qtr IV 739.8 448.5 - - - 62.0 - 13,550.1 885.5 4,409.6 15,536.9 513,474.6 4,490.2 338,312.3
2018/19 Qtr I 553.9 108.1 - - - 16.4 - 12,122.2 989.9 3,446.0 9,478.5 293,768.7 5,062.2 - 252,459.3
period Coffee oil Seeds
leather and
leather productsa
pulsesMeat &
Meat prodts.
fruits & Veget. Sugar Gold oil
Cakeslive animals Chat
petrol. & pet. prdts
Bees Wax tantalem Cotton text. &
text. prdts
2013/14
Qtr I 40,607.4 42,396.2 1,234.0 73,940.7 3,970.4 34,044.8 - 1.9 - 36,179.2 13,399.0 - 55.0 12.4 615.5 5,348.4
Qtr II 25,462.9 60,204.0 1,567.6 83,661.8 3,129.6 35,983.1 - 3.4 - 24,390.8 13,022.5 - 96.0 21.2 - 5,236.4
Qtr III 44,320.0 135,867.8 1,296.4 110,039.3 3,604.9 36,447.0 - 3.3 - 26,373.3 12,957.9 - 88.5 28.1 91.5 4,519.8
Qtr IV 79,279.1 75,058.6 1,475.0 85,380.4 4,267.0 38,961.4 - 3.0 - 18,884.1 12,310.4 - 95.2 26.2 44.9 3,533.7
2014/15
Qtr I 42,147.5 46,714.0 1,551.2 91,360.5 4,900.0 35,556.8 - 2.1 - 31,243.4 11,942.5 - 120.5 42.4 0.2 3,144.5
Qtr II 30,419.0 66,114.6 1,423.6 82,896.7 4,403.3 41,231.9 - 1.9 - 16,407.3 15,207.7 - 121.0 67.7 - 2,812.5
Qtr III 37,737.8 117,147.9 1,548.2 100,900.5 4,829.0 34,875.2 - 3.4 - 12,436.6 11,851.5 - 87.5 20.9 8.1 5,247.5
Qtr IV 73,566.5 89,485.4 1,651.9 65,579.2 4,902.2 38,484.8 - 1.7 - 17,773.1 10,202.4 - 191.4 16.7 - 3,653.8
2015/16
Qtr I 48,791.9 39,036.0 1,521.5 77,378.6 5,059.4 43,459.6 - 2.3 - 38,543.2 13,054.8 - 69.5 52.9 - 3,151.8
Qtr II 38,987.8 75,681.3 1,475.1 95,395.4 4,413.4 41,617.8 - 2.1 - 14,341.2 11,926.0 - 76.3 46.0 - 3,044.3
Qtr III 43,718.5 201,471.9 1,367.2 102,695.8 4,670.3 41,743.5 - 1.9 - 10,972.9 11,060.7 - 35.4 63.0 0.3 3,068.1
Qtr IV 67,160.0 120,384.3 1,619.6 99,955.3 4,822.0 40,255.5 - 2.4 - 13,921.7 10,958.7 - 86.5 24.0 - 3,017.3
2016/17
Qtr I 47,935.3 62,849.2 1,241.0 73,722.9 4,499.5 42,284.5 - 1.7 - 17,869.7 13,565.9 - 65.0 56.4 - 3,446.1
Qtr II 37,490.2 69,630.3 1,629.5 108,149.0 4,735.7 45,227.6 - 0.8 - 5,183.1 12,078.8 - 51.0 40.1 - 3,334.2
Qtr III 54,698.0 102,931.1 1,386.1 139,885.6 4,958.6 43,550.3 26,514.6 1.4 - 5,170.2 11,576.4 - 98.3 92.7 - 3,814.4
Qtr IV 85,623.5 98,103.5 1,633.5 70,985.8 5,371.1 47,506.8 24,612.0 1.9 - 7,843.6 11,597.1 - 88.0 40.1 - 5,598.2
2017/18
Qtr I 55,862.3 69,482.8 1,578.5 68,758.6 4,697.6 46,826.2 15,330.8 0.8 - 15,182.6 11,209.9 - 18.0 33.7 847.1 5,172.8
Qtr II 51,511.3 117,658.6 1,674.6 110,392.2 4,159.4 47,367.3 2,718.8 0.5 - 4,351.2 11,176.4 - 125.5 2,132.6 1,156.7 3,427.0
Qtr III 52,367.3 105,505.6 1,464.4 148,509.3 5,016.1 44,155.0 8,278.5 1.3 - 4,454.0 12,021.5 - 116.5 633.7 1,266.6 3,991.2
Qtr IV 78,831.9 55,900.9 1,683.2 110,401.4 6,081.8 50,628.4 9,630.0 0.2 - 7,949.2 12,616.2 - 98.7 60.4 259.0 4,170.9
2018/19 Qtr I 59,199.0 42,370.8 1,539.8 69,123.1 4,703.0 41,609.1 7,355.1 0.5 - 7,180.1 14,228.7 - 88.0 288.6 182.0 4,591.6

First Quarter 2018/19108
National Bank of Ethiopia Quarterly Bulletin
table 25: Value of Exports, by Major Commodity Groups
Source: Ethiopian Revenue and Customs Authority, Ethiopian Electric Power (EEP) and Ethiopian Electric Utility (EEU)
Source: Ethiopian Revenue and Customs Authority, Ethiopian Electric Power (EEP) and Ethiopian Electric Utility (EEU)
period Coffee oil Seeds
leather and leather
products pulsesMeat & Meat
prodts.fruits & Vegetables Sugar Gold oil Cakes
live animals Chat
petrol. & pet. prdts Bees Wax tantalem Cotton
text. & text. prdts
2013/14
Qtr I 2,571,879.02 1,368,355.56 599,029.96 888,604.25 376,049.06 185,036.53 - 1,465,413.10 - 1,196,022.71 1,427,123.25 - 8,236.86 3,478.96 16,932.10 535,850.02
Qtr II 1,613,907.40 2,590,227.05 665,155.27 1,129,528.18 298,627.99 262,105.31 - 2,225,243.14 - 788,435.10 1,370,729.01 - 14,174.58 20,383.51 - 553,399.09
Qtr III 3,166,700.91 5,770,739.28 614,057.55 1,569,048.72 331,095.19 237,001.35 - 2,407,850.09 - 874,204.57 1,425,240.39 - 14,660.42 34,633.96 2,026.11 497,720.31
Qtr IV 6,355,627.05 2,747,887.38 596,407.36 1,203,261.48 418,241.25 235,010.32 - 2,623,684.49 - 694,613.64 1,405,654.33 - 14,974.08 27,925.47 1,097.70 513,947.93
2014/15
Qtr I 3,601,606.60 1,782,898.66 650,939.82 1,231,102.44 472,079.61 202,646.32 - 1,548,672.59 - 1,182,546.88 1,316,313.98 - 21,439.25 74,818.49 4.74 420,448.06
Qtr II 2,518,466.43 2,455,328.14 599,692.01 1,157,023.03 416,795.93 256,407.19 - 1,283,486.68 - 615,036.67 1,658,532.63 - 21,584.25 82,407.47 - 364,718.87
Qtr III 3,450,896.65 3,515,303.69 693,219.39 1,243,523.40 473,887.80 245,897.65 - 2,365,432.58 - 462,946.54 1,325,665.80 - 16,251.30 23,524.21 231.25 779,611.07
Qtr IV 6,163,963.66 2,515,767.17 700,896.33 777,563.07 503,104.87 251,662.78 - 1,201,434.50 - 716,025.97 1,167,518.10 - 36,452.15 21,895.90 - 404,544.21
2015/16
Qtr I 3,833,482.55 1,117,113.73 611,869.33 1,008,591.81 536,437.89 284,426.10 - 1,533,270.26 - 1,513,932.09 1,513,299.59 - 12,738.43 43,474.09 - 462,484.53
Qtr II 2,483,305.88 1,744,206.98 599,845.57 1,270,029.37 461,902.72 285,570.28 - 1,353,852.86 - 562,849.10 1,382,213.41 - 14,305.96 40,780.40 - 399,474.19
Qtr III 3,468,404.77 4,246,993.00 565,811.69 1,296,829.87 503,926.11 283,215.63 - 1,428,736.52 - 444,847.26 1,286,804.44 - 7,269.83 44,244.54 11.59 384,833.83
Qtr IV 5,482,069.78 2,968,529.53 646,580.27 1,311,552.35 524,281.73 274,857.76 - 1,797,371.68 - 568,958.88 1,329,711.26 - 17,011.91 23,065.16 - 387,202.37
2016/17
Qtr I 3,967,681.81 1,566,890.84 568,470.09 1,122,225.51 481,858.65 294,980.86 - 1,429,988.74 - 729,289.63 1,646,044.16 - 12,745.69 41,717.52 - 461,145.78
Qtr II 2,947,226.42 1,545,549.69 642,588.05 1,736,431.27 533,074.66 325,785.53 - 751,520.29 - 214,348.91 1,504,475.06 - 10,395.38 29,485.20 - 457,402.49
Qtr III 5,262,982.58 2,447,326.56 570,064.32 2,162,962.11 562,140.77 305,094.56
59,869.51 1,020,138.31 - 212,897.51 1,460,530.31 - 19,689.21 33,777.29 - 516,886.85
Qtr IV 7,719,668.05 2,331,595.43 777,873.35 1,254,944.02 637,647.65 331,887.52
55,562.19 1,482,343.45 - 349,972.81 1,502,640.11 - 17,736.43 32,881.43 - 568,850.61
2017/18
Qtr I 5,011,278.90 1,744,858.76 769,891.95 1,067,855.73 562,830.79 362,770.12
73,122.09 665,027.05 - 698,508.03 1,478,336.66 - 3,557.04 32,525.56 35,581.39 709,998.20
Qtr II 4,443,198.44 3,834,235.78 949,826.11 1,839,139.38 563,485.93 417,619.41 7,754.76 501,643.73 - 212,460.16 1,641,071.57 - 27,767.27 73,565.65 44,337.81 508,420.22
Qtr III 4,861,307.06 3,706,619.53 788,275.50 2,307,768.02 684,152.76 386,724.14
27,284.49 1,256,940.42 - 217,174.16 1,846,728.64 - 27,095.50 35,121.47 49,979.95 678,085.12
Qtr IV 7,577,696.00 1,903,139.95 947,815.16 1,909,501.27 851,498.53 436,383.47
25,421.15 182,145.95 - 410,929.25 1,916,101.39 - 22,891.58 104,794.87 10,452.29 798,725.24
2018/19 Qtr I 5,606,714.42 1,595,732.93 912,007.83 1,193,432.93 664,247.51 406,255.91
18,005.50 429,197.17 - 400,073.40 2,162,094.27 - 20,306.93 41,732.37 6,947.01 932,321.83
periodCereals
and flourNatural
Gum Civet hopanimal fodder
Natural honey Marble flower Beverage Spices others Electricity others*
Re-Exports Grand total
2013/14
Qtr I 27,777.70 56,608.67 - - - 9,910.90 - 739,115.07 19,556.85 98,147.13 232,015.90 246,301.16 556,261.08 - 10,642,011.39
Qtr II 12,120.35 65,847.07 - - - 12,728.26 - 854,266.66 19,129.72 127,691.94 281,688.78 195,215.97 573,782.60 - 11,531,915.63
Qtr III 25,020.02 60,823.94 - - - 13,211.00 -
1,144,376.26 10,384.12 178,127.80 338,091.96 177,870.44 534,380.38 - 16,944,978.84
Qtr IV 148,196.53 48,180.11 - - - 11,376.45 -
1,079,625.85 10,824.22 157,185.08 503,732.86 244,529.18 542,971.10 - 16,838,332.48
2014/15
Qtr I 150,602.42 48,948.61 - - - 9,515.37 - 863,071.79 17,535.03 139,740.12 478,824.02 301,876.97 495,271.29 - 12,505,517.44
Qtr II 45,667.00 50,931.24 - - - 18,480.82 - 941,129.15 19,768.74 214,032.25 317,035.83 205,459.11 447,126.34 - 11,429,479.30
Qtr III 56,976.52 61,952.36 - - 250.92 12,177.23 -
1,114,876.62 17,489.82 166,314.22 352,692.15 213,847.85 803,366.52 - 14,596,391.33
Qtr IV 66,311.12 69,121.82 - - - 5,966.71 -
1,167,788.58 25,107.58 127,762.90 308,093.40 136,269.21 426,440.11 - 14,460,828.72
2015/16
Qtr I 46,093.59 34,858.54 - - - 18,622.23 -
1,112,635.18 27,384.59 81,105.78 315,695.13 114,332.66 505,958.62 - 12,471,120.40
Qtr II 38,982.52 43,255.52 - - - 6,606.44 -
1,106,521.26 23,434.28 136,724.05 399,943.14 163,153.89 440,254.59 - 10,598,336.69
Qtr III 66,187.87 47,327.01 - - - 11,996.87 -
1,336,078.82 26,837.95 208,123.71 464,528.36 116,892.36 429,089.96 - 13,961,929.09
Qtr IV 33,947.12 50,557.29 - - - 4,703.20 -
1,182,616.71 32,124.90 140,268.60 366,561.08 322,189.21 410,267.52 - 15,331,192.67
2016/17
Qtr I 15,454.20 41,522.18 - - - 10,707.79 -
1,105,141.90 20,112.72 131,608.91 399,218.95 394,411.57 502,863.29 - 12,323,039.26
Qtr II 38,022.84 56,872.05 - - - 3,649.66 -
1,045,226.32 20,345.58 111,679.53 500,765.25 300,235.98 486,887.69 10,698,282.95
Qtr III 102,075.77 64,418.22 - - - 13,778.95 -
1,366,378.54 22,716.24 176,613.38 593,113.21
384,298,139.26 550,664.13 14,634,359.88
Qtr.IV 195,142.14 118,724.11 - - - 22,421.80 -
2,287,106.82 36,930.87 302,310.02 1,015,628.87
671,946,659.59 940,887.77 - 25,243,562.23
2017/18
Qtr I 64,616.68 38,735.39 - - - 10,124.92 -
1,266,346.36 22,798.98 101,110.03 443,307.74 517,682.43 778,105.16 - 13,216,142.28
Qtr II 29,613.61 86,711.99 - - - 5,137.37 -
1,322,830.19 35,531.87 106,985.75 296,197.05 399,594.85 2,908,926.36 17,347,128.89
Qtr III 42,778.32 52,128.29 - - - 3,808.18 -
1,776,936.74 22,194.74 101,646.73 326,520.65 500,366.79 763,186.55 16,873,256.77
Qtr.IV 19,770.96 56,224.93 - - - 4,624.29 -
1,615,957.90 28,273.77 131,539.76 251,415.39 780,060.63 3,801,840.03 19,985,363.74
2018/19 Qtr I 17,470.15 16,093.37 - - - 1,475.15 -
1,451,212.49 25,556.93 113,331.98 277,665.97 456,745.80 3,340,553.05 16,748,621.86
table 25 continued:

First Quarter 2018/19 109
National Bank of Ethiopia Quarterly Bulletin
table 26: Value of imports, by Major Commodity Groups**(In 000 birr)
Source: Ethiopian Revenues and Customs Authority* Data on import of petroleum products are obtained from Ethiopian Petroleum Enterprise ** All the data are updated based on revised data from the Ethiopian Revenues and Customs Authority
table 26 continued:
Source: Ethiopian Revenues and Customs Authority* Data on import of petroleum products are obtained from Ethiopian Petroleum Enterprise ** All the data are updated based on revised data from the Ethiopian Revenues and Customs Authority
PeriodFood & Live
Animals Beverages TobaccoPetroleum
CrudePetroleum Prod.**** Chemicals Fertilizers
Medical & Pharm. Prod Soap & Polish Rubber Prod.
Paper & Paper Manfc.
2013/14
Qtr I 1,215 163 19 0 11,978 674 1,534 690 467 1,446 512
Qtr II 3,913 124 27 0 10,006 899 3,728 747 580 1,625 564
Qtr III 2,581 139 32 - 12,565 899 1,062 421 601 1,361 502
Qtr IV 1,458 108 15 0 13,071 1,174 1,485 531 539 1,426 414
2014/15
Qtr I 3,614,064 169,116 18,366 45 11,125,318 929,302 1,310,143 242,236 483,501 1,587,620 522,434
Qtr II 3,357,999 148,421 22,050 71 11,793,269 954,461 1,081,713 1,269,710 607,792 1,426,216 514,790
Qtr III 3,352,714 165,580 29,315 - 7,415,455 899,651 2,045,870 209,194 582,277 1,477,470 578,833
Qtr IV 2,830,621 86,928 25,046 84 9,488,497 968,581 4,204,046 847,847 513,167 1,488,362 446,776
2015/16
Qtr I 2,723,464 177,134 37,401 47 7,269,778 910,225 1,649,390 328,325 582,691 1,649,379 495,802
Qtr II 5,738,333 204,992 48,584 50 7,186,215 723,846 1,859,882 1,191,311 680,624 1,572,598 567,087
Qtr II 9,814,431 198,590 31,413 5 5,534,198 816,529 1,861,968 292,866 692,295 1,603,370 691,583
Qtr IV 6,316,660 165,606 36,197 7 7,015,302 1,166,104 5,120,080 719,231 738,846 1,525,275 771,085
2016/17
Qtr.I 5,174,484 178,486 25,900 25 7,812,912 981,066 1,535,843 645,674 921,470 1,676,917 638,321
Qtr.II 2,903,309 161,168 32,573 7 9,779,325 668,951 3,447,434 897,417 664,975 1,619,764 666,069
Qtr.III 4,038,531 155,586 27,239 84 11,196,395 610,163 2,208,577 279,284 585,677 1,659,964 602,408
Qtr.IV 2,714,657 204,161 36,574 3,613 10,354,648 1,063,782 5,087,230 269,118 917,879 1,751,928 550,387
2017/18
Qtr. I 5,097,596 242,383 22,093 - 10,217,553 964,874 2,132,654 332,193 714,235 1,687,081 657,329
Qtr.II 6,544,508 216,136 26,897 172 14,481,837 1,094,307 1,784,113 651,619 975,471 1,786,643 614,351
Qtr.III 3,875,159 231,936 25,794 1,527 15,362,850 1,045,727 3,158,363 200,846 734,633 1,431,496 476,604
Qtr IV 6,829,349 153,048 32,263 96 18,551,748 1,172,184 5,286,696 311,339 875,399 1,533,488 432,250
2018/19 Qtr I 6108505.141 171394.7575 18925.99783 0 17291910.91 1640215.796 3200285.606 537018.1834 997359.7832 1938502.258 563586.3214
period textiles ClothingsGlass & Glass
WareMetal & Metal
Manfc.Machinery &
aircraftRoad Motor
VehiclesElectrical Materials Grain*
telecomm. appara. others GRaND total
2013/14
Qtr I 898 1,449 512 6,152 6,034 5,872 3,262 979 120 11,695 54,693
Qtr II 1,598 1,403 511 6,757 9,088 6,467 4,629 3,057 44 13,375 66,084
Qtr III 1,116 1,246 441 6,679 10,214 5,181 9,587 1,014 60 16,004 70,690
Qtr IV 1,010 1,345 478 10,351 11,438 6,300 5,256 553 126 13,843 70,370
2014/15
Qtr I 1,382,449 1,854,400 607,650 11,404,893 9,246,269 5,960,021 6,591,109 689,775 68,975 15,229,957 72,347,869
Qtr II 1,413,409 1,762,478 648,320 12,737,671 12,380,955 8,060,575 11,072,288 610,477 452,791 17,934,138 87,639,117
Qtr III 1,543,161 1,637,457 641,197 12,771,367 12,115,191 8,753,874 12,305,462 791,821 473,791 17,664,885 84,662,746
Qtr IV 1,480,110 1,548,163 580,113 8,717,207 11,964,849 8,697,385 13,282,677 879,719 493,615 18,480,428 86,144,501
2015/16
Qtr. I 1,398,135 2,064,413 627,591 12,299,464 11,948,027 8,470,542 15,447,371 818,473 149,425 17,180,363 85,408,968
Qtr.II 1,579,650 2,135,932 729,110 11,408,166 13,931,995 11,836,615 8,447,821 905,411 757,068 16,688,579 87,288,459
Qtr. III 1,460,601 1,806,638 616,393 12,441,279 19,369,129 6,876,924 6,173,385 1,067,599 190,054 22,173,067 92,644,720
Qtr. IV 1,230,856 1,983,777 758,872 10,601,333 12,881,820 6,575,215 7,347,648 825,910 115,616 22,602,181 87,671,709
2016/17
Qtr.I 1,383,978 2,192,374 808,926 10,290,955 12,737,311 7,965,263 7,595,439 988,419 7,308,290 19,005,059 88,878,692
Qtr.II 1,645,039 2,105,322 833,900 11,428,967 13,511,699 9,629,018 7,410,779 926,544 223,723 19,981,624 87,611,064
Qtr. III 1,150,448 1,981,457 935,599 9,347,851 14,717,861 8,580,209 5,905,610 1,009,261 59,694 19,971,213 84,013,849
Qtr. IV 1,237,227 2,250,547 798,397 10,504,708 16,014,724 7,324,469 9,174,224 923,184 138,938 23,370,095 93,767,307
2017/18
Qtr.I 1,317,775 2,341,556 851,532 10,705,075 17,029,020 7,851,355 7,957,574 1,406,934 131,105 22,507,995 92,760,976
Qtr.II 1,264,948 2,349,149 1,033,330 9,463,471 16,898,937 8,663,856 7,197,524 1,375,593 115,803 30,611,664 105,774,738
Qtr.III 1,169,718 3,120,985 695,758 8,974,972 16,948,824 6,542,352 6,975,499 1,409,797 98,565 25,455,731 96,527,340
QtrIV 1,286,900 1,828,263 579,208 7,929,223 14,869,246 4,900,213 6,092,034 1,782,783 82,770 26,492,914 99,238,631
2018/19 Qtr.I 1,562,470 2,163,693 701,640 9,627,455 17,850,408 4,941,253 7,724,711 1,251,621 80,252 23,862,895 100,982,482
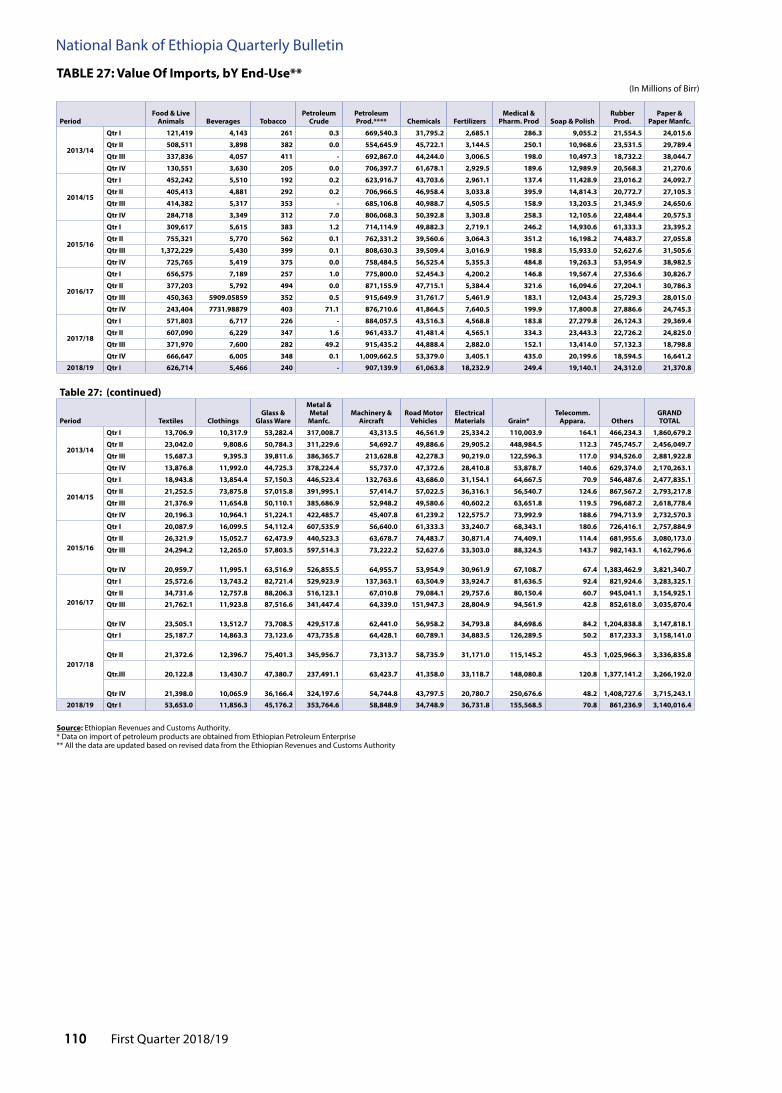
First Quarter 2018/19110
National Bank of Ethiopia Quarterly Bulletin
taBlE 27: Value of imports, bY End-Use** (In Millions of Birr)
Source: Ethiopian Revenues and Customs Authority.* Data on import of petroleum products are obtained from Ethiopian Petroleum Enterprise ** All the data are updated based on revised data from the Ethiopian Revenues and Customs Authority
periodfood & live
animals Beverages tobaccopetroleum
Crudepetroleum prod.**** Chemicals fertilizers
Medical & pharm. prod Soap & polish
Rubber prod.
paper & paper Manfc.
2013/14
Qtr i 121,419 4,143 261 0.3 669,540.3 31,795.2 2,685.1 286.3 9,055.2 21,554.5 24,015.6
Qtr ii 508,511 3,898 382 0.0 554,645.9 45,722.1 3,144.5 250.1 10,968.6 23,531.5 29,789.4
Qtr iii 337,836 4,057 411 - 692,867.0 44,244.0 3,006.5 198.0 10,497.3 18,732.2 38,044.7
Qtr iV 130,551 3,630 205 0.0 706,397.7 61,678.1 2,929.5 189.6 12,989.9 20,568.3 21,270.6
2014/15
Qtr i 452,242 5,510 192 0.2 623,916.7 43,703.6 2,961.1 137.4 11,428.9 23,016.2 24,092.7
Qtr ii 405,413 4,881 292 0.2 706,966.5 46,958.4 3,033.8 395.9 14,814.3 20,772.7 27,105.3
Qtr iii 414,382 5,317 353 - 685,106.8 40,988.7 4,505.5 158.9 13,203.5 21,345.9 24,650.6
Qtr iV 284,718 3,349 312 7.0 806,068.3 50,392.8 3,303.8 258.3 12,105.6 22,484.4 20,575.3
2015/16
Qtr i 309,617 5,615 383 1.2 714,114.9 49,882.3 2,719.1 246.2 14,930.6 61,333.3 23,395.2
Qtr ii 755,321 5,770 562 0.1 762,331.2 39,560.6 3,064.3 351.2 16,198.2 74,483.7 27,055.8
Qtr iii 1,372,229 5,430 399 0.1 808,630.3 39,509.4 3,016.9 198.8 15,933.0 52,627.6 31,505.6
Qtr iV 725,765 5,419 375 0.0 758,484.5 56,525.4 5,355.3 484.8 19,263.3 53,954.9 38,982.5
2016/17
Qtr i 656,575 7,189 257 1.0 775,800.0 52,454.3 4,200.2 146.8 19,567.4 27,536.6 30,826.7
Qtr ii 377,203 5,792 494 0.0 871,155.9 47,715.1 5,384.4 321.6 16,094.6 27,204.1 30,786.3
Qtr iii 450,363 5909.05859 352 0.5 915,649.9 31,761.7 5,461.9 183.1 12,043.4 25,729.3 28,015.0
Qtr iV 243,404 7731.98879 403 71.1 876,710.6 41,864.5 7,640.5 199.9 17,800.8 27,886.6 24,745.3
2017/18
Qtr i 571,803 6,717 226 - 884,057.5 43,516.3 4,568.8 183.8 27,279.8 26,124.3 29,369.4
Qtr ii 607,090 6,229 347 1.6 961,433.7 41,481.4 4,565.1 334.3 23,443.3 22,726.2 24,825.0
Qtr iii 371,970 7,600 282 49.2 915,435.2 44,888.4 2,882.0 152.1 13,414.0 57,132.3 18,798.8
Qtr iV 666,647 6,005 348 0.1 1,009,662.5 53,379.0 3,405.1 435.0 20,199.6 18,594.5 16,641.2
2018/19 Qtr i 626,714 5,466 240 - 907,139.9 61,063.8 18,232.9 249.4 19,140.1 24,312.0 21,370.8
table 27: (continued)
period textiles ClothingsGlass &
Glass Ware
Metal & Metal
Manfc.Machinery &
aircraftRoad Motor
VehiclesElectrical Materials Grain*
telecomm. appara. others
GRaND total
2013/14
Qtr i 13,706.9 10,317.9 53,282.4 317,008.7 43,313.5 46,561.9 25,334.2 110,003.9 164.1 466,234.3 1,860,679.2
Qtr ii 23,042.0 9,808.6 50,784.3 311,229.6 54,692.7 49,886.6 29,905.2 448,984.5 112.3 745,745.7 2,456,049.7
Qtr iii 15,687.3 9,395.3 39,811.6 386,365.7 213,628.8 42,278.3 90,219.0 122,596.3 117.0 934,526.0 2,881,922.8
Qtr iV 13,876.8 11,992.0 44,725.3 378,224.4 55,737.0 47,372.6 28,410.8 53,878.7 140.6 629,374.0 2,170,263.1
2014/15
Qtr i 18,943.8 13,854.4 57,150.3 446,523.4 132,763.6 43,686.0 31,154.1 64,667.5 70.9 546,487.6 2,477,835.1
Qtr ii 21,252.5 73,875.8 57,015.8 391,995.1 57,414.7 57,022.5 36,316.1 56,540.7 124.6 867,567.2 2,793,217.8
Qtr iii 21,376.9 11,654.8 50,110.1 385,686.9 52,948.2 49,580.6 40,602.2 63,651.8 119.5 796,687.2 2,618,778.4
Qtr iV 20,196.3 10,964.1 51,224.1 422,485.7 45,407.8 61,239.2 122,575.7 73,992.9 188.6 794,713.9 2,732,570.3
2015/16
Qtr i 20,087.9 16,099.5 54,112.4 607,535.9 56,640.0 61,333.3 33,240.7 68,343.1 180.6 726,416.1 2,757,884.9
Qtr ii 26,321.9 15,052.7 62,473.9 440,523.3 63,678.7 74,483.7 30,871.4 74,409.1 114.4 681,955.6 3,080,173.0
Qtr iii 24,294.2 12,265.0 57,803.5 597,514.3 73,222.2 52,627.6 33,303.0 88,324.5 143.7 982,143.1 4,162,796.6
Qtr iV 20,959.7 11,995.1 63,516.9 526,855.5 64,955.7 53,954.9 30,961.9 67,108.7 67.4
1,383,462.9 3,821,340.7
2016/17
Qtr i 25,572.6 13,743.2 82,721.4 529,923.9 137,363.1 63,504.9 33,924.7 81,636.5 92.4 821,924.6 3,283,325.1
Qtr ii 34,731.6 12,757.8 88,206.3 516,123.1 67,010.8 79,084.1 29,757.6 80,150.4 60.7 945,041.1 3,154,925.1
Qtr iii 21,762.1 11,923.8 87,516.6 341,447.4 64,339.0 151,947.3 28,804.9 94,561.9 42.8 852,618.0 3,035,870.4
Qtr iV 23,505.1 13,512.7 73,708.5 429,517.8 62,441.0 56,958.2 34,793.8 84,698.6 84.2
1,204,838.8 3,147,818.1
2017/18
Qtr i 25,187.7 14,863.3 73,123.6 473,735.8 64,428.1 60,789.1 34,883.5 126,289.5 50.2 817,233.3 3,158,141.0
Qtr ii 21,372.6 12,396.7 75,401.3 345,956.7 73,313.7 58,735.9 31,171.0 115,145.2 45.3
1,025,966.3 3,336,835.8
Qtr.iii 20,122.8 13,430.7 47,380.7 237,491.1 63,423.7 41,358.0 33,118.7 148,080.8 120.8
1,377,141.2 3,266,192.0
Qtr iV 21,398.0 10,065.9 36,166.4 324,197.6 54,744.8 43,797.5 20,780.7 250,676.6 48.2
1,408,727.6 3,715,243.1
2018/19 Qtr i 53,653.0 11,856.3 45,176.2 353,764.6 58,848.9 34,748.9 36,731.8 155,568.5 70.8 861,236.9 3,140,016.4
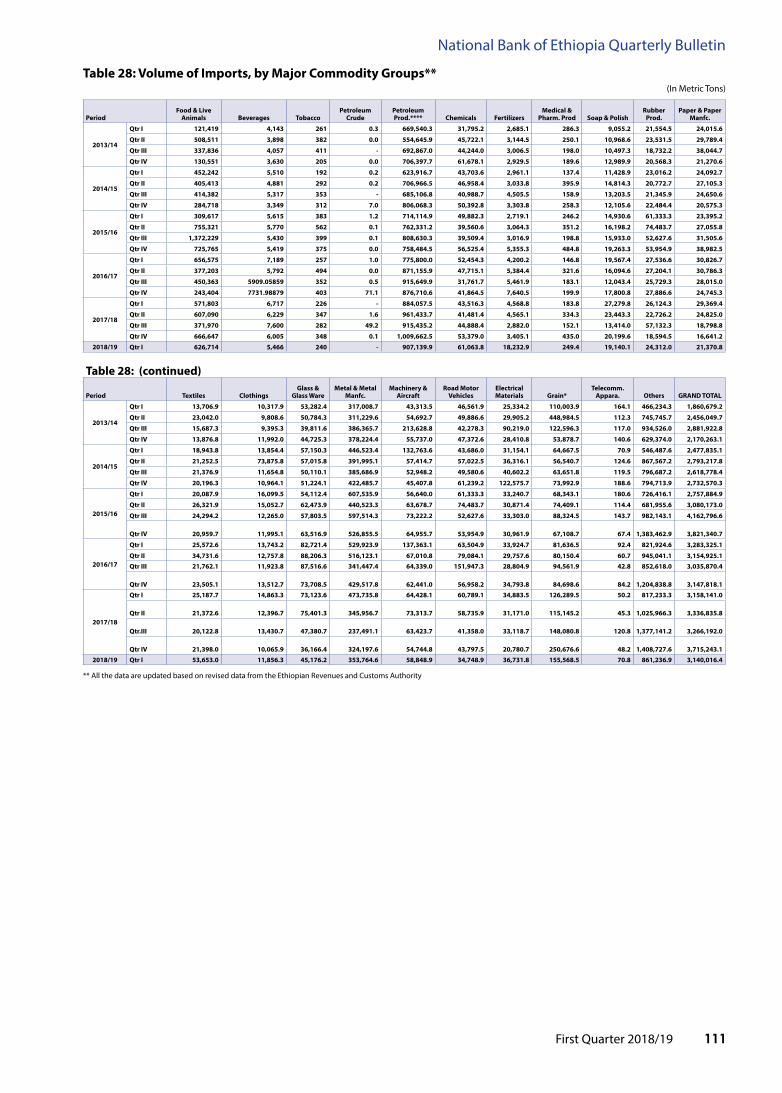
First Quarter 2018/19 111
National Bank of Ethiopia Quarterly Bulletin
table 28: Volume of imports, by Major Commodity Groups**(In Metric Tons)
** All the data are updated based on revised data from the Ethiopian Revenues and Customs Authority
periodfood & live
animals Beverages tobaccopetroleum
Crudepetroleum prod.**** Chemicals fertilizers
Medical & pharm. prod Soap & polish
Rubber prod.
paper & paper Manfc.
2013/14
Qtr i 121,419 4,143 261 0.3 669,540.3 31,795.2 2,685.1 286.3 9,055.2 21,554.5 24,015.6
Qtr ii 508,511 3,898 382 0.0 554,645.9 45,722.1 3,144.5 250.1 10,968.6 23,531.5 29,789.4
Qtr iii 337,836 4,057 411 - 692,867.0 44,244.0 3,006.5 198.0 10,497.3 18,732.2 38,044.7
Qtr iV 130,551 3,630 205 0.0 706,397.7 61,678.1 2,929.5 189.6 12,989.9 20,568.3 21,270.6
2014/15
Qtr i 452,242 5,510 192 0.2 623,916.7 43,703.6 2,961.1 137.4 11,428.9 23,016.2 24,092.7
Qtr ii 405,413 4,881 292 0.2 706,966.5 46,958.4 3,033.8 395.9 14,814.3 20,772.7 27,105.3
Qtr iii 414,382 5,317 353 - 685,106.8 40,988.7 4,505.5 158.9 13,203.5 21,345.9 24,650.6
Qtr iV 284,718 3,349 312 7.0 806,068.3 50,392.8 3,303.8 258.3 12,105.6 22,484.4 20,575.3
2015/16
Qtr i 309,617 5,615 383 1.2 714,114.9 49,882.3 2,719.1 246.2 14,930.6 61,333.3 23,395.2
Qtr ii 755,321 5,770 562 0.1 762,331.2 39,560.6 3,064.3 351.2 16,198.2 74,483.7 27,055.8
Qtr iii 1,372,229 5,430 399 0.1 808,630.3 39,509.4 3,016.9 198.8 15,933.0 52,627.6 31,505.6
Qtr iV 725,765 5,419 375 0.0 758,484.5 56,525.4 5,355.3 484.8 19,263.3 53,954.9 38,982.5
2016/17
Qtr i 656,575 7,189 257 1.0 775,800.0 52,454.3 4,200.2 146.8 19,567.4 27,536.6 30,826.7
Qtr ii 377,203 5,792 494 0.0 871,155.9 47,715.1 5,384.4 321.6 16,094.6 27,204.1 30,786.3
Qtr iii 450,363 5909.05859 352 0.5 915,649.9 31,761.7 5,461.9 183.1 12,043.4 25,729.3 28,015.0
Qtr iV 243,404 7731.98879 403 71.1 876,710.6 41,864.5 7,640.5 199.9 17,800.8 27,886.6 24,745.3
2017/18
Qtr i 571,803 6,717 226 - 884,057.5 43,516.3 4,568.8 183.8 27,279.8 26,124.3 29,369.4
Qtr ii 607,090 6,229 347 1.6 961,433.7 41,481.4 4,565.1 334.3 23,443.3 22,726.2 24,825.0
Qtr iii 371,970 7,600 282 49.2 915,435.2 44,888.4 2,882.0 152.1 13,414.0 57,132.3 18,798.8
Qtr iV 666,647 6,005 348 0.1 1,009,662.5 53,379.0 3,405.1 435.0 20,199.6 18,594.5 16,641.2
2018/19 Qtr i 626,714 5,466 240 - 907,139.9 61,063.8 18,232.9 249.4 19,140.1 24,312.0 21,370.8
table 28: (continued)
period textiles ClothingsGlass &
Glass WareMetal & Metal
Manfc.Machinery &
aircraftRoad Motor
VehiclesElectrical Materials Grain*
telecomm. appara. others GRaND total
2013/14
Qtr i 13,706.9 10,317.9 53,282.4 317,008.7 43,313.5 46,561.9 25,334.2 110,003.9 164.1 466,234.3 1,860,679.2
Qtr ii 23,042.0 9,808.6 50,784.3 311,229.6 54,692.7 49,886.6 29,905.2 448,984.5 112.3 745,745.7 2,456,049.7
Qtr iii 15,687.3 9,395.3 39,811.6 386,365.7 213,628.8 42,278.3 90,219.0 122,596.3 117.0 934,526.0 2,881,922.8
Qtr iV 13,876.8 11,992.0 44,725.3 378,224.4 55,737.0 47,372.6 28,410.8 53,878.7 140.6 629,374.0 2,170,263.1
2014/15
Qtr i 18,943.8 13,854.4 57,150.3 446,523.4 132,763.6 43,686.0 31,154.1 64,667.5 70.9 546,487.6 2,477,835.1
Qtr ii 21,252.5 73,875.8 57,015.8 391,995.1 57,414.7 57,022.5 36,316.1 56,540.7 124.6 867,567.2 2,793,217.8
Qtr iii 21,376.9 11,654.8 50,110.1 385,686.9 52,948.2 49,580.6 40,602.2 63,651.8 119.5 796,687.2 2,618,778.4
Qtr iV 20,196.3 10,964.1 51,224.1 422,485.7 45,407.8 61,239.2 122,575.7 73,992.9 188.6 794,713.9 2,732,570.3
2015/16
Qtr i 20,087.9 16,099.5 54,112.4 607,535.9 56,640.0 61,333.3 33,240.7 68,343.1 180.6 726,416.1 2,757,884.9
Qtr ii 26,321.9 15,052.7 62,473.9 440,523.3 63,678.7 74,483.7 30,871.4 74,409.1 114.4 681,955.6 3,080,173.0
Qtr iii 24,294.2 12,265.0 57,803.5 597,514.3 73,222.2 52,627.6 33,303.0 88,324.5 143.7 982,143.1 4,162,796.6
Qtr iV 20,959.7 11,995.1 63,516.9 526,855.5 64,955.7 53,954.9 30,961.9 67,108.7 67.4
1,383,462.9 3,821,340.7
2016/17
Qtr i 25,572.6 13,743.2 82,721.4 529,923.9 137,363.1 63,504.9 33,924.7 81,636.5 92.4 821,924.6 3,283,325.1
Qtr ii 34,731.6 12,757.8 88,206.3 516,123.1 67,010.8 79,084.1 29,757.6 80,150.4 60.7 945,041.1 3,154,925.1
Qtr iii 21,762.1 11,923.8 87,516.6 341,447.4 64,339.0 151,947.3 28,804.9 94,561.9 42.8 852,618.0 3,035,870.4
Qtr iV 23,505.1 13,512.7 73,708.5 429,517.8 62,441.0 56,958.2 34,793.8 84,698.6 84.2
1,204,838.8 3,147,818.1
2017/18
Qtr i 25,187.7 14,863.3 73,123.6 473,735.8 64,428.1 60,789.1 34,883.5 126,289.5 50.2 817,233.3 3,158,141.0
Qtr ii 21,372.6 12,396.7 75,401.3 345,956.7 73,313.7 58,735.9 31,171.0 115,145.2 45.3
1,025,966.3 3,336,835.8
Qtr.iii 20,122.8 13,430.7 47,380.7 237,491.1 63,423.7 41,358.0 33,118.7 148,080.8 120.8
1,377,141.2 3,266,192.0
Qtr iV 21,398.0 10,065.9 36,166.4 324,197.6 54,744.8 43,797.5 20,780.7 250,676.6 48.2
1,408,727.6 3,715,243.1
2018/19 Qtr i 53,653.0 11,856.3 45,176.2 353,764.6 58,848.9 34,748.9 36,731.8 155,568.5 70.8 861,236.9 3,140,016.4

First Quarter 2018/19112
National Bank of Ethiopia Quarterly Bulletinta
ble
29:
Num
ber a
nd in
vest
men
t Cap
ital
of D
omet
ic a
nd f
orei
gn p
roje
cts
app
rove
d by
Sec
tor
(cap
ital i
n m
illio
ns o
f Birr
)
Sour
ce: E
thio
pia
Inve
stm
ent A
genc
y. *
Proj
ects
with
Initi
al In
vest
men
t Cap
ital b
elow
Birr
250
,000
are
not
incl
uded
.
Sect
or/S
ub-s
ecto
r
2009
(201
6/17
)20
10(2
017/
18)
2011
(201
8/19
)
Qii
Qiii
QiV
Qi
Qii
Qiii
QiV
Qi
No
of
proj
ects
inve
stm
ent
Capi
tal
No
of
proj
ects
inve
stm
ent
Capi
tal
No
of
proj
ects
inve
stm
ent
Capi
tal
No
of
proj
ects
inve
stm
ent
Capi
tal
No
of
proj
ects
inve
stm
ent
Capi
tal
No
of
proj
ects
inve
stm
ent
Capi
tal
No
of
proj
ects
inve
stm
ent
Capi
tal
No
of
proj
ects
inve
stm
ent
Capi
tal
Man
ufac
turin
g47
550.
317
177.
3461
4618
247.
0795
4525
361.
421
261.
721
529
01.3
278
6036
.541
963
232
34
35.7
Agric
ultu
re, h
untin
g an
d fo
rest
ry2
10.5
25.
434
34.3
12.
09
105.
37
190.
9976
66 8
58
.2
Real
est
ate,
rent
ing
and
busi
ness
act
iviti
es11
46.2
3353
5.25
48
29.6
245
1755
.224
117.
122
928
73.7
208
4069
.373
636
169
10
76.8
Hot
els
and
rest
aura
nts
219
.8
2
21
.1
Educ
atio
n
4
6.12
1112
21.
82
16.0
350
3
13.1
Hea
lth a
nd s
ocia
l wor
k1
0.3
140
.04
11.2
224
.38
200.
9 3
22
.3
Cons
truc
tion
6034
7.6
4412
6.30
6234
2781
.248
553
171.
847
196.
497
443.
914
320
76.3
0438
2 1
22
1243
.6
Who
lesa
le, r
etai
l tra
de a
nd re
pair
serv
ice
12.
0
1
69
1076
.8
Tran
spor
t, st
orag
e an
d co
mm
unic
atio
n
1
4.4
12.
0
3
10
.9
Min
ing
and
Qua
rryi
ng
4
9.59
836
22
140
.02
19.2
421
.765
55 1
3
Elec
tric
ity, g
as, s
team
and
wat
er s
uppl
y
1
100
Cons
truc
tion
mac
hine
ry le
asin
g
Fish
ing
Oth
er c
omm
unity
, soc
ial
and
pers
onal
ser
vice
act
iviti
es3
8.1
11.
0
45
244.
8113
72 1
2
Oth
ers
Gra
nd To
tal
124
962.
9749
009
105.
086
4.5
39
4.29
2545
9766
8.5
103
612.
555
76,
386.
469
712
990.
6945
754
458
86.8
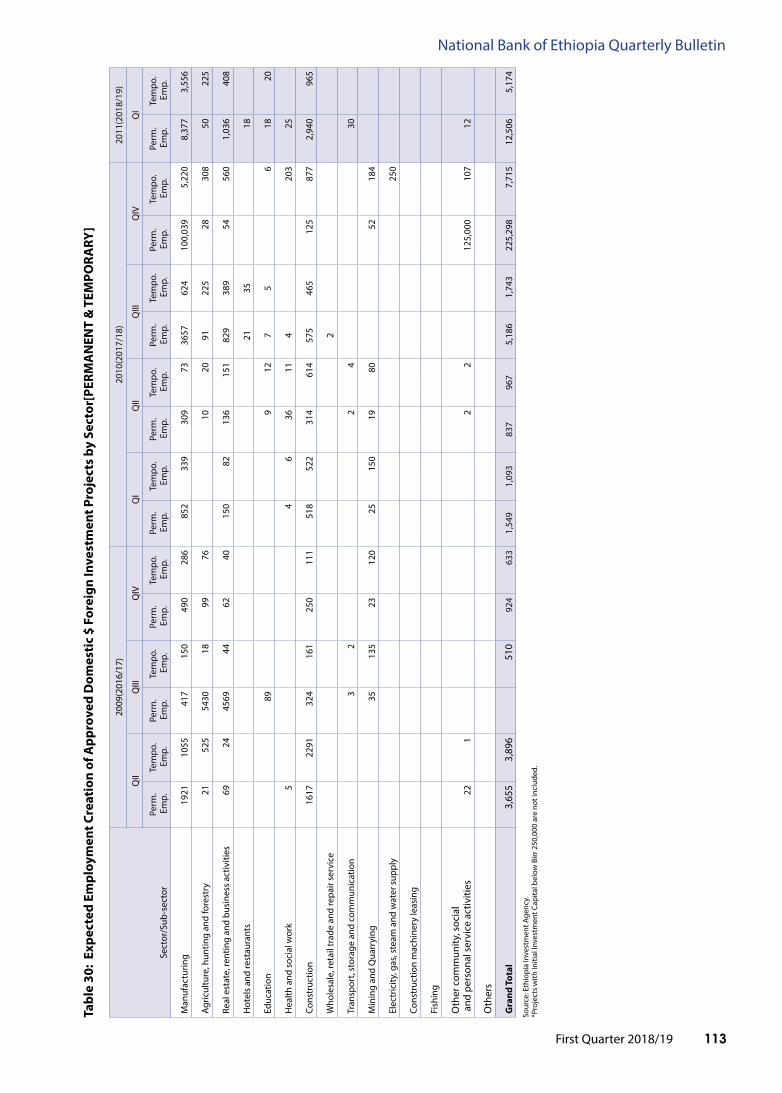
First Quarter 2018/19 113
National Bank of Ethiopia Quarterly Bulletin
tabl
e 30
: Ex
pect
ed E
mpl
oym
ent C
reat
ion
of a
ppro
ved
Dom
esti
c $
fore
ign
inve
stm
ent p
roje
cts
by S
ecto
r[pE
RMa
NEN
t &
tEM
poRa
RY]
Sour
ce: E
thio
pia
Inve
stm
ent A
genc
y.*P
roje
cts
with
Initi
al In
vest
men
t Cap
ital b
elow
Birr
250
,000
are
not
incl
uded
.
Sect
or/S
ub-s
ecto
r
2009
(201
6/17
)20
10(2
017/
18)
2011
(201
8/19
)
QII
QIII
QIV
QI
QII
QIII
QIV
QI
Perm
. E
mp.
Tem
po.
Em
p.Pe
rm.
Em
p.Te
mpo
. E
mp.
Perm
. E
mp.
Tem
po.
Em
p.Pe
rm.
Em
p.Te
mpo
. E
mp.
Perm
. E
mp.
Tem
po.
Em
p.Pe
rm.
Em
p.Te
mpo
. E
mp.
Perm
. E
mp.
Tem
po.
Em
p.Pe
rm.
Em
p.Te
mpo
. E
mp.
Man
ufac
turin
g19
2110
5541
715
049
028
685
233
930
973
3657
624
100
,039
5
,220
8
,377
3
,556
Agric
ultu
re, h
untin
g an
d fo
rest
ry21
525
5430
1899
76
10
2091
225
28
308
5
0 2
25
Real
est
ate,
rent
ing
and
busi
ness
act
iviti
es69
2445
6944
6240
150
8213
615
182
938
9 5
4 5
60
1,0
36
408
Hot
els
and
rest
aura
nts
2135
18
Educ
atio
n
89
9
127
5
6
18
20
Hea
lth a
nd s
ocia
l wor
k5
4
636
114
203
2
5
Cons
truc
tion
1617
2291
324
161
250
111
518
522
314
614
575
465
125
8
77
2,9
40
965
Who
lesa
le, r
etai
l tra
de a
nd re
pair
serv
ice
2
Tran
spor
t, st
orag
e an
d co
mm
unic
atio
n
3
2
2
4
3
0
Min
ing
and
Qua
rryi
ng
35
135
2312
025
150
1980
52
184
Elec
tric
ity, g
as, s
team
and
wat
er s
uppl
y
250
Cons
truc
tion
mac
hine
ry le
asin
g
Fish
ing
Oth
er c
omm
unity
, soc
ial
and
per
sona
l ser
vice
act
iviti
es22
1
2
2
1
25,0
00
107
1
2
Oth
ers
Gra
nd t
otal
3,65
53,
896
51
092
463
31,
549
1,09
383
796
7 5
,186
1
,743
2
25,2
98
7,7
15
12,
506
5,1
74
First Quarter 2018/19114
National Bank of Ethiopia Quarterly Bulletin
39

39

National Bank of Ethiopia
Quarterly Bulletin First Quarter 2018/19
Fiscal Year Series
Volume 35 No. 1
Addis Ababa2019
National Bank of Ethiopia Q
uarterly Bulletin Volume 35, N
o. 1