multilevel analysis of inpatient experience - picker · multilevel analysis of inpatient data march...
TRANSCRIPT

Multilevel analysis of inpatient data March 2011 v2.0 SS/CG 15-03-2011
Multilevel analysis of inpatient experience Steve Sizmur, Picker Institute Europe, March 2011
Background The United Kingdom National Health Service evaluates the quality of service under three main dimensions: safety, effectiveness and patient experience. The Care Quality Commission is the independent regulator of health and social care in England and, as part of its quality brief, oversees each year a survey of acute inpatient experience for all National Health Service hospital trusts in England. This survey programme was established by the UK Department of Health and has been running since 2002. It is coordinated for the Care Quality Commission by Picker Institute Europe. Full details of the survey programme are published on the NHS Surveys website (http://www.nhssurveys.org/).
The 2010 Inpatients Survey was a postal self-completion survey, sent to a sequential sample of 850 patients from each trust who were discharged within a specified period in the Summer of 2010. The initial questionnaire mailing was followed up by two postal reminders. The survey itself contained a range of questions covering varied aspects of the patient’s experience of hospital care. These questions focused primarily on what happened during the patient’s stay in hospital, but also included questions that ask for opinions about the quality of provision and an overall rating of satisfaction with the care received. The questionnaire items were designed to give the type of information needed for quality improvement, based on principles first established by the Picker Institute in the USA (Cleary, 1999).
Variations in patient experience Various studies have found that the reported experience of patients differs according to patient characteristics. The Department of Health published findings that showed differential reports of patient experience by ethnic group (DH, 2009). Compared to the White majority, Black and minority ethnic groups tended to give less positive ratings of their care, although the pattern varied between different aspects of experience. Generally, patients from Asian and Chinese ethnic groups tended to be more negative and Black patients’ reports were more mixed.
Other reports have found differences in experience with age, gender, education level, health status, type of trust, emergency admission and deprivation (CHI, 2004, Healthcare Commission, 2006). Moreover, this kind of variation is not unique to the United Kingdom (Young et al, 2000; Bleich et al, 2007). Age, in particular, has been linked to differing expectations and therefore differential satisfaction with care (Bleich et al, op cit).
Geographical variation Ipsos-Mori (2008) reported that overall satisfaction ratings in the 2006 Inpatient Survey were distinctly lower for patients in London, based solely on data aggregated at trust level. The Healthcare Commission (2008) referred to a range of geographical variation, including north-south differences and evidence for more

Multilevel analysis of inpatient data March 2011 v2.0 SS/CG 15-03-2011
positive experience in the North East of England (also evident in the Ipsos-MORI report). That geographical differences in survey results exist is not in doubt. However, the causes of these differences are not well understood. Amongst potential explanations are:
• Actual differences in patient experience;
• Different response rates to surveys in particular areas;
• Ethnic fractionalisation;
• Concentrations of social deprivation;
• Different expectations on the part of patients;
• Staffing issues;
• Transient populations (although it is not necessarily clear that this would impact on experience as an inpatient);
• Differences in primary care, leading to differential admission to hospital.
Further evidence that can help elucidate the potential reasons for variation is therefore needed.
Multilevel analysis Analyses of variations in patient experience have, to date, used traditional multivariate analysis techniques such as multiple regression. When such approaches are used with data that are hierarchically ‘nested’ (patients nested within hospitals, for example), difficulties can arise. Firstly, the data are clustered: patients from one trust are likely to share characteristics apart from where they were hospitalised that might impact on their reported experience. Secondly, conventional regression models do not correctly model the effect of variables that are measured at higher levels in the hierarchy (such as trust-level factors) which can typically lead to over-estimation of those effects (Snijders & Bosker, 1999). Conversely, models that use aggregated data (such as trust-level experience scores as in the Ipsos-MORI, 2008, report) do not correctly represent individual data and therefore run the risk of ‘ecological fallacy’ – attributing the results for a group to individuals within it.
Multilevel regression models allow variation to be modelled correctly in hierarchically-structured data and provide a solution to the difficulties of cross-level inference (Goldstein 1999; Snijders & Bosker, 1999). Initially applied mainly in the field of educational data, a number of early examples of multilevel analysis reversed initial findings from single-level analyses based on the same data (eg Aitkin & Longford, 1986). Subsequently, multilevel models have been applied in a wide range of social science and other research settings; anywhere, in fact, where there is clear clustering of data, such as is the case with patients within hospitals within regions. It was therefore of interest to see how the findings from previous research on variations in patient experience would hold up when multi-level analysis was applied.
Objectives • To examine the association with differential patient survey responses of
individual and trust level variables;
Multilevel analysis of inpatient data March 2011 v2.0 SS/CG 15-03-2011
• To identify any regional level differences in reported patient experience.
Data The data set for the analysis was the entire national data set for the Inpatients Survey 2010, administered by Picker Institute Europe on behalf of the Care Quality Commission. The questionnaire was sent out to 850 patients per trust, resulting in between 246 and 577 complete questionnaires returned for each trust. The mean trust response rate was 50 per cent.
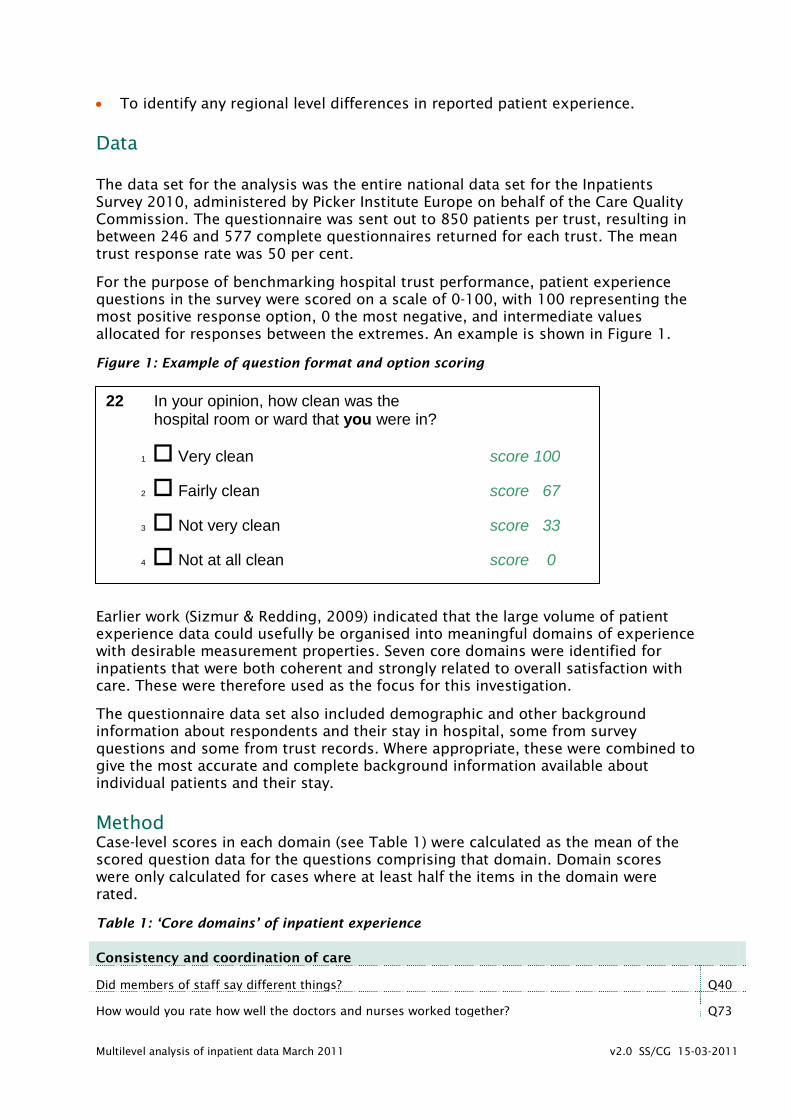
For the purpose of benchmarking hospital trust performance, patient experience questions in the survey were scored on a scale of 0-100, with 100 representing the most positive response option, 0 the most negative, and intermediate values allocated for responses between the extremes. An example is shown in Figure 1.
Figure 1: Example of question format and option scoring
Earlier work (Sizmur & Redding, 2009) indicated that the large volume of patient experience data could usefully be organised into meaningful domains of experience with desirable measurement properties. Seven core domains were identified for inpatients that were both coherent and strongly related to overall satisfaction with care. These were therefore used as the focus for this investigation.
The questionnaire data set also included demographic and other background information about respondents and their stay in hospital, some from survey questions and some from trust records. Where appropriate, these were combined to give the most accurate and complete background information available about individual patients and their stay.
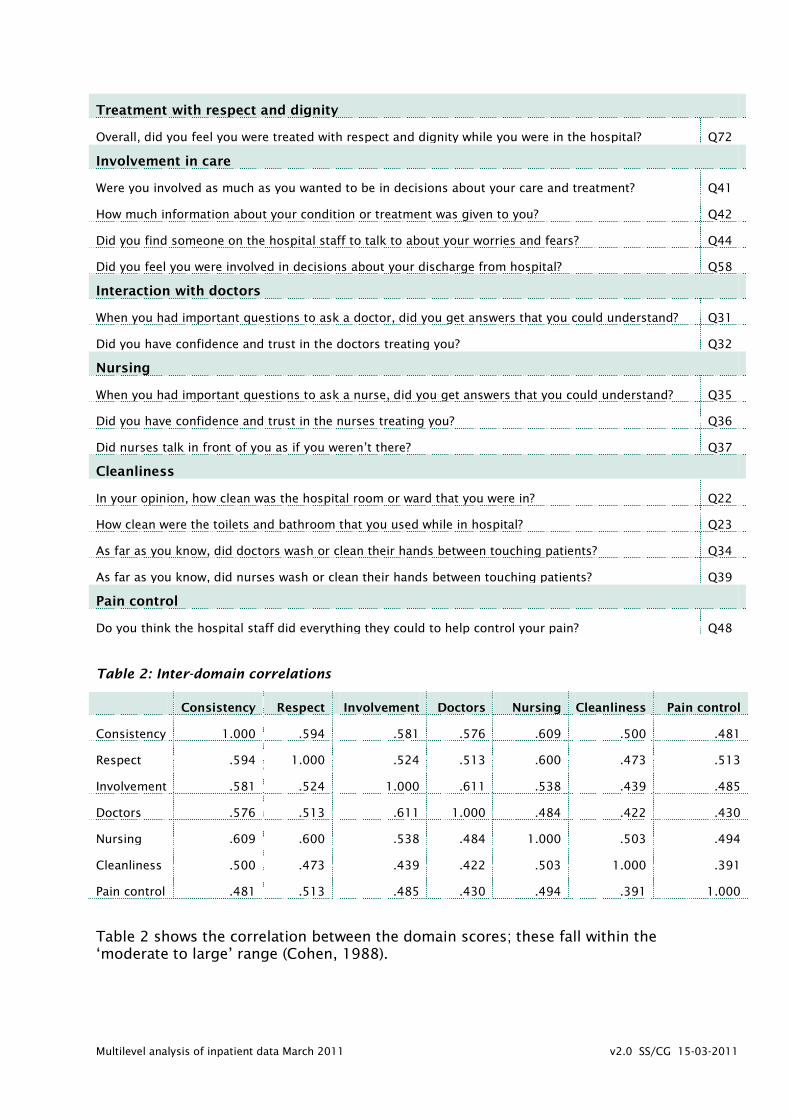
Method Case-level scores in each domain (see Table 1) were calculated as the mean of the scored question data for the questions comprising that domain. Domain scores were only calculated for cases where at least half the items in the domain were rated.
Table 1: ‘Core domains’ of inpatient experience
Consistency and coordination of care
Did members of staff say different things? Q40
How would you rate how well the doctors and nurses worked together? Q73
22 In your opinion, how clean was the hospital room or ward that you were in?
1 Very clean score 100
2 Fairly clean score 67
3 Not very clean score 33
4 Not at all clean score 0
Multilevel analysis of inpatient data March 2011 v2.0 SS/CG 15-03-2011
Treatment with respect and dignity
Overall, did you feel you were treated with respect and dignity while you were in the hospital? Q72
Involvement in care
Were you involved as much as you wanted to be in decisions about your care and treatment? Q41
How much information about your condition or treatment was given to you? Q42
Did you find someone on the hospital staff to talk to about your worries and fears? Q44
Did you feel you were involved in decisions about your discharge from hospital? Q58
Interaction with doctors
When you had important questions to ask a doctor, did you get answers that you could understand? Q31
Did you have confidence and trust in the doctors treating you? Q32
Nursing
When you had important questions to ask a nurse, did you get answers that you could understand? Q35
Did you have confidence and trust in the nurses treating you? Q36
Did nurses talk in front of you as if you weren’t there? Q37
Cleanliness
In your opinion, how clean was the hospital room or ward that you were in? Q22
How clean were the toilets and bathroom that you used while in hospital? Q23
As far as you know, did doctors wash or clean their hands between touching patients? Q34
As far as you know, did nurses wash or clean their hands between touching patients? Q39
Pain control
Do you think the hospital staff did everything they could to help control your pain? Q48
Table 2: Inter-domain correlations
Consistency Respect Involvement Doctors Nursing Cleanliness Pain control
Consistency 1.000 .594 .581 .576 .609 .500 .481
Respect .594 1.000 .524 .513 .600 .473 .513
Involvement .581 .524 1.000 .611 .538 .439 .485
Doctors .576 .513 .611 1.000 .484 .422 .430
Nursing .609 .600 .538 .484 1.000 .503 .494
Cleanliness .500 .473 .439 .422 .503 1.000 .391
Pain control .481 .513 .485 .430 .494 .391 1.000
Table 2 shows the correlation between the domain scores; these fall within the ‘moderate to large’ range (Cohen, 1988).
Multilevel analysis of inpatient data March 2011 v2.0 SS/CG 15-03-2011
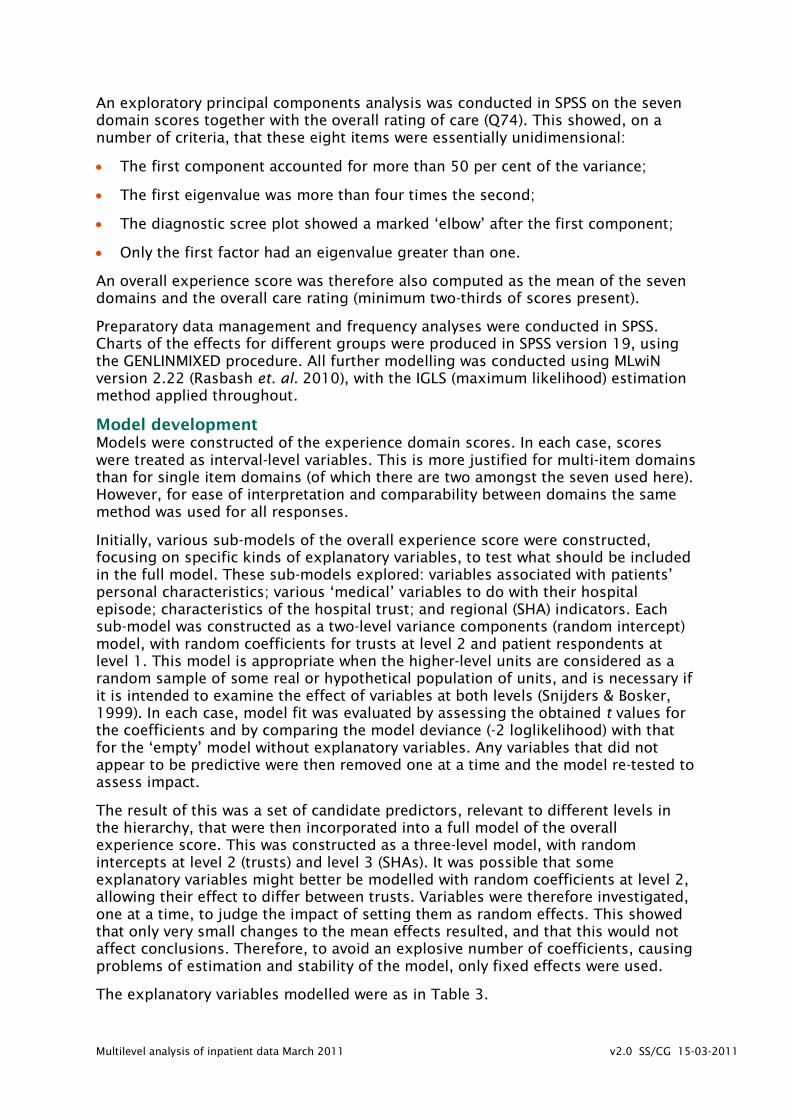
An exploratory principal components analysis was conducted in SPSS on the seven domain scores together with the overall rating of care (Q74). This showed, on a number of criteria, that these eight items were essentially unidimensional:
• The first component accounted for more than 50 per cent of the variance;
• The first eigenvalue was more than four times the second;
• The diagnostic scree plot showed a marked ‘elbow’ after the first component;
• Only the first factor had an eigenvalue greater than one.
An overall experience score was therefore also computed as the mean of the seven domains and the overall care rating (minimum two-thirds of scores present).
Preparatory data management and frequency analyses were conducted in SPSS. Charts of the effects for different groups were produced in SPSS version 19, using the GENLINMIXED procedure. All further modelling was conducted using MLwiN version 2.22 (Rasbash et. al. 2010), with the IGLS (maximum likelihood) estimation method applied throughout.
Model development Models were constructed of the experience domain scores. In each case, scores were treated as interval-level variables. This is more justified for multi-item domains than for single item domains (of which there are two amongst the seven used here). However, for ease of interpretation and comparability between domains the same method was used for all responses.
Initially, various sub-models of the overall experience score were constructed, focusing on specific kinds of explanatory variables, to test what should be included in the full model. These sub-models explored: variables associated with patients’ personal characteristics; various ‘medical’ variables to do with their hospital episode; characteristics of the hospital trust; and regional (SHA) indicators. Each sub-model was constructed as a two-level variance components (random intercept) model, with random coefficients for trusts at level 2 and patient respondents at level 1. This model is appropriate when the higher-level units are considered as a random sample of some real or hypothetical population of units, and is necessary if it is intended to examine the effect of variables at both levels (Snijders & Bosker, 1999). In each case, model fit was evaluated by assessing the obtained t values for the coefficients and by comparing the model deviance (-2 loglikelihood) with that for the ‘empty’ model without explanatory variables. Any variables that did not appear to be predictive were then removed one at a time and the model re-tested to assess impact.
The result of this was a set of candidate predictors, relevant to different levels in the hierarchy, that were then incorporated into a full model of the overall experience score. This was constructed as a three-level model, with random intercepts at level 2 (trusts) and level 3 (SHAs). It was possible that some explanatory variables might better be modelled with random coefficients at level 2, allowing their effect to differ between trusts. Variables were therefore investigated, one at a time, to judge the impact of setting them as random effects. This showed that only very small changes to the mean effects resulted, and that this would not affect conclusions. Therefore, to avoid an explosive number of coefficients, causing problems of estimation and stability of the model, only fixed effects were used.
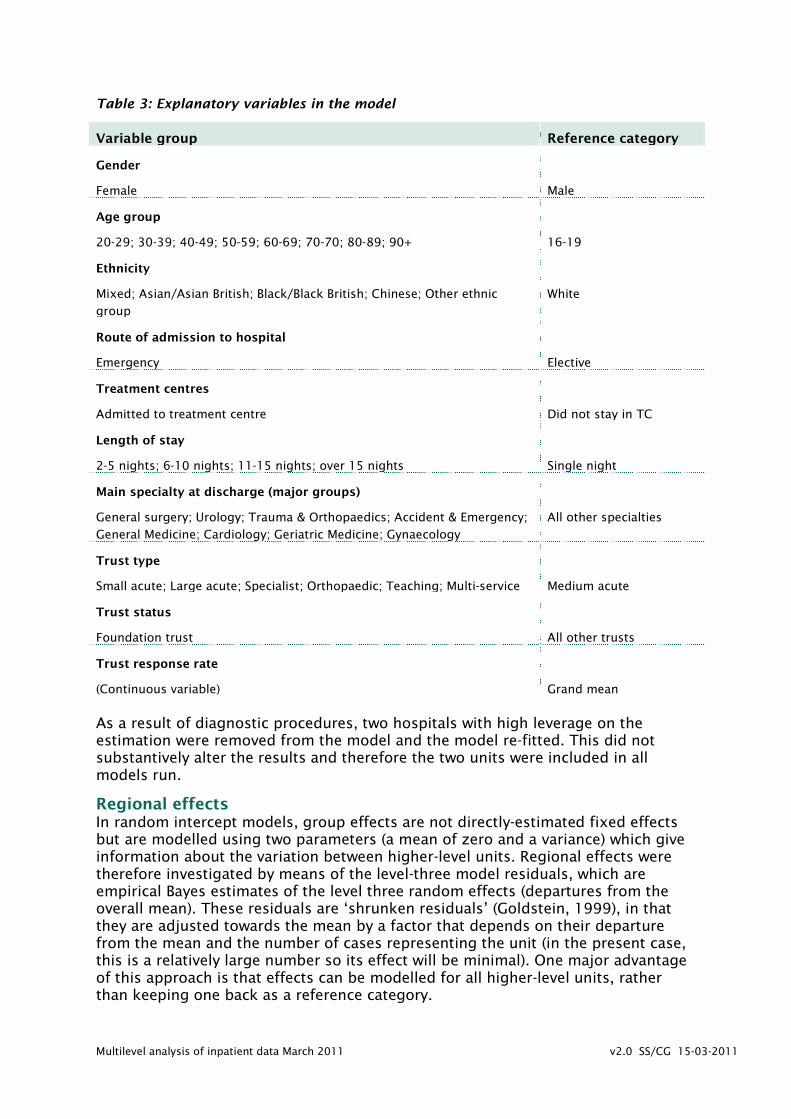
The explanatory variables modelled were as in Table 3.
Multilevel analysis of inpatient data March 2011 v2.0 SS/CG 15-03-2011
Table 3: Explanatory variables in the model
Variable group Reference category
Gender
Female
Male
Age group
20-29; 30-39; 40-49; 50-59; 60-69; 70-70; 80-89; 90+
16-19
Ethnicity
Mixed; Asian/Asian British; Black/Black British; Chinese; Other ethnic
group
White
Route of admission to hospital
Emergency
Elective
Treatment centres
Admitted to treatment centre
Did not stay in TC
Length of stay
2-5 nights; 6-10 nights; 11-15 nights; over 15 nights
Single night
Main specialty at discharge (major groups)
General surgery; Urology; Trauma & Orthopaedics; Accident & Emergency;
General Medicine; Cardiology; Geriatric Medicine; Gynaecology
All other specialties
Trust type
Small acute; Large acute; Specialist; Orthopaedic; Teaching; Multi-service
Medium acute
Trust status
Foundation trust
All other trusts
Trust response rate
(Continuous variable)
Grand mean
As a result of diagnostic procedures, two hospitals with high leverage on the estimation were removed from the model and the model re-fitted. This did not substantively alter the results and therefore the two units were included in all models run.
Regional effects In random intercept models, group effects are not directly-estimated fixed effects but are modelled using two parameters (a mean of zero and a variance) which give information about the variation between higher-level units. Regional effects were therefore investigated by means of the level-three model residuals, which are empirical Bayes estimates of the level three random effects (departures from the overall mean). These residuals are ‘shrunken residuals’ (Goldstein, 1999), in that they are adjusted towards the mean by a factor that depends on their departure from the mean and the number of cases representing the unit (in the present case, this is a relatively large number so its effect will be minimal). One major advantage of this approach is that effects can be modelled for all higher-level units, rather than keeping one back as a reference category.
Multilevel analysis of inpatient data March 2011 v2.0 SS/CG 15-03-2011
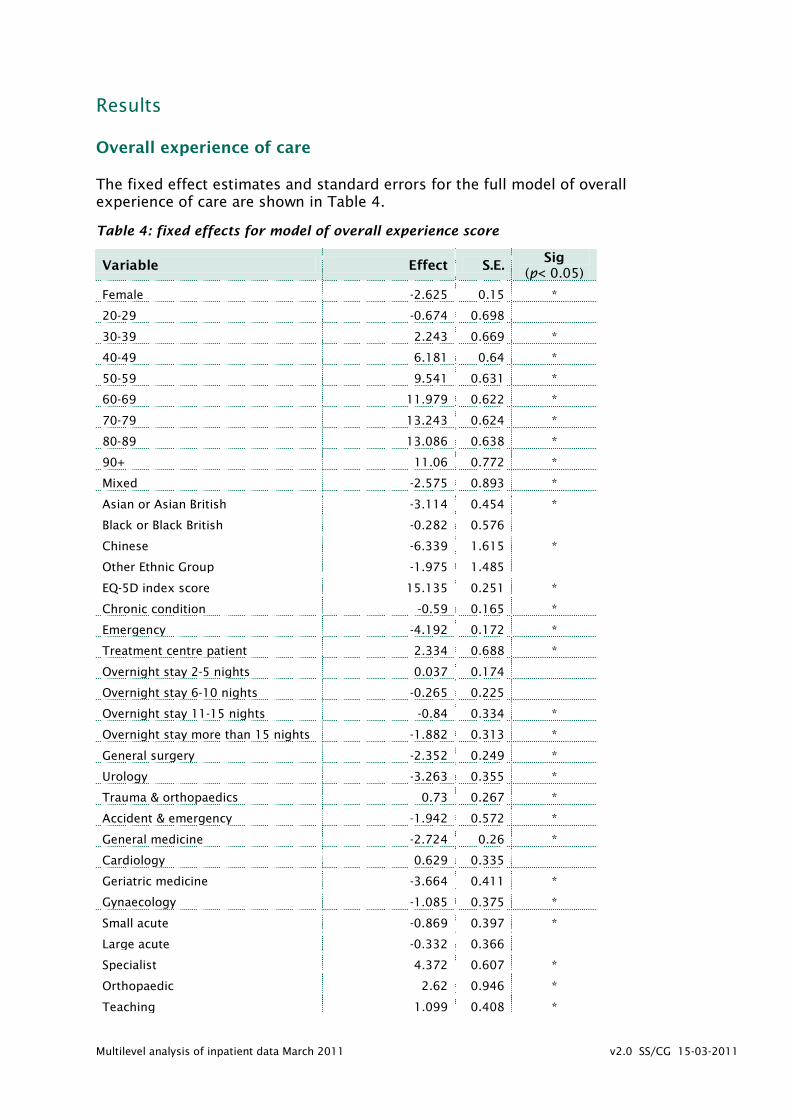
Results Overall experience of care The fixed effect estimates and standard errors for the full model of overall experience of care are shown in Table 4.
Table 4: fixed effects for model of overall experience score
Variable Effect S.E. Sig
(p< 0.05)
Female -2.625 0.15 *
20-29 -0.674 0.698
30-39 2.243 0.669 *
40-49 6.181 0.64 *
50-59 9.541 0.631 *
60-69 11.979 0.622 *
70-79 13.243 0.624 *
80-89 13.086 0.638 *
90+ 11.06 0.772 *
Mixed -2.575 0.893 *
Asian or Asian British -3.114 0.454 *
Black or Black British -0.282 0.576
Chinese -6.339 1.615 *
Other Ethnic Group -1.975 1.485
EQ-5D index score 15.135 0.251 *
Chronic condition -0.59 0.165 *
Emergency -4.192 0.172 *
Treatment centre patient 2.334 0.688 *
Overnight stay 2-5 nights 0.037 0.174
Overnight stay 6-10 nights -0.265 0.225
Overnight stay 11-15 nights -0.84 0.334 *
Overnight stay more than 15 nights -1.882 0.313 *
General surgery -2.352 0.249 *
Urology -3.263 0.355 *
Trauma & orthopaedics 0.73 0.267 *
Accident & emergency -1.942 0.572 *
General medicine -2.724 0.26 *
Cardiology 0.629 0.335
Geriatric medicine -3.664 0.411 *
Gynaecology -1.085 0.375 *
Small acute -0.869 0.397 *
Large acute -0.332 0.366
Specialist 4.372 0.607 *
Orthopaedic 2.62 0.946 *
Teaching 1.099 0.408 *

Multilevel analysis of inpatient data March 2011 v2.0 SS/CG 15-03-2011
Multi-service -0.001 0.674
Foundation Trust 0.929 0.278 *
Trust response rate 0.115 0.024 *
For all categorical variables, these effects can be interpreted as the average difference in score points (out of 100) between two groups, one with the characteristic and one without, but equal in other respects. Thus, in Table 4, female patients, on average, gave scores just under three points lower than the reference group of men (all else being equal). This difference is significant at the 95% level.
This set of results shows a pattern that is, by and large, repeated for the separate experience domains:
• Gender: women gave more negative reports of experience compared to men.
• Age: compared to the youngest age group, those aged 20-29 gave more negative ratings, the 30-39 group did not differ significantly, and older groups were increasingly more positive except for a downturn amongst the most elderly patient group (Figure 2).
Figure 2: Overall experience score by age group with 95% confidence intervals
• Ethnicity: compared to the majority White group, other ethnic groups reported more negative experience (although here the difference is not significant for Black patients) (Figure 3).

Multilevel analysis of inpatient data March 2011 v2.0 SS/CG 15-03-2011
Figure 3: Overall experience score by ethnic group with 95% confidence intervals
• Admission route: those admitted in an emergency were more negative than elective admissions.
• Treatment centres: those admitted to a treatment centre were more positive.
• Length of stay: experience was increasingly negative with length of stay (Figure 4).
Figure 4: Overall experience score by length of stay with 95% confidence intervals
• Main specialty on discharge: there were score differences associated with specific speciality groups (Figure 5).

Multilevel analysis of inpatient data March 2011 v2.0 SS/CG 15-03-2011
Figure 5: Overall experience by specialty on discharge with 95% confidence intervals
• Type of trust: those who were discharged from certain types of hospital trust (here, specialist and teaching trusts) were more positive (Figure 6). Also, those whose experience was in a Foundation trust were more positive.
Figure 6: Overall experience score by trust type with 95% confidence intervals
• Response rate: increased response was associated with higher scores.
Multilevel analysis of inpatient data March 2011 v2.0 SS/CG 15-03-2011
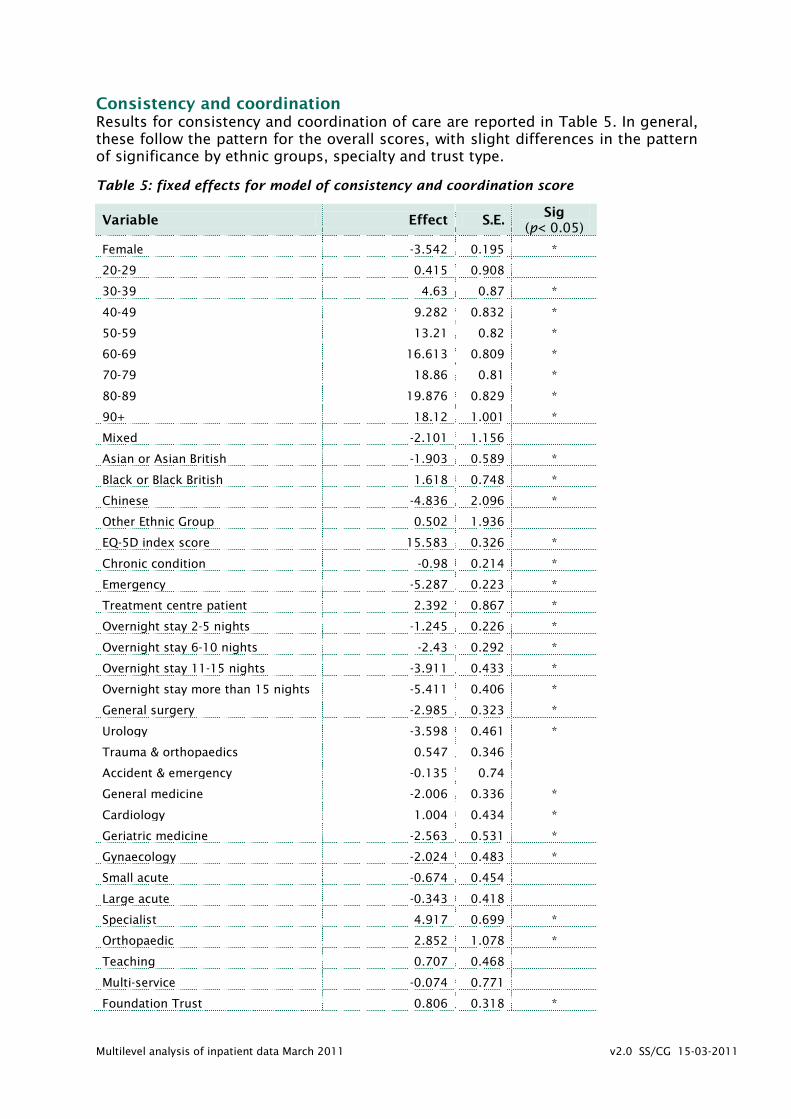
Consistency and coordination Results for consistency and coordination of care are reported in Table 5. In general, these follow the pattern for the overall scores, with slight differences in the pattern of significance by ethnic groups, specialty and trust type.
Table 5: fixed effects for model of consistency and coordination score
Variable Effect S.E. Sig
(p< 0.05)
Female -3.542 0.195 *
20-29 0.415 0.908
30-39 4.63 0.87 *
40-49 9.282 0.832 *
50-59 13.21 0.82 *
60-69 16.613 0.809 *
70-79 18.86 0.81 *
80-89 19.876 0.829 *
90+ 18.12 1.001 *
Mixed -2.101 1.156
Asian or Asian British -1.903 0.589 *
Black or Black British 1.618 0.748 *
Chinese -4.836 2.096 *
Other Ethnic Group 0.502 1.936
EQ-5D index score 15.583 0.326 *
Chronic condition -0.98 0.214 *
Emergency -5.287 0.223 *
Treatment centre patient 2.392 0.867 *
Overnight stay 2-5 nights -1.245 0.226 *
Overnight stay 6-10 nights -2.43 0.292 *
Overnight stay 11-15 nights -3.911 0.433 *
Overnight stay more than 15 nights -5.411 0.406 *
General surgery -2.985 0.323 *
Urology -3.598 0.461 *
Trauma & orthopaedics 0.547 0.346
Accident & emergency -0.135 0.74
General medicine -2.006 0.336 *
Cardiology 1.004 0.434 *
Geriatric medicine -2.563 0.531 *
Gynaecology -2.024 0.483 *
Small acute -0.674 0.454
Large acute -0.343 0.418
Specialist 4.917 0.699 *
Orthopaedic 2.852 1.078 *
Teaching 0.707 0.468
Multi-service -0.074 0.771
Foundation Trust 0.806 0.318 *

Multilevel analysis of inpatient data March 2011 v2.0 SS/CG 15-03-2011
Trust response rate 0.119 0.028 *
Treatment with respect and dignity Results for treatment with respect and dignity are reported in Table 6. These largely follow the established pattern for the overall scores, with slight differences in the pattern of significance by ethnic groups and by specialty and trust type.
Table 6: fixed effects for model of treatment with respect and dignity score
Variable Effect S.E. Sig
(p< 0.05)
Female -3.135 0.202 *
20-29 0.09 0.94
30-39 2.128 0.901 *
40-49 6.774 0.862 *
50-59 10.54 0.849 *
60-69 13.05 0.837 *
70-79 15.259 0.839 *
80-89 15.765 0.858 *
90+ 12.733 1.038 *
Mixed -0.744 1.194
Asian or Asian British -1.674 0.608 *
Black or Black British 1.528 0.774 *
Chinese -6.718 2.172 *
Other Ethnic Group -0.364 2.012
EQ-5D index score 14.78 0.338 *
Chronic condition -0.601 0.221 *
Emergency -3.551 0.23 *
Treatment centre patient 2.092 0.878 *
Overnight stay 2-5 nights 0.048 0.234
Overnight stay 6-10 nights -0.249 0.303
Overnight stay 11-15 nights -1.22 0.449 *
Overnight stay more than 15 nights -2.864 0.421 *
General surgery -2.485 0.334 *
Urology -3.397 0.477 *
Trauma & orthopaedics 0.039 0.357
Accident & emergency -1.904 0.768 *
General medicine -2.196 0.347 *
Cardiology 0.408 0.449
Geriatric medicine -2.781 0.55 *
Gynaecology -1.219 0.497 *
Small acute -1.044 0.437 *
Large acute -0.446 0.4
Specialist 3.599 0.667 *
Orthopaedic 2.391 1.015 *
Teaching 1.001 0.452 *
Multilevel analysis of inpatient data March 2011 v2.0 SS/CG 15-03-2011
Multi-service -0.001 0.739
Foundation Trust 0.789 0.302 *
Trust response rate 0.129 0.026 *
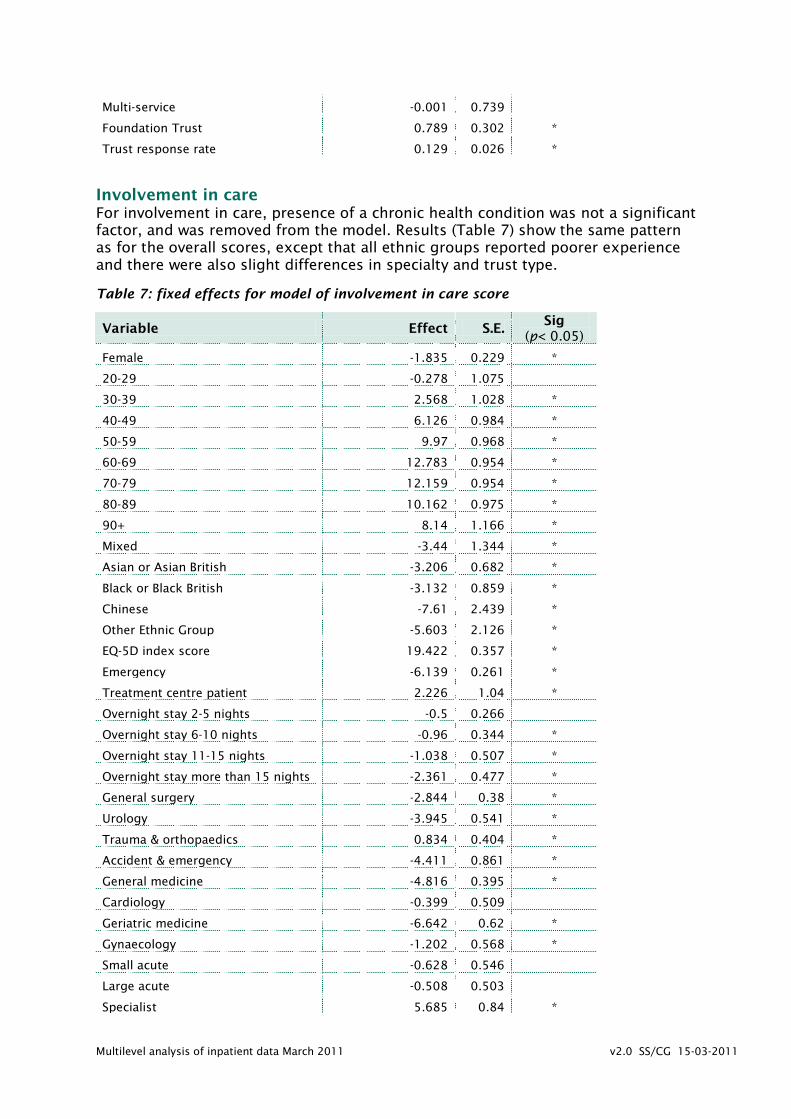
Involvement in care For involvement in care, presence of a chronic health condition was not a significant factor, and was removed from the model. Results (Table 7) show the same pattern as for the overall scores, except that all ethnic groups reported poorer experience and there were also slight differences in specialty and trust type.
Table 7: fixed effects for model of involvement in care score
Variable Effect S.E. Sig
(p< 0.05)
Female -1.835 0.229 *
20-29 -0.278 1.075
30-39 2.568 1.028 *
40-49 6.126 0.984 *
50-59 9.97 0.968 *
60-69 12.783 0.954 *
70-79 12.159 0.954 *
80-89 10.162 0.975 *
90+ 8.14 1.166 *
Mixed -3.44 1.344 *
Asian or Asian British -3.206 0.682 *
Black or Black British -3.132 0.859 *
Chinese -7.61 2.439 *
Other Ethnic Group -5.603 2.126 *
EQ-5D index score 19.422 0.357 *
Emergency -6.139 0.261 *
Treatment centre patient 2.226 1.04 *
Overnight stay 2-5 nights -0.5 0.266
Overnight stay 6-10 nights -0.96 0.344 *
Overnight stay 11-15 nights -1.038 0.507 *
Overnight stay more than 15 nights -2.361 0.477 *
General surgery -2.844 0.38 *
Urology -3.945 0.541 *
Trauma & orthopaedics 0.834 0.404 *
Accident & emergency -4.411 0.861 *
General medicine -4.816 0.395 *
Cardiology -0.399 0.509
Geriatric medicine -6.642 0.62 *
Gynaecology -1.202 0.568 *
Small acute -0.628 0.546
Large acute -0.508 0.503
Specialist 5.685 0.84 *

Multilevel analysis of inpatient data March 2011 v2.0 SS/CG 15-03-2011
Orthopaedic 3.44 1.297 *
Teaching 1.126 0.564 *
Multi-service -0.288 0.929
Foundation Trust 1.383 0.382 *
Trust response rate 0.111 0.034 *
Interaction with doctors For interaction with doctors (Table 8), presence of a chronic health condition and the treatment centre indicator were not significant predictors and were removed from the model. Apart from this, the pattern of results was similar to other domains, with differences in the ethnic groups, specialties and trust types associated with significant effects.
Table 8: fixed effects for model of interaction with doctors score
Variable Effect S.E. Sig
(p< 0.05)
Female -1.512 0.189 *
20-29 -2.109 0.888 *
30-39 1.697 0.848 *
40-49 6.251 0.812 *
50-59 10.003 0.799 *
60-69 12.677 0.787 *
70-79 13.325 0.787 *
80-89 13.138 0.804 *
90+ 12.245 0.962 *
Mixed -2.718 1.107 *
Asian or Asian British -0.268 0.561
Black or Black British -0.177 0.707
Chinese -5.671 2.008 *
Other Ethnic Group -1.186 1.762
EQ-5D index score 15.528 0.295 *
Emergency -5.761 0.215 *
Overnight stay 2-5 nights 0.085 0.22
Overnight stay 6-10 nights -0.31 0.283
Overnight stay 11-15 nights -0.772 0.419
Overnight stay more than 15 nights -2.081 0.393 *
General surgery -2.329 0.313 *
Urology -3.191 0.446 *
Trauma & orthopaedics 1.521 0.333 *
Accident & emergency -3.716 0.709 *
General medicine -3.64 0.325 *
Cardiology -0.298 0.419
Geriatric medicine -4.107 0.51 *
Gynaecology -1.916 0.465 *
Small acute -0.782 0.408
Multilevel analysis of inpatient data March 2011 v2.0 SS/CG 15-03-2011
Large acute -0.289 0.377
Specialist 3.616 0.629 *
Orthopaedic 1.606 0.968
Teaching 1.516 0.423 *
Multi-service -0.217 0.694
Foundation Trust 0.87 0.286 *
Trust response rate 0.089 0.025 *
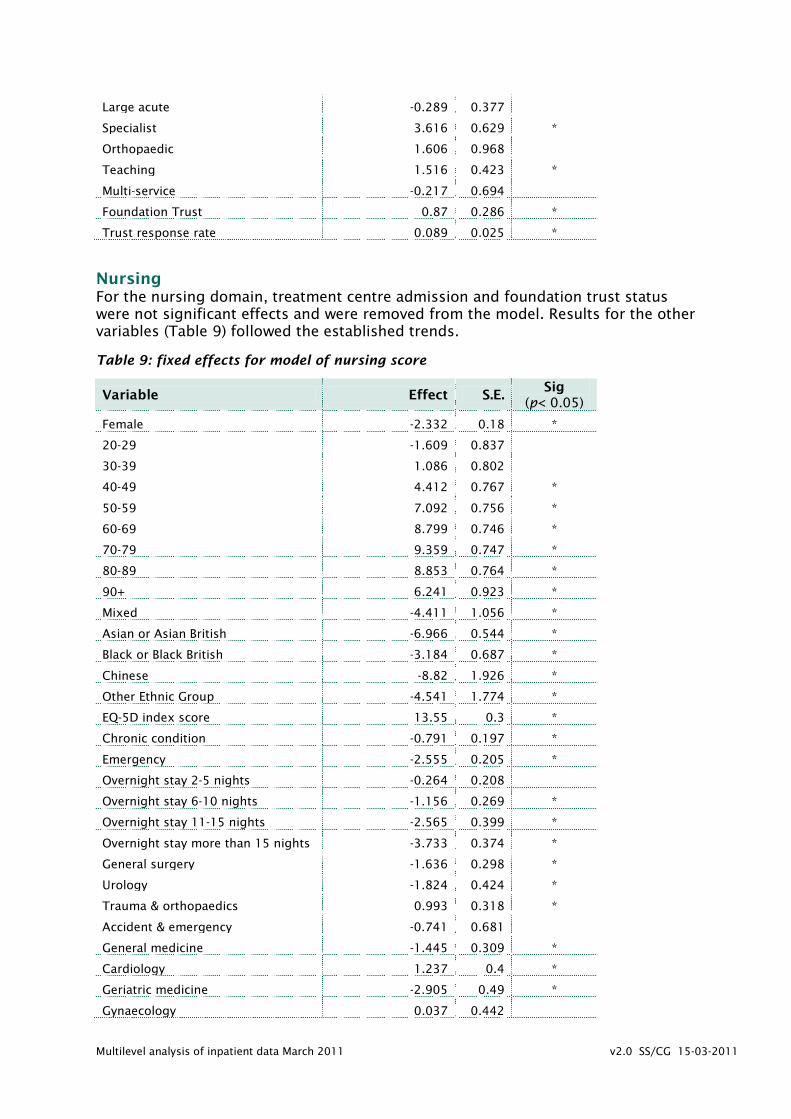
Nursing For the nursing domain, treatment centre admission and foundation trust status were not significant effects and were removed from the model. Results for the other variables (Table 9) followed the established trends.
Table 9: fixed effects for model of nursing score
Variable Effect S.E. Sig
(p< 0.05)
Female -2.332 0.18 *
20-29 -1.609 0.837
30-39 1.086 0.802
40-49 4.412 0.767 *
50-59 7.092 0.756 *
60-69 8.799 0.746 *
70-79 9.359 0.747 *
80-89 8.853 0.764 *
90+ 6.241 0.923 *
Mixed -4.411 1.056 *
Asian or Asian British -6.966 0.544 *
Black or Black British -3.184 0.687 *
Chinese -8.82 1.926 *
Other Ethnic Group -4.541 1.774 *
EQ-5D index score 13.55 0.3 *
Chronic condition -0.791 0.197 *
Emergency -2.555 0.205 *
Overnight stay 2-5 nights -0.264 0.208
Overnight stay 6-10 nights -1.156 0.269 *
Overnight stay 11-15 nights -2.565 0.399 *
Overnight stay more than 15 nights -3.733 0.374 *
General surgery -1.636 0.298 *
Urology -1.824 0.424 *
Trauma & orthopaedics 0.993 0.318 *
Accident & emergency -0.741 0.681
General medicine -1.445 0.309 *
Cardiology 1.237 0.4 *
Geriatric medicine -2.905 0.49 *
Gynaecology 0.037 0.442
Multilevel analysis of inpatient data March 2011 v2.0 SS/CG 15-03-2011
Small acute -0.252 0.406
Large acute -0.161 0.37
Specialist 3.559 0.62 *
Orthopaedic 2.069 0.964 *
Teaching 0.596 0.423
Multi-service -0.073 0.692
Trust response rate 0.122 0.025 *
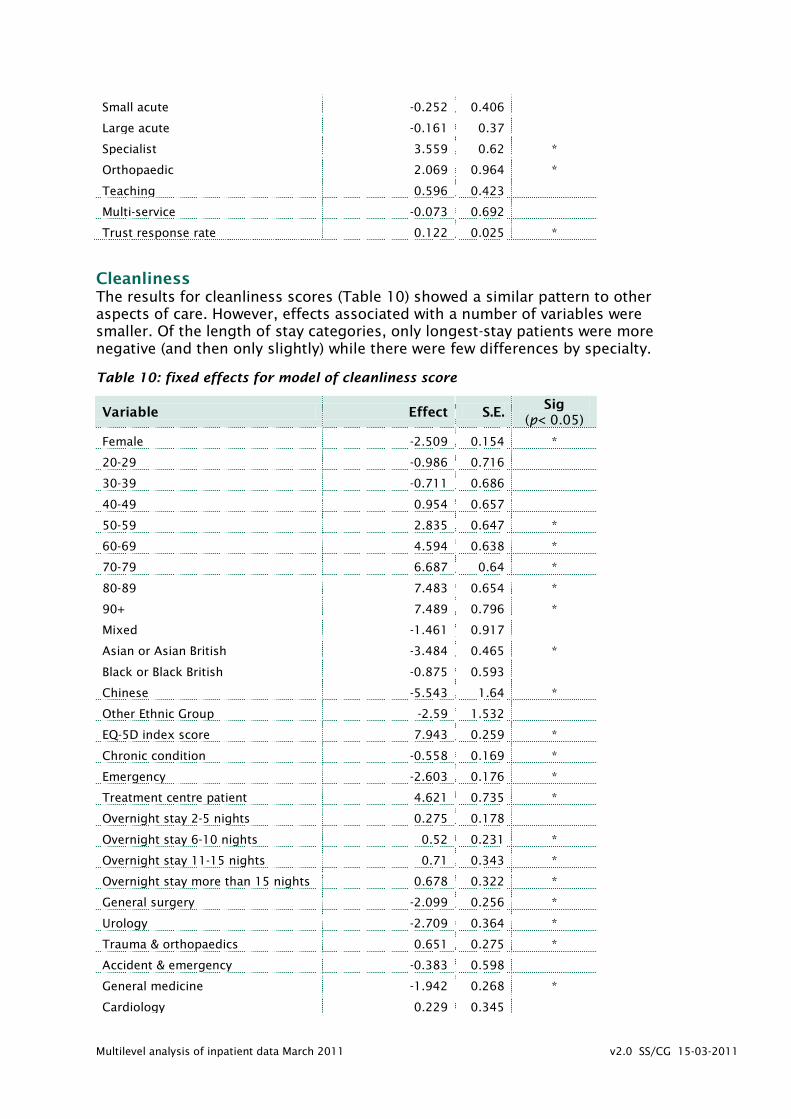
Cleanliness The results for cleanliness scores (Table 10) showed a similar pattern to other aspects of care. However, effects associated with a number of variables were smaller. Of the length of stay categories, only longest-stay patients were more negative (and then only slightly) while there were few differences by specialty.
Table 10: fixed effects for model of cleanliness score
Variable Effect S.E. Sig
(p< 0.05)
Female -2.509 0.154 *
20-29 -0.986 0.716
30-39 -0.711 0.686
40-49 0.954 0.657
50-59 2.835 0.647 *
60-69 4.594 0.638 *
70-79 6.687 0.64 *
80-89 7.483 0.654 *
90+ 7.489 0.796 *
Mixed -1.461 0.917
Asian or Asian British -3.484 0.465 *
Black or Black British -0.875 0.593
Chinese -5.543 1.64 *
Other Ethnic Group -2.59 1.532
EQ-5D index score 7.943 0.259 *
Chronic condition -0.558 0.169 *
Emergency -2.603 0.176 *
Treatment centre patient 4.621 0.735 *
Overnight stay 2-5 nights 0.275 0.178
Overnight stay 6-10 nights 0.52 0.231 *
Overnight stay 11-15 nights 0.71 0.343 *
Overnight stay more than 15 nights 0.678 0.322 *
General surgery -2.099 0.256 *
Urology -2.709 0.364 *
Trauma & orthopaedics 0.651 0.275 *
Accident & emergency -0.383 0.598
General medicine -1.942 0.268 *
Cardiology 0.229 0.345

Multilevel analysis of inpatient data March 2011 v2.0 SS/CG 15-03-2011
Geriatric medicine -2.033 0.424 *
Gynaecology -0.82 0.389 *
Small acute -1.283 0.505 *
Large acute -0.281 0.465
Specialist 3.933 0.766 *
Orthopaedic 2.598 1.209 *
Teaching 0.611 0.517
Multi-service -0.463 0.856
Foundation Trust 0.723 0.354 *
Trust response rate 0.078 0.031 *
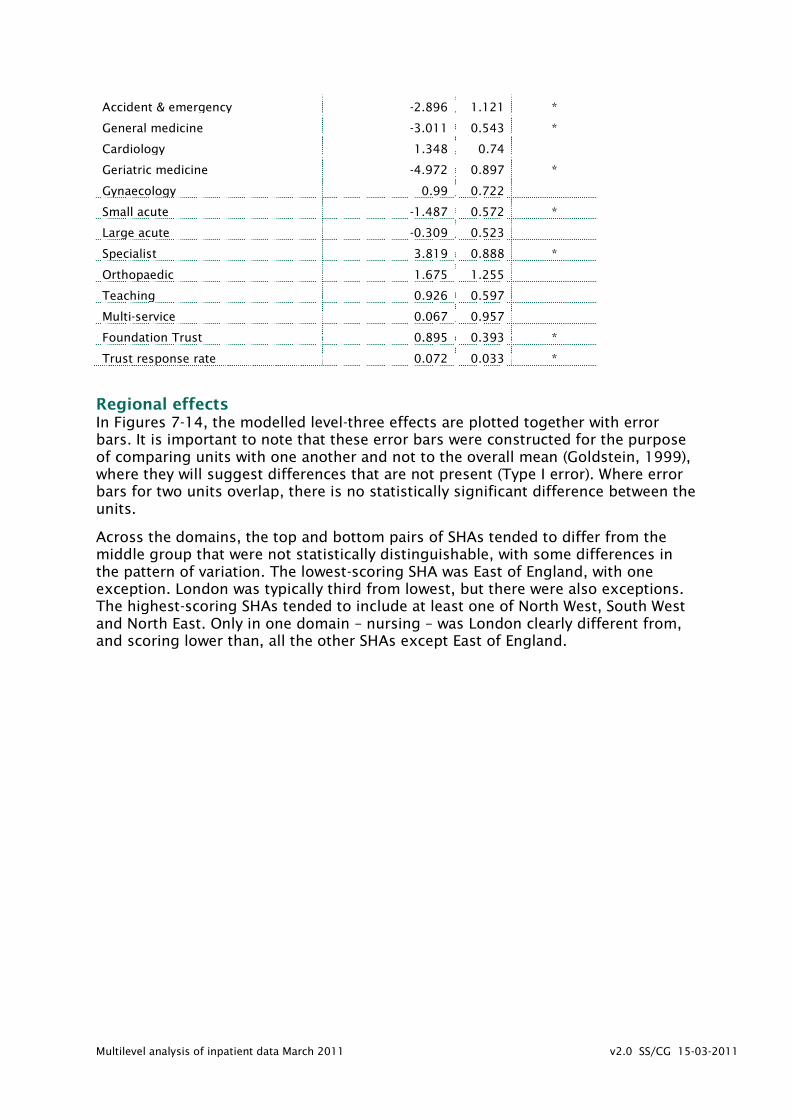
Pain control Pain control scores were not significantly related to the treatment centre indicator, and this was removed from the model. Otherwise, scores (Table 11) differed in similar ways to other domains. Only the longest stay patients were more negative, while there were the usual small differences in the pattern of variation by ethnicity, speciality and trust type.
Table 11: fixed effects for model of pain control score
Variable Effect S.E. Sig
(p< 0.05)
Female -2.726 0.304 *
20-29 -0.551 1.254
30-39 3.818 1.203 *
40-49 9.95 1.153 *
50-59 14.25 1.139 *
60-69 16.725 1.125 *
70-79 18.222 1.132 *
80-89 17.919 1.173 *
90+ 15.93 1.518 *
Mixed 1.091 1.713
Asian or Asian British -2.073 0.851 *
Black or Black British 3.415 1.076 *
Chinese -2.253 3.174
Other Ethnic Group -0.262 2.746
EQ-5D index score 18.905 0.494 *
Chronic condition -1.34 0.337 *
Emergency -3.171 0.34 *
Overnight stay 2-5 nights 1.086 0.36 *
Overnight stay 6-10 nights 1.47 0.453 *
Overnight stay 11-15 nights 1.866 0.66 *
Overnight stay more than 15 nights 1.545 0.621 *
General surgery -1.481 0.497 *
Urology -3.278 0.737 *
Trauma & orthopaedics 1.775 0.518 *
Multilevel analysis of inpatient data March 2011 v2.0 SS/CG 15-03-2011
Accident & emergency -2.896 1.121 *
General medicine -3.011 0.543 *
Cardiology 1.348 0.74
Geriatric medicine -4.972 0.897 *
Gynaecology 0.99 0.722
Small acute -1.487 0.572 *
Large acute -0.309 0.523
Specialist 3.819 0.888 *
Orthopaedic 1.675 1.255
Teaching 0.926 0.597
Multi-service 0.067 0.957
Foundation Trust 0.895 0.393 *
Trust response rate 0.072 0.033 *
Regional effects In Figures 7-14, the modelled level-three effects are plotted together with error bars. It is important to note that these error bars were constructed for the purpose of comparing units with one another and not to the overall mean (Goldstein, 1999), where they will suggest differences that are not present (Type I error). Where error bars for two units overlap, there is no statistically significant difference between the units.
Across the domains, the top and bottom pairs of SHAs tended to differ from the middle group that were not statistically distinguishable, with some differences in the pattern of variation. The lowest-scoring SHA was East of England, with one exception. London was typically third from lowest, but there were also exceptions. The highest-scoring SHAs tended to include at least one of North West, South West and North East. Only in one domain – nursing – was London clearly different from, and scoring lower than, all the other SHAs except East of England.

Multilevel analysis of inpatient data March 2011 v2.0 SS/CG 15-03-2011
Figure 7: Regional effects on overall experience score
Key: E (East of England) L (London) SC (South Central) SE (South East Coast) EM (East Midlands) WM
(West Midlands) YH (Yorkshire and the Humber) SW (South West) NW (North West) NE (North East)
Figure 8: Regional effects on consistency and coordination score
EE L SC SE EM WM YH SW NW NE
EE SC L SE EM WM YH SW NW NE

Multilevel analysis of inpatient data March 2011 v2.0 SS/CG 15-03-2011
Figure 9: Regional effects on respect and dignity score
Figure 10: Regional effects on involvement in care score
EE SC L SE YH WM EM SW NE NW
EE SE L SC EM WM NW YH SW NE

Multilevel analysis of inpatient data March 2011 v2.0 SS/CG 15-03-2011
Figure 11: Regional effects on interaction with doctors score
Figure 12: Regional effects on nursing score
EE SC SE EM L YH WM NW SW NE
L EE SC SE EM WM SW NW YH NE

Multilevel analysis of inpatient data March 2011 v2.0 SS/CG 15-03-2011
Figure 13: Regional effects on cleanliness score
Figure 14: Regional effects on pain control score
EE SC L SE YH WM EM SW NE NW
EE EM L SC WM SE YH NW NE SW

Multilevel analysis of inpatient data March 2011 v2.0 SS/CG 15-03-2011
Discussion The results for the different domains and for the overall score showed a recurring pattern.
Gender Women consistently reported worse experience than men in all domains.
Age group The largest effects on ratings of experience were associated with age, although this varied between domains, being greatest for consistency and coordination and smallest for nursing and cleanliness. Compared to the youngest age group, those in the 20-29 age group generally reported worse experience (although as the youngest group was also the smallest, this difference may be less reliable). There was then an upward trend in reported experience that peaked in the 70-89 age range then declined for the highest age group, but with the latter were still more positive than the youngest groups. For Involvement in care, the peak was lower, in the 60-69 age range. Bleith et al (2007) regarded age as a key indicator of expectations, and this may well underpin some of the differences in experience reported here. Within the older groups, there may also be increasing numbers of questionnaires that were filled out by family members on behalf of the patient.
Ethnicity The pattern for results by ethnicity was mixed. For the overall experience score, all except Black groups were more negative than the White comparison group. Black groups were in addition more critical only for involvement in care, nursing and cleanliness, and reported more positive experience of pain control, giving overall the most similar pattern of responses to White patients. Asian patients were significantly more critical in all domains except interaction with doctors. Chinese patients reported more negative experience in overall care, treatment with respect and dignity, involvement in care, interaction with doctors, nursing and cleanliness.
These findings mirror closely those reported, using a different methodology and in a range of settings, by the Department of Health (DH, 2009). That report concluded that Asian and Chinese service users were the most likely to be critical, and that in acute settings the experience of Black patients was more mixed.
Personal characteristics It is not clear whether the differences in reported experience revealed in these results are due to real differences in treatment, or whether they derive from different expectations or, indeed, whether some kinds of patient are less likely to be critical for fear of being discriminated against in their care. In order to explore this further, models were run on what might be regarded as the survey item for which personal preferences would play the most limited role – whether the patient had somewhere to keep their belongings. This question still showed clear differences by gender, age and ethnic group. Either way, it is clear from the results reported here that there are groups of patients whose expectations are differentially less well met and that this is a general finding across trusts.
Admission route Those admitted as emergencies were consistently more negative than those with elective or planned admissions. As with other factors, it is not necessarily clear why this is so. It is possible that those whose admission was planned are more prepared

Multilevel analysis of inpatient data March 2011 v2.0 SS/CG 15-03-2011
for what they will experience and that this affects expectations and perception of care. They may also be better informed about their condition.
Length of stay Reported experience was increasingly negative with length of stay, although sometimes this was significant only for the longest-stay patients. This effect was largest for consistency and coordination and smallest for cleanliness, where there was only a small difference for the longest-stay group. That patients who stay longer are more critical is perhaps not surprising – they will have more opportunity to experience problems in their care, more time to reflect on them and will possibly also be less tolerant of deficiencies. They are also likely to have more serious health problems with consequent effects on expectations and perceptions.
Main specialty Patients discharged from General surgery, urology, accident and emergency, general medicine and geriatric medicine were more negative about all or most of the experience domains. It is worth noting here that the negative difference for geriatric medicine is independent of the age effects note previously. Gynaecology patients were generally neutral or in the case of pain control and nursing, more positive. Patients discharged from trauma and orthopaedics were also neutral or positive, and cardiology patients were more positive for four of the seven domains as well as for the overall experience score.
Type of trust Those discharged from specialist trusts were more positive about each aspect of care. Those in teaching trusts were more positive about doctors as well as overall. Patients whose experience was of Foundation trusts were more positive in all domains except nursing.
Regional effects With all these variables taken into account, there were some differences in patient experience between regions. The North East, North West and South West SHAs were often associated with more positive reports, while East of England and London SHAs were more negative. However, with the exception of the nursing domain, there was no evidence for a clear ‘London effect’. Relatively poor experience of nursing in London could in turn be connected to difficulties in recruiting and retaining staff and the use of agency nurses.
There were most likely a combination of reasons behind this finding, but one factor appears to have been the inclusion of response rate as a trust-level variable. In exploratory analyses without response rate included, the ‘London effect’ was more in evidence. London trusts had the lowest mean response rate for the survey, but the North West and North East also had low response so this is clearly not a simple relationship. It is also not clear to what extent response rate is a cause or a result of patient experience, so perhaps a key question here is why response rate differs.
Limitations The relationships uncovered in these analyses do not necessarily imply any particular causation mechanism. The data used in this analysis are all obtained from answers to questions in the patient experience survey with the exception of a few variables from administrative data. An assumption underlying all statistical models is that they are correctly specified. It is possible that important but unmeasured variables – proxy response on behalf of the patient, for example – could change these results.

Multilevel analysis of inpatient data March 2011 v2.0 SS/CG 15-03-2011
References Aitkin, M and Longford, N. (1986). Statistical modelling issues in school effectiveness studies. Journal of the Royal Statistical Society. 149(1), pp1-43.
Bleich, S, Özaltin, E and Murray, C. (2007). How does satisfaction with the health-care system relate to patient experience? Bulletin of the World Health Organization. 87(4), pp 271-278.
Cleary, P. (1999). The increasing importance of patient surveys. British Medical Journal. 319, pp 720-721.
Commission for Health Improvement (2004). Unpacking the patient’s perspective: variations in NHS patient experience in England. London: Commission for Health Improvement.
Department of Health (2009). Report on self reported experience of patients from black and minority ethnic groups. London: Department of Health.
Goldstein, H. (1999). Multilevel statistical models, Internet version (http://www.ats.ucla.edu/stat/examples/msm_goldstein/goldstein.pdf ).
Healthcare Commission (2006). Variations in Patient Experience in England: Analysis of the Healthcare Commission’s 2004/05 National Patient Surveys. London: Healthcare Commission.
Healthcare Commission (2008). Geographical effects in patient surveys. Unpublished document.
Ipsos-MORI (2008) Frontiers of performance in the NHS II. http://www.ipsos-mori.com/DownloadPublication/1221_sri_health_frontiers_of_performance_in_the_NHS_II.pdf
Rasbash, J., Charlton, C., Browne, W.J., Healy, M. and Cameron, B. (2010) MLwiN Version 2.22. Centre for Multilevel Modelling, University of Bristol.
Sizmur, S and Redding, D. (2009). Core domains for measuring inpatients’ experience of care. Oxford: Picker Institute Europe.
Snijders, T. and Bosker, R. (1999). Multilevel analysis: An introduction to basic and advanced multilevel modeling. Thousand Oaks, CA: Sage.
Young, G., Meterko, M, and Desai, K. (2000). Patient Satisfaction With Hospital Care: Effects of Demographic and Institutional Characteristics. Medical Care. 38(3), pp 325-334.

Multilevel analysis of inpatient data March 2011 v2.0 SS/CG 15-03-2011
Appendix: Basic frequencies of level 1 variables
Gender
Frequency Percent Valid Percent
Cumulative
Percent
Valid Male 30166 45.7 45.7 45.7
Female 35847 54.3 54.3 100.0
Total 66013 100.0 100.0
Age groups
Frequency Percent Valid Percent
Cumulative
Percent
Valid 16-19 912 1.4 1.4 1.4
20-29 2503 3.8 3.8 5.2
30-39 3744 5.7 5.7 10.8
40-49 6798 10.3 10.3 21.1
50-59 9449 14.3 14.3 35.5
60-69 14842 22.5 22.5 57.9
70-79 15921 24.1 24.1 82.1
80-89 10124 15.3 15.3 97.4
90+ 1720 2.6 2.6 100.0
Total 66013 100.0 100.0
Ethnic groups
Frequency Percent Valid Percent
Cumulative
Percent
Valid White 62076 94.0 94.3 94.3
Mixed 444 .7 .7 95.0
Asian or Asian British 1836 2.8 2.8 97.8
Black or Black British 1160 1.8 1.8 99.5
Chinese 133 .2 .2 99.7
Other Ethnic Group 173 .3 .3 100.0
Total 65822 99.7 100.0
Missing System 191 .3
Total 66013 100.0

Multilevel analysis of inpatient data March 2011 v2.0 SS/CG 15-03-2011
Main specialty on discharge
Frequency Percent Valid Percent
Cumulative
Percent
Valid All other specialties 12962 19.6 19.6 19.6
General surgery 11884 18.0 18.0 37.6
Urology 3777 5.7 5.7 43.4
Trauma& orthopaedics 11598 17.6 17.6 60.9
A&E 1268 1.9 1.9 62.9
General medicine 13180 20.0 20.0 82.8
Cardiology 4343 6.6 6.6 89.4
Geriatric medicine 2966 4.5 4.5 93.9
Gynaecology 4028 6.1 6.1 100.0
Total 66006 100.0 100.0
Missing 7 .0
Total 66013 100.0
Length of stay
Frequency Percent Valid Percent
Cumulative
Percent
Valid Single overnight stay 20093 30.4 30.4 30.4
Overnight stay 2-5 nights 26594 40.3 40.3 70.7
Overnight stay 6-10
nights 10845 16.4 16.4 87.2
Overnight stay 11-15
nights 3807 5.8 5.8 92.9
Overnight stay more than
15 nights 4667 7.1 7.1 100.0
Total 66006 100.0 100.0
Missing System 7 .0
Total 66013 100.0
Multilevel analysis of inpatient data March 2011 v2.0 SS/CG 15-03-2011
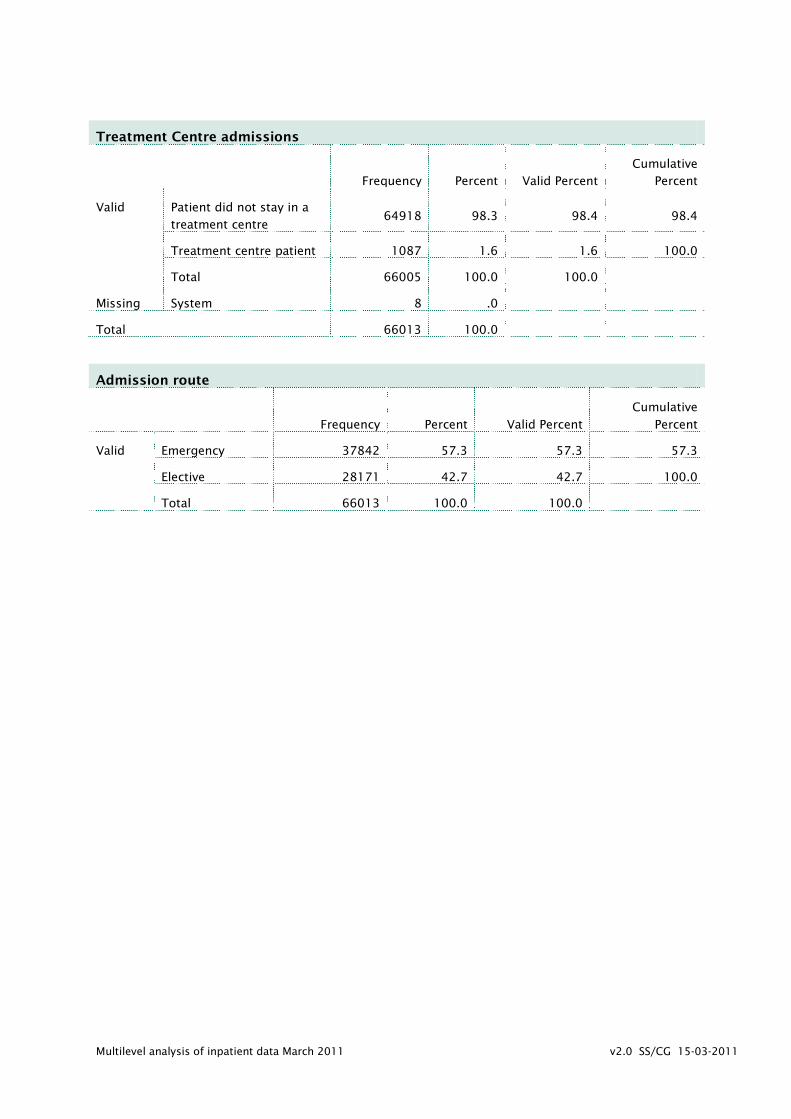
Treatment Centre admissions
Frequency Percent Valid Percent
Cumulative
Percent
Valid Patient did not stay in a
treatment centre 64918 98.3 98.4 98.4
Treatment centre patient 1087 1.6 1.6 100.0
Total 66005 100.0 100.0
Missing System 8 .0
Total 66013 100.0
Admission route
Frequency Percent Valid Percent
Cumulative
Percent
Valid Emergency 37842 57.3 57.3 57.3
Elective 28171 42.7 42.7 100.0
Total 66013 100.0 100.0