morbidity and mortality weekly report - cdc.gov · morbidity and mortality weekly report weekly...
TRANSCRIPT

Morbidity and Mortality Weekly Report
Weekly February 13, 2004 / Vol. 53 / No. 5
depardepardepardepardepartment of health and human sertment of health and human sertment of health and human sertment of health and human sertment of health and human servicesvicesvicesvicesvicesCenters for Disease Control and PreventionCenters for Disease Control and PreventionCenters for Disease Control and PreventionCenters for Disease Control and PreventionCenters for Disease Control and Prevention
INSIDE
100 Cases of Influenza A (H5N1) — Thailand, 2004103 Secondary and Tertiary Transfer of Vaccinia Virus Among
U.S. Military Personnel — United States and Worldwide,2002–2004
106 Update: Adverse Events Following Civilian SmallpoxVaccination — United States, 2003
107 Global Polio Eradication Initiative Strategic Plan, 2004108 Notice to Readers
Outbreaks of Avian Influenza A (H5N1) in Asia and Interim Recommendationsfor Evaluation and Reporting of Suspected Cases — United States, 2004
During December 2003–February 2004, outbreaks of highlypathogenic avian influenza A (H5N1) among poultry werereported in Cambodia, China, Indonesia, Japan, Laos, SouthKorea, Thailand, and Vietnam. As of February 9, 2004, a totalof 23 cases of laboratory-confirmed influenza A (H5N1) virusinfections in humans, resulting in 18 deaths, had been reportedin Thailand and Vietnam. In addition, approximately 100 sus-pected cases in humans are under investigation by nationalhealth authorities in Thailand and Vietnam. CDC, the WorldHealth Organization (WHO), and national health authoritiesin Asian countries are working to assess and monitor the situ-ation, provide epidemiologic and laboratory support, andassist with control efforts. This report summarizes informa-tion about the human infections and avian outbreaks in Asiaand provides recommendations to guide influenza A (H5N1)surveillance, diagnosis, and testing in the United States.
Poultry OutbreaksOn December 12, 2003, an outbreak of avian influenza A
(H5N1) among poultry in South Korea was reported. Subse-quent influenza A (H5N1) outbreaks among poultry wereconfirmed in Vietnam (January 8, 2004), on a single farm inJapan (January 12), in Thailand (January 23), in Cambodia(January 24), in China (January 27), in Laos (January 27),and in Indonesia (February 2). On January 19, a single per-egrine falcon found dead in Hong Kong also tested positivefor influenza A (H5N1) virus, but no poultry outbreak hasbeen identified.
In Vietnam, as of February 9, a total of 18 human influenzaA (H5N1) infections had been reported, resulting in 13 deaths.Patients ranged in age from 4 to 30 years; 10 patients wereaged <18 years. The cases included fatal infections in two sis-ters who were part of a cluster of four cases of severe respira-tory illness in a single family.
In Thailand, influenza A (H5N1) infection was confirmedin four males, aged 6–7 years, and one female, aged 58 years.All five patients died (1). Other cases are under investigation.
Analysis of VirusesAntigenic analysis and genetic sequencing distinguish
between influenza viruses that usually circulate among birdsand those that usually circulate among humans. Sequencingof the H5N1 viruses obtained from five persons in Vietnamand Thailand, including one sister from the cluster in Viet-nam, has indicated that all of the genes of these viruses are ofavian origin. No evidence of genetic reassortment betweenavian and human influenza viruses has been identified. Ifreassortment occurs, the likelihood that the H5N1 virus canbe transmitted more readily from person to person willincrease. Although all the genes are of avian origin, the cur-rent H5N1 viruses are antigenically distinguishable from thoseisolated from humans in Hong Kong in 1997 and 2003.
Genetic sequencing of the five human H5N1 isolates fromThailand and Vietnam also indicates that the viruses havegenetic characteristics associated with resistance to the influ-enza antiviral drugs amantadine and rimantadine. Antiviralsusceptibility testing confirms this finding. Testing forsusceptibility of the H5N1 isolates to the neuraminidase

98 MMWR February 13, 2004
SUGGESTED CITATIONCenters for Disease Control and Prevention. [Article Title].MMWR 2004;53:[inclusive page numbers].
The MMWR series of publications is published by theEpidemiology Program Office, Centers for Disease Controland Prevention (CDC), U.S. Department of Health andHuman Services, Atlanta, GA 30333.
Centers for Disease Control and Prevention
Julie L. Gerberding, M.D., M.P.H.Director
Dixie E. Snider, M.D., M.P.H.(Acting) Deputy Director for Public Health Science
Susan Y. Chu, Ph.D., M.S.P.H.(Acting) Associate Director for Science
Epidemiology Program Office
Stephen B. Thacker, M.D., M.Sc.Director
Office of Scientific and Health Communications
John W. Ward, M.D.Director
Editor, MMWR Series
Suzanne M. Hewitt, M.P.A.Managing Editor, MMWR Series
Jeffrey D. Sokolow, M.A.(Acting) Lead Technical Writer/Editor
Jude C. RutledgeTeresa F. Rutledge
Douglas W. WeatherwaxWriters/Editors
Lynda G. CupellMalbea A. LaPete
Visual Information Specialists
Kim L. Bright, M.B.A.Quang M. Doan, M.B.A.
Erica R. ShaverInformation Technology Specialists
Division of Public Health Surveillanceand Informatics
Notifiable Disease Morbidity and 122 Cities Mortality DataRobert F. Fagan
Deborah A. AdamsJudith Allen
Felicia J. ConnorLateka Dammond
Rosaline DharaDonna Edwards
Patsy A. HallPearl C. Sharp
inhibitor oseltamivir has demonstrated the sensitivity ofthese viruses to the drug; testing to determine susceptibilityto the neuraminidase inhibitor zanamavir is under way.
Interim Recommendations for U.S.Surveillance and Diagnostic Evaluation
CDC recommends that state and local health departments,hospitals, and clinicians enhance their efforts to identifypatients who could be infected by influenza A (H5N1) virusand take infection-control precautions when influenza A(H5N1) is suspected (Box). Testing of hospitalized patientsfor influenza A (H5N1) infection is indicated when both ofthe following exist: 1) radiographically confirmed pneumo-nia, acute respiratory distress syndrome (ARDS), or othersevere respiratory illness for which an alternative diagnosis hasnot been established and 2) a history of travel within 10 days
BOX. Interim recommended infection-control precautions* forinfluenza A (H5N1)
• All patients with a febrile respiratory illness should beasked about their recent travel history and managedusing Respiratory Hygiene/Cough Etiquette in HealthCareSettings guidelines†.
• Isolation precautions for all hospitalized patients whohave or are under evaluation for influenza A (H5N1)are the same as those that should be used for severe acuterespiratory syndrome (SARS), as follows:— Pay careful attention to hand hygiene before and
after all patient contact.— Use gloves and gown for all patient contact.— Wear eye protection when within 3 feet of the
patient.— Place the patient in an airborne isolation room (i.e.,
monitored negative air pressure in relation to sur-rounding areas with six to 12 air changes per hour).
— When entering the patient’s room, use a fit-testedrespirator at least as protective as an N95 filtering-facepiece respirator approved by the NationalInstitute for Occupational Safety and Health.
• Outpatients or hospitalized patients discharged in <14days should be isolated in the home setting on the basisof principles for home isolation of SARS patients§.
• These precautions should be continued for 14 daysafter onset of symptoms until an alternative diagnosis isestablished or diagnostic test results indicate that thepatient is not infected with influenza A virus.
* Additional information about health-care isolation precautions is availableat http://www.cdc.gov/ncidod/hip/isolat/isolat.htm.
† Available at http://www.cdc.gov/flu/professionals/infectioncontrol/resphygiene.htm.
§ Available at http://www.cdc.gov/ncidod/sars/guidance.

Vol. 53 / No. 5 MMWR 99
of symptom onset to a country with documented H5N1 avianinfluenza infections in poultry or humans. Ongoing listingsof countries affected by avian influenza are available from theWorld Organization for Animal Health*.
Testing for influenza A (H5N1) also should be consideredon a case-by-case basis in consultation with state and localhealth departments for hospitalized or ambulatory patientswith all of the following: 1) documented temperature of>100.4°F (>38°C); 2) cough, sore throat, or shortness ofbreath; and 3) history of contact with poultry or domesticbirds (e.g., visited a poultry farm, a household raising poultry,or a bird market) or a known or suspected patient with influ-enza A (H5N1) in an H5N1-affected country within 10 daysof symptom onset.
Recommended Laboratory TestingProcedures
The highly pathogenic avian influenza A (H5N1) virusrequires Biosafety Level (BSL)-3+ laboratory conditions for cer-tain procedures. CDC recommends that virus isolation studieson respiratory specimens from patients who meet the testingcriteria should not be performed unless all BSL-3+ conditionsare met. However, clinical specimens can be tested by poly-merase chain reaction (PCR) assays by using standard BSL-2work practices in a Class II biological safety cabinet. CDC hasdeveloped real-time PCR protocols† for various respiratorypathogens, including SARS and influenza A and B viruses. Inaddition, commercially available antigen-detection tests can beused under BSL-2 levels to test for influenza. Although theserapid tests for human influenza also can detect avian influenzaA (H5N1) viruses, the sensitivity of these tests is substantiallylower than that of virus culture or PCR (2).
Specimens from persons meeting clinical and epidemiologicindications for testing should be sent to CDC if they test posi-tive for influenza A either by PCR or antigen detection test-ing, or if PCR assays for influenza are not available locally.CDC also will accept, for follow-up testing, specimens frompersons meeting the clinical and epidemiologic indicationsbut testing negative on the rapid tests when PCR assay wasnot available. Requests for testing by CDC should comethrough local and state health departments, which shouldcontact CDC’s Emergency Operations Center, telephone 770-488-7100.Reported by: CDC/WHO Avian Influenza Response Team.
Editorial Note: Since 1997, human infection with avianinfluenza viruses has been confirmed on five occasions§. Theability of avian viruses to transmit from person to personappears limited. Rare person-to-person infection was notedin the A (H5N1) outbreak in Hong Kong in 1997 (3,4) andin the A (H7N7) outbreak in the Netherlands in 2003 (5),but these secondary cases did not result in sustained chains oftransmission or communitywide outbreaks. These previousexperiences with avian influenza viruses suggest that limitedperson-to-person transmission of the current H5N1 virusescould occur.
The majority of the human H5N1 cases are apparentlyassociated with direct exposure to infected birds or to surfacescontaminated with excretions from infected birds. The familyrespiratory illness cluster in Vietnam suggests the possibilityof limited person-to-person transmission. However, otherpossibilities (e.g., transmission through exposure to surfacescontaminated by H5N1-infected poultry feces) cannot beruled out. Although no evidence for sustained person-to-person transmission of influenza A (H5N1) has been identi-fied, influenza viruses have the capacity to change quickly.Continued monitoring for new transmission patterns is animportant aspect of the current investigation.
In 1997, the influenza A (H5N1) outbreak among personsin Hong Kong ended abruptly after the culling of poultry.However, the current outbreaks present challenges because ofthe large geographic areas and numbers of affected poultry.Asian poultry populations are maintained both on large com-mercial farms and in backyard flocks. In addition, infectionsamong wild bird populations might be extensive, and theresources to address this problem are limited in certainaffected countries. Because of increasing evidence that avianinfluenza viruses infect humans, persons involved in the slaugh-ter of poultry potentially infected with avian influenza virusesor their contaminated environments should follow WHO rec-ommendations for worker protection¶.
Because the influenza A (H5N1) virus could develop theability to maintain sustained person-to-person transmission,WHO collaborating centers are working to coordinate vac-cine development. Efforts are under way in the United King-dom and the United States to develop influenza A (H5N1)reference viruses for use in vaccine preparation. The mini-mum estimated time necessary to complete reference virusdevelopment and safety testing is 3 months. Production byvaccine manufacturers of pilot lots of vaccine for clinical test-
* Available at http://www.oie.int/eng/en_index.htm.† These protocols are available to public health laboratories and have been posted,
under SARS (password required), by the Association of Public HealthLaboratories at http://www.aphl.org/members_only/index.cfm.
§ Influenza A (H5N1) in Hong Kong in 1997 and 2003, influenza A (H9N2) inHong Kong in 1999 and 2003, and influenza A (H7N7) in the Netherlands in2003.
¶ Available at http://www.wpro.who.int/avian/docs/recommendations.asp.

100 MMWR February 13, 2004
ing can begin only after reference virus development and safetytesting have been completed. Decisions on whether to pro-ceed with vaccine manufacture will depend, in part, on theevolution of the current outbreaks.
On February 4, CDC issued an order for an immediateban** on the import of all birds from Cambodia, China(including Hong Kong), Indonesia, Japan, Laos, South Korea,Thailand, and Vietnam. Birds from these affected countriespotentially can infect humans with influenza A (H5N1). Thisorder complements a similar action taken by the U.S.Department of Agriculture (USDA).
CDC advises that travelers to countries in Asia with docu-mented H5N1 outbreaks should avoid poultry farms, con-tact with animals in live food markets, and any surfaces thatappear to be contaminated with feces from poultry or otheranimals. More information on travel is available from CDCat http://www.cdc.gov/travel. Additional information oninfluenza viruses and avian influenza is available from CDCat http://www.cdc.gov/flu. Updated information on humaninfections is available from WHO at http://www.who.int/en.
**Additional information on the embargo is available at http://www.cdc.gov/flu/avian/embargo.htm.
References1. CDC. Cases of influenza A (H5N1) — Thailand, 2004. MMWR 2004;
53:100–3.2. CDC. Prevention and control of influenza: recommendations of the
Advisory Committee on Immunization Practices (ACIP). MMWR 2003;52(No. RR-8).
3. Bridges CB, Lim W, Hu-Primmer J, et al. Risk of influenza A (H5N1)infection among poultry workers, Hong Kong, 1997–1998. J Infect Dis2002;185:1005–10.
4. Bridges CB, Katz JM, Seto WH, et al. Risk of influenza A (H5N1)infection among health care workers exposed to patients with influenzaA (H5N1), Hong Kong. J Infect Dis 2000;181:344–8.
5. de Jong JC, Rimmelzwaan GF, Bartelds AI, Wilbrink B, Fouchier RA,Osterhaus AD. The 2002/2003 influenza season in the Netherlands andthe vaccine composition for the 2003/2004 season [Dutch]. Ned TijdschrGeneeskd 2003;147:1971–5.
Cases of Influenza A (H5N1) —Thailand, 2004
Since mid-December 2003, eight Asian countries (Cambo-dia, China, Indonesia, Japan, Laos, South Korea, Thailand,and Vietnam) have reported an epizootic of highly pathogenicavian influenza in poultry and various other birds caused byinfluenza A (H5N1). As of February 9, 2004, a total of 23laboratory-confirmed human cases of influenza A (H5N1)had been reported in Thailand and Vietnam. In 18 (78%) ofthese cases, the patients died. Clinical experience with avian
H5N1 disease in humans is limited (1). The human H5N1viruses identified in Asia in 2004 are antigenically and geneti-cally distinguishable from the 1997 and February 2003 viruses.To aid surveillance and clinical activities, this report providesa preliminary clinical description of the initial five confirmedcases in Thailand.
Of the five laboratory-confirmed cases in Thailand, fourwere in male children aged 6–7 years, and one was in a femaleaged 58 years; all patients were previously healthy (Table).Four patients reported deaths in poultry owned by the patient’sfamily, and two patients reported touching an infected chicken.One patient had infected chickens in his neighborhood andwas reported to have played near a chicken cage. None of theconfirmed cases occurred among persons involved in the massculling of chickens.
Patients reported to hospitals 2–6 days after onset of feverand cough (Table). Other early symptoms included sore throat(four), rhinorrhea (two), and myalgia (two). Shortness ofbreath was reported in all patients 1–5 days after symptomonset. On admission, clinically apparent pneumonia with chestradiograph changes was observed in all patients, with patchyinfiltrates in four and interstitial infiltrates in one. Diarrheaand vomiting were not reported. Peripheral leukocytes werenormal or decreased, and four patients had lymphopenia(<1,000/µL). Mild-to-moderate elevations in hepatic transami-nases were found in four patients.
All patients had respiratory failure and required intubationa median of 7 days (range: 4–10 days) after onset of illness.Two patients had a pneumothorax. Three patients requiredinotropic support for decreased cardiac function; two patientshad renal impairment as a later manifestation. None had docu-mented evidence of secondary bacterial infection.
Late in the course of illness, three patients were treated withoseltamivir for 3–5 days. All received empiric broad-spectrumantibiotics for community-acquired pneumonia while thecause of illness was under investigation. Four were treated withsystemic steroids for increasing respiratory distress and clini-cally diagnosed acute respiratory distress syndrome (ARDS)with compatible chest radiograph changes.
Three children died 2–4 weeks after symptom onset, andone child and the adult died 8 days after symptom onset. Allpatients had laboratory evidence of influenza A (H5N1) byreverse transcriptase–polymerase chain reaction. In three cases,the virus was isolated in tissue culture, and in three cases, theviral antigens were identified by immunofluorescent assay.Reported by: T Chotpitayasunondh, S Lochindarat, P Srisan, QueenSirikit National Institute of Child Health; K Chokepaibulkit, Facultyof Medicine, Siriraj Hospital, Mahidol Univ, Bangkok; J Weerakul,Buddhachinaraj Hospital, Phitsanulok; M Maneerattanaporn, 17th

know what matters.
Dispatch
up-to-the-minute: adj1 : extending up to the immediate present,
including the very latest information;
see also MMWR.
Centers for Disease Control and Prevention
Centers for Disease Control and Prevention
Centers for Disease Control and Prevention
Centers for Disease Control and Prevention
Centers for Disease Control and Prevention
MMWR Dispatch
Vol. 52 / April 29, 2003
Morbidity and Mortality Weekly ReportCDC’s interim surveillance case definition for severe acute
respiratory syndrome (SARS) has been updated to include
laboratory criteria for evidence of infection with the SARS-
associated coronavirus (SARS-CoV) (Figure, Box). In addi-
tion, clinical criteria have been revised to reflect the possible
spectrum of respiratory illness associated with SARS-CoV. Epi-
demiologic criteria have been retained. The majority of U.S.
cases of SARS continue to be associated with travel*, with
only limited secondary spread to household members or
health-care providers (1).
SARS has been associated etiologically with a novel
coronavirus, SARS-CoV (2,3). Evidence of SARS-CoV
infection has been identified in patients with SARS in several
countries, including the United States. Several new labora-
tory tests can be used to detect SARS-CoV. Serologic testing
for coronavirus antibody can be performed by using indirect
fluorescent antibody or enzyme-linked immunosorbent
assays that are specific for antibody produced after infection.
Although some patients have detectable coronavirus antibody
during the acute phase (i.e., within 14 days of illness onset),
definitive interpretation of negative coronavirus antibody tests
is possible only for specimens obtained >21 days after onset
of symptoms. A reverse transcriptase polymerase chain reac-
tion (RT-PCR) test specific for viral RNA has been positive
within the first 10 days after onset of fever in specimens from
some SARS patients, but the duration of detectable viremia
or viral shedding is unknown. RT-PCR testing can detect
SARS-CoV in clinical specimens, including serum, stool, and
nasal secretions. Finally, viral culture and isolation have both
been used to detect SARS-CoV. Absence of SARS-CoV anti-
body in serum obtained <21 days after illness onset, a nega-
tive PCR test, or a negative viral culture does not exclude
coronavirus infection.Reported U.S. cases of SARS still will be classified as sus-
pect or probable; however, these cases can be further classi-
fied as laboratory-confirmed or -negative if laboratory data
are available and complete, or as laboratory-indeterminate if
specimens are not available or testing is incomplete. Obtain-
ing convalescent serum samples to make a final determina-
tion about infection with SARS-CoV is critical.
No instances of SARS-CoV infection have been detected
in persons who are asymptomatic. However, data are insuffi-
cient to exclude the possibility of asymptomatic infection with
SARS-CoV and the possibility that such persons can trans-
mit the virus. Investigations of close contacts and health-care
workers exposed to SARS patients might provide informa-
tion about the occurrence of asymptomatic infected persons.
Similarly, the clinical manifestations of SARS might extend
Updated Interim Surveillance Case Definition for Severe Acute Respiratory Syndrome
(SARS) — United States, April 29, 2003
* In this updated case definition, Taiwan has been added to the areas with documented
or suspected community transmission of SARS; Hanoi, Vietnam is now an area
with recently documented or suspected community transmission of SARS.
FIGURE. Clinical and laboratory criteria for probable and
suspect severe acute respiratory syndrome (SARS) cases and
SARS-associated coronavirus (SARS-CoV) infection — United
States, April 29, 2003
Laboratory-confirmed UndeterminedNegative
Moderaterespiratoryillness
Severerespiratoryillness
Mildrespiratory*illness/Asymptomatic
Clin
ical
crit
eria
Laboratory criteria for SARS-CoV
Suspect case*Probable case*
Reported to World Health Organization
* Meets epidemiologic criteria.

102 MMWR February 13, 2004
Somdejprasangkaraj Hospital, Suphanburi; P Sawanpanyalert, Deptof Medical Sciences, Ministry of Public Health, Thailand. World HealthOrganization, Thailand. CDC International Emerging InfectionsProgram, Thailand.
Editorial Note: The 1997 outbreak of influenza A (H5N1) inHong Kong established that highly pathogenic avian influenzaviruses can infect humans directly, with resulting illness thatwas fatal in six (33%) of 18 patients. The viruses were not trans-mitted efficiently from person to person, and human infectionsstopped after the culling of poultry (2). The 2003–2004 avianoutbreak is more widespread, with poultry disease reportedacross much of east and southeast Asia. Direct infection of hu-mans with H5N1 viruses has been confirmed in Thailand andVietnam. However, no evidence of sustained person-to-persontransmission has been identified.
Despite the antigenic and genetic differences in the H5N1viruses causing the current Asian outbreaks, certain clinicalfeatures of the five human cases described in this report aresimilar to those of severely affected patients from the 1997outbreak in Hong Kong (3). In all five cases, disease was severe,with pneumonia progressing to respiratory failure and death.
Early distinguishing features included fever, sore throat, cough,and lymphopenia. Other organ involvement included mild-to-moderate hepatitis and later cardiac and renal impairment.In contrast with the cases reported from Hong Kong, gas-trointestinal symptoms were not prominent features.
Because of the severity of disease and the concern for thesafety of health-care personnel, the Ministry of Public Healthin Thailand recommends that hospitalized patients with sus-pected avian influenza be cared for by using precautions tominimize the risk for airborne transmission. Broad-spectrumantibacterial drugs should be used as empiric treatment forthe major causes of pneumonia (e.g., Streptococcus pneumoniae),including possible superinfection with Staphylococcus aureus.Testing of a limited number of human isolates demonstratesresistance to amantadine and rimantadine (4). For this rea-son, treatment with neuraminidase inhibitors should be initi-ated early. The effectiveness of antiviral drugs against H5N1infections and the period after which these drugs will providelittle or no benefit is not known. A more detailed understand-ing of the pathogenesis is needed to direct therapeuticapproaches such as the use of immunomodulating drugs.
TABLE. Clinical features, treatment, and outcomes in five patients with laboratory-confirmed influenza A (H5N1), by sex and age ofpatient — Thailand, 2004
Signs and symptomson admission*
Fever, cough, sore throat for 6days. Dyspnea on day 6; CXR†
bilateral interstitial infiltrates.
Fever, cough, rhinorrhea for 5days. Dyspnea on day 6; CXRpatchy infiltrates in right lowerlobe.
Fever, cough, rhinorrhea, sorethroat for 4 days. Dyspnea onday 5; CXR multifocal patchyinfiltrates.
Fever, cough, sore throat,myalgia for 2 days. Dyspnea onday 2; CXR multifocal patchyinfiltrates.
Fever, cough, sore throat,myalgia for 4 days. Dyspnea onday 5; CXR multifocal patchyinfiltrates.
Subsequent complications
Respiratory failure on day 10;cardiac failure, pneumothorax,ARDS§, gastrointestinal bleeding.
Respiratory failure on day 8;hepatitis, ARDS.
Respiratory failure on day 6;pneumothorax, ARDS.
Respiratory failure on day 4; cardiacfailure, renal failure, ARDS.
Respiratory failure on day 5; cardiacfailure, renal failure, ARDS.
Initial investigativefindings
Leukocytes: 4,100/µLLymphocytes: 1,440/µLPlatelets: 304,000/µLAST¶: 120, ALT**: 52
Leukocytes: 1,200/µLLymphocytes: 624 /µLPlatelets: 89,000/µLAST: 790, ALT: 150Proteinuria: >3
Leukocytes: 2,200/µLLymphocytes: 638/µLPlatelets: 150,000/µLAST: 175, ALT: 43
Leukocytes: 5,680/µLLymphocytes: 454/µLPlatelets: 185,000/µLBUN††: 39 mg/dLCreatinine: 2.3 mg/dL
Leukocytes: 2,900/µLLymphocytes: 696/µLPlatelets: 87,000/µLAST: 280, ALT: 50BUN: 54 mg/dLCreatinine: 4.6 mg/dL
Treatmentand outcome
Oseltamivir on days18–22. Died on day 29.
Oseltamivir on days18–20. Died on day 20.
Died on day 18.
Died on day 8.
Oseltamivir on days 5–8.Died on day 8.
* No patients had an underlying illness reported.† Chest radiograph.§ Acute respiratory distress syndrome.¶ Aspartate aminotransferase.
** Alanine aminotransferase.†† Blood urea nitrogen.
Sex
Male
Male
Male
Female
Male
Age(yrs)
7
6
6
58
6
Vol. 53 / No. 5 MMWR 103
Updated recommendations for hospital infection control andtreatment are available from the World Health Organizationat http://www.who.int/csr/disease/avian_influenza/en.
The epidemiology of influenza A (H5N1) in Thailand andneighboring countries remains incompletely described, butthe confirmed human infections have occurred in geographicareas with recognized avian disease, and two patients reporteddirect physical contact with ill or dead chickens. Of the fivelaboratory-confirmed cases in Thailand, four were in boys aged6–7 years, which suggests that boys in this age group mightbe subject to particular high-risk exposures. Case-control stud-ies in Thailand and Vietnam should help define specific riskfactors for infection and allow for the development of evi-dence-based public health interventions.
Control of highly pathogenic avian influenza should includesurveillance for affected flocks, aggressive culling on the basisof international guidelines to eradicate foci of infection, care-ful protection of cullers through the use of personal protec-tive equipment, and use of the currently licensed humantrivalent influenza vaccine to reduce the risk for co-infectionin poultry workers and cullers, which might lead to geneticreassortment of avian and human influenza viruses (2,3). Inrecent weeks, Thailand has moved aggressively to 1) identifygeographic areas with confirmed H5N1 disease in poultry (e.g.,cull-affected flocks and flocks within a 5-kilometer radius),2) establish controls on the transport of poultry and poultryproducts out of affected areas, and 3) promote safe food-handling practices.
Clinicians should be aware of the clinical features of the cur-rent human influenza A (H5N1) disease and the potential riskfactors for infection so that health-care workers are protected andpatients can be identified quickly and managed appropriately.Interim U.S. recommendations for infection-control precautionsand the diagnostic evaluation of persons with specific epidemio-logic and clinical criteria have been developed (4). Additionalinformation is available from CDC at http://www.cdc.gov/flu/avian/index.htm.References1. Yuen KY, Chan PK, Peiris M, et al. Clinical features and rapid viral
diagnosis of human disease associated with avian influenza A H5N1virus. Lancet 1998;351:467–71.
2. Chan PK. Outbreak of avian influenza A (H5N1) virus infection inHong Kong in 1997. Clin Infect Dis 2002;34:S58–S64.
3. Claas EC, Osterhaus AD, van Beek R, et al. Human influenza A H5N1virus related to a highly pathogenic avian influenza virus. Lancet1998;351:472–7.
4. CDC. Outbreaks of avian influenza A (H5N1) in Asia and interim rec-ommendations for evaluation and reporting of suspected cases — UnitedStates, 2004. MMWR 2004;53:97–100.
Secondary and Tertiary Transferof Vaccinia Virus Among U.S.
Military Personnel — United Statesand Worldwide, 2002–2004
In December 2002, the Department of Defense (DoD)began vaccinating military personnel as part of the pre-eventvaccination program (1). Because vaccinia virus is present onthe skin at the site of vaccination, it can spread to other partsof the body (i.e., autoinoculation) or to contacts of vaccinees(i.e., contact transfer). To prevent autoinoculation and con-tact transfer, DoD gave vaccinees printed information thatfocused on hand washing, covering the vaccination site, andlimiting contact with infants (1,2). This report describes casesof contact transfer of vaccinia virus among vaccinated mili-tary personnel since December 2002; findings indicate thatcontact transfer of vaccinia virus is rare. Continued efforts areneeded to educate vaccinees about the importance of propervaccination-site care in preventing contact transmission,especially in household settings.
DoD conducts surveillance for vaccine-associated adverseevents by using automated immunization registries, militarycommunication channels, and the Vaccine Adverse EventsReporting System (VAERS). Contact transfer cases aredefined as those in which vaccinia virus is confirmed by viralculture or polymerase chain reaction (PCR) assays. Other casesare classified as suspected on the basis of lesion descriptionand reported linkage to a vaccinated person 3–9 days beforelesion development.
During December 2002–January 2004, a total of 578,286military personnel were vaccinated; 508,546 (88%) were male,and 407,923 (71%) were primary vaccinees (i.e., receivedsmallpox vaccination for the first time). The median age ofvaccinees was 29 years (range: 17–76 years). Among vaccinees,cases of suspected contact transfer of vaccinia were identifiedamong 30 persons: 12 spouses, eight adult intimate contacts,eight adult friends, and two children in the same household.These cases were reported from Colorado (four), North Caro-lina (four), Texas (four), Alaska (two), California (two), Con-necticut (one), Kansas (one), New Jersey (one), Ohio (one),South Carolina (one), Washington state (one), West Virginia(one), and overseas (seven). The sources of suspected contacttransfer were all male service members who were primaryvaccinees. Except for six male sports partners, all infected con-tacts were female.
Vaccinia virus was confirmed in 18 (60%) of the 30 casesby viral culture or PCR. Sixteen (89%) of the 18 confirmedcases involved uncomplicated infections of the skin; two (11%)involved the eye (3). None resulted in eczema vaccinatum or

104 MMWR February 13, 2004
Case 2. In July 2003, a service member who had been vac-cinated was wrestling with an unvaccinated service memberat a military recreational function when the bandages cover-ing the vaccination site fell off. The unvaccinated service mem-ber subsequently wrestled with another unvaccinated servicemember. Six days later, both unvaccinated service membershad lesions on their forearms, neck, and face. Skin lesion speci-mens from both men tested positive for vaccinia virus by PCRand viral culture at Tripler Army Medical Center’s microbiol-ogy laboratory.Reported by: TW Barkdoll, MD, Okinawa, Japan. RB Cabiad, FortRichardson; MS Tankersley, MD, JL Adkins, MD, Elmendorf Air ForceBase; B Jilly, PhD, G Herriford, Alaska Public Health Laboratory.AC Whelen, PhD, CA Bell, PhD, Tripler Army Medical Center, Honolulu,Hawaii. MP Fairchok, MD, LC Raynor, MD, VA Garde, MD,VM Rothmeyer, SD Mahlen, PhD, Madigan Army Medical Center, FortLewis, Washington. RJ Engler, MD, LC Collins, MD, LL Duran, VaccineHealthcare Center Network, Walter Reed Army Medical Center;MT Huynh, MD, RD Bradshaw, MD, Bolling Air Force Base,Washington, DC. JD Grabenstein, PhD, Military Vaccine Agency,U.S. Dept of Defense.
Editorial Note: The findings in this report indicate that theprimary risk for secondary transfer of vaccinia was amongpersons who shared a bed; 12 of the 18 confirmed cases werespouses or adult intimate contacts. However, the majority ofvaccinated DoD personnel who shared a bed did not transfervaccinia virus to their contacts. The frequency of contact trans-fer in the military vaccination program is comparable to ratesobserved during the 1960s, although persons are less likely tobe immune to vaccinia today and thus are more susceptible tocontact transfer (1).
The first case of tertiary transfer described in this reportunderscores the need for breastfeeding mothers with house-hold contact with vaccinees to take precautions to preventinadvertent transmission of vaccinia to their infants. Directcontact is presumed to be the major mode of transmission,but clothing and bed linen might act as vectors for secondarytransmission. Tertiary transmission, although rare, is facili-tated when the secondary infection is not recognized.
Programs that educate health-care workers, vaccinees, andcontacts should note that new vesicles or pustules that appear<15 days after the vaccinia scab falls off from the vaccinationsite might be vaccinia infections. Although an infant living inthe home is not a contraindication to vaccination of a familymember in a nonoutbreak setting, measures to prevent trans-mission include having vaccinees launder their own linens andtowels and change their bandages away from other householdmembers.
progressive vaccinia. Twelve (67%) of the 18 confirmed caseswere among spouses or adult intimate contacts. The observedrate of contact transfer was 5.2 per 100,000 vaccinees overallor 7.4 per 100,000 primary vaccinees. Among 27,700 small-pox-vaccinated DoD health-care workers, no transmission ofvaccinia from a vaccinated health-care worker to an unvacci-nated patient or from a vaccinated patient to an unvaccinatedhealth-care worker has been identified.
Two (11%) of the 18 confirmed cases of transfer of vacciniavirus resulted from tertiary transfer. One involved a servicemember, his wife, and their breastfed infant; the otherinvolved serial transmission among male sports partners.
Case ReportsCase 1. In early May 2003, a service member received his
primary smallpox vaccination. Approximately 6–8 days aftervaccination, he experienced a major reaction (i.e., an eventthat indicates a successful take; is characterized by a papule,vesicle, ulcer, or crusted lesion, surrounded by an area ofinduration; and usually results in a scar) (4). The vaccineereported no substantial pruritus. He slept in the same bed ashis wife and kept the vaccination site covered with bandages.After bathing, he reportedly dried the vaccination site withtissue, which he discarded into a trash receptacle. He also usedseparate towels to dry himself, rolled them so the area thatdried his arm was inside, and placed them in a laundry con-tainer. His wife handled bed linen, soiled clothing, and tow-els; she reported that she did not see any obvious drainage onclothing or linen and had no direct contact with the vaccina-tion site.
In mid-May, the wife had vesicular skin lesions on each breastnear the areola but continued to breastfeed. Approximately 2weeks later, she was examined at a local hospital, treated formastitis, and continued to breastfeed. The same day, theinfant had a vesicular lesion on the upper lip, followed byanother lesion on the left cheek (5). Three days later, theinfant was examined by a pediatrician, when another lesionwas noted on her tongue. Because of possible early atopic der-matitis lesions on the infant’s cheeks, contact vaccinia infec-tion with increased risk for eczema vaccinatum was considered.The infant was transferred to a military referral medical cen-ter for further evaluation. On examination, the infant hadseborrheic dermatitis and no ocular involvement. Skin lesionspecimens from the mother and infant tested positive for vac-cinia by viral culture and PCR at the Alaska Health Depart-ment Laboratory and at Madigan Army Medical Center.Because both patients were stable clinically and the lesionswere healing without risk for more serious complications, vac-cinia immune globulin was not administered. Neither patienthad systemic complications from the infection.

Vol. 53 / No. 5 MMWR 105
something yet to learn.""The wisest mind has
MMWR Continuing Education
makes it possible for you to stay
current on relevant public health
and clinical topics– online and
at no charge.
Review course descriptions,
take exams, track your results,
and receive course certificates–
all from your own computer,
when and where your sche-
dule allows.
MMWR CE
A wise choice.
cdc.gov/mmwr
George Santayana
ContinuingEducation
During the 1960s, the rate of unintentional infection withvaccinia in secondary contacts was two to six cases per 100,000primary vaccinees (4,6,7). During that period, two thirds ofreported contact infections occurred among children, typi-cally siblings. Such spread could manifest as an inadvertentinfection or, in more severe fashion, as eczema vaccinatum orprogressive vaccinia. Infections of the skin predominated, withrarer ocular involvement posing a risk for scarring or keratitis.In the current DoD smallpox vaccination program, no casesof eczema vaccinatum have occurred, although the popula-tion of atopic dermatitis patients might have increased sub-stantially since the 1960s (8). During the 1960s, eczemavaccinatum resulted in deaths, and two thirds of such caseswere related to contact transfer of vaccinia virus (6). In thecurrent DoD smallpox vaccination program, careful screen-ing of DoD vaccinees and their household contacts for skindiseases along with targeted education likely contributed toboth screening out vaccine candidates with personal or close-contact contraindications and educating vaccinees aboutproper infection-control measures.
Health-care workers and the public should report suspectedcases of contact transfer of vaccinia virus to their state or localhealth departments and to VAERS at http://www.vaers.org,or by telephone 800-822-7967. Viral culture or PCR assays,important for confirming vaccinia virus, are available fromthe majority of state public health laboratories.References1. Grabenstein JD, Winkenwerder W Jr. US military smallpox vaccina-
tion program experience. JAMA 2003;289:3278–82.2. CDC. Recommendations for using smallpox vaccine in pre-event vac-
cination program: supplemental recommendations of the Advisory Com-mittee on Immunization Practices (ACIP) and the Healthcare InfectionControl Practices Advisory Committee (HICPAC). MMWR 2003;52(No. RR-7).
3. CDC. Smallpox vaccine adverse events among civilians—United States,February 25–March 3, 2003. MMWR 2003;52:180–1, 191.
4. CDC. Smallpox vaccination and adverse events: guidance for clinicians.MMWR 2003;52(No. RR-4).
5. Garde V, Harper D, Fairchok M. Tertiary contact vaccinia in a breast-feeding infant. JAMA 2004;291:725–7.
6. Neff JM, Lane JM, Fulginiti VA, Henderson DA. Contact vaccinia—transmission of vaccinia from smallpox vaccination. JAMA 2002;288:1901–5.
7. Sepkowitz KA. How contagious is vaccinia? N Engl J Med 2003;348:439–46.
8. Engler RJ, Kenner J, Leung DY. Smallpox vaccination: risk consider-ations for patients with atopic dermatitis. J Allergy Clin Immunol 2002;110:357–65.

106 MMWR February 13, 2004
Update: Adverse Events FollowingCivilian Smallpox Vaccination —
United States, 2003During January 24–December 31, 2003, smallpox vaccine
was administered to 39,213 civilian health-care and publichealth workers in 55 jurisdictions to prepare the United Statesfor a possible terrorist attack using smallpox virus. Thisreport updates information on vaccine-associated adverseevents among civilians vaccinated since the beginning of theprogram and among contacts of vaccinees, received by CDCfrom the Vaccine Adverse Event Reporting System (VAERS)during August 9–December 31.
In this vaccination program, CDC, the Food and DrugAdministration, and state health departments are conductingsurveillance for vaccine-associated adverse events amongcivilian vaccinees (1,2). As part of the vaccination program,civilian vaccinees receive routine follow-up, and reportedadverse events after vaccination receive follow-up as needed.The U.S. Department of Defense is conducting surveillancefor vaccine-associated adverse events among military vaccineesand providing follow-up care to those persons with reportedadverse events (3).
Adverse events associated with smallpox vaccination are clas-sified on the basis of evidence supporting the reported diag-noses. Cases verified by virologic testing or, in some instances,by other diagnostic testing, are classified as confirmed(Table 1). Cases are classified as probable if possible alterna-
tive etiologies are investigated and excluded and supportiveinformation for the diagnosis is found. Cases are classified assuspected if they have clinical features compatible with thediagnosis, but either further investigation is required or inves-tigation of the case did not provide supporting evidence forthe diagnosis. All reports of events that follow vaccination(i.e., events associated temporally) are accepted; however, re-ported adverse events are not necessarily associated causallywith vaccination, and some or all of these events might becoincidental. This report includes cases reported as of De-cember 31 that are either under investigation or have a re-ported final diagnosis.
During August 9–December 31, no new cases of selectedadverse events were reported (Table 1). During the vaccina-tion program, no cases of eczema vaccinatum, erythemamultiforme major, fetal vaccinia, or progressive vaccinia havebeen reported.
During August 9–December 31, a total of 20 other seriousadverse events were reported (Table 2). Also during this period,59 other nonserious events were reported. Among the 712vaccinees with reported other nonserious adverse events duringJanuary 24–December 31 (Table 2), the most common signsand symptoms were rash (n = 142), fever (n = 135), pain(n = 122), headache (n = 111), and fatigue (n = 97). All of thesecommonly reported events are consistent with mild expectedreactions following receipt of smallpox vaccine. Some vaccineesreported multiple signs and symptoms.
TABLE 1. Number of cases* of selected adverse events associated with smallpox vaccination among civilians, by type — United States,January 24–December 31, 2003
No. new cases Total no. cases(August 9–December 31) (January 24–December 31)
Adverse events Suspected† Probable§ Confirmed¶ Suspected Probable Confirmed
Eczema vaccinatum —** — — — — —Fetal vaccinia — — — — — —Generalized vaccinia — — — 2 — 1Inadvertent inoculation, nonocular — — — 11 — 9Ocular vaccinia — — — 1 — 2Progressive vaccinia — — — — — —Erythema multiforme major (Stevens-Johnson syndrome) — — — — — —Myo/pericarditis — — — 16 5 —Postvaccinial encephalitis or encephalomyelitis — — — 1 — —Pyogenic infection of vaccination site — — — — — —
* Under investigation or completed as of December 31, 2003; numbers and classifications of adverse events will be updated regularly on CDC’s website athttp://www.cdc.gov/od/oc/media/spadverse.htm.
† Events are classified as suspected if they have clinical features compatible with the diagnosis, but either further investigation is required or additionalinvestigation of the case did not provide supporting evidence for the diagnosis and did not identify an alternative diagnosis.
§ Events are classified as probable if possible alternative etiologies are investigated and excluded and supportive information for the diagnosis is found.¶ The first six events listed are classified as confirmed if virologic tests are positive. The last four events are classified as confirmed on the basis of diagnostic
testing (e.g., histopathology); confirmation of events thought to be immunologically mediated (i.e., erythema multiforme, myo/pericarditis, postvaccinialencephalitis, or encephalomyelitis) does not establish causality.
** No cases reported.

Vol. 53 / No. 5 MMWR 107
TABLE 2. Number of cases* of other adverse events reportedafter smallpox vaccination among civilians, by severity —United States, January 24–December 31, 2003
No. new cases Total no. cases(August 9– (January 24–
Adverse events December 31) December 31)
Other serious adverse events† 20§ 97Other nonserious adverse events¶ 59 712* Under investigation or completed as of December 31, 2003; numbers
and classifications of adverse events will be updated regularly in MMWRas more information becomes available.
†Events that result in hospitalization, permanent disability, life-threateningillness, or death. These events are temporally associated with vaccina-tion but are not necessarily causally associated with vaccination.
§Include nine cases of chest pain, two cases of myocardial infarction, twocases of unspecfied neurologic disorder, and one case each of angina,dilated cardiomyopathy, Parkinson’s disease, lymphoma, appendicitis, sei-zure, and cellulitis secondary to trauma.
¶Include expected self-limited responses to smallpox vaccination (e.g.,fatigue, headache, pruritis, local reaction at vaccination site, regional lym-phadenopathy, lymphangitis, fever, myalgia and chills, and nausea); addi-tional events are temporally associated with smallpox vaccination but arenot necessarily causally associated with vaccination.
TABLE 3. Vaccinia immune globulin release and vacciniatransmission to contacts — United States, January 24–December 31, 2003
No. new cases Total no. cases(August 9– (January 24–
Event December 31) December 31)
Vaccinia immune globulin release 0 1Vaccinia transmission to contacts*
Health-care settings 0 0Other settings 0 0
* No cases of transmission from civilian vaccinees have been reported.Sixteen cases of transmission from military personnel to civilian contactshave been reported and are included in Table 1 (14 cases of inadvertentinoculation, nonocular, and two cases of ocular vaccinia).
During this reporting period, no vaccinia immune globulinwas released for civilian vaccinees. No cases of vaccine trans-mission from civilian vaccinees to their contacts have beenreported during the vaccination program (Table 3). Surveil-lance for adverse events during the civilian and military small-pox vaccination programs is ongoing.Reported by: Smallpox vaccine adverse events coordinators; NationalImmunization Program, CDC.
References1. CDC. Smallpox vaccine adverse events monitoring and response sys-
tem for the first stage of the smallpox vaccination program. MMWR2003;52:88–9, 99.
2. CDC. Update: adverse events following civilian smallpox vaccination—United States, 2003. MMWR 2003;52:819–20.
3. CDC. Secondary and tertiary transfer of vaccinia virus among U.S.military personnel—United States and worldwide, 2002–2004. MMWR2004;53:100–2.
Brief Report
Global Polio Eradication InitiativeStrategic Plan, 2004
Since the 1988 World Health Assembly resolution to eradi-cate poliomyelitis (1), the number of polio-endemic coun-tries has decreased from 125 in 1988 to six in 2003 (i.e.,Afghanistan, Egypt, India, Niger, Nigeria, and Pakistan), andthe number of cases reported worldwide has decreased fromapproximately 350,000 to 682. In 2003, approximately 90%of cases were reported from Nigeria (305), India (220), andPakistan (99); epidemiologic and virologic data demonstratedfocal endemic transmission in Afghanistan and Niger, withrepeated importations from Pakistan and Nigeria, respectively,and localized transmission in Egypt. On January 15, 2004,the World Health Organization (WHO) released an updatedGlobal Polio Eradication Initiative Strategic Plan outliningactivities required to 1) interrupt poliovirus transmission glo-bally, 2) achieve global certification of polio eradication, and3) prepare for global cessation of childhood vaccination withoral poliovirus vaccine (OPV) (2). The discontinuation of massvaccination campaigns in the majority of polio-free countrieshas left these areas vulnerable to importations of wild poliovi-rus (WPV) from the remaining countries in which polio isendemic. For polio to be eradicated, all remaining poliovirusreservoirs must be eliminated.
Objective 1 details the immunization and surveillanceactivities required to interrupt transmission in the remainingcountries where polio is endemic. During 2004, supplemen-tary immunization activities (SIAs) in India, Nigeria, andPakistan will be intensified. The suspension in 2003 of OPVcampaigns in the highly polio-endemic areas of northernNigeria led to a marked increase in the number of reportedcases from that country, resulting in WPV transmission inpreviously polio-free areas within Nigeria and importation ofWPV into at least six neighboring countries. For polio to beeradicated, all children aged <5 years in Nigeria, the other fivecountries in which polio also is endemic, and those countrieswith imported cases must be vaccinated during intensified SIAsin 2004.
Objectives 2 and 3 outline activities for certifying the worldpolio-free and preparing for the cessation of use of OPV.Objective 2 focuses on improving surveillance quality (espe-cially in the 19 countries that have not achieved certification-standard surveillance), reversing declines in surveillancesensitivity in the WHO regions that have been certified polio-free, and working to complete WPV laboratory containment.Objective 3 outlines the development of policies for thepostcertification era, including detection and notification ofcirculating polioviruses as public health emergencies, long-term

108 MMWR February 13, 2004
Online
know what matters.
e ncore.Week after week, MMWR Online plays an important role in helping
you stay informed. From the latest CDC guidance to breaking
health news, count on MMWR Online to deliver the news you
need, when you need it.
Log on to cdc.gov/mmwr and enjoy MMWR performance.
containment of all poliovirus strains, polio vaccine stockpilesand outbreak response mechanisms, and routine vaccination.
Objective 4 outlines how to incorporate the humanresources, physical infrastructure, and institutional arrange-ments that have been established for polio eradication intoother disease-control programs and recommends that thosepolio-eradication activities that must be continued indefinitely(i.e., surveillance, vaccine stockpiles, and laboratory contain-ment) be undertaken by existing national, WHO, and UnitedNations Children’s Fund (UNICEF) programs.
More information about the Global Polio Eradication Initia-tive is available from CDC at http://www.cdc.gov/nip/global/stopteam/backgrd.htm. Copies of the Global Polio Eradica-tion Initiative Strategic Plan are available from WHO, e-mail,[email protected] or at http://www.polioeradication/all/news/document.asp.Reported by: Polio Eradication Initiative/Office of the Director-Generaland Dept of Immunization, Vaccines and Biologicals/Family andCommunity Health, World Health Organization, Geneva, Switzerland.United Nations Children’s Fund, New York, New York. RotaryInternational, Evanston, Illinois. Div of Viral and Rickettsial Diseases,National Center for Infectious Diseases; Global Immunization Div,National Immunization Program, CDC.
References1. World Health Assembly. Global eradication of poliomyelitis by the year
2000: resolution of the 41st World Health Assembly. Geneva, Switzer-land: World Health Organization, 1988 (WHA resolution no. 41.28).
2. Polio Eradication Initiative, Office of the Director-General andDepartment of Immunization, Vaccines and Biologicals, Family and Com-munity Health. The Global Polio Eradication Initiative Strategic Plan2004–2008. Geneva, Switzerland: World Health Organization, 2004.
Notice to Readers
Limited Supply of PneumococcalConjugate Vaccine: Suspension
of Recommendation for Fourth DoseIn December 2003, CDC reported that Wyeth Vaccines,
the only U.S. supplier of 7-valent pneumococcal conjugatevaccine (PCV7, marketed as Prevnar®), was experiencing pro-duction constraints that could cause delays in shipments andwas implementing an allocation plan to ensure the equitabledistribution of available vaccine (1). In February 2004, Wyethadvised CDC that production constraints had not beenresolved and that supplies will remain limited at least throughJuly 2004. Until full production capacity is resumed, localshortages might occur. Effective immediately, CDC recom-

Vol. 53 / No. 5 MMWR 109
mends that health-care providers temporarily suspend rou-tine use of the fourth dose of PCV7 to conserve vaccine andminimize the likelihood of shortages.
PCV7 is a highly effective vaccine. In October 2000, a pri-mary series of three PCV7 injections and one booster wasrecommended for all children (2). In 2001, the incidence ofinvasive pneumococcal disease among children aged <2 yearswas 69% less than during 1998–1999, before the recommen-dation (3). Preliminary data from CDC’s Active Bacterial CoreSurveillance program indicate that effectiveness, at least forthe short term, is not compromised by delaying administra-tion of the fourth dose. A case-control study comparing theeffectiveness of a 3-dose series with a 4-dose series found that3 doses were 90% effective (95% confidence interval [CI] =74%–96%) against invasive disease caused by serotypes rep-resented in the vaccine, whereas 4 doses were 96% effective(95% CI = 68%–100%); this difference was not statisticallysignificant.
Because precise allocation of PCV7 is difficult, spot short-ages are inevitable when supplies are limited. To ensure thatevery child can be protected against pneumococcal diseasedespite the limited supply, and on the basis of the short-termeffectiveness of the 3-dose primary series of PCV7 at ages 2,4, and 6 months, CDC, in consultation with the AmericanAcademy of Family Physicians, the American Academy of Pe-diatrics, and the Advisory Committee on Immunization Prac-tices, recommends that all health-care providers, regardless ofthe amount of PCV7 in their inventories, help conserve thenational PCV7 supply by temporarily discontinuing admin-istration of the fourth dose of PCV7 for healthy children.Health-care providers should continue to administer the fourthdose to children at increased risk for severe disease*. Children
whose booster dose is deferred should receive PCV7 on theirfirst visit after supplies are restored. If all health-care provid-ers comply with this temporary recommendation, >1 milliondoses will be conserved by July 2004, making widespread orprolonged disruptions in vaccination services less likely.
This recommendation reflects CDC’s assessment of theexisting national PCV7 supply and may be changed if the sup-ply changes. Updated information about vaccine supplies is avail-able from CDC at http://www.cdc.gov/nip/news/shortages.References1. CDC. Limited supply of pneumococcal conjugate vaccine. MMWR
2003;52:1234.2. CDC. Preventing pneumococcal disease among infants and young chil-
dren: recommendations of the Advisory Committee on ImmunizationPractices (ACIP). MMWR 2000;49(No. RR-9).
3. Whitney CG, Farley MM, Hadler J, et al. Decline in invasive pneumo-coccal disease after the introduction of protein-polysaccharide conju-gate vaccine. N Engl J Med 2003;348:1737–46.
4. CDC. Pneumococcal vaccination for cochlear implant candidates andrecipients: updated recommendations of the Advisory Committee onImmunization Practices. MMWR 2003;52:739–40.
5. American Academy of Pediatrics. Table 3.43. In: Pickering LK, ed. 2003Red Book: Report of the Committee on Infectious Diseases, 26th ed.Elk Grove Village, Illinois: American Academy of Pediatrics, 2003.
Erratum: Vol. 53, No. 4In the report, “Child Passenger Deaths Involving Drinking
Drivers—United States, 1997–2002,” on page 77 in the thirdsentence of the first paragraph, the number of children whodied in alcohol-related crashes was incorrect. The correct num-ber is 2,335.
* Includes children with sickle cell disease and other hemoglobinopathies,anatomic asplenia, chronic diseases (e.g., chronic cardiac and pulmonary diseaseand diabetes), cerebrospinal fluid leak, human immunodeficiency virus infectionand other immunocompromising conditions, immunosuppressivechemotherapy or long-term systemic corticosteroid use; children who haveundergone solid organ transplantation (2); and children who either have receivedor will receive cochlear implants (4). All these children have been identified asbeing at either “high risk” or “presumed high risk” for severe invasivepneumoccocal disease (5).

110 MMWR February 13, 2004
-: No reported cases.* Incidence data for reporting years 2003 and 2004 are provisional and cumulative (year-to-date).†
Not notifiable in all states.§
Updated monthly from reports to the Division of HIV/AIDS Prevention — Surveillance and Epidemiology, National Center for HIV, STD, and TB Prevention.Last update December 28, 2003.
¶Of two cases reported, one was indigenous, and one was imported from another country.
** Updated weekly from reports to the Division of Viral and Rickettsial Diseases, National Center for Infectious Diseases (notifiable as of July 2003).††
Not previously notifiable.
TABLE I. Summary of provisional cases of selected notifiable diseases, United States, cumulative, week ending February 7, 2004 (5th Week)*
Cum. Cum. Cum. Cum.2004 2003 2004 2003
Anthrax - - Hemolytic uremic syndrome, postdiarrheal† 4 15Botulism: - - HIV infection, pediatric†§ - 27
foodborne 2 1 Measles, total 2¶ -infant 5 9 Mumps 15 25other (wound & unspecified 2 1 Plague - -
Brucellosis† 4 18 Poliomyelitis, paralytic - -Chancroid 3 2 Psittacosis† - 5Cholera 1 - Q fever† 1 12Cyclosporiasis† 2 17 Rabies, human - -Diphtheria - - Rubella 2 -Ehrlichiosis: - - Rubella, congenital syndrome - -
human granulocytic (HGE)† 3 10 SARS-associated coronavirus disease† ** - -human monocytic (HME)† 3 16 Smallpox† †† - NAhuman, other and unspecified - 1 Staphylococcus aureus: - -
Encephalitis/Meningitis: - - Vancomycin-intermediate (VISA)† †† 2 NACalifornia serogroup viral† - - Vancomycin-resistant (VRSA)† †† - NAeastern equine† - 2 Streptococcal toxic-shock syndrome† 12 19Powassan† - - Tetanus - 4St. Louis† - 2 Toxic-shock syndrome 8 4western equine† - - Trichinosis 1 -
Hansen disease (leprosy)† 3 16 Tularemia† 2 3Hantavirus pulmonary syndrome† 2 4 Yellow fever - -
* No measles cases were reported for the current 4-week period yielding a ratio for week 5 of zero (0).† Ratio of current 4-week total to mean of 15 4-week totals (from previous, comparable, and subsequent 4-week periods for the past 5 years). The point where the hatched area
begins is based on the mean and two standard deviations of these 4-week totals.
FIGURE I. Selected notifiable disease reports, United States, comparison of provisional 4-week totals February 7, 2004, with historicaldata
DISEASE DECREASE INCREASECASES CURRENT
4 WEEKS
Ratio (Log scale)†
Beyond historical limits
4210.50.250.125
239
196
41
76
0
94
9
247
2
Hepatitis A, acute
Hepatitis B, acute
Hepatitis C, acute
Legionellosis
Measles, total
Mumps
Pertussis
Rubella
Meningococcal disease
0.06250.03125
*

Vol. 53 / No. 5 MMWR 111
N: Not notifiable. U: Unavailable. -: No reported cases. C.N.M.I.: Commonwealth of Northern Mariana Islands.* Incidence data for reporting years 2003 and 2004 are provisional and cumulative (year-to-date).† Chlamydia refers to genital infections caused by C. trachomatis.§ Updated monthly from reports to the Division of HIV/AIDS Prevention — Surveillance and Epidemiology, National Center for HIV, STD, and TB Prevention. Last update
December 28, 2003.¶ Contains data reported through National Electronic Disease Surveillance System (NEDSS).
TABLE II. Provisional cases of selected notifiable diseases, United States, weeks ending February 7, 2004, and February 1, 2003(5th Week)*
Encephalitis/MeningitisAIDS Chlamydia† Coccidiodomycosis Cryptosporidiosis West Nile
Cum. Cum. Cum. Cum. Cum. Cum. Cum. Cum. Cum. Cum.Reporting area 2004§ 2003 2004 2003 2004 2003 2004 2003 2004 2003
UNITED STATES - 5,274 57,460 74,252 105 346 161 280 2 57
NEW ENGLAND - 192 2,163 2,587 - - 5 10 - -Maine - - 102 167 N N 2 - - -N.H. - 3 - 147 - - - - - -Vt. - 5 71 94 - - 2 1 - -Mass. - 111 1,408 933 - - 1 7 - -R.I. - 16 429 269 - - - 1 - -Conn. - 57 153 977 N N - 1 - -
MID. ATLANTIC - 1,541 7,664 9,402 - - 21 21 1 -Upstate N.Y. - 77 1,371 922 N N 7 3 - -N.Y. City - 942 2,757 3,001 - - 2 10 - -N.J. - 170 1,125 1,548 - - 1 1 - -Pa. - 352 2,411 3,931 N N 11 7 1 -
E.N. CENTRAL - 632 8,945 14,792 - 1 32 34 - -Ohio - 95 483 3,764 - - 15 7 - -Ind. - 84 1,429 1,755 N N 2 - - -Ill. - 290 2,301 4,983 - - - 8 - -Mich. - 143 3,954 2,636 - 1 10 4 - -Wis. - 20 778 1,654 - - 5 15 - -
W.N. CENTRAL - 60 3,139 4,126 - - 14 9 - -Minn. - 9 192 1,024 N N 2 4 - -Iowa - 17 - 269 N N 1 2 - -Mo. - 25 1,620 1,565 - - 3 1 - -N. Dak. - - 90 63 N N - - - -S. Dak. - 1 249 204 - - 4 2 - -Nebr.¶ - - 444 270 - - - - - -Kans. - 8 544 731 N N 4 - - -
S. ATLANTIC - 1,118 9,219 12,093 - - 36 143 1 57Del. - 30 263 293 N N - 1 - -Md. - 103 1,633 1,532 - - 2 3 - -D.C. - 179 202 348 - - - - - -Va. - 176 992 1,327 - - 3 - - -W. Va. - 6 275 230 N N - - - -N.C. - 123 1,951 2,120 N N 10 2 - -S.C.¶ - 45 893 973 - - - 1 - -Ga. - 309 280 1,908 - - 8 7 - -Fla. - 147 2,730 3,362 N N 13 129 1 57
E.S. CENTRAL - 80 3,873 4,909 N N 11 10 - -Ky. - 28 509 694 N N 3 1 - -Tenn. - 21 1,681 1,456 N N 5 4 - -Ala. - 12 1,268 1,376 - - 2 4 - -Miss. - 19 415 1,383 N N 1 1 - -
W.S. CENTRAL - 698 10,178 9,386 - - 8 4 - -Ark. - 14 635 551 - - 5 1 - -La. - 15 3,221 1,564 N N - - - -Okla. - 16 622 645 N N 2 - - -Tex. - 653 5,700 6,626 - - 1 3 - -
MOUNTAIN - 204 2,699 4,566 3 286 5 6 - -Mont. - 7 26 128 N N - - - -Idaho - 1 120 151 N N - 3 - -Wyo. - 1 96 104 - - 1 - - -Colo. - 23 200 1,228 N N 4 2 - -N. Mex. - 14 31 638 - - - - - -Ariz. - 112 2,134 1,587 - 282 - 1 - -Utah - 6 92 191 3 1 - - - -Nev. - 40 - 539 - 3 - - - -
PACIFIC - 749 9,580 12,391 102 59 29 43 - -Wash. - 72 1,444 1,313 N N - - - -Oreg. - 47 676 414 - - 3 2 - -Calif. - 618 7,197 9,852 102 59 26 41 - -Alaska - 6 252 305 - - - - - -Hawaii - 6 11 507 - - - - - -
Guam - 1 - - - - - - - -P.R. - 145 135 24 N N N N - -V.I. - 2 - 30 - - - - - -Amer. Samoa U U U U U U U U U UC.N.M.I. - U - U - U - U - U

112 MMWR February 13, 2004
N: Not notifiable. U: Unavailable. - : No reported cases.* Incidence data for reporting years 2003 and 2004 are provisional and cumulative (year-to-date).
TABLE II. (Continued) Provisional cases of selected notifiable diseases, United States, weeks ending February 7, 2004, and February 1, 2003(5th Week)*
Escherichia coli, Enterohemorrhagic (EHEC)Shiga toxin positive, Shiga toxin positive,
O157:H7 serogroup non-O157 not serogrouped Giardiasis GonorrheaCum. Cum. Cum. Cum. Cum. Cum. Cum. Cum. Cum. Cum.
Reporting area 2004 2003 2004 2003 2004 2003 2004 2003 2004 2003
UNITED STATES 72 130 11 37 9 15 961 2,429 21,200 30,547
NEW ENGLAND 2 6 1 - 1 1 57 75 490 760Maine - - - - - - 12 10 17 13N.H. - - - - - - - 4 - 11Vt. - - - - - - 5 7 4 11Mass. - 3 - - 1 1 37 53 325 271R.I. - - - - - - 3 1 98 105Conn. 2 3 1 - - - - - 46 349
MID. ATLANTIC 6 12 - - 1 2 198 273 2,689 4,191Upstate N.Y. 1 2 - - - - 47 32 559 477N.Y. City 2 1 - - - - 53 116 922 1,291N.J. - 3 - - 1 - 18 42 452 1,026Pa. 3 6 - - - 2 80 83 756 1,397
E.N. CENTRAL 18 24 2 2 1 1 143 278 3,460 7,020Ohio 10 4 - - 1 1 82 95 248 2,104Ind. 2 - - - - - - - 565 677Ill. 1 5 - - - - 13 83 892 2,318Mich. 5 6 - - - - 43 68 1,539 1,312Wis. - 9 2 2 - - 5 32 216 609
W.N. CENTRAL 11 12 3 2 6 1 79 130 1,077 1,548Minn. 3 6 - 2 - - 21 6 83 304Iowa - 1 - - - - 20 28 - 39Mo. 5 2 3 - 1 - 21 58 639 839N. Dak. - - - - 3 1 1 2 4 3S. Dak. - - - - - - 3 3 23 7Nebr. 1 3 - - - - 5 15 123 72Kans. 2 - - - 2 - 8 18 205 284
S. ATLANTIC 5 48 4 28 - 10 178 1,288 4,528 6,430Del. - - N N N N 1 5 103 147Md. 1 - - - - - 12 10 799 791D.C. - - - - - - 3 - 130 272Va. - 1 1 - - - 18 11 374 644W. Va. - - - - - - 1 - 87 81N.C. - - 2 3 - - N N 1,144 1,303S.C. - - - - - - 1 4 452 571Ga. 1 - - - - - 53 123 207 974Fla. 3 47 1 25 - 10 89 1,135 1,232 1,647
E.S. CENTRAL 2 6 - - - - 20 29 1,911 2,716Ky. - - - - - - N N 218 331Tenn. - 4 - - - - 11 14 709 776Ala. 1 2 - - - - 9 15 753 901Miss. 1 - - - - - - - 231 708
W.S. CENTRAL - 3 - 2 - - 19 16 4,015 4,096Ark. - 1 - - - - 13 13 320 388La. - - - - - - - - 1,478 919Okla. - - - - - - 6 3 302 269Tex. - 2 - 2 - - - - 1,915 2,520
MOUNTAIN 9 4 - 2 - - 64 118 848 1,074Mont. 1 - - - - - 1 2 8 10Idaho 1 1 - 1 - - 17 17 3 7Wyo. - - - - - - 1 2 3 5Colo. 4 1 - - - - 18 37 202 343N. Mex. - - - 1 - - 3 6 4 101Ariz. 1 1 N N N N - 27 616 427Utah 2 1 - - - - 24 14 12 25Nev. - - - - - - - 13 - 156
PACIFIC 19 15 1 1 - - 203 222 2,182 2,712Wash. 3 3 - - - - 13 3 265 247Oreg. 3 1 1 1 - - 30 26 87 73Calif. 10 11 - - - - 151 173 1,789 2,242Alaska - - - - - - 4 8 40 51Hawaii 3 - - - - - 5 12 1 99
Guam N N - - - - - - - -P.R. - - - - - - - 4 10 5V.I. - - - - - - - - - 7Amer. Samoa U U U U U U U U U UC.N.M.I. - U - U - U - U - U

Vol. 53 / No. 5 MMWR 113
N: Not notifiable. U: Unavailable. -: No reported cases.* Incidence data for reporting years 2003 and 2004 are provisional and cumulative (year-to-date).
TABLE II. (Continued) Provisional cases of selected notifiable diseases, United States, weeks ending February 7, 2004, and February 1, 2003(5th Week)*
Haemophilus influenzae, invasive Hepatitis
All ages Age <5 years (viral, acute), by type
All serotypes Serotype b Non-serotype b Unknown serotype ACum. Cum. Cum. Cum. Cum. Cum. Cum. Cum. Cum. Cum.
Reporting area 2004 2003 2004 2003 2004 2003 2004 2003 2004 2003
UNITED STATES 143 253 2 5 7 11 13 25 379 878
NEW ENGLAND 11 16 - - 1 - - 1 77 15Maine 1 - - - - - - - 4 -N.H. - 3 - - - - - - - -Vt. 1 4 - - - - - - 4 1Mass. 2 7 - - - - - 1 62 10R.I. 1 - - - - - - - - -Conn. 6 2 - - 1 - - - 7 4
MID. ATLANTIC 32 23 - - - - 4 3 53 85Upstate N.Y. 10 3 - - - - 1 1 5 3N.Y. City 3 7 - - - - 1 2 10 40N.J. 5 3 - - - - 1 - 9 13Pa. 14 10 - - - - 1 - 29 29
E.N. CENTRAL 25 19 - 1 3 1 4 4 31 62Ohio 16 3 - - - - 3 1 6 9Ind. 1 1 - - - - 1 - 3 1Ill. - 10 - - - - - 3 7 26Mich. 5 3 - 1 3 1 - - 13 18Wis. 3 2 - - - - - - 2 8
W.N. CENTRAL 2 10 - - - - - 3 14 14Minn. - 1 - - - - - - - -Iowa - - - - - - - - 4 5Mo. 1 8 - - - - - 3 4 3N. Dak. - - - - - - - - - -S. Dak. - - - - - - - - - -Nebr. 1 - - - - - - - 1 2Kans. - 1 - - - - - - 5 4
S. ATLANTIC 41 138 - 1 - 8 1 9 82 512Del. - - - - - - - - - 1Md. 14 7 - - - 1 - - 16 19D.C. - - - - - - - - - -Va. 7 2 - - - - - - 6 4W. Va. 1 - - - - - - - - -N.C. 1 1 - - - - - - 5 4S.C. - 1 - - - - - - - 6Ga. 7 4 - - - - 1 - 26 67Fla. 11 123 - 1 - 7 - 9 29 411
E.S. CENTRAL 9 11 - - - - 1 2 10 14Ky. - 1 - - - - - - - 1Tenn. 4 4 - - - - - 1 7 9Ala. 5 6 - - - - 1 1 - 3Miss. - - - - - - - - 3 1
W.S. CENTRAL 3 9 - - 1 1 - - 8 44Ark. - 1 - - - - - - 4 -La. - 4 - - - - - - - 6Okla. 3 4 - - 1 1 - - 3 -Tex. - - - - - - - - 1 38
MOUNTAIN 15 17 - 1 2 1 2 2 6 24Mont. - - - - - - - - - -Idaho - - - - - - - - 1 -Wyo. - - - - - - - - 1 -Colo. 3 3 - - - - 1 - 1 1N. Mex. 4 2 - - 1 - - - - -Ariz. 7 7 - 1 1 - - 1 - 15Utah 1 3 - - - - 1 1 3 3Nev. - 2 - - - 1 - - - 5
PACIFIC 5 10 2 2 - - 1 1 98 108Wash. 3 - 2 - - - 1 - 4 2Oreg. 2 4 - - - - - 1 7 8Calif. - 4 - 2 - - - - 86 96Alaska - - - - - - - - - 1Hawaii - 2 - - - - - - 1 1
Guam - - - - - - - - - -P.R. - - - - - - - - - 1V.I. - - - - - - - - - -Amer. Samoa U U U U U U U U U UC.N.M.I. - U - U - U - U - U

114 MMWR February 13, 2004
N: Not notifiable. U: Unavailable. -: No reported cases.* Incidence data for reporting years 2003 and 2004 are provisional and cumulative (year-to-date).
TABLE II. (Continued) Provisional cases of selected notifiable diseases, United States, weeks ending February 7, 2004, and February 1, 2003(5th Week)*
Hepatitis (viral, acute), by typeB C Legionellosis Listeriosis Lyme disease
Cum. Cum. Cum. Cum. Cum. Cum. Cum. Cum. Cum. Cum.Reporting area 2004 2003 2004 2003 2004 2003 2004 2003 2004 2003UNITED STATES 332 1,233 93 290 104 244 31 72 402 743
NEW ENGLAND 13 28 - - 1 4 1 2 5 30Maine - - - - - - - - - -N.H. - - - - - - - 1 - -Vt. 1 1 - - - 1 - - - 3Mass. 12 18 - - - 2 - 1 1 27R.I. - - - - - - - - - -Conn. - 9 U U 1 1 1 - 4 -
MID. ATLANTIC 31 103 11 7 21 21 6 11 337 541Upstate N.Y. 3 - 1 - 3 3 1 2 105 139N.Y. City - 48 - - - 4 - 4 - -N.J. 13 25 - - 4 2 3 1 31 116Pa. 15 30 10 7 14 12 2 4 201 286
E.N. CENTRAL 20 54 5 16 34 30 4 3 11 16Ohio 13 18 1 1 24 13 3 1 11 2Ind. - - - - 1 - - - - 1Ill. - - - 3 - 8 - 2 - -Mich. 7 25 4 12 9 9 - - - -Wis. - 11 - - - - 1 - U 13
W.N. CENTRAL 31 31 41 13 2 2 - 2 7 2Minn. 1 - - - - - - 1 - -Iowa - 1 - - - 1 - - 2 1Mo. 28 27 41 13 1 - - - 3 1N. Dak. - - - - - - - - - -S. Dak. - - - - 1 - - - - -Nebr. 1 2 - - - - - 1 - -Kans. 1 1 - - - 1 - - 2 -
S. ATLANTIC 141 799 24 84 23 164 10 42 33 124Del. - 1 - - 1 - N N - 11Md. 11 8 2 2 6 7 2 1 24 27D.C. - - - - - - - - - -Va. 6 4 1 - 1 2 - - - -W. Va. - - 1 - - - 1 - - -N.C. 23 12 1 1 4 2 3 1 5 5S.C. - - - - - - - 1 - -Ga. 40 138 4 2 - 2 2 1 - 1Fla. 61 636 15 79 11 151 2 38 4 80
E.S. CENTRAL 20 28 3 10 3 1 1 2 - 6Ky. 3 2 2 2 - - 1 - - -Tenn. 6 4 1 2 2 1 - - - 1Ala. 2 11 - - 1 - - 2 - -Miss. 9 11 - 6 - - - - - 5
W.S. CENTRAL 4 66 3 149 1 13 - 1 - 12Ark. - 5 - 1 - - - - - -La. 4 14 3 19 - - - - - 2Okla. - 2 - - 1 2 - - - -Tex. - 45 - 129 - 11 - 1 - 10
MOUNTAIN 10 54 1 3 6 4 - 5 1 2Mont. - 2 - - - - - 1 - -Idaho 1 1 - - 1 1 - - - 1Wyo. 1 1 - - 2 - - - - -Colo. 4 7 - 2 1 - - 2 - -N. Mex. - 3 - - - - - - - -Ariz. - 30 1 - - 2 - 2 - -Utah 4 4 - - 2 1 - - 1 -Nev. - 6 - 1 - - - - - 1
PACIFIC 62 70 5 8 13 5 9 4 8 10Wash. 4 1 1 - 2 - 1 - 1 -Oreg. 11 14 1 2 N N 3 - 1 3Calif. 47 53 2 5 11 5 5 4 6 7Alaska - - - - - - - - - -Hawaii - 2 1 1 - - - - N N
Guam - - - - - - - - - -P.R. 1 5 - - - - - - N NV.I. - - - - - - - - - -Amer. Samoa U U U U U U U U U UC.N.M.I. - U - U - U - U - U

Vol. 53 / No. 5 MMWR 115
N: Not notifiable. U: Unavailable. - : No reported cases.* Incidence data for reporting years 2003 and 2004 are provisional and cumulative (year-to-date).
TABLE II. (Continued) Provisional cases of selected notifiable diseases, United States, weeks ending February 7, 2004, and February 1, 2003(5th Week)*
Meningococcal Rocky MountainMalaria disease Pertussis Rabies, animal spotted fever
Cum. Cum. Cum. Cum. Cum. Cum. Cum. Cum. Cum. Cum.Reporting area 2004 2003 2004 2003 2004 2003 2004 2003 2004 2003
UNITED STATES 71 171 169 236 515 596 206 490 50 43
NEW ENGLAND 8 4 4 7 184 82 16 40 3 -Maine - 1 - - - - 1 2 - -N.H. - - - - - - - 2 - -Vt. - - 1 - 5 14 3 2 - -Mass. 6 3 3 6 179 67 7 15 3 -R.I. - - - - - - - - - -Conn. 2 - - 1 - 1 5 19 - -
MID. ATLANTIC 9 16 22 18 142 53 26 60 3 5Upstate N.Y. 4 2 6 2 96 20 26 18 - -N.Y. City 2 8 2 5 - - - 1 1 -N.J. - 2 2 2 8 12 - 15 - 4Pa. 3 4 12 9 38 21 - 26 2 1
E.N. CENTRAL 7 10 30 22 61 45 1 1 1 1Ohio 2 2 16 6 50 32 1 - 1 1Ind. - - 2 4 - - - - - -Ill. - 5 1 3 - - - - - -Mich. 2 2 9 5 10 4 - 1 - -Wis. 3 1 2 4 1 9 - - - -
W.N. CENTRAL 7 4 9 9 32 16 24 47 1 1Minn. 4 2 - 1 - - 6 3 - -Iowa - 2 2 2 5 3 6 4 - 1Mo. 2 - 2 5 23 9 2 - 1 -N. Dak. - - - - - - 5 5 - -S. Dak. - - 1 - - - - 6 - -Nebr. - - - - - - - 3 - -Kans. 1 - 4 1 4 4 5 26 - -
S. ATLANTIC 31 109 32 119 23 156 105 315 38 33Del. - - - 4 1 - 1 - - -Md. 10 10 3 2 8 10 12 28 2 5D.C. - - - - 1 - - - - -Va. - 1 2 2 3 1 - 33 - -W. Va. - 1 3 - - - 6 4 - -N.C. 1 2 3 3 - 17 49 46 35 10S.C. 1 - 1 - 2 - 7 11 - -Ga. 2 3 4 1 - 14 30 35 1 -Fla. 17 92 16 107 8 114 - 158 - 18
E.S. CENTRAL 1 2 7 7 8 12 8 10 3 1Ky. - - - - - 2 1 3 - -Tenn. - - 4 2 5 3 5 6 1 1Ala. 1 2 1 2 1 7 2 1 1 -Miss. - - 2 3 2 - - - 1 -
W.S. CENTRAL 1 8 9 19 - - 11 5 - 2Ark. 1 - 2 1 - - 4 - - -La. - 1 3 5 - - - - - -Okla. - - 1 2 - - 7 5 - -Tex. - 7 3 11 - - - - - 2
MOUNTAIN 1 2 7 5 36 68 8 7 - -Mont. - - - - 3 - - 1 - -Idaho - - 1 - 6 2 - - - -Wyo. - - 1 - 2 - - - - -Colo. - 1 4 - 20 28 - - - -N. Mex. 1 - - 1 - 10 - - - -Ariz. - 1 1 3 3 15 8 6 - -Utah - - - - 2 8 - - - -Nev. - - - 1 - 5 - - - -
PACIFIC 6 16 49 30 29 164 7 5 1 -Wash. - 2 3 2 13 2 - - - -Oreg. - 4 9 7 16 17 - - - -Calif. 6 10 35 20 - 145 7 4 1 -Alaska - - - - - - - 1 - -Hawaii - - 2 1 - - - - - -
Guam - - - - - - - - - -P.R. - - - 1 - - 7 3 N NV.I. - - - - - - - - - -Amer. Samoa U U U U U U U U U UC.N.M.I. - U - U - U - U - U

116 MMWR February 13, 2004
N: Not notifiable. U: Unavailable. - : No reported cases.* Incidence data for reporting years 2003 and 2004 are provisional and cumulative (year-to-date).
TABLE II. (Continued) Provisional cases of selected notifiable diseases, United States, weeks ending February 7, 2004, and February 1, 2003(5th Week)*
Streptococcus pneumoniae, invasiveStreptococcal disease, Drug resistant,
Salmonellosis Shigellosis invasive, group A all ages Age <5 yearsCum. Cum. Cum. Cum. Cum. Cum. Cum. Cum. Cum. Cum.
Reporting area 2004 2003 2004 2003 2004 2003 2004 2003 2004 2003
UNITED STATES 1,799 6,823 681 4,432 384 700 298 773 26 45
NEW ENGLAND 83 87 22 28 13 42 - 12 - -Maine 3 3 - 1 1 - - - - -N.H. - 4 - - - 1 - - N NVt. 3 1 - - - 2 - 2 - -Mass. 58 60 17 20 10 22 N N N NR.I. 4 4 - 2 2 - - - - -Conn. 15 15 5 5 - 17 - 10 U U
MID. ATLANTIC 186 282 80 164 47 93 15 12 6 6Upstate N.Y. 38 23 34 12 19 22 5 4 2 5N.Y. City 49 99 17 46 1 14 U U U UN.J. 31 62 12 53 7 18 N N N NPa. 68 98 17 53 20 39 10 8 4 1
E.N. CENTRAL 260 362 69 149 78 125 83 41 19 30Ohio 90 121 24 28 39 30 73 41 16 21Ind. 17 11 3 5 1 2 10 - 3 1Ill. 63 133 22 77 - 41 - - - -Mich. 51 50 12 24 35 35 N N N NWis. 39 47 8 15 3 17 N N - 8
W.N. CENTRAL 121 113 33 76 25 21 25 29 - 2Minn. 21 28 6 3 - - - - - 1Iowa 24 24 2 2 N N N N N NMo. 38 34 9 37 8 10 1 - - -N. Dak. 3 2 1 - 2 - - - - 1S. Dak. 5 5 1 4 3 3 - - - -Nebr. 10 8 1 22 1 4 - - N NKans. 20 12 13 8 11 4 24 29 N N
S. ATLANTIC 537 5,133 252 3,372 115 265 158 654 1 -Del. - 6 1 47 - 1 - - N NMd. 42 58 16 91 18 17 - 1 - -D.C. - - 4 - - - - - 1 -Va. 38 26 7 18 5 1 N N N NW. Va. 1 - - - 1 - 4 3 - -N.C. 64 136 24 92 11 8 N N U US.C. 9 38 15 11 1 1 9 9 N NGa. 128 200 55 264 53 6 64 30 N NFla. 255 4,669 130 2,849 26 231 81 611 N N
E.S. CENTRAL 105 167 30 82 17 7 8 9 - -Ky. 7 21 1 10 5 2 3 - N NTenn. 27 53 16 19 12 5 5 9 N NAla. 49 61 10 37 - - - - N NMiss. 22 32 3 16 - - - - - -
W.S. CENTRAL 47 196 41 255 13 54 4 14 - 6Ark. 19 18 5 1 1 1 1 - - -La. 4 32 6 39 - - 3 14 - 1Okla. 19 5 24 38 7 5 N N - 2Tex. 5 141 6 177 5 48 N N - 3
MOUNTAIN 98 128 44 69 19 60 5 2 - 1Mont. 6 4 1 - - - - - - -Idaho 22 9 - 1 1 4 N N N NWyo. 2 2 1 1 2 - 3 - - -Colo. 16 52 7 17 6 13 - - - -N. Mex. 18 10 16 21 8 10 2 2 - -Ariz. 21 25 12 25 - 31 - - N NUtah 13 11 7 2 2 2 - - - 1Nev. - 15 - 2 - - - - - -
PACIFIC 362 355 110 237 57 33 - - - -Wash. 22 15 5 - - - - - N NOreg. 29 16 5 6 N N N N N NCalif. 273 298 94 225 39 20 N N N NAlaska 13 11 - 2 - - - - N NHawaii 25 15 6 4 18 13 - - - -
Guam - - - - - - - - - -P.R. 5 20 1 - N N N N N NV.I. - - - - - - - - - -Amer. Samoa U U U U U U U U U UC.N.M.I. - U - U - U - U - U
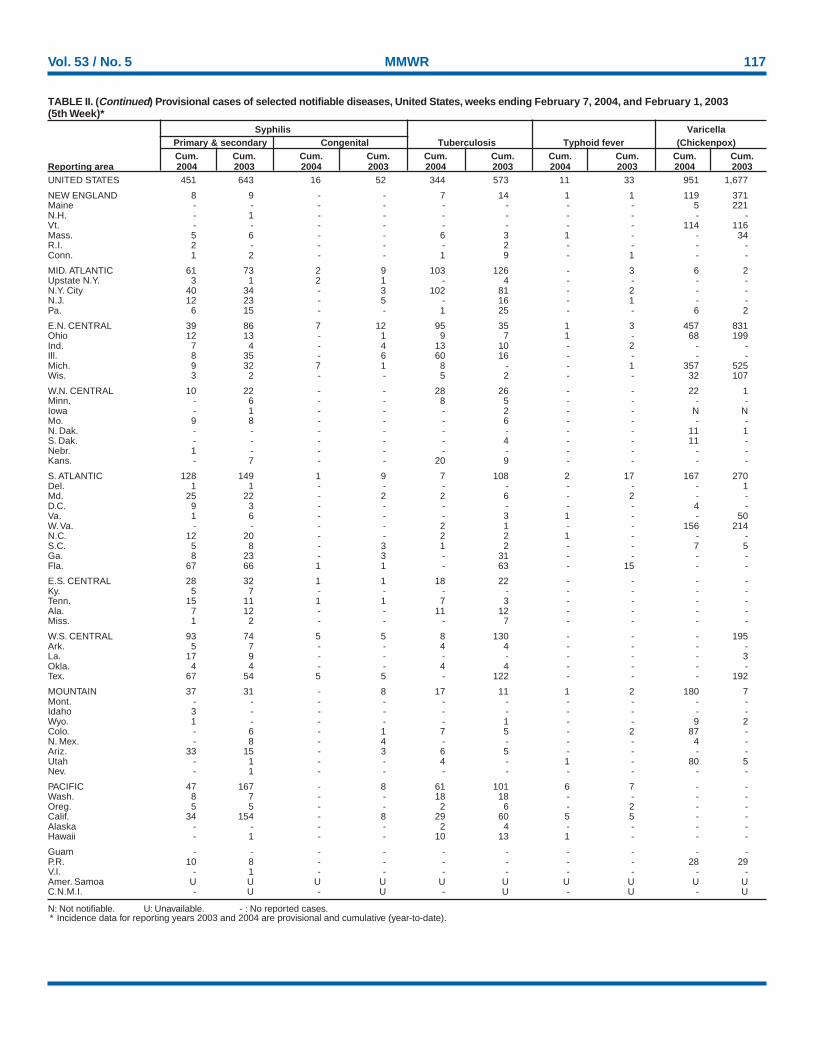
Vol. 53 / No. 5 MMWR 117
N: Not notifiable. U: Unavailable. - : No reported cases.* Incidence data for reporting years 2003 and 2004 are provisional and cumulative (year-to-date).
TABLE II. (Continued) Provisional cases of selected notifiable diseases, United States, weeks ending February 7, 2004, and February 1, 2003(5th Week)*
Syphilis VaricellaPrimary & secondary Congenital Tuberculosis Typhoid fever (Chickenpox)Cum. Cum. Cum. Cum. Cum. Cum. Cum. Cum. Cum. Cum.
Reporting area 2004 2003 2004 2003 2004 2003 2004 2003 2004 2003UNITED STATES 451 643 16 52 344 573 11 33 951 1,677
NEW ENGLAND 8 9 - - 7 14 1 1 119 371Maine - - - - - - - - 5 221N.H. - 1 - - - - - - - -Vt. - - - - - - - - 114 116Mass. 5 6 - - 6 3 1 - - 34R.I. 2 - - - - 2 - - - -Conn. 1 2 - - 1 9 - 1 - -
MID. ATLANTIC 61 73 2 9 103 126 - 3 6 2Upstate N.Y. 3 1 2 1 - 4 - - - -N.Y. City 40 34 - 3 102 81 - 2 - -N.J. 12 23 - 5 - 16 - 1 - -Pa. 6 15 - - 1 25 - - 6 2
E.N. CENTRAL 39 86 7 12 95 35 1 3 457 831Ohio 12 13 - 1 9 7 1 - 68 199Ind. 7 4 - 4 13 10 - 2 - -Ill. 8 35 - 6 60 16 - - - -Mich. 9 32 7 1 8 - - 1 357 525Wis. 3 2 - - 5 2 - - 32 107
W.N. CENTRAL 10 22 - - 28 26 - - 22 1Minn. - 6 - - 8 5 - - - -Iowa - 1 - - - 2 - - N NMo. 9 8 - - - 6 - - - -N. Dak. - - - - - - - - 11 1S. Dak. - - - - - 4 - - 11 -Nebr. 1 - - - - - - - - -Kans. - 7 - - 20 9 - - - -
S. ATLANTIC 128 149 1 9 7 108 2 17 167 270Del. 1 1 - - - - - - - 1Md. 25 22 - 2 2 6 - 2 - -D.C. 9 3 - - - - - - 4 -Va. 1 6 - - - 3 1 - - 50W. Va. - - - - 2 1 - - 156 214N.C. 12 20 - - 2 2 1 - - -S.C. 5 8 - 3 1 2 - - 7 5Ga. 8 23 - 3 - 31 - - - -Fla. 67 66 1 1 - 63 - 15 - -
E.S. CENTRAL 28 32 1 1 18 22 - - - -Ky. 5 7 - - - - - - - -Tenn. 15 11 1 1 7 3 - - - -Ala. 7 12 - - 11 12 - - - -Miss. 1 2 - - - 7 - - - -
W.S. CENTRAL 93 74 5 5 8 130 - - - 195Ark. 5 7 - - 4 4 - - - -La. 17 9 - - - - - - - 3Okla. 4 4 - - 4 4 - - - -Tex. 67 54 5 5 - 122 - - - 192
MOUNTAIN 37 31 - 8 17 11 1 2 180 7Mont. - - - - - - - - - -Idaho 3 - - - - - - - - -Wyo. 1 - - - - 1 - - 9 2Colo. - 6 - 1 7 5 - 2 87 -N. Mex. - 8 - 4 - - - - 4 -Ariz. 33 15 - 3 6 5 - - - -Utah - 1 - - 4 - 1 - 80 5Nev. - 1 - - - - - - - -
PACIFIC 47 167 - 8 61 101 6 7 - -Wash. 8 7 - - 18 18 - - - -Oreg. 5 5 - - 2 6 - 2 - -Calif. 34 154 - 8 29 60 5 5 - -Alaska - - - - 2 4 - - - -Hawaii - 1 - - 10 13 1 - - -
Guam - - - - - - - - - -P.R. 10 8 - - - - - - 28 29V.I. - 1 - - - - - - - -Amer. Samoa U U U U U U U U U UC.N.M.I. - U - U - U - U - U

118 MMWR February 13, 2004
U: Unavailable. -:No reported cases.* Mortality data in this table are voluntarily reported from 122 cities in the United States, most of which have populations of >100,000. A death is reported by the place of its
occurrence and by the week that the death certificate was filed. Fetal deaths are not included.† Pneumonia and influenza.§ Because of changes in reporting methods in this Pennsylvania city, these numbers are partial counts for the current week. Complete counts will be available in 4 to 6 weeks.¶ Total includes unknown ages.
NEW ENGLAND 543 386 96 46 7 8 73Boston, Mass. 158 102 30 17 3 6 20Bridgeport, Conn. 37 26 7 3 1 - 9Cambridge, Mass. 22 14 6 2 - - 5Fall River, Mass. 32 24 5 3 - - 5Hartford, Conn. U U U U U U ULowell, Mass. 27 17 6 4 - - 1Lynn, Mass. 13 10 1 2 - - 2New Bedford, Mass. 43 35 6 2 - - 4New Haven, Conn. 30 24 3 1 - 2 6Providence, R.I. 62 48 10 2 2 - 4Somerville, Mass. U U U U U U USpringfield, Mass. 36 25 8 2 1 - 7Waterbury, Conn. 19 10 5 4 - - 1Worcester, Mass. 64 51 9 4 - - 9
MID. ATLANTIC 2,191 1,598 415 129 26 22 168Albany, N.Y. 47 34 12 1 - - 3Allentown, Pa. 24 20 3 1 - - 4Buffalo, N.Y. 90 62 20 5 1 2 9Camden, N.J. 29 14 9 4 - 2 3Elizabeth, N.J. 21 17 3 - 1 - -Erie, Pa. 39 34 4 1 - - 2Jersey City, N.J. 68 49 16 3 - - -New York City, N.Y. 1,045 754 196 68 11 15 75Newark, N.J. 50 23 20 5 2 - 5Paterson, N.J. 30 14 10 1 4 1 3Philadelphia, Pa. 281 207 53 19 2 - 15Pittsburgh, Pa.§ 32 23 8 1 - - 6Reading, Pa. 28 24 2 2 - - 6Rochester, N.Y. 156 130 19 6 1 - 13Schenectady, N.Y. 24 23 1 - - - 2Scranton, Pa. 26 21 3 1 1 - 3Syracuse, N.Y. 125 96 17 7 3 2 15Trenton, N.J. 41 28 12 1 - - -Utica, N.Y. 13 11 2 - - - 2Yonkers, N.Y. 22 14 5 3 - - 2
E.N. CENTRAL 2,360 1,642 484 128 55 51 164Akron, Ohio 45 31 11 2 1 - 5Canton, Ohio 46 32 9 3 - 2 7Chicago, Ill. 355 224 80 35 8 8 26Cincinnati, Ohio 85 59 20 2 3 1 5Cleveland, Ohio 276 200 51 12 4 9 15Columbus, Ohio 195 138 47 3 3 4 15Dayton, Ohio 165 118 32 6 6 3 19Detroit, Mich. 200 112 51 23 8 6 7Evansville, Ind. 48 40 4 2 - 2 4Fort Wayne, Ind. 61 44 13 2 1 1 2Gary, Ind. 21 11 6 1 3 - -Grand Rapids, Mich. 90 74 11 2 1 2 4Indianapolis, Ind. 243 164 53 9 12 5 13Lansing, Mich. 51 37 11 2 1 - 3Milwaukee, Wis. 137 96 36 4 - 1 13Peoria, Ill. 39 26 6 4 1 2 5Rockford, Ill. 51 42 6 1 - 2 5South Bend, Ind. 69 51 12 5 1 - 5Toledo, Ohio 110 83 20 4 2 1 10Youngstown, Ohio 73 60 5 6 - 2 1
W.N. CENTRAL 611 422 129 32 14 14 75Des Moines, Iowa 73 52 15 5 - 1 9Duluth, Minn. 36 30 4 - - 2 6Kansas City, Kans. 36 24 8 2 2 - 7Kansas City, Mo. 96 70 17 5 3 1 4Lincoln, Nebr. 45 33 8 3 - 1 9Minneapolis, Minn. 79 59 13 3 2 2 8Omaha, Nebr. 76 54 15 5 1 1 9St. Louis, Mo. 2 2 - - - - 2St. Paul, Minn. 62 41 17 2 1 1 9Wichita, Kans. 106 57 32 7 5 5 12
S. ATLANTIC 1,498 952 347 117 45 37 104Atlanta, Ga. 208 121 59 20 7 1 11Baltimore, Md. 194 126 38 23 7 - 24Charlotte, N.C. 138 90 33 7 4 4 16Jacksonville, Fla. 213 135 50 11 8 9 4Miami, Fla. 145 87 29 23 4 2 10Norfolk, Va. 62 36 16 2 2 6 3Richmond, Va. 75 41 23 4 3 4 6Savannah, Ga. 68 42 15 4 3 4 8St. Petersburg, Fla. 65 47 14 2 1 1 2Tampa, Fla. 207 150 40 11 2 4 15Washington, D.C. 99 57 27 9 4 2 3Wilmington, Del. 24 20 3 1 - - 2
E.S. CENTRAL 860 581 201 54 11 11 79Birmingham, Ala. 218 154 48 12 - 2 26Chattanooga, Tenn. 98 61 29 6 1 1 10Knoxville, Tenn. 117 77 23 11 5 1 1Lexington, Ky. 107 77 25 1 1 3 10Memphis, Tenn. U U U U U U UMobile, Ala. 101 60 27 11 1 2 5Montgomery, Ala. 83 55 16 10 2 - 9Nashville, Tenn. 136 97 33 3 1 2 18
W.S. CENTRAL 1,584 1,014 338 115 51 66 96Austin, Tex. 81 55 16 9 1 - 5Baton Rouge, La. 47 31 5 6 1 4 2Corpus Christi, Tex. 62 40 11 5 4 2 4Dallas, Tex. 228 143 49 17 8 11 13El Paso, Tex. 110 86 13 6 2 3 5Ft. Worth, Tex. 149 88 42 5 3 11 10Houston, Tex. 391 226 98 31 13 23 22Little Rock, Ark. 70 46 16 2 3 3 7New Orleans, La. 39 17 13 7 2 - -San Antonio, Tex. 227 152 42 17 11 5 18Shreveport, La. 47 37 5 3 - 2 4Tulsa, Okla. 133 93 28 7 3 2 6
MOUNTAIN 869 583 182 61 20 23 76Albuquerque, N.M. 138 88 33 9 3 5 12Boise, Idaho 45 28 13 2 1 1 2Colo. Springs, Colo. 83 58 14 5 5 1 -Denver, Colo. 108 70 19 9 3 7 13Las Vegas, Nev. 271 178 60 24 3 6 24Ogden, Utah 40 35 5 - - - 5Phoenix, Ariz. U U U U U U UPueblo, Colo. 31 25 2 2 2 - 6Salt Lake City, Utah 153 101 36 10 3 3 14Tucson, Ariz. U U U U U U U
PACIFIC 3,253 2,297 630 201 77 48 359Berkeley, Calif. 19 11 5 3 - - 1Fresno, Calif. 85 63 14 6 1 1 3Glendale, Calif. 73 61 10 - 2 - 15Honolulu, Hawaii 101 76 17 4 3 1 9Long Beach, Calif. 90 67 15 2 5 1 13Los Angeles, Calif. 1,755 1,238 328 122 42 25 208Pasadena, Calif. U U U U U U UPortland, Oreg. 160 117 29 9 1 4 15Sacramento, Calif. 204 137 51 8 5 3 26San Diego, Calif. 229 157 45 15 6 6 27San Francisco, Calif. U U U U U U USan Jose, Calif. 217 147 48 13 5 4 22Santa Cruz, Calif. 29 21 6 2 - - 2Seattle, Wash. 116 78 27 8 3 - 7Spokane, Wash. 62 42 15 4 - 1 3Tacoma, Wash. 113 82 20 5 4 2 8
TOTAL 13,769¶ 9,475 2,822 883 306 280 1,194
TABLE III. Deaths in 122 U.S. cities,* week ending February 7, 2004 (5th Week)All causes, by age (years) All causes, by age (years)
All P&I† All P&I†
Reporting Area Ages >65 45-64 25-44 1-24 <1 Total Reporting Area Ages >65 45-64 25-44 1-24 <1 Total

Vol. 53 / No. 5 MMWR 119

MMWR
The Morbidity and Mortality Weekly Report (MMWR) Series is prepared by the Centers for Disease Control and Prevention (CDC) and is available free of chargein electronic format and on a paid subscription basis for paper copy. To receive an electronic copy each week, send an e-mail message to [email protected]. Thebody content should read SUBscribe mmwr-toc. Electronic copy also is available from CDC’s World-Wide Web server at http://www.cdc.gov/mmwr or from CDC’sfile transfer protocol server at ftp://ftp.cdc.gov/pub/publications/mmwr. To subscribe for paper copy, contact Superintendent of Documents, U.S. GovernmentPrinting Office, Washington, DC 20402; telephone 202-512-1800.
Data in the weekly MMWR are provisional, based on weekly reports to CDC by state health departments. The reporting week concludes at close of business onFriday; compiled data on a national basis are officially released to the public on the following Friday. Address inquiries about the MMWR Series, including materialto be considered for publication, to Editor, MMWR Series, Mailstop C-08, CDC, 1600 Clifton Rd., N.E., Atlanta, GA 30333; telephone 888-232-3228.
All material in the MMWR Series is in the public domain and may be used and reprinted without permission; citation as to source, however, is appreciated.
All MMWR references are available on the Internet at http://www.cdc.gov/mmwr. Use the search function to find specific articles.
Use of trade names and commercial sources is for identification only and does not imply endorsement by the U.S. Department of Health and Human Services.
References to non-CDC sites on the Internet are provided as a service to MMWR readers and do not constitute or imply endorsement of these organizations ortheir programs by CDC or the U.S. Department of Health and Human Services. CDC is not responsible for the content of these sites. URL addresses listed inMMWR were current as of the date of publication.
✩ U.S. Government Printing Office: 2004-633-140/69170 Region IV ISSN: 0149-2195
120 February 13, 2004