morbidity and mortality weekly report · morbidity and mortality weekly report world tb day, ......
TRANSCRIPT
Weekly March 21, 2003 / Vol. 52 / No. 11
depardepardepardepardepartment of health and human sertment of health and human sertment of health and human sertment of health and human sertment of health and human servicesvicesvicesvicesvicesCenters for Disease Control and PreventionCenters for Disease Control and PreventionCenters for Disease Control and PreventionCenters for Disease Control and PreventionCenters for Disease Control and Prevention
Morbidity and Mortality Weekly Report
World TB Day, March 24, 2003World TB Day is an annual event that commemorates
the date in 1882 when Robert Koch announced his dis-covery of the tuberculosis (TB) bacillus. TB is one of theleading causes of death from infectious diseases world-wide. An estimated 2 billion persons—one third of theworld’s population—are infected with the bacteria thatcause TB, and approximately 2 million persons die eachyear from TB. After years of decline in the United States,the number of reported TB cases increased 20% during1985–1992. This resurgence was associated with dete-rioration of the infrastructure for TB services, the humanimmunodeficiency virus (HIV) epidemic, immigrationof persons from countries where TB is endemic, TB trans-mission in congregate settings (e.g., hospitals and pris-ons), and development of multidrug-resistant TB.However, a renewed emphasis on TB control and pre-vention in the 1990s resulted in substantial declines inthe disease. Provisional data indicate that 2002 will markthe 10th consecutive year of declining TB cases reportedin the United States.
CDC is committed to the goal of eliminating TB inthe United States. However, achieving this goal will notbe possible without strengthening collaborations withnational and international health partners to reach thoseat highest risk for TB and identifying innovative strate-gies to improve testing and treatment among high-riskpopulations. One important CDC effort has been theestablishment of a binational TB referral system for TBpatients who cross the United States–Mexico border.Other efforts include supporting public health actionthrough prompt and accurate TB surveillance, assistingwith the control of domestic outbreaks, and contribut-ing to the global effort against TB. Additional informa-tion about World TB Day and CDC’s TB eliminationactivities is available at http://www.cdc.gov/nchstp/tb/worldtb2003/default.htm.
Trends in Tuberculosis Morbidity —United States, 1992–2002
During 2002, a total of 15,078 TB cases were reported toCDC, representing a 5.7% decline from 2001, a 43.5%decline from the 1992 peak of the TB resurgence, and thelowest recorded TB rate in the United States since reportingbegan in 1953. Declines have occurred since 1992 in all agegroups, racial/ethnic populations, and regions of the UnitedStates. Despite this progress, the 2002 rate of 5.2 per 100,000population remained higher than the 2000 interim goal of3.5 set as part of the national strategic plan for TB elimina-tion (<1 case per 1,000,000 by 2010) (1). This report sum-marizes data from the national TB surveillance system for 2002and describes trends over the past decade. Overall nationaldeclines in TB incidence mask substantial disparities betweenrates in the majority of U.S. residents and rates in the twopopulations, foreign-born persons and U.S.-born non-Hispanic blacks, which now account for approximately threefourths of TB cases. Further progress toward TB elimination inthe United States will depend on 1) domestic programs that pro-vide services to foreign-born persons with latent TB infection, 2)collaborative efforts that reduce the burden of TB disease glo-bally, and 3) intensified TB-control efforts that address higherTB rates in the U.S.-born non-Hispanic black population.
INSIDE
222 Transmission of Mycobacterium Tuberculosis Associatedwith Failed Completion of Treatment for Latent Tuber-culosis Infection — Chickasaw County, Mississippi, June1999–March 2002
224 Update: Influenza Activity — United States, 2002–03Season
226 Outbreak of Severe Acute Respiratory Syndrome —Worldwide, 2003
228 Absence of Transmission of the d9 Measles Virus —Region of the Americas, November 2002–March 2003
229 Notices to Readers
218 MMWR March 21, 2003
SUGGESTED CITATIONCenters for Disease Control and Prevention. [ArticleTitle]. MMWR 2003;52:[inclusive page numbers].
Centers for Disease Control and Prevention
Julie L. Gerberding, M.D., M.P.H.Director
David W. Fleming, M.D.Deputy Director for Public Health Science
Dixie E. Snider, Jr., M.D., M.P.H.Associate Director for Science
Epidemiology Program Office
Stephen B. Thacker, M.D., M.Sc.Director
Office of Scientific and Health Communications
John W. Ward, M.D.Director
Editor, MMWR Series
Suzanne M. Hewitt, M.P.A.Managing Editor, MMWR Series
David C. Johnson(Acting) Lead Technical Writer/Editor
Jude C. RutledgeTeresa F. Rutledge
Jeffrey D. Sokolow, M.A.Writers/Editors
Lynda G. CupellMalbea A. Heilman
Visual Information Specialists
Quang M. DoanErica R. Shaver
Information Technology Specialists
Division of Public Health Surveillanceand Informatics
Notifiable Disease Morbidity and 122 Cities Mortality DataRobert F. Fagan
Deborah A. AdamsFelicia J. ConnorLateka Dammond
Patsy A. HallPearl C. Sharp
The MMWR series of publications is published by theEpidemiology Program Office, Centers for Disease Controland Prevention (CDC), U.S. Department of Health andHuman Services, Atlanta, GA 30333.
The 50 states and the District of Columbia report to thenational TB surveillance system by using a standard case defi-nition and report form (2). Completeness of reporting to thenational system is estimated to be >95% (3). Data were ana-lyzed for cases reported during 1992–2002 by using casereports updated as of February 18, 2003. A U.S.-born personwas defined as someone born in the United States or its asso-ciated jurisdictions, or someone born in a foreign countrybut having at least one U.S.-born parent; others were classi-fied as foreign-born. U.S.-born and foreign-born populationcounts in 1992 were obtained from postcensus estimates (4).Overall U.S.-born and foreign-born population counts for2002 were based on an extrapolation from the April 2000U.S. Census, and the distribution of racial/ethnic groups wasestimated from the March 2000 Current Population Survey (5).
In 2002, the overall TB case rate of 5.2 represents a declineof 7.1% from 2001 and 50.5% from 1992. During 1992–2002, case rates declined in all but three states (Table 1). Fivestates (California, Florida, Illinois, New York, and Texas)accounted for 52.5% of cases and 68.3% of the overalldecrease in the number of cases; case rates in these statesdeclined an average of approximately 50% during 1992–2002.The proportion of patients with multidrug-resistant TB (i.e.,resistance to at least isoniazid and rifampin) decreased from486 (2.7%) of 17,690 culture-positive cases with initial sus-ceptibility results in 1993 (the first year for which data werecollected) to 138 (1.3%) of 10,601 cases in 2002.
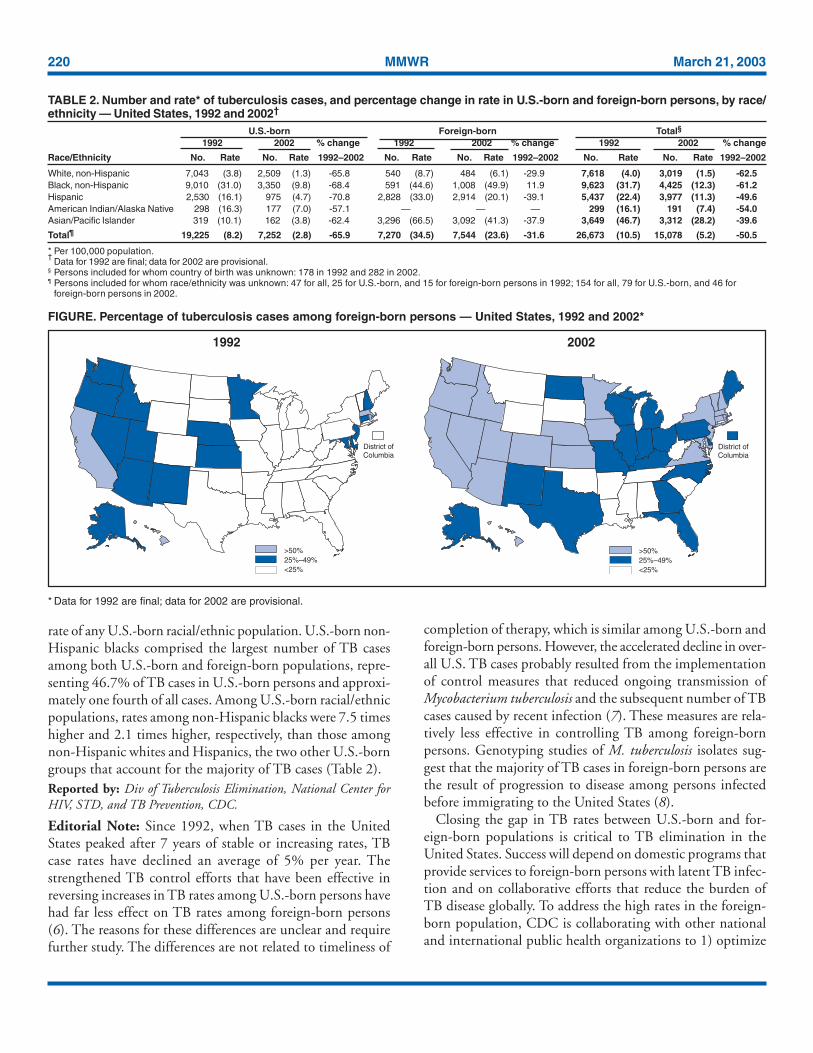
During 1992–2002, rates declined in both the U.S.-bornand the foreign-born populations. However, the decline wassubstantially less among foreign-born populations (Table 2),and the ratio of foreign-born to U.S.-born rates doubled, from4.2 in 1992 to 8.4 in 2002. In 2002, for the first time, TBcases among foreign-born persons accounted for the majority(51.0%) of TB cases in the United States. The number ofstates with >50% of cases among foreign-born persons in-creased from four in 1992 to 22 in 2002 (Figure). In sevenstates, approximately 70% of cases were among foreign-bornpersons (New Hampshire [79.0%], Idaho [76.9%], Minne-sota [76.4%], California [75.8%], Massachusetts [75.7%],Hawaii [74.3%], and Colorado [70.2%]. As in 1992, the mostcommon birth countries for foreign-born persons with TB in2002 were Mexico (24.8%), the Philippines (11.3%), Viet-nam (8.6%), India (7.6%), China (4.5%), Haiti (3.4%), andSouth Korea (2.7%). The proportion of patients who com-pleted recommended treatment within 1 year was 81.0% inthe U.S.-born and 79.2% in the foreign-born populations in1999 (the most recent year for which these outcome data wereavailable).
Despite a 68.4% decline in rates from 1992, U.S.-born non-Hispanic blacks in 2002 continued to have the highest TB
Vol. 52 / No. 11 MMWR 219
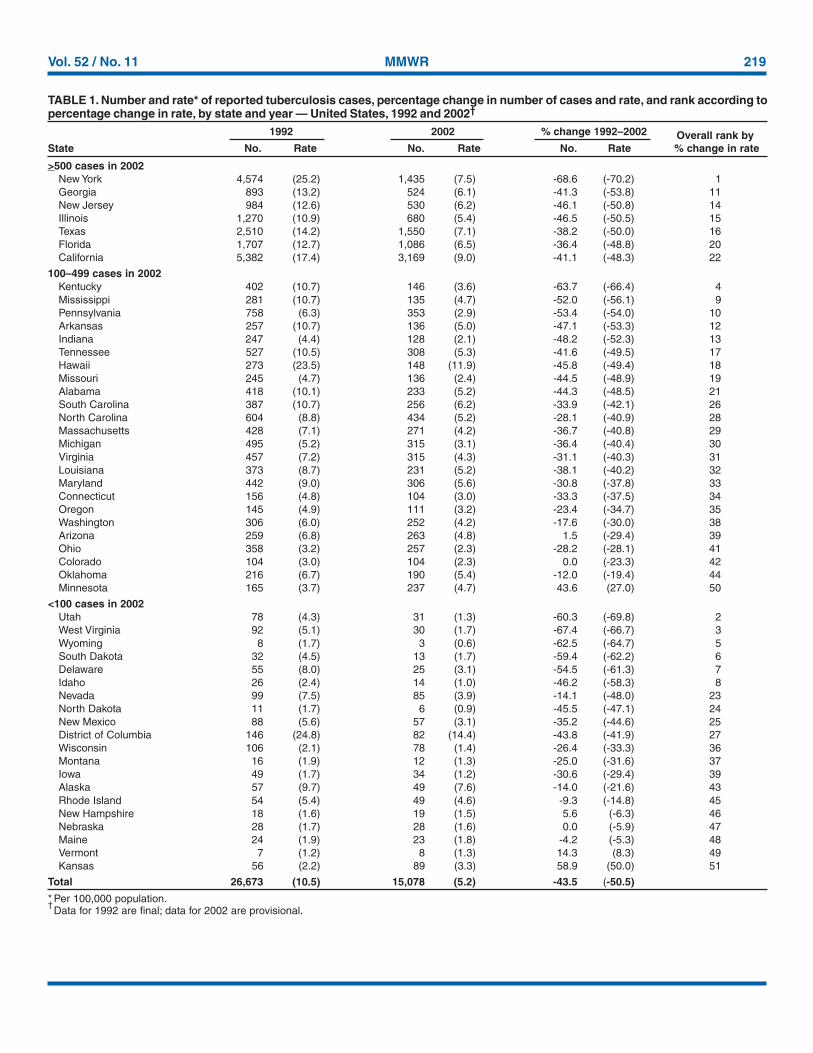
TABLE 1. Number and rate* of reported tuberculosis cases, percentage change in number of cases and rate, and rank according topercentage change in rate, by state and year — United States, 1992 and 2002†
1992 2002 % change 1992–2002 Overall rank byState No. Rate No. Rate No. Rate % change in rate
>500 cases in 2002New York 4,574 (25.2) 1,435 (7.5) -68.6 (-70.2) 1Georgia 893 (13.2) 524 (6.1) -41.3 (-53.8) 11New Jersey 984 (12.6) 530 (6.2) -46.1 (-50.8) 14Illinois 1,270 (10.9) 680 (5.4) -46.5 (-50.5) 15Texas 2,510 (14.2) 1,550 (7.1) -38.2 (-50.0) 16Florida 1,707 (12.7) 1,086 (6.5) -36.4 (-48.8) 20California 5,382 (17.4) 3,169 (9.0) -41.1 (-48.3) 22
100–499 cases in 2002Kentucky 402 (10.7) 146 (3.6) -63.7 (-66.4) 4Mississippi 281 (10.7) 135 (4.7) -52.0 (-56.1) 9Pennsylvania 758 (6.3) 353 (2.9) -53.4 (-54.0) 10Arkansas 257 (10.7) 136 (5.0) -47.1 (-53.3) 12Indiana 247 (4.4) 128 (2.1) -48.2 (-52.3) 13Tennessee 527 (10.5) 308 (5.3) -41.6 (-49.5) 17Hawaii 273 (23.5) 148 (11.9) -45.8 (-49.4) 18Missouri 245 (4.7) 136 (2.4) -44.5 (-48.9) 19Alabama 418 (10.1) 233 (5.2) -44.3 (-48.5) 21South Carolina 387 (10.7) 256 (6.2) -33.9 (-42.1) 26North Carolina 604 (8.8) 434 (5.2) -28.1 (-40.9) 28Massachusetts 428 (7.1) 271 (4.2) -36.7 (-40.8) 29Michigan 495 (5.2) 315 (3.1) -36.4 (-40.4) 30Virginia 457 (7.2) 315 (4.3) -31.1 (-40.3) 31Louisiana 373 (8.7) 231 (5.2) -38.1 (-40.2) 32Maryland 442 (9.0) 306 (5.6) -30.8 (-37.8) 33Connecticut 156 (4.8) 104 (3.0) -33.3 (-37.5) 34Oregon 145 (4.9) 111 (3.2) -23.4 (-34.7) 35Washington 306 (6.0) 252 (4.2) -17.6 (-30.0) 38Arizona 259 (6.8) 263 (4.8) 1.5 (-29.4) 39Ohio 358 (3.2) 257 (2.3) -28.2 (-28.1) 41Colorado 104 (3.0) 104 (2.3) 0.0 (-23.3) 42Oklahoma 216 (6.7) 190 (5.4) -12.0 (-19.4) 44Minnesota 165 (3.7) 237 (4.7) 43.6 (27.0) 50
<100 cases in 2002Utah 78 (4.3) 31 (1.3) -60.3 (-69.8) 2West Virginia 92 (5.1) 30 (1.7) -67.4 (-66.7) 3Wyoming 8 (1.7) 3 (0.6) -62.5 (-64.7) 5South Dakota 32 (4.5) 13 (1.7) -59.4 (-62.2) 6Delaware 55 (8.0) 25 (3.1) -54.5 (-61.3) 7Idaho 26 (2.4) 14 (1.0) -46.2 (-58.3) 8Nevada 99 (7.5) 85 (3.9) -14.1 (-48.0) 23North Dakota 11 (1.7) 6 (0.9) -45.5 (-47.1) 24New Mexico 88 (5.6) 57 (3.1) -35.2 (-44.6) 25District of Columbia 146 (24.8) 82 (14.4) -43.8 (-41.9) 27Wisconsin 106 (2.1) 78 (1.4) -26.4 (-33.3) 36Montana 16 (1.9) 12 (1.3) -25.0 (-31.6) 37Iowa 49 (1.7) 34 (1.2) -30.6 (-29.4) 39Alaska 57 (9.7) 49 (7.6) -14.0 (-21.6) 43Rhode Island 54 (5.4) 49 (4.6) -9.3 (-14.8) 45New Hampshire 18 (1.6) 19 (1.5) 5.6 (-6.3) 46Nebraska 28 (1.7) 28 (1.6) 0.0 (-5.9) 47Maine 24 (1.9) 23 (1.8) -4.2 (-5.3) 48Vermont 7 (1.2) 8 (1.3) 14.3 (8.3) 49Kansas 56 (2.2) 89 (3.3) 58.9 (50.0) 51
Total 26,673 (10.5) 15,078 (5.2) -43.5 (-50.5)
* Per 100,000 population.†Data for 1992 are final; data for 2002 are provisional.
220 MMWR March 21, 2003
rate of any U.S.-born racial/ethnic population. U.S.-born non-Hispanic blacks comprised the largest number of TB casesamong both U.S.-born and foreign-born populations, repre-senting 46.7% of TB cases in U.S.-born persons and approxi-mately one fourth of all cases. Among U.S.-born racial/ethnicpopulations, rates among non-Hispanic blacks were 7.5 timeshigher and 2.1 times higher, respectively, than those amongnon-Hispanic whites and Hispanics, the two other U.S.-borngroups that account for the majority of TB cases (Table 2).Reported by: Div of Tuberculosis Elimination, National Center forHIV, STD, and TB Prevention, CDC.
Editorial Note: Since 1992, when TB cases in the UnitedStates peaked after 7 years of stable or increasing rates, TBcase rates have declined an average of 5% per year. Thestrengthened TB control efforts that have been effective inreversing increases in TB rates among U.S.-born persons havehad far less effect on TB rates among foreign-born persons(6). The reasons for these differences are unclear and requirefurther study. The differences are not related to timeliness of
completion of therapy, which is similar among U.S.-born andforeign-born persons. However, the accelerated decline in over-all U.S. TB cases probably resulted from the implementationof control measures that reduced ongoing transmission ofMycobacterium tuberculosis and the subsequent number of TBcases caused by recent infection (7). These measures are rela-tively less effective in controlling TB among foreign-bornpersons. Genotyping studies of M. tuberculosis isolates sug-gest that the majority of TB cases in foreign-born persons arethe result of progression to disease among persons infectedbefore immigrating to the United States (8).
Closing the gap in TB rates between U.S.-born and for-eign-born populations is critical to TB elimination in theUnited States. Success will depend on domestic programs thatprovide services to foreign-born persons with latent TB infec-tion and on collaborative efforts that reduce the burden ofTB disease globally. To address the high rates in the foreign-born population, CDC is collaborating with other nationaland international public health organizations to 1) optimize
TABLE 2. Number and rate* of tuberculosis cases, and percentage change in rate in U.S.-born and foreign-born persons, by race/ethnicity — United States, 1992 and 2002†
U.S.-born Foreign-born Total§
1992 2002 % change 1992 2002 % change 1992 2002 % change
Race/Ethnicity No. Rate No. Rate 1992–2002 No. Rate No. Rate 1992–2002 No. Rate No. Rate 1992–2002
White, non-Hispanic 7,043 (3.8) 2,509 (1.3) -65.8 540 (8.7) 484 (6.1) -29.9 7,618 (4.0) 3,019 (1.5) -62.5Black, non-Hispanic 9,010 (31.0) 3,350 (9.8) -68.4 591 (44.6) 1,008 (49.9) 11.9 9,623 (31.7) 4,425 (12.3) -61.2Hispanic 2,530 (16.1) 975 (4.7) -70.8 2,828 (33.0) 2,914 (20.1) -39.1 5,437 (22.4) 3,977 (11.3) -49.6American Indian/Alaska Native 298 (16.3) 177 (7.0) -57.1 — — — 299 (16.1) 191 (7.4) -54.0Asian/Pacific Islander 319 (10.1) 162 (3.8) -62.4 3,296 (66.5) 3,092 (41.3) -37.9 3,649 (46.7) 3,312 (28.2) -39.6
Total¶ 19,225 (8.2) 7,252 (2.8) -65.9 7,270 (34.5) 7,544 (23.6) -31.6 26,673 (10.5) 15,078 (5.2) -50.5
* Per 100,000 population.†
Data for 1992 are final; data for 2002 are provisional.§ Persons included for whom country of birth was unknown: 178 in 1992 and 282 in 2002.¶ Persons included for whom race/ethnicity was unknown: 47 for all, 25 for U.S.-born, and 15 for foreign-born persons in 1992; 154 for all, 79 for U.S.-born, and 46 for
foreign-born persons in 2002.
>50%25%–49%<25%
District ofColumbia
1992
>50%25%–49%<25%
District ofColumbia
2002
FIGURE. Percentage of tuberculosis cases among foreign-born persons — United States, 1992 and 2002*
* Data for 1992 are final; data for 2002 are provisional.
know what matters.
Dispatch
dis • patch: n 1 : A written message,
particularly an official communication,
sent with speed; see also MMWR.
(dis-'pach)
Morbidity and Mortality Weekly Report
Weekly
August 9, 2002 / Vol. 51 / No. 31
Centers for Disease Control and Prevention
SAFER � HEALTHIER � PEOPLE TM
This report summarizes West Nile virus (WNV) surveillance
data reported to CDC through ArboNET and by states and
other jurisdictions as of August 7, 2002.
United StatesDuring the reporting period of July 31–August 7, a total of
68 laboratory-positive human cases of WNV-associated ill-
ness were reported from Louisiana (n=40), Mississippi (n=23),
Texas (n=four), and Illinois (n=one). During the same
period, WNV infections were reported in 447 dead crows,
263 other dead birds, 42 horses, and 183 mosquito pools.
During 2002, a total of 112 human cases with laboratory
evidence of recent WNV infection have been reported from
Louisiana (n=71), Mississippi (n=28), Texas (n=12), and Illi-
nois (n=one). Five deaths have been reported, all from Louisi-
ana. Among the 98 cases with available data, 59 (60%)
occurred among men; the median age was 55 years (range:
3–88 years), and the dates of illness onset ranged from June 10
to July 29.In addition, 1,076 dead crows and 827 other dead birds
with WNV infection were reported from 34 states, New York
City, and the District of Columbia (Figure 1); 87 WNV
infections in horses have been reported from 12 states
(Alabama, Florida, Georgia, Illinois, Kentucky, Louisiana,
Minnesota, Mississippi, North Dakota, South Dakota, Ten-
nessee, and Texas). During 2002, WNV seroconversions have
been reported in 52 sentinel chicken flocks from Florida,
Nebraska, and Pennsylvania; and 425 WNV-positive mos-
quito pools have been reported from 12 states (Alabama, Geor-
gia, Illinois, Indiana, Massachusetts, Mississippi, New Jersey,
Ohio, Pennsylvania, South Dakota, Texas, and Virginia), New
York City, and the District of Columbia.
West Nile Virus Activity — United States, July 31–August 7, 2002,
and Louisiana, January 1–August 7, 2002
INSIDE683 Outbreak of Salmonella Serotype Javiana Infections —
Orlando, Florida, June 2002
684 Childhood Lead Poisoning Associated with Tamarind
Candy and Folk Remedies — California, 1999–2000
686 Human Rabies — California, 2002
688 Outbreak of Tularemia Among Commercially Distributed
Prairie Dogs, 2002
699 Notices to Readers
Recent human WNV infection and animal WNV activity
Animal WNV activity only
District ofColumbia
* As of August 7, 2002.
FIGURE 1. Areas reporting West Nile virus (WNV) activity —
United States, 2002*
222 MMWR March 21, 2003
8. Zuber PLF, McKenna MT, Binkin NJ, Onorato IM, Castro KG. Long-term risk of tuberculosis among foreign-born persons in the UnitedStates. JAMA 1997;278:304–7.
9. Cantwell MF, McKenna MT, McCray E, Onorato IM. Tuberculosisand race/ethnicity in the United States: impact of socioeconomic sta-tus. Am J Respir Crit Care Med 1997;157:1016–20.
10. U.S. Department of Health and Human Services. Healthy people 2010(2nd ed., 2 vols.). Washington, DC: U.S. Government Printing Office,November 2000.
Transmission of MycobacteriumTuberculosis Associated with
Failed Completion of Treatmentfor Latent Tuberculosis Infection —
Chickasaw County, Mississippi,June 1999–March 2002
During June 1999–March 2002, a total of 16 tuberculosis(TB) cases were reported from Chickasaw County, Missis-sippi (2000 population: 19,440), corresponding to annual TBincidences of 20.5–27.6 cases per 100,000 population. Incomparison, annual TB incidences for Mississippi during thesame period decreased from 7.8 to 5.4 cases per 100,000 popu-lation. This report summarizes the results of an investigationof the patients and their contacts and demonstrates the needfor strategies to increase the proportion of infected contactsthat successfully complete treatment for latent TB infection(LTBI).
During April–May 1, 2002, the Mississippi State Depart-ment of Health (MSDH) conducted an epidemiologic inves-tigation of the high incidence of TB in Chickasaw County.Patients were interviewed, and health department medicalrecords were reviewed for clinical data. Restriction fragmentlength polymorphism (RFLP) analysis using IS6110 was per-formed on all culture isolates. For contacts, LTBI was definedas infection in a patient with a tuberculin skin test (TST) >5mm induration and no evidence of TB disease. Contact in-vestigation logs were reviewed and health department recordsused to establish outcomes of treatment for LTBI.
The median age of the 16 TB patients was 31 years (range:2–64 years); five (31%) were aged <16 years. Ten (63%)patients were male, and 15 (94%) were black. All 16 TBpatients were born in the United States and were humanimmunodeficiency virus (HIV)-seronegative. For 11 patientsfrom whom sputum specimens were obtained for bacterio-logic examination, eight (73%) were culture-positive forMycobacterium tuberculosis, of whom six (55%) also were spu-tum-smear positive for acid-fast bacilli. RFLP analysis per-formed on all eight culture-positive isolates showed seven(88%) with matching 10-band patterns . The contact investi-
overseas screening of immigrants and refugees, 2) enhancethe notification system that alerts local health departments tothe arrival of immigrants or refugees with suspected TB toimprove diagnosis and treatment, 3) establish a binational TBreferral and case management system for the United Statesand Mexico to improve treatment completion by TB patientswho cross the United States–Mexico border (the U.S.–MexicoBinational TB Referral and Case Management Project), 4)identify and treat persons arriving from high-incidence coun-tries who have latent TB infection, and 5) strengthen collabo-rations with the World Health Organization and otherinternational partners aimed at improving TB control in high-incidence countries (the STOP TB Partnership). In supportof these efforts, CDC and its 22 partner research institutes,clinical centers, and health departments in the United Statesand Canada that compose the Tuberculosis EpidemiologicStudies Consortium have initiated a study to identify missedopportunities for TB prevention among foreign-born persons.
Although intensified TB control efforts helped reduce theTB case rate in the U.S.-born non-Hispanic black populationby approximately 70% during 1992–2002, that rate hasremained approximately eight times higher than the rateamong non-Hispanic whites. Because much of this disparityis associated with socioeconomic status (9), intensified out-reach programs tailored to the needs of low-income personsmight accelerate TB elimination. CDC is funding demon-stration projects in South Carolina, Georgia, and Chicago,Illinois, to identify innovative strategies to improve TB screen-ing, diagnosis, and treatment adherence in high-risk blackcommunities.
Elimination of health disparities is one of the national healthgoals for 2010 (Goal 2) (10). Closing the gaps in TB rateswill help achieve this and the goal of TB elimination.References1. CDC. A strategic plan for the elimination of tuberculosis in the United
States. In: CDC Surveillance Summaries (April 21). MMWR1989;38(No. S-3).
2. CDC. Reported tuberculosis in the United States, 2001. Atlanta, Geor-gia: U.S. Department of Health and Human Services, CDC, Septem-ber 2002. Available at http://www.cdc.gov/nchstp/tb/surv/surv.lhtm.
3. Curtis AB, McCray E, McKenna M, Onorato IM. Completeness and time-liness of tuberculosis case reporting. Am J Prev Med 2001;20:108–12.
4. U.S. Census Bureau. Native and foreign-born resident populationestimates of the United States by age and sex: April 1, 1990 to July 1,1999. Available at http://eire.census.gov/popest/archives/national/us_nativity/nbtab003.txt and fbtab003.txt.
5. U.S. Census Bureau. Profile of the foreign-born population in theUnited States: 2000. Available at http://www.census.gov/prod/2002pubs/p23-206.pdf.
6. McKenna MT, McCray E, Jones JL, Onorato M, Castro KG. The fallafter the rise: tuberculosis in the United States, 1991 through 1994.Am J Public Health 1998;88:1059–63.
7. Talbot EA, Moore M, McCray E, Binkin NJ. Tuberculosis among for-eign-born persons in the United States, 1993–1998. JAMA2000;284:2894–900.
Vol. 52 / No. 11 MMWR 223
gations and matching RFLP patterns suggest recent transmis-sion of M. tuberculosis. Isolates from all culture-confirmedpatients were susceptible to first-line anti-TB drugs (isoniazid,rifampin, pyrazinamide, and ethambutol). All 16 patientssuccessfully completed a CDC-recommended course of treat-ment.
Among the 16 TB patients, five had been diagnosed previ-ously with LTBI as a result of TB contact investigations;patients ranged in age from 28 to 51 years, and four (80%)had a history of regular alcohol use. MSDH attempted totreat all five patients, but all had either refused or stoppedtreatment. The patients subsequently progressed to active TBand became sources of infection for an additional 10 TB pa-tients, including the five patients aged <16 years.
The 16 TB patients identified 364 contacts (median: 19contacts per case; range: 6–90). The patients, with the assis-tance of a health department worker, classified 350 (96%) ofthese contacts as either close (63%) or casual (37%). The 364contacts represented 253 persons. As of May 1, 2002, TSTscreening, including if indicated a 10–12 week follow-up TST,was completed for 230 (91%) of the 253 persons. TST screen-ing results and subsequent evaluation (including chest radio-graph, and if indicated, sputum examination) detected LTBIin 67 (26%) persons. Patients with LTBI were not offeredHIV testing and counseling routinely.
Adults with LTBI were offered a 9-month regimen of dailyself-administered isoniazid, dispensed at 1-month increments.Directly observed treatment for LTBI was offered both tochildren and those adults with known HIV infection. Treat-ment for LTBI was defined as complete if the patient hadretrieved >6 months of isoniazid and was assessed by a super-vising nurse as having completed treatment. Among the 67persons with LTBI diagnosed, treatment was initiated in 57(85%), discontinued in nine (13%) because of side effects,and completed in 36 (54%).
As a result of this investigation, patients in ChickasawCounty with untreated LTBI were again offered treatment.To enhance completion of treatment for LTBI, MSDH hiredadditional outreach workers and expanded the use of directobservation of treatment for LTBI. MSDH staff targeted theuse of direct observation to adult patients considered at highrisk for treatment default, including persons who regularlyused alcohol and those who had interrupted treatment previ-ously. MSDH also is considering the use of incentives such asgrocery coupons.
To identify barriers to LTBI treatment completion, MSDHin partnership with CDC, conducted three focus groups withTB-control staff, patients adherent to treatment for LTBI, andpatients nonadherent to treatment for LTBI. Focus groupparticipants suggested that TB-control staff persistence and
flexibility helped adherence to treatment for LTBI, as did par-ticipation of sex and race-matched community outreach work-ers. Many participants cited community and family stigma astreatment barriers and identified a need for additional infor-mation about the importance of LTBI treatment.
To address patient concerns and misconceptions, MSDHhas initiated ongoing individual counseling during treatmentfor LTBI. Furthermore, MSDH has engaged community lead-ers, churches, and civic organizations to disseminate TB-related educational messages.Reported by: T Chamblee, D Hartley, M Holcombe, MPPA,K Parham, P Upchurch, RM Webb, MD, Mississippi Dept of Health.AG Robillard, PhD, Rollins School of Public Health of Emory Univ,Atlanta, Georgia. L Diem, B Metchock, PhD, Div of AIDS, STD, andTB Laboratory Research, National Center for Infectious Diseases; NDeLuca, MA, PD McElroy, PhD, T Navin, MD, W Walton, MEd,Div of Tuberculosis Elimination, National Center for HIV, STD, andTB Prevention; Div of Applied Public Health Training, EpidemiologyProgram Office; PK Dewan, MD, EIS Officer, CDC.
Editorial Note: The findings in this investigation underscorethe need to ensure completion of treatment for LTBI by in-fected contacts of TB patients. Integral components of suc-cessful contact investigations include patient interview, contactidentification, and medical evaluation for active TB and LTBI(1), followed by successful initiation and completion of treat-ment for LTBI.
This investigation found that contact identification andevaluation were thorough and effective. For example, themedian number of contacts identified and the proportion ofcontacts evaluated for LTBI were higher than those found infive other TB programs in a recent study of contact investiga-tions (1,2). Despite these efforts, patients with untreated LTBIsubsequently developed active TB and served as the source ofongoing TB transmission in the community. This contrib-uted to the persistently high TB incidences in ChickasawCounty.
The discovery of LTBI during contact investigation sug-gests recent infection. Because the risk for progression frominfection to active disease is highest during the first 2 yearsfollowing infection, priority should be given to treating in-fected contacts identified during contact investigations (3).Studies among populations at highest risk for loss to follow-up (e.g., injection-drug users, released jail inmates, and home-less persons) have shown that the use of incentives and directobservation of treatment substantially improves LTBI treat-ment completion rates (4–7). Among high-risk groups, theseinterventions might be cost-effective (8). Additional evalua-tion is needed to determine if patients outside these high-riskgroups might benefit from incentives and direct observationof treatment. Qualitative evaluation of patient, staff, and sys-
224 MMWR March 21, 2003
tem barriers might identify community-specific barriers totreatment initiation and completion. In Chickasaw County,focus group findings suggested that ongoing individual coun-seling for patients with LTBI and efforts to reduce stigmathrough community engagement might promote completionof treatment for LTBI. A follow-up evaluation might helpdetermine the effectiveness of these interventions.
Completion of treatment for LTBI is the final componentof an effective contact investigation. If the actual number ofinfected contacts substantially exceeds those identified andsuccessfully screened, the treatment completion rate mightoverestimate the contact investigation effectiveness (2). Toeffectively interrupt M. tuberculosis transmission, successfulimplementation of all elements of contact investigation is nec-essary (8). Treating patients with LTBI increasingly challengesthe response capacity of state and local TB-control programs(9). Although the decline of TB in blacks has paralleled theoverall national trends, in 2001, incidence among non-His-panic blacks remained 8.6 times higher than incidence amongwhites (10). TB-control programs serving black communitieswith high TB incidence should have the resources necessaryto control TB and reduce this health disparity.References1. Reichler MR, Reves R, Bur S, et al. Evaluation of investigations con-
ducted to detect and prevent transmission of tuberculosis. JAMA2002;287:991–5.
2. Reichler MR, Reves R, Bur S, et al. Treatment of latent tuberculosisinfection in contacts of new tuberculosis cases in the United States.South Med J 2002;95:414–20.
3. CDC. The use of preventive therapy for tuberculous infection in theUnited States: recommendations of the Advisory Committee for Elimi-nation of Tuberculosis. MMWR 1990;39(No. RR-8):9–12.
4. Chaisson RE, Barnes GL, Hackman J, et al. A randomized, controlledtrial of interventions to improve adherence to isoniazid preventativetherapy to prevent tuberculosis in injection drug users. Am J Med2001;110:610–5.
5. White MC, Gournis E, Kawamura M, et al. Effect of directly ob-served preventative therapy for latent tuberculosis infection in SanFrancisco. Int J Tuberc Lung Dis 2003;7:30–5.
6. Tulsky JP, Pilote L, Hahn J, et al. Adherence to INH prophylaxis inthe homeless: a randomized controlled trial. Arch Intern Med2000;160:697–702.
7. Snyder DC, Paz EA, Mohle-Boetani JC, et al. Tuberculosis preventionin methadone maintenance clinics: effectiveness and cost-effectiveness.Am J Respir Crit Care Med 1999;160:178–85.
8. CDC. Screening for tuberculosis and tuberculosis infection in high-risk populations. Recommendations of the Advisory Council for theElimination of Tuberculosis. MMWR 1995;44(No. RR-11):19–34.
9. CDC. Tuberculosis elimination revisited: obstacles, opportunities, anda renewed commitment. Recommendations of the Advisory Committeefor Elimination of Tuberculosis. MMWR 1999;48(No. RR-9):1–13.
10. CDC. Reported tuberculosis in the United States, 2001. Atlanta, Geor-gia: U.S. Department of Health and Human Services, CDC, 2001.
Update: Influenza Activity —United States, 2002–03 Season
This report summarizes influenza activity in the UnitedStates during September 29, 2002–March 8, 2003,* andupdates the previous summary (1). Influenza activity was mildin the United States overall but varied by region. Preliminarydata collected through the four components of the CDCinfluenza surveillance system suggest that national influenzaactivity peaked during the week ending February 8, 2003 (2).
As of the week ending March 8, the World Health Organi-zation (WHO) and National Respiratory and Enteric VirusSurveillance System collaborating laboratories in the UnitedStates tested 59,731 specimens for influenza viruses, of which6,433 (10.8%) were positive. The percentage of specimenstesting positive for influenza exceeded 10.0% during the weekending January 18 and appears to have peaked at 25.0% dur-ing the week ending February 8. During the three mostrecent influenza seasons (1999–00, 2000–01, and 2001–02),the peak percentage of specimens testing positive for influ-enza ranged from 23.9% to 30.9% (3; CDC, unpublisheddata, 2003). Of the 6,433 influenza viruses reported duringthe 2002–03 season, 2,916 (45.3%) were influenza type Aand 3,517 (54.7%) were influenza type B viruses. However,during the weeks ending February 22–March 8, influenza Aviruses have been reported more frequently (57.0%) thaninfluenza B viruses. Of the 1,329 influenza type A virusesthat have been subtyped, 1,089 (81.9%) are influenza A (H1)†
viruses and 240 (18.1%) are influenza A (H3N2) viruses. Forthe season, influenza type A viruses have predominated in theNew England, East North Central, Mountain, Pacific, andMid-Atlantic regions, and influenza B viruses have predomi-nated in the West South Central, South Atlantic, West NorthCentral, and East South Central regions. However, duringthe weeks ending February 22–March 8, influenza A viruseswere reported more frequently (71.1%) in the West SouthCentral region than influenza B viruses.
CDC has characterized antigenically 266 influenza virusessubmitted by U.S. laboratories since September 29, 2002: 65influenza A (H1) viruses, 54 influenza A (H3N2) viruses, and147 influenza B viruses. Of the 65 influenza A (H1)viruses, 45 (69.2%) had the N1 neuraminidase and 20(30.8%) had the N2 neuraminidase. The hemagglutinin pro-teins of all 65 influenza A (H1) viruses were similar antigeni-cally to the hemagglutinin of the vaccine strain A/NewCaledonia/20/99 (H1N1). Of the 54 influenza A (H3N2)isolates that have been characterized, 47 (87.0%) were similarto A/Panama/2007/99, the H3N2 component of the 2002–03 influenza vaccine, and seven (13.0%) showed reduced
* As of March 14, 2003. Reporting is incomplete.† Includes both the A (H1N1) and A (H1N2) influenza virus subtypes.
Vol. 52 / No. 11 MMWR 225
titers to ferret antisera produced against A/Panama/2007/99.Of the 147 influenza B viruses that have been characterized,146 (99.3%) belonged to the B/Victoria lineage and were simi-lar antigenically to the vaccine strain B/Hong Kong/330/01,and one (0.7%) belonged to the B/Yamagata lineage and wassimilar to B/Sichuan/379/99.
During the weeks ending January 11–March 8, the weeklypercentages of patient visits for influenza-like illness (ILI)§ toapproximately 750 sentinel providers in 49 states ranged from1.5% to 3.1% and exceeded the national baseline of 1.9%¶
for 7 consecutive weeks (the weeks ending January 25–March8). The peak percentage of patient visits for ILI (3.1%) oc-curred during the weeks ending February 8 and 15. For theweek ending March 8, the percentage of patient visits for ILIwas 2.0%. During the 1999–2000, 2000–01, and 2001–02influenza seasons, the peak percentages of patient visits for ILIranged from 3.2% to 5.6% (3; CDC, unpublished data, 2003).
Since October 20, influenza activity** has been reported bystate and territorial epidemiologists as regional in at least onestate each week. During the weeks ending December 7–21,widespread influenza activity was reported in Texas. Wide-spread activity was not reported again until the week endingJanuary 18 and has been reported by two to 13 states eachweek since then. The greatest number of states reportingregional or widespread activity was 34 during the weeks end-ing February 8 and February 15. For the week ending March8, nine states reported widespread influenza activity, and 23reported regional influenza activity.
During the week ending March 8, of the deaths in the 122Cities Mortality Reporting System, 8% were attributed topneumonia and influenza (P&I). This percentage was belowthe epidemic threshold†† of 8.3% for that week. The percent-age of P&I deaths has been below the epidemic thresholdeach week during September 29–March 8.Reported by: L Brammer, MPH, A Postema, MPH, S Harper, MD,A Klimov, PhD, N Cox, PhD, WHO Collaborating Center forSurveillance, Epidemiology and Control of Influenza, Div of Viral and
§ Temperature of >100.0º F (>37.8º C) and either cough or sore throat in theabsence of a known cause other than influenza.
¶ The national baseline was calculated as the mean percentage of visits for ILIduring noninfluenza weeks plus two standard deviations. Wide variability inregional data precludes calculating region-specific baselines and makes itinappropriate to apply the national baseline to regional data.
** Levels of activity are 1) no activity, 2) sporadic—sporadically occurring ILI orlaboratory-confirmed influenza with no outbreaks detected, 3) regional—outbreaks of ILI or laboratory-confirmed influenza in counties with a combinedpopulation of <50% of a state’s population, and 4) widespread—outbreaks ofILI or laboratory-confirmed influenza in counties with a combined populationof >50% of a state’s population.
†† The expected seasonal baseline proportion of P&I deaths reported by the 122Cities Mortality Reporting System is projected by using a robust regressionprocedure in which a periodic regression model is applied to the observedpercentage of deaths from P&I during the previous 5 years. The epidemicthreshold is 1.654 standard deviations above the seasonal baseline (3).
Rickettsial Diseases, National Center for Infectious Diseases; P Terebuh,MD, EIS Officer, CDC.
Editorial Note: Although overall influenza activity has beenmild this season, numerous outbreaks have been reportedamong school children, some leading to school closures, andsevere illnesses and deaths associated with influenza have beenreported in children. These severe illnesses and deaths werenot associated with a single influenza virus type; both influ-enza A (H1) and influenza B viruses were identified.
CDC contributes to the international surveillance for in-fluenza through the World Health Organization’s (WHO)Global Influenza Programme as the WHO CollaboratingCenter for Surveillance, Epidemiology and Control of Influ-enza. In February, the Hong Kong Department of Health(DOH) confirmed influenza A (H5N1) infection in two pa-tients from a single family of Hong Kong residents who hadtraveled recently to Fujian Province on the Chinese main-land. The first case occurred in a boy aged 9 years who washospitalized in Hong Kong and recovered. The second caseoccurred in the boy’s father, who died in a Hong Kong hospi-tal on February 16. Additional family members had respira-tory symptoms, and the boy’s sister aged 8 years died whilethe family was in China. The Hong Kong DOH has intensi-fied its influenza surveillance, and no additional human in-fections with A (H5N1) virus have been identified. Noindication exists that the influenza A (H5N1) virus has spreadoutside Asia. On February 26, CDC issued recommendationsto state health departments for enhanced influenza surveil-lance in the United States. CDC is in communication withWHO about these cases of influenza A (H5N1) and will con-tinue to monitor the situation.
Influenza surveillance reports for the United States are pub-lished weekly during October–May and are available at http://www.cdc.gov/ncidod/diseases/flu/weekly.htm or throughCDC’s voice (telephone, 888-232-3228) and fax (telephone, 888-232-3299, document number 361100) information systems.
AcknowledgmentsThis report is based on data contributed by participating state
and territorial epidemiologists and state public health laboratorydirectors, WHO collaborating laboratories, National Respiratoryand Enteric Virus Surveillance System collaborating laboratories,U.S. Influenza Sentinel Provider Surveillance System, and Div ofPublic Health Surveillance and Informatics, Epidemiology ProgramOffice, CDC.
References1. CDC. Update: influenza activity—United States, 2002–03 season.
MMWR 2002;52:26–8.2. CDC. Influenza activity—United States, 1999–2000 season. MMWR
1999;48:1039–42.3. CDC. Surveillance for influenza—United States 1997–98, 1998–99,
and 1999–2000. In: CDC surveillance summaries (October 25).MMWR 2002;51(No. SS-7).
226 MMWR March 21, 2003
Outbreak of Severe Acute RespiratorySyndrome —Worldwide, 2003
Since late February 2003, CDC has been supporting theWorld Health Organization (WHO) in the investigation of amulticountry outbreak of atypical pneumonia of unknownetiology. The illness is being referred to as severe acute respi-ratory syndrome (SARS). This report describes the scope ofthe outbreak, preliminary case definition, and interim infec-tion control guidance for the United States.
On February 11, the Chinese Ministry of Health notifiedWHO that 305 cases of acute respiratory syndrome ofunknown etiology had occurred in six municipalities inGuangdong province in southern China during November16, 2002–February 9, 2003. The disease was characterized bytransmission to health-care workers and household contacts;five deaths were reported (1). On February 26, a man aged 47years who had traveled in mainland China and Hong Kongbecame ill with a respiratory illness and was hospitalized shortlyafter arriving in Hanoi, Vietnam. Health-care providers at thehospital in Hanoi subsequently developed a similar illness.The patient died on March 13 after transfer to an isolationfacility in Hong Kong. During late February, an outbreak of asimilar respiratory illness was reported in Hong Kong amongworkers at another hospital; this cluster was linked to apatient who had traveled previously to southern China. OnMarch 12, WHO issued a global alert about the outbreakand instituted worldwide surveillance.
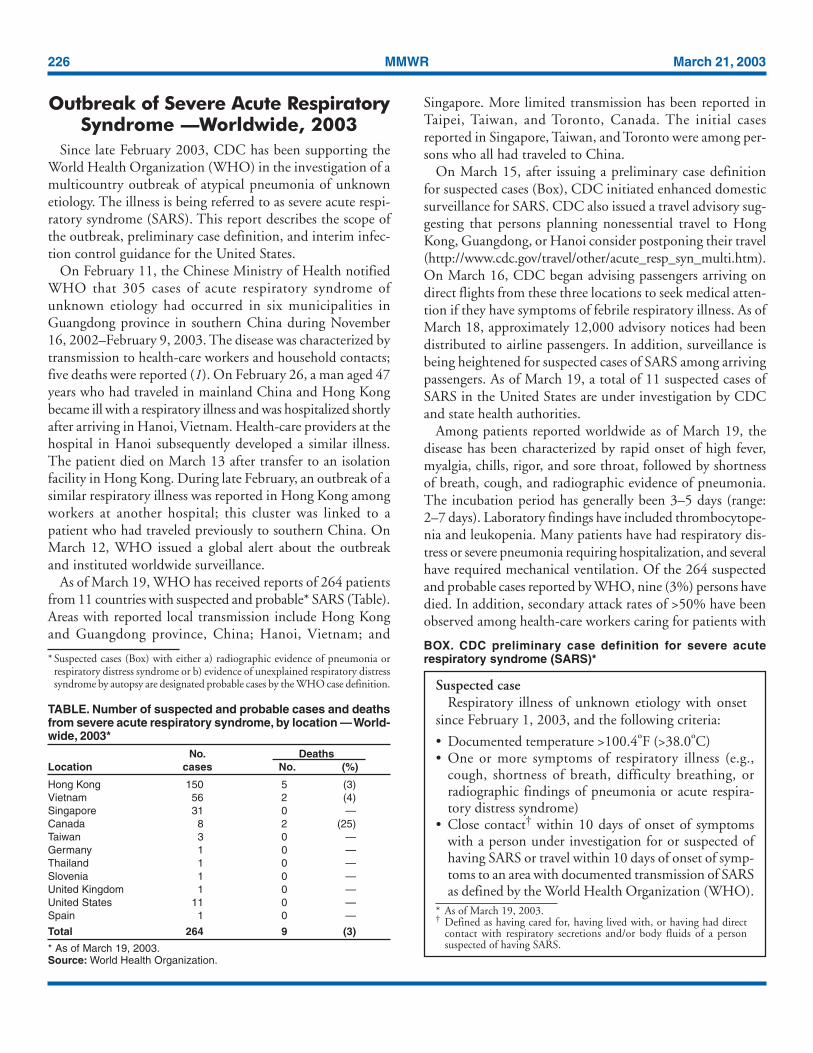
As of March 19, WHO has received reports of 264 patientsfrom 11 countries with suspected and probable* SARS (Table).Areas with reported local transmission include Hong Kongand Guangdong province, China; Hanoi, Vietnam; and
Singapore. More limited transmission has been reported inTaipei, Taiwan, and Toronto, Canada. The initial casesreported in Singapore, Taiwan, and Toronto were among per-sons who all had traveled to China.
On March 15, after issuing a preliminary case definitionfor suspected cases (Box), CDC initiated enhanced domesticsurveillance for SARS. CDC also issued a travel advisory sug-gesting that persons planning nonessential travel to HongKong, Guangdong, or Hanoi consider postponing their travel(http://www.cdc.gov/travel/other/acute_resp_syn_multi.htm).On March 16, CDC began advising passengers arriving ondirect flights from these three locations to seek medical atten-tion if they have symptoms of febrile respiratory illness. As ofMarch 18, approximately 12,000 advisory notices had beendistributed to airline passengers. In addition, surveillance isbeing heightened for suspected cases of SARS among arrivingpassengers. As of March 19, a total of 11 suspected cases ofSARS in the United States are under investigation by CDCand state health authorities.
Among patients reported worldwide as of March 19, thedisease has been characterized by rapid onset of high fever,myalgia, chills, rigor, and sore throat, followed by shortnessof breath, cough, and radiographic evidence of pneumonia.The incubation period has generally been 3–5 days (range:2–7 days). Laboratory findings have included thrombocytope-nia and leukopenia. Many patients have had respiratory dis-tress or severe pneumonia requiring hospitalization, and severalhave required mechanical ventilation. Of the 264 suspectedand probable cases reported by WHO, nine (3%) persons havedied. In addition, secondary attack rates of >50% have beenobserved among health-care workers caring for patients with
TABLE. Number of suspected and probable cases and deathsfrom severe acute respiratory syndrome, by location — World-wide, 2003*
No. DeathsLocation cases No. (%)
Hong Kong 150 5 (3)Vietnam 56 2 (4)Singapore 31 0 —Canada 8 2 (25)Taiwan 3 0 —Germany 1 0 —Thailand 1 0 —Slovenia 1 0 —United Kingdom 1 0 —United States 11 0 —Spain 1 0 —
Total 264 9 (3)
* As of March 19, 2003.Source: World Health Organization.
* Suspected cases (Box) with either a) radiographic evidence of pneumonia orrespiratory distress syndrome or b) evidence of unexplained respiratory distresssyndrome by autopsy are designated probable cases by the WHO case definition. Suspected case
Respiratory illness of unknown etiology with onsetsince February 1, 2003, and the following criteria:
• Documented temperature >100.4ºF (>38.0ºC)• One or more symptoms of respiratory illness (e.g.,
cough, shortness of breath, difficulty breathing, orradiographic findings of pneumonia or acute respira-tory distress syndrome)
• Close contact† within 10 days of onset of symptomswith a person under investigation for or suspected ofhaving SARS or travel within 10 days of onset of symp-toms to an area with documented transmission of SARSas defined by the World Health Organization (WHO).
* As of March 19, 2003.† Defined as having cared for, having lived with, or having had direct
contact with respiratory secretions and/or body fluids of a personsuspected of having SARS.
BOX. CDC preliminary case definition for severe acuterespiratory syndrome (SARS)*
Vol. 52 / No. 11 MMWR 227
SARS in both Hong Kong and Hanoi. Additional clinicaland epidemiologic details are available from WHO at http://www.who.int/wer/pdf/2003/wer7812.pdf.
In the United States, initial diagnostic testing for personswith suspected SARS should include chest radiograph, pulseoximetry, blood cultures, sputum Gram stain and culture, andtesting for viral respiratory pathogens, particularly influenzatypes A and B and respiratory syncytial virus. Clinicians shouldsave any available clinical specimens (e.g., respiratory samples,blood, serum, tissue, and biopsies) for additional testinguntil diagnosis is confirmed. Instructions for specimen col-lection are available from CDC at http://www.cdc.gov/ncidod/sars/pdf/specimencollection-sars.pdf. Specimens should beforwarded to CDC by state health departments after consul-tation with the SARS State Support Team at the CDC Emer-gency Operations Center.
Clinicians evaluating suspected cases should use standardprecautions (e.g., hand hygiene) together with airborne (e.g.,N-95 respirator) and contact (e.g., gowns and gloves) precau-tions (http://www.cdc.gov/ncidod/sars/infectioncontrol.htm).Until the mode of transmission has been defined more pre-cisely, eye protection also should be worn for all patient con-tact. As more clinical and epidemiologic information becomesavailable, interim recommendations will be updated.Reported by: CDC SARS Investigative Team; AT Fleischauer, PhD,EIS Officer, CDC.
Editorial Note: During 2000, approximately 83 million non-resident passengers arrived in China, 13 million in HongKong, and 2 million in Vietnam, and approximately 460,000residents of China, Hong Kong, and Vietnam traveled to theUnited States (2). During January 1, 1997–March 18, 2003,an estimated 5% of ill tourists worldwide who sought post-travel care from one of 35 worldwide GeoSentinel travel clin-ics had pneumonia (International Society of TropicalMedicine, unpublished data, 2003). In the United States,approximately 500,000 persons with pneumonia require hos-pitalization each year; in approximately half of these cases, noetiologic agent is identified despite intensive investigation(3,4). On the basis of these data and the broad and necessar-ily nonspecific case definition, cases meeting the criteria forSARS are anticipated worldwide and in the United States.However, most of the anticipated cases are expected to beunrelated to the current outbreak.
Electron microscopic identification of paramxyovirus-likeparticles has been reported from Germany and Hong Kong(5). This family of viruses includes measles, mumps, humanparainfluenza viruses, and respiratory syncytial virus inaddition to the recently identified henipaviruses andmetapneumovirus. Additional testing is under way to confirma definitive etiology. Identification of the causative agent
know what matters.
Dispatch
MMWR now publishes important health
information, like reports related to terrorism
and other health emergencies, as often as
required to protect the public health.
MMWR Dispatch provides the latest and
most accurate information regarding
public health investigations, surveillance,
prevention and treatment guidelines,
and other clinical information. Visit
cdc.gov/mmwr, and sign up to receive
MMWR Dispatch by e-mail. In addition
to MMWR Dispatch, you'll also receive
MMWR Weekly, MMWR Recommen-
dations and Reports, and MMWR
Surveillance Summaries. As always,
MMWR is also available in print.
Anytime MMWR Dispatch is published
online, it also appears in the next
printed MMWR issue. MMWR
Dispatch. Another way MMWR helps
you stay current on important public
health, clinical, and scientific topics.
228 MMWR March 21, 2003
should lead to specific diagnostic tests, simplify surveillance,and focus treatment guidelines and infection control guidance.
Clinicians and public health officials who suspect cases ofSARS are requested to report such cases to their state healthdepartments. CDC requests that reports of suspect cases fromstate health departments, international airlines, cruise ships,or cargo carriers be directed to the SARS Investigative Teamat the CDC Emergency Operations Center, telephone 770-488-7100. Additional information about SARS (e.g., infec-tion control guidance and procedures for reporting suspectedcases) is available at http://www.cdc.gov/ncidod/sars. Globalcase counts are available at http://www.who.int.References1. World Health Organization. Disease outbreak reported: acute respira-
tory syndrome in China—update 3. Available at http://www.who.int/csr/don/2003_2_20/en.
2. World Tourism Organization. Statistic tables 2001. Available at http://www.world-tourism.org/market_research/facts&figures/latest_data/tita01_07-02.pdf.
3. Martson BJ, Plouffe JF, File TM, et al. Incidence of community-acquired pneumonia requiring hospitalization: results of a population-based active surveillance study in Ohio. Arch Intern Med1997;157:1709–18.
4. Marrie TJ, Durant H, Yates L. Community-acquired pneumoniarequiring hospitalization: 5-year prospective study. Rev Infect Dis1989;11:586–98.
5. World Health Organization. Disease outbreak reported: acute respira-tory syndrome in China—update 4. Available at http://www.who.int/csr/don/2003_03_19/en.
Public Health Dispatch
Absence of Transmission of the d9Measles Virus — Region of the Americas,
November 2002–March 2003In 1994, countries of the Region of the Americas set a goal
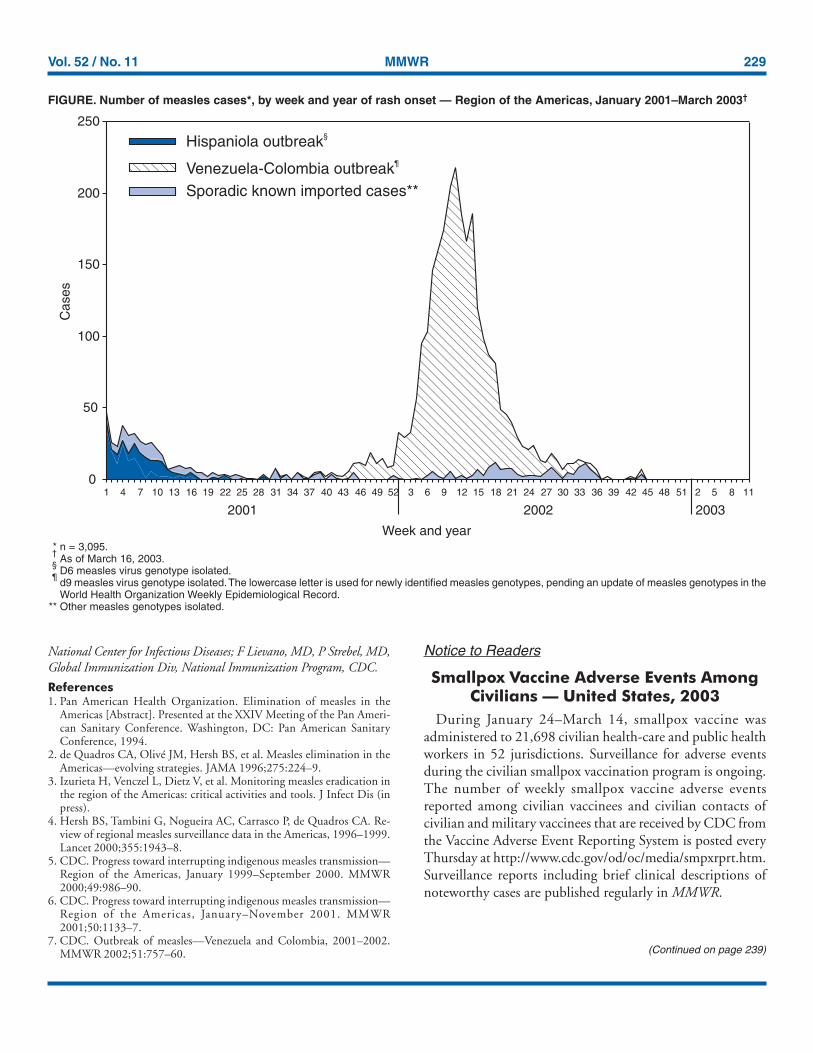
of interrupting indigenous measles transmission (1), and theregional plan of action for achieving this goal was begun in1996. As of March 16, 2003, the Region of the Americas hasbeen free for 17 weeks from known circulation of the d9*measles virus, the strain responsible for the only large out-break of measles in the region during 2002 (Figure).
The measles vaccination strategy recommended by the PanAmerican Health Organization (PAHO) includes a one-time,national “catch-up” campaign for all children aged 1–14 years,routine “keep-up” vaccination for infants aged 1 year, andnational “follow-up” campaigns every 3–4 years for all chil-dren aged 1–4 years, regardless of measles vaccination history(2). Other key components of the strategy include rapid house-
to-house monitoring for local validation of vaccinationactivities and active epidemiologic and virologic surveillance (3).
During 1997–2001, reported confirmed measles cases inthe Region of the Americas decreased 99%, from 53,683 in1997 to 541 in 2001 (4–6). During September 2001, trans-mission of the D6 measles virus genotype, which had circu-lated in the region since 1995 and had caused large outbreaksin Argentina, Bolivia, Brazil, the Dominican Republic, andHaiti, was finally interrupted. However, also during Septem-ber 2001, the recently discovered measles genotype d9 wasintroduced into Venezuela by a Venezuelan traveler returningfrom Europe and resulted in an outbreak that spread to neigh-boring Colombia during January 2002. This outbreak wasattributable to low routine vaccination coverage in Venezuela(7). Because Colombia, unlike Venezuela, did not have a largecohort of susceptible children, the outbreak was controlledeasily. Following nationwide vaccination efforts by both coun-tries, transmission of the d9 measles virus has been interrupted.The last reported case occurred in Carabobo, Venezuela, onNovember 16, 2002. During the outbreak, 2,501 cases werereported in Venezuela and 140 in Colombia. As of March 16,no circulation of the d9 measles virus has been reported any-where in the region for the preceding 17 weeks. During thissame 17-week period, 1,066 suspected cases of measles werereported, of which 846 (79%) were measles IgM-antibodynegative and discarded, 216 (20%) are still under investiga-tion but do not appear to be linked to a measles outbreak; four(<1%) were confirmed, one from Canada and three from theUnited States. These confirmed cases are presumed to be asso-ciated with importations; virus genotyping data are pending.
Progress toward interruption of indigenous measles trans-mission in the Region of the Americas reflects sustained highpolitical commitment by member countries and full imple-mentation of PAHO’s recommended measles-control strate-gies and suggests that global measles eradication is achievable.However, important challenges remain. Measles is stillendemic in other regions, and sporadic cases continue tooccur in the Region of the Americas because of importation.The majority of countries in the region have not achievedand sustained routine measles vaccination coverage rates of>95% in all municipalities. Because poor, underserved neigh-borhoods in large cities that attract migrants of rural originare particularly at risk for measles outbreaks when the virus isreintroduced, persons living in these areas are targeted forsupplementary vaccination activities.Reported by: H Izurieta, MD, V Dietz, MD, P Carrasco, MPH,M Landaverde, MD, C Castillo, MD, Immunization Unit; M Brana,MPP, G Tambini, MD, Family and Community Health Area, PanAmerican Health Organization, Washington, DC. W Bellini, PhD,J Rota, MPH, P Rota, PhD, Div of Viral and Rickettsial Diseases,
*The lowercase letter is used for newly identified measles genotypes, pending anupdate of measles genotypes in the World Health Organization WeeklyEpidemiological Record.
Vol. 52 / No. 11 MMWR 229
National Center for Infectious Diseases; F Lievano, MD, P Strebel, MD,Global Immunization Div, National Immunization Program, CDC.
References1. Pan American Health Organization. Elimination of measles in the
Americas [Abstract]. Presented at the XXIV Meeting of the Pan Ameri-can Sanitary Conference. Washington, DC: Pan American SanitaryConference, 1994.
2. de Quadros CA, Olivé JM, Hersh BS, et al. Measles elimination in theAmericas—evolving strategies. JAMA 1996;275:224–9.
3. Izurieta H, Venczel L, Dietz V, et al. Monitoring measles eradication inthe region of the Americas: critical activities and tools. J Infect Dis (inpress).
4. Hersh BS, Tambini G, Nogueira AC, Carrasco P, de Quadros CA. Re-view of regional measles surveillance data in the Americas, 1996–1999.Lancet 2000;355:1943–8.
5. CDC. Progress toward interrupting indigenous measles transmission—Region of the Americas, January 1999–September 2000. MMWR2000;49:986–90.
6. CDC. Progress toward interrupting indigenous measles transmission—Region of the Americas, January–November 2001. MMWR2001;50:1133–7.
7. CDC. Outbreak of measles—Venezuela and Colombia, 2001–2002.MMWR 2002;51:757–60.
Notice to Readers
Smallpox Vaccine Adverse Events AmongCivilians — United States, 2003
During January 24–March 14, smallpox vaccine wasadministered to 21,698 civilian health-care and public healthworkers in 52 jurisdictions. Surveillance for adverse eventsduring the civilian smallpox vaccination program is ongoing.The number of weekly smallpox vaccine adverse eventsreported among civilian vaccinees and civilian contacts ofcivilian and military vaccinees that are received by CDC fromthe Vaccine Adverse Event Reporting System is posted everyThursday at http://www.cdc.gov/od/oc/media/smpxrprt.htm.Surveillance reports including brief clinical descriptions ofnoteworthy cases are published regularly in MMWR.
(Continued on page 239)
FIGURE. Number of measles cases*, by week and year of rash onset — Region of the Americas, January 2001–March 2003†
* n = 3,095.†
As of March 16, 2003.§
D6 measles virus genotype isolated.¶
d9 measles virus genotype isolated. The lowercase letter is used for newly identified measles genotypes, pending an update of measles genotypes in theWorld Health Organization Weekly Epidemiological Record.
** Other measles genotypes isolated.
0
50
100
150
200
250
1 4 7 10 13 16 19 22 25 28 31 34 37 40 43 46 49 52 3 6 9 12 15 18 21 24 27 30 33 36 39 42 45 48 51 2 5 8
Cas
es
Hispaniola outbreak§
Venezuela-Colombia outbreak¶
Sporadic known imported cases**
2001 2002 2003
Week and year
11
230 MMWR March 21, 2003
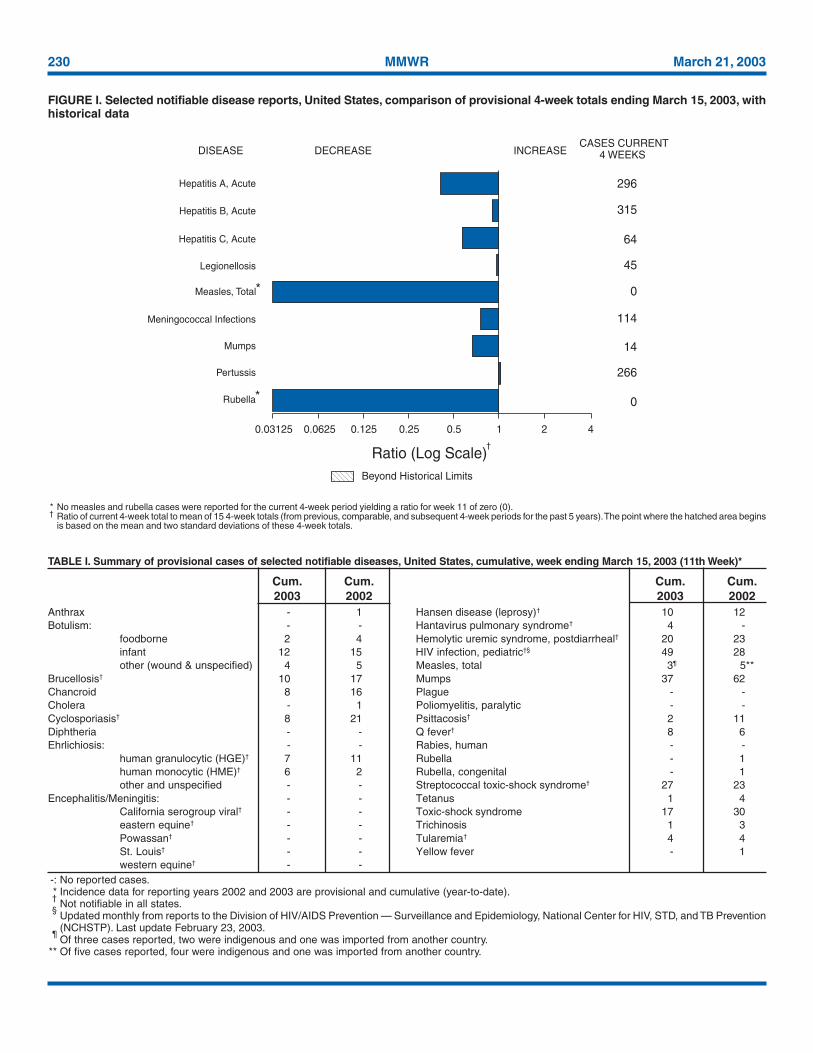
* No measles and rubella cases were reported for the current 4-week period yielding a ratio for week 11 of zero (0).† Ratio of current 4-week total to mean of 15 4-week totals (from previous, comparable, and subsequent 4-week periods for the past 5 years). The point where the hatched area begins
is based on the mean and two standard deviations of these 4-week totals.
FIGURE I. Selected notifiable disease reports, United States, comparison of provisional 4-week totals ending March 15, 2003, withhistorical data
DISEASE DECREASE INCREASECASES CURRENT
4 WEEKS
Ratio (Log Scale)
*
Beyond Historical Limits
4210.50.250.125
296
315
64
45
0
114
14
266
0
Hepatitis A, Acute
Hepatitis B, Acute
Hepatitis C, Acute
Legionellosis
Measles, Total
Mumps
Pertussis
Rubella
Meningococcal Infections
0.06250.03125
*
†
Anthrax - 1 Hansen disease (leprosy)† 10 12Botulism: - - Hantavirus pulmonary syndrome† 4 -
foodborne 2 4 Hemolytic uremic syndrome, postdiarrheal† 20 23infant 12 15 HIV infection, pediatric†§ 49 28other (wound & unspecified) 4 5 Measles, total 3¶ 5**
Brucellosis† 10 17 Mumps 37 62Chancroid 8 16 Plague - -Cholera - 1 Poliomyelitis, paralytic - -Cyclosporiasis† 8 21 Psittacosis† 2 11Diphtheria - - Q fever† 8 6Ehrlichiosis: - - Rabies, human - -
human granulocytic (HGE)† 7 11 Rubella - 1human monocytic (HME)† 6 2 Rubella, congenital - 1other and unspecified - - Streptococcal toxic-shock syndrome† 27 23
Encephalitis/Meningitis: - - Tetanus 1 4California serogroup viral† - - Toxic-shock syndrome 17 30eastern equine† - - Trichinosis 1 3Powassan† - - Tularemia† 4 4St. Louis† - - Yellow fever - 1western equine† - -
-: No reported cases.* Incidence data for reporting years 2002 and 2003 are provisional and cumulative (year-to-date).†
Not notifiable in all states.§
Updated monthly from reports to the Division of HIV/AIDS Prevention — Surveillance and Epidemiology, National Center for HIV, STD, and TB Prevention(NCHSTP). Last update February 23, 2003.
¶Of three cases reported, two were indigenous and one was imported from another country.
** Of five cases reported, four were indigenous and one was imported from another country.
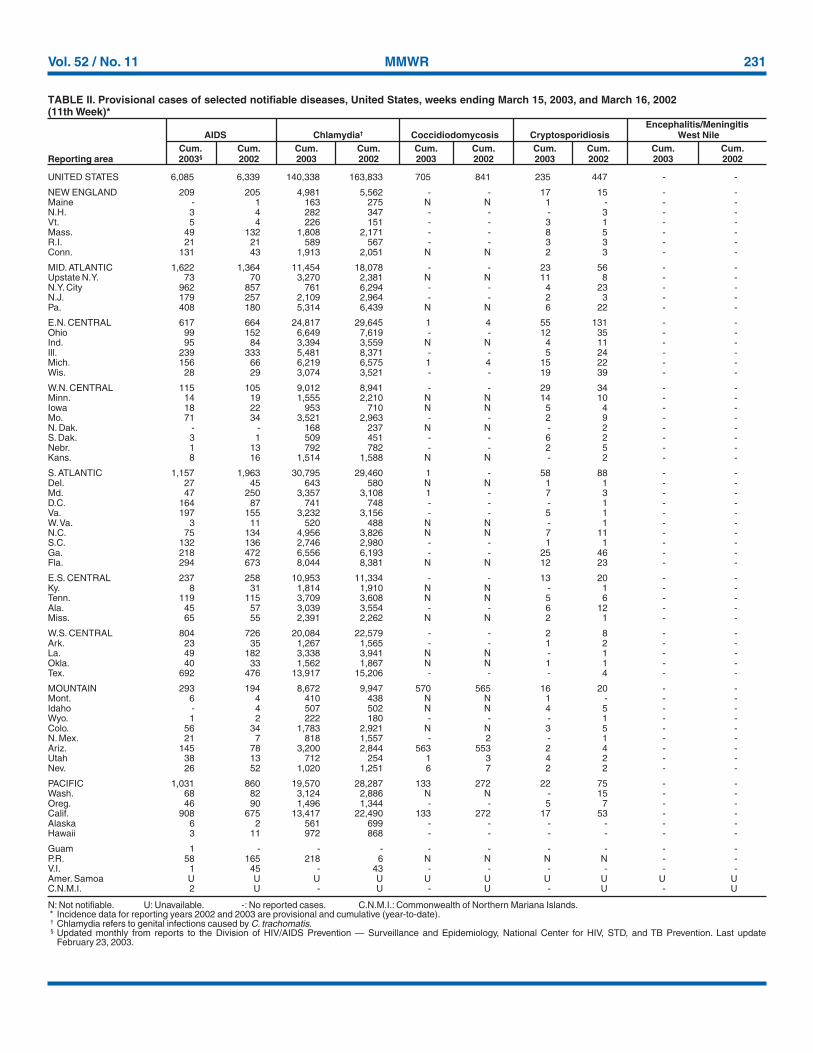
TABLE I. Summary of provisional cases of selected notifiable diseases, United States, cumulative, week ending March 15, 2003 (11th Week)*
Cum. Cum. Cum. Cum.2003 2002 2003 2002
Vol. 52 / No. 11 MMWR 231
UNITED STATES 6,085 6,339 140,338 163,833 705 841 235 447 - -
NEW ENGLAND 209 205 4,981 5,562 - - 17 15 - -Maine - 1 163 275 N N 1 - - -N.H. 3 4 282 347 - - - 3 - -Vt. 5 4 226 151 - - 3 1 - -Mass. 49 132 1,808 2,171 - - 8 5 - -R.I. 21 21 589 567 - - 3 3 - -Conn. 131 43 1,913 2,051 N N 2 3 - -
MID. ATLANTIC 1,622 1,364 11,454 18,078 - - 23 56 - -Upstate N.Y. 73 70 3,270 2,381 N N 11 8 - -N.Y. City 962 857 761 6,294 - - 4 23 - -N.J. 179 257 2,109 2,964 - - 2 3 - -Pa. 408 180 5,314 6,439 N N 6 22 - -
E.N. CENTRAL 617 664 24,817 29,645 1 4 55 131 - -Ohio 99 152 6,649 7,619 - - 12 35 - -Ind. 95 84 3,394 3,559 N N 4 11 - -Ill. 239 333 5,481 8,371 - - 5 24 - -Mich. 156 66 6,219 6,575 1 4 15 22 - -Wis. 28 29 3,074 3,521 - - 19 39 - -
W.N. CENTRAL 115 105 9,012 8,941 - - 29 34 - -Minn. 14 19 1,555 2,210 N N 14 10 - -Iowa 18 22 953 710 N N 5 4 - -Mo. 71 34 3,521 2,963 - - 2 9 - -N. Dak. - - 168 237 N N - 2 - -S. Dak. 3 1 509 451 - - 6 2 - -Nebr. 1 13 792 782 - - 2 5 - -Kans. 8 16 1,514 1,588 N N - 2 - -
S. ATLANTIC 1,157 1,963 30,795 29,460 1 - 58 88 - -Del. 27 45 643 580 N N 1 1 - -Md. 47 250 3,357 3,108 1 - 7 3 - -D.C. 164 87 741 748 - - - 1 - -Va. 197 155 3,232 3,156 - - 5 1 - -W. Va. 3 11 520 488 N N - 1 - -N.C. 75 134 4,956 3,826 N N 7 11 - -S.C. 132 136 2,746 2,980 - - 1 1 - -Ga. 218 472 6,556 6,193 - - 25 46 - -Fla. 294 673 8,044 8,381 N N 12 23 - -
E.S. CENTRAL 237 258 10,953 11,334 - - 13 20 - -Ky. 8 31 1,814 1,910 N N - 1 - -Tenn. 119 115 3,709 3,608 N N 5 6 - -Ala. 45 57 3,039 3,554 - - 6 12 - -Miss. 65 55 2,391 2,262 N N 2 1 - -
W.S. CENTRAL 804 726 20,084 22,579 - - 2 8 - -Ark. 23 35 1,267 1,565 - - 1 2 - -La. 49 182 3,338 3,941 N N - 1 - -Okla. 40 33 1,562 1,867 N N 1 1 - -Tex. 692 476 13,917 15,206 - - - 4 - -
MOUNTAIN 293 194 8,672 9,947 570 565 16 20 - -Mont. 6 4 410 438 N N 1 - - -Idaho - 4 507 502 N N 4 5 - -Wyo. 1 2 222 180 - - - 1 - -Colo. 56 34 1,783 2,921 N N 3 5 - -N. Mex. 21 7 818 1,557 - 2 - 1 - -Ariz. 145 78 3,200 2,844 563 553 2 4 - -Utah 38 13 712 254 1 3 4 2 - -Nev. 26 52 1,020 1,251 6 7 2 2 - -
PACIFIC 1,031 860 19,570 28,287 133 272 22 75 - -Wash. 68 82 3,124 2,886 N N - 15 - -Oreg. 46 90 1,496 1,344 - - 5 7 - -Calif. 908 675 13,417 22,490 133 272 17 53 - -Alaska 6 2 561 699 - - - - - -Hawaii 3 11 972 868 - - - - - -
Guam 1 - - - - - - - - -P.R. 58 165 218 6 N N N N - -V.I. 1 45 - 43 - - - - - -Amer. Samoa U U U U U U U U U UC.N.M.I. 2 U - U - U - U - U
N: Not notifiable. U: Unavailable. -: No reported cases. C.N.M.I.: Commonwealth of Northern Mariana Islands.* Incidence data for reporting years 2002 and 2003 are provisional and cumulative (year-to-date).† Chlamydia refers to genital infections caused by C. trachomatis.§ Updated monthly from reports to the Division of HIV/AIDS Prevention — Surveillance and Epidemiology, National Center for HIV, STD, and TB Prevention. Last update
February 23, 2003.
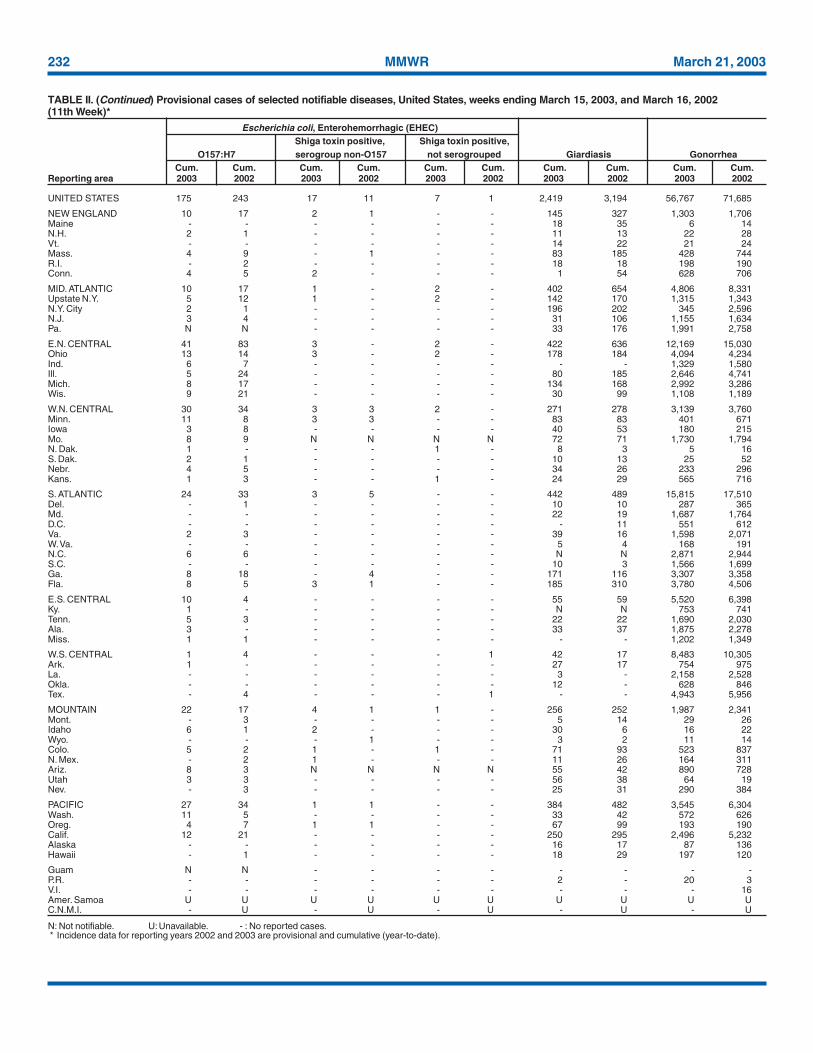
TABLE II. Provisional cases of selected notifiable diseases, United States, weeks ending March 15, 2003, and March 16, 2002(11th Week)*
Encephalitis/MeningitisAIDS Chlamydia† Coccidiodomycosis Cryptosporidiosis West Nile
Cum. Cum. Cum. Cum. Cum. Cum. Cum. Cum. Cum. Cum.Reporting area 2003§ 2002 2003 2002 2003 2002 2003 2002 2003 2002
232 MMWR March 21, 2003
UNITED STATES 175 243 17 11 7 1 2,419 3,194 56,767 71,685
NEW ENGLAND 10 17 2 1 - - 145 327 1,303 1,706Maine - - - - - - 18 35 6 14N.H. 2 1 - - - - 11 13 22 28Vt. - - - - - - 14 22 21 24Mass. 4 9 - 1 - - 83 185 428 744R.I. - 2 - - - - 18 18 198 190Conn. 4 5 2 - - - 1 54 628 706
MID. ATLANTIC 10 17 1 - 2 - 402 654 4,806 8,331Upstate N.Y. 5 12 1 - 2 - 142 170 1,315 1,343N.Y. City 2 1 - - - - 196 202 345 2,596N.J. 3 4 - - - - 31 106 1,155 1,634Pa. N N - - - - 33 176 1,991 2,758
E.N. CENTRAL 41 83 3 - 2 - 422 636 12,169 15,030Ohio 13 14 3 - 2 - 178 184 4,094 4,234Ind. 6 7 - - - - - - 1,329 1,580Ill. 5 24 - - - - 80 185 2,646 4,741Mich. 8 17 - - - - 134 168 2,992 3,286Wis. 9 21 - - - - 30 99 1,108 1,189
W.N. CENTRAL 30 34 3 3 2 - 271 278 3,139 3,760Minn. 11 8 3 3 - - 83 83 401 671Iowa 3 8 - - - - 40 53 180 215Mo. 8 9 N N N N 72 71 1,730 1,794N. Dak. 1 - - - 1 - 8 3 5 16S. Dak. 2 1 - - - - 10 13 25 52Nebr. 4 5 - - - - 34 26 233 296Kans. 1 3 - - 1 - 24 29 565 716
S. ATLANTIC 24 33 3 5 - - 442 489 15,815 17,510Del. - 1 - - - - 10 10 287 365Md. - - - - - - 22 19 1,687 1,764D.C. - - - - - - - 11 551 612Va. 2 3 - - - - 39 16 1,598 2,071W. Va. - - - - - - 5 4 168 191N.C. 6 6 - - - - N N 2,871 2,944S.C. - - - - - - 10 3 1,566 1,699Ga. 8 18 - 4 - - 171 116 3,307 3,358Fla. 8 5 3 1 - - 185 310 3,780 4,506
E.S. CENTRAL 10 4 - - - - 55 59 5,520 6,398Ky. 1 - - - - - N N 753 741Tenn. 5 3 - - - - 22 22 1,690 2,030Ala. 3 - - - - - 33 37 1,875 2,278Miss. 1 1 - - - - - - 1,202 1,349
W.S. CENTRAL 1 4 - - - 1 42 17 8,483 10,305Ark. 1 - - - - - 27 17 754 975La. - - - - - - 3 - 2,158 2,528Okla. - - - - - - 12 - 628 846Tex. - 4 - - - 1 - - 4,943 5,956
MOUNTAIN 22 17 4 1 1 - 256 252 1,987 2,341Mont. - 3 - - - - 5 14 29 26Idaho 6 1 2 - - - 30 6 16 22Wyo. - - - 1 - - 3 2 11 14Colo. 5 2 1 - 1 - 71 93 523 837N. Mex. - 2 1 - - - 11 26 164 311Ariz. 8 3 N N N N 55 42 890 728Utah 3 3 - - - - 56 38 64 19Nev. - 3 - - - - 25 31 290 384
PACIFIC 27 34 1 1 - - 384 482 3,545 6,304Wash. 11 5 - - - - 33 42 572 626Oreg. 4 7 1 1 - - 67 99 193 190Calif. 12 21 - - - - 250 295 2,496 5,232Alaska - - - - - - 16 17 87 136Hawaii - 1 - - - - 18 29 197 120
Guam N N - - - - - - - -P.R. - - - - - - 2 - 20 3V.I. - - - - - - - - - 16Amer. Samoa U U U U U U U U U UC.N.M.I. - U - U - U - U - U
N: Not notifiable. U: Unavailable. - : No reported cases.* Incidence data for reporting years 2002 and 2003 are provisional and cumulative (year-to-date).
TABLE II. (Continued) Provisional cases of selected notifiable diseases, United States, weeks ending March 15, 2003, and March 16, 2002(11th Week)*
Escherichia coli, Enterohemorrhagic (EHEC)Shiga toxin positive, Shiga toxin positive,
O157:H7 serogroup non-O157 not serogrouped Giardiasis GonorrheaCum. Cum. Cum. Cum. Cum. Cum. Cum. Cum. Cum. Cum.
Reporting area 2003 2002 2003 2002 2003 2002 2003 2002 2003 2002

Vol. 52 / No. 11 MMWR 233
UNITED STATES 282 400 2 4 39 73 9 4 902 2,077
NEW ENGLAND 22 35 - - 1 5 1 - 27 87Maine 1 1 - - - - - - 1 3N.H. 4 4 - - - - - - 3 3Vt. 4 2 - - - - - - 1 -Mass. 8 18 - - 1 3 1 - 17 46R.I. - - - - - - - - 2 4Conn. 5 10 - - - 2 - - 3 31
MID. ATLANTIC 45 72 - 1 7 10 2 - 115 226Upstate N.Y. 23 32 - 1 6 4 1 - 21 34N.Y. City 6 17 - - 1 4 - - 68 99N.J. 8 19 - - - 2 - - 15 40Pa. 8 4 - - - - 1 - 11 53
E.N. CENTRAL 23 63 1 1 5 9 - - 111 257Ohio 13 25 - - 4 3 - - 31 64Ind. 6 6 - - 1 1 - - 6 10Ill. - 29 - - - 5 - - 25 99Mich. 4 3 1 1 - - - - 41 52Wis. - - - - - - - - 8 32
W.N. CENTRAL 20 11 - - 3 1 2 2 34 79Minn. 8 8 - - 3 1 - 1 4 5Iowa - 1 - - - - - - 11 19Mo. 7 2 - - - - 2 1 6 17N. Dak. - - - - - - - - - -S. Dak. 1 - - - - - - - - 2Nebr. - - - - - - - - 4 4Kans. 4 - - - - - - - 9 32
S. ATLANTIC 63 91 - - 4 20 - - 283 545Del. - - - - - - - - 1 5Md. 15 18 - - 1 - - - 39 77D.C. - - - - - - - - - 20Va. 2 8 - - - 2 - - 2 11W. Va. 2 1 - - - - - - 4 5N.C. 3 10 - - - 1 - - 15 75S.C. 1 3 - - - 1 - - 10 12Ga. 15 28 - - 2 10 - - 112 68Fla. 25 23 - - 1 6 - - 100 272
E.S. CENTRAL 24 18 - 1 3 4 - - 31 78Ky. 2 1 - - - - - - 6 16Tenn. 10 8 - - 2 2 - - 13 34Ala. 11 5 - 1 1 2 - - 9 7Miss. 1 4 - - - - - - 3 21
W.S. CENTRAL 17 18 - 1 1 4 - - 34 174Ark. 3 1 - - - - - - - 13La. 4 1 - - - - - - 6 6Okla. 10 15 - - 1 4 - - 3 10Tex. - 1 - 1 - - - - 25 145
MOUNTAIN 50 48 1 - 10 9 3 1 80 152Mont. - - - - - - - - - 5Idaho - 1 - - - - - - - 10Wyo. - 1 - - - - - - - 2Colo. 9 11 - - 2 1 - - 7 21N. Mex. 5 10 - - 1 4 2 - 5 4Ariz. 29 17 1 - 5 3 - - 54 80Utah 5 5 - - 2 - - - 5 12Nev. 2 3 - - - 1 1 1 9 18
PACIFIC 18 44 - - 5 11 1 1 187 479Wash. 3 - - - 2 - 1 - 12 21Oreg. 11 24 - - 2 4 - - 20 30Calif. 1 10 - - 1 6 - 1 150 413Alaska - 1 - - - 1 - - 3 5Hawaii 3 9 - - - - - - 2 10
Guam - - - - - - - - - -P.R. - - - - - - - - - -V.I. - - - - - - - - - -Amer. Samoa U U U U U U U U U UC.N.M.I. - U - U - U - U - UN: Not notifiable. U: Unavailable. -: No reported cases.* Incidence data for reporting years 2002 and 2003 are provisional and cumulative (year-to-date).
TABLE II. (Continued) Provisional cases of selected notifiable diseases, United States, weeks ending March 15, 2003, and March 16, 2002(11th Week)*
Haemophilus influenzae, invasive Hepatitis
All ages Age <5 years (viral, acute), by type
All serotypes Serotype B Non-serotype B Unknown serotype ACum. Cum. Cum. Cum. Cum. Cum. Cum. Cum. Cum. Cum.
Reporting area 2003 2002 2003 2002 2003 2002 2003 2002 2003 2002
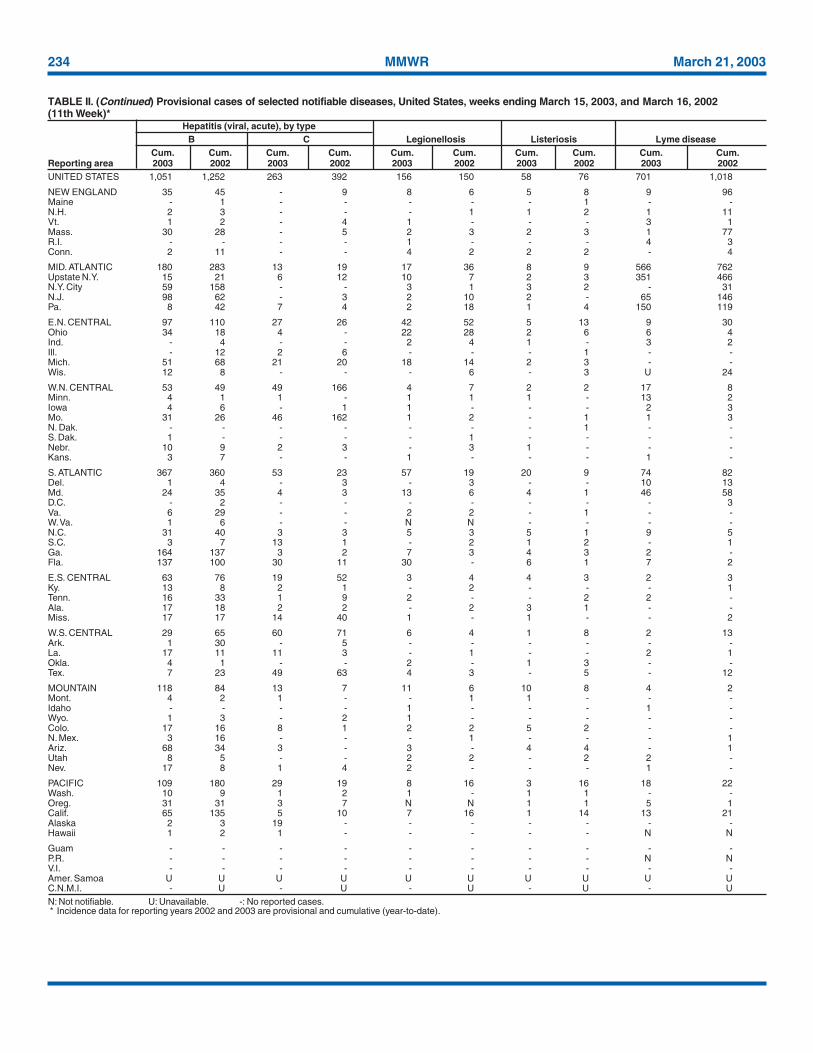
234 MMWR March 21, 2003
UNITED STATES 1,051 1,252 263 392 156 150 58 76 701 1,018
NEW ENGLAND 35 45 - 9 8 6 5 8 9 96Maine - 1 - - - - - 1 - -N.H. 2 3 - - - 1 1 2 1 11Vt. 1 2 - 4 1 - - - 3 1Mass. 30 28 - 5 2 3 2 3 1 77R.I. - - - - 1 - - - 4 3Conn. 2 11 - - 4 2 2 2 - 4
MID. ATLANTIC 180 283 13 19 17 36 8 9 566 762Upstate N.Y. 15 21 6 12 10 7 2 3 351 466N.Y. City 59 158 - - 3 1 3 2 - 31N.J. 98 62 - 3 2 10 2 - 65 146Pa. 8 42 7 4 2 18 1 4 150 119
E.N. CENTRAL 97 110 27 26 42 52 5 13 9 30Ohio 34 18 4 - 22 28 2 6 6 4Ind. - 4 - - 2 4 1 - 3 2Ill. - 12 2 6 - - - 1 - -Mich. 51 68 21 20 18 14 2 3 - -Wis. 12 8 - - - 6 - 3 U 24
W.N. CENTRAL 53 49 49 166 4 7 2 2 17 8Minn. 4 1 1 - 1 1 1 - 13 2Iowa 4 6 - 1 1 - - - 2 3Mo. 31 26 46 162 1 2 - 1 1 3N. Dak. - - - - - - - 1 - -S. Dak. 1 - - - - 1 - - - -Nebr. 10 9 2 3 - 3 1 - - -Kans. 3 7 - - 1 - - - 1 -
S. ATLANTIC 367 360 53 23 57 19 20 9 74 82Del. 1 4 - 3 - 3 - - 10 13Md. 24 35 4 3 13 6 4 1 46 58D.C. - 2 - - - - - - - 3Va. 6 29 - - 2 2 - 1 - -W. Va. 1 6 - - N N - - - -N.C. 31 40 3 3 5 3 5 1 9 5S.C. 3 7 13 1 - 2 1 2 - 1Ga. 164 137 3 2 7 3 4 3 2 -Fla. 137 100 30 11 30 - 6 1 7 2
E.S. CENTRAL 63 76 19 52 3 4 4 3 2 3Ky. 13 8 2 1 - 2 - - - 1Tenn. 16 33 1 9 2 - - 2 2 -Ala. 17 18 2 2 - 2 3 1 - -Miss. 17 17 14 40 1 - 1 - - 2
W.S. CENTRAL 29 65 60 71 6 4 1 8 2 13Ark. 1 30 - 5 - - - - - -La. 17 11 11 3 - 1 - - 2 1Okla. 4 1 - - 2 - 1 3 - -Tex. 7 23 49 63 4 3 - 5 - 12
MOUNTAIN 118 84 13 7 11 6 10 8 4 2Mont. 4 2 1 - - 1 1 - - -Idaho - - - - 1 - - - 1 -Wyo. 1 3 - 2 1 - - - - -Colo. 17 16 8 1 2 2 5 2 - -N. Mex. 3 16 - - - 1 - - - 1Ariz. 68 34 3 - 3 - 4 4 - 1Utah 8 5 - - 2 2 - 2 2 -Nev. 17 8 1 4 2 - - - 1 -
PACIFIC 109 180 29 19 8 16 3 16 18 22Wash. 10 9 1 2 1 - 1 1 - -Oreg. 31 31 3 7 N N 1 1 5 1Calif. 65 135 5 10 7 16 1 14 13 21Alaska 2 3 19 - - - - - - -Hawaii 1 2 1 - - - - - N N
Guam - - - - - - - - - -P.R. - - - - - - - - N NV.I. - - - - - - - - - -Amer. Samoa U U U U U U U U U UC.N.M.I. - U - U - U - U - UN: Not notifiable. U: Unavailable. -: No reported cases.* Incidence data for reporting years 2002 and 2003 are provisional and cumulative (year-to-date).
TABLE II. (Continued) Provisional cases of selected notifiable diseases, United States, weeks ending March 15, 2003, and March 16, 2002(11th Week)*
Hepatitis (viral, acute), by typeB C Legionellosis Listeriosis Lyme disease
Cum. Cum. Cum. Cum. Cum. Cum. Cum. Cum. Cum. Cum.Reporting area 2003 2002 2003 2002 2003 2002 2003 2002 2003 2002
Vol. 52 / No. 11 MMWR 235
UNITED STATES 132 237 342 436 824 1,235 648 1,145 40 59
NEW ENGLAND 5 15 18 32 134 190 74 121 1 -Maine 1 1 1 2 - 3 6 5 - -N.H. 1 4 1 4 9 1 3 1 - -Vt. - - - 3 16 29 6 24 - -Mass. 3 6 14 19 109 152 29 38 1 -R.I. - - - 2 - - 2 6 - -Conn. - 4 2 2 - 5 28 47 - -
MID. ATLANTIC 26 55 20 45 80 71 47 153 1 6Upstate N.Y. 8 8 7 12 53 55 47 93 - -N.Y. City 11 28 5 7 - 5 - 5 - -N.J. 2 11 3 9 5 - - 22 1 -Pa. 5 8 5 17 22 11 - 33 - 6
E.N. CENTRAL 11 30 48 63 75 167 4 3 1 2Ohio 5 7 19 23 56 102 - 1 1 2Ind. - 1 12 10 6 12 2 1 - -Ill. 1 10 - 7 - 19 - 1 - -Mich. 5 8 14 14 9 15 2 - - -Wis. - 4 3 9 4 19 - - - -
W.N. CENTRAL 4 18 29 38 52 112 88 63 2 3Minn. 2 7 4 6 27 32 6 5 - -Iowa 2 2 5 5 7 26 9 6 1 -Mo. - 4 17 17 10 32 - 1 1 3N. Dak. - - - - - - 14 - - -S. Dak. - - - 2 1 5 6 18 - -Nebr. - 2 1 4 2 2 11 - - -Kans. - 3 2 4 5 15 42 33 - -
S. ATLANTIC 46 68 77 64 114 80 355 387 32 44Del. - 1 6 1 1 1 - 3 - -Md. 18 19 7 2 14 11 2 74 5 8D.C. - 2 - - - - - - - -Va. 3 4 4 7 28 22 101 100 - 1W. Va. 2 - 1 - 1 1 12 25 - -N.C. 4 6 5 10 41 11 130 101 27 27S.C. 1 2 3 10 2 18 25 15 - 4Ga. 4 33 10 8 14 10 63 47 - 4Fla. 14 1 41 26 13 6 22 22 - -
E.S. CENTRAL 5 5 19 20 19 40 9 111 1 3Ky. 1 1 - 3 3 9 4 3 - -Tenn. 2 1 3 5 6 22 - 108 1 3Ala. 2 1 6 9 8 2 5 - - -Miss. - 2 10 3 2 7 - - - -
W.S. CENTRAL 7 2 49 59 5 238 39 235 - 1Ark. 1 - 3 7 - 140 13 - - -La. 1 2 17 4 3 1 - - - -Okla. - - 4 6 2 9 26 22 - -Tex. 5 - 25 42 - 88 - 213 - 1
MOUNTAIN 8 7 15 33 176 141 14 27 1 -Mont. - - 1 1 - 2 1 - - -Idaho 1 - - - 6 20 - - - -Wyo. - - - - 15 4 - 1 - -Colo. 6 2 4 10 78 74 - - - -N. Mex. - - 2 1 13 20 - - - -Ariz. 1 2 6 10 44 12 13 26 1 -Utah - 2 - 1 14 7 - - - -Nev. - 1 2 10 6 2 - - - -
PACIFIC 20 37 67 82 169 196 18 45 1 -Wash. 4 1 8 12 53 56 - - - -Oreg. 5 - 21 17 49 12 - - - -Calif. 11 33 36 49 67 123 17 26 1 -Alaska - 1 - 1 - 1 1 19 - -Hawaii - 2 2 3 - 4 - - - -
Guam - - - - - - - - - -P.R. - - - - - - - - N NV.I. - - - - - - - - - -Amer. Samoa U U U U U U U U U UC.N.M.I. - U - U - U - U - U
N: Not notifiable. U: Unavailable. - : No reported cases.* Incidence data for reporting years 2002 and 2003 are provisional and cumulative (year-to-date).
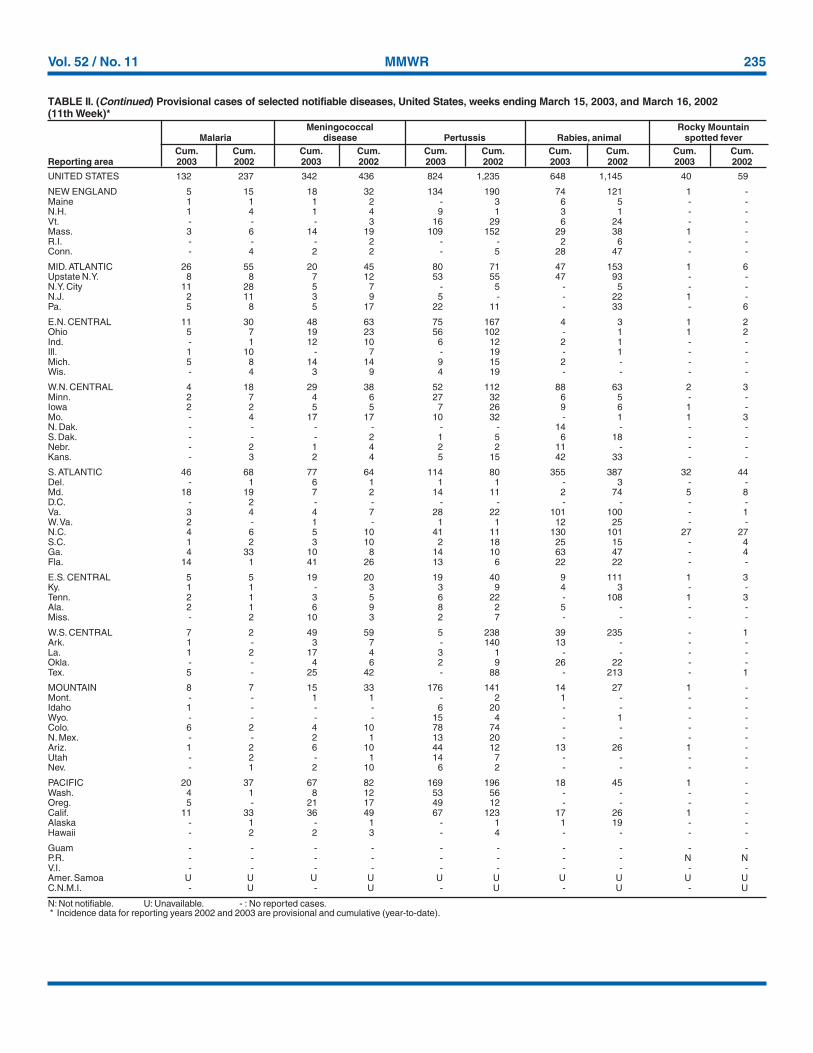
TABLE II. (Continued) Provisional cases of selected notifiable diseases, United States, weeks ending March 15, 2003, and March 16, 2002(11th Week)*
Meningococcal Rocky MountainMalaria disease Pertussis Rabies, animal spotted fever
Cum. Cum. Cum. Cum. Cum. Cum. Cum. Cum. Cum. Cum.Reporting area 2003 2002 2003 2002 2003 2002 2003 2002 2003 2002
236 MMWR March 21, 2003
UNITED STATES 4,075 5,683 3,193 2,809 982 996 542 472 75 39
NEW ENGLAND 192 280 61 52 56 48 2 1 1 1Maine 9 40 2 2 4 7 - - - -N.H. 12 9 - 3 5 12 - - N NVt. 3 12 - - 6 1 2 1 1 1Mass. 116 155 37 39 41 28 N N N NR.I. 10 5 2 - - - - - - -Conn. 42 59 20 8 - - - - - -
MID. ATLANTIC 330 743 177 176 135 165 16 24 18 11Upstate N.Y. 99 129 47 21 91 70 15 24 15 11N.Y. City 125 200 54 73 15 34 U U U UN.J. 27 211 45 39 10 43 N N N NPa. 79 203 31 43 19 18 1 - 3 -
E.N. CENTRAL 582 975 228 386 236 249 105 38 36 20Ohio 215 266 59 194 84 48 81 - 32 -Ind. 46 48 25 11 15 7 24 36 4 6Ill. 169 405 82 115 41 91 - 2 - -Mich. 102 140 47 36 95 67 N N N NWis. 50 116 15 30 1 36 N N - 14
W.N. CENTRAL 288 397 157 269 84 61 70 94 9 6Minn. 81 77 15 31 31 21 - 36 9 5Iowa 67 55 7 25 - - N N N NMo. 76 175 52 32 20 19 3 1 - 1N. Dak. 6 5 - - 3 - 3 - - -S. Dak. 15 18 8 100 8 3 - 1 - -Nebr. 14 18 63 59 11 6 12 18 N NKans. 29 49 12 22 11 12 52 38 N N
S. ATLANTIC 1,285 1,457 1,595 1,036 173 171 302 249 2 1Del. 4 12 66 3 2 - - 3 N NMd. 121 103 134 116 68 22 - - - -D.C. - 15 - 13 - 3 - 16 - 1Va. 78 92 47 205 2 14 N N N NW. Va. 5 6 - 2 5 - 16 6 2 -N.C. 237 197 158 60 22 43 N N U US.C. 60 65 34 9 3 12 20 52 N NGa. 310 357 612 390 16 50 99 101 N NFla. 470 610 544 238 55 27 167 71 N N
E.S. CENTRAL 287 286 165 198 31 31 23 45 - -Ky. 55 33 32 41 5 5 1 6 N NTenn. 86 87 46 14 26 26 22 39 N NAla. 96 94 62 64 - - - - N NMiss. 50 72 25 79 - - - - - -
W.S. CENTRAL 182 346 368 186 48 63 15 7 9 -Ark. 51 56 8 26 1 - 3 2 - -La. 38 48 40 22 1 1 12 5 7 -Okla. 36 48 132 42 22 11 N N 2 -Tex. 57 194 188 96 24 51 N N - -
MOUNTAIN 332 334 210 88 155 69 8 14 - -Mont. 16 7 - - - - - - - -Idaho 24 18 3 2 8 1 N N N NWyo. 4 13 1 1 - 3 1 7 - -Colo. 98 95 31 23 55 28 - - - -N. Mex. 26 50 29 12 34 32 7 7 - -Ariz. 119 82 131 36 53 - - - N NUtah 27 26 6 7 5 5 - - - -Nev. 18 43 9 7 - - - - - -
PACIFIC 597 865 232 418 64 139 1 - - -Wash. 69 29 26 12 - 26 - - N NOreg. 58 55 14 27 N N N N N NCalif. 422 723 178 366 43 98 N N N NAlaska 20 15 3 1 - - - - N NHawaii 28 43 11 12 21 15 1 - - -
Guam - - - - - - - - - -P.R. 3 - - - N N N N N NV.I. - - - - - - - - - -Amer. Samoa U U U U U U U U U UC.N.M.I. - U - U - U - U - U
N: Not notifiable. U: Unavailable. - : No reported cases.* Incidence data for reporting years 2002 and 2003 are provisional and cumulative (year-to-date).
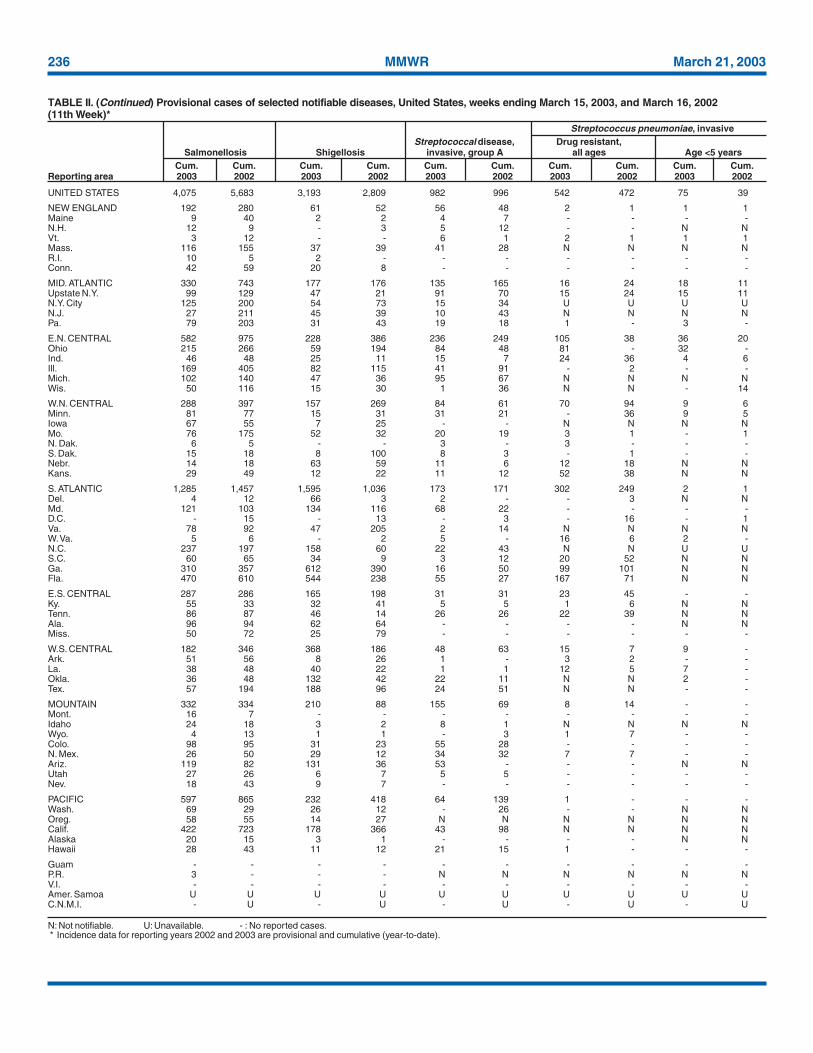
TABLE II. (Continued) Provisional cases of selected notifiable diseases, United States, weeks ending March 15, 2003, and March 16, 2002(11th Week)*
Streptococcus pneumoniae, invasiveStreptococcal disease, Drug resistant,
Salmonellosis Shigellosis invasive, group A all ages Age <5 yearsCum. Cum. Cum. Cum. Cum. Cum. Cum. Cum. Cum. Cum.
Reporting area 2003 2002 2003 2002 2003 2002 2003 2002 2003 2002
Vol. 52 / No. 11 MMWR 237
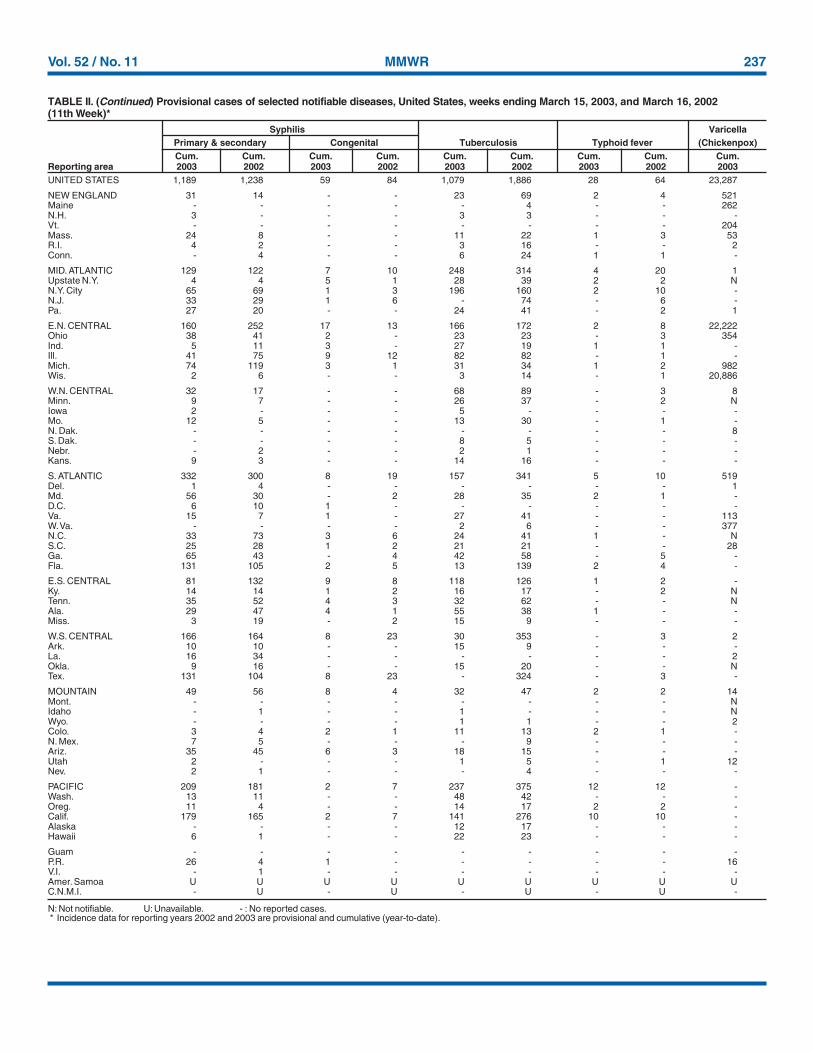
UNITED STATES 1,189 1,238 59 84 1,079 1,886 28 64 23,287
NEW ENGLAND 31 14 - - 23 69 2 4 521Maine - - - - - 4 - - 262N.H. 3 - - - 3 3 - - -Vt. - - - - - - - - 204Mass. 24 8 - - 11 22 1 3 53R.I. 4 2 - - 3 16 - - 2Conn. - 4 - - 6 24 1 1 -
MID. ATLANTIC 129 122 7 10 248 314 4 20 1Upstate N.Y. 4 4 5 1 28 39 2 2 NN.Y. City 65 69 1 3 196 160 2 10 -N.J. 33 29 1 6 - 74 - 6 -Pa. 27 20 - - 24 41 - 2 1
E.N. CENTRAL 160 252 17 13 166 172 2 8 22,222Ohio 38 41 2 - 23 23 - 3 354Ind. 5 11 3 - 27 19 1 1 -Ill. 41 75 9 12 82 82 - 1 -Mich. 74 119 3 1 31 34 1 2 982Wis. 2 6 - - 3 14 - 1 20,886
W.N. CENTRAL 32 17 - - 68 89 - 3 8Minn. 9 7 - - 26 37 - 2 NIowa 2 - - - 5 - - - -Mo. 12 5 - - 13 30 - 1 -N. Dak. - - - - - - - - 8S. Dak. - - - - 8 5 - - -Nebr. - 2 - - 2 1 - - -Kans. 9 3 - - 14 16 - - -
S. ATLANTIC 332 300 8 19 157 341 5 10 519Del. 1 4 - - - - - - 1Md. 56 30 - 2 28 35 2 1 -D.C. 6 10 1 - - - - - -Va. 15 7 1 - 27 41 - - 113W. Va. - - - - 2 6 - - 377N.C. 33 73 3 6 24 41 1 - NS.C. 25 28 1 2 21 21 - - 28Ga. 65 43 - 4 42 58 - 5 -Fla. 131 105 2 5 13 139 2 4 -
E.S. CENTRAL 81 132 9 8 118 126 1 2 -Ky. 14 14 1 2 16 17 - 2 NTenn. 35 52 4 3 32 62 - - NAla. 29 47 4 1 55 38 1 - -Miss. 3 19 - 2 15 9 - - -
W.S. CENTRAL 166 164 8 23 30 353 - 3 2Ark. 10 10 - - 15 9 - - -La. 16 34 - - - - - - 2Okla. 9 16 - - 15 20 - - NTex. 131 104 8 23 - 324 - 3 -
MOUNTAIN 49 56 8 4 32 47 2 2 14Mont. - - - - - - - - NIdaho - 1 - - 1 - - - NWyo. - - - - 1 1 - - 2Colo. 3 4 2 1 11 13 2 1 -N. Mex. 7 5 - - - 9 - - -Ariz. 35 45 6 3 18 15 - - -Utah 2 - - - 1 5 - 1 12Nev. 2 1 - - - 4 - - -
PACIFIC 209 181 2 7 237 375 12 12 -Wash. 13 11 - - 48 42 - - -Oreg. 11 4 - - 14 17 2 2 -Calif. 179 165 2 7 141 276 10 10 -Alaska - - - - 12 17 - - -Hawaii 6 1 - - 22 23 - - -
Guam - - - - - - - - -P.R. 26 4 1 - - - - - 16V.I. - 1 - - - - - - -Amer. Samoa U U U U U U U U UC.N.M.I. - U - U - U - U -
N: Not notifiable. U: Unavailable. - : No reported cases.* Incidence data for reporting years 2002 and 2003 are provisional and cumulative (year-to-date).
TABLE II. (Continued) Provisional cases of selected notifiable diseases, United States, weeks ending March 15, 2003, and March 16, 2002(11th Week)*
Syphilis VaricellaPrimary & secondary Congenital Tuberculosis Typhoid fever (Chickenpox)Cum. Cum. Cum. Cum. Cum. Cum. Cum. Cum. Cum.
Reporting area 2003 2002 2003 2002 2003 2002 2003 2002 2003
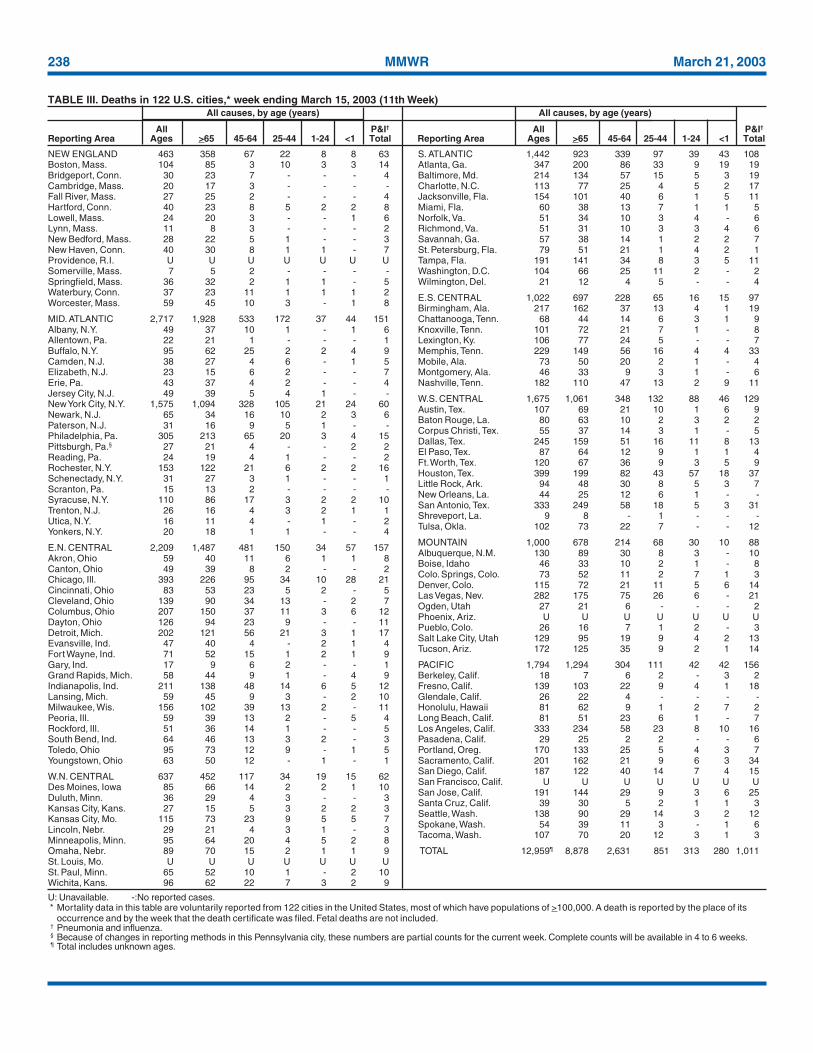
238 MMWR March 21, 2003
NEW ENGLAND 463 358 67 22 8 8 63Boston, Mass. 104 85 3 10 3 3 14Bridgeport, Conn. 30 23 7 - - - 4Cambridge, Mass. 20 17 3 - - - -Fall River, Mass. 27 25 2 - - - 4Hartford, Conn. 40 23 8 5 2 2 8Lowell, Mass. 24 20 3 - - 1 6Lynn, Mass. 11 8 3 - - - 2New Bedford, Mass. 28 22 5 1 - - 3New Haven, Conn. 40 30 8 1 1 - 7Providence, R.I. U U U U U U USomerville, Mass. 7 5 2 - - - -Springfield, Mass. 36 32 2 1 1 - 5Waterbury, Conn. 37 23 11 1 1 1 2Worcester, Mass. 59 45 10 3 - 1 8
MID. ATLANTIC 2,717 1,928 533 172 37 44 151Albany, N.Y. 49 37 10 1 - 1 6Allentown, Pa. 22 21 1 - - - 1Buffalo, N.Y. 95 62 25 2 2 4 9Camden, N.J. 38 27 4 6 - 1 5Elizabeth, N.J. 23 15 6 2 - - 7Erie, Pa. 43 37 4 2 - - 4Jersey City, N.J. 49 39 5 4 1 - -New York City, N.Y. 1,575 1,094 328 105 21 24 60Newark, N.J. 65 34 16 10 2 3 6Paterson, N.J. 31 16 9 5 1 - -Philadelphia, Pa. 305 213 65 20 3 4 15Pittsburgh, Pa.§ 27 21 4 - - 2 2Reading, Pa. 24 19 4 1 - - 2Rochester, N.Y. 153 122 21 6 2 2 16Schenectady, N.Y. 31 27 3 1 - - 1Scranton, Pa. 15 13 2 - - - -Syracuse, N.Y. 110 86 17 3 2 2 10Trenton, N.J. 26 16 4 3 2 1 1Utica, N.Y. 16 11 4 - 1 - 2Yonkers, N.Y. 20 18 1 1 - - 4
E.N. CENTRAL 2,209 1,487 481 150 34 57 157Akron, Ohio 59 40 11 6 1 1 8Canton, Ohio 49 39 8 2 - - 2Chicago, Ill. 393 226 95 34 10 28 21Cincinnati, Ohio 83 53 23 5 2 - 5Cleveland, Ohio 139 90 34 13 - 2 7Columbus, Ohio 207 150 37 11 3 6 12Dayton, Ohio 126 94 23 9 - - 11Detroit, Mich. 202 121 56 21 3 1 17Evansville, Ind. 47 40 4 - 2 1 4Fort Wayne, Ind. 71 52 15 1 2 1 9Gary, Ind. 17 9 6 2 - - 1Grand Rapids, Mich. 58 44 9 1 - 4 9Indianapolis, Ind. 211 138 48 14 6 5 12Lansing, Mich. 59 45 9 3 - 2 10Milwaukee, Wis. 156 102 39 13 2 - 11Peoria, Ill. 59 39 13 2 - 5 4Rockford, Ill. 51 36 14 1 - - 5South Bend, Ind. 64 46 13 3 2 - 3Toledo, Ohio 95 73 12 9 - 1 5Youngstown, Ohio 63 50 12 - 1 - 1
W.N. CENTRAL 637 452 117 34 19 15 62Des Moines, Iowa 85 66 14 2 2 1 10Duluth, Minn. 36 29 4 3 - - 3Kansas City, Kans. 27 15 5 3 2 2 3Kansas City, Mo. 115 73 23 9 5 5 7Lincoln, Nebr. 29 21 4 3 1 - 3Minneapolis, Minn. 95 64 20 4 5 2 8Omaha, Nebr. 89 70 15 2 1 1 9St. Louis, Mo. U U U U U U USt. Paul, Minn. 65 52 10 1 - 2 10Wichita, Kans. 96 62 22 7 3 2 9
S. ATLANTIC 1,442 923 339 97 39 43 108Atlanta, Ga. 347 200 86 33 9 19 19Baltimore, Md. 214 134 57 15 5 3 19Charlotte, N.C. 113 77 25 4 5 2 17Jacksonville, Fla. 154 101 40 6 1 5 11Miami, Fla. 60 38 13 7 1 1 5Norfolk, Va. 51 34 10 3 4 - 6Richmond, Va. 51 31 10 3 3 4 6Savannah, Ga. 57 38 14 1 2 2 7St. Petersburg, Fla. 79 51 21 1 4 2 1Tampa, Fla. 191 141 34 8 3 5 11Washington, D.C. 104 66 25 11 2 - 2Wilmington, Del. 21 12 4 5 - - 4
E.S. CENTRAL 1,022 697 228 65 16 15 97Birmingham, Ala. 217 162 37 13 4 1 19Chattanooga, Tenn. 68 44 14 6 3 1 9Knoxville, Tenn. 101 72 21 7 1 - 8Lexington, Ky. 106 77 24 5 - - 7Memphis, Tenn. 229 149 56 16 4 4 33Mobile, Ala. 73 50 20 2 1 - 4Montgomery, Ala. 46 33 9 3 1 - 6Nashville, Tenn. 182 110 47 13 2 9 11
W.S. CENTRAL 1,675 1,061 348 132 88 46 129Austin, Tex. 107 69 21 10 1 6 9Baton Rouge, La. 80 63 10 2 3 2 2Corpus Christi, Tex. 55 37 14 3 1 - 5Dallas, Tex. 245 159 51 16 11 8 13El Paso, Tex. 87 64 12 9 1 1 4Ft. Worth, Tex. 120 67 36 9 3 5 9Houston, Tex. 399 199 82 43 57 18 37Little Rock, Ark. 94 48 30 8 5 3 7New Orleans, La. 44 25 12 6 1 - -San Antonio, Tex. 333 249 58 18 5 3 31Shreveport, La. 9 8 - 1 - - -Tulsa, Okla. 102 73 22 7 - - 12
MOUNTAIN 1,000 678 214 68 30 10 88Albuquerque, N.M. 130 89 30 8 3 - 10Boise, Idaho 46 33 10 2 1 - 8Colo. Springs, Colo. 73 52 11 2 7 1 3Denver, Colo. 115 72 21 11 5 6 14Las Vegas, Nev. 282 175 75 26 6 - 21Ogden, Utah 27 21 6 - - - 2Phoenix, Ariz. U U U U U U UPueblo, Colo. 26 16 7 1 2 - 3Salt Lake City, Utah 129 95 19 9 4 2 13Tucson, Ariz. 172 125 35 9 2 1 14
PACIFIC 1,794 1,294 304 111 42 42 156Berkeley, Calif. 18 7 6 2 - 3 2Fresno, Calif. 139 103 22 9 4 1 18Glendale, Calif. 26 22 4 - - - -Honolulu, Hawaii 81 62 9 1 2 7 2Long Beach, Calif. 81 51 23 6 1 - 7Los Angeles, Calif. 333 234 58 23 8 10 16Pasadena, Calif. 29 25 2 2 - - 6Portland, Oreg. 170 133 25 5 4 3 7Sacramento, Calif. 201 162 21 9 6 3 34San Diego, Calif. 187 122 40 14 7 4 15San Francisco, Calif. U U U U U U USan Jose, Calif. 191 144 29 9 3 6 25Santa Cruz, Calif. 39 30 5 2 1 1 3Seattle, Wash. 138 90 29 14 3 2 12Spokane, Wash. 54 39 11 3 - 1 6Tacoma, Wash. 107 70 20 12 3 1 3
TOTAL 12,959¶ 8,878 2,631 851 313 280 1,011
U: Unavailable. -:No reported cases.* Mortality data in this table are voluntarily reported from 122 cities in the United States, most of which have populations of >100,000. A death is reported by the place of its
occurrence and by the week that the death certificate was filed. Fetal deaths are not included.† Pneumonia and influenza.§ Because of changes in reporting methods in this Pennsylvania city, these numbers are partial counts for the current week. Complete counts will be available in 4 to 6 weeks.¶ Total includes unknown ages.
TABLE III. Deaths in 122 U.S. cities,* week ending March 15, 2003 (11th Week)All causes, by age (years) All causes, by age (years)
All P&I† All P&I†
Reporting Area Ages >65 45-64 25-44 1-24 <1 Total Reporting Area Ages >65 45-64 25-44 1-24 <1 Total
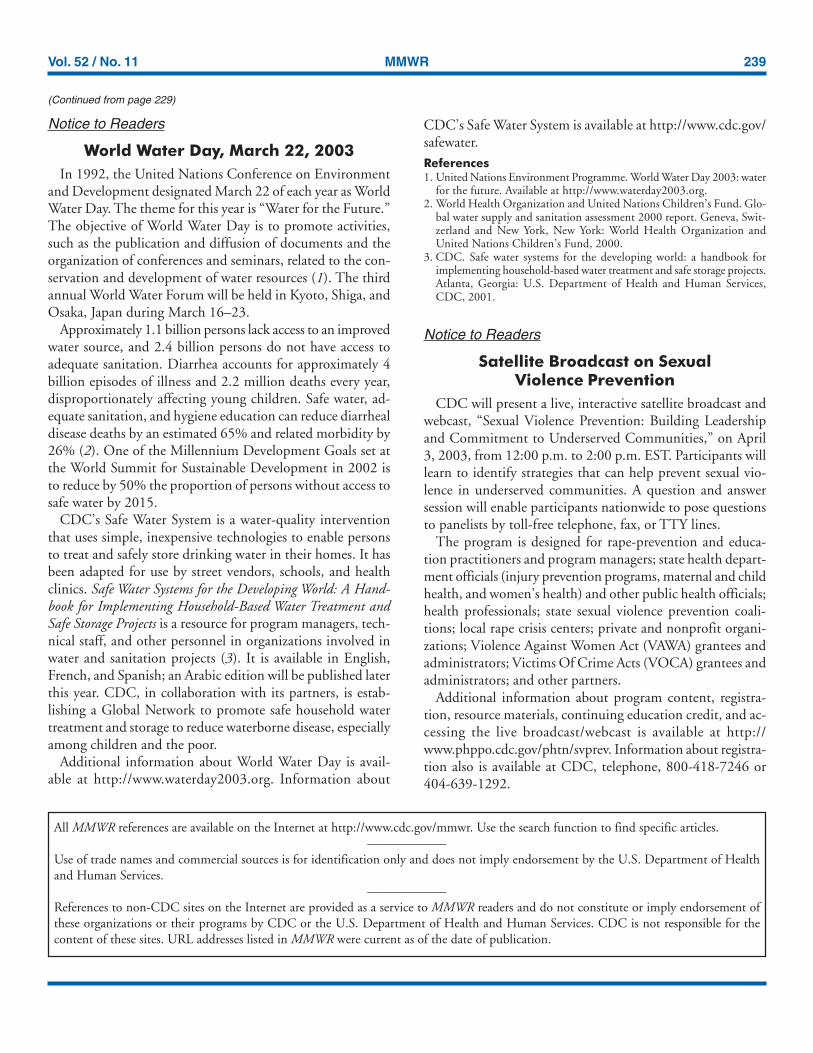
Vol. 52 / No. 11 MMWR 239
All MMWR references are available on the Internet at http://www.cdc.gov/mmwr. Use the search function to find specific articles.——————
Use of trade names and commercial sources is for identification only and does not imply endorsement by the U.S. Department of Healthand Human Services.
——————References to non-CDC sites on the Internet are provided as a service to MMWR readers and do not constitute or imply endorsement ofthese organizations or their programs by CDC or the U.S. Department of Health and Human Services. CDC is not responsible for thecontent of these sites. URL addresses listed in MMWR were current as of the date of publication.
(Continued from page 229)
Notice to Readers
World Water Day, March 22, 2003In 1992, the United Nations Conference on Environment
and Development designated March 22 of each year as WorldWater Day. The theme for this year is “Water for the Future.”The objective of World Water Day is to promote activities,such as the publication and diffusion of documents and theorganization of conferences and seminars, related to the con-servation and development of water resources (1). The thirdannual World Water Forum will be held in Kyoto, Shiga, andOsaka, Japan during March 16–23.
Approximately 1.1 billion persons lack access to an improvedwater source, and 2.4 billion persons do not have access toadequate sanitation. Diarrhea accounts for approximately 4billion episodes of illness and 2.2 million deaths every year,disproportionately affecting young children. Safe water, ad-equate sanitation, and hygiene education can reduce diarrhealdisease deaths by an estimated 65% and related morbidity by26% (2). One of the Millennium Development Goals set atthe World Summit for Sustainable Development in 2002 isto reduce by 50% the proportion of persons without access tosafe water by 2015.
CDC’s Safe Water System is a water-quality interventionthat uses simple, inexpensive technologies to enable personsto treat and safely store drinking water in their homes. It hasbeen adapted for use by street vendors, schools, and healthclinics. Safe Water Systems for the Developing World: A Hand-book for Implementing Household-Based Water Treatment andSafe Storage Projects is a resource for program managers, tech-nical staff, and other personnel in organizations involved inwater and sanitation projects (3). It is available in English,French, and Spanish; an Arabic edition will be published laterthis year. CDC, in collaboration with its partners, is estab-lishing a Global Network to promote safe household watertreatment and storage to reduce waterborne disease, especiallyamong children and the poor.
Additional information about World Water Day is avail-able at http://www.waterday2003.org. Information about
CDC’s Safe Water System is available at http://www.cdc.gov/safewater.References1. United Nations Environment Programme. World Water Day 2003: water
for the future. Available at http://www.waterday2003.org.2. World Health Organization and United Nations Children’s Fund. Glo-
bal water supply and sanitation assessment 2000 report. Geneva, Swit-zerland and New York, New York: World Health Organization andUnited Nations Children’s Fund, 2000.
3. CDC. Safe water systems for the developing world: a handbook forimplementing household-based water treatment and safe storage projects.Atlanta, Georgia: U.S. Department of Health and Human Services,CDC, 2001.
Notice to Readers
Satellite Broadcast on SexualViolence Prevention
CDC will present a live, interactive satellite broadcast andwebcast, “Sexual Violence Prevention: Building Leadershipand Commitment to Underserved Communities,” on April3, 2003, from 12:00 p.m. to 2:00 p.m. EST. Participants willlearn to identify strategies that can help prevent sexual vio-lence in underserved communities. A question and answersession will enable participants nationwide to pose questionsto panelists by toll-free telephone, fax, or TTY lines.
The program is designed for rape-prevention and educa-tion practitioners and program managers; state health depart-ment officials (injury prevention programs, maternal and childhealth, and women’s health) and other public health officials;health professionals; state sexual violence prevention coali-tions; local rape crisis centers; private and nonprofit organi-zations; Violence Against Women Act (VAWA) grantees andadministrators; Victims Of Crime Acts (VOCA) grantees andadministrators; and other partners.
Additional information about program content, registra-tion, resource materials, continuing education credit, and ac-cessing the live broadcast/webcast is available at http://www.phppo.cdc.gov/phtn/svprev. Information about registra-tion also is available at CDC, telephone, 800-418-7246 or404-639-1292.
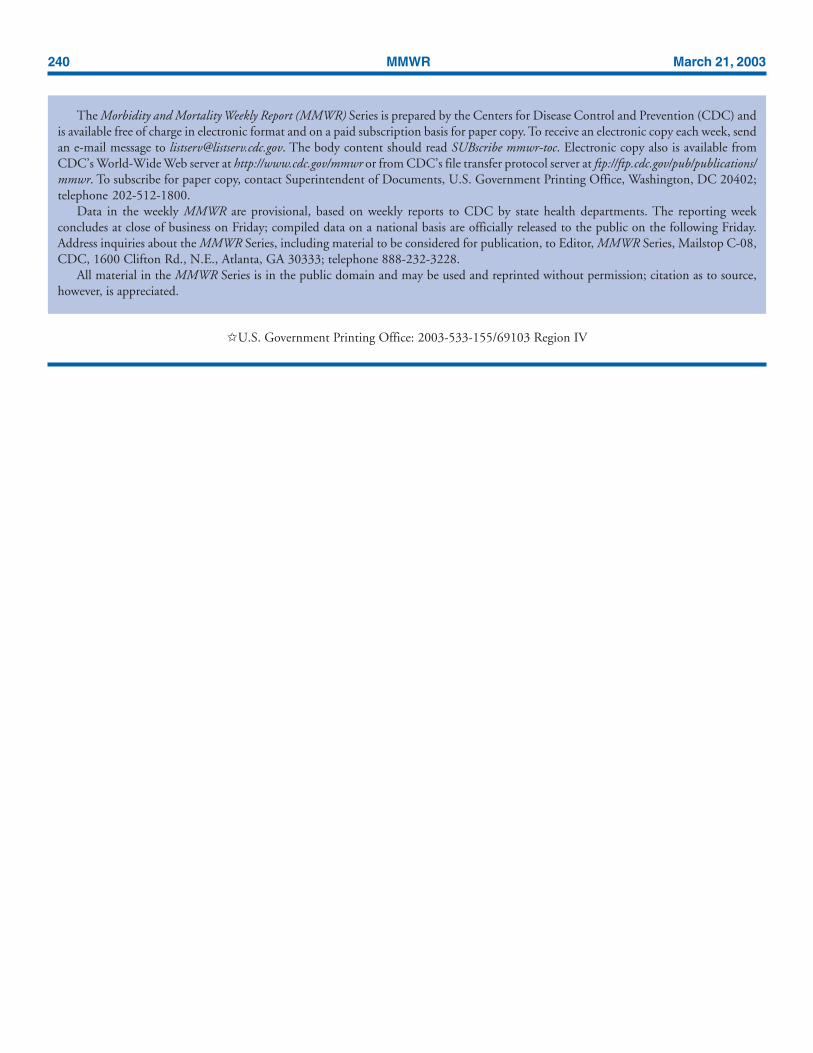
MMWR
The Morbidity and Mortality Weekly Report (MMWR) Series is prepared by the Centers for Disease Control and Prevention (CDC) andis available free of charge in electronic format and on a paid subscription basis for paper copy. To receive an electronic copy each week, sendan e-mail message to [email protected]. The body content should read SUBscribe mmwr-toc. Electronic copy also is available fromCDC’s World-Wide Web server at http://www.cdc.gov/mmwr or from CDC’s file transfer protocol server at ftp://ftp.cdc.gov/pub/publications/mmwr. To subscribe for paper copy, contact Superintendent of Documents, U.S. Government Printing Office, Washington, DC 20402;telephone 202-512-1800.
Data in the weekly MMWR are provisional, based on weekly reports to CDC by state health departments. The reporting weekconcludes at close of business on Friday; compiled data on a national basis are officially released to the public on the following Friday.Address inquiries about the MMWR Series, including material to be considered for publication, to Editor, MMWR Series, Mailstop C-08,CDC, 1600 Clifton Rd., N.E., Atlanta, GA 30333; telephone 888-232-3228.
All material in the MMWR Series is in the public domain and may be used and reprinted without permission; citation as to source,however, is appreciated.
✩U.S. Government Printing Office: 2003-533-155/69103 Region IV
240 March 21, 2003