morbidity and mortality weekly report · 2002-05-30 · morbidity and mortality weekly report...
TRANSCRIPT
Morbidity and Mortality Weekly Report
Weekly May 31, 2002 / Vol. 51 / No. 21
Centers for Disease Control and PreventionCenters for Disease Control and PreventionCenters for Disease Control and PreventionCenters for Disease Control and PreventionCenters for Disease Control and PreventionSAFER • HEALSAFER • HEALSAFER • HEALSAFER • HEALSAFER • HEALTHIER • PEOPLETHIER • PEOPLETHIER • PEOPLETHIER • PEOPLETHIER • PEOPLETM
Occupational Exposures to Air Contaminants at the World Trade CenterDisaster Site — New York, September–October, 2001
Amid concerns about the fires and suspected presence oftoxic materials in the rubble pile following the collapse of theWorld Trade Center (WTC) buildings on September 11, 2001,the New York City Department of Health (NYCDOH) askedCDC for assistance in evaluating occupational exposures atthe site. CDC’s National Institute for Occupational Safetyand Health (NIOSH) collected general area (GA) and per-sonal breathing zone (PBZ) air samples for numerous poten-tial air contaminants. This report summarizes the results ofthe assessment, which indicate that most exposures, includ-ing asbestos, did not exceed NIOSH recommended exposurelimits (RELs) or Occupational Safety and Health Adminis-tration (OSHA) permissible exposure limits (PELs) (1,2). Onetorch cutter was overexposed to cadmium; another workerwas overexposed to carbon monoxide (CO) while cutting metalbeams with an oxyacetylene torch or a gasoline-powered saw,and two more were possibly overexposed to CO. NIOSH rec-ommended that workers ensure adequate on-site ventilationwhen using gas-powered equipment and use rechargeable,battery-powered equipment when possible.
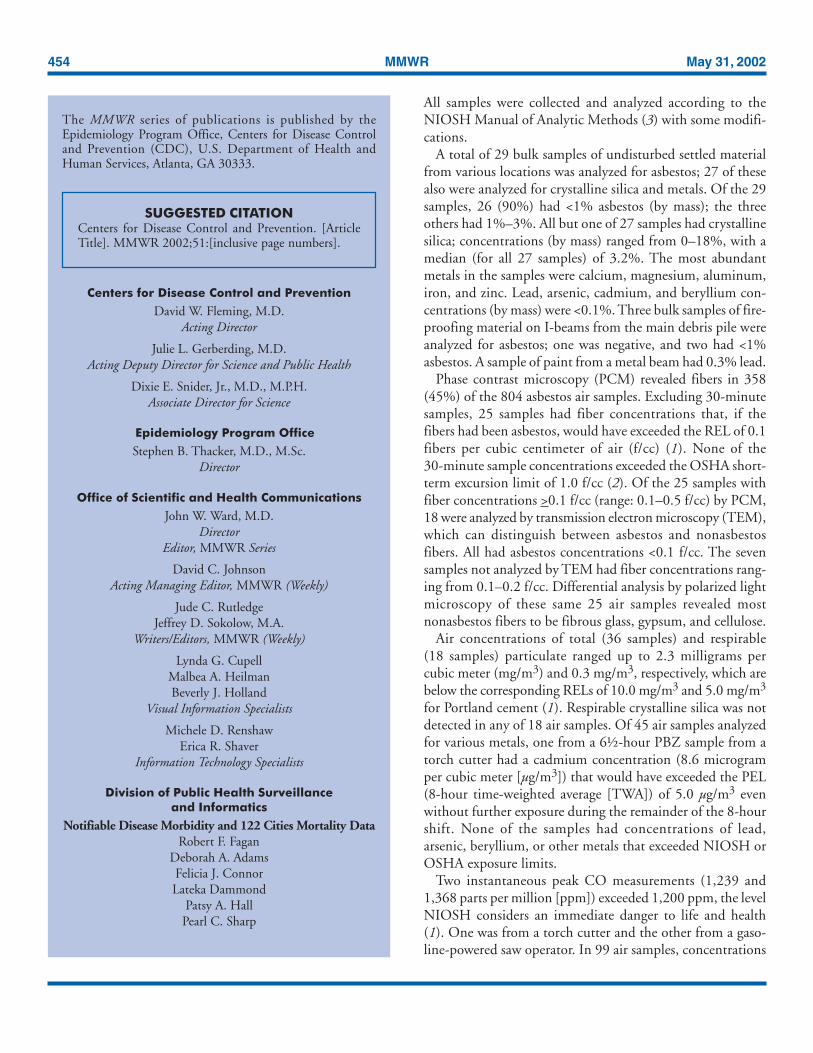
Toxic substances of concern included asbestos (from insu-lation and fireproofing materials), concrete (made from Port-land cement and used in the buildings’ construction) and thecrystalline silica it contained, CO (from fires and engineexhaust), diesel exhaust (from vehicles and equipment), mer-cury (from fluorescent lights), chlorodifluoromethane(Freon™-22, from air conditioning systems), heavy metals(from building materials), hydrogen sulfide (from sewers,anaerobically decomposing bodies, and spoiled food), inor-ganic acids, volatile organic compounds (VOCs), and poly-nuclear aromatic hydrocarbons (PAHs) (from fires and engineexhaust). Environmental sampling during September 18–October 4 focused on search-and-rescue personnel, heavy equip-ment operators, and workers cutting metal beams (Figure 1) but
also included various other occupations. A total of 1,174 airsamples was collected, including 804 for asbestos. NYCDOHcontractors collected most of the asbestos samples; NIOSHpersonnel collected all other samples. In addition, NIOSHcollected 33 bulk samples of dust, debris, and other materials.
FIGURE 1. A worker clears rubble at the World Trade Centerdisaster site using an oxyacetylene torch
Photo/National Institute for Occupational Safety and Health
INSIDE
456 State-Specific Trends in Self-Reported Blood PressureScreening and High Blood Pressure — United States,1991–1999
460 Nonfatal Physical Assault–Related Injuries Treated inHospital Emergency Departments — United States,2000
454 MMWR May 31, 2002
SUGGESTED CITATIONCenters for Disease Control and Prevention. [ArticleTitle]. MMWR 2002;51:[inclusive page numbers].
Centers for Disease Control and Prevention
David W. Fleming, M.D.Acting Director
Julie L. Gerberding, M.D.Acting Deputy Director for Science and Public Health
Dixie E. Snider, Jr., M.D., M.P.H.Associate Director for Science
Epidemiology Program Office
Stephen B. Thacker, M.D., M.Sc.Director
Office of Scientific and Health Communications
John W. Ward, M.D.Director
Editor, MMWR Series
David C. JohnsonActing Managing Editor, MMWR (Weekly)
Jude C. RutledgeJeffrey D. Sokolow, M.A.
Writers/Editors, MMWR (Weekly)
Lynda G. CupellMalbea A. HeilmanBeverly J. Holland
Visual Information Specialists
Michele D. RenshawErica R. Shaver
Information Technology Specialists
Division of Public Health Surveillanceand Informatics
Notifiable Disease Morbidity and 122 Cities Mortality DataRobert F. Fagan
Deborah A. AdamsFelicia J. ConnorLateka Dammond
Patsy A. HallPearl C. Sharp
The MMWR series of publications is published by theEpidemiology Program Office, Centers for Disease Controland Prevention (CDC), U.S. Department of Health andHuman Services, Atlanta, GA 30333.
All samples were collected and analyzed according to theNIOSH Manual of Analytic Methods (3) with some modifi-cations.
A total of 29 bulk samples of undisturbed settled materialfrom various locations was analyzed for asbestos; 27 of thesealso were analyzed for crystalline silica and metals. Of the 29samples, 26 (90%) had <1% asbestos (by mass); the threeothers had 1%–3%. All but one of 27 samples had crystallinesilica; concentrations (by mass) ranged from 0–18%, with amedian (for all 27 samples) of 3.2%. The most abundantmetals in the samples were calcium, magnesium, aluminum,iron, and zinc. Lead, arsenic, cadmium, and beryllium con-centrations (by mass) were <0.1%. Three bulk samples of fire-proofing material on I-beams from the main debris pile wereanalyzed for asbestos; one was negative, and two had <1%asbestos. A sample of paint from a metal beam had 0.3% lead.
Phase contrast microscopy (PCM) revealed fibers in 358(45%) of the 804 asbestos air samples. Excluding 30-minutesamples, 25 samples had fiber concentrations that, if thefibers had been asbestos, would have exceeded the REL of 0.1fibers per cubic centimeter of air (f/cc) (1). None of the30-minute sample concentrations exceeded the OSHA short-term excursion limit of 1.0 f/cc (2). Of the 25 samples withfiber concentrations >0.1 f/cc (range: 0.1–0.5 f/cc) by PCM,18 were analyzed by transmission electron microscopy (TEM),which can distinguish between asbestos and nonasbestosfibers. All had asbestos concentrations <0.1 f/cc. The sevensamples not analyzed by TEM had fiber concentrations rang-ing from 0.1–0.2 f/cc. Differential analysis by polarized lightmicroscopy of these same 25 air samples revealed mostnonasbestos fibers to be fibrous glass, gypsum, and cellulose.
Air concentrations of total (36 samples) and respirable(18 samples) particulate ranged up to 2.3 milligrams percubic meter (mg/m3) and 0.3 mg/m3, respectively, which arebelow the corresponding RELs of 10.0 mg/m3 and 5.0 mg/m3
for Portland cement (1). Respirable crystalline silica was notdetected in any of 18 air samples. Of 45 air samples analyzedfor various metals, one from a 6½-hour PBZ sample from atorch cutter had a cadmium concentration (8.6 microgramper cubic meter [µg/m3]) that would have exceeded the PEL(8-hour time-weighted average [TWA]) of 5.0 µg/m3 evenwithout further exposure during the remainder of the 8-hourshift. None of the samples had concentrations of lead,arsenic, beryllium, or other metals that exceeded NIOSH orOSHA exposure limits.
Two instantaneous peak CO measurements (1,239 and1,368 parts per million [ppm]) exceeded 1,200 ppm, the levelNIOSH considers an immediate danger to life and health(1). One was from a torch cutter and the other from a gaso-line-powered saw operator. In 99 air samples, concentrations
Vol. 51 / No. 21 MMWR 455
of CO ranged from 0.2 to 242.0 ppm; the highest finding(in a 32½-minute PBZ sample from a saw operator) exceededthe NIOSH limit of 200 ppm and would have exceeded thePEL of 50 ppm (8-hour TWA) had it been sustained for2 hours (1,2). CO concentrations of 41 ppm and 45 ppm inPBZ samples from torch cutters and 40 ppm in a GA samplenear a saw operator, with sampling durations of ½, 5, and 2½hours, respectively, would have exceeded the REL of 35 ppmhad they represented full-shift exposures (1,2).
Hydrogen sulfide was present in seven of 10 samples, oneor more inorganic acids in all 27 samples, mercury in five of16 samples, and one or more VOCs in 14 of 76 samples; allconcentrations were below applicable NIOSH and OSHAexposure limits except for two benzene concentrations (0.4mg/m3 and 0.5 mg/m3) that exceeded the REL of 0.3 mg/m3
(1). Both were in GA samples from a smoke plume and didnot represent any specific worker’s exposure. The highest con-centration of elemental carbon (an indicator of diesel exhaust)was 0.023 mg/m3. Neither NIOSH nor OSHA has anumerical exposure limit for diesel exhaust, but the Ameri-can Conference of Governmental Hygienists has proposed alimit of 0.2 mg/m3 (measured as elemental carbon) (4). NoFreon™-22 was detected in any of five samples. Small amountsof various PAHs were present in all 12 samples, but not atconcentrations that exceeded individually or collectivelyany applicable NIOSH or OSHA exposure limit.Reported by: K McKinney, MPA, New York City Dept of Health;S Benson, New York City Office of Emergency Management; A Lempert,New York City School Construction Authority. M Singal, MD,Cincinnati, Ohio. K Wallingford, MS, E Snyder, MS, Div ofSurveillance, Hazard Evaluations and Field Studies, National Institutefor Occupational Safety and Health, CDC.
Editorial Note: In addition to the physical hazards associ-ated with work at the WTC site, hazardous exposures to toxicdusts and gases were suspected initially. Asbestos exposure, inparticular, was an occupational and community health con-cern. The findings of this survey documented no occupationalexposure to asbestos, at least after September 18, in excess ofNIOSH or OSHA occupational exposure limits. The sevenair samples that had fiber concentrations (determined byPCM) higher than the REL for asbestos probably would havehad asbestos concentrations <0.1 f/cc if analyzed by TEM. Inmany other samples, asbestos concentrations determined byTEM tended to be lower than those determined by PCM.The NIOSH asbestos sampling did not provide data aboutoccupational exposures before September 18 and was designedto assess occupational exposures, not community exposures,which probably were lower.
The absence of exposure to respirable crystalline silica,despite its presence in the bulk samples, indicates either thatthe crystalline silica in the dust at the site consisted of larger,nonrespirable particles or that work activities were not caus-ing the dust to become airborne. In the absence of effectivedust-control measures, the former explanation seems morelikely. Although the air sampling indicated the presence ofrespirable airborne particulate, this material was apparentlynot crystalline silica. One torch cutter had cadmium overex-posure, and excess CO was associated with workers using oxy-acetylene torches and gasoline-powered saws. To reduce COexposure, NIOSH recommended replacing gasoline-poweredsaws with rechargeable, battery-powered saws.
At the time of the NIOSH sampling, the ambient air didnot appear to be contaminated with toxic substances fromthe buildings or their contents or with combustion productsto an extent that posed an occupational health hazard. How-ever, the presence of hazards related to specific work activitiesat the WTC disaster site underscores the importance ofassessing suspected occupational exposures. In response to theWTC disaster, NIOSH has issued guidelines for addressing avariety of occupational safety and health hazards at disastersites (5).
AcknowledgmentsThis report is based on data contributed by: New York City School
Construction Authority. Data Chem Laboratories, Salt Lake City,Utah. B Bernard, MD, D Booher, G Burr, E Esswein, MSPH,R Hall, MS, J Harney, MS, D Hewett, MS, B King, MPH,S Lenhart, MSPH, B Lushniak, MD, R McCleery, MSPH,K Martinez, MSEE, D Mattorano, MS, A Weber, MS, Div ofSurveillance, Hazard Evaluations, and Field Studies; K Linch, MS,P Middendorf, PhD, Div of Respiratory Disease Studies; S Earnest,PhD, A Echt, MPH, J Fernback, A Grote, C Neumeister, E Kennedy,PhD, T Zimmer, PhD, Div of Applied Research Technology,National Institute for Occupational Safety and Health, CDC.
References1. National Institute for Occupational Safety and Health. NIOSH pocket
guide to chemical hazards. Cincinnati, Ohio: U.S. Department of Healthand Human Services, CDC, National Institute for Occupational Safetyand Health, 1997 (DHHS publication no. 97-140).
2. Occupational Safety and Health Administration. Toxic and hazardoussubstances, 29 C.F.R. 1910 Subpart Z. U.S. Department of Labor,Occupational Safety and Health Administration. Available at http://www.osha-slc.gov/OshStd_toc/OSHA_Std_toc_1910_SUBPART_Z.html.
3. National Institute for Occupational Safety and Health. NIOSH manualof analytical methods, 4th ed. Cincinnati, Ohio: U.S. Department ofHealth and Human Services, CDC, National Institute for OccupationalSafety and Health, 1994 (DHHS publication no. 94-113).
4. American Conference of Government Industrial Hygienists. Thresholdlimit values for chemical substances and physical agents & biologicalexposure indices. Cincinnati, Ohio: American Conference of Govern-mental Industrial Hygienists, 2001.
456 MMWR May 31, 2002
5. National Institute for Occupational Safety and Health. Suggested guid-ance for supervisors at disaster rescue sites. Cincinnati, Ohio: U.S.Department of Health and Human Services, CDC, National Institutefor Occupational Safety and Health. Available at http://www.cdc.gov/niosh/emhaz2.html.
State-Specific Trends in Self-Reported Blood Pressure Screeningand High Blood Pressure — United
States, 1991–1999High blood pressure (HBP) increases the risk for heart dis-
ease and stroke, the first and third leading causes of death inthe United States, respectively. An estimated one in four U.S.adults has HBP, which is defined as taking antihypertensivemedication or having either a systolic blood pressure (SBP) of>140 mmHg or a diastolic blood pressure (DBP) of>90 mmHg (1). Optimal blood pressure is defined as SBP of<120 mmHg or DBP of <80 mmHg. To reduce the preva-lence of HBP in the United States, the National Heart, Lung,and Blood Institute initiated the National High Blood Pres-sure Education Program (NHBPEP) in 1972, recommend-ing that all adults aged >20 years have their blood pressure(BP) checked at least once every 2 years. Although HBP iseasily detectable and can usually be controlled with treatment,greater awareness of BP levels among U.S. adults is needed(2). This report summarizes data from the Behavioral RiskFactor Surveillance System (BRFSS) on state-specific trendsin recent BP screening and prevalence of HBP (both by self-report). The findings indicate that during 1991–1999, BPscreening levels were very high, and the percent of adultsreporting HBP increased among some populations. Innova-tive education and intervention programs are needed to pre-vent and treat HBP in five high-risk groups: men, blacks,Hispanics, persons with less education, and older adults.
BRFSS is a state-based, random-digit–dialed telephone sur-vey of the civilian, noninstitutionalized U.S. population aged>18 years. CDC analyzed BRFSS data from 1991, 1993, 1995,1997, and 1999 for persons from the 50 states and the Dis-trict of Columbia (DC). The range of sample sizes for indi-vidual states was 1,163–3,404 in 1991, 1,182–4,294 in 1993,1,184–5,052 in 1995, 1,437–4,877 in 1997, and 1,225–4,914in 1999. BRFSS CASRO median response rates ranged from70.9% in 1991 to 55.2% in 1999. These rates reflect bothtelephone sampling efficiency and the degree of cooperationamong eligible respondents who were contacted. Survey par-ticipants were asked 1) about how long it had been since theylast had their BP taken by a doctor, nurse, or other health-careprofessional, and 2) if they had ever been told by a
doctor, nurse, or other health-care professional that they hadHBP. Recent BP screening was defined if the respondent’sblood pressure had been checked during the 2 years preced-ing the interview. Persons who reported that they were evertold they had HBP were classified as having self-reported HBP.Analyses were restricted to persons aged >20 years. Data wereweighted and analyzed using SUDAAN (version 7.0) toaccount for the complex sampling design in each state and toobtain prevalence and variance estimates. Prevalences were age-adjusted to the 2000 U.S. standard population. The state-specific percentage point differences between 1991 and 1999for recent BP screening and HBP were limited to DC and the47 states that participated in BRFSS during 1991–1999.
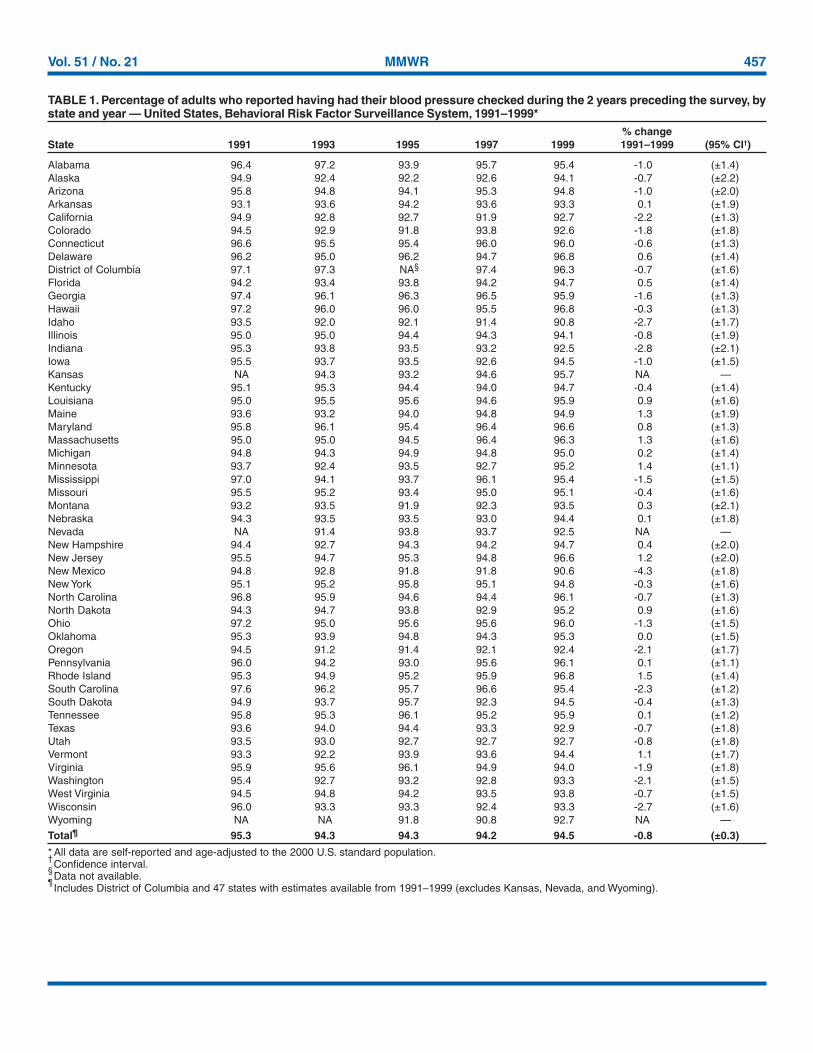
During 1991–1999, approximately 100% of adults reportedthat they ever had their BP checked. The age-adjusted preva-lence of adults reporting that they had recent BP screeningremained relatively constant at 95.3% in 1991 and 94.5% in1999 (Table 1). The prevalence of recent BP screeningdeclined in 30 states; the decline was statistically significantin 11 states (California, Georgia, Idaho, Indiana, Mississippi,New Mexico, Oregon, South Carolina, Virginia, Washing-ton, and Wisconsin). Recent BP screening increased signifi-cantly in Minnesota, New Jersey, North Dakota, and Vermont.
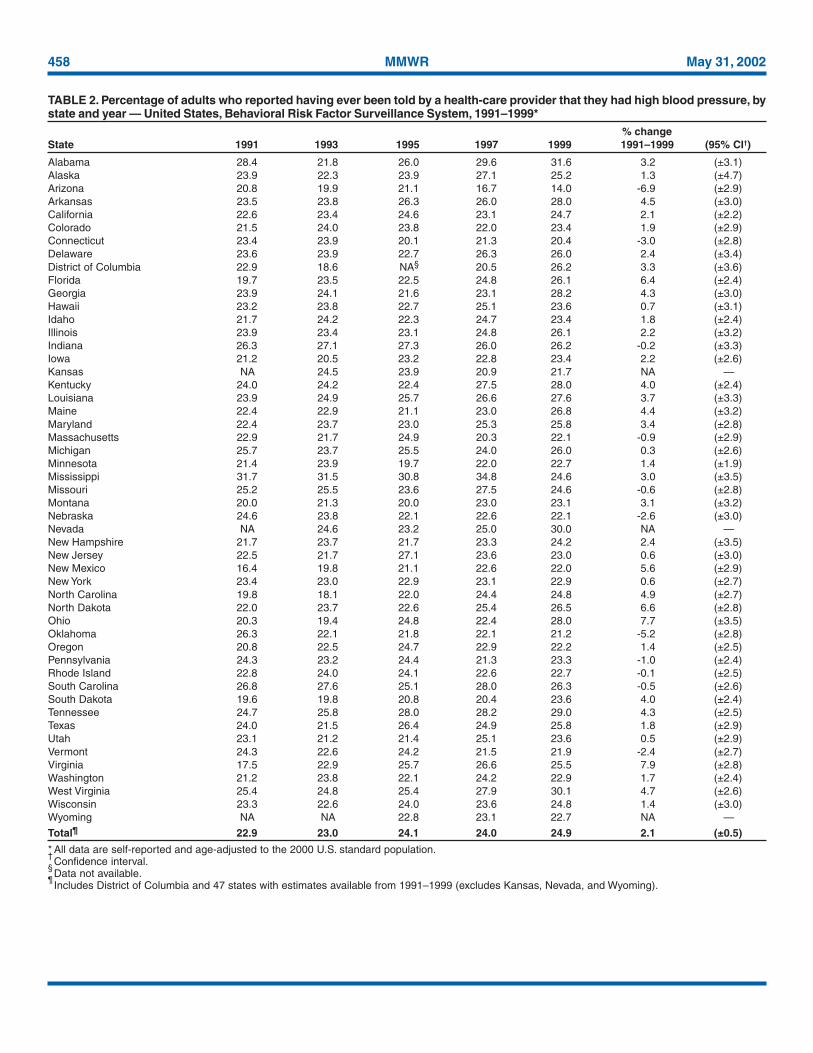
The age-adjusted prevalence of adults reporting having everbeen told that they had HBP increased significantly from22.9% in 1991 to 24.9% in 1999 (Table 2). In 1999, age-adjusted prevalence of self-reported HBP ranged from 14.0%in Arizona to 31.6% in Alabama. During 1991–1999, statis-tically significant increases in age-adjusted prevalence of self-reported HBP were observed in 17 states (Alabama, Arkansas,Florida, Georgia, Kentucky, Louisiana, Maine, Maryland, NewMexico, North Carolina, North Dakota, Ohio, SouthDakota, Tennessee, Virginia, Washington, and West Virginia).Significant declines were observed in Arizona, Connecticut,and Oklahoma.
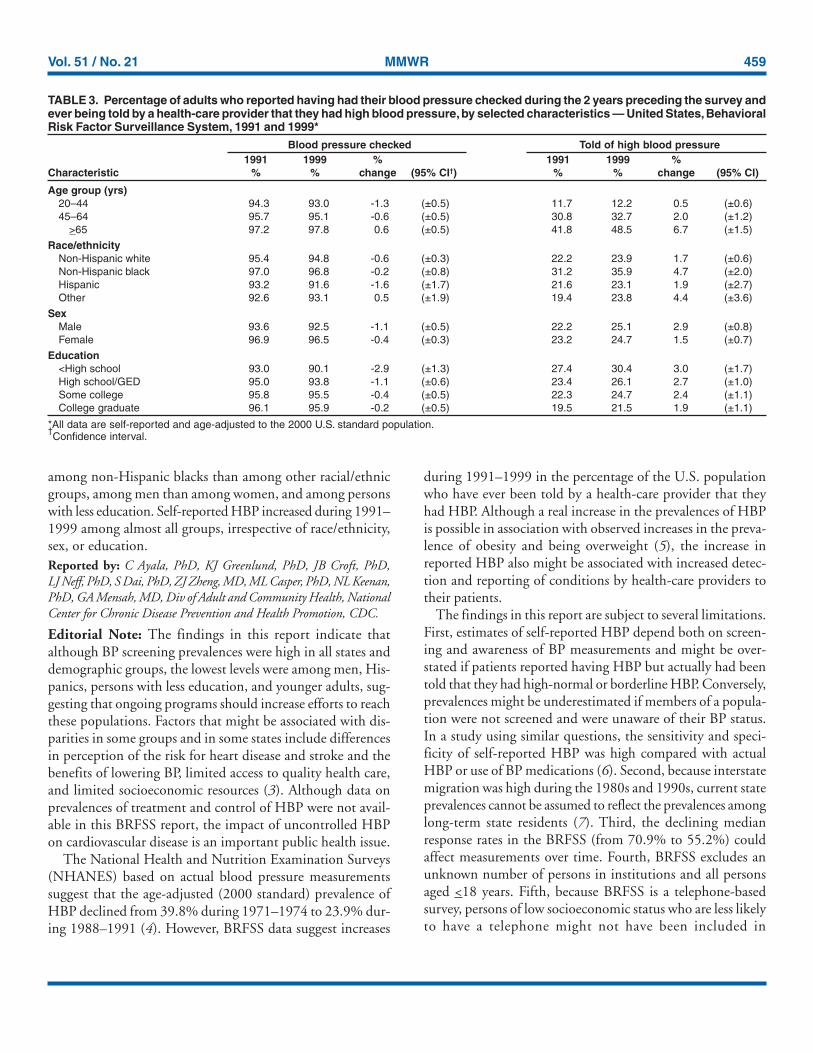
In 1991 and 1999, age-specific prevalences of recent BPscreening and self-reported HBP were higher among adultsaged >65 years than among those aged 20–64 years (Table 3).Recent BP screening declined significantly among persons aged20–44 years and those aged 45–64 years, but increased amongthose aged >65 years. Prevalences of self-reported HBPincreased in all age groups except among persons aged 20–44years. In 1991 and 1999, age-adjusted prevalences of recentBP screening were higher among non-Hispanic blacks, women,and persons with >12 years of education compared, respec-tively, with those of other racial/ethnic groups, men, and per-sons with less education. However, recent BP screeningdeclined significantly among non-Hispanic whites, men,women, and persons with <12 years of education. In 1999,age-adjusted prevalences of self-reported HBP were higher
Vol. 51 / No. 21 MMWR 457
TABLE 1. Percentage of adults who reported having had their blood pressure checked during the 2 years preceding the survey, bystate and year — United States, Behavioral Risk Factor Surveillance System, 1991–1999*
% changeState 1991 1993 1995 1997 1999 1991–1999 (95% CI†)
Alabama 96.4 97.2 93.9 95.7 95.4 -1.0 (±1.4)Alaska 94.9 92.4 92.2 92.6 94.1 -0.7 (±2.2)Arizona 95.8 94.8 94.1 95.3 94.8 -1.0 (±2.0)Arkansas 93.1 93.6 94.2 93.6 93.3 0.1 (±1.9)California 94.9 92.8 92.7 91.9 92.7 -2.2 (±1.3)Colorado 94.5 92.9 91.8 93.8 92.6 -1.8 (±1.8)Connecticut 96.6 95.5 95.4 96.0 96.0 -0.6 (±1.3)Delaware 96.2 95.0 96.2 94.7 96.8 0.6 (±1.4)District of Columbia 97.1 97.3 NA§ 97.4 96.3 -0.7 (±1.6)Florida 94.2 93.4 93.8 94.2 94.7 0.5 (±1.4)Georgia 97.4 96.1 96.3 96.5 95.9 -1.6 (±1.3)Hawaii 97.2 96.0 96.0 95.5 96.8 -0.3 (±1.3)Idaho 93.5 92.0 92.1 91.4 90.8 -2.7 (±1.7)Illinois 95.0 95.0 94.4 94.3 94.1 -0.8 (±1.9)Indiana 95.3 93.8 93.5 93.2 92.5 -2.8 (±2.1)Iowa 95.5 93.7 93.5 92.6 94.5 -1.0 (±1.5)Kansas NA 94.3 93.2 94.6 95.7 NA —Kentucky 95.1 95.3 94.4 94.0 94.7 -0.4 (±1.4)Louisiana 95.0 95.5 95.6 94.6 95.9 0.9 (±1.6)Maine 93.6 93.2 94.0 94.8 94.9 1.3 (±1.9)Maryland 95.8 96.1 95.4 96.4 96.6 0.8 (±1.3)Massachusetts 95.0 95.0 94.5 96.4 96.3 1.3 (±1.6)Michigan 94.8 94.3 94.9 94.8 95.0 0.2 (±1.4)Minnesota 93.7 92.4 93.5 92.7 95.2 1.4 (±1.1)Mississippi 97.0 94.1 93.7 96.1 95.4 -1.5 (±1.5)Missouri 95.5 95.2 93.4 95.0 95.1 -0.4 (±1.6)Montana 93.2 93.5 91.9 92.3 93.5 0.3 (±2.1)Nebraska 94.3 93.5 93.5 93.0 94.4 0.1 (±1.8)Nevada NA 91.4 93.8 93.7 92.5 NA —New Hampshire 94.4 92.7 94.3 94.2 94.7 0.4 (±2.0)New Jersey 95.5 94.7 95.3 94.8 96.6 1.2 (±2.0)New Mexico 94.8 92.8 91.8 91.8 90.6 -4.3 (±1.8)New York 95.1 95.2 95.8 95.1 94.8 -0.3 (±1.6)North Carolina 96.8 95.9 94.6 94.4 96.1 -0.7 (±1.3)North Dakota 94.3 94.7 93.8 92.9 95.2 0.9 (±1.6)Ohio 97.2 95.0 95.6 95.6 96.0 -1.3 (±1.5)Oklahoma 95.3 93.9 94.8 94.3 95.3 0.0 (±1.5)Oregon 94.5 91.2 91.4 92.1 92.4 -2.1 (±1.7)Pennsylvania 96.0 94.2 93.0 95.6 96.1 0.1 (±1.1)Rhode Island 95.3 94.9 95.2 95.9 96.8 1.5 (±1.4)South Carolina 97.6 96.2 95.7 96.6 95.4 -2.3 (±1.2)South Dakota 94.9 93.7 95.7 92.3 94.5 -0.4 (±1.3)Tennessee 95.8 95.3 96.1 95.2 95.9 0.1 (±1.2)Texas 93.6 94.0 94.4 93.3 92.9 -0.7 (±1.8)Utah 93.5 93.0 92.7 92.7 92.7 -0.8 (±1.8)Vermont 93.3 92.2 93.9 93.6 94.4 1.1 (±1.7)Virginia 95.9 95.6 96.1 94.9 94.0 -1.9 (±1.8)Washington 95.4 92.7 93.2 92.8 93.3 -2.1 (±1.5)West Virginia 94.5 94.8 94.2 93.5 93.8 -0.7 (±1.5)Wisconsin 96.0 93.3 93.3 92.4 93.3 -2.7 (±1.6)Wyoming NA NA 91.8 90.8 92.7 NA —
Total¶ 95.3 94.3 94.3 94.2 94.5 -0.8 (±0.3)
* All data are self-reported and age-adjusted to the 2000 U.S. standard population.†Confidence interval.
§Data not available.
¶Includes District of Columbia and 47 states with estimates available from 1991–1999 (excludes Kansas, Nevada, and Wyoming).
458 MMWR May 31, 2002
TABLE 2. Percentage of adults who reported having ever been told by a health-care provider that they had high blood pressure, bystate and year — United States, Behavioral Risk Factor Surveillance System, 1991–1999*
% changeState 1991 1993 1995 1997 1999 1991–1999 (95% CI†)
Alabama 28.4 21.8 26.0 29.6 31.6 3.2 (±3.1)Alaska 23.9 22.3 23.9 27.1 25.2 1.3 (±4.7)Arizona 20.8 19.9 21.1 16.7 14.0 -6.9 (±2.9)Arkansas 23.5 23.8 26.3 26.0 28.0 4.5 (±3.0)California 22.6 23.4 24.6 23.1 24.7 2.1 (±2.2)Colorado 21.5 24.0 23.8 22.0 23.4 1.9 (±2.9)Connecticut 23.4 23.9 20.1 21.3 20.4 -3.0 (±2.8)Delaware 23.6 23.9 22.7 26.3 26.0 2.4 (±3.4)District of Columbia 22.9 18.6 NA§ 20.5 26.2 3.3 (±3.6)Florida 19.7 23.5 22.5 24.8 26.1 6.4 (±2.4)Georgia 23.9 24.1 21.6 23.1 28.2 4.3 (±3.0)Hawaii 23.2 23.8 22.7 25.1 23.6 0.7 (±3.1)Idaho 21.7 24.2 22.3 24.7 23.4 1.8 (±2.4)Illinois 23.9 23.4 23.1 24.8 26.1 2.2 (±3.2)Indiana 26.3 27.1 27.3 26.0 26.2 -0.2 (±3.3)Iowa 21.2 20.5 23.2 22.8 23.4 2.2 (±2.6)Kansas NA 24.5 23.9 20.9 21.7 NA —Kentucky 24.0 24.2 22.4 27.5 28.0 4.0 (±2.4)Louisiana 23.9 24.9 25.7 26.6 27.6 3.7 (±3.3)Maine 22.4 22.9 21.1 23.0 26.8 4.4 (±3.2)Maryland 22.4 23.7 23.0 25.3 25.8 3.4 (±2.8)Massachusetts 22.9 21.7 24.9 20.3 22.1 -0.9 (±2.9)Michigan 25.7 23.7 25.5 24.0 26.0 0.3 (±2.6)Minnesota 21.4 23.9 19.7 22.0 22.7 1.4 (±1.9)Mississippi 31.7 31.5 30.8 34.8 24.6 3.0 (±3.5)Missouri 25.2 25.5 23.6 27.5 24.6 -0.6 (±2.8)Montana 20.0 21.3 20.0 23.0 23.1 3.1 (±3.2)Nebraska 24.6 23.8 22.1 22.6 22.1 -2.6 (±3.0)Nevada NA 24.6 23.2 25.0 30.0 NA —New Hampshire 21.7 23.7 21.7 23.3 24.2 2.4 (±3.5)New Jersey 22.5 21.7 27.1 23.6 23.0 0.6 (±3.0)New Mexico 16.4 19.8 21.1 22.6 22.0 5.6 (±2.9)New York 23.4 23.0 22.9 23.1 22.9 0.6 (±2.7)North Carolina 19.8 18.1 22.0 24.4 24.8 4.9 (±2.7)North Dakota 22.0 23.7 22.6 25.4 26.5 6.6 (±2.8)Ohio 20.3 19.4 24.8 22.4 28.0 7.7 (±3.5)Oklahoma 26.3 22.1 21.8 22.1 21.2 -5.2 (±2.8)Oregon 20.8 22.5 24.7 22.9 22.2 1.4 (±2.5)Pennsylvania 24.3 23.2 24.4 21.3 23.3 -1.0 (±2.4)Rhode Island 22.8 24.0 24.1 22.6 22.7 -0.1 (±2.5)South Carolina 26.8 27.6 25.1 28.0 26.3 -0.5 (±2.6)South Dakota 19.6 19.8 20.8 20.4 23.6 4.0 (±2.4)Tennessee 24.7 25.8 28.0 28.2 29.0 4.3 (±2.5)Texas 24.0 21.5 26.4 24.9 25.8 1.8 (±2.9)Utah 23.1 21.2 21.4 25.1 23.6 0.5 (±2.9)Vermont 24.3 22.6 24.2 21.5 21.9 -2.4 (±2.7)Virginia 17.5 22.9 25.7 26.6 25.5 7.9 (±2.8)Washington 21.2 23.8 22.1 24.2 22.9 1.7 (±2.4)West Virginia 25.4 24.8 25.4 27.9 30.1 4.7 (±2.6)Wisconsin 23.3 22.6 24.0 23.6 24.8 1.4 (±3.0)Wyoming NA NA 22.8 23.1 22.7 NA —
Total¶ 22.9 23.0 24.1 24.0 24.9 2.1 (±0.5)
* All data are self-reported and age-adjusted to the 2000 U.S. standard population.†
Confidence interval.§
Data not available.¶
Includes District of Columbia and 47 states with estimates available from 1991–1999 (excludes Kansas, Nevada, and Wyoming).
Vol. 51 / No. 21 MMWR 459
among non-Hispanic blacks than among other racial/ethnicgroups, among men than among women, and among personswith less education. Self-reported HBP increased during 1991–1999 among almost all groups, irrespective of race/ethnicity,sex, or education.Reported by: C Ayala, PhD, KJ Greenlund, PhD, JB Croft, PhD,LJ Neff, PhD, S Dai, PhD, ZJ Zheng, MD, ML Casper, PhD, NL Keenan,PhD, GA Mensah, MD, Div of Adult and Community Health, NationalCenter for Chronic Disease Prevention and Health Promotion, CDC.
Editorial Note: The findings in this report indicate thatalthough BP screening prevalences were high in all states anddemographic groups, the lowest levels were among men, His-panics, persons with less education, and younger adults, sug-gesting that ongoing programs should increase efforts to reachthese populations. Factors that might be associated with dis-parities in some groups and in some states include differencesin perception of the risk for heart disease and stroke and thebenefits of lowering BP, limited access to quality health care,and limited socioeconomic resources (3). Although data onprevalences of treatment and control of HBP were not avail-able in this BRFSS report, the impact of uncontrolled HBPon cardiovascular disease is an important public health issue.
The National Health and Nutrition Examination Surveys(NHANES) based on actual blood pressure measurementssuggest that the age-adjusted (2000 standard) prevalence ofHBP declined from 39.8% during 1971–1974 to 23.9% dur-ing 1988–1991 (4). However, BRFSS data suggest increases
TABLE 3. Percentage of adults who reported having had their blood pressure checked during the 2 years preceding the survey andever being told by a health-care provider that they had high blood pressure, by selected characteristics — United States, BehavioralRisk Factor Surveillance System, 1991 and 1999*
Blood pressure checked Told of high blood pressure1991 1999 % 1991 1999 %
Characteristic % % change (95% CI†) % % change (95% CI)
Age group (yrs)20–44 94.3 93.0 -1.3 (±0.5) 11.7 12.2 0.5 (±0.6)45–64 95.7 95.1 -0.6 (±0.5) 30.8 32.7 2.0 (±1.2)
>65 97.2 97.8 0.6 (±0.5) 41.8 48.5 6.7 (±1.5)
Race/ethnicityNon-Hispanic white 95.4 94.8 -0.6 (±0.3) 22.2 23.9 1.7 (±0.6)Non-Hispanic black 97.0 96.8 -0.2 (±0.8) 31.2 35.9 4.7 (±2.0)Hispanic 93.2 91.6 -1.6 (±1.7) 21.6 23.1 1.9 (±2.7)Other 92.6 93.1 0.5 (±1.9) 19.4 23.8 4.4 (±3.6)
SexMale 93.6 92.5 -1.1 (±0.5) 22.2 25.1 2.9 (±0.8)Female 96.9 96.5 -0.4 (±0.3) 23.2 24.7 1.5 (±0.7)
Education<High school 93.0 90.1 -2.9 (±1.3) 27.4 30.4 3.0 (±1.7)High school/GED 95.0 93.8 -1.1 (±0.6) 23.4 26.1 2.7 (±1.0)Some college 95.8 95.5 -0.4 (±0.5) 22.3 24.7 2.4 (±1.1)College graduate 96.1 95.9 -0.2 (±0.5) 19.5 21.5 1.9 (±1.1)
*All data are self-reported and age-adjusted to the 2000 U.S. standard population.†Confidence interval.
during 1991–1999 in the percentage of the U.S. populationwho have ever been told by a health-care provider that theyhad HBP. Although a real increase in the prevalences of HBPis possible in association with observed increases in the preva-lence of obesity and being overweight (5), the increase inreported HBP also might be associated with increased detec-tion and reporting of conditions by health-care providers totheir patients.
The findings in this report are subject to several limitations.First, estimates of self-reported HBP depend both on screen-ing and awareness of BP measurements and might be over-stated if patients reported having HBP but actually had beentold that they had high-normal or borderline HBP. Conversely,prevalences might be underestimated if members of a popula-tion were not screened and were unaware of their BP status.In a study using similar questions, the sensitivity and speci-ficity of self-reported HBP was high compared with actualHBP or use of BP medications (6). Second, because interstatemigration was high during the 1980s and 1990s, current stateprevalences cannot be assumed to reflect the prevalences amonglong-term state residents (7). Third, the declining medianresponse rates in the BRFSS (from 70.9% to 55.2%) couldaffect measurements over time. Fourth, BRFSS excludes anunknown number of persons in institutions and all personsaged <18 years. Fifth, because BRFSS is a telephone-basedsurvey, persons of low socioeconomic status who are less likelyto have a telephone might not have been included in
460 MMWR May 31, 2002
representative numbers. Finally, because time and functionalcapacity are required for participation in the questionnaire,BRFSS might underrepresent those with a severe impairment.
Estimates of self-reported HBP depend on screening, aware-ness of BP measurements, and the accurate reporting of HBPrather than clinical diagnoses such as high-normal or border-line HBP. HBP is a major modifiable risk factor for cardio-vascular diseases, and BP screening is an important first stepin identifying and controlling HBP and preventing heart dis-ease and stroke. Clinical guidelines for BP screening and man-agement emphasize prevention of HBP by improving lifestyles,self-measurement of BP, the use of new combination antihy-pertensive medications, and strategies for improving adher-ence to treatment (2). Many CDC-sponsored statecardiovascular health programs, the NHBPEP, and the Ameri-can Heart Association provide programs that raise publicawareness and understanding about HBP as a risk factor forheart disease and stroke. Eleven states (Alaska, California,Connecticut, Illinois, Iowa, Massachusetts, Michigan,Nebraska, North Carolina, South Dakota, and Vermont) pro-vide BP screening and other services to participants in theNational Breast and Cervical Cancer Early Detection pro-gram (8). Some states use prevention block grant funds toconduct BP screening campaigns that target priority popula-tions (e.g., younger members of certain racial/ethnic groupsor older adults). In addition to these ongoing public healthefforts, prevention programs are encouraged to seek innova-tive strategies to ensure that high BP screening rates continueamong priority populations.
AcknowledgmentsThis report is based on data contributed by the following BRFSS
coordinators: S Reese, MPH, Alabama; P Owens, Alaska; R Weyant,Arizona; B Woodson, Arkansas; B Davis, PhD, California;B Rosenblatt, Colorado; M Adams, MPH, Connecticut;F Breukelman, Delaware; J Davies-Cole, District of Columbia;S Oba, MSPH, Florida; L Martin, MS, Georgia; F Reyes-Salvail,MS, Hawaii; J Aydelotte, MA, Idaho; B Steiner, MS, Illinois;L Stemnock, Indiana; D Sheperd, PhD, Iowa; M Arnold, Kansas;T Sparks, Kentucky; B Bates, MSPH, Louisiana; J Graber, MS,Maine; H Lopez, Maryland; Z Zhang, MPH, Massachusetts;H McGee, MPH, Michigan; N Salem, PhD, Minnesota; D Johnson,MS, Mississippi; J Jackson-Thompson, PhD, Missouri; P Feigley,PhD, Montana; L Andelt, PhD, Nebraska; E DeJan, MPH, Nevada;J Porter, MPH, New Hampshire; G Boeselager, MS, New Jersey;W Honey, MPH, New Mexico; C Baker, New York; Z Gizlice, PhD,North Carolina; L Shireley, MPH, North Dakota; P (Pullen) Cross,Ohio; K Baker, MPH, Oklahoma; K Pickle, MPH, Oregon;L Mann, Pennsylvania; J Hesser, PhD, Rhode Island; DJ Goodwin,DrPH, South Carolina; M Gildemaster, South Dakota; D Ridings,
Tennessee; K Condon, MS, Texas; K Marti, Utah; R McCormick,PhD, Vermont; G Seifen, MS, Virginia; KW Simmons, PhD,Washington; F King, West Virginia; K Pearson, Wisconsin; M Futa,Wyoming.
References1. Burt VL, Cutler JA, Higgins M, et al. Trends in the prevalence, aware-
ness, treatment, and control of hypertension in the adult U.S. popula-tion. Data from the health examination surveys, 1960–1991.Hypertension 1995;26:60–9.
2. Anonymous. The sixth report of the Joint National Committee on thePrevention, Detection, Evaluation, and Treatment of High Blood Pres-sure (JNC-VI). Arch Intern Med 1997;157:2413–46.
3. Meissner I, Whisnant JP, Sheps SG, et al. Detection and control of highblood pressure in the community: do we need a wake-up call? Hyper-tension 1999;34:466–71.
4. National Center for Health Statistics. Health, United States, 2001 withUrban and Rural Health Chartbook. Hyattsville, Maryland: U.S.Department of Health and Human Services, CDC, National Centerfor Health Statistics, 2001.
5. Mokdad AH, Serdula MK, Dietz WH, et al. The spread of the obesityepidemic in the United States, 1991–1998. JAMA 1999;282:1519–22.
6. Giles WH, Croft JB, Keenan NL, Lane MJ, Wheeler FC. The validityof self-reported hypertension and correlates of hypertension awarenessamong blacks and whites within the stroke belt. Am J Prev Med1995;11:163–9.
7. Hansen KA. Geographical mobility: March 1993 to March 1994. Wash-ington, DC: U.S. Department of Commerce, Economics, and StatisticsAdministration, Bureau of the Census, 1995 (current populationreports no. P20-485).
8. Will JC, Massoudi B, Mokdad A, et al. Reducing risk for cardiovasculardisease in uninsured women: combined results from two WISEWOMANProjects. J Am Med Womens Assoc 2001;56:161–5.
Nonfatal Physical Assault–RelatedInjuries Treated in HospitalEmergency Departments —
United States, 2000CDC, in collaboration with the Consumer Product Safety
Commission (CPSC), expanded CPSC’s National ElectronicInjury Surveillance System (NEISS) in July 2000 to includeall types and external causes of nonfatal injuries treated inU.S. hospital emergency departments (EDs). This ongoingsurveillance system, called NEISS All Injury Program (NEISS-AIP), can be used to calculate national, annualized, weightedestimates for nonfatal injuries treated in U.S. hospital EDs.This report summarizes NEISS-AIP data, which indicate thatapproximately 1.6 million persons were treated in U.S. EDsduring 2000 for nonfatal physical (i.e., nonsexual) assault–related injuries. Such injuries occurred disproportionatelyamong males, adolescents, and young adults, particularlyamong black males; most of these injuries were contusions orlacerations, few of which resulted in hospital admission.
Vol. 51 / No. 21 MMWR 461
* Often only one entry is available on the ED record for race/ethnicity. Theclassification scheme for this report assumed that most white Hispanicsprobably were recorded on the ED record as Hispanics and that most blackHispanics probably were recorded as black.
† Injuries inflicted by law enforcement personnel during official duties.
NEISS-AIP data can increase understanding of physicalassault–related injuries and serve as a basis for monitoringtrends, facilitating additional research, and evaluating inter-vention approaches.
NEISS-AIP includes data from 66 (out of the 100) NEISShospitals, which are a nationally representative, stratified prob-ability sample of all hospitals in the United States and its ter-ritories with a minimum of six beds and a 24-hour ED (1,2).NEISS-AIP provides data on approximately 500,000 injury-and consumer product–related ED cases each year. Data fromthese cases are weighted by the inverse of the probability ofselection to provide national estimates (1). Annualized esti-mates for this report are based on weighted data for 13,976nonfatal assault-related injuries treated in EDs during July–December 2000. The weight of each case was doubled, andthen these adjusted values were added to provide annualizedestimates for the overall population and population subgroups(i.e., age, sex, and race/ethnicity*). A direct variance estima-tion procedure was used to calculate 95% confidence inter-vals and to account for the complex sample design (1).
Injuries were defined as bodily harm resulting from acuteexposure to an external force or substance, including unin-tentional and violence-related causes. Cases were excludedfrom this analysis if 1) the principal diagnosis was an illness,pain only, psychological harm (e.g., anxiety and depression)only, contact dermatitis associated with exposure to consumerproducts (e.g., body lotions, detergents, and diapers) and plants(e.g., poison ivy), or unknown; or 2) the ED visit was foradverse effects of therapeutic drugs or of surgical and medicalcare (3). All injuries were classified according to the intent(i.e., unintentional, sexual and physical assault, self-harm, andlegal intervention†) of the most severe injury (4). Suspectedand confirmed instances of interpersonal violence were codedas assaults; persons injured included victims, bystanders,police, and perpetrators. Data also were collected aboutinjury diagnosis, primary body part injured, disposition, andmechanism. The mechanism of injury is the precipitatingmechanism (e.g., struck by/against, cut/pierced, or bitten) thatinitiated the chain of events leading to the injury, similar tothe underlying cause of an injury-related death. Mechanismsof injury were classified into recommended major externalcause-of-injury groupings (3,5) according to definitions con-sistent with International Classification of Diseases, NinthRevision, Clinical Modifications (ICD-9-CM) external-causecoding guidelines (6).
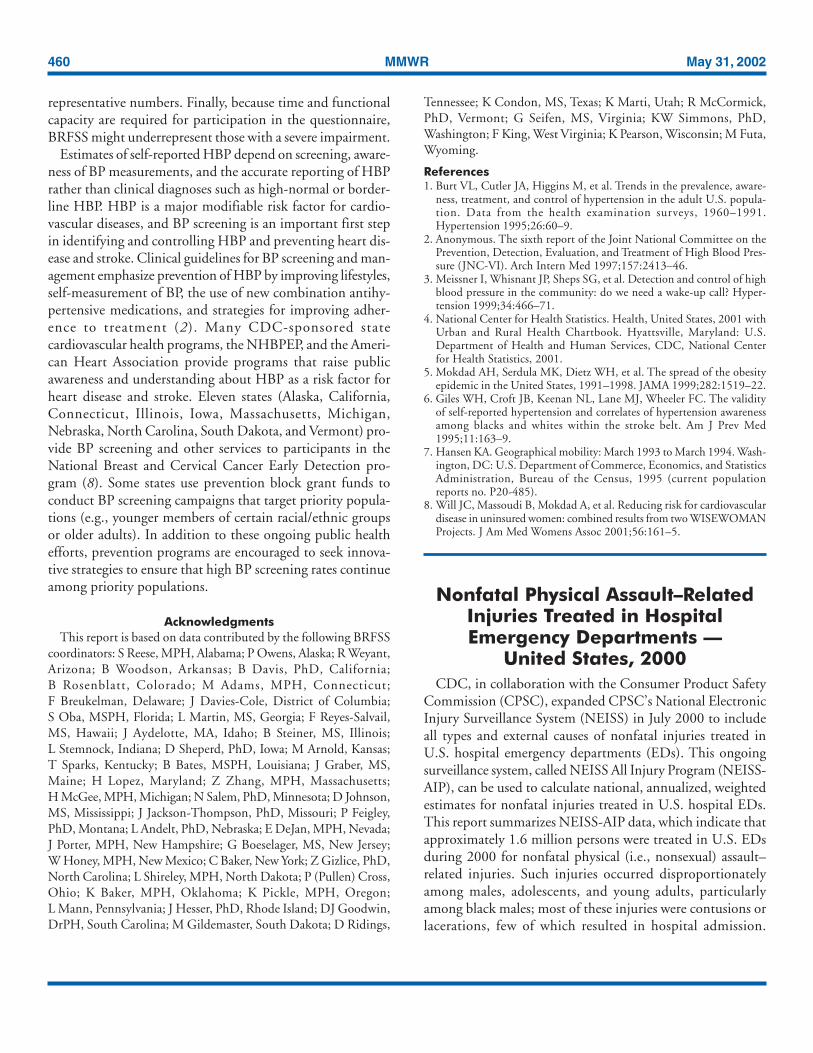
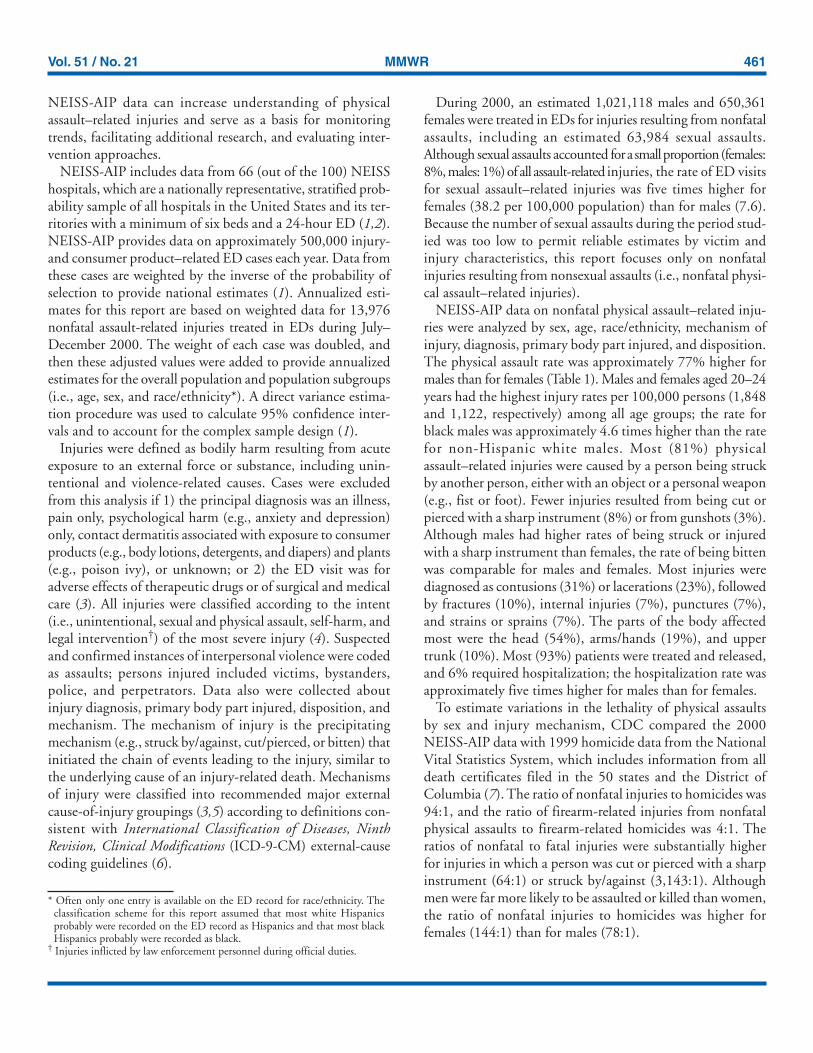
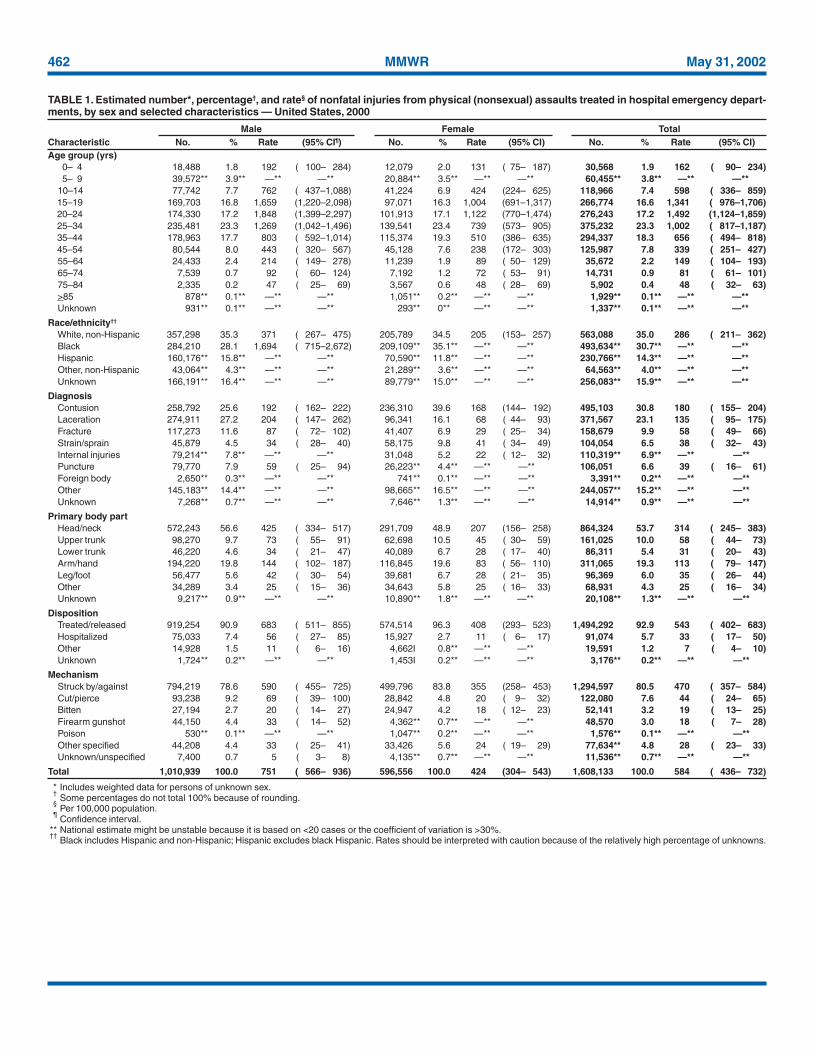
During 2000, an estimated 1,021,118 males and 650,361females were treated in EDs for injuries resulting from nonfatalassaults, including an estimated 63,984 sexual assaults.Although sexual assaults accounted for a small proportion (females:8%, males: 1%) of all assault-related injuries, the rate of ED visitsfor sexual assault–related injuries was five times higher forfemales (38.2 per 100,000 population) than for males (7.6).Because the number of sexual assaults during the period stud-ied was too low to permit reliable estimates by victim andinjury characteristics, this report focuses only on nonfatalinjuries resulting from nonsexual assaults (i.e., nonfatal physi-cal assault–related injuries).
NEISS-AIP data on nonfatal physical assault–related inju-ries were analyzed by sex, age, race/ethnicity, mechanism ofinjury, diagnosis, primary body part injured, and disposition.The physical assault rate was approximately 77% higher formales than for females (Table 1). Males and females aged 20–24years had the highest injury rates per 100,000 persons (1,848and 1,122, respectively) among all age groups; the rate forblack males was approximately 4.6 times higher than the ratefor non-Hispanic white males. Most (81%) physicalassault–related injuries were caused by a person being struckby another person, either with an object or a personal weapon(e.g., fist or foot). Fewer injuries resulted from being cut orpierced with a sharp instrument (8%) or from gunshots (3%).Although males had higher rates of being struck or injuredwith a sharp instrument than females, the rate of being bittenwas comparable for males and females. Most injuries werediagnosed as contusions (31%) or lacerations (23%), followedby fractures (10%), internal injuries (7%), punctures (7%),and strains or sprains (7%). The parts of the body affectedmost were the head (54%), arms/hands (19%), and uppertrunk (10%). Most (93%) patients were treated and released,and 6% required hospitalization; the hospitalization rate wasapproximately five times higher for males than for females.
To estimate variations in the lethality of physical assaultsby sex and injury mechanism, CDC compared the 2000NEISS-AIP data with 1999 homicide data from the NationalVital Statistics System, which includes information from alldeath certificates filed in the 50 states and the District ofColumbia (7). The ratio of nonfatal injuries to homicides was94:1, and the ratio of firearm-related injuries from nonfatalphysical assaults to firearm-related homicides was 4:1. Theratios of nonfatal to fatal injuries were substantially higherfor injuries in which a person was cut or pierced with a sharpinstrument (64:1) or struck by/against (3,143:1). Althoughmen were far more likely to be assaulted or killed than women,the ratio of nonfatal injuries to homicides was higher forfemales (144:1) than for males (78:1).
462 MMWR May 31, 2002
TABLE 1. Estimated number*, percentage†, and rate§ of nonfatal injuries from physical (nonsexual) assaults treated in hospital emergency depart-ments, by sex and selected characteristics — United States, 2000
Male Female TotalCharacteristic No. % Rate (95% CI¶) No. % Rate (95% CI) No. % Rate (95% CI)Age group (yrs)
0– 4 18,488 1.8 192 ( 100– 284) 12,079 2.0 131 ( 75– 187) 30,568 1.9 162 ( 90– 234)5– 9 39,572** 3.9** —** —** 20,884** 3.5** —** —** 60,455** 3.8** —** —**
10–14 77,742 7.7 762 ( 437–1,088) 41,224 6.9 424 (224– 625) 118,966 7.4 598 ( 336– 859)15–19 169,703 16.8 1,659 (1,220–2,098) 97,071 16.3 1,004 (691–1,317) 266,774 16.6 1,341 ( 976–1,706)20–24 174,330 17.2 1,848 (1,399–2,297) 101,913 17.1 1,122 (770–1,474) 276,243 17.2 1,492 (1,124–1,859)25–34 235,481 23.3 1,269 (1,042–1,496) 139,541 23.4 739 (573– 905) 375,232 23.3 1,002 ( 817–1,187)35–44 178,963 17.7 803 ( 592–1,014) 115,374 19.3 510 (386– 635) 294,337 18.3 656 ( 494– 818)45–54 80,544 8.0 443 ( 320– 567) 45,128 7.6 238 (172– 303) 125,987 7.8 339 ( 251– 427)55–64 24,433 2.4 214 ( 149– 278) 11,239 1.9 89 ( 50– 129) 35,672 2.2 149 ( 104– 193)65–74 7,539 0.7 92 ( 60– 124) 7,192 1.2 72 ( 53– 91) 14,731 0.9 81 ( 61– 101)75–84 2,335 0.2 47 ( 25– 69) 3,567 0.6 48 ( 28– 69) 5,902 0.4 48 ( 32– 63)>85 878** 0.1** —** —** 1,051** 0.2** —** —** 1,929** 0.1** —** —**Unknown 931** 0.1** —** —** 293** 0** —** —** 1,337** 0.1** —** —**
Race/ethnicity††
White, non-Hispanic 357,298 35.3 371 ( 267– 475) 205,789 34.5 205 (153– 257) 563,088 35.0 286 ( 211– 362)Black 284,210 28.1 1,694 ( 715–2,672) 209,109** 35.1** —** —** 493,634** 30.7** —** —**Hispanic 160,176** 15.8** —** —** 70,590** 11.8** —** —** 230,766** 14.3** —** —**Other, non-Hispanic 43,064** 4.3** —** —** 21,289** 3.6** —** —** 64,563** 4.0** —** —**Unknown 166,191** 16.4** —** —** 89,779** 15.0** —** —** 256,083** 15.9** —** —**
DiagnosisContusion 258,792 25.6 192 ( 162– 222) 236,310 39.6 168 (144– 192) 495,103 30.8 180 ( 155– 204)Laceration 274,911 27.2 204 ( 147– 262) 96,341 16.1 68 ( 44– 93) 371,567 23.1 135 ( 95– 175)Fracture 117,273 11.6 87 ( 72– 102) 41,407 6.9 29 ( 25– 34) 158,679 9.9 58 ( 49– 66)Strain/sprain 45,879 4.5 34 ( 28– 40) 58,175 9.8 41 ( 34– 49) 104,054 6.5 38 ( 32– 43)Internal injuries 79,214** 7.8** —** —** 31,048 5.2 22 ( 12– 32) 110,319** 6.9** —** —**Puncture 79,770 7.9 59 ( 25– 94) 26,223** 4.4** —** —** 106,051 6.6 39 ( 16– 61)Foreign body 2,650** 0.3** —** —** 741** 0.1** —** —** 3,391** 0.2** —** —**Other 145,183** 14.4** —** —** 98,665** 16.5** —** —** 244,057** 15.2** —** —**Unknown 7,268** 0.7** —** —** 7,646** 1.3** —** —** 14,914** 0.9** —** —**
Primary body partHead/neck 572,243 56.6 425 ( 334– 517) 291,709 48.9 207 (156– 258) 864,324 53.7 314 ( 245– 383)Upper trunk 98,270 9.7 73 ( 55– 91) 62,698 10.5 45 ( 30– 59) 161,025 10.0 58 ( 44– 73)Lower trunk 46,220 4.6 34 ( 21– 47) 40,089 6.7 28 ( 17– 40) 86,311 5.4 31 ( 20– 43)Arm/hand 194,220 19.8 144 ( 102– 187) 116,845 19.6 83 ( 56– 110) 311,065 19.3 113 ( 79– 147)Leg/foot 56,477 5.6 42 ( 30– 54) 39,681 6.7 28 ( 21– 35) 96,369 6.0 35 ( 26– 44)Other 34,289 3.4 25 ( 15– 36) 34,643 5.8 25 ( 16– 33) 68,931 4.3 25 ( 16– 34)Unknown 9,217** 0.9** —** —** 10,890** 1.8** —** —** 20,108** 1.3** —** —**
DispositionTreated/released 919,254 90.9 683 ( 511– 855) 574,514 96.3 408 (293– 523) 1,494,292 92.9 543 ( 402– 683)Hospitalized 75,033 7.4 56 ( 27– 85) 15,927 2.7 11 ( 6– 17) 91,074 5.7 33 ( 17– 50)Other 14,928 1.5 11 ( 6– 16) 4,662I 0.8** —** —** 19,591 1.2 7 ( 4– 10)Unknown 1,724** 0.2** —** —** 1,453I 0.2** —** —** 3,176** 0.2** —** —**
MechanismStruck by/against 794,219 78.6 590 ( 455– 725) 499,796 83.8 355 (258– 453) 1,294,597 80.5 470 ( 357– 584)Cut/pierce 93,238 9.2 69 ( 39– 100) 28,842 4.8 20 ( 9– 32) 122,080 7.6 44 ( 24– 65)Bitten 27,194 2.7 20 ( 14– 27) 24,947 4.2 18 ( 12– 23) 52,141 3.2 19 ( 13– 25)Firearm gunshot 44,150 4.4 33 ( 14– 52) 4,362** 0.7** —** —** 48,570 3.0 18 ( 7– 28)Poison 530** 0.1** —** —** 1,047** 0.2** —** —** 1,576** 0.1** —** —**Other specified 44,208 4.4 33 ( 25– 41) 33,426 5.6 24 ( 19– 29) 77,634** 4.8 28 ( 23– 33)Unknown/unspecified 7,400 0.7 5 ( 3– 8) 4,135** 0.7** —** —** 11,536** 0.7** —** —**
Total 1,010,939 100.0 751 ( 566– 936) 596,556 100.0 424 (304– 543) 1,608,133 100.0 584 ( 436– 732)
* Includes weighted data for persons of unknown sex.†
Some percentages do not total 100% because of rounding.§
Per 100,000 population.¶
Confidence interval.** National estimate might be unstable because it is based on <20 cases or the coefficient of variation is >30%.††
Black includes Hispanic and non-Hispanic; Hispanic excludes black Hispanic. Rates should be interpreted with caution because of the relatively high percentage of unknowns.
Vol. 51 / No. 21 MMWR 463
Reported by: TR Simon, PhD, LE Saltzman, PhD, MH Swahn, PhD,JA Mercy, PhD, EM Ingram, PhD, RR Mahendra, MPH, Div ofViolence Prevention; JL Annest, PhD, P Holmgreen, MS, Office ofStatistics and Programming, National Center for Injury Prevention andControl, CDC.
Editorial Note: In 2000, an estimated 1,608,133 persons weretreated for nonfatal physical assault–related injuries in U.S.EDs. The NEISS-AIP results and the ratios of physicalassault–related ED visits to homicides underscore the need toprevent both fatal and nonfatal assault-related injuries.
A previous study found that estimates of nonfatal physicalassault–related injuries treated in EDs obtained through asupplement to NEISS are approximately 3.2 times higher thanthe estimated number of ED visits based on reports by crimevictims interviewed in the National Crime Victimization Sur-vey (NCVS) (8). The NCVS estimate of the number of EDvisits might be lower because of victim reluctance to reportinjuries as crime-related and difficulty in securing a samplethat adequately represents those at greatest risk for violentvictimization (8,9). Although NCVS includes fewer assault-related injuries treated in EDs, NCVS data indicate that most(82%) injured victims of physical assaults were not treated inan ED or hospital (10). NCVS provides estimates of all physi-cal assault–related injuries whereas NEISS-AIP data reflectonly injuries that were treated in EDs.
The findings in this report are subject to at least five limita-tions. First, data were collected for a 6-month period and mightnot reflect seasonal differences in the number of physicalassault–related injuries. Second, NEISS-AIP data are basedonly on information in ED records and are not linked to orsupplemented with other data sources (e.g., police reports).Third, outcomes are specific to ED visits and do not includesubsequent outcomes of the injuries. Fourth, NEISS-AIP datareflect only those injuries that were severe enough to requiretreatment in an ED. Finally, NEISS-AIP data probablyprovide a conservative estimate of the number of physicalassault–related injuries treated in EDs because the violentintent of injury might not be reported.
This analysis highlights the value of NEISS-AIP for esti-mating the number of nonfatal physical assault–related inju-ries treated in U.S. hospital EDs and for analyzing thecharacteristics of these injuries. When additional data becomeavailable, similar analyses can be generated for sexual assault–related injuries. NEISS-AIP data can help health-care profes-sionals better understand the magnitude and characteristicsof physical assault–related injuries and serve as a basis formonitoring trends, facilitating additional research on the costsand consequences of these injuries, and evaluating preven-tion programs and policies.References1. U.S. Consumer Product Safety Commission. NEISS All Injury Pro-
gram: sample design and implementation. In: Schroeder T, Ault K, eds.Washington, DC: U.S. Consumer Product Safety Commission, 2000.
2. U.S. Consumer Product Safety Commission. NEISS coding manual 2000.Washington, DC: U.S. Consumer Product Safety Commission, 2000.
3. CDC. Recommended framework for presenting injury mortality data.MMWR 1997;46(No. RR-14).
4. CDC. A training module for coding mechanism and intent of injuryfor the NEISS All Injury Program. In: Annest JL, Pogostin CL, eds.Atlanta, Georgia: U.S. Department of Health and Human Services,CDC, National Center for Injury Prevention and Control, 2000.
5. Annest JL, Pogostin CL. CDC’s short version of the ICECI (Interna-tional Classification of External Causes of Injury): a pilot study.Report to the World Health Organization Collaborating Centers onthe Classification of Disease. Atlanta, Georgia: U.S. Department ofHealth and Human Services, CDC, National Center for Injury Pre-vention and Control, 2000.
6. U.S. Department of Health and Human Services. Generic ICD-9-CM.Hospital version 1999. Reno, Nevada: Channel Publishing LTD, 1998.
7. Office of Statistics and Programming. Injury mortality reports 1999.Atlanta, Georgia: National Center for Injury Prevention and Control,CDC. Available at http://webapp.cdc.gov/sasweb/ncipc/mortrate10.html.
8. Rand M, Strom K. Violence-related injuries treated in hospital emer-gency departments. Washington, DC: Bureau of Justice Statistics, U.S.Department of Justice, 1997 (publication no. NCJ-156921).
9. Cook PJ. The case of the missing victims: gunshot woundings in theNational Crime Survey. Journal of Quantitative Criminology1985;1:91–102.
10. Simon T, Mercy J, Perkins C. Injuries from violent crime, 1992–98.Washington, DC: Bureau of Justice Statistics, U.S. Department ofJustice, 2001 (publication no. NCJ-168633).

464 MMWR May 31, 2002
Vol. 51 / No. 21 MMWR 465
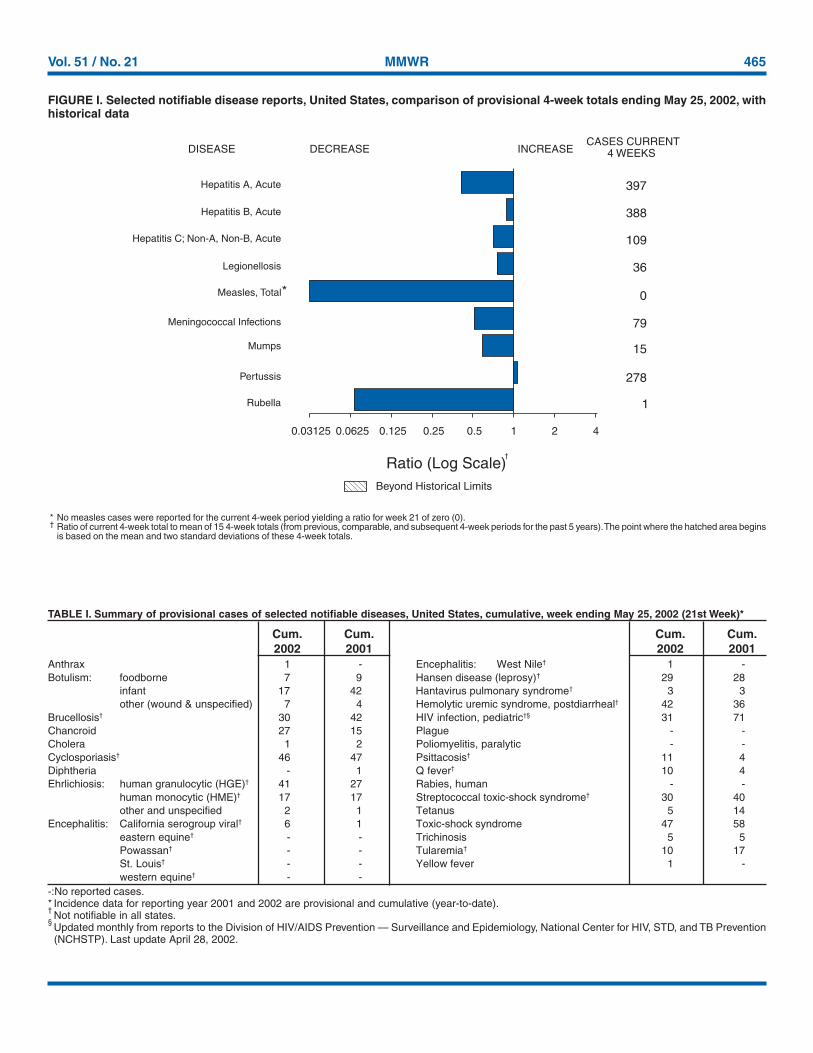
FIGURE I. Selected notifiable disease reports, United States, comparison of provisional 4-week totals ending May 25, 2002, withhistorical data
* No measles cases were reported for the current 4-week period yielding a ratio for week 21 of zero (0).† Ratio of current 4-week total to mean of 15 4-week totals (from previous, comparable, and subsequent 4-week periods for the past 5 years). The point where the hatched area begins
is based on the mean and two standard deviations of these 4-week totals.
DISEASE DECREASE INCREASECASES CURRENT
4 WEEKS
Ratio (Log Scale)†
Beyond Historical Limits
4210.50.250.125
397
388
109
36
0
79
15
278
1
Hepatitis A, Acute
Hepatitis B, Acute
Hepatitis C; Non-A, Non-B, Acute
Legionellosis
Measles, Total
Mumps
Pertussis
Rubella
Meningococcal Infections
0.06250.03125
*
TABLE I. Summary of provisional cases of selected notifiable diseases, United States, cumulative, week ending May 25, 2002 (21st Week)*
Anthrax 1 - Encephalitis: West Nile† 1 -Botulism: foodborne 7 9 Hansen disease (leprosy)† 29 28
infant 17 42 Hantavirus pulmonary syndrome† 3 3other (wound & unspecified) 7 4 Hemolytic uremic syndrome, postdiarrheal† 42 36
Brucellosis† 30 42 HIV infection, pediatric†§ 31 71Chancroid 27 15 Plague - -Cholera 1 2 Poliomyelitis, paralytic - -Cyclosporiasis† 46 47 Psittacosis† 11 4Diphtheria - 1 Q fever† 10 4Ehrlichiosis: human granulocytic (HGE)† 41 27 Rabies, human - -
human monocytic (HME)† 17 17 Streptococcal toxic-shock syndrome† 30 40other and unspecified 2 1 Tetanus 5 14
Encephalitis: California serogroup viral† 6 1 Toxic-shock syndrome 47 58eastern equine† - - Trichinosis 5 5Powassan† - - Tularemia† 10 17St. Louis† - - Yellow fever 1 -western equine† - -
Cum. Cum. Cum. Cum.2002 2001 2002 2001
-:No reported cases.* Incidence data for reporting year 2001 and 2002 are provisional and cumulative (year-to-date).†Not notifiable in all states.
§Updated monthly from reports to the Division of HIV/AIDS Prevention — Surveillance and Epidemiology, National Center for HIV, STD, and TB Prevention(NCHSTP). Last update April 28, 2002.
466 MMWR May 31, 2002
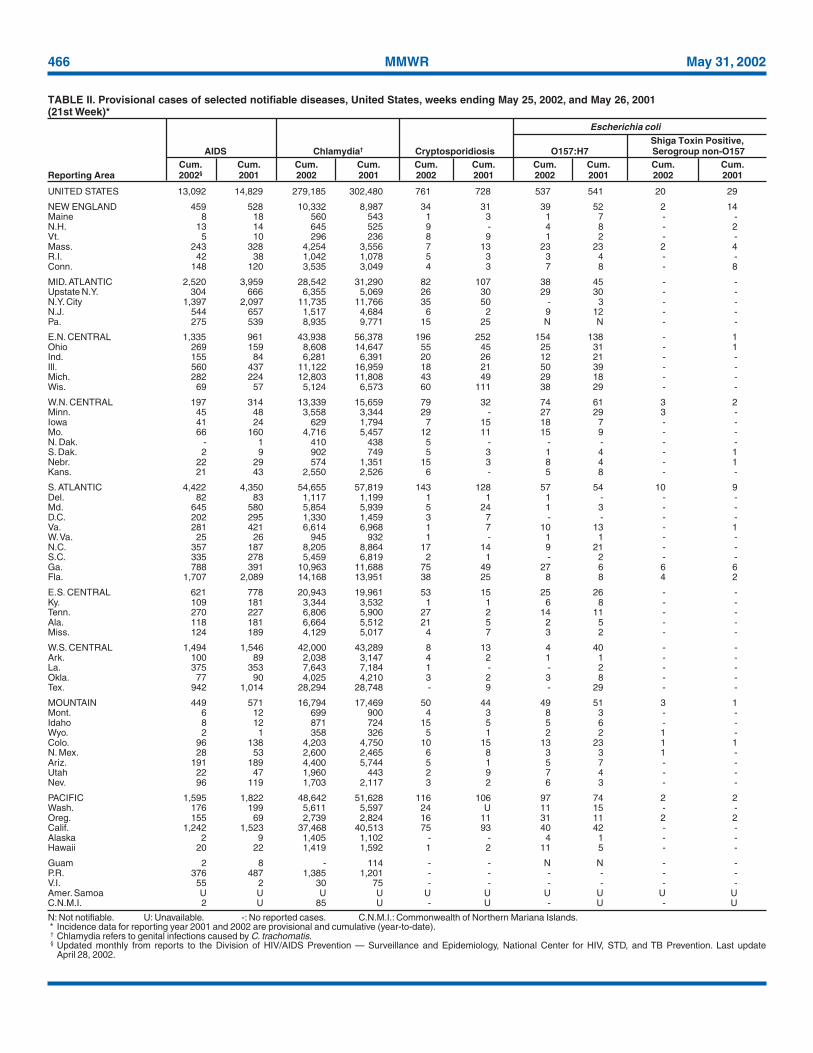
N: Not notifiable. U: Unavailable. -: No reported cases. C.N.M.I.: Commonwealth of Northern Mariana Islands.* Incidence data for reporting year 2001 and 2002 are provisional and cumulative (year-to-date).† Chlamydia refers to genital infections caused by C. trachomatis.§ Updated monthly from reports to the Division of HIV/AIDS Prevention — Surveillance and Epidemiology, National Center for HIV, STD, and TB Prevention. Last update
April 28, 2002.
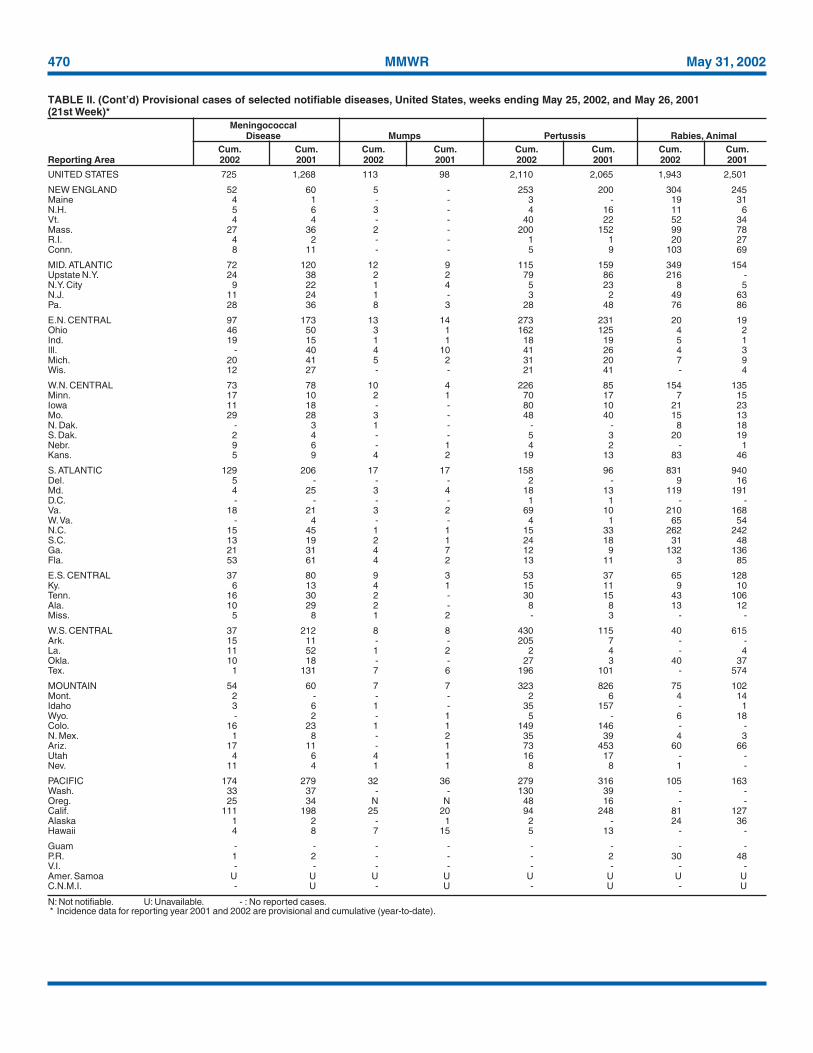
TABLE II. Provisional cases of selected notifiable diseases, United States, weeks ending May 25, 2002, and May 26, 2001(21st Week)*
UNITED STATES 13,092 14,829 279,185 302,480 761 728 537 541 20 29
NEW ENGLAND 459 528 10,332 8,987 34 31 39 52 2 14Maine 8 18 560 543 1 3 1 7 - -N.H. 13 14 645 525 9 - 4 8 - 2Vt. 5 10 296 236 8 9 1 2 - -Mass. 243 328 4,254 3,556 7 13 23 23 2 4R.I. 42 38 1,042 1,078 5 3 3 4 - -Conn. 148 120 3,535 3,049 4 3 7 8 - 8
MID. ATLANTIC 2,520 3,959 28,542 31,290 82 107 38 45 - -Upstate N.Y. 304 666 6,355 5,069 26 30 29 30 - -N.Y. City 1,397 2,097 11,735 11,766 35 50 - 3 - -N.J. 544 657 1,517 4,684 6 2 9 12 - -Pa. 275 539 8,935 9,771 15 25 N N - -
E.N. CENTRAL 1,335 961 43,938 56,378 196 252 154 138 - 1Ohio 269 159 8,608 14,647 55 45 25 31 - 1Ind. 155 84 6,281 6,391 20 26 12 21 - -Ill. 560 437 11,122 16,959 18 21 50 39 - -Mich. 282 224 12,803 11,808 43 49 29 18 - -Wis. 69 57 5,124 6,573 60 111 38 29 - -
W.N. CENTRAL 197 314 13,339 15,659 79 32 74 61 3 2Minn. 45 48 3,558 3,344 29 - 27 29 3 -Iowa 41 24 629 1,794 7 15 18 7 - -Mo. 66 160 4,716 5,457 12 11 15 9 - -N. Dak. - 1 410 438 5 - - - - -S. Dak. 2 9 902 749 5 3 1 4 - 1Nebr. 22 29 574 1,351 15 3 8 4 - 1Kans. 21 43 2,550 2,526 6 - 5 8 - -
S. ATLANTIC 4,422 4,350 54,655 57,819 143 128 57 54 10 9Del. 82 83 1,117 1,199 1 1 1 - - -Md. 645 580 5,854 5,939 5 24 1 3 - -D.C. 202 295 1,330 1,459 3 7 - - - -Va. 281 421 6,614 6,968 1 7 10 13 - 1W. Va. 25 26 945 932 1 - 1 1 - -N.C. 357 187 8,205 8,864 17 14 9 21 - -S.C. 335 278 5,459 6,819 2 1 - 2 - -Ga. 788 391 10,963 11,688 75 49 27 6 6 6Fla. 1,707 2,089 14,168 13,951 38 25 8 8 4 2
E.S. CENTRAL 621 778 20,943 19,961 53 15 25 26 - -Ky. 109 181 3,344 3,532 1 1 6 8 - -Tenn. 270 227 6,806 5,900 27 2 14 11 - -Ala. 118 181 6,664 5,512 21 5 2 5 - -Miss. 124 189 4,129 5,017 4 7 3 2 - -
W.S. CENTRAL 1,494 1,546 42,000 43,289 8 13 4 40 - -Ark. 100 89 2,038 3,147 4 2 1 1 - -La. 375 353 7,643 7,184 1 - - 2 - -Okla. 77 90 4,025 4,210 3 2 3 8 - -Tex. 942 1,014 28,294 28,748 - 9 - 29 - -
MOUNTAIN 449 571 16,794 17,469 50 44 49 51 3 1Mont. 6 12 699 900 4 3 8 3 - -Idaho 8 12 871 724 15 5 5 6 - -Wyo. 2 1 358 326 5 1 2 2 1 -Colo. 96 138 4,203 4,750 10 15 13 23 1 1N. Mex. 28 53 2,600 2,465 6 8 3 3 1 -Ariz. 191 189 4,400 5,744 5 1 5 7 - -Utah 22 47 1,960 443 2 9 7 4 - -Nev. 96 119 1,703 2,117 3 2 6 3 - -
PACIFIC 1,595 1,822 48,642 51,628 116 106 97 74 2 2Wash. 176 199 5,611 5,597 24 U 11 15 - -Oreg. 155 69 2,739 2,824 16 11 31 11 2 2Calif. 1,242 1,523 37,468 40,513 75 93 40 42 - -Alaska 2 9 1,405 1,102 - - 4 1 - -Hawaii 20 22 1,419 1,592 1 2 11 5 - -
Guam 2 8 - 114 - - N N - -P.R. 376 487 1,385 1,201 - - - - - -V.I. 55 2 30 75 - - - - - -Amer. Samoa U U U U U U U U U UC.N.M.I. 2 U 85 U - U - U - U
Shiga Toxin Positive,AIDS Chlamydia† Cryptosporidiosis O157:H7 Serogroup non-O157
Cum. Cum. Cum. Cum. Cum. Cum. Cum. Cum. Cum. Cum.Reporting Area 2002§ 2001 2002 2001 2002 2001 2002 2001 2002 2001
Escherichia coli
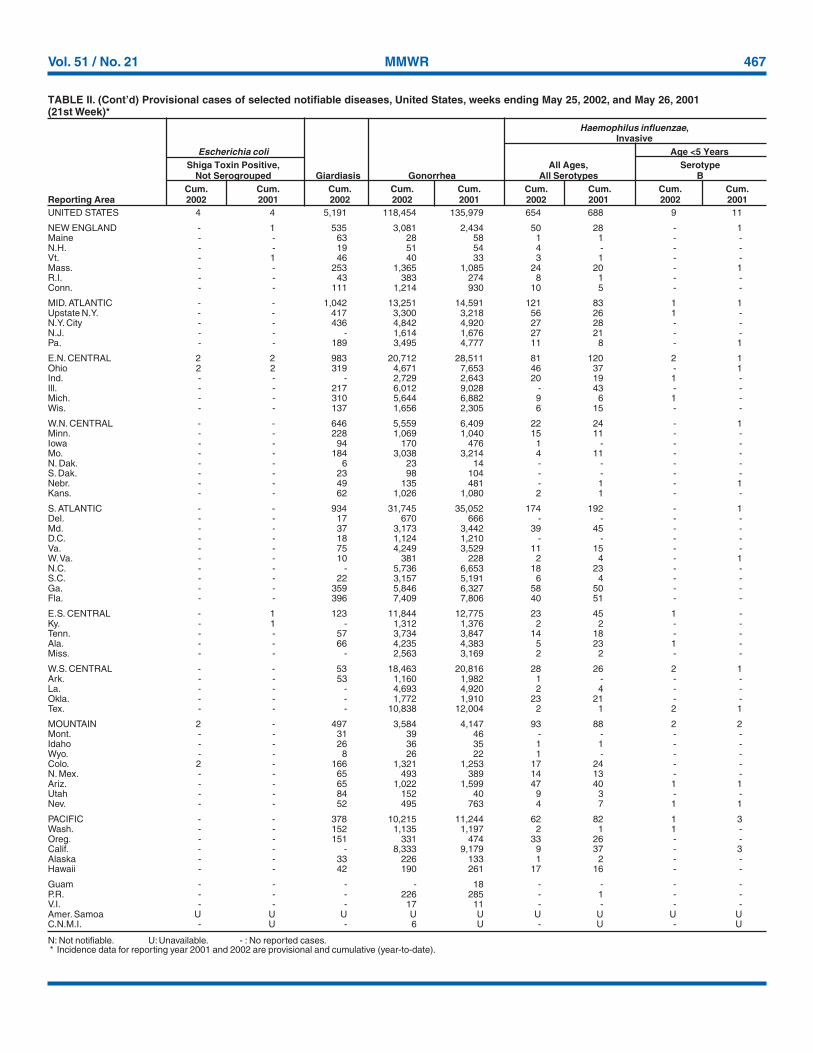
Vol. 51 / No. 21 MMWR 467
N: Not notifiable. U: Unavailable. - : No reported cases.* Incidence data for reporting year 2001 and 2002 are provisional and cumulative (year-to-date).
UNITED STATES 4 4 5,191 118,454 135,979 654 688 9 11
NEW ENGLAND - 1 535 3,081 2,434 50 28 - 1Maine - - 63 28 58 1 1 - -N.H. - - 19 51 54 4 - - -Vt. - 1 46 40 33 3 1 - -Mass. - - 253 1,365 1,085 24 20 - 1R.I. - - 43 383 274 8 1 - -Conn. - - 111 1,214 930 10 5 - -
MID. ATLANTIC - - 1,042 13,251 14,591 121 83 1 1Upstate N.Y. - - 417 3,300 3,218 56 26 1 -N.Y. City - - 436 4,842 4,920 27 28 - -N.J. - - - 1,614 1,676 27 21 - -Pa. - - 189 3,495 4,777 11 8 - 1
E.N. CENTRAL 2 2 983 20,712 28,511 81 120 2 1Ohio 2 2 319 4,671 7,653 46 37 - 1Ind. - - - 2,729 2,643 20 19 1 -Ill. - - 217 6,012 9,028 - 43 - -Mich. - - 310 5,644 6,882 9 6 1 -Wis. - - 137 1,656 2,305 6 15 - -
W.N. CENTRAL - - 646 5,559 6,409 22 24 - 1Minn. - - 228 1,069 1,040 15 11 - -Iowa - - 94 170 476 1 - - -Mo. - - 184 3,038 3,214 4 11 - -N. Dak. - - 6 23 14 - - - -S. Dak. - - 23 98 104 - - - -Nebr. - - 49 135 481 - 1 - 1Kans. - - 62 1,026 1,080 2 1 - -
S. ATLANTIC - - 934 31,745 35,052 174 192 - 1Del. - - 17 670 666 - - - -Md. - - 37 3,173 3,442 39 45 - -D.C. - - 18 1,124 1,210 - - - -Va. - - 75 4,249 3,529 11 15 - -W. Va. - - 10 381 228 2 4 - 1N.C. - - - 5,736 6,653 18 23 - -S.C. - - 22 3,157 5,191 6 4 - -Ga. - - 359 5,846 6,327 58 50 - -Fla. - - 396 7,409 7,806 40 51 - -
E.S. CENTRAL - 1 123 11,844 12,775 23 45 1 -Ky. - 1 - 1,312 1,376 2 2 - -Tenn. - - 57 3,734 3,847 14 18 - -Ala. - - 66 4,235 4,383 5 23 1 -Miss. - - - 2,563 3,169 2 2 - -
W.S. CENTRAL - - 53 18,463 20,816 28 26 2 1Ark. - - 53 1,160 1,982 1 - - -La. - - - 4,693 4,920 2 4 - -Okla. - - - 1,772 1,910 23 21 - -Tex. - - - 10,838 12,004 2 1 2 1
MOUNTAIN 2 - 497 3,584 4,147 93 88 2 2Mont. - - 31 39 46 - - - -Idaho - - 26 36 35 1 1 - -Wyo. - - 8 26 22 1 - - -Colo. 2 - 166 1,321 1,253 17 24 - -N. Mex. - - 65 493 389 14 13 - -Ariz. - - 65 1,022 1,599 47 40 1 1Utah - - 84 152 40 9 3 - -Nev. - - 52 495 763 4 7 1 1
PACIFIC - - 378 10,215 11,244 62 82 1 3Wash. - - 152 1,135 1,197 2 1 1 -Oreg. - - 151 331 474 33 26 - -Calif. - - - 8,333 9,179 9 37 - 3Alaska - - 33 226 133 1 2 - -Hawaii - - 42 190 261 17 16 - -
Guam - - - - 18 - - - -P.R. - - - 226 285 - 1 - -V.I. - - - 17 11 - - - -Amer. Samoa U U U U U U U U UC.N.M.I. - U - 6 U - U - U
TABLE II. (Cont’d) Provisional cases of selected notifiable diseases, United States, weeks ending May 25, 2002, and May 26, 2001(21st Week)*
Haemophilus influenzae,Invasive
Escherichia coli Age <5 YearsShiga Toxin Positive, All Ages, Serotype
Not Serogrouped Giardiasis Gonorrhea All Serotypes BCum. Cum. Cum. Cum. Cum. Cum. Cum. Cum. Cum.
Reporting Area 2002 2001 2002 2002 2001 2002 2001 2002 2001
468 MMWR May 31, 2002
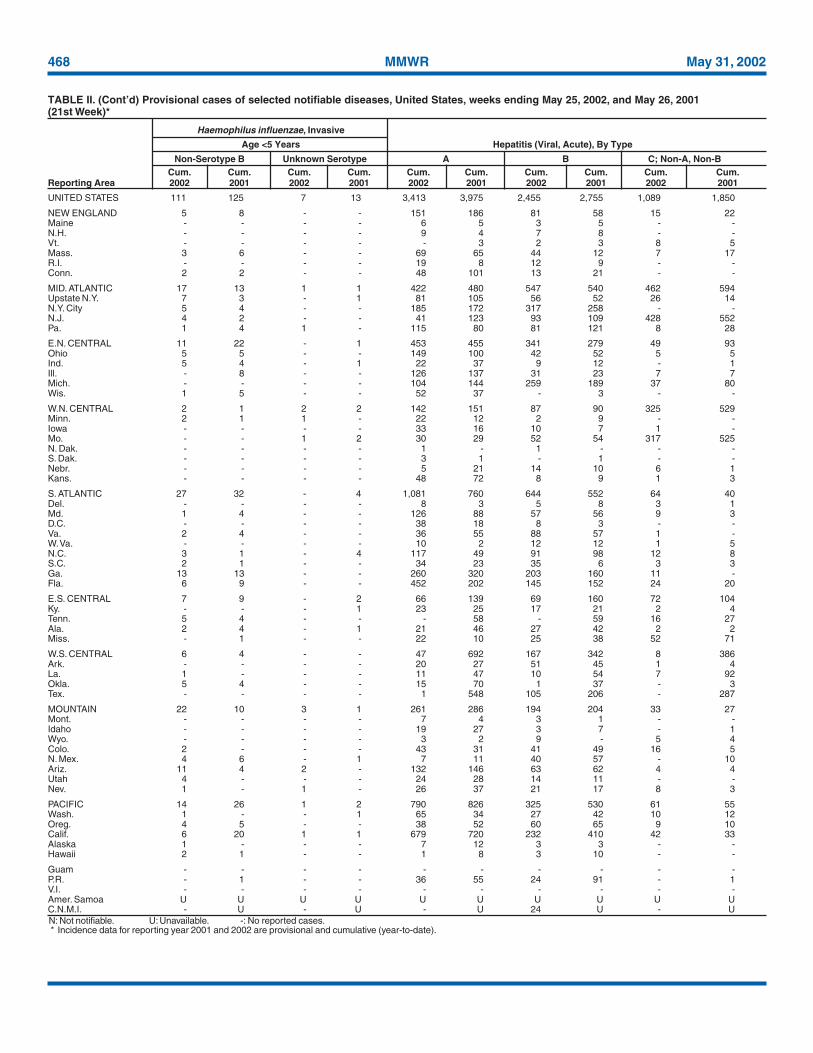
N: Not notifiable. U: Unavailable. -: No reported cases.* Incidence data for reporting year 2001 and 2002 are provisional and cumulative (year-to-date).
UNITED STATES 111 125 7 13 3,413 3,975 2,455 2,755 1,089 1,850
NEW ENGLAND 5 8 - - 151 186 81 58 15 22Maine - - - - 6 5 3 5 - -N.H. - - - - 9 4 7 8 - -Vt. - - - - - 3 2 3 8 5Mass. 3 6 - - 69 65 44 12 7 17R.I. - - - - 19 8 12 9 - -Conn. 2 2 - - 48 101 13 21 - -
MID. ATLANTIC 17 13 1 1 422 480 547 540 462 594Upstate N.Y. 7 3 - 1 81 105 56 52 26 14N.Y. City 5 4 - - 185 172 317 258 - -N.J. 4 2 - - 41 123 93 109 428 552Pa. 1 4 1 - 115 80 81 121 8 28
E.N. CENTRAL 11 22 - 1 453 455 341 279 49 93Ohio 5 5 - - 149 100 42 52 5 5Ind. 5 4 - 1 22 37 9 12 - 1Ill. - 8 - - 126 137 31 23 7 7Mich. - - - - 104 144 259 189 37 80Wis. 1 5 - - 52 37 - 3 - -
W.N. CENTRAL 2 1 2 2 142 151 87 90 325 529Minn. 2 1 1 - 22 12 2 9 - -Iowa - - - - 33 16 10 7 1 -Mo. - - 1 2 30 29 52 54 317 525N. Dak. - - - - 1 - 1 - - -S. Dak. - - - - 3 1 - 1 - -Nebr. - - - - 5 21 14 10 6 1Kans. - - - - 48 72 8 9 1 3
S. ATLANTIC 27 32 - 4 1,081 760 644 552 64 40Del. - - - - 8 3 5 8 3 1Md. 1 4 - - 126 88 57 56 9 3D.C. - - - - 38 18 8 3 - -Va. 2 4 - - 36 55 88 57 1 -W. Va. - - - - 10 2 12 12 1 5N.C. 3 1 - 4 117 49 91 98 12 8S.C. 2 1 - - 34 23 35 6 3 3Ga. 13 13 - - 260 320 203 160 11 -Fla. 6 9 - - 452 202 145 152 24 20
E.S. CENTRAL 7 9 - 2 66 139 69 160 72 104Ky. - - - 1 23 25 17 21 2 4Tenn. 5 4 - - - 58 - 59 16 27Ala. 2 4 - 1 21 46 27 42 2 2Miss. - 1 - - 22 10 25 38 52 71
W.S. CENTRAL 6 4 - - 47 692 167 342 8 386Ark. - - - - 20 27 51 45 1 4La. 1 - - - 11 47 10 54 7 92Okla. 5 4 - - 15 70 1 37 - 3Tex. - - - - 1 548 105 206 - 287
MOUNTAIN 22 10 3 1 261 286 194 204 33 27Mont. - - - - 7 4 3 1 - -Idaho - - - - 19 27 3 7 - 1Wyo. - - - - 3 2 9 - 5 4Colo. 2 - - - 43 31 41 49 16 5N. Mex. 4 6 - 1 7 11 40 57 - 10Ariz. 11 4 2 - 132 146 63 62 4 4Utah 4 - - - 24 28 14 11 - -Nev. 1 - 1 - 26 37 21 17 8 3
PACIFIC 14 26 1 2 790 826 325 530 61 55Wash. 1 - - 1 65 34 27 42 10 12Oreg. 4 5 - - 38 52 60 65 9 10Calif. 6 20 1 1 679 720 232 410 42 33Alaska 1 - - - 7 12 3 3 - -Hawaii 2 1 - - 1 8 3 10 - -
Guam - - - - - - - - - -P.R. - 1 - - 36 55 24 91 - 1V.I. - - - - - - - - - -Amer. Samoa U U U U U U U U U UC.N.M.I. - U - U - U 24 U - U
TABLE II. (Cont’d) Provisional cases of selected notifiable diseases, United States, weeks ending May 25, 2002, and May 26, 2001(21st Week)*
Haemophilus influenzae, Invasive
Age <5 Years Hepatitis (Viral, Acute), By Type
Non-Serotype B Unknown Serotype A B C; Non-A, Non-BCum. Cum. Cum. Cum. Cum. Cum. Cum. Cum. Cum. Cum.
Reporting Area 2002 2001 2002 2001 2002 2001 2002 2001 2002 2001
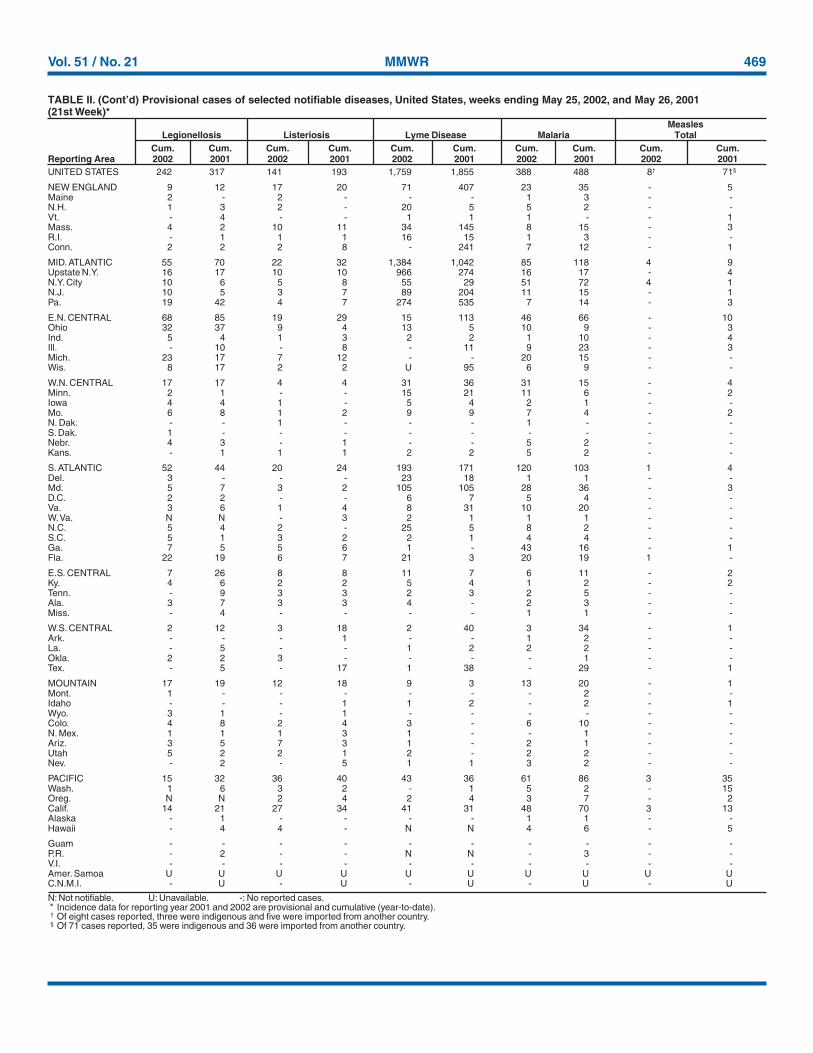
Vol. 51 / No. 21 MMWR 469
N: Not notifiable. U: Unavailable. -: No reported cases.* Incidence data for reporting year 2001 and 2002 are provisional and cumulative (year-to-date).† Of eight cases reported, three were indigenous and five were imported from another country.§ Of 71 cases reported, 35 were indigenous and 36 were imported from another country.
UNITED STATES 242 317 141 193 1,759 1,855 388 488 8† 71§
NEW ENGLAND 9 12 17 20 71 407 23 35 - 5Maine 2 - 2 - - - 1 3 - -N.H. 1 3 2 - 20 5 5 2 - -Vt. - 4 - - 1 1 1 - - 1Mass. 4 2 10 11 34 145 8 15 - 3R.I. - 1 1 1 16 15 1 3 - -Conn. 2 2 2 8 - 241 7 12 - 1
MID. ATLANTIC 55 70 22 32 1,384 1,042 85 118 4 9Upstate N.Y. 16 17 10 10 966 274 16 17 - 4N.Y. City 10 6 5 8 55 29 51 72 4 1N.J. 10 5 3 7 89 204 11 15 - 1Pa. 19 42 4 7 274 535 7 14 - 3
E.N. CENTRAL 68 85 19 29 15 113 46 66 - 10Ohio 32 37 9 4 13 5 10 9 - 3Ind. 5 4 1 3 2 2 1 10 - 4Ill. - 10 - 8 - 11 9 23 - 3Mich. 23 17 7 12 - - 20 15 - -Wis. 8 17 2 2 U 95 6 9 - -
W.N. CENTRAL 17 17 4 4 31 36 31 15 - 4Minn. 2 1 - - 15 21 11 6 - 2Iowa 4 4 1 - 5 4 2 1 - -Mo. 6 8 1 2 9 9 7 4 - 2N. Dak. - - 1 - - - 1 - - -S. Dak. 1 - - - - - - - - -Nebr. 4 3 - 1 - - 5 2 - -Kans. - 1 1 1 2 2 5 2 - -
S. ATLANTIC 52 44 20 24 193 171 120 103 1 4Del. 3 - - - 23 18 1 1 - -Md. 5 7 3 2 105 105 28 36 - 3D.C. 2 2 - - 6 7 5 4 - -Va. 3 6 1 4 8 31 10 20 - -W. Va. N N - 3 2 1 1 1 - -N.C. 5 4 2 - 25 5 8 2 - -S.C. 5 1 3 2 2 1 4 4 - -Ga. 7 5 5 6 1 - 43 16 - 1Fla. 22 19 6 7 21 3 20 19 1 -
E.S. CENTRAL 7 26 8 8 11 7 6 11 - 2Ky. 4 6 2 2 5 4 1 2 - 2Tenn. - 9 3 3 2 3 2 5 - -Ala. 3 7 3 3 4 - 2 3 - -Miss. - 4 - - - - 1 1 - -
W.S. CENTRAL 2 12 3 18 2 40 3 34 - 1Ark. - - - 1 - - 1 2 - -La. - 5 - - 1 2 2 2 - -Okla. 2 2 3 - - - - 1 - -Tex. - 5 - 17 1 38 - 29 - 1
MOUNTAIN 17 19 12 18 9 3 13 20 - 1Mont. 1 - - - - - - 2 - -Idaho - - - 1 1 2 - 2 - 1Wyo. 3 1 - 1 - - - - - -Colo. 4 8 2 4 3 - 6 10 - -N. Mex. 1 1 1 3 1 - - 1 - -Ariz. 3 5 7 3 1 - 2 1 - -Utah 5 2 2 1 2 - 2 2 - -Nev. - 2 - 5 1 1 3 2 - -
PACIFIC 15 32 36 40 43 36 61 86 3 35Wash. 1 6 3 2 - 1 5 2 - 15Oreg. N N 2 4 2 4 3 7 - 2Calif. 14 21 27 34 41 31 48 70 3 13Alaska - 1 - - - - 1 1 - -Hawaii - 4 4 - N N 4 6 - 5
Guam - - - - - - - - - -P.R. - 2 - - N N - 3 - -V.I. - - - - - - - - - -Amer. Samoa U U U U U U U U U UC.N.M.I. - U - U - U - U - U
TABLE II. (Cont’d) Provisional cases of selected notifiable diseases, United States, weeks ending May 25, 2002, and May 26, 2001(21st Week)*
MeaslesLegionellosis Listeriosis Lyme Disease Malaria Total
Cum. Cum. Cum. Cum. Cum. Cum. Cum. Cum. Cum. Cum.Reporting Area 2002 2001 2002 2001 2002 2001 2002 2001 2002 2001
470 MMWR May 31, 2002
N: Not notifiable. U: Unavailable. - : No reported cases.* Incidence data for reporting year 2001 and 2002 are provisional and cumulative (year-to-date).
UNITED STATES 725 1,268 113 98 2,110 2,065 1,943 2,501
NEW ENGLAND 52 60 5 - 253 200 304 245Maine 4 1 - - 3 - 19 31N.H. 5 6 3 - 4 16 11 6Vt. 4 4 - - 40 22 52 34Mass. 27 36 2 - 200 152 99 78R.I. 4 2 - - 1 1 20 27Conn. 8 11 - - 5 9 103 69
MID. ATLANTIC 72 120 12 9 115 159 349 154Upstate N.Y. 24 38 2 2 79 86 216 -N.Y. City 9 22 1 4 5 23 8 5N.J. 11 24 1 - 3 2 49 63Pa. 28 36 8 3 28 48 76 86
E.N. CENTRAL 97 173 13 14 273 231 20 19Ohio 46 50 3 1 162 125 4 2Ind. 19 15 1 1 18 19 5 1Ill. - 40 4 10 41 26 4 3Mich. 20 41 5 2 31 20 7 9Wis. 12 27 - - 21 41 - 4
W.N. CENTRAL 73 78 10 4 226 85 154 135Minn. 17 10 2 1 70 17 7 15Iowa 11 18 - - 80 10 21 23Mo. 29 28 3 - 48 40 15 13N. Dak. - 3 1 - - - 8 18S. Dak. 2 4 - - 5 3 20 19Nebr. 9 6 - 1 4 2 - 1Kans. 5 9 4 2 19 13 83 46
S. ATLANTIC 129 206 17 17 158 96 831 940Del. 5 - - - 2 - 9 16Md. 4 25 3 4 18 13 119 191D.C. - - - - 1 1 - -Va. 18 21 3 2 69 10 210 168W. Va. - 4 - - 4 1 65 54N.C. 15 45 1 1 15 33 262 242S.C. 13 19 2 1 24 18 31 48Ga. 21 31 4 7 12 9 132 136Fla. 53 61 4 2 13 11 3 85
E.S. CENTRAL 37 80 9 3 53 37 65 128Ky. 6 13 4 1 15 11 9 10Tenn. 16 30 2 - 30 15 43 106Ala. 10 29 2 - 8 8 13 12Miss. 5 8 1 2 - 3 - -
W.S. CENTRAL 37 212 8 8 430 115 40 615Ark. 15 11 - - 205 7 - -La. 11 52 1 2 2 4 - 4Okla. 10 18 - - 27 3 40 37Tex. 1 131 7 6 196 101 - 574
MOUNTAIN 54 60 7 7 323 826 75 102Mont. 2 - - - 2 6 4 14Idaho 3 6 1 - 35 157 - 1Wyo. - 2 - 1 5 - 6 18Colo. 16 23 1 1 149 146 - -N. Mex. 1 8 - 2 35 39 4 3Ariz. 17 11 - 1 73 453 60 66Utah 4 6 4 1 16 17 - -Nev. 11 4 1 1 8 8 1 -
PACIFIC 174 279 32 36 279 316 105 163Wash. 33 37 - - 130 39 - -Oreg. 25 34 N N 48 16 - -Calif. 111 198 25 20 94 248 81 127Alaska 1 2 - 1 2 - 24 36Hawaii 4 8 7 15 5 13 - -
Guam - - - - - - - -P.R. 1 2 - - - 2 30 48V.I. - - - - - - - -Amer. Samoa U U U U U U U UC.N.M.I. - U - U - U - U
TABLE II. (Cont’d) Provisional cases of selected notifiable diseases, United States, weeks ending May 25, 2002, and May 26, 2001(21st Week)*
MeningococcalDisease Mumps Pertussis Rabies, Animal
Cum. Cum. Cum. Cum. Cum. Cum. Cum. Cum.Reporting Area 2002 2001 2002 2001 2002 2001 2002 2001
Vol. 51 / No. 21 MMWR 471
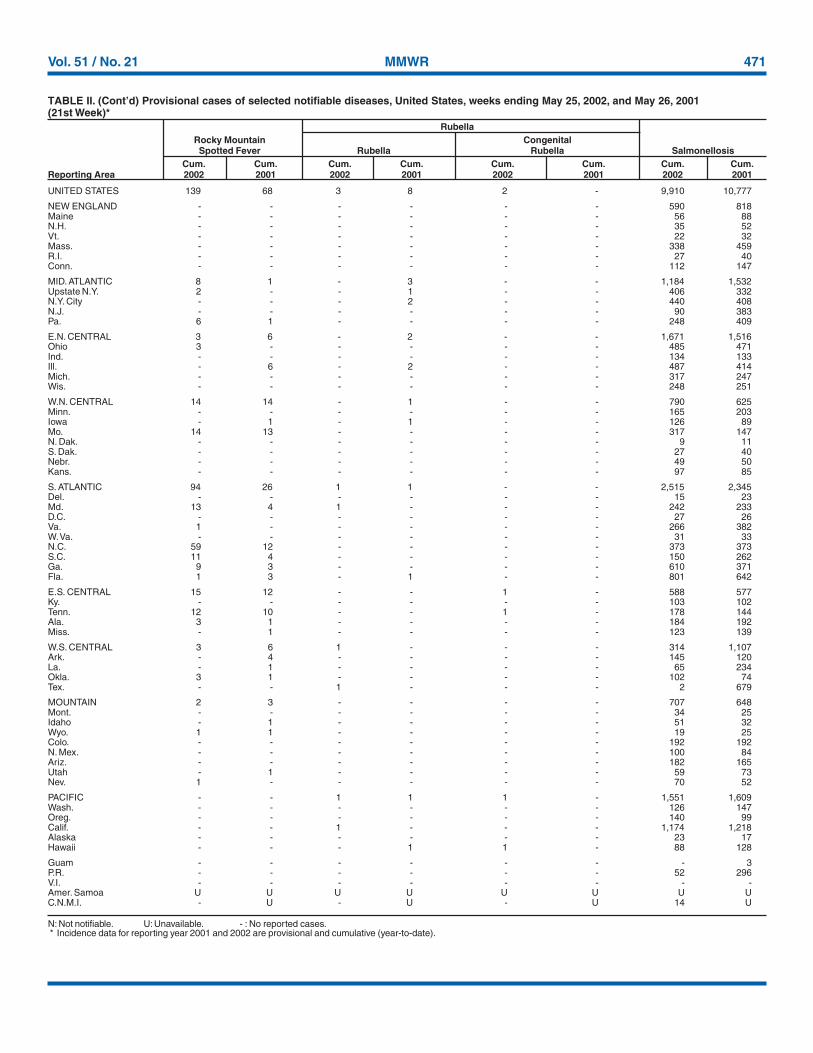
N: Not notifiable. U: Unavailable. - : No reported cases.* Incidence data for reporting year 2001 and 2002 are provisional and cumulative (year-to-date).
UNITED STATES 139 68 3 8 2 - 9,910 10,777
NEW ENGLAND - - - - - - 590 818Maine - - - - - - 56 88N.H. - - - - - - 35 52Vt. - - - - - - 22 32Mass. - - - - - - 338 459R.I. - - - - - - 27 40Conn. - - - - - - 112 147
MID. ATLANTIC 8 1 - 3 - - 1,184 1,532Upstate N.Y. 2 - - 1 - - 406 332N.Y. City - - - 2 - - 440 408N.J. - - - - - - 90 383Pa. 6 1 - - - - 248 409
E.N. CENTRAL 3 6 - 2 - - 1,671 1,516Ohio 3 - - - - - 485 471Ind. - - - - - - 134 133Ill. - 6 - 2 - - 487 414Mich. - - - - - - 317 247Wis. - - - - - - 248 251
W.N. CENTRAL 14 14 - 1 - - 790 625Minn. - - - - - - 165 203Iowa - 1 - 1 - - 126 89Mo. 14 13 - - - - 317 147N. Dak. - - - - - - 9 11S. Dak. - - - - - - 27 40Nebr. - - - - - - 49 50Kans. - - - - - - 97 85
S. ATLANTIC 94 26 1 1 - - 2,515 2,345Del. - - - - - - 15 23Md. 13 4 1 - - - 242 233D.C. - - - - - - 27 26Va. 1 - - - - - 266 382W. Va. - - - - - - 31 33N.C. 59 12 - - - - 373 373S.C. 11 4 - - - - 150 262Ga. 9 3 - - - - 610 371Fla. 1 3 - 1 - - 801 642
E.S. CENTRAL 15 12 - - 1 - 588 577Ky. - - - - - - 103 102Tenn. 12 10 - - 1 - 178 144Ala. 3 1 - - - - 184 192Miss. - 1 - - - - 123 139
W.S. CENTRAL 3 6 1 - - - 314 1,107Ark. - 4 - - - - 145 120La. - 1 - - - - 65 234Okla. 3 1 - - - - 102 74Tex. - - 1 - - - 2 679
MOUNTAIN 2 3 - - - - 707 648Mont. - - - - - - 34 25Idaho - 1 - - - - 51 32Wyo. 1 1 - - - - 19 25Colo. - - - - - - 192 192N. Mex. - - - - - - 100 84Ariz. - - - - - - 182 165Utah - 1 - - - - 59 73Nev. 1 - - - - - 70 52
PACIFIC - - 1 1 1 - 1,551 1,609Wash. - - - - - - 126 147Oreg. - - - - - - 140 99Calif. - - 1 - - - 1,174 1,218Alaska - - - - - - 23 17Hawaii - - - 1 1 - 88 128
Guam - - - - - - - 3P.R. - - - - - - 52 296V.I. - - - - - - - -Amer. Samoa U U U U U U U UC.N.M.I. - U - U - U 14 U
TABLE II. (Cont’d) Provisional cases of selected notifiable diseases, United States, weeks ending May 25, 2002, and May 26, 2001(21st Week)*
RubellaRocky Mountain CongenitalSpotted Fever Rubella Rubella Salmonellosis
Cum. Cum. Cum. Cum. Cum. Cum. Cum. Cum.Reporting Area 2002 2001 2002 2001 2002 2001 2002 2001
472 MMWR May 31, 2002
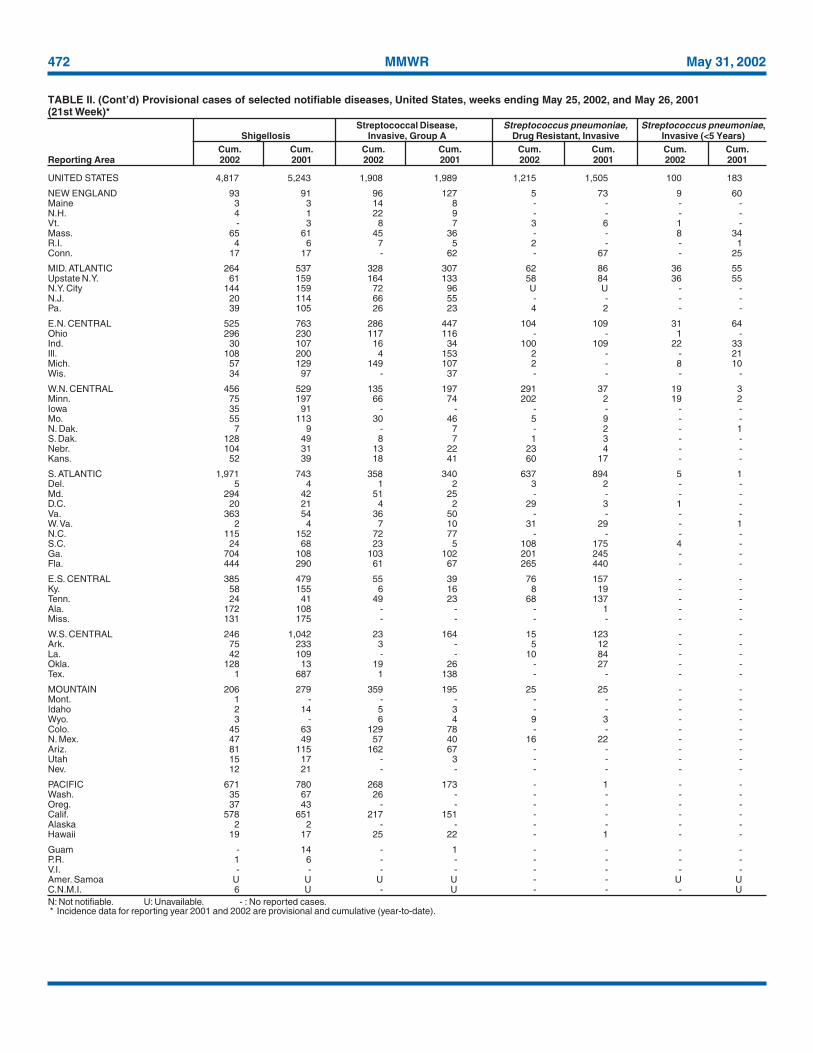
N: Not notifiable. U: Unavailable. - : No reported cases.* Incidence data for reporting year 2001 and 2002 are provisional and cumulative (year-to-date).
UNITED STATES 4,817 5,243 1,908 1,989 1,215 1,505 100 183
NEW ENGLAND 93 91 96 127 5 73 9 60Maine 3 3 14 8 - - - -N.H. 4 1 22 9 - - - -Vt. - 3 8 7 3 6 1 -Mass. 65 61 45 36 - - 8 34R.I. 4 6 7 5 2 - - 1Conn. 17 17 - 62 - 67 - 25
MID. ATLANTIC 264 537 328 307 62 86 36 55Upstate N.Y. 61 159 164 133 58 84 36 55N.Y. City 144 159 72 96 U U - -N.J. 20 114 66 55 - - - -Pa. 39 105 26 23 4 2 - -
E.N. CENTRAL 525 763 286 447 104 109 31 64Ohio 296 230 117 116 - - 1 -Ind. 30 107 16 34 100 109 22 33Ill. 108 200 4 153 2 - - 21Mich. 57 129 149 107 2 - 8 10Wis. 34 97 - 37 - - - -
W.N. CENTRAL 456 529 135 197 291 37 19 3Minn. 75 197 66 74 202 2 19 2Iowa 35 91 - - - - - -Mo. 55 113 30 46 5 9 - -N. Dak. 7 9 - 7 - 2 - 1S. Dak. 128 49 8 7 1 3 - -Nebr. 104 31 13 22 23 4 - -Kans. 52 39 18 41 60 17 - -
S. ATLANTIC 1,971 743 358 340 637 894 5 1Del. 5 4 1 2 3 2 - -Md. 294 42 51 25 - - - -D.C. 20 21 4 2 29 3 1 -Va. 363 54 36 50 - - - -W. Va. 2 4 7 10 31 29 - 1N.C. 115 152 72 77 - - - -S.C. 24 68 23 5 108 175 4 -Ga. 704 108 103 102 201 245 - -Fla. 444 290 61 67 265 440 - -
E.S. CENTRAL 385 479 55 39 76 157 - -Ky. 58 155 6 16 8 19 - -Tenn. 24 41 49 23 68 137 - -Ala. 172 108 - - - 1 - -Miss. 131 175 - - - - - -
W.S. CENTRAL 246 1,042 23 164 15 123 - -Ark. 75 233 3 - 5 12 - -La. 42 109 - - 10 84 - -Okla. 128 13 19 26 - 27 - -Tex. 1 687 1 138 - - - -
MOUNTAIN 206 279 359 195 25 25 - -Mont. 1 - - - - - - -Idaho 2 14 5 3 - - - -Wyo. 3 - 6 4 9 3 - -Colo. 45 63 129 78 - - - -N. Mex. 47 49 57 40 16 22 - -Ariz. 81 115 162 67 - - - -Utah 15 17 - 3 - - - -Nev. 12 21 - - - - - -
PACIFIC 671 780 268 173 - 1 - -Wash. 35 67 26 - - - - -Oreg. 37 43 - - - - - -Calif. 578 651 217 151 - - - -Alaska 2 2 - - - - - -Hawaii 19 17 25 22 - 1 - -
Guam - 14 - 1 - - - -P.R. 1 6 - - - - - -V.I. - - - - - - - -Amer. Samoa U U U U - - U UC.N.M.I. 6 U - U - - - U
TABLE II. (Cont’d) Provisional cases of selected notifiable diseases, United States, weeks ending May 25, 2002, and May 26, 2001(21st Week)*
Streptococcal Disease, Streptococcus pneumoniae, Streptococcus pneumoniae,Shigellosis Invasive, Group A Drug Resistant, Invasive Invasive (<5 Years)
Cum. Cum. Cum. Cum. Cum. Cum. Cum. Cum.Reporting Area 2002 2001 2002 2001 2002 2001 2002 2001
Vol. 51 / No. 21 MMWR 473
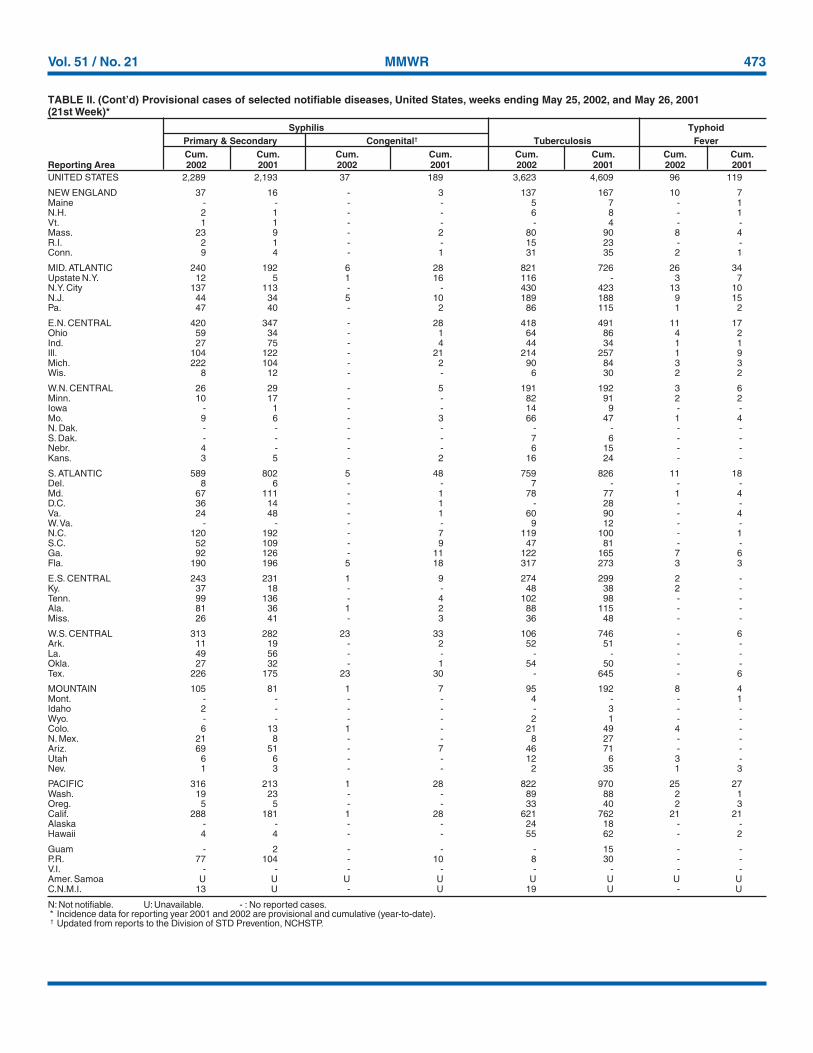
N: Not notifiable. U: Unavailable. - : No reported cases.* Incidence data for reporting year 2001 and 2002 are provisional and cumulative (year-to-date).† Updated from reports to the Division of STD Prevention, NCHSTP.
UNITED STATES 2,289 2,193 37 189 3,623 4,609 96 119
NEW ENGLAND 37 16 - 3 137 167 10 7Maine - - - - 5 7 - 1N.H. 2 1 - - 6 8 - 1Vt. 1 1 - - - 4 - -Mass. 23 9 - 2 80 90 8 4R.I. 2 1 - - 15 23 - -Conn. 9 4 - 1 31 35 2 1
MID. ATLANTIC 240 192 6 28 821 726 26 34Upstate N.Y. 12 5 1 16 116 - 3 7N.Y. City 137 113 - - 430 423 13 10N.J. 44 34 5 10 189 188 9 15Pa. 47 40 - 2 86 115 1 2
E.N. CENTRAL 420 347 - 28 418 491 11 17Ohio 59 34 - 1 64 86 4 2Ind. 27 75 - 4 44 34 1 1Ill. 104 122 - 21 214 257 1 9Mich. 222 104 - 2 90 84 3 3Wis. 8 12 - - 6 30 2 2
W.N. CENTRAL 26 29 - 5 191 192 3 6Minn. 10 17 - - 82 91 2 2Iowa - 1 - - 14 9 - -Mo. 9 6 - 3 66 47 1 4N. Dak. - - - - - - - -S. Dak. - - - - 7 6 - -Nebr. 4 - - - 6 15 - -Kans. 3 5 - 2 16 24 - -
S. ATLANTIC 589 802 5 48 759 826 11 18Del. 8 6 - - 7 - - -Md. 67 111 - 1 78 77 1 4D.C. 36 14 - 1 - 28 - -Va. 24 48 - 1 60 90 - 4W. Va. - - - - 9 12 - -N.C. 120 192 - 7 119 100 - 1S.C. 52 109 - 9 47 81 - -Ga. 92 126 - 11 122 165 7 6Fla. 190 196 5 18 317 273 3 3
E.S. CENTRAL 243 231 1 9 274 299 2 -Ky. 37 18 - - 48 38 2 -Tenn. 99 136 - 4 102 98 - -Ala. 81 36 1 2 88 115 - -Miss. 26 41 - 3 36 48 - -
W.S. CENTRAL 313 282 23 33 106 746 - 6Ark. 11 19 - 2 52 51 - -La. 49 56 - - - - - -Okla. 27 32 - 1 54 50 - -Tex. 226 175 23 30 - 645 - 6
MOUNTAIN 105 81 1 7 95 192 8 4Mont. - - - - 4 - - 1Idaho 2 - - - - 3 - -Wyo. - - - - 2 1 - -Colo. 6 13 1 - 21 49 4 -N. Mex. 21 8 - - 8 27 - -Ariz. 69 51 - 7 46 71 - -Utah 6 6 - - 12 6 3 -Nev. 1 3 - - 2 35 1 3
PACIFIC 316 213 1 28 822 970 25 27Wash. 19 23 - - 89 88 2 1Oreg. 5 5 - - 33 40 2 3Calif. 288 181 1 28 621 762 21 21Alaska - - - - 24 18 - -Hawaii 4 4 - - 55 62 - 2
Guam - 2 - - - 15 - -P.R. 77 104 - 10 8 30 - -V.I. - - - - - - - -Amer. Samoa U U U U U U U UC.N.M.I. 13 U - U 19 U - U
TABLE II. (Cont’d) Provisional cases of selected notifiable diseases, United States, weeks ending May 25, 2002, and May 26, 2001(21st Week)*
Syphilis TyphoidPrimary & Secondary Congenital† Tuberculosis FeverCum. Cum. Cum. Cum. Cum. Cum. Cum. Cum.
Reporting Area 2002 2001 2002 2001 2002 2001 2002 2001
474 MMWR May 31, 2002
NEW ENGLAND 483 353 90 27 7 6 48Boston, Mass. 147 97 35 9 3 3 19Bridgeport, Conn. 25 18 4 2 1 - 3Cambridge, Mass. 17 15 1 1 - - 2Fall River, Mass. 31 26 3 2 - - 2Hartford, Conn. 50 35 10 3 1 1 3Lowell, Mass. 22 14 5 3 - - 1Lynn, Mass. 9 7 2 - - - 1New Bedford, Mass. 21 17 3 1 - - 2New Haven, Conn. 31 25 1 3 1 1 1Providence, R.I. U U U U U U USomerville, Mass. 3 2 1 - - - 1Springfield, Mass. 52 42 5 3 1 1 3Waterbury, Conn. 17 12 5 - - - 1Worcester, Mass. 58 43 15 - - - 9
MID. ATLANTIC 2,101 1,435 421 168 44 32 109Albany, N.Y. 51 25 11 10 3 2 4Allentown, Pa. 21 18 2 - - 1 3Buffalo, N.Y. 109 73 29 4 1 2 7Camden, N.J. 22 15 6 - - 1 3Elizabeth, N.J. 21 16 3 1 1 - -Erie, Pa. 30 24 5 1 - - 1Jersey City, N.J. 43 27 11 4 - 1 -New York City, N.Y. 1,103 761 215 93 24 10 37Newark, N.J. 51 28 10 9 2 1 4Paterson, N.J. 18 13 3 - 2 - 2Philadelphia, Pa. 277 167 64 33 9 4 21Pittsburgh, Pa.§ 32 21 9 1 - 1 3Reading, Pa. 23 19 4 - - - 2Rochester, N.Y. 120 92 18 6 - 4 7Schenectady, N.Y. 19 16 3 - - - 1Scranton, Pa. 26 21 2 2 - 1 1Syracuse, N.Y. 77 62 10 1 1 3 9Trenton, N.J. 34 22 7 3 1 1 2Utica, N.Y. 10 6 4 - - - -Yonkers, N.Y. 14 9 5 - - - 2
E.N. CENTRAL 1,353 913 283 95 27 35 77Akron, Ohio U U U U U U UCanton, Ohio 35 26 6 3 - - 3Chicago, Ill. U U U U U U UCincinnati, Ohio 80 47 20 7 4 2 8Cleveland, Ohio 136 80 36 11 1 8 6Columbus, Ohio 190 126 40 16 3 5 10Dayton, Ohio 131 86 33 8 4 - 9Detroit, Mich. U U U U U U UEvansville, Ind. 39 32 4 3 - - 4Fort Wayne, Ind. 78 51 16 4 4 3 2Gary, Ind. 18 10 3 3 1 1 -Grand Rapids, Mich. 55 39 9 2 3 2 5Indianapolis, Ind. 164 111 32 13 3 5 12Lansing, Mich. 29 17 9 1 1 1 2Milwaukee, Wis. 98 58 26 10 1 3 4Peoria, Ill. 60 47 8 5 - - 3Rockford, Ill. 49 37 10 1 1 - 3South Bend, Ind. 49 42 6 1 - - 1Toledo, Ohio 93 65 18 5 1 4 4Youngstown, Ohio 49 39 7 2 - 1 1
W.N. CENTRAL 522 348 109 34 16 15 40Des Moines, Iowa U U U U U U UDuluth, Minn. 26 18 4 2 2 - 1Kansas City, Kans. 34 21 11 1 1 - 1Kansas City, Mo. 87 57 18 7 2 3 8Lincoln, Nebr. 34 25 5 3 - 1 -Minneapolis, Minn. 95 54 28 6 6 1 9Omaha, Nebr. 85 60 16 6 1 2 9St. Louis, Mo. U U U U U U USt. Paul, Minn. 57 39 9 5 1 3 6Wichita, Kans. 104 74 18 4 3 5 6
S. ATLANTIC 1,231 781 263 119 39 29 80Atlanta, Ga. 147 90 26 23 5 3 3Baltimore, Md. 200 125 46 22 7 - 18Charlotte, N.C. 118 79 26 8 2 3 15Jacksonville, Fla. 137 86 33 10 2 6 7Miami, Fla. 83 55 17 8 2 1 4Norfolk, Va. 66 42 12 5 4 3 3Richmond, Va. 75 37 16 16 3 3 5Savannah, Ga. 64 36 24 2 2 - 7St. Petersburg, Fla. 75 56 8 8 1 2 5Tampa, Fla. 153 108 26 10 7 2 12Washington, D.C. 100 63 20 7 4 6 1Wilmington, Del. 13 4 9 - - - -
E.S. CENTRAL 629 427 142 41 9 10 51Birmingham, Ala. 174 122 37 11 3 1 19Chattanooga, Tenn. 80 51 21 5 1 2 4Knoxville, Tenn. 87 64 18 1 1 3 7Lexington, Ky. U U U U U U UMemphis, Tenn. U U U U U U UMobile, Ala. 106 71 23 9 1 2 2Montgomery, Ala. 42 19 17 5 1 - 7Nashville, Tenn. 140 100 26 10 2 2 12
W.S. CENTRAL 1,356 888 289 102 50 27 101Austin, Tex. 89 57 21 7 4 - 4Baton Rouge, La. 93 72 15 3 2 1 2Corpus Christi, Tex. 45 26 15 3 1 - 3Dallas, Tex. 194 115 51 16 10 2 16El Paso, Tex. 90 63 20 5 1 1 3Ft. Worth, Tex. 105 68 20 9 4 4 5Houston, Tex. 375 230 80 34 18 13 37Little Rock, Ark. U U U U U U UNew Orleans, La. U U U U U U USan Antonio, Tex. 197 142 37 11 5 2 13Shreveport, La. 59 41 9 6 3 - 6Tulsa, Okla. 109 74 21 8 2 4 12
MOUNTAIN 853 576 177 65 22 12 74Albuquerque, N.M. 135 87 34 11 2 - 18Boise, Idaho 29 24 2 2 1 - -Colo. Springs, Colo. 73 52 13 7 1 - 5Denver, Colo. 103 63 19 11 5 5 9Las Vegas, Nev. 200 130 44 19 5 2 21Ogden, Utah 32 25 7 - - - 1Phoenix, Ariz. U U U U U U UPueblo, Colo. 30 27 1 1 1 - -Salt Lake City, Utah 101 66 24 5 3 3 11Tucson, Ariz. 150 102 33 9 4 2 9
PACIFIC 1,300 942 225 83 25 25 116Berkeley, Calif. 19 11 6 2 - - 1Fresno, Calif. 86 56 18 10 1 1 5Glendale, Calif. U U U U U U UHonolulu, Hawaii 80 64 10 4 1 1 5Long Beach, Calif. 71 51 16 4 - - 5Los Angeles, Calif. U U U U U U UPasadena, Calif. 25 17 6 1 - 1 4Portland, Oreg. 126 95 18 6 3 4 8Sacramento, Calif. 227 157 50 12 5 3 24San Diego, Calif. 156 113 23 14 4 2 14San Francisco, Calif. U U U U U U USan Jose, Calif. 186 142 26 11 2 5 24Santa Cruz, Calif. 42 29 7 6 - - 5Seattle, Wash. 117 85 19 4 4 5 10Spokane, Wash. 63 48 11 1 1 2 7Tacoma, Wash. 102 74 15 8 4 1 4
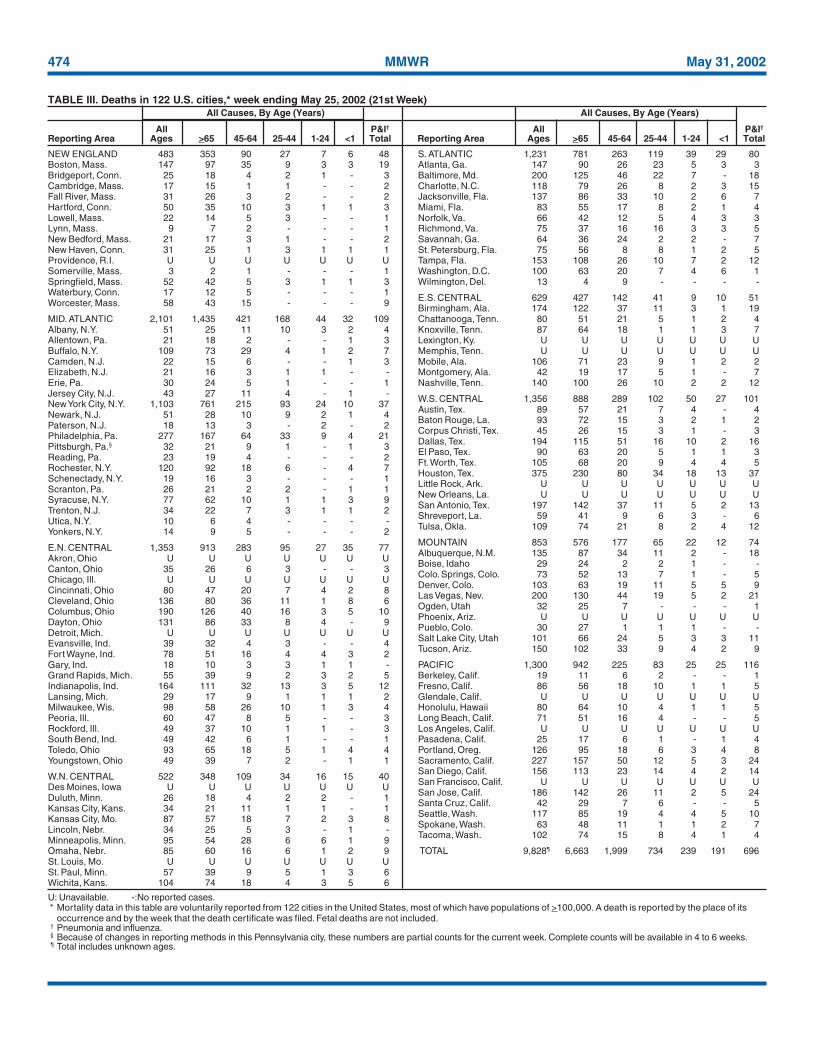
TOTAL 9,828¶ 6,663 1,999 734 239 191 696
U: Unavailable. -:No reported cases.* Mortality data in this table are voluntarily reported from 122 cities in the United States, most of which have populations of >100,000. A death is reported by the place of its
occurrence and by the week that the death certificate was filed. Fetal deaths are not included.† Pneumonia and influenza.§ Because of changes in reporting methods in this Pennsylvania city, these numbers are partial counts for the current week. Complete counts will be available in 4 to 6 weeks.¶ Total includes unknown ages.
TABLE III. Deaths in 122 U.S. cities,* week ending May 25, 2002 (21st Week)All Causes, By Age (Years) All Causes, By Age (Years)
All P&I† All P&I†
Reporting Area Ages >65 45-64 25-44 1-24 <1 Total Reporting Area Ages >65 45-64 25-44 1-24 <1 Total
Vol. 51 / No. 21 MMWR 475
All MMWR references are available on the Internet at http://www.cdc.gov/mmwr. Use the search function to find specific articles.——————
Use of trade names and commercial sources is for identification only and does not imply endorsement by the U.S. Department of Healthand Human Services.
——————References to non-CDC sites on the Internet are provided as a service to MMWR readers and do not constitute or imply endorsement ofthese organizations or their programs by CDC or the U.S. Department of Health and Human Services. CDC is not responsible for thecontent of these sites. URL addresses listed in MMWR were current as of the date of publication.
MMWR
The Morbidity and Mortality Weekly Report (MMWR) Series is prepared by the Centers for Disease Control and Prevention (CDC) andis available free of charge in electronic format and on a paid subscription basis for paper copy. To receive an electronic copy each week, sendan e-mail message to [email protected]. The body content should read SUBscribe mmwr-toc. Electronic copy also is available fromCDC’s World-Wide Web server at http://www.cdc.gov/mmwr or from CDC’s file transfer protocol server at ftp://ftp.cdc.gov/pub/publications/mmwr. To subscribe for paper copy, contact Superintendent of Documents, U.S. Government Printing Office, Washington, DC 20402;telephone 202-512-1800.
Data in the weekly MMWR are provisional, based on weekly reports to CDC by state health departments. The reporting week concludesat close of business on Friday; compiled data on a national basis are officially released to the public on the following Friday. Addressinquiries about the MMWR Series, including material to be considered for publication, to Editor, MMWR Series, Mailstop C-08, CDC,1600 Clifton Rd., N.E., Atlanta, GA 30333; telephone 888-232-3228.
All material in the MMWR Series is in the public domain and may be used and reprinted without permission; citation as to source,however, is appreciated.
✩U.S. Government Printing Office: 2002-733-100/69032 Region IV
476 May 31, 2002