morbidity and mortality weekly report epidemiologic
TRANSCRIPT

CENTERS FOR DISEASE CONTROL September 2,1988 / Vol. 37 / No. 34
517 HIV Seroprevalence in Migrant and Seasonal Farmworkers —North Carolina, 1987
519 Acute Rheumatic Fever among Army Trainees - Fort Leonard Wood, Missouri, 1987-1988
527 Measles - United States, 1987
MORBIDITY AND MORTALITY WEEKLY REPORT
Epidemiologic Notes and Reports
HIV Seroprevalence in Migrant and Seasonal Farmworkers - North Carolina, 1987
The prevalence of human immunodeficiency virus (HIV) was determined for patients attending a health clinic serving approximately 4500 migrant and seasonal farmworkers in North Carolina. From August 27 to October 27, 1987, all blood specimens routinely collected at the clinic for other purposes were tested for HIV antibody by enzyme immunoassay, with confirmation by Western blot; the specimens had no personal identifiers. They were also tested for syphilis antibody by rapid plasma reagin (RPR), with confirmation by the fluorescent treponemal antibody absorption (FTA-ABS) method.
Four hundred twenty-six blood samples were collected. Eleven (2.6%) of the 426 samples were HIV-antibody-positive (Table 1). All positive specimens were from persons 13-59 years of age. The highest age-specific prevalence (6.7%) was in the 30-39-year age group. The HIV-antibody prevalence was more than twice as high for males (3.5%) as for females (1.5%). The prevalence for black males was more than twice as high (eight [5.9%] of 135) as that for black females at the same clinic (three [2.3%] of 128). Persons positive by RPR and FTA-ABS had higher rates of HIV infection (5.6%) than did those whose syphilis serologies were negative (2.2%). Only those differences in prevalence of HIV by race were statistically significant.Reported by: AE Rodman, JE Misak, MD, CL Taylor, MD, Tri-County Community Health Center, Newton Grove; DH Jolly, MPH, JM Owen-O'Dowd, North Carolina AIDS Control Program; JC Catignani, DrPH, PJ Baker, SM Jones, North Carolina State Public Health Laboratory; RA Meriwether, MD, JN MacCormack, MD, State Epidemiologist, North Carolina Div of Health Svcs. Div of Field Svcs, Epidemiology Program Office; AIDS Program, Center for Infectious Diseases, CDC.Editorial Note: Estimates of the prevalence of HIV infection in migrant and seasonal farmworkers are limited. The transience of this population makes it difficult for health-care workers to assess the health status of these persons, who frequently may not have access to health care. This survey detected a relatively high prevalence of HIV infection among black migrant and seasonal farmworkers who were patients at one clinic in North Carolina. However, the observed rates may overestimate the prevalence of HIV in migrant and seasonal farmworkers because the 426 samples
U.S. DEPARTMENT OF HEALTH AND HUMAN SERVICES / PUBLIC HEALTH SERVICE

518 MMWR September 2, 1988
tested may not be representative of the migrant and seasonal farmworker population as a whole (i.e., some of the blood specimens may have been drawn because of HIV-related symptoms or to detect sexually transmitted diseases). The results are consistent with other published reports ( 1-4 ). Additional data are required from other migrant and seasonal farmworker populations to document the extent of HIV infection and adequately target HIV prevention programs.
Outpatient clinics provide the primary opportunity to estimate the HIV seropreva- lence in migrant and seasonal farmworkers seeking health care. CDC, in collaboration with the Migrant Health Program, Bureau of Health Care Delivery and Assistance, Health Resources and Services Administration, has initiated HIV seroprevalence surveys in eight clinics serving migrant and seasonal farmworkers around the country. Results obtained from these surveys will provide a basis for targeting appropriate HIV education, testing, and counseling services for this population. Migrant and seasonal farmworkers who are at increased risk and those with other sexually transmitted diseases (especially syphilis) should be encouraged to seek counseling and testing for HIV. Other innovative outreach programs will be particularly important for this difficult-to-reach population.References1. Ward JW, Kleinman SH, Douglas DK, Grindon AJ, Holmberg SD. Epidemiologic characteris
tics of blood donors with antibody to human immunodeficiency virus. Transfusion 1988;28:298-301.
HIV — Continued
TABLE 1. Number and percent of HIV-seropositive migrant workers, by patient characteristics — North Carolina, 1987
and seasonal farm-
Patientcharacteristic
No.screened
No. (%) positive
Age* (yrs) ^12 2 0
13-19 32 1 (3.1)20-29 97 1 (1.0)30-39 75 5 (6.7)40—49 83 3 (3.6)50-59 82 1 (1.2)oCDA\ 54 0
SexMale 227 8 (3.5)Female 199 3 (1.5)
Syphilis serologyRPR and FTA-ABS positive 54 3 (5.6)RPR or FTA-ABS negative 372 8 (2.2)
Race/ethnicityWhite 38 0Black 263 11 (4.1)Hispanic 125 0
Total 426 11 (2.6)*Age unknown for 1.
Vol. 37 / No. 34 MMWR 519
HIV — Continued
2. CDC. Trends in human immunodeficiency virus infection among civilian applicants for military service-United States, October 1985-December 1986. MMWR 1987;36:273-6.
3. Selik RM, Castro KG, Pappaioanou M. Racial/ethnic differences in the risk of AIDS in the United States. Am J Public Health 1988 (in press).
4. Castro KG, Lieb S, Jaffe HW, et al. Transmission of HIV in Belle Glade, Florida: lessons for other communities in the United States. Science 1988;239:193-7.
Acute Rheumatic Fever among Army Trainees —Fort Leonard Wood, Missouri, 1987-1988
In February 1988, the Office of the Army Surgeon General was notified of two cases of acute rheumatic fever (ARF) and four cases of suppurative axillary lymphadenitis associated with group A p-hemolytic streptococcus (GABHS) infections among soldiers who recently completed training at Fort Leonard Wood, Missouri. An investigation was conducted in March 1988 to determine the extent of ARF and GABHS among soldiers and their dependents at Fort Leonard Wood.
A retrospective records review revealed that from February 1987 through February 1988, 10 soldiers assigned to Fort Leonard Wood were hospitalized with ARF*; four additional patients developed signs and symptoms of ARF within 5 weeks of transfer to other army posts. Thirteen of the cases occurred from October 1987 through February 1988. Eight patients had carditis, 12 had polyarthritis, one had erythema marginatum, and one had subcutaneous nodules. Eleven had had a positive throat culture for GABHS, and 11 had an elevated antistreptolysin 0 titer. Neighboring hospitals and health departments reported no ARF cases among civilians during the same period.
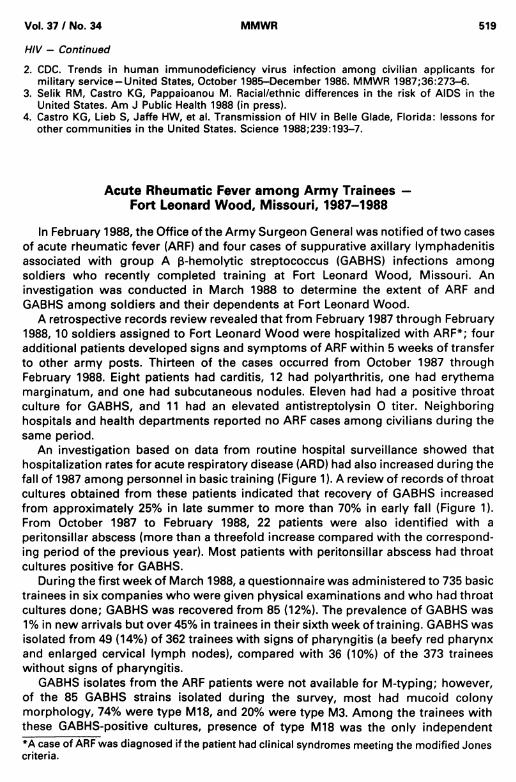
An investigation based on data from routine hospital surveillance showed that hospitalization rates for acute respiratory disease (ARD) had also increased during the fall of 1987 among personnel in basic training (Figure 1). A review of records of throat cultures obtained from these patients indicated that recovery of GABHS increased from approximately 25% in late summer to more than 70% in early fall (Figure 1). From October 1987 to February 1988, 22 patients were also identified with a peritonsillar abscess (more than a threefold increase compared with the corresponding period of the previous year). Most patients with peritonsillar abscess had throat cultures positive for GABHS.
During the first week of March 1988, a questionnaire was administered to 735 basic trainees in six companies who were given physical examinations and who had throat cultures done; GABHS was recovered from 85 (12%). The prevalence of GABHS was 1% in new arrivals but over 45% in trainees in their sixth week of training. GABHS was isolated from 49 (14%) of 362 trainees with signs of pharyngitis (a beefy red pharynx and enlarged cervical lymph nodes), compared with 36 (10%) of the 373 trainees without signs of pharyngitis.
GABHS isolates from the ARF patients were not available for M-typing; however, of the 85 GABHS strains isolated during the survey, most had mucoid colony morphology, 74% were type M18, and 20% were type M3. Among the trainees with these GABHS-positive cultures, presence of type M18 was the only independent*A case of ARF was diagnosed if the patient had clinical syndromes meeting the modified Jones criteria.

520 MMWR September 2, 1988
predictor of signs of pharyngitis. Convalescent serum samples were obtained from six of the patients with ARF; bactericidal antibodies to type M18 or type M3 strains were detected in only one.
In response to the outbreak, benzathine penicillin was given once during the second week of March to all nonallergic soldiers in training at Fort Leonard Wood, and all new trainees are now treated on arrival. No further cases of ARF have been reported. Admissions to the hospital for ARD and the percentage of throat cultures yielding GABHS have decreased after institution of the prophylactic regimen.Reported by: GL Sampson, COL, MC, USA, RG Williams, COL, MC, USA, MD House, NE Wetzel, MD, Fort Leonard Wood Army Community Hospital, Fort Leonard Wood, Missouri. JF Brundage, MAJ, MC, USA, JG McNeil, MAJ, MC, USA, CD Magruder, CART, MC, USA, GC Gray, LCDR, MC, USN, Div of Preventive Medicine, Walter Reed Army Institute of Research, Washington, DC. Respiratory Diseases Br, Div of Bacterial Diseases, Center for Infectious Diseases, CDC.Editorial Note: The number of ARF cases seen by physicians in several areas of the United States where ARF data have been examined has increased recently (1- 4 ). For example, in Utah, a high rate of the disease (11.8 cases/100,000 children 3-18 years old) was observed in 1985 (5). This rate was six times greater than annual rates for 1977 through 1981 in Memphis, Tennessee (6 ), and 19 times greater than those for 1971 through 1980 in suburban Los Angeles County (7). However, the Utah rate was similar to those reported in Baltimore from 1968 to 1970 (8 ) and in Olmstead County, Minnesota, from 1965 to 1978 (9 ). The report of an increase in cases of ARF at Fort Leonard Wood is similar to reports from civilian populations and a recent report from the Navy Training Center, San Diego, California ( 10). A marked increase in strepto-
FIGURE 1. Rates of hospitalization for acute respiratory disease (ARD) and percent of recovery of group A p-hemolytic streptococcus (GABHS) in Army trainees, by week - Fort Leonard Wood, Missouri, 1987 and 1988
Rheumatic Fever — Continued
Date

Vol. 37 / No. 34 MMWR 521
Rheumatic Fever — Continued
coccal pharyngitis and other suppurative streptococcal infections was observed in the military trainees coincident with each outbreak of ARF. Prophylactic use of penicillin in trainees to prevent ARF had been discontinued for several years at the Navy Training Center in San Diego before the outbreak there and at all U.S. Army facilities because of the absence of cases.
The predominance of type M18 among GABHS isolated at Fort Leonard Wood and the association of this M-type with clinical signs of pharyngitis suggest that type M18 may have caused the outbreak of ARF. Unfortunately, GABHS isolates were not available for typing from patients with ARF. The presence of mucoid strains and the association between mucoid colony morphology and type M18 GABHS have been described in Ohio, where an increase in ARF cases has also been observed ( 11). The lack of bactericidal antibody to type M18 or type M3 in all but one of the six patients with ARF is unexplained and suggests that either these M-types were not involved or that the bactericidal antibody response to these M-types cannot be used to determine their etiologic role.
Although the Army closely monitors respiratory infections among basic trainees, an ARF outbreak was difficult to detect because of 1) the variety of clinical syndromes, 2) the low clinical suspicion for diagnosing this disease, and 3) the latency from infection to the occurrence of ARF signs and symptoms, which caused at least four cases of ARF to appear at medical facilities removed from Fort Leonard Wood. Reduction of streptococcal pharyngitis and suppurative infections as well as ARF are the objectives of GABHS control programs for military trainees. Rapid detection of an increase in GABHS infections is required for control programs in the military not routinely using penicillin prophylaxis. Although mucoid colony morphology is an easily identifiable characteristic that has occurred coincident with reemergence of ARF in selected geographic areas, it is unknown whether this bacterial characteristic is important in the pathogenesis of ARF. Therefore, the presence of mucoid strains is not a valid criterion alone for reintroducing penicillin prophylaxis. The Army will continue to monitor cases of ARF and symptomatic trainees with GABHS-positive throat cultures to determine levels of activity. Surveillance data will also be used to determine a threshold level of GABHS disease for implementing prophylaxis. Rapid detection kits are useful for expediting identification of infected persons, but they should not be used as the only method to detect GABHS.
State health departments are requested to notify the Respiratory Diseases Branch (RDB), Division of Bacterial Diseases, Center for Infectious Diseases, CDC (404) 639-3021, of clusters of cases (two or more) of ARF. The Bacterial Reference Laboratory, RDB, serves as the national reference laboratory for serotyping streptococcal isolates from patients with known or suspected ARF.References
1. Veasy LG, Wiedmeier SE, Orsmond GS, et al. Resurgence of acute rheumatic fever in the intermountain area of the United States. N Engl J Med 1987;316:421-7.
2. Hosier DM, Craenen JM, Teske DW, Wheller JJ. Resurgence of acute rheumatic fever. Am J Dis Child 1987;141:730-3.
3. Congeni B, Rizzo C, Congeni J, Sreenivasan W . Outbreak of acute rheumatic fever in northeast Ohio. J Pediatr 1987;111:176-9.
4. Wald ER, Dashefsky B, Feidt C, Chiponis D, Byers C. Acute rheumatic fever in western Pennsylvania and the tristate area. Pediatrics 1987;80:371-4.
5. CDC. Acute rheumatic fever-Utah. MMWR 1987;36:108-10,115.6. Land MA, Bisno AL. Acute rheumatic fever: a vanishing disease in suburbia. JAMA
1983;249:895-8.

522 MMWR September 2, 1988
7. Odio A. The incidence of acute rheumatic fever in a suburban area of Los Angeles: a ten-year study. West J Med 1986;144:179-84.
8. Gordis L. Effectiveness of comprehensive-care programs in preventing rheumatic fever. N Engl J Med 1973;289:331-5.
9. Annegers JF, Pillman NL, Weidman WH, Kurland LT. Rheumatic fever in Rochester, Minnesota, 1935-1978. Mayo Clin Proc 1982;57:753-7.
10. CDC. Acute rheumatic fever at a Navy Training Center-San Diego, California. MMWR 1988;37:101-4.
11. Marcon MJ, Hribar MM, Hosier DM, et al. Occurrence of mucoid M-18 Streptococcus pyogenes in a central Ohio pediatric population. J Clin Microbiol 1988;26:1539-42.
Rheumatic Fever — Continued
TABLE I. Summary - cases of specified notifiable diseases, United States
Disease34th Week Ending Cumulative, 34th Week Ending
Aug. 27, 1988
Aug. 29, 1987
Median1983-1987
Aug. 27, 1988
Aug. 29, 1987
Median1983-1987
Acquired Immunodeficiency Syndrome (AIDS) 844 U * 136 20,661 12,702 4,944Aseptic meningitis 198 557 557 3,328 6,381 5,408Encephalitis: Primary (arthropod-borne
& unspec) 16 67 40 480 773 697Post-infectious 2 2 1 83 79 79
Gonorrhea: Civilian 12,156 15,789 18,862 440,295 510,758 568,921Military 216 452 433 7,981 11,092 13,794
Hepatitis: Type A 513 431 429 15,794 16,121 14,095Type B 442 519 527 14,496 16,879 16,484Non A, Non B 50 54 72 1,673 2,061 2,384Unspecified 41 80 106 1,386 2,065 3,181
Legionellosis 12 31 13 578 623 463Leprosy 6 6 6 114 129 163Malaria 25 45 21 538 582 595Measles: Total* 47 14 18 2,135 3,221 2,332
Indigenous 43 10 14 1,917 2,835 1,961Imported 4 4 4 218 386 258
Meningococcal infections 29 41 30 2,033 2,058 1,961Mumps 52 70 28 3,367 10,114 2,382Pertussis 84 110 101 1,535 1,477 1,477Rubella (German measles) 7 3 6 150 278 496Syphilis (Primary & Secondary): Civilian 789 831 562 24,860 22,862 18,088
Military 2 5 5 112 125 125Toxic Shock syndrome 6 19 6 212 223 258Tuberculosis 464 510 488 13,235 13,793 13,793Tularemia 3 8 8 127 136 136Typhoid Fever 8 18 6 216 209 215Typhus fever, tick-borne (RMSF) 25 23 25 437 448 508Rabies, animal 81 113 121 2,756 3,218 3,477
TABLE II. Notifiable diseases of low frequency, United States
Anthrax
Cum. 1988
Leptospirosis (Hawaii 1)
Cum. 1988
20Botulism: Foodborne 16 Plague (N. Mex. 1) 9
Infant 22 Poliomyelitis, ParalyticOther 3 Psittacosis (N.C. 1) 53
Brucellosis (Mo. 1; Up.N.Y. 1) 41 Rabies, humanCholera - Tetanus (Conn. 1; Up.N.Y. 1) 32Congenital rubella syndrome 3 Trichinosis 36Congenital syphilis, ages < 1 year Diphtheria
171
♦Because AIDS cases are not received weekly from all reporting areas, comparison of weekly figures may be misleading.Four of the 47 reported cases for this week were imported from a foreign country or can be directly traceable to a known
internationally imported case within two generations.

Vol. 37 / No. 34 MMWR 523
TABLE III. Cases of specified notifiable diseases, United States, weeks endingAugust 27, 1988 and August 29, 1987 (34th Week)
Reporting AreaAIDS
AsepticMenin
gitis
Encephalitis Gonorrhea(Civilian)
Hepatitis (Viral), by typeLeprosy
Primary Post-infectious A B NA,NB Unspeci
fiedlosis
Cum.1988
Cum.1988
Cum.1988
Cum.1988
Cum.1988
Cum.1987
Cum.1988
Cum.1988
Cum.1988
Cum.1988
Cum.1988
Cum.1988
UNITED STATES 20,661 3,328 480 83 440,295 510,758 15,794 14,496 1,673 1,386 578 114
NEW ENGLAND 863 187 18 4 13,715 15,509 587 809 95 69 26 14Maine 26 10 1 - 263 469 16 37 3 1 5 -
N.H. 19 20 1 3 173 267 37 53 7 4 3 -
Vt. 9 12 5 - 87 137 9 23 5 2 1 -
Mass. 463 79 8 1 4,713 5,698 280 503 64 49 14 13R.I. 56 42 - - 1,161 1,363 64 64 9 3 1Conn. 290 24 3 - 7,318 7,575 181 129 7 13 -
MID. ATLANTIC 6,974 299 38 4 65,429 82,688 987 1,892 104 155 141 8Upstate N.Y. 880 185 26 1 9,265 11,271 494 498 45 15 65 -N.Y. City 3,901 67 7 3 26,303 42,879 216 845 11 112 27 7N.J. 1,662 47 5 - 9,756 10,641 167 426 37 26 20 1Pa. 531 - 20,105 17,897 110 123 11 2 29 -
E.N. CENTRAL 1,488 475 119 12 71,611 75,794 1,037 1,554 147 78 116 4Ohio 322 164 32 3 16,317 17,251 232 372 25 12 49 -Ind. 80 49 15 - 5,613 5,826 100 220 13 21 8 -
III. 691 66 30 9 20,938 23,020 297 319 51 19 - 3Mich. 317 172 31 23,577 22,869 253 469 38 23 46 -Wis. 78 24 11 - 5,166 6,828 155 174 20 3 13 1
W.N. CENTRAL 494 149 31 7 18,527 20,588 896 690 78 24 58 1Minn. 102 25 6 3 2,508 3,228 71 90 15 3 2 -Iowa 28 19 8 1,350 1,978 35 66 13 1 14Mo. 256 59 1 10,598 10,841 522 405 33 12 13 -N. Dak. 4 . 4 97 195 4 6 2 4 1 -S. Dak. 5 13 1 1 348 378 7 3 2 - 14 -Nebr. 30 5 5 2 1,056 1,359 42 35 1 - 5 -Kans. 69 28 6 1 2,570 2,609 215 85 12 4 9 1
S. ATLANTIC 3,532 749 71 27 128,116 133,315 1,455 3,128 257 211 100 1Del. 44 17 3 - 1,910 2,173 24 86 6 2 8Md. 358 88 6 3 13,286 15,128 203 457 25 18 15 1D.C. 327 14 1 1 8,842 8,704 12 32 3 1 1Va. 225 81 23 3 8,929 9,730 270 210 54 133 6W. Va. 10 19 11 884 985 10 43 3 3 -N.C. 200 94 16 20,053 19,690 219 548 63 - 27 -
S.C. 116 12 - 1 9,660 10,944 31 343 8 5 15 -Ga. 474 85 1 24,250 23,510 313 442 10 5 13 -Fla. 1,778 339 10 19 40,302 42,451 373 967 85 44 15
E.S. CENTRAL 507 227 40 6 34,972 38,618 482 872 123 7 24 1Ky. 61 66 11 1 3,487 3,877 362 151 42 2 9 -Tenn. 235 21 11 11,726 13,436 73 453 31 - 7Ala. 127 115 18 2 10,894 12,524 31 216 42 5 5 1Miss. 84 25 - 3 8,865 8,781 16 52 8 - 3
W.S. CENTRAL 1,770 432 55 3 49,742 57,719 1,849 1,223 133 351 15 19Ark. 65 8 2 - 4,820 6,597 217 69 1 11 3 -
La. 207 66 17 1 9,867 10,272 94 238 17 11 5 1Okla. 99 41 4 4,591 6,410 352 124 32 22 7 -Tex. 1,399 317 32 2 30,464 34,440 1,186 792 83 307 18
MOUNTAIN 619 125 22 2 9,637 13,501 2,182 1,127 175 112 31 1Mont. 10 2 311 374 26 37 9 3 2 -Idaho 8 1 - 249 475 109 80 5 3 - -Wyo. 3 2 - - 135 291 5 11 3 - 2Colo. 230 47 3 - 2,181 2,946 150 142 48 55 8 1N. Mex. 30 8 2 - 923 1,442 396 161 13 1 1Ariz. 196 36 8 1 3,370 4,691 1,109 440 54 32 12 -Utah 47 18 4 1 376 422 228 91 29 14 3 -
Nev. 95 11 5 - 2,092 2,860 159 165 14 4 3 *PACIFIC 4,414 685 86 18 48,546 73,026 6,319 3,201 561 379 67 65Wash. 248 - 6 4 4,257 5,690 1,404 525 134 40 14 4Oreg. 135 - - 2,114 2,689 937 393 55 21 - 1Calif. 3,947 606 76 14 41,072 62,958 3,683 2,207 363 308 50 52Alaska 15 13 2 - 679 1,117 288 42 5 5 - 1Hawaii 69 66 2 - 424 572 7 34 4 5 3 7Guam 1 - - . 87 151 9 9 _ 2 1 4P.R. 768 35 2 1 900 1,392 31 170 29 31 - 3V.l. 32 - - 265 175 1 5 2 . .Amer. Samoa - - - 59 57 . 2 . 5 . 2C.N.M.I. * * * * 34 - 1 2 - 4 1
N: Not notifiable U: Unavailable C.N.M.I.: Commonwealth of the Northern Mariana Islands

524 MMWR September 2, 1988
TABLE III. (Cont'd.) Cases of specified notifiable diseases, United States, weeks endingAugust 27, 1988 and August 29,1987 (34th Week)
Reporting AreaMalaria
Measles (Rubeola) Menin-gococcalInfections
Mumps Pertussis RubellaIndigenous Imported* Total
Cum. Cum. Cum. Cum. Cum. 1000 Cum. Cum. Cum. Cum. Cum.1988 1988 1988 1987 1988 1900 1988 1988 1988 1987 1988 1988 1987
UNITED STATES 538 43 1,917 4 218 3,221 2,033 52 3,367 84 1,535 1,477 7 150 278NEW ENGLAND 44 . 80 50 253 179 1 105 6 119 89 5 1Maine 2 . 7 . 3 7 . . 11 17 1N.H. 1 - 66 44 152 20 . 95 . 33 17 3 .Vt. 3 . . . 26 13 1 3 . 3 4 .Mass, 23 - 1 2 49 82 . 7 1 47 36 1 .R.I. 6 - - - 2 21 . . 3 9 1 1 .Conn. 9 - 6 4 21 36 - - 2 16 14 -MID. ATLANTIC 74 25 791 1 43 564 191 6 280 16 100 153 12 11Upstate N.Y. 23 - 16 16 39 93 3 78 15 61 107 2 9N.Y. City 40 40 1t 3 452 52 2 94 2 7 1N.J. 5 25 217 11 35 45 31 . 4 9 1 1Pa. 6 - 518 13 38 1 1 77 1 33 37 2E.N. CENTRAL 32 - 132 46 300 281 5 684 4 157 198 1 24 35Ohio 7 - 2 22 5 97 97 . 25 51 1 1Ind. 2 - 57 - - 23 . 67 _ 60 13 .III. 1 55 15 129 63 5 258 1 24 14 19 25Mich. 19 - 18 5 29 61 . 174 3 28 41 4 9Wis. 3 - 4 137 37 88 20 79 1W.N. CENTRAL 14 - 11 1 230 78 1 118 5 90 89 1Minn. 5 - 10 1 39 16 . . 5 42 11Iowa 1 - - - - - 31 19 31 1Mo. 4 - 1 189 29 . 30 . 11 24N. Dak. - 1 . _ 7 7S. Dak. . . . 3 . 1 5 3Nebr. 1 - - . 10 . 11 _ 1Kans. 3 - - 1 20 1 45 - 6 12 -S. ATLANTIC 74 9 289 1 15 130 360 21 560 16 174 230 16 14Del. - - - - 32 2 - . . 5 5 2Md. 10 - 11 3 5 41 5 100 . 26 11 1 2D.C. 11 - - - 1 7 8 212 1 1Va. 10 - 141 2 1 40 6 148 3 30 44 11 1W. Va. - - 6 - - 6 . 9 1 7 33N.C. 11 1 1 1t 3 5 60 2 40 6 46 93 . 1S.C. 8 - - 2 33 - 4 . 1 _Ga. 4 - - 1 51 25 5 30 23 1 1Fla. 20 8 130 7 83 120 22 - 28 21 3 7E.S. CENTRAL 8 - 52 5 192 1 384 12 51 30 2 2 3Ky. - 35 . 39 174 . 6 1 2Tenn. - - 116 1 196 1 17 9 2 2 1Ala. 5 - 1 3 26 11 11 27 15Miss. 3 - 16 2 11 N N - 1 5 . .W.S. CENTRAL 53 - 11 3 409 134 7 652 3 93 149 7 11Ark. 2 - 1 - 17 3 85 2 11 10 3 2La. 9 - - - 38 4 252 1 16 30Okla. 8 - 8 - 3 14 173 . 39 109 1 5Tex. 34 * 3 2 406 65 - 142 - 27 - 3 4MOUNTAIN 26 - 117 21 491 58 2 152 13 443 129 6 24Mont. 4 - 5 - 19 128 2 . 2 . 1 6 8Idaho 1 1 - 7 1 3 1 261 42 1Wyo. - - - - 2 . . 2 . 1 5 1Colo. 9 - 112 1 9 14 - 28 . 14 43 2N. Mex. 1 - - - 317 10 N N •5 25 8Ariz. 6 - - - 31 15 1 103 7 • 120 23 4Utah 4 - - - 1 9 3 - 20 2 3 10Nev. 1 - - ' 3 1 - 11 - 1 - 1PACIFIC 213 9 434 2 39 839 560 8 432 9 308 410 4 78 178Wash. 14 - 2 - 41 48 - 40 7 71 63Oreg. 11 - 3 - 74 31 N N . 20 55 2Calif. 177 9 426 2t 31 720 460 6 359 2 166 150 54 112Alaska 2 - - 6 9 . 6 6 2Hawaii 9 - 3 8 4 15 2 13 - 45 136 4 24 61Guam . . . 1 2 . 2 . iP.R. 1 - 191 - 724 8 1 8 . 12 15 2
12V.l. - - - - - . 28 .
Amer. Samoa . . . . 2 . 3 .C.N.M.I. 1 - - - 1 - 2 - - - - - •
*For measles only, imported cases includes both out-of-state and international importations.N: Not notifiable U: Unavailable international sOut-of-state

Vol. 37 / No. 34 MMWR 525
TABLE III. (Cont'd.) Cases of specified notifiable diseases, United States, weeks endingAugust 27, 1988 and August 29, 1987 (34th Week)
Reporting Area
Syphilis (Civilian) (Primary & Secondary)
Toxic-shock
SyndromeTuberculosis Tula
remiaTyphoid
FeverTyphus Fever (Tick-home)
(RMSF)Rabies,Animal
Cum.1988
Cum.1987
Cum.1988
Cum.1988
Cum.1987
Cum.1988
Cum.1988
Cum.1988
Cum.1988
UNITED STATES 24,860 22,862 212 13,235 13,793 127 216 437 2,756
NEW ENGLAND 718 393 17 330 422 2 16 8 11Maine 11 1 4 18 18 - - - 1N.H. 6 3 3 7 12 - - - 3Vt. 3 2 2 2 9 - 1 -Maas. 278 188 8 184 238 1 10 4 -R.I. 22 8 . 31 35 - 2Conn. 398 191 - 88 110 1 5 2 7
MID. ATLANTIC 5,048 4,304 31 2,388 2,340 40 16 339Upstate N.Y. 335 149 16 343 338 5 8 17N.Y. City 3,234 3,119 5 1,187 1,109 24 6 -NJ. 591 453 3 428 445 11 - 10Pa. 888 583 7 430 448 2 312
E.N. CENTRAL 713 609 33 1,488 1,561 1 24 34 100Ohio 68 76 23 277 298 - 6 29 4Ind. 36 42 150 144 - 2 - 17III. 351 316 1 635 686 - 11 2 21Mich. 238 128 9 356 363 1 4 2 29Wis. 20 47 - 70 70 - 1 1 29
W.N. CENTRAL 149 113 26 351 414 62 4 66 337Minn. 16 13 5 58 85 3 2 2 106Iowa 16 19 5 35 29 - - - 13Mo. 88 62 7 179 228 36 2 40 16N. Dak. 1 2 5 6 1 - 68S. Dak. . 8 1 25 21 16 - 7 95Nebr. 22 7 2 9 16 2 - 1 10Kans. 6 4 4 40 29 4 * 16 29
S. ATLANTIC 9,175 7,785 16 2,934 2,956 4 24 142 900Del. 74 51 1 22 31 1 - 1 37Md. 489 392 3 287 260 1 20 219D.C. 445 233 . 131 99 - 1 - 5Va. 267 194 . 266 296 2 9 12 246W. Va. 34 6 - 52 75 - - 2 69N.C. 518 432 7 288 314 - 1 77 5S.C. 463 503 2 323 303 - 15 61Ga. 1,525 1,100 483 506 1 2 10 180Fla. 5,360 4,874 3 1,082 1,072 - 10 5 78
E.S. CENTRAL 1,303 1,260 17 1,110 1,177 8 3 52 194Ky. 43 13 7 254 275 4 1 15 76Tenn. 583 516 7 326 334 3 26 55Ala. 376 323 3 346 353 - 1 7 61Miss. 301 408 - 184 215 1 1 4 2
W.S. CENTRAL 2,786 2,796 19 1,671 1,619 35 7 104 372Ark. 160 176 1 184 192 21 18 60La. 537 493 190 188 - 3 1 7Okla. 104 99 6 161 158 12 - 75 25Tex. 1,985 2,028 12 1,136 1,081 2 4 10 280
MOUNTAIN 529 470 24 346 405 10 7 11 248Mont. 3 8 - 12 9 - 1 6 151Idaho 2 5 3 13 25 - - 1 8Wyo. 1 1 - 2 2 2 - 3 31Colo. 76 78 3 40 113 5 3 1 18N. Mex. 39 40 - 65 64 2 1 - 7Ariz. 108 227 9 158 156 - 2 - 29Utah 11 19 9 18 16 1 - 4Nev. 289 92 - 38 20 - - - ■PACIFIC 4,439 5,132 29 2,617 2,899 5 91 4 255Wash. 116 92 3 137 173 - 6 1Oreg. 191 193 1 99 76 - 6 1 -Calif. 4,099 4,835 25 2,251 2,490 3 76 2 247Alaska 9 3 28 32 2 - 8Hawaii 24 9 - 102 128 - 3Guam 3 2 . 14 25 . . . .
P.R. 413 621 - 149 195 - 4 47V.l. 1 4 . 4 2 - . .Amer. Samoa - . 3 7 . 1C.N.M.I. 1 17 - - - .
U: Unavailable

526 MMWR September 2, 1988
TABLE IV. Deaths in 121 U.S. cities,* week ending August 27, 1988 (34th Week)
All Causes, By Age (Years) P&l** All Causes, By Age (Years)All
Ages 3*65 45-64 25-44 1-24 <1 TotalReporting Area All
Ages 3*65 45-64 25-44 1-24 <1Reporting Area P « ”
Total
NEW ENGLAND Boston, Mass. Bridgeport, Conn. Cambridge, Mass. Fall River, Mass. Hartford, Conn. Lowell, Mass.Lynn, Mass.New Bedford, Mass. New Haven, Conn. Providence, R.l. Somerville, Mass. Springfield, Mass. Waterbury, Conn. Worcester, Mass.MID. ATLANTIC Albany, N.Y. Allentown, Pa. Buffalo, N.Y. Camden, N.J. Elizabeth, N.J.Erie, Pa.t Jersey City, N.J.N.Y. City, N.Y. Newark, N.J. Paterson, N.J. Philadelphia, Pa. Pittsburgh, Pa.t Reading, Pa. Rochester, N.Y. Schenectady, N.Y. Scranton, Pa.t Syracuse, N.Y. Trenton, N.J.Utica, N.Y.Yonkers, N.Y.E.N. CENTRAL Akron, Ohio Canton, Ohio Chicago, lll.§ Cincinnati, Ohio Cleveland, Ohio Columbus, Ohio Dayton, Ohio Detroit, Mich. Evansville, Ind.Fort Wayne, Ind. Gary, Ind.Grand Rapids, Mich. Indianapolis, Ind. Madison, Wis. Milwaukee, Wis. Peoria, III.Rockford, III.South Bend, Ind. Toledo, Ohio Youngstown, OhioW.N. CENTRAL Des Moines, Iowa Duluth, Minn. Kansas City, Kans. Kansas City, Mo. Lincoln, Nebr. Minneapolis, Minn. Omaha, Nebr.St. Louis, Mo.St. Paul, Minn. Wichita, Kans.§
65017545331994 39 15 23 42 44
4442350
2,9045012933820 3739
1,5915235
4836727
1113333 78 4431 30
2,3415532
564 148 167 121 106 25949552252
19034
138484495
12042
8349228 28
10820
17899
1506071
465 114119 313925 14 6032 11 2026 30
233 19 35
445
176 23 9
12
74
101,800 622
339
6322152717
962 346 23 1421 8
295 1154123 74 2824 52 30 20 21
163
1845
15 1257
1,518 489 36 1419 11
362 12596
1106372
15034431636
12826813134688627
28 38 40 18 50 1175
10 40
32386
17 23 12
571 16115
21237414
11566974154
63
225
3719328
14
341223
3066
7 6 2 1 3
199113
358 1
10143 2 2 2
1634 1
45878 8
282211
122
17 234 7 1
567
291
188 6 4 1
16 21 41 S. ATLANTIC 1,257 728 261 164 45 57 488 5 15 Atlanta, Ga. 185 94 44 36 7 4 2• 4 Baltimore, Md. 205 112 59 19 10 5 91 - 1 Charlotte, N.C. 74 52 10 5 3 4 2■ - 1 Jacksonville, Fla. 116 78 19 9 5 5 42 7 4 Miami, Fla. 140 71 34 28 5 2 11 2 Norfolk, Va. 71 37 9 9 5 11 41 - - Richmond, Va. 81 49 16 8 1 7 5• - 3 Savannah, Ga. 59 41 12 6 . 61 4 4 St. Petersburg, Fla. 81 68 7 5 . 1 3■ 2 • Tampa, Fla. 82 48 19 11 1 1 71 * • Washington, D.C. 129 56 25 23 8 17 2" 2 2 Wilmington, Del. 34 22 7 5 - 32 . 3 E.S. CENTRAL 748 475 161 57 33 22 38
Birmingham, Ala. 144 88 22 15 11 8 295 78 137 Chattanooga, Tenn. 91 67 17 5 1 1 72 2 2 Knoxville, Tenn. 50 32 11 5 2 31 - 1 Louisville, Ky. 49 35 11 2 1 11 ■ 13 Memphis, Tenn. 165 107 32 14 5 7 124 2 * Mobile, Ala. 55 31 13 5 4 2 4■ ■ • Montgomery, Ala. 44 23 17 2 1 1 215
22
2 Nashville, Tenn. 150 92 38 11 7 2 745 39 66 W.S. CENTRAL 1,834 1,095 421 184 65 69 58
3 1 Austin, Tex. 57 30 15 6 2 4 41 2 1 Baton Rouge, La. 53 37 13 1 . 2 1
24 13 24 Corpus Christi, Tex.§ 48 37 10 1 . 11 1 Dallas, Tex. 201 103 53 24 10 11 4
3 El Paso, Tex. 50 32 9 4 3 2 33 6 12 Fort Worth, Tex 92 60 14 8 3 7 4
1 Houston, Tex.S 831 487 193 104 28 19 22. . 2 Little Rock, Ark. 48 29 11 6 1 1 42 6 4 New Orleans, La. 129 72 34 11 5 7
3 San Antonio, Tex. 180 115 38 12 5 10 82 2 1 Shreveport, La. 44 24 9 3 7 1 2
2 Tulsa, Okla. 101 69 22 4 1 5 595 76 95 MOUNTAIN 660 434 126 43 32 25 29
1 4 Albuquerque, N. Mex.§ 82 53 15 8 4 2 21 . 2 Colo. Springs, Colo. 33 23 5 2 . 3 3
10 22 16 Denver, Colo. 100 66 15 6 5 8 410 6 9 Las Vegas, Nev. 92 68 14 4 5 1 77 5 8 Ogden, Utah 23 16 6 1 35 5 3 Phoenix, Ariz. 141 87 32 10 6 6 36 2 3 Pueblo, Colo. 24 19 3 1 1 5
21 10 2 Salt Lake City, Utah 53 27 8 6 9 32 3 Tucson, Ariz. 112 75 28 6 1 2 2
- 3 1 PACIFIC 1,775 1,166 331 163 59 49 106• • * Berkeley, Calif. 22 19 3 . . 21 4 3 Fresno, Calif. 54 39 6 4 1 4 77 3 6 Glendale, Calif. 14 9 2 22 1 4 Honolulu, Hawaii 87 64 12 4 6 1 1213 4 5 Long Beach, Calif. 97 67 14 9 2 4 113 4 5 Los Angeles Calif. 441 266 97 55 17 3 161 - 4 Oakland, Calif. 87 48 20 10 5 4 64 2 9 Pasadena, Calif. 36 26 5 4 13 1 8 Portland, Oreg. 108 73 20 7 3 5 4* 2 - Sacramento, Calif. 161 113 25 9 6 8 20
24 22 31 San Diego, Calif. 138 89 28 11 5 3 93 1 4 San Francisco, Calif. 160 91 38 25 2 4 5
1 3 San Jose, Calif. 156 112 25 10 3 6 9Seattle, Wash. 114 79 17 10 4 4
2 1 7 Spokane, Wash. 61 46 10 2 1 2 11 Tacoma, Wash. 39 25 9 3 1 1 4
55
31
83 TOTAL 13,003™ 8,252 :2,686 1,170 464 419 583
5 103 4 21 1 3
•Mortality data in this table are voluntarily reported from 121 cities in the United states, most of which have populations of 100,000 or more. A death is reported by the place of its occurrence and by the week that the death certificate was filed. Fetal deaths are not included.
••Pneumonia and influenza.tBecause of changes in reporting methods in these 3 Pennsylvania cities, these numbers are partial counts for the current week Complete counts w ill be available in 4 to 6 weeks.
ttTotal includes unknown ages.IData not available. Figures are estimates based on average of past available 4 weeks.

Vol. 37 / No. 34 MMWR 527
Current Trends
Measles — United States, 1987
In 1987, a provisional total of 3655 measles cases was reported to CDC, a 42% decrease from the 6282 cases reported in 1986 ( 1 ) (Figure 1). The 1987 incidence rate was 1.5 cases/100,000 population, compared with 2.7 cases/100,000 population in 1986.
Detailed information was provided to CDC's Division of Immunization, Center for Prevention Services, on 3652 cases. Of these, 3312 (90.7%) met the standard clinical case definition for measles,* and 1106 (30.3%) were serologically confirmed. The usual seasonal pattern was observed, with the peak number of cases occurring from February through May (weeks 4-24) (Figure 2).
Three fourths (2759) of the cases were reported from New York City (469 cases) and seven states: California (809), Texas (452), New Mexico (318), Illinois (213), Missouri (190), New Hampshire (162), and Wisconsin (146). Incidence rates were >3.0/100,000 population in New York City (6.5) and eight states: New Mexico (21.5), New Hampshire (15.8), Montana (15.5), Delaware (5.1), Oregon (4.9), Vermont (4.8), Missouri (3.8), and Wisconsin (3.1). Forty-one states and 265 (8.4%) of the nation's 3138 counties reported measles cases, compared with 46 states and 347 (11.1%) counties in 1986.
There were 76 outbreaks (i.e., five or more epidemiologically related cases), which accounted for 3165 (86.7%) cases. Seven outbreaks with more than 100 cases each accounted for 1877 (51.4%) cases. Eighty-three cases (2.3%) were known to be imported from other countries. Of these, 44 were in U.S. citizens. An additional 88 (2.4%) cases were epidemiologically linked to imported cases within two generations of onset in the index patient.*Fever >38.3 C (>101 F), if measured; generalized rash lasting >3 days; and at least one of the following: cough, coryza, or conjunctivitis.
FIGURE 1. Measles, by year - United States, 1950-1987
Year

528 MMWR September 2, 1988
Measles — ContinuedIn 1065 (29.2%) cases, the patients were <5 years of age (Table 1); 482 (13.2%)
were <15 months of age (297 children <12 months of age and 185 children 12-14 months of age). The 15-19-year age group accounted for 28.7% of all cases. The incidence rate of measles decreased from 1986 to 1987 in all age groups. The highest incidence rates occurred in 0-4-year-olds and 15-19-year-olds.
Complications were reported in 445 (12.2%) cases. Otitis media was reported in 209 (5.7%) cases; diarrhea, in 159 (4.4%); pneumonia, in 91 (2.5%); and encephalitis, in five (0.1%). Two hundred eighty-four (7.8%) of the reported patients were hospitalized. Four measles-attributable deaths were reported (death-to-case ratio of 1.1 deaths per 1000 cases) (2,3 ).
Of the 2451 (67.1%) patients for whom setting of transmission was reported, 1296 (52.9%) acquired measles in primary or secondary schools; 153 (6.2%), in medical settings; 141 (5.8%), in colleges or universities; 72 (2.9%), in child day care; 503 (2.0%), at home; and 286 (11.7%), in a variety of other settings.
A total of 1734 (47.5%) patients had been vaccinated on or after the first birthday, including 609 (16.7%) who were vaccinated at 12-14 months of age. One hundred sixty-nine (4.6%) had a history of vaccination before the first birthday, and 1749 (47.9%) were unvaccinated. Of the 2101 school-aged children 5-19 years of age, 1506 (71.7%) had been adequately vaccinated, including 579 (27.6%) who were vaccinated at 12-14 months of age. In contrast, of the 1065 preschool-aged children 0-4 years of age, 153 (14.4%) had been adequately vaccinated, including 20 (1.9%) vaccinated at 12-14 months of age (Table 2).
Measles cases are classified as preventable or nonpreventable. A case is defined as preventable if it occurs in a person for whom vaccine is indicated by current recommendations (4,5). Of the 3652 cases, 1010 (27.7%) were classified as preventable (4) (Table 2). From 1986 to 1987, the absolute number and proportion of cases that were preventable through vaccination decreased in all age groups except those ^25 years of age. The highest proportion of cases that were preventable through vaccination occurred in adults 25-29 years old and in children 16 months-4 years old.
Onset (week number)

Vol. 37 / No. 34 MMWR 529
Measles — ContinuedIn contrast, fewer than one fifth of cases in school-aged children 5-19 years of age were preventable through vaccination. However, 40.1% of all preventable cases occurred in this age group.
A total of 2642 cases were classified as nonpreventable. Of these, 1718 (65.0%) were in persons who had been vaccinated on or after the first birthday; 526 (19.9%) were in children too young for routine vaccination (<16 months of age); 216 (8.2%) were in persons with medical contraindications or exemptions under state law; 126 (4.8%) were in persons older than the recommended age for vaccination (born before 1957); 45 (1.7%) were international importations in non-U.S. citizens; and 11 (0.4%) were in persons with a prior physician diagnosis of measles (Table 3).Reported by: Div of Immunization, Center for Prevention Svcs, CDC.Editorial Note: The decrease in number of cases reported in 1987 reverses the trend of annual increases in measles incidence since the record-low year 1983, when 1497 cases were reported. The number of cases reported in 1987 represents a 99%
TABLE 1. Age distribution and estimated incidence rates* of measles - United States, 1986 and 1987
Age group (yrs)
1986 1987f% ChangeNo. (%> Rate No. <%) Rate
0-^ 2454 (39.2) 13.0 1065 (29.2) 5.9 -54.65-9 675 (10.8) 3.9 337 (9.2) 1.9 -51.3
10-14 1313 (21.0) 8.1 717 (19.6) 4.3 -46.915-19 1168 (18.7) 6.3 1047 (28.7) 5.6 -11.120-24 290 (4.6) 1.4 205 (5.6) 1.0 -28.6
s*25 336 (5.4) 0.3 281 (7.7) 0.2 -33 .3Unknown 19 (0.3) - - - -
Total 6255 (100.0) 2.7 3652 (100.0) 1.5 -44.4♦Cases per 100,000 population. Provisional data for 1987.
TABLE 2. Age distribution and preventability of measles cases - United States, 1986 and 1987
Age group
1986 1987*
TotalPreventable
No. (%) TotalPreventable
No. (%)^15 mos 1229 0 526 016 mos-4 yrs 1225 1019 (83.2) 539 345 (64.0)5-9 yrs 675 237 (35.1) 337 64 (19.0)10-14 yrs 1313 318 (24.2) 717 117 (16.3)15-19 yrs 1168 372 (31.8) 1047 224 (21.4)20-24 yrs 290 213 (73.4) 205 124 (60.5)25-29 yrs 170 119 (70.0) 146 127 (87.0)5=30 yrs 166 0 135 9 (6.7)Total 6236* 2278 (36.5) 3652 1010 (27.7)♦Provisional data for 1987.*ln 1986, preventability status is not known for 19 cases.

530 MMWR September 2,1988
Measles — Continued
reduction from the prevaccine era. Incidence rates in 1987 decreased from 1986 in all age groups; the largest decrease was in children <5 years of age. The overall decline observed in 1987 has continued into 1988; the provisional 1988 case count through week 27 is approximately 40% below the 1987 level. Reasons for the decline in measles cases may be multiple —secular trends, exhaustion of susceptibles in some areas from which large numbers of cases have previously been reported, or fewer importations in 1987.
As in previous years, almost one third of cases reported were classified as preventable, i.e., patients were eligible for vaccination but unvaccinated. Many of these cases occurred in preschool-aged children living in inner-city areas. Innovative strategies are needed to increase immunization levels in these populations.
Most cases reported in 1987, however, were classified as nonpreventable and occurred in school-aged children who had been vaccinated on or after the first birthday. Most of these cases probably result from primary vaccine failure, i.e., the failure to seroconvert following vaccination; there is little epidemiologic evidence to indicate that secondary vaccine failure or waning immunity is a major problem. The approximate primary measles vaccine failure rate of 5% (range 2%—10%) may provide enough susceptibles to sustain an outbreak among highly vaccinated populations (6 ) in some settings. Moreover, persons vaccinated at 12-14 months of age are at slightly higher risk for measles than are persons vaccinated at 2*15 months (7).
The four deaths reported in 1987 are the first measles-attributable deaths reported to the Division of Immunization since 1985. All deaths occurred in immunocompromised patients, including two children with AIDS. Since large measles outbreaks have occurred in areas with high prevalence of human immunodeficiency virus (HIV) infections and since HIV-infected persons appear to be at increased risk for serious complications (3 ), the Immunization Practices Advisory Committee (ACIP) recom-
TABLE 3. Classification of measles cases - United States, 1987*
Classification No. % of total % of nonpreventableNonpreventable
Persons <16 mos of age 526 14.4 19.9Persons born before 1957 126 3.5 4.8Adequately vaccinated* 1718 47.0 65.0Prior physician diagnosis 11 0.3 0.4Non-U.S. citizens 45 1.2 1.7Exemptions 216 5.9 8.2
Medical (22)Religious (59)Philosophic (108)Nonspecific (27)
Subtotal 2642 72.3 100.0Preventable 1010 27.7Total 3652 100.0*Provisional data.+Does not include four adequately vaccinated patients born before 1957 and 12 adequately vaccinated patients <16 months of age.

Vol. 37 / No. 34 MMWR 531
Measles — Continued
mends that asymptomatic HIV-infected children be vaccinated with measles, mumps, and rubella (MMR) vaccine and that consideration be given to vaccinating symptomatic HIV-infected children (5).
A group of expert consultants was recently convened by CDC to consider the problem of continuing measles transmission in the United States. The consultants felt that the goal of measles elimination should be pursued. They reviewed the two predominant patterns of measles: 1) measles in unvaccinated preschool-aged children—a failure to implement the current strategy, and 2) infections in adequately vaccinated school-aged children —a failure of the current strategy. These two patterns require different solutions. Increased efforts are needed to vaccinate preschool-aged children. Vaccination schedules may need to be modified in selected high-risk areas. Proposed changes include lowering the recommended age for routine vaccination and/or instituting a two-dose schedule. Aggressive revaccination strategies may also be necessary to control outbreaks among highly vaccinated school-aged populations. These recommendations are being evaluated by ACIP. In the meantime, efforts should continue to ensure that all susceptible persons are vaccinated and that appropriate surveillance and outbreak-control procedures are practiced.
1. CDC. Measles-United States, 1986. MMWR 1987;36:301-5.2. CDC. Measles-United States, first 26 weeks, 1987. MMWR 1988;37:53-7.3. CDC. Measles in HIV-infected children, United States. MMWR 1988;37:183-6.4. CDC. Classification of measles cases and categorization of measles elimination programs.
MMWR 1983;31:707-11.5. Immunization Practices Advisory Committee. Measles prevention. MMWR 1987;36:409-18,
423-5.6. Gustafson TL, Lievens AW, Brunell PA, Moellenberg RG, Buttery CMG, Sehulster LM. Measles
outbreak in a fully immunized secondary-school population. N Engl J Med 1987;316:771-4.7. Orenstein WA, Markowitz L, Preblud SR, Hinman AR, Tomasi A, Bart KJ. Appropriate age for
measles vaccination in the United States. Dev Biol Stand 1986;65:13-21.8. Immunization Practices Advisory Committee. Immunization of children infected with human
immunodeficiency virus—supplementary ACIP statement. MMWR 1988;37:181-3.

532 MMWR September 2, 1988
The Morbidity and Mortality Weekly Report is prepared by the Centers for Disease Control, Atlanta, Georgia, and available on a paid subscription basis from the Superintendent of Documents, U.S. Government Printing Office, Washington, D.C. 20402, (202) 783-3238.
The data in this report are provisional, based on weekly reports to CDC by state health departments. The reporting week concludes at close of business on Friday; compiled data on a national basis are officially released to the public on the succeeding Friday. The editor welcomes accounts of interesting cases, outbreaks, environmental hazards, or other public health problems of current interest to health officials. Such reports and any other matters pertaining to editorial or other textual considerations should be addressed to: Editor, Morbidity and Mortality Weekly Report, Centers for Disease Control, Atlanta, Georgia 30333.
Director, Centers for Disease Control James 0. Mason, M.D., Dr.P.H.
Acting Director, Epidemiology Program Office Michael B. Gregg, M.D.
Editor Pro TernRichard A. Goodman, M.D. M.P.H.
Managing EditorKaren L. Foster, M.A.
☆ U.S. Government Printing Office: 1988-530-111/81523 Region IV
DEPARTMENT OF HEALTH 8i HUMAN SERVICESPublic Health Service Centers for Disease Control Atlanta, GA 30333
FIRST-CLASS MAIL POSTAGE & FEES PAID
PHS/CDC Permit No. G-284
Official BusinessPenalty for Private Use $300
7 4 *HCRU9FISD22 8721
! « « « f i s h b7— 613
X
HHS Publication No. (CDC) 88-8017 Redistribution using a First Class permit imprint is illegal.