morbidity and mortality weekly report · morbidity and mortality weekly report ... notifiable...
TRANSCRIPT

Morbidity and Mortality Weekly Report
Weekly February 14, 2003 / Vol. 52 / No. 6
depardepardepardepardepartment of health and human sertment of health and human sertment of health and human sertment of health and human sertment of health and human servicesvicesvicesvicesvicesCenters for Disease Control and PreventionCenters for Disease Control and PreventionCenters for Disease Control and PreventionCenters for Disease Control and PreventionCenters for Disease Control and Prevention
Public Health and Aging
Trends in Aging — United Statesand Worldwide
The median age of the world’s population is increasingbecause of a decline in fertility and a 20-year increase in theaverage life span during the second half of the 20th century(1). These factors, combined with elevated fertility in manycountries during the 2 decades after World War II (i.e., the“Baby Boom”), will result in increased numbers of personsaged >65 years during 2010–2030 (2). Worldwide, the aver-age life span is expected to extend another 10 years by 2050(1). The growing number of older adults increases demandson the public health system and on medical and social ser-vices. Chronic diseases, which affect older adults dispropor-tionately, contribute to disability, diminish quality of life, andincreased health- and long-term–care costs. Increased lifeexpectancy reflects, in part, the success of public health inter-ventions (2), but public health programs must now respondto the challenges created by this achievement, including the
growing burden of chronic illnesses, injuries, and disabilitiesand increasing concerns about future caregiving and health-care costs. This report presents data from the U.S. Bureau ofthe Census, the World Health Organization, and the UnitedNations on U.S. and global trends in aging, including demo-graphic and epidemiologic transitions, increasing medical andsocial costs related to aging, and the implications for publichealth.
U.S. TrendsIn the United States, the proportion of the population aged
>65 years is projected to increase from 12.4% in 2000 to19.6% in 2030 (3). The number of persons aged >65 years is
MMWR Series on Public Health and Aging
The demographic shift toward an aging populationposes major challenges for public health programs and prac-tice in the 21st century. This issue of MMWR begins aspecial series on Public Health and Aging that will high-light important health topics associated with older popu-lations and the implications for public health. Reports willexamine data about older adult health; discuss the influ-ence of aging on current public health program priorities,program delivery, relevance, and reach; and explore poten-tial strategies for future directions in public health as thepopulation ages.
Reports in MMWR (Weekly) will present science-basedinformation on key public health and aging topics. Anaccompanying MMWR Recommendations and Reportsseries will discuss public health policy implications of theaging population.
A compilation of these reports will be available athttp://www.cdc.gov/mmwr. Additional information isavailable at http://www.cdc.gov/aging/index.htm.
INSIDE
106 Outbreak of Group A Streptococcal Pneumonia AmongMarine Corps Recruits — California, November 1–December 20, 2002
109 Increase in Coccidioidomycosis — Arizona, 1998–2001112 Notice to Readers

102 MMWR February 14, 2003
SUGGESTED CITATIONCenters for Disease Control and Prevention. [ArticleTitle]. MMWR 2003;52:[inclusive page numbers].
Centers for Disease Control and Prevention
Julie L. Gerberding, M.D., M.P.H.Director
David W. Fleming, M.D.Deputy Director for Public Health Science
Dixie E. Snider, Jr., M.D., M.P.H.Associate Director for Science
Epidemiology Program Office
Stephen B. Thacker, M.D., M.Sc.Director
Office of Scientific and Health Communications
John W. Ward, M.D.Director
Editor, MMWR Series
Suzanne M. Hewitt, M.P.A.Managing Editor, MMWR Series
David C. Johnson(Acting) Lead Technical Writer/Editor
Jude C. RutledgeTeresa F. Rutledge
Jeffrey D. Sokolow, M.A.Writers/Editors
Lynda G. CupellMalbea A. Heilman
Visual Information Specialists
Quang M. DoanErica R. Shaver
Information Technology Specialists
Division of Public Health Surveillanceand Informatics
Notifiable Disease Morbidity and 122 Cities Mortality DataRobert F. Fagan
Deborah A. AdamsFelicia J. ConnorLateka Dammond
Patsy A. HallPearl C. Sharp
The MMWR series of publications is published by theEpidemiology Program Office, Centers for Disease Controland Prevention (CDC), U.S. Department of Health andHuman Services, Atlanta, GA 30333.
expected to increase from approximately 35 million in 2000to an estimated 71 million in 2030 (3), and the number ofpersons aged >80 years is expected to increase from 9.3 mil-lion in 2000 to 19.5 million in 2030 (3). In 1995, the mostpopulous states had the largest number of older persons; ninestates (California, Florida, Illinois, Michigan, New Jersey, NewYork, Ohio, Pennsylvania, and Texas) each had more thanone million persons aged >65 years (4). In 1995, four stateshad >15% of their population aged >65 years; Florida hadthe largest proportion (19%) (5). By 2025, the proportion ofFlorida’s population aged >65 years is projected to be 26%(5) and >15% in 48 states (all but Alaska and California) (5).
The sex distribution of older U.S. residents is expected tochange only moderately. Women represented 59% of personsaged >65 years in 2000 compared with an estimated 56% in2030 (3). However, larger changes in the racial/ethnic com-position of persons aged >65 years are expected. From 2000to 2030, the proportion of persons aged >65 years who aremembers of racial minority groups (i.e., black, AmericanIndian/Alaska Native, Asian/Pacific Islander) is expected toincrease from 11.3% to 16.5% (4); the proportion ofHispanics is expected to increase from 5.6% to 10.9% (4).
Global TrendsIn 2000, the worldwide population of persons aged >65
years was an estimated 420 million, a 9.5 million increasefrom 1999 (2). During 2000–2030, the worldwide popula-tion aged >65 years is projected to increase by approximately550 million to 973 million (3), increasing from 6.9% to 12.0%worldwide, from 15.5% to 24.3% in Europe, from 12.6% to20.3% in North America, from 6.0% to 12.0% in Asia, andfrom 5.5% to 11.6% in Latin America and the Caribbean(2). In Sub-Saharan Africa, an area where both fertility andmortality rates are high, the proportion of persons aged >65years is expected to remain small, increasing from an esti-mated 2.9% in 2000 to 3.7% in 2030 (2). The largestincreases in absolute numbers of older persons will occur indeveloping countries*. During 2000–2030, the number ofpersons in developing countries aged >65 years is projectedto almost triple, from approximately 249 million in 2000 toan estimated 690 million in 2030 (3), and the developingcountries’ share of the world’s population aged >65 years is
* The “developing” and “developed” country categories used in this reportcorrespond directly to the “less developed” and “more developed” classificationemployed by the United Nations. Developed countries comprise all nations inEurope and North America, and Japan, Australia, and New Zealand. Theremaining nations are classified as developing countries. Although thesecategories are used commonly for comparative purposes, they no longeraccurately reflect developmental differences among countries (2).

Vol. 52 / No. 6 MMWR 103
projected to increase from 59% to 71% (2). However,migration patterns could influence these projections.
The aging of the world’s population is the result of twofactors: declines in fertility and increases in life expectancy(2). Fertility rates declined in developing countries duringthe preceding 30 years and in developed countries through-out the 20th century (2). In addition, in developed countries,the largest gain ever in life expectancy at birth occurred dur-ing the 20th century, averaging 71% for females and 66% formales (2). Life expectancy at birth in developed countries nowranges from 76 to 80 years (2). Life expectancy also hasincreased in developing countries since 1950, although theamount of increase varied. A higher life expectancy at birthfor females compared with males is almost universal. Theaverage sex differential in 2000 was approximately 7 years inEurope and North America but less in developing countries(2).
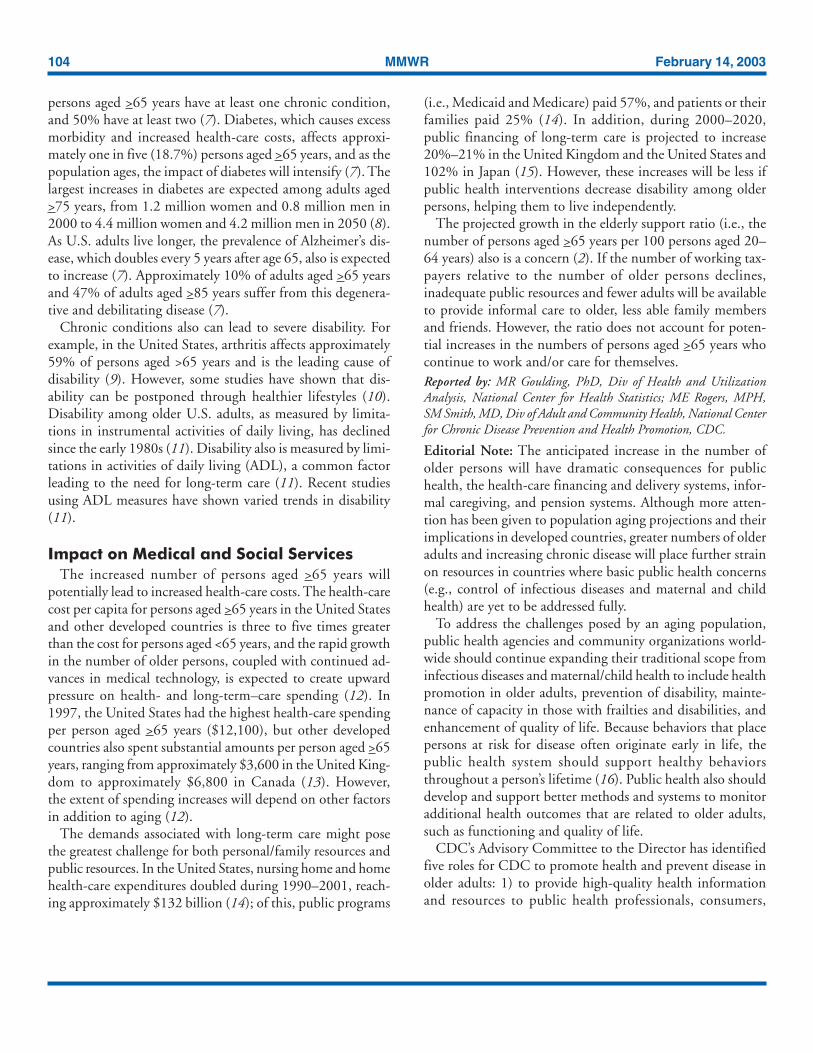
Demographic TransitionThe world has experienced a gradual demographic transi-
tion from patterns of high fertility and high mortality rates tolow fertility and delayed mortality (2). The transitionbegins with declining infant and childhood mortality, in partbecause of effective public health measures (2). Lower child-hood mortality contributes initially to a longer life expect-ancy and a younger population. Declines in fertility ratesgenerally follow, and improvements in adult health lead to anolder population. As a result of demographic transitions, theshape of the global age distribution is changing. By 1990, theage distribution in developed countries represented similarproportions of younger and older persons (Figure) (2). Fordeveloping countries, age distribution is projected to havesimilar proportions by 2030 (2).
Epidemiologic TransitionThe world also has experienced an epidemiologic transi-
tion in the leading causes of death, from infectious diseaseand acute illness to chronic disease and degenerative illness.Developed countries in North America, Europe, and theWestern Pacific already have undergone this epidemiologictransition, and other countries are at different stages of pro-gression. In 2001, the leading causes of death in developedcountries, which had low child and delayed adult mortality,were primarily cardiovascular diseases and cancer, followedby respiratory diseases and injuries (6). The leading causes ofdeath in African countries, which had high child and adultmortality, were infectious and parasitic diseases (e.g., humanimmunodeficiency virus/acquired immunodeficiency
syndrome, malaria, childhood diseases, and diarrheal disease),respiratory infections, perinatal conditions, cardiovasculardiseases, cancer, and injuries (6).
The epidemiologic transition, combined with the increas-ing number of older persons, represents a challenge forpublic health. In the United States, approximately 80% of all
FIGURE. Population age distribution for developing anddeveloped countries, by age group and sex — worldwide, 1950,1990, and 2030
Source: United Nations, 1999, and U.S. Bureau of the Census, 2000.
400 300 200 100 0 100 200 300 400
Male Female
Population (millions)
Age
gro
up
0 – 4
5 – 9
10–14
15–19
20–24
25–29
30–34
35–39
40–44
45–49
50–54
55–59
60–64
65–69
70–74
75–79
>80
1950Developing countries
Developed countries
400 300 200 100 0 100 200 300 400
Male Female
Population (millions)
Age
gro
up
1990
0 – 4
5 – 9
10–14
15–19
20–24
25–29
30–34
35–39
40–44
45–49
50–54
55–59
60–64
65–69
70–74
75–79
>80
400 300 200 100 0 100 200 300 400
Male Female
Population (millions)
Age
gro
up
Projections for2030
0 – 4
5 – 9
10–14
15–19
20–24
25–29
30–34
35–39
40–44
45–49
50–54
55–59
60–64
65–69
70–74
75–79
>80
104 MMWR February 14, 2003
persons aged >65 years have at least one chronic condition,and 50% have at least two (7). Diabetes, which causes excessmorbidity and increased health-care costs, affects approxi-mately one in five (18.7%) persons aged >65 years, and as thepopulation ages, the impact of diabetes will intensify (7). Thelargest increases in diabetes are expected among adults aged>75 years, from 1.2 million women and 0.8 million men in2000 to 4.4 million women and 4.2 million men in 2050 (8).As U.S. adults live longer, the prevalence of Alzheimer’s dis-ease, which doubles every 5 years after age 65, also is expectedto increase (7). Approximately 10% of adults aged >65 yearsand 47% of adults aged >85 years suffer from this degenera-tive and debilitating disease (7).
Chronic conditions also can lead to severe disability. Forexample, in the United States, arthritis affects approximately59% of persons aged >65 years and is the leading cause ofdisability (9). However, some studies have shown that dis-ability can be postponed through healthier lifestyles (10).Disability among older U.S. adults, as measured by limita-tions in instrumental activities of daily living, has declinedsince the early 1980s (11). Disability also is measured by limi-tations in activities of daily living (ADL), a common factorleading to the need for long-term care (11). Recent studiesusing ADL measures have shown varied trends in disability(11).
Impact on Medical and Social ServicesThe increased number of persons aged >65 years will
potentially lead to increased health-care costs. The health-carecost per capita for persons aged >65 years in the United Statesand other developed countries is three to five times greaterthan the cost for persons aged <65 years, and the rapid growthin the number of older persons, coupled with continued ad-vances in medical technology, is expected to create upwardpressure on health- and long-term–care spending (12). In1997, the United States had the highest health-care spendingper person aged >65 years ($12,100), but other developedcountries also spent substantial amounts per person aged >65years, ranging from approximately $3,600 in the United King-dom to approximately $6,800 in Canada (13). However,the extent of spending increases will depend on other factorsin addition to aging (12).
The demands associated with long-term care might posethe greatest challenge for both personal/family resources andpublic resources. In the United States, nursing home and homehealth-care expenditures doubled during 1990–2001, reach-ing approximately $132 billion (14); of this, public programs
(i.e., Medicaid and Medicare) paid 57%, and patients or theirfamilies paid 25% (14). In addition, during 2000–2020,public financing of long-term care is projected to increase20%–21% in the United Kingdom and the United States and102% in Japan (15). However, these increases will be less ifpublic health interventions decrease disability among olderpersons, helping them to live independently.
The projected growth in the elderly support ratio (i.e., thenumber of persons aged >65 years per 100 persons aged 20–64 years) also is a concern (2). If the number of working tax-payers relative to the number of older persons declines,inadequate public resources and fewer adults will be availableto provide informal care to older, less able family membersand friends. However, the ratio does not account for poten-tial increases in the numbers of persons aged >65 years whocontinue to work and/or care for themselves.Reported by: MR Goulding, PhD, Div of Health and UtilizationAnalysis, National Center for Health Statistics; ME Rogers, MPH,SM Smith, MD, Div of Adult and Community Health, National Centerfor Chronic Disease Prevention and Health Promotion, CDC.
Editorial Note: The anticipated increase in the number ofolder persons will have dramatic consequences for publichealth, the health-care financing and delivery systems, infor-mal caregiving, and pension systems. Although more atten-tion has been given to population aging projections and theirimplications in developed countries, greater numbers of olderadults and increasing chronic disease will place further strainon resources in countries where basic public health concerns(e.g., control of infectious diseases and maternal and childhealth) are yet to be addressed fully.
To address the challenges posed by an aging population,public health agencies and community organizations world-wide should continue expanding their traditional scope frominfectious diseases and maternal/child health to include healthpromotion in older adults, prevention of disability, mainte-nance of capacity in those with frailties and disabilities, andenhancement of quality of life. Because behaviors that placepersons at risk for disease often originate early in life, thepublic health system should support healthy behaviorsthroughout a person’s lifetime (16). Public health also shoulddevelop and support better methods and systems to monitoradditional health outcomes that are related to older adults,such as functioning and quality of life.
CDC’s Advisory Committee to the Director has identifiedfive roles for CDC to promote health and prevent disease inolder adults: 1) to provide high-quality health informationand resources to public health professionals, consumers,

rec • om • men • da • tion: n 1 : something, such
as a course of action, that is recommended;
see also MMWR.
ReportsRecommendations
and
know what matters.

106 MMWR February 14, 2003
health-care providers, and aging experts; 2) to support health-care providers and health-care organizations in preventionefforts; 3) to integrate public health prevention expertise withthe aging services network; 4) to identify and implementeffective prevention efforts; and 5) to monitor changes in thehealth of older adults. These roles will require new efforts toaddress the special needs of older adults and todeliver programs in communities in which older adults work,reside, and congregate. Existing public health programs willbe required to examine whether they meet the needs of anaging population.References1. United Nations. Report of the Second World Assembly on Aging.
Madrid, Spain: United Nations, April 8–12, 2002.2. Kinsella K, Velkoff V. U.S. Census Bureau. An Aging World: 2001.
Washington, DC: U.S. Government Printing Office, 2001; series P95/01-1.
3. U.S. Census Bureau. International database. Table 094. Midyear popu-lation, by age and sex. Available at http://www.census.gov/population/www/projections/natdet-D1A.html.
4. U.S. Census Bureau. State and national population projections. Avail-able at http://www.census.gov/population/www/projections/popproj.html.
5. Campbell PR. Population projections for states by age, sex, race, andHispanic origin: 1995 to 2025. U.S. Bureau of the Census, Popula-tion Division, PPL-47, 1996. Available at http://www.census.gov/population/www/projections/stproj.html.
6. World Health Organization. World Health Report 2002, Annex Table2 (deaths by cause, sex and mortality stratum in WHO Regions, esti-mates for 2001). Geneva, Switzerland: World Health Organization,2002:186–91.
7. National Center for Chronic Disease Prevention and Health Promo-tion, CDC. Chronic disease notes and reports: special focus. HealthyAging 1999;12:3.
8. Boyle JP, Honeycutt AA, Narayan KMV, et al. Projection of diabetesburden through 2050: impact of changing demography and diseaseprevalence in the US. Diabetes Care 2001;24:1936–40.
9. CDC. Prevalence of self-reported arthritis or chronic joint symptomsamong adults—United States, 2001. MMWR 2002;51:948–50.
10. Hubert H, Bloch D, Oehlert J, Fries J. Lifestyle habits and compres-sion of morbidity. Journal of Gerontology: Medical Sciences2002;57A:347–51.
11. Freedman VA, Martin LG, Schoeni RF. Recent trends in disability andfunctioning among older adults in the United States: a systematic re-view. JAMA 2002;288:3137–46.
12. Jacobzone S, Oxley H. Ageing and Health Care Costs. InternationalePolitik und Gesellschaft Online (International Politics and Society) 1/2002. Available at http://fesportal.fes.de/pls/portal30/docs/folder/ipg/ipg1_2002/artjacobzone.htm.
13. Anderson GF, Hussey PS. Population aging: a comparison among in-dustrialized countries. Health Affairs 2000;19:191–203.
14. Levit K, Smith C, Cowan C, Lazenby H, Sensenig A, Catlin A. Trendsin U.S. health care spending, 2001. Health Affairs 2003;22:154–64.
15. Jacobzone S. Coping with aging: international challenges. HealthAffairs 2000;19:213–25.
16. Koplan JP, Fleming DW. Current and future public health challenges.JAMA 2000;284:1696–8.
Outbreak of Group A StreptococcalPneumonia Among Marine Corps
Recruits — California,November 1–December 20, 2002
During November 1–December 20, 2002, a total of 163Marine Corps personnel from the Marine Corps RecruitDepot (MCRD) in San Diego, California, including 160 newrecruits, were admitted to the Naval Medical Center SanDiego (NMCSD) for possible pneumonia. For 128 (79%)patients, pneumonia was confirmed by chest radiograph; ofthese 128 cases, 31 (24%) were definitely or probably causedby group A streptococci (GAS). This is the first outbreak ofserious GAS-associated illness at a San Diego military train-ing facility since the 1987 outbreak of rheumatic fever (1)and the largest outbreak of GAS pneumonia in the UnitedStates since 1968 (2). This report summarizes the results ofthe investigation of this outbreak, which indicate that GASinfection can occur among military recruit populationsdespite routine chemoprophylaxis administered to incomingrecruits. Instituting routine surveillance for noninvasive GASdisease in military training facilities might prevent futureinvasive GAS outbreaks.
All patients with radiographically confirmed pneumoniawere tested by sputum, blood, and throat cultures; Mycoplasmapneumoniae IgM (ETI-MP enzyme-linked immunosorbentassay [ELISA], Diasorin, Inc.) and IgG (ELISA, Wampole);Chlamydia pneumoniae IgM and IgG (microimmuno-fluorescence, Focus Technologies); rhinoprobe direct fluores-cent antibody for respiratory syncytial virus, adenovirus,influenzae, and parainfluenzae; urine Legionella antigen test;urine Streptococcus pneumoniae antigen test; and an antistrep-tolysin O (ASO) titer. Available GAS isolates underwent emm-typing through sequencing of the 5’ emm variable region andantimicrobial susceptibility testing by broth microdilution andE-test.
All case definitions required radiographic confirmation ofpneumonia in a marine recruit hospitalized with acute respi-ratory illness (ARI) during the outbreak period. A confirmedcase of GAS pneumonia required a blood or pleural fluid cul-ture that was positive for GAS. A probable case of GAS pneu-monia required a positive throat or sputum culture for GASor an ASO titer of >250 Todd units in the absence of anotheridentified etiologic agent. A confirmed case of M. pneumoniaepneumonia required IgG seroconversion, and a probable caserequired a positive IgM. A confirmed case of C. pneumoniaerequired a fourfold rise in IgG or an IgM titer of >16, and apossible case required an IgG titer of >512.

Vol. 52 / No. 6 MMWR 107
A total of 128 male recruits aged 18–33 years (median: 20years) had radiographically confirmed pneumonia; 110 (86%)were white non-Hispanics, 14 (11%) were white Hispanics,and four (3%) were members of other racial/ethnic groups.All recruits were previously healthy and were seronegative forhuman immunodeficiency virus. Of the 128 recruits withconfirmed pneumonia, 66 (52%) had multilobar involvement,and 29 (23%) had a pleural effusion, including five (4%)with an empyema. GAS was identified in 31 (24%) pneumo-nia episodes (six confirmed and 25 probable GAS cases),resulting in a GAS pneumonia attack rate of 0.7% among theapproximately 4,500 recruits present at the training facilityduring November 1–December 20. An etiologic agent couldbe established for 47 (48%) of 97 remaining pneumonia epi-sodes and for 78 (61%) of the pneumonia episodes overall(Table). Multiple etiologies were identified for several pneu-monia cases; one patient had confirmed GAS and confirmedC. pneumoniae infections, and three patients had confirmedGAS and possible C. pneumoniae. Sputum or throat cultureswere positive for GAS or the patient had an ASO of >250Todd units in two (29%) of the seven confirmed and five(28%) of the 18 possible C. pneumoniae cases, one (33%) ofthe three confirmed and nine (56%) of the 16 probableM. pneumoniae cases, and one (20%) of the five adenoviruscases.
Symptoms reported by the 31 recruits with GAS pneumo-nia included cough (29 [94%]), fever (20 [65%]), sore throat(19 [61%]), pleuritic chest pain (15 [48%]), dyspnea (14[45%]), chills (nine [29%]), and exanthem (two [7%]). Themean ASO titer for GAS pneumonia cases was 997 Todd units(range: <25–>4,800) compared with 249 for non-GAS cases(p = 0.03). Those with GAS were more likely to have anempyema (16% versus 0%; p = 0.005) and had a longer meanhospital stay (5.4 versus 2.4 days; p = 0.03) than those withnon-GAS pneumonia. Two patients with GAS had strepto-coccal toxic shock syndrome (TSS) and required intensive
care management. All recruits with pneumonia were treatedsuccessfully with ceftriaxone and either levofloxacin orazithromycin; clindamycin also was administered to those withTSS. One marine recruit died of purpura fulminans causedby Neisseria meningitidis serogroup C during the outbreakperiod. All GAS isolates were identified as emm type 3. Inaddition, all GAS isolates were susceptible to all 15 antibiot-ics tested, including penicillin, erythromycin, andazithromycin.
Before the outbreak, recruits had received intramuscularbenzathine penicillin on the day of arrival at MCRD and 28days later (or oral erythromycin twice daily) as prophylaxisagainst streptococcal disease. Of the 31 recruits with GASpneumonia, 27 (87%) were hospitalized with suspected pneu-monia >21 days after the last dose of penicillin was adminis-tered. The epidemic was halted by re-administration ofantibiotic prophylaxis to all 4,500 recruits at the facility onDecember 15 by using benzathine penicillin 1.2 million unitsintramuscularly; azithromycin 1 g was administered orally forthose recruits who reported a penicillin allergy (Figure). Medi-cal personnel from NMCSD, MCRD, and the Naval HealthResearch Center were involved in halting the outbreak.Reported by: NF Crum, MD, BR Hale, MD, DA Bradshaw, MD,JD Malone, MD, HM Chun, MD, WM Gill, MD, D Norton, MD,CT Lewis, MD, AA Truett, MD, C Beadle, MD, JL Town, MSN,MR Wallace, MD, Naval Medical Center; DJ Morris, MD,EK Yasumoto, MD, Marine Corps Recruit Depot; KL Russell, MD,Naval Health Research Center, San Diego, California. E Kaplan, MD,Univ of Minnesota Medical School, Minneapolis. C Van Beneden, MD,Div of Bacterial and Mycotic Diseases, National Center for InfectiousDiseases; R Gorwitz, MD, EIS Officer, CDC.
Editorial Note: Outbreaks of ARI, including pneumonia,among military trainees are well documented (3,4). Factorsthat might contribute to increased ARI susceptibility in thispopulation include the rapid gathering of persons from acrossthe country into crowded living and working quarters, which
TABLE. Number* and percentage of episodes of radiographically confirmed pneumonia among Marine Corps recruits, by etiology —San Diego, California, November 1–December 20, 2002
Confirmed cases Probable or possible cases† Total§
Pathogen No. (%) No. (%) No. (%)
Group A streptococcus (GAS) 6 (4.7) 25 (19.5) 31 (24.2)Mycoplasma pneumoniae 3 (2.3) 16 (12.5) 19 (14.8)Chlamydia pneumoniae 7 (5.5) 18 (14.1) 25 (19.5)Adenovirus 5 (3.9) 0 — 5 (3.9)Streptococcus pneumoniae 2 (1.6) 0 — 2 (1.6)Unknown etiology 50 (39.1)
Total with a defined etiology 22 (17.2) 56 (43.8) 78 (60.9)
* n = 128.†The alternate case definition was “possible” for C. pneumoniae only. For M. pneumoniae and GAS, the alternate case definition was “probable.”
§Categories are not mutually exclusive; one patient had confirmed GAS and confirmed C. pneumoniae infection, and three patients had confirmed GASand possible C. pneumoniae infection.

108 MMWR February 14, 2003
exposes nonimmune persons to several pathogens, and thephysical and psychological stressors of training. Disease pre-vention efforts include immunoprophylaxis (e.g., pneumo-coccal, meningococcal, and influenza vaccinations) andchemoprophylaxis (e.g., penicillin prophylaxis for streptococ-cal infections) administered to incoming recruits (3) andongoing surveillance for ARI (4).
A leading cause of bacterial ARI among military recruits isS. pyogenes or GAS, which manifests as outbreaks of GASpharyngitis, acute rheumatic fever, and pneumonia (3). Thisoutbreak involved the circulation of a single GAS serotypeand probably evolved from the introduction of this strain intoa population of recruits lacking type-specific immunity. Strep-tococcal emm type 3 (corresponding to M type 3) is one ofthe most common serotypes associated with invasive GAS dis-ease in the United States (5,6) and has been associated fre-quently, along with M types 1, 5, and 18, with outbreaksamong U.S. military recruits (3). Population-based surveil-lance for all invasive GAS infections in nine disparate loca-tions in the United States indicated that pneumonia accountedfor 11%–14% of reported cases and was the third most com-mon syndrome after invasive cutaneous or soft tissue infec-tions and bacteremia without a known source (5,6). Amongthe civilian population, outbreaks of GAS pneumonia are rare.
A higher baseline rate of invasive andnoninvasive GAS disease and a potential todelay seeking medical treatment for minor ill-ness (including pharyngitis) among militaryrecruit populations might account for thisdifference.
Several pathogens were identified as thepotential source of pneumonia among the 78(61%) pneumonia episodes for which a caus-ative agent could be identified, and severalpneumonia patients had dual diagnoses.Whether this represents a true concurrentincrease in multiple respiratory pathogens or isan artifact of the diagnostic testing methodsused is uncertain.
The findings in this report are subject to atleast three limitations. First, a definitive diag-nosis of GAS pneumonia is difficult. Bloodcultures frequently are negative in GAS pneu-monia (2); therefore, a confirmed diagnosismight not be possible unless pleural fluid isobtained. Second, because positive throat orsputum cultures can represent simple GASpharyngitis or asymptomatic carriage of theorganism, the specificity of these cultures for
diagnosis of GAS pneumonia is low. Rising ASO titers mightdistinguish between GAS carriage and infection but are notspecific for invasive GAS disease (7). Finally, diagnosingM. pneumoniae and C. pneumoniae infections by serology alonecan be problematic, especially in the context of known GASinfections. Several serologic assays for M. pneumoniae are avail-able commercially but vary in sensitivity and specificity (8).Although the microimmunofluorescence assay is consideredthe method of choice for serologic diagnosis of C. pneumoniaeinfection, interpretation of the results can be subjective. Falsepositives can occur for M. pneumoniae and possiblyfor C. pneumoniae serologic assays in the presence of anonspecific antibody response to GAS infection.
Primary and secondary penicillin chemoprophylaxis forGAS infections is effective in military recruit populations andhas been used intermittently since 1951 (3,4). Primary (i.e.,tandem) prophylaxis is administered to all recruits shortly aftertheir arrival at a training facility to prevent the introductionof GAS into this population, and secondary (i.e., mass) pro-phylaxis is provided concurrently to all recruits in a givenfacility to interrupt established disease transmission. Oralerythromycin or azithromycin prophylaxis is used to preventinfection among recruits who are allergic to penicillin. Thereason that primary prophylaxis failed in this circumstance is
GASpneumonia
Pneumonia confirmedby chest radiograph
Hospitalized for suspectedpneumonia
8 9 10 11 12 13 14 15 16 17 18 19 20
0
5
10
15
20
25
30
35
40
45
50
Num
ber
Date
Antibiotic prophylaxis administered
FIGURE. Number of persons with Group A streptococcus (GAS) pneumonia*,with pneumonia confirmed by chest radiograph†, and with suspectedpneumonia§, by date of hospitalization — San Diego, California, December8–20, 2002¶
* n = 24.†
n = 110.§
n = 143.¶
During November 1–December 7, 2002, an additional 20 Marine Corps recruits werehospitalized for suspected pneumonia. For 18 patients, pneumonia was confirmed by chestradiograph; seven cases were caused by GAS.

Vol. 52 / No. 6 MMWR 109
unclear. Possible explanations include failure to achieveadequate serum levels of penicillin (9), waning protection asserum levels declined before the second scheduled dose ofpenicillin was administered on training day 28, and lack ofcompliance with oral erythromycin among penicillin-allergicrecruits. Eradicating GAS carriage is difficult even withappropriate doses of penicillin and in the absence ofpenicillin resistance (10).
Early diagnosis and management of GAS infections mightprevent the development of suppurative complications. Rou-tine surveillance for noninvasive GAS disease was initiatedrecently at MCRD to identify breakthrough GAS infectionsand prevent outbreaks of GAS disease. Institution of routinesurveillance for noninvasive GAS disease also might be usefulfor other military training facilities.
AcknowledgmentsThis report is based on assistance provided by W MacAllister,
J Christensen, Naval Medical Center San Diego, California, and byR Besser, MD, R Facklam, PhD, B Fields, PhD, D Talkington,PhD, WL Thacker, MS, and ML Tondella, PhD, Div of Bacterialand Mycotic Diseases, National Center for Infectious Diseases,CDC.
References1. Wallace MR, Garst PD, Papadimos TJ, Oldfield EC III. The return of
acute rheumatic fever in young adults. JAMA 1989;262:2557–61.2. Basiliere JL, Bistrong HW, Spence WF. Streptococcal pneumonia:
recent outbreaks in military recruit populations. Am J Med1968;44:580–9.
3. Brundage JF, Gunzenhauser JD, Longfield JN, et al. Epidemiologyand control of acute respiratory diseases with emphasis on group Abeta-hemolytic streptococcus A: a decade of U.S. Army experience.Pediatrics 1996;97:964–70.
4. Gray GC, Callahan JD, Hawksworth AW, et al. Respiratory diseasesamong U.S. military personnel: countering emerging threats. EmergInfect Dis 1999;5:379–87.
5. O’Brien KL, Beall B, Barrett NL, et al. Epidemiology of invasive groupA Streptococcus disease in the United States, 1995–1999. Clin InfectDis 2002;35:268–76.
6. CDC. Active Bacterial Core Surveillance Reports, Emerging Infec-tions Program Network, group A streptococcus. Available at http://www.cdc.gov/ncidod/dbmd/abcs/survreports.htm.
7. Shet A, Kaplan EL. Clinical use and interpretation of group A strepto-coccal antibody tests: a practical approach for the pediatrician orprimary care physician. Pediatr Infect Dis J 2002;21:420–30.
8. Thacker WL, Talkington DF. Analysis of complement fixation andcommercial enzyme immunoassays for detection of antibodies toMycoplasma pneumoniae in human serum. Clin Diagn Lab Immunol2000;7:778–80.
9. Bass JW, Longfield J, Jones R, et al. Serum levels of penicillin in basictrainees in the U.S. Army who received intramuscular penicillin Gbenzathine. Clin Infect Dis 1996;22:727–8.
10. Kaplan EL, Johnson BA. Unexplained reduced microbiologicalefficacy of intramuscular benzathine penicillin G and of oral penicil-lin V in eradication of group A streptococci from children with acutepharyngitis. Pediatrics 2001;108:1180–6.
Increase in Coccidioidomycosis —Arizona, 1998–2001
Coccidioidomycosis is a systemic infection caused by inha-lation of airborne spores from Coccidioides immitis, a fungusfound in soil in the southwestern United States and in partsof Mexico and Central and South America (1). Infectionoccurs usually following activities or natural events that dis-rupt the soil, resulting in aerosolization of the fungalarthrospores (2). Clinical manifestations occur in 40% ofinfected persons and range from an influenza-like illness (ILI)to severe pneumonia and, rarely, extrapulmonary disseminateddisease (3). Persons at higher risk for disseminated diseaseinclude blacks, Filipinos, pregnant women in their third tri-mester, and immunocompromised persons (4). During 2001,the Arizona Department of Health Services (ADHS) reporteda coccidioidomycosis incidence of 43 cases per 100,000 popu-lation, representing an increase of 186% since 1995 (3). Tocharacterize this increase, CDC analyzed data from theNational Electronic Telecommunications System for Surveil-lance (NETSS) and the Arizona Hospital Discharge Data-base (AHDD), and environmental and climatic data, andconducted a cohort study of a random sample of patientswith coccidioidomycosis. This report summarizes the find-ings of this investigation, which indicate that the recentArizona coccidioidomycosis epidemic is attributed to seasonalpeaks in incidence that probably are related to climate. Health-care providers in Arizona should be aware that peak periodsof coccidioidomycosis incidence occur during the winter andshould consider testing patients with ILI.
Surveillance and HospitalizationsCoccidioidomycosis became a nationally reportable disease
at the southwest regional level through NETSS in 1995, atwhich time a case definition was adopted that required labo-ratory confirmation*. During 1997, laboratory reporting ofcoccidioidomycosis became mandatory in Arizona, after whicha marked increase was noted in the number of reported cases.However, incidence continued to increase in subsequent years.NETSS data for 1998–2001 were analyzed to calculate inci-dence by using U.S. Census 2000 data for denominators.
* The laboratory criteria for diagnosis are cultural, histopathologic, or molecularevidence of the presence of Coccidioides spp; a positive serologic test forcoccidioidal antibodies in serum or cerebrospinal fluid by 1) detection ofcoccidioidal IgM by immunodiffusion, enzyme immunoassay (EIA) latexagglutination, or tube precipitin or 2) detection of rising titer of coccidioidalIgM by immunodiffusion, EIA, or complement fixation; or a coccidioidal skintest conversion from negative to positive after the onset of clinical signs andsymptoms.

110 MMWR February 14, 2003
During 2001, a total of 2,203 cases were reported to ADHS(rate: 43 cases per 100,000 population), compared with 1,551cases in 1998 (rate: 33). Persons aged >65 years had the high-est incidence (79 during 2001), although incidence in all agegroups increased. The youngest age groups experienced thelargest increase in incidence during the surveillance period:during 2001, incidence of coccidioidomycosis among patientsaged <20 years increased 121%, from approximately five in1998 to 11 in 2001. Analysis by season demonstrated peakperiods of disease incidence during the winter months(November–February) (Figure 1). The baseline rate betweenpeak periods was stable, indicating that the seasonal periodswere responsible for the overall annual increase in reportedcases.
AHDD was reviewed to identify patients with a primary orsecondary discharge diagnosis of coccidioidomycosis(International Classification of Diseases, Ninth Revision codes114.0–114.3 and 114.5–114.9). Hospitalizations caused bycoccidioidomycosis increased substantially during the studyperiod. During 2001, a total of 598 persons were dischargedwith a primary or secondary diagnosis of coccidioidomycosis,compared with 69 persons during 1998; 154 (26%) of the598 hospitalized patients had disseminated coccidioidomy-cosis. Persons aged >65 years comprised 34% of all hospital-ized patients during the study period and had the highest rateof hospitalization (29 per 100,000 population during 2001).
Cohort StudyTo explain peak periods and to further characterize the epi-
demic, CDC conducted a cohort study of patients fromNETSS who had coccidioidomycosis to evaluate host factors,exposures, and outcomes. Patients reported with
coccidioidomycosis were divided into four groups based oninclusion in peak or nonpeak periods and year of disease. Of208 randomly selected persons contacted by telephone, 196(94%) completed a questionnaire (range per group: 43–56persons). No statistically significant differences were foundbetween groups related to host risk factors or exposures thatcould explain the large peak seasons.
Geographic Information SystemsGeographic Information Systems (GIS) software was used
to identify areas of high incidence in Maricopa County, themost populous county in Arizona. Locations of patients iden-tified in NETSS and AHDD were plotted by postal code byusing Arc View v3.2, and incidence was calculated by usingU.S. Census 2000 data. The highest incidence of coccidio-idomycosis for both NETSS cases and hospitalizationsoccurred in areas surrounding metropolitan Phoenix (Figure 2).These areas have experienced substantial construction activ-ity according to building permit data provided by theMaricopa County Association of Governments. Seasonal varia-tions in construction activity approximated by buildingpermits were not significantly associated with cases (Table).
50
100
150
200
250
300
350
400
Month and year
Winter seasons
CasesPredicted cases
0
Num
ber
Feb Jun Oct Feb Jun Oct Jun Oct Feb JunFeb Oct
1998 1999 2000 2001
FIGURE 1. Number of predicted coccidioidomycosis casescompared with actual cases, by month and year — Arizona,1998–2001
FIGURE 2. Coccidioidomycosis case rate* — Maricopa County,Arizona, 1998–2001
* Per 100,000 population. Population and cases calculated by using postalcode tabulation areas for U.S. Census 2000.
†Population estimates in these areas not reliable for analysis.
0–7.0–
21.7–43.4–94.2–
7.0 21.7 43.4 94.2159.6
Rates not calculated †
Arizona

Vol. 52 / No. 6 MMWR 111
TABLE. Association* between coccidioidomycosis incidence andselected environmental and climatic variables — Maricopa County,Arizona, 1998–2001Variable RR† (95% CI§) p value
Building permits 1.0 (1.0 –1.0) 0.4315Palmer Z Index¶ 0.921 (0.874–0.970) 0.0018PDSI** 0.939 (0.897–0.983) 0.00702 mos mean wind 0.965 (0.858–1.086) 0.5541Wind velocity 0.835 (0.728–0.957) 0.0094Temperature average over 3 mos 1.012 (1.003–1.020) 0.0087Dust (PM10)†† 1.015 (1.007–1.024) 0.0002Rain 0.797 (0.681–0.933) 0.0048Rain 3 mos before 0.926 (0.796–1.076) 0.3146Rain 5 mos before 0.968 (0.836–1.121) 0.6672Proportion 2 mos rain to 7 mos rain§§ 0.554 (0.331–0.930) 0.0253Cumulative rain, 2 mos 0.844 (0.760–0.937) 0.0015Cumulative rain, 7 mos 0.860 (0.814–0.908) <0.0001
* Determined by Poisson regression analysis.†
Relative risk.§
Confidence interval.¶
Short-term drought index.** Palmer Drought Severity Index, a measure for long-term drought severity.††
Concentration in the air of suspended particulate matter <10 microns.§§
Cumulative rainfall during the preceding 2 months in proportion to cumulativerainfall during the preceding 7 months.
Environment and ClimateArizona has been experiencing dry weather conditions
recently. Environmental and climatic data were analyzed inrelation to incidence of disease, and Poisson regression wasperformed to construct a model that might predict seasonalpeaks. Many climatic variables were significantly associatedwith increased incidence of disease, including drought indi-ces (Palmer Z Index and Palmer Drought Severity Index),wind velocity, mean temperature, dust (measured by concen-tration of suspended particulate matter <10 microns), andrain (Table).
Poisson regression analysis indicated a high correlation(R-squared = 0.75) between incidence of disease and1) cumulative rain during the preceding 7 months, 2) theaverage temperature during the preceding 3 months, 3) dustduring the preceding month, and 4) the amount of rain dur-ing the preceding 2 months in proportion to the preceding 7months. The projected cases based on the model were com-pared with the actual cases in Maricopa County (Figure 1).The model accurately mirrored peak seasonal periods during1998–1999, in particular the large peak beginning inNovember 2001. In addition, the model accurately describedthe absence of a seasonal peak during winter 2000–01.Reported by: K Komatsu, V Vaz, C McRill, T Colman, Arizona Deptof Health Svcs; A Comrie, Univ of Arizona Dept of Geography, Tucson.K Sigel, T Clark, M Phelan, R Hajjeh, Div of Bacterial and MycoticDiseases, National Center for Infectious Diseases; B Park, MD, EISOfficer, CDC.
Editorial Note: Coccidioidomycosis is the fourth mostcommon infectious disease reported to ADHS; onlygonorrhea, chlamydia, and chronic hepatitis C are morefrequent (ADHS, unpublished data, 2002). The find-ings in this report indicate that the incidence of coc-cidioidomycosis in Arizona has increased substantiallysince 1998, affecting all age groups. In addition, hospi-talizations for coccidioidomycosis have increased, indi-cating an increase in the numbers of persons with severedisease.
Although seasonality of coccidioidomycosis in Arizonahas been suggested previously, this study is the first toconfirm the pattern (5,6). In addition, this study docu-ments peak incidence periods during November–February; improved timeliness and completeness ofreporting because of mandatory laboratory reportingsince 1997 might have helped reveal the seasonal pat-tern. Seasonal fluctuations could not be explained bydifferences in the prevalence of the various host risk fac-tors or exposures but were significantly associated with
climatic and environmental factors. A climate model incor-porating some of these factors recreated the seasonal outbreaksin Maricopa county and predicted that large outbreak sea-sons might occur during winter seasons following prolongeddrought periods, especially in conjunction with hot and dustyconditions. These conditions, which might facilitate aero-solization of arthrospores, have been described in studies ofcoccidioidomycosis epidemics in California (7). Dry and dustyconditions continue in Arizona, suggesting that another largepeak season might occur this winter. Preliminary data for 2002indicate that the number of total cases already exceeds 3,000,considerably surpassing 2001 levels (ADHS, unpublished data,2002).
Although coccidioidomycosis is not readily preventable, abetter understanding of its epidemiology can assist in devel-oping more effective prevention and education strategies andhelp with earlier diagnosis and appropriate medical manage-ment. Health-care providers should consider testing for coc-cidioidomycosis in any patient who has moved or traveledrecently to Arizona and who has ILI, especially during thewinter months. Dust reduction measures, such as paving roadsor wetting soil at construction sites, are currently in place andmight be useful in preventing further cases. Persons at risk forsevere disease should avoid activities that might increase theirexposure to dust. These persons might benefit from develop-ment of a vaccine that confers long-term immunity (6).

112 MMWR February 14, 2003
References1. Galgiani JN. Coccidioidomycosis: a regional disease of national impor-
tance: rethinking approaches for control. Ann Intern Med1999;130:293–300.
2. Schneider E, Hajjeh RA, Spiegel RA, et al. A coccidioidomycosis out-break following the Northridge, California, earthquake. JAMA1997;277:904–8.
3. Ampel NM, Mosley DG, England B, Vertz PD, Komatsu K, HajjehRA. Coccidioidomycosis in Arizona: increase in incidence from 1990to 1995. Clin Infect Dis 1998;27:1528–30.
4. Rosenstein NE, Emery KW, Werner SB, et al. Risk factors for severepulmonary and disseminated coccidioidomycosis: Kern County,California, 1995–1996. Clin Infect Dis 2001;32:708–15.
5. Kerrick SS, Lundergan LL, Galgiani JN. Coccidioidomycosis at auniversity health service. American Review of Respiratory Disease1985;131:100–2.
6. Kirkland TN, Fierer J. Coccidioidomycosis: a reemerging infectiousdisease. Emerg Infect Dis 1996;2:192–9.
7. Koenig G, White TJ, Taylor JW, Fisher MC. Pathogenic clones versusenvironmentally driven population increase: analysis of an epidemic ofthe human fungal pathogen Coccidioides immitis. Mol Biol Evol2000;17:1164–74.
Notice to Readers
Knight Journalism FellowshipsOffered at CDC
The CDC Foundation is accepting applications for theKnight Journalism Fellowships. The Knight Fellowships atCDC provides journalists a closer look at the practice of pub-lic health and combines a general curriculum with special-ized content that reflects the individual interests of each fellow.Examples of activities include the following:
Disease investigation: Each fellow accompanies an EpidemicIntelligence Service (EIS) Officer on an investigation of anoutbreak of disease and serves as a team member in designingquestionnaires, conducting surveys, analyzing data, anddetermining causes of outbreaks.
Scientific research: Knight fellows are matched with scien-tists conducting research on specific diseases or threats topublic health. Fellows can participate in one or more stagesof research projects. Fellows also might contribute to the writ-ing or editing of an article for MMWR or other scientificjournals.
e xperience.For over 50 years, MMWR has been the key provider of up-to-date
public health reports and news. All of our publications–the
Weekly, Recommendations and Reports, and Surveillance
Summaries –are available online, free of charge.
Visit cdc.gov/mmwr and experience timely public health infor-
mation from a trusted source.
know what matters.
Online

Vol. 52 / No. 6 MMWR 113
FIGURE 5. Reports of Guillain-Barré syndrome after influenzavaccination, by influenza seasons — United States, 1991–2001
* Net doses distributed equals total doses distributed during the period,less returned doses.
0
20
40
60
80
100
120
91–92 92–93 93–94 94–95 95–96 96–97 97–98- 98–99 99–00 00–01
Influenza seasons
0
10
20
30
40
50
60
70
80
ReportsDoses
Num
ber
of r
epor
ts
Net doses distr ibuted* (m
illions)
FIGURE 7. Reports of febrile seizure and other convulsivedisorders after DTaP,* DTP,† or DTPH§ vaccination — UnitedStates, 1991–2001
* Diphtheria and tetanus toxoids and acellular pertussis vaccine adsorbed.†Diphtheria and tetanus toxoids and pertussis vaccine adsorbed.
§Diphtheria and tetanus toxoids and pertussis vaccine adsorbed andHaemophilus b conjugate vaccine (diphtheria CRM197 protein conjugate).
0
100
200
300
400
500
600
1991 1992 1993 1994 1995 1996 1997 1998 1999 2000 2001
Date of vaccination (yr)
Num
ber
of r
epor
ts
DTaP
DTP
DTPH
Field practice: Activities include working in the field withpublic health officials, examining how priorities are set in apublic health agency, and contributing to a health area ofinterest to fellows. Local experience will help fellows gain abetter understanding of the partnership among state, local,and federal agencies and community-based organizations.
Interaction with colleagues: Time will be allowed forfellows to interact with each other and to share ideas andexperiences. Fellows also will attend a series of colloquiafeaturing nationally recognized experts in public health.
In 2003, nine journalists will be selected as Knight Journal-ism Fellows at CDC. Duration of the fellowship program isJune 16–September 30, 2003. A $5,000 per month stipend isprovided. Application deadline is February 20, 2003. Addi-tional information and applications are available from theCDC Foundation at http://www.cdcfoundation.org/programs/fellowships/knight.html.
Erratum: Vol. 52, No. 3In the report, “Norovirus Activity — United States, 2002,”
on page 43 under “CDC Laboratory Surveillance,” the par-enthetical list on the 22nd line should read (Alaska, Georgia,Kentucky, North Carolina, and Utah).
Erratum: Vol. 52, No. SS-1On page 7 in the CDC’s Surveillance Summaries, “Surveil-
lance for Safety After Immunization: Vaccine Adverse EventReporting System (VAERS)—United States, 1991–2001,”published on January 24, 2003, an error occurred in the lastsentence of the first paragraph. The sentence should read, “OnFebruary 25, 2002, the manufacturer withdrew the vaccinefrom the market, citing poor sales.”
On page 23, errors occurred in Figures 5 and 7. The correctfigures follow.

114 MMWR February 14, 2003
Anthrax - - Hansen disease (leprosy)† 4 3Botulism: - - Hantavirus pulmonary syndrome† 3 -
foodborne - 4 Hemolytic uremic syndrome, postdiarrheal† 8 9infant 6 8 HIV infection, pediatric†§ - 21other (wound & unspecified) 2 3 Measles, total -¶ 1**
Brucellosis† 5 8 Mumps 16 19Chancroid 2 3 Plague - -Cholera - - Poliomyelitis, paralytic - -Cyclosporiasis† - 13 Psittacosis† 3 8Diphtheria - - Q fever† 5 3Ehrlichiosis: - - Rabies, human - -
human granulocytic (HGE)† 10 7 Rubella - 1human monocytic (HME)† 7 2 Rubella, congenital - 1other and unspecified - - Streptococcal toxic-shock syndrome† 7 11
Encephalitis/Meningitis: - - Tetanus 1 -California serogroup viral† - - Toxic-shock syndrome 5 13eastern equine† - - Trichinosis - 2Powassan† - - Tularemia† 2 3St. Louis† - - Yellow fever - -western equine† - -
-: No reported cases.* Incidence data for reporting years 2002 and 2003 are provisional and cumulative (year-to-date).†
Not notifiable in all states.§
Updated monthly from reports to the Division of HIV/AIDS Prevention — Surveillance and Epidemiology, National Center for HIV, STD, and TB Prevention(NCHSTP). Last update December 22, 2002.
¶No cases of indigenous or imported measles were reported.
** Of one case reported, zero were indigenous and one was imported from another country.
TABLE I. Summary of provisional cases of selected notifiable diseases, United States, cumulative, week ending February 8, 2003 (6th Week)*
Cum. Cum. Cum. Cum.2003 2002 2003 2002
* No measles or rubella cases were reported for the current 4-week period yielding a ratio for week 6 of zero (0).† Ratio of current 4-week total to mean of 15 4-week totals (from previous, comparable, and subsequent 4-week periods for the past 5 years). The point where the hatched area begins
is based on the mean and two standard deviations of these 4-week totals.
FIGURE I. Selected notifiable disease reports, United States, comparison of provisional 4-week totals ending February 8, 2003, withhistorical data
DISEASE DECREASE INCREASECASES CURRENT
4 WEEKS
Ratio (Log Scale)†
*
Beyond Historical Limits
4210.50.250.125
246
322
43
58
0
65
7
178
0
Hepatitis A, Acute
Hepatitis B, Acute
Hepatitis C, Acute
Legionellosis
Measles, Total
Mumps
Pertussis
Rubella
Meningococcal Infections
0.06250.03125
*

Vol. 52 / No. 6 MMWR 115
UNITED STATES - 3,372 66,602 84,106 408 201 117 239 - -
NEW ENGLAND - 111 2,359 2,969 - - 9 7 - -Maine - 1 138 154 N N 1 - - -N.H. - 2 182 185 - - - 2 - -Vt. - 3 127 81 - - 1 - - -Mass. - 76 771 1,140 - - 5 2 - -R.I. - 5 269 313 - - 1 3 - -Conn. - 24 872 1,096 - - 1 - - -
MID. ATLANTIC - 835 4,788 8,891 - - 28 20 - -Upstate N.Y. - 46 1,203 866 - - 4 1 - -N.Y. City - 587 419 3,402 - - 22 13 - -N.J. - 145 1,187 1,450 - - 1 1 - -Pa. - 57 1,979 3,173 N N 1 5 - -
E.N. CENTRAL - 370 14,020 15,845 1 2 16 74 - -Ohio - 103 5,495 4,406 - - 7 14 - -Ind. - 52 1,571 1,757 N N 1 7 - -Ill. - 176 2,502 4,566 - - 2 17 - -Mich. - 31 3,171 3,183 1 2 5 10 - -Wis. - 8 1,281 1,933 - - 1 26 - -
W.N. CENTRAL - 48 2,817 4,750 - - 14 13 - -Minn. - 9 161 1,265 - - 6 5 - -Iowa - 15 174 327 N N 3 1 - -Mo. - 22 1,282 1,636 - - 2 3 - -N. Dak. - - 19 112 N N - - - -S. Dak. - - 220 241 - - 3 - - -Nebr. - - 114 346 - - - 2 - -Kans. - 2 847 823 N N - 2 - -
S. ATLANTIC - 1,093 13,696 15,071 - - 24 54 - -Del. - 21 333 279 N N 1 - - -Md. - 140 1,829 1,570 - - 5 - - -D.C. - 19 394 397 - - - 1 - -Va. - 107 1,426 1,574 - - - - - -W. Va. - 6 272 274 N N - - - -N.C. - 45 2,120 2,447 - - 3 7 - -S.C. - 102 796 1,617 - - 1 - - -Ga. - 375 2,741 2,512 - - 11 38 - -Fla. - 278 3,785 4,401 N N 3 8 - -
E.S. CENTRAL - 136 5,577 5,848 - - 7 8 - -Ky. - 16 857 987 - - - 1 - -Tenn. - 66 1,617 1,978 - - 3 1 - -Ala. - 20 1,736 1,854 - - 4 5 - -Miss. - 34 1,367 1,029 N N - 1 - -
W.S. CENTRAL - 379 10,673 12,086 - - 2 7 - -Ark. - 15 657 834 - - 1 2 - -La. - 65 1,718 2,044 N N - 1 - -Okla. - 7 825 991 N N 1 1 - -Tex. - 292 7,473 8,217 - - - 3 - -
MOUNTAIN - 106 3,500 5,232 349 120 8 6 - -Mont. - 3 238 289 - - - - - -Idaho - 1 174 153 - - 5 2 - -Wyo. - 1 140 79 - - - - - -Colo. - 20 736 1,550 N N 2 1 - -N. Mex. - 6 43 840 - 1 - - - -Ariz. - 39 1,663 1,603 347 113 1 - - -Utah - 7 186 51 1 2 - 2 - -Nev. - 29 320 667 1 4 - 1 - -
PACIFIC - 294 9,172 13,414 58 79 9 50 - -Wash. - 1 1,654 1,454 N N - U - -Oreg. - 75 495 624 - - 2 6 - -Calif. - 215 6,168 10,533 58 79 7 34 - -Alaska - - 367 335 - - - - - -Hawaii - 3 488 468 - - - - - -
Guam - - - - - - - - - -P.R. - 68 103 194 N N - - - -V.I. - 33 - 26 - - - - - -Amer. Samoa U U U U U U U U U UC.N.M.I. - U - U - U - U - U
N: Not notifiable. U: Unavailable. -: No reported cases. C.N.M.I.: Commonwealth of Northern Mariana Islands.* Incidence data for reporting years 2002 and 2003 are provisional and cumulative (year-to-date).† Chlamydia refers to genital infections caused by C. trachomatis.§ Updated monthly from reports to the Division of HIV/AIDS Prevention — Surveillance and Epidemiology, National Center for HIV, STD, and TB Prevention. Last update
December 22, 2002.
TABLE II. Provisional cases of selected notifiable diseases, United States, weeks ending February 8, 2003, and February 9, 2002(6th Week)*
Encephalitis/MeningitisAIDS Chlamydia† Coccidiodomycosis Cryptosporidiosis West Nile
Cum. Cum. Cum. Cum. Cum. Cum. Cum. Cum. Cum. Cum.Reporting area 2003§ 2002 2003 2002 2003 2002 2003 2002 2003 2002

116 MMWR February 14, 2003
UNITED STATES 81 139 6 7 5 2 1,557 1,512 29,722 38,570
NEW ENGLAND 8 6 - 1 - - 63 167 648 965Maine - - - - - - 10 18 5 11N.H. 2 1 - - - - 5 9 15 10Vt. - - - - - - 8 17 14 14Mass. 3 1 - 1 - - 36 90 213 437R.I. - 1 - - - - 4 10 105 103Conn. 3 3 - - - - - 23 296 390
MID. ATLANTIC 5 9 - - 1 - 516 297 2,108 4,142Upstate N.Y. 3 5 - - 1 - 51 53 607 431N.Y. City - - - - - - 447 114 133 1,455N.J. 2 4 - - - - 11 52 685 919Pa. N N - - - - 7 78 683 1,337
E.N. CENTRAL 20 49 - - 1 1 222 358 7,537 8,285Ohio 4 8 - - 1 1 114 93 3,496 2,463Ind. 1 4 - - - - - - 631 815Ill. 5 19 - - - - 27 112 1,228 2,572Mich. 7 6 - - - - 76 90 1,718 1,768Wis. 3 12 - - - - 5 63 464 667
W.N. CENTRAL 14 22 1 3 2 - 132 113 1,184 2,113Minn. 6 7 1 3 - - 33 13 73 387Iowa 1 6 - - - - 29 30 31 93Mo. 3 2 N N N N 19 32 752 1,031N. Dak. - - - - 1 - 4 - 1 1S. Dak. 1 - - - - - 7 8 7 29Nebr. 3 4 - - - - 20 13 5 165Kans. - 3 - - 1 - 20 17 315 407
S. ATLANTIC 9 17 1 1 - - 256 314 7,802 9,227Del. - 1 - - - - 6 7 169 210Md. - - - - - - 14 15 963 921D.C. - - - - - - - 6 331 343Va. 1 2 - - - - 13 9 768 1,111W. Va. - - - - - - - 2 95 111N.C. 3 3 - - - - - - 1,639 1,588S.C. - - - - - - 4 1 484 955Ga. - 10 - - - - 132 102 1,487 1,515Fla. 5 1 1 1 - - 87 172 1,866 2,473
E.S. CENTRAL 5 - - - - - 33 24 3,063 3,539Ky. - - - - - - - - 403 405Tenn. 3 - - - - - 12 5 823 1,231Ala. 2 - - - - - 21 19 1,121 1,220Miss. - - - - - - - - 716 683
W.S. CENTRAL 1 3 - - - 1 22 9 4,639 5,886Ark. 1 - - - - - 15 9 441 604La. - - - - - - - - 1,078 1,388Okla. - - - - - - 7 - 352 438Tex. - 3 - - - 1 - - 2,768 3,456
MOUNTAIN 7 10 3 1 1 - 129 117 860 1,302Mont. - 1 - - - - 2 3 18 21Idaho 2 1 2 - - - 20 3 8 10Wyo. - - - 1 - - 3 1 9 6Colo. 2 2 - - 1 - 42 48 223 459N. Mex. - 2 1 - - - 2 13 23 159Ariz. 1 1 - - - - 32 10 453 439Utah 2 1 - - - - 16 22 17 2Nev. - 2 - - - - 12 17 109 206
PACIFIC 12 23 1 1 - - 184 113 1,881 3,111Wash. 4 4 - - - - 9 22 322 325Oreg. 1 6 1 1 - - 35 71 86 105Calif. 5 13 - - - - 119 - 1,307 2,557Alaska - - - - - - 9 8 58 67Hawaii 2 - - - - - 12 12 108 57
Guam N N - - - - - - - -P.R. - - - - - - - - 11 70V.I. - - - - - - - - - 8Amer. Samoa U U U U U U U U U UC.N.M.I. - U - U - U - U - U
N: Not notifiable. U: Unavailable. - : No reported cases.* Incidence data for reporting years 2002 and 2003 are provisional and cumulative (year-to-date).
TABLE II. (Continued) Provisional cases of selected notifiable diseases, United States, weeks ending February 8, 2003, and February 9, 2002(6th Week)*
Escherichia coli, Enterohemorrhagic (EHEC)Shiga toxin positive, Shiga toxin positive,
O157:H7 serogroup non-O157 not serogrouped Giardiasis GonorrheaCum. Cum. Cum. Cum. Cum. Cum. Cum. Cum. Cum. Cum.
Reporting area 2003 2002 2003 2002 2003 2002 2003 2002 2003 2002
Vol. 52 / No. 6 MMWR 117
UNITED STATES 116 190 2 - 15 30 1 1 443 1,032
NEW ENGLAND 14 14 - - - 3 - - 15 51Maine - 1 - - - - - - 1 1N.H. 3 - - - - - - - - 1Vt. 4 - - - - - - - 1 -Mass. 5 9 - - - 2 - - 11 28R.I. - - - - - - - - - 2Conn. 2 4 - - - 1 - - 2 19
MID. ATLANTIC 9 35 - - 3 3 - - 67 100Upstate N.Y. 3 14 - - 1 2 - - 5 9N.Y. City 5 11 - - 2 1 - - 62 27N.J. 1 7 - - - - - - - 27Pa. - 3 - - - - - - - 37
E.N. CENTRAL 9 38 1 - 2 6 - - 60 129Ohio 5 20 - - 2 3 - - 21 28Ind. 1 3 - - - 1 - - 2 1Ill. - 14 - - - 2 - - 10 57Mich. 3 1 1 - - - - - 24 27Wis. - - - - - - - - 3 16
W.N. CENTRAL 9 3 - - 1 - 1 1 17 43Minn. 4 - - - - - - - 1 -Iowa - 1 - - - - - - 7 11Mo. 3 2 - - - - 1 1 3 10N. Dak. - - - - - - - - 1 -S. Dak. - - - - - - - - - 1Nebr. - - - - - - - - 1 1Kans. 2 - - - 1 - - - 4 20
S. ATLANTIC 28 50 - - 2 9 - - 153 256Del. - - - - - - - - 1 2Md. 8 16 - - 1 - - - 21 53D.C. - - - - - - - - - 10Va. 1 3 - - - 1 - - 1 5W. Va. - - - - - - - - 2 1N.C. 2 3 - - - - - - 5 31S.C. 1 - - - - - - - 6 5Ga. 4 18 - - - 4 - - 63 35Fla. 12 10 - - 1 4 - - 54 114
E.S. CENTRAL 13 2 - - 3 1 - - 13 46Ky. 1 - - - - - - - 2 7Tenn. 5 1 - - 2 - - - 8 16Ala. 7 1 - - 1 1 - - 3 5Miss. - - - - - - - - - 18
W.S. CENTRAL 8 4 - - 1 1 - - 6 108Ark. 1 - - - - - - - - 4La. 2 - - - - - - - 3 4Okla. 5 4 - - 1 1 - - 3 6Tex. - - - - - - - - - 94
MOUNTAIN 20 24 1 - 2 3 - - 28 50Mont. - - - - - - - - - 2Idaho - - - - - - - - - 5Wyo. - - - - - - - - - 2Colo. 3 4 - - - - - - 4 12N. Mex. 2 5 - - - 1 - - - 3Ariz. 11 12 1 - 1 2 - - 17 11Utah 3 3 - - 1 - - - 4 5Nev. 1 - - - - - - - 3 10
PACIFIC 6 20 - - 1 4 - - 84 249Wash. - - - - - - - - 2 7Oreg. 4 12 - - 1 1 - - 12 20Calif. - 2 - - - 2 - - 67 222Alaska - 1 - - - 1 - - 1 -Hawaii 2 5 - - - - - - 2 -
Guam - - - - - - - - - -P.R. - - - - - - - - - 6V.I. - - - - - - - - - -Amer. Samoa U U U U U U U U U UC.N.M.I. - U - U - U - U - UN: Not notifiable. U: Unavailable. -: No reported cases.* Incidence data for reporting years 2002 and 2003 are provisional and cumulative (year-to-date).
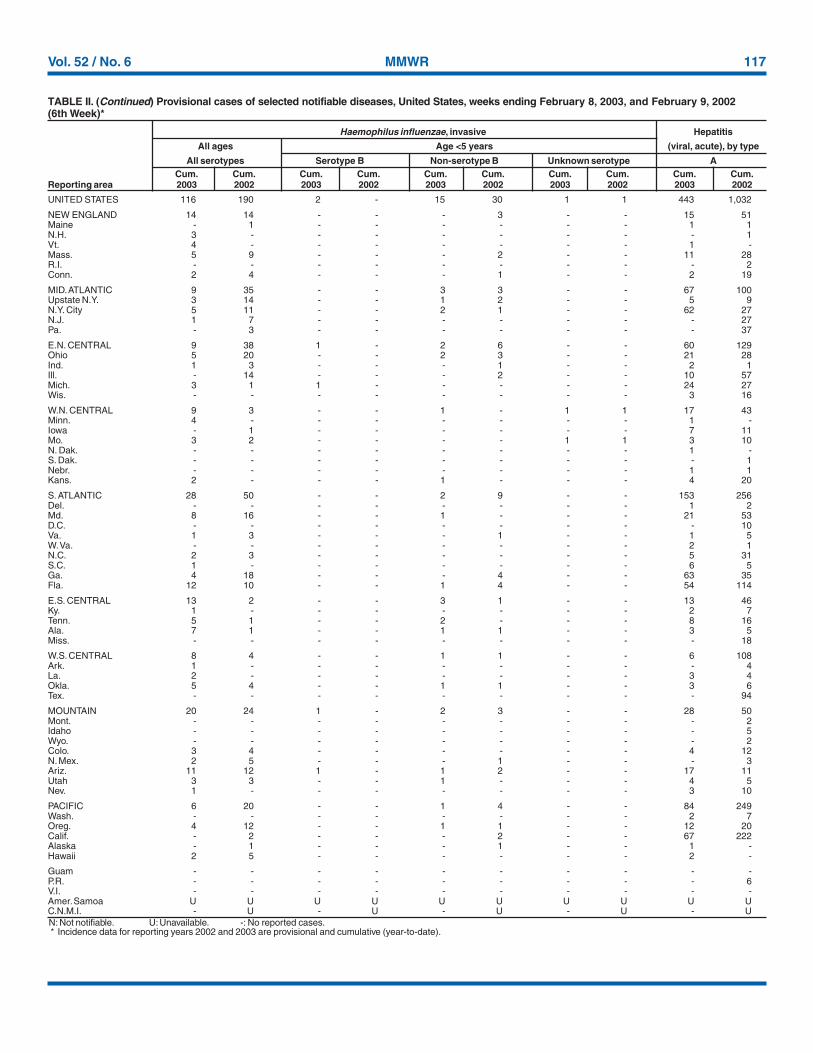
TABLE II. (Continued) Provisional cases of selected notifiable diseases, United States, weeks ending February 8, 2003, and February 9, 2002(6th Week)*
Haemophilus influenzae, invasive Hepatitis
All ages Age <5 years (viral, acute), by type
All serotypes Serotype B Non-serotype B Unknown serotype ACum. Cum. Cum. Cum. Cum. Cum. Cum. Cum. Cum. Cum.
Reporting area 2003 2002 2003 2002 2003 2002 2003 2002 2003 2002

118 MMWR February 14, 2003
UNITED STATES 562 483 86 182 90 88 33 41 323 542
NEW ENGLAND 17 25 - 2 3 4 3 3 3 46Maine - - - - - - - 1 - -N.H. - 2 - - - 1 1 - - 7Vt. 1 2 - 1 1 - - - 3 -Mass. 16 18 - 1 1 2 2 1 - 39R.I. - - - - - - - - - -Conn. - 3 - - 1 1 - 1 - -
MID. ATLANTIC 136 114 6 6 11 16 10 5 264 404Upstate N.Y. 4 3 2 1 3 2 2 3 174 238N.Y. City 74 59 - - 8 - 5 1 54 -N.J. 55 34 4 3 - 5 2 - 34 80Pa. 3 18 - 2 - 9 1 1 2 86
E.N. CENTRAL 50 43 13 9 28 36 3 8 5 14Ohio 23 7 1 - 17 23 2 3 4 2Ind. - - - - - 3 - - 1 1Ill. - 3 1 2 - - - 1 - -Mich. 27 27 11 7 11 8 1 1 - -Wis. - 6 - - - 2 - 3 U 11
W.N. CENTRAL 17 28 21 65 2 2 2 1 - 7Minn. 2 1 - - - - 1 - - 2Iowa 1 6 - - 1 - - - - 3Mo. 9 13 19 62 - 1 - 1 - 2N. Dak. - - - - - - - - - -S. Dak. - - - - - - - - - -Nebr. 3 4 2 3 - 1 1 - - -Kans. 2 4 - - 1 - - - - -
S. ATLANTIC 209 114 20 10 35 9 6 6 35 55Del. 1 1 - 3 - 2 - - - 6Md. 7 18 1 2 9 3 1 1 23 41D.C. - 2 - - - - - - - 3Va. 1 8 - - 2 - - - - -W. Va. - 2 - - N N - - - -N.C. 17 12 1 2 2 1 1 - 6 -S.C. - 3 - - - - 1 2 - 1Ga. 133 15 2 - 5 2 1 2 1 -Fla. 50 53 16 3 17 1 2 1 5 4
E.S. CENTRAL 24 38 12 21 1 1 3 1 1 -Ky. 4 4 2 1 - - - - - -Tenn. 5 11 - 2 1 - - 1 1 -Ala. 8 10 - 1 - 1 2 - - -Miss. 7 13 10 17 - - 1 - - -
W.S. CENTRAL 7 14 5 55 2 2 - 4 2 7Ark. - 11 - 4 - - - - - -La. 7 2 5 1 - - - - 2 1Okla. - 1 - - 2 - - - - -Tex. - - - 50 - 2 - 4 - 6
MOUNTAIN 59 28 4 4 4 4 6 3 1 1Mont. 2 - - - - - 1 - - -Idaho - - - - 1 - - - 1 -Wyo. 1 2 - 2 - - - - - -Colo. 11 9 4 1 - 1 3 1 - -N. Mex. - 4 - - - 1 - - - 1Ariz. 40 5 - - 2 - 2 2 - -Utah 4 3 - - 1 2 - - - -Nev. 1 5 - 1 - - - - - -
PACIFIC 43 79 5 10 4 14 - 10 12 8Wash. 2 2 - - - - - - - -Oreg. 12 19 2 5 N N - 1 3 1Calif. 29 57 3 5 4 14 - 9 9 7Alaska - 1 - - - - - - - -Hawaii - - - - - - - - N N
Guam - - - - - - - - - -P.R. - 3 - - - - - 1 N NV.I. - - - - - - - - - -Amer. Samoa U U U U U U U U U UC.N.M.I. - U - U - U - U - UN: Not notifiable. U: Unavailable. -: No reported cases.* Incidence data for reporting years 2002 and 2003 are provisional and cumulative (year-to-date).
TABLE II. (Continued) Provisional cases of selected notifiable diseases, United States, weeks ending February 8, 2003, and February 9, 2002(6th Week)*
Hepatitis (viral, acute), by typeB C Legionellosis Listeriosis Lyme disease
Cum. Cum. Cum. Cum. Cum. Cum. Cum. Cum. Cum. Cum.Reporting area 2003 2002 2003 2002 2003 2002 2003 2002 2003 2002

Vol. 52 / No. 6 MMWR 119
UNITED STATES 83 106 119 209 346 535 329 549 26 29
NEW ENGLAND 2 11 7 14 83 117 49 54 1 -Maine 1 1 1 2 - 3 3 3 - -N.H. 1 4 - 1 - - 2 1 - -Vt. - - - 2 14 16 3 13 - -Mass. - 4 5 8 69 93 18 18 1 -R.I. - - - - - - - 2 - -Conn. - 2 1 1 - 5 23 17 - -
MID. ATLANTIC 33 20 10 27 25 20 29 76 1 4Upstate N.Y. 4 2 2 6 23 15 26 49 - -N.Y. City 27 7 6 5 - 4 1 3 1 -N.J. 2 9 1 6 2 - - 12 - -Pa. - 2 1 10 - 1 2 12 - 4
E.N. CENTRAL 6 12 17 34 43 75 4 2 1 2Ohio 3 4 6 14 38 43 - 1 1 2Ind. - - 4 6 - 2 2 1 - -Ill. 1 5 - 4 - 8 - - - -Mich. 2 3 6 6 4 10 2 - - -Wis. - - 1 4 1 12 - - - -
W.N. CENTRAL 4 6 8 9 11 49 49 34 1 1Minn. 2 - 1 - - 1 4 2 - -Iowa 2 2 4 - - 14 5 4 1 -Mo. - 2 2 5 7 23 - - - 1N. Dak. - - - - - - 8 - - -S. Dak. - - - 2 - 1 - 14 - -Nebr. - - - 1 - 2 - - - -Kans. - 2 1 1 4 8 32 14 - -
S. ATLANTIC 25 22 30 27 49 31 168 142 20 21Del. - - 4 1 - 1 - 3 - -Md. 11 9 2 1 11 6 2 43 4 5D.C. - 2 - - - - - - - -Va. - - 2 1 1 8 47 39 - -W. Va. 1 - - - - - 7 11 - -N.C. 4 3 3 3 17 7 54 39 16 16S.C. - 2 - 1 - 8 13 6 - -Ga. 3 6 2 6 14 - 35 - - -Fla. 6 - 17 14 6 1 10 1 - -
E.S. CENTRAL 2 3 9 8 12 21 4 109 1 1Ky. - - - - 2 6 3 1 - -Tenn. - 1 3 1 3 8 - 108 1 1Ala. 2 1 3 6 7 1 1 - - -Miss. - 1 3 1 - 6 - - - -
W.S. CENTRAL 1 1 8 33 - 85 9 99 - -Ark. - - 1 5 - 69 - - - -La. 1 1 4 2 - - - - - -Okla. - - 3 4 - 2 9 12 - -Tex. - - - 22 - 14 - 87 - -
MOUNTAIN 2 4 4 17 93 68 10 13 - -Mont. - - - - - 2 1 - - -Idaho - - - - 2 5 - - - -Wyo. - - - - - 2 - 1 - -Colo. 1 2 - 5 40 39 - - - -N. Mex. - - 1 - 7 10 - - - -Ariz. 1 - 3 7 35 4 9 12 - -Utah - 1 - - 6 5 - - - -Nev. - 1 - 5 3 1 - - - -
PACIFIC 8 27 26 40 30 69 7 20 1 -Wash. 3 - 2 7 5 4 - - - -Oreg. 4 - 7 7 25 11 - - - -Calif. 1 24 16 24 - 50 7 8 1 -Alaska - 1 - 1 - 1 - 12 - -Hawaii - 2 1 1 - 3 - - - -
Guam - - - - - - - - - -P.R. - - - 1 - - - 11 - -V.I. - - - - - - - - - -Amer. Samoa U U U U U U U U U UC.N.M.I. - U - U - U - U - U
N: Not notifiable. U: Unavailable. - : No reported cases.* Incidence data for reporting years 2002 and 2003 are provisional and cumulative (year-to-date).
TABLE II. (Continued) Provisional cases of selected notifiable diseases, United States, weeks ending February 8, 2003, and February 9, 2002(6th Week)*
Meningococcal Rocky MountainMalaria disease Pertussis Rabies, animal spotted fever
Cum. Cum. Cum. Cum. Cum. Cum. Cum. Cum. Cum. Cum.Reporting area 2003 2002 2003 2002 2003 2002 2003 2002 2003 2002

120 MMWR February 14, 2003
UNITED STATES 2,135 3,005 1,598 1,542 371 474 243 179 42 13
NEW ENGLAND 89 133 28 28 12 20 2 1 - 1Maine 4 21 1 1 - 3 - - - -N.H. 4 4 - 1 1 2 - - N NVt. 2 6 - - 2 1 2 1 - 1Mass. 59 72 19 24 9 14 N N N NR.I. 4 5 2 - - - - - - -Conn. 16 25 6 2 - - - - - -
MID. ATLANTIC 205 312 96 72 49 78 6 9 8 1Upstate N.Y. 37 25 17 7 30 24 6 9 8 1N.Y. City 147 102 65 35 14 26 U U U UN.J. 11 105 5 14 1 24 N N N NPa. 10 80 9 16 4 4 - - - -
E.N. CENTRAL 319 514 117 227 88 119 53 11 26 10Ohio 149 78 40 107 31 20 46 - 25 -Ind. 21 25 7 6 3 3 7 9 1 2Ill. 75 278 39 82 1 38 - 2 - -Mich. 58 77 27 20 52 37 - - N NWis. 16 56 4 12 1 21 N N - 8
W.N. CENTRAL 133 195 72 179 31 21 32 29 5 -Minn. 38 35 3 20 11 - - - 5 -Iowa 39 26 3 11 - - N N N NMo. 25 89 19 23 4 10 - 1 - -N. Dak. 2 - - - 1 - 1 - - -S. Dak. 5 11 8 82 4 - - - - -Nebr. 10 11 30 29 6 6 4 9 N NKans. 14 23 9 14 5 5 27 19 N N
S. ATLANTIC 772 855 959 526 78 91 126 100 - 1Del. 2 9 50 2 1 - - 3 N NMd. 69 61 103 40 26 12 - - - -D.C. - 7 - 3 - 2 - 3 - 1Va. 41 61 25 145 - 6 N N N NW. Va. 1 4 - 1 - - 5 3 - -N.C. 151 112 111 32 17 22 N N U US.C. 39 31 14 6 1 2 9 18 N NGa. 203 205 348 174 10 35 32 45 N NFla. 266 365 308 123 23 12 80 28 N N
E.S. CENTRAL 176 161 85 108 8 13 9 19 - -Ky. 28 19 5 30 1 3 - 1 N NTenn. 52 35 20 5 7 10 9 18 N NAla. 67 59 47 31 - - - - N NMiss. 29 48 13 42 - - - - - -
W.S. CENTRAL 48 179 64 113 9 38 12 3 3 -Ark. 25 29 1 18 1 - 1 2 - -La. 8 11 13 8 - - 11 1 1 -Okla. 15 22 50 27 8 4 N N 2 -Tex. - 117 - 60 - 34 N N - -
MOUNTAIN 117 157 66 37 73 31 3 7 - -Mont. 4 3 - - - - - - - -Idaho 11 9 1 2 4 - N N N NWyo. 2 4 1 - - 1 1 4 - -Colo. 39 56 16 10 22 12 - - - -N. Mex. 9 24 13 3 10 16 2 3 - -Ariz. 32 26 31 11 35 - - - N NUtah 12 14 2 5 2 2 - - - -Nev. 8 21 2 6 - - - - - -
PACIFIC 276 499 111 252 23 63 - - - -Wash. 26 12 2 2 - 16 - - N NOreg. 24 34 8 20 N N N N N NCalif. 197 421 93 223 10 36 N N N NAlaska 11 10 2 1 - - - - N NHawaii 18 22 6 6 13 11 - - - -
Guam - - - - - - - - - -P.R. - 10 - 1 N N - - N NV.I. - - - - - - - - - -Amer. Samoa U U U U U U U U U UC.N.M.I. - U - U - U - U - U
N: Not notifiable. U: Unavailable. - : No reported cases.* Incidence data for reporting years 2002 and 2003 are provisional and cumulative (year-to-date).
TABLE II. (Continued) Provisional cases of selected notifiable diseases, United States, weeks ending February 8, 2003, and February 9, 2002(6th Week)*
Streptococcus pneumoniae, invasiveStreptococcal disease, Drug resistant,
Salmonellosis Shigellosis invasive, group A all ages Age <5 yearsCum. Cum. Cum. Cum. Cum. Cum. Cum. Cum. Cum. Cum.
Reporting area 2003 2002 2003 2002 2003 2002 2003 2002 2003 2002

Vol. 52 / No. 6 MMWR 121
UNITED STATES 606 601 18 40 342 805 20 23 1,486
NEW ENGLAND 13 9 - - 11 28 1 4 382Maine - - - - - 2 - - 203N.H. - - - - - - - - -Vt. - - - - - - - - 141Mass. 10 6 - - 5 2 - 3 38R.I. 3 - - - - 10 - - -Conn. - 3 - - 6 14 1 1 -
MID. ATLANTIC 65 57 4 9 111 122 7 3 -Upstate N.Y. 2 1 2 1 - 9 - - -N.Y. City 39 32 1 3 102 53 7 2 -N.J. 23 15 1 5 - 34 - 1 -Pa. 1 9 - - 9 26 - - -
E.N. CENTRAL 84 104 6 4 60 73 2 2 793Ohio 22 13 1 - 12 11 - 1 200Ind. 1 9 1 - 13 12 1 - -Ill. 11 36 3 3 33 44 - - -Mich. 48 43 1 1 - - 1 - 577Wis. 2 3 - - 2 6 - 1 16
W.N. CENTRAL 10 10 - - 25 51 - 1 2Minn. - 5 - - 7 19 - 1 -Iowa - - - - 6 - - - -Mo. 3 2 - - 1 22 - - -N. Dak. - - - - - - - - 2S. Dak. - - - - 4 - - - -Nebr. - 2 - - - - - - -Kans. 7 1 - - 7 10 - - -
S. ATLANTIC 172 141 3 8 12 102 1 6 300Del. 1 2 - - - - - - 1Md. 30 11 - 1 4 3 1 1 -D.C. 5 3 - - - - - - -Va. 9 4 - - 3 8 - - 55W. Va. - - - - 1 5 - - 239N.C. 21 41 - 3 2 7 - - -S.C. 9 15 1 2 2 2 - - 5Ga. 22 17 - 1 - 10 - 1 -Fla. 75 48 2 1 - 67 - 4 -
E.S. CENTRAL 38 73 2 2 25 51 - - -Ky. 5 1 - - - 8 - - -Tenn. 18 29 2 1 7 24 - - -Ala. 14 29 - - 18 15 - - -Miss. 1 14 - 1 - 4 - - -
W.S. CENTRAL 89 82 - 13 10 172 - 3 1Ark. 8 1 - - 5 3 - - -La. 9 20 - - - - - - 1Okla. 7 8 - - 5 2 - - -Tex. 65 53 - 13 - 167 - 3 -
MOUNTAIN 22 34 3 1 10 27 2 1 8Mont. - - - - - - - - -Idaho - 1 - - - - - - -Wyo. - - - - 1 1 - - 2Colo. - 1 - - 2 5 2 1 -N. Mex. 3 4 - - - 7 - - -Ariz. 19 28 3 1 7 9 - - -Utah - - - - - 2 - - 6Nev. - - - - - 3 - - -
PACIFIC 113 91 - 3 78 179 7 3 -Wash. 7 5 - - 20 14 - - -Oreg. 5 4 - - 5 4 2 - -Calif. 99 81 - 3 39 135 5 3 -Alaska - - - - 4 11 - - -Hawaii 2 1 - - 10 15 - - -
Guam - - - - - - - - -P.R. 8 18 - 7 - - - - -V.I. - 1 - - - - - - -Amer. Samoa U U U U U U U U UC.N.M.I. - U - U - U - U -
N: Not notifiable. U: Unavailable. - : No reported cases.* Incidence data for reporting years 2002 and 2003 are provisional and cumulative (year-to-date).
TABLE II. (Continued) Provisional cases of selected notifiable diseases, United States, weeks ending February 8, 2003, and February 9, 2002(6th Week)*
Syphilis VaricellaPrimary & secondary Congenital Tuberculosis Typhoid fever (Chickenpox)Cum. Cum. Cum. Cum. Cum. Cum. Cum. Cum. Cum.
Reporting area 2003 2002 2003 2002 2003 2002 2003 2002 2003

122 MMWR February 14, 2003
NEW ENGLAND 561 417 97 36 4 7 75Boston, Mass. 145 98 29 13 2 3 18Bridgeport, Conn. 47 38 8 1 - - 6Cambridge, Mass. 21 17 3 1 - - 2Fall River, Mass. 30 25 2 3 - - 9Hartford, Conn. 44 30 8 5 - 1 8Lowell, Mass. 30 25 3 2 - - 1Lynn, Mass. 10 6 1 3 - - 1New Bedford, Mass. 26 21 5 - - - 6New Haven, Conn. U U U U U U UProvidence, R.I. 45 31 9 2 1 2 -Somerville, Mass. 2 - 2 - - - -Springfield, Mass. 49 36 8 4 1 - 5Waterbury, Conn. 47 42 5 - - - 4Worcester, Mass. 65 48 14 2 - 1 15
MID. ATLANTIC 2,736 1,961 519 171 42 36 162Albany, N.Y. 56 38 10 5 - 3 5Allentown, Pa. 26 20 4 - 2 - 4Buffalo, N.Y. 110 86 18 4 2 - 9Camden, N.J. 29 16 7 4 - 2 2Elizabeth, N.J. 23 22 1 - - - 2Erie, Pa. 42 32 9 1 - - 3Jersey City, N.J. 41 24 10 6 - 1 -New York City, N.Y. 1,635 1,189 304 99 18 18 67Newark, N.J. 47 23 13 7 1 3 2Paterson, N.J. 10 6 2 2 - - 1Philadelphia, Pa. 270 165 68 23 12 2 23Pittsburgh, Pa.§ 33 21 8 1 1 2 2Reading, Pa. 25 20 3 1 1 - 6Rochester, N.Y. 143 110 25 7 1 - 12Schenectady, N.Y. 29 24 3 1 - 1 4Scranton, Pa. 36 31 2 2 - 1 4Syracuse, N.Y. 118 88 17 6 4 3 10Trenton, N.J. 16 13 2 1 - - -Utica, N.Y. 26 17 8 1 - - 1Yonkers, N.Y. 21 16 5 - - - 5
E.N. CENTRAL 2,080 1,415 423 122 46 49 149Akron, Ohio 49 36 7 2 - 1 10Canton, Ohio 50 37 8 3 - 2 5Chicago, Ill. 336 205 82 26 12 11 23Cincinnati, Ohio 96 66 18 6 2 4 8Cleveland, Ohio 138 93 29 9 5 2 3Columbus, Ohio 210 151 35 11 4 9 20Dayton, Ohio 119 91 19 6 2 1 9Detroit, Mich. 228 135 62 21 5 5 14Evansville, Ind. 57 47 6 2 2 - 2Fort Wayne, Ind. 64 49 12 2 1 - 7Gary, Ind. 22 13 6 - 1 2 1Grand Rapids, Mich. 61 42 12 2 2 3 8Indianapolis, Ind. 207 131 51 17 5 3 7Lansing, Mich. 62 46 12 3 - 1 5Milwaukee, Wis. 123 88 23 6 2 4 14Peoria, Ill. 58 42 12 2 2 - 3Rockford, Ill. 46 35 8 1 1 1 5South Bend, Ind. U U U U U U UToledo, Ohio 86 54 8 2 - - 3Youngstown, Ohio 68 54 13 1 - - 2
W.N. CENTRAL 675 477 127 39 18 14 68Des Moines, Iowa 106 80 17 6 1 2 13Duluth, Minn. 30 22 4 2 2 - 3Kansas City, Kans. 32 24 4 4 - - 5Kansas City, Mo. 104 68 26 4 3 3 9Lincoln, Nebr. 33 27 5 1 - - 5Minneapolis, Minn. 87 59 21 4 2 1 10Omaha, Nebr. 123 84 20 11 1 7 10St. Louis, Mo. U U U U U U USt. Paul, Minn. 60 42 12 3 2 1 6Wichita, Kans. 100 71 18 4 7 - 7
S. ATLANTIC 1,395 930 281 112 43 28 95Atlanta, Ga. 221 140 44 26 8 3 13Baltimore, Md. 321 187 89 27 12 6 22Charlotte, N.C. 137 93 26 8 4 6 9Jacksonville, Fla. 150 103 30 10 5 2 16Miami, Fla. 120 89 15 12 2 2 6Norfolk, Va. 61 40 12 3 5 1 1Richmond, Va. U U U U U U USavannah, Ga. 61 40 12 3 5 1 1St. Petersburg, Fla. 100 75 16 6 - 3 5Tampa, Fla. 210 154 33 16 2 4 20Washington, D.C. U U U U U U UWilmington, Del. 14 9 4 1 - - 2
E.S. CENTRAL 959 664 193 72 16 14 93Birmingham, Ala. 185 133 30 14 5 3 11Chattanooga, Tenn. 79 59 10 8 1 1 8Knoxville, Tenn. 137 99 26 7 1 4 11Lexington, Ky. 41 20 16 4 1 - 3Memphis, Tenn. 206 141 49 13 2 1 22Mobile, Ala. 99 70 19 8 - 2 6Montgomery, Ala. 57 38 13 5 - 1 7Nashville, Tenn. 155 104 30 13 6 2 25
W.S. CENTRAL 1,296 800 272 119 67 38 100Austin, Tex. 100 73 10 16 1 - 9Baton Rouge, La. 72 54 15 2 - 1 3Corpus Christi, Tex. 37 21 10 - 3 3 3Dallas, Tex. 234 136 54 27 8 9 21El Paso, Tex. 132 98 25 7 2 - 10Ft. Worth, Tex. U U U U U U UHouston, Tex. 427 227 86 46 45 23 35Little Rock, Ark. 81 49 25 5 2 - -New Orleans, La. 42 25 10 6 1 - -San Antonio, Tex. U U U U U U UShreveport, La. 32 21 6 1 2 2 6Tulsa, Okla. 139 96 31 9 3 - 13
MOUNTAIN 979 657 192 77 27 26 77Albuquerque, N.M. 126 75 23 19 5 4 12Boise, Idaho 50 31 12 2 2 3 5Colo. Springs, Colo. 90 63 15 6 4 2 5Denver, Colo. 116 68 28 13 1 6 9Las Vegas, Nev. 277 190 61 15 9 2 15Ogden, Utah 31 25 4 2 - - 3Phoenix, Ariz. U U U U U U UPueblo, Colo. 36 28 5 3 - - 2Salt Lake City, Utah 117 75 22 12 4 4 15Tucson, Ariz. 136 102 22 5 2 5 11
PACIFIC 1,507 1,065 294 83 43 22 113Berkeley, Calif. 18 11 3 4 - - 1Fresno, Calif. 109 77 20 7 4 1 6Glendale, Calif. 26 22 2 1 1 - 1Honolulu, Hawaii 90 63 19 4 1 3 8Long Beach, Calif. 84 53 21 8 2 - 9Los Angeles, Calif. 466 319 101 25 13 8 25Pasadena, Calif. U U U U U U UPortland, Oreg. U U U U U U USacramento, Calif. U U U U U U USan Diego, Calif. 199 145 37 11 4 2 17San Francisco, Calif. U U U U U U USan Jose, Calif. 184 136 29 9 6 4 20Santa Cruz, Calif. 33 28 4 1 - - 4Seattle, Wash. 145 93 34 7 8 3 9Spokane, Wash. 50 37 11 2 - - 4Tacoma, Wash. 103 81 13 4 4 1 9
TOTAL 12,188¶ 8,386 2,398 831 306 234 932
U: Unavailable. -:No reported cases.* Mortality data in this table are voluntarily reported from 122 cities in the United States, most of which have populations of >100,000. A death is reported by the place of its
occurrence and by the week that the death certificate was filed. Fetal deaths are not included.† Pneumonia and influenza.§ Because of changes in reporting methods in this Pennsylvania city, these numbers are partial counts for the current week. Complete counts will be available in 4 to 6 weeks.¶ Total includes unknown ages.
TABLE III. Deaths in 122 U.S. cities,* week ending February 8, 2003 (6th Week)All causes, by age (years) All causes, by age (years)
All P&I† All P&I†
Reporting Area Ages >65 45-64 25-44 1-24 <1 Total Reporting Area Ages >65 45-64 25-44 1-24 <1 Total

Vol. 52 / No. 6 MMWR 123
All MMWR references are available on the Internet at http://www.cdc.gov/mmwr. Use the search function to find specific articles.——————
Use of trade names and commercial sources is for identification only and does not imply endorsement by the U.S. Department of Healthand Human Services.
——————References to non-CDC sites on the Internet are provided as a service to MMWR readers and do not constitute or imply endorsement ofthese organizations or their programs by CDC or the U.S. Department of Health and Human Services. CDC is not responsible for thecontent of these sites. URL addresses listed in MMWR were current as of the date of publication.

MMWR
The Morbidity and Mortality Weekly Report (MMWR) Series is prepared by the Centers for Disease Control and Prevention (CDC) andis available free of charge in electronic format and on a paid subscription basis for paper copy. To receive an electronic copy each week, sendan e-mail message to [email protected]. The body content should read SUBscribe mmwr-toc. Electronic copy also is available fromCDC’s World-Wide Web server at http://www.cdc.gov/mmwr or from CDC’s file transfer protocol server at ftp://ftp.cdc.gov/pub/publications/mmwr. To subscribe for paper copy, contact Superintendent of Documents, U.S. Government Printing Office, Washington, DC 20402;telephone 202-512-1800.
Data in the weekly MMWR are provisional, based on weekly reports to CDC by state health departments. The reporting week concludesat close of business on Friday; compiled data on a national basis are officially released to the public on the following Friday. Addressinquiries about the MMWR Series, including material to be considered for publication, to Editor, MMWR Series, Mailstop C-08, CDC,1600 Clifton Rd., N.E., Atlanta, GA 30333; telephone 888-232-3228.
All material in the MMWR Series is in the public domain and may be used and reprinted without permission; citation as to source,however, is appreciated.
✩U.S. Government Printing Office: 2003-533-155/69095 Region IV
124 February 14, 2003