morbidity and mortality weekly report · morbidity and mortality weekly report. ... years, little...
TRANSCRIPT
Weekly May 22, 2009 / Vol. 58 / No. 19
department of health and human servicesCenters for disease Control and Prevention
Morbidity and Mortality Weekly Reportwww.cdc.gov/mmwr
Serum Cross-Reactive Antibody Response to a Novel Influenza A (H1N1) Virus After Vaccination with Seasonal Influenza Vaccine
seasonal influenza vaccines is unlikely to elicit a protective antibody response to the novel influenza A (H1N1) virus.
Serum specimens were provided to CDC from academic, government, and industry partners for use as part of the pub-lic health response to the emergence of the novel influenza A (H1N1) virus. The specimens had been collected from healthy human participants, with written, informed consent. All participants had been vaccinated either 1) intramuscularly with licensed TIV developed for the northern hemisphere 2005–06, 2006–07, 2007–08, or 2008–09 influenza seasons or 2) intranasally with licensed LAIV developed for the northern hemisphere 2005–06 or 2006–07 influenza seasons. The serum specimens were grouped for influenza serology testing by the age of participants and formulation of the vaccines.
Microneutralization (MN) and hemagglutination inhi-bition (HI) assays were performed at CDC, according to standard MN and HI procedures (5,6). As with vaccine production, the seasonal influenza A (H1N1) viruses used in this study (A/New Caledonia/20/1999 [2005–06 and
As of May 19, 2009, a total of 5,469 confirmed or probable cases* of human infection with a novel influenza A (H1N1) virus had been documented in 47 states and the District of Columbia (1,2). In addition, the virus had spread to 41 countries (3), with a total of 4,774 cases reported in countries outside the United States. Because producing a novel influenza A (H1N1) virus vaccine will take several months (4), determin-ing whether receipt of seasonal influenza vaccine might offer any protection against the novel influenza A (H1N1) virus is important. Therefore, using stored serum specimens collected during previous vaccine studies, CDC assessed the level of cross-reactive antibody to the novel influenza A (H1N1) virus in cohorts of children and adults before and after they had been vaccinated with the 2005–06, 2006–07, 2007–08, or 2008–09 influenza season vaccines. The results indicated that before vaccination, no cross-reactive antibody to the novel influenza A (H1N1) virus existed among children. Among adults, before vaccination, cross-reactive antibody was detected in 6%–9% of those aged 18–64 years and in 33% of those aged >60 years. Previous vaccination of children with any of four seasonal trivalent, inactivated influenza vaccines (TIV) or with live, attenuated influenza vaccine (LAIV) did not elicit a cross-reactive antibody response to the novel influenza A (H1N1) virus. Among adults, vaccination with seasonal TIV resulted in a twofold increase in cross-reactive antibody response to the novel influenza A (H1N1) virus among those aged 18–64 years, compared with a twelvefold to nineteenfold increase in cross-reactive antibody response to the seasonal H1N1 strain; no increase in cross-reactive antibody response to the novel influenza A (H1N1) virus was observed among adults aged >60 years. These data suggest that receipt of recent (2005–2009)
INSIDE
524 Federal and State Cigarette Excise Taxes — United States, 1995–2009
528 Health Warnings on Tobacco Products — Worldwide, 2007
529 Alcohol Use Among Pregnant and Nonpregnant Women of Childbearing Age — United States, 1991–2005
532 Progressive Vaccinia in a Military Smallpox Vaccinee — United States, 2009
536 Hospitalized Patients with Novel Influenza A (H1N1) Virus Infection — California, April–May, 2009
541 Notice to Readers542 QuickStats* Case definitions available at http://www.cdc.gov/h1n1flu/casedef.htm.
Editorial BoardWilliam L. Roper, MD, MPH, Chapel Hill, NC, Chairman
Virginia A. Caine, MD, Indianapolis, INDavid W. Fleming, MD, Seattle, WA
William E. Halperin, MD, DrPH, MPH, Newark, NJMargaret A. Hamburg, MD, Washington, DC
King K. Holmes, MD, PhD, Seattle, WADeborah Holtzman, PhD, Atlanta, GA
John K. Iglehart, Bethesda, MDDennis G. Maki, MD, Madison, WI
Sue Mallonee, MPH, Oklahoma City, OKPatricia Quinlisk, MD, MPH, Des Moines, IA
Patrick L. Remington, MD, MPH, Madison, WIBarbara K. Rimer, DrPH, Chapel Hill, NCJohn V. Rullan, MD, MPH, San Juan, PR
William Schaffner, MD, Nashville, TNAnne Schuchat, MD, Atlanta, GA
Dixie E. Snider, MD, MPH, Atlanta, GAJohn W. Ward, MD, Atlanta, GA
The MMWR series of publications is published by the Coordinating Center for Health Information and Service, Centers for Disease Control and Prevention (CDC), U.S. Department of Health and Human Services, Atlanta, GA 30333.Suggested Citation: Centers for Disease Control and Prevention. [Article title]. MMWR 2009;58:[inclusive page numbers].
Centers for Disease Control and PreventionRichard E. Besser, MD
(Acting) DirectorTanja Popovic, MD, PhD
Chief Science OfficerJames W. Stephens, PhD
Associate Director for ScienceSteven L. Solomon, MD
Director, Coordinating Center for Health Information and ServiceJay M. Bernhardt, PhD, MPH
Director, National Center for Health MarketingKatherine L. Daniel, PhD
Deputy Director, National Center for Health Marketing
Editorial and Production StaffFrederic E. Shaw, MD, JD
Editor, MMWR SeriesChristine G. Casey, MD
Deputy Editor, MMWR SeriesSheryl B. Lyss, MD, MPHGuest Editor, MMWR SeriesRobert A. Gunn, MD, MPH
Associate Editor, MMWR SeriesTeresa F. Rutledge
Managing Editor, MMWR SeriesDouglas W. Weatherwax
Lead Technical Writer-EditorDonald G. Meadows, MA
Jude C. RutledgeWriters-EditorsMartha F. Boyd
Lead Visual Information SpecialistMalbea A. LaPete
Stephen R. SpriggsVisual Information Specialists
Kim L. Bright, MBAQuang M. Doan, MBA
Phyllis H. KingInformation Technology Specialists
522 MMWR May 22, 2009
2006–07], A/Solomon Islands/3/2006 [2007–08], and A/Brisbane/59/2007 [2008–09]) were propagated in embryo-nated chicken eggs. The novel influenza A (H1N1) virus used in the study was A/California/04/2009, which was grown in Madin-Darby canine kidney cells. All procedures were per-formed in a biosafety level 2 laboratory using biosafety level 3 practices.† The HI assay was performed using 0.5% turkey red blood cells. Serum specimens were treated with receptor-destroying enzymes. Sera containing nonspecific agglutinins were heme-adsorbed and tested at an initial dilution of 1:10. For the MN assay, serum specimens were heat inactivated (at 133oF [56oC], for 30 minutes) and tested at an initial dilu-tion of 1:10. For calculation of geometric mean titer (GMT) estimates, a titer of <10 was assigned a value of 5, and a titer of >1280 was assigned a value of 1280. Statistical significance was determined using a paired t-test.
An initial comparison between the HI and MN assays was made for panels of sera from children aged 6 months to 9 years (n = 28), adults aged 18–59 years (n = 30), and adults aged >60 years (n = 42). Although the estimated correlation between HI and MN titers was high (r = 0.82) for the seasonal vaccine strains, the MN assay generally yielded higher titers and detected more seroconversions (i.e., fourfold or greater increases in antibody titers) to A/California/04/2009 than the HI assay. Therefore, the MN assay was used to assess the level of cross-reactive antibody to A/California/04/2009 in populations before and after vaccination with seasonal influ-enza vaccines. Although serum HI antibody titers of 40 are associated with at least a 50% reduction in risk for influenza infection or disease in populations (7), no such correlate of protection exists for MN antibody titers. Therefore, a linear regression model was used to predict the MN titer for seasonal influenza A (H1N1) viruses that corresponded to an HI titer of 40 and to measure titer achievement against the seasonal vaccine strain and the novel influenza A (H1N1) virus. In the pediatric population, an HI titer of 40 corresponded to an MN titer of 40, whereas in the adult population the corresponding MN titer was >160.
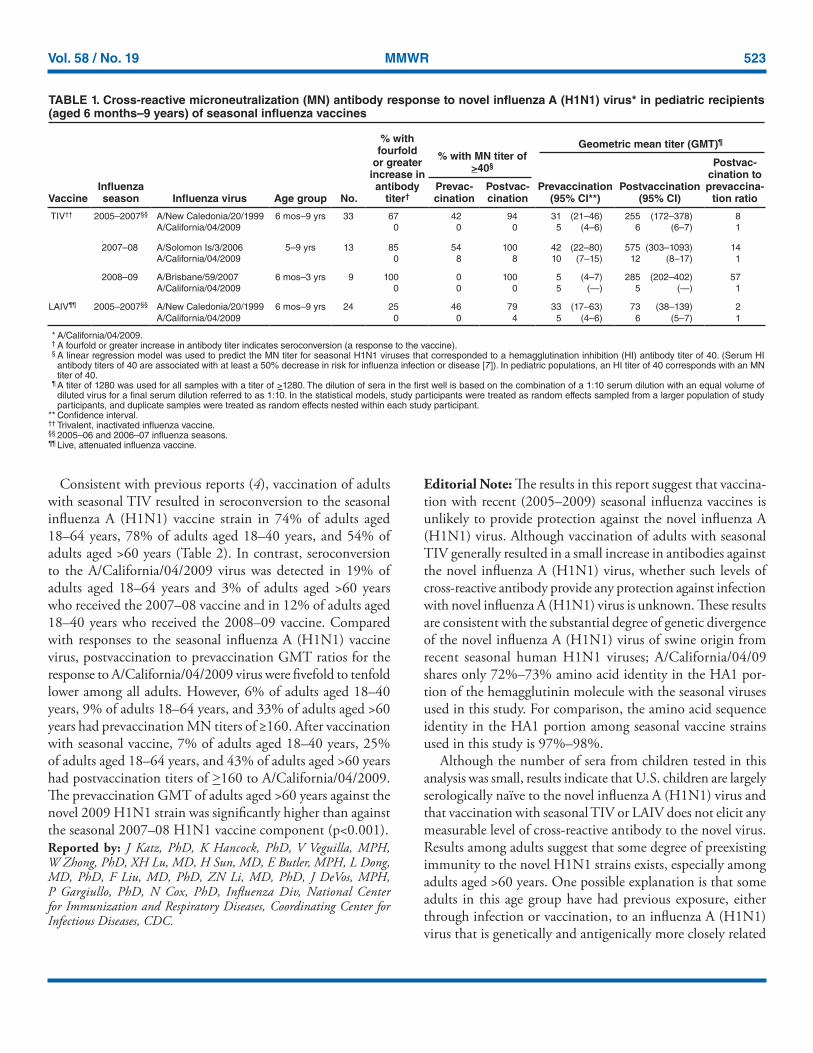
Among 79 children ranging in age from 6 months to 9 years, little evidence was found of prevaccination cross-reactive antibodies to A/California/04/2009 (Table 1). In addition, after vaccination with seasonal TIV, no seroconversions to A/California/04/2009 virus were detected, whereas sero-conversions to the seasonal vaccine strains were detected in 67%–100% of children. Children vaccinated with LAIV also had no seroconversions to the A/California/04/2009 virus.
† Biosafety level information is available at http://www.cdc.gov/od/ohs/biosfty/bmbl5/bmbl5toc.htm.
Vol. 58 / No. 19 MMWR 523
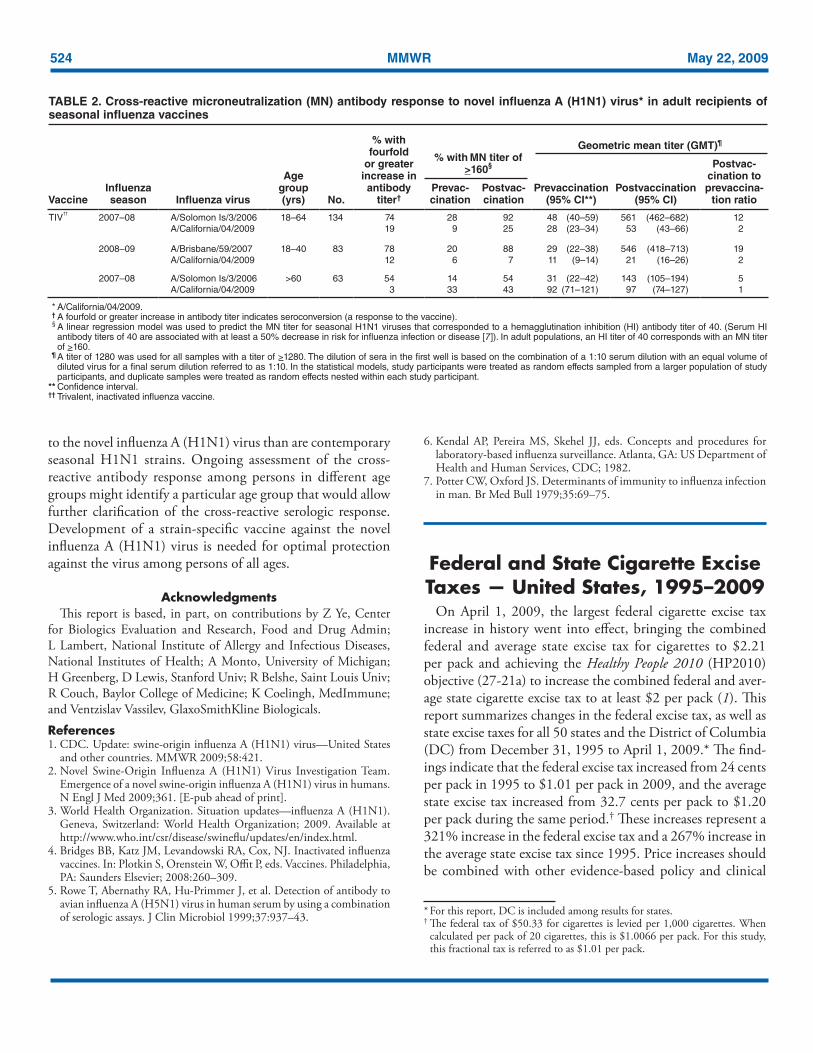
Consistent with previous reports (4), vaccination of adults with seasonal TIV resulted in seroconversion to the seasonal influenza A (H1N1) vaccine strain in 74% of adults aged 18–64 years, 78% of adults aged 18–40 years, and 54% of adults aged >60 years (Table 2). In contrast, seroconversion to the A/California/04/2009 virus was detected in 19% of adults aged 18–64 years and 3% of adults aged >60 years who received the 2007–08 vaccine and in 12% of adults aged 18–40 years who received the 2008–09 vaccine. Compared with responses to the seasonal influenza A (H1N1) vaccine virus, postvaccination to prevaccination GMT ratios for the response to A/California/04/2009 virus were fivefold to tenfold lower among all adults. However, 6% of adults aged 18–40 years, 9% of adults 18–64 years, and 33% of adults aged >60 years had prevaccination MN titers of ≥160. After vaccination with seasonal vaccine, 7% of adults aged 18–40 years, 25% of adults aged 18–64 years, and 43% of adults aged >60 years had postvaccination titers of >160 to A/California/04/2009. The prevaccination GMT of adults aged >60 years against the novel 2009 H1N1 strain was significantly higher than against the seasonal 2007–08 H1N1 vaccine component (p<0.001). Reported by: J Katz, PhD, K Hancock, PhD, V Veguilla, MPH, W Zhong, PhD, XH Lu, MD, H Sun, MD, E Butler, MPH, L Dong, MD, PhD, F Liu, MD, PhD, ZN Li, MD, PhD, J DeVos, MPH, P Gargiullo, PhD, N Cox, PhD, Influenza Div, National Center for Immunization and Respiratory Diseases, Coordinating Center for Infectious Diseases, CDC.
Editorial Note: The results in this report suggest that vaccina-tion with recent (2005–2009) seasonal influenza vaccines is unlikely to provide protection against the novel influenza A (H1N1) virus. Although vaccination of adults with seasonal TIV generally resulted in a small increase in antibodies against the novel influenza A (H1N1) virus, whether such levels of cross-reactive antibody provide any protection against infection with novel influenza A (H1N1) virus is unknown. These results are consistent with the substantial degree of genetic divergence of the novel influenza A (H1N1) virus of swine origin from recent seasonal human H1N1 viruses; A/California/04/09 shares only 72%–73% amino acid identity in the HA1 por-tion of the hemagglutinin molecule with the seasonal viruses used in this study. For comparison, the amino acid sequence identity in the HA1 portion among seasonal vaccine strains used in this study is 97%–98%.
Although the number of sera from children tested in this analysis was small, results indicate that U.S. children are largely serologically naïve to the novel influenza A (H1N1) virus and that vaccination with seasonal TIV or LAIV does not elicit any measurable level of cross-reactive antibody to the novel virus. Results among adults suggest that some degree of preexisting immunity to the novel H1N1 strains exists, especially among adults aged >60 years. One possible explanation is that some adults in this age group have had previous exposure, either through infection or vaccination, to an influenza A (H1N1) virus that is genetically and antigenically more closely related
TABLE 1. Cross-reactive microneutralization (MN) antibody response to novel influenza A (H1N1) virus* in pediatric recipients (aged 6 months–9 years) of seasonal influenza vaccines
VaccineInfluenza season Influenza virus Age group No.
% with fourfold
or greater increase in antibody
titer†
% with MN titer of >40§
Geometric mean titer (GMT)¶
Prevac-cination
Postvac-cination
Prevaccination
(95% CI**)Postvaccination
(95% CI)
Postvac-cination to prevaccina-
tion ratio
TIV†† 2005–2007§§ A/New Caledonia/20/1999 6 mos–9 yrs 33 67 42 94 31 (21–46) 255 (172–378) 8A/California/04/2009 0 0 0 5 (4–6) 6 (6–7) 1
2007–08 A/Solomon Is/3/2006 5–9 yrs 13 85 54 100 42 (22–80) 575 (303–1093) 14A/California/04/2009 0 8 8 10 (7–15) 12 (8–17) 1
2008–09 A/Brisbane/59/2007 6 mos–3 yrs 9 100 0 100 5 (4–7) 285 (202–402) 57A/California/04/2009 0 0 0 5 (—) 5 (—) 1
LAIV¶¶ 2005–2007§§ A/New Caledonia/20/1999 6 mos–9 yrs 24 25 46 79 33 (17–63) 73 (38–139) 2A/California/04/2009 0 0 4 5 (4–6) 6 (5–7) 1
* A/California/04/2009. † A fourfold or greater increase in antibody titer indicates seroconversion (a response to the vaccine). § A linear regression model was used to predict the MN titer for seasonal H1N1 viruses that corresponded to a hemagglutination inhibition (HI) antibody titer of 40. (Serum HI
antibody titers of 40 are associated with at least a 50% decrease in risk for influenza infection or disease [7]). In pediatric populations, an HI titer of 40 corresponds with an MN titer of 40.
¶ A titer of 1280 was used for all samples with a titer of >1280. The dilution of sera in the first well is based on the combination of a 1:10 serum dilution with an equal volume of diluted virus for a final serum dilution referred to as 1:10. In the statistical models, study participants were treated as random effects sampled from a larger population of study participants, and duplicate samples were treated as random effects nested within each study participant.
** Confidence interval. †† Trivalent, inactivated influenza vaccine. §§ 2005–06 and 2006–07 influenza seasons. ¶¶ Live, attenuated influenza vaccine.
524 MMWR May 22, 2009
to the novel influenza A (H1N1) virus than are contemporary seasonal H1N1 strains. Ongoing assessment of the cross-reactive antibody response among persons in different age groups might identify a particular age group that would allow further clarification of the cross-reactive serologic response. Development of a strain-specific vaccine against the novel influenza A (H1N1) virus is needed for optimal protection against the virus among persons of all ages.
Acknowledgments This report is based, in part, on contributions by Z Ye, Center
for Biologics Evaluation and Research, Food and Drug Admin; L Lambert, National Institute of Allergy and Infectious Diseases, National Institutes of Health; A Monto, University of Michigan; H Greenberg, D Lewis, Stanford Univ; R Belshe, Saint Louis Univ; R Couch, Baylor College of Medicine; K Coelingh, MedImmune; and Ventzislav Vassilev, GlaxoSmithKline Biologicals.
References 1. CDC. Update: swine-origin influenza A (H1N1) virus—United States
and other countries. MMWR 2009;58:421.2. Novel Swine-Origin Influenza A (H1N1) Virus Investigation Team.
Emergence of a novel swine-origin influenza A (H1N1) virus in humans. N Engl J Med 2009;361. [E-pub ahead of print].
3. World Health Organization. Situation updates—influenza A (H1N1). Geneva, Switzerland: World Health Organization; 2009. Available at http://www.who.int/csr/disease/swineflu/updates/en/index.html.
4. Bridges BB, Katz JM, Levandowski RA, Cox, NJ. Inactivated influenza vaccines. In: Plotkin S, Orenstein W, Offit P, eds. Vaccines. Philadelphia, PA: Saunders Elsevier; 2008:260–309.
5. Rowe T, Abernathy RA, Hu-Primmer J, et al. Detection of antibody to avian influenza A (H5N1) virus in human serum by using a combination of serologic assays. J Clin Microbiol 1999;37:937–43.
6. Kendal AP, Pereira MS, Skehel JJ, eds. Concepts and procedures for laboratory-based influenza surveillance. Atlanta, GA: US Department of Health and Human Services, CDC; 1982.
7. Potter CW, Oxford JS. Determinants of immunity to influenza infection in man. Br Med Bull 1979;35:69–75.
Federal and State Cigarette Excise Taxes — United States, 1995–2009
On April 1, 2009, the largest federal cigarette excise tax increase in history went into effect, bringing the combined federal and average state excise tax for cigarettes to $2.21 per pack and achieving the Healthy People 2010 (HP2010) objective (27-21a) to increase the combined federal and aver-age state cigarette excise tax to at least $2 per pack (1). This report summarizes changes in the federal excise tax, as well as state excise taxes for all 50 states and the District of Columbia (DC) from December 31, 1995 to April 1, 2009.* The find-ings indicate that the federal excise tax increased from 24 cents per pack in 1995 to $1.01 per pack in 2009, and the average state excise tax increased from 32.7 cents per pack to $1.20 per pack during the same period.† These increases represent a 321% increase in the federal excise tax and a 267% increase in the average state excise tax since 1995. Price increases should be combined with other evidence-based policy and clinical
* For this report, DC is included among results for states.† The federal tax of $50.33 for cigarettes is levied per 1,000 cigarettes. When
calculated per pack of 20 cigarettes, this is $1.0066 per pack. For this study, this fractional tax is referred to as $1.01 per pack.
TABLE 2. Cross-reactive microneutralization (MN) antibody response to novel influenza A (H1N1) virus* in adult recipients of seasonal influenza vaccines
VaccineInfluenza season Influenza virus
Age group (yrs) No.
% with fourfold
or greater increase in antibody
titer†
% with MN titer of >160§
Geometric mean titer (GMT)¶
Prevac-cination
Postvac-cination
Prevaccination
(95% CI**)Postvaccination
(95% CI)
Postvac-cination to prevaccina-
tion ratio
TIV††
2007–08 A/Solomon Is/3/2006 18–64 134 74 28 92 48 (40–59) 561 (462–682) 12A/California/04/2009 19 9 25 28 (23–34) 53 (43–66) 2
2008–09 A/Brisbane/59/2007 18–40 83 78 20 88 29 (22–38) 546 (418–713) 19A/California/04/2009 12 6 7 11 (9–14) 21 (16–26) 2
2007–08 A/Solomon Is/3/2006 >60 63 54 14 54 31 (22–42) 143 (105–194) 5A/California/04/2009 3 33 43 92 (71–121) 97 (74–127) 1
* A/California/04/2009. † A fourfold or greater increase in antibody titer indicates seroconversion (a response to the vaccine). § A linear regression model was used to predict the MN titer for seasonal H1N1 viruses that corresponded to a hemagglutination inhibition (HI) antibody titer of 40. (Serum HI
antibody titers of 40 are associated with at least a 50% decrease in risk for influenza infection or disease [7]). In adult populations, an HI titer of 40 corresponds with an MN titer of >160.
¶ A titer of 1280 was used for all samples with a titer of >1280. The dilution of sera in the first well is based on the combination of a 1:10 serum dilution with an equal volume of diluted virus for a final serum dilution referred to as 1:10. In the statistical models, study participants were treated as random effects sampled from a larger population of study participants, and duplicate samples were treated as random effects nested within each study participant.
** Confidence interval. †† Trivalent, inactivated influenza vaccine.
Vol. 58 / No. 19 MMWR 525
interventions to meet HP2010 objectives to decrease smoking prevalence and reduce the burden from smoking-attributable death and disease.
Cigarettes and other tobacco products are taxed by federal, state, and local governments in various ways, including excise taxes, which are levied per unit, such as per pack of 20 ciga-rettes (2). Federal and state excise tax rates are set by legislation, are contained in federal and state statutes, and typically are collected before the point of sale (i.e., from manufacturers, wholesalers, or distributors), as denoted by a tax stamp.
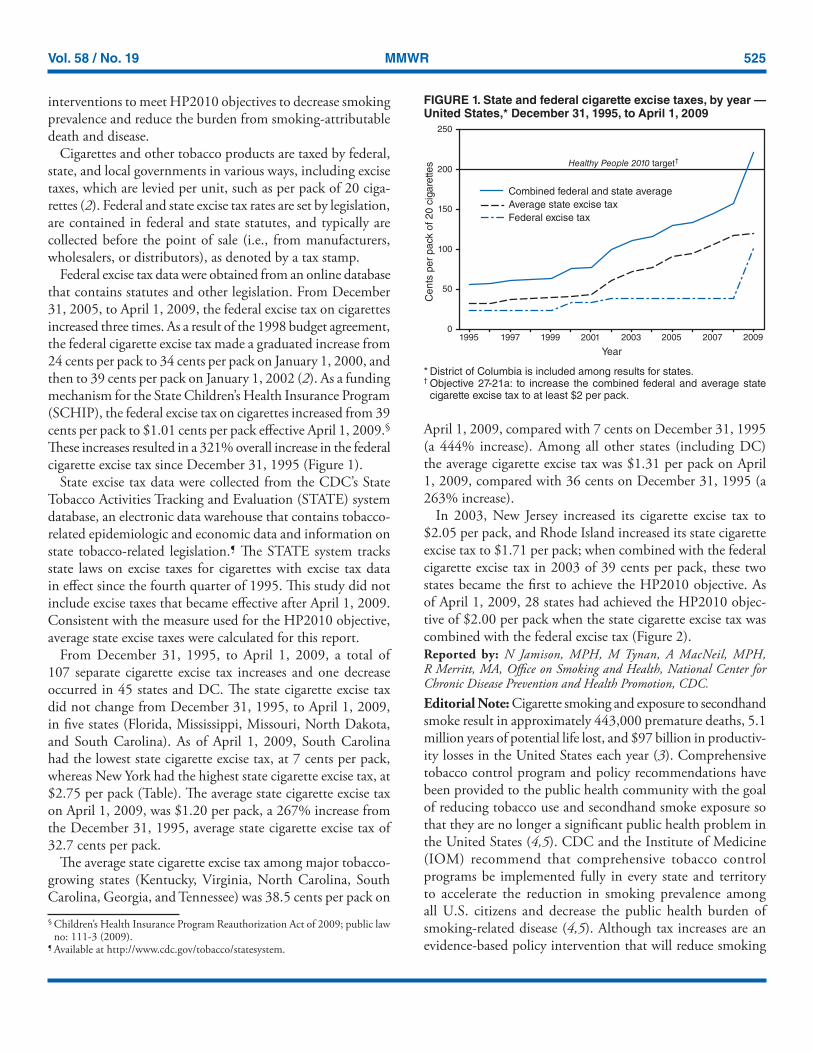
Federal excise tax data were obtained from an online database that contains statutes and other legislation. From December 31, 2005, to April 1, 2009, the federal excise tax on cigarettes increased three times. As a result of the 1998 budget agreement, the federal cigarette excise tax made a graduated increase from 24 cents per pack to 34 cents per pack on January 1, 2000, and then to 39 cents per pack on January 1, 2002 (2). As a funding mechanism for the State Children’s Health Insurance Program (SCHIP), the federal excise tax on cigarettes increased from 39 cents per pack to $1.01 cents per pack effective April 1, 2009.§ These increases resulted in a 321% overall increase in the federal cigarette excise tax since December 31, 1995 (Figure 1).
State excise tax data were collected from the CDC’s State Tobacco Activities Tracking and Evaluation (STATE) system database, an electronic data warehouse that contains tobacco-related epidemiologic and economic data and information on state tobacco-related legislation.¶ The STATE system tracks state laws on excise taxes for cigarettes with excise tax data in effect since the fourth quarter of 1995. This study did not include excise taxes that became effective after April 1, 2009. Consistent with the measure used for the HP2010 objective, average state excise taxes were calculated for this report.
From December 31, 1995, to April 1, 2009, a total of 107 separate cigarette excise tax increases and one decrease occurred in 45 states and DC. The state cigarette excise tax did not change from December 31, 1995, to April 1, 2009, in five states (Florida, Mississippi, Missouri, North Dakota, and South Carolina). As of April 1, 2009, South Carolina had the lowest state cigarette excise tax, at 7 cents per pack, whereas New York had the highest state cigarette excise tax, at $2.75 per pack (Table). The average state cigarette excise tax on April 1, 2009, was $1.20 per pack, a 267% increase from the December 31, 1995, average state cigarette excise tax of 32.7 cents per pack.
The average state cigarette excise tax among major tobacco-growing states (Kentucky, Virginia, North Carolina, South Carolina, Georgia, and Tennessee) was 38.5 cents per pack on
April 1, 2009, compared with 7 cents on December 31, 1995 (a 444% increase). Among all other states (including DC) the average cigarette excise tax was $1.31 per pack on April 1, 2009, compared with 36 cents on December 31, 1995 (a 263% increase).
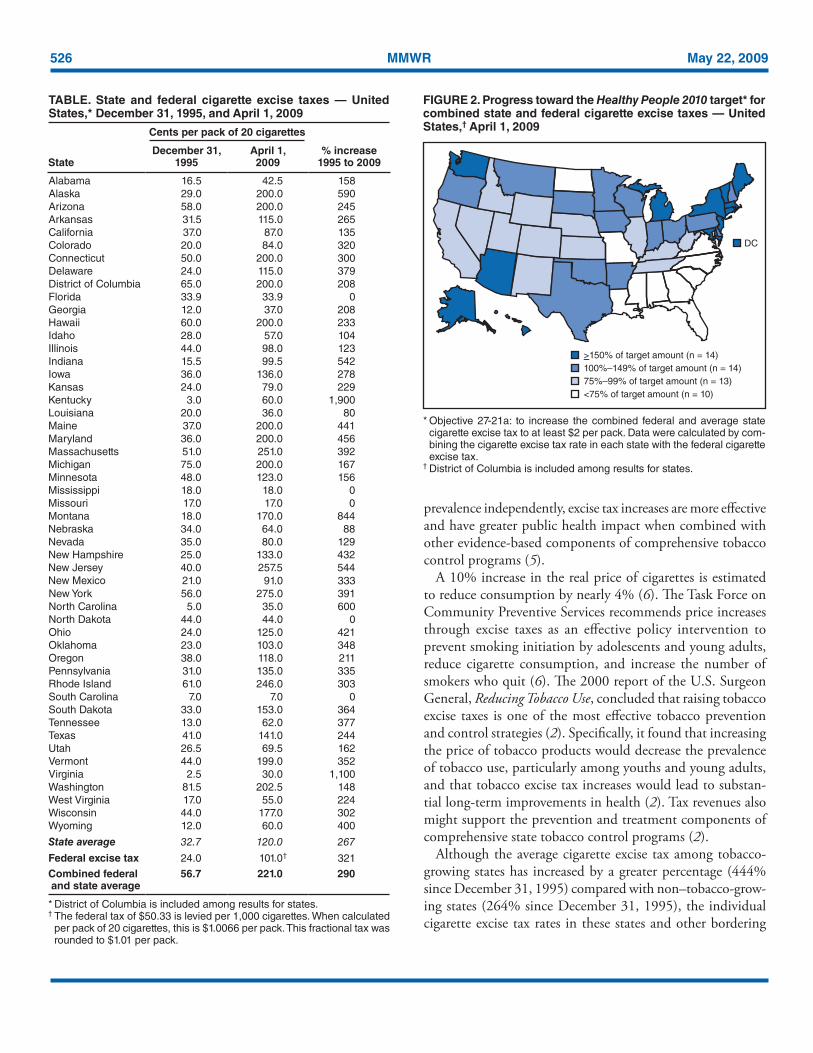
In 2003, New Jersey increased its cigarette excise tax to $2.05 per pack, and Rhode Island increased its state cigarette excise tax to $1.71 per pack; when combined with the federal cigarette excise tax in 2003 of 39 cents per pack, these two states became the first to achieve the HP2010 objective. As of April 1, 2009, 28 states had achieved the HP2010 objec-tive of $2.00 per pack when the state cigarette excise tax was combined with the federal excise tax (Figure 2).Reported by: N Jamison, MPH, M Tynan, A MacNeil, MPH, R Merritt, MA, Office on Smoking and Health, National Center for Chronic Disease Prevention and Health Promotion, CDC. Editorial Note: Cigarette smoking and exposure to secondhand smoke result in approximately 443,000 premature deaths, 5.1 million years of potential life lost, and $97 billion in productiv-ity losses in the United States each year (3). Comprehensive tobacco control program and policy recommendations have been provided to the public health community with the goal of reducing tobacco use and secondhand smoke exposure so that they are no longer a significant public health problem in the United States (4,5). CDC and the Institute of Medicine (IOM) recommend that comprehensive tobacco control programs be implemented fully in every state and territory to accelerate the reduction in smoking prevalence among all U.S. citizens and decrease the public health burden of smoking-related disease (4,5). Although tax increases are an evidence-based policy intervention that will reduce smoking
FIGURE 1. State and federal cigarette excise taxes, by year — United States,* December 31, 1995, to April 1, 2009
* District of Columbia is included among results for states.† Objective 27-21a: to increase the combined federal and average state
cigarette excise tax to at least $2 per pack.
0
50
100
150
200
250
1995 1997 1999 2001 2003 2005 2007 2009
Year
Ce
nts
pe
rp
ack
of
20
cig
are
tte
s
Average state excise tax
Federal excise tax
Combined federal and state average
Healthy People 2010 target†
§ Children’s Health Insurance Program Reauthorization Act of 2009; public law no: 111-3 (2009).
¶ Available at http://www.cdc.gov/tobacco/statesystem.
526 MMWR May 22, 2009
prevalence independently, excise tax increases are more effective and have greater public health impact when combined with other evidence-based components of comprehensive tobacco control programs (5).
A 10% increase in the real price of cigarettes is estimated to reduce consumption by nearly 4% (6). The Task Force on Community Preventive Services recommends price increases through excise taxes as an effective policy intervention to prevent smoking initiation by adolescents and young adults, reduce cigarette consumption, and increase the number of smokers who quit (6). The 2000 report of the U.S. Surgeon General, Reducing Tobacco Use, concluded that raising tobacco excise taxes is one of the most effective tobacco prevention and control strategies (2). Specifically, it found that increasing the price of tobacco products would decrease the prevalence of tobacco use, particularly among youths and young adults, and that tobacco excise tax increases would lead to substan-tial long-term improvements in health (2). Tax revenues also might support the prevention and treatment components of comprehensive state tobacco control programs (2).
Although the average cigarette excise tax among tobacco-growing states has increased by a greater percentage (444% since December 31, 1995) compared with non–tobacco-grow-ing states (264% since December 31, 1995), the individual cigarette excise tax rates in these states and other bordering
TABLE. State and federal cigarette excise taxes — United States,* December 31, 1995, and April 1, 2009
Cents per pack of 20 cigarettes
% increase 1995 to 2009State
December 31, 1995
April 1, 2009
Alabama 16.5 42.5 158Alaska 29.0 200.0 590Arizona 58.0 200.0 245Arkansas 31.5 115.0 265California 37.0 87.0 135Colorado 20.0 84.0 320Connecticut 50.0 200.0 300Delaware 24.0 115.0 379District of Columbia 65.0 200.0 208Florida 33.9 33.9 0Georgia 12.0 37.0 208Hawaii 60.0 200.0 233Idaho 28.0 57.0 104Illinois 44.0 98.0 123Indiana 15.5 99.5 542Iowa 36.0 136.0 278Kansas 24.0 79.0 229Kentucky 3.0 60.0 1,900Louisiana 20.0 36.0 80Maine 37.0 200.0 441Maryland 36.0 200.0 456Massachusetts 51.0 251.0 392Michigan 75.0 200.0 167Minnesota 48.0 123.0 156Mississippi 18.0 18.0 0Missouri 17.0 17.0 0Montana 18.0 170.0 844Nebraska 34.0 64.0 88Nevada 35.0 80.0 129New Hampshire 25.0 133.0 432New Jersey 40.0 257.5 544New Mexico 21.0 91.0 333New York 56.0 275.0 391North Carolina 5.0 35.0 600North Dakota 44.0 44.0 0Ohio 24.0 125.0 421Oklahoma 23.0 103.0 348Oregon 38.0 118.0 211Pennsylvania 31.0 135.0 335Rhode Island 61.0 246.0 303South Carolina 7.0 7.0 0South Dakota 33.0 153.0 364Tennessee 13.0 62.0 377Texas 41.0 141.0 244Utah 26.5 69.5 162Vermont 44.0 199.0 352Virginia 2.5 30.0 1,100Washington 81.5 202.5 148West Virginia 17.0 55.0 224Wisconsin 44.0 177.0 302Wyoming 12.0 60.0 400
State average 32.7 120.0 267
Federal excise tax 24.0 101.0† 321
Combined federal and state average
56.7 221.0 290
* District of Columbia is included among results for states.† The federal tax of $50.33 is levied per 1,000 cigarettes. When calculated
per pack of 20 cigarettes, this is $1.0066 per pack. This fractional tax was rounded to $1.01 per pack.
FIGURE 2. Progress toward the Healthy People 2010 target* for combined state and federal cigarette excise taxes — United States,† April 1, 2009
* Objective 27-21a: to increase the combined federal and average state cigarette excise tax to at least $2 per pack. Data were calculated by com-bining the cigarette excise tax rate in each state with the federal cigarette excise tax.
† District of Columbia is included among results for states.
>150% of target amount (n = 14)
100%–149% of target amount (n = 14)
75%–99% of target amount (n = 13)
<75% of target amount (n = 10)
DC
Vol. 58 / No. 19 MMWR 527
southeastern states remain substantially lower than the rest of the country (Figure 2). In addition to having lower excise taxes, these states typically do not have strong statewide tobacco control policies, such as laws that would protect the public from secondhand smoke exposure in worksites, restaurants, and bars.
Persons in lower-income groups usually smoke more, mean-ing they expend a greater share of their income to cigarette excise taxes than other socioeconomic groups (2,7,8). Cigarette excise taxes increase the purchase price of cigarettes and can pose a disproportionate economic burden on lower socioeconomic populations (7–9). However, because low-income groups are more responsive to price increases, increasing the real price of cigarettes can reduce cigarette consumption among low-income smokers by a greater percentage than among higher-income smokers, and thereby diminish socioeconomic smoking dis-parities (7–9). As excise tax increases diminish these smoking disparities, they potentially reduce disparities in morbidity and life expectancy (9). In addition to gaining health benefits attributable to quitting, groups with lower incomes will spend less on cigarettes and more resources will be available to spend on food, housing, and other goods (7).
The findings in this report are subject to at least three limita-tions. First, the STATE system only collects state-level excise tax data; it does not reflect city, county, or other local excise tax or any state or local sales tax that might be in place in some jurisdictions. Although not included in this study, at least 460 local communities impose a local tax on cigarettes, including New York City ($1.50 per pack) and Chicago-Cook County ($2.68 per pack) (10). Second, HP2010 objective 27-21a mea-sures the simple mean of the legislated excise tax in states, not a weighted average that reflects relevant factors such as smoking rate, population size, and demographics. Finally, the excise tax amounts presented in this report, including the HP2010 target of $2, are not adjusted for inflation. Had the HP2010 goal been required to have the buying power of $2.00 when the objectives were published in 2000, the inflation-adjusted goal on April 1, 2009, would be approximately $2.47.**
Increases in state and federal cigarette excise taxes per pack since 1995 have provided an important contribution to pre-venting tobacco use and promoting cessation. IOM concluded that because excise taxes place a disproportionate burden on lower-income smokers, revenue from excise tax increases should be coupled with existing governmental financing to support cessation programs and services, especially for lower-income smokers. Telephone-based tobacco-use quitlines are an example of existing cessation services that might be expanded using
excise tax revenue. Quitlines are a free, evidence-based cessa-tion service currently available to all populations in every state and DC through a toll-free access number (800-QUIT-NOW [800-784-8669]). IOM further recommends that states dedi-cate a portion of their tobacco excise tax revenue by statute, if constitutionally permissible, to fund state tobacco control pro-grams at levels recommended by CDC (5). If every state were to fund their tobacco control programs at the level of investment recommended by CDC in its Best Practices for Comprehensive Tobacco Control Programs — 2007, in 5 years an estimated 5 million fewer persons in the United States would smoke, and hundreds of thousands of premature tobacco-related deaths would be prevented each year (4).
AcknowledgmentThis report is based, in part, on contributions by R Patrick, JD, C
Holmes, SS Eidson, JD, and L Lineberger, MayaTech Corporation, Silver Spring, Maryland; and T Pechacek, PhD, Office on Smoking and Health, National Center for Chronic Disease Prevention and Health Promotion, CDC.
References 1. US Department of Health and Human Services. Healthy People 2010,
2nd ed. With understanding and improving health and objectives for improving health (2 vols.). Washington, DC: US Department of Health and Human Services; 2000. Available at http://www.healthypeople.gov.
2. CDC. Reducing tobacco use: a report of the Surgeon General. Atlanta, GA: US Department of Health and Human Services, CDC; 2000. Available at http://www.cdc.gov/tobacco/data_statistics/sgr/sgr_2000/index.htm.
3. CDC. Smoking-attributable mortality, years of potential life lost, and productivity losses—United States, 2000–2004. MMWR 2008;57:1226–8.
4. CDC. Best practices for comprehensive tobacco control pro-grams—2007. Atlanta, GA: US Department of Health and Human Services, CDC; 2007. Available at http://www.cdc.gov/tobacco/tobacco_control_programs/stateandcommunity/best_practices.
5. Institute of Medicine. Ending the tobacco problem: a blueprint for the nation. Washington, DC: The National Academies Press; 2007.
6. Task Force on Community Preventive Services. Guide to community preventive services: tobacco use prevention and control. Am J Prev Med 2001;20(2 Suppl 1):1–87.
7. Ross H, Chaloupka FJ. Economic policies for tobacco control in devel-oping countries. Salud Publica Mex 2006;48(Suppl 1):S113–20.
8. Warner KE, Chaloupka FJ, Cook PJ, et al. Criteria for determining an optimal cigarette tax: the economist’s perspective. Tob Control 1995;4:380–6.
9. Siahpush M, Wakefiled MA, Spittal MJ, Durkin SJ, Scollo MM. Taxation reduces social disparities in adult smoking prevalence. Am J Prev Med 2009;36:285–91.
10. Boonn A. Top combined state-local cigarette tax rates. Campaign for Tobacco-Free Kids fact sheet. Available at http://www.tobaccofreekids.org/research/factsheets/pdf/0267.pdf.
**Based on calculation using the Bureau of Labor Statistics Consumer Price Index inflation calculator, available at http://data.bls.gov/cgi-bin/cpicalc.pl.
528 MMWR May 22, 2009
Health Warnings on Tobacco Products — Worldwide, 2007
Many countries require that tobacco product* packaging includes health warnings about the risks associated with tobacco use (1–3). Health warnings on tobacco product pack-ages are effective in highlighting the perception of health risk (4), supporting the intention to quit tobacco use (5), discourag-ing the intention to begin tobacco use, and increasing cessation rates (6). Prominent displays of health warnings increase their effectiveness; larger warnings, with pictures, are more likely to be noticed, better communicate health risks, provoke greater emotional response, and further motivate tobacco users to quit (7–9). This report assesses the current status of tobacco pack-aging health warning requirements worldwide. Governments could further discourage tobacco use by requiring prominent health warnings on tobacco packaging.
Placing health warnings on tobacco product packages was one of the key evidence-based interventions included in the World Health Organization Framework Convention on Tobacco Control (WHO-FCTC) (2), the first public health treaty negotiated under WHO auspices, which was adopted in 2005. Within 3 years, participating countries agreed to implement health warnings describing the harmful effects of all tobacco products. Article 11 (Packaging and labeling of tobacco products) of WHO-FCTC requires government bodies such as ministries of health to approve and ensure the display of large, clear, visible, and legible warnings on at least 30%, and preferably 50% or more, of the principal display area of tobacco packages.
In early 2007, WHO’s Tobacco Free Initiative collected information about legally mandated use of tobacco health warnings through a questionnaire distributed to all 193 WHO member states and one territory. Data specific to health warn-ings were collected for seven criteria: 1) mandate of specific tobacco use health warnings; 2) inclusion of health warnings on tobacco packs and outside packaging; 3) use of large, clear, and visible health warnings; 4) rotation of health warnings; 5) use of the principal languages of the country; 6) inclusion of pictorial warnings; and 7) descriptions of specific harmful effects of tobacco use in health.
National data collectors were appointed by ministries of health and local WHO offices in each country to complete the questionnaire; regional data collectors, appointed for each of the six WHO regional offices, verified the accuracy and completeness of the data. The regional data collectors in turn submitted the data for further processing and analysis to the
Tobacco Free Initiative. The results were validated by each of the member states and then published in 2008 (1).
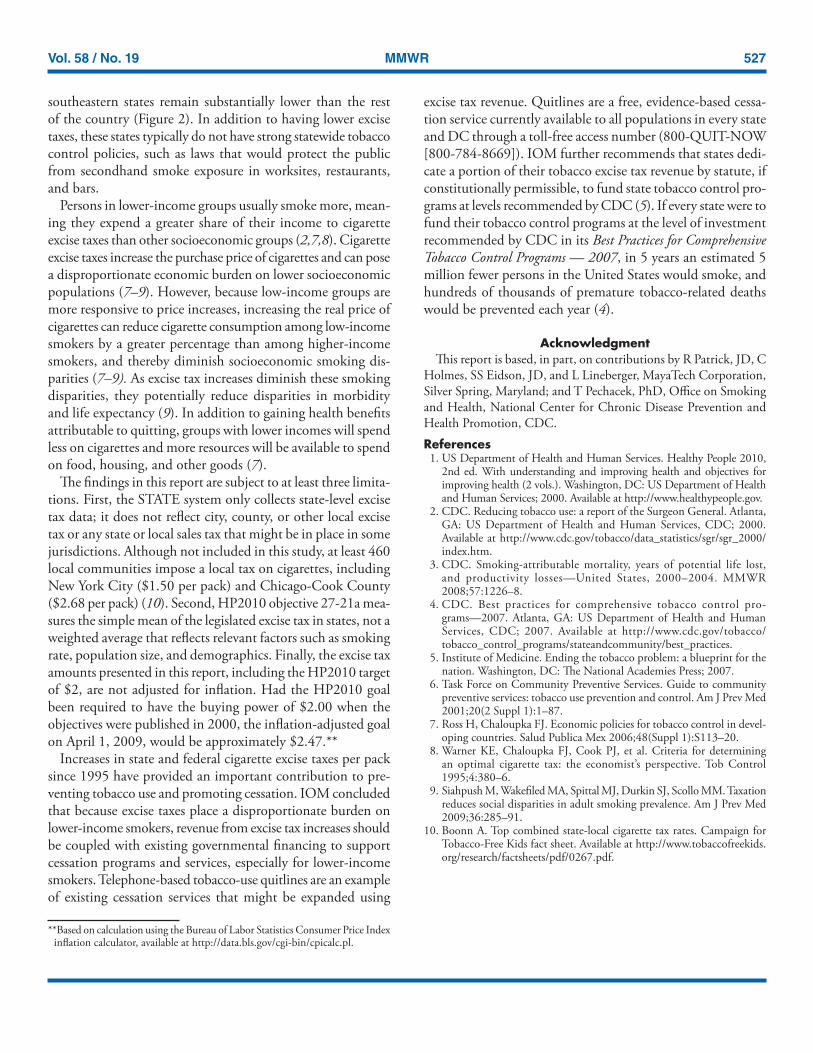
Data reported from 176 member states indicated that 77 (44%) did not require any warnings on cigarette packs, and 71 (40%) required warnings covering less than 30% of the principal display area. Among the member states, 23 (13%) had warnings that covered at least 30% of the main package display area and included one of the seven warning criteria. Five coun-tries (Australia, Brazil, Canada, Thailand, and Uruguay) (3%) had warnings that covered 50% or more of the principal display areas and included all seven criteria. Among the 176 countries, 15 (9%) required pictorial warnings, and 66 (38%) countries had laws that ban the use of deceptive marketing terms (such as “light” and “mild”) that falsely convey that a particular product is less harmful than other tobacco products.
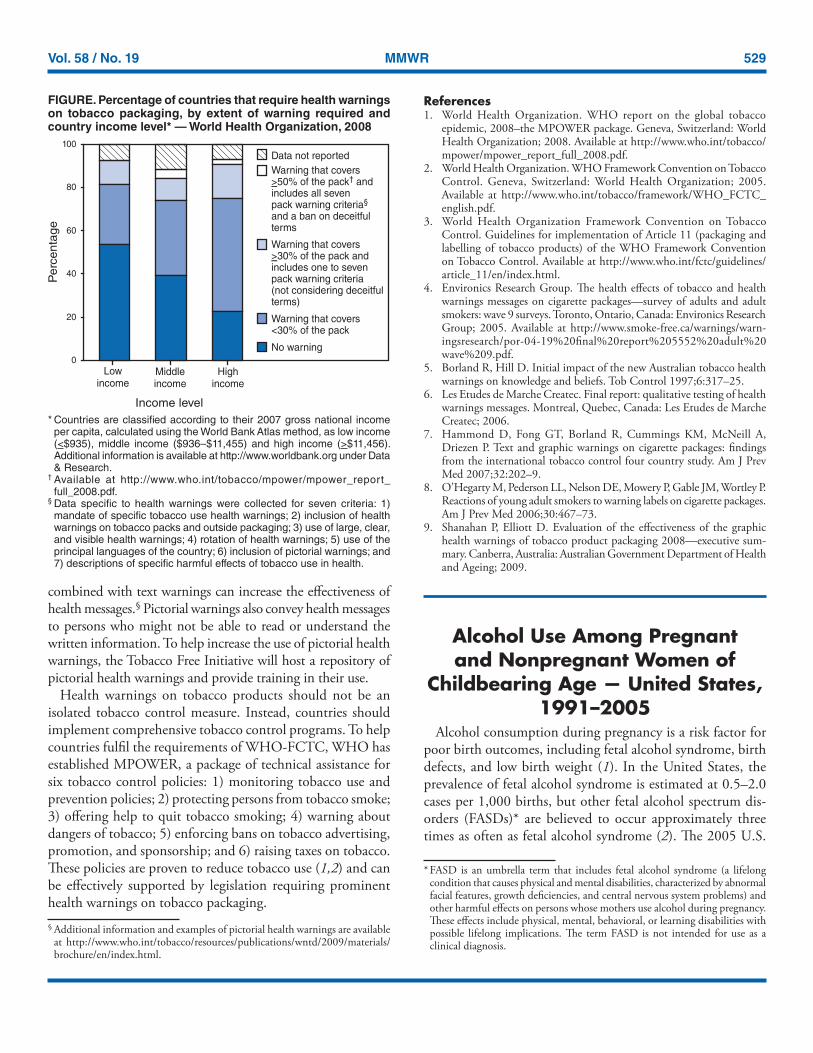
The percentage of member states that had no warnings or warnings that covered less than 30% of the principal package display area was high across all WHO regions: African Region (88%), American Region (74%), Eastern Mediterranean Region (82%), European Region (92%), South East Asia Region (82%), and the Western Pacific Region (71%). The level of implementation of health warnings was associated with a nation’s economic status.† Approximately 58% of low-income countries, 45% of middle-income countries, and 24% of high-income countries had not implemented any health warnings (Figure). Reported by: Tobacco Free Initiative, World Health Organization, Geneva, Switzerland. Editorial Note: Guidelines for implementation of Article 11 were adopted in November 2008 to assist countries in meet-ing their WHO-FCTC obligations. These guidelines propose that national authorities approve regulations that require warnings on display areas of tobacco packaging that are of size and characteristics that will enhance the effectiveness of health warnings (3).
Governments can use cigarette packaging to raise awareness among smokers and nonsmokers about the health risks of tobacco use. Health warnings provide countries with a relatively inexpensive method of informing consumers about the risks of smoking (7). However, findings from WHO’s Tobacco Free Initiative indicate that the strategy of placing health warnings on tobacco packaging has been implemented comprehensively in only a few countries.
Countries can require that packaging include larger health warnings, effective text, and pictures. Pictorial warnings
* Products entirely or partly made of leaf tobacco and intended for smoking, sucking, chewing, or snuffing.
† For this report, countries are classified according to their 2007 gross national income per capita, calculated using the World Bank Atlas method, as low income (<$935), middle income ($936–$11,455) and high income (>$11,456). Additional information is available at http://www.worldbank.org under Data & Research.
Vol. 58 / No. 19 MMWR 529
combined with text warnings can increase the effectiveness of health messages.§ Pictorial warnings also convey health messages to persons who might not be able to read or understand the written information. To help increase the use of pictorial health warnings, the Tobacco Free Initiative will host a repository of pictorial health warnings and provide training in their use.
Health warnings on tobacco products should not be an isolated tobacco control measure. Instead, countries should implement comprehensive tobacco control programs. To help countries fulfil the requirements of WHO-FCTC, WHO has established MPOWER, a package of technical assistance for six tobacco control policies: 1) monitoring tobacco use and prevention policies; 2) protecting persons from tobacco smoke; 3) offering help to quit tobacco smoking; 4) warning about dangers of tobacco; 5) enforcing bans on tobacco advertising, promotion, and sponsorship; and 6) raising taxes on tobacco. These policies are proven to reduce tobacco use (1,2) and can be effectively supported by legislation requiring prominent health warnings on tobacco packaging.
References 1. World Health Organization. WHO report on the global tobacco
epidemic, 2008–the MPOWER package. Geneva, Switzerland: World Health Organization; 2008. Available at http://www.who.int/tobacco/mpower/mpower_report_full_2008.pdf.
2. World Health Organization. WHO Framework Convention on Tobacco Control. Geneva, Switzerland: World Health Organization; 2005. Available at http://www.who.int/tobacco/framework/WHO_FCTC_english.pdf.
3. World Health Organization Framework Convention on Tobacco Control. Guidelines for implementation of Article 11 (packaging and labelling of tobacco products) of the WHO Framework Convention on Tobacco Control. Available at http://www.who.int/fctc/guidelines/article_11/en/index.html.
4. Environics Research Group. The health effects of tobacco and health warnings messages on cigarette packages—survey of adults and adult smokers: wave 9 surveys. Toronto, Ontario, Canada: Environics Research Group; 2005. Available at http://www.smoke-free.ca/warnings/warn-ingsresearch/por-04-19%20final%20report%205552%20adult%20wave%209.pdf.
5. Borland R, Hill D. Initial impact of the new Australian tobacco health warnings on knowledge and beliefs. Tob Control 1997;6:317–25.
6. Les Etudes de Marche Createc. Final report: qualitative testing of health warnings messages. Montreal, Quebec, Canada: Les Etudes de Marche Createc; 2006.
7. Hammond D, Fong GT, Borland R, Cummings KM, McNeill A, Driezen P. Text and graphic warnings on cigarette packages: findings from the international tobacco control four country study. Am J Prev Med 2007;32:202–9.
8. O’Hegarty M, Pederson LL, Nelson DE, Mowery P, Gable JM, Wortley P. Reactions of young adult smokers to warning labels on cigarette packages. Am J Prev Med 2006;30:467–73.
9. Shanahan P, Elliott D. Evaluation of the effectiveness of the graphic health warnings of tobacco product packaging 2008—executive sum-mary. Canberra, Australia: Australian Government Department of Health and Ageing; 2009.
Alcohol Use Among Pregnant and Nonpregnant Women of
Childbearing Age — United States, 1991–2005
Alcohol consumption during pregnancy is a risk factor for poor birth outcomes, including fetal alcohol syndrome, birth defects, and low birth weight (1). In the United States, the prevalence of fetal alcohol syndrome is estimated at 0.5–2.0 cases per 1,000 births, but other fetal alcohol spectrum dis-orders (FASDs)* are believed to occur approximately three times as often as fetal alcohol syndrome (2). The 2005 U.S.
FIGURE. Percentage of countries that require health warnings on tobacco packaging, by extent of warning required and country income level* — World Health Organization, 2008
* Countries are classified according to their 2007 gross national income per capita, calculated using the World Bank Atlas method, as low income (<$935), middle income ($936–$11,455) and high income (>$11,456). Additional information is available at http://www.worldbank.org under Data & Research.
† Available at http://www.who.int/tobacco/mpower/mpower_report_full_2008.pdf.
§ Data specific to health warnings were collected for seven criteria: 1) mandate of specific tobacco use health warnings; 2) inclusion of health warnings on tobacco packs and outside packaging; 3) use of large, clear, and visible health warnings; 4) rotation of health warnings; 5) use of the principal languages of the country; 6) inclusion of pictorial warnings; and 7) descriptions of specific harmful effects of tobacco use in health.
Highincome
0
20
40
60
80
100
Middleincome
Lowincome
Pe
rce
nta
ge
Income level
Data not reported
No warning
Warning that covers<30% of the pack
Warning that covers30% of the> pack and
includes one to sevenpack warning criteria(not considering deceitfulterms)
Warning that covers50% of the> pack and
includes all sevenpack warning criteriaand a ban on deceitfulterms
†
§
* FASD is an umbrella term that includes fetal alcohol syndrome (a lifelong condition that causes physical and mental disabilities, characterized by abnormal facial features, growth deficiencies, and central nervous system problems) and other harmful effects on persons whose mothers use alcohol during pregnancy. These effects include physical, mental, behavioral, or learning disabilities with possible lifelong implications. The term FASD is not intended for use as a clinical diagnosis.
§ Additional information and examples of pictorial health warnings are available at http://www.who.int/tobacco/resources/publications/wntd/2009/materials/brochure/en/index.html.
530 MMWR May 22, 2009
Surgeon General’s advisory on alcohol use in pregnancy, advises women who are pregnant or considering becoming pregnant to abstain from using alcohol (2). Binge drinking is particularly harmful to fetal brain development (2,3). Healthy People 2010 objectives include increasing the percentage of pregnant women who report abstinence from alcohol use to 95% and increasing the percentage who report abstinence from binge drinking to 100% (4). To examine the prevalence of any alcohol use and binge drinking among pregnant women and nonpregnant women of childbearing age in the United States and to characterize the women with these alcohol use behaviors, CDC analyzed 1991–2005 data from Behavioral Risk Factor Surveillance System (BRFSS) surveys. The find-ings indicated that the prevalence of any alcohol use and binge drinking among pregnant and nonpregnant women of childbearing age did not change substantially from 1991 to 2005. During 2001–2005, the highest percentages of preg-nant women reporting any alcohol use were aged 35–44 years (17.7%), college graduates (14.4%), employed (13.7%), and unmarried (13.4%). Health-care providers should ask women of childbearing age about alcohol use routinely, inform them of the risks from drinking alcohol while pregnant, and advise them not to drink alcohol while pregnant or if they might become pregnant (2,5).
BRFSS conducts state-based, random-digit–dialed telephone surveys of the noninstitutionalized U.S. civilian population aged >18 years, collecting data on health conditions and health risk behaviors. For this report, CDC analyzed BRFSS data from 1991 to 2005 from all 50 states and the District of Columbia for women aged 18–44 years. The median response rate among states, based on Council of American Survey and Research Organizations (CASRO) guidelines, ranged from 71.4% in 1993 to 51.1% in 2005. This report focuses on two drinking behaviors: any use, defined as having at least one drink of any alcoholic beverage in the past 30 days, and binge drinking, defined as having five or more drinks on at least one occasion in the past 30 days.† The wording of the question regarding any alcohol use was changed in 1993, 2001, and 2005,§ the word-ing of the question regarding binge drinking was changed in
1993 and 2001.¶ BRFSS questionnaires are available at http://www.cdc.gov/brfss/questionnaires/questionnaires.htm.
Percentage estimates and 95% confidence intervals were calculated each year for the two drinking behaviors among pregnant and nonpregnant women. Logistic regression was used to examine the association of age, race/ethnicity, educa-tion, employment, and marital status with the two drinking behaviors for pregnant and nonpregnant women with the behaviors as the dependent variables and sociodemographic characteristics as the independent variables in the models. Adjusted odds ratios (AORs) were calculated to describe significant differences by characteristic category. Data from 2001–2005 were aggregated to provide stable estimates to assess the association of these characteristics with the drinking behaviors. Data were weighted to state population estimates and aggregated to represent a nationwide estimate.
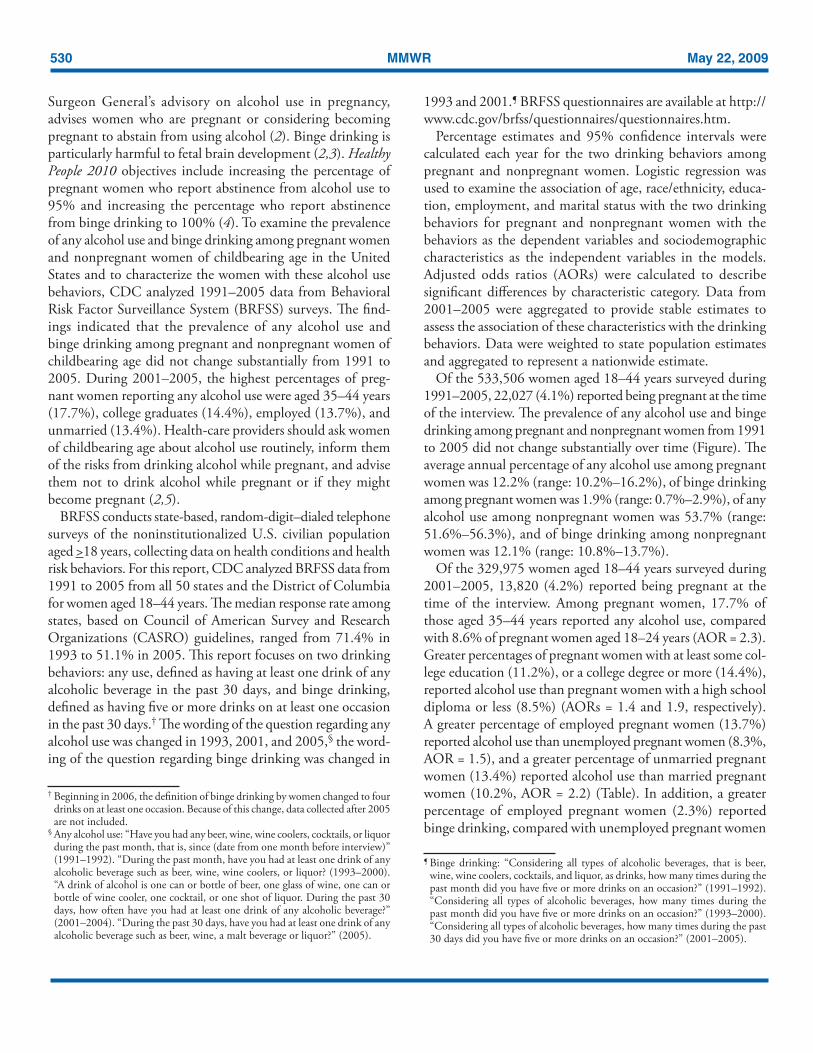
Of the 533,506 women aged 18–44 years surveyed during 1991–2005, 22,027 (4.1%) reported being pregnant at the time of the interview. The prevalence of any alcohol use and binge drinking among pregnant and nonpregnant women from 1991 to 2005 did not change substantially over time (Figure). The average annual percentage of any alcohol use among pregnant women was 12.2% (range: 10.2%–16.2%), of binge drinking among pregnant women was 1.9% (range: 0.7%–2.9%), of any alcohol use among nonpregnant women was 53.7% (range: 51.6%–56.3%), and of binge drinking among nonpregnant women was 12.1% (range: 10.8%–13.7%).
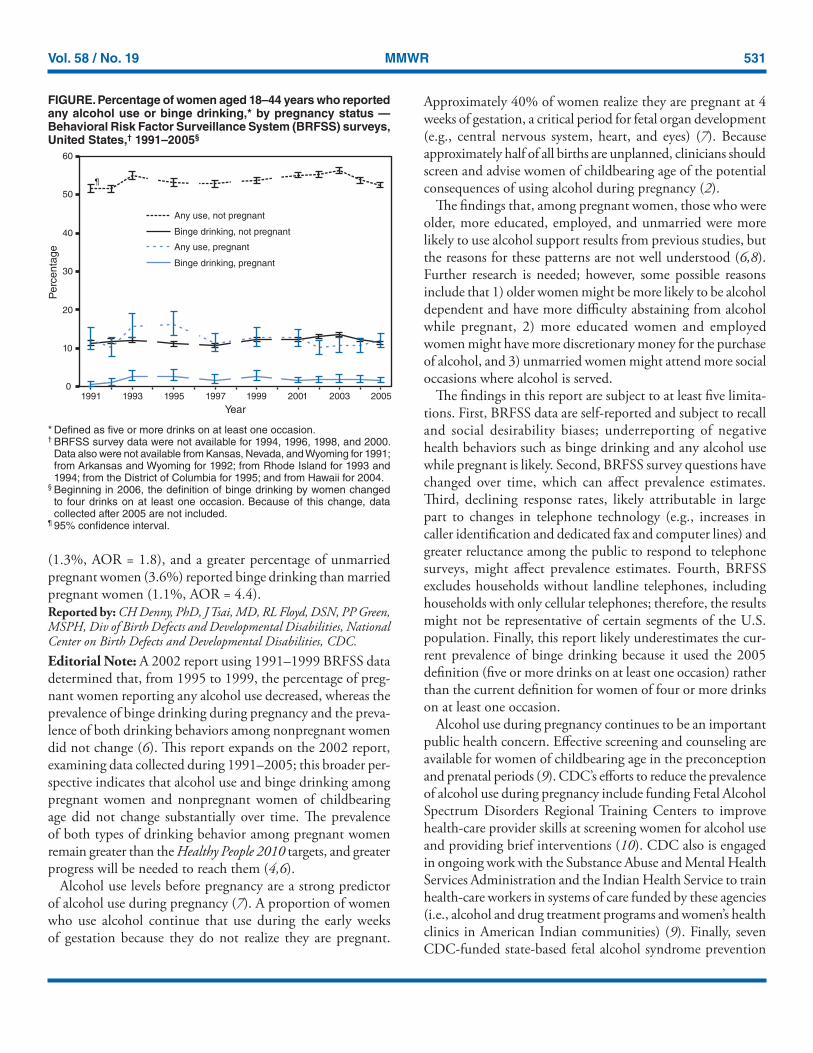
Of the 329,975 women aged 18–44 years surveyed during 2001–2005, 13,820 (4.2%) reported being pregnant at the time of the interview. Among pregnant women, 17.7% of those aged 35–44 years reported any alcohol use, compared with 8.6% of pregnant women aged 18–24 years (AOR = 2.3). Greater percentages of pregnant women with at least some col-lege education (11.2%), or a college degree or more (14.4%), reported alcohol use than pregnant women with a high school diploma or less (8.5%) (AORs = 1.4 and 1.9, respectively). A greater percentage of employed pregnant women (13.7%) reported alcohol use than unemployed pregnant women (8.3%, AOR = 1.5), and a greater percentage of unmarried pregnant women (13.4%) reported alcohol use than married pregnant women (10.2%, AOR = 2.2) (Table). In addition, a greater percentage of employed pregnant women (2.3%) reported binge drinking, compared with unemployed pregnant women
† Beginning in 2006, the definition of binge drinking by women changed to four drinks on at least one occasion. Because of this change, data collected after 2005 are not included.
§ Any alcohol use: “Have you had any beer, wine, wine coolers, cocktails, or liquor during the past month, that is, since (date from one month before interview)” (1991–1992). “During the past month, have you had at least one drink of any alcoholic beverage such as beer, wine, wine coolers, or liquor? (1993–2000). “A drink of alcohol is one can or bottle of beer, one glass of wine, one can or bottle of wine cooler, one cocktail, or one shot of liquor. During the past 30 days, how often have you had at least one drink of any alcoholic beverage?” (2001–2004). “During the past 30 days, have you had at least one drink of any alcoholic beverage such as beer, wine, a malt beverage or liquor?” (2005).
¶ Binge drinking: “Considering all types of alcoholic beverages, that is beer, wine, wine coolers, cocktails, and liquor, as drinks, how many times during the past month did you have five or more drinks on an occasion?” (1991–1992). “Considering all types of alcoholic beverages, how many times during the past month did you have five or more drinks on an occasion?” (1993–2000). “Considering all types of alcoholic beverages, how many times during the past 30 days did you have five or more drinks on an occasion?” (2001–2005).
Vol. 58 / No. 19 MMWR 531
(1.3%, AOR = 1.8), and a greater percentage of unmarried pregnant women (3.6%) reported binge drinking than married pregnant women (1.1%, AOR = 4.4).Reported by: CH Denny, PhD, J Tsai, MD, RL Floyd, DSN, PP Green, MSPH, Div of Birth Defects and Developmental Disabilities, National Center on Birth Defects and Developmental Disabilities, CDC. Editorial Note: A 2002 report using 1991–1999 BRFSS data determined that, from 1995 to 1999, the percentage of preg-nant women reporting any alcohol use decreased, whereas the prevalence of binge drinking during pregnancy and the preva-lence of both drinking behaviors among nonpregnant women did not change (6). This report expands on the 2002 report, examining data collected during 1991–2005; this broader per-spective indicates that alcohol use and binge drinking among pregnant women and nonpregnant women of childbearing age did not change substantially over time. The prevalence of both types of drinking behavior among pregnant women remain greater than the Healthy People 2010 targets, and greater progress will be needed to reach them (4,6).
Alcohol use levels before pregnancy are a strong predictor of alcohol use during pregnancy (7). A proportion of women who use alcohol continue that use during the early weeks of gestation because they do not realize they are pregnant.
Approximately 40% of women realize they are pregnant at 4 weeks of gestation, a critical period for fetal organ development (e.g., central nervous system, heart, and eyes) (7). Because approximately half of all births are unplanned, clinicians should screen and advise women of childbearing age of the potential consequences of using alcohol during pregnancy (2).
The findings that, among pregnant women, those who were older, more educated, employed, and unmarried were more likely to use alcohol support results from previous studies, but the reasons for these patterns are not well understood (6,8). Further research is needed; however, some possible reasons include that 1) older women might be more likely to be alcohol dependent and have more difficulty abstaining from alcohol while pregnant, 2) more educated women and employed women might have more discretionary money for the purchase of alcohol, and 3) unmarried women might attend more social occasions where alcohol is served.
The findings in this report are subject to at least five limita-tions. First, BRFSS data are self-reported and subject to recall and social desirability biases; underreporting of negative health behaviors such as binge drinking and any alcohol use while pregnant is likely. Second, BRFSS survey questions have changed over time, which can affect prevalence estimates. Third, declining response rates, likely attributable in large part to changes in telephone technology (e.g., increases in caller identification and dedicated fax and computer lines) and greater reluctance among the public to respond to telephone surveys, might affect prevalence estimates. Fourth, BRFSS excludes households without landline telephones, including households with only cellular telephones; therefore, the results might not be representative of certain segments of the U.S. population. Finally, this report likely underestimates the cur-rent prevalence of binge drinking because it used the 2005 definition (five or more drinks on at least one occasion) rather than the current definition for women of four or more drinks on at least one occasion.
Alcohol use during pregnancy continues to be an important public health concern. Effective screening and counseling are available for women of childbearing age in the preconception and prenatal periods (9). CDC’s efforts to reduce the prevalence of alcohol use during pregnancy include funding Fetal Alcohol Spectrum Disorders Regional Training Centers to improve health-care provider skills at screening women for alcohol use and providing brief interventions (10). CDC also is engaged in ongoing work with the Substance Abuse and Mental Health Services Administration and the Indian Health Service to train health-care workers in systems of care funded by these agencies (i.e., alcohol and drug treatment programs and women’s health clinics in American Indian communities) (9). Finally, seven CDC-funded state-based fetal alcohol syndrome prevention
* Defined as five or more drinks on at least one occasion.† BRFSS survey data were not available for 1994, 1996, 1998, and 2000.
Data also were not available from Kansas, Nevada, and Wyoming for 1991; from Arkansas and Wyoming for 1992; from Rhode Island for 1993 and 1994; from the District of Columbia for 1995; and from Hawaii for 2004.
§ Beginning in 2006, the definition of binge drinking by women changed to four drinks on at least one occasion. Because of this change, data collected after 2005 are not included.
¶ 95% confidence interval.
FIGURE. Percentage of women aged 18–44 years who reported any alcohol use or binge drinking,* by pregnancy status — Behavioral Risk Factor Surveillance System (BRFSS) surveys, United States,† 1991–2005§
0
10
20
30
40
50
60
1991 1993 1995 1997 1999 2001 2003 2005Year
Perc
enta
ge
Any use, not pregnantBinge drinking, not pregnantAny use, pregnantBinge drinking, pregnant
¶
532 MMWR May 22, 2009
programs for women in high-risk geographic areas or high-risk subpopulations are completing work in developing, implementing, and evaluating population-based and targeted programs. These programs will provide valuable insights for CDC’s continuing efforts to reduce the prevalence of alcohol use during pregnancy.
AcknowledgmentThis report is based, in part, on data contributed by BRFSS state
coordinators and contributions by O Devine, PhD, National Center on Birth Defects and Developmental Disabilities, CDC.
References 1. Bailey BA, Sokol RJ. Pregnancy and alcohol use: evidence and recom-
mendations for prenatal care. Clin Obstet Gynecol 2008;51:436–44. 2. US Department of Health and Human Services. US Surgeon General
releases advisory on alcohol use in pregnancy. Washington, DC: US Department of Health and Human Services; 2005. Available at http://www.surgeongeneral.gov/pressreleases/sg02222005.html.
3. Maier SE, West JR. Drinking patterns and alcohol-related birth defects. Alcohol Res Health. 2001;25:168–74.
4. US Department of Health and Human Services. Healthy people 2010 midcourse review [objectives 16-17a, 16-17b]. Washington, DC: US Department of Health and Human Services; 2006. Available at http://www.healthypeople.gov/data/midcourse.
5. US Department of Health and Human Services and US Department of Agriculture. Dietary guidelines for Americans 2005. Washington, DC: US Department of Health and Human Services; 2005. Available at http://www.health.gov/dietaryguidelines/dga2005/document/default.htm.
6. CDC. Alcohol use among women of childbearing age—United States, 1991–1999. MMWR 2002;51:273–6.
7. Floyd RL, Decoufle P, Hungerford DW. Alcohol use prior to pregnancy recognition. Am J Prev Med 1999;17:101–7.
8. Haynes G, Dunnagan T, Christopher S. Determinants of alcohol use in pregnant women at risk for alcohol consumption. Neurotoxicol Teratol 2003;25:659–66.
9. Floyd RL, Sobell M, Velasquez MM, et al; Project CHOICES Efficacy Study Group. Preventing alcohol-exposed pregnancies: a randomized controlled trial. Am J Prev Med 2007;32:1–10.
10. FASD Regional Training Centers Consortium. Educating health pro-fessionals about fetal alcohol spectrum disorders. Am J Health Educ 2007;386:364–73.
Progressive Vaccinia in a Military Smallpox Vaccinee —
United States, 2009On May 19, this report was posted as an MMWR Early Release
on the MMWR website (http://www.cdc.gov/mmwr).Progressive vaccinia (PV), previously known as vaccinia
necrosum, vaccinia gangrenosum, or disseminated vaccinia, is a rare, often fatal adverse event after vaccination with smallpox vaccine, which is made from live vaccinia virus (1). During
TABLE. Estimated percentage* of women aged 18–44 years who reported any alcohol use or binge drinking,† by pregnancy status and selected characteristics — Behavioral Risk Factor Surveillance System (BRFSS) surveys, United States, 2001–2005§
Pregnant Nonpregnant
Any use Binge drinking Any use Binge drinking
Characteristic % AOR¶ 95% CI** % AOR 95% CI % AOR 95% CI % AOR 95% CI
Total 11.2 1.8 54.6 12.6Age group (yrs) 18–24 8.6 1.0 Referent 2.5 1.0 Referent 55.5 1.0 Referent 19.6 1.0 Referent 25–34 11.2 1.4 (1.1–1.7) 1.4 0.7 (0.4–1.2) 55.1 0.9 (0.9–0.9) 12.2 0.7 (0.7–0.8) 35–44 17.7 2.3 (1.7–3.0) 1.8 0.9 (0.5–1.6) 53.6 0.8 (0.8–0.9) 8.9 0.5 (0.5–0.5)Race/Ethnicity White, non-Hispanic 11.6 1.0 (0.8–1.4) 1.8 1.1 (0.6–2.0) 60.9 1.8 (1.7–1.9) 14.9 1.9 (1.7–2.0) Black, non-Hispanic 10.3 0.8 (0.5–1.1) 2.1 0.8 (0.4–1.6) 43.3 0.9 (0.8–0.9) 6.8 0.6 (0.6–0.7) Hispanic (any race) 10.2 1.0 Referent 1.7 1.0 Referent 41.1 1.0 Referent 8.9 1.0 Referent Other race, non-Hispanic 12.1 1.1 (0.7–1.7) 2.5 1.6 (0.7–3.6) 46.0 0.9 (0.9–1.0) 9.7 1.0 (0.9–1.2)Education High school diploma or less 8.5 1.0 Referent 1.8 1.0 Referent 43.1 1.0 Referent 11.6 1.0 Referent Some college 11.2 1.4 (1.1–1.8) 2.0 1.4 (0.8–2.3) 57.2 1.6 (1.6–1.7) 14.4 1.2 (1.1–1.2) College degree or more 14.4 1.9 (1.4–2.4) 1.8 1.8 (0.9–3.4) 66.3 2.4 (2.3–2.5) 12.0 1.1 (1.0–1.1)Employed Yes 13.7 1.5 (1.3–1.9) 2.3 1.8 (1.2–2.8) 59.1 1.5 (1.5–1.6) 13.5 1.4 (1.3–1.4) No 8.3 1.0 Referent 1.3 1.0 Referent 46.1 1.0 Referent 10.9 1.0 ReferentMarried Yes 10.2 1.0 Referent 1.1 1.0 Referent 52.6 1.0 Referent 8.4 1.0 Referent No 13.4 2.2 (1.7–2.7) 3.6 4.4 (2.4–8.0) 56.9 1.4 (1.3–1.4) 17.6 2.2 (2.1–2.2)
* Percentages weighted to represent the U.S. population. † Defined as five or more drinks on at least one occasion. § Beginning in 2006, the definition of binge drinking by women changed to four drinks on at least one occasion. Because of this change, data collected
after 2005 are not included. ¶ Adjusted odds ratio; model includes age, race/ethnicity, education, employment, and marital status. ** Confidence interval.
Vol. 58 / No. 19 MMWR 533
recent vaccination programs potential cases of PV were inves-tigated, but none met standard case definitions (2). PV has not been confirmed to have occurred in the United States since 1987 (3). On March 2, 2009, a U.S. Navy Hospital contacted the Poxvirus Program at CDC to report a possible case of PV in a male military smallpox vaccinee. The service member had been newly diagnosed with acute mylegenous leukemia M0 (AML M0). During evaluation for a chemotherapy-induced neutropenic fever, he was found to have an expanding and nonhealing painless vaccination site 6.5 weeks after receipt of smallpox vaccine. Clinical and laboratory investigation confirmed that the vaccinee met the Brighton Collaboration and CDC adverse event surveillance guideline case definition for PV (4,5). This report summarizes the patient’s protracted clinical course and the military and civilian interagency gov-ernmental, academic, and industry public health contributions to his complex medical management. The quantities of inves-tigational and licensed therapeutics and diagnostics used were greater than anticipated based on existing smallpox prepared-ness plans. To support future public health needs adequately, the estimated national supply of therapeutics and diagnostic resources required to care for smallpox vaccine adverse events should be reevaluated.
Case DescriptionOn January 13, 2009, a healthy service member aged 20
years received a primary smallpox vaccination (ACAM2000 [Acambis, Inc., Cambridge, Massachusetts]) in accordance with the U.S. Department of Defense smallpox vaccination policy*; no other vaccinations were administered that day. Twelve days later, the patient visited a local hospital with fever and headache of 1 day’s duration and was admitted for workup of leukopenia after his white blood cell count was found to be 1,400 cells/mm3. On January 28, after transfer to a U.S. Navy tertiary-care facility, he was diagnosed with AML M0. On January 30 and February 13, the patient underwent two successive rounds of induction chemotherapy with cytarabine, idarubicin, and dexamethasone. Before initial chemotherapy, the vaccination site pustule had a central crust and measured approximately 1 cm in diameter with minimal surrounding erythema. During the patient’s hospital stay from the end of January to the beginning of March, his vaccination site dress-ing was changed daily.
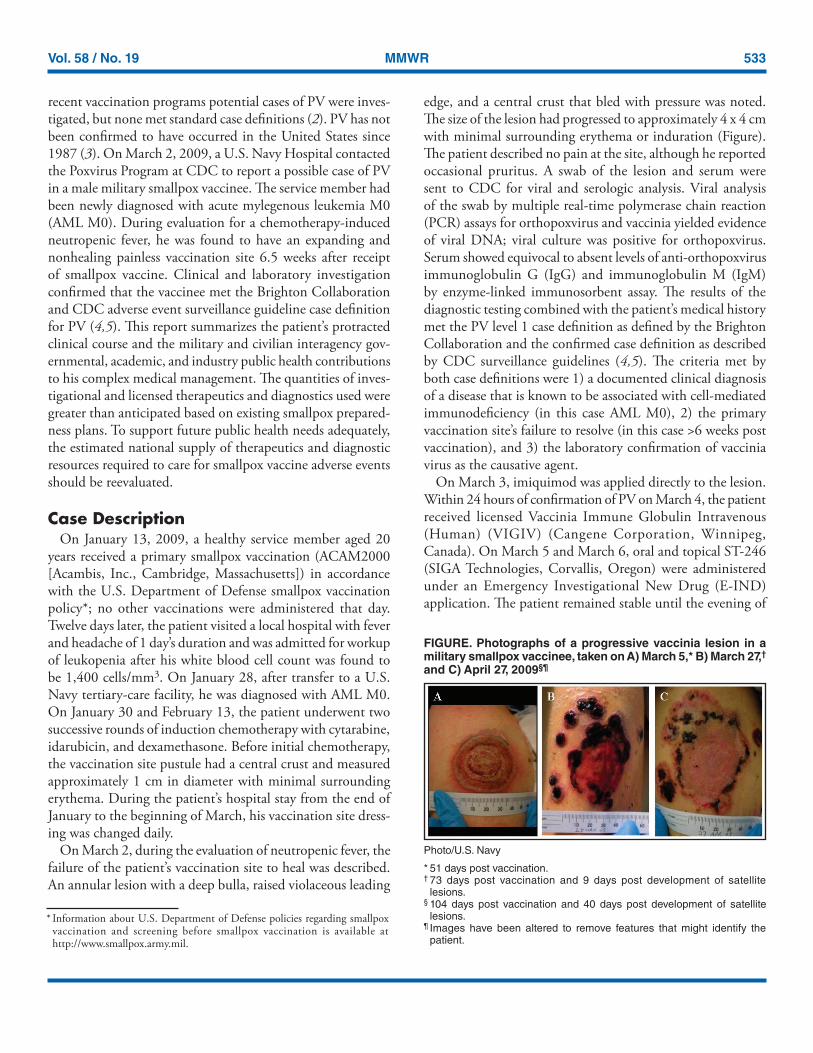
On March 2, during the evaluation of neutropenic fever, the failure of the patient’s vaccination site to heal was described. An annular lesion with a deep bulla, raised violaceous leading
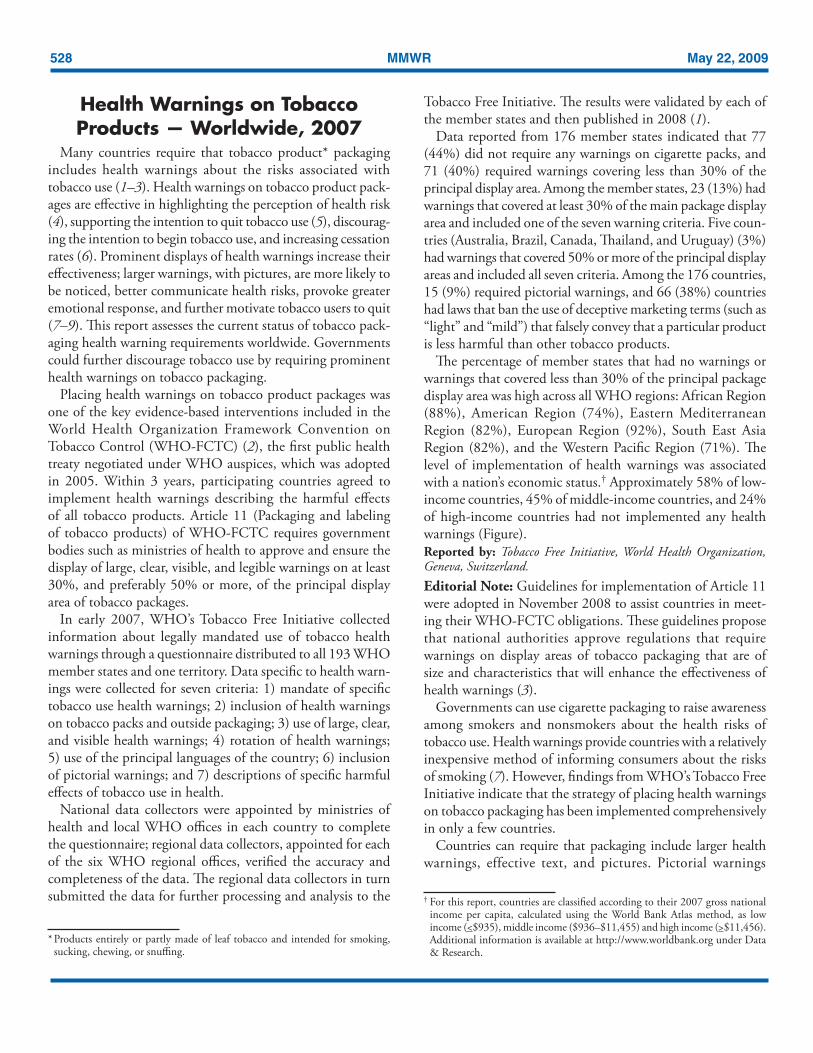
edge, and a central crust that bled with pressure was noted. The size of the lesion had progressed to approximately 4 x 4 cm with minimal surrounding erythema or induration (Figure). The patient described no pain at the site, although he reported occasional pruritus. A swab of the lesion and serum were sent to CDC for viral and serologic analysis. Viral analysis of the swab by multiple real-time polymerase chain reaction (PCR) assays for orthopoxvirus and vaccinia yielded evidence of viral DNA; viral culture was positive for orthopoxvirus. Serum showed equivocal to absent levels of anti-orthopoxvirus immunoglobulin G (IgG) and immunoglobulin M (IgM) by enzyme-linked immunosorbent assay. The results of the diagnostic testing combined with the patient’s medical history met the PV level 1 case definition as defined by the Brighton Collaboration and the confirmed case definition as described by CDC surveillance guidelines (4,5). The criteria met by both case definitions were 1) a documented clinical diagnosis of a disease that is known to be associated with cell-mediated immunodeficiency (in this case AML M0), 2) the primary vaccination site’s failure to resolve (in this case >6 weeks post vaccination), and 3) the laboratory confirmation of vaccinia virus as the causative agent.
On March 3, imiquimod was applied directly to the lesion. Within 24 hours of confirmation of PV on March 4, the patient received licensed Vaccinia Immune Globulin Intravenous (Human) (VIGIV) (Cangene Corporation, Winnipeg, Canada). On March 5 and March 6, oral and topical ST-246 (SIGA Technologies, Corvallis, Oregon) were administered under an Emergency Investigational New Drug (E-IND) application. The patient remained stable until the evening of
* Information about U.S. Department of Defense policies regarding smallpox vaccination and screening before smallpox vaccination is available at http://www.smallpox.army.mil.
FIGURE. Photographs of a progressive vaccinia lesion in a military smallpox vaccinee, taken on A) March 5,* B) March 27,†
and C) April 27, 2009§¶
* 51 days post vaccination.† 73 days post vaccination and 9 days post development of satellite
lesions.§ 104 days post vaccination and 40 days post development of satellite
lesions.¶ Images have been altered to remove features that might identify the
patient.
Photo/U.S. Navy
534 MMWR May 22, 2009
March 7, when he became septic with Pseudomonas aerugi-nosa, likely from a perirectal abscess. He required intubation, maximal vasopressor support, multiple antibiotics, and stress dose corticosteroids. He then developed multiorgan failure and began continuous venovenous hemodialysis. During the next 12 days, the patient slowly stabilized. As a consequence of the duration and amount of vasopressor support, the patient required a bilateral trans-tibial amputation because of dry gangrene of his feet.
During March 6–19, the patient received additional oral and topical ST-246 and VIGIV; his ST-246 levels were noted to be lower than those achieved both in healthy subjects in phase I clinical trials and in successful treatment of nonhuman primates with systemic orthopoxvirus disease. The lesion size remained unchanged, but the central crust of the vaccina-tion site sloughed off, followed by most of the outer “ring” flattening, leaving a shallow ulcer with healthy-appearing granulation tissue. During his steroid taper, additional satellite lesions surrounding the vaccination site appeared on March 18, and viral DNA was detected again in the blood. These lesions became vesicular in nature, and on March 26, after a second E-IND was issued, CMX001 (Chimerix, Inc., Research Triangle Park, North Carolina), a lipid conjugate of cidofovir, was administered.
From March 24 onward, the satellite and main vaccina-tion site lesions continued to crust, the scabs separated, and underlying tissue epithelialized (Figure). Blood viral DNA levels cleared on March 29. On April 10, the borders of lesions again appeared raised; a shave biopsy grew methicillin-resistant Staphylococcus aureus, which responded to antibiotic therapy. The patient received intermittent granulocyte colony-stim-ulating factor, and his absolute neutrophil and lymphocyte
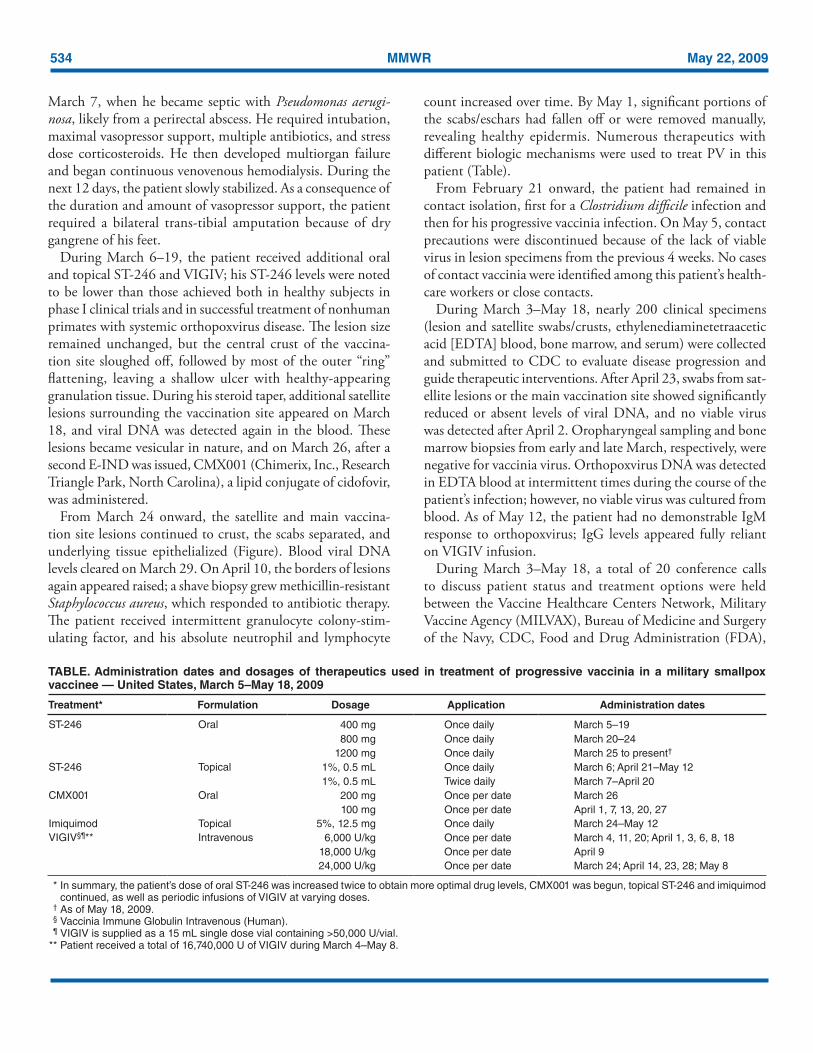
count increased over time. By May 1, significant portions of the scabs/eschars had fallen off or were removed manually, revealing healthy epidermis. Numerous therapeutics with different biologic mechanisms were used to treat PV in this patient (Table).
From February 21 onward, the patient had remained in contact isolation, first for a Clostridium difficile infection and then for his progressive vaccinia infection. On May 5, contact precautions were discontinued because of the lack of viable virus in lesion specimens from the previous 4 weeks. No cases of contact vaccinia were identified among this patient’s health-care workers or close contacts.
During March 3–May 18, nearly 200 clinical specimens (lesion and satellite swabs/crusts, ethylenediaminetetraacetic acid [EDTA] blood, bone marrow, and serum) were collected and submitted to CDC to evaluate disease progression and guide therapeutic interventions. After April 23, swabs from sat-ellite lesions or the main vaccination site showed significantly reduced or absent levels of viral DNA, and no viable virus was detected after April 2. Oropharyngeal sampling and bone marrow biopsies from early and late March, respectively, were negative for vaccinia virus. Orthopoxvirus DNA was detected in EDTA blood at intermittent times during the course of the patient’s infection; however, no viable virus was cultured from blood. As of May 12, the patient had no demonstrable IgM response to orthopoxvirus; IgG levels appeared fully reliant on VIGIV infusion.
During March 3–May 18, a total of 20 conference calls to discuss patient status and treatment options were held between the Vaccine Healthcare Centers Network, Military Vaccine Agency (MILVAX), Bureau of Medicine and Surgery of the Navy, CDC, Food and Drug Administration (FDA),
TABLE. Administration dates and dosages of therapeutics used in treatment of progressive vaccinia in a military smallpox vaccinee — United States, March 5–May 18, 2009
Treatment* Formulation Dosage Application Administration dates
ST-246 Oral 400 mg Once daily March 5–19800 mg Once daily March 20–24
1200 mg Once daily March 25 to present†
ST-246 Topical 1%, 0.5 mL Once daily March 6; April 21–May 121%, 0.5 mL Twice daily March 7–April 20
CMX001 Oral 200 mg Once per date March 26 100 mg Once per date April 1, 7, 13, 20, 27
Imiquimod Topical 5%, 12.5 mg Once daily March 24–May 12VIGIV§¶** Intravenous 6,000 U/kg Once per date March 4, 11, 20; April 1, 3, 6, 8, 18
18,000 U/kg Once per date April 924,000 U/kg Once per date March 24; April 14, 23, 28; May 8
* In summary, the patient’s dose of oral ST-246 was increased twice to obtain more optimal drug levels, CMX001 was begun, topical ST-246 and imiquimod continued, as well as periodic infusions of VIGIV at varying doses.
† As of May 18, 2009. § Vaccinia Immune Globulin Intravenous (Human). ¶ VIGIV is supplied as a 15 mL single dose vial containing >50,000 U/vial. ** Patient received a total of 16,740,000 U of VIGIV during March 4–May 8.

Vol. 58 / No. 19 MMWR 535
National Institutes of Health (NIH), SIGA Technologies, Chimerix, Inc., and academic and health-care profession-als. As of May 18, MILVAX provided 22 and the Strategic National Stockpile (SNS) provided 254 vials of VIGIV used in treatment of this case. Reported by: E Lederman, MD, H Groff, MD, T Warkentien, MD, A Reese, MD, US Naval Medical Center. D Hruby, PhD, T Bolken, D Grosenbach, PhD, S Yan, PhD, SIGA Technologies, Corvallis, Oregon. W Painter, MD, L Trost, MD, B Lampert, MD, Chimerix, Inc., Research Triangle Park, North Carolina. J Cohen, MD, National Institutes of Health; R Engler, MD, Walter Reed Vaccine Healthcare Center; W Davidson, MPH, S Smith, MS, K Wilkins, Z Braden, Y Li, PhD, I Damon, MD, Div of Viral and Rickettsial Diseases, National Center for Zoonotic, Vector-Borne, and Enteric Diseases, CDC.Editorial Note: Although PV is a rare adverse event (one case per million during routine vaccination during 1963–1968), its case fatality rate in primary U.S. vaccinees was 15% despite treatment with massive amounts of VIG (intramuscular) (6). Extensive surgical debridement was sometimes required, even necessitating disarticulation of the arm to “debulk” the amount of infectious material (7). Before smallpox vaccination, patients are screened for numerous contraindications (8). At the time of his vaccination, the patient described in this report did not have any obvious signs or symptoms that would meet any exclusion criteria for vaccination. Training in use of, and careful adher-ence to, screening tools can identify vaccine candidates at risk for PV and other adverse events (2). Despite this, vaccinees with occult immunodeficiencies might not be recognized, and therefore appropriately deferring vaccination in these persons is not always possible.
Lack of inflammation at the expanding vaccination site is the hallmark of PV. Any smallpox vaccinee who has an expanding, nonhealing, painless vaccination site without inflammation for more than 2 weeks should be evaluated for an underlying immunodeficiency, and diagnosis of and treatment for PV should be considered. Health-care providers should report suspected cases of PV or other adverse events to the Vaccine Adverse Event Reporting System (VAERS).† Suspected cases of PV also should be reported to state health officials and CDC for clinical consultation and to obtain select therapeutics available only through the SNS. State health departments should call the CDC Emergency Operations Center at 770-488-7100.
This patient’s protracted clinical course is consistent with previously published cases reports and surveillance summaries. The development of progressive vaccinia, historically observed in patients with cellular immunodeficiencies, often leads to superinfection and subsequent sepsis (i.e., fungal, parasitic, and bacterial infections resulting in toxic or septicemic shock, then ultimately death). Past treatment typically included massive
† Information about VAERS is available at http://vaers.hhs.gov.
doses of VIG, administration of thiosemicarbazone, blood products, and supportive care for accompanying infections (7,9). The improvement of progressive vaccinia in this patient was associated with receipt of VIGIV (the only licensed product for treatment of vaccinia adverse events stockpiled by the SNS), ST-246, and CMX001, and an increase in lymphocyte count. The use of two antiviral agents with different mechanisms of action§ was enabled by the research and development of medical countermeasures for smallpox preparedness activities, as well as the use of the emergency IND process. As of May 18, the patient had shed nearly all of the scab material on and around the vaccination site.
The rapid mobilization of military, CDC, FDA, NIH, drug manufacturer, and academic and health-care human resources to review the case’s status and to provide daily, then biweekly laboratory findings that guided treatment recommendations, was enabled by smallpox public health preparedness research and training efforts. Future cases of PV likely will require similar intensive and multidisciplinary clinical consultation. Experts with background in vaccine safety, PV treatment, clinical virology, infectious disease, and immunodeficiencies should be engaged.
Continuing medical education and reinforcement of train-ing related to the prevention, early recognition, and treatment of smallpox vaccine–related adverse events should be part of smallpox vaccination programs.¶ The patient described in this report received VIGIV in the amount originally estimated to treat 30 persons. The extraordinary amounts of VIGIV used to treat this single case of PV underscore the need to reevaluate the adequacy of the national stockpiled supply of this or other medical countermeasures (treatment or prophylactic). Such reevaluation, with additional focus on immunocompromised hosts, will aid in the smallpox vaccination program planning and overall smallpox preparedness efforts.
AcknowledgmentsThis report is based, in part, on contributions by JM Lane and staff
members from SIGA Technologies, Corvallis, Oregon; Chimerix, Inc., Research Triangle Park, North Carolina; Center for Biologics Evaluation and Research and Center for Drug Evaluation and Research, Food and Drug Admin; Military Vaccine Agency; Walter Reed Vaccine Healthcare Center; Bur of Medicine and Surgery of the Navy; Office of the Chief of Naval Operations; Chemical Biological Medical Systems of the US Dept of Defense; and the Emergency Operations Center and Strategic National Stockpile, CDC.
§ ST-246 prevents viral egress, whereas CMX001 inhibits viral replication, and some data suggest they are synergistic in vitro (10).
¶ CDC’s clinical evaluation tools for smallpox vaccine adverse reactions are available at http://emergency.cdc.gov/agent/smallpox/vaccination/clineval.
536 MMWR May 22, 2009
References 1. CDC. Recommendations for using smallpox vaccine in a pre-event
vaccination program. Supplemental recommendations of the Advisory Committee on Immunization Practices (ACIP) and the Healthcare Infection Control Practices Advisory Committee (HICPAC). MMWR 2003;52(No. RR-7).
2. Vellozzi C, Lane JM, Averhoff F, et al. Generalized vaccinia, progressive vaccinia, and eczema vaccinatum are rare following smallpox (vac-cinia) vaccination: United States surveillance, 2003. Clin Infect Dis 2005;41:689–97.
3. Redfield RR, Wright DC, James WD, Jones TS, Brown C, Burke DS. Disseminated vaccinia in a military recruit with human immunodefi-ciency virus (HIV) disease. N Engl J Med 1987;316:673–6.
4. Nell P, Kohl KS, Graham PL, et al. Progressive vaccinia as an adverse event following exposure to vaccinia virus: case definition and guidelines of data collection, analysis, and presentation of immunization safety data. Vaccine 2007;25:5735–44.
5. CDC. Surveillance guidelines for smallpox vaccine (vaccinia) adverse reactions. MMWR 2006;55:(No. RR-1).
6. Aragón TJ, Ulrich S, Fernyak S, Rutherford GW. Risks of serious com-plications and death from smallpox vaccination: a systematic review of the United States experience, 1963–1968. BMC Public Health 2003;3:26.
7. Maurer DM, Harrington B, Lane JM. Smallpox vaccine: contrain-dications, administration, and adverse reactions. Am Fam Physician 2003;68:889–96.
8. Fulginiti VA, Papier A, Lane JM, Neff JM, Henderson DA. Smallpox vaccination: a review, part II. Adverse events. Clin Infect Dis 2003;37:251–71.
9. Bray M, Wright ME. Progressive vaccinia. Clin Infect Dis 2003;36:766–74.
10. Quenelle, DC, Prichard MN, Keith KA, et al. Synergistic efficacy of the combination of ST-246 with CMX001 against orthopoxviruses. Antimicrob Agents Chemother 2007;51:4118–24.
Hospitalized Patients with Novel Influenza A (H1N1) Virus Infection
— California, April–May, 2009On May 18, this report was posted as an MMWR Early Release
on the MMWR website (http://www.cdc.gov/mmwr).Since April 15 and 17, 2009, when the first two cases of
novel influenza A (H1N1) infection were identified from two southern California counties, novel influenza A (H1N1) cases have been documented throughout the world, with most cases occurring in the United States and Mexico (1–3). In the United States, early reports of illnesses associated with novel influenza A (H1N1) infection indicated the disease might be similar in severity to seasonal influenza, with the majority of patients not requiring hospitalization and only rare deaths reported, gener-ally in persons with underlying medical conditions (2,3). As of May 17, 2009, 553 novel influenza A (H1N1) cases, including 333 confirmed and 220 probable cases, had been reported in 32 of 61 local health jurisdictions in California. Of the 553 patients, 30 have been hospitalized. No fatal cases associated
with novel influenza A (H1N1) infection had been reported in California. This report summarizes the 30 hospitalized cases as of May 17, including a detailed description of four cases that illustrate the spectrum of illness severity and underlying risk factors. This preliminary overview indicates that, although the majority of hospitalized persons infected with novel influenza A (H1N1) recovered without complications, certain patients had severe and prolonged disease. All hospitalized patients with novel influenza A (H1N1) infection should be monitored carefully and treated with antiviral therapy, including patients who seek care >48 hours after illness onset (4,5).
Summary of Hospitalized Cases Beginning on April 20, 2009, the California Department
of Public Health (CDPH) and local health departments in Imperial and San Diego counties worked with hospital infec-tion-control practitioners to initiate enhanced surveillance for hospitalized cases of laboratory-confirmed or probable novel influenza A (H1N1) infection at all 25 hospitals in the two counties. Three days later, on April 23, 2009, CDPH extended this surveillance statewide. Cases are reported as either prob-able (defined as detection of influenza A by real-time reverse transcription–polymerase chain reaction [rRT-PCR] that is unsubtypable for human influenza virus subtypes H1 or H3) or confirmed (defined as positive by CDC protocol for rRT-PCR for novel influenza A H1N1).* Approximately 96% of unsubtypable California specimens subsequently have been confirmed as novel influenza A (H1N1) at CDC or at the CDPH Viral and Rickettsial Disease Laboratory (VRDL).†
For this report, a hospitalized case was defined as a con-firmed or probable case of novel influenza A (H1N1) infec-tion in a patient who was hospitalized for >24 hours. Of the 30 hospitalized patients, 26 were confirmed and four were probable (confirmatory testing is in progress); symptom onset ranged from April 3 to May 9. The cases were reported from 11 counties, most of which are located in southern or central California. The largest number of patients, (15 [50%]) resided in San Diego and Imperial counties. Of the 26 patients for whom information on ethnicity was available, 17 (65%) were Hispanic. Ages of the 30 patients ranged from 27 days to 89 years, with a median age of 27.5 years; 21 (70%) were female. Four (13%) patients had traveled to Mexico in the 7 days before onset of illness. None of the 30 patients reported exposure to swine or a known confirmed case of novel influenza A (H1N1) infection.
* Additional information available at http://www.who.int/csr/resources/publications/swineflu/realtimeptpcr/en/index.html.
† Additional information available at http://ww2.cdph.ca.gov/programs/vrdl/pages/enhancedsurveillanceforinfluenzaa(h1).aspx.
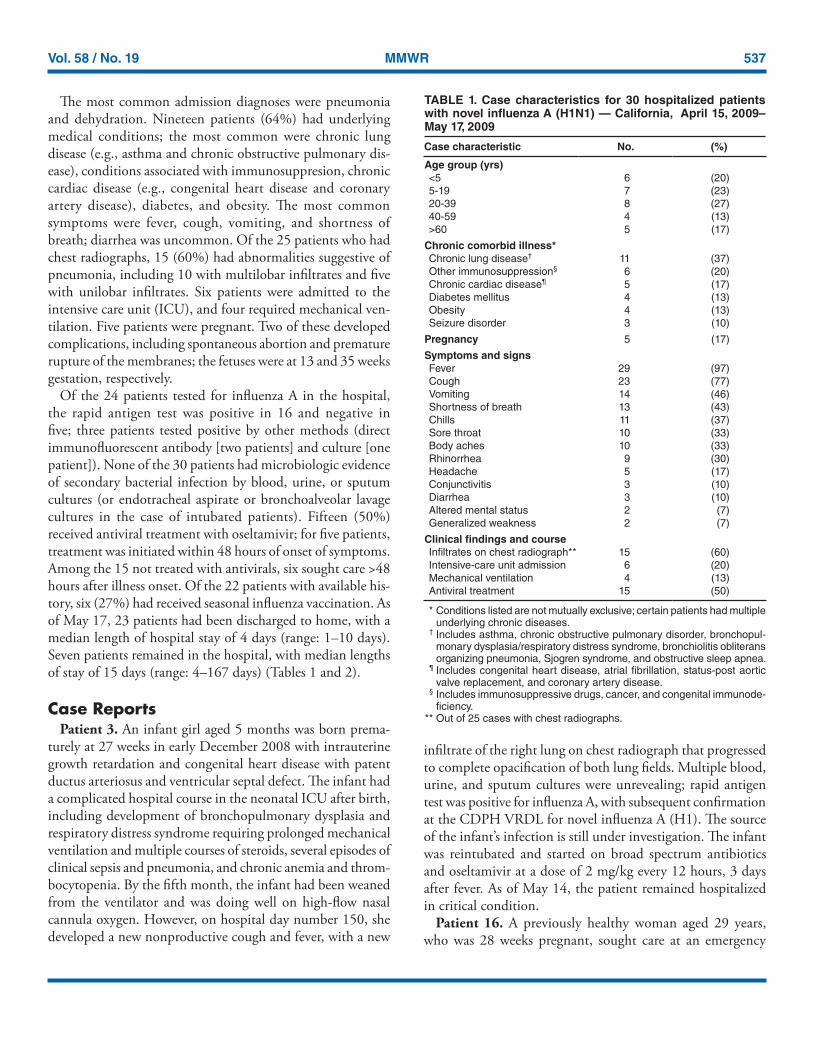
Vol. 58 / No. 19 MMWR 537
The most common admission diagnoses were pneumonia and dehydration. Nineteen patients (64%) had underlying medical conditions; the most common were chronic lung disease (e.g., asthma and chronic obstructive pulmonary dis-ease), conditions associated with immunosuppresion, chronic cardiac disease (e.g., congenital heart disease and coronary artery disease), diabetes, and obesity. The most common symptoms were fever, cough, vomiting, and shortness of breath; diarrhea was uncommon. Of the 25 patients who had chest radiographs, 15 (60%) had abnormalities suggestive of pneumonia, including 10 with multilobar infiltrates and five with unilobar infiltrates. Six patients were admitted to the intensive care unit (ICU), and four required mechanical ven-tilation. Five patients were pregnant. Two of these developed complications, including spontaneous abortion and premature rupture of the membranes; the fetuses were at 13 and 35 weeks gestation, respectively.
Of the 24 patients tested for influenza A in the hospital, the rapid antigen test was positive in 16 and negative in five; three patients tested positive by other methods (direct immunofluorescent antibody [two patients] and culture [one patient]). None of the 30 patients had microbiologic evidence of secondary bacterial infection by blood, urine, or sputum cultures (or endotracheal aspirate or bronchoalveolar lavage cultures in the case of intubated patients). Fifteen (50%) received antiviral treatment with oseltamivir; for five patients, treatment was initiated within 48 hours of onset of symptoms. Among the 15 not treated with antivirals, six sought care >48 hours after illness onset. Of the 22 patients with available his-tory, six (27%) had received seasonal influenza vaccination. As of May 17, 23 patients had been discharged to home, with a median length of hospital stay of 4 days (range: 1–10 days). Seven patients remained in the hospital, with median lengths of stay of 15 days (range: 4–167 days) (Tables 1 and 2).
Case ReportsPatient 3. An infant girl aged 5 months was born prema-
turely at 27 weeks in early December 2008 with intrauterine growth retardation and congenital heart disease with patent ductus arteriosus and ventricular septal defect. The infant had a complicated hospital course in the neonatal ICU after birth, including development of bronchopulmonary dysplasia and respiratory distress syndrome requiring prolonged mechanical ventilation and multiple courses of steroids, several episodes of clinical sepsis and pneumonia, and chronic anemia and throm-bocytopenia. By the fifth month, the infant had been weaned from the ventilator and was doing well on high-flow nasal cannula oxygen. However, on hospital day number 150, she developed a new nonproductive cough and fever, with a new
infiltrate of the right lung on chest radiograph that progressed to complete opacification of both lung fields. Multiple blood, urine, and sputum cultures were unrevealing; rapid antigen test was positive for influenza A, with subsequent confirmation at the CDPH VRDL for novel influenza A (H1). The source of the infant’s infection is still under investigation. The infant was reintubated and started on broad spectrum antibiotics and oseltamivir at a dose of 2 mg/kg every 12 hours, 3 days after fever. As of May 14, the patient remained hospitalized in critical condition.
Patient 16. A previously healthy woman aged 29 years, who was 28 weeks pregnant, sought care at an emergency
TABLE 1. Case characteristics for 30 hospitalized patients with novel influenza A (H1N1) — California, April 15, 2009– May 17, 2009
Case characteristic No. (%)
Age group (yrs)<5 6 (20)5-19 7 (23)20-39 8 (27)40-59 4 (13)>60 5 (17)
Chronic comorbid illness*Chronic lung disease† 11 (37)Other immunosuppression§ 6 (20)Chronic cardiac disease¶ 5 (17)Diabetes mellitus 4 (13)Obesity 4 (13)Seizure disorder 3 (10)
Pregnancy 5 (17)
Symptoms and signsFever 29 (97)Cough 23 (77)Vomiting 14 (46)Shortness of breath 13 (43)Chills 11 (37)Sore throat 10 (33)Body aches 10 (33)Rhinorrhea 9 (30)Headache 5 (17)Conjunctivitis 3 (10)Diarrhea 3 (10)Altered mental status 2 (7)Generalized weakness 2 (7)
Clinical findings and courseInfiltrates on chest radiograph** 15 (60)Intensive-care unit admission 6 (20)Mechanical ventilation 4 (13)Antiviral treatment 15 (50)
* Conditions listed are not mutually exclusive; certain patients had multiple underlying chronic diseases.
† Includes asthma, chronic obstructive pulmonary disorder, bronchopul-monary dysplasia/respiratory distress syndrome, bronchiolitis obliterans organizing pneumonia, Sjogren syndrome, and obstructive sleep apnea.
¶ Includes congenital heart disease, atrial fibrillation, status-post aortic valve replacement, and coronary artery disease.
§ Includes immunosuppressive drugs, cancer, and congenital immunode-ficiency.
** Out of 25 cases with chest radiographs.
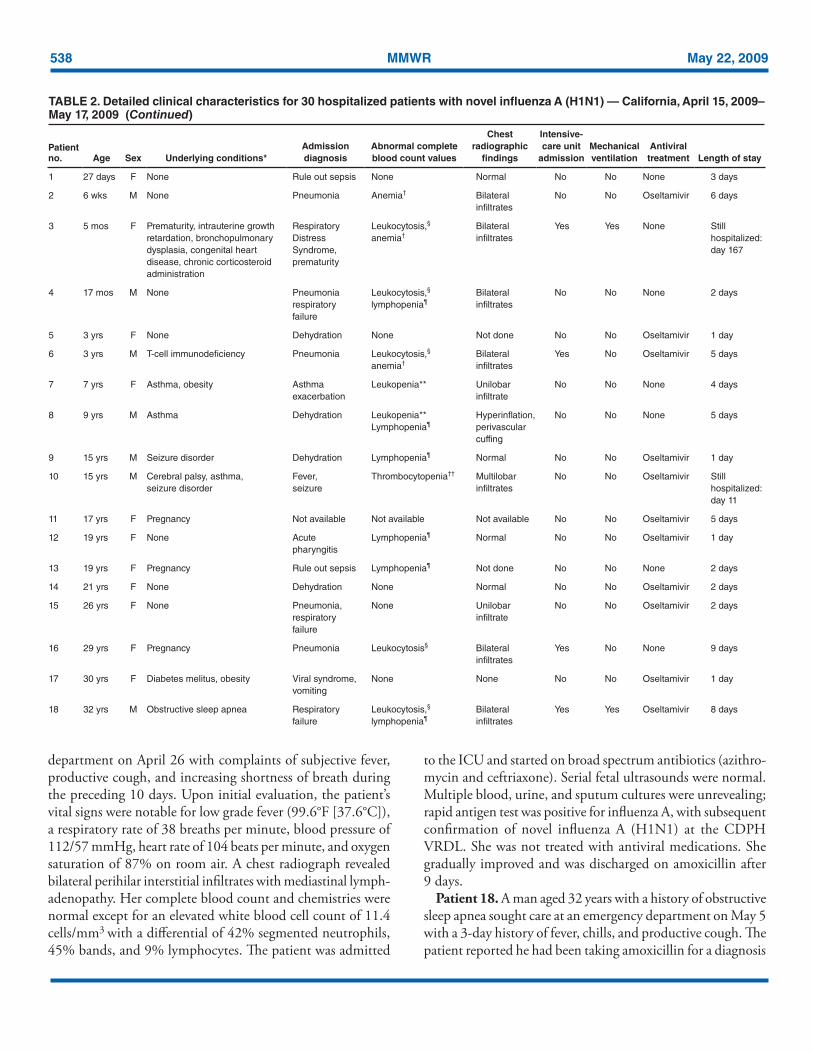
538 MMWR May 22, 2009
department on April 26 with complaints of subjective fever, productive cough, and increasing shortness of breath during the preceding 10 days. Upon initial evaluation, the patient’s vital signs were notable for low grade fever (99.6°F [37.6°C]), a respiratory rate of 38 breaths per minute, blood pressure of 112/57 mmHg, heart rate of 104 beats per minute, and oxygen saturation of 87% on room air. A chest radiograph revealed bilateral perihilar interstitial infiltrates with mediastinal lymph-adenopathy. Her complete blood count and chemistries were normal except for an elevated white blood cell count of 11.4 cells/mm3 with a differential of 42% segmented neutrophils, 45% bands, and 9% lymphocytes. The patient was admitted
to the ICU and started on broad spectrum antibiotics (azithro-mycin and ceftriaxone). Serial fetal ultrasounds were normal. Multiple blood, urine, and sputum cultures were unrevealing; rapid antigen test was positive for influenza A, with subsequent confirmation of novel influenza A (H1N1) at the CDPH VRDL. She was not treated with antiviral medications. She gradually improved and was discharged on amoxicillin after 9 days.
Patient 18. A man aged 32 years with a history of obstructive sleep apnea sought care at an emergency department on May 5 with a 3-day history of fever, chills, and productive cough. The patient reported he had been taking amoxicillin for a diagnosis
TABLE 2. Detailed clinical characteristics for 30 hospitalized patients with novel influenza A (H1N1) — California, April 15, 2009– May 17, 2009 (Continued)
Patient no. Age Sex Underlying conditions*
Admission diagnosis
Abnormal complete blood count values
Chest radiographic
findings
Intensive-care unit
admissionMechanical ventilation
Antiviral treatment Length of stay
1 27 days F None Rule out sepsis None Normal No No None 3 days
2 6 wks M None Pneumonia Anemia† Bilateral infiltrates
No No Oseltamivir 6 days
3 5 mos F Prematurity, intrauterine growth retardation, bronchopulmonary dysplasia, congenital heart disease, chronic corticosteroid administration
Respiratory Distress Syndrome, prematurity
Leukocytosis,§ anemia†
Bilateral infiltrates
Yes Yes None Still hospitalized: day 167
4 17 mos M None Pneumonia respiratory failure
Leukocytosis,§ lymphopenia¶
Bilateral infiltrates
No No None 2 days
5 3 yrs F None Dehydration None Not done No No Oseltamivir 1 day
6 3 yrs M T-cell immunodeficiency Pneumonia Leukocytosis,§ anemia†
Bilateral infiltrates
Yes No Oseltamivir 5 days
7 7 yrs F Asthma, obesity Asthma exacerbation
Leukopenia** Unilobar infiltrate
No No None 4 days
8 9 yrs M Asthma Dehydration Leukopenia** Lymphopenia¶
Hyperinflation, perivascular cuffing
No No None 5 days
9 15 yrs M Seizure disorder Dehydration Lymphopenia¶ Normal No No Oseltamivir 1 day
10 15 yrs M Cerebral palsy, asthma, seizure disorder
Fever, seizure
Thrombocytopenia†† Multilobar infiltrates
No No Oseltamivir Still hospitalized: day 11
11 17 yrs F Pregnancy Not available Not available Not available No No Oseltamivir 5 days
12 19 yrs F None Acute pharyngitis
Lymphopenia¶ Normal No No Oseltamivir 1 day
13 19 yrs F Pregnancy Rule out sepsis Lymphopenia¶ Not done No No None 2 days
14 21 yrs F None Dehydration None Normal No No Oseltamivir 2 days
15 26 yrs F None Pneumonia, respiratory failure
None Unilobar infiltrate
No No Oseltamivir 2 days
16 29 yrs F Pregnancy Pneumonia Leukocytosis§ Bilateral infiltrates
Yes No None 9 days
17 30 yrs F Diabetes melitus, obesity Viral syndrome, vomiting
None None No No Oseltamivir 1 day
18 32 yrs M Obstructive sleep apnea Respiratory failure
Leukocytosis,§ lymphopenia¶
Bilateral infiltrates
Yes Yes Oseltamivir 8 days
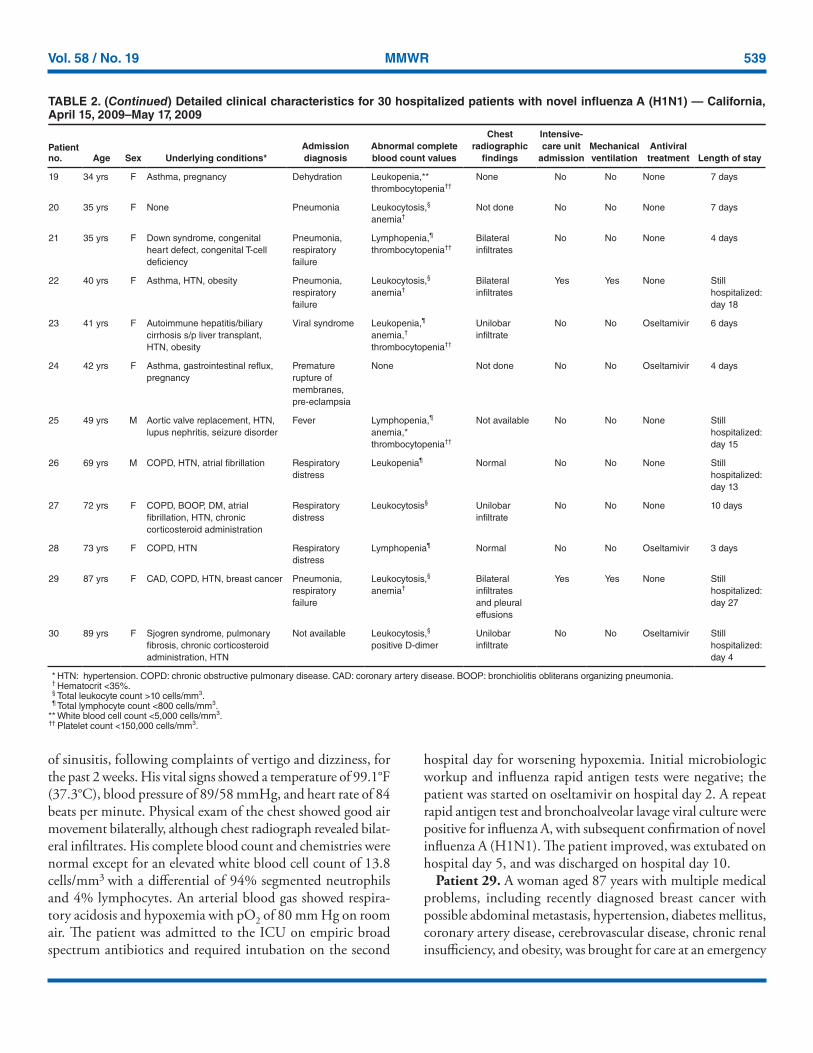
Vol. 58 / No. 19 MMWR 539
of sinusitis, following complaints of vertigo and dizziness, for the past 2 weeks. His vital signs showed a temperature of 99.1°F (37.3°C), blood pressure of 89/58 mmHg, and heart rate of 84 beats per minute. Physical exam of the chest showed good air movement bilaterally, although chest radiograph revealed bilat-eral infiltrates. His complete blood count and chemistries were normal except for an elevated white blood cell count of 13.8 cells/mm3 with a differential of 94% segmented neutrophils and 4% lymphocytes. An arterial blood gas showed respira-tory acidosis and hypoxemia with pO2 of 80 mm Hg on room air. The patient was admitted to the ICU on empiric broad spectrum antibiotics and required intubation on the second
hospital day for worsening hypoxemia. Initial microbiologic workup and influenza rapid antigen tests were negative; the patient was started on oseltamivir on hospital day 2. A repeat rapid antigen test and bronchoalveolar lavage viral culture were positive for influenza A, with subsequent confirmation of novel influenza A (H1N1). The patient improved, was extubated on hospital day 5, and was discharged on hospital day 10.
Patient 29. A woman aged 87 years with multiple medical problems, including recently diagnosed breast cancer with possible abdominal metastasis, hypertension, diabetes mellitus, coronary artery disease, cerebrovascular disease, chronic renal insufficiency, and obesity, was brought for care at an emergency
TABLE 2. (Continued) Detailed clinical characteristics for 30 hospitalized patients with novel influenza A (H1N1) — California, April 15, 2009–May 17, 2009
Patient no. Age Sex Underlying conditions*
Admission diagnosis
Abnormal complete blood count values
Chest radiographic
findings
Intensive-care unit
admissionMechanical ventilation
Antiviral treatment Length of stay
19 34 yrs F Asthma, pregnancy Dehydration Leukopenia,** thrombocytopenia††
None No No None 7 days
20 35 yrs F None Pneumonia Leukocytosis,§ anemia†
Not done No No None 7 days
21 35 yrs F Down syndrome, congenital heart defect, congenital T-cell deficiency
Pneumonia, respiratory failure
Lymphopenia,¶ thrombocytopenia††
Bilateral infiltrates
No No None 4 days
22 40 yrs F Asthma, HTN, obesity Pneumonia, respiratory failure
Leukocytosis,§ anemia†
Bilateral infiltrates
Yes Yes None Still hospitalized: day 18
23 41 yrs F Autoimmune hepatitis/biliary cirrhosis s/p liver transplant, HTN, obesity
Viral syndrome Leukopenia,¶ anemia,† thrombocytopenia††
Unilobar infiltrate
No No Oseltamivir 6 days
24 42 yrs F Asthma, gastrointestinal reflux, pregnancy
Premature rupture of membranes, pre-eclampsia
None Not done No No Oseltamivir 4 days
25 49 yrs M Aortic valve replacement, HTN, lupus nephritis, seizure disorder
Fever Lymphopenia,¶
anemia,* thrombocytopenia††
Not available No No None Still hospitalized: day 15
26 69 yrs M COPD, HTN, atrial fibrillation Respiratory distress
Leukopenia¶ Normal No No None Still hospitalized: day 13
27 72 yrs F COPD, BOOP, DM, atrial fibrillation, HTN, chronic corticosteroid administration
Respiratory distress
Leukocytosis§ Unilobar infiltrate
No No None 10 days
28 73 yrs F COPD, HTN Respiratory distress
Lymphopenia¶ Normal No No Oseltamivir 3 days
29 87 yrs F CAD, COPD, HTN, breast cancer Pneumonia, respiratory failure
Leukocytosis,§ anemia†
Bilateral infiltrates and pleural effusions
Yes Yes None Still hospitalized: day 27
30 89 yrs F Sjogren syndrome, pulmonary fibrosis, chronic corticosteroid administration, HTN
Not available Leukocytosis,§ positive D-dimer
Unilobar infiltrate
No No Oseltamivir Still hospitalized: day 4
* HTN: hypertension. COPD: chronic obstructive pulmonary disease. CAD: coronary artery disease. BOOP: bronchiolitis obliterans organizing pneumonia. † Hematocrit <35%. § Total leukocyte count >10 cells/mm3. ¶ Total lymphocyte count <800 cells/mm3. ** White blood cell count <5,000 cells/mm3. †† Platelet count <150,000 cells/mm3.
540 MMWR May 22, 2009
department on April 21 after being found unconscious by her daughter. The patient had reported onset of fever, cough, and weakness 2 days before admission and also new onset of orthopnea and bilateral leg swelling. She was wheelchair bound and had no recent history of travel or known contact with ill persons.. In the emergency room the patient was afebrile, with a blood pressure of 57/39 mmHg, pulse 57, respiratory rate of 14 breaths per minute, and oxygen saturation of 87% on room air. Electrocardiogram was suggestive of non Q-wave myocar-dial infarction. Chest radiograph showed bilateral pneumonia and congestive heart failure with marked cardiomegaly. Her laboratory abnormalities included an elevated white blood cell count of 13.4 cells/mm3, mild anemia with a hematocrit of 34%, a mildly elevated creatinine at 1.8 mg/dL, alanine ami-notransferase of 36 units/L and aspartate aminotransferase of 160 units/L, and markedly elevated troponin and creatinine kinase levels of 29.43 ng/mL and 653 IU/L, respectively. The patient went into respiratory arrest and was subsequently intu-bated and started on low dose dopamine, and admitted to the ICU with a diagnosis of myocardial infarction, congestive heart failure, pneumonia and presumed sepsis. A chest computed tomography (CT) scan showed complete atelectasis of the right middle lobe, bilateral ground glass opacities of the upper lobes, and bilateral pleural effusions. A subsequent bronchoscopy identified a large cauliflower-shaped mass in the right lower lobe airway. Multiple blood, urine, and sputum cultures were unrevealing; rapid antigen test was positive for influenza A, with subsequent confirmation of novel influenza A (H1N1) at the CDPH VRDL. The patient remains hospitalized in critical condition under intensive care.Reported by: J Louie, MD, K Winter, MPH, K Harriman, PhD, D Vugia, MD, C Glaser, MD, B Matyas, MD, D Schnurr, PhD, H Guevara, MS, CY Pan, E Saguar, R Berumen, E Hunley, S Messenger, PhD, C Preas, D Hatch, MD, G Chavez, MD, California Dept of Public Health. P Kriner, MPH, K Lopez, MD, Imperial County Public Health Dept; D Sunega, D Rexin, San Diego County Health and Human Svcs; Los Angeles County Swine Flu Surveillance Team, Los Angeles County Dept of Public Health; S Roach, J Kempf, Tulare County Health and Human Svcs Agency; R Gonzalez, L Morgan, MPH, San Bernardino County Dept of Public Health, California. N Barnes, MS, L Berman, MS, S Emery, MPH, B Shu, MD, KH Wu, PhD, J Villanueva, PhD, S Lindstrom, PhD, Influenza Div; D Sugarman, MD, M Patel, MD, J Jaeger, MD, E Meites, MD, N Dharan, MD, EIS officers, CDC. Editorial Note: Initial surveillance for hospitalized cases of novel influenza A (H1N1) infection in California indicates that the majority of patients were discharged after short hospital stays. Previously healthy patients without underlying chronic medical conditions recovered with an uncomplicated hospital course and a median length of stay of 2.5 days (range: 1–7 days). Although one third of hospitalized patients had abnor-mal chest radiographs with multilobar infiltrates, only 9%
were treated with oseltamivir; nonetheless, most had favorable outcomes. Of five pregnant women, two developed serious sequelae; however, the role that preceding infection with novel influenza A (H1N1) played in these outcomes is unclear.
Certain hospitalized patients in California experienced severe disease and prolonged hospital courses. Of note, three of the six California patients admitted to an ICU continue to require prolonged intensive care. Extremes in age and multiple and debilitating underlying medical conditions might be con-tributing to the severity of illness in these patients. Although chronic underlying medical conditions and pregnancy clas-sically are associated with a greater risk for complications for seasonal influenza (6), one patient (patient 18) who was relatively healthy with only mild chronic pulmonary disease required intensive care and mechanical ventilation. More data are needed regarding which populations are at greatest risk for hospitalization and severe sequelae after infection with novel influenza A (H1N1).
As of May 15, 2009, 9% of approximately 11,600 clinical specimens submitted for testing to California public health laboratories since April 27, 2009, were positive by rRT-PCR for influenza A; of those, 23% and 28% were subtyped as seasonal influenza A/H1 and A/H3, respectively. These results indicate that seasonal influenza viruses continue to circulate throughout California and might be a cause of influenza-like illness and positive results from rapid antigen tests. Although rapid antigen test results were positive in 67% of tested cases in this series, anecdotal reports from other cases confirmed at CDPH VRDL, tested mostly in the outpatient setting, suggest that false positive and negative results are common. Accordingly, CDPH has emphasized the importance of testing influenza viruses in the state with rRT-PCR. CDPH also has advised clinicians in California to collect respiratory specimens for rRT-PCR testing, subtyping, and further characterization at public health laboratories from patients who are hospitalized or who die with febrile respiratory illness.
Additional information regarding California testing guidelines is available at http://ww2.cdph.ca.gov/programs/vrdl/pages/diagnostictestingforswineinfluenzaA(H1).aspx. Additional information regarding novel influenza A (H1N1) treatment guidance and other CDC recommendations is avail-able at http://www.cdc.gov/h1n1flu/guidance.References1. CDC. Swine influenza A (H1N1) infection in two children—southern
California, March–April 2009. MMWR 2009;58:400–2.2. Dawood FS, Jain S, Finelli L, et al. Emergence of a novel swine-origin influ-
enza A (H1N1) virus in humans. N Engl J Med 2009;361[online]. Available at http://content.NEJM.org/cgi/content/full/nejmoa0903810.
3. CDC. Outbreak of swine-origin influenza A (H1N1) virus infection—Mexico, March–April 2009. MMWR 2009;58:467–70.
4. CDC. Novel influenza A (H1N1) virus infections in three pregnant women—United States, April–May 2009. MMWR 2009;58:497–500.
Vol. 58 / No. 19 MMWR 541
5. McGeer A, Green KA, Plevneshi A, et al; Toronto Invasive Bacterial Diseases Network. Antiviral therapy and outcomes of influenza requiring hospitalization in Ontario, Canada. Clin Infect Dis 2007;45:1568–75.
6. CDC. Prevention and control of influenza: recommendations of the Advisory Committee on Immunization Practices (ACIP), 2008. MMWR 2008;57(No. RR-7).
Notice to Readers
World No Tobacco Day — May 31, 2009
Tobacco use is one of the major preventable causes of pre-mature death and disease in the world (1). The World Health Organization (WHO) attributes approximately 5.4 million deaths per year to tobacco use (or one in 10 deaths among adults worldwide), a number expected to exceed 8 million per year by 2030 (2).
Evidence-based tobacco control programs that are com-prehensive, sustained, and support nonsmoking behaviors have been shown to prevent and reduce tobacco use (3). Such programs combine educational, clinical, regulatory, economic, and social strategies to establish smoke-free policies and social norms, to promote and assist tobacco users to quit, and to prevent initiation of tobacco use. Strategies include increasing the unit price of tobacco products and implementing smoking bans through policies, regulations, and laws; providing insur-ance coverage of tobacco use treatment; and limiting minors’ access to tobacco products.
As part of a comprehensive tobacco control program, prominent tobacco health warnings that appear on packs of cigarettes have been proven to motivate users to quit and to
reduce the appeal of tobacco for those who are not yet addicted (4). WHO’s theme for World No Tobacco Day, which will take place on May 31, 2009, is Tobacco Health Warnings. Additional information on World No Tobacco Day 2009 is available at http://www.who.int/tobacco/wntd/2009. References1. Jha P, Chaloupka FJ. Tobacco control in developing countries. Oxford,
England: Oxford University Press; 2000.2. World Health Organization. WHO report on the global tobacco epi-
demic, 2008–the MPower package. Geneva, Switzerland: World Health Organization; 2008. Available at http://www.who.int/tobacco/mpower/mpower_report_full_2008.pdf.
3. CDC. Best practices for comprehensive tobacco control programs—2007. Atlanta, GA: US Department of Health and Humans Services, CDC; 2007. Available at http://www.cdc.gov/tobacco/tobacco_control_programs/stateandcommunity/best_practices.
4. World Health Organization. WHO Framework Convention on Tobacco Control. Geneva, Switzerland: World Health Organization; 2005. Available at http://www.who.int/tobacco/framework/WHO_FCTC_eng-lish.pdf.
Errata: Vol. 58, No. 18
In the report, “Novel Influenza A (H1N1) Virus Infections in Three Pregnant Women—United States, April–May 2009,” on page 498, the second and third sentences in the first com-plete paragraph should read as follows: “The specimen was forwarded to the Virus Surveillance and Diagnostic Branch Laboratory, Influenza Division, CDC, where it could not be confirmed as novel influenza A (H1N1) virus. On April 30, a repeat nasopharyngeal specimen and sputum specimen were collected that were both positive by rRT-PCR for novel influenza A (H1N1) virus at CDC.”
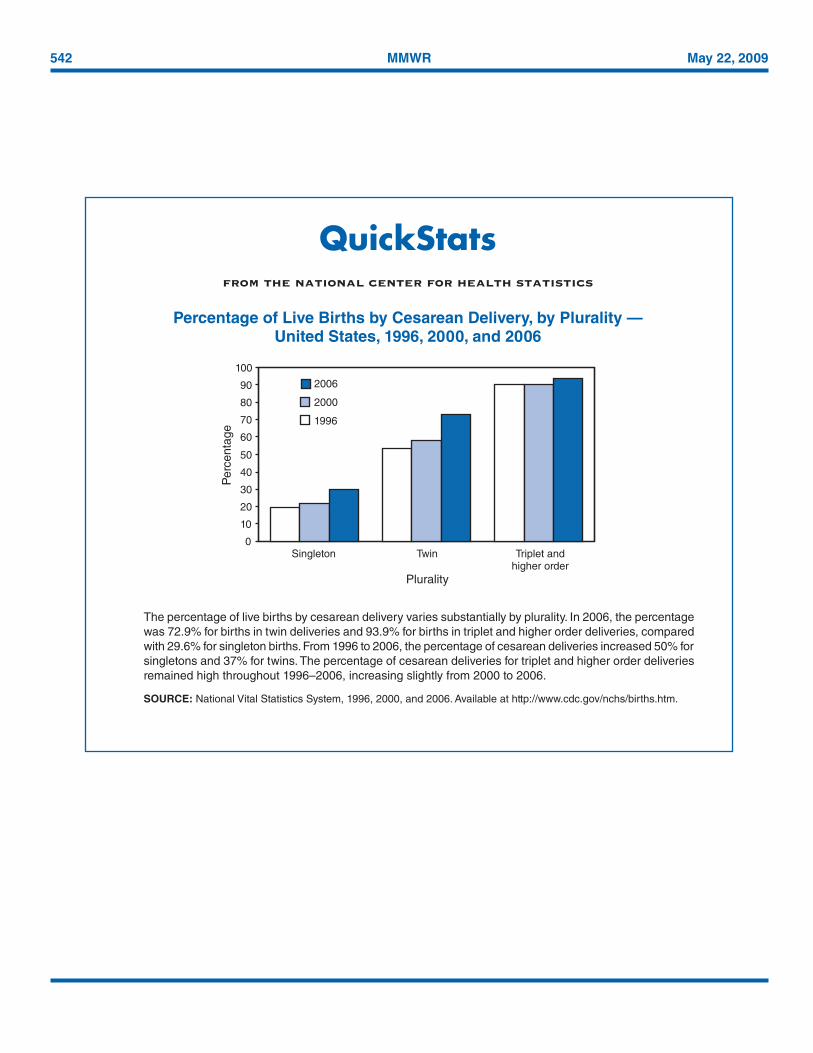
542 MMWR May 22, 2009
QuickStatsfrom the national center for health statistics
Percentage of Live Births by Cesarean Delivery, by Plurality — United States, 1996, 2000, and 2006
The percentage of live births by cesarean delivery varies substantially by plurality. In 2006, the percentage was 72.9% for births in twin deliveries and 93.9% for births in triplet and higher order deliveries, compared with 29.6% for singleton births. From 1996 to 2006, the percentage of cesarean deliveries increased 50% for singletons and 37% for twins. The percentage of cesarean deliveries for triplet and higher order deliveries remained high throughout 1996–2006, increasing slightly from 2000 to 2006.
SOURCE: National Vital Statistics System, 1996, 2000, and 2006. Available at http://www.cdc.gov/nchs/births.htm.
0102030405060708090
100
Singleton
Perc
enta
ge
199620002006
Twin
Plurality
Triplet andhigher order
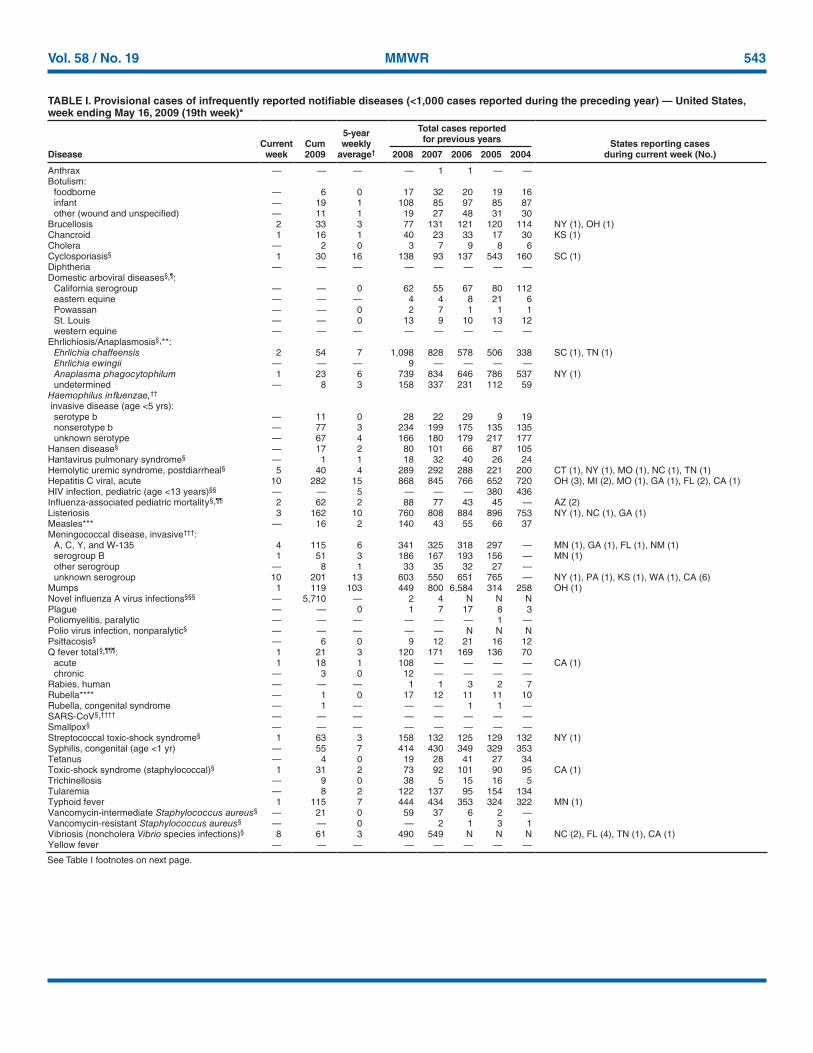
Vol. 58 / No. 19 MMWR 543
TABLE I. Provisional cases of infrequently reported notifiable diseases (<1,000 cases reported during the preceding year) — United States, week ending May 16, 2009 (19th week)*
DiseaseCurrent
weekCum 2009
5-year weekly
average†
Total cases reported for previous years States reporting cases
during current week (No.)2008 2007 2006 2005 2004
Anthrax — — — — 1 1 — —Botulism: foodborne — 6 0 17 32 20 19 16 infant — 19 1 108 85 97 85 87 other (wound and unspecified) — 11 1 19 27 48 31 30Brucellosis 2 33 3 77 131 121 120 114 NY (1), OH (1)Chancroid 1 16 1 40 23 33 17 30 KS (1)Cholera — 2 0 3 7 9 8 6Cyclosporiasis§ 1 30 16 138 93 137 543 160 SC (1)Diphtheria — — — — — — — —Domestic arboviral diseases§,¶: California serogroup — — 0 62 55 67 80 112 eastern equine — — — 4 4 8 21 6 Powassan — — 0 2 7 1 1 1 St. Louis — — 0 13 9 10 13 12 western equine — — — — — — — —Ehrlichiosis/Anaplasmosis§,**: Ehrlichia chaffeensis 2 54 7 1,098 828 578 506 338 SC (1), TN (1) Ehrlichia ewingii — — — 9 — — — — Anaplasma phagocytophilum 1 23 6 739 834 646 786 537 NY (1) undetermined — 8 3 158 337 231 112 59Haemophilus influenzae,††
invasive disease (age <5 yrs): serotype b — 11 0 28 22 29 9 19 nonserotype b — 77 3 234 199 175 135 135 unknown serotype — 67 4 166 180 179 217 177Hansen disease§ — 17 2 80 101 66 87 105Hantavirus pulmonary syndrome§ — 1 1 18 32 40 26 24Hemolytic uremic syndrome, postdiarrheal§ 5 40 4 289 292 288 221 200 CT (1), NY (1), MO (1), NC (1), TN (1)Hepatitis C viral, acute 10 282 15 868 845 766 652 720 OH (3), MI (2), MO (1), GA (1), FL (2), CA (1)HIV infection, pediatric (age <13 years)§§ — — 5 — — — 380 436Influenza-associated pediatric mortality§,¶¶ 2 62 2 88 77 43 45 — AZ (2)Listeriosis 3 162 10 760 808 884 896 753 NY (1), NC (1), GA (1)Measles*** — 16 2 140 43 55 66 37Meningococcal disease, invasive†††: A, C, Y, and W-135 4 115 6 341 325 318 297 — MN (1), GA (1), FL (1), NM (1) serogroup B 1 51 3 186 167 193 156 — MN (1) other serogroup — 8 1 33 35 32 27 — unknown serogroup 10 201 13 603 550 651 765 — NY (1), PA (1), KS (1), WA (1), CA (6)Mumps 1 119 103 449 800 6,584 314 258 OH (1)Novel influenza A virus infections§§§ — 5,710 — 2 4 N N NPlague — — 0 1 7 17 8 3Poliomyelitis, paralytic — — — — — — 1 —Polio virus infection, nonparalytic§ — — — — — N N NPsittacosis§ — 6 0 9 12 21 16 12Q fever total §,¶¶¶: 1 21 3 120 171 169 136 70 acute 1 18 1 108 — — — — CA (1) chronic — 3 0 12 — — — —Rabies, human — — — 1 1 3 2 7Rubella**** — 1 0 17 12 11 11 10Rubella, congenital syndrome — 1 — — — 1 1 —SARS-CoV§,†††† — — — — — — — —Smallpox§ — — — — — — — —Streptococcal toxic-shock syndrome§ 1 63 3 158 132 125 129 132 NY (1)Syphilis, congenital (age <1 yr) — 55 7 414 430 349 329 353Tetanus — 4 0 19 28 41 27 34Toxic-shock syndrome (staphylococcal)§ 1 31 2 73 92 101 90 95 CA (1)Trichinellosis — 9 0 38 5 15 16 5Tularemia — 8 2 122 137 95 154 134Typhoid fever 1 115 7 444 434 353 324 322 MN (1)Vancomycin-intermediate Staphylococcus aureus§ — 21 0 59 37 6 2 —Vancomycin-resistant Staphylococcus aureus§ — — 0 — 2 1 3 1Vibriosis (noncholera Vibrio species infections)§ 8 61 3 490 549 N N N NC (2), FL (4), TN (1), CA (1)Yellow fever — — — — — — — —
See Table I footnotes on next page.
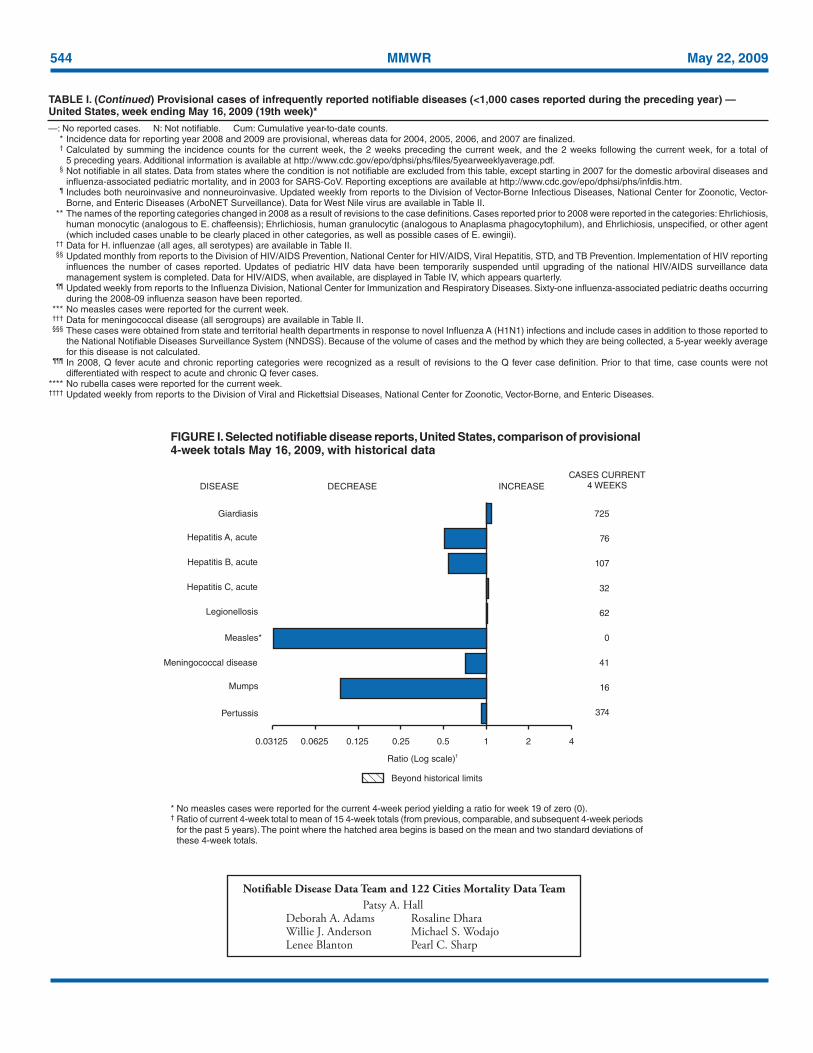
544 MMWR May 22, 2009
* No measles cases were reported for the current 4-week period yielding a ratio for week 19 of zero (0).† Ratio of current 4-week total to mean of 15 4-week totals (from previous, comparable, and subsequent 4-week periods
for the past 5 years). The point where the hatched area begins is based on the mean and two standard deviations of these 4-week totals.
FIGURE I. Selected notifiable disease reports, United States, comparison of provisional 4-week totals May 16, 2009, with historical data
Notifiable Disease Data Team and 122 Cities Mortality Data Team Patsy A. HallDeborah A. Adams Rosaline DharaWillie J. Anderson Michael S. WodajoLenee Blanton Pearl C. Sharp
DISEASE DECREASE INCREASE
CASES CURRENT4 WEEKS
Ratio (Log scale)†
Beyond historical limits
4210.50.250.125
725
76
107
32
62
0
41
16
374
Hepatitis A, acute
Hepatitis B, acute
Hepatitis C, acute
Legionellosis
Measles*
Mumps
Pertussis
Giardiasis
Meningococcal disease
0.06250.03125
TABLE I. (Continued) Provisional cases of infrequently reported notifiable diseases (<1,000 cases reported during the preceding year) — United States, week ending May 16, 2009 (19th week)*
—: No reported cases. N: Not notifiable. Cum: Cumulative year-to-date counts. * Incidence data for reporting year 2008 and 2009 are provisional, whereas data for 2004, 2005, 2006, and 2007 are finalized. † Calculated by summing the incidence counts for the current week, the 2 weeks preceding the current week, and the 2 weeks following the current week, for a total of
5 preceding years. Additional information is available at http://www.cdc.gov/epo/dphsi/phs/files/5yearweeklyaverage.pdf. § Not notifiable in all states. Data from states where the condition is not notifiable are excluded from this table, except starting in 2007 for the domestic arboviral diseases and
influenza-associated pediatric mortality, and in 2003 for SARS-CoV. Reporting exceptions are available at http://www.cdc.gov/epo/dphsi/phs/infdis.htm. ¶ Includes both neuroinvasive and nonneuroinvasive. Updated weekly from reports to the Division of Vector-Borne Infectious Diseases, National Center for Zoonotic, Vector-
Borne, and Enteric Diseases (ArboNET Surveillance). Data for West Nile virus are available in Table II. ** The names of the reporting categories changed in 2008 as a result of revisions to the case definitions. Cases reported prior to 2008 were reported in the categories: Ehrlichiosis,
human monocytic (analogous to E. chaffeensis); Ehrlichiosis, human granulocytic (analogous to Anaplasma phagocytophilum), and Ehrlichiosis, unspecified, or other agent (which included cases unable to be clearly placed in other categories, as well as possible cases of E. ewingii).
†† Data for H. influenzae (all ages, all serotypes) are available in Table II. §§ Updated monthly from reports to the Division of HIV/AIDS Prevention, National Center for HIV/AIDS, Viral Hepatitis, STD, and TB Prevention. Implementation of HIV reporting
influences the number of cases reported. Updates of pediatric HIV data have been temporarily suspended until upgrading of the national HIV/AIDS surveillance data management system is completed. Data for HIV/AIDS, when available, are displayed in Table IV, which appears quarterly.
¶¶ Updated weekly from reports to the Influenza Division, National Center for Immunization and Respiratory Diseases. Sixty-one influenza-associated pediatric deaths occurring during the 2008-09 influenza season have been reported.
*** No measles cases were reported for the current week. ††† Data for meningococcal disease (all serogroups) are available in Table II. §§§ These cases were obtained from state and territorial health departments in response to novel Influenza A (H1N1) infections and include cases in addition to those reported to
the National Notifiable Diseases Surveillance System (NNDSS). Because of the volume of cases and the method by which they are being collected, a 5-year weekly average for this disease is not calculated.
¶¶¶ In 2008, Q fever acute and chronic reporting categories were recognized as a result of revisions to the Q fever case definition. Prior to that time, case counts were not differentiated with respect to acute and chronic Q fever cases.
**** No rubella cases were reported for the current week. †††† Updated weekly from reports to the Division of Viral and Rickettsial Diseases, National Center for Zoonotic, Vector-Borne, and Enteric Diseases.

Vol. 58 / No. 19 MMWR 545
TABLE II. Provisional cases of selected notifiable diseases, United States, weeks ending May 16, 2009, and May 10, 2008 (19th week)*
Reporting area
Chlamydia† Coccidiodomycosis Cryptosporidiosis
Current week
Previous 52 weeks Cum
2009Cum 2008
Current week
Previous 52 weeks Cum
2009Cum 2008
Current week
Previous 52 week Cum
2009Cum 2008Med Max Med Max Med Max
United States 10,574 22,617 25,548 372,487 425,102 43 129 333 2,589 2,446 66 109 481 1,468 1,458New England 535 744 1,655 14,365 12,943 — 0 0 — 1 1 5 23 85 128
Connecticut 231 230 1,306 4,285 3,261 N 0 0 N N — 0 9 9 41Maine§ 55 48 72 949 932 N 0 0 N N — 1 6 9 6Massachusetts 192 326 950 6,983 6,434 N 0 0 N N — 2 13 35 38New Hampshire 4 34 63 410 758 — 0 0 — 1 — 1 4 15 23Rhode Island§ 31 53 244 1,306 1,141 — 0 0 — — — 0 3 2 3Vermont§ 22 21 53 432 417 N 0 0 N N 1 1 7 15 17
Mid. Atlantic 2,602 2,888 6,734 55,605 54,559 — 0 0 — — 11 13 35 179 186New Jersey 331 383 769 6,310 8,410 N 0 0 N N — 0 4 1 15New York (Upstate) 512 584 4,563 11,169 9,476 N 0 0 N N 2 4 17 49 48New York City 1,214 1,097 3,130 23,006 21,178 N 0 0 N N — 1 8 24 36Pennsylvania 545 796 1,072 15,120 15,495 N 0 0 N N 9 5 15 105 87
E.N. Central 1,047 3,337 4,273 54,188 71,114 — 0 3 13 19 11 26 125 328 328Illinois — 1,062 1,356 14,519 21,477 N 0 0 N N — 2 13 18 32Indiana 413 398 713 8,447 8,103 N 0 0 N N — 3 17 52 39Michigan 413 827 1,253 16,417 17,426 — 0 3 5 15 1 5 13 67 70Ohio 69 783 1,300 8,599 16,681 — 0 2 8 4 8 6 59 110 76Wisconsin 152 307 439 6,206 7,427 N 0 0 N N 2 8 46 81 111
W.N. Central 469 1,317 1,548 23,341 24,161 — 0 1 1 — 16 16 68 207 224Iowa 130 192 257 3,601 3,160 N 0 0 N N 5 4 30 45 48Kansas 241 187 401 3,709 3,195 N 0 0 N N 1 1 8 22 19Minnesota — 265 314 3,928 5,404 — 0 0 — — 4 4 14 46 56Missouri — 496 581 9,208 8,855 — 0 1 1 — 2 3 13 38 48Nebraska§ 23 97 254 1,620 1,819 N 0 0 N N 3 2 8 25 35North Dakota — 25 60 156 707 N 0 0 N N — 0 9 1 —South Dakota 75 56 85 1,119 1,021 N 0 0 N N 1 1 9 30 18
S. Atlantic 1,800 4,583 5,730 64,921 81,082 — 0 1 4 2 9 21 49 294 264Delaware 64 71 180 1,782 1,344 — 0 1 1 — — 0 1 — 6District of Columbia — 124 229 2,447 2,607 — 0 0 — — — 0 2 — 6Florida 486 1,384 1,906 26,917 26,858 N 0 0 N N 4 8 35 94 118Georgia 4 676 1,909 6,282 14,362 N 0 0 N N 4 6 13 124 81Maryland§ 331 445 772 7,621 8,394 — 0 1 3 2 — 1 5 9 6North Carolina — 819 1,814 — 5,969 N 0 0 N N 1 0 16 36 9South Carolina§ 334 534 887 7,787 9,735 N 0 0 N N — 1 6 15 11Virginia§ 581 618 903 10,734 10,556 N 0 0 N N — 1 4 11 18West Virginia — 67 101 1,351 1,257 N 0 0 N N — 0 3 5 9
E.S. Central 1,276 1,668 2,161 31,152 29,744 — 0 0 — — 2 3 9 47 41Alabama§ — 463 553 6,937 9,280 N 0 0 N N — 1 6 10 18Kentucky 166 243 380 3,938 3,835 N 0 0 N N — 1 4 14 7Mississippi 470 424 841 9,114 6,530 N 0 0 N N — 0 2 4 3Tennessee§ 640 559 796 11,163 10,099 N 0 0 N N 2 1 5 19 13
W.S. Central 539 2,856 4,001 38,437 54,316 — 0 1 — 2 3 8 272 60 64Arkansas§ 417 276 395 5,606 5,300 N 0 0 N N — 1 10 10 11Louisiana 102 401 1,090 4,838 7,157 — 0 1 — 2 — 1 5 6 12Oklahoma 20 199 1,753 2,225 5,029 N 0 0 N N 3 2 16 23 13Texas§ — 1,900 2,532 25,768 36,830 N 0 0 N N — 5 258 21 28
Mountain 463 1,344 2,145 21,769 27,060 28 91 211 1,788 1,649 — 8 38 95 114Arizona 95 460 627 6,355 8,947 26 89 209 1,756 1,610 — 1 10 10 12Colorado — 323 986 4,794 6,614 N 0 0 N N — 2 12 28 21Idaho§ 33 69 314 1,357 1,392 N 0 0 N N — 1 5 13 23Montana§ 13 58 87 1,118 1,150 N 0 0 N N — 0 4 10 13Nevada§ 160 177 365 3,775 3,646 2 1 7 25 17 — 0 4 6 5New Mexico§ 131 159 540 2,452 2,621 — 0 2 2 14 — 2 23 19 23Utah — 92 251 1,100 2,185 — 0 1 5 8 — 0 6 1 10Wyoming§ 31 33 97 818 505 — 0 1 — — — 0 2 8 7
Pacific 1,843 3,665 4,607 68,709 70,123 15 37 172 783 773 13 9 31 173 109Alaska 103 89 199 1,718 1,728 N 0 0 N N — 0 1 2 1California 1,219 2,869 3,585 54,289 54,345 15 37 172 783 773 11 6 14 96 69Hawaii — 112 247 1,828 2,139 N 0 0 N N — 0 1 1 1Oregon§ 251 187 631 3,576 3,861 N 0 0 N N — 1 29 56 19Washington 270 403 557 7,298 8,050 N 0 0 N N 2 2 10 18 19
American Samoa — 0 8 — 62 N 0 0 N N N 0 0 N NC.N.M.I. — — — — — — — — — — — — — — —Guam — 5 24 — 52 — 0 0 — — — 0 0 — —Puerto Rico — 138 269 2,663 2,469 N 0 0 N N N 0 0 N NU.S. Virgin Islands — 9 40 106 253 — 0 0 — — — 0 0 — —
C.N.M.I.: Commonwealth of Northern Mariana Islands.U: Unavailable. —: No reported cases. N: Not notifiable. Cum: Cumulative year-to-date counts. Med: Median. Max: Maximum. * Incidence data for reporting year 2008 and 2009 are provisional. Data for HIV/AIDS, AIDS, and TB, when available, are displayed in Table IV, which appears quarterly.† Chlamydia refers to genital infections caused by Chlamydia trachomatis.§ Contains data reported through the National Electronic Disease Surveillance System (NEDSS).
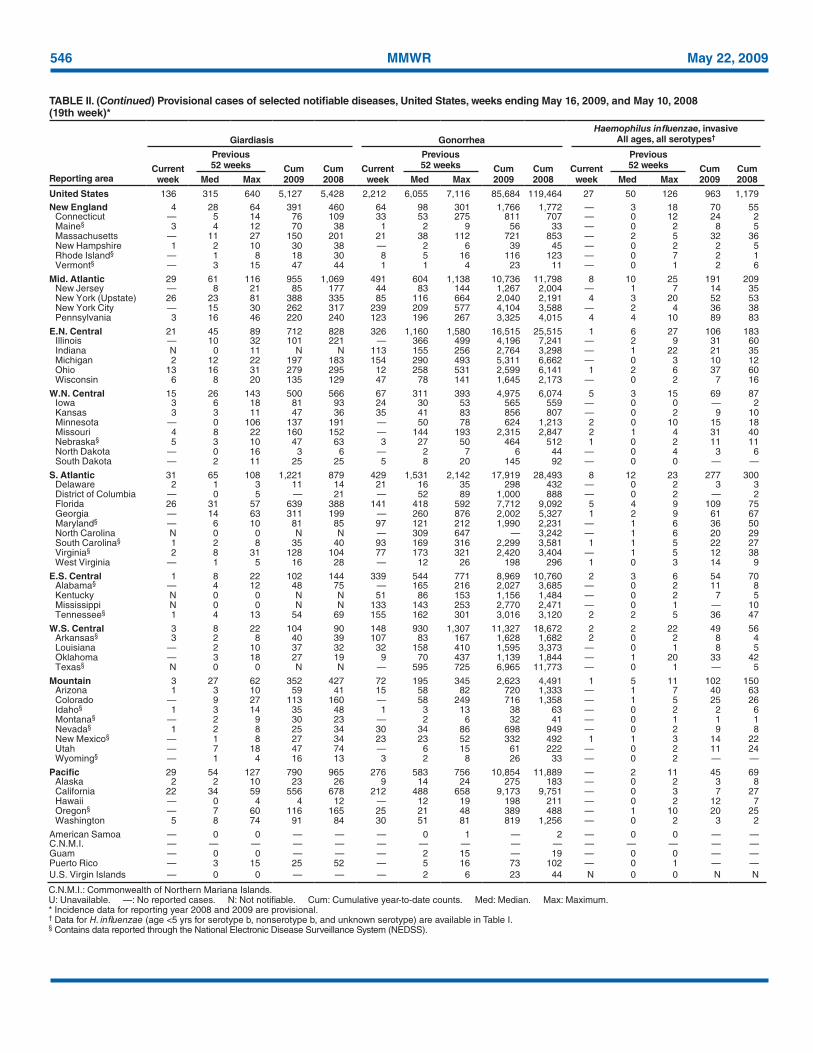
546 MMWR May 22, 2009
TABLE II. (Continued) Provisional cases of selected notifiable diseases, United States, weeks ending May 16, 2009, and May 10, 2008 (19th week)*
Reporting area
Giardiasis GonorrheaHaemophilus influenzae, invasive
All ages, all serotypes†
Current week
Previous 52 weeks Cum
2009Cum 2008
Current week
Previous 52 weeks Cum
2009Cum 2008
Current week
Previous 52 weeks Cum
2009Cum 2008Med Max Med Max Med Max
United States 136 315 640 5,127 5,428 2,212 6,055 7,116 85,684 119,464 27 50 126 963 1,179New England 4 28 64 391 460 64 98 301 1,766 1,772 — 3 18 70 55
Connecticut — 5 14 76 109 33 53 275 811 707 — 0 12 24 2Maine§ 3 4 12 70 38 1 2 9 56 33 — 0 2 8 5Massachusetts — 11 27 150 201 21 38 112 721 853 — 2 5 32 36New Hampshire 1 2 10 30 38 — 2 6 39 45 — 0 2 2 5Rhode Island§ — 1 8 18 30 8 5 16 116 123 — 0 7 2 1Vermont§ — 3 15 47 44 1 1 4 23 11 — 0 1 2 6
Mid. Atlantic 29 61 116 955 1,069 491 604 1,138 10,736 11,798 8 10 25 191 209New Jersey — 8 21 85 177 44 83 144 1,267 2,004 — 1 7 14 35New York (Upstate) 26 23 81 388 335 85 116 664 2,040 2,191 4 3 20 52 53New York City — 15 30 262 317 239 209 577 4,104 3,588 — 2 4 36 38Pennsylvania 3 16 46 220 240 123 196 267 3,325 4,015 4 4 10 89 83
E.N. Central 21 45 89 712 828 326 1,160 1,580 16,515 25,515 1 6 27 106 183Illinois — 10 32 101 221 — 366 499 4,196 7,241 — 2 9 31 60Indiana N 0 11 N N 113 155 256 2,764 3,298 — 1 22 21 35Michigan 2 12 22 197 183 154 290 493 5,311 6,662 — 0 3 10 12Ohio 13 16 31 279 295 12 258 531 2,599 6,141 1 2 6 37 60Wisconsin 6 8 20 135 129 47 78 141 1,645 2,173 — 0 2 7 16
W.N. Central 15 26 143 500 566 67 311 393 4,975 6,074 5 3 15 69 87Iowa 3 6 18 81 93 24 30 53 565 559 — 0 0 — 2Kansas 3 3 11 47 36 35 41 83 856 807 — 0 2 9 10Minnesota — 0 106 137 191 — 50 78 624 1,213 2 0 10 15 18Missouri 4 8 22 160 152 — 144 193 2,315 2,847 2 1 4 31 40Nebraska§ 5 3 10 47 63 3 27 50 464 512 1 0 2 11 11North Dakota — 0 16 3 6 — 2 7 6 44 — 0 4 3 6South Dakota — 2 11 25 25 5 8 20 145 92 — 0 0 — —
S. Atlantic 31 65 108 1,221 879 429 1,531 2,142 17,919 28,493 8 12 23 277 300Delaware 2 1 3 11 14 21 16 35 298 432 — 0 2 3 3District of Columbia — 0 5 — 21 — 52 89 1,000 888 — 0 2 — 2Florida 26 31 57 639 388 141 418 592 7,712 9,092 5 4 9 109 75Georgia — 14 63 311 199 — 260 876 2,002 5,327 1 2 9 61 67Maryland§ — 6 10 81 85 97 121 212 1,990 2,231 — 1 6 36 50North Carolina N 0 0 N N — 309 647 — 3,242 — 1 6 20 29South Carolina§ 1 2 8 35 40 93 169 316 2,299 3,581 1 1 5 22 27Virginia§ 2 8 31 128 104 77 173 321 2,420 3,404 — 1 5 12 38West Virginia — 1 5 16 28 — 12 26 198 296 1 0 3 14 9
E.S. Central 1 8 22 102 144 339 544 771 8,969 10,760 2 3 6 54 70Alabama§ — 4 12 48 75 — 165 216 2,027 3,685 — 0 2 11 8Kentucky N 0 0 N N 51 86 153 1,156 1,484 — 0 2 7 5Mississippi N 0 0 N N 133 143 253 2,770 2,471 — 0 1 — 10Tennessee§ 1 4 13 54 69 155 162 301 3,016 3,120 2 2 5 36 47
W.S. Central 3 8 22 104 90 148 930 1,307 11,327 18,672 2 2 22 49 56Arkansas§ 3 2 8 40 39 107 83 167 1,628 1,682 2 0 2 8 4Louisiana — 2 10 37 32 32 158 410 1,595 3,373 — 0 1 8 5Oklahoma — 3 18 27 19 9 70 437 1,139 1,844 — 1 20 33 42Texas§ N 0 0 N N — 595 725 6,965 11,773 — 0 1 — 5
Mountain 3 27 62 352 427 72 195 345 2,623 4,491 1 5 11 102 150Arizona 1 3 10 59 41 15 58 82 720 1,333 — 1 7 40 63Colorado — 9 27 113 160 — 58 249 716 1,358 — 1 5 25 26Idaho§ 1 3 14 35 48 1 3 13 38 63 — 0 2 2 6Montana§ — 2 9 30 23 — 2 6 32 41 — 0 1 1 1Nevada§ 1 2 8 25 34 30 34 86 698 949 — 0 2 9 8New Mexico§ — 1 8 27 34 23 23 52 332 492 1 1 3 14 22Utah — 7 18 47 74 — 6 15 61 222 — 0 2 11 24Wyoming§ — 1 4 16 13 3 2 8 26 33 — 0 2 — —
Pacific 29 54 127 790 965 276 583 756 10,854 11,889 — 2 11 45 69Alaska 2 2 10 23 26 9 14 24 275 183 — 0 2 3 8California 22 34 59 556 678 212 488 658 9,173 9,751 — 0 3 7 27Hawaii — 0 4 4 12 — 12 19 198 211 — 0 2 12 7Oregon§ — 7 60 116 165 25 21 48 389 488 — 1 10 20 25Washington 5 8 74 91 84 30 51 81 819 1,256 — 0 2 3 2
American Samoa — 0 0 — — — 0 1 — 2 — 0 0 — —C.N.M.I. — — — — — — — — — — — — — — —Guam — 0 0 — — — 2 15 — 19 — 0 0 — —Puerto Rico — 3 15 25 52 — 5 16 73 102 — 0 1 — —U.S. Virgin Islands — 0 0 — — — 2 6 23 44 N 0 0 N N
C.N.M.I.: Commonwealth of Northern Mariana Islands.U: Unavailable. —: No reported cases. N: Not notifiable. Cum: Cumulative year-to-date counts. Med: Median. Max: Maximum. * Incidence data for reporting year 2008 and 2009 are provisional. † Data for H. influenzae (age <5 yrs for serotype b, nonserotype b, and unknown serotype) are available in Table I.§ Contains data reported through the National Electronic Disease Surveillance System (NEDSS).
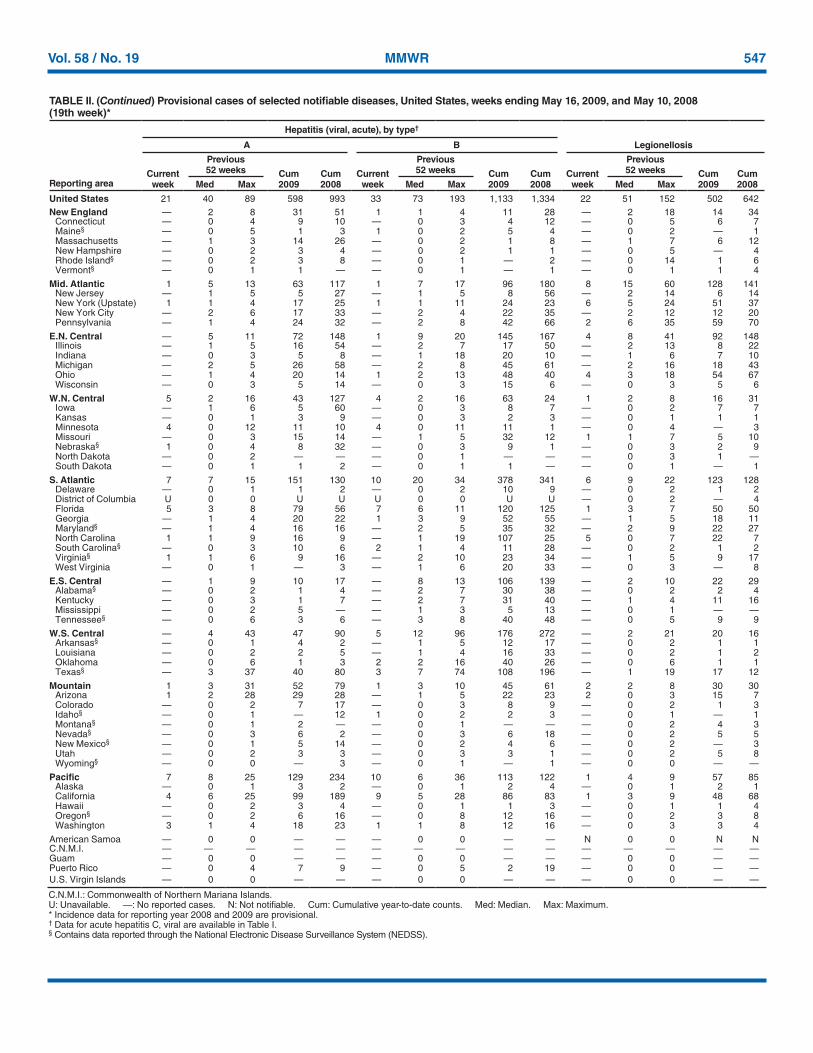
Vol. 58 / No. 19 MMWR 547
TABLE II. (Continued) Provisional cases of selected notifiable diseases, United States, weeks ending May 16, 2009, and May 10, 2008 (19th week)*
Reporting area
Hepatitis (viral, acute), by type†
LegionellosisA B
Current week
Previous 52 weeks Cum
2009Cum 2008
Current week
Previous 52 weeks Cum
2009Cum 2008
Current week
Previous 52 weeks Cum
2009Cum 2008Med Max Med Max Med Max
United States 21 40 89 598 993 33 73 193 1,133 1,334 22 51 152 502 642New England — 2 8 31 51 1 1 4 11 28 — 2 18 14 34
Connecticut — 0 4 9 10 — 0 3 4 12 — 0 5 6 7Maine§ — 0 5 1 3 1 0 2 5 4 — 0 2 — 1Massachusetts — 1 3 14 26 — 0 2 1 8 — 1 7 6 12New Hampshire — 0 2 3 4 — 0 2 1 1 — 0 5 — 4Rhode Island§ — 0 2 3 8 — 0 1 — 2 — 0 14 1 6Vermont§ — 0 1 1 — — 0 1 — 1 — 0 1 1 4
Mid. Atlantic 1 5 13 63 117 1 7 17 96 180 8 15 60 128 141New Jersey — 1 5 5 27 — 1 5 8 56 — 2 14 6 14New York (Upstate) 1 1 4 17 25 1 1 11 24 23 6 5 24 51 37New York City — 2 6 17 33 — 2 4 22 35 — 2 12 12 20Pennsylvania — 1 4 24 32 — 2 8 42 66 2 6 35 59 70
E.N. Central — 5 11 72 148 1 9 20 145 167 4 8 41 92 148Illinois — 1 5 16 54 — 2 7 17 50 — 2 13 8 22Indiana — 0 3 5 8 — 1 18 20 10 — 1 6 7 10Michigan — 2 5 26 58 — 2 8 45 61 — 2 16 18 43Ohio — 1 4 20 14 1 2 13 48 40 4 3 18 54 67Wisconsin — 0 3 5 14 — 0 3 15 6 — 0 3 5 6
W.N. Central 5 2 16 43 127 4 2 16 63 24 1 2 8 16 31Iowa — 1 6 5 60 — 0 3 8 7 — 0 2 7 7Kansas — 0 1 3 9 — 0 3 2 3 — 0 1 1 1Minnesota 4 0 12 11 10 4 0 11 11 1 — 0 4 — 3Missouri — 0 3 15 14 — 1 5 32 12 1 1 7 5 10Nebraska§ 1 0 4 8 32 — 0 3 9 1 — 0 3 2 9North Dakota — 0 2 — — — 0 1 — — — 0 3 1 —South Dakota — 0 1 1 2 — 0 1 1 — — 0 1 — 1
S. Atlantic 7 7 15 151 130 10 20 34 378 341 6 9 22 123 128Delaware — 0 1 1 2 — 0 2 10 9 — 0 2 1 2District of Columbia U 0 0 U U U 0 0 U U — 0 2 — 4Florida 5 3 8 79 56 7 6 11 120 125 1 3 7 50 50Georgia — 1 4 20 22 1 3 9 52 55 — 1 5 18 11Maryland§ — 1 4 16 16 — 2 5 35 32 — 2 9 22 27North Carolina 1 1 9 16 9 — 1 19 107 25 5 0 7 22 7South Carolina§ — 0 3 10 6 2 1 4 11 28 — 0 2 1 2Virginia§ 1 1 6 9 16 — 2 10 23 34 — 1 5 9 17West Virginia — 0 1 — 3 — 1 6 20 33 — 0 3 — 8
E.S. Central — 1 9 10 17 — 8 13 106 139 — 2 10 22 29Alabama§ — 0 2 1 4 — 2 7 30 38 — 0 2 2 4Kentucky — 0 3 1 7 — 2 7 31 40 — 1 4 11 16Mississippi — 0 2 5 — — 1 3 5 13 — 0 1 — —Tennessee§ — 0 6 3 6 — 3 8 40 48 — 0 5 9 9
W.S. Central — 4 43 47 90 5 12 96 176 272 — 2 21 20 16Arkansas§ — 0 1 4 2 — 1 5 12 17 — 0 2 1 1Louisiana — 0 2 2 5 — 1 4 16 33 — 0 2 1 2Oklahoma — 0 6 1 3 2 2 16 40 26 — 0 6 1 1Texas§ — 3 37 40 80 3 7 74 108 196 — 1 19 17 12
Mountain 1 3 31 52 79 1 3 10 45 61 2 2 8 30 30Arizona 1 2 28 29 28 — 1 5 22 23 2 0 3 15 7Colorado — 0 2 7 17 — 0 3 8 9 — 0 2 1 3Idaho§ — 0 1 — 12 1 0 2 2 3 — 0 1 — 1Montana§ — 0 1 2 — — 0 1 — — — 0 2 4 3Nevada§ — 0 3 6 2 — 0 3 6 18 — 0 2 5 5New Mexico§ — 0 1 5 14 — 0 2 4 6 — 0 2 — 3Utah — 0 2 3 3 — 0 3 3 1 — 0 2 5 8Wyoming§ — 0 0 — 3 — 0 1 — 1 — 0 0 — —
Pacific 7 8 25 129 234 10 6 36 113 122 1 4 9 57 85Alaska — 0 1 3 2 — 0 1 2 4 — 0 1 2 1California 4 6 25 99 189 9 5 28 86 83 1 3 9 48 68Hawaii — 0 2 3 4 — 0 1 1 3 — 0 1 1 4Oregon§ — 0 2 6 16 — 0 8 12 16 — 0 2 3 8Washington 3 1 4 18 23 1 1 8 12 16 — 0 3 3 4
American Samoa — 0 0 — — — 0 0 — — N 0 0 N NC.N.M.I. — — — — — — — — — — — — — — —Guam — 0 0 — — — 0 0 — — — 0 0 — —Puerto Rico — 0 4 7 9 — 0 5 2 19 — 0 0 — —U.S. Virgin Islands — 0 0 — — — 0 0 — — — 0 0 — —
C.N.M.I.: Commonwealth of Northern Mariana Islands.U: Unavailable. —: No reported cases. N: Not notifiable. Cum: Cumulative year-to-date counts. Med: Median. Max: Maximum. * Incidence data for reporting year 2008 and 2009 are provisional. † Data for acute hepatitis C, viral are available in Table I.§ Contains data reported through the National Electronic Disease Surveillance System (NEDSS).
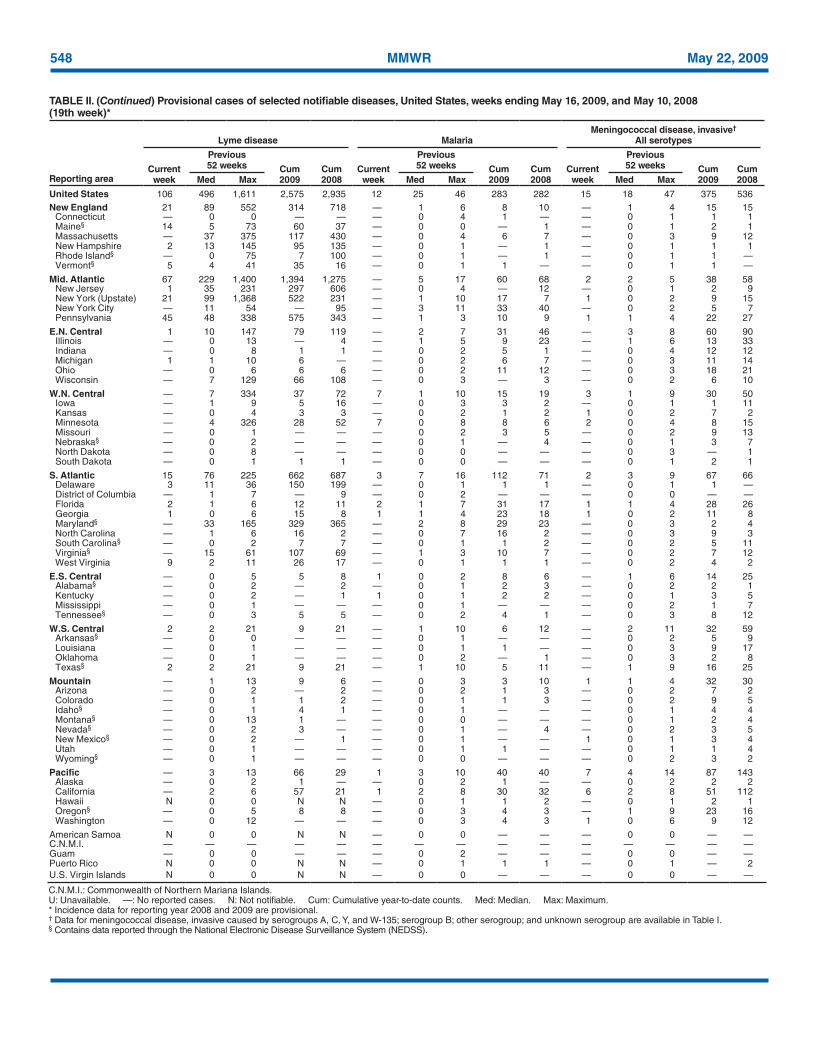
548 MMWR May 22, 2009
TABLE II. (Continued) Provisional cases of selected notifiable diseases, United States, weeks ending May 16, 2009, and May 10, 2008 (19th week)*
Reporting area
Lyme disease MalariaMeningococcal disease, invasive†
All serotypes
Current week
Previous 52 weeks Cum
2009Cum 2008
Current week
Previous 52 weeks Cum
2009Cum 2008
Current week
Previous 52 weeks Cum
2009Cum 2008Med Max Med Max Med Max
United States 106 496 1,611 2,575 2,935 12 25 46 283 282 15 18 47 375 536New England 21 89 552 314 718 — 1 6 8 10 — 1 4 15 15
Connecticut — 0 0 — — — 0 4 1 — — 0 1 1 1Maine§ 14 5 73 60 37 — 0 0 — 1 — 0 1 2 1Massachusetts — 37 375 117 430 — 0 4 6 7 — 0 3 9 12New Hampshire 2 13 145 95 135 — 0 1 — 1 — 0 1 1 1Rhode Island§ — 0 75 7 100 — 0 1 — 1 — 0 1 1 —Vermont§ 5 4 41 35 16 — 0 1 1 — — 0 1 1 —
Mid. Atlantic 67 229 1,400 1,394 1,275 — 5 17 60 68 2 2 5 38 58New Jersey 1 35 231 297 606 — 0 4 — 12 — 0 1 2 9New York (Upstate) 21 99 1,368 522 231 — 1 10 17 7 1 0 2 9 15New York City — 11 54 — 95 — 3 11 33 40 — 0 2 5 7Pennsylvania 45 48 338 575 343 — 1 3 10 9 1 1 4 22 27
E.N. Central 1 10 147 79 119 — 2 7 31 46 — 3 8 60 90Illinois — 0 13 — 4 — 1 5 9 23 — 1 6 13 33Indiana — 0 8 1 1 — 0 2 5 1 — 0 4 12 12Michigan 1 1 10 6 — — 0 2 6 7 — 0 3 11 14Ohio — 0 6 6 6 — 0 2 11 12 — 0 3 18 21Wisconsin — 7 129 66 108 — 0 3 — 3 — 0 2 6 10
W.N. Central — 7 334 37 72 7 1 10 15 19 3 1 9 30 50Iowa — 1 9 5 16 — 0 3 3 2 — 0 1 1 11Kansas — 0 4 3 3 — 0 2 1 2 1 0 2 7 2Minnesota — 4 326 28 52 7 0 8 8 6 2 0 4 8 15Missouri — 0 1 — — — 0 2 3 5 — 0 2 9 13Nebraska§ — 0 2 — — — 0 1 — 4 — 0 1 3 7North Dakota — 0 8 — — — 0 0 — — — 0 3 — 1South Dakota — 0 1 1 1 — 0 0 — — — 0 1 2 1
S. Atlantic 15 76 225 662 687 3 7 16 112 71 2 3 9 67 66Delaware 3 11 36 150 199 — 0 1 1 1 — 0 1 1 —District of Columbia — 1 7 — 9 — 0 2 — — — 0 0 — —Florida 2 1 6 12 11 2 1 7 31 17 1 1 4 28 26Georgia 1 0 6 15 8 1 1 4 23 18 1 0 2 11 8Maryland§ — 33 165 329 365 — 2 8 29 23 — 0 3 2 4North Carolina — 1 6 16 2 — 0 7 16 2 — 0 3 9 3South Carolina§ — 0 2 7 7 — 0 1 1 2 — 0 2 5 11Virginia§ — 15 61 107 69 — 1 3 10 7 — 0 2 7 12West Virginia 9 2 11 26 17 — 0 1 1 1 — 0 2 4 2
E.S. Central — 0 5 5 8 1 0 2 8 6 — 1 6 14 25Alabama§ — 0 2 — 2 — 0 1 2 3 — 0 2 2 1Kentucky — 0 2 — 1 1 0 1 2 2 — 0 1 3 5Mississippi — 0 1 — — — 0 1 — — — 0 2 1 7Tennessee§ — 0 3 5 5 — 0 2 4 1 — 0 3 8 12
W.S. Central 2 2 21 9 21 — 1 10 6 12 — 2 11 32 59Arkansas§ — 0 0 — — — 0 1 — — — 0 2 5 9Louisiana — 0 1 — — — 0 1 1 — — 0 3 9 17Oklahoma — 0 1 — — — 0 2 — 1 — 0 3 2 8Texas§ 2 2 21 9 21 — 1 10 5 11 — 1 9 16 25
Mountain — 1 13 9 6 — 0 3 3 10 1 1 4 32 30Arizona — 0 2 — 2 — 0 2 1 3 — 0 2 7 2Colorado — 0 1 1 2 — 0 1 1 3 — 0 2 9 5Idaho§ — 0 1 4 1 — 0 1 — — — 0 1 4 4Montana§ — 0 13 1 — — 0 0 — — — 0 1 2 4Nevada§ — 0 2 3 — — 0 1 — 4 — 0 2 3 5New Mexico§ — 0 2 — 1 — 0 1 — — 1 0 1 3 4Utah — 0 1 — — — 0 1 1 — — 0 1 1 4Wyoming§ — 0 1 — — — 0 0 — — — 0 2 3 2
Pacific — 3 13 66 29 1 3 10 40 40 7 4 14 87 143Alaska — 0 2 1 — — 0 2 1 — — 0 2 2 2California — 2 6 57 21 1 2 8 30 32 6 2 8 51 112Hawaii N 0 0 N N — 0 1 1 2 — 0 1 2 1Oregon§ — 0 5 8 8 — 0 3 4 3 — 1 9 23 16Washington — 0 12 — — — 0 3 4 3 1 0 6 9 12
American Samoa N 0 0 N N — 0 0 — — — 0 0 — —C.N.M.I. — — — — — — — — — — — — — — —Guam — 0 0 — — — 0 2 — — — 0 0 — —Puerto Rico N 0 0 N N — 0 1 1 1 — 0 1 — 2U.S. Virgin Islands N 0 0 N N — 0 0 — — — 0 0 — —
C.N.M.I.: Commonwealth of Northern Mariana Islands.U: Unavailable. —: No reported cases. N: Not notifiable. Cum: Cumulative year-to-date counts. Med: Median. Max: Maximum. * Incidence data for reporting year 2008 and 2009 are provisional. † Data for meningococcal disease, invasive caused by serogroups A, C, Y, and W-135; serogroup B; other serogroup; and unknown serogroup are available in Table I.§ Contains data reported through the National Electronic Disease Surveillance System (NEDSS).
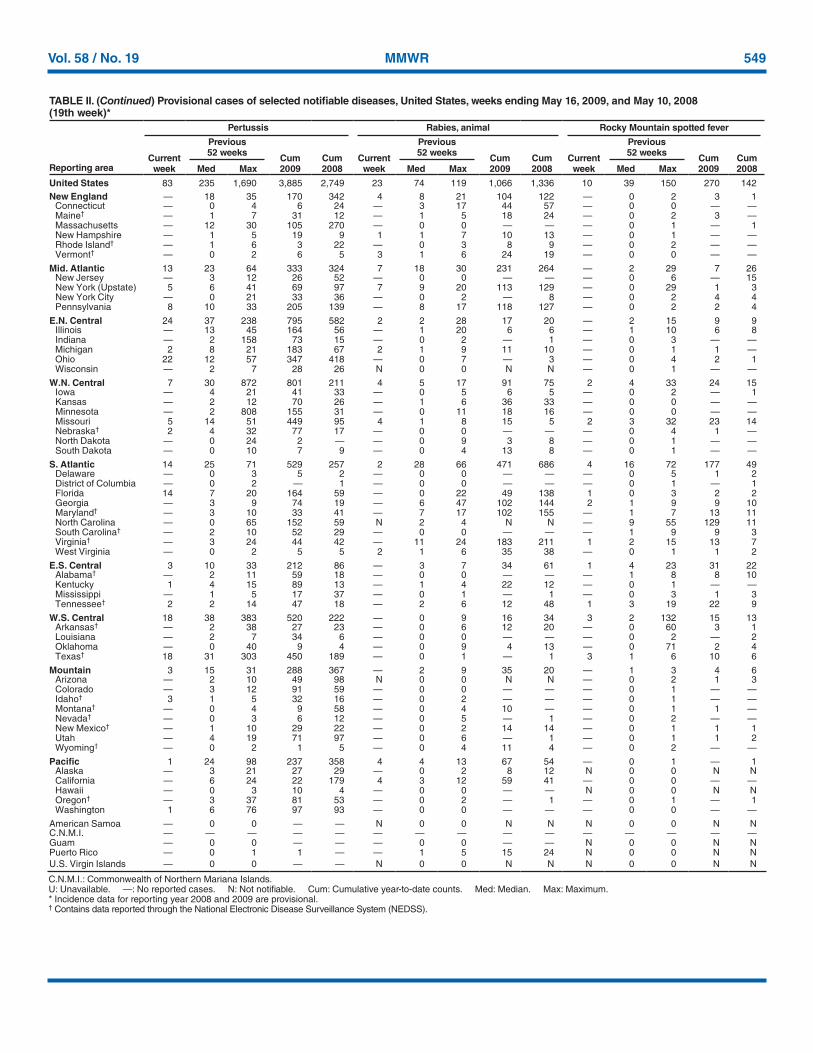
Vol. 58 / No. 19 MMWR 549
TABLE II. (Continued) Provisional cases of selected notifiable diseases, United States, weeks ending May 16, 2009, and May 10, 2008 (19th week)*
Reporting area
Pertussis Rabies, animal Rocky Mountain spotted fever
Current week
Previous 52 weeks
Cum 2009
Cum 2008
Current week
Previous 52 weeks
Cum 2009
Cum 2008
Current week
Previous 52 weeks
Cum 2009
Cum 2008Med Max Med Max Med Max
United States 83 235 1,690 3,885 2,749 23 74 119 1,066 1,336 10 39 150 270 142New England — 18 35 170 342 4 8 21 104 122 — 0 2 3 1
Connecticut — 0 4 6 24 — 3 17 44 57 — 0 0 — —Maine† — 1 7 31 12 — 1 5 18 24 — 0 2 3 —Massachusetts — 12 30 105 270 — 0 0 — — — 0 1 — 1New Hampshire — 1 5 19 9 1 1 7 10 13 — 0 1 — —Rhode Island† — 1 6 3 22 — 0 3 8 9 — 0 2 — —Vermont† — 0 2 6 5 3 1 6 24 19 — 0 0 — —
Mid. Atlantic 13 23 64 333 324 7 18 30 231 264 — 2 29 7 26New Jersey — 3 12 26 52 — 0 0 — — — 0 6 — 15New York (Upstate) 5 6 41 69 97 7 9 20 113 129 — 0 29 1 3New York City — 0 21 33 36 — 0 2 — 8 — 0 2 4 4Pennsylvania 8 10 33 205 139 — 8 17 118 127 — 0 2 2 4
E.N. Central 24 37 238 795 582 2 2 28 17 20 — 2 15 9 9Illinois — 13 45 164 56 — 1 20 6 6 — 1 10 6 8Indiana — 2 158 73 15 — 0 2 — 1 — 0 3 — —Michigan 2 8 21 183 67 2 1 9 11 10 — 0 1 1 —Ohio 22 12 57 347 418 — 0 7 — 3 — 0 4 2 1Wisconsin — 2 7 28 26 N 0 0 N N — 0 1 — —
W.N. Central 7 30 872 801 211 4 5 17 91 75 2 4 33 24 15Iowa — 4 21 41 33 — 0 5 6 5 — 0 2 — 1Kansas — 2 12 70 26 — 1 6 36 33 — 0 0 — —Minnesota — 2 808 155 31 — 0 11 18 16 — 0 0 — —Missouri 5 14 51 449 95 4 1 8 15 5 2 3 32 23 14Nebraska† 2 4 32 77 17 — 0 0 — — — 0 4 1 —North Dakota — 0 24 2 — — 0 9 3 8 — 0 1 — —South Dakota — 0 10 7 9 — 0 4 13 8 — 0 1 — —
S. Atlantic 14 25 71 529 257 2 28 66 471 686 4 16 72 177 49Delaware — 0 3 5 2 — 0 0 — — — 0 5 1 2District of Columbia — 0 2 — 1 — 0 0 — — — 0 1 — 1Florida 14 7 20 164 59 — 0 22 49 138 1 0 3 2 2Georgia — 3 9 74 19 — 6 47 102 144 2 1 9 9 10Maryland† — 3 10 33 41 — 7 17 102 155 — 1 7 13 11North Carolina — 0 65 152 59 N 2 4 N N — 9 55 129 11South Carolina† — 2 10 52 29 — 0 0 — — — 1 9 9 3Virginia† — 3 24 44 42 — 11 24 183 211 1 2 15 13 7West Virginia — 0 2 5 5 2 1 6 35 38 — 0 1 1 2
E.S. Central 3 10 33 212 86 — 3 7 34 61 1 4 23 31 22Alabama† — 2 11 59 18 — 0 0 — — — 1 8 8 10Kentucky 1 4 15 89 13 — 1 4 22 12 — 0 1 — —Mississippi — 1 5 17 37 — 0 1 — 1 — 0 3 1 3Tennessee† 2 2 14 47 18 — 2 6 12 48 1 3 19 22 9
W.S. Central 18 38 383 520 222 — 0 9 16 34 3 2 132 15 13Arkansas† — 2 38 27 23 — 0 6 12 20 — 0 60 3 1Louisiana — 2 7 34 6 — 0 0 — — — 0 2 — 2Oklahoma — 0 40 9 4 — 0 9 4 13 — 0 71 2 4Texas† 18 31 303 450 189 — 0 1 — 1 3 1 6 10 6
Mountain 3 15 31 288 367 — 2 9 35 20 — 1 3 4 6Arizona — 2 10 49 98 N 0 0 N N — 0 2 1 3Colorado — 3 12 91 59 — 0 0 — — — 0 1 — —Idaho† 3 1 5 32 16 — 0 2 — — — 0 1 — —Montana† — 0 4 9 58 — 0 4 10 — — 0 1 1 —Nevada† — 0 3 6 12 — 0 5 — 1 — 0 2 — —New Mexico† — 1 10 29 22 — 0 2 14 14 — 0 1 1 1Utah — 4 19 71 97 — 0 6 — 1 — 0 1 1 2Wyoming† — 0 2 1 5 — 0 4 11 4 — 0 2 — —
Pacific 1 24 98 237 358 4 4 13 67 54 — 0 1 — 1Alaska — 3 21 27 29 — 0 2 8 12 N 0 0 N NCalifornia — 6 24 22 179 4 3 12 59 41 — 0 0 — —Hawaii — 0 3 10 4 — 0 0 — — N 0 0 N NOregon† — 3 37 81 53 — 0 2 — 1 — 0 1 — 1Washington 1 6 76 97 93 — 0 0 — — — 0 0 — —
American Samoa — 0 0 — — N 0 0 N N N 0 0 N NC.N.M.I. — — — — — — — — — — — — — — —Guam — 0 0 — — — 0 0 — — N 0 0 N NPuerto Rico — 0 1 1 — — 1 5 15 24 N 0 0 N NU.S. Virgin Islands — 0 0 — — N 0 0 N N N 0 0 N N
C.N.M.I.: Commonwealth of Northern Mariana Islands.U: Unavailable. —: No reported cases. N: Not notifiable. Cum: Cumulative year-to-date counts. Med: Median. Max: Maximum. * Incidence data for reporting year 2008 and 2009 are provisional. † Contains data reported through the National Electronic Disease Surveillance System (NEDSS).
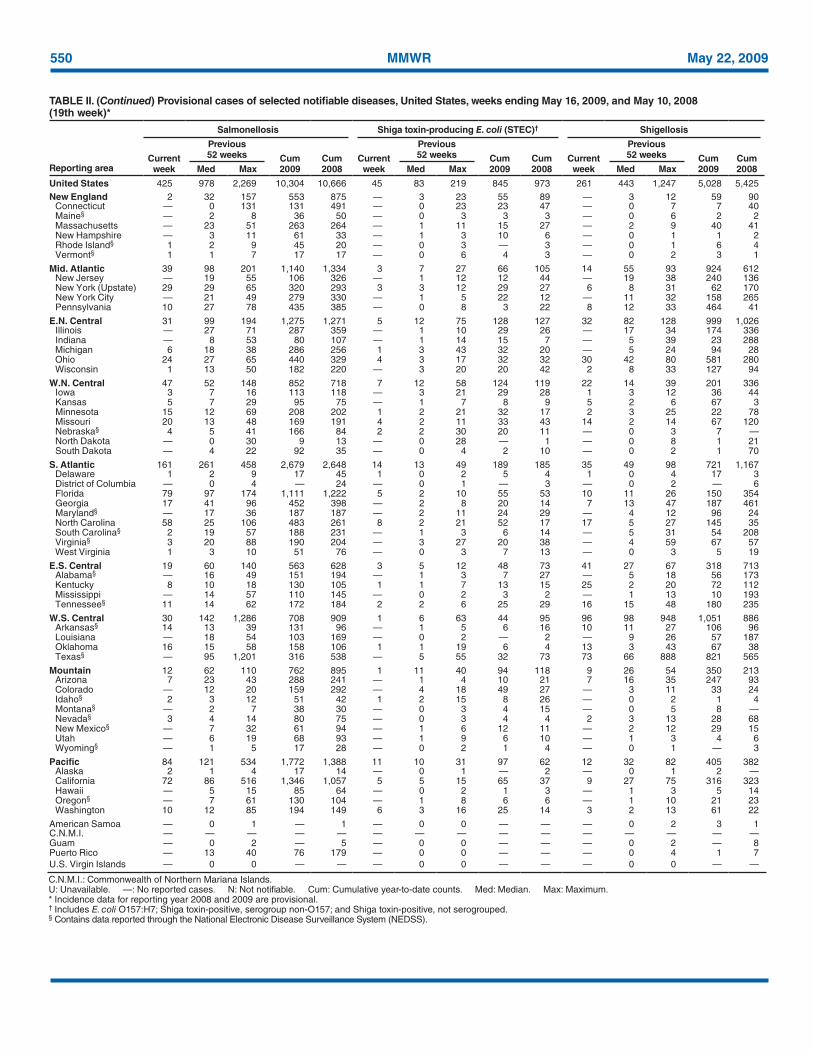
550 MMWR May 22, 2009
TABLE II. (Continued) Provisional cases of selected notifiable diseases, United States, weeks ending May 16, 2009, and May 10, 2008 (19th week)*
Reporting area
Salmonellosis Shiga toxin-producing E. coli (STEC)† Shigellosis
Current week
Previous 52 weeks Cum
2009Cum 2008
Current week
Previous 52 weeks Cum
2009Cum 2008
Current week
Previous 52 weeks Cum
2009Cum 2008Med Max Med Max Med Max
United States 425 978 2,269 10,304 10,666 45 83 219 845 973 261 443 1,247 5,028 5,425New England 2 32 157 553 875 — 3 23 55 89 — 3 12 59 90
Connecticut — 0 131 131 491 — 0 23 23 47 — 0 7 7 40Maine§ — 2 8 36 50 — 0 3 3 3 — 0 6 2 2Massachusetts — 23 51 263 264 — 1 11 15 27 — 2 9 40 41New Hampshire — 3 11 61 33 — 1 3 10 6 — 0 1 1 2Rhode Island§ 1 2 9 45 20 — 0 3 — 3 — 0 1 6 4Vermont§ 1 1 7 17 17 — 0 6 4 3 — 0 2 3 1
Mid. Atlantic 39 98 201 1,140 1,334 3 7 27 66 105 14 55 93 924 612New Jersey — 19 55 106 326 — 1 12 12 44 — 19 38 240 136New York (Upstate) 29 29 65 320 293 3 3 12 29 27 6 8 31 62 170New York City — 21 49 279 330 — 1 5 22 12 — 11 32 158 265Pennsylvania 10 27 78 435 385 — 0 8 3 22 8 12 33 464 41
E.N. Central 31 99 194 1,275 1,271 5 12 75 128 127 32 82 128 999 1,026Illinois — 27 71 287 359 — 1 10 29 26 — 17 34 174 336Indiana — 8 53 80 107 — 1 14 15 7 — 5 39 23 288Michigan 6 18 38 286 256 1 3 43 32 20 — 5 24 94 28Ohio 24 27 65 440 329 4 3 17 32 32 30 42 80 581 280Wisconsin 1 13 50 182 220 — 3 20 20 42 2 8 33 127 94
W.N. Central 47 52 148 852 718 7 12 58 124 119 22 14 39 201 336Iowa 3 7 16 113 118 — 3 21 29 28 1 3 12 36 44Kansas 5 7 29 95 75 — 1 7 8 9 5 2 6 67 3Minnesota 15 12 69 208 202 1 2 21 32 17 2 3 25 22 78Missouri 20 13 48 169 191 4 2 11 33 43 14 2 14 67 120Nebraska§ 4 5 41 166 84 2 2 30 20 11 — 0 3 7 —North Dakota — 0 30 9 13 — 0 28 — 1 — 0 8 1 21South Dakota — 4 22 92 35 — 0 4 2 10 — 0 2 1 70
S. Atlantic 161 261 458 2,679 2,648 14 13 49 189 185 35 49 98 721 1,167Delaware 1 2 9 17 45 1 0 2 5 4 1 0 4 17 3District of Columbia — 0 4 — 24 — 0 1 — 3 — 0 2 — 6Florida 79 97 174 1,111 1,222 5 2 10 55 53 10 11 26 150 354Georgia 17 41 96 452 398 — 2 8 20 14 7 13 47 187 461Maryland§ — 17 36 187 187 — 2 11 24 29 — 4 12 96 24North Carolina 58 25 106 483 261 8 2 21 52 17 17 5 27 145 35South Carolina§ 2 19 57 188 231 — 1 3 6 14 — 5 31 54 208Virginia§ 3 20 88 190 204 — 3 27 20 38 — 4 59 67 57West Virginia 1 3 10 51 76 — 0 3 7 13 — 0 3 5 19
E.S. Central 19 60 140 563 628 3 5 12 48 73 41 27 67 318 713Alabama§ — 16 49 151 194 — 1 3 7 27 — 5 18 56 173Kentucky 8 10 18 130 105 1 1 7 13 15 25 2 20 72 112Mississippi — 14 57 110 145 — 0 2 3 2 — 1 13 10 193Tennessee§ 11 14 62 172 184 2 2 6 25 29 16 15 48 180 235
W.S. Central 30 142 1,286 708 909 1 6 63 44 95 96 98 948 1,051 886Arkansas§ 14 13 39 131 96 — 1 5 6 16 10 11 27 106 96Louisiana — 18 54 103 169 — 0 2 — 2 — 9 26 57 187Oklahoma 16 15 58 158 106 1 1 19 6 4 13 3 43 67 38Texas§ — 95 1,201 316 538 — 5 55 32 73 73 66 888 821 565
Mountain 12 62 110 762 895 1 11 40 94 118 9 26 54 350 213Arizona 7 23 43 288 241 — 1 4 10 21 7 16 35 247 93Colorado — 12 20 159 292 — 4 18 49 27 — 3 11 33 24Idaho§ 2 3 12 51 42 1 2 15 8 26 — 0 2 1 4Montana§ — 2 7 38 30 — 0 3 4 15 — 0 5 8 —Nevada§ 3 4 14 80 75 — 0 3 4 4 2 3 13 28 68New Mexico§ — 7 32 61 94 — 1 6 12 11 — 2 12 29 15Utah — 6 19 68 93 — 1 9 6 10 — 1 3 4 6Wyoming§ — 1 5 17 28 — 0 2 1 4 — 0 1 — 3
Pacific 84 121 534 1,772 1,388 11 10 31 97 62 12 32 82 405 382Alaska 2 1 4 17 14 — 0 1 — 2 — 0 1 2 —California 72 86 516 1,346 1,057 5 5 15 65 37 9 27 75 316 323Hawaii — 5 15 85 64 — 0 2 1 3 — 1 3 5 14Oregon§ — 7 61 130 104 — 1 8 6 6 — 1 10 21 23Washington 10 12 85 194 149 6 3 16 25 14 3 2 13 61 22
American Samoa — 0 1 — 1 — 0 0 — — — 0 2 3 1C.N.M.I. — — — — — — — — — — — — — — —Guam — 0 2 — 5 — 0 0 — — — 0 2 — 8Puerto Rico — 13 40 76 179 — 0 0 — — — 0 4 1 7U.S. Virgin Islands — 0 0 — — — 0 0 — — — 0 0 — —
C.N.M.I.: Commonwealth of Northern Mariana Islands.U: Unavailable. —: No reported cases. N: Not notifiable. Cum: Cumulative year-to-date counts. Med: Median. Max: Maximum. * Incidence data for reporting year 2008 and 2009 are provisional. † Includes E. coli O157:H7; Shiga toxin-positive, serogroup non-O157; and Shiga toxin-positive, not serogrouped.§ Contains data reported through the National Electronic Disease Surveillance System (NEDSS).
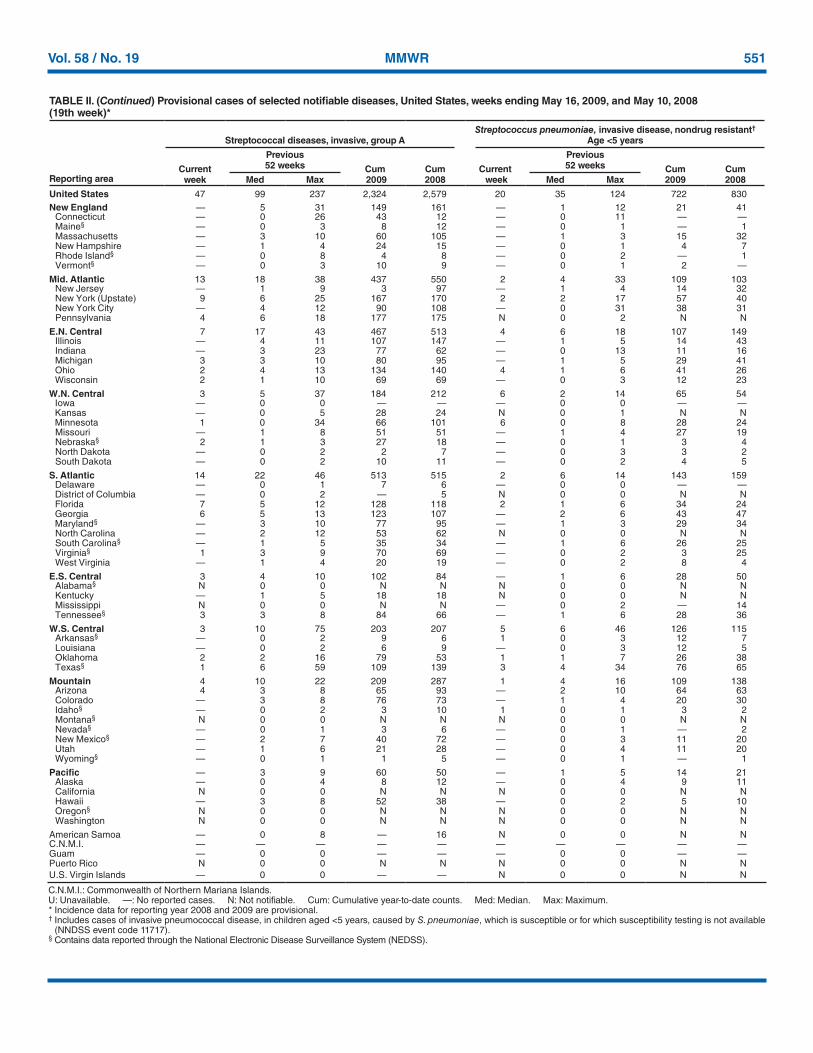
Vol. 58 / No. 19 MMWR 551
TABLE II. (Continued) Provisional cases of selected notifiable diseases, United States, weeks ending May 16, 2009, and May 10, 2008 (19th week)*
Reporting area
Streptococcal diseases, invasive, group AStreptococcus pneumoniae, invasive disease, nondrug resistant†
Age <5 years
Current week
Previous 52 weeks Cum
2009Cum 2008
Current week
Previous 52 weeks Cum
2009Cum 2008Med Max Med Max
United States 47 99 237 2,324 2,579 20 35 124 722 830New England — 5 31 149 161 — 1 12 21 41
Connecticut — 0 26 43 12 — 0 11 — —Maine§ — 0 3 8 12 — 0 1 — 1Massachusetts — 3 10 60 105 — 1 3 15 32New Hampshire — 1 4 24 15 — 0 1 4 7Rhode Island§ — 0 8 4 8 — 0 2 — 1Vermont§ — 0 3 10 9 — 0 1 2 —
Mid. Atlantic 13 18 38 437 550 2 4 33 109 103New Jersey — 1 9 3 97 — 1 4 14 32New York (Upstate) 9 6 25 167 170 2 2 17 57 40New York City — 4 12 90 108 — 0 31 38 31Pennsylvania 4 6 18 177 175 N 0 2 N N
E.N. Central 7 17 43 467 513 4 6 18 107 149Illinois — 4 11 107 147 — 1 5 14 43Indiana — 3 23 77 62 — 0 13 11 16Michigan 3 3 10 80 95 — 1 5 29 41Ohio 2 4 13 134 140 4 1 6 41 26Wisconsin 2 1 10 69 69 — 0 3 12 23
W.N. Central 3 5 37 184 212 6 2 14 65 54Iowa — 0 0 — — — 0 0 — —Kansas — 0 5 28 24 N 0 1 N NMinnesota 1 0 34 66 101 6 0 8 28 24Missouri — 1 8 51 51 — 1 4 27 19Nebraska§ 2 1 3 27 18 — 0 1 3 4North Dakota — 0 2 2 7 — 0 3 3 2South Dakota — 0 2 10 11 — 0 2 4 5
S. Atlantic 14 22 46 513 515 2 6 14 143 159Delaware — 0 1 7 6 — 0 0 — —District of Columbia — 0 2 — 5 N 0 0 N NFlorida 7 5 12 128 118 2 1 6 34 24Georgia 6 5 13 123 107 — 2 6 43 47Maryland§ — 3 10 77 95 — 1 3 29 34North Carolina — 2 12 53 62 N 0 0 N NSouth Carolina§ — 1 5 35 34 — 1 6 26 25Virginia§ 1 3 9 70 69 — 0 2 3 25West Virginia — 1 4 20 19 — 0 2 8 4
E.S. Central 3 4 10 102 84 — 1 6 28 50Alabama§ N 0 0 N N N 0 0 N NKentucky — 1 5 18 18 N 0 0 N NMississippi N 0 0 N N — 0 2 — 14Tennessee§ 3 3 8 84 66 — 1 6 28 36
W.S. Central 3 10 75 203 207 5 6 46 126 115Arkansas§ — 0 2 9 6 1 0 3 12 7Louisiana — 0 2 6 9 — 0 3 12 5Oklahoma 2 2 16 79 53 1 1 7 26 38Texas§ 1 6 59 109 139 3 4 34 76 65
Mountain 4 10 22 209 287 1 4 16 109 138Arizona 4 3 8 65 93 — 2 10 64 63Colorado — 3 8 76 73 — 1 4 20 30Idaho§ — 0 2 3 10 1 0 1 3 2Montana§ N 0 0 N N N 0 0 N NNevada§ — 0 1 3 6 — 0 1 — 2New Mexico§ — 2 7 40 72 — 0 3 11 20Utah — 1 6 21 28 — 0 4 11 20Wyoming§ — 0 1 1 5 — 0 1 — 1
Pacific — 3 9 60 50 — 1 5 14 21Alaska — 0 4 8 12 — 0 4 9 11California N 0 0 N N N 0 0 N NHawaii — 3 8 52 38 — 0 2 5 10Oregon§ N 0 0 N N N 0 0 N NWashington N 0 0 N N N 0 0 N N
American Samoa — 0 8 — 16 N 0 0 N NC.N.M.I. — — — — — — — — — —Guam — 0 0 — — — 0 0 — —Puerto Rico N 0 0 N N N 0 0 N NU.S. Virgin Islands — 0 0 — — N 0 0 N N
C.N.M.I.: Commonwealth of Northern Mariana Islands.U: Unavailable. —: No reported cases. N: Not notifiable. Cum: Cumulative year-to-date counts. Med: Median. Max: Maximum. * Incidence data for reporting year 2008 and 2009 are provisional. † Includes cases of invasive pneumococcal disease, in children aged <5 years, caused by S. pneumoniae, which is susceptible or for which susceptibility testing is not available
(NNDSS event code 11717).§ Contains data reported through the National Electronic Disease Surveillance System (NEDSS).
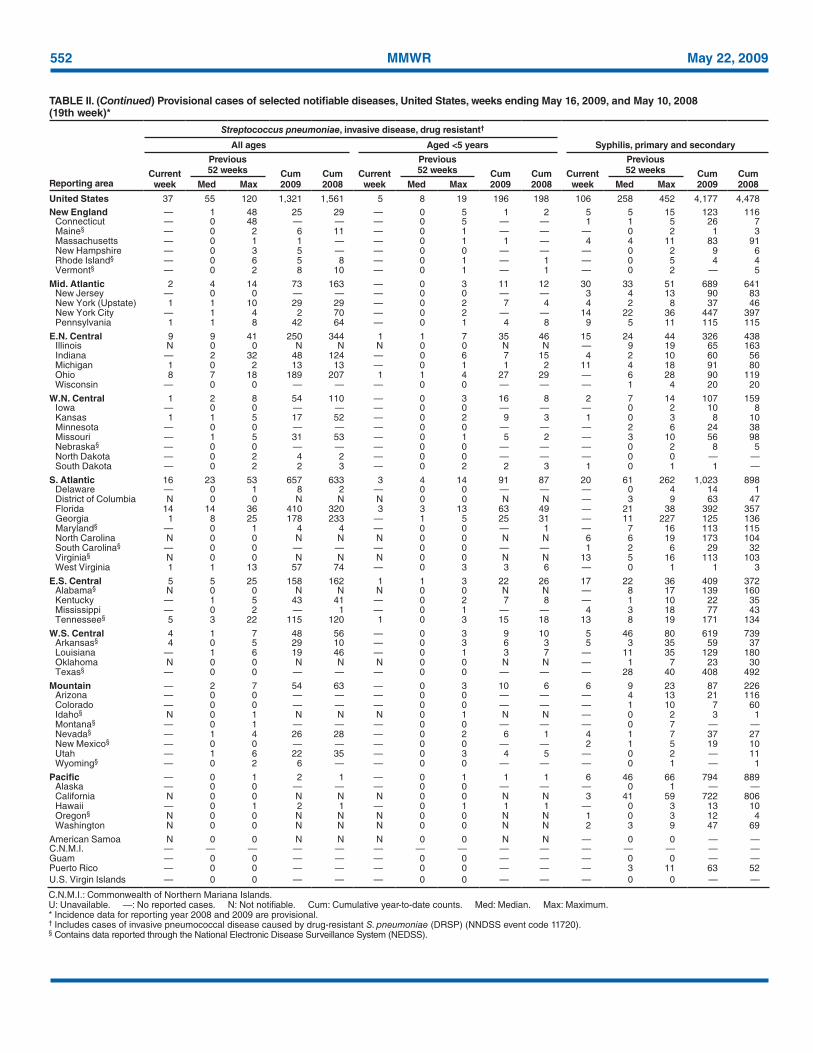
552 MMWR May 22, 2009
TABLE II. (Continued) Provisional cases of selected notifiable diseases, United States, weeks ending May 16, 2009, and May 10, 2008 (19th week)*
Reporting area
Streptococcus pneumoniae, invasive disease, drug resistant†
Syphilis, primary and secondaryAll ages Aged <5 years
Current week
Previous 52 weeks Cum
2009Cum 2008
Current week
Previous 52 weeks Cum
2009Cum 2008
Current week
Previous 52 weeks Cum
2009Cum 2008Med Max Med Max Med Max
United States 37 55 120 1,321 1,561 5 8 19 196 198 106 258 452 4,177 4,478New England — 1 48 25 29 — 0 5 1 2 5 5 15 123 116
Connecticut — 0 48 — — — 0 5 — — 1 1 5 26 7Maine§ — 0 2 6 11 — 0 1 — — — 0 2 1 3Massachusetts — 0 1 1 — — 0 1 1 — 4 4 11 83 91New Hampshire — 0 3 5 — — 0 0 — — — 0 2 9 6Rhode Island§ — 0 6 5 8 — 0 1 — 1 — 0 5 4 4Vermont§ — 0 2 8 10 — 0 1 — 1 — 0 2 — 5
Mid. Atlantic 2 4 14 73 163 — 0 3 11 12 30 33 51 689 641New Jersey — 0 0 — — — 0 0 — — 3 4 13 90 83New York (Upstate) 1 1 10 29 29 — 0 2 7 4 4 2 8 37 46New York City — 1 4 2 70 — 0 2 — — 14 22 36 447 397Pennsylvania 1 1 8 42 64 — 0 1 4 8 9 5 11 115 115
E.N. Central 9 9 41 250 344 1 1 7 35 46 15 24 44 326 438Illinois N 0 0 N N N 0 0 N N — 9 19 65 163Indiana — 2 32 48 124 — 0 6 7 15 4 2 10 60 56Michigan 1 0 2 13 13 — 0 1 1 2 11 4 18 91 80Ohio 8 7 18 189 207 1 1 4 27 29 — 6 28 90 119Wisconsin — 0 0 — — — 0 0 — — — 1 4 20 20
W.N. Central 1 2 8 54 110 — 0 3 16 8 2 7 14 107 159Iowa — 0 0 — — — 0 0 — — — 0 2 10 8Kansas 1 1 5 17 52 — 0 2 9 3 1 0 3 8 10Minnesota — 0 0 — — — 0 0 — — — 2 6 24 38Missouri — 1 5 31 53 — 0 1 5 2 — 3 10 56 98Nebraska§ — 0 0 — — — 0 0 — — — 0 2 8 5North Dakota — 0 2 4 2 — 0 0 — — — 0 0 — —South Dakota — 0 2 2 3 — 0 2 2 3 1 0 1 1 —
S. Atlantic 16 23 53 657 633 3 4 14 91 87 20 61 262 1,023 898Delaware — 0 1 8 2 — 0 0 — — — 0 4 14 1District of Columbia N 0 0 N N N 0 0 N N — 3 9 63 47Florida 14 14 36 410 320 3 3 13 63 49 — 21 38 392 357Georgia 1 8 25 178 233 — 1 5 25 31 — 11 227 125 136Maryland§ — 0 1 4 4 — 0 0 — 1 — 7 16 113 115North Carolina N 0 0 N N N 0 0 N N 6 6 19 173 104South Carolina§ — 0 0 — — — 0 0 — — 1 2 6 29 32Virginia§ N 0 0 N N N 0 0 N N 13 5 16 113 103West Virginia 1 1 13 57 74 — 0 3 3 6 — 0 1 1 3
E.S. Central 5 5 25 158 162 1 1 3 22 26 17 22 36 409 372Alabama§ N 0 0 N N N 0 0 N N — 8 17 139 160Kentucky — 1 5 43 41 — 0 2 7 8 — 1 10 22 35Mississippi — 0 2 — 1 — 0 1 — — 4 3 18 77 43Tennessee§ 5 3 22 115 120 1 0 3 15 18 13 8 19 171 134
W.S. Central 4 1 7 48 56 — 0 3 9 10 5 46 80 619 739Arkansas§ 4 0 5 29 10 — 0 3 6 3 5 3 35 59 37Louisiana — 1 6 19 46 — 0 1 3 7 — 11 35 129 180Oklahoma N 0 0 N N N 0 0 N N — 1 7 23 30Texas§ — 0 0 — — — 0 0 — — — 28 40 408 492
Mountain — 2 7 54 63 — 0 3 10 6 6 9 23 87 226Arizona — 0 0 — — — 0 0 — — — 4 13 21 116Colorado — 0 0 — — — 0 0 — — — 1 10 7 60Idaho§ N 0 1 N N N 0 1 N N — 0 2 3 1Montana§ — 0 1 — — — 0 0 — — — 0 7 — —Nevada§ — 1 4 26 28 — 0 2 6 1 4 1 7 37 27New Mexico§ — 0 0 — — — 0 0 — — 2 1 5 19 10Utah — 1 6 22 35 — 0 3 4 5 — 0 2 — 11Wyoming§ — 0 2 6 — — 0 0 — — — 0 1 — 1
Pacific — 0 1 2 1 — 0 1 1 1 6 46 66 794 889Alaska — 0 0 — — — 0 0 — — — 0 1 — —California N 0 0 N N N 0 0 N N 3 41 59 722 806Hawaii — 0 1 2 1 — 0 1 1 1 — 0 3 13 10Oregon§ N 0 0 N N N 0 0 N N 1 0 3 12 4Washington N 0 0 N N N 0 0 N N 2 3 9 47 69
American Samoa N 0 0 N N N 0 0 N N — 0 0 — —C.N.M.I. — — — — — — — — — — — — — — —Guam — 0 0 — — — 0 0 — — — 0 0 — —Puerto Rico — 0 0 — — — 0 0 — — — 3 11 63 52U.S. Virgin Islands — 0 0 — — — 0 0 — — — 0 0 — —
C.N.M.I.: Commonwealth of Northern Mariana Islands.U: Unavailable. —: No reported cases. N: Not notifiable. Cum: Cumulative year-to-date counts. Med: Median. Max: Maximum. * Incidence data for reporting year 2008 and 2009 are provisional. † Includes cases of invasive pneumococcal disease caused by drug-resistant S. pneumoniae (DRSP) (NNDSS event code 11720).§ Contains data reported through the National Electronic Disease Surveillance System (NEDSS).
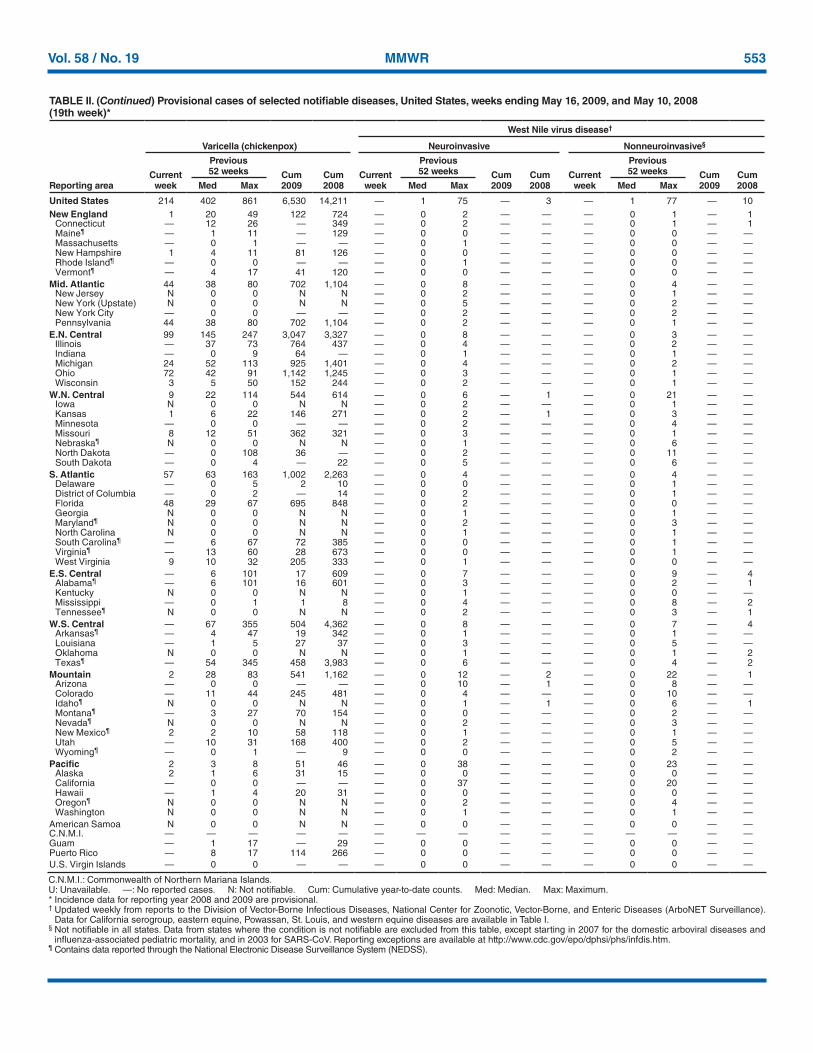
Vol. 58 / No. 19 MMWR 553
TABLE II. (Continued) Provisional cases of selected notifiable diseases, United States, weeks ending May 16, 2009, and May 10, 2008 (19th week)*
West Nile virus disease†
Reporting area
Varicella (chickenpox) Neuroinvasive Nonneuroinvasive§
Current week
Previous 52 weeks Cum
2009Cum 2008
Current week
Previous 52 weeks Cum
2009Cum 2008
Current week
Previous 52 weeks Cum
2009Cum 2008Med Max Med Max Med Max
United States 214 402 861 6,530 14,211 — 1 75 — 3 — 1 77 — 10New England 1 20 49 122 724 — 0 2 — — — 0 1 — 1
Connecticut — 12 26 — 349 — 0 2 — — — 0 1 — 1Maine¶ — 1 11 — 129 — 0 0 — — — 0 0 — —Massachusetts — 0 1 — — — 0 1 — — — 0 0 — —New Hampshire 1 4 11 81 126 — 0 0 — — — 0 0 — —Rhode Island¶ — 0 0 — — — 0 1 — — — 0 0 — —Vermont¶ — 4 17 41 120 — 0 0 — — — 0 0 — —
Mid. Atlantic 44 38 80 702 1,104 — 0 8 — — — 0 4 — —New Jersey N 0 0 N N — 0 2 — — — 0 1 — —New York (Upstate) N 0 0 N N — 0 5 — — — 0 2 — —New York City — 0 0 — — — 0 2 — — — 0 2 — —Pennsylvania 44 38 80 702 1,104 — 0 2 — — — 0 1 — —
E.N. Central 99 145 247 3,047 3,327 — 0 8 — — — 0 3 — —Illinois — 37 73 764 437 — 0 4 — — — 0 2 — —Indiana — 0 9 64 — — 0 1 — — — 0 1 — —Michigan 24 52 113 925 1,401 — 0 4 — — — 0 2 — —Ohio 72 42 91 1,142 1,245 — 0 3 — — — 0 1 — —Wisconsin 3 5 50 152 244 — 0 2 — — — 0 1 — —
W.N. Central 9 22 114 544 614 — 0 6 — 1 — 0 21 — —Iowa N 0 0 N N — 0 2 — — — 0 1 — —Kansas 1 6 22 146 271 — 0 2 — 1 — 0 3 — —Minnesota — 0 0 — — — 0 2 — — — 0 4 — —Missouri 8 12 51 362 321 — 0 3 — — — 0 1 — —Nebraska¶ N 0 0 N N — 0 1 — — — 0 6 — —North Dakota — 0 108 36 — — 0 2 — — — 0 11 — —South Dakota — 0 4 — 22 — 0 5 — — — 0 6 — —
S. Atlantic 57 63 163 1,002 2,263 — 0 4 — — — 0 4 — —Delaware — 0 5 2 10 — 0 0 — — — 0 1 — —District of Columbia — 0 2 — 14 — 0 2 — — — 0 1 — —Florida 48 29 67 695 848 — 0 2 — — — 0 0 — —Georgia N 0 0 N N — 0 1 — — — 0 1 — —Maryland¶ N 0 0 N N — 0 2 — — — 0 3 — —North Carolina N 0 0 N N — 0 1 — — — 0 1 — —South Carolina¶ — 6 67 72 385 — 0 0 — — — 0 1 — —Virginia¶ — 13 60 28 673 — 0 0 — — — 0 1 — —West Virginia 9 10 32 205 333 — 0 1 — — — 0 0 — —
E.S. Central — 6 101 17 609 — 0 7 — — — 0 9 — 4Alabama¶ — 6 101 16 601 — 0 3 — — — 0 2 — 1Kentucky N 0 0 N N — 0 1 — — — 0 0 — —Mississippi — 0 1 1 8 — 0 4 — — — 0 8 — 2Tennessee¶ N 0 0 N N — 0 2 — — — 0 3 — 1
W.S. Central — 67 355 504 4,362 — 0 8 — — — 0 7 — 4Arkansas¶ — 4 47 19 342 — 0 1 — — — 0 1 — —Louisiana — 1 5 27 37 — 0 3 — — — 0 5 — —Oklahoma N 0 0 N N — 0 1 — — — 0 1 — 2Texas¶ — 54 345 458 3,983 — 0 6 — — — 0 4 — 2
Mountain 2 28 83 541 1,162 — 0 12 — 2 — 0 22 — 1Arizona — 0 0 — — — 0 10 — 1 — 0 8 — —Colorado — 11 44 245 481 — 0 4 — — — 0 10 — —Idaho¶ N 0 0 N N — 0 1 — 1 — 0 6 — 1Montana¶ — 3 27 70 154 — 0 0 — — — 0 2 — —Nevada¶ N 0 0 N N — 0 2 — — — 0 3 — —New Mexico¶ 2 2 10 58 118 — 0 1 — — — 0 1 — —Utah — 10 31 168 400 — 0 2 — — — 0 5 — —Wyoming¶ — 0 1 — 9 — 0 0 — — — 0 2 — —
Pacific 2 3 8 51 46 — 0 38 — — — 0 23 — —Alaska 2 1 6 31 15 — 0 0 — — — 0 0 — —California — 0 0 — — — 0 37 — — — 0 20 — —Hawaii — 1 4 20 31 — 0 0 — — — 0 0 — —Oregon¶ N 0 0 N N — 0 2 — — — 0 4 — —Washington N 0 0 N N — 0 1 — — — 0 1 — —
American Samoa N 0 0 N N — 0 0 — — — 0 0 — —C.N.M.I. — — — — — — — — — — — — — — —Guam — 1 17 — 29 — 0 0 — — — 0 0 — —Puerto Rico — 8 17 114 266 — 0 0 — — — 0 0 — —U.S. Virgin Islands — 0 0 — — — 0 0 — — — 0 0 — —
C.N.M.I.: Commonwealth of Northern Mariana Islands.U: Unavailable. —: No reported cases. N: Not notifiable. Cum: Cumulative year-to-date counts. Med: Median. Max: Maximum. * Incidence data for reporting year 2008 and 2009 are provisional. † Updated weekly from reports to the Division of Vector-Borne Infectious Diseases, National Center for Zoonotic, Vector-Borne, and Enteric Diseases (ArboNET Surveillance).
Data for California serogroup, eastern equine, Powassan, St. Louis, and western equine diseases are available in Table I.§ Not notifiable in all states. Data from states where the condition is not notifiable are excluded from this table, except starting in 2007 for the domestic arboviral diseases and
influenza-associated pediatric mortality, and in 2003 for SARS-CoV. Reporting exceptions are available at http://www.cdc.gov/epo/dphsi/phs/infdis.htm.¶ Contains data reported through the National Electronic Disease Surveillance System (NEDSS).
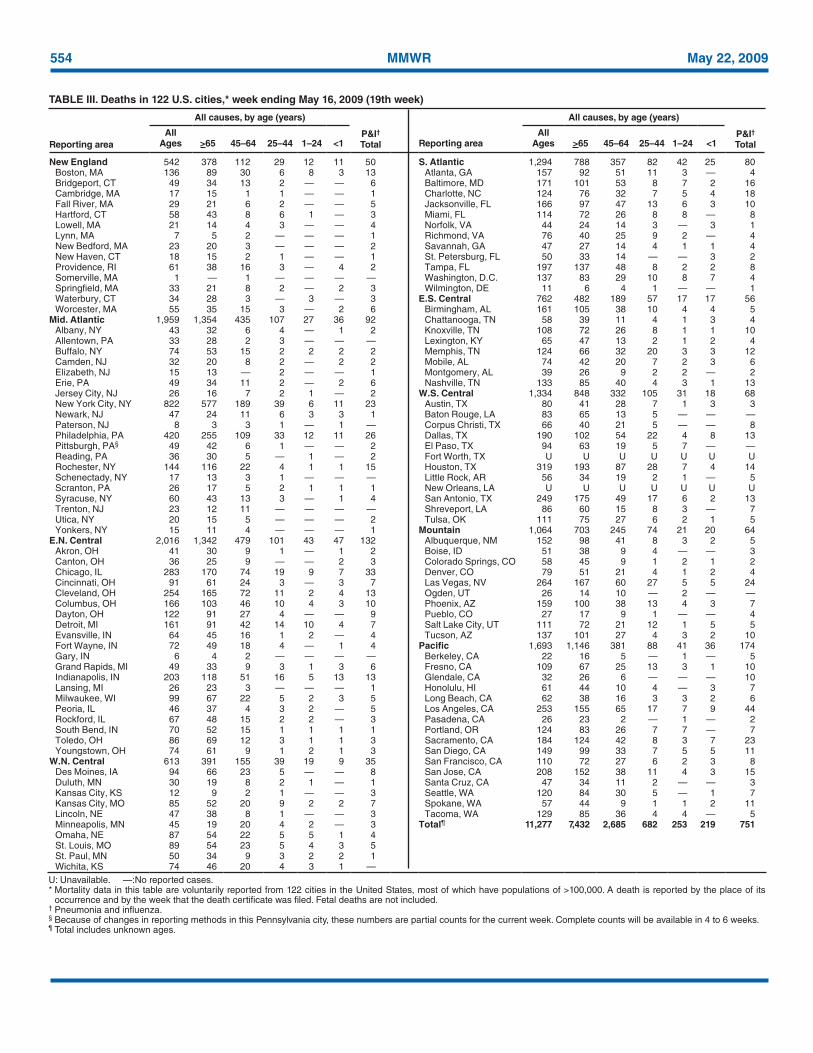
554 MMWR May 22, 2009
TABLE III. Deaths in 122 U.S. cities,* week ending May 16, 2009 (19th week)
Reporting area
All causes, by age (years)
P&I† Total Reporting area
All causes, by age (years)
P&I† Total
All Ages >65 45–64 25–44 1–24 <1
All Ages >65 45–64 25–44 1–24 <1
New England 542 378 112 29 12 11 50 S. Atlantic 1,294 788 357 82 42 25 80Boston, MA 136 89 30 6 8 3 13 Atlanta, GA 157 92 51 11 3 — 4Bridgeport, CT 49 34 13 2 — — 6 Baltimore, MD 171 101 53 8 7 2 16Cambridge, MA 17 15 1 1 — — 1 Charlotte, NC 124 76 32 7 5 4 18Fall River, MA 29 21 6 2 — — 5 Jacksonville, FL 166 97 47 13 6 3 10Hartford, CT 58 43 8 6 1 — 3 Miami, FL 114 72 26 8 8 — 8Lowell, MA 21 14 4 3 — — 4 Norfolk, VA 44 24 14 3 — 3 1Lynn, MA 7 5 2 — — — 1 Richmond, VA 76 40 25 9 2 — 4New Bedford, MA 23 20 3 — — — 2 Savannah, GA 47 27 14 4 1 1 4New Haven, CT 18 15 2 1 — — 1 St. Petersburg, FL 50 33 14 — — 3 2Providence, RI 61 38 16 3 — 4 2 Tampa, FL 197 137 48 8 2 2 8Somerville, MA 1 — 1 — — — — Washington, D.C. 137 83 29 10 8 7 4Springfield, MA 33 21 8 2 — 2 3 Wilmington, DE 11 6 4 1 — — 1Waterbury, CT 34 28 3 — 3 — 3 E.S. Central 762 482 189 57 17 17 56Worcester, MA 55 35 15 3 — 2 6 Birmingham, AL 161 105 38 10 4 4 5
Mid. Atlantic 1,959 1,354 435 107 27 36 92 Chattanooga, TN 58 39 11 4 1 3 4Albany, NY 43 32 6 4 — 1 2 Knoxville, TN 108 72 26 8 1 1 10Allentown, PA 33 28 2 3 — — — Lexington, KY 65 47 13 2 1 2 4Buffalo, NY 74 53 15 2 2 2 2 Memphis, TN 124 66 32 20 3 3 12Camden, NJ 32 20 8 2 — 2 2 Mobile, AL 74 42 20 7 2 3 6Elizabeth, NJ 15 13 — 2 — — 1 Montgomery, AL 39 26 9 2 2 — 2Erie, PA 49 34 11 2 — 2 6 Nashville, TN 133 85 40 4 3 1 13Jersey City, NJ 26 16 7 2 1 — 2 W.S. Central 1,334 848 332 105 31 18 68New York City, NY 822 577 189 39 6 11 23 Austin, TX 80 41 28 7 1 3 3Newark, NJ 47 24 11 6 3 3 1 Baton Rouge, LA 83 65 13 5 — — —Paterson, NJ 8 3 3 1 — 1 — Corpus Christi, TX 66 40 21 5 — — 8Philadelphia, PA 420 255 109 33 12 11 26 Dallas, TX 190 102 54 22 4 8 13Pittsburgh, PA§ 49 42 6 1 — — 2 El Paso, TX 94 63 19 5 7 — —Reading, PA 36 30 5 — 1 — 2 Fort Worth, TX U U U U U U URochester, NY 144 116 22 4 1 1 15 Houston, TX 319 193 87 28 7 4 14Schenectady, NY 17 13 3 1 — — — Little Rock, AR 56 34 19 2 1 — 5Scranton, PA 26 17 5 2 1 1 1 New Orleans, LA U U U U U U USyracuse, NY 60 43 13 3 — 1 4 San Antonio, TX 249 175 49 17 6 2 13Trenton, NJ 23 12 11 — — — — Shreveport, LA 86 60 15 8 3 — 7Utica, NY 20 15 5 — — — 2 Tulsa, OK 111 75 27 6 2 1 5Yonkers, NY 15 11 4 — — — 1 Mountain 1,064 703 245 74 21 20 64
E.N. Central 2,016 1,342 479 101 43 47 132 Albuquerque, NM 152 98 41 8 3 2 5Akron, OH 41 30 9 1 — 1 2 Boise, ID 51 38 9 4 — — 3Canton, OH 36 25 9 — — 2 3 Colorado Springs, CO 58 45 9 1 2 1 2Chicago, IL 283 170 74 19 9 7 33 Denver, CO 79 51 21 4 1 2 4Cincinnati, OH 91 61 24 3 — 3 7 Las Vegas, NV 264 167 60 27 5 5 24Cleveland, OH 254 165 72 11 2 4 13 Ogden, UT 26 14 10 — 2 — —Columbus, OH 166 103 46 10 4 3 10 Phoenix, AZ 159 100 38 13 4 3 7Dayton, OH 122 91 27 4 — — 9 Pueblo, CO 27 17 9 1 — — 4Detroit, MI 161 91 42 14 10 4 7 Salt Lake City, UT 111 72 21 12 1 5 5Evansville, IN 64 45 16 1 2 — 4 Tucson, AZ 137 101 27 4 3 2 10Fort Wayne, IN 72 49 18 4 — 1 4 Pacific 1,693 1,146 381 88 41 36 174Gary, IN 6 4 2 — — — — Berkeley, CA 22 16 5 — 1 — 5Grand Rapids, MI 49 33 9 3 1 3 6 Fresno, CA 109 67 25 13 3 1 10Indianapolis, IN 203 118 51 16 5 13 13 Glendale, CA 32 26 6 — — — 10Lansing, MI 26 23 3 — — — 1 Honolulu, HI 61 44 10 4 — 3 7Milwaukee, WI 99 67 22 5 2 3 5 Long Beach, CA 62 38 16 3 3 2 6Peoria, IL 46 37 4 3 2 — 5 Los Angeles, CA 253 155 65 17 7 9 44Rockford, IL 67 48 15 2 2 — 3 Pasadena, CA 26 23 2 — 1 — 2South Bend, IN 70 52 15 1 1 1 1 Portland, OR 124 83 26 7 7 — 7Toledo, OH 86 69 12 3 1 1 3 Sacramento, CA 184 124 42 8 3 7 23Youngstown, OH 74 61 9 1 2 1 3 San Diego, CA 149 99 33 7 5 5 11
W.N. Central 613 391 155 39 19 9 35 San Francisco, CA 110 72 27 6 2 3 8Des Moines, IA 94 66 23 5 — — 8 San Jose, CA 208 152 38 11 4 3 15Duluth, MN 30 19 8 2 1 — 1 Santa Cruz, CA 47 34 11 2 — — 3Kansas City, KS 12 9 2 1 — — 3 Seattle, WA 120 84 30 5 — 1 7Kansas City, MO 85 52 20 9 2 2 7 Spokane, WA 57 44 9 1 1 2 11Lincoln, NE 47 38 8 1 — — 3 Tacoma, WA 129 85 36 4 4 — 5Minneapolis, MN 45 19 20 4 2 — 3 Total¶ 11,277 7,432 2,685 682 253 219 751Omaha, NE 87 54 22 5 5 1 4St. Louis, MO 89 54 23 5 4 3 5St. Paul, MN 50 34 9 3 2 2 1Wichita, KS 74 46 20 4 3 1 —
U: Unavailable. —:No reported cases.* Mortality data in this table are voluntarily reported from 122 cities in the United States, most of which have populations of >100,000. A death is reported by the place of its
occurrence and by the week that the death certificate was filed. Fetal deaths are not included.† Pneumonia and influenza.§ Because of changes in reporting methods in this Pennsylvania city, these numbers are partial counts for the current week. Complete counts will be available in 4 to 6 weeks.¶ Total includes unknown ages.

MMWR
The Morbidity and Mortality Weekly Report (MMWR) Series is prepared by the Centers for Disease Control and Prevention (CDC) and is available free of charge in electronic format. To receive an electronic copy each week, visit MMWR’s free subscription page at http://www.cdc.gov/mmwr/mmwrsubscribe.html. Paper copy subscriptions are available through the Superintendent of Documents, U.S. Government Printing Office, Washington, DC 20402; telephone 202-512-1800.
Data in the weekly MMWR are provisional, based on weekly reports to CDC by state health departments. The reporting week concludes at close of business on Friday; compiled data on a national basis are officially released to the public on the following Friday. Data are compiled in the National Center for Public Health Informatics, Division of Integrated Surveillance Systems and Services. Address all inquiries about the MMWR Series, including material to be considered for publication, to Editor, MMWR Series, Mailstop E-90, CDC, 1600 Clifton Rd., N.E., Atlanta, GA 30333 or to [email protected].
All material in the MMWR Series is in the public domain and may be used and reprinted without permission; citation as to source, however, is appreciated.
Use of trade names and commercial sources is for identification only and does not imply endorsement by the U.S. Department of Health and Human Services.
References to non-CDC sites on the Internet are provided as a service to MMWR readers and do not constitute or imply endorsement of these organizations or their programs by CDC or the U.S. Department of Health and Human Services. CDC is not responsible for the content of these sites. URL addresses listed in MMWR were current as of the date of publication.
556 May 22, 2009
U.S. Government Printing Office: 2009-523-019/41175 Region IV ISSN: 0149-2195