morbidity and mortality weekly report · 22/12/2002 · morbidity and mortality weekly report ......
TRANSCRIPT

Morbidity and Mortality Weekly Report
Weekly February 21, 2003 / Vol. 52 / No. 7
depardepardepardepardepartment of health and human sertment of health and human sertment of health and human sertment of health and human sertment of health and human servicesvicesvicesvicesvicesCenters for Disease Control and PreventionCenters for Disease Control and PreventionCenters for Disease Control and PreventionCenters for Disease Control and PreventionCenters for Disease Control and Prevention
INSIDE
128 Atrial Fibrillation as a Contributing Cause of Death andMedicare Hospitalization — United States, 1999
131 Potential Exposures to Airborne and Settled Surface Dustin Residential Areas of Lower Manhattan Following theCollapse of the World Trade Center — New York City,November 4–December 11, 2001
136 Smallpox Vaccine Adverse Events Among Civilians —United States, January 24–February 18, 2003
136 Notice to Readers
Fatal Degenerative Neurologic Illnesses in Men Who Participatedin Wild Game Feasts — Wisconsin, 2002
Creutzfeldt-Jakob disease (CJD) is a fatal neurologic disor-der in humans. CJD is one of a group of conditions known astransmissible spongiform encephalopathies (TSEs), or priondiseases, that are believed to be caused by abnormally config-ured, host-encoded prion proteins that accumulate in the cen-tral nervous tissue (1). CJD has an annual incidence ofapproximately 1 case per million population in the UnitedStates (1) and occurs in three forms: sporadic, geneticallydetermined, and acquired by infection. In the latter form, theincubation period is measured typically in years. Recent evi-dence that prion infection can cross the species barrierbetween humans and cattle has raised increasing public healthconcerns about the possible transmission to humans of a TSEamong deer and elk known as chronic wasting disease (CWD)(2). During 1993–1999, three men who participated in wildgame feasts in northern Wisconsin died of degenerative neu-rologic illnesses. This report documents the investigation ofthese deaths, which was initiated in August 2002 and whichconfirmed the death of only one person from CJD. Althoughno association between CWD and CJD was found, contin-ued surveillance of both diseases remains important to assessthe possible risk for CWD transmission to humans.
Case ReportsCase 1. In December 1992, a Wisconsin man aged 66 years
with a history of seizures since 1969 sought treatment forrecurring seizures, increasing forgetfulness, and worseninghand tremors. Electroencephalographic (EEG) examinationdemonstrated focal epileptiform activity and nonspecific dif-fuse abnormalities, but no specific diagnosis was made. InFebruary 1993, he was hospitalized for increasing confusion,ataxia, and movement tremors of his extremities. A magneticresonance image (MRI) demonstrated mild, nonspecificenhancement along the inferior parasagittal occipital lobe.
A repeat EEG showed bifrontal intermittent, short-interval,periodic sharp waves, suggesting a progressive encephalopa-thy; a diagnosis of CJD was suspected. The man died laterthat month; neuropathologic examination of brain tissue dur-ing autopsy indicated subacute spongiform encephalopathy,compatible with CJD.
The man was a lifelong hunter who ate venison frequently.He hunted primarily in northern Wisconsin but also at leastonce in Montana. He hosted wild game feasts at his cabin innorthern Wisconsin from 1976 until shortly before his death.Fixed brain tissue obtained during the autopsy was sent foranalysis to the National Prion Disease Pathology SurveillanceCenter (NPDPSC) and reexamined at the institution wherethe autopsy was conducted. Histopathologic examination didnot substantiate the diagnosis of prion disease. In addition,27 brain tissue sections were negative for prions byimmunostaining despite positive antibody reactions againstother proteins (controls), which indicated that other epitopesin the tissue samples were preserved.
Case 2. In May 1999, a Minnesota man aged 55 years withno previous history of a neurologic disease sought evaluationand treatment following a 3-month history of progressive dif-ficulty in writing and unsteadiness of gait. A computerized

126 MMWR February 21, 2003
SUGGESTED CITATIONCenters for Disease Control and Prevention. [ArticleTitle]. MMWR 2003;52:[inclusive page numbers].
Centers for Disease Control and Prevention
Julie L. Gerberding, M.D., M.P.H.Director
David W. Fleming, M.D.Deputy Director for Public Health Science
Dixie E. Snider, Jr., M.D., M.P.H.Associate Director for Science
Epidemiology Program Office
Stephen B. Thacker, M.D., M.Sc.Director
Office of Scientific and Health Communications
John W. Ward, M.D.Director
Editor, MMWR Series
Suzanne M. Hewitt, M.P.A.Managing Editor, MMWR Series
David C. Johnson(Acting) Lead Technical Writer/Editor
Jude C. RutledgeTeresa F. Rutledge
Jeffrey D. Sokolow, M.A.Writers/Editors
Lynda G. CupellMalbea A. Heilman
Visual Information Specialists
Quang M. DoanErica R. Shaver
Information Technology Specialists
Division of Public Health Surveillanceand Informatics
Notifiable Disease Morbidity and 122 Cities Mortality DataRobert F. Fagan
Deborah A. AdamsFelicia J. ConnorLateka Dammond
Patsy A. HallPearl C. Sharp
The MMWR series of publications is published by theEpidemiology Program Office, Centers for Disease Controland Prevention (CDC), U.S. Department of Health andHuman Services, Atlanta, GA 30333.
tomography (CT) scan and MRI examination of his head didnot indicate any abnormality. In June 1999, he was hospital-ized following onset of dementia, speech abnormalities, andmyoclonic jerking. An EEG indicated left-hemispheric peri-odic sharp waves and moderate generalized background slow-ing; CJD was diagnosed clinically. In July 1999, followingworsening symptoms and development of right upper extrem-ity dystonia, the patient died. Neuropathologic evaluation ofbrain tissue during autopsy demonstrated widespread subcor-tical spongiform lesions, consistent with CJD.
The man was not a hunter but had a history of eating veni-son. He made an estimated 12 visits to the cabin where thewild game feasts were held, but he participated in only onefeast during the mid-1980s. Sections of fixed and frozen braintissue obtained during autopsy were analyzed at NPDPSC,and prion disease was confirmed by immunohistochemicaland Western blot testing. The Western blot characteristics andprion disease phenotype in this patient were consistent withthe most common form of sporadic CJD, classified as M/M(M/V) 1 (3). Subsequent genetic typing confirmed the pres-ence of methionine homozygosity (M/M) at codon 129 ofthe patient’s prion protein gene.
Case 3. In June 1992, a Wisconsin man aged 65 years soughttreatment for progressive slowing of speech, worseningmemory, and personality changes. By January 1993, his speechwas reduced to one-word utterances. Neurologic examinationshowed a flat affect, decreased reflexes, and apraxia. A CThead scan showed mild atrophy, and an EEG was normal.Pick’s disease was diagnosed. By May, he was unable to per-form any daily living activities; he died in August 1993. Neu-ropathologic evaluation of brain tissue during autopsy showedsymmetrical frontal lobe cerebral cortical atrophy and mildtemporal lobe atrophy. No Pick’s bodies or spongiformlesions were observed.
The man had a history of eating venison and participatedregularly in wild game feasts held at the cabin owned bypatient 1. He was a lifelong hunter and hunted mostly inWisconsin but also in Wyoming and British Columbia. Nogame was brought to the wild game feasts from his huntingtrips outside of Wisconsin. Examination of fixed brain tissuesent to NPDPSC demonstrated no lesions indicative of CJD,and immunohistochemical testing with antibody to the prionprotein did not demonstrate the granular deposits seen in priondiseases.
Epidemiologic InvestigationWild game feasts consisting of elk, deer, antelope, and other
game that occurred at a cabin in northern Wisconsin ownedby patient 1 began in 1976 and continued through 2002.

Vol. 52 / No. 7 MMWR 127
These feasts typically involved 10–15 participants and usu-ally occurred on weekends before or during hunting seasonsin the fall and occasionally in the spring. Wild game broughtto these feasts usually were harvested in Wisconsin, but threemen who attended these feasts reported hunting in the west-ern United States and bringing game back to Wisconsin. Theseactivities took place in Colorado (near the towns of Cortez,Trinidad, Collbran, Durango, and Meeker), Wyoming (nearthe towns of Gilette and Cody), and Montana (near the townof Malta). CWD was not known to be endemic in these areasat the time that these hunting activities took place.
Information was obtained for 45 (85%) of 53 persons whowere identified as possibly participating in the wild game feasts;all were male. Information was obtained by direct interviewor from family members of decedents. Of the 45 persons, forwhom information was obtained, 34 were reported to haveattended wild game feasts. Seven of the 34 feast attendeeswere deceased, including the three patients. None of the fourother decedents had a cause of death attributed to or associ-ated with a degenerative neurologic disorder. None of the liv-ing participants had any signs or symptoms consistent with adegenerative neurologic disorder.Reported by: JP Davis, MD, J Kazmierczak, DVM, M Wegner, MD,R Wierzba, Div of Public Health, State of Wisconsin Dept of Healthand Family Svcs. P Gambetti, National Prion Disease PathologySurveillance Center, Case Western Reserve University, Cleveland, Ohio.L Schonberger, MD, R Maddox, MPH, E Belay, MD, Div of Viral andRickettsial Diseases, National Center for Infectious Diseases; V Hsu,MD, EIS Officer, CDC.
Editorial Note: CWD was first described in the United Statesin the 1960s and classified as a TSE in 1978. Previously local-ized to a contiguous endemic area in northeastern Coloradoand southeast Wyoming, since 2000, CWD has been foundin free-ranging deer or elk in Illinois, Nebraska, New Mexico,South Dakota, Wisconsin, and outside the previously knownendemic areas of Colorado and Wyoming. CWD has beenidentified also in captive deer or elk in Colorado, Kansas,Minnesota, Montana, Nebraska, Oklahoma, South Dakota,and Wisconsin (4). Because a variant form of CJD, with spe-cific neuropathologic and molecular characteristics that dis-tinguish it from sporadic CJD, has been associated with eatingcattle products infected with a prion that causes bovinespongiform encephalopathy (5), concern has been raised aboutthe possibility that the prion associated with CWD might betransmitted to humans in a similar way.
In this investigation, because only one of the three cases inWisconsin had neuropathologic confirmation of a prion dis-ease, no association could be made between case participa-tion in the wild game feasts and the development of CJD.Although patient 2 had confirmed CJD, he was unlikely to
have eaten CWD-infected venison at these feasts because veni-son and other game from outside Wisconsin that was servedat these feasts did not originate from known CWD-endemicareas, and the man participated in the feasts only once. Inaddition, the prion disease in this case was consistent withthe most common form of sporadic CJD, without apparentunusual neuropathologic or molecular characteristics thatmight occur if the prion related to CWD had been respon-sible for the disease.
The findings in this report are subject to at least two limita-tions. First, not all members participating in wild game feastscould be identified, and not all persons listed as participatingcould be contacted for interviews. Second, interviews that wereconducted required recall of events that occurred up to 25years ago, limiting the detail or accuracy of events. However,the similar responses obtained from different sources supportthe accuracy of the investigation findings.
A previous investigation of unusually young CJD patientsin whom the transmission of CWD was suspected also didnot provide convincing evidence for a causal relationshipbetween CWD and CJD (2). However, limited epidemio-logic investigations cannot rule out the possibility that CWDmight play a role in causing human illness. Ongoing surveil-lance of CJD, particularly in states with CWD, is importantto assess the risk, if any, for CWD transmission to humans.Because the confirmation of CJD and the detection of a newprion disease require neuropathologic study of brain tissue,physicians are encouraged to contact NPDPSC (http://www.cjdsurveillance.com; telephone, 216-368-0587) to con-firm diagnoses of CJD and to distinguish its various subtypes.Because of the known severity of TSEs in humans and thepossibility that the CWD prion can affect humans, animalswith evidence of CWD should be excluded from the humanfood or animal feed chains. Hunters and wild venison con-sumers should follow precautionary guidelines available fromthe Wisconsin Department of Agriculture, Trade, and Con-sumer Protection (http://datcp.state.wi.us/core/consumerinfo)to prevent potential exposures to the CWD agent.References1. Belay E. Transmissible spongiform encephalopathies in humans. Annu
Rev Microbiol 1999;53:283–314.2. Belay E, Gambetti P, Schonberger L, et al. Creutzfeldt-Jakob disease in
unusually young patients who consumed venison. Arch Neurol2001;58:1673–8.
3. Parchi P, Giese A, Capellari S, et al. Classification of sporadic Creutzfeldt-Jakob disease based on molecular and phenotypic analysis of 300 sub-jects. Ann Neurol 1999;46:224–33.
4. U.S. Department of Agriculture. Positive CWD cases: cumulativethrough Dec 2002 (including farm herds already depopulated). Avail-able at http://aphisweb.aphis.usda.gov/vs/nahps//cwd/USAMapOfInfectedHerds.jpg.
5. Will RG, Ironside JW, Zeidler M, et al. A new variant of Creutzfeldt-Jakob disease in the UK. Lancet 1996;347:921–5.

128 MMWR February 21, 2003
Public Health and Aging
Atrial Fibrillation as a ContributingCause of Death and Medicare
Hospitalization — United States, 1999Stroke is the leading cause in the United States of serious
long-term disability and the third leading cause of death. Oneof the major risk factors for stroke is atrial fibrillation (AF), acommon cardiac disorder characterized by cardiac arrhyth-mia and the absence of coordinated contractions, whichincreases the risk for blood stasis, clot formation, and embo-lic stroke. AF affects approximately 2.2 million adults in theUnited States (1,2) and is the most common sustained heartrhythm disturbance observed in clinical practice (3). The rateof AF increases with age, from <1% among persons aged <60years to approximately 10% among persons aged >80 years(4). The frequency with which AF is reported on death cer-tificates as a contributing cause of death has increased since1980 (5). To assess the burden of AF-related deaths and hos-pitalizations among U.S. residents, CDC analyzed nationaland state multiple-cause mortality statistics and Medicarehospital claims for persons with AF in 1999 (the latest yearfor which data were available) for the 50 states and the Dis-trict of Columbia. The findings indicate that AF as a contrib-uting cause of death and hospitalization affects primarilypersons aged >75 years and that death and hospitalizationrates vary by state. Public and medical education are neededto prevent and reduce AF-related disability and death.
National and state multiple-cause mortality statistics wereobtained from death certificates in state vital statistics officesand compiled by CDC. AF-related deaths are those for whichthe contributing cause of death* (any one of the 20 possibleconditions listed on the death certificate) listed by a physi-cian or a coroner is classified as code I48 according to theInternational Classification of Diseases, Tenth Revision (ICD-10). Among decedents who had AF, the proportion of thosewho had an underlying cause of death listed as AF (ICD-10I48), coronary heart disease (ICD-10 I20–I25), or stroke(ICD-10 I60–I69) also was assessed. Demographic data (age,sex, and race/ethnicity) on death certificates were reported byfuneral directors or provided by family members of the dece-dent. The denominators for death rates were obtained from1999 census records and included only U.S. residents.
Medicare (Part A) hospital claims and enrollment recordsfrom the Medicare Provider Analysis and Review files wereobtained from the Centers for Medicare and Medicaid Services.
AF-related hospitalizations among Medicare enrollees aged>65 years were classified as code 427.3 according tothe International Classification of Diseases, Ninth Revision, Clini-cal Modification (ICD-9-CM) as one of six diagnoses on thehospital claims during 1999. The denominators for hospital-ization rates were obtained from Medicare enrollment recordsand included enrollees aged >65 years who were entitled toMedicare Part A benefits on July 1, 1999 (excluding 15.7%of members with coverage from health maintenance organi-zations). Among persons hospitalized with AF, the propor-tion of those who had a primary hospital diagnosis of AF(ICD-9 427.3), coronary heart disease (ICD-9 410–414,429.2), or stroke (ICD-9 430–434, 436–438) also wasassessed.
AF-related death rates for groups defined by age, sex, race/ethnicity, and state were determined by dividing the numberof deaths by the population at risk (denominator) in eachgroup. Rates of hospitalizations among Medicare enrolleesaged >65 years with AF for each group were determined bydividing the number of hospitalizations by the population atrisk (denominator) in the group. Age-adjusted death rates (per100,000 population) and hospitalization rates (per 1,000Medicare enrollees) were calculated by using the 2000 U.S.standard population (6).
In 1999, a total of 66,875 deaths with AF as a contributingcause occurred, resulting in an age-adjusted death rate of 24.7per 100,000 population. Of these deaths, 56,138 (84.0%)were among persons aged >75 years. The greatest proportionof these AF-related deaths occurred among persons aged >85years (47.4%), followed by those aged 75–84 years (36.6%),aged 65–74 years (12.3%), and aged <65 years (3.7%). Age-specific death rates increased for successive age groups (Table 1).Age-adjusted death rates for AF were highest among whites(25.7) and blacks (16.4) and higher for men (34.7) thanwomen (22.8). In 1999, for all decedents who had AF, themost common underlying causes of death were coronary heartdisease (28.0%), AF (12.4%), and stroke (10.8%).
In 1999, a total of 1,765,304 hospitalizations (137.1 per1,000 Medicare enrollees) were reported among persons withAF in the Medicare population (Table 1). Rates increasedamong successive age groups. The rate of hospitalizationamong persons with AF was higher among whites (142.7)than among blacks (100.4). Although 55.7% of these hospi-talizations were among women, men (162.9) had a higherrate of AF-related hospitalization than women (121.2). Themost common diseases listed as the primary diagnosis for per-sons hospitalized with AF were congestive heart failure(11.8%), followed by AF (10.9%), coronary heart disease(9.9%), and stroke (4.9%).
* Contributing cause of death was defined as the subsequent diagnosis consideredwith the cause of death, and underlying cause of death was defined as theprimary diagnosis associated with the death.

rec • om • men • da • tion: n 1 : something, such
as a course of action, that is recommended;
see also MMWR.
know what matters.
ReportsRecommendations
and
Recommendations and Reports
September 13, 2002 / Vol. 51 / No. RR-13
Folic Acid and Prevention
of Spina Bifida and Anencephaly
10 Years After the U.S. Public Health
Service Recommendation
Morbidity and Motality Weekly Report
Centers for Disease Control and Prevention
safer healthier people
•
•
™
130 MMWR February 21, 2003
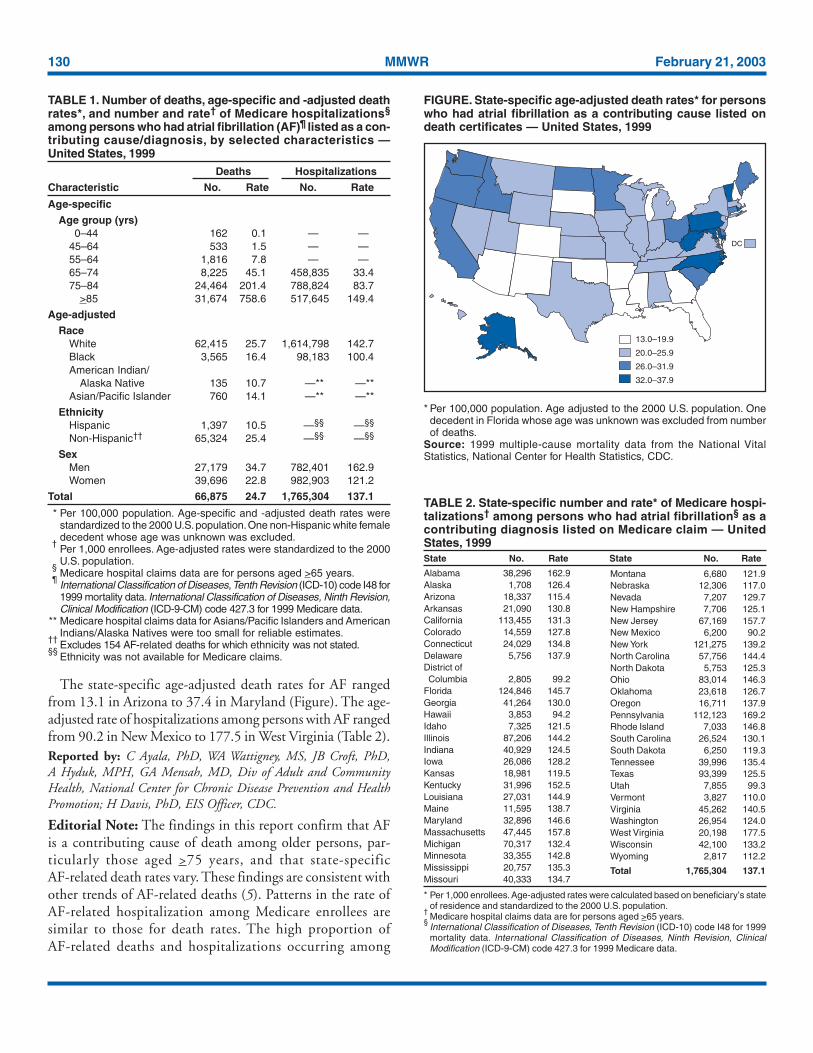
The state-specific age-adjusted death rates for AF rangedfrom 13.1 in Arizona to 37.4 in Maryland (Figure). The age-adjusted rate of hospitalizations among persons with AF rangedfrom 90.2 in New Mexico to 177.5 in West Virginia (Table 2).Reported by: C Ayala, PhD, WA Wattigney, MS, JB Croft, PhD,A Hyduk, MPH, GA Mensah, MD, Div of Adult and CommunityHealth, National Center for Chronic Disease Prevention and HealthPromotion; H Davis, PhD, EIS Officer, CDC.
Editorial Note: The findings in this report confirm that AFis a contributing cause of death among older persons, par-ticularly those aged >75 years, and that state-specificAF-related death rates vary. These findings are consistent withother trends of AF-related deaths (5). Patterns in the rate ofAF-related hospitalization among Medicare enrollees aresimilar to those for death rates. The high proportion ofAF-related deaths and hospitalizations occurring among
TABLE 2. State-specific number and rate* of Medicare hospi-talizations† among persons who had atrial fibrillation§ as acontributing diagnosis listed on Medicare claim — UnitedStates, 1999State No. Rate State No. Rate
Alabama 38,296 162.9Alaska 1,708 126.4Arizona 18,337 115.4Arkansas 21,090 130.8California 113,455 131.3Colorado 14,559 127.8Connecticut 24,029 134.8Delaware 5,756 137.9District ofColumbia 2,805 99.2
Florida 124,846 145.7Georgia 41,264 130.0Hawaii 3,853 94.2Idaho 7,325 121.5Illinois 87,206 144.2Indiana 40,929 124.5Iowa 26,086 128.2Kansas 18,981 119.5Kentucky 31,996 152.5Louisiana 27,031 144.9Maine 11,595 138.7Maryland 32,896 146.6Massachusetts 47,445 157.8Michigan 70,317 132.4Minnesota 33,355 142.8Mississippi 20,757 135.3Missouri 40,333 134.7
* Per 1,000 enrollees. Age-adjusted rates were calculated based on beneficiary’s stateof residence and standardized to the 2000 U.S. population.
†Medicare hospital claims data are for persons aged >65 years.
§International Classification of Diseases, Tenth Revision (ICD-10) code I48 for 1999mortality data. International Classification of Diseases, Ninth Revision, ClinicalModification (ICD-9-CM) code 427.3 for 1999 Medicare data.
Montana 6,680 121.9Nebraska 12,306 117.0Nevada 7,207 129.7New Hampshire 7,706 125.1New Jersey 67,169 157.7New Mexico 6,200 90.2New York 121,275 139.2North Carolina 57,756 144.4North Dakota 5,753 125.3Ohio 83,014 146.3Oklahoma 23,618 126.7Oregon 16,711 137.9Pennsylvania 112,123 169.2Rhode Island 7,033 146.8South Carolina 26,524 130.1South Dakota 6,250 119.3Tennessee 39,996 135.4Texas 93,399 125.5Utah 7,855 99.3Vermont 3,827 110.0Virginia 45,262 140.5Washington 26,954 124.0West Virginia 20,198 177.5Wisconsin 42,100 133.2Wyoming 2,817 112.2
Total 1,765,304 137.1
FIGURE. State-specific age-adjusted death rates* for personswho had atrial fibrillation as a contributing cause listed ondeath certificates — United States, 1999
13.0–19.9
20.0–25.9
26.0–31.9
32.0–37.9
DC
* Per 100,000 population. Age adjusted to the 2000 U.S. population. Onedecedent in Florida whose age was unknown was excluded from numberof deaths.
Source: 1999 multiple-cause mortality data from the National VitalStatistics, National Center for Health Statistics, CDC.
TABLE 1. Number of deaths, age-specific and -adjusted deathrates*, and number and rate† of Medicare hospitalizations§
among persons who had atrial fibrillation (AF)¶ listed as a con-tributing cause/diagnosis, by selected characteristics —United States, 1999
Deaths Hospitalizations
Characteristic No. Rate No. Rate
Age-specific
Age group (yrs)0–44 162 0.1 — —
45–64 533 1.5 — —55–64 1,816 7.8 — —65–74 8,225 45.1 458,835 33.475–84 24,464 201.4 788,824 83.7
>85 31,674 758.6 517,645 149.4
Age-adjusted
RaceWhite 62,415 25.7 1,614,798 142.7Black 3,565 16.4 98,183 100.4American Indian/
Alaska Native 135 10.7 —** —**Asian/Pacific Islander 760 14.1 —** —**
EthnicityHispanic 1,397 10.5 —§§ —§§
Non-Hispanic†† 65,324 25.4 —§§ —§§
SexMen 27,179 34.7 782,401 162.9Women 39,696 22.8 982,903 121.2
Total 66,875 24.7 1,765,304 137.1
* Per 100,000 population. Age-specific and -adjusted death rates werestandardized to the 2000 U.S. population. One non-Hispanic white femaledecedent whose age was unknown was excluded.
†Per 1,000 enrollees. Age-adjusted rates were standardized to the 2000U.S. population.
§Medicare hospital claims data are for persons aged >65 years.
¶International Classification of Diseases, Tenth Revision (ICD-10) code I48 for1999 mortality data. International Classification of Diseases, Ninth Revision,Clinical Modification (ICD-9-CM) code 427.3 for 1999 Medicare data.
** Medicare hospital claims data for Asians/Pacific Islanders and AmericanIndians/Alaska Natives were too small for reliable estimates.
††Excludes 154 AF-related deaths for which ethnicity was not stated.
§§Ethnicity was not available for Medicare claims.
Vol. 52 / No. 7 MMWR 131
persons aged >75 years suggests that as the population ages,AF might be diagnosed more frequently. A cohort study ofhospitalized Medicare patients indicated that medical costswere greater for patients with AF than for those without AF(7). In addition, effective therapies for AF reduced the riskfor stroke by >70%. Patients who have coronary heart dis-ease, hypertensive disease, or stroke diagnosed and who livelonger might be at risk for AF if effective therapy is not main-tained (8). Serious complications among patients withuncontrolled AF also can include congestive heart failure, myo-cardial infarction, and thrombotic stroke.
Initial treatment of AF should be directed at controllingthe ventricular rate with a calcium channel blocker, beta-blocker, or digitalis (3). Medical or electrical cardioversion torestore sinus rhythm is the next step in patients who remainin AF. Effective therapies in preventing stroke and cardiovas-cular complications include anticoagulation, heart rate con-trol, conversion of AF to normal heart rhythm, andcatheter-based and surgical interventions (3).
Educating the public to recognize the signs of cardiacarrhythmia can help identify persons with AF. Persons canidentify an irregular heartbeat by monitoring their wrist pulsefor 1 minute. The irregularity of these beats is detected andthe next beat cannot be predicted. Persons who identify thesigns of cardiac arrhythmia should seek medical care to deter-mine the presence of AF or other heart disorders. TheResearch Center for Stroke and Heart Disease (http://www.strokeheart.org), has initiated the educational campaign, “TakeYour Pulse For Life.” This initiative recommends that per-sons, particularly those aged >55 years, monitor their pulsefor 1 minute the first day of every month. Assessing whethera patient has AF can be easy and inexpensive through usingelectrocardiography (ECG) (3); the availability of moreadvanced diagnostic tools, such as ECG monitoring, mightcontribute to AF diagnosis in persons suspected to have car-diac arrhythmia. Delay in diagnosis occurs when the rhythmhas not been documented specifically and additional moni-toring is necessary (3). All persons should know how to take apulse for themselves or their family members.
The findings in this report are subject to at least two limita-tions. First, data are subject to misclassification of race/ethnicity both in the population census and on death certifi-cates, possibly resulting in overreporting among blacks andwhites and underreporting among other racial/ethnic groups(9). Second, it was not possible to determine the accuracy ofphysician or administrative reporting, the validity of the ICDcodes, or multiple hospitalizations on Medicare hospital claims.
Because AF is one of the major treatable risk factors forstroke, prevention of AF through public and medical educa-tion for early identification and appropriate treatment should
become an important focus of public health efforts to reducestroke-related deaths and disability. Prevention efforts shouldinclude broad-based public health efforts to increase publicawareness of AF and to foster timely and appropriate diagnosticevaluation and effective treatment from health-care providers.References1. Feinberg WM, Blackshear JL, Laupacis A, Kronmal R, Hart RG. Preva-
lence, age distribution, and gender of patients with atrial fibrillation.Arch Intern Med 1995;155:469–73.
2. Go AS, Hylek EM, Phillips KA, et al. Prevalence of diagnosed atrialfibrillation in adults: national implications for rhythm management andstroke prevention: the Anticoagulation and Risk Factors in AF (ATRIA)Study. JAMA 2001;285:2370–5.
3. Fuster V, Rydén LE, Asinger RW, et al. ACC/AHA/ESC guidelines forthe management of patients with atrial fibrillation: executive summarya report of the American College of Cardiology/American Heart Asso-ciation Task Force on Practice Guidelines and the European Society ofCardiology Committee for Practice Guidelines and Policy Conferences(Committee to Develop Guidelines for the Management of PatientsWith Atrial Fibrillation) developed in collaboration with the NorthAmerican Society of Pacing and Electrophysiology. Circulation2001;104:2118–50.
4. Ryder KM, Benjamin EJ. Epidemiology and significance of atrial fibril-lation. Am J Cardiol 1999;84:131–8.
5. Wattigney WA, Mensah GA, Croft JB. Increased atrial fibrillation mor-tality: United States, 1980–1998. Am J Epidemiol 2002;155:1–7.
6. Anderson RN, Rosenberg HM. Age standardization of death rates: imple-mentation of the year 2000 standard. Hyattsville, Maryland: U.S.Department of Health and Human Services, CDC, National Centerfor Health Statistics, 1998; Natl Vital Stat Rep, vol. 47, no. 3.
7. Wolf PA, Mitchell JB, Baker CS, et al. Impact of atrial fibrillation onmortality, stroke, and medical cost. Arch Intern Med 1998;158:229–34.
8. Cooper R, Cutler J, Desvigne-Nickens P, et al. Trends and disparities incoronary heart disease, stroke, and other cardiovascular disease in theUnited States: findings of the National Conference on CardiovascularDisease Prevention. Circulation 2000;102:3137–47.
9. Rosenberg HM, Maurer JD, Sorlie PD, et al. Quality of death rates byrace and Hispanic origin: a summary of current research, 1999. VitalHealth Stat 1999;2:1–12.
Potential Exposures to Airborneand Settled Surface Dust
in Residential Areas of LowerManhattan Following the Collapse
of the World Trade Center —New York City, November 4–
December 11, 2001Following the terrorist attacks of September 11, 2001, which
destroyed the World Trade Center (WTC) in lower Manhat-tan, the New York City (NYC) Department of Health andMental Hygiene (DOHMH) and the Agency for Toxic Sub-stances and Disease Registry (ATSDR), with assistance fromthe U.S. Public Health Service (PHS) Commissioned Corps
132 MMWR February 21, 2003
§ Estimated.
Readiness Force* and the WTC Environmental AssessmentWorking Group†, assessed the composition of outdoor andindoor settled surface and airborne dust in residential areasaround the WTC and in comparison areas. This report sum-marizes the results of the investigation, which found 1) simi-lar levels of airborne total fibers in lower and in upperManhattan, 2) greater percentage levels of synthetic vitreousfibers (SVF) and mineral components of concrete and build-ing wallboard in settled dust of residential areas in lowerManhattan than in upper Manhattan, and 3) low levels ofasbestos in some settled surface dust in lower Manhattan resi-dential areas (1). Based in part on the results of this investiga-tion, the U.S. Environmental Protection Agency (EPA) iscleaning and sampling residential areas as requested by lowerManhattan residents. In addition, to assess any short- or long-term health effects of smoke, dust, and airborne substancesaround the WTC site, DOHMH and ATSDR are develop-ing a registry that will track the health of persons who weremost highly exposed to these materials.
During November 4–December 11, 2001, air and settledsurface dust samples were collected in and around 30 residen-tial buildings within three concentric circles surrounding theWTC site in lower Manhattan, including 59 residential units(2). In addition, five residential units in four buildingslocated north of 59th Street (approximately 5 miles northeastof the WTC site) were sampled for purposes of comparison.Attention was focused on building material constituents 1)that have irritant properties (e.g., SVF, including fiberglassand gypsum) or might have negative long-term health effects(e.g., crystalline silica and asbestos) and 2) that were reason-ably presumed to be either in the initial WTC collapse dustcloud or in dust generated by subsequent rescue and recoveryactivities at the WTC site. All samples collected during theinvestigation were analyzed for the presence of asbestos, SVF,crystalline mineral components of concrete (e.g., silica, cal-cite, and portlandite), and crystalline mineral components ofbuilding wallboard (e.g., gypsum, mica, and halite).
At each sampling location, time-weighted air sampling wasconducted for three or four particulate matter (PM) fractions(i.e., PM 100 microns, 10 microns, 4 microns, and 2.5microns) (3–5). Each PM fraction was analyzed for crystal-line minerals by using X-ray diffraction (XRD) analysis (6).
The XRD analysis for crystalline minerals was semiquantitative(i.e., estimated). Air samples for fibers were analyzed first byphase contrast microscopy (PCM) (5). If the concentrationof total fibers was higher than the maximum concentrationof fibers found in the comparison homes (0.003 fibers percubic centimeter of air [f/cc]), the sample was re-analyzed forasbestos fibers by using transmission electron microscopy(TEM) (5). In addition, scanning electron microscopy (SEM)to look for SVF was used for PCM fiber counts >0.003 f/cc ifthe settled surface dust sample from that area contained SVF.
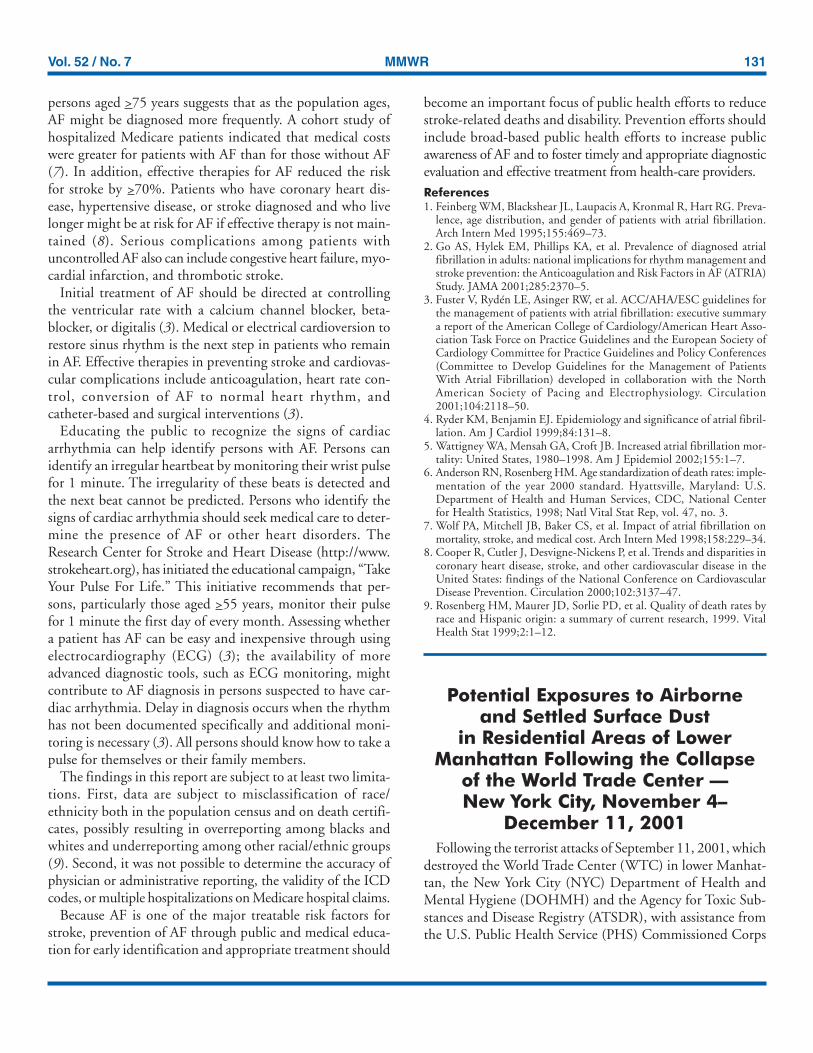
Settled surface dust samples also were taken at each sam-pling location and analyzed for crystalline minerals and fibers(Figure). Fiber analysis of settled dust samples for asbestosand SVF was conducted by using polarized light microscopy(PLM) (7). If asbestos levels were below the detection limit(i.e., <1%), samples were re-analyzed by using TEM (7). Thedust samples also were analyzed for crystalline mineral con-tent by using XRD.
Air Sampling ResultsFor 111 (94.9%) of the 117 air samples, the concentrations
of fibers found in lower Manhattan residential areas were simi-lar to the concentration of fibers found in comparison areas(<0.003 f/cc). The six lower Manhattan areas that had elevatedtotal fiber counts were re-examined by TEM and SEM todetermine the types of fibers; the results indicated that nei-ther asbestos nor SVF (e.g., fiberglass) contributed to theelevated total fiber counts.
Air sampling results for minerals detected quartz and otherbuilding material constituents in lower Manhattan. No otherforms of crystalline silica were detected in any air samplesexcept for a one-time detection of cristobalite (15 microgramsper cubic meter [µg/m3]§). The estimated concentrations ofthese minerals in air were low. In some locations, mineral com-
* A cadre of PHS Commissioned Corps officers who can be mobilized duringdisaster, strife, or other public health emergencies and in response to domesticor international requests.
† A group formed on September 15, 2001, that comprises representatives of theU.S. Department of Health and Human Services, Environmental ProtectionAgency (EPA), Department of Labor, and New York State and NYC governmentand private organizations to coordinate public health and occupational samplingand data review among the three federal agencies in support of state and cityhealth departments.
FIGURE. U.S. Public Health Service commissioned officercollecting samples from a previously cleaned interiorresidential area — New York City, November 2001
Photo/U.S. Public Health Service
Vol. 52 / No. 7 MMWR 133
ponents of concrete (quartz [not detected (ND)–19 µg/m3§],calcite [ND–14 µg/m3§], and portlandite [ND–95 µg/m3§])and mineral components of building wallboard (gypsum[ND–15 µg/m3§], mica [ND–43 µg/m3§], and halite [ND–19 µg/m3§]) were detected at higher estimated levels in airsamples in lower Manhattan than in samples collected in com-parison areas. Gypsum was the only mineral detected in thecomparison building air samples (ND–5 µg/m3§). No otherminerals tested (i.e., quartz, calcite, portlandite, mica, andhalite) were detected in comparison building air samples.
Settled Surface Dust ResultsIn lower Manhattan, asbestos and SVF were found in some
indoor settled dust samples from residential units and com-mon areas (Table 1). No asbestos or SVF was detected in thecomparison area dust samples. Quartz, calcite, portlandite,and gypsum comprised a higher percentage of the dust in 29samples from buildings in lower Manhattan compared witheight samples from comparison area buildings (Table 2). Onlytwo (2.1%) of the 97 dust samples collected provided enoughbulk material for pH analysis. The samples, which were col-lected from two outdoor locations in lower Manhattan, hadpH values of 8.6 and 9.8, respectively.
Reported by: NL Jeffery, MPH, C D’Andrea, MS, J Leighton, PhD,New York City Dept of Health and Mental Hygiene, New York. SERodenbeck, ScD, L Wilder, CIH, D DeVoney, PhD, S Neurath, PhD,CV Lee, MD, RC Williams, MS, Div of Health Assessment andConsultation, Agency for Toxic Substances and Diseases Registry.
Editorial Note: Exposure to substantial amounts of SVF, min-eral components of concrete, and mineral components ofbuilding wallboard might cause skin rashes, eye irritation, andupper respiratory irritation, all of which were reported morefrequently than expected seasonal rates by community mem-bers and first responders after the collapse of the WTC towers(8–10). If the reported irritant effects were associated withWTC-related materials, these effects would subside onceexposure to SVF, mineral components of concrete, and min-eral components of building wallboard ceased. Persons withpre-existing heart or lung diseases (e.g., asthma) or a previoushistory of occupational exposure to these materials might bemore sensitive to their irritant effects.
Settled surface dust might become airborne if disturbed,potentially causing exposures to occur through inhalation.Several worst-case assumptions were made to assess thepotential long-term public health risks for inhaling airborneasbestos and quartz. These assumptions included 1) that no
TABLE 1. Number and percentage of locations with asbestos or synthetic vitreous fibers (SVF) found in settled surface dust, by test-ing method and sampling location/environment — New York City, November 4–December 11, 2001
Locations with Locations withasbestos in settled Range SVF in settled Range
Sampling location/ No. and type of analysis* surface dust†of asbestos surface dust¶
of SVFEnvironment No. Material Test No. (%) found§ No. (%) found**
Lower ManhattanOutdoor (n = 14) 14 Asbestos PLM 6 (43) <1%–3.4% 11 (79) 1%–72%
12 Asbestos TEM14 SVF PLM
Common (n = 26) 26 Asbestos PLM 5 (19) <1%–1.5% 14 (54) 5%–27%25 Asbestos TEM26 SVF PLM
Residential (n = 57) 57 Asbestos PLM 10 (18) <1%–1.5% 26 (46) 2%–35%††
52 Asbestos TEM57 SVF PLM
Whole building (n = 29) 29 Asbestos PLM 12 (41) <1%–3.4% 21 (72) 2%–72%29 Asbestos TEM29 SVF PLM
Comparison buildingsCommon (n = 3) 3 Asbestos PLM 0 0 — 0 0 —
3 Asbestos TEM3 SVF PLM
Residential (n = 5) 5 Asbestos PLM 0 0 — 0 0 —4 Asbestos TEM5 SVF PLM
* All dust samples were analyzed initially by using polarized light microscopy (PLM); transmission electron microscopy (TEM) analysis was performed toconfirm the absence of asbestos if not detected by PLM analysis.
†Detected by either PLM or TEM (reported as <1% or more); calculated from the total number of dust samples.
§The highest value detected at a location (PLM or TEM).
¶Calculated from the number of SVF PLM samples.
** For some locations, an additional co-located sample was obtained; the range shown considers the highest measured value for each sampling location.††
One residential unit had an extra settled surface dust sample, taken from a window sill, which contained 40% SVF by PLM.

134 MMWR February 21, 2003
cleaning of indoor spaces had occurred or would occur, 2)that all airborne fibers were asbestos, and 3) that the highestlevels detected during sampling represented long-term air lev-els. Under these worst-case conditions, prolonged exposure(i.e., decades) to airborne asbestos and quartz might increasethe long-term risk for persons developing lung cancer andother adverse lung health effects (approximately one additionalcase per 10,000 persons exposed). However, persons who cleantheir residences frequently as recommended (1) or who par-ticipate in the EPA cleaning and sampling program areunlikely to be exposed to worst-case conditions.
The findings of this investigation are subject to at least twolimitations. First, the results do not necessarily reflect condi-tions found in other buildings, the time period immediatelyafter the collapse, or the time period after December 12, whenthe sampling was completed. Second, a limited number ofsamples were obtained from comparison areas to determineNYC background levels of asbestos, SVF, mineral componentsof concrete, and mineral components of building wallboard.The comparison area results might not reflect NYC back-ground levels.
TABLE 2. Number and percentage of locations in which selected mineral components were found in settled surface dust, by sam-pling location/environment and amount detected — New York City, November 4–December 11, 2001
Minimum Maximum Average No. aboveOccurrences* detected detected of detections comparison†
Location/Environment No. (%) (% by weight) (% by weight) (% by weight) No. (%)
Lower ManhattanOutdoor settled surface dust (n = 14)
Quartz 14 (100) 1.00§ 27.00§ 12.00§ ¶
Calcite 13 (93) 0.80§ 19.00§ 6.00§ ¶
Portlandite 12 (86) 0.07§ 6.00§ 2.00§ ¶
Gypsum 11 (79) 0.03§ 27.00§ 6.00§ ¶
Mica 9 (64) 0.05§ 0.30§ 0.10§ ¶
Halite 7 (50) <0.03§ 0.10§ 0.05§ ¶
Common area settled surface dust (n = 26)Quartz 21 (81) 0.03§ 25.00§ 5.00§ 6 (23)Calcite 15 (58) 0.02§ 10.00§ 3.00§ 9 (35)Portlandite 13 (50) 0.04§ 4.00§ 2.00§ 9 (35)Gypsum 23 (88) 0.07§ 20.00§ 5.00§ 6 (23)Mica 5 (19) 0.06§ 0.60§ 0.20§ 5 (19)Halite 4 (15) 0.04§ 0.06§ 0.05§ 1 (4)
Residential units settled surface dust (n = 57)Quartz 30 (53) 0.05§ 31.00§ 9.00§ 15 (26)Calcite 20 (35) 0.02§ 21.00§ 8.00§ 13 (23)Portlandite 21 (37) 0.05§ 8.00§ 2.00§ 17 (30)Gypsum 45 (79) 0.05§ 30.00§ 4.00§ 9 (16)Mica 5 (9) 0.03§ 0.30§ 0.10§ 1 (2)Halite 6 (11) 0.03§ 0.10§ 0.06§ 0
Comparison areas above 59th Street
Common areas (n = 3)Quartz 2 (67) 1.00§ 1.00§ ¶
Calcite 2 (67) 0.03§ 0.40§ ¶
Portlandite 1 (33) 0.05§ 0.05§ ¶
Gypsum 2 (67) 2.00§ 3.00§ ¶
Mica 0 (0) — — —Halite 1 (33) 0.04§ 0.04§ ¶
Residential units (n = 5)Quartz 2 (40) 1.00§ 2.00§ ¶
Calcite 1 (20) 0.90§ 0.90§ ¶
Portlandite 2 (40) 0.08§ 0.08§ ¶
Gypsum 4 (80) 2.00§ 4.00§ 3.00§
Mica 1 (20) 0.08§ 0.08§ ¶
Halite 1 (20) 0.40§ 0.40§ ¶
* Locations where a mineral was detected; percentages based on number of samples obtained from an area. Outdoor samples were not taken fromcomparison areas above 59th Street because no settled surface dust was visible.
†Shows the number of results and the percentage of samples obtained from this area that had estimated values greater than the maximum levels foundat locations above 59th Street.
§Estimated values to one significant digit; presentation of results as shown does not imply any higher degree of accuracy.
¶Not applicable.
Vol. 52 / No. 7 MMWR 135
Following the investigation, DOHMH and ATSDR madethree recommendations (1). First, because more asbestos, SVF,mineral components of concrete and building wallboard werefound in settled surface dust in lower Manhattan residentialareas than in comparison residential areas, residents of lowerManhattan were advised to continue cleaning frequently withhigh-efficiency particulate air (HEPA) filter vacuums anddamp cloths/mops to reduce the potential for exposure. Sec-ond, to ensure the effectiveness of the recommended clean-ing, DOHMH and ATSDR recommended additionalmonitoring of residential areas in lower Manhattan and aninvestigation to define background levels specific to NYC forasbestos, SVF, mineral components of concrete, and mineralcomponents of building wallboard. EPA is implementing thisrecommendation and conducting this investigation. Finally,lower Manhattan residents concerned about possible WTC-related dust in their residential areas were advised to requestcleaning and testing from EPA no later than December 31,2002. EPA is conducting the requested cleaning and testingof lower Manhattan residential areas.
DOHMH and ATSDR are developing a registry of thosepersons who were most highly exposed, including persons liv-ing, working, or attending school in lower Manhattan; per-sons who responded to the emergency; persons working atthe WTC site or the Staten Island landfill following theattacks; and persons working in buildings that were damagedor destroyed in the attacks. The registry will track the healthof participants to determine whether their exposures to smoke,dust, and airborne substances around the WTC site mighthave any short- or long-term impacts on their physical health.Additionally, the registry is intended to track the mental healthof the approximately 100,000–200,000 persons who mightenroll.References1. New York City Department of Health and Mental Hygiene and Agency
for Toxic Substances and Disease Registry. Final report of the publichealth investigation to assess potential exposures to airborne and settledsurface dust in residential areas of lower Manhattan. Atlanta, Georgia:U.S. Department of Health and Human Services, Agency for ToxicSubstances and Disease Registry, 2002.
2. New York City Department of Health and Mental Hygiene and Agencyfor Toxic Substances and Disease Registry. Ambient and indoor sam-pling for public health evaluations of residential areas near World TradeCenter, New York, New York: sampling protocol. New York, New York:New York City Department of Health and Mental Hygiene, 2001.
3. American Conference of Governmental Industrial Hygienists. Docu-mentation of TLVs and BEIs, 7th edition. Cincinnati, Ohio: Ameri-can Conference of Governmental Industrial Hygienists, 2001.
4. U.S. Environmental Protection Agency. National ambient air qualitystandards for particulate matter; final rule. Federal Register, Part II, 40CFR Part 50, July 18, 1997.
5. CDC. Manual of analytical methods, 4th edition. Atlanta, Georgia:U.S. Department of Health and Human Services, National Institutefor Occupational Safety and Health, CDC, August 1994.
something yet to learn.""The wisest mind has
MMWR Continuing Education
makes it possible for you to stay
current on relevant public health
and clinical topics– online and
at no charge.
Review course descriptions,
take exams, track your results,
and receive course certificates–
all from your own computer,
when and where your sche-
dule allows.
MMWR CE
A wise choice.
cdc.gov/mmwr
George Santayana
136 MMWR February 21, 2003
6. EMSL Analytical, Inc. EMSL Laboratory’s MSD 0700: operating pro-cedures for the analysis of silica by X-ray diffraction (XRD). Westmont,New Jersey: EMSL Analytical, Inc., January 2000.
7. New York State Department of Health. Environmental LaboratoryApproval Program (ELAP) certification manual. Albany, New York:New York State Department of Health, March 1997.
8. CDC. Self-reported increase in asthma severity after the September11 attacks on the World Trade Center—Manhattan, New York, 2001.MMWR 2002;51:781–4.
9. CDC. Injuries and illnesses among New York City Fire Departmentrescue workers after responding to the World Trade Center attacks.MMWR 2002;51(Special Issue):1–5.
10. CDC. Community needs assessment of lower Manhattan residentsfollowing the World Trade Center attacks — Manhattan, New YorkCity, 2001. MMWR 2002:51(Special Issue):10–3.
Smallpox Vaccine Adverse EventsAmong Civilians — United States,
January 24–February 18, 2003During the civilian smallpox vaccination program, CDC
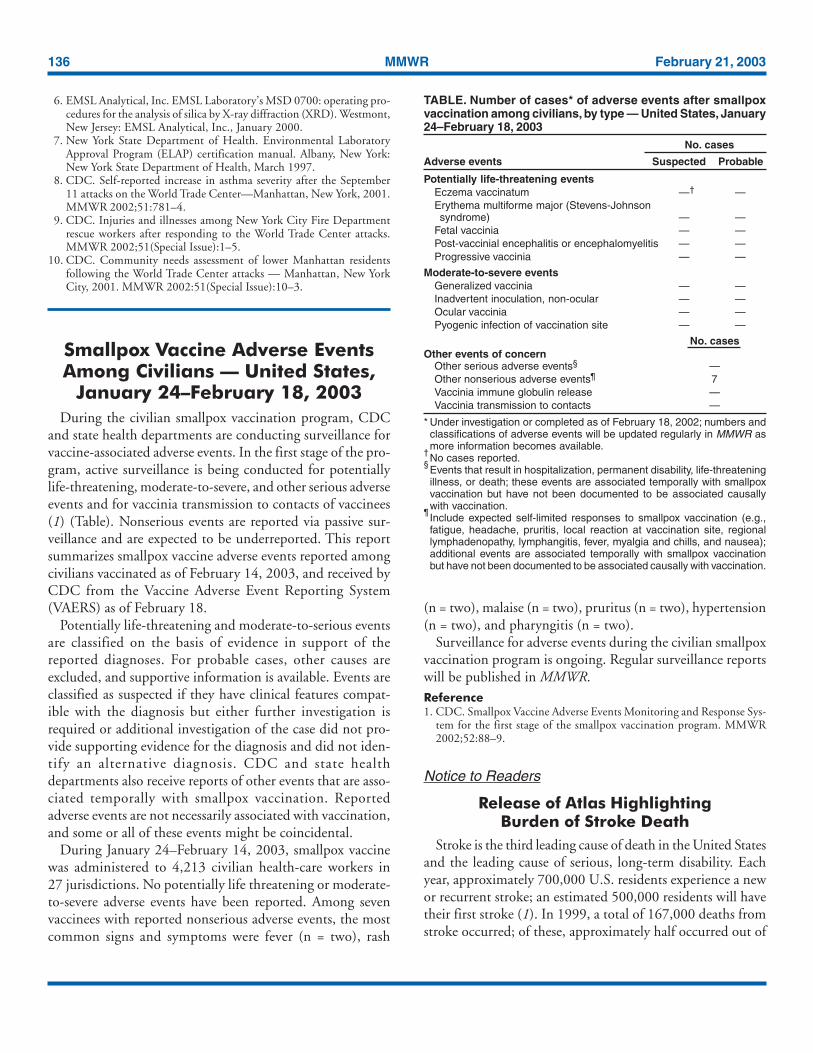
and state health departments are conducting surveillance forvaccine-associated adverse events. In the first stage of the pro-gram, active surveillance is being conducted for potentiallylife-threatening, moderate-to-severe, and other serious adverseevents and for vaccinia transmission to contacts of vaccinees(1) (Table). Nonserious events are reported via passive sur-veillance and are expected to be underreported. This reportsummarizes smallpox vaccine adverse events reported amongcivilians vaccinated as of February 14, 2003, and received byCDC from the Vaccine Adverse Event Reporting System(VAERS) as of February 18.
Potentially life-threatening and moderate-to-serious eventsare classified on the basis of evidence in support of thereported diagnoses. For probable cases, other causes areexcluded, and supportive information is available. Events areclassified as suspected if they have clinical features compat-ible with the diagnosis but either further investigation isrequired or additional investigation of the case did not pro-vide supporting evidence for the diagnosis and did not iden-tify an alternative diagnosis. CDC and state healthdepartments also receive reports of other events that are asso-ciated temporally with smallpox vaccination. Reportedadverse events are not necessarily associated with vaccination,and some or all of these events might be coincidental.
During January 24–February 14, 2003, smallpox vaccinewas administered to 4,213 civilian health-care workers in27 jurisdictions. No potentially life threatening or moderate-to-severe adverse events have been reported. Among sevenvaccinees with reported nonserious adverse events, the mostcommon signs and symptoms were fever (n = two), rash
TABLE. Number of cases* of adverse events after smallpoxvaccination among civilians, by type — United States, January24–February 18, 2003
No. cases
Adverse events Suspected Probable
Potentially life-threatening eventsEczema vaccinatum —† —Erythema multiforme major (Stevens-Johnsonsyndrome) — —
Fetal vaccinia — —Post-vaccinial encephalitis or encephalomyelitis — —Progressive vaccinia — —
Moderate-to-severe eventsGeneralized vaccinia — —Inadvertent inoculation, non-ocular — —Ocular vaccinia — —Pyogenic infection of vaccination site — —
No. casesOther events of concern
Other serious adverse events§ —Other nonserious adverse events¶ 7Vaccinia immune globulin release —Vaccinia transmission to contacts —
* Under investigation or completed as of February 18, 2002; numbers andclassifications of adverse events will be updated regularly in MMWR asmore information becomes available.
†No cases reported.
§Events that result in hospitalization, permanent disability, life-threateningillness, or death; these events are associated temporally with smallpoxvaccination but have not been documented to be associated causallywith vaccination.
¶Include expected self-limited responses to smallpox vaccination (e.g.,fatigue, headache, pruritis, local reaction at vaccination site, regionallymphadenopathy, lymphangitis, fever, myalgia and chills, and nausea);additional events are associated temporally with smallpox vaccinationbut have not been documented to be associated causally with vaccination.
(n = two), malaise (n = two), pruritus (n = two), hypertension(n = two), and pharyngitis (n = two).
Surveillance for adverse events during the civilian smallpoxvaccination program is ongoing. Regular surveillance reportswill be published in MMWR.Reference1. CDC. Smallpox Vaccine Adverse Events Monitoring and Response Sys-
tem for the first stage of the smallpox vaccination program. MMWR2002;52:88–9.
Notice to Readers
Release of Atlas HighlightingBurden of Stroke Death
Stroke is the third leading cause of death in the United Statesand the leading cause of serious, long-term disability. Eachyear, approximately 700,000 U.S. residents experience a newor recurrent stroke; an estimated 500,000 residents will havetheir first stroke (1). In 1999, a total of 167,000 deaths fromstroke occurred; of these, approximately half occurred out of

Vol. 52 / No. 7 MMWR 137
hospital (2). A new CDC report, The Atlas of Stroke Mortal-ity: Racial, Ethnic, and Geographic Disparities in the UnitedStates (3) provides, for the first time, an extensive series ofnational and state maps that show local disparities in strokedeath rates for the five largest racial/ethnic groups in the UnitedStates. The maps provide health-care professionals and con-cerned persons with county-level maps of stroke mortality thatare essential for tailoring stroke-prevention policies and pro-grams to the needs of communities.
High blood pressure and atrial fibrillation are importantrisk factors for stroke that can be prevented and controlled inreducing stroke-related deaths and disability. CDC fundshealth departments in 29 states and the District of Columbiato develop effective strategies for reducing the burden of car-diovascular diseases (e.g., heart disease and stroke) with anemphasis on policy and systems changes. Through these state-based programs, CDC aims to eliminate disparities in treat-ment, risk factors, and disease; delay the onset of disease;postpone death from cardiovascular disease; and diminishdisabling conditions.
Additional information is available at http://www.cdc.gov/nccdphp/cvd/stateprogram.htm. Detailed maps of stroke andheart disease mortality at state and county levels are availableat http://www.cdc.gov/cvh. Additional information aboutstroke also is available from the National Institute of Neuro-logical Disorders and Stroke at http://www.ninds.nih.gov, theAmerican Stroke Association Division of the American HeartAssociation at http://www.strokeassociation.org, the BrainAttack Coalition at http://www.stroke-site.org, and theNational Stroke Association at http://www.stroke.org.References1. American Heart Association. Heart and Stroke Statistics—2003
Update. Dallas, Texas: American Heart Association, 2003. Available athttp://www.americanheart.org/statistics.
2. CDC. State-specific mortality from stroke and distribution of place ofdeath—United States, 1999. MMWR 2002;51:429–33.
3. Casper ML, Barnett E, Williams I, Halverson J, Braham V, GreenlundK. The Atlas of Stroke Mortality: Racial, Ethnic, and Geographic Dis-parities in the United States, 1st ed. Atlanta, Georgia: U.S. Departmentof Health and Human Services, CDC, February 2003.
138 MMWR February 21, 2003
Anthrax - - Hansen disease (leprosy)† 4 3Botulism: - - Hantavirus pulmonary syndrome† 3 -
foodborne - 4 Hemolytic uremic syndrome, postdiarrheal† 9 11infant 8 9 HIV infection, pediatric†§ - 21other (wound & unspecified) 3 3 Measles, total¶ 2 2
Brucellosis† 6 8 Mumps 21 26Chancroid 5 3 Plague - -Cholera - - Poliomyelitis, paralytic - -Cyclosporiasis† 2 14 Psittacosis† 3 8Diphtheria - - Q fever† 6 3Ehrlichiosis: - - Rabies, human - -
human granulocytic (HGE)† 10 7 Rubella - 1human monocytic (HME)† 7 2 Rubella, congenital - 1other and unspecified - - Streptococcal toxic-shock syndrome† 11 11
Encephalitis/Meningitis: - - Tetanus 2 -California serogroup viral† - - Toxic-shock syndrome 5 15eastern equine† - - Trichinosis 1 2Powassan† - - Tularemia† 2 3St. Louis† - - Yellow fever - -western equine† - -
-: No reported cases.* Incidence data for reporting years 2002 and 2003 are provisional and cumulative (year-to-date).†
Not notifiable in all states.§
Updated monthly from reports to the Division of HIV/AIDS Prevention — Surveillance and Epidemiology, National Center for HIV, STD, and TB Prevention(NCHSTP). Last update December 22, 2002.
¶Of two cases reported in 2002 and two cases reported in 2003, in each year, one was indigenous and one was imported from another country.
TABLE I. Summary of provisional cases of selected notifiable diseases, United States, cumulative, week ending February 15, 2003 (7th Week)*
Cum. Cum. Cum. Cum.2003 2002 2003 2002
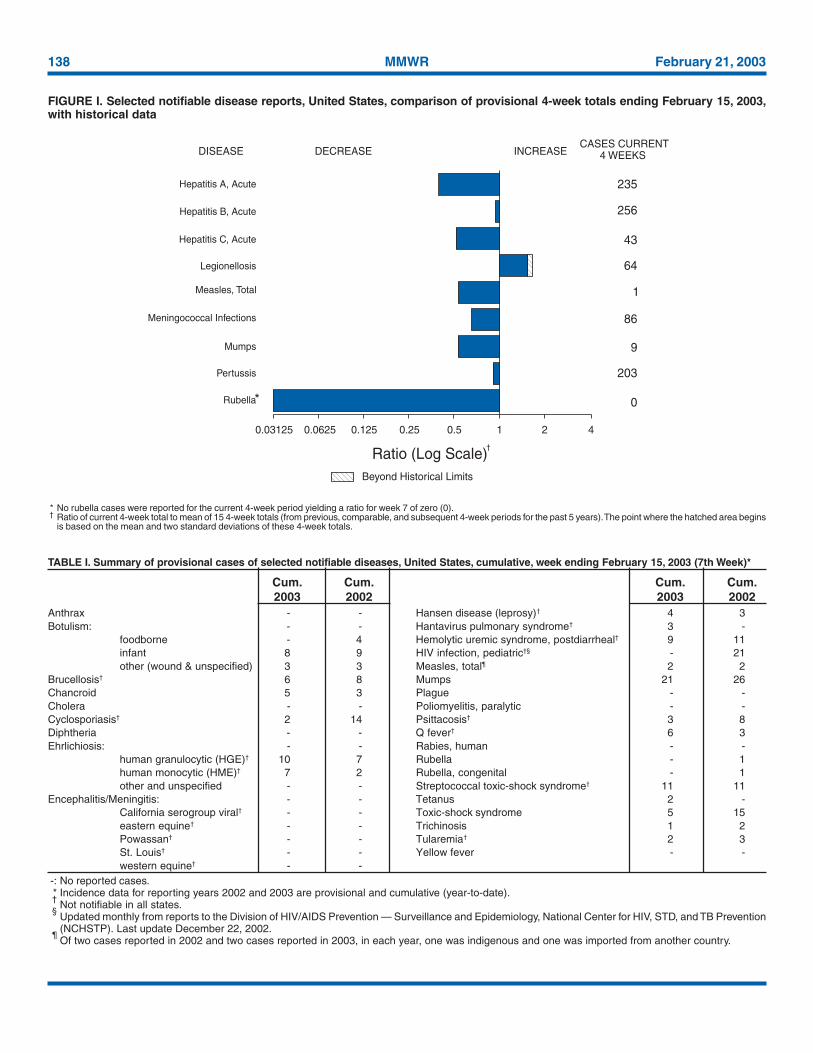
* No rubella cases were reported for the current 4-week period yielding a ratio for week 7 of zero (0).† Ratio of current 4-week total to mean of 15 4-week totals (from previous, comparable, and subsequent 4-week periods for the past 5 years). The point where the hatched area begins
is based on the mean and two standard deviations of these 4-week totals.
FIGURE I. Selected notifiable disease reports, United States, comparison of provisional 4-week totals ending February 15, 2003,with historical data
DISEASE DECREASE INCREASECASES CURRENT
4 WEEKS
Ratio (Log Scale)Beyond Historical Limits
4210.50.250.125
235
256
43
64
1
86
9
203
0
Hepatitis A, Acute
Hepatitis B, Acute
Hepatitis C, Acute
Legionellosis
Measles, Total
Mumps
Pertussis
Rubella
Meningococcal Infections
0.06250.03125
*
†
Vol. 52 / No. 7 MMWR 139
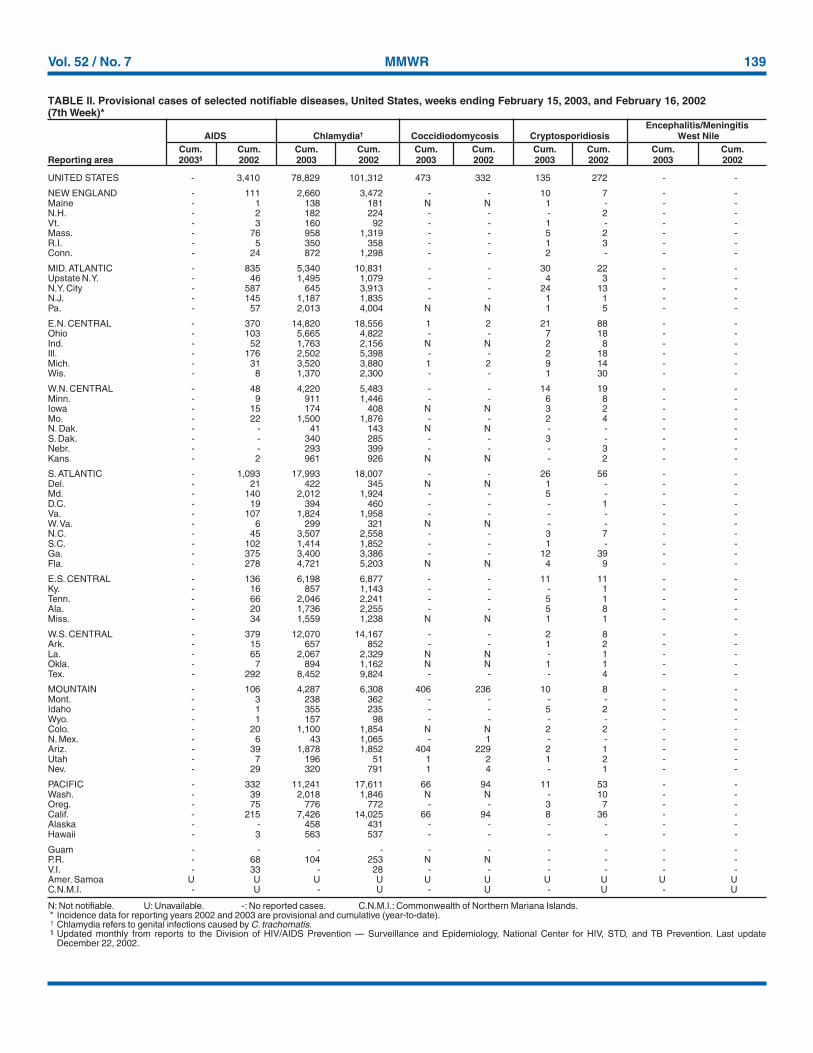
UNITED STATES - 3,410 78,829 101,312 473 332 135 272 - -
NEW ENGLAND - 111 2,660 3,472 - - 10 7 - -Maine - 1 138 181 N N 1 - - -N.H. - 2 182 224 - - - 2 - -Vt. - 3 160 92 - - 1 - - -Mass. - 76 958 1,319 - - 5 2 - -R.I. - 5 350 358 - - 1 3 - -Conn. - 24 872 1,298 - - 2 - - -
MID. ATLANTIC - 835 5,340 10,831 - - 30 22 - -Upstate N.Y. - 46 1,495 1,079 - - 4 3 - -N.Y. City - 587 645 3,913 - - 24 13 - -N.J. - 145 1,187 1,835 - - 1 1 - -Pa. - 57 2,013 4,004 N N 1 5 - -
E.N. CENTRAL - 370 14,820 18,556 1 2 21 88 - -Ohio - 103 5,665 4,822 - - 7 18 - -Ind. - 52 1,763 2,156 N N 2 8 - -Ill. - 176 2,502 5,398 - - 2 18 - -Mich. - 31 3,520 3,880 1 2 9 14 - -Wis. - 8 1,370 2,300 - - 1 30 - -
W.N. CENTRAL - 48 4,220 5,483 - - 14 19 - -Minn. - 9 911 1,446 - - 6 8 - -Iowa - 15 174 408 N N 3 2 - -Mo. - 22 1,500 1,876 - - 2 4 - -N. Dak. - - 41 143 N N - - - -S. Dak. - - 340 285 - - 3 - - -Nebr. - - 293 399 - - - 3 - -Kans. - 2 961 926 N N - 2 - -
S. ATLANTIC - 1,093 17,993 18,007 - - 26 56 - -Del. - 21 422 345 N N 1 - - -Md. - 140 2,012 1,924 - - 5 - - -D.C. - 19 394 460 - - - 1 - -Va. - 107 1,824 1,958 - - - - - -W. Va. - 6 299 321 N N - - - -N.C. - 45 3,507 2,558 - - 3 7 - -S.C. - 102 1,414 1,852 - - 1 - - -Ga. - 375 3,400 3,386 - - 12 39 - -Fla. - 278 4,721 5,203 N N 4 9 - -
E.S. CENTRAL - 136 6,198 6,877 - - 11 11 - -Ky. - 16 857 1,143 - - - 1 - -Tenn. - 66 2,046 2,241 - - 5 1 - -Ala. - 20 1,736 2,255 - - 5 8 - -Miss. - 34 1,559 1,238 N N 1 1 - -
W.S. CENTRAL - 379 12,070 14,167 - - 2 8 - -Ark. - 15 657 852 - - 1 2 - -La. - 65 2,067 2,329 N N - 1 - -Okla. - 7 894 1,162 N N 1 1 - -Tex. - 292 8,452 9,824 - - - 4 - -
MOUNTAIN - 106 4,287 6,308 406 236 10 8 - -Mont. - 3 238 362 - - - - - -Idaho - 1 355 235 - - 5 2 - -Wyo. - 1 157 98 - - - - - -Colo. - 20 1,100 1,854 N N 2 2 - -N. Mex. - 6 43 1,065 - 1 - - - -Ariz. - 39 1,878 1,852 404 229 2 1 - -Utah - 7 196 51 1 2 1 2 - -Nev. - 29 320 791 1 4 - 1 - -
PACIFIC - 332 11,241 17,611 66 94 11 53 - -Wash. - 39 2,018 1,846 N N - 10 - -Oreg. - 75 776 772 - - 3 7 - -Calif. - 215 7,426 14,025 66 94 8 36 - -Alaska - - 458 431 - - - - - -Hawaii - 3 563 537 - - - - - -
Guam - - - - - - - - - -P.R. - 68 104 253 N N - - - -V.I. - 33 - 28 - - - - - -Amer. Samoa U U U U U U U U U UC.N.M.I. - U - U - U - U - U
N: Not notifiable. U: Unavailable. -: No reported cases. C.N.M.I.: Commonwealth of Northern Mariana Islands.* Incidence data for reporting years 2002 and 2003 are provisional and cumulative (year-to-date).† Chlamydia refers to genital infections caused by C. trachomatis.§ Updated monthly from reports to the Division of HIV/AIDS Prevention — Surveillance and Epidemiology, National Center for HIV, STD, and TB Prevention. Last update
December 22, 2002.
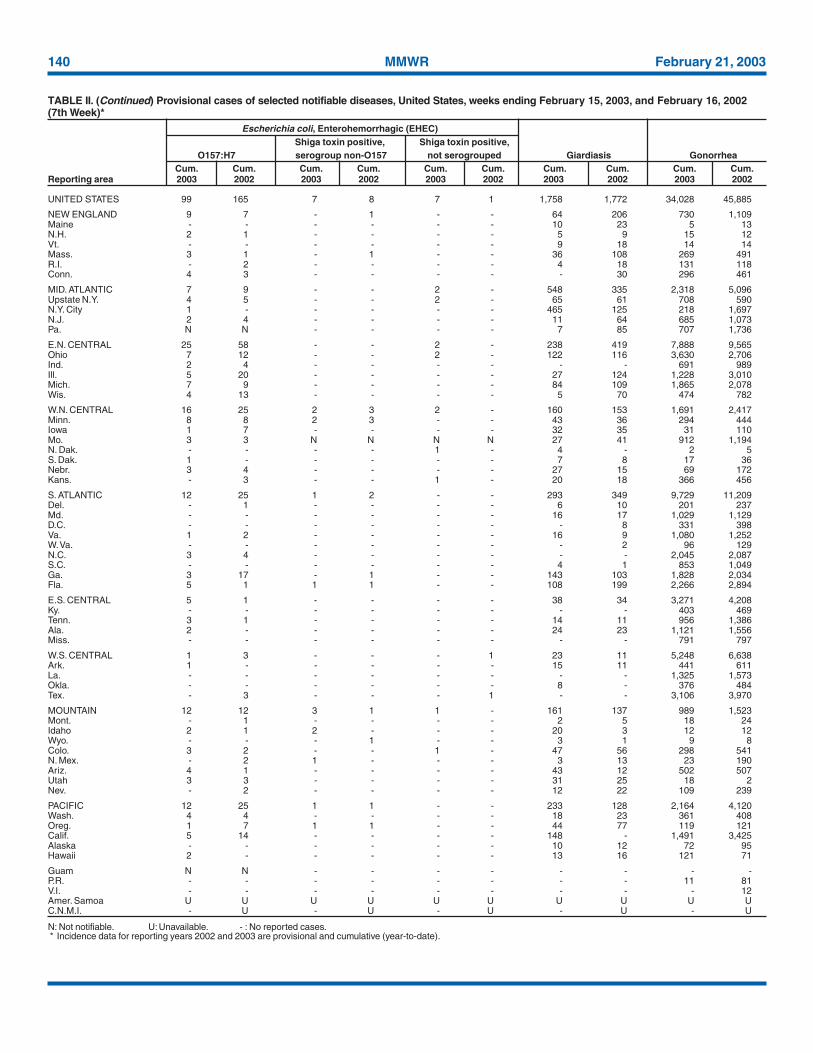
TABLE II. Provisional cases of selected notifiable diseases, United States, weeks ending February 15, 2003, and February 16, 2002(7th Week)*
Encephalitis/MeningitisAIDS Chlamydia† Coccidiodomycosis Cryptosporidiosis West Nile
Cum. Cum. Cum. Cum. Cum. Cum. Cum. Cum. Cum. Cum.Reporting area 2003§ 2002 2003 2002 2003 2002 2003 2002 2003 2002
140 MMWR February 21, 2003
UNITED STATES 99 165 7 8 7 1 1,758 1,772 34,028 45,885
NEW ENGLAND 9 7 - 1 - - 64 206 730 1,109Maine - - - - - - 10 23 5 13N.H. 2 1 - - - - 5 9 15 12Vt. - - - - - - 9 18 14 14Mass. 3 1 - 1 - - 36 108 269 491R.I. - 2 - - - - 4 18 131 118Conn. 4 3 - - - - - 30 296 461
MID. ATLANTIC 7 9 - - 2 - 548 335 2,318 5,096Upstate N.Y. 4 5 - - 2 - 65 61 708 590N.Y. City 1 - - - - - 465 125 218 1,697N.J. 2 4 - - - - 11 64 685 1,073Pa. N N - - - - 7 85 707 1,736
E.N. CENTRAL 25 58 - - 2 - 238 419 7,888 9,565Ohio 7 12 - - 2 - 122 116 3,630 2,706Ind. 2 4 - - - - - - 691 989Ill. 5 20 - - - - 27 124 1,228 3,010Mich. 7 9 - - - - 84 109 1,865 2,078Wis. 4 13 - - - - 5 70 474 782
W.N. CENTRAL 16 25 2 3 2 - 160 153 1,691 2,417Minn. 8 8 2 3 - - 43 36 294 444Iowa 1 7 - - - - 32 35 31 110Mo. 3 3 N N N N 27 41 912 1,194N. Dak. - - - - 1 - 4 - 2 5S. Dak. 1 - - - - - 7 8 17 36Nebr. 3 4 - - - - 27 15 69 172Kans. - 3 - - 1 - 20 18 366 456
S. ATLANTIC 12 25 1 2 - - 293 349 9,729 11,209Del. - 1 - - - - 6 10 201 237Md. - - - - - - 16 17 1,029 1,129D.C. - - - - - - - 8 331 398Va. 1 2 - - - - 16 9 1,080 1,252W. Va. - - - - - - - 2 96 129N.C. 3 4 - - - - - - 2,045 2,087S.C. - - - - - - 4 1 853 1,049Ga. 3 17 - 1 - - 143 103 1,828 2,034Fla. 5 1 1 1 - - 108 199 2,266 2,894
E.S. CENTRAL 5 1 - - - - 38 34 3,271 4,208Ky. - - - - - - - - 403 469Tenn. 3 1 - - - - 14 11 956 1,386Ala. 2 - - - - - 24 23 1,121 1,556Miss. - - - - - - - - 791 797
W.S. CENTRAL 1 3 - - - 1 23 11 5,248 6,638Ark. 1 - - - - - 15 11 441 611La. - - - - - - - - 1,325 1,573Okla. - - - - - - 8 - 376 484Tex. - 3 - - - 1 - - 3,106 3,970
MOUNTAIN 12 12 3 1 1 - 161 137 989 1,523Mont. - 1 - - - - 2 5 18 24Idaho 2 1 2 - - - 20 3 12 12Wyo. - - - 1 - - 3 1 9 8Colo. 3 2 - - 1 - 47 56 298 541N. Mex. - 2 1 - - - 3 13 23 190Ariz. 4 1 - - - - 43 12 502 507Utah 3 3 - - - - 31 25 18 2Nev. - 2 - - - - 12 22 109 239
PACIFIC 12 25 1 1 - - 233 128 2,164 4,120Wash. 4 4 - - - - 18 23 361 408Oreg. 1 7 1 1 - - 44 77 119 121Calif. 5 14 - - - - 148 - 1,491 3,425Alaska - - - - - - 10 12 72 95Hawaii 2 - - - - - 13 16 121 71
Guam N N - - - - - - - -P.R. - - - - - - - - 11 81V.I. - - - - - - - - - 12Amer. Samoa U U U U U U U U U UC.N.M.I. - U - U - U - U - U
N: Not notifiable. U: Unavailable. - : No reported cases.* Incidence data for reporting years 2002 and 2003 are provisional and cumulative (year-to-date).
TABLE II. (Continued) Provisional cases of selected notifiable diseases, United States, weeks ending February 15, 2003, and February 16, 2002(7th Week)*
Escherichia coli, Enterohemorrhagic (EHEC)Shiga toxin positive, Shiga toxin positive,
O157:H7 serogroup non-O157 not serogrouped Giardiasis GonorrheaCum. Cum. Cum. Cum. Cum. Cum. Cum. Cum. Cum. Cum.
Reporting area 2003 2002 2003 2002 2003 2002 2003 2002 2003 2002
Vol. 52 / No. 7 MMWR 141
UNITED STATES 145 221 2 - 19 41 2 2 537 1,213
NEW ENGLAND 14 19 - - - 5 - - 15 60Maine - 1 - - - - - - 1 1N.H. 3 - - - - - - - - 3Vt. 4 - - - - - - - 1 -Mass. 5 12 - - - 3 - - 11 32R.I. - - - - - - - - - 4Conn. 2 6 - - - 2 - - 2 20
MID. ATLANTIC 10 38 - - 3 3 - - 81 112Upstate N.Y. 4 16 - - 1 2 - - 7 13N.Y. City 5 11 - - 2 1 - - 74 27N.J. 1 8 - - - - - - - 30Pa. - 3 - - - - - - - 42
E.N. CENTRAL 12 40 1 - 3 6 - - 63 140Ohio 6 21 - - 2 3 - - 22 28Ind. 2 3 - - 1 1 - - 3 2Ill. - 15 - - - 2 - - 10 65Mich. 4 1 1 - - - - - 25 29Wis. - - - - - - - - 3 16
W.N. CENTRAL 14 3 - - 1 - 2 1 20 50Minn. 4 - - - - - - - 1 1Iowa - 1 - - - - - - 8 12Mo. 6 2 - - - - 2 1 3 10N. Dak. - - - - - - - - 1 -S. Dak. 1 - - - - - - - - 2Nebr. - - - - - - - - 2 3Kans. 3 - - - 1 - - - 5 22
S. ATLANTIC 37 54 - - 3 10 - - 194 313Del. - - - - - - - - 1 3Md. 10 16 - - 1 - - - 27 61D.C. - - - - - - - - - 12Va. 1 3 - - - 1 - - 1 5W. Va. - - - - - - - - 2 1N.C. 3 5 - - - - - - 5 42S.C. 1 - - - - - - - 6 7Ga. 7 19 - - 1 5 - - 89 41Fla. 15 11 - - 1 4 - - 63 141
E.S. CENTRAL 16 4 - - 3 1 - - 19 50Ky. 1 - - - - - - - 2 7Tenn. 7 2 - - 2 - - - 12 19Ala. 8 1 - - 1 1 - - 5 5Miss. - 1 - - - - - - - 19
W.S. CENTRAL 10 9 - - 1 4 - - 6 125Ark. 1 - - - - - - - - 5La. 3 - - - - - - - 4 4Okla. 6 9 - - 1 4 - - 2 7Tex. - - - - - - - - - 109
MOUNTAIN 22 31 1 - 4 6 - - 33 71Mont. - - - - - - - - - 2Idaho - - - - - - - - - 7Wyo. - - - - - - - - - 2Colo. 4 7 - - 1 1 - - 4 13N. Mex. 2 7 - - - 2 - - - 3Ariz. 11 13 1 - 1 2 - - 21 24Utah 4 3 - - 2 - - - 5 8Nev. 1 1 - - - 1 - - 3 12
PACIFIC 10 23 - - 1 6 - 1 106 292Wash. - - - - - - - - 2 7Oreg. 8 13 - - 1 2 - - 14 20Calif. - 4 - - - 3 - 1 87 265Alaska - 1 - - - 1 - - 1 -Hawaii 2 5 - - - - - - 2 -
Guam - - - - - - - - - -P.R. - - - - - - - - - 11V.I. - - - - - - - - - -Amer. Samoa U U U U U U U U U UC.N.M.I. - U - U - U - U - UN: Not notifiable. U: Unavailable. -: No reported cases.* Incidence data for reporting years 2002 and 2003 are provisional and cumulative (year-to-date).
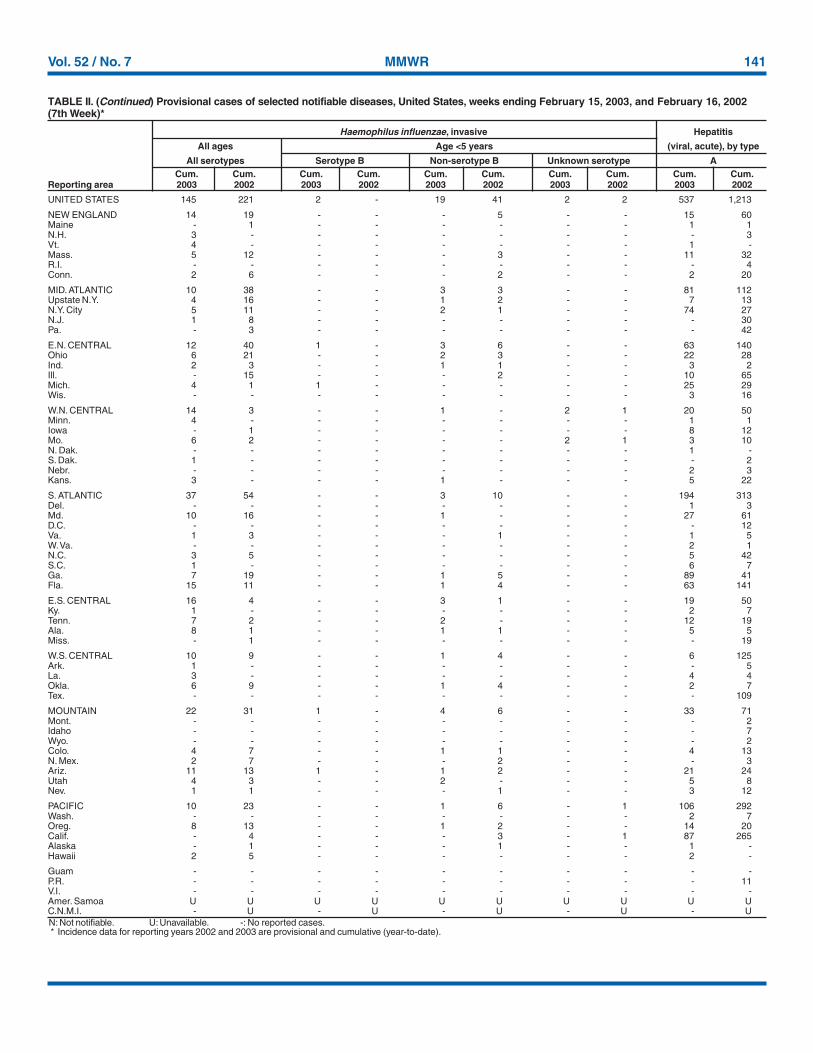
TABLE II. (Continued) Provisional cases of selected notifiable diseases, United States, weeks ending February 15, 2003, and February 16, 2002(7th Week)*
Haemophilus influenzae, invasive Hepatitis
All ages Age <5 years (viral, acute), by type
All serotypes Serotype B Non-serotype B Unknown serotype ACum. Cum. Cum. Cum. Cum. Cum. Cum. Cum. Cum. Cum.
Reporting area 2003 2002 2003 2002 2003 2002 2003 2002 2003 2002
142 MMWR February 21, 2003
UNITED STATES 627 603 102 222 98 97 43 45 354 576
NEW ENGLAND 17 31 - 6 3 5 3 3 4 55Maine - - - - - - - 1 - -N.H. - 3 - - - 1 1 - - 7Vt. 1 2 - 4 1 - - - 3 -Mass. 16 22 - 2 1 2 2 1 - 45R.I. - - - - - - - - 1 3Conn. - 4 - - 1 2 - 1 - -
MID. ATLANTIC 154 121 7 7 13 19 10 5 285 417Upstate N.Y. 5 4 3 2 5 4 2 3 194 241N.Y. City 91 59 - - 8 - 5 1 55 -N.J. 55 36 4 3 - 6 2 - 34 89Pa. 3 22 - 2 - 9 1 1 2 87
E.N. CENTRAL 50 50 14 10 28 37 5 9 6 16Ohio 24 7 1 - 16 24 2 4 4 2Ind. - 2 - - - 3 1 - 2 1Ill. - 3 1 2 - - - 1 - -Mich. 26 32 12 8 12 8 2 1 - -Wis. - 6 - - - 2 - 3 U 13
W.N. CENTRAL 21 30 27 82 2 2 2 1 - 7Minn. 2 1 - - - - 1 - - 2Iowa 1 6 - - 1 - - - - 3Mo. 13 13 25 79 - 1 - 1 - 2N. Dak. - - - - - - - - - -S. Dak. - - - - - - - - - -Nebr. 4 5 2 3 - 1 1 - - -Kans. 1 5 - - 1 - - - - -
S. ATLANTIC 221 167 22 13 40 13 11 6 43 62Del. 1 2 - 3 - 3 - - - 9Md. 9 18 2 2 11 5 2 1 31 45D.C. - 2 - - - - - - - 3Va. 1 18 - - 2 - - - - -W. Va. - 2 - - N N - - - -N.C. 17 34 1 3 4 1 1 - 6 -S.C. - 3 - 1 - - 1 2 - 1Ga. 133 27 3 1 5 3 3 2 1 -Fla. 60 61 16 3 18 1 4 1 5 4
E.S. CENTRAL 28 48 13 24 1 1 4 2 1 2Ky. 6 4 2 1 - - - - - -Tenn. 6 17 - 3 1 - - 1 1 -Ala. 9 14 1 2 - 1 3 1 - -Miss. 7 13 10 18 - - 1 - - 2
W.S. CENTRAL 10 21 6 61 2 2 - 4 2 8Ark. - 17 - 4 - - - - - -La. 10 3 6 1 - - - - 2 1Okla. - 1 - - 2 - - - - -Tex. - - - 56 - 2 - 4 - 7
MOUNTAIN 69 38 7 5 5 4 8 3 1 1Mont. 2 - - - - - 1 - - -Idaho - - - - 1 - - - 1 -Wyo. 1 3 - 2 - - - - - -Colo. 12 10 5 1 1 1 5 1 - -N. Mex. - 10 - - - 1 - - - 1Ariz. 49 7 2 - 2 - 2 2 - -Utah 4 3 - - 1 2 - - - -Nev. 1 5 - 2 - - - - - -
PACIFIC 57 97 6 14 4 14 - 12 12 8Wash. 3 5 1 1 - - - - - -Oreg. 17 20 2 6 N N - 1 3 1Calif. 37 71 3 7 4 14 - 11 9 7Alaska - 1 - - - - - - - -Hawaii - - - - - - - - N N
Guam - - - - - - - - - -P.R. - 4 - - - - - 1 N NV.I. - - - - - - - - - -Amer. Samoa U U U U U U U U U UC.N.M.I. - U - U - U - U - UN: Not notifiable. U: Unavailable. -: No reported cases.* Incidence data for reporting years 2002 and 2003 are provisional and cumulative (year-to-date).
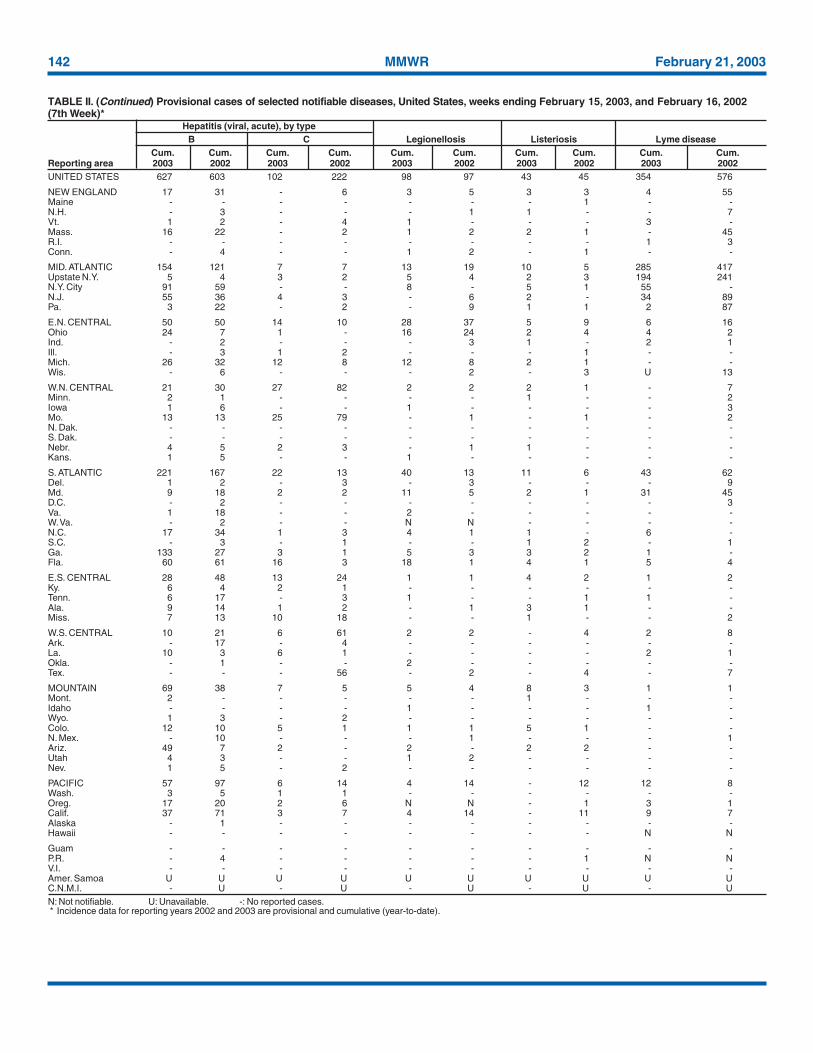
TABLE II. (Continued) Provisional cases of selected notifiable diseases, United States, weeks ending February 15, 2003, and February 16, 2002(7th Week)*
Hepatitis (viral, acute), by typeB C Legionellosis Listeriosis Lyme disease
Cum. Cum. Cum. Cum. Cum. Cum. Cum. Cum. Cum. Cum.Reporting area 2003 2002 2003 2002 2003 2002 2003 2002 2003 2002
Vol. 52 / No. 7 MMWR 143
UNITED STATES 93 131 153 254 413 662 363 650 26 33
NEW ENGLAND 2 12 7 19 85 138 50 64 1 -Maine 1 1 1 2 - 3 4 4 - -N.H. 1 4 - 1 - 1 2 1 - -Vt. - - - 2 16 19 3 17 - -Mass. - 4 5 11 69 110 18 19 1 -R.I. - - - 2 - - - 4 - -Conn. - 3 1 1 - 5 23 19 - -
MID. ATLANTIC 34 21 12 28 30 35 37 85 1 4Upstate N.Y. 4 3 3 6 28 26 34 54 - -N.Y. City 28 7 7 5 - 4 1 4 1 -N.J. 2 9 1 6 2 - - 14 - -Pa. - 2 1 11 - 5 2 13 - 4
E.N. CENTRAL 6 18 26 39 49 90 4 2 1 2Ohio 3 7 11 16 44 50 - 1 1 2Ind. - - 4 6 - 3 2 1 - -Ill. 1 6 - 5 - 11 - - - -Mich. 2 4 8 7 4 11 2 - - -Wis. - 1 3 5 1 15 - - - -
W.N. CENTRAL 4 8 10 14 14 61 52 39 1 1Minn. 2 - 1 - - 1 4 3 - -Iowa 2 2 4 3 1 22 5 4 1 -Mo. - 2 4 6 7 23 - 1 - 1N. Dak. - - - - - - 8 - - -S. Dak. - - - 2 1 2 - 15 - -Nebr. - 2 - 2 - 2 - - - -Kans. - 2 1 1 5 11 35 16 - -
S. ATLANTIC 27 34 40 35 60 38 184 188 20 23Del. - - 4 1 - 1 - 3 - -Md. 12 14 3 1 12 7 2 48 4 5D.C. - 2 - - - - - - - -Va. - - 2 2 1 12 47 54 - -W. Va. 1 - - - - - 7 18 - -N.C. 4 4 4 5 27 7 66 54 16 18S.C. - 2 - 2 - 10 13 6 - -Ga. 3 11 6 7 14 - 36 - - -Fla. 7 1 21 17 6 1 13 5 - -
E.S. CENTRAL 3 3 9 10 14 23 4 109 1 2Ky. - - - - 3 6 3 1 - -Tenn. 1 1 3 1 4 10 - 108 1 2Ala. 2 1 3 8 7 1 1 - - -Miss. - 1 3 1 - 6 - - - -
W.S. CENTRAL 1 1 11 40 - 111 10 122 - 1Ark. - - 1 5 - 93 - - - -La. 1 1 7 3 - - - - - -Okla. - - 3 4 - 2 10 16 - -Tex. - - - 28 - 16 - 106 - 1
MOUNTAIN 3 4 5 19 108 82 10 15 - -Mont. - - - - - 2 1 - - -Idaho - - - - 2 5 - - - -Wyo. - - - - - 2 - 1 - -Colo. 2 2 1 6 51 45 - - - -N. Mex. - - 1 - 10 13 - - - -Ariz. 1 - 3 7 35 9 9 14 - -Utah - 1 - 1 7 5 - - - -Nev. - 1 - 5 3 1 - - - -
PACIFIC 13 30 33 50 53 84 12 26 1 -Wash. 4 - 2 7 15 4 - - - -Oreg. 5 - 9 11 32 11 - - - -Calif. 4 27 21 30 6 65 12 12 1 -Alaska - 1 - 1 - 1 - 14 - -Hawaii - 2 1 1 - 3 - - - -
Guam - - - - - - - - - -P.R. - - - 1 - - - 12 - -V.I. - - - - - - - - - -Amer. Samoa U U U U U U U U U UC.N.M.I. - U - U - U - U - U
N: Not notifiable. U: Unavailable. - : No reported cases.* Incidence data for reporting years 2002 and 2003 are provisional and cumulative (year-to-date).
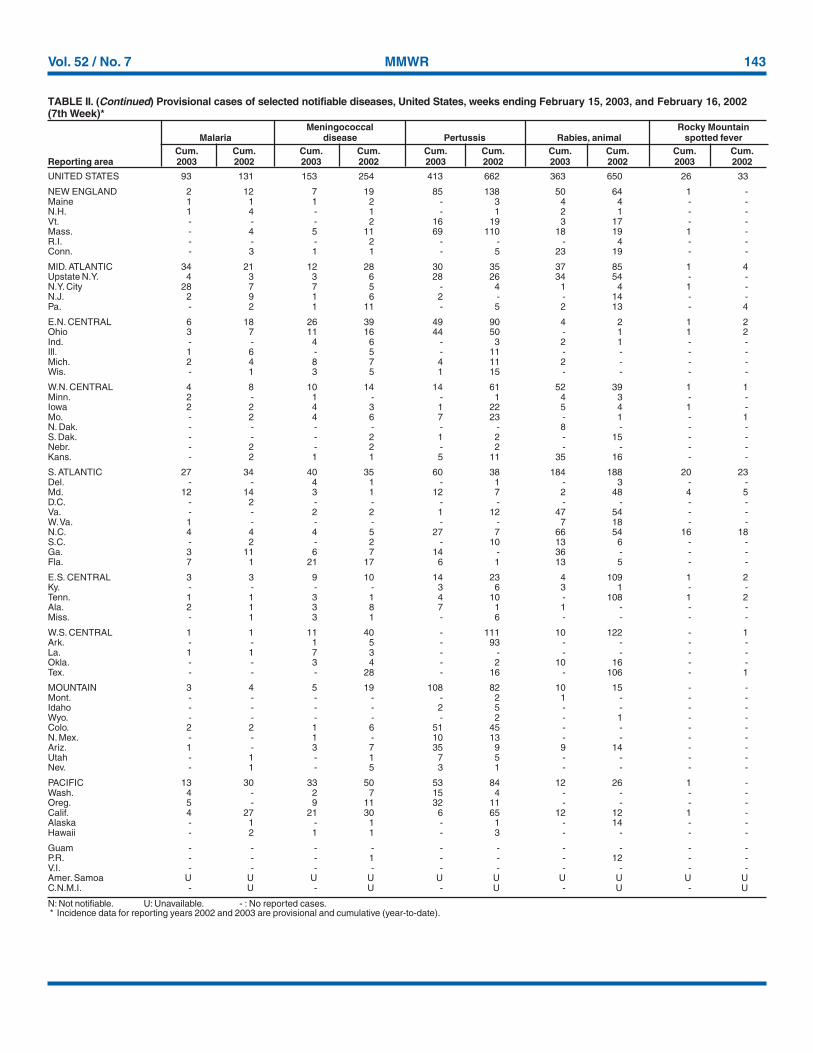
TABLE II. (Continued) Provisional cases of selected notifiable diseases, United States, weeks ending February 15, 2003, and February 16, 2002(7th Week)*
Meningococcal Rocky MountainMalaria disease Pertussis Rabies, animal spotted fever
Cum. Cum. Cum. Cum. Cum. Cum. Cum. Cum. Cum. Cum.Reporting area 2003 2002 2003 2002 2003 2002 2003 2002 2003 2002
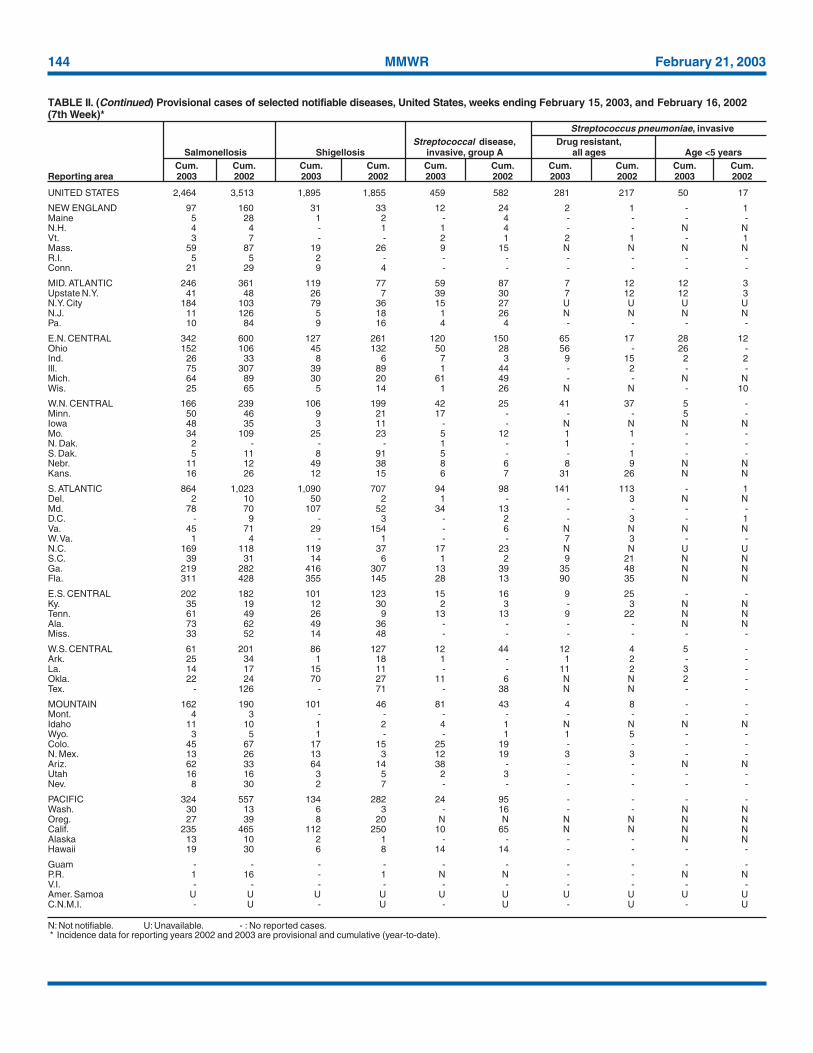
144 MMWR February 21, 2003
UNITED STATES 2,464 3,513 1,895 1,855 459 582 281 217 50 17
NEW ENGLAND 97 160 31 33 12 24 2 1 - 1Maine 5 28 1 2 - 4 - - - -N.H. 4 4 - 1 1 4 - - N NVt. 3 7 - - 2 1 2 1 - 1Mass. 59 87 19 26 9 15 N N N NR.I. 5 5 2 - - - - - - -Conn. 21 29 9 4 - - - - - -
MID. ATLANTIC 246 361 119 77 59 87 7 12 12 3Upstate N.Y. 41 48 26 7 39 30 7 12 12 3N.Y. City 184 103 79 36 15 27 U U U UN.J. 11 126 5 18 1 26 N N N NPa. 10 84 9 16 4 4 - - - -
E.N. CENTRAL 342 600 127 261 120 150 65 17 28 12Ohio 152 106 45 132 50 28 56 - 26 -Ind. 26 33 8 6 7 3 9 15 2 2Ill. 75 307 39 89 1 44 - 2 - -Mich. 64 89 30 20 61 49 - - N NWis. 25 65 5 14 1 26 N N - 10
W.N. CENTRAL 166 239 106 199 42 25 41 37 5 -Minn. 50 46 9 21 17 - - - 5 -Iowa 48 35 3 11 - - N N N NMo. 34 109 25 23 5 12 1 1 - -N. Dak. 2 - - - 1 - 1 - - -S. Dak. 5 11 8 91 5 - - 1 - -Nebr. 11 12 49 38 8 6 8 9 N NKans. 16 26 12 15 6 7 31 26 N N
S. ATLANTIC 864 1,023 1,090 707 94 98 141 113 - 1Del. 2 10 50 2 1 - - 3 N NMd. 78 70 107 52 34 13 - - - -D.C. - 9 - 3 - 2 - 3 - 1Va. 45 71 29 154 - 6 N N N NW. Va. 1 4 - 1 - - 7 3 - -N.C. 169 118 119 37 17 23 N N U US.C. 39 31 14 6 1 2 9 21 N NGa. 219 282 416 307 13 39 35 48 N NFla. 311 428 355 145 28 13 90 35 N N
E.S. CENTRAL 202 182 101 123 15 16 9 25 - -Ky. 35 19 12 30 2 3 - 3 N NTenn. 61 49 26 9 13 13 9 22 N NAla. 73 62 49 36 - - - - N NMiss. 33 52 14 48 - - - - - -
W.S. CENTRAL 61 201 86 127 12 44 12 4 5 -Ark. 25 34 1 18 1 - 1 2 - -La. 14 17 15 11 - - 11 2 3 -Okla. 22 24 70 27 11 6 N N 2 -Tex. - 126 - 71 - 38 N N - -
MOUNTAIN 162 190 101 46 81 43 4 8 - -Mont. 4 3 - - - - - - - -Idaho 11 10 1 2 4 1 N N N NWyo. 3 5 1 - - 1 1 5 - -Colo. 45 67 17 15 25 19 - - - -N. Mex. 13 26 13 3 12 19 3 3 - -Ariz. 62 33 64 14 38 - - - N NUtah 16 16 3 5 2 3 - - - -Nev. 8 30 2 7 - - - - - -
PACIFIC 324 557 134 282 24 95 - - - -Wash. 30 13 6 3 - 16 - - N NOreg. 27 39 8 20 N N N N N NCalif. 235 465 112 250 10 65 N N N NAlaska 13 10 2 1 - - - - N NHawaii 19 30 6 8 14 14 - - - -
Guam - - - - - - - - - -P.R. 1 16 - 1 N N - - N NV.I. - - - - - - - - - -Amer. Samoa U U U U U U U U U UC.N.M.I. - U - U - U - U - U
N: Not notifiable. U: Unavailable. - : No reported cases.* Incidence data for reporting years 2002 and 2003 are provisional and cumulative (year-to-date).
TABLE II. (Continued) Provisional cases of selected notifiable diseases, United States, weeks ending February 15, 2003, and February 16, 2002(7th Week)*
Streptococcus pneumoniae, invasiveStreptococcal disease, Drug resistant,
Salmonellosis Shigellosis invasive, group A all ages Age <5 yearsCum. Cum. Cum. Cum. Cum. Cum. Cum. Cum. Cum. Cum.
Reporting area 2003 2002 2003 2002 2003 2002 2003 2002 2003 2002

Vol. 52 / No. 7 MMWR 145
UNITED STATES 682 728 23 48 474 981 20 32 1,677
NEW ENGLAND 20 9 - - 14 34 1 4 405Maine - - - - - 2 - - 211N.H. - - - - - 1 - - -Vt. - - - - - - - - 156Mass. 17 6 - - 5 4 - 3 38R.I. 3 - - - 3 12 - - -Conn. - 3 - - 6 15 1 1 -
MID. ATLANTIC 73 74 5 9 130 165 7 4 -Upstate N.Y. 3 3 3 1 1 14 - - -N.Y. City 46 42 1 3 117 75 7 2 -N.J. 23 19 1 5 - 41 - 2 -Pa. 1 10 - - 12 35 - - -
E.N. CENTRAL 94 141 6 4 76 86 2 4 933Ohio 26 19 1 - 13 13 - 2 255Ind. 1 9 1 - 13 12 1 - -Ill. 11 43 3 3 33 44 - - -Mich. 54 65 1 1 14 11 1 1 662Wis. 2 5 - - 3 6 - 1 16
W.N. CENTRAL 14 11 - - 39 58 - 1 2Minn. 4 5 - - 11 22 - 1 -Iowa - - - - 6 - - - -Mo. 3 3 - - 8 24 - - -N. Dak. - - - - - - - - 2S. Dak. - - - - 4 - - - -Nebr. - 2 - - - 1 - - -Kans. 7 1 - - 10 11 - - -
S. ATLANTIC 192 169 3 11 59 130 1 9 326Del. 1 2 - - - - - - 1Md. 30 14 - 1 8 10 1 1 -D.C. 5 3 - - - - - - -Va. 10 5 - - 13 19 - - 65W. Va. - - - - 1 5 - - 255N.C. 22 48 - 3 13 10 - - -S.C. 14 17 1 2 10 2 - - 5Ga. 22 22 - 2 14 17 - 4 -Fla. 88 58 2 3 - 67 - 4 -
E.S. CENTRAL 43 81 3 3 31 64 - - -Ky. 5 2 - - - 13 - - -Tenn. 21 33 3 2 9 29 - - -Ala. 14 31 - - 22 16 - - -Miss. 3 15 - 1 - 6 - - -
W.S. CENTRAL 96 100 2 16 12 206 - 3 1Ark. 8 1 - - 5 3 - - -La. 11 20 - - - - - - 1Okla. 6 11 - - 7 2 - - -Tex. 71 68 2 16 - 201 - 3 -
MOUNTAIN 22 36 4 2 10 31 2 1 10Mont. - - - - - - - - -Idaho - 1 - - - - - - -Wyo. - - - - 1 1 - - 2Colo. - 2 - 1 2 7 2 1 -N. Mex. 3 4 - - - 7 - - -Ariz. 19 29 4 1 7 11 - - -Utah - - - - - 2 - - 8Nev. - - - - - 3 - - -
PACIFIC 128 107 - 3 103 207 7 6 -Wash. 7 6 - - 24 18 - - -Oreg. 5 4 - - 6 8 2 1 -Calif. 114 96 - 3 49 154 5 5 -Alaska - - - - 9 11 - - -Hawaii 2 1 - - 15 16 - - -
Guam - - - - - - - - -P.R. 9 23 - 8 - - - - 5V.I. - 1 - - - - - - -Amer. Samoa U U U U U U U U UC.N.M.I. - U - U - U - U -
N: Not notifiable. U: Unavailable. - : No reported cases.* Incidence data for reporting years 2002 and 2003 are provisional and cumulative (year-to-date).
TABLE II. (Continued) Provisional cases of selected notifiable diseases, United States, weeks ending February 15, 2003, and February 16, 2002(7th Week)*
Syphilis VaricellaPrimary & secondary Congenital Tuberculosis Typhoid fever (Chickenpox)Cum. Cum. Cum. Cum. Cum. Cum. Cum. Cum. Cum.
Reporting area 2003 2002 2003 2002 2003 2002 2003 2002 2003

146 MMWR February 21, 2003
NEW ENGLAND 491 383 76 15 7 10 55Boston, Mass. 169 124 30 5 2 8 14Bridgeport, Conn. 43 30 8 3 1 1 2Cambridge, Mass. 12 9 2 1 - - 4Fall River, Mass. 32 29 3 - - - 2Hartford, Conn. U U U U U U ULowell, Mass. 27 25 2 - - - 3Lynn, Mass. 15 11 4 - - - -New Bedford, Mass. 29 27 2 - - - 4New Haven, Conn. U U U U U U UProvidence, R.I. U U U U U U USomerville, Mass. 5 4 - - 1 - -Springfield, Mass. 43 33 6 3 1 - 6Waterbury, Conn. 46 36 8 1 1 - 8Worcester, Mass. 70 55 11 2 1 1 12
MID. ATLANTIC 2,270 1,582 468 124 38 54 130Albany, N.Y. 48 37 8 2 - 1 2Allentown, Pa. 23 19 4 - - - 1Buffalo, N.Y. 111 84 22 4 - 1 12Camden, N.J. 43 26 9 6 - 2 8Elizabeth, N.J. U U U U U U UErie, Pa. 58 49 6 1 - 2 2Jersey City, N.J. 51 40 10 1 - - -New York City, N.Y. 1,050 715 240 61 18 12 44Newark, N.J. 49 16 15 11 - 7 1Paterson, N.J. 23 16 5 - 2 - 1Philadelphia, Pa. 400 263 83 24 10 20 24Pittsburgh, Pa.§ 29 20 6 1 - 2 1Reading, Pa. 19 17 1 1 - - -Rochester, N.Y. 133 103 24 3 1 2 13Schenectady, N.Y. 18 15 2 - 1 - 1Scranton, Pa. 31 25 5 1 - - 2Syracuse, N.Y. 101 78 14 4 3 2 12Trenton, N.J. 37 26 5 2 1 3 -Utica, N.Y. 15 8 5 1 1 - 1Yonkers, N.Y. 31 25 4 1 1 - 5
E.N. CENTRAL 1,967 1,321 429 124 55 38 143Akron, Ohio 58 36 13 5 3 1 10Canton, Ohio 45 32 10 2 1 - 4Chicago, Ill. 318 192 89 29 4 4 26Cincinnati, Ohio 99 71 18 4 1 5 12Cleveland, Ohio 148 96 37 8 4 3 4Columbus, Ohio 210 136 48 16 5 5 22Dayton, Ohio 118 80 23 6 8 1 4Detroit, Mich. 187 106 49 12 11 9 10Evansville, Ind. 42 42 - - - - 3Fort Wayne, Ind. 59 42 8 8 1 - 3Gary, Ind. 14 8 2 3 1 - -Grand Rapids, Mich. 55 41 11 2 - 1 7Indianapolis, Ind. 241 163 56 13 5 4 12Lansing, Mich. U U U U U U UMilwaukee, Wis. 122 88 21 6 6 1 12Peoria, Ill. 44 36 6 2 - - 2Rockford, Ill. 64 51 9 2 2 - 6South Bend, Ind. 50 31 13 1 3 2 1Toledo, Ohio 93 70 16 5 - 2 5Youngstown, Ohio U U U U U U U
W.N. CENTRAL 564 395 104 34 19 12 38Des Moines, Iowa 48 42 4 1 1 - 3Duluth, Minn. 34 25 8 1 - - 1Kansas City, Kans. 47 24 15 4 3 1 3Kansas City, Mo. 100 66 18 8 6 2 6Lincoln, Nebr. 35 26 4 3 - 2 5Minneapolis, Minn. 71 47 13 2 5 4 5Omaha, Nebr. 98 74 11 7 4 2 6St. Louis, Mo. U U U U U U USt. Paul, Minn. 47 37 8 1 - 1 3Wichita, Kans. 84 54 23 7 - - 6
S. ATLANTIC 1,276 820 286 113 26 30 84Atlanta, Ga. 203 124 50 23 5 1 11Baltimore, Md. 189 117 47 20 4 1 15Charlotte, N.C. 119 83 17 13 3 3 7Jacksonville, Fla. 175 116 33 18 2 6 16Miami, Fla. 124 76 33 8 2 5 8Norfolk, Va. 45 26 13 4 1 1 3Richmond, Va. 49 34 6 5 3 1 3Savannah, Ga. 49 30 14 3 2 - 3St. Petersburg, Fla. 77 50 17 6 - 3 3Tampa, Fla. 221 150 48 11 4 8 14Washington, D.C. U U U U U U UWilmington, Del. 25 14 8 2 - 1 1
E.S. CENTRAL 888 617 174 58 27 11 73Birmingham, Ala. 198 140 36 16 3 2 22Chattanooga, Tenn. 73 50 15 6 2 - 2Knoxville, Tenn. 106 81 18 4 1 2 5Lexington, Ky. 69 47 17 3 2 - 9Memphis, Tenn. 171 117 34 12 5 3 11Mobile, Ala. 87 59 17 6 3 2 10Montgomery, Ala. 14 11 3 - - - 3Nashville, Tenn. 170 112 34 11 11 2 11
W.S. CENTRAL 1,130 731 220 83 52 44 79Austin, Tex. 104 63 27 9 2 3 13Baton Rouge, La. 66 40 18 4 1 3 1Corpus Christi, Tex. 59 43 9 3 1 3 4Dallas, Tex. 90 72 13 1 1 3 9El Paso, Tex. 110 86 14 4 2 4 1Ft. Worth, Tex. 125 81 27 12 2 3 12Houston, Tex. 369 204 74 35 37 19 24Little Rock, Ark. 67 39 13 8 3 4 -New Orleans, La. U U U U U U USan Antonio, Tex. U U U U U U UShreveport, La. 38 29 7 1 - 1 5Tulsa, Okla. 102 74 18 6 3 1 10
MOUNTAIN 931 602 159 87 38 26 59Albuquerque, N.M. 123 73 - 30 18 2 7Boise, Idaho 42 33 7 - 2 - 6Colo. Springs, Colo. 64 39 4 2 - - 1Denver, Colo. 111 65 21 9 8 8 10Las Vegas, Nev. 261 159 72 21 5 4 13Ogden, Utah 26 20 3 3 - - 2Phoenix, Ariz. U U U U U U UPueblo, Colo. 23 19 2 2 - - 3Salt Lake City, Utah 94 55 20 10 2 7 8Tucson, Ariz. 187 139 30 10 3 5 9
PACIFIC 1,629 1,134 314 100 42 34 148Berkeley, Calif. 12 8 4 - - - 1Fresno, Calif. 155 111 28 12 4 - 9Glendale, Calif. 20 17 2 1 - - 2Honolulu, Hawaii U U U U U U ULong Beach, Calif. 58 35 13 5 3 2 10Los Angeles, Calif. 425 285 85 31 16 8 37Pasadena, Calif. 27 18 2 1 - 1 2Portland, Oreg. 121 82 28 6 3 2 5Sacramento, Calif. 155 112 27 11 2 3 20San Diego, Calif. 166 111 33 11 3 8 17San Francisco, Calif. U U U U U U USan Jose, Calif. 197 142 34 11 4 6 25Santa Cruz, Calif. 28 22 4 1 1 - 3Seattle, Wash. 90 61 19 6 3 1 6Spokane, Wash. 65 51 11 - 1 2 4Tacoma, Wash. 110 79 24 4 2 1 7
TOTAL 11,146¶ 7,585 2,230 738 304 259 809
U: Unavailable. -:No reported cases.* Mortality data in this table are voluntarily reported from 122 cities in the United States, most of which have populations of >100,000. A death is reported by the place of its
occurrence and by the week that the death certificate was filed. Fetal deaths are not included.† Pneumonia and influenza.§ Because of changes in reporting methods in this Pennsylvania city, these numbers are partial counts for the current week. Complete counts will be available in 4 to 6 weeks.¶ Total includes unknown ages.
TABLE III. Deaths in 122 U.S. cities,* week ending February 15, 2003 (7th Week)All causes, by age (years) All causes, by age (years)
All P&I† All P&I†
Reporting Area Ages >65 45-64 25-44 1-24 <1 Total Reporting Area Ages >65 45-64 25-44 1-24 <1 Total
Vol. 52 / No. 7 MMWR 147
All MMWR references are available on the Internet at http://www.cdc.gov/mmwr. Use the search function to find specific articles.——————
Use of trade names and commercial sources is for identification only and does not imply endorsement by the U.S. Department of Healthand Human Services.
——————References to non-CDC sites on the Internet are provided as a service to MMWR readers and do not constitute or imply endorsement ofthese organizations or their programs by CDC or the U.S. Department of Health and Human Services. CDC is not responsible for thecontent of these sites. URL addresses listed in MMWR were current as of the date of publication.

MMWR
The Morbidity and Mortality Weekly Report (MMWR) Series is prepared by the Centers for Disease Control and Prevention (CDC) andis available free of charge in electronic format and on a paid subscription basis for paper copy. To receive an electronic copy each week, sendan e-mail message to [email protected]. The body content should read SUBscribe mmwr-toc. Electronic copy also is available fromCDC’s World-Wide Web server at http://www.cdc.gov/mmwr or from CDC’s file transfer protocol server at ftp://ftp.cdc.gov/pub/publications/mmwr. To subscribe for paper copy, contact Superintendent of Documents, U.S. Government Printing Office, Washington, DC 20402;telephone 202-512-1800.
Data in the weekly MMWR are provisional, based on weekly reports to CDC by state health departments. The reporting weekconcludes at close of business on Friday; compiled data on a national basis are officially released to the public on the following Friday.Address inquiries about the MMWR Series, including material to be considered for publication, to Editor, MMWR Series, Mailstop C-08,CDC, 1600 Clifton Rd., N.E., Atlanta, GA 30333; telephone 888-232-3228.
All material in the MMWR Series is in the public domain and may be used and reprinted without permission; citation as to source,however, is appreciated.
✩U.S. Government Printing Office: 2003-533-155/69096 Region IV
148 February 21, 2003