market value added and traditional accounting criteria ... · desired regarding the incremental...
TRANSCRIPT

Market value added and traditional accounting criteria:
Which measure is a best predictor of stock return in
Malaysian companies
Habibollah Nakhaei
Department of Accounting, Birjand Branch, Islamic Azad University, Birjand, Iran
(Received: 10 May, 2015; Revised: 19 September, 2015; Accepted: 31 October, 2015)
Abstract
This study tests the hypothesis that market value added (MVA) is more highly
associated with stock return (SR) than traditional performance measures. The
purpose of this study is to provide empirical evidence on the relative and
incremental information content of MVA and traditional performance measures,
namely, net income (NI), net operational profit after tax (NOPAT), and earning per
shares (EPS). The sample involved 395 non-financial companies listed in the main
market of Bursa Malaysia over the period 2002–2011. To analyze the hypotheses
panel data regression methods were employed. The results indicated that accounting
measures (NI, NOPAT and EPS) have higher relative information content with stock
return compared to MVA. Thus, the results do not support the hypothesis that MVA
is superior to traditional accounting measures in association with stock return.
Moreover, the findings showed that MVA has incremental information content with
stock return compared to accounting measures. Consequently, MVA is a useful
measure in describing the firm’s stock return in Bursa Malaysia. Therefore,
Malaysian companies can use MVA with traditional measures (NI, NOPAT, and
EPS) in evaluating companies’ performance.
Keywords
Earning per shares, Market value added, Net income, Relative and incremental
information content, Stock return.
Corresponding Author, E-mail: [email protected]
Iranian Journal of Management Studies (IJMS) http://ijms.ut.ac.ir/
Vol. 9, No. 2, Spring 2016 Print ISSN: 2008-7055
pp. 433-455 Online ISSN: 2345-3745
Online ISSN 2345-3745

434 (IJMS) Vol. 9, No. 2, Spring 2016
Introduction
Maximization of shareholder value is the main purpose of each
company. In this regard, evaluating companies’ performance is vital in
ensuring and achieving optimal allocation of limited resources. Large
numbers of accounting performance measures have been developed.
These criteria are often criticized for two reasons namely, not
including the companies’ capital cost and they are based on
accounting information, which could be distorted by Generally
Accepted Accounting Principle (GAAP). For this reason, the value
based measures are presented to resolve the limitation of accounting
measures (Nakhaei et al., 2013). According to, Erasmus (2008b, p.66),
“Value-based (VB) financial performance measures are often
advanced as improvements over measures facilitates the evaluation of
value creation. Furthermore, they attempt to remove some accounting
distortions resulting from the limitations of conventional accounting
information.”
Incremental comparisons ask whether one accounting measure
provides information content beyond that provided by another, and
apply when one measure is viewed as given and an assessment is
desired regarding the incremental contribution of another (e.g., a
supplemental disclosure). Relative comparisons ask which measure
has greater information content, and apply when making mutually
exclusive choices among alternatives, or when rankings by
information content are desired (e.g., when comparing alternative
disclosures). Questions of both incremental and relative information
content arise frequently in accounting. However, few previous studies
have examined questions of relative information content. Possible
explanations include unfamiliarity with the relative versus incremental
distinction, and the additional statistical complexity involved in
testing for relative information content (Biddle et al., 1995).
MVA is an option to approximate the stockholder value creation.
MVA is a contrast between market value of company and capital
supplied by the investors over a period of time. MVA is connected to
EVA because it is the present value of future EVA value (Baum et al.,

Market value added and traditional accounting criteria: Which measure is … 435
2004). Hence, EVA is a measure of performance in a given year,
while MVA is the increasing calculate of future years (Kramer &
Peters, 2001). Moreover, EVA is an internal performance measure and
MVA is an external performance measure (Rahnamay-Roodposhti et
al., 2006).
Internationally, there are many studies directed to recognize the
relationship between accounting and value based financial
performance measures with stock return, but most of these studies
have been managed in developed countries and very little research has
been conducted on EVA in Asian countries specially in Malaysia
(Sharma & Kumar, 2010). In addition, more research is needed on
performance measures tools, especially on value based criteria (Al
Mamun & Abu Mansor, 2012; Ismail, 2006).
Subsequently, there have been very little research conducted on
MVA in Asian countries, including Malaysia (Al Mamun & Abu
Mansor, 2012; Sharma & Kumar, 2010). The study aimed to examine
the relative and incremental information content between MVA as
proxy of value based measures and accounting measures (NI,
NOPAT, & EPS) with stock return on non-financial firms listed in
Bursa Malaysia over the period 2002 to 2011. In other words, this
study seeks to investigate whether MVA is a superior measure in
prediction of stock return compared to NI, NOPAT and EPS.
The remainder of the paper is organized as follows; literature
review, hypothesis, research variables, methodology, empirical
findings, conclusion, limitations, and recommendations for future
research.
Literature review
Finding a superior measure to evaluate a company's performance is
one of the important subjects of recent financial researches. MVA is
an option to approximate the stockholder value creation. MVA is a
contrast between market value of company and capital supplied by the
investors over a period of time. MVA is connected to economic value
added (EVA) because it is the present value of future EVA value
(Baum et al., 2004). Moreover, EVA is a measure of performance in a

436 (IJMS) Vol. 9, No. 2, Spring 2016
given year, while MVA is a market generated number that we
calculate by subtracting the capital invested in a firm from sum of the
total market value of the firm’s equity and the book value of its debt
(Kramer & Peters 2001).
MVA is explained as the difference between the firm’s market
value (including equity and debt) and the total capital invested in the
company (Young & O’Byrne, 2001). It is an external performance
measure, which is considered to be the best index of creation
shareholder value. MVA has presented a new shareholder value
measure by Stewart (1991) which describes the value market adds
over the book value of invested capital (Khan et al., 2012). Karpik and
Belkaoui (1990) used market model and found that value added
variables process incremental information content beyond accrual
earnings and cash flows in the context of explaining market risk.
Likewise, Peixoto (2002) examined the relative information content of
EVA against operational profit (OP) and net profit (NP). The results
illustrated that net profit (NP) have provided more explanatory power
beyond operational profit (OP) and EVA in relevant of total stock
return (dependent variable).
De Wet (2005) investigated the relationship between EVA and
traditional accounting measures (OCF, ROA, EPS, and DPS) with
MVA. The study rooted on the data of firms listed on the JSE South
Africa from 1994-2004.The findings discovered that year-on-year
basis; EVA did not reveal the strongest association with MVA. The
results also demonstrated the strongest association between MVA and
operational cash flow (OCF). Furthermore, the study also found very
little relationship between EPS and DPS with MVA.
Furthermore, Wong (2005) examined the impact of EVA and
traditional performance measures (ROA, ROE, and EPS) on stock
returns in the public companies listed in the main market of Bursa
Malaysia for the year 1990-2000. The findings revealed that ROA,
ROE, and EPS have significant influence on stock returns.
Nonetheless, EVA was found to be the worst performer in predicting
stock returns. Beside, Yaghoob-nejad and Akaf (2007) studied the
relationship between EVA, residual income (RI), return on sales

Market value added and traditional accounting criteria: Which measure is … 437
(ROS), return on investment (ROI), and MVA on companies listed in
Tehran stock exchange (TSE). Their results revealed there is
meaningful relationship between EVA, RI, ROS, and ROI with MVA.
Ismail (2011) also used EVA as a predictor for predicting company
performance after 1997 economic crisis. His results showed that EVA
had a better relationship with stock return than traditional tools (EPS,
DPS, and NOPAT) for the period of 1997-2002, for the main board
company listed in Bursa Malaysia.
Talebnia and Shoja (2011) investigated the relation between market
Value Added (MVA) to earnings ratio and economic value added
(EVA) To earnings ratio in companies listed on Tehran Stock
Exchange over the period 2003 to 2007. The findings exhibited that
there is a weak positive relationship between MVA to earnings ratio
and EVA to earnings ratio. Thus, EVA to earnings ratio as an internal
performance measure cannot predict the market value of firms.
Ramana (2005) used regression analysis to examine the correlation
between EVA and MVA in Indian companies, and compared it with
common measures of accounting (net operational earnings after tax,
earnings before interest and tax, etc.). The results of the study suggest
EVA does not outperform common accounting criteria. Likewise,
Ghanbari and More (2007) empirically tested the relationship between
EVA and MVA in Indian automobile industry over the period 2001-
2005. Their findings indicated that there are strong evidences to
support Stern-Stewart’s claim that EVA is greater to the traditional
performance appraising, and it is the best internal evolution of firm
success in adding value to shareholders’ investments.
Accordingly, Yahaya and Mahmood (2011) measured the property
firms’ performance under EVA criterion. Their sample involved 27
Malaysian property firms over the period of 1997-2006. Their results
revealed that most Malaysian property firms failed to generate enough
revenue for covering their capital cost. Therefore, these companies are
failure in creating company wealth. Pourali and Roze (2013) also
studied the relationship between EVA, REVA, and accounting criteria
with MVA in firms listed in TSE over the period 2006-2010. The
findings showed there is positive and significant relationship between

438 (IJMS) Vol. 9, No. 2, Spring 2016
MVA as dependent variable and all independent variables (EVA,
REVA, ROA, ROE, and EPS).
Additionally, Nakhaei et al. (2014) examined the relationship
between EVA, return on assets (ROA), return on equity (ROE), net
income (NI), and earning per share (EPS) with share market value
(MV). The sample involves 87 non-financial companies listed in
Tehran Stock Exchange (TSE) over the period 2004–2008. The results
indicated there are meaningful relationship between EVA, ROE, NI,
and EPS with MV, but there is not meaningful association between
ROA and MV.
Research hypotheses
Evaluation of companies is always a main concern participators in
capital markets, especially those interested in how the financial
performance related to stock returns (Huang & Wang, 2008). This
research was carried out to study the relative and incremental
information content between MVA and accounting performance
measures (NI, NOPAT and EPS) with stock return in Bursa Malaysia.
Creating highest capital wealth (owner and lenders) and increasing
the firm value is the important goal of financial management. The
question appears is, which criteria appraise value of companies
correctly. In response to this question, it can be supposed different
accounting measures such as EPS, NI, NOPAT and dividend per share
(DPS) have been applied to evaluate the company performance.
Likewise, proponents of the value based financial performance
measures demonstrate these criteria as a main development over the
accounting measures and statement high levels of association among
these criteria and stock returns. The numbers of studies including
inconsistent results have been printed. Based on these conflicting
results, it is not clear whether the value based financial performance
measures are able to outperform accounting performance measures in
explanation stock returns. Furthermore, it is not clear which measure
(or measures) has highest (or higher) relative information content with
stock return. For this reason, the main goal of this study is to
investigate the relative and incremental information content of MVA

Market value added and traditional accounting criteria: Which measure is … 439
with stock return compared to NI, NOPAT and EPS. Accordingly, the
related hypotheses are as follow:
H1: MVA has higher relative information content with stock return
compared to accounting measures.
H2: MVA has higher incremental information content with stock
return compared to accounting measures.
Research variables
Market value added (MVA), net income (NI), net operational profit
after tax (NOPAT), and earnings per share (EPS) are independent
variables and stock return (SR) is dependent variable.
This study deflates all numeric independent variables (MVA, NI
and NOPAT) by the market value of equity (MVEt-1) at the beginning
of the firm’s financial year For reducing the heteroscedasticity and
improving the data normality (Biddle et al., 1997; Chen & Dodd,
2001; Erasmus, 2008a; Jabbarzadeh-Kangarlouei et al., 2012; Nakhaei
et al., 2014; Parvaei & Farhadi, 2013). Furthermore, this study does
not deflate EPS and SR since they are already divided by the total
common stock and sale per share at the beginning of the firm’s
financial year (P0), respectively. By dividing the values of the
measures by the market value of the equity, the independent variables
are adjusted for the size of the firms.
Market value added (MVA)
MVA is difference between the company's market value and book
value of shares. According to Stern Stewart, if the total market value
of a company is more than the amount of capital invested in it, the
company has managed to create shareholder value. If the market value
is less than the capital invested, the company has destroyed
shareholder value (Khan et al., 2012).
MVA = MV - IC (1)
SMVA = MVA / MVEt-1 (2)
where MVA is market value added, MV is company’s total market
value, IC is invested capital, SMVA is standard market value added,

440 (IJMS) Vol. 9, No. 2, Spring 2016
and MVEt-1 is market value of equity (MVEt-1) at the beginning of the
firm’s financial year.
If MVA> 0 Wealth is created
If MVA< 0 Wealth is destroyed
MVA is a cumulative measure of the value created by management
in excess of the capital invested by shareholders. Although the
calculation of MVA uses the book value of capital, which is subject to
inflationary distortions, it provides an excellent measure of a
company’s ability to create wealth (Kramer & Peters 2001). Stern et
al. (1995) saying, “… there is one measure, Market Value Added
(MVA), that captures all the dynamics of corporate performance.”
Net income (NI) or Net profit (NP)
Net income (NI) is calculated by subtracting the total expenses of
company from total revenues. It shows what the firm has earned (or
lost) in a given period of time (usually one year). Furthermore, it is
called net profit (NP) or net income (NI). In other words, net income
represents the amount of money remaining after all operating
expenses, interest, taxes and preferred stock dividends (but not
common stock dividends) have been deducted from a company's total
revenue (Nakhaei et al., 2012).
SNI = NI / MVEt-1 (3)
where SNI is standard NI; MVEt-1is market value of equity at the
beginning of the period t.
Net operational profit after tax (NOPAT)
Brigham and Ehrhardt, (2005) stated net profit is definitely important,
but it does not reveal the true firm operating performance or the
operating managers effectiveness. A better criterion to evaluate
performance is NOPAT. It is the profit amount a firm would make if it
did not have debt and did not hold financial assets. Earnings before
interest and taxes (EBIT) or operating profit equals sales revenue
minus cost of goods sold and all expenses except for interest and
taxes. This is the surplus generated by operations. It is also known as
operating profit before interest and taxes (OPBIT) or simply profit

Market value added and traditional accounting criteria: Which measure is … 441
before interest and taxes (PBIT). NOPAT is after tax profit of
company for all investors, involving stockholders and creditors. It is
defined as follows (Brigham & Ehrhardt, 2005):
NOPAT = operating profit × (1 – tax rate) (4)
NOPAT = Net Profit after Tax + after tax Interest Expense
– after tax Interest Income
(5)
SNOPAT = NOPAT / MVEt-1 (6)
where SNOPAT is standard NOPAT; MVEt-1is market value of equity
at the beginning of the period t.
Earnings per share (EPS)
EPS is the portion of a company's profit allocated to each outstanding
share of common stock. It is usually considered to be the single most
significant variable in determining a stock’s price. Furthermore, it is a
main component used to calculate the price-earnings ratio (P/E ratio).
According to Irala (2005), measuring the performance of firm's per
share is EPS. It equal, the net profit divided by the number of
outstanding stocks. In compared to profit, EPS is a relative criterion
because it considers the capital size. It does not consider the capital
cost same profit (Irala, 2005). EPS can calculate by the following
equation:
EPS = (Net profit - Dividends on preferred stock) /
(Average outstanding shares)
(7)
Stock returns (SR)
In this study, stock return (SR) is a dependent variable. Stock return is
the total earning derived from investment in a given period divided by
investments made in the period (Nakhaei et al., 2013). According to
Davvani (2004), stock return is the change in the value of the shares in
the end of given period, compared to begging of the same period,
which this change in value is due to the changes in the price plus any
dividends paid. For calculating of stock return, we can use the
following equation:
(8)

442 (IJMS) Vol. 9, No. 2, Spring 2016
where,
Dt = dividend per share at the end of period t.
Pt = stock price at the end of period t.
Pt-1 = stock price at the beginning of the period t, (or initial share
price).
Relative and incremental information content
The information content test is managed in two types: incremental
information content (IIC) and relative information content (RIC).
Incremental information content comparisons assess whether one
accounting measure (or set of measures) provides information content
beyond that provided by another. On other words, Incremental
comparisons apply when one or more accounting measures are viewed
as given and an assessment is desired regarding the incremental
contribution of another, for examples IIC of cash flows beyond
earnings and IIC of supplemental financial disclosures. Furthermore,
Relative information content comparisons ask a subtly different
question, which is whether one measure provides greater information
content than another (Biddle et al., 1995).
Methodology
The sample data of this study was restricted to non-financial
companies listed in Bursa Malaysia with available annual trading data
over the period 2002-2011. The financial companies such as holdings
and investments are excluded from the sample data in order to have
consistent interpretation on certain company characteristics such as
earnings and size. Furthermore, this financial sector in Malaysia is
governed by specific rules and regulations known on the Banking and
Financial Institutions Act 1989 (BAFIA). The final sample size
became 3950 firm-year observations (involving 395 companies and 10
years period) after accounting for the missing data items and
calculating variables.
In this study, panel regression method is used for testing the
hypotheses by using E-Views 7 software. Baltagi (2008) claimed that
panel data has some benefits such as giving a richer source of

Market value added and traditional accounting criteria: Which measure is … 443
variation which allows for more efficient estimation of the parameters.
With additional informative data, one can get more reliable estimates
and test more sophisticated behavioral models with less restrictive
assumptions. In addition, another advantage is their ability to control
for individual heterogeneity, whereby, No controlling for these
unobserved individual specific effects leads to bias in the resulting
estimates. Panel data sets are also better able to identify and estimate
effects that are simply not detectable in pure cross-sections or pure
time-series data. In particular, panel data sets are better able to study
complex issues of dynamic behavior (Baltagi, 2008, p.305).
Furthermore, for choosing the best model (fixed effect or random
effect model), Hausman test is employed. According to the results,
fixed effect model is more appropriate for all regression models in this
study.
This study employed one variable regression for each measure to
determine which measure has greatest relative information content
(RIC). Then, the results are compared for R-square (R2). Whichever
that has greater R-Square (R2), has also greater relative information
content too. Many investigators applied this approach in their
research, e.g. (Asadi et al., 2013; Biddle et al., 1997; Darabi &
Esfandiyari, 2009; De Wet, 2012; Holiana & Reza, 2011; Ismail,
2011; Noravesh & Mashayekhi, 2004; Noravesh et al., 2004; Parvaei
& Farhadi, 2013).
For determining which measure or measures have the highest
incremental information content (IIC), this study compared two
multiple regression models together. Then, R-square of multiple
regression No.2 is deducted from R-square of multiple regression
No.1 (R2
2 – R2
1); whereby, the difference indicates the incremental
information content. Moreover, for comparing the two R-Squres the Z
Wong test is used. Asadi, et al. (2013), Worthington and West,
(2004), Parvaei and Farhadi, (2013), Noravesh and Mashayekhi
(2004), and Arabmazar-yazdi, (1995) applied this approach in their
researches.
444 (IJMS) Vol. 9, No. 2, Spring 2016
Empirical Findings
Descriptive statistics
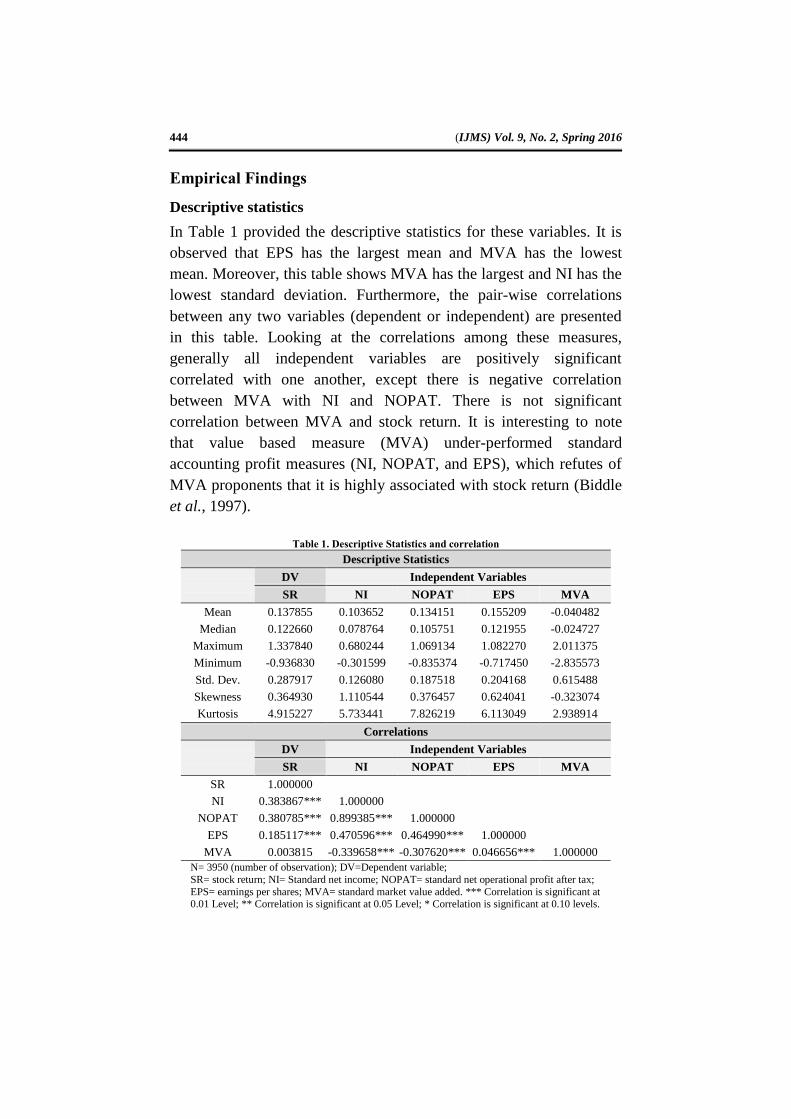
In Table 1 provided the descriptive statistics for these variables. It is
observed that EPS has the largest mean and MVA has the lowest
mean. Moreover, this table shows MVA has the largest and NI has the
lowest standard deviation. Furthermore, the pair-wise correlations
between any two variables (dependent or independent) are presented
in this table. Looking at the correlations among these measures,
generally all independent variables are positively significant
correlated with one another, except there is negative correlation
between MVA with NI and NOPAT. There is not significant
correlation between MVA and stock return. It is interesting to note
that value based measure (MVA) under-performed standard
accounting profit measures (NI, NOPAT, and EPS), which refutes of
MVA proponents that it is highly associated with stock return (Biddle
et al., 1997).
Table 1. Descriptive Statistics and correlation
Descriptive Statistics
DV Independent Variables
SR NI NOPAT EPS MVA
Mean 0.137855 0.103652 0.134151 0.155209 -0.040482
Median 0.122660 0.078764 0.105751 0.121955 -0.024727
Maximum 1.337840 0.680244 1.069134 1.082270 2.011375
Minimum -0.936830 -0.301599 -0.835374 -0.717450 -2.835573
Std. Dev. 0.287917 0.126080 0.187518 0.204168 0.615488
Skewness 0.364930 1.110544 0.376457 0.624041 -0.323074
Kurtosis 4.915227 5.733441 7.826219 6.113049 2.938914
Correlations
DV Independent Variables
SR NI NOPAT EPS MVA
SR 1.000000
NI 0.383867*** 1.000000
NOPAT 0.380785*** 0.899385*** 1.000000
EPS 0.185117*** 0.470596*** 0.464990*** 1.000000
MVA 0.003815 -0.339658*** -0.307620*** 0.046656*** 1.000000
N= 3950 (number of observation); DV=Dependent variable;
SR= stock return; NI= Standard net income; NOPAT= standard net operational profit after tax;
EPS= earnings per shares; MVA= standard market value added. *** Correlation is significant at 0.01 Level; ** Correlation is significant at 0.05 Level; * Correlation is significant at 0.10 levels.

Market value added and traditional accounting criteria: Which measure is … 445
Relative information content test
The results of Hausman test is indicated in Table 2. These findings
showed the fixed effect model is appropriate for all regression models,
except regression model No. 4, since the P-value of Chi-Sq. is less
than 5%. Considering, some researchers have used fixed effect model
for all regression models (Asadi et al., 2013; Ismail, 2011; Parvaei and
Farhadi, 2013). Based on Table 3 and Table 5, the value of Durbin-
Watson test for all regression models is between 1.5 and 2.5. This
result presented that there is no auto-correlation problems in these
single and multiple regression models (Narimani, 2011).
Table 2. Redundant and Hausman test
N Regression Model
Redundant
test;
Statistic and
(P-Value)
Hausman test;
Statistic and
(P-Value)
Suitable
Model
1 SRit = b0 + b1MVAit / MVEi,t-1 + εit 862.058841
(0.0000)***
206.000687
(0.0000)***
Fixed
effect
2 SRit = b0 + b1NIit / MVEi,t-1 + εit 428.826154
(0.0495)**
9.165270
0.0025***
Fixed
effect
3 SRit = b0 + b1NOPATit / MVEi,t-1
+ εit
509.968729
(0.0027)***
9.084344
(0.0088)***
Fixed
effect
4 SRit = b0 + b1EPSit + εit 615.943027
(0.0000)***
0.846671
(0.3575)
Random
effect
5 SRit = b0 + b1NIit / MVEi,t-1 +
b2NOPATit / MVEi,t-1 + b3EPSit +εit
423.229384
(0.1491)
13.332636
(0.0040)***
Fixed
effect
6
SRit = b0 + b1NIit / MVEi,t-1 +
b2NOPATit / MVEi,t-1 + b3EPSit +
b4MVAit / MVEi,t-1 + εit
574.708727
(0.0000)***
144.732463
(0.0000)***
Fixed
effect

446 (IJMS) Vol. 9, No. 2, Spring 2016
Table 3: Cross-section fixed effect panel single regression results on RIC of MVA and
accounting measures with SR (H1)
Variable Coefficient T statistic
(P-value)
R-square
(R2)
Adj.
R-square
F statistic
(P-value)
Durbin-Watson
(DW)
Model 1; SRit = b0 + b1MVAit / MVEt-1 + εit
C 0.146549 33.48997
(0.0000)*** 0.196081 0.106732
2.194546
(0.0000)*** 2.165616
MVA 0.214756 13.71107
(0.0000)***
Model 2; SRit = b0 + b1NIit / MVEt-1 + εit
C 0.034870 5.150231
(0.0000)*** 0.235072 0.150056
2.765038
(0.0000)*** 2.211698
NI 0.993566 19.46110
(0.0000)***
Model 3; SRit = b0 + b1NOPATit / MVEt-1 + εit
C 0.054724 8.905422
(0.0000)*** 0.229287 0.143629
2.676751
(0.0000)*** 2.215263
NOPAT 0.619680 18.68732
(0.0000)***
Model 4; SRit = b0 + b1EPSit + εit
C 0.093883 14.55964
(0.0000)*** 0.173706 0.081869
1.891470
(0.0000)*** 2.238063
EPS 0.283306 9.309200
(0.0000)***
Based on Table 3, the single panel regression with the common
coefficients analysis for the period of 2002 to 2011 (period of 10
years), shows that for all independent variables F-statistics (P-value)
are strongly significant at 1% level. The table also illustrated the T-
statistic (P-value) of NI, NOPAT, EPS and MVA, are 19.46110
(0.0000), 18.68732 (0.0000), 18.68732 (0.0000), 9.309200 (0.0000),
13.71107 (0.0000), respectively. These results showed that coefficient
of these independent variables are significant at the 1% level. It is also
noted that there are positive coefficients of MVA (0.2148), NI
(0.9936), NOPAT (0.6197), and EPS (0.2833) with stock return.
Therefore, it can be concluded that there is a high positive significant
relationship between MVA and accounting measures (NI, NOPAT,
and EPS) with stock return.
Furthermore, Table 3 exhibited that NI had a strongest relationship
with stock return and highest R2 of 23.51% when compared to
NOPAT, MVA, and EPS, R2 of 22.93%, 19.61%, and 17.37%,

Market value added and traditional accounting criteria: Which measure is … 447
respectively. The findings of single regression models exhibited NI
and NOPAT have higher RIC with SR compared to MVA.
Meanwhile, EPS has not higher RIC with SR compared to MVA. In
other words, the results do not support the MVA proponent’s idea that
MVA is superior to accounting measures. Consequently, the first
hypothesis is rejected.
Incremental information content test
Tables 4 shows, variance inflation factor (VIF) value is less than 10
and tolerance value is more than 0.10. Therefore, there is no evidence
of multi collinearity problem in these regression models. Furthermore,
based on Table 5, the value of Durbin-Watson is between 1.5 and 2.5
for both models. This result presented that there is no auto-correlation
problems in these multiple regression models.
Table 4. VIF and tolerance related to model 5 and 6
Variables Model 5 Model 6
Tolerance VIF Tolerance VIF
NI 0.188 5.330 0.181 5.527
NOPAT 0.189 5.295 0.189 5.301
EPS 0.769 1.300 0.721 1.387
MVA 0.829 1.206
Based on Table 5, the multiple panel regression with the common
coefficients analysis for the period of 2002 to 2011(period of 10
years), showed that for all independent variables jointly, F- statistics
(P-Value) is significant at 1% level. It exhibited that there are positive
significant relationship between all independent variables jointly
(MVA, NI, and NOPAT) with stock return except EPS that has
negative association with stock return. Moreover, this table indicates
there is a high significant relationship between all accounting
measures jointly (F= 2.824445, P-value <0.000) and all accounting
measures and MVA (F= 3.603297, P-value <0.000) with stock return.
Furthermore, Table 5 illustrates the R-square (R2) for accounting
measures jointly and all accounting and MVA jointly are 0.239938
and 0.287679, respectively. The R2
of 0.239938 and R2
of 0.287679;
indicates that the variables in the model 5 and in the model 6 explain
only 23.99% and 28.68% of the variation in SR, respectively.

448 (IJMS) Vol. 9, No. 2, Spring 2016
Additionally, it revealed after adding MVA in the model, the R-square
has increased 4.77%; (0.287679– 0.239938 = 0.047741).
Furthermore, the results of Z Wong test are shown in Table 6. It
revealed that in 95% confidence level, MVA has incremental
information content. In conclusion, MVA has incremental information
content with stock return compared to accounting measures jointly.
Therefore, it can reasonably be concluded that second hypothesis (H2)
is failed to reject.
Table 5. Cross-section fixed effect panel multiple regression results on IIC of MVA with SR
compared to accounting measures (H2)
Variable Coefficient T statistic
(P-value)
R-square
(R2)
Adj.
R-square
F statistic
(P-value)
Durbin-
Watson
(DW)
Model 5; SRit = b0 + b1NIit / MVEi,t-1 + b2NOPATit / MVEi,t-1 + b3EPSit +εit
C 0.036504 5.155137
(0.0000)***
0.239938 0.154988 2.824445
(0.0000)*** 2.207498
NI 0.658395 7.019832
(0.0000)***
NOPAT 0.283085 4.756144
(0.0000)***
EPS -0.031368 -0.915936
(0.3598)
Model 6; SRit = b0 + b1NIit / MVEi,t-1 + b2NOPATit / MVEi,t-1 + b3EPSit + b4MVAit /
MVEi,t-1 + εit
C 0.047379 6.874348
(0.0000)***
0.287679 0.207841
3.603297
(0.0000)***
2.135974
NI 0.700200 7.707153
(0.0000)***
NOPAT 0.309821 5.373769
(0.0000)***
EPS -0.092660 -2.774585
(0.0056)***
MVA 0.229292 15.42702
(0.0000)***
Table 6. Z wong test
Model R-Square (R2) Z Wong (P-Value)
5 0.2399 2.728
0.0146 6 0.2877
Conclusion
The study aimed to investigate the relative and incremental
information content of MVA with stock return compared to

Market value added and traditional accounting criteria: Which measure is … 449
accounting measures, namely NI, NOPAT, and EPS in non-financial
companies listed in the main market of Bursa Malaysia from 2002 to
2011. The RIC test showed that there is positive significant
association between MVA, NI, NOPAT and EPS with stock return.
Moreover, the findings revealed accounting measures have higher RIC
with stock return compared to MVA as proxy of value based
measures. Therefore, these results do not support the MVA
proponent’s idea that MVA is superior to accounting measures. The
results of IIC test illustrate that MVA has higher IIC with stock return
compared to accounting measures. Moreover, the findings acquired in
this study consistent with the findings of researchers such as Uyemura
et al. (1996), and Shahriari (2002), who conducted that MVA has
greater incremental information content with stock return compared to
accounting measures. In contrast, the results are inconsistent with the
findings of researchers such as Moeinadin et al. (2011), Hajiabbasi et
al. (2012), El Mir and Seboui (2008).
Additionally, the findings showed MVA as proxy of value based
measures can be an effective measure in describing the firm’s stock
return in Bursa Malaysia. Malaysian companies can use MVA with
traditional measures (NI, NOPAT, and EPS) in evaluating companies’
performance. This measure can help managers/ owners to consider all
the cost of capital (debt and equity) and capital returns for improving
the company’s performance and increasing the wealth of shareholders.
Therefore, it is recommended that management of Bursa Malaysia
requests and requires all listed companies to prepare the MVA along
with accounting measures in an attempt to provide investors or
potential investors with more accurate information on the firms’ stock
return.
Limitations of the Study
Similar to any research, researcher was faced with several limitations
in doing this research. first, in line with the study objectives, the
sample of this study belong to non-financial public companies listed in
main market of Bursa Malaysia, while financial institutions were not
included in the sampling frame of this study due to the differences in

450 (IJMS) Vol. 9, No. 2, Spring 2016
cash flow and accrual patterns (Edvinsson & Malone, 1997; Goh,
2005; Kamath, 2007).
Second, the lack of data on some variables identified in the
research, noted that it was prevented from entering these variables into
the model.
Third, this research has focused on the analysis of Malaysian
companies’ performance determinants and patterns, and has not
sought to explain comparative differences between this data and that
collected and analyses in different national and institutional contexts,
even though we know there are significant differences between
Malaysian and Western companies in their performance.
Recommendations for Future Research
Based on the results obtained in this study, the following
recommendations are offered for future research:
This study was undertaken in general and non-separation of
various industries. Therefore, it is recommended that future
research should be done to differentiate the industry and
different years.
In this study, among various value based measures, just MVA
measure has been used. Thus, it is recommended that in future
research should be used from other value based measures such
as; EVA, refined economic value added (REVA), cash value
added (CVA), Tobin’s Q, free cash flow (FCF), cash flow return
on investment (CFROI).
In this study was used from accrual accounting and value based
metrics. Since accrual accounting is the accounting basis of the
companies listed in Bursa Malaysia. So, it is recommended that
future research should use the accrual accounting and value
based metrics and cash accounting and value based metrics and
compare the results.
Market value added and traditional accounting criteria: Which measure is … 451
References
Al Mamun, A. & Abu Mansor, S. (2012). "EVA as Superior Performance
Measurement Tool". Modern Economy, 3(3), 310-318.
Arabmazar-yazdi, M. (1995). Incremental Information Content of Cash
flows and Accrual. Doctor Philosophy, Faculty of Management,
University of Tehran. (In Persian)
Asadi, A.R., Zendeh-del, A. & Kianinezhad, A. (2013). "Relation of
Information Content of Economic Value Added and Traditional
Measures with Market Value Added". Accounting and Auditing
Review, 20(2), 1-18. (In Persian)
Baltagi, B. H. (2008). Econometrics. (5th ed.): springer.
Baum, C.L., Saver, L. & Strickland, T. (2004). "EVA, MVA and
Compensation: Further Evidence". American Business Review, 22(2),
82-87.
Biddle, G.C., Seow, G.S. & Siegel, A.F. (1995). "Relative versus
Incremental Information Content". Contemporary Accounting
Research Journal, 12(1), 1-23.
Biddle, G.C., Bowen, R.M. & Wallace, J.S. (1997). "Does EVAt Beat
Earnings? Evidence on Associations with Stock Returns and Firm
values". Journal of Accounting and Economics, 24(3), 301-336.
Brigham, E.F. & Ehrhardt, M.C. (2005). Financial Management Theory and
Practice. South - Western, United States of America: Infotrac College
Edition.
Chen, S. & Dodd, J.L. (2001). "Operating Income, Residual Income And
EVA™: Which Metric Is More Value Relevant?". Journal of
Managerial Issues, 13(1), 65-86.
Darabi, R. & Esfandiyari, E. (2009). "The Relationship between REVA,
EBIT, and OCF with Stock Price in Tehran Stock Exchang". Journal
of Financial Accounting and Auditing, 1(1), 121- 144.
Davvani, G. (2004). Stock Exchange and Pricing of Stocks.Tehran, Iran:
Nashre Nekhostin. (In Persian)
De Wet, J. (2005). "EVA versus Traditional Accounting Measures of
Performance as Drivers of Shareholder Value – A Comparative
Analysis". Meditari Accountancy Research, 13(2), 1-16.
De Wet, J.H. (2012). "Executive Compensation and the EVA and MVA
Performance of South African Listed Companies". Southern African
Business Review 16(3), 57-80.
Edvinsson, L. & Malone, M.S. (1997). Intellectual Capital: Realizing Your
Company's True Value by Finding Its Hidden Brainpower. New York:

452 (IJMS) Vol. 9, No. 2, Spring 2016
Harper Business.
El Mir, A. & Seboui, S. (2008). "Corporate Governance and the Relationship
between EVA and Created Shareholder Value". Corporate
Governance, 8(1), 46-58.
Erasmus, P. (2008a). Evaluating Value Based Financial Performance
Measures. Doctor Philosophy (PhD.), Stellenbosch University.
Erasmus, P. (2008b). "Value Based Financial Performance Measures: An
Evaluation of Relative and Incremental Information Content".
Corporate Ownership & Control, 6(1), 66-77.
Ghanbari, A.M. & More, V. (2007). "The Relationship between Economic
Value Added and Market Value Added: An empirical analysis in
Indian Automobile Industry". The IUP Journal of Accounting
Research and Audit Practices, 6(3), 7-22.
Goh, P.C. (2005). "Intellectual Capital Performance of Commercial Banks in
Malaysia". Intellectual Capital, 6(3), 385-396.
Hajiabbasi, M., Kaviani, M., Samadi Largani, N., Samadi Largani, M. &
Montazeri, H. (2012). "Comparison of Information Content Value
Creation Measures (EVA, REVA, MVA, SVA, CSV and CVA) and
Accounting Measures (ROA, ROE, EPS, CFO) in Predicting the
Shareholder Return SR) Evidence from Iran Stock Exchange". ARPN
Journal of Science and Technology, 2(5), 517-521.
Holiana, J.M. & Reza, M.A. (2011). "Firm versus Industry Effects in
Accounting and Economic Profit Data". Applied Economics Letters,
18(3), 527-535.
Huang, J. & Wang, J. (2008). "Market Liquidity, Asset Prices, and Welfare".
NBER Working Paper serise (14058). from
http://ssrn.com/abstract=1009568.
Irala, L. R. (2005). "EVA: The Right Measure of Managerial Performance?".
Indian Journal of Accounting & Finance, 119(2), 1-10.
Ismail, I. (2006). Economic Value Added (EVA): Its Usefulness in
Predicting Company Performance in Malaysia. PhD Thesis, Faculty of
Business and Accounting, University of Malaya, Kuala Lumpur.
Ismail, I. (2011). "Company Performance in Malaysia after the 1997
Economic Crisis: Using Economic Value Added (EVA) as a
Predictor". African Journal of Business Management, 5(7), 3012-
3018.
Jabbarzadeh-Kangarlouei, S., Motavassel, M., azizi, A. & Sarbandi Farahani,
M. (2012). "The Investigation of the Impact of Ownership
Concentration on Financial Performance Measurment Criteria and
Market Value Added". International Journal of Economics and

Market value added and traditional accounting criteria: Which measure is … 453
Management Sciences, 1(9), 44-51.
Kamath, G. B. (2007). "The Intellectual Capital Performance of the Indian
Banking Sector". Journal of Intellectual Capital, 8(1), 96-123.
Karpik, P. & Belkaoui, A. (1990). "The Relative Relationship between
Syetematic Risk and Value Added". International Financial
Management and Accounting, 1(3), 256-276.
Khan, S., Chouhan, V., Chandra, B. & Wami, S. (2012). "Measurement of
Value Creation Vis-À-Vis EVA: Analysis of Select BSE Companies".
Pacific Business Review International, 5(3), 114-131.
Kramer , J.K. & Peters, J.R. (2001). "An Interindustry Analysis of Economic
Value Added as a Proxy for Market Value Added". Journal of Applied
Finance, 11(1), 41-49.
Moeinadin, M., Mansouri, E. & Zare Nikooparvar, M. (2011). "Investigating
the Power of Accounting and Economic Criteria at Stock Return
Determinant". International Review of Business Research Papers,
7(4), 84-93.
Nakhaei, H., Nik Intan, H. & Melati, A. (2013). "Analyzing the Relationship
Between Economic Value Added (EVA) and Accounting Variables
with Share Market Value in Tehran Stock Exchange (TSE)". Middle-
East Journal of Scientific Research, 16(11), 1589-1598.
Nakhaei, H., Nik Intan, H. & Melati, A. (2014). "Analyzing the Relationship
between Economic Value Added and Accounting Measures with
Share Market Value (MV) in Tehran Stock Exchange (TSE)".
International Research Journal of Finance and Economics, 1(118),
146-152.
Nakhaei, H., Nik Intan, H., Melati, A. & Nakhaei, K. (2012). "Performance
Evaluation Using Accounting Variables (Net Profit and Operational
Profit) and Economic Measures". International Journal of e-
Education, e-Business, e-Management and e-Learning, 2(5), 443-448.
Nakhaei, H., Nik Intan, H., Melati , A. & Nakhaei, K. (2013). "Evaluation
Of Company Performance with Accounting and Economic Criteria In
Bursa Malaysia". Journal of Global Business and Economics, 6(1),
49-63.
Narimani, A. (2011). Applied Econometrics. Tehran, Iran: Naghoos
Publication.
Noravesh, I. & Mashayekhi, B. (2004). "Incremental Information Content of
Economic Value Added (EVA) and Cash Value Added (CVA)
Beyond Accounting Profit (AP) and Oprerational Cash Flow (OCF)".
Financial Research, 6(17), 131-150. (In Persian)
Noravesh, I., Salehy, F. & Karami, G. (2004). "Investigating the relation

454 (IJMS) Vol. 9, No. 2, Spring 2016
between Operational Cash Flows, Operational Profit and Economic
Value Added with Created Shareholder Value". The Iranian
Accounting and Auditing Review, 11(37), 121-144. (In Persian)
Parvaei, A. & Farhadi, S. (2013). "The Ability of Explaining and Predicting
of Economic Value Added (EVA) versus Net Income (NI), Residual
Income (RI) and Free Cash Flow (FCF) in Tehran Stock Exchange
(TSE)". International Journal of Economics and Finance, 5(2), 67-77.
Peixoto, S. (2002). "Economic Value Added: Appplication to Portuguese
Public Companies". Journal of Accounting Portuguese, 3(6), 25-40.
Pourali, M.R. & Roze, Z. (2013). "The Relationship between Market Value
Added with Refined Economic Value Added and Performance
Accounting Criteria in the Firms listed in the Tehran Stock
Exchange". International Research Journal of Applied and Basic
Sciences, 4(6), 1636-1645.
Rahnamay-Roodposhti, F., Nikomaram, H. & Shahverdiani, S. (2006).
Strategic Financial Management. Tehran: Kasakavoosh.
Ramana, D.V. (2005). "Market Value Adaed and Economic Value Added:
Some Empirical Evidence". Working Paper, evailable ssrn website.
Shariari, A. (2002). Survey Information Content of Value Added Compairson
to Profit and Operational Cash Flow. Master of Art, Islamic Azad
University, Tehran branch, Tehran. (In Persian)
Sharma, A.K. & Kumar, S. (2010). "Economic Value Added (EVA)-
Literature Review and Relevant Issues". International Journal of
Economics and Finance, 2(2), 200-220.
Stern, J.M., Stewart, G.B. & Chew, J., D.H. (1995). "The EVA Financial
System". Journal of Applied Corporate Finance, 8(2), 32-46.
Talebnia, G. & Shojaa, E. (2011). "Investigating the Relation between
Market Value Added (MVA) To Earning Ratio with Economic Value
Added (EVA) To Earning Ratio (Tehran Stock Exchange)".
Management Accounting, 4(8), 47-60.
Wong, P.H. (2005). The Impact of Economic Value Added (EVA) and
Traditional Performance Based Measures on Stock Returns: Evidence
from Malaysia. PhD Thesis, Universiti Sain Malaysia (USM), Penang,
Malaysia.
Worthington, A.C. & West, T. (2004 ). "Australian Evidence Concerning the
Information Content of Economic Value-Added". Australian Journal
of Management, 29(2), 201-223.
Yaghoob-nejad, A. & Akaf, A. (2007). "The Relationship between
Evaluation Performance Measures (EVA, RI, ROS, ROI) and Market
Value Added (MVA) in Companies Accepted in Tehran Stock

Market value added and traditional accounting criteria: Which measure is … 455
Exchange (TSE)". Iranian Economic and Management Journal, 75,
77-89.
Yahaya, H.N. & Mahmood, W.M.W. (2011). "Creating Wealth for
Shareholders: Evaluating the Performance of the Malaysia Property
Companies". International Review of Business Research Papers, 7(2),
269-281.
Young, D. & O’Byrne, S.F. (2001). EVA and Value Based Management.
New York: Mc Grow - Hill.