march 2015 u.s. employment update and outlook
TRANSCRIPT

U.S. employment situation: September 2013
Release date: October 22, 2013
February registers 295,000 new jobs
as 2015’s solid start continues
U.S. employment situation: February 2015 March 6, 2015

February 2015 employment summary
• After a strong start in January, February saw 295,000 net new jobs added to the national economy, bringing the 2015 year-to-date total to
534,000.
- Unemployment declined by 20 basis points to 5.5 percent. A 10-basis-point decrease in labor force participation to 62.8 percent was a
contributor in falling unemployment, lowering the number of people looking for work.
- Total unemployment dropped even faster, down 30 basis points to 11.0 percent.
- Unemployment for college and high-school grads remains near cyclical lows (2.7 and 5.4 percent, respectively), but labor force
participation for both groups is at record lows with little sign of increase.
• Office-using industries contributed 68,000 jobs to February growth, similar to previous months but not on the same upward trajectory as
other high-growth sectors.
- Due to strong performance in education, health, leisure and construction, the office-using industries contributed only 23.1 percent of
December’s job creation.
• Consumer confidence dipped slightly to 96.4 points in February. However, as this is a measure of consumer sentiment, it is prone to
variation, while other fundamentals show that the trend is still on the up and growth in consumption expenditures shows further increases in
consumer demand.
• Texas, the Sunbelt and the West Coast continue to lead job growth: Dallas, Denver, Houston, Jacksonville, Orlando and Silicon Valley,
among other markets, all posted in excess of 3.0 percent year-on-year job creation.
• Improvements in the labor market have finally had a significant effect on the office sector. Over the course of 2014, occupancy growth has
surpassed 54.7 million square feet (highest in more than five years), pushing vacancy to 15.6 percent and placing upward pressure on
rents across markets.
Source: JLL Research, Bureau of Labor Statistics

February registered 295,000 new jobs, bringing the year-to-date
total to 534,000 already; January revised downward slightly36
0,00
0
226,
000
243,
000
96,0
00
110,
000
88,0
00 106,
000
122,
000
221,
000
183,
000
164,
000 19
6,00
0
360,
000
226,
000
243,
000
96,0
00
110,
000
88,0
00
160,
000
150,
000
161,
000
225,
000
203,
000
214,
000
197,
000
280,
000
141,
000
203,
000
199,
000
201,
000
149,
000
202,
000
164,
000
237,
000 27
4,00
0
84,0
00
166,
000
188,
000 22
5,00
0
330,
000
236,
000
286,
000
249,
000
213,
000 25
0,00
0
221,
000
423,
000
329,
000
239,
000
295,
000
0
50,000
100,000
150,000
200,000
250,000
300,000
350,000
400,000
450,000
Jan-
11
Mar
-11
May
-11
Jul-1
1
Sep
-11
Nov
-11
Jan-
12
Mar
-12
May
-12
Jul-1
2
Sep
-12
Nov
-12
Jan-
13
Mar
-13
May
-13
Jul-1
3
Sep
-13
Nov
-13
Jan-
14
Mar
-14
May
-14
Jul-1
4
Sep
-14
Nov
-14
Jan-
15
1-m
onth
net
cha
nge
Source: JLL Research, Bureau of Labor Statistics
3

Although more people are looking for work, strong growth
figures pushed unemployment down to 5.5 percent
0.0%
2.0%
4.0%
6.0%
8.0%
10.0%
12.0%
-1,000.0
-800.0
-600.0
-400.0
-200.0
0.0
200.0
400.0
600.0
Une
mpl
oym
ent r
ate
(%)
1-m
onth
net
cha
nge
(tho
usan
ds)
Monthly employment change Unemployment rate
Source: JLL Research, Bureau of Labor Statistics
4

Job openings broke 5.0 million for the first time during the
current cycle as expansionary labor market activity increases
Source: JLL Research, Bureau of Labor Statistics
5
0
1,000
2,000
3,000
4,000
5,000
6,000
Job
open
ings
(th
ousa
nds)

-8.0
-7.8
-3.0
0.4
0.8
7.0
7.0
8.0
9.0
10.0
11.0
11.7
18.5
29.0
32.0
32.8
51.0
54.0
66.0
-20 0 20 40 60 80
Mining and logging
Temporary help services
Nondurable goods
Utilities
Motor vehicles and parts
Government
Information
Manufacturing
Other services
Financial activities
Durable goods
Wholesale trade
Transportation and warehousing
Construction
Retail trade
Health care and social assistance
Professional and business services
Education and health services
Leisure and hospitality
1-month net change (thousands)
Leisure and hospitality, education and health and PBS post
consistent gains, while falling oil prices are hurting mining
Source: JLL Research, Bureau of Labor Statistics
6
Leisure and hospitality
Education and health
PBS
All other subsectors
Top three
subsectors
responsible for
58.0 percent of
monthly
growth.
9.7
13.0
22.0
48.3
59.0
87.0
89.0
113.4
141.1
150.0
192.2
195.0
208.0
318.9
321.0
473.7
527.0
539.0
660.0
0 100 200 300 400 500 600 700
Utilities
Nondurable goods
Mining and logging
Motor vehicles and parts
Information
Government
Other services
Wholesale trade
Temporary help services
Financial activities
Transportation and warehousing
Durable goods
Manufacturing
Retail trade
Construction
Health care and social assistance
Leisure and hospitality
Education and health services
Professional and business services
12-month net change (thousands)
PBS
Education and health
Leisure and hospitality
Retail trade
Manufacturing
Financial activities
All other jobs
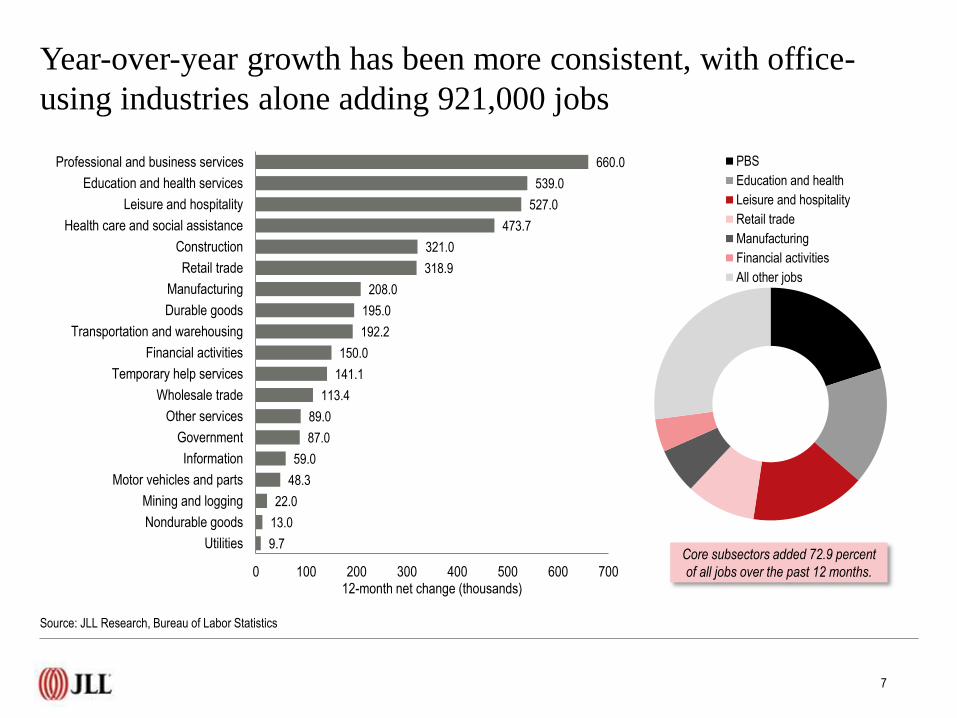
Year-over-year growth has been more consistent, with office-
using industries alone adding 921,000 jobs
Source: JLL Research, Bureau of Labor Statistics
7
Core subsectors added 72.9 percent
of all jobs over the past 12 months.

-1,000
-800
-600
-400
-200
0
200
400
2008 2009 2010 2011 2012 2013 2014 2015
Change in '000s jobs
The private sector continues to drive job growth, with more
than 5.5 million jobs created over the past two years
Private sector hiring up 5.5
million since February 2013
Public sector hiring up 17,000
workers since February 2013
Source: JLL Research, Bureau of Labor Statistics
8

0
2
4
6
8
10
12
Une
mpl
oym
ent (
%)
Bachelor's degree and higher High school graduates, no college
White-collar unemployment continues to fall, now at cyclical
low of 2.7 percent
2.7%
5.4%
Source: JLL Research, Bureau of Labor Statistics
9

Labor force participation in both segments has remained
largely flat and at record lows
Source: JLL Research, Bureau of Labor Statistics
10
54.0%
55.0%
56.0%
57.0%
58.0%
59.0%
60.0%
61.0%
62.0%
63.0%
64.0%
70.0%
71.0%
72.0%
73.0%
74.0%
75.0%
76.0%
77.0%
78.0%
79.0%
80.0%
2007 2008 2009 2010 2011 2012 2013 2014 2015
Hig
h sc
hool
gra
duat
e la
bor
forc
e pa
rtic
ipat
ion
rate
(%
)
Col
lege
gra
duat
e la
bor
forc
e pa
rtic
ipat
ion
rate
(%
)
Bachelor's degree High school, no college

Goods-producing industries post 14th consecutive month of
aggregate job growth in February
-1,000.0
-800.0
-600.0
-400.0
-200.0
0.0
200.0
400.0
600.0
2008 2009 2010 2011 2012 2013 2014 2015
1-m
onth
net
cha
nge
(tho
usan
ds)
Goods-producing Service-providing
Source: JLL Research, Bureau of Labor Statistics
11

Tech stays steady at 5.9 percent, while energy employment is
feeling the effects of falling oil prices
-11.0
-9.0
-7.0
-5.0
-3.0
-1.0
1.0
3.0
5.0
7.0
9.0
2008 2009 2010 2011 2012 2013 2014 2015
High-tech Energy, Mining, and Utilities Office-using industries Total non-farm
Source: JLL Research, Moody’s. Note: Due to data lags, high-tech employment only available through January 2015.
12
12-m
onth
% c
hang
e (jo
bs)

Tech still leading; energy demonstrating first signs of decline in
response to falling pricesYear-on-year percent employment growth
Source: JLL Research, Bureau of Labor Statistics
13

Throughout 2015 so far, initial unemployment claims have been
largely steady around 300,000
Source: JLL Research, U.S. Department of Labor
14
200,000
250,000
300,000
350,000
400,000
450,000
500,000
550,000
600,000
650,000
700,000
Cla
ims
Initial claims 4-week moving average

0%
2%
4%
6%
8%
10%
12%
0
20
40
60
80
100
120
2008 2009 2010 2011 2012 2013 2014 2015
Une
mpl
oym
ent r
ate
(%)
Con
sum
er c
onfid
ence
inde
x
Consumer confidence index
Unemployment rate
Although declining slightly in February, consumer confidence
remains at cyclical highs due to sustained economic momentum
Source: JLL Research, Conference Board, Bureau of Labor Statistics
15

0
1,000
2,000
3,000
4,000
5,000
6,000
2007 2008 2009 2010 2011 2012 2013 2014
Hire
s an
d qu
its (
thou
sand
s)
Hires Quits
Both hires and quits rose once again in February as companies
are now competing for talent
Source: JLL Research, Bureau of Labor Statistics

Texas, Florida and West Coast markets continue to post fastest
job growth, led by Dallas
Source: JLL Research, Bureau of Labor Statistics
17
Denver
3.3%
Silicon Valley
4.0%
Jacksonville
3.7%
Orlando
4.3%Houston
4.2%
Dallas
4.4%
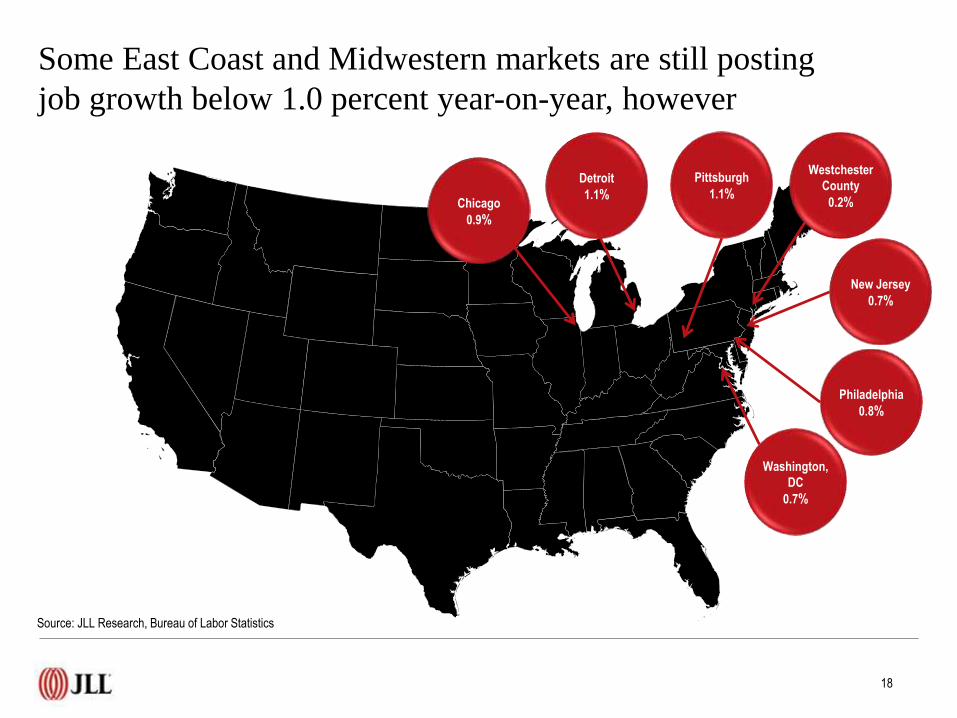
Some East Coast and Midwestern markets are still posting
job growth below 1.0 percent year-on-year, however
18
Source: JLL Research, Bureau of Labor Statistics
Washington,
DC
0.7%
Pittsburgh
1.1%
Westchester
County
0.2%
Philadelphia
0.8%
New Jersey
0.7%
Chicago
0.9%
Detroit
1.1%

Labor force participation is stuck at 62.8 percent, which is
helping to push unemployment down slowly
Source: JLL Research, Bureau of Labor Statistics
19
60.0%
61.0%
62.0%
63.0%
64.0%
65.0%
66.0%
67.0%
2008 2009 2010 2011 2012 2013 2014 2015
Labo
r fo
rce
part
icip
atio
n ra
te (
%)
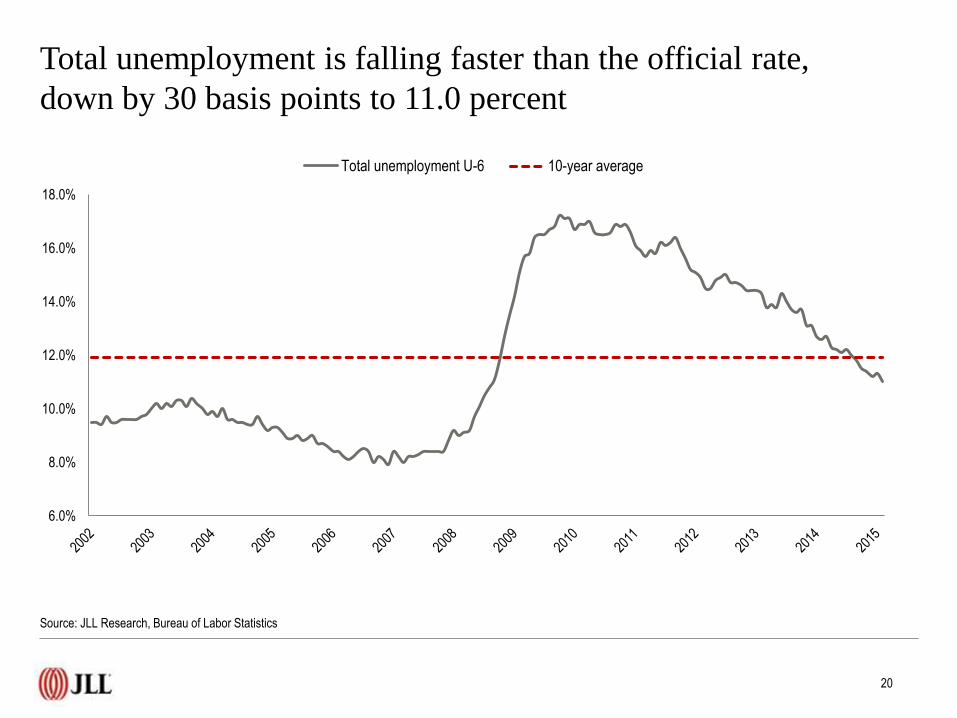
Total unemployment is falling faster than the official rate,
down by 30 basis points to 11.0 percent
6.0%
8.0%
10.0%
12.0%
14.0%
16.0%
18.0%
Total unemployment U-6 10-year average
Source: JLL Research, Bureau of Labor Statistics
20

Strong performance in construction, education, health and leisure
pushed down office-using industries’ share of monthly growth
Source: JLL Research, Bureau of Labor Statistics
21

Although financial activities and information are becoming more
stable, office-using growth is contributing less to overall gains
-300
-250
-200
-150
-100
-50
0
50
100
150
200
2009 2010 2011 2012 2013 2014 2015
Information Professional and business services Financial activities
PBS represented 78.2 percent of office jobs lost in February 2010.
In February 2015, it represented 75.0 percent of monthly growth.
Source: JLL Research, Bureau of Labor Statistics
22

Temporary help services contracted for the second month in a
row; 2015 losses total 21,600 jobs
1,000.0
1,200.0
1,400.0
1,600.0
1,800.0
2,000.0
2,200.0
2,400.0
2,600.0
2,800.0
3,000.0
-100.0
-80.0
-60.0
-40.0
-20.0
0.0
20.0
40.0
60.0
80.0
2009 2010 2011 2012 2013 2014 2015
Mon
thly
net
cha
nge
in jo
bs (
ths)
Temporary employment monthly net change Temporary employment
Temporary em
ployment (ths)
Source: JLL Research, Bureau of Labor Statistics
23

©2015 JLL Research IP, Inc. All rights reserved. All information contained herein is from sources deemed reliable; however, no representation or warranty is made to the accuracy thereof.
For more information, please contact:
Ben Breslau
Managing Director - Americas Research
John Sikaitis
Managing Director - Office and Local Markets Research
Phil Ryan
Research Analyst – Office and Economy Research
Or, find more employment, business and real estate
research at jll.com.
>>> Click here to check it out.