april 2017 u.s. employment update and outlook
TRANSCRIPT

National employment situation: March 2017
April 7, 2017

March 2017 U.S. labor market at a glance
2
+98,000(78 consecutive months
of growth)
1-month net change
+2,185,000(+1.5% y-o-y)
12-month change
+795,00010-year average annual growth
4.5%Unemployment rate
5,626,000(-1.5% y-o-y)
Job openings
-50bp12-month change in unemployment
63.0%Labor force participation rate
5,440,000(+6.3% y-o-y)
Hires
3,220,000(+11.3% y-o-y)
Quits
Source: JLL Research, Bureau of Labor Statistics

After two strong months, March disappointsJanuary and February both exceeded the 200,000-job threshold, while March fell well below expectations with only 98,000 net new jobs. A contraction in retail
trade and slowdowns in all major sectors with the exception of professional and business services (PBS) were the primary drivers of this, compounded by
volatility due to tightening and employment growth continuing to exceed the rate of labor-force expansion. Although March’s monthly growth did not meet consensus figures, the broader trend remains positive and future months will dictate whether this is an anomalous month or a broader shift in growth rates.
Unemployment drops, but slack is beginning to run outCounter to job growth, unemployment metrics improved once again, with the unemployment rate dropping by another 20 basis points to a cyclical low of 4.5
percent. Total unemployment fell below the 9.0-percent threshold for the first time since 2007 and now stands at 8.9 percent. With unemployment already low,
the slowing rate of labor-force expansion (0.5 percent annually compared to total non-farm job growth of 1.5 percent) will present a challenge for employers
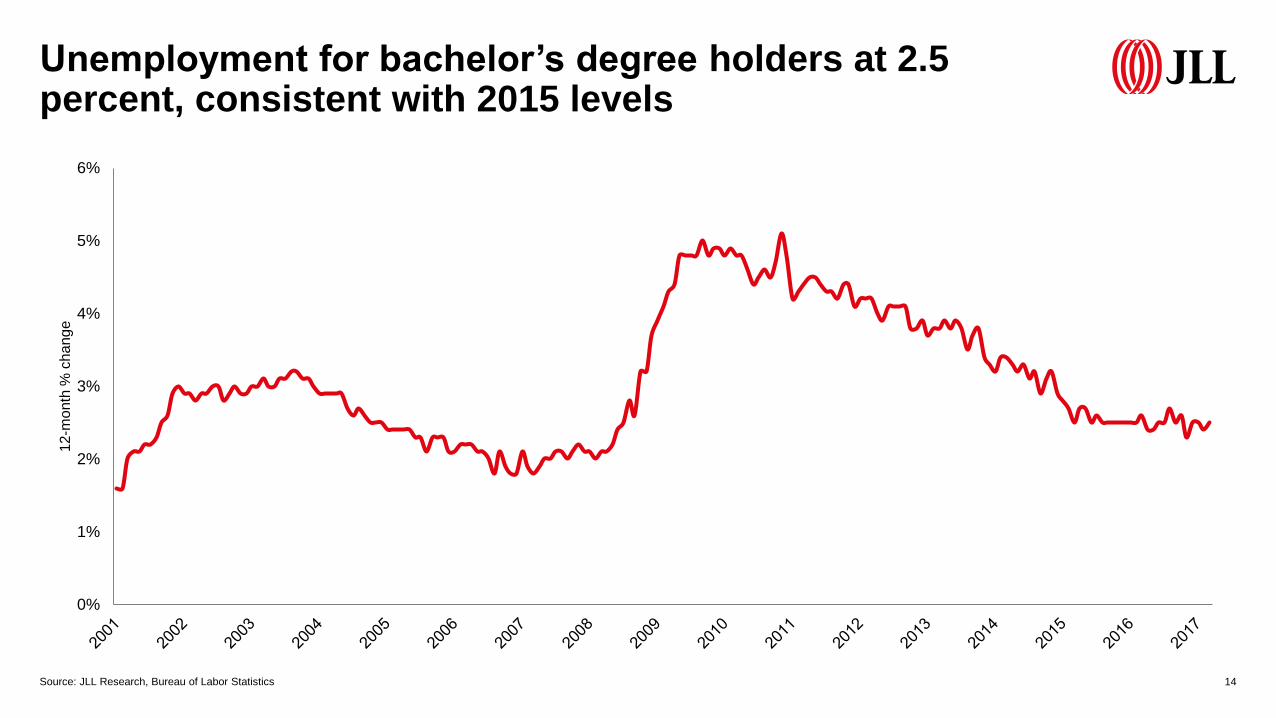
seeking to increase headcounts, particularly as unemployment for bachelor’s-degree holders remains steady at 2.5 percent.
Confidence is up even as inflation ramps upThe consumer confidence index spiked in March to 125.6 points, its highest figure since 2000. Business confidence metrics have also showed optimism,
indicating further economic growth ahead. The acceleration in inflation to 2.7 percent – now at the same rate as wage growth – may begin to affect consumer
spending, however, but tightening labor-market conditions will likely push wages up further.
March 2017 U.S. labor market highlights
3Source: JLL Research, Bureau of Labor Statistics

360,0
00
226,0
00
243,0
00
96,0
00
110,0
00
88,0
00
106,0
00
122,0
00
221,0
00
183,0
00
164,0
00 196,0
00
360,0
00
226,0
00
243,0
00
96,0
00
110,0
00
88,0
00
160,0
00
150,0
00
161,0
00
225,0
00
203,0
00
214,0
00
197,0
00
280,0
00
141,0
00
203,0
00
199,0
00
201,0
00
149,0
00
202,0
00
164,0
00
237,0
00 2
74,0
00
84,0
00
166,0
00
188,0
00 2
25,0
00
330,0
00
236,0
00
286,0
00
249,0
00
213,0
00 2
50,0
00
221,0
00
423,0
00
329,0
00
221,0
00
265,0
00
84,0
00
251,0
00
273,0
00
228,0
00
277,0
00
150,0
00
149,0
00
295,0
00
280,0
00
262,0
00
168,0
00
233,0
00
186,0
00
277,0
00
24,0
00
271,0
00
252,0
00
176,0
00 208,0
00
135,0
00 164,0
00
155,0
00
216,0
00
219,0
00
98,0
00
0
50,000
100,000
150,000
200,000
250,000
300,000
350,000
400,000
450,000
2011 2012 2013 2014 2015 2016 2017
1-m
onth
net ch
an
ge
After a strong start to 2017, March saw only 98,000 net new jobs, while downward revisions hit Jan. and Feb.
Source: JLL Research, Bureau of Labor Statistics 4

0%
2%
4%
6%
8%
10%
12%
-1,000
-800
-600
-400
-200
0
200
400
600
Un
em
plo
ym
ent ra
te (
%)
1-m
onth
net ch
an
ge
(th
ou
san
ds)
1-month net change Unemployment rate
Unemployment fell to its lowest rate this cycle (4.5 percent) on the back of further labor-market tightening
5Source: JLL Research, Bureau of Labor Statistics
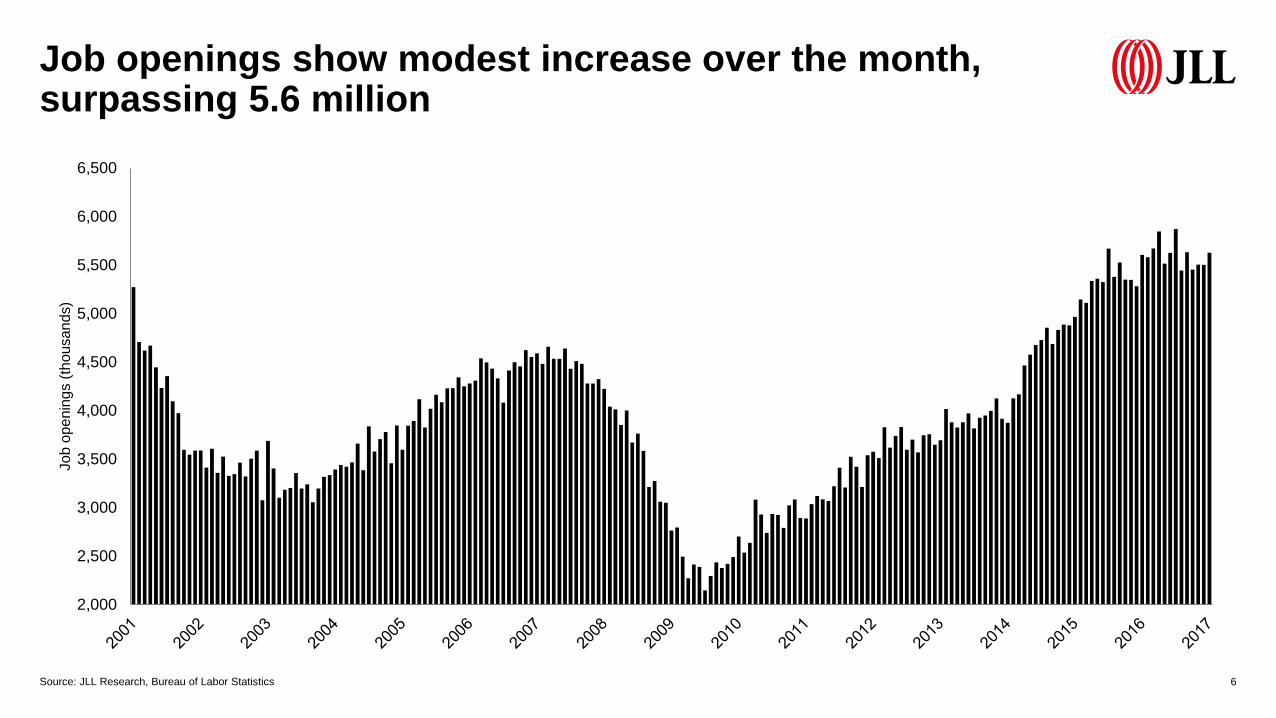
2,000
2,500
3,000
3,500
4,000
4,500
5,000
5,500
6,000
6,500
Jo
b o
pe
nin
gs (
thou
san
ds)
Job openings show modest increase over the month, surpassing 5.6 million
6Source: JLL Research, Bureau of Labor Statistics

2.1%
2.3%
2.9%
3.0%
3.4%
3.9%
4.3%
4.5%
4.7%
5.2%
0.0% 1.0% 2.0% 3.0% 4.0% 5.0% 6.0%
Construction
Mining and logging
Manufacturing
Information
Trade, transportation and utilities
Other services
Leisure and hospitality
Financial activities
Education and health
Professional and business services
Job openings rate (%)
The rate of job openings across sectors has remained largely stable, although financial activities has risen
7Source: JLL Research, Bureau of Labor Statistics

-3%
-2%
-1%
0%
1%
2%
3%
4%
5%
6%
2008 2009 2010 2011 2012 2013 2014 2015 2016 2017
12-m
onth
% c
han
ge
Wage growth Inflation
Inflation has now caught up with wage growth, which may begin to squeeze consumer spending
8Source: JLL Research, Bureau of Labor Statistics
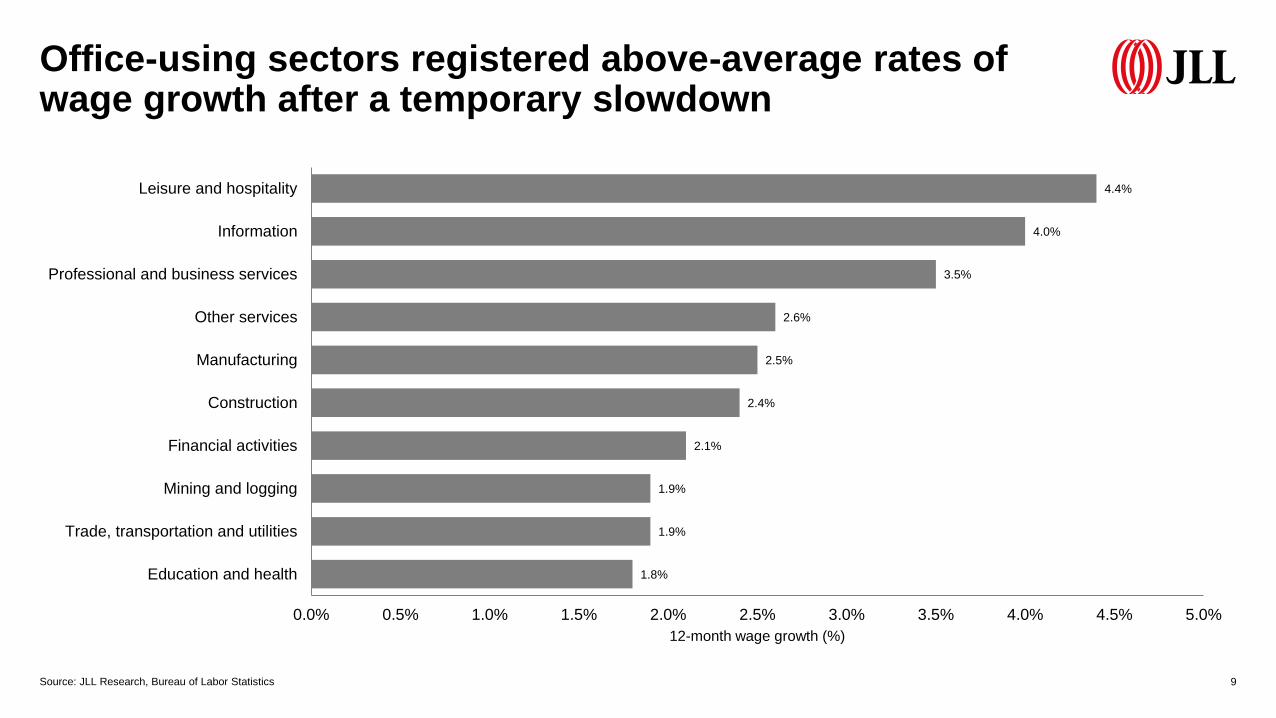
1.8%
1.9%
1.9%
2.1%
2.4%
2.5%
2.6%
3.5%
4.0%
4.4%
0.0% 0.5% 1.0% 1.5% 2.0% 2.5% 3.0% 3.5% 4.0% 4.5% 5.0%
Education and health
Trade, transportation and utilities
Mining and logging
Financial activities
Construction
Manufacturing
Other services
Professional and business services
Information
Leisure and hospitality
12-month wage growth (%)
Office-using sectors registered above-average rates of wage growth after a temporary slowdown
9Source: JLL Research, Bureau of Labor Statistics

62%
63%
63%
64%
64%
65%
65%
66%
66%
67%
2008 2009 2010 2011 2012 2013 2014 2015 2016 2017
12-m
onth
% c
han
ge
The labor force participation rate showed no sign of change in March at 63.0 percent
10Source: JLL Research, Bureau of Labor Statistics

-6%
-5%
-4%
-3%
-2%
-1%
0%
1%
2%
3%
2008 2009 2010 2011 2012 2013 2014 2015 2016 2017
12-m
onth
% c
han
ge
Civilian labor force Employment
The rate of labor force expansion continues to slow, posing further difficulty for employers
11Source: JLL Research, Bureau of Labor Statistics

-29.7
-3.0
-0.7
-0.4
0.0
1.0
3.0
3.5
6.0
9.0
9.0
9.0
10.5
11.0
11.0
11.0
16.0
16.7
56.0
-40 -30 -20 -10 0 10 20 30 40 50 60 70
Retail trade
Information
Utilities
Wholesale trade
Nondurable goods
Other services
Motor vehicles and parts
Transportation and warehousing
Construction
Financial activities
Government
Leisure and hospitality
Temporary help services
Mining and logging
Durable goods
Manufacturing
Education and health services
Health care and social assistance
Professional and business services
1-month net change (thousands)
Professional and business services was the only major sector that did not record a slowdown in March
12Source: JLL Research, Bureau of Labor Statistics

-32.0
-1.5
1.0
3.0
9.3
36.0
37.0
46.4
54.0
58.5
88.7
110.2
152.0
177.0
178.0
258.0
437.0
527.0
639.0
-100 0 100 200 300 400 500 600 700
Information
Utilities
Durable goods
Mining and logging
Motor vehicles and parts
Nondurable goods
Manufacturing
Wholesale trade
Other services
Retail trade
Transportation and warehousing
Temporary help services
Government
Construction
Financial activities
Leisure and hospitality
Health care and social assistance
Education and health services
Professional and business services
12-month net change (thousands)
Mining and logging has returned to growth on an annual basis after a sharp contraction
13Source: JLL Research, Bureau of Labor Statistics
639.0
527.0258.0
178.0
58.5
487.5
PBS Education and health
Leisure and hospitality Financial activities
Retail trade Manufacturing
All other jobs
Core subsectors added 77.7 percent of all
jobs over the past 12 months.
0%
1%
2%
3%
4%
5%
6%
12-m
onth
% c
han
ge
Unemployment for bachelor’s degree holders at 2.5 percent, consistent with 2015 levels
14Source: JLL Research, Bureau of Labor Statistics

-300
-250
-200
-150
-100
-50
0
50
100
150
200
2009 2010 2011 2012 2013 2014 2015 2016 2017
1-m
onth
net ch
an
ge
(th
ou
san
ds)
Professional and business services Financial activities Information
A third consecutive month of contraction in information is beginning to drag down office-using growth
15Source: JLL Research, Bureau of Labor Statistics

-10%
-8%
-6%
-4%
-2%
0%
2%
4%
6%
8%
10%
2008 2009 2010 2011 2012 2013 2014 2015 2016 2017
12-m
onth
% c
han
ge
Tech Energy, mining and utilities Office-using Total non-farm
Tech’s slight bump to 4.9-percent growth held up, but remains below 2015 highs
16Source: JLL Research, Bureau of Labor Statistics

200,000
250,000
300,000
350,000
400,000
450,000
500,000
550,000
600,000
650,000
700,000
Initia
l u
ne
mp
loym
ent cla
ims p
er
we
ek
Intial weekly claims 4-week moving average
Initial unemployment claims remain on a downward trend despite already being at cyclical lows
17Source: JLL Research, U.S. Department of Labor

0
20
40
60
80
100
120
140
Co
nsu
me
r co
nfid
en
ce in
de
xConsumer confidence is soaring even as inflation rises and now strongly exceed their previous peak
18Source: JLL Research, Conference Board

All metro areas exceeding 3.0-percent job growth except for Salt Lake City are in the Sun Belt
19
3.1%
3.2%
3.6%
3.7%
3.9%
3.9%
4.3%
2.5% 3.0% 3.5% 4.0% 4.5%
Salt Lake City
Charlotte
Atlanta
Dallas
Jacksonville
Nashville
Orlando
12-month % change
Source: JLL Research, Bureau of Labor Statistics

0%
2%
4%
6%
8%
10%
12%
14%
16%
18%
20%
12-m
onth
% c
han
ge
Total unemployment 10-year average
Total unemployment dropped to 8.9 percent, the first time below 9.0 percent since 2007
20Source: JLL Research, Bureau of Labor Statistics
