may 2016 u.s. employment update and outlook
TRANSCRIPT
U.S. employment situation: September 2013
Release date: October 22, 2013
After a bounce-back, April’s slow
growth may mark a turning point
U.S. employment situation: April 2016 May 6, 2016

March 2016 employment summary
• Job creation sees marked slowdown, in line with a pause in GDP growth
- After some earlier rebounds, employment growth slowed sharply in April to 160,000 net new jobs, the lowest figure since early 2015. Slow
job growth mirrored underwhelming GDP growth of 0.5 percent in Q1 2016.
- A slight drop in the labor force participation rate as well as slower job creation kept unemployment at 5.0 percent. Similarly, total
unemployment is stable at 9.7 percent.
- Most subsectors saw below-average monthly gains in April, although the office-using sectors countered this trend with 85,000 new jobs.
• Employee turnover and confidence increasing as hires and quits spike
- Although labor-market performance was disappointing in April, employee confidence in particular showed a very different story. A record
5.4 million job openings were recorded (+6.1 percent year-over-year) as companies seek to expand their headcounts to handle new
demand for goods and services.
- Similarly, hires and quits are rising and growing at annual rates far exceeding total non-farm job growth. The level of quits demonstrates
employees’ confidence in the labor market as job openings and hiring activity rise at a steady clip.
• Numerous indicators show signs of faltering
- A number of indicators seem to have plateaued, either at their cyclical highs or lows. Consumer confidence is hovering around the 95-point
mark, while monthly increases and decreases are shrinking.
- Initial unemployment claims are declining, but the rate of decrease is flattening to around 255,000-260,000. In addition, wage growth has
yet to surpass the 2.5-percent mark, although continued low inflation has helped workers in real terms.
Source: JLL Research, Bureau of Labor Statistics
2
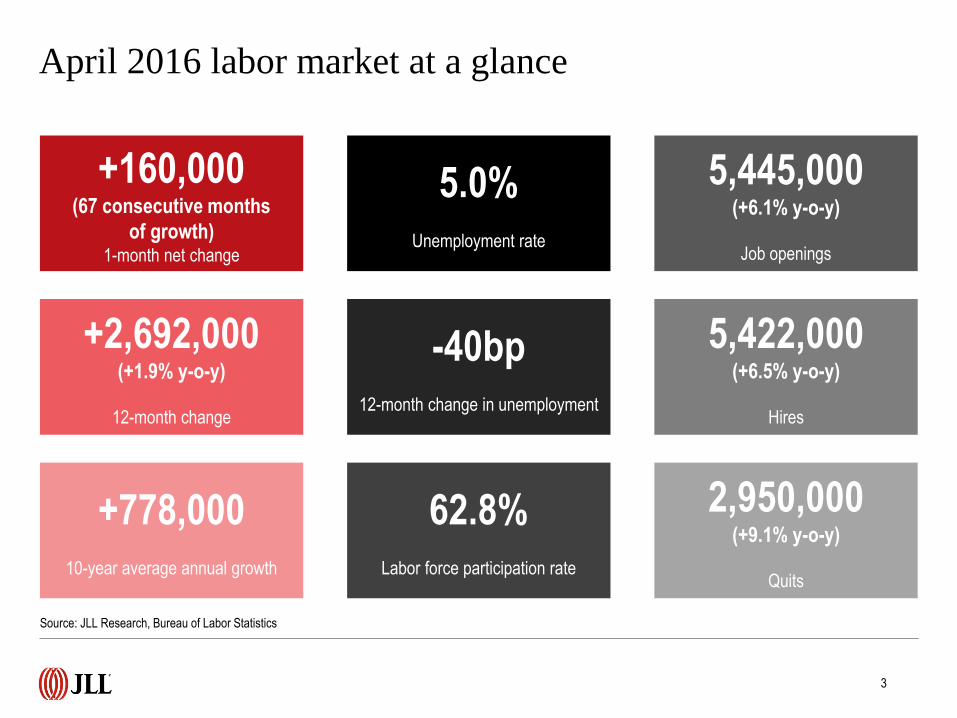
April 2016 labor market at a glance
+160,000(67 consecutive months
of growth)1-month net change
+2,692,000(+1.9% y-o-y)
12-month change
+778,00010-year average annual growth
Source: JLL Research, Bureau of Labor Statistics
5.0%Unemployment rate
-40bp12-month change in unemployment
62.8%Labor force participation rate
5,445,000(+6.1% y-o-y)
Job openings
5,422,000(+6.5% y-o-y)
Hires
2,950,000(+9.1% y-o-y)
Quits
3

In line with Q1 2016 GDP slowdown, the labor marked added
just 160,000 jobs in April
360,
000
226,
000
243,
000
96,0
0011
0,00
088
,000 10
6,00
012
2,00
022
1,00
018
3,00
016
4,00
0 196,
000
360,
000
226,
000
243,
000
96,0
0011
0,00
088
,000
160,
000
150,
000
161,
000
225,
000
203,
000
214,
000
197,
000
280,
000
141,
000
203,
000
199,
000
201,
000
149,
000
202,
000
164,
000
237,
000 27
4,00
084
,000
166,
000
188,
000 22
5,00
033
0,00
023
6,00
028
6,00
024
9,00
021
3,00
0 250,
000
221,
000
423,
000
329,
000
221,
000 26
5,00
084
,000
251,
000
273,
000
228,
000
277,
000
150,
000
149,
000
295,
000
280,
000
262,
000
168,
000
233,
000
208,
000
160,
000
0
50,000
100,000
150,000
200,000
250,000
300,000
350,000
400,000
450,000
2011
2012
2013
2014
2015
2016
1-m
onth
net
cha
nge
4
Source: JLL Research, Bureau of Labor Statistics

Slow job growth and downward revisions kept unemployment
steady at 5.0 percent
0.0%
2.0%
4.0%
6.0%
8.0%
10.0%
12.0%
-1,000.0
-800.0
-600.0
-400.0
-200.0
0.0
200.0
400.0
600.0
Une
mpl
oym
ent r
ate
(%)
1-m
onth
net
cha
nge
(tho
usan
ds)
Monthly employment change Unemployment rate
Source: JLL Research, Bureau of Labor Statistics
5

Job openings continue to hover around the 5.5-million mark,
indicating a potential plateau
Source: JLL Research, Bureau of Labor Statistics
6
0
1,000
2,000
3,000
4,000
5,000
6,000
Job
open
ings
(th
ousa
nds)

0.0
20.0
40.0
60.0
80.0
100.0
120.0
140.0
Con
sum
er c
onfid
ence
inde
xAs with over indicators, consumer confidence shows little sign
of movement, falling slightly to 94.2 points
Source: JLL Research, Bureau of Labor Statistics
7
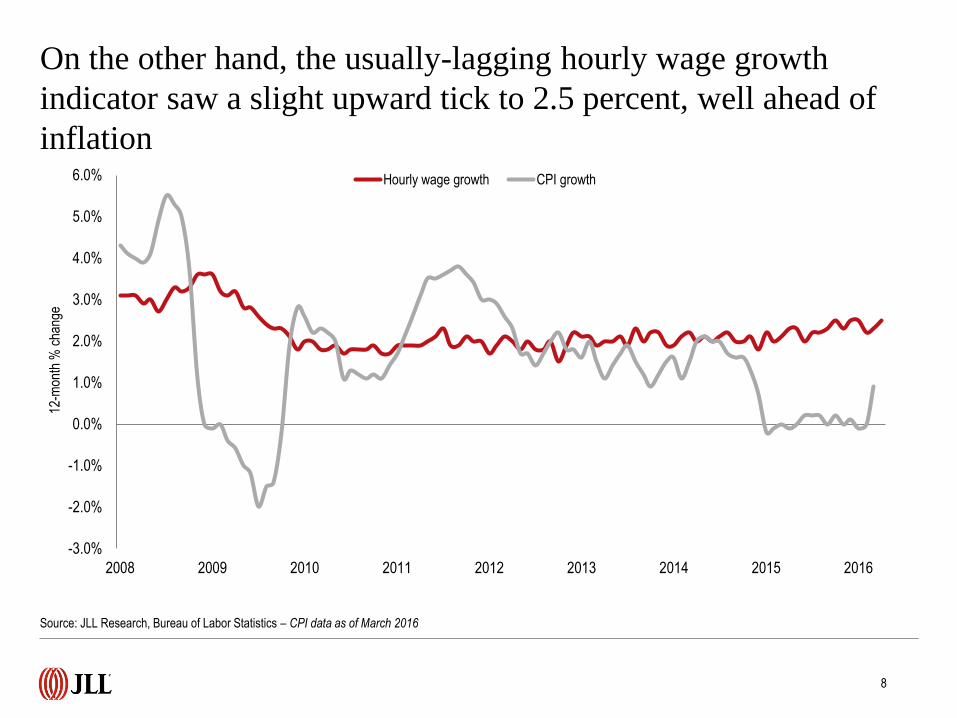
On the other hand, the usually-lagging hourly wage growth
indicator saw a slight upward tick to 2.5 percent, well ahead of
inflation
Source: JLL Research, Bureau of Labor Statistics – CPI data as of March 2016
8
-3.0%
-2.0%
-1.0%
0.0%
1.0%
2.0%
3.0%
4.0%
5.0%
6.0%
2008 2009 2010 2011 2012 2013 2014 2015 2016
12-m
onth
% c
hang
e
Hourly wage growth CPI growth

1.5%
2.0%
2.0%
2.3%
2.4%
3.0%
3.0%
3.3%
3.3%
4.1%
0.0% 0.5% 1.0% 1.5% 2.0% 2.5% 3.0% 3.5% 4.0% 4.5%
Other services
Construction
Education and health
Wholesale trade
Professional and business services
Mining and logging
Manufacturing
Information
Leisure and hospitality
Financial activities
12-month % change
With the exception of financial activities, the variance in wage
growth across industries is small
Source: JLL Research, Bureau of Labor Statistics
9

-11.0
-8.0
-3.1
-2.0
0.0
0.1
1.0
2.7
4.0
5.0
6.0
6.1
8.6
9.3
20.0
22.0
38.2
54.0
65.0
-20 0 20 40 60 80
Government
Mining and logging
Retail trade
Nondurable goods
Information
Utilities
Construction
Wholesale trade
Manufacturing
Other services
Durable goods
Motor vehicles and parts
Transportation and warehousing
Temporary help services
Financial activities
Leisure and hospitality
Health care and social assistance
Education and health services
Professional and business services
1-month net change (thousands)
PBS countered below-average gains elsewhere with a strong
65,000 net new jobs added in April
10
PBS
Education and health
Leisure and hospitality
All other subsectors
Top three
subsectors
responsible for
88.1 percent of
monthly
growth.
Source: JLL Research, Bureau of Labor Statistics

-132.0
-55.0
-19.0
8.8
24.9
35.0
38.0
61.9
65.2
67.3
73.0
106.0
160.0
260.0
337.4
449.0
597.8
611.0
673.0
-200 0 200 400 600 800
Mining and logging
Durable goods
Manufacturing
Utilities
Motor vehicles and parts
Information
Nondurable goods
Transportation and warehousing
Temporary help services
Wholesale trade
Other services
Government
Financial activities
Construction
Retail trade
Leisure and hospitality
Health care and social assistance
Professional and business services
Education and health services
12-month net change (thousands)
Education and health PBS
Leisure and hospitality Retail trade
Financial activities Manufacturing
All other jobs
Contractions in durable goods employment have pulled
manufacturing into red over the past 12 months
Source: JLL Research, Bureau of Labor Statistics
11
Core subsectors added 82.5 percent
of all jobs over the past 12 months.

0.0%
1.0%
2.0%
3.0%
4.0%
5.0%
6.0%
Une
mpl
oym
ent r
ate
(%)
Unemployment for bachelor’s degree holders fell to just 2.3
percent, exacerbating existing talent shortage in metro areas
Source: JLL Research, Bureau of Labor Statistics
12

The office-using sectors bucked the trend of slow growth with
the best performance in six months: up 85,000 jobs
-300
-250
-200
-150
-100
-50
0
50
100
150
200
2009 2010 2011 2012 2013 2014 2015 2016
Information Professional and business services Financial activities
Source: JLL Research, Bureau of Labor Statistics
13

Energy appears to have reached its cyclical low, while tech
continues slowing to 5.2 percent
-11.0
-9.0
-7.0
-5.0
-3.0
-1.0
1.0
3.0
5.0
7.0
9.0
2008 2009 2010 2011 2012 2013 2014 2015 2016
High-tech Energy, Mining, and Utilities Office-using industries Total non-farm
Source: JLL Research, Moody’s. Note: Due to data lags, high-tech employment only available through January 2015.
14
12-m
onth
% c
hang
e (jo
bs)
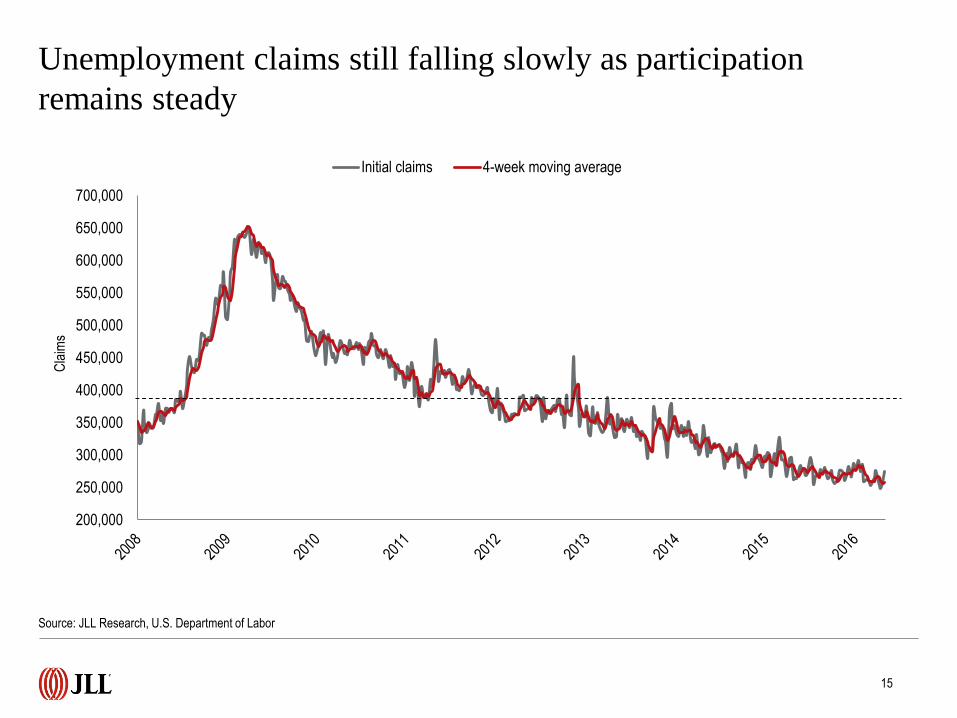
Unemployment claims still falling slowly as participation
remains steady
Source: JLL Research, U.S. Department of Labor
15
200,000
250,000
300,000
350,000
400,000
450,000
500,000
550,000
600,000
650,000
700,000
Cla
ims
Initial claims 4-week moving average

0
1,000
2,000
3,000
4,000
5,000
6,000
2007 2008 2009 2010 2011 2012 2013 2014 2015 2016
Hire
s an
d qu
its (
thou
sand
s)
Hires Quits
Employee confidence in the labor market is strengthening, with
quits approaching late 2015 peak
Source: JLL Research, Bureau of Labor Statistics

Month after month, tech and Sun Belt markets continue to
surpass the national rate of job growth by more than 100bp
Source: JLL Research, Bureau of Labor Statistics
17
Austin
4.1%
Dallas
3.9%
San
Francisco
4.0%
Nashville
3.7%
Tampa
3.4%
Orlando
4.3%
Fort
Lauderdale
3.4%
Silicon
Valley
3.8%
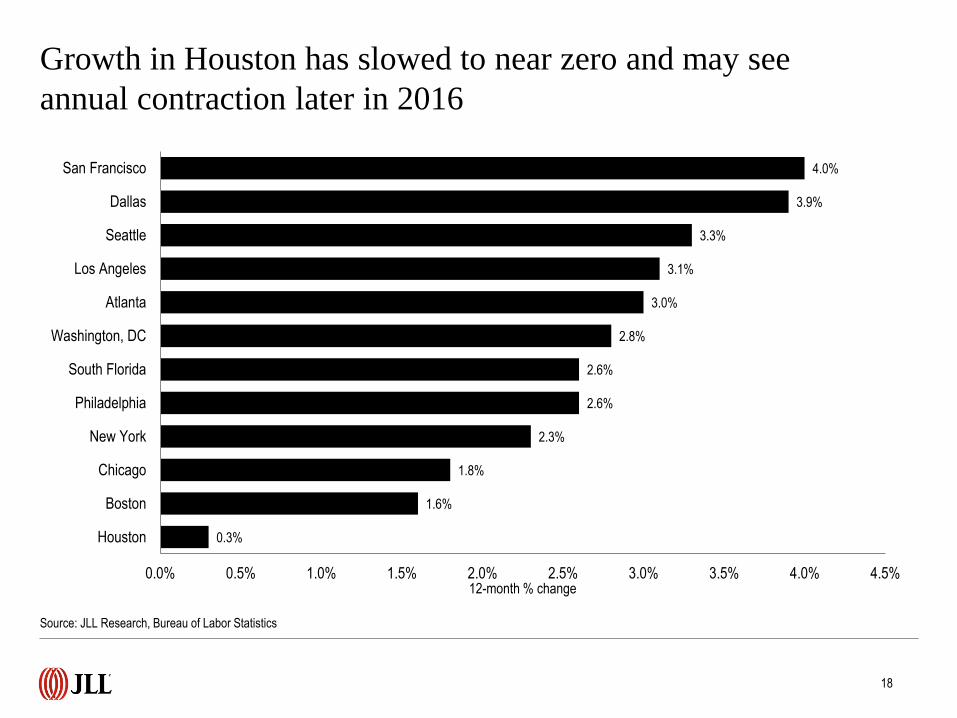
0.3%
1.6%
1.8%
2.3%
2.6%
2.6%
2.8%
3.0%
3.1%
3.3%
3.9%
4.0%
0.0% 0.5% 1.0% 1.5% 2.0% 2.5% 3.0% 3.5% 4.0% 4.5%
Houston
Boston
Chicago
New York
Philadelphia
South Florida
Washington, DC
Atlanta
Los Angeles
Seattle
Dallas
San Francisco
12-month % change
Growth in Houston has slowed to near zero and may see
annual contraction later in 2016
Source: JLL Research, Bureau of Labor Statistics
18
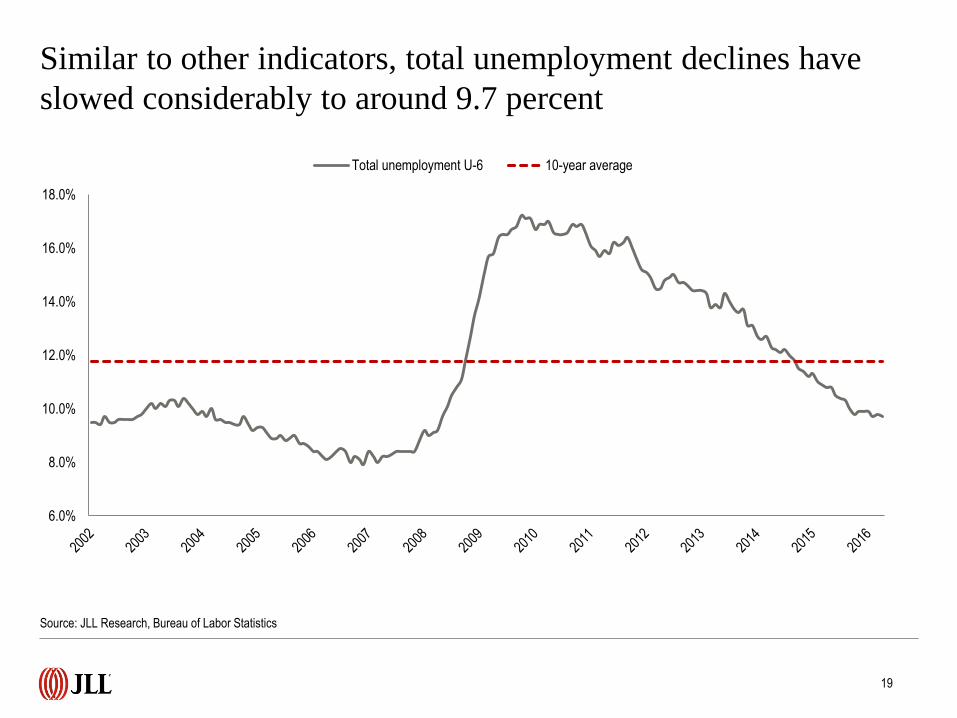
Similar to other indicators, total unemployment declines have
slowed considerably to around 9.7 percent
6.0%
8.0%
10.0%
12.0%
14.0%
16.0%
18.0%
Total unemployment U-6 10-year average
Source: JLL Research, Bureau of Labor Statistics
19

Labor force participation dropped back to 62.8 percent after a
hopeful uptick earlier in the year
Source: JLL Research, Bureau of Labor Statistics
20
60.0%
61.0%
62.0%
63.0%
64.0%
65.0%
66.0%
67.0%
2008 2009 2010 2011 2012 2013 2014 2015 2016
Labo
r fo
rce
part
icip
atio
n ra
te (
%)
©2016 Jones Lang LaSalle Research IP, Inc. All rights reserved. All information contained herein is from sources deemed reliable; however, no representation or warranty is made to the accuracy thereof.
For more information, please contact:
Ben Breslau
Managing Director - Americas Research
Phil Ryan
Senior Research Analyst – Office and Economy Research
Or, find more employment, business and real estate research at jll.com.
>>> Click here to check it out.