october 2015 u.s. employment update and outlook
TRANSCRIPT

U.S. employment situation: September 2013
Release date: October 22, 2013
September’s monthly growth was below
average, but is only one part of the picture
U.S. employment situation: September 2015 October 2, 2015
September 2015 employment summary
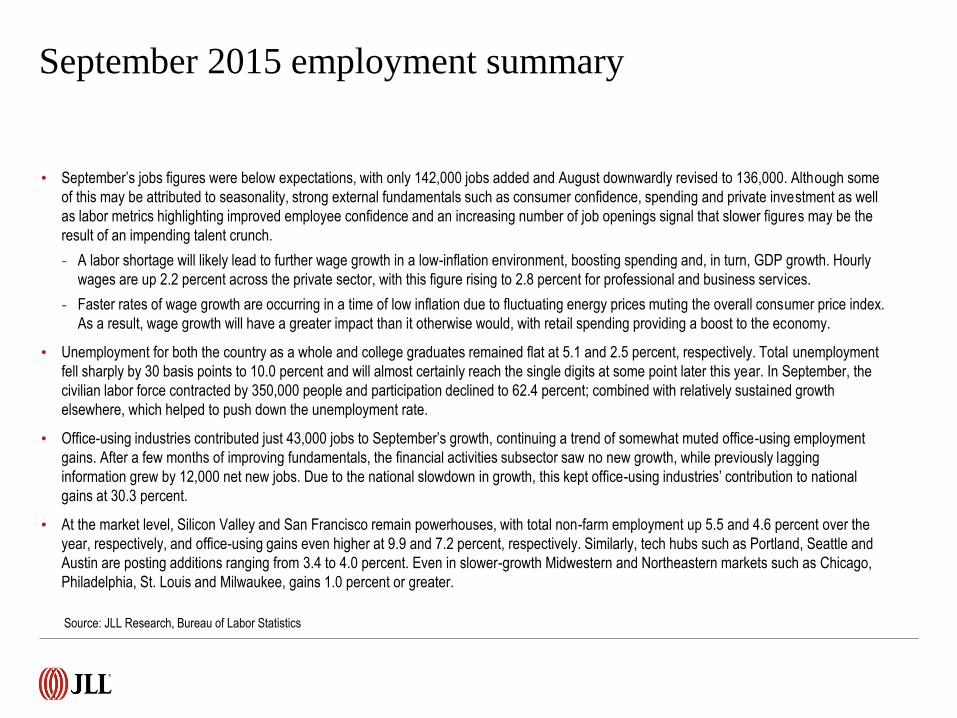
• September’s jobs figures were below expectations, with only 142,000 jobs added and August downwardly revised to 136,000. Although some
of this may be attributed to seasonality, strong external fundamentals such as consumer confidence, spending and private investment as well
as labor metrics highlighting improved employee confidence and an increasing number of job openings signal that slower figures may be the
result of an impending talent crunch.
- A labor shortage will likely lead to further wage growth in a low-inflation environment, boosting spending and, in turn, GDP growth. Hourly
wages are up 2.2 percent across the private sector, with this figure rising to 2.8 percent for professional and business services.
- Faster rates of wage growth are occurring in a time of low inflation due to fluctuating energy prices muting the overall consumer price index.
As a result, wage growth will have a greater impact than it otherwise would, with retail spending providing a boost to the economy.
• Unemployment for both the country as a whole and college graduates remained flat at 5.1 and 2.5 percent, respectively. Total unemployment
fell sharply by 30 basis points to 10.0 percent and will almost certainly reach the single digits at some point later this year. In September, the
civilian labor force contracted by 350,000 people and participation declined to 62.4 percent; combined with relatively sustained growth
elsewhere, which helped to push down the unemployment rate.
• Office-using industries contributed just 43,000 jobs to September’s growth, continuing a trend of somewhat muted office-using employment
gains. After a few months of improving fundamentals, the financial activities subsector saw no new growth, while previously lagging
information grew by 12,000 net new jobs. Due to the national slowdown in growth, this kept office-using industries’ contribution to national
gains at 30.3 percent.
• At the market level, Silicon Valley and San Francisco remain powerhouses, with total non-farm employment up 5.5 and 4.6 percent over the
year, respectively, and office-using gains even higher at 9.9 and 7.2 percent, respectively. Similarly, tech hubs such as Portland, Seattle and
Austin are posting additions ranging from 3.4 to 4.0 percent. Even in slower-growth Midwestern and Northeastern markets such as Chicago,
Philadelphia, St. Louis and Milwaukee, gains 1.0 percent or greater.
Source: JLL Research, Bureau of Labor Statistics
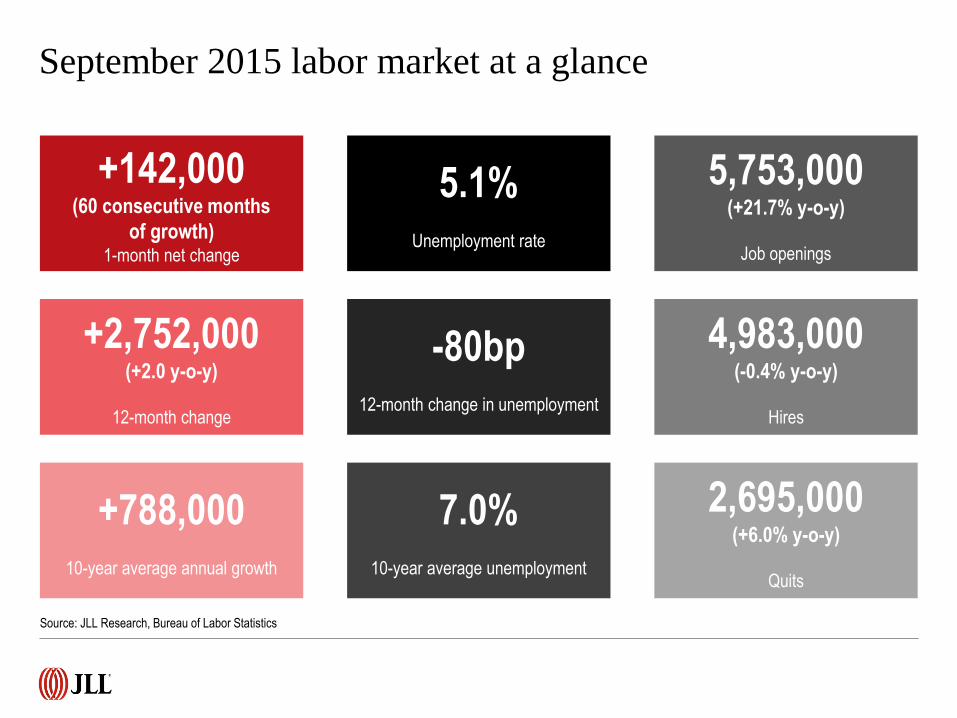
September 2015 labor market at a glance
+142,000 (60 consecutive months
of growth) 1-month net change
+2,752,000 (+2.0 y-o-y)
12-month change
+788,000
10-year average annual growth
Source: JLL Research, Bureau of Labor Statistics
5.1%
Unemployment rate
-80bp
12-month change in unemployment
7.0%
10-year average unemployment
5,753,000 (+21.7% y-o-y)
Job openings
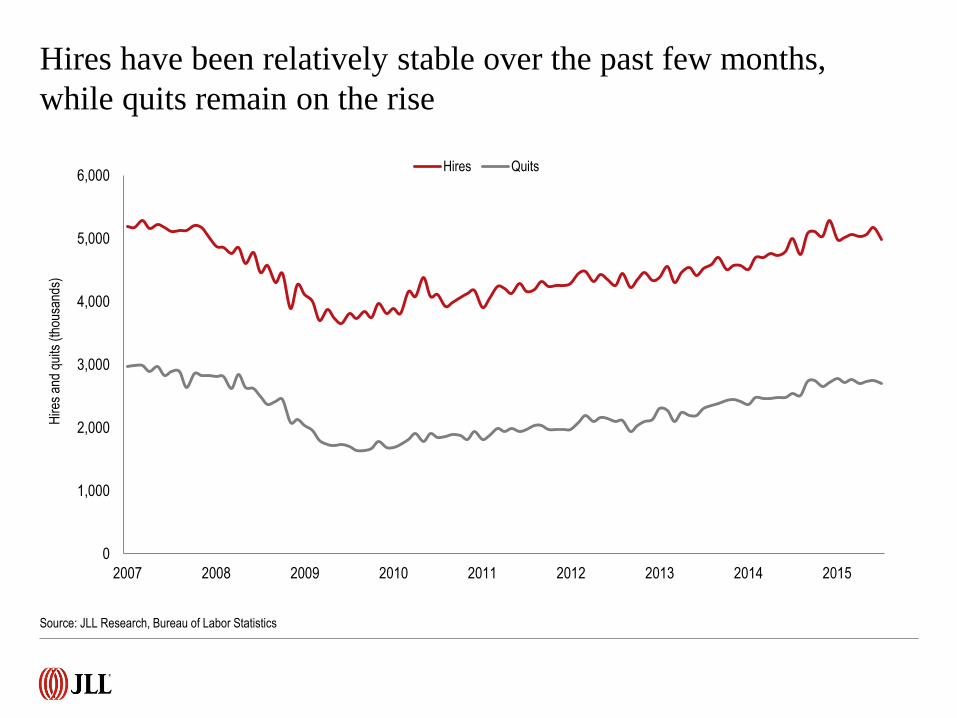
4,983,000 (-0.4% y-o-y)
Hires
2,695,000 (+6.0% y-o-y)
Quits
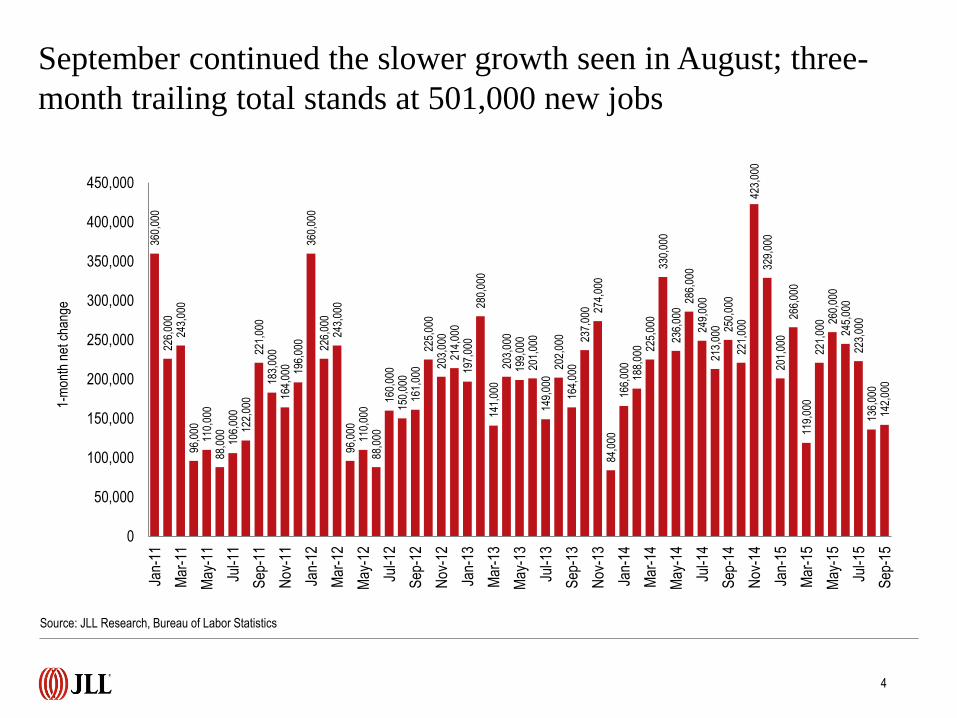
September continued the slower growth seen in August; three-
month trailing total stands at 501,000 new jobs
360,
000
226,
000
243,
000
96,0
00
110,
000
88,0
00
106,
000
122,
000
221,
000
183,
000
164,
000 19
6,00
0 36
0,00
0 22
6,00
0 24
3,00
0 96
,000
11
0,00
0 88
,000
16
0,00
0 15
0,00
0 16
1,00
0 22
5,00
0 20
3,00
0 21
4,00
0 19
7,00
0 28
0,00
0 14
1,00
0 20
3,00
0 19
9,00
0 20
1,00
0 14
9,00
0 20
2,00
0 16
4,00
0 23
7,00
0 274,
000
84,0
00
166,
000
188,
000 22
5,00
0 33
0,00
0 23
6,00
0 28
6,00
0 24
9,00
0 21
3,00
0 250,
000
221,
000
423,
000
329,
000
201,
000
266,
000
119,
000
221,
000 26
0,00
0 24
5,00
0 22
3,00
0 13
6,00
0 14
2,00
0
0
50,000
100,000
150,000
200,000
250,000
300,000
350,000
400,000
450,000
Jan-
11
Mar
-11
May
-11
Jul-1
1
Sep
-11
Nov
-11
Jan-
12
Mar
-12
May
-12
Jul-1
2
Sep
-12
Nov
-12
Jan-
13
Mar
-13
May
-13
Jul-1
3
Sep
-13
Nov
-13
Jan-
14
Mar
-14
May
-14
Jul-1
4
Sep
-14
Nov
-14
Jan-
15
Mar
-15
May
-15
Jul-1
5
Sep
-15
1-m
onth
net
cha
nge
4
Source: JLL Research, Bureau of Labor Statistics
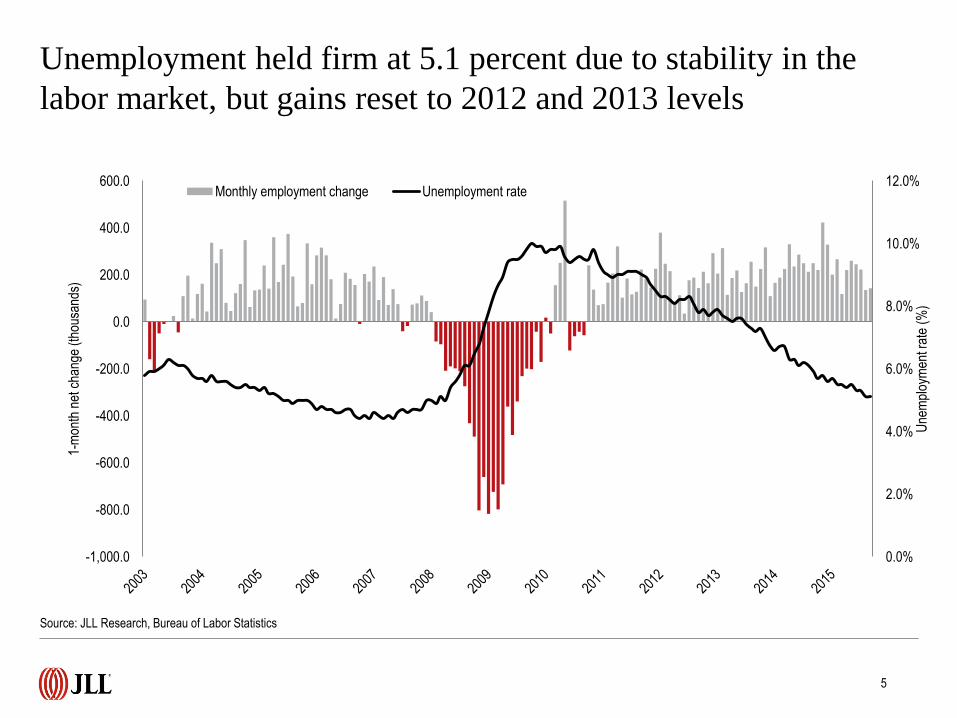
Unemployment held firm at 5.1 percent due to stability in the
labor market, but gains reset to 2012 and 2013 levels
0.0%
2.0%
4.0%
6.0%
8.0%
10.0%
12.0%
-1,000.0
-800.0
-600.0
-400.0
-200.0
0.0
200.0
400.0
600.0
Une
mpl
oym
ent r
ate
(%)
1-m
onth
net
cha
nge
(tho
usan
ds)
Monthly employment change Unemployment rate
Source: JLL Research, Bureau of Labor Statistics
5
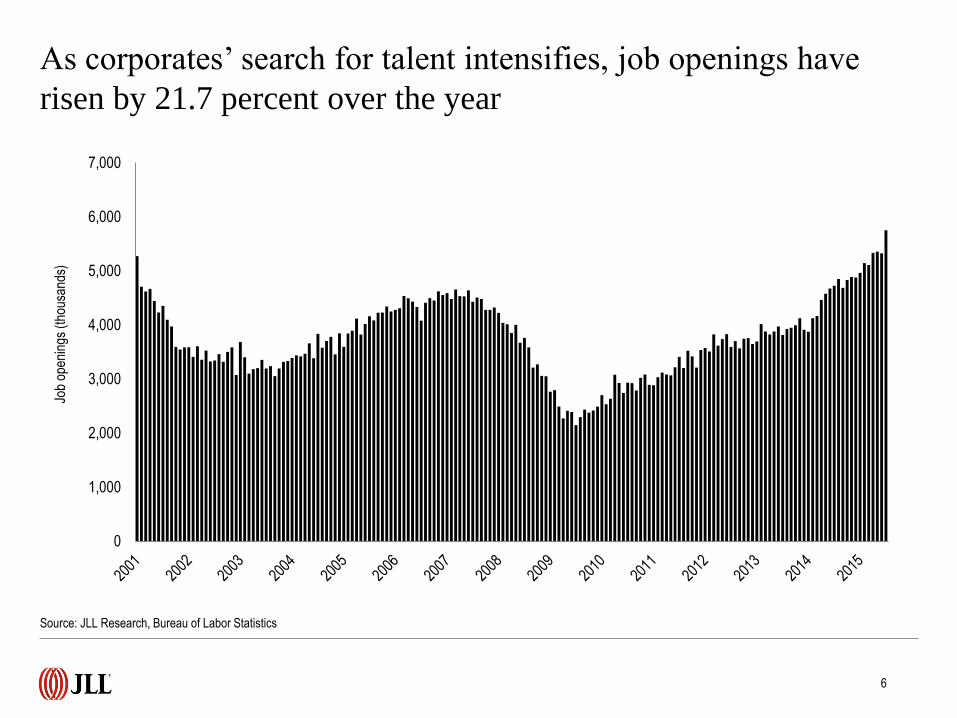
As corporates’ search for talent intensifies, job openings have
risen by 21.7 percent over the year
Source: JLL Research, Bureau of Labor Statistics
6
0
1,000
2,000
3,000
4,000
5,000
6,000
7,000
Job
open
ings
(th
ousa
nds)
0.0
20.0
40.0
60.0
80.0
100.0
120.0
140.0
Con
sum
er c
onfid
ence
inde
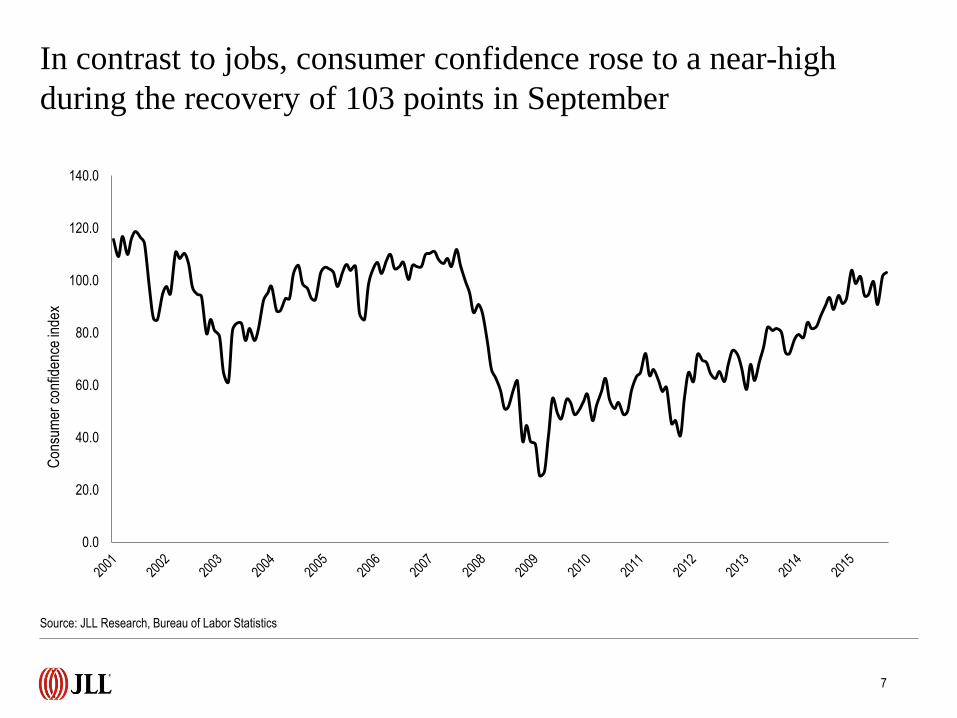
x In contrast to jobs, consumer confidence rose to a near-high
during the recovery of 103 points in September
Source: JLL Research, Bureau of Labor Statistics
7
-12.0
-9.0
-5.0
-4.1
-4.0
-0.7
0.0
1.0
2.1
3.5
4.6
8.0
12.0
23.7
24.0
29.0
31.0
35.0
36.4
-20 -10 0 10 20 30 40
Mining and logging
Manufacturing
Durable goods
Wholesale trade
Nondurable goods
Utilities
Financial activities
Other services
Motor vehicles and parts
Transportation and warehousing
Temporary help services
Construction
Information
Retail trade
Government
Education and health services
Professional and business services
Leisure and hospitality
Health care and social assistance
1-month net change (thousands)
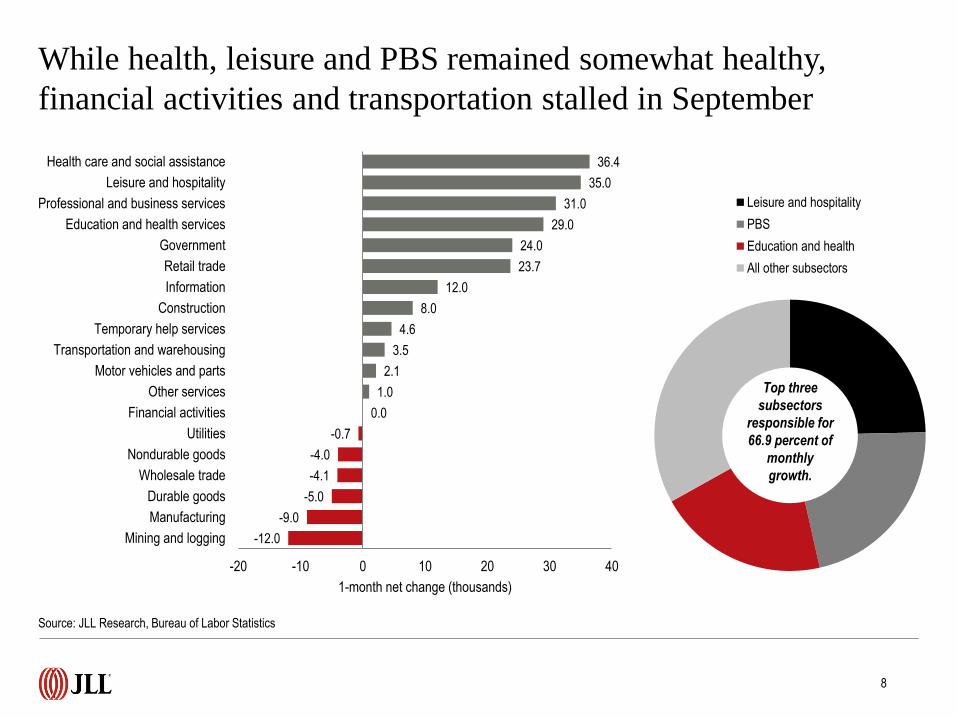
While health, leisure and PBS remained somewhat healthy,
financial activities and transportation stalled in September
Source: JLL Research, Bureau of Labor Statistics
8
Leisure and hospitality
PBS
Education and health
All other subsectors
Top three
subsectors
responsible for
66.9 percent of
monthly
growth.
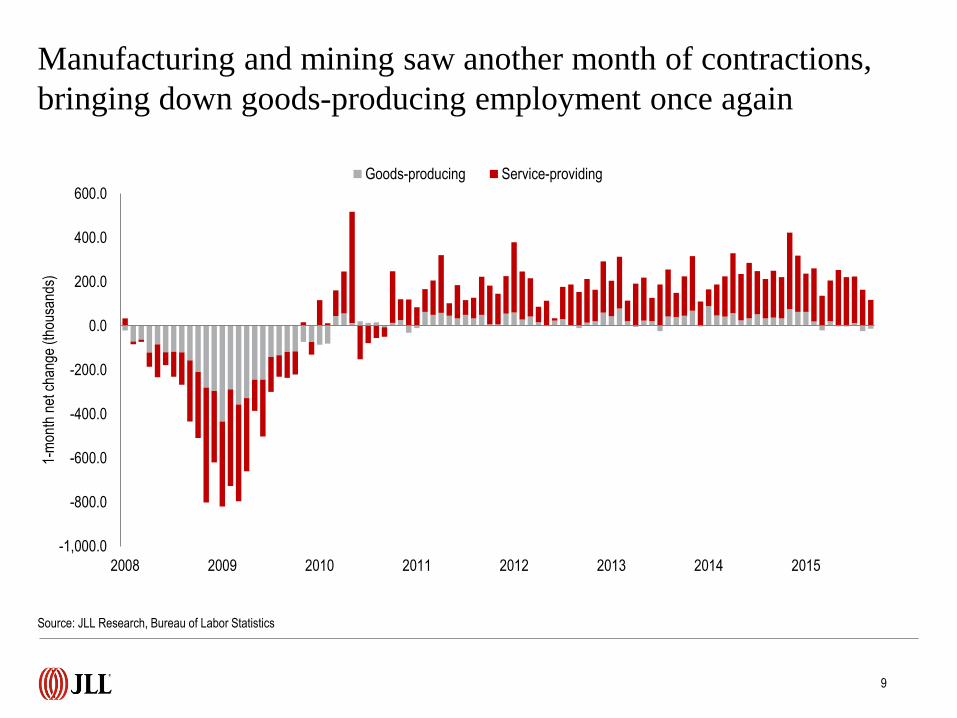
Manufacturing and mining saw another month of contractions,
bringing down goods-producing employment once again
-1,000.0
-800.0
-600.0
-400.0
-200.0
0.0
200.0
400.0
600.0
2008 2009 2010 2011 2012 2013 2014 2015
1-m
onth
net
cha
nge
(tho
usan
ds)
Goods-producing Service-providing
Source: JLL Research, Bureau of Labor Statistics
9
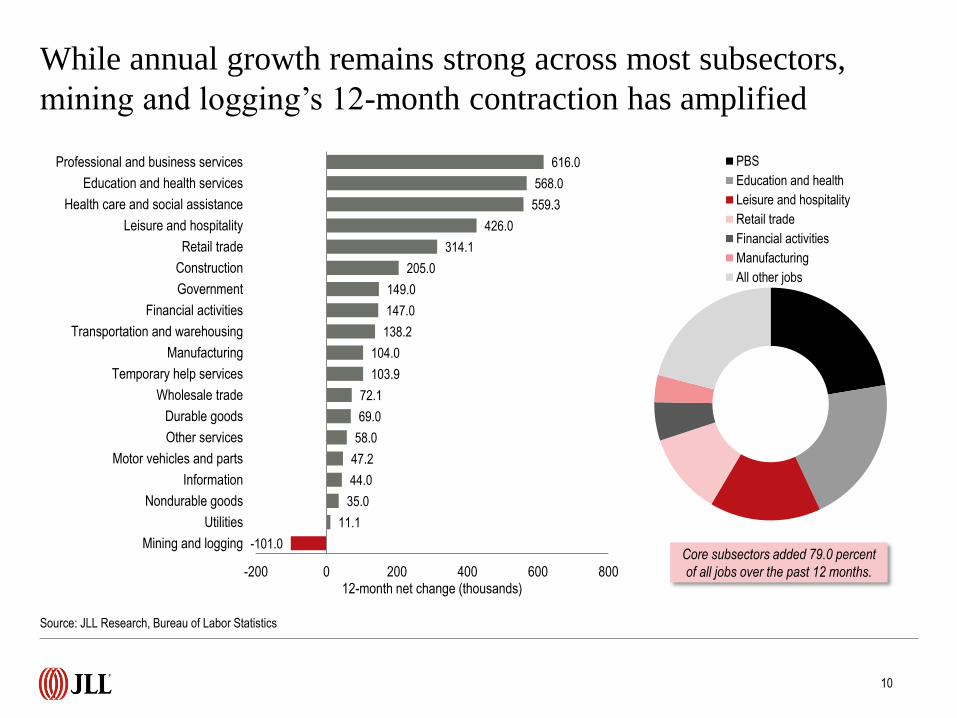
-101.0
11.1
35.0
44.0
47.2
58.0
69.0
72.1
103.9
104.0
138.2
147.0
149.0
205.0
314.1
426.0
559.3
568.0
616.0
-200 0 200 400 600 800
Mining and logging
Utilities
Nondurable goods
Information
Motor vehicles and parts
Other services
Durable goods
Wholesale trade
Temporary help services
Manufacturing
Transportation and warehousing
Financial activities
Government
Construction
Retail trade
Leisure and hospitality
Health care and social assistance
Education and health services
Professional and business services
12-month net change (thousands)
PBS
Education and health
Leisure and hospitality
Retail trade
Financial activities
Manufacturing
All other jobs
While annual growth remains strong across most subsectors,
mining and logging’s 12-month contraction has amplified
Source: JLL Research, Bureau of Labor Statistics
10
Core subsectors added 79.0 percent
of all jobs over the past 12 months.
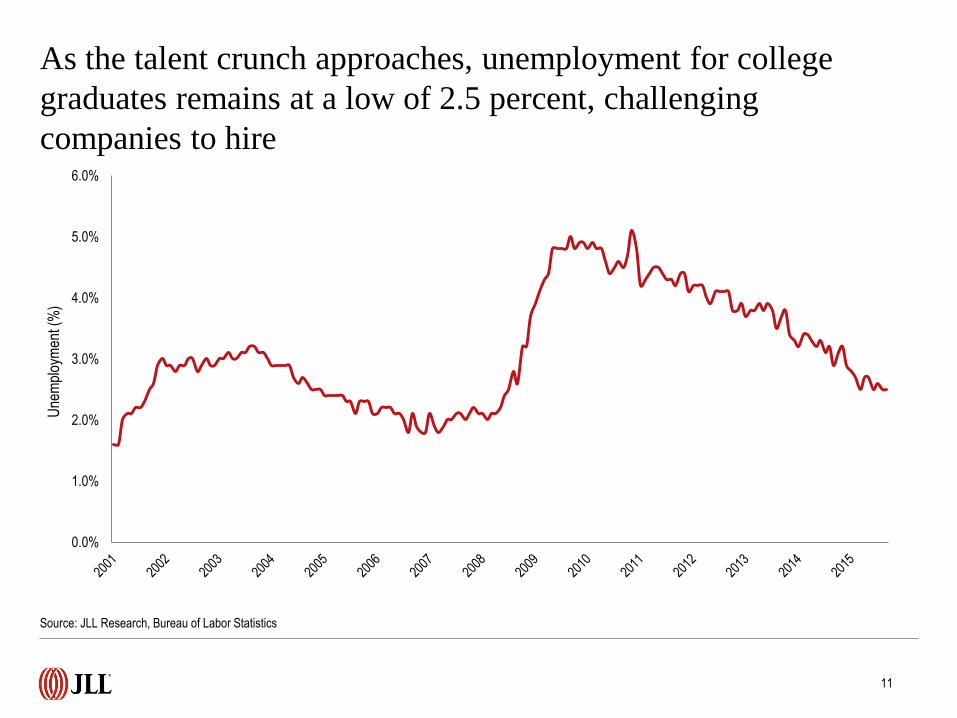
0.0%
1.0%
2.0%
3.0%
4.0%
5.0%
6.0%
Une
mpl
oym
ent (
%)
As the talent crunch approaches, unemployment for college
graduates remains at a low of 2.5 percent, challenging
companies to hire
Source: JLL Research, Bureau of Labor Statistics
11
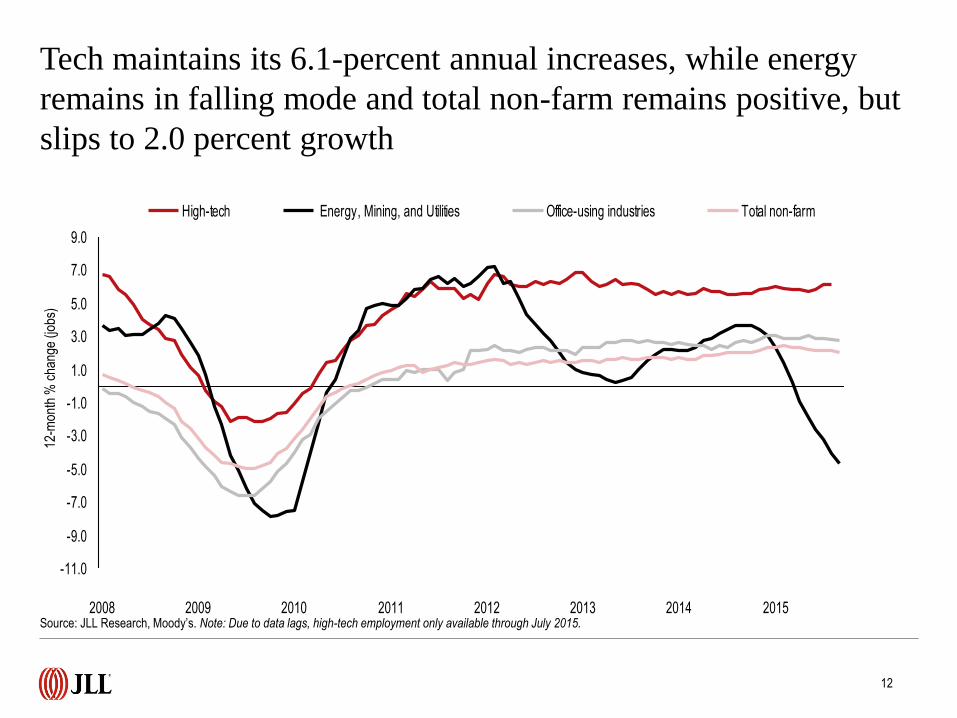
Tech maintains its 6.1-percent annual increases, while energy
remains in falling mode and total non-farm remains positive, but
slips to 2.0 percent growth
-11.0
-9.0
-7.0
-5.0
-3.0
-1.0
1.0
3.0
5.0
7.0
9.0
2008 2009 2010 2011 2012 2013 2014 2015
High-tech Energy, Mining, and Utilities Office-using industries Total non-farm
Source: JLL Research, Moody’s. Note: Due to data lags, high-tech employment only available through July 2015.
12
12-m
onth
% c
hang
e (jo
bs)
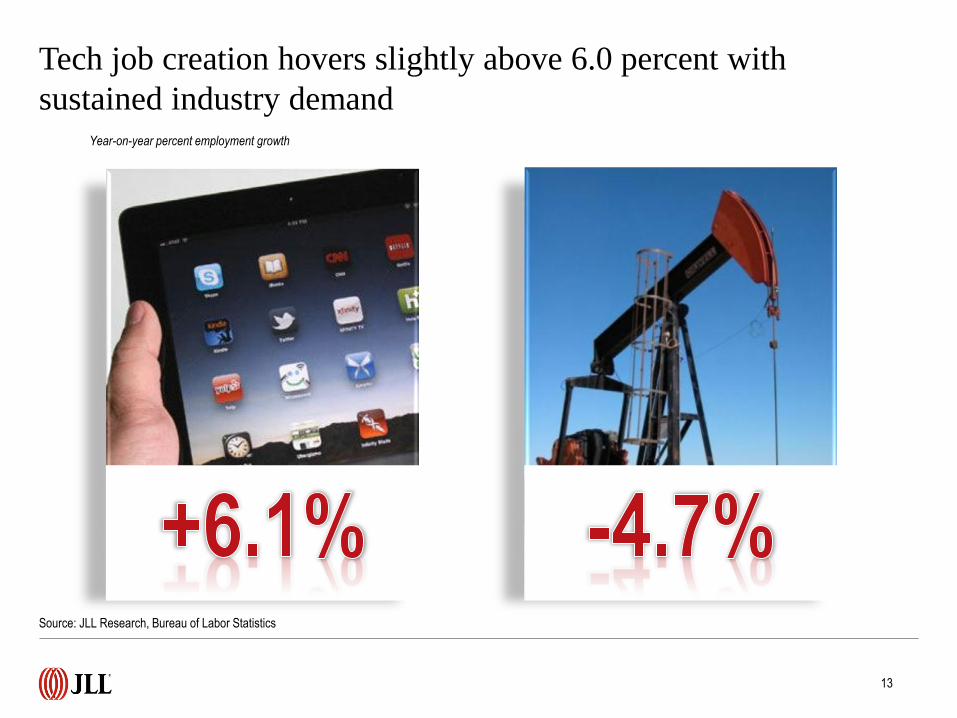
Tech job creation hovers slightly above 6.0 percent with
sustained industry demand Year-on-year percent employment growth
Source: JLL Research, Bureau of Labor Statistics
13
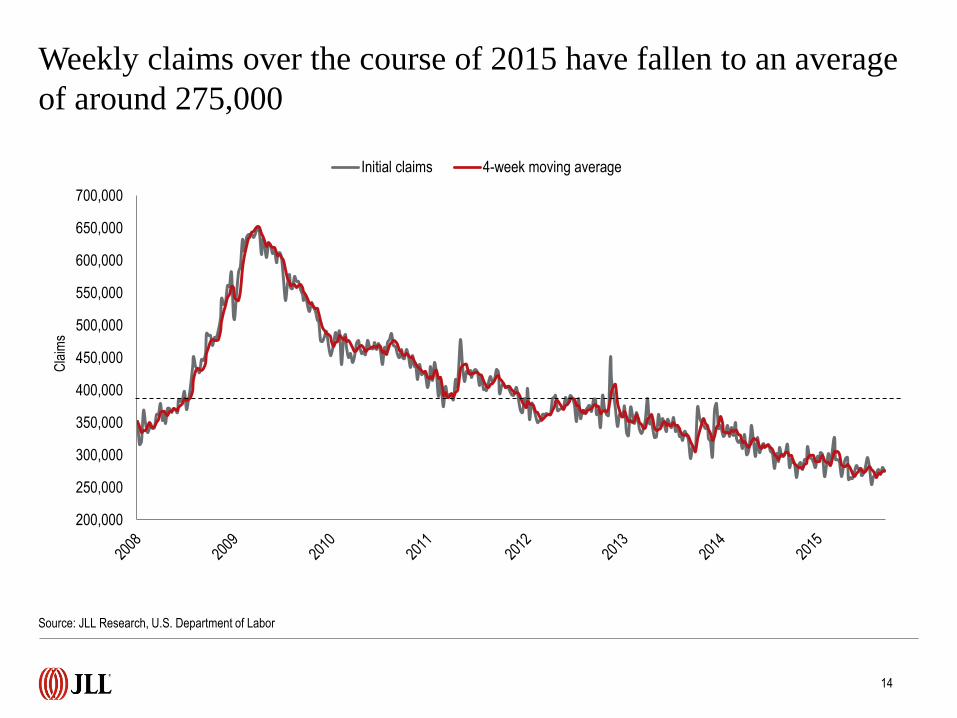
Weekly claims over the course of 2015 have fallen to an average
of around 275,000
Source: JLL Research, U.S. Department of Labor
14
200,000
250,000
300,000
350,000
400,000
450,000
500,000
550,000
600,000
650,000
700,000
Cla
ims
Initial claims 4-week moving average
0
1,000
2,000
3,000
4,000
5,000
6,000
2007 2008 2009 2010 2011 2012 2013 2014 2015
Hire
s an
d qu
its (
thou
sand
s)
Hires Quits
Hires have been relatively stable over the past few months,
while quits remain on the rise
Source: JLL Research, Bureau of Labor Statistics
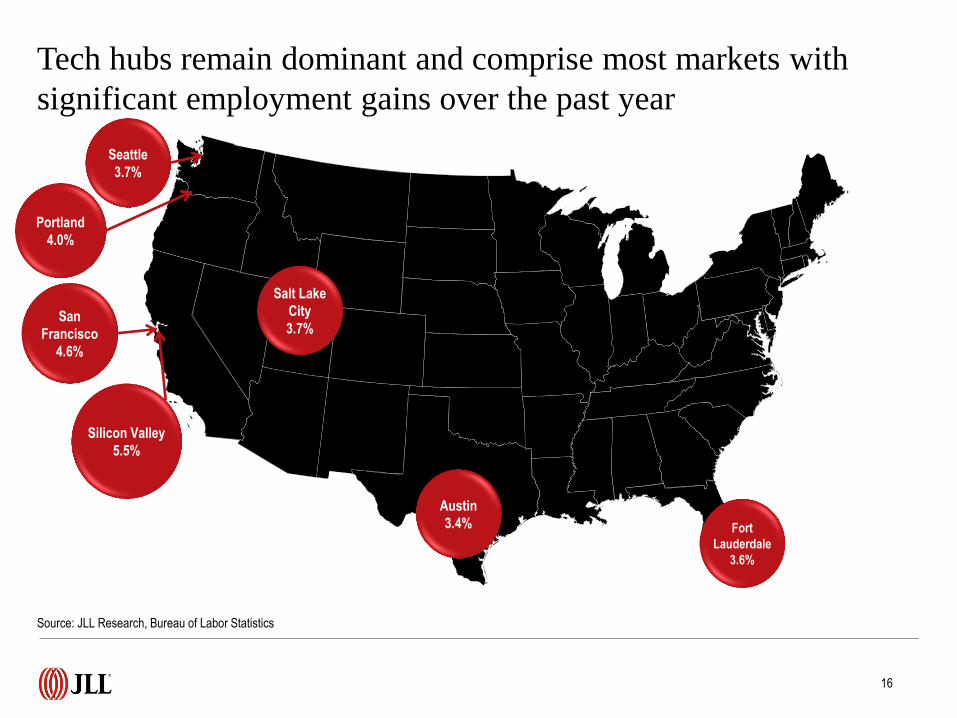
Tech hubs remain dominant and comprise most markets with
significant employment gains over the past year
Source: JLL Research, Bureau of Labor Statistics
16
Silicon Valley
5.5%
San
Francisco
4.6%
Portland
4.0%
Austin
3.4% Fort
Lauderdale
3.6%
Salt Lake
City
3.7%
Seattle
3.7%
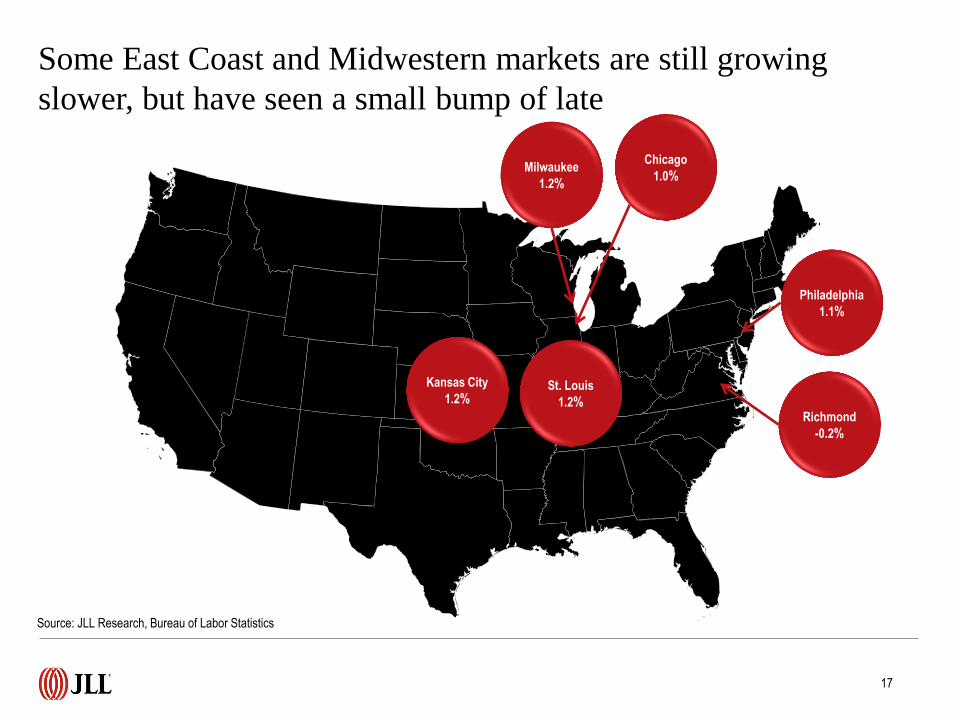
Some East Coast and Midwestern markets are still growing
slower, but have seen a small bump of late
17
Source: JLL Research, Bureau of Labor Statistics
Richmond
-0.2%
Philadelphia
1.1%
Chicago
1.0% Milwaukee
1.2%
Kansas City
1.2% St. Louis
1.2%
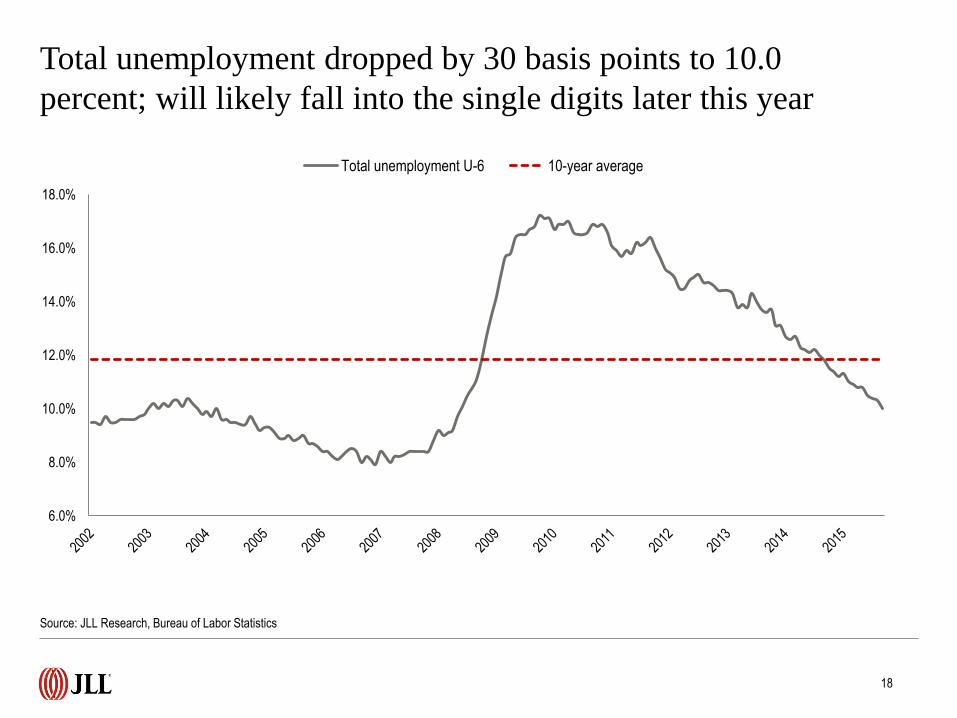
Total unemployment dropped by 30 basis points to 10.0
percent; will likely fall into the single digits later this year
6.0%
8.0%
10.0%
12.0%
14.0%
16.0%
18.0%
Total unemployment U-6 10-year average
Source: JLL Research, Bureau of Labor Statistics
18
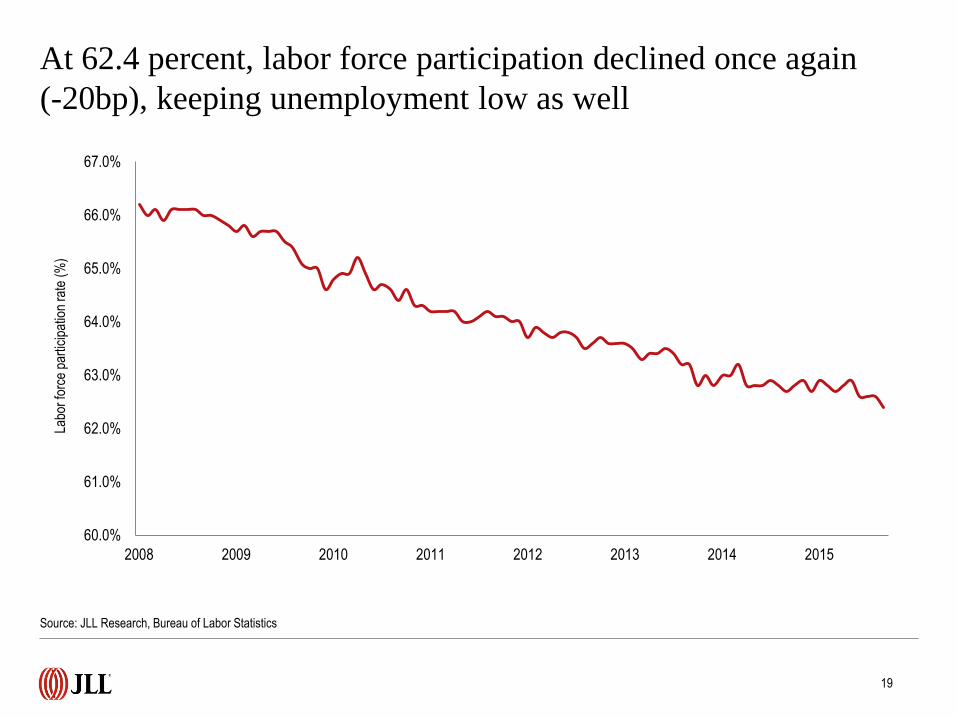
At 62.4 percent, labor force participation declined once again
(-20bp), keeping unemployment low as well
Source: JLL Research, Bureau of Labor Statistics
19
60.0%
61.0%
62.0%
63.0%
64.0%
65.0%
66.0%
67.0%
2008 2009 2010 2011 2012 2013 2014 2015
Labo
r fo
rce
part
icip
atio
n ra
te (
%)
A boost in information and stable PBS growth kept office-using
contribution to total at 30.3 percent despite flat financial figures
Source: JLL Research, Bureau of Labor Statistics
20
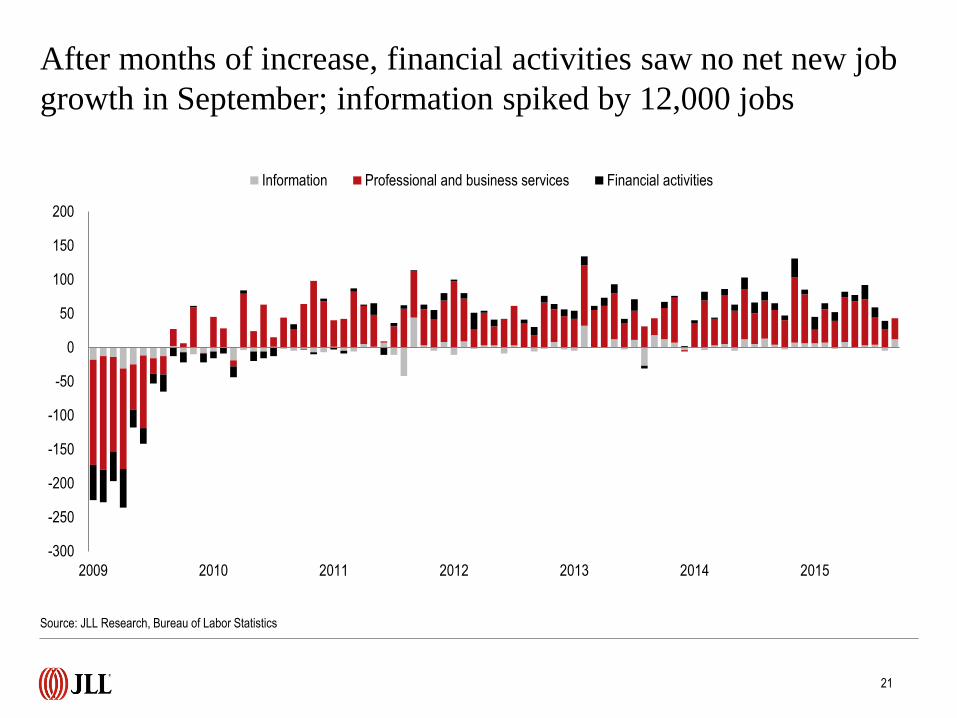
After months of increase, financial activities saw no net new job
growth in September; information spiked by 12,000 jobs
-300
-250
-200
-150
-100
-50
0
50
100
150
200
2009 2010 2011 2012 2013 2014 2015
Information Professional and business services Financial activities
Source: JLL Research, Bureau of Labor Statistics
21
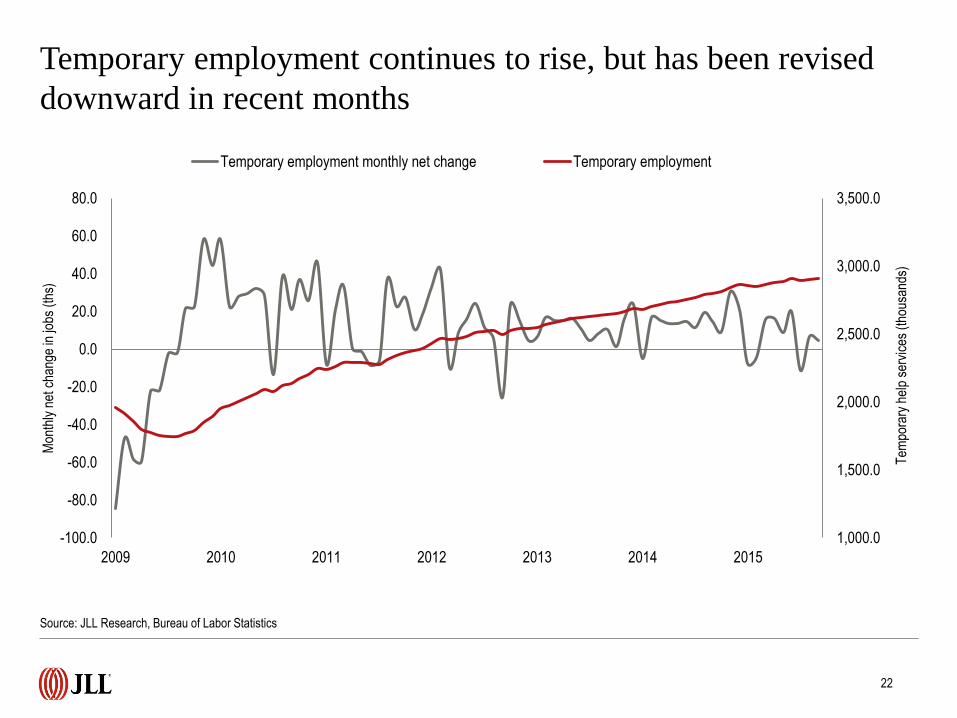
Temporary employment continues to rise, but has been revised
downward in recent months
1,000.0
1,500.0
2,000.0
2,500.0
3,000.0
3,500.0
-100.0
-80.0
-60.0
-40.0
-20.0
0.0
20.0
40.0
60.0
80.0
2009 2010 2011 2012 2013 2014 2015
Tem
pora
ry h
elp
serv
ices
(th
ousa
nds)
Mon
thly
net
cha
nge
in jo
bs (
ths)
Temporary employment monthly net change Temporary employment
Source: JLL Research, Bureau of Labor Statistics
22

©2015 Jones Lang LaSalle Research IP, Inc. All rights reserved. All information contained herein is from sources deemed reliable; however, no representation or warranty is made to the accuracy thereof.
For more information, please contact:
Ben Breslau
Managing Director - Americas Research
Phil Ryan
Research Analyst – Office and Economy Research
Or, find more employment, business and real estate
research at jll.com.
>>> Click here to check it out.