making full use of petrophysical data - geoconvention … data can be used to supplement a sparse...
TRANSCRIPT

What’s Next? Where is Our Industry Heading? 546
Building Better Models – Making Full Use of Petrophysical Data
Elizabeth L’Heureux* University of Toronto, Toronto, Ontario, Canada
Abstract We have developed a new method for building 3D petrophysical background models that incorporate both large scale trends in lithology and smaller scale variations in physical properties. The method stems from the need for an accurate representation of the distribution of physical properties within a given geological setting, in order to properly model the seismic response of the target of interest embedded within a realistic, heterogeneous medium. This degree of heterogeneity can be assessed using the stochastic variations observed in borehole log data. The autocovariance of the fluctuations is fit to a function characterized by a scale length that is proportional to the degree of homogeneity of the medium surrounding the borehole. This function and scale length can then be used to generate synthetic data in one, two and three dimensions that accurately represent the variations in physical properties of the medium, including any anisotropy in seismic velocities, attenuation, porosity, etc.
We use these detailed petrophysical models to simulate 3D elastic and viscoelastic seismic wave propagation in random media. Seismic models thus far have shown that exploration target responses are partially obscured by the scattering of seismic energy off small scale heterogeneities. By accurately modeling this kind of effect we can begin to design seismic surveys that better capture AVO or AVA responses of specific targets. Another of the direct applications of this method is the “filling in” of sparse datasets with simulated log data, notably for the purposes of kriging and inversion.
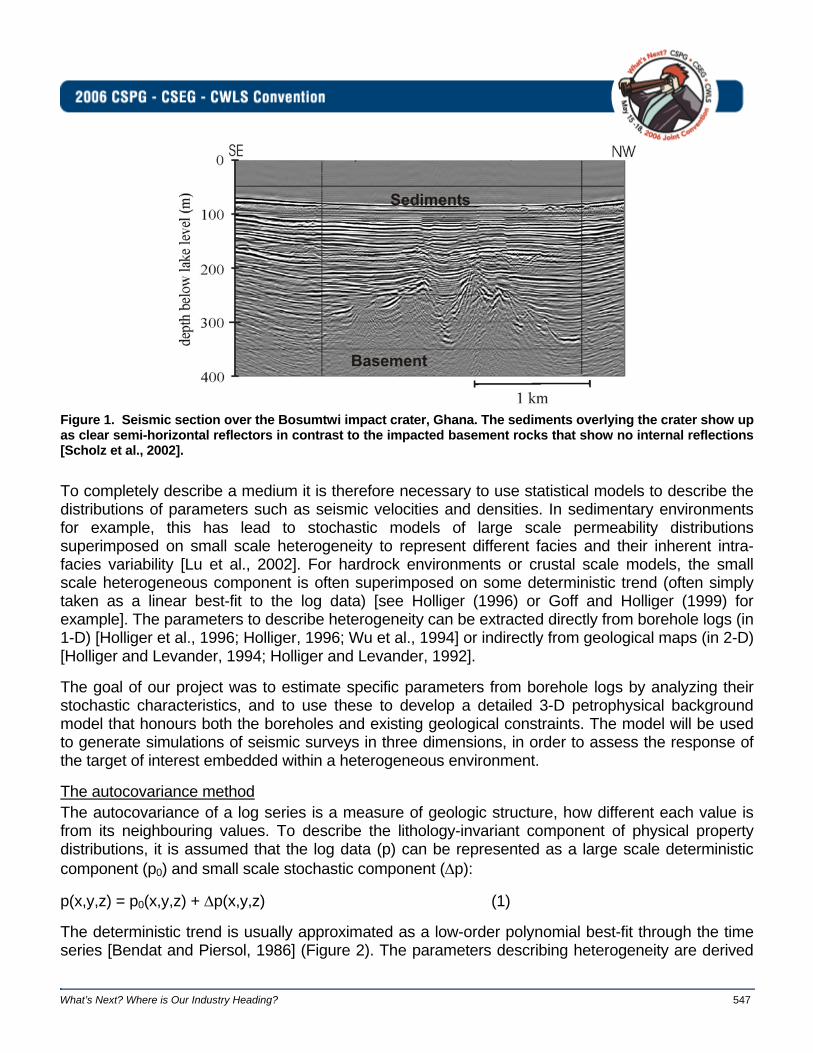
Introduction We can often generate complicated geological models based on geophysical and borehole log data. Information about lithology is generally extracted from bulk variations in logs; the smaller, higher frequency fluctuations are simply treated as a type of noise. Subsurface models derived in this way do not take advantage of the full sampling of physical properties available through logging, and lack an accurate representation of the inherent heterogeneity of the medium. The heterogeneous component of a medium can have a large influence on seismic wave propagation, depending on the magnitude of the variations. Whether a structure is “transparent” to seismic waves or whether it will scatter energy in any defined pattern depends on the scale (in all three dimensions) of the stochastic component of physical property distributions. This effect is readily seen in seismic images of impact craters for example, where the surrounding structure is interrupted by the semi-transparent zone within the impacted bedrock (Figure 1). This zone of high brecciation or possible melting is characterized by small scale lengths in both vertical and horizontal directions, whereas sedimentary layers such as those in Figure 1 can have quite large horizontal scales.
What’s Next? Where is Our Industry Heading? 547
Figure 1. Seismic section over the Bosumtwi impact crater, Ghana. The sediments overlying the crater show up as clear semi-horizontal reflectors in contrast to the impacted basement rocks that show no internal reflections [Scholz et al., 2002]. To completely describe a medium it is therefore necessary to use statistical models to describe the distributions of parameters such as seismic velocities and densities. In sedimentary environments for example, this has lead to stochastic models of large scale permeability distributions superimposed on small scale heterogeneity to represent different facies and their inherent intra-facies variability [Lu et al., 2002]. For hardrock environments or crustal scale models, the small scale heterogeneous component is often superimposed on some deterministic trend (often simply taken as a linear best-fit to the log data) [see Holliger (1996) or Goff and Holliger (1999) for example]. The parameters to describe heterogeneity can be extracted directly from borehole logs (in 1-D) [Holliger et al., 1996; Holliger, 1996; Wu et al., 1994] or indirectly from geological maps (in 2-D) [Holliger and Levander, 1994; Holliger and Levander, 1992].
The goal of our project was to estimate specific parameters from borehole logs by analyzing their stochastic characteristics, and to use these to develop a detailed 3-D petrophysical background model that honours both the boreholes and existing geological constraints. The model will be used to generate simulations of seismic surveys in three dimensions, in order to assess the response of the target of interest embedded within a heterogeneous environment.
The autocovariance method The autocovariance of a log series is a measure of geologic structure, how different each value is from its neighbouring values. To describe the lithology-invariant component of physical property distributions, it is assumed that the log data (p) can be represented as a large scale deterministic component (p0) and small scale stochastic component (∆p):
p(x,y,z) = p0(x,y,z) + ∆p(x,y,z) (1)
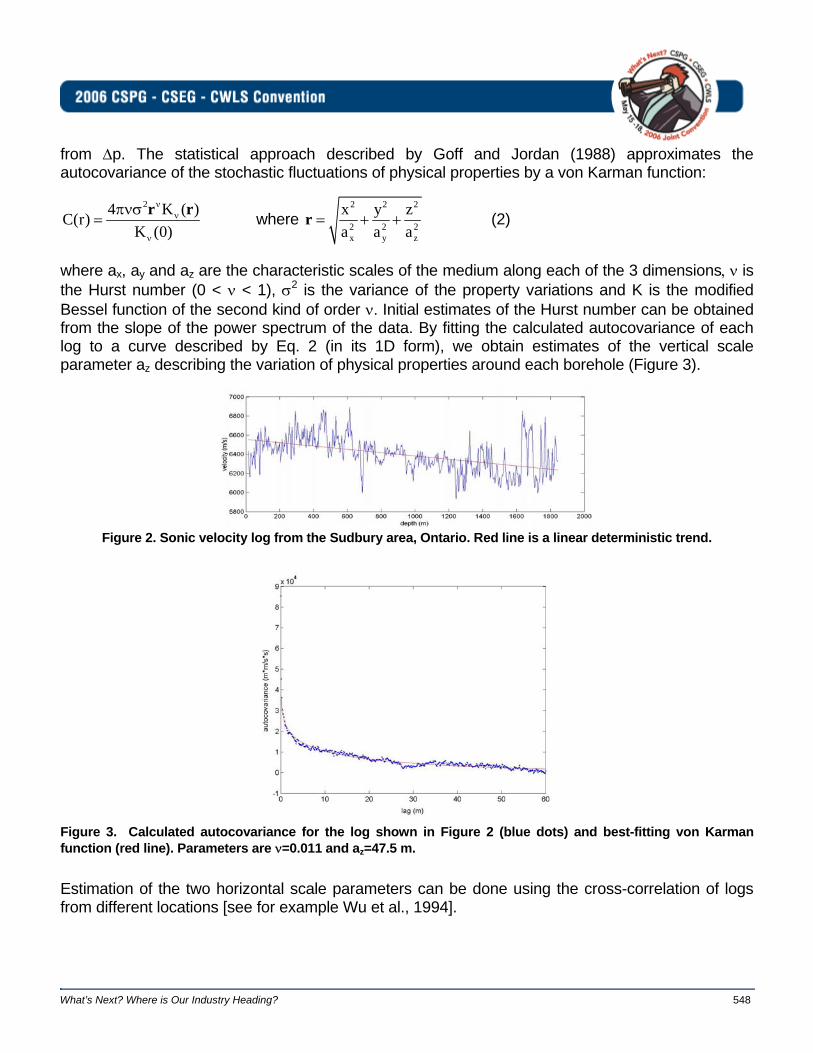
The deterministic trend is usually approximated as a low-order polynomial best-fit through the time series [Bendat and Piersol, 1986] (Figure 2). The parameters describing heterogeneity are derived
What’s Next? Where is Our Industry Heading? 548
from ∆p. The statistical approach described by Goff and Jordan (1988) approximates the autocovariance of the stochastic fluctuations of physical properties by a von Karman function:
24 K ( )C(r)K (0)
r rνν
ν
πνσ= where
2 2 2
2 2 2x y z
x y za a a
r = + + (2)
where ax, ay and az are the characteristic scales of the medium along each of the 3 dimensions, ν is the Hurst number (0 < ν < 1), σ2 is the variance of the property variations and K is the modified Bessel function of the second kind of order ν. Initial estimates of the Hurst number can be obtained from the slope of the power spectrum of the data. By fitting the calculated autocovariance of each log to a curve described by Eq. 2 (in its 1D form), we obtain estimates of the vertical scale parameter az describing the variation of physical properties around each borehole (Figure 3).
Figure 2. Sonic velocity log from the Sudbury area, Ontario. Red line is a linear deterministic trend.
Figure 3. Calculated autocovariance for the log shown in Figure 2 (blue dots) and best-fitting von Karman function (red line). Parameters are ν=0.011 and az=47.5 m. Estimation of the two horizontal scale parameters can be done using the cross-correlation of logs from different locations [see for example Wu et al., 1994].

What’s Next? Where is Our Industry Heading? 549
Synthetic models Synthetic models can be generated by multiplying the square root of the power spectrum of the autocovariance (Eq. 2) (calculated with the parameters estimated from the logs) by eiφ, where φ is uniformly distributed on the interval [0, 2π]. Any deterministic trend can then be added. Media can be modeled in one, two or three dimensions, with either isotropic or anisotropic scale parameters. The scale lengths have a direct effect on the distribution of heterogeneity (Figure 4), which in turn can be related to the amount of scattering a seismic wave undergoes as it propagates through the medium.
Figure 4. Synthetic velocity models with ν=0.25 and a) ax=az=10m, b) ax=az=100m and c) ax=100m, az=10m. Scattering regimes can be quantified through the size of inhomogeneities compared to the wavelength of seismic waves [Wu, 1989]: a quasi-homogeneous medium such as the one in Figure 4a will transmit energy with little scattering, while the media represented by Figures 4b and c may produce large amounts of scattering in either forward or backward directions. In addition, scattering attenuation and mode conversions may be of importance in all three of these media. Seismic surveys will pick up coherent reflections if the size and shape of heterogeneities meet the right conditions of amplitude and directivity of the scattered wavefield.
What’s Next? Where is Our Industry Heading? 550
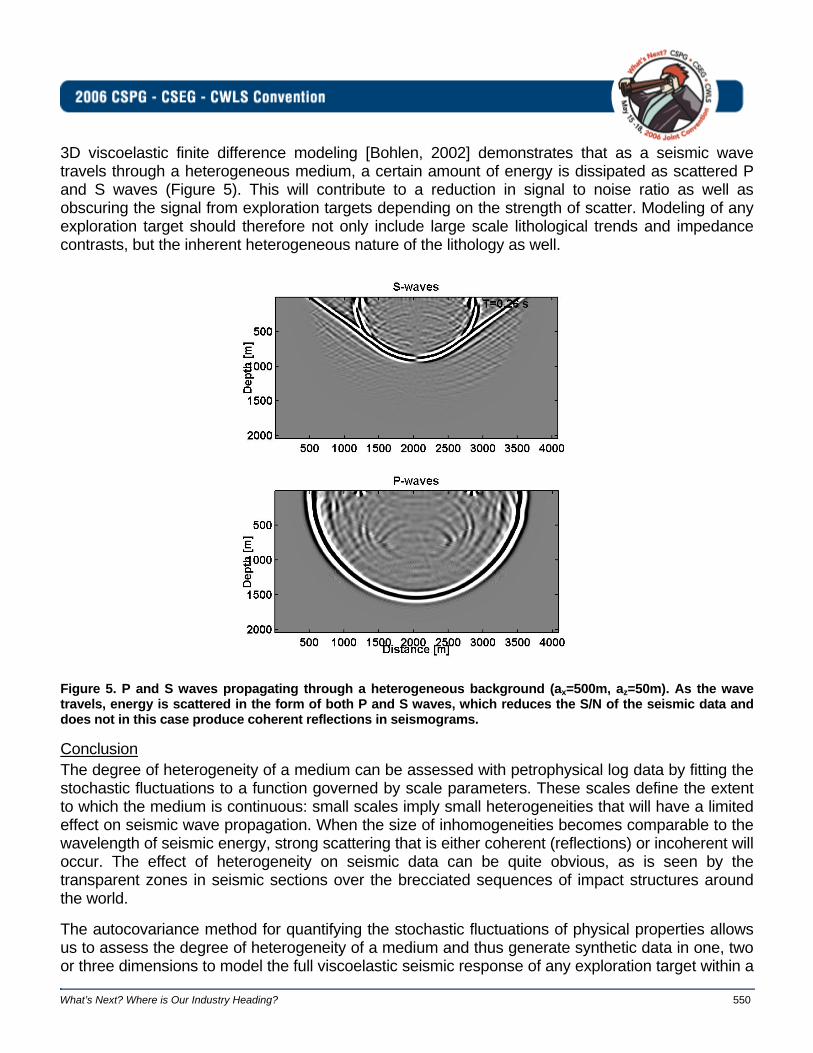
3D viscoelastic finite difference modeling [Bohlen, 2002] demonstrates that as a seismic wave travels through a heterogeneous medium, a certain amount of energy is dissipated as scattered P and S waves (Figure 5). This will contribute to a reduction in signal to noise ratio as well as obscuring the signal from exploration targets depending on the strength of scatter. Modeling of any exploration target should therefore not only include large scale lithological trends and impedance contrasts, but the inherent heterogeneous nature of the lithology as well.
Figure 5. P and S waves propagating through a heterogeneous background (ax=500m, az=50m). As the wave travels, energy is scattered in the form of both P and S waves, which reduces the S/N of the seismic data and does not in this case produce coherent reflections in seismograms.
Conclusion The degree of heterogeneity of a medium can be assessed with petrophysical log data by fitting the stochastic fluctuations to a function governed by scale parameters. These scales define the extent to which the medium is continuous: small scales imply small heterogeneities that will have a limited effect on seismic wave propagation. When the size of inhomogeneities becomes comparable to the wavelength of seismic energy, strong scattering that is either coherent (reflections) or incoherent will occur. The effect of heterogeneity on seismic data can be quite obvious, as is seen by the transparent zones in seismic sections over the brecciated sequences of impact structures around the world.
The autocovariance method for quantifying the stochastic fluctuations of physical properties allows us to assess the degree of heterogeneity of a medium and thus generate synthetic data in one, two or three dimensions to model the full viscoelastic seismic response of any exploration target within a

What’s Next? Where is Our Industry Heading? 551
realistic medium. It also provides the means of completing geological databases with a full description of the distributions of physical properties, taking advantage of entire log datasets. The synthetic data can be used to supplement a sparse dataset during inversions or while interpolating/kriging between available control information.
Acknowledgment The author would like to acknowledge funding from NSERC.
References Bendat, J.S. and Piersol, A.G. (1986) Random data: analysis and measurement procedures. 2nd edition, John Wiley and Sons, New York, 566 pages.
Bohlen, T. (2002) Parallel 3-D viscoelastic finite difference seismic modelling. Computers and Geosciences, 28, p.887-899.
Goff, J.A. and Holliger, K. (1999) Nature and origin of upper crustal seismic velocity fluctuations and associated scaling properties: Combined stochastic analyses of KTB velocity and lithology logs. Journal of Geophysical Research, 104(B6), p.13169-13182.
Goff, J.A. and Jordan, T.H. (1988) Stochastic modeling of seafloor morphology: inversion of sea beam data for second-order statistics. Journal of Geophysical Research, 93(B11), p.13589-13608.
Holliger, K. (1996) Upper-crustal seismic heterogeneity as derived from a variety of P-wave sonic logs. Geophysical Journal International, 125, p.813-829.
Holliger, K., Green, A.G. and Juhlin, C. (1996) Stochastic analysis of sonic logs from the upper crystalline crust: methodology. Tectonophysics, 264, p.341-356.
Holliger, K. and Levander, R. (1992) A stochastic view of lower crustal fabric based on evidence from the Ivrea zone. Geophysical Research Letters, 19(11), p.1153-1156.
Holliger, K. and Levander, R. (1994) A. Structure and seismic response of extended continental crust: Stochastic analysis of the Strona-Ceneri and Ivrea zones, Italy. Geology, 22, p.79-82.
Lu, S., Molz, F.J., Fogg, G.E. and Castle, J.W. (2002) Combining stochastic facies and fractal models for representing natural heterogeneity. Hydrogeology Journal, 10(4), p.475-482.
Scholz, C., Karp, T., Brooks, K., Milkereit, B., Amoako, P. and Arko, J. (2002) Pronounced central uplift identified in the Bosumtwi impact structure, Ghana, using multichannel seismic reflection data. Geology, 30(10), p.939-942.
Wu, R. (1989) Seismic wave scattering. In: The Encyclopedia of Solid Earth Geophysics, James, D.E. (Edt.), Van Nostrand Reinhold.
Wu, R-S., Xu, Z. and Li, X-P. (1994) Heterogeneity spectrum and scale-anisotropy in the upper crust revealed by the German Continental Deep-Drilling (KTB) holes. Geophysical Research Letters, 21(10), p.911-914.