and water - usda ars by bendat and piersol (1966), which are "generally valid for the vast...
TRANSCRIPT

Purchased -iy
U. S. Department of Agriculture
VOLUME 3 For Official Use
HYDROLOGY
and WATERRESOURCESin ARIZONA
and theSOUTHWESTPROCEEDINGS OF THE 1973 MEETINGS
OF THE
ARIZONA SECTION-
AMERICAN WATER RESOURCES ASSN.
AND THE
HYDROLOGY SECTION-
ARIZONA ACADEMY OF SCIENCE
MAY 4-5, 1973, TUCSON, ARIZONA

STATIONARITY IN THUNDERSTORM RAINFALL IN THE SOUTHWEST-'
William C. Hills and Herbert B. Osborn^'
INTRODUCTION
Air-mass thunderstorm rainfall is a major source of water in the
rangeland areas of the southwestern United States. These thunderstorms
occur during the summer months and produce intense afternoon and evening
rains of short duration and limited areal extent. For small (100 square
miles and less) watersheds in the southwest, air-mass thunderstorms
produce the major flood peaks (Osborn & Hickok, 1968), therefore,
knowledge of occurrence frequencies of these thunderstorms is essential
in predicting flood sediment transport for small watersheds in the
southwest.
Air-mass thunderstorm rainfall appears to be randomly distri
buted in time and space. Thus, it can be considered as a stochastic
process. Stochastic processes are classified as either stationary or
nonstationary. If thunderstorm rainfall can be assumed to' be stationary,it most likely can also be assumed to be ergodic. If ergodic, several
independent short-term samples can be combined to provide a sample
which is equivalent to a long-term record, thus providing greater
opportunity for obtaining sample points in the extreme tails of the
rainfall probability distribution. Such extreme sample points are
needed to better define the rainfall probability tails for more accurate
prediction of extreme events.
In this paper, several long-term U.S. Weather Bureau records
from gages in southeastern Arizona are tested for stationarity. Both
the maximum daily rainfall for each season and seasonal total rainfall
are tested. Also, rainfall records from a dense raingage network on
the ARS Walnut Gulch Experimental Watershed near Tombstone, Arizona
are examined to determine the elevation range for which these records
can be considered ergodic.
TESTS FOR STATIONARITY
A rigorous definition of a stationary process requires that
statistical properties computed across the ensemble of all possible
sample functions at any arbitrary time point be the same for any
other time point. Verification of stationarity by this definition is
1. Contribution of USDA, ARS, Soil, Water, and Air Sciences.
2. Research Hydraulic Engineers, USDA, ARS, Southwest Watershed
Research Center, Tucson, Arizona.
26

not feasible since there are an infinite number of possible statistics,
and a complete description of the random process by the ensemble of
all sample functions would be required to compute them. Usually,
long-term observations are available from only one sample function.
Even so, practical tests for stationarity using individual sample
functions can be devised by making some important assumptions,
proposed by Bendat and Piersol (1966), which are "generally valid
for the vast majority of random data in nature."
These assumptions are:
(1) If the data of interest are nonstationary, then the statis
tical properties computed over each of a sequence of short time inter
vals from a single sample record will vary significantly from one
interval to the next.
(2) Verification of weak stationarity (time lnvarlance of the
mean value and autocorrelation function) is acceptable for the desired
analyses and applications.
(3) The sample record of the data to be investigated is very
long compared to the random fluctuations of the data time history.
(4) If the mean square value of the data is stationary, then
the autocorrelation function for the data is also stationary. (This
assumption is not necessary to test whether a single sample record
is stationary, but it does simplify practical testing procedures.)
Under the above assumptions, stationarity of annual maximum
24-hour thunderstorm rainfalls and annual rainfall totals for the
summer season for eight Weather Bureau stations in southeastern
Arizona was tested. Figure 1 shows location and elevation of these
gages. Figures 2 and 3 give annual maximum 24-hour thunderstorm rain
falls for the eight stations and 6-year means. Figures 4 and 5 show
6-year running means of summer seasonal rainfall.
To test for stationarity of the rainfall sequences, the follow
ing procedure was used.
Periods were divided into equal intervals of 6 years each,
and a mean value and a mean square value were computed for each interval.
The sequences of mean values and mean square values were then tested
under the null hypothesis that they were each independent samples
of a random variable with the same true mean value and the same true
mean square value. The nonparametric run test as recommended by Bendat
and Piersol (1966) was used.
In the run test procedure, the mean values and mean square values
computed for a rainfall record are designated (+) or (-) depending upon
whether they are above or below the average of all values for the record.
27

NEW
MEXICO
CLIFTON
ELEV. 3460/^
saffordV. ■ -ELEV. 2900
BOWIEo
WILCOX ELEV. 3740
ELEV. 4190
BENSON^
ELEV 3600\WALNUT GULCH
TOMBSTONEELEV. 4610
\ELEV. 5440 DgUGLAS
ELEV. 3970SCALE IN MILES
0 10 20 30 40
ELEV. IN FEET
\M E X I C 0
FIGURE 1. Location in southeastern Arizona of U. S. Weather Bureau
rain gages used in tests for stationarity.

OS P
*a gosr
2.8H-tn
conO Bc c
§ -
roo ro
5
ft
H H-H-CD
n o*
o a
MAXIMUM 24-HOUR RAINFALL (INCHES)fp o — &_ o — ro O ro
oo
<To
|O
O
^r
m i
" ^1" AFFOn
—
.
IDm
o
Er--2l- I
CD
m
m

S£
E=
sr gn
to
erst
nto
st
as*o
MAXIMUM
24-HOUR
RA^FALL
(INCHES)
i,
t->
toO
I-1
O(-
•
-Mrt n
oo
MO
§*
o o M O S o
■i
—
—1
ro
1i
CD
1—
o m
^^
=
--.
,*—
—-—
H t -AP~
ro
ro
ro
oi
o r ^l
ito s
o o (0

«/Id
z
Ili
ID
t
X
UJ
BISBEE
TOMBSTONE—
DOUGLAS-
BENSON—
0 1895 IbOO 1905 MO 1915 1920 1925 I ^0 1935 1940 1945 1950 1955 I960 1965 1970Y£AR
FIGURE U. Six-year running means of summer seasonal rainfall recorded at Bisbee, Tombstone,
Douglas and Benson.

SUMMER
RAINFALL,6-YR
RUNNING_MEANIINCHES)_
Oro
aff>
a>Q
*?•*
1i
II
•I
iT
'I
'i
'i
in
p)
CO
as?
gn
Is £ B s g O Ml
CD 6 g CD s o g H n P. & H ►1 n n 0 2. n S. 0 * H>O s R. Hi o s.
w Ol
<p
o w & o Ol 55 ro
c <p I".
mM*
— Ol
Ol
5 Ol
o OlOl
O
o B
DDOU)
I•>-
t_l
Hi

The number of runs, which is a sequence of like signs followed,
preceded, or both by a different sign, is then determined for the
record. The number of runs which occur in a sequence indicates whether
or not results are Independent random observations of the same random
variables.
The number of runs determined for each of the eight Weather
Bureau records are tabulated in Table 1. These are all within the
90% limits of the sampling distribution for runs, i.e., if A is the
event that the number of runs is within these limits for record 1, then
F(A.) = .90, where F(A.)>is the probability that A. occurs. Since air-
mass thunderstorms are limited in areal extent and the Mni^im spacing
is 25 miles between the Weather Bureau gages for which records were
obtained, we assume the events A. are independent. Therefore, the
probability of the number of runs for all eight records falling within
the 90% confidence limits of the runs sampling distribution is as follows:
8 8
* P(A.) - (.90) « 0.43
i=l *
Thus, with these test results as a basis, the null hypothesis
that the statistics for each Interval were samples from the same popu
lation was accepted for all 8 records. That is, the sequences of
annual maximum thunderstorm rainfall and summer seasonal rainfall for
southeastern Arizona are assumed to be sample functions of stationary
processes subject to the basic assumptions made in the above tests.
It is recognized that, In general, thunderstorm rainfall is not a
stationary process since the probability structure varies within the
season. However, since in this paper we are interested only in
sequences constructed from selected values from each season (maximum
24-hour thunderstorm rainfall and total summer seasonal rainfall),
probability structure changes within the season would not be expected
to affect these sequences.
CONSIDERATION OF ERGODICITY
For a stationary random process to be ergodic, the distribution
of the variant must not differ when computed over different sample
functions. This means that statistical properties of rainfall
measured at different points must not differ significantly if the
rainfall process is to be considered ergodic. Elevation may be the
major factor in causing rainfall statistical properties to differ at
different points in the rolling rangeland areas of southeastern Arizona.
The ARS Walnut Gulch Experimental Watershed, which is instrumented
with a dense ralngage network, slopes gradually upward from west to
east with the lowest and highest gages spaced about 15 miles and 1,400
feet in elevation apart. The lowest point on the watershed is about
4,000 feet; the highest about 6,300 feet.
28

TABLE 1. Number of runs obtained by the use of run test for stationarity on U. S. Weather Bureau
thunderstorm rainfall records in southeastern Arizona.
Gage Location
Benson
Bisbee
Bowie
Clifton
Douglas
Safford
Tombstone
Willcox
Annual Maximum 24-hour
Thunderstorm Rainfall
Mean
X
6
6
6
7
5
5
7
4
Mean Square
6
8
6
9
5
5
7
4
Summer Seasonal
Rainfall
Mean
X
6
6
3
7
8
5
8
6
Mean Square
6
6
4
7
8
5
6
6
9
10
7
10
9
8
10
8
3
3
3
3
3
3
3
3
1) Number of runs r such that P(R > r ] = .05 where R is random variable for number of runs.
2) Number of runs r such that P[R < r_] = .05.

A regression analysis was run on the Walnut Gulch data in
which average number of storms per year was regressed on elevation.
Statistically, according to Student's "t" test with an OC level
of 0.05, elevation and occurrence of significant storms were not
correlated. Furthermore, there was no suggestion of a significant
increase In storm occurrence for the gages closest to the Dragoon
Mountains. According to Student's "t" test, there was a correlation,
although poor, between elevation and occurrence of storm rainfall
greater than 1 inch. If the 3 gages at the lowest watershed elevations
were eliminated, there would have been no significant correlation.
Osborn, Lane, and Hundley (1972) found that mean summer rainfall was
significantly greater on the upper half of Walnut Gulch than on the
lower half. Also, analyses of records from 8, long-term (66 years
or more) USWB gages in southeastern Arizona indicate differences
In average summer rainfall and average maximum 24-hour rainfall
between stations at different elevations (Figure 6). Therefore, for
Walnut Gulch, an ergodic network for a range of 1,400 feet in
elevation between gages may be too much to assume. In this particular
case, records from gages located between 4,200 and 5,400 feet in
elevation might be considered ergodic. There is no evidence that
this restriction would be necessary for measuring or predicting major
runoff-producing thunderstorm rainfalls, but it could be significant,
as suggested above, in determining such things as average seasonal
rainfall.
INDEPENDENCE OF SAMPLING POINTS
Thunderstorm rainfall records from 64 gages at various spacings
on Walnut Gulch were examined to determine the minimum spacing for
which gage records can be considered independent. Independence of
records is necessary if they are to be combined as sample functions
of an ergodic process. To check for independence, both conditional
frequencies (estimates of conditional probabilities) and correlation
coefficients were examined.
Conditional frequencies of measuring individual thunderstorm
rainfall above thresholds of 1 and 2 inches were determined by tabulating
total number of occurrences above the thresholds for selected gages and
the number of simultaneous occurrences above these thresholds at other
gages. The ratios of simultaneous (during the same event) occurrences
to total occurrences gave the conditional frequencies (Figure 7). Thisrelation indicates that the conditional frequency asymptotically
approaches the unconditional frequencies as gage spacing increases.
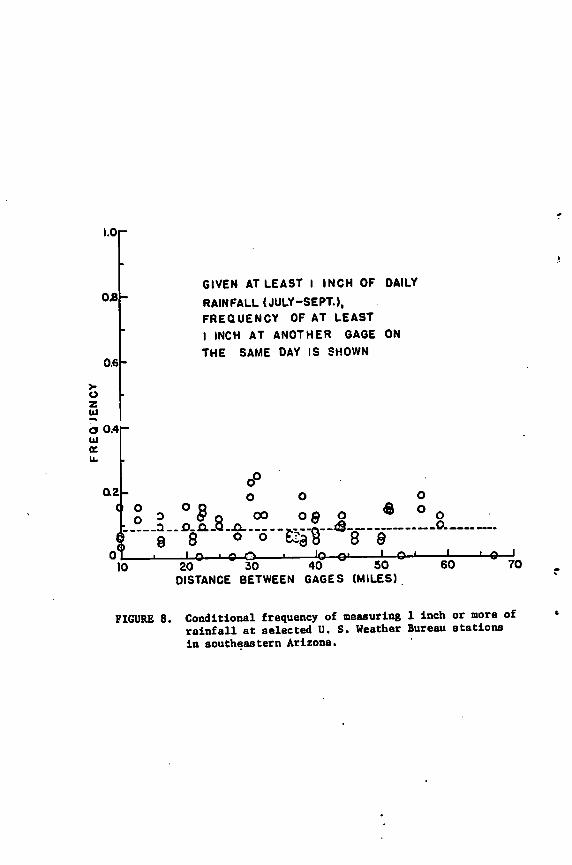
To further investigate conditional frequencies, 10 years of
summer rainfall records from 9 U.S. Weather Bureau standard raingages
in the general vicinity of Walnut Gulch with spacings ranging from
10 to 67 miles were examined. Several stations with relatively short
29

records were Included In this analysis to provide a denser network
of gages, while some long-term stations were excluded because of
spacing or because of missing records during the specific 10-year
period. Generally, USWB gages are considered to provide independent
rainfall measurements. Conditional frequencies were computed for
24-hour rainfall amounts in the same manner as for Walnut Gulch
gages, on the assumption that for southeastern Arizona during the
summer months 24-hour rainfall amounts essentially represent
individual storm amounts. Figure 8 shows conditional frequencies
plotted versus distance between gages. This plotting shows no
relation between conditional frequency of 24-hour thunderstorm rain
fall occurrence and distances between gages for spacings of 10 miles
and more. It supports the interpretation of Figure 7 that conditional
frequencies asymptotically approach the unconditional frequencies as
distance between gages Increases. Thus, paired gages for which
conditional and unconditional frequencies are essentially equal are
considered independent sampling points.
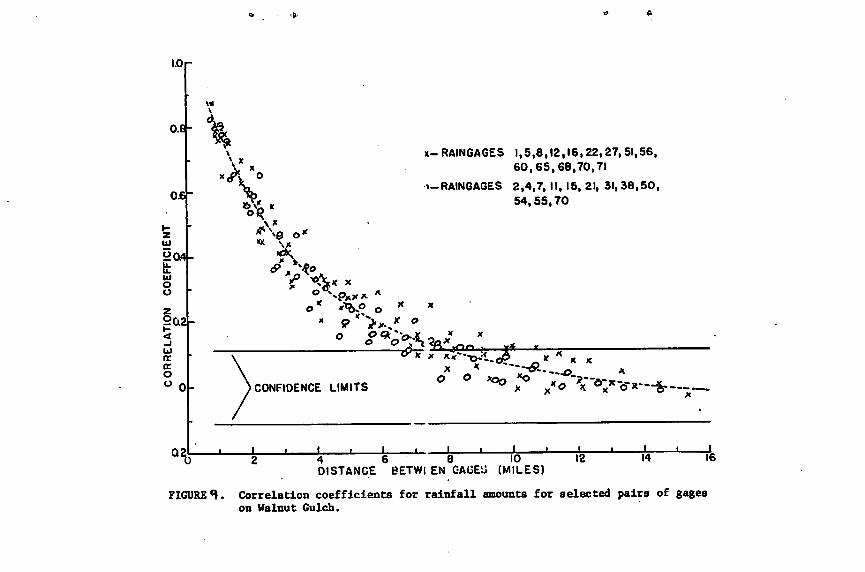
Correlation coefficients were computed for rainfall amounts
recorded during thunderstorms for sets of 12 and 14 gages for a
12-year record from Walnut Gulch. The gages were chosen to provide
as much variability in distances as possible without duplication and
without having to compare all 64 gages. About 320 storms occurred
during the 12-year record. Distance between the gages ranged from
0.5 to 14.5 miles. Figure 9 shows the relationship between correlation
coefficient (r) and distance between gages. The upper 95% confidence
limit for the null hypotheses that r = 0 was computed as 0.11 and
is shown on the graph.
These studies indicate that gages spaced approximately 8 miles
apart can be considered independent when air-mass thunderstorm rain
fall is measured. However, independence may be assumed with much
closer spacings for some purposes.
CONCLUSIONS
The following are major conclusions of this paper.
1) The hypothesis that sequences of annual maximum thunderstorm
rainfall and summer seasonal rainfall for southeastern Arizona can
be considered as stationary stochastic processes could not be re
jected by run tests for stationarity recommended by Bendat and Piersol
(1966).
2) Rainfall sequences that can be assumed stationary as
recorded by gages located between elevations 4,200 ft. and 5,400 ft.
on ASS Walnut Gulch Experimental Watershed may also be assumed ergodic.
3) Gages spaced approximately 8 miles apart on the rangeland
areas of southeastern Arizona can be considered independent when
air-mass thunderstorm rainfall is measured.
30

AVERAGESUMMER
RAINFALL(INCHES)
«*
nOB
5
AERAGE
MAX.24-HRSUMMER
RAINFALL(INCHES)
oel
o«2
p
(A 4
o >4 TO O
O
O
o en
n
o o r w
o at
PI
I
o
o CD
0)
O PI
o o a>ca II pi
o in an
pi
pi
O

1.0IX)
u
7.uj fi
aui
GIVEN I INCH OF RAIN ATANY GAGE , FREQUENCY
OF RECORDINGI INCH AT ANOTHER G* 3EDURING THE SAME EVENT
IS SHOWN.
.6
GIVEN 2 INCHES OF RAIN ATANY GAGE, FuECUENCY
OF RECORDING
2 INCHES AT ANOTHER GAGE
DURING THE SAME EVENTIS SHOWN.
4 6 8
BETWEEN GAGES {Ml ES)
10 "0 2DISTANCE BETWEEN GAGES (MILES)
FIGURE T Conditional frequency of measuring thunderstorm rainfall above thresholds of
1 and 2 inches.
i.or
0
0.6h
o
z111
O 0.4u
K
o°0.2
n 0
GIVEN AT LEAST I INCH OF DAILY
RAINFALL (JULY-SEPT.),
FREQUENCY OF AT LEAST
I INCH AT ANOTHER GAGE ON
THE SAME DAY IS SHOWN
f""Y 8 ° ° K3^ 8 8I_0__i_0_O i lO—C 1—©-1 ' ' 0 '
10 20 30 40 50 60 70
DISTANCE BETWEEN GAGES (MILES)
FIGURE 8. Conditional frequency of measuring 1 inch or more ofrainfall at selected U. S. Weather Bureau stations
in southeastern Arizona.
1.0r
04-
0.6"
l-z
tUJ
oo
rt
cr
o
V xx-RAINGAGES 1,5,8,12,16,22,27,51,56,
60,65,68,70,71
>-RAiNGAGES 2,4,7, It, 15, 21, 31,38,50,
54,55,70
► CONFIDENCE LIMITS "o»—h—-—
4 6 8 10
DISTANCE BETWI EN GAOEt; (MILES)
12 14
FIGURED. Correlation coefficients for rainfall amounts for selected pairs of gages
on Walnut Gulch.
REFERENCES CITED
Bendat, J. S. and A. G. Pleraol, Measurement and Analysis of Random
Data, 390 pp, John Wiley & Sons, New York, 1966.
Osborn, H. B. and R. B. Hlckok, Variability of Rainfall Affecting
Runoff from £ Semiarid Rangeland Watershed, Water Resources
Res., 4(1): 199-203, 1968.
Osborn, H. B., L. J. Lane, and J. F. Hundley, Optimum Gaging of
Thunderstorm Rainfall in Southeastern Arizona, Water Resources
Res., 8(1): 259-265, 1972.