integrated solid waste management in island...
TRANSCRIPT

Integrated Solid Waste Management in Island Regions


Integrated Solid Waste Management in Island Regions | 1
Integrated Solid Waste Management in Island Regions

INTEGRATED SOLID WASTE MANAGEMENT IN ISLAND REGIONSJanuary 2014
Program Directors
Lauren Spurrier Managing Director, Marine and Fisheries Program, WWF-US
Eliécer CruzEcoregional Director, WWF-Galápagos Program
AuthorsEng. Marcelo Castillo, External Advisor Ulf Torsten Hardter, Ph.D, Environnmental Management Officer, WWF Galapagos Program
Translation into EnglishPatricia Fierro, Lisa Kohn, Jeffrey Morrison and Joanne Welling
Final Translation and revisionJessica Gifford
EditionIrma Larrea Oña (WWF)
Final EditionUlf Torsten Hardter, Ph.D, Environnmental Management Officer, WWF Galapagos ProgramMaría Fernanda Burneo Sevilla, Communications, WWF Ecuador
Cover pictureSanta Cruz Island, Galápagos. © WWF / Jean Claude Constant
Layout and [email protected]
How to cite this publication:Castillo M. and Hardter U., (2014) Integrated Solid Waste Management in Island Regions.Ed. Irma Larrea Oña.WWF and Toyota, Galapagos-Ecuador, X pp
Copyright Nº 043126 © (2014) WWF. All rights reserved to WWF-Ecuador.ISBN 978-9942-924-02-5
Source must be cited in all cases. Parts of this publication cannot be reproduced without previous written permission if the source is cited. For the total reproduction of this document, WWF must be previously informed.
Published in Quito, Ecuador by WWF © 2014. All rights reserved for WWF.
Printed in FSC certified paper

Integrated Solid Waste Management in Island Regions | 3Integrated Solid Waste Management in Island Regions | 3
Table of Contents
INTRODUCTION 7
CHAPTER 1
INTEGRATED SOLID WASTE MANAGEMENT 111. Solid Waste Concepts 11
2. Integrated Solid Waste Management 13
3. Components of an Integrated Solid Waste Management 14
4. Integrated Solid Waste Management Hierarchy 16
5. Legal Aspects 17
CHAPTER 2
SOLID WASTE QUALITY AND QUANTITY STUDIES 191. Solid Waste Characterization Methods 20
2. Statistical Sampling Method 212.1 Mexican Standards for Solid Waste Sampling 22
2.1.1 Determination of Production per Capita 222.1.2 Quartering Method 262.1.3 Dimensional Weight 272.1.4 Classification of By-products 27
2.2 Simple Method of Waste Analysis 28
3. Total Weighing Method 30
CHAPTER 3
TIME AND MOTION ANALYSIS OF COLLECTION AND SWEEPING SERVICES 331. Definition of Sanitation System Management Indicators 34
2. Obtaining Information from Route Data Sheets 352.1 Obtaining Information from Collection Route Data Sheets 362.2 Obtaining Information from Sweeping Route Data Sheets 402.3 Obtaining Information from Final Disposal Route Data Sheets 43
3. Time and Motion Studies 453.1 Collection Times and Motions 453.2 Sweeping Time and Motion 48
CHAPTER 4
TEMPORARY STORAGE 531. Definition of Design Parameters for Temporary Storage 53
1.1 Dimensioning of Temporary Storage 531.2 Types of Storage Containers 551.3 Legal Issues Concerning Temporary Storage 57

4 | Integrated Solid Waste Management in Island Regions
CHAPTER 5
STREET AND BEACH SWEEPING 591. Definition of Cleanliness 59
2. Types of Sweeping 60
3. Dimensioning of Sweeping Operations 61
4. DDesign of Micro-Routes for Sweeping Operations 65
CHAPTER 6
WASTE COLLECTION AND TRANSPORTATION 691. Design Parameters for Solid Waste Collection Services 69
1.1 Amount of Garbage to Be Collected 711.2 Types of Waste to Be Collected 711.3 Frequency and Schedule of Services to Be Provided 721.4 Distances to be Travelled and Work Schedule 731.5 Types of Collection Equipment and Work Crews 73
2. Estimation of Loads and Design of Collection Services 76
3. Service Costs 83
CHAPTER 7
DISPOSAL OF GARBAGE 871. Processes That Occur Within a Landfill 88
2. Definitions of Landfills 90
3. Types of Landfill 91
4. Components of Landfills 93
5. Estimation of the Size of Landfill Components 95
6. Location of the Landfill 97
7. Landfill Design 997.1 Cell and Platform Design 997.2 Design for the Handling of Leachates 1017.3 Biogas Production and Handling 1047.4 Treatment of Leachates 105
8. Operation of Landfills 1078.1 Entrance to the Landfill Site 1098.2 Entrance to the Work Site 1098.3 Operation of Cells 1098.4 Pest Control 1148.5 Live Hedges and Enclosures of the Landfill 1148.6 Control Measures 1158.7 Maintenance 1158.8 Training 115

Integrated Solid Waste Management in Island Regions | 5Integrated Solid Waste Management in Island Regions | 5
CHAPTER 8
MINIMIZATION OF SOLID WASTE 1171. Principles and Strategies 118
CHAPTER 9
USE OF SOLID WASTE 1231. Reuse of Solid Waste 1232. Recycling 1243. Characteristics of Waste 1254. Manual Materials Sorting Systems 1285. Mechanized Material Sorting Systems 1286. Dimensioning of Materials Sorting 131
CHAPTER 10
TREATMENT OF ORGANIC WASTE 1371. Composting 139
1.1 Composting Process and Dimensioning 139
CHAPTER 11
INTERNATIONAL CONVENTION FOR THE PREVENTION OF SEA POLLUTION FROM SHIPPING 1471. Objective and Structure of the MARPOL International Convention 148
2. MARPOL Appendix V: Garbage Pollution 148
CHAPTER 12
WASTE MANAGEMENT ON OCEANIC ISLANDS: THE CASE OF THE GALÁPAGOS ISLANDS 1511. Case Study: Integrated Solid Waste Management System on Santa Cruz Island, Galápagos, Ecuador 153
1.1 Classification of Solid Waste on Santa Cruz Island 1571.2 Temporary Solid Waste Storage on Santa Cruz Island 1591.3 Waste Collection on Santa Cruz Island 1611.4 Street Sweeping on Santa Cruz Island 1641.5 Fabricio Valverde Recycling Center 166
1.5.1 Recycling Area 1661.5.2 Composting Area 168
1.6 Final Waste Disposal 1691.6.1 Characteristics of the Santa Cruz Sanitary Landfill 171
1.7 Awareness Campaign on Recycling Practices on Santa Cruz Island 1741.8 Lessons Learned on Santa Cruz Island 175
1.8.1 Sustainability 176
BIBLIOGRAPHY 179LIST OF TABLES 182LIST OF FIGURES 183ACRONYMS 184


Integrated Solid Waste Management in Island Regions | 7
For several years now, WWF has been carrying out a series of projects to advance education about renewable energy. Additionally, it has supported a comprehensive waste management plan and an oil collection and reuse initiative, among other projects, to improve environmental conditions in the Galápagos Islands.
With support from Toyota, WWF has worked with the municipality of Santa Cruz since 2006 to improve the island’s integrated solid waste management and recycling system by donating different colored containers for waste separation; hiring a waste management specialist and an environmental management expert to advise the municipality; and developing an educational campaign on recycling practices. Moreover, WWF provided technical assistance in 2008 to strengthen waste management in Santa Cruz, through the donation of a garbage compactor truck, a truck scale and its required accessories, and a mechanical composter. It has also supported other waste management and recycling activities on the islands of San Cristobal and Isabela.
Together with Toyota, WWF commissioned a series of surveys, feasibility studies, environmental impact assessments, and landfill designs and blueprints to assist in the transition towards a comprehensive and sustainable waste management in the Galápagos Islands. In March 2010, WWF and Toyota co-produced a document entitled “Waste Management Blueprint for the Galápagos Islands”. This paper was prepared as a tool to guide island municipalities in achieving technical, financial, and social sustainability for a complete and efficient collection of all types of waste through effective waste minimization programs in order to significantly reduce the amounts of waste generated. Such programs included: 1) removing waste at the source; 2) improving current recycling practices; and 3) developing options for the recycling, treatment, and disposal of other types of waste.
© W
WF/
Jean
Cla
ude
Con
stan
t
Introduction

WWF and Toyota’s vision is that by year 2020, an integrated waste management and recycling system will be implemented in all of the inhabited islands of the Galápagos. The system will ensure an efficient and comprehensive collection of all kinds of waste, with significant reductions in the quantities of waste generated through effective waste minimization programs, including elimination of waste at the source, improvement of current recycling activities, and the development of recycling, disposal, and treatment options for other types of waste.
WWF and Toyota’s hope is that this document will be a means of disseminating the concepts and methodologies of the various components of a solid waste management system in order to share the experiences gained on Santa Cruz Island as a practical example that can be replicated in other island regions.
OBJECTIVE
The overall objective of this document is to contribute to proper solid waste management in island regions by offering expertise and methods for handling waste in its different phases. It is aimed at decision makers and technical experts responsible for waste management in island regions.
It is expected that the use of the Santa Cruz Island case study in the Galápagos archipelago will lead to an improvement in the waste management of other island locations from basic or conventional to integrated, covering all phases from waste generation control to sorting, storage, collection, transport, sweeping, treatment, and final disposal, as adapted to the particular conditions of the island region.
TARGET AUDIENCE
This document is aimed at populations in island regions or territories, especially those living on small islands in developing countries that usually lack technical and economic resources to implement proper solid waste management. This situation is usually accompanied by environmental degradation of land areas, which are generally noted for their unique biodiversity and rich landscapes.
Islands are land masses that rise above the surface of waterbodies, such as oceans, lakes, and rivers, and are completely surrounded by water. Although the size of islands varies greatly, the potential users of this document will be inhabitants of islands that have populations of up to 50,000, regardless of the islands’ physical size.
8 | Introduction

Integrated Solid Waste Management in Island Regions | 9
Islands and archipelagos in the tropics tend to enjoy an abundant and unique biodiversity that is extremely vulnerable and threatened by human activities. This is the case because island populations require natural resources for their survival and development (which in most cases is not necessarily sustainable). They are constantly generating emissions, effluents, and waste that require proper management to avoid damaging the islands’ environment.
The issue of space is especially critical on small inhabited islands because all activities must be carried out efficiently in relation to the land needed in order to meet the demand for future urban growth, facility and supply areas, protected areas or nature reserves, and areas destined for sewage treatment and solid waste disposal. A look at actual conditions in developing countries reveals disorganized land-use planning, a lack of zoning criteria, an absence of liquid effluent treatment systems, and the widespread use of open-air dumpsites as the final destination for generated waste, which degrades the environment and can have harmful effects on human health.
Another major issue in island regions that impacts the lives of island dwellers is the availability of freshwater in the necessary quantities and quality for human consumption. In this regard, and depending on the geological formation of the island region,1 the presence of contaminants (e.g., sewage discharge, garbage, or leachates produced by the degradation of organic waste in landfills) affects to varying degrees the ability to obtain freshwater and, in certain cases, makes it unsuitable for human consumption.
Other problems are posed by endemic and introduced species that feed on waste at dumpsites, becoming vectors of contamination, as well as the uncontrolled burning of waste, which has adverse environmental impacts.
Last but not least, insufficient collection and sweeping services result in significant amounts of solid waste littering the streets and ending up in vacant lots, natural ground depressions, and even the sea and surrounding water bodies, with corresponding negative consequences for the environment.
1 Islands may be of continental, volcanic, coral, sedimentary, or fluvial origin. Generally, inhabited islands belong to the continental and volcanic types


Integrated Solid Waste Management in Island Regions | 11
CHAPTER 1
Integrated Solid Waste Management
1. Solid Waste ConceptsWaste is defined as materials that are discarded by their owners in a solid, semisolid, liquid, or contained gas state, and can be subjected to treatment or final disposal in accordance with the environmental regulations of each country or region (GTZ, 2006).
Waste is commonly generated in varying amounts and with diverse characteristics in all human activities and poses a wide range of risks to human health and the environment.
There are different ways to classify solid waste:• Source• Physical, chemical, and biological characteristics• Amount generated• Level of risk
Waste may be classified according to its source, for example domestic, industrial, hospital, construction, commercial, etc. The source of waste generally determines its physical, chemical, and biological characteristics and, thus, its risk level and method of handling. In addition, certain processes generate waste that, insofar as its origin and composition are concerned, would not normally require particular care but which may pose problems and need special management due to the large amounts generated.
In general, urban solid waste (USW) refers to waste generated in homes, offices, markets, restaurants, and similar settings. One definition of the term says that it is:
… generated in dwellings, results from the disposal of materials used in their domestic activities and the products they consume, along with their containers, packing or packaging; the waste that comes from any other
© W
WF/
Jean
Cla
ude
Con
stan
t

activity inside establishments or in public thoroughfares which generates waste with household characteristics, and that which results from sanitation of streets, roads, and public places. (General Congress of United Mexican States, 2003)
Other types of solid waste that may require special handling “are those generated in production processes that do not possess all the characteristics to be considered hazardous or municipal solid waste, or that are produced by large generators of municipal solid waste” (Ibid.). Within this type of waste we find:
• Debris• Sewage treatment plant sludge, not containing hazardous substances• Non-hazardous waste from industrial processes• Non-hazardous waste generated in large quantities; for example, more
than ten tons/year
Wastes considered hazardous are those that possess one or more of the following characteristics:
• Corrosive• Reactive• Explosive• Toxic• Inflammable• Bio-hazardous
The acronym CRETIB, made up of the first letter of each characteristic in the above list, is used for ease of recall (Ibid.). These types of waste require special handling at all stages.
12 | CHAPTER 1 | Integrated Solid Waste Management
Figure 1 Waste Generators
Markets
Restaurants Hospitals
Institutions Household City
S O L I D W A S T EHouseholdsIndustries
Industry Parks, beaches Schools

Integrated Solid Waste Management in Island Regions | 13
Storage
Separation
Presentation
Generation
Users Urban Sanitat ion Publ ic Service
Basic activities of an urban solid waste management system
Complementary activities
Transport* Direct* Transfer
Final disposalSanitary landfill* Heavy equipment* Manual
Use* Re-use* Recycling* Use for construction
Tratamiento* Compost* Vermiculture* Incineration
Sweeping
Collection
2. Integrated Solid Waste ManagementIntegrated solid waste management (ISWM) is a term used in recent years that is often misunderstood, since it is generally associated with recycling initiatives incorporated into a conventional sanitation system. It actually refers to an articulation of the various components of a sanitation service using a holistic point of view.
Figure 2 shows the design of an integrated solid waste management system incorporated into a basic management system (Jaramillo, 2002).
Figure 2 Integrated Municipal Solid Waste Management
A widely used concept describes Integrated Urban Solid Waste Management as:
… a full range of activities involving generation control, separation, storage, collection, transport, sweeping, treatment, and final disposal to ensure that (1) they are in keeping with the best principles of public health, economics, engineering, aesthetics, and other environmental considerations, and that (2) they fulfill public expectations. (Ibid.)
Another concept states that:
Integrated Waste Management is the articulated and interrelated set of regulatory, operational, financial, planning, administrative, social, educational, monitoring, supervisory, and evaluative actions for the management of waste, from its generation to its final disposal, to achieve environmental benefits, the financial optimization of its management, and its social acceptance, responding to the needs and circumstances of each area or region. (General Congress of the United Mexican States, 2003)

The above concepts show the holistic approach to the different components of a sanitation service, which are aimed at such eminent goals as preventing harm to human health, protecting the environment, social acceptance, and financial savings. These objectives should be developed through user-community participation into processes adapted to the specific conditions of each area, bearing in mind local strengths and weaknesses.
3. Components of an Integrated Solid Waste Management
A basic sanitation system is one that includes the following components:• Waste storage• Collection services• Sweeping services• Transportation• Final disposal
Many countries and areas can be described as having implemented an operational basic sanitation system. However, it is also true in most cases in developing regions that these systems are plagued by a number of problems, such as a lack of technical criteria in decision-making and insufficient coverage due to poor work equipment performance. This increases service costs, which are usually borne by local governments. In some locations, for instance, optimization of collection services has created savings that have enabled the construction of landfills or other sanitation system components. Another problem, perhaps even more crucial, is widespread final disposal in open dumps without any kind of infrastructure or technical handling.
Moving to an ISWM therefore represents a qualitative and quantitative leap in the implementation of rational solid waste operations through new actions, such as:
• Standards that support the performance and sustainability of the new system
• Optimization of the operational aspects of all service components• Financial issues of cost recovery• Proper planning and management of the new system• Inclusion of social aspects by incorporating the community as a key
player in service operation and sustainability
14 | CHAPTER 1 | Integrated Solid Waste Management

Integrated Solid Waste Management in Island Regions | 15
In turn, new sanitation service components may be incorporated, depending on the situation in each area. For example:
• Waste generation control and minimization• Waste separation at the source in keeping with a separated waste
collection system• Presentation of solid waste in storage containers as required by current
technical standards and according to a collection service schedule• Separated waste collection• Transfer, to reduce transportation costs, if required• Implementation of solid waste utilization systems that separate and
recycle materials for subsequent processing, which can then be used as raw material in production processes and as building materials
• Treatment of organic waste, to improve soils through composting or vermiculture systems
• A landfill with all the necessary infrastructure and operational components and in compliance with all legal requirements of each region and country, since appropriate final disposal is a sine qua non of ISWM
The foregoing is summarized in Table 1, which deals with the optimal ISWM components.
Table 1 Optimal ISWM Characteristics
COMPONENT OPTIMAL CHARACTERISTICS
Generation Policies and rules exist that promote waste minimization, such as product packaging standards, and incentives for reuse of packaging and containers and their application by the population.
Operational The different components of the sanitation service are properly planned and technically designed, enabling equipment and human resource to be optimized. They are easily implemented and controlled with cooperation from citizens.
Social Citizens are informed of and involved in proper USW management, and they take part actively, from separation at source to payment of the fees required for the service’s financial sustainability.
Commercial There is an up-to-date service registry, proper definition of fees and charges to cover the actual service costs, and a proper billing and collection system.
Administrative A competent management system exists, with efficient staff and customer service, as well as technical planning and service administration, all focused on optimizing costs and providing quality services.
Financial Cost management systems for service components and indicators that yield the lowest costs have been implemented, as reflected in the rates paid by the user community.
Health and Environmental There is compliance with local and national regulations in health and environmental matters, both with respect to the occupational health of sanitation workers and to environmental management plans and licensing requirements for each service component.
Legal There are updated regulations that legally underpin the service components and are consistent with the regional and national legal framework.
DES
IRAB
LE
Avoid
Minimize
Recover
Process and treat
Sanitary landfill
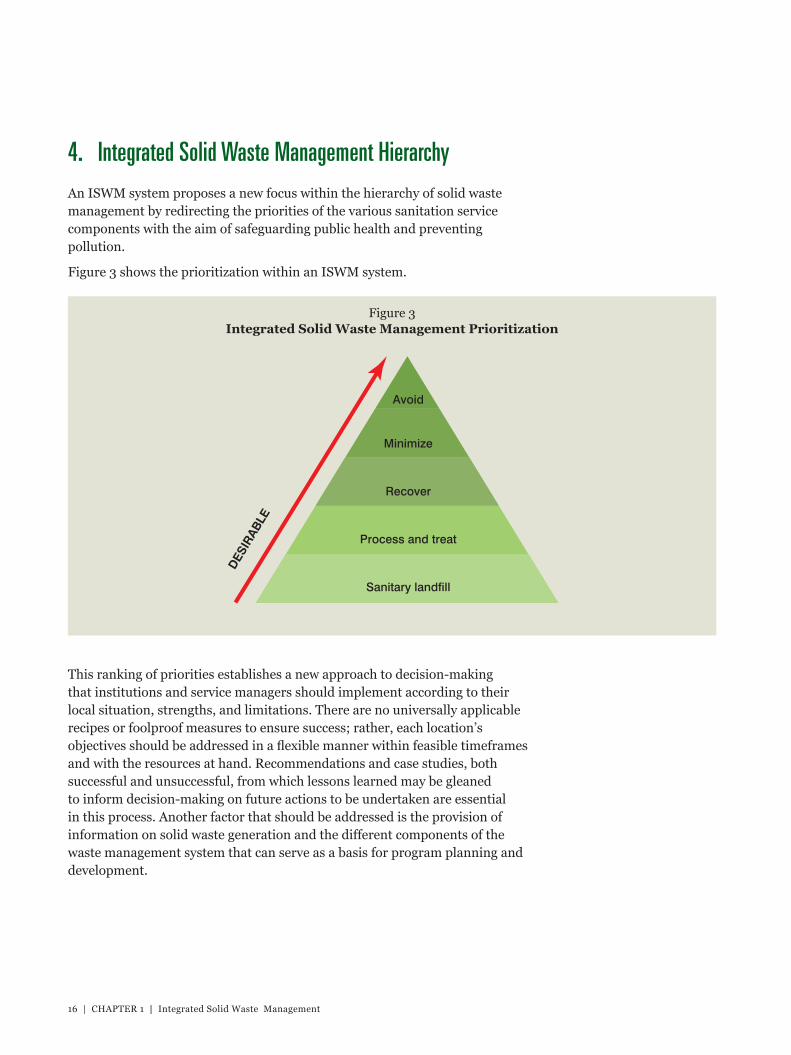
Figure 3 Integrated Solid Waste Management Prioritization
16 | CHAPTER 1 | Integrated Solid Waste Management
4. Integrated Solid Waste Management HierarchyAn ISWM system proposes a new focus within the hierarchy of solid waste management by redirecting the priorities of the various sanitation service components with the aim of safeguarding public health and preventing pollution.
Figure 3 shows the prioritization within an ISWM system.
This ranking of priorities establishes a new approach to decision-making that institutions and service managers should implement according to their local situation, strengths, and limitations. There are no universally applicable recipes or foolproof measures to ensure success; rather, each location’s objectives should be addressed in a flexible manner within feasible timeframes and with the resources at hand. Recommendations and case studies, both successful and unsuccessful, from which lessons learned may be gleaned to inform decision-making on future actions to be undertaken are essential in this process. Another factor that should be addressed is the provision of information on solid waste generation and the different components of the waste management system that can serve as a basis for program planning and development.

Integrated Solid Waste Management in Island Regions | 17
5. Legal AspectsThe legal framework for implementing the various service components of a sanitation system is best gathered into a single body of law. This is of fundamental importance for the operation and support of a sanitation system. Among other things, it should contain the following aspects:
• Compatibility of the local legal framework with higher-level bodies of law• A set of guiding principles for service delivery, such as the universality
of coverage, the sanitation institution’s commitment to ongoing environmental management in accordance with the law and applicable regulations, the pursuit of financial self-sustainability, and so on
• Definition of roles and responsibilities, specifying key actors, the role they perform, and their rights and obligations within the sanitation service
• Specification of service components, including modes of operation, types of containers to be used, frequencies, schedules, etc.
• Definition of the types and severity of law infringement; application of penalties for noncompliance and incentives for the application of good service practices
• Definition of sanitation service rates along with a proposal for establishing a method for automatic adjustment, such as price-adjustment formulas, a consumer price index, or salary tables, so that they are continually updated
Ordinances and local laws provide legal support for a sanitation system’s operation. Special attention should be given to pricing and rates, which must be set on the basis of actual service costs and provide for the service’s financial sustainability.


Integrated Solid Waste Management in Island Regions | 19
CHAPTER 2
Solid Waste Quality and Quantity Studies
Different countries and cities within a country do not generate the same types and amounts of solid waste. Similarly, variations exist within population centers at different times of the year. These differences depend on the varying habits of communities, economic activities and policies, the weather, seasons, eating habits, and other local conditions that change season by season, and year by year. Nevertheless, certain parameters can be identified. These are basic for the system and provide crucial information, for example:
• Knowing approximately how much solid waste each service user generates allows the required volume of household storage containers to be determined, based on the frequency of service. It also makes it possible to determine the size of the vehicle fleet needed to serve those users and to estimate the size of the treatment system and the area required for solid waste disposal.
• In the case of medium and large generators, such as markets, shopping centers, etc., knowing the amount of waste they generate is equally important for the design of waste storage containers and the vehicles that will transport their waste to the treatment site or landfill.
• Determining the composition of waste and its main characteristics, such as humidity, apparent weight, and calorific value, can provide the parameters for deciding what and how much can be recycled or composted, as well as measures to be taken into account at the landfill.
© W
WF/
Jean
Cla
ude
Con
stan
t

It is essential to understand design parameters like the amount and composition of solid waste to provide adequate service. Thus, a number of methods have been developed that are generally referred to as solid waste characterization, sampling, or quality and quantity studies.
It is important to define the objectives of sampling or characterization analyses using the most appropriate method according to the type of information to be obtained in each case. Human and financial resources available must also be taken into account, since they will be limiting factors in conducting such studies.
1. Solid Waste Characterization MethodsAmong the main methods for obtaining the basic parameters of solid waste characterization are the following (Runfolaet al., 2009):
a. Statistical sampling method: This method randomly selects a certain number of samples, depending on the desired level of sampling reliability, over a period of several days or up to a week. The weight generated per sample and a sample’s average representative of the analyzed sector is then determined. Statistical sampling also allows waste composition and dimensional weight to be determined.
b. Total waste weighing method: This method determines the total amount of waste generated and estimates values for each type of user, provided there is separate collection per type of waste producer (e.g., markets, industries, etc.). This approach systematizes the weighing records of scales installed at transfer stations and landfills. It requires accurate knowledge of the areas served and of the current population size, so it must go hand in hand with a study of the collection routes.
c. Mass balance method: This method provides quantitative and qualitative data on inputs (raw materials, water, energy, etc.), the products obtained, and the waste generated by a process or service. The general principle behind this analysis is that all inputs to a process or operation end up either as products or as waste (National Environmental Commission of Chile, 2005).
20 | CHAPTER 2 | Solid Waste Quality and Quantity Studies

Integrated Solid Waste Management in Island Regions | 21
OUTPUTSINPUTS
Productsmass
Residuesmass
Otherproducts
mass
Unit Operation
Figure 4 Mass Balance
As shown in Figure 4, the mass balance method is quite accurate and generally considered reliable but also requires a lot of information. It is sometimes impossible to obtain most of the information in the case of the variables involved in a solid waste management process, making the mass balance method more applicable to industrial processes.
Other methods have been developed for specific cases in which it is necessary to determine the flow of a particular type of waste. Researchers have developed even more methods for case studies in a number of cities. In this document the first two methods mentioned will be analyzed.
2. Statistical Sampling MethodThis characterization method is commonly used at the regional level, since it relies on the availability of personnel for weighing and sorting processes. There are two models for this approach. The first was brought into effect through Mexican law and is included in the country’s current technical standards developed in 1985 by the Department of Urban Development and Ecology (Secretaría de Desarrollo Urbano y Ecología, or SEDUE in Spanish).
The second, called Simple Method of Analysis of Solid Waste, was developed by Dr. Kunitoshi Sakurai and published in Spanish in 1983 by the Center for Sanitary Engineering and Environmental Sciences (Centro Panamericano de Ingeniería Sanitara y Ciencias del Ambiente, or CEPIS in Spanish) of the Pan American Health Organization (PAHO).
Since these are the two most commonly applied methods, they are described below along with a description of the experience gained on Santa Cruz Island in Galápagos, Ecuador, as a case study.

HOUSEHOLDS
Lower stratum
Market
Upper stratum
Hotel
Middle stratum
Hospital
School
2.1. Mexican Standards for Solid Waste Sampling
This method is described in detail in the following Mexican technical standards:
• NMX-AA061-1985, regulates the procedure for obtaining the production per capita (PPC), measured in kg/person/day
• NMX-AA015-1985, outlines the sample preparation through the quartering method for byproduct classification analysis, dimensional weight, and sampling for solid waste chemical analysis
• NMX-AA019-1985, deals with the method for determining the dimensional weight of waste
• NMX-AA022-1985, determines byproducts
The following is a summary of the procedures prescribed by the aforementioned standards.
2.1.1. Determination of Production per Capita
a) Pinpointing areas for sampling
The major solid waste generators and socioeconomic groups should be pinpointed on a city map. An example of this is shown in Figure 5.
Figure 5 Example of Location of Groups and Major Generators
22 | CHAPTER 2 | Solid Waste Quality and Quantity Studies

Integrated Solid Waste Management in Island Regions | 23
It should be noted that it would be necessary to sample several neighborhoods or sectors from the same socioeconomic group to measure the representative average amount of generated waste. Therefore, in some cases such as small towns, the process may be simplified by assuming a single social group for the whole area under study.
b) Defining sample size
The sampling risk to be obtained should be determined for each group, since:
100% = Reliability + Sampling Risk
That is, the greater the risk (∞), the lower the reliability of results. In turn, for greater reliability, a larger number of samples must be taken, which in turn leads to higher sampling costs.
According to standard NMX-AA061-1985, n number of samples must be taken as a reference, as Table 2 demonstrates.
Table 2 Size of the Pre-Sample
RISK(∞) SIZEOFTHEPRE-SAMPLE(n)
5% 115
10% 80
20% 50
For example, a pre-sample of 80 units would be needed for a study requiring 90% reliability (∞ = 10%). Generally, additional samples are gathered in the field as a safety precaution since some may be lost during the sampling period, thus affecting the reliability of the study. At the end of this part of the study, a reliability check is carried out based on the number of valid samples obtained.
c) Defining sampling locations
Once the number of samples to be taken is determined, they are placed within the entire work area. For this, all the city blocks in the study area must be numbered and selected at random, which can be done using a table of random numbers, a raffle system, or a spreadsheet random number generator.
Once the blocks are selected, one house is singled out for study.

d) Surveying and sampling
Once the samples have been pinpointed on the work map, the field phase begins with an interview of the residents at the randomly selected house. The reason for the study is explained, and their collaboration is requested for the sampling period. This interview is generally used to conduct a survey on the status of the service and on other issues that may be relevant to its improvement. A key part of the survey is determining the number of people in the household and identifying which household members generate what waste.
Mexican regulations recommend a seven-day sampling period of the household’s activities.
As illustrated in Table 3, day two’s sample is discarded to ensure that the waste to be weighed the following day is only that of a single day. Thus, weighing actually begins on day three. A 0.70 x 0.50 m plastic bag is provided daily from day one to day six for the household to dispose of their waste. It is important to emphasize cooperation during the sampling period to make sure that the garbage bags are not delivered to the regular garbage truck. A sample collection schedule should be set up that is acceptable for the interviewee.
The weight of the bag (using scales for up to ten kilograms with a precision of one gram) is recorded during the sampling period, at the end of which the household’s average waste generation is determined and then divided by the number of people living in the house to obtain the representative kg/person/day amount of that sample.
Figure 6 Example of Random Block Selection
24 | CHAPTER 2 | Solid Waste Quality and Quantity Studies

Integrated Solid Waste Management in Island Regions | 25
e) Information processing and reliability verification
Mexican standard NMX-AA061-1985 specifies in detail the statistical analy-sis done on the PPC data from each household, starting with the rejection of the highest and lowest amounts obtained because they may distort the representative average amounts for the sample. For this, the Dixon rejection criterion is used, which examines and rejects both high and low outliers.
The remaining valid amounts are taken into account to obtain the sample mean value, and the actual sample size is verified for the desired reliability. The Student’s t-Test is used for this. The expression used for this calculation is:
Where:
n1 = Actual number of samplest = Percentile of Student’s t-distribution, obtained from tables
based on sampling reliabilityS = Standard deviation of valid samples (standard deviation
measures how much the data varies from the sample mean)
E = Assumed sampling error of between 0.4 and 0.7 kg /person/day
By comparing the actual amount of the samples taken for the desired reliability (n1) with the size of the pre-sample (n), the following can be determined:
• If n1 = n, then the size of the pre-sample is accepted and no more samples are needed to achieve the desired reliability.
• If n1 < n, the reliability of the sample can be raised to a higher value than initially expected, so no additional field samples are required.
• If n1> n, more field samples are needed to achieve the desired reliability, until n is at least equal to n1.
Table 3 Sampling Activity Table
ACTIVITY DAY 1 DAY 2 DAY 3 DAY 4 DAY 5 DAY 6 DAY 7 DAY 8 DAY 9
INTERVIEW AND BAG DELIVERY X
ELIMINATION OF THE SAMPLE X
WEIGHING THE SAMPLE AND QUARTERING X X X X X X X
n1 = t x S )2( E

A B
CD
Finally, in order to determine if the sample mean is similar to the average of the group under study, the Mexican standard uses the null hypothesis method. There are a number of spreadsheet tools that facilitate the processing of the information obtained from the samples.
2.1.2 Quartering MethodAfter weighing the plastic bags containing the samples from selected households, standard NMX-AA015-1985 is applied to carry out the quartering method.
This method basically consists of preparing samples for the rest of the assays to be performed. The standard recommends the use of a roofed site with adequate ventilation and a floor covering to prevent sample contamination.
Once the bags have been weighed and the weight recorded on the field forms, they are transported to the quartering site, where they are opened and the solid waste is mixed together into one pile, which is then separated into four parts. The dimensional weight is then determined using opposite parts A and C, and the classification of byproducts is determined using opposite parts B and D.
Figure 7 Quartering of Samples
26 | CHAPTER 2 | Solid Waste Quality and Quantity Studies

Integrated Solid Waste Management in Island Regions | 27
2.1.3. Dimensional WeightThe dimensional weight of solid waste represents the weight per unit of volume. This is a very useful parameter to determine volume based on weight, and vice versa. Standard NMX-AA019-1985 is used for this determination.
As specified in the standard, a container with a known volume is required for this purpose. The container is filled to the top with uncompacted waste. It is then dropped to the floor three times from a height of about ten centimeters, after which it is refilled to the brim without pressing down on the contents. After this, the weight of the container, both empty and filled with waste, is recorded. The formula for this calculation is:
Where:
Dw = Dimensional weight ‘in situ’ in kg/m3
W = Net weight (total weight minus weight of the container) in kg
V = Volume of container in m3
2.1.4. Classification of By-productsThe classification of byproducts enables the different components of solid waste to be quantified by weight. This is the purpose of the parts selected in the abovementioned quartering method, which must provide a minimum weight of fifty kilograms per sample. A manual classification of the byproducts and materials present in the waste is performed. According to standard NMX-AA022-1985, the material classification list is as follows.
• Cotton• Cardboard• Leather• Fine waste (all material that passes through a 1 centimeter mesh)• Waxed carton• Tough plant fiber (sclerenchyma)• Synthetic fibers• Bone• Rubber• Tin• Earthenware and ceramics• Wood• Building material• Ferrous material• Nonferrous material• Paper• Disposable diapers• Rigid plastic and plastic film• Polyurethane
Dw = WV

• Expanded polystyrene• Food and garden waste• Cloth• High temperature glass• Clear glass• Others
A sieve with an area of one squared meter and a mesh of one centimeter is used to separate fine elements. Once the materials are separated, they are weighed on top loading balances with a twenty kilogram capacity and sensitivity of one gram. Then each material’s percentage share in the sample is calculated by means of the expression:
Where:
Pb = Percentage of the byproduct concernedGb = Weight in kg of the byproduct concernedP = Total weight of the sample (minimum 50 kg)
It should be noted that once the different percentages of the byproducts have been added, the result must be at least 98% of the total weight of the sample (G). Otherwise, the assay must be repeated.
2.2. Simple Method of Waste Analysis
This simplified method developed by Dr. Kunitoshi Sakurai presents tables for determining the number of samples to be taken from each socioeconomic group based on the reliability and sampling error assumed (Sakurai, 2000).
Dr. Sakurai proposed the following expression for calculating the number of samples:
Where:
n = Number of samples taken randomly from the group in question
V = Standard deviation of variables xi (xi: PPC of home in g/person/day)
E = Allowable error in the PPC determination (g/person/day)
N = Total number of homes in the group under study
Pb _ Gb = 100G
n = V 2
E 2 + V 2
1.96 N
28 | CHAPTER 2 | Solid Waste Quality and Quantity Studies

Integrated Solid Waste Management in Island Regions | 29
Final pile
Initial pile
1/4
1/4
1/4
1/41/4
1/4
Figure 8 Selection of the Final Pile for the Sample
• Sort out the following materials:- Paper and cardboard- Rags- Wood and foliage- Food scraps- Plastic, rubber, and leather- Metals- Glass- Soil and others
If there have been no prior PPC studies, Dr. Sakurai recommends assuming E to be 200 g/person/day; the standard deviation V to be between 50 and 250 g/person/day. The higher the standard deviation, the higher the number of samples needed.
To obtain the total production per capita, a weighted average is established that takes into account the weight of the waste generated and the number of users in each of the groups sampled.
For the determination of the dimensional weight or density of the waste, Dr. Sakurai establishes a method similar to the Mexican standard for handling loose waste. He then outlines the steps to be followed for newly compacted waste and for stabilized waste in the landfill.
To determine byproducts or physical composition, he suggests the following procedure:
• Take a sample of approximately one cubic meter and spread it into a pile on a paved surface
• Break open the plastic bags and cut cardboard and wood to a size of approximately 15 x 15 cm
• Mix the entire sample, divide it into four parts, choose two opposite parts, and separate them to obtain a sample of approximately fifty kilograms, as in Figure 8

Figure 9 Example of a Sampling Area
Finally, the separated waste is weighed to obtain the percentage of the total that each material represents. Dr. Sakurai also recommends procedures for obtaining the humidity value of solid waste and its calorific value.
3. Total Weighing MethodThis method requires a truck weighing facility and, preferably, historical data that enables greater certainty of the amounts of waste obtained. In the case of small towns in which there are no weighing facilities, the alternative would be to go to private companies that have truck-weighing facilities.
Weighing should be conducted for at least one week to obtain representative amounts. The area served by each collection route should be marked off on the field-prepared route layout. It is essential to know the population in the sector or at least its current population density.
30 | CHAPTER 2 | Solid Waste Quality and Quantity Studies

Integrated Solid Waste Management in Island Regions | 31
The calculation is performed as follows.
Where:ppc = Production per capita of the sector in kg/person/dayW = Average weight collected daily in kg/dayP = Population of the sector served by this route
To obtain data on population density, the calculation would be:
Where:ppc = Production per capita of the sector in kg/capita/dayW = Average weight collected daily in kg/dayPd = Population density in persons per hectareA = Area served in hectares
Dr. Sakurai‘s method may be used to classify byproducts or physical composition by obtaining a significant sample of fifty kilograms, as indicated.
ppc = WP
ppc = W
Pd x A


Integrated Solid Waste Management in Island Regions | 33
CHAPTER 3
Time and Motion Analysis of Collection and Sweeping Services
Understanding and applying indicators for sweeping and collection aspects of waste management is important when designing an ISWM system. These indicators are crucial because collection and sweeping costs generally represent between seventy and eighty percent of overall sanitation service costs. It is thus essential to employ an easily implemented and integrated system of SWM indicators that enables decision-makers to act opportunely and efficiently to sustain service quality standards and environmental protection measures while providing service planners with design and operational control parameters.
The axiom, “To know what to do, you have to know what is going on.” Within most agencies responsible for solid waste management, workers may have differing perceptions or ideas of how their sanitation systems function, but these may be misguided or untrue.
For instance, the manager of an SWM system should have the following information at his or her disposal:
• Coverage of the collection service• Cost per ton collected• Sweeping output• Number and type of users• Other pertinent statistics
Therefore, a manager must know how to obtain information and how to calculate and interpret certain indicators that reflect the actual situation of the service. One of the most appropriate ways to discover the real operational circumstances of a production process is to apply yardstick of efficiency indicators to the activities performed. If this is not possible, a statistical
© W
WF
/ Die
go A
ñazc
o

system of applicable average figures that enable numerically visualizing of what’s going on should at least be in place.
An indicator is a measurement that represents the state of affairs in a particular process or activity. Innumerable indicators have been developed to assess or index the manifold activities carried out in different fields of human endeavors. The following are examples of various types of indicators applicable to the subject of solid waste management:
• Quality and quantity indicators• Coverage indicators• Efficiency indicators• Cost indicators• Staff attitude indicators
1. Definition of Sanitation System Management Indicators
It is important to note that the proposed system of indicators will not, in and of itself, automatically change or improve the management of municipal sanitation systems. Nevertheless, it is a tool that enables system managers to know what is really going on within their systems’ components. By understanding their services, decision-makers can adopt alternatives to optimize, change, rethink, and, above all, try to achieve technical and economic sustainability for their systems, or to switch to other management models that are better suited to their interests and those of the communities they serve.
Management improvement depends on the political will of decision-makers to change or implement strategies based on real management data available in an ongoing and timely manner.
The most widely used indicators for sanitation services are presented below.
a) Collection and route indicators:NT: Number of tripsOLW: Official length of work day (shift)ALW: Actual length of work dayPPW: Productive percentage of work in the work dayPT(t): Productive time per tripPT(r): Productive time for the routeIT(t): Idle or in-transit time per tripIT(r): Idle time for the routeTD(r): Total distance traveled on the routeCK(t): Collection distance in km per tripCK(r): Collection or productive distance in km per routeIK(r): Idle or in-transit distance in km per route
34 | CHAPTER 3 | Time and Motion Analysis of Collection and Sweeping Services

Integrated Solid Waste Management in Island Regions | 35
WC(t): Weight or tonnage collected per tripWC(r): Weight or tonnage collected per routeTK(r): Tons per kilometer for the routeTH: Tons per hourCEE: Collection equipment efficiencyCPE: Collection personnel efficiencyRCS: Route collection speedICS: In-transit collection speedCCT: Collection cost per ton
b) Sweeping indicators:
KS: Kilometers sweptOST: Official sweeping timeAST: Actual sweeping timePPS: Productive percentage of sweeping workAPT(r): Average productive time for the routeAIT(r): Average idle time for the routeTSW: Total amount of swept-up wasteAKMD: Average kilometers/man per dayACSK: Average cost of sweeping per kilometer
c) Final disposal indicators:
• Percentage of waste deposited in a sanitary landfill• Total tonnage disposed of• Number of hours the final disposal equipment is operated• Number of people working in final disposal• Cost per ton disposed of
These indicators can be calculated through two widely used methods: route data sheets or time and motion studies.
2. Obtaining Information from Route Data SheetsA route data sheet is a fieldwork form that is routinely filled out for collection, sweeping, and final disposal operations during each work shift.

2.1. Obtaining Information from Collection Route Data Sheets
Below is an example of a route data sheet for obtaining indicators and for collection service control.
This data sheet is initially filled out by the operator in charge of the services or by the collection supervisor, and then given to the drivers assigned to each route for them to record the route’s data.
36 | CHAPTER 3 | Time and Motion Analysis of Collection and Sweeping Services
DATE: M T W Th F S Su
ROUTE CODE: AREA SERVED:
FREQUENCY: SCHEDULE: TYPE OF WASTE COLLECTED
VEHICLE: REAR LOAD GARBAGE TRUCK: DISCO: HOUSEHOLDS
FRONT LOAD GARBAGE TRUCK: VEHICLE ID GALLONS MARKETS
DUMPER: FUEL: INDUSTRY
CANTER DIESEL: SWEEPING
OTHER: OTHERS
CREW:
NUMBER OF TRIPS: TIME KILOMETRAGE WEIGHT (KG) OR REMARKSCOMPACTIONS
GARAGE EXIT:
TRIP 1 START
END
UNLOAD 1
TRIP 2 START
END
UNLOAD 2
TRIP 3 START
END
UNLOAD 3
ARRIVAL TO THE GARAGE:
REMARKS:
DRIVER’S SIGNATURE SUPERVISOR’S SIGNATURE
ROUTE DATA SHEET FOR COLLECTION SERVICE CONTROL
TRIP, TIME AND DISTANCE DATA
STAMP HEREMUNICIPALITY OF

Integrated Solid Waste Management in Island Regions | 37
The route data sheet is designed to provide the following information.
a) General information
The date, day of the week, route code, a brief description of the area served, and the route service frequency and schedule are to be completed by the collection supervisor.
b) Crew and equipment details
The type of vehicle that covers the route is identified with an X. The identification number of the vehicle should be entered in the Vehicle ID field.
The fuel type and number of gallons available for the workday should be recorded.
The number and type of personnel assigned to the crew will be identified, for example: one driver, three assistants. If sanitation system managers so require, the names and employee codes of the personnel can also be recorded. The collection supervisor should fill in this information.
DATE: M T W Th F S Su
ROUTE CODE: AREA SERVED:
FREQUENCY: SCHEDULE: TYPE OF WASTE COLLECTED
VEHICLE: REAR LOAD GARBAGE TRUCK: DISCO: HOUSEHOLDS
FRONT LOAD GARBAGE TRUCK: ID NUMBER: GALLONS MARKETS
DUMPER: GASOLINE: INDUSTRY
CANTER DIESEL: SWEEPING
OTHER: OTHERS
CREW:
NUMBER OF TRIPS: TIME KILOMETRAGE WEIGHT (KG) OR REMARKSCOMPACTACIONES
GARAGE EXIT:
TRIP 1 START
END
UNLOAD 1
TRIP 2 START
END
UNLOAD 2
TRIP 3 START
END
UNLOAD 3
ARRIVAL TO THE GARAGE:
REMARKS:
DRIVER’S SIGNATURE SUPERVISOR’S SIGNATURE
ROUTE DATA SHEET FOR COLLECTION SERVICE CONTROL
TRIP, TIME AND DISTANCE DATA
STAMP HEREMUNICIPALITY OF
DATE: M T W Th F S Su
ROUTE CODE: AREA SERVED:
FREQUENCY: SCHEDULE: TYPE OF WASTE COLLECTED
VEHICLE: REAR LOAD GARBAGE TRUCK: DISCO: HOUSEHOLDS
FRONT LOAD GARBAGE TRUCK: VEHICLE ID GALLONS MARKETS
DUMPER: FUEL: INDUSTRY
CANTER DIESEL: SWEEPING
OTHER: OTHERS
CREW:
NUMBER OF TRIPS: TIME KILOMETRAGE WEIGHT (KG) OR REMARKSCOMPACTIONS
GARAGE EXIT:
TRIP 1 START
END
UNLOAD 1
TRIP 2 START
END
UNLOAD 2
TRIP 3 START
END
UNLOAD 3
ARRIVAL TO THE GARAGE:
REMARKS:
DRIVER’S SIGNATURE SUPERVISOR’S SIGNATURE
ROUTE DATA SHEET FOR COLLECTION SERVICE CONTROL
TRIP, TIME AND DISTANCE DATA
STAMP HEREMUNICIPALITY OF

c) Type of waste collected
In certain situations, it may be necessary to record the amount of waste collected according to type. In such cases, the type of waste collected will be marked with an X. This identification should be as clear as possible, because in many instances more than one type of waste is collected on the same route. If different types of waste are included, more than one box can be marked.
If necessary, the ‘Others’ field can be used to indicate some other type of waste not covered by the specified boxes. For example: hospital waste, park or beach trash, etc.
d) Trip, time, and distance data
In these fields, the driver must enter the following information:
• Number of trips to be made during the work day• Garage exit time showing hour, minutes, and seconds• Kilometer reading at the time of departure• Time and kilometer reading at the start and end of each trip• Time and kilometer reading upon arrival at the final waste disposal
site• Weight recorded on the scale or, if there is no scale available, the
number of compactions made during the trip. The approximate weight collected may be calculated later using the number of compactions
38 | CHAPTER 3 | Time and Motion Analysis of Collection and Sweeping Services
DATE: M T W Th F S Su
ROUTE CODE: AREA SERVED:
FREQUENCY: SCHEDULE: TYPE OF WASTE COLLECTED
VEHICLE: REAR LOAD GARBAGE TRUCK: DISCO: HOUSEHOLDS
FRONT LOAD GARBAGE TRUCK: VEHICLE ID GALLONS MARKETS
DUMPER: FUEL: INDUSTRY
CANTER DIESEL: SWEEPING
OTHER: OTHERS
CREW:
NUMBER OF TRIPS: TIME KILOMETRAGE WEIGHT (KG) OR REMARKSCOMPACTIONS
GARAGE EXIT:
TRIP 1 START
END
UNLOAD 1
TRIP 2 START
END
UNLOAD 2
TRIP 3 START
END
UNLOAD 3
ARRIVAL TO THE GARAGE:
REMARKS:
DRIVER’S SIGNATURE SUPERVISOR’S SIGNATURE
ROUTE DATA SHEET FOR COLLECTION SERVICE CONTROL
TRIP, TIME AND DISTANCE DATA
STAMP HEREMUNICIPALITY OF
DATE: M T W Th F S Su
ROUTE CODE: AREA SERVED:
FREQUENCY: SCHEDULE: TYPE OF WASTE COLLECTED
VEHICLE: REAR LOAD GARBAGE TRUCK: DISCO: HOUSEHOLDS
FRONT LOAD GARBAGE TRUCK: ID NUMBER: GALLONS MARKETS
DUMPER: GASOLINE: INDUSTRY
CANTER DIESEL: SWEEPING
OTHER: OTHERS
CREW:
NUMBER OF TRIPS: TIME KILOMETRAGE WEIGHT (KG) OR REMARKSCOMPACTACIONES
GARAGE EXIT:
TRIP 1 START
END
UNLOAD 1
TRIP 2 START
END
UNLOAD 2
TRIP 3 START
END
UNLOAD 3
ARRIVAL TO THE GARAGE:
REMARKS:
DRIVER’S SIGNATURE SUPERVISOR’S SIGNATURE
ROUTE DATA SHEET FOR COLLECTION SERVICE CONTROL
TRIP, TIME AND DISTANCE DATA
STAMP HEREMUNICIPALITY OF

Integrated Solid Waste Management in Island Regions | 39
• Time and kilometer reading upon arrival at the garage at the end of the day
• Remarks, recorded in the respective field
e) Remarks
The supervisor will add any necessary observations to the driver’s own remarks, if applicable, and both driver and supervisor should sign the route data sheet. It is important that supervisor make sure the driver fills out the route data sheet both legibly and properly.
Through this system, preliminary information will be available to derive service indicators. After several months of obtaining such data, averages can be established that will become standard times. Subsequently, results can be compared with the standard figures to evaluate performance on a particular day and determine whether the crew worked normally, or whether normal vehicle performance had been impaired.
Calculations are tracked in a spreadsheet and generally comprise the following:• The number of trips each route requires (NT)• The actual length of the work day (ALW), which is obtained from the
difference between the time at the end of the shift, when the crew returns from the last trip, and the time they left the garage to start work
• The productive percentage of the work day (PPW), which is determined by comparing the actual work time with the official time. If the PPW amounts are very low, one option would be to increase the service area for better utilization of the shift, and vice versa
• The idle time (IT) and idle or in-transit kilometers traveled (IK), which is obtained by adding up all the times and distances for vehicle transport in which no collection activities are performed; that is, from the garage to the beginning of the route, from the end of the route to the landfill, and from the landfill back to the garage
• Productive time (PT) and collection distance in km (CK), which are obtained by adding the times and distances for each trip of the collection vehicle from the start of the route to the end
• Standard fuel consumption for each route• The approximate amount of waste per type of user and the total
amount collected (WC), which are obtained by adding up the weights of each trip, if the waste is weighed
DATE: M T W Th F S Su
ROUTE CODE: AREA SERVED:
FREQUENCY: SCHEDULE: TYPE OF WASTE COLLECTED
VEHICLE: REAR LOAD GARBAGE TRUCK: DISCO: HOUSEHOLDS
FRONT LOAD GARBAGE TRUCK: ID NUMBER: GALLONS MARKETS
DUMPER: GASOLINE: INDUSTRY
CANTER DIESEL: SWEEPING
OTHER: OTHERS
CREW:
NUMBER OF TRIPS: TIME KILOMETRAGE WEIGHT (KG) OR REMARKSCOMPACTACIONES
GARAGE EXIT:
TRIP 1 START
END
UNLOAD 1
TRIP 2 START
END
UNLOAD 2
TRIP 3 START
END
UNLOAD 3
ARRIVAL TO THE GARAGE:
REMARKS:
DRIVER’S SIGNATURE SUPERVISOR’S SIGNATURE
ROUTE DATA SHEET FOR COLLECTION SERVICE CONTROL
TRIP, TIME AND DISTANCE DATA
STAMP HEREMUNICIPALITY OF

• The number of tons per kilometer for the route (TK), which is obtained by dividing the total weight by the distance of the route. This parameter is very useful for designing routes in new areas because it enables foreseeing the length of the new routes to make better use of the collection vehicle
• The number of tons per hour (TH), which is calculated by dividing total tons by the total productive time for the workday. As in the previous case, this is useful for designing new collection areas
• Collection equipment efficiency (CEE), measured as a percentage, which is the result of comparing the collected tonnage with collection vehicle capacity
• Collection personnel efficiency (CPE), measured in tons/person/day, which results from dividing the total amount collected by the number of work crew members
• Route collection speed (RCS), which is obtained by dividing the route’s distance by the time on the route
• In-transit collection speed (ICS), which is obtained by dividing the in-transit trips by the idle time
2.2. Obtaining Information from Sweeping Route Data Sheets
As with garbage collection, sweeping service indicators are obtained by means of a route data sheet, as presented below.
40 | CHAPTER 3 | Time and Motion Analysis of Collection and Sweeping Services
CREW:
HOUR:MINUTE
DEPARTURE FROM HEADQUARTERS:
STARTING TIME FOR THE ROUTE:
COMPLETION TIME FOR THE ROUTE:
ARRIVAL TO HEADQUARTERS:
REMARKS:
SUPERVISOR’S SIGNATURE SWEEPING MANAGER'S SIGNATURE
ROUTE DATA
WASTE DISPOSAL SITE
NUMBER OF WHEELBARROWS OR SWEEPING CARTS
ROUTE PRODUCTION
KILOMETERS COVERED
NUMBER OF BLOCKS
MUNICIPALITY OF
DATE: M T W Th F S Su
ROUTE CODE: AREA SERVED:
FREQUENCY:
STAMP HERE
SCHEDULE:
SWEEPING ROUTE DATA SHEET

Integrated Solid Waste Management in Island Regions | 41
The following are the fields to be filled in.
a) General information
Sweeping supervisors should complete this data control sheet. This section identifies the route and thoroughfare serviced. Additionally, supervisors should enter data on crew members. The number of blocks or kilometers covered are entered at the end of the route. Where fixed routes are used, the data entered in these fields is already known.
b) Route data
For this section, sweeping supervisors will note the time of departure from the departure point or headquarters and then call the roll. Using their knowledge of the routes, they will later verify the starting time for the route (it is advisable that they accompany the workers on a few occasions to determine the route’s starting time and the place where the workers begin their sweeping activities). The same holds true for the completion time of the route.
Once the workers report back for roll call, the supervisors should note their time of arrival at the headquarters and find out how many sweeping carts or wheelbarrows were filled along the route and the sites where they were unloaded. Subsequently, they should record any remarks concerning the route and sign the route data sheet.
It should be noted that it is known from experience in various cities that workers may not abide by route start and completion times once these have been established, instead they often report that the work day has been completed. It is therefore very important to conduct random drop-in supervision of the crews on the route.
WASTE DISPOSAL SITE
NUMBER OF WHEELBARROWS OR SWEEPING CARTS
ROUTE PRODUCTION
CREW:
HOUR:MINUTE
DEPARTURE FROM HEADQUARTERS:
STARTING TIME FOR THE ROUTE:
COMPLETION TIME FOR THE ROUTE:
AARIVAL TO HEADQUARTER:
REMARKS:
SUPERVISOR’S SIGNATURE SWEEPING MAMANGER’S SIGNATURE
ROUTE DATA
KILOMETERS COVERED
NUMBER OF BLOCKS
MUNICIPALITY OF
DATE: M T W Th F S Su
ROUTE CODE: AREA SERVED:
FREQUENCY:
STAMP HERE
SCHEDULE:
SWEEPING ROUTE DATA SHEET

Once the system has been deployed, information will become available to derive service indicators and standard sweeping indicators.
All calculations should be performed in a spreadsheet. These generally comprise the following:• Kilometers swept (KS), which is derived by measuring the service route as
drawn to scale on a map• The official length of sweeping work (OLS), which is established by the
municipality or agency in charge• The actual length of sweeping time (AST), which is the difference between
the time of departure at the beginning of the shift and the time of return at the end
• The productive percentage of sweeping work for the day (PPS), which is the ratio between the AST and the OST, and shows the degree of utilization of the work shift
• The average productive time for the route (APT(r)), which is the actual time spent sweeping, calculated by comparing the difference between the start time and the end time of the route
• The average idle time for the route (AIT(r)), which is the time spent in transporting the crew to and from the area served, plus the time required to empty or unload the swept-up waste
• The total amount of swept-up waste (TSW), which is calculated by adding up the number of containers or bags of sweepings filled during the work shift
• The average kilometers per person per day (AKPD), which measures the output of the sweeping crew and is a basic parameter for designing sweeping operations
42 | CHAPTER 3 | Time and Motion Analysis of Collection and Sweeping Services
WASTE DISPOSAL SITE
NUMBER OF WHEELBARROWS OR SWEEPING CARTS
ROUTE PRODUCTION
CREW:
HOUR:MINUTE
DEPARTURE FROM HEADQUARTERS:
STARTING TIME FOR THE ROUTE:
COMPLETION TIME FOR THE ROUTE:
ARRIVAL TO HEADQUARTERS:
REMARKS:
SUPERVISOR’S SIGNATURE SWEEPING MANAGER'S SIGNATURE
ROUTE DATA
KILOMETERS COVERED
NUMBER OF BLOCKS
MUNICIPALITY OF
DATE: M T W Th F S Su
ROUTE CODE: AREA SERVED:
FREQUENCY:
STAMP HERE
SCHEDULE:
SWEEPING ROUTE DATA SHEET

Integrated Solid Waste Management in Island Regions | 43
2.3. Obtaining Information from Final Disposal Route Data Sheets
Below is a design for a final disposal route data sheet.
a) Overview of final disposal
In this section, the landfill supervisor will enter the date, day, equipment used and its identification number, and the personnel assigned to the landfill, including guards, supervisors, technical staff, etc.
b) User data and amount of waste disposed
This section estimates the total amount of waste deposited in the landfill or dump and allows an assessment of the type of waste deposited there. The potential users and the actual system of municipal sanitation are determined.
FINAL DISPOSAL ROUTE DATA SHEET
MUNICIPALITY OF
EQUIPMENT: VEHICLE ID:
CREW:
USER: NUMBER TONNAGE DISPOSED OF GENERAL DESCRIPTION OF TYPE OF VEHICLES OF WASTE DISPOSED OF
REMARKS:
LANDFILL SUPERVISOR’S SIGNATURE
MUNICIPAL CLEANING:
DATE: M T W Th F S Su
STAMP HERE
USERS DATA AND AMOUNT DISPOSED

The supervisor will record the total number of vehicles entering the dump and the tonnage disposed of, as well as the type of waste disposed of by each landfill user. (If there is no scale, an estimate of the volume may be made.)
44 | CHAPTER 3 | Time and Motion Analysis of Collection and Sweeping Services
FINAL DISPOSAL ROUTE DATA SHEET
MUNICIPALITY OF
EQUIPMENT: VEHICLE ID:
CREW:
USER: NUMBER TONNAGE DISPOSED OF GENERAL DESCRIPTION OF TYPE OF VEHICLES OF WASTE DISPOSED OF
REMARKS:
LANDFILL SUPERVISOR’S SIGNATURE
MUNICIPAL CLEANING:
DATE: M T W Th F S Su
STAMP HERE
USERS DATA AND AMOUNT DISPOSED
FINAL DISPOSAL ROUTE DATA SHEET
MUNICIPALITY OF
EQUIPMENT: VEHICLE ID:
CREW:
USER: NUMBER TONNAGE DISPOSED OF GENERAL DESCRIPTION OF TYPE OF VEHICLES OF WASTE DISPOSED OF
REMARKS:
LANDFILL SUPERVISOR’S SIGNATURE
MUNICIPAL CLEANING:
DATE: M T W Th F S Su
STAMP HERE
USERS DATA AND AMOUNT DISPOSED

Integrated Solid Waste Management in Island Regions | 45
The final disposal indicator calculations are as follows:• The percentage of waste deposited in a sanitary landfill; the ratio of
the amount of waste arriving at the final disposal site compared to the total amount of waste generated
• The total tonnage disposed of; the sum of the waste transported by all the vehicles at the final disposal site
• The number of hours the final disposal equipment is operated; the difference between the shift start and end times
• The number of people working in final disposal; identifies both the equipment and the personnel working at the site
3. Time and Motion StudiesTime and motion studies are crucial for any production process since they make it possible to find out how long it takes to complete the process. They are also the basis for calculating the standard times that reveal the actual process cost.
This kind of study is much more detailed than route data sheets because it follows up on the collection and sweeping routes by describing the activities performed in detail. The indicators derived through this method are much more realistic and precise.
A time and motion study aims to determine the standard time in which a work crew performs a specific task under normal working conditions and with a normal level of effort.
The time and motion study on collection and sweeping systems is designed to provide indicators for:
• Determining control parameters to assess personnel performance and detect problems in efficiency or in the area served
• Determining design parameters for servicing new sectors with characteristics similar to the one studied
• Creating a database that reflects the system’s functioning for administrative and operational decision-making
For this purpose, the relevant information is compiled using field forms.
The following description shows the calculations required to determine the proposed indicators, as well as how to fill out the forms.
3.1. Collection Times and Motions
The following materials are recommended for conducting the time and motion study:

• An adequate number of field forms• A pencil• A clipboard• An updated map of the area under study• A digital clock that measures hours, minutes, and seconds• A separate vehicle to follow the vehicle of the crew being studied, with an
odometer to record the distance covered• A GPS device for subsequent charting of the route
The Time and Motion Form consists of different fields (see Table 4).
a) General information of the route under study
This section describes the route identification information: the location served (sector, housing development, zone, parish), identification of the route by a number or name, the person responsible for the data survey, and the data collection date.
The composition of the crew is noted: a driver and the number of assistants, as well as the route frequency and service schedule.
The equipment making the route collection is noted, including its ID number, make and type of vehicle, and the number of gallons of fuel supplied for the work shift, if applicable.
The pages of the study should be numbered for subsequent data analysis. The field data sheets are sequentially numbered throughout.
b) Time and motion data
The following columns are delineated in the field data section of the form:• Route Start, with two columns: one normal for T (Time) and one
shaded for R (Reading). The amount of time calculated is recorded in the first column; in the second, the field reading. In the example that follows, the route start time reading is 13:13:30.
• The shaded lines corresponding to R are field readings, while the amount of time between R readings is indicated in the T columns.
46 | CHAPTER 3 | Time and Motion Analysis of Collection and Sweeping Services
STUDIES OF COLLECTION TIME AND MOTION
LOCATION:ROUTE N:DATA SURVEY COLLECTED BY:DATA:COMPOSITION OF THE CREW:FREQUENCY:SCHEDULE:Collec�on truck:
CODE INDICATOR VALUE OBTAINED UNIT STANDARD VALUE REMARKS1 Official �me of the work day 6:00:00 HOURS To be defined in each city COLLECTIVE AGREEMENT
2 Real �me of the work day 5:02:37 HOURS Obtained from study TIME DIFFERENCE BETWEEN DEPARTURE FROM AND
3 Percentage worked during work day 84.1% % OVER 90% QUOTIENT 2/1
4 Number of trips 1 To be defined in each city
5 Produc�ve �me 2:48:24 Hour:min:sec Obtained from study SUM OF PRODUCTIVE TIMES
6 Percentage of produc�ve �me 55.6% % OVER 60% QUOTIENT 5/2
7 Idle or in-transit �me 2:14:13 Hour:min:sec Obtained from study SUM OF IDLE TIMES
8 Percentage of idle or in-transit �me 44.4% % UNDER 40% QUOTIENT 7/2
9 Total distance traveled 39,00 Km Obtained from study DATA OBTAINED IN THE FIELD
10 Kilometrage in road 13 Km Obtained from study DATA OBTAINED IN THE FIELD
11 Percentage of kilometrage in road 33.3% % OVER 50% QUOTIENT 10/9
12 Kilometrage in-transit 26.00 Km Obtained from study DATA OBTAINED IN THE FIELD
13 Percentage of kilometrage in-transit 66.7% % OVER 50% QUOTIENT 12/9
14 Tons collected 6.9 Ton 21 * 22
15 Tons per hour 2.5 Ton/hour DEPENDS ON POPULATION DENSITY OF CUOCIENTE DE 14/5. PRODUCTIVE TIME HAS BEENTHE SECTOR. DESIGN PARAMETER TRANSFORMED INTO A CENTECIMAL FORM
THE SECTOR. DESIGN PARAMETER16 Tons per Kilometer 0.53 Ton/Km DEPENDS ON POPULATION DENSITY OF QUOTIENT 14/10.
17 Speed in route 4.6 Km/hour 4 Km/day QUOTIENT 10/5. PRODUCTIVE TIME HAS BEEN TRANSFORMED INTO A CENTECIMAL FORM
18 Vehicle capacity 7 Ton DEPENDS ON THE VEHICLE19 Efficiency of collec�on equipment 98.6% % 2 TRIPS RECOMMENDED QUOTIENT 14/19. SUMMING UP THE TOTAL AMOUNT
WITH AN EFFICIENCY OF 90% COLLECTED IN ALL THE TRIPS BY THE CAPACITY
20 Crew efficiency 2.3 Ton/person/day Op�mal 3 Ton/person/day QUOTIENT 14/NUMBER OF PEOPLE
21 Number of compac�ons 29 DEPENDS ON THE VEHICLE
22 Average weight for compac�on 238 Kg/compac�ons ASSUMED VALUE (21 – 290 KG/COMPACTION)
23 Cost per ton collected 18.96 USD/Ton USD 25 NATIONAL AVERAGE (COST OF DRIVER’S TIME + NUMBER OF WORKERS * COST OF WORKER’S TIME + COST SCHEDULE

Integrated Solid Waste Management in Island Regions | 47
• In the example, collection operations begin at reading 13:21:46. The time difference pertains to idle or in-transit time from the vehicle’s departure from the garage until the route starts; i.e., eight minutes and sixteen seconds.
• According to the example, the vehicle then halts, stops collecting, and continues on at 13:26:00. The difference between the time when it stopped and began activities was a productive or collection time of four minutes and fourteen seconds.
• Completion of this form entails noting the readings when collection activities begin and the vehicle starts moving or stops collecting for whatever reason.
• Time spent collecting is calculated and recorded under the Productive Time column.
• Time spent in transit or traffic is calculated and recorded in the Idle Time column.
• At the end of the study, all the data is computed to calculate the total amounts of productive and idle time.
• The kilometer reading at the start of the route is noted in the Initial Kilometer Reading column. Usually the kilometer count is reset to zero and kilometer readings are then recorded as needed.
• If it is not possible to reset the odometer to zero, the initial kilometer reading is recorded in the Final Kilometer Reading column to establish, through the difference, the distance covered, which is recorded in the Distance column.
• The in-transit speed can be recorded in the respective column if such information is necessary or required.
• All relevant data for the study is recorded in the Remarks column, especially the vehicle’s route, so that once back at the office, the micro-route or route covered can be charted. Records of compactions and the location of piles, etc., are also made.
ESTUDIOS DE TIEMPOS Y MOVIMIENTOSPARA
RECOLECCIÓN
IN-T
RAN
SIT
DIS
TAN
CE
FIN
AL K
M
INIT
IAL
KM
ACTI
VITY
IN:
STAR
T O
F
IN:
FOR
ROU
TE REMARKS
T R Produc�ve T. R Idle T RLEAVES GARAGE0.0013:13:30
13:13:30
00:04:14
00:00:35
00:03:00
00:06:35
13:26:00
13:28:23
13:31:40
13:38:35
00:01:48
00:00:20
00:00:20
00:00:43
13:27:48
13:28:40
13:32:00
13:39:18
00:08:16 13:21:46 3.60
5.20
5.70
STARTS ROUTE
PICK UP CONTAINERS
TURNS RIGHT AT 24 DE MAYO STREET
MANABI STREET
COMPACTS
COMPACTS
LOCATION:ROUTE N:DATA SURVEY COLLECTED BY:DATA:COMPOSITION OF THE CREW:FREQUENCY:SCHEDULE:Collec�on truck:

Additionally, the form has a section to record any circumstances outside normal service operations, such as accidents, vehicle damage, and obstructions along the way. For these situations, the start and finish time of such events is recorded, calculated, and added to the idle time.
The indicator calculations based on the aforementioned form are shown in the time and motion appendices accompanying each study.
3.2. Sweeping Time and Motion
As with the preceding section, the following information indicates the correct way to fill out and calculate sweeping operations’ time and motion data.
a) General information about the route under study
This section describes the route’s identification data: the thoroughfare to be serviced (squares, parks, or markets), identification of the route according to a number or name, the person responsible for the data survey, and the data collection date.
The composition of the work crew is noted: the number of workers, the route frequency, and the service schedule.
b) Time and motion data
48 | CHAPTER 3 | Time and Motion Analysis of Collection and Sweeping Services
IN:
FOR
ACTI
VITY
IN
STAR
T O
F
REMARKSMAP
MUNICIPAL GARAGE04:30:30
04:42:20 00:12:20 ROUTE 1 STARTS. Chile and Bolivia square
Down Chile towards France Street
Sweep France in intersec�ons towards le�
Two sidewalks are swept
At Avenue De la Unidad Nacional, sidewalks are swept
France swept up to Los Argen�nos street.
Produc�ve T R Idle T R
STUDIES OF SWEEPING TIMEAND MOTION
LOCATION:ROUTE N:DATA SURVEY COLLECTED BY:DATA:COMPOSITION OF THE CREW:FREQUENCY:SCHEDULE:Collec�on truck:

Integrated Solid Waste Management in Island Regions | 49
• The route map goes in the space to the left with the street names and relevant details for the study.
• The arrangement of time and reading columns is the same as for collection activities; the time readings gathered in the field for stopping and starting sweeping work go under R; the amount of time calculated for sweeping operations goes under Productive T; and the amount calculated for time in transit goes under Idle T.
• To determine the distance covered, the route is charted on a map drawn to scale, and the sweeping and in-transit distances are determined accordingly.
• Such information as which streets are covered, how many times a sweeping cart is filled, and the point where it is unloaded, etc., is noted in the Remarks column.
• The section for outside circumstances is used in the same way as in the collection activities data sheet.
The results of these calculations are summarized in Table 4, where some standard amounts are recommended. The Remarks column also contains the indicator calculation formulas.
STUDIES OF COLLECTION TIME AND MOTION
LOCATION:ROUTE N:DATA SURVEY COLLECTED BY:DATA:COMPOSITION OF THE CREW:FREQUENCY:SCHEDULE:Collec�on truck:
CODE INDICATOR VALUE OBTAINED UNIT STANDARD VALUE REMARKS1 Official �me of the work day 6:00:00 HOURS To be defined in each city COLLECTIVE AGREEMENT
2 Real �me of the work day 5:02:37 HOURS Obtained from study TIME DIFFERENCE BETWEEN DEPARTURE FROM AND
3 Percentage worked during work day 84.1% % OVER 90% QUOTIENT 2/1
4 Number of trips 1 To be defined in each city
5 Produc�ve �me 2:48:24 Hour:min:sec Obtained from study SUM OF PRODUCTIVE TIMES
6 Percentage of produc�ve �me 55.6% % OVER 60% QUOTIENT 5/2
7 Idle or in-transit �me 2:14:13 Hour:min:sec Obtained from study SUM OF IDLE TIMES
8 Percentage of idle or in-transit �me 44.4% % UNDER 40% QUOTIENT 7/2
9 Total distance traveled 39,00 Km Obtained from study DATA OBTAINED IN THE FIELD
10 Kilometrage in road 13 Km Obtained from study DATA OBTAINED IN THE FIELD
11 Percentage of kilometrage in road 33.3% % OVER 50% QUOTIENT 10/9
12 Kilometrage in-transit 26.00 Km Obtained from study DATA OBTAINED IN THE FIELD
13 Percentage of kilometrage in-transit 66.7% % OVER 50% QUOTIENT 12/9
14 Tons collected 6.9 Ton 21 * 22
15 Tons per hour 2.5 Ton/hour DEPENDS ON POPULATION DENSITY OF CUOCIENTE DE 14/5. PRODUCTIVE TIME HAS BEENTHE SECTOR. DESIGN PARAMETER TRANSFORMED INTO A CENTECIMAL FORM
THE SECTOR. DESIGN PARAMETER16 Tons per Kilometer 0.53 Ton/Km DEPENDS ON POPULATION DENSITY OF QUOTIENT 14/10.
17 Speed in route 4.6 Km/hour 4 Km/day QUOTIENT 10/5. PRODUCTIVE TIME HAS BEEN TRANSFORMED INTO A CENTECIMAL FORM
18 Vehicle capacity 7 Ton DEPENDS ON THE VEHICLE19 Efficiency of collec�on equipment 98.6% % 2 TRIPS RECOMMENDED QUOTIENT 14/19. SUMMING UP THE TOTAL AMOUNT
WITH AN EFFICIENCY OF 90% COLLECTED IN ALL THE TRIPS BY THE CAPACITY
20 Crew efficiency 2.3 Ton/person/day Op�mal 3 Ton/person/day QUOTIENT 14/NUMBER OF PEOPLE
21 Number of compac�ons 29 DEPENDS ON THE VEHICLE
22 Average weight for compac�on 238 Kg/compac�ons ASSUMED VALUE (21 – 290 KG/COMPACTION)
23 Cost per ton collected 18.96 USD/Ton USD 25 NATIONAL AVERAGE (COST OF DRIVER’S TIME + NUMBER OF WORKERS * COST OF WORKER’S TIME + COST SCHEDULE

The collection route under study must be charted on the form, since the final chart marked with all the city routes will accurately determine actual service coverage, any zones left unserviced, and any places where service overlaps.
The same procedure is used for sweeping operations, summarized below.
Finally, the collection cost per ton is calculated based on the direct service costs, not including administrative costs. The respective considerations are as follows.
50 | CHAPTER 3 | Time and Motion Analysis of Collection and Sweeping Services
ESTUDIOS DE TIEMPOS Y MOVIMIENTOSPARA
BARRIDOLOCATION:ROUTE N:DATA SURVEY COLLECTED BY: DATE:COMPOSITION OF THE CREW:FREQUENCY:SCHEDULE:
VALUE OBTAINED UNIT STANDARD VALUE REMARKSINDICATORCODE1 Total kilometrage covered 3.84 Km To be determined in
each cityValue obtained by measuring the route studied in a map at a suitable scale
2 Kilometrage swept 2.44 Km
3 Percentage of kilometrage swept 63.5% % Over 70% 2/1 quo�ent. Near standard
4 Kilometrage in-transit 1.40 Km
5 Percentage of kilometrage in-transit 36.5% % Less than 30% 4/1 quo�ent. Near standard
6 Kilometers swept per person per day 1.22 Km/person*day 1.5 to 3.0 Km/person*day Quo�ent of 2/number of workers of the crew. Below standard
7 Official dura�on of the working day 4:00:00 Hour:min:sec To be determined in each city
Corresponds to part of the working day
8 Real dura�on of the working day 3:30:36 Hour:min:sec Obtained from the �me and mo�on study
Time between departure and return to headquarters
9 Produc�ve percentage produc�veof the working day
87.8% % Over 90% 3/1 quo�ent. Near standard
10 Produc�ve �me of the working day 1:43:55 Hour:min:sec Defined from the �me and mo�on study and corresponds to the �me used exclusively for sweeping
11 Percentage of produc�ve �me of the working day
49.3% % Over 70% 10/3 quo�ent. Below standard
12 Time in-transit during working day 1:46:41 Hour:min:sec Defined from the �me and mo�on study and corresponds to the �me used to go and return from the area covered
13 Percentage of �me in-transit during working day
50.7% % Below 30% 12/3 quo�ent. Below standard
14 Number of wheelbarrows collected 2.50 Obtained from �me and mo�on study
Depends on the area covered
15 Volume of total collected 500.00 Liters 200 liters per wheelbarrow
16 Weight collected 200 Kg 400 Kg/m3. It is calculated 11*density
17 Genera�on of waste from sweeping 81.97 Kg/Km 12/2 quo�ent. Swept area very dirty
18 Cost per kilometer swept 2.50 USD/Km To be determined in each city
To be determined in each city
To be determined in each city
To be determined in each city
Cost hour worker*number of workers*hours of working day*indirects divided by number of km swept
DATA TO CALCULATE APPROXIMATE VALUE OF TONS COLLECTEDWORKER MONTHLY SALARY: 126.63 USD
MONTHLY WORK HOURS: 40 USD
WORKER SALARY PER HOUR: 3.17 USD
DRIVER MONTHLY SALARY: 135.48 USD
MONTHLY WORK HOURS: 40 USD
DRIVER SALARY PER HOUR: 3.39 USD
DAILY COST OF COLLECTION TRUCK: 96.67 USD
COST OF SCHEDULE OF COLLECTION TRUCK: 12.08 USD
INDIRECT COSTS 20% USD

Integrated Solid Waste Management in Island Regions | 51
LOCATION:
AT:
FOR
ACTI
VITY
AT:
STAR
T
REMARKSMAP
Produc�ve T R Idle T R
TIME AND MOTION STUDY
LOCATION:
ROUTE No.:
DATA ENTERED BY:
DATE:
CREW COMPOSITION:
FREQUENCY:
SCHEDULE:
OUTSIDE CIRCUMSTANCES:
No. 1
FROM:
TO:
REASON:
No. 2
FROM:
TO:
REASON:
No. 3
FROM:
TO:
REASON:
No. 4
FROM:
TO:
REASON:
0:00:00 SUM= 0:00:00 SUM=
DATA SHEET: 1
Other indicators commonly used for solid waste management are (more information in Paraguassú de Sá, 2002):
CS(t): Total cost of sanitation services per tonUSD/Ton: Total cost depending on the time period analyzedNWS/1000: Total number of workers and administrative staff per
one-thousand inhabitantsDEF(t): Service cost deficit (%)NS: Number of people servedAAU(t): Average amount billed to service users (USD/person)CSC%: Collection service coverageSSC%: Sweeping service coverage
Table 4 Time and Motion Form


Integrated Solid Waste Management in Island Regions | 53
CHAPTER 4
Temporary Storage
Temporary storage makes it possible to accumulate waste in sanitary conditions between collection periods. This depends on the amount of waste to be stored and the type and frequency of the waste collection service. Thus, there is a direct correlation between temporary solid waste storage and the collection service.
It is common practice for people to use cardboard boxes or wooden crates to store waste, but cardboard boxes become damp and split open, causing waste spillage and delays to service operators, while wooden crates come apart during handling, with similar consequences.
Another widely observed practice for businesses or housing complexes is the use of fifty-five-gallon drums, but these are a problem for service operators because of their weight.
It is therefore necessary to regulate storage containers in order to facilitate collection work.
1. Definition of Design Parameters for Temporary Storage
1.1. Dimensioning of Temporary Storage
The capacity or volume of the storage container depends on:• Amount and kind of waste generated• Frequency of collection service
© W
WF
/ Ver
ónic
a To
ral-G
rand
a

Information on waste generation should be ascertained for each type of user; that is, residential users, industrial users, markets, etc. An example of how to calculate waste generation for domestic users is as follows:
• PPC (household waste production per capita): 0.70 kg/person/day• Typical number of people per household: 5.5 person/house• Dimensional weight of domestic waste: 220 kg /m3
In this example, the required daily volume of temporary storage will be:
V = PPC x person x DW
V = 0.70 kg/person/day x 5.5 person/house x 1000 L/220 kg /m3
V = 17.5 L/day
The frequency of collection must be taken into account to calculate the volume of the container. For example, assuming a frequency of collection of every other day and using the volume calculated in the previous step, the most critical day will be Monday, since waste will have to be stored from Friday after waste pick-up, through Saturday and Sunday, according to the following weekly schedule:
MON TUE WED THU FRI SAT SUN
X X X
Therefore, the volume for a temporary storage container should be:
V = 17.5 L/day x 3 days
V = 52.5 L
The container volume to be adopted could be that of commercially available containers having the closest volume larger than that figure; in this instance, perhaps 60 liters.
The process of calculating is similar in the case of community trash cans or dumpsters, but the number of family units depositing waste in such stationary containers must be factored in. Likewise, in the case of markets, the daily volume of waste generated must be known in order to size suitable containers or storage facilities. The situation is also similar for industries.
As for temporary storage for street sweeping, time and motion studies will provide the indicator of kg/km swept and the dimensional weight of swept-up waste. The minimum required volume of street sweeping containers may be calculated based on these figures, or an estimate made from the number of plastic bags or gunnysacks to hold waste for subsequent collection.
54 | CHAPTER 4 | Temporary Storage

Integrated Solid Waste Management in Island Regions | 55
1.2 Types of Storage Containers
The types of storage containers and the materials they are made of depend on the following factors:
• Climate and weather conditions in the region• Type of waste to be stored• Mode of operation/method of collection• Amount of waste stored• Dimensional weight of the waste• Frequency of the collection service
Storage containers and the collection system are in close correlation to each other. Some types of containers require special collection vehicles, as is the case with dumpsters. In the case of islands and coastal areas, metal containers do not last long because they corrode rapidly. Reinforced plastic containers are better suited to these climates.
High-impact plastic containers are also widely used because of their sanitary conditions, ease of handling, and the fact that they usually have a life span of several years. For medium and large generators of waste, there are a variety of receptacles to choose from, depending on the type and quantities of waste to be stored.
Street trash cans are made of various materials, with varying results as to functionality and durability. Waste bins made of wood, fiberglass, and plastic have been proven to last. No matter the material, all waste receptacles should be easy to empty and kept clean to encourage their use.
© W
WF
/ Mar
celo
Cas
tillo
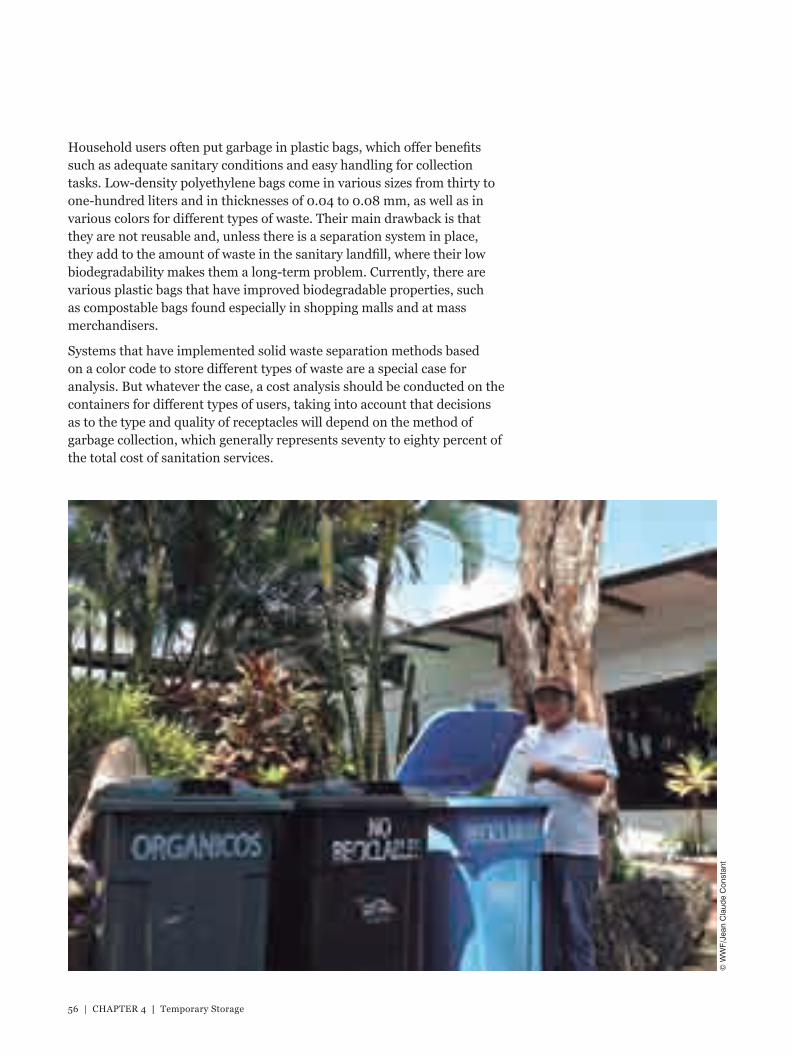
Household users often put garbage in plastic bags, which offer benefits such as adequate sanitary conditions and easy handling for collection tasks. Low-density polyethylene bags come in various sizes from thirty to one-hundred liters and in thicknesses of 0.04 to 0.08 mm, as well as in various colors for different types of waste. Their main drawback is that they are not reusable and, unless there is a separation system in place, they add to the amount of waste in the sanitary landfill, where their low biodegradability makes them a long-term problem. Currently, there are various plastic bags that have improved biodegradable properties, such as compostable bags found especially in shopping malls and at mass merchandisers.
Systems that have implemented solid waste separation methods based on a color code to store different types of waste are a special case for analysis. But whatever the case, a cost analysis should be conducted on the containers for different types of users, taking into account that decisions as to the type and quality of receptacles will depend on the method of garbage collection, which generally represents seventy to eighty percent of the total cost of sanitation services.
56 | CHAPTER 4 | Temporary Storage
© W
WF/
Jean
Cla
ude
Con
stan
t

Integrated Solid Waste Management in Island Regions | 57
1.3 Legal Issues Concerning Temporary Storage
It is important to standardize storage containers in the service area for service efficiency, allowing for the objectives of proper handling to be met while providing sanitary conditions inside the home, ease of collection, and lower costs to the user and the sanitation system in general.
Thus, ordinances should foster the normalization of storage containers for different types of users. This issue should receive special attention following the implementation of separation systems that include regulations establishing responsibility for sorting garbage and penalties for those who fail to comply with the established requirements.


Integrated Solid Waste Management in Island Regions | 59
CHAPTER 5
Street and Beach Sweeping
Street sweeping in squares, public areas, and beaches is important for people’s health and a city’s outward appearance. The cleanliness of streets and public spaces is of particular importance in coastal areas whose economies are primarily tourism-based. The consequences of failing to keep streets clean in times of crisis are clearly understood. Such neglect can affect not only peoples’ quality of life, but also the city’s local economy.
In general, smaller cities and towns use a manual sweeping method, which requires a substantial workforce and generates corresponding costs, depending on the size of the city. This component thus requires proper technical planning to optimize human and material resource utilization.
The sweeping and cleaning of streets, parks, public areas, and beaches is also especially essential on islands because they are surrounded by marine ecosystems that are extremely sensitive to waste contamination. In contrast to mainland coastal cities, island territories have a 360-degree coastline. Thus the likelihood of contaminating marine ecosystems is much higher.
1. Definition of CleanlinessThe rating of cleanliness is subjective, making it difficult to achieve a consensus on its evaluation. It is thus advisable to apply the Degree of Street Cleanliness guidelines prepared by Francisco Galvez for the city of Santiago de Chile, described in Table 5.
© W
WF
/ Mar
celo
Cas
tillo

The application of this method is best achieved by visiting areas prior to sweeping operations, immediately afterwards, and then some hours thereafter. This facilitates the assessment of the work crew’s efficiency.
It also serves to evaluate whether a particular thoroughfare or sector requires further attention to maintain proper conditions of cleanliness, above all in areas where large numbers of tourists perambulate.
It is desirable to maintain streets at least at a B level. This degree of street sanitation could be regulated in a city plan to define service needs, service frequency, and amount of work crews, along with types and target areas of educational campaigns to encourage public cooperation.
2. Types of SweepingMethods for providing sweeping services are based on the type of equipment employed:
• Manual sweeping• Mechanical sweeping• Combined sweeping
Manual sweeping is the most widely used method and is by nature applicable to all types of streets and roads. The initial investment or cost is low, but it requires a large workforce based on the total length of the streets and roads to be serviced. Thus, operating costs are often high and depend greatly on work crew performance.
Table 5 Definition of Degree of Municipal Public Sanitation
SERVICELEVEL VISIBLECONDITIONSFORMEETINGACERTAINSERVICELEVEL
A No dust or other waste is observed on streets or sidewalks
B Only a moderate amount of dust is observed
C Dust and paper are observed in moderation
D There is some dust, a lot of paper, and a moderate amount of other waste
E There is a lot of dust, paper, and other waste, particularly household waste
F Large amounts of domestic waste are deposited on public thoroughfares
Source: Paraguassú de Sá, 1985.
60 | CHAPTER 5 | Street and Beach Sweeping

Integrated Solid Waste Management in Island Regions | 61
Mechanical sweeping is used for routes with a high volume of traffic, such as underpasses or multi-lane thoroughfares. This method faces operating difficulties in urban areas with high pedestrian and vehicular traffic. Overall, it involves high investment costs but provides good results on main roads that have heavy traffic.
In some cases it is advisable to combine manual and mechanical sweeping for efficient service provision. In such cases, mechanical sweeping is reserved for main avenues and expressways, while the remainder of the streets are swept manually. These sweeping services are provided on varying schedules and frequencies, as needed.
3. Dimensioning of Sweeping OperationsSolid knowledge of a city’s street and road system is a basic input for establishing the dimensions of the sweeping service. The following information is needed:
• The total length of roads• Routes suitable for sweeping; that is, those that have some sort of coating
or surface layer, such as asphalt, cobblestone, paving stone, concrete, etc. In general, dirt roads are not serviced unless they are important for some reason; for instance, as an access road to a tourist site.
• Identification of areas of the city as high pedestrian flow zones, tourist areas, areas of historical interest, business districts, or sectors where public buildings are located
• Location of plazas, parks, esplanades, docks, and other places of interest• Location of beaches and other tourist sites
© W
WF
/ Mar
celo
Cas
tillo

This information should be included on a map of the city, after which the following decisions must be made:
• Service frequency; i.e., whether sweeping is done daily, several times a day, or on some other regular basis. In residential areas, sweeping could be done less frequently, perhaps once a week, and in suburban areas, once every two weeks. It should be kept in mind that the higher the frequency, the more workers required and the higher the service cost.
• Size of sweeping crews; for example, whether to use single-man, two-man, or larger crews
• Equipment and tools employed; for example, whether swept-up waste is collected in wheelbarrows, pushcarts, receptacles, or plastic bags
• Expected performance; for example, the acceptable range for sweeping curbs, gutters, and paved roads is from 1.3 to 1.5 linear km/sweeper/day (Paraguassú de Sá, 2002)
• The collection method for swept-up waste; i.e., depositing at collection centers, waiting for the collection vehicle, leaving plastic bags at predefined locations for later collection, etc.
It should not be forgotten that much of this information is obtained by conducting time and motion studies of the existing system, as explained in Chapter 3.
Table 6 provides an example case for the dimensions of a sweeping service. A calculation is made of the number of workers necessary to provide service to a city based on the characteristics listed in the table. In the example, only surfaced roads will be swept. It is assumed that this city has developed streets and roads suitable for sweeping in its suburbs and service coverage of these roads is in the order of 100%. A daily service frequency is assumed for the city center because of its importance as a political and tourist hub and its concentration of pedestrian and vehicular traffic. A biweekly service frequency is assumed for residential areas, where each sweeping sector will be serviced at least twice a week. On the other hand, suburban areas where road surfacing exists are serviced at a rate of once a week.
62 | CHAPTER 5 | Street and Beach Sweeping

Integrated Solid Waste Management in Island Regions | 63
Table 6 Example of Dimensioning of Sweeping Services
COMMUNITY DIMENSIONINGOFPUBLICSWEEPING
DATA:
TOTAL KILOMETERS OF STREETS AND ROADS: 129 km
KILOMETERS OF DIRT ROADS: 27 km
KILOMETERS OF BEACH: 10 km
KILOMETERS IN CITY CENTER: 28 km DAILY
KILOMETERS IN RESIDENTIAL AREAS: 40 km BIWEEKLY
KILOMETERS IN SUBURBS: 34 km WEEKLY
KILOMETERS ADDED TO THE ROAD SYSTEM ANNUALLY: 4 km KM WITH SURFACING SUITABLE FOR SWEEPING
PERFORMANCE ON STREETS AND ROADS: 2.5 km/person/day
PERFORMANCE AT BEACHES: 2.0 km/person/day
YEAR TOTAL KM KM TO KM CITY KM KM CITY RESIDENTIAL SUBURB BEACH TOTAL SWEEP CENTER RESIDENTIAL SUBURBS CENTER AREA WORKERS WORKERS WORKERS AREA WORKERS WORKERS
2010 129.0 102.0 28.0 40.0 34.0 12.0 6.0 3,0 5.0 26.0
2011 133.0 106.0 28.0 40.0 38.0 12.0 6.0 3,0 5.0 26.0
2012 137.0 110.0 28.0 40.0 42.0 12.0 6.0 3,0 5.0 26.0
2013 141.0 114.0 28.0 40.0 46.0 12.0 6.0 4.0 5.0 27.0
2014 145.0 118.0 28.0 40.0 50.0 12.0 6.0 4.0 5.0 27.0
2015 149.0 122.0 28.0 40.0 54.0 12.0 6.0 4.0 5.0 27.0
2016 153.0 126.0 28.0 40.0 58.0 12.0 6.0 4.0 5.0 27.0
2017 157.0 130.0 28.0 40.0 62.0 12.0 6.0 5.0 5.0 28.0
2018 161.0 134.0 28.0 40.0 66.0 12.0 6.0 5.0 5.0 28.0
2019 165.0 138.0 28.0 40.0 70.0 12.0 6.0 5.0 5.0 28.0
2020 169.0 142.0 28.0 40.0 74.0 12.0 6.0 5.0 5.0 28.0
The distance covered in km for sweeping is determined separately for each case. In this example, the distance figures for the city center and residential areas do not increase, because they are assumed to be consolidated areas, while the suburbs are still growing.

Based on these parameters, the number of workers for each case is calculated by dividing the kilometers in that area by the respective sweeping performance. In the case of consolidated residential areas, the result is further divided by three, since one sweeping worker can handle three sectors per week. For example, a worker can sweep sector one on Monday and Thursday, sector two on Tuesday and Friday, and sector three on Wednesday and Saturday. In the suburbs, the procedure is similar, but the result is further divided by six, since a worker will be able to cover a different sector every day.
Finally, it is assumed that the beach area is serviced on a daily basis. This situation must be analyzed since more than one cleanup per day will be necessary during the high season, and performance levels will be lower due to the amount of litter and waste on the beach. In this example, a daily beach cleanup performance of two km/person/day is assumed. This amount should be derived from time and motion studies conducted in the field.
The above example should be expanded to include the number of workers needed to clean up parks and gardens, in addition to other places of interest in the city.
64 | CHAPTER 5 | Street and Beach Sweeping
© W
WF
/ Mar
celo
Cas
tillo

Integrated Solid Waste Management in Island Regions | 65
4. Design of Micro-Routes for Sweeping OperationsOnce the number of workers has been defined, micro-routes for sweeping coverage must be designed using an up-to-date map of the city. Initially, the streets and roads to be serviced are selected in segments equal to the assumed performance parameter. In the example, a total of 2.5 km of roads will be serviced by a one-person crew.
It is then necessary to chart the route that the sweeper should take to cover the assigned area. The most widely used method for this exercise is the heuristic approach, or the common sense procedure, which involves choosing and refining the shortest route from among several layout alternatives to reduce idle time and avoid crossing the same points more than once. To prepare these designs, it is advisable to simplify the maps to include only a diagram of the streets to be serviced.
Figure 10 shows an example of a sweeping micro-route that conforms to the design’s route and that services both sides of the road.
Figure 10 Inefficient Routing Scheme
The symbols used in Figure 10 are:S : Start of the routeE : End of the routeP : Location of plastic bags with swept-up waste : Route in service (productive)- : Route in transit (idle)
Although the route shown covers both sides of the road in the assigned sector, it is evident that it services twelve blocks and has eighteen crossings, which increases the distance travelled and the time required.
S
P
P P P
E

Figure 11 shows the same service area, but with an improved route that saves time and travel. The symbols used are the same as in the previous scheme.
Figure 11 Improved Route
Application of the heuristic approach generally requires several attempts to achieve a micro-route that services the entire area assigned with the minimum amount of crossings and backtracking.
A tour should be held with the workers before implementing the sweeping route in order to identify any problems or difficulties that might occur on the micro-route. Since a key aspect of sweeping service operation is field supervision, it is advisable to hire sweeping foremen or supervisors to randomly oversee micro-routes and to evaluate their state of cleanliness by using the previously mentioned method of defining the degree of street cleanliness. It is estimated that there should be one supervisor for every fifteen to twenty micro-routes. These employees could be supplied with a motorcycle or bicycle to improve efficiency.
In view of its labor-intensive nature, this service will require effective supervision to maintain good performance and reasonable service costs.
All items required for effective service provision should be taken into account to estimate the service’s costs; for example:
• Tools such as wheelbarrows or pushcarts• Plastic bags for swept-up litter and waste that must be picked up later by
the collection service• Brooms, scoops, dustpans, etc.• Personal protective gear such as uniforms, gloves, boots, masks, and so
on
66 | CHAPTER 5 | Street and Beach Sweeping
SE
P
P P P

Integrated Solid Waste Management in Island Regions | 67
The sweeping service cost calculation takes into account the price of equipment, tools, protective equipment, employee wages, etc. Dividing these costs by the number of kilometers swept per day results in USD/km swept per day. This indicator shows how one service compares to standard regional costs, which are around 10 USD/km swept (OPS & OMS, 2005).
The recommended minimum performance level for a combined or mechanical sweeping service is 20 km/machine/day, or what is recommended in the manufacturer’s technical specifications. The number of operating hours between each technical maintenance inspection must be observed to keep the equipment operating efficiently over an extended service life.
© W
WF
/ Mar
celo
Cas
tillo


Integrated Solid Waste Management in Island Regions | 69
CHAPTER 6
Waste Collection and Transportation
A waste collection system is essential in order to maintain good sanitary conditions in towns and cities. This helps prevent bad odors, the propagation of pests, and the spread of liquid contaminants produced from decomposing waste, thus protecting the population’s health and quality of life, as well as the environment. In addition, the methods used to collect and dispose of certain types of waste, such as toxic and hospital waste, should be considered, as they must be managed separately.
1. Design Parameters for Solid Waste Collection ServicesIt is important to review possible solid waste collection methods prior to determining the design parameters of a solid waste collection service. Such methods are classified as follows:2
• Curbside collection• Door-to-door collection• Garbage dumpster collection
The first method is the most common, in which users carry their garbage cans to the curb in front of their house or to the closest place along the garbage collection trucks’ routes. The providers establish the frequency and schedule of this service. Therefore, after the garbage has been collected, it is the users’ responsibility to store their garbage cans back inside their homes. (If plastic bags are used, this step would not be needed.)
2 Adapted from: Subsecretaría de Saneamiento Ambiental del Ecuador 1985.
© W
WF/
Jean
Cla
ude
Con
stan
t

In the second method, garbage collection service personnel remove garbage cans from doorsteps and return them to their place after they have been emptied into the garbage collection truck.
In the third method, dumpsters are placed in specific locations by the service company, and users must put their garbage into these. Subsequently, the dumpsters are emptied into garbage collection trucks that are specially designed for this purpose.
The advantages and disadvantages of each method are described in Table 7.
Source: Paraguassú de Sá, 1985.
Based on this table, it can be concluded that the curbside collection method is a good option due to its cost efficiency. Additionally, this method is well accepted by the community and requires a reasonable amount of operating time when compared to the two other methods. However, suitable storage bins are needed in order to facilitate collection activities. Because of these factors, this is one of the most frequently used methods.
Doorstep collection is considered to be complicated and expensive, and the process is too slow to make adequate use of collection vehicles and work crews. Finally, the use of dumpsters is a feasible option, but community cooperation is essential for the garbage to be left inside the containers. Users sometimes leave their garbage around the dumpster site, which consequently attracts pests such as rats, mosquitoes, etc.
70 | CHAPTER 6 | Waste Collection and Transportation
Table 7 Types of Waste Collection
CHARACTERISTICS COLLECTION PLACE CURBSIDE DOORSTEP DUMPSTER
Amount of time required Average amount of time A lot of time Less time
Assistants per vehicle 2 – 3 3 – 5 1 – 2
Cost Low cost Very high cost Very low cost
Amount of cooperation required Average amount Low amount of Very large from the community of cooperation cooperation amount of cooperation
Spilled waste on streets Average amount of No spilled waste Large amount of spilled waste
External appearance Ordinary appearance Good appearance Poor appearance
Problems with the community None Many problems because None employees must enter people’s properties
Service quality Good Excellent Average

Integrated Solid Waste Management in Island Regions | 71
In some areas that are not easily accessed, dual systems such as curbside collection in conjunction with dumpsters are used.
Once the collection method has been determined, other basic design parameters to be considered are:
• The amount of garbage to be collected• Type of waste to be collected• Frequency and schedule of service provided• Distance to be travelled and work schedule• Type of collection equipment• Formation of work crews
1.1. Amount of Garbage to Be Collected
In Chapter 3, the most commonly used methodologies to determine the amount of garbage produced by a town or city were described. Estimates determining the amount of garbage to be collected are based on values of solid waste production per capita and on population growth.
A key factor in these calculations is the estimation of coverage, established by the amount of waste collected compared to the amount produced. Obviously, global coverage (100%) of a city or region is preferable. However, in general special cases or zones exist where unsuitable roads, steep slopes, poor access routes, or the bad habits of citizens impede complete coverage. Therefore, collection coverage should be as close as possible to the majority of the waste produced.
Another way in which service quality is measured is by the collection service’s geographical coverage. This means, how much of the total area has access to waste collection services. The causes that prevent global coverage would be similar to those previously mentioned.
In the next section Table 8 shows the calculations used for this type of estimation and how to determine the number of trucks needed.
1.2. Types of Waste to Be Collected
Solid waste collection depends on a city’s management decisions and policies. For example, if solid waste is to be sorted at the source in order to implement a recycling process of materials, a differentiated waste collection system is required. Likewise, if waste is to be collected from large producers such as markets, or from domestic or industrial sources, hydraulic dumpster lifting equipment might be needed.
The types of vehicles and dumpsters or bins to be used should be determined depending on the definition of how the waste will be collected.

As such, the following types of vehicles might be needed:• For general waste (which is mixed, cannot be recycled, or has been
rejected), a rear loading garbage collection vehicle with a loading hopper and a hydraulic compacting system is recommended. The compacting system decreases the volume of collected waste and prevents bad odors and the accidental spillage of waste when travelling to landfills or driving on roads.
• For recyclable waste, garbage compactor trucks are not suitable since the compacting process affects the quality of the recyclable material and, consequently, its economic and material value. For these types of materials, trucks with large cargo boxes are recommended, since such materials occupy a lot of space. Trucks with compartments for different kinds of pre-sorted materials can also be used.
• For organic waste, compactor trucks are a good option, since they prevent bad odors and leachate from spilling from the truck.
• For large or mid-sized markets or producers, large dumpsters are recommended which can be lifted by collection vehicles with special hydraulic equipment. Some of these hydraulic devices can be fitted to normal trucks.
1.3. Frequency and Schedule of Services to Be Provided
Service frequency is closely related to cost, since an everyday or regular service increases operating fees. If waste is not to be sorted, daily garbage collection services prove to be too expensive and therefore their frequency should be reduced in order to decrease costs. It is not recommended to provide collection services less than once a week, especially on islands in the tropics with elevated temperatures that favor the degradation of organic materials, resulting in odors and the proliferation of insects and rodents.
Frequency is defined by the number of days per week on which garbage is collected. The following formula is applied:
Where:
f = frequency. Where this is equal to 6/6, this means that the service is provided on a daily basis. Where it is equal to 6/3, the service is provided every other day. Where it is equal to 6/2, it is a biweekly service, and 6/1 corresponds to a weekly service. Please note that only 6 days per week are considered, because services are usually not provided on Sundays. Therefore, the amount of waste to
f = 6
n
72 | CHAPTER 6 | Waste Collection and Transportation

Integrated Solid Waste Management in Island Regions | 73
be collected every other day, for example, would be equal to the number of daily tons times 6/33
n = collection days per week
Another factor that must be decided is the collection schedule, which is based on people’s habits, meteorological factors, and the need to optimize the use of garbage trucks. For example, if temperatures are high during the day, nighttime and evening garbage collection is recommended. This option has been implemented in many cities due to the smaller volume of traffic and pedestrians at night, which decreases the down time on collection routes. However, it is difficult for users to place garbage cans on curbs when they are resting, and nighttime collection results in noise that can disturb clients.
In other cases, for example when there is an insufficient number of collection trucks, services are provided in one area in the morning and in other areas at night. Obviously, this option shortens the service life of equipment because of the additional hours included in its work schedule.
1.4. Distances to be Travelled and Work Schedule
Decisions about collection services also depend on the location of the collection vehicle garages and of the final dumping site. Based on distances and on the amount of time required, the actual time needed for trips on the corresponding routes should be established so that it will fit within official work schedules, so as to avoid additional costs being incurred due to overtime payments.
1.5. Types of Collection Equipment and Work Crews
The type of equipment to be selected depends on a series of criteria. The use of compactor trucks is not always the most appropriate option.
Currently, there is a wide range of collection equipment for solid waste provided by several companies. In addition, different types of collection vehicles have been developed for areas that are not easily accessed. Low cost systems also exist, operated by micro-businesses or other community organizations. In short, some of the most common options are:
• Rear loaders with hydraulically powered compactors and lifting loading and unloading/empty mechanisms
• Rear loaders with hydraulically powered compactors and no lifting loading and unloading/empty mechanisms
3 Practical studies have proven that the amount of waste collected every other day is not double the daily amount, but that waste production increases by 60% to 70% when collected daily. Therefore, when the frequency of garbage collection is changed from a daily collection to an every-other-day collection, the fleet’s savings range from 60% to 70%, allowing the expansion of coverage to new areas.

• Trucks that do not have any hydraulically powered compactors or loading or unloading mechanisms
• Other options such as tricycles, wagons, etc.
As described in Chapter 3, one of the main design parameters and factors to be considered when selecting equipment is the specific weight of the garbage. Domestic solid waste has low specific weight, which generally ranges from 200 to 300 kg/m3.
Therefore, if five tons are collected and transported using a non-compactor truck, for example, a space of around 20 m3 would be needed, in accordance with this formula:
Where:
∂ = Dimensional weight in kg/m3
P = Weight of solid waste in kgV = Volume in cubic meters
Volume is equal to the following formula:
If a dimensional weight of 250 kg/m3 is assumed, then:
The result obtained for 20 m3 would mean that a cargo box of at least 5 x 2 x 2 m would be needed. These dimensions would not be manageable if a larger quantity were to be collected. In this case, it would be more convenient to use compactor trucks, with compacting capacities ranging from a 2-to-1 ratio to a 4-to-1 ratio. This means that the waste volume is mechanically reduced to half or even to one-fourth of the original volume. Another advantage of this equipment is its mechanical loading capacity by means of an ejector plate, which facilitates the emptying of the vehicle into the landfill area, decreasing down time.
This type of vehicle should be selected carefully, requiring an in-depth review of technical specifications from suppliers. It would be preferable for these vehicles to have an integrated storage system for liquids produced by the process of compacting waste, especially if very moist organic matter is to be handled.
∂ = P V
V = P
∂
V = 5,000 Kg
250 Kg/m3
74 | CHAPTER 6 | Waste Collection and Transportation

Integrated Solid Waste Management in Island Regions | 75
One disadvantage of these vehicles is that they are very expensive and operating costs increase if the compaction unit capacity is not completely used. The collection vehicle’s operating costs do not depend on the number of tons collected, but rather on fuel, lubricants, equipment depreciation, and personnel expenses (drivers and assistants). These expenses will be incurred regardless of the number of tons to be transported. The cost per collected ton will be minimized if the quantity is equal to the maximum capacity of the vehicle.
The compaction boxes of these vehicles come in different sizes, which will affect their capacity and the size of the chassis. Another important fact is the turning radius of vehicles, particularly the large ones, which can limit their use in cities with narrow streets and in rural topography.4
In any case, the use of mechanical unloading systems for dumping the waste at a landfill site is recommended. Otherwise, the amount of time needed for manual unloading must also be taken into account. In this case, special equipment could be included inside the boxes in order to facilitate such tasks, for example, sloped floors and lateral doors might be used.
Finally, it is worth mentioning that other types of vehicles have been used, such as wagons pulled by animals, agricultural tractors with bins, bicycles with small baskets, hand-pushed tricycles, etc. Each of these has advantages and disadvantages depending on various factors corresponding to the places in which they have been implemented. A standard performance should be established and time and motion studies should be undertaken in order to estimate costs for each option and to calculate actual service costs. It is advisable to compare several options so as to best determine which one is the most advantageous for the place in which it will be implemented.
Once the type of vehicle to be used has been decided, the size of the work crew may be established. In some cases, the size of the crew may vary by increasing the number of workers for peak garbage production days. The indicator that will help decide is tons/assistant*day. The standard regional value is 4.5 to 5.0 tons/assistant per day.5
4 For an in-depth analysis of the issue of garbage collection vehicle selection, see Arevelo 1983.
5 Values estimated for a compactor truck with a capacity of 14 m3, two trips, and the curbside collection method. Source: Paraguassú de Sá 2002.
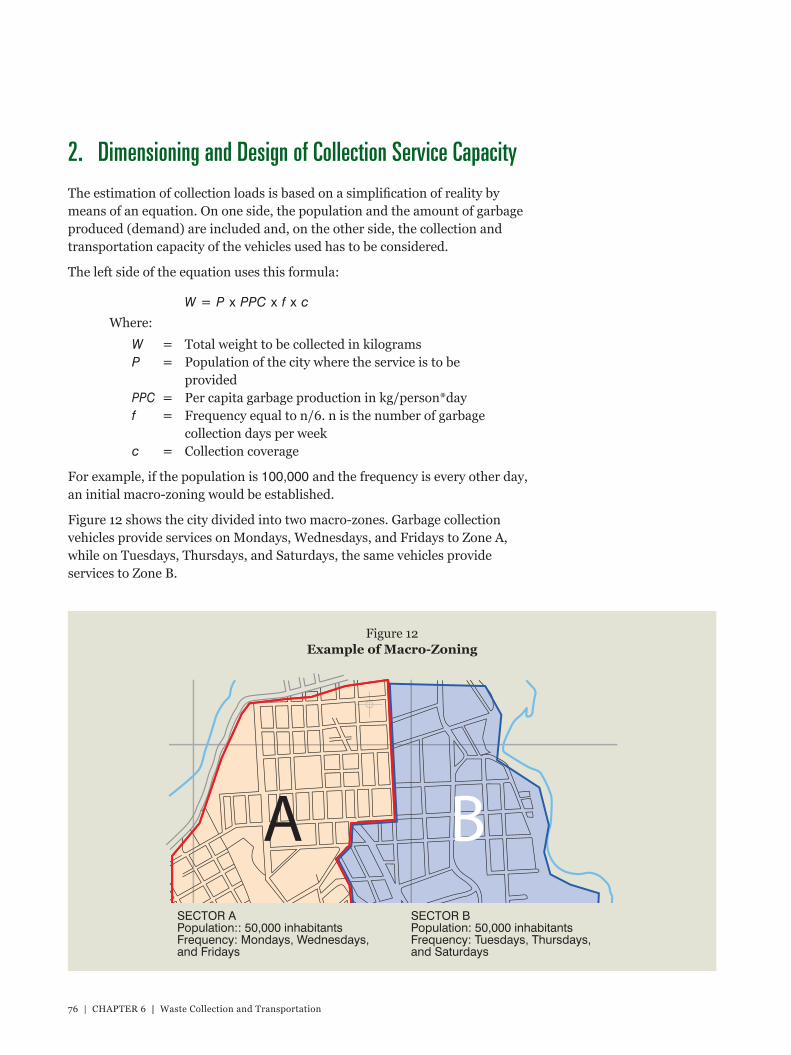
A B
2. Dimensioning and Design of Collection Service CapacityThe estimation of collection loads is based on a simplification of reality by means of an equation. On one side, the population and the amount of garbage produced (demand) are included and, on the other side, the collection and transportation capacity of the vehicles used has to be considered.
The left side of the equation uses this formula:
Where:
W = Total weight to be collected in kilogramsP = Population of the city where the service is to be
providedPPC = Per capita garbage production in kg/person*dayf = Frequency equal to n/6. n is the number of garbage
collection days per weekc = Collection coverage
For example, if the population is 100,000 and the frequency is every other day, an initial macro-zoning would be established.
Figure 12 shows the city divided into two macro-zones. Garbage collection vehicles provide services on Mondays, Wednesdays, and Fridays to Zone A, while on Tuesdays, Thursdays, and Saturdays, the same vehicles provide services to Zone B.
W = P x PPC x f x c
Figure 12 Example of Macro-Zoning
76 | CHAPTER 6 | Waste Collection and Transportation
SECTOR APopulation:: 50,000 inhabitantsFrequency: Mondays, Wednesdays, and Fridays
SECTOR BPopulation: 50,000 inhabitantsFrequency: Tuesdays, Thursdays, and Saturdays

Integrated Solid Waste Management in Island Regions | 77
The following data is used to be able to estimate the number of vehicles: If the population equals 50,000 inhabitants with a PPC of 0.60 kg/person*day; the collection frequency is every other day; and the expected coverage is 90%; then the weight to be collected would be:
W = 50,000 x 0,60 x x 0,90
W = 54,000 Kg or 54 Ton/day (when collection services are provided)
The right side of the equation is used to determine the required number of collection vehicles. The formula used is:
F = No x V x ∂ x g x N x T
Where:
No = Number of vehiclesV = Volume of the compaction box in cubic meters∂ = Dimensional weight of non-compacted garbage in kg/m3
g = Compaction ratio or degree of the compaction equipmentN = Number of trips per shiftT = Number of work shifts per day
The following data is used in this example: trucks will have a capacity of 13 m3; the dimensional weight determined by studies on the quality and quantity of produced garbage is 250 kg/m3; and the compaction ratio specified in manufacturer’s catalog is two-to-one. Two trips will be made per shift per day. Since 54,000 kg must be collected, the number of required vehicles is:
54,000 = No x 13 x 250 x 2 x 2 x 1
No = 54,000
No = 4.15 garbage collection trucks
Therefore, 4 collection trucks with a capacity of 13 m3 would be needed. For safety reasons, it is recommendable to always have 10% of vehicles on standby. In this example, this would mean one additional garbage truck.
The zoning design for the service can be drawn up using the same equation. In this case, the unknown variable is the number of people to whom one garbage collection truck can provide services. In the example, a vehicle with a capacity of 13 m3 is used. The previous example’s data will be used to determine the number of people to whom one garbage truck can provide services.
P x ppc x f x c = No x V x ∂ x g x N x T
P x 0.60 x x 0.90 = 1 x 13 x 250 x 2 x 2 x 1
P = 12,037 inhabitants
6
3
13,000
P = 13,000
1.08
6
3

Source: EPA, 1974.
Based on the assumed conditions, one vehicle can provide services to 12,000 inhabitants. In terms of macro-zoning, this can be defined using information on population density.
Where:
A = Area in which services will be provided in hectaresP = Population∂p = Population density in number of people per hectare
This design should be tested to verify the time required for trips, based on indicators of tons/hour, speed, and distances.
The time required for various workday tasks should also be considered. A few examples include: time needed to leave the garage; time until the trip is started; time needed to travel to the landfill; time to unload the garbage into the landfill; time needed to start the second trip; time to unload the second garbage load; and time to return to the garage, store, and clean the equipment.
Once zoning has been determined, a micro-route can be designed for which the heuristic method is the most appropriate. A micro-route is the route that the vehicle will travel within the zone where services are to be provided. Several tests will be carried out until the design with the best operating advantages, optimized times, and distances are defined.
Some examples of micro-routes are shown in Figures 13, 14, 15, 16, 17, 18, 19, and 20.
Figure 13 Example of a Micro-Route with Four Blocks and Two-Way Streets
A = P ∂p
78 | CHAPTER 6 | Waste Collection and Transportation
Start
End

Integrated Solid Waste Management in Island Regions | 79
Source: EPA, 1974.
Source: EPA, 1974.
Source: EPA, 1974.
Figure 14 Example of a Micro-Route with Three Blocks and Two-Way Streets
Figure 15 Example of a Modified Micro-Route with Three Blocks and Two-Way Streets
Figure 16 Example of a Micro-Route for an Area that has 4 x 4 Blocks and Two-Way Streets
Start
End
StartEnd
StartEnd

Source: EPA, 1974.
Source: EPA, 1974.
StartEnd
Figure 17 Example of a Micro-Route for an Area that has 6 x 4 Blocks and Two-Way Streets
Figure 18 Example of a Micro-Route for an Area that has 6 x 8 Blocks and Two-Way Streets
80 | CHAPTER 6 | Waste Collection and Transportation
Start End

Integrated Solid Waste Management in Island Regions | 81
Source: EPA, 1974.
Source: EPA, 1974.
Start
End
Garage
Start
End
Garage
Figure 19 Example of a Micro-Route for an Area that has irregularly-shaped Blocks and Two-Way Streets
Figure 20 Example of a Micro-Route for an Area that has irregularly-shaped Blocks and Two-Way Streets

It should be emphasized that population growth will make annual re-estimation of the required number of garbage collection trucks necessary, so as to increase the number of vehicles if the service coverage is to be maintained or extended. The estimation process is shown in Table 8.
Table 8 shows that 10% of the vehicle fleet is on standby, which corresponds to one additional garbage collection truck in this example. This vehicle is indispensable if one of the main vehicles breaks down or must be repaired. In 2016, an additional vehicle will be needed, and in 2017 six of the vehicles bought in 2010 must be replaced, assuming a service life of eight years. For this reason, depreciation costs must be considered so that there will be sufficient funds to replace the vehicles when their service life ends.
Example for Dimensioning the Capacity of the Collection System
COMMUNITY DIMENSIONINGOFCOLLECTIONCAPACITY
GENERALINFORMATIONPOPULATION IN 2010 50,000PERIOD CORRESPONDING TO THIS DESIGN 10TOTAL PPC 0.600ANNUAL GROWTH RATE OF PPC 0.005TCD = ANNUAL POPULATION GROWTH RATE 2.5%TYPE OF COLLECTION CURBSIDECAPACITY OF GARBAGE COLLECTION VEHICLES 6.5 TONS – BOX CAPACITY = 13 m3 (17 yd3)NUMBER OF TRIPS / SHIFT 2.0NUMBER OF SHIFTS 1FREQUENCY EVERY OTHER DAYASSUMED COVERAGE 90%
YEAR NUMBER INHABITANTS PPC TONS TONS AMOUNT OF STANDBY TOTAL REPLACEMENT OF YEARS PRODUCED COLLECTED GARBAGE VEHICLES NUMBER OF PER DAY PER DAY COLLECTED VEHICLES
2010 0 50,000 0.600 60.00 54.00 5.00 1.00 6.0
2011 1 51,250 0.605 62.01 55.81 5.00 1.00 6.0
2012 2 52,531 0.610 64.09 57.68 5.00 1.00 6.0
2013 3 53,845 0.615 66.23 59.61 5.00 1.00 6.0
2014 4 55,191 0.620 68.44 61.59 5.00 1.00 6.0
2015 5 56,570 0.625 70.71 63.64 5.00 1.00 6.0
2016 6 57,985 0.630 73.06 65.76 6.00 1.00 7.0
2017 7 59,434 0.635 75.48 67.93 6.00 1.00 7.0 6.0
2018 8 60,920 0.640 77.98 70.18 6.00 1.00 7.0
2019 9 62,443 0.645 80.55 72.50 6.00 1.00 7.0
2020 10 64,004 0.650 83.21 74.89 6.00 1.00 7.0
82 | CHAPTER 6 | Waste Collection and Transportation
Table 8

Integrated Solid Waste Management in Island Regions | 83
3. Service CostsService costs must be rigorously controlled and monitored since they are one of the most expensive components of service (ranging from 60% to 80% of global service costs). It is crucial to have an adequate supervision system in place to continuously monitor the operation of services because the fleet capacity is frequently used in an inefficient manner, causing a significant increase in the cost per collected ton.
Supervision must be carried out constantly and at random. In addition, a route sheet must be used to register the main features of the workday, as described in Chapter 4. This is an essential source of information on actual service indicators, so that operating adjustments can be made to attain the best equipment efficiency.
The costing system must consider the following aspects:• Investment costs, including the replacement of equipment at the end of
its service life• Capital or depreciation costs, in order to have sufficient funds to replace
vehicles at the end of their service life• Human resource costs, which include payments made to drivers,
garbage collection assistants, supervisors, and clerical staff, along with management costs
• Control and record-keeping of equipment operating costs such as fuel, lubricants, upkeep, etc. Since equipment is a key factor in the service, it must be well taken-care-of, as it is quite expensive. Routine maintenance will therefore take place at the mileage specified by the manufacturer. Records must be updated with information on maintenance that has been carried out and that will be needed in the future so that standby vehicles may take over from the main ones during maintenance procedures. Likewise, it is important to carefully select the drivers, hiring careful and responsible people to use this equipment.
• Cost of uniforms, tools, personal safety equipment, etc.• Payments required on any pending loans• The cost per ton, which will be estimated by adding all actual annual
service costs and dividing this number by the amount of collected tons. This value has to be monitored each year in order to optimize the performance of the service.
An example of these estimates is shown in Table 9.

Table 9 Example on How to Estimate Service Costs
COMMUNITY DIMENSIONINGOFGARBAGECOLLECTION
GENERALINFORMATION:
NUMBER OF EMPLOYEES PER GARBAGE COLLECTION 2 Employees TRUCK (12 m3)
NUMBER OF EMPLOYEES PER LIGHTWEIGHT TRUCK 2 Employees (6 m3)
COST OF A 12 m3 GARBAGE COLLECTION 120,000 US$
COST OF A 6 m3 TRUCK 70,000 US$
DRIVER’S MONTHLY SALARY 235 US$
ASSISTANT’S MONTHLY SALARY 241,09 US$
A PERCENTAGE OF THIS AMOUNT IS RESERVED 10% FOR ASSISTANTS AND DRIVERS
REQUIRED COLL. TRUCKS INVESTMENTCOSTS OPERATINGCOSTSEXCLUDINGCAPITALCOSTS YEAR COLL. TRUCKS FOR EMPLOYEES DRIVERS COLL. 6m3 INVEST- UNIFORMS SALARIES GARBAGE DIFF. OPERATING TRUCKS TOBE MARKET 12m3 TRUCKS MENTS AND COLL. GARB. COSTS PURCHA- GARBAGE TOOLS TRUCK COLL. SED COLLECTION TRUCK
2007 2 1 0 5 3 120,000 0 120,000 1,703.25 22,925.40 45,894.16 0 70,312.81
2008 2 0 0 5 3 0 0 0 1,703.25 22,925.40 45,894.16 0 70,312.81
2009 2 0 0 5 3 0 0 0 1,703.25 22,925.40 45,894.16 0 70,312.81
2010 2 0 0 5 3 0 0 0 1,703.25 22,925.40 45,894.16 0 70,312.81
2011 2 1 0 5 3 120,0000 0 120,000 1,703.25 22,925.40 45,894.16 0 70,312.81
2012 2 1 0 5 3 120,0000 0 120,000 1,703.25 22,925.40 45,894.16 0 70,312.81
2013 2 0 0 5 3 0 0 0 1,703.25 22,925.40 45,894.16 0 70,312.81
2014 2 1 0 5 120,000 0 120,000 1,703.25 22,925.40 45,894.16 0 70,312.81
2015 2 0 0 5 3 0 0 0 1,703.25 22,925.40 45,894.16 0 70,312.81
2016 2 0 0 5 3 0 0 0 1,703.25 22,925.40 45,894.16 0 70,312.81
2017 2 0 0 5 3 0 0 0 1,703.25 22,925.40 45,894.16 0 70,312.81
2018 3 1 0 7 4 120,000 0 120,000 2,342.75 31,531.56 68,526.24 0 102,400.55
2019 3 2 0 7 4 120,000 0 120,000 2,342.75 31,531.56 68,526.24 0 102,400.55
2020 3 0 0 7 4 240,000 0 240,000 2,342.75 31,531.56 68,526.24 0 102,400.55
2021 3 0 0 7 4 0 0 0 2,342.75 31,531.56 68,526.24 0 102,400.55
2022 3 0 0 7 4 0 0 00 2,342.75 31,531.56 68,526.24 0 102,400.55
84 | CHAPTER 6 | Waste Collection and Transportation

Integrated Solid Waste Management in Island Regions | 85
COSTSOFUNIFORMS COSTSTOOPERATEONE12m3GARBAGECOLL.TRUCK
ITEM Amount/year Price Total ITEM UNITS QUANTITIES COST ANNUALCOST
Uniforms 2 20 40 Diesel Gallons 3,744 1.20 4,492
Raincoats 1 15 15 Lubricants GLOBAL 1 449.28 449.28
Hard hats 2 12 24 Batteries UNITS 1 150 150
Leather boots w/tip 2 30 60 Tires UNITS 7 250 1,750
Leather gloves 12 5 60 Upkeep GLOBAL 1 12,000 12,000
Support belts 1 10 10 License plates GLOBAL 1 4,000 4,000 and insurance
Subtotal 209 Subtotal 22,842.08
COSTSOFTOOLS COSTOFTRUCKS(MARKETS)
ITEM Amount/year Price Total ITEM UNITS QUANTITIES COST ANNUALCOST
Brooms 0.5 2.50 1.25 Diesel Gallons 3,120.00 1.30 3,744.00
Shovels 0.5 10.00 5.00 Lubricants GLOBAL 1.00 374.40 374.40
- Batteries UNITS 1.00 150.00 150.00
Subtotal 6.25 Tires UNITS 7.00 240.00 1,680.00
Total costs of uniforms and tools 215.25 Upkeep GLOBAL 1.00 7,000.00 7,000.00
License plates GLOBAL 1.00 2,800.00 2,800.00 and insurance
Subtotal 15,748.40
ESTIMATIONOFCAPITALCOSTS COSTOFEACHCOLLECTEDTON
ITEM GARB. COLL.TRUCKS YEAR COLL.TONS/DAY TONS/YEAR
Cost of the vehicle 70,000 100,000 2007 15.01 5,478.65
Service life 8 8 2008 15.43 5,631.95
Replacement costs 0 0 2009 15.86 5,788.90
Interest 0.08 0.08 2010 16.29 5,945.85
Annual depreciation 8,750 12,500 2011 16.74 6,110.10
Capital Costs 12,181.03 17,401.48 2012 17.21 6,281.65
2013 17.68 6,453.20
2014 18.17 6,632.05
2015 18.67 6,814.55
2016 19.19 7,004.35
2017 19.72 7,197.80
2018 20.26 7,394.90
2019 20.82 7,599.30
2020 21.39 7,807.35
2021 21.98 8,022.70
2022 22.10 8,066.50


Integrated Solid Waste Management in Island Regions | 87
CHAPTER 7
Disposal of Garbage
The last stage in the waste management system is the final disposal of the collected garbage and the waste produced by treatment processes.
Very often, facilities for processing, treating, and transforming are utilized in order to improve the characteristics of waste before it is finally disposed of (for example, garbage may be ground down or recycled). Waste may be modified to decrease its toxicity or to make it suitable for other processes, such as incineration, composting, etc.
Of all the types of processes that can be implemented before the final disposal of waste, physical, thermal, and biological processes can be mentioned:
Physical treatments may include:
• Sorting of solid waste components: This entails manual or mechanical sorting processes, with the goal of homogenizing waste mass in order to recover recyclable and reusable materials, such as paper, plastic, cardboard, etc. Certain dangerous materials or irritants can be removed, such as batteries, tires, etc. There are additional details on this component in Chapter 8.
• Mechanical volume reduction: The goal is to decrease the initial volume occupied by garbage by exerting pressure. One example is a landfill, where garbage is compacted in order to increase the capacity of landfills.
• Mechanical size reduction: Uses mechanical equipment to obtain a uniform end-product with a smaller size than the original. One application of this process is the separation of large articles, which can be useful at recycling plants. Examples of the equipment used for this include hammer-, wood-, and glass-grinders.
© W
WF/
FTG
© W
WF
/ Ver
ónic
a To
ral-G
rand
a

The goal of thermal treatment is to reduce the volume or toxicity of waste and to use waste to generate energy. The combustion process must be controlled and technically managed to minimize any adverse effects of the process, such as the production of toxic gases. Thermal treatment has many advantages: weight and volume reduction ranging from 80% to 90%; short residence times; stabilized ashes; and less space occupied in landfills. Detracting from these advantages, special equipment is needed, which has high operating and investment costs, and a landfill site is also required to deposit the ashes. In some cases, residues are taken for energy recycling and are put to use as an alternative fuel. This equipment is patented and, in general, requires a large amount of residues to justify its great cost.
Biological treatment relies on the fact that certain materials and contaminants contained in waste products are substrates or food for bacterial populations and other microorganisms that break down these compounds into simpler substances during their feeding process. These substances can be absorbed by nature or used as raw material for other processes, such as the production of biogas. There are two types of biological processing, differentiated by the type of respiration of the organisms involved in the process. The two types are aerobic and anaerobic:
• The aerobic process is characterized by the presence of oxygen. The end-products are mainly water, carbon dioxide, and heat, which can be useful to eliminate the pathogenic organisms that live in residues. This process is explained in more detail in Chapter 10.
• Anaerobic respiration occurs in the absence of oxygen and is a slower process. The main end-products are mineral compounds, carbon dioxide, and methane. Another of its characteristics is the production of bad smells.
As described, although different types of treatments can be applied to solid waste, a final place will always be needed to dispose of waste that cannot be otherwise treated. Landfill technology has been developed in order to manage and dispose of waste in a definitive and appropriate manner so as to minimize its environmental impact. This is even more important given the fact that most waste is deposited directly into the soil without any preliminary processing or treatment and, quite often, there are no adequate protection measures to prevent the contamination of the soil, water, and air.
1. Processes That Occur Within a Sanitary LandfillA sanitary landfill (known simply as a landfill) is a reactor, i.e., a place where several physical, chemical, and biological processes take place between extremely heterogeneous internal elements. The landfill’s content varies depending on its location, the processing of residues, and the types and characteristics of deposited solid waste.
88 | CHAPTER 7 | Disposal of Garbage

Integrated Solid Waste Management in Island Regions | 89
Because of this, it is necessary to be aware of what happens inside a reactor in order to predict its behavior and take adequate control measures. A synthesis is given below of the complex activities and reactions that occur within a sanitary landfill.
Rainwater penetrates the whole landfill, causing a dilution process of its substances, producing leachate. Absorption and desorption processes and pH changes occur, as well as the dragging of particles with salinity changes, potential reduction of oxides, etc.
Biological processes are also extremely complex, since organic matter is broken down by several types of microorganisms specialized in the diverse compounds produced during the process. Most of the degradation is anaerobic, due to the depth of cells and platforms where there is no oxygen (Robles Martinez, 2008).
The anaerobic degradation process has four stages:• Hydrolysis• Acidogenesis• Acetogenesis• Methanogenesis
In the hydrolytic stage, the solid waste’s organic matter, which is usually in a solid state, hydrolyzes. This means that substances with a high molecular weight (polysaccharides, lignin, proteins, nucleic acids, and lipids) transform into simpler substances such as peptones, amino acids, simple sugars, organic acids, and alcohols.
In the stage of acidogenesis, fatty acids, amino acids, and sugars are degraded by acidogenic bacteria into alcohols, CO2, H2, and volatile fatty acids. Subsequently, amino acids are degraded into volatile fatty acids, CO2, and NH3.
During the stages of hydrolysis and of acidogenesis, the landfill’s pH decreases, and there is an elevated organic content in leachate.
In the stage of acetogenesis, acids and alcohols produced in the previous stage are transformed into acetates, carbonic acid, and hydrogen gasses by acetogenetic bacteria. This is a very slow process.
The methanogenic stage occurs in strict anaerobic conditions, in which acetic acid and methanol are transformed into carbonic acid and methane gas (CH4).
Within the sanitary landfill, during the acetogenetic and methanogenic stages, the pH gradually increases, the organic content of leachate decreases, and biogas and methane are produced in increasing quantities. When the landfill matures, the organic matter stabilizes and biogas production decreases since substrates have been depleted.

Based on these descriptions, when solid waste is confined within a sanitary landfill, several byproducts are created (such as biogas and leachate) that are specific to the process of organic matter degradation. Such byproducts must be carefully managed in order to prevent environmental contamination.
2. Definition of Sanitary Landfill ConceptsVarious concepts related to sanitary landfills are defined below.
According to Mexican standards, a sanitary landfill is defined as “a piece of infrastructure that involves engineering methods and projects for the final disposal of solid municipal waste and specially-managed waste, in order to limit environmental impacts by means of compaction and other infrastructures” (NOM-083-SEMARNAT-2003).
The American Society of Civil Engineers (ASCE) proposes the following definition:
A landfill is a technique used for the disposal of garbage in soil, without causing negative environmental impacts or risks to health and public safety. This method uses engineering principles to confine garbage to the smallest possible area, reducing its volume as much as possible, and to cover the garbage deposited in this way with a layer of soil as frequently as required, which should be done at least at the end of each working day.
On the basis of the aforementioned definitions, it is clear that a landfill requires technical design and management in order to confine the largest amount of solid waste (urban and special waste where applicable) in the soil, to compact it, and to implement several components to control or minimize any environmental impact and adverse effects on health in order to comply with local legal requirements.
One issue that the above concepts do not touch upon is the need to undertake an in-depth analysis to decide on the location of a new sanitary landfill.
90 | CHAPTER 7 | Disposal of Garbage

Integrated Solid Waste Management in Island Regions | 91
Surface level of the soil
TRENCH METHOD
AREA METHOD
COMBINED METHOD
Surface level of the soil
Surface level of the soil
3. Types of Sanitary Landfills According to the type of solid waste to be disposed of, landfills are classified in the following manner:
• Common sanitary landfills. These are landfills for solid urban waste, which is similar in nature to domestic waste, so there are no toxic or dangerous residues
• Protected sanitary landfills for toxic or dangerous residues
Depending on the shape of the body or vessel of the landfill, it can be classified in the following manner:
• Trench landfill• Area landfill• Combined landfill
Figure 21 Types of Landfills

The trench method consists of digging under the surface level of the soil in order to deposit waste in this space. The removed material can later be used to cover cells. The main disadvantages are greater costs for soil movement, and, pumping work that is quite often needed to remove leachates.
The area method takes advantage of slightly sloped land to create a landfill on its surface. This is a good option that facilitates the handling of leachate. If no covering materials are available nearby, however, operating costs can sometimes increase.
The combined method is used most frequently and combines the two previously mentioned methods. This method optimizes the use of the area available for sanitary landfills.
Depending on the equipment to be used, landfills are classified in the following manner:
• Manual landfills• Semi-mechanical landfills• Mechanical landfills
In accordance with the “Handbook on the Design, Construction, and Operation of Manual Sanitary Landfills” (Jaramillo, 2002), referential values that define the operating methods of landfills have been established:
• A manual landfill is recommended for populations that produce less than fifteen tons of garbage per day. The main argument for this type of landfill mentioned by the author is the lack of financial resources for investment and operating costs of mechanical equipment.
• A semi-mechanical landfill is recommended for populations that produce between sixteen and forty tons of garbage per day. The use of mechanical equipment would be for specific activities such as the compacting of residues. Other tasks can be carried out manually.
• A mechanical landfill is recommended for populations that produce more than forty tons of garbage per day.
As explained below, determining the operating method is a key factor of the decision-making process for the implementation of a sanitary landfill in order to compare investment and operating costs with the compaction ratio and the service life of the landfill.
92 | CHAPTER 7 | Disposal of Garbage

Integrated Solid Waste Management in Island Regions | 93
4. Components of Sanitary LandfillsOnce the main byproducts of these types of facilities have been considered, the principle components of landfills can be described:
• Platforms where solid waste will be disposed can either be dug or constructed on the surface of the land.
• Depending on geological and geotechnical studies, a foundation for the landfill must be prepared to prevent contamination through the infiltration of leachate to lower layers of soil. In the example given, a geomembrane has been used to protect the soil.
• Leachate collection, removal, and treatment system; the main collector is located in the lower border of the landfill.
• Solid waste cells that have been duly compacted are located on top of the platforms.
• In the upper part, there are crest ditches and the diversion of water runoff, as the latter might enter the landfill. It must be emphasized that the lower the quantity of water that enters the landfill, the lower the quantity of generated leachate.
• Access roads are needed to allow collection trucks to enter the site to unload waste.
• A screen of vegetation will be used to isolate the landfill site from its surroundings. As well as helping to visually isolate the landfill, this component also prevents that loose material gets blown away, such as paper and plastic, to places beyond the landfill.
• A perimeter fence to prevent people and animals from entering the landfill site is needed.
• Monitoring wells must be installed to establish whether contamination of groundwater occurs through the migration of leachates from the landfill.
• Chimneys and methane burners are needed to control the discharge of landfill gas and eliminate methane.

LININGSYSTEM
MAINDRAINAGE
Fence
Screen of vegetation
Chimney
Platform
Access road
Ditch
Monitoring well
GravelSand
Geomembrane
Gravel
Fine sand
Pipe
Waste
Soil
In Figure 22, the following components are not shown: a hut for the security staff (and visitors’ sign-in), a truck scale, warehouses, a maintenance facility, administrative offices, and leachate treatment facilities. Some of these components are optional, such as the maintenance facility and the truck scale, since their construction will depend on the size of the landfill and on the number of tons to be handled. The management and treatment of leachates, however, is always essential in order to comply with legal regulations.
The following types of drainage systems exist:• Herringbone pattern• Longitudinal
Figure 22 Components of Sanitary Landfills
94 | CHAPTER 7 | Disposal of Garbage

Integrated Solid Waste Management in Island Regions | 95
3%
3%
3%
3%
3%
3%
3%
3%
3%
3%
3%3%
3%
Secon
dary
draina
ge
Secon
dary
draina
ge
Herringbone drainage patterns have a main drainage component consisting of a perforated pipe and granular material to facilitate the drainage of leachate. Generally, the drainage is covered with a geotextile liner to prevent the granular material from getting blocked by fine particles. The secondary drainage component is placed at a 45° angle from the main drainage component, and the distance between secondary branches might range from twenty-five to thirty m. The suggested slope for the drainage system is 3% and the secondary drains should also have 3% slopes.
The longitudinal drainage system works on the same principles, with the difference being that the secondary drainage components join the main drainage component at a 90° angle. The main drainage component is situated in the lowest part of the landfill site.
5. Estimation of the Size of the Sanitary LandfillThe key factor to increase the service life of a landfill is the compacting of solid waste within platforms built for this purpose, as described in previous paragraphs. Equipment that will increase the compaction ratio is needed to allow waste densities within landfills to reach values of 700 kg/m3 or greater.
Densities in the range of 500 kg/m3 are recommended for manual landfills (Jaramillo, 2002).
Figure 23 Some Patterns of Drainage Systems for Leachate

Table 10 Estimation of a Landfill’s Area
GENERALINFORMATION
Compacted density of the landfill: 500 Kg/m3
Percentage of the volume to be covered: 20% of the volume of solid waste
Average height of the landfill: 6 meters
Additional percentage of the area to be used for facilities: 20% of the net area of the landfill
YEAR SOLID WASTE SOLID WASTE DOMESTIC DOMESTIC ACCUMULATED ACCUMULATED TOTAL TOTAL TOTAL SOLIDWASTE SOLIDWASTE VOLUMEOF TOTALVOLUME REQUIRED TONS/DAY TONS/YEAR CUBICMETERS CUBICMETERS SOLIDWASTE m3YEAR AREA(Ha.) (m3)/DAY (m3)/YEAR m3 YEAR
2010 2.42 883.19 4.84 1,766.38 1,766.38 2,119.66 0.04
2011 2.59 945.01 5.18 1,890.01 3,656.39 4,387.67 0.09
2012 2.77 1,009.93 5.53 2,019.85 5,676.24 6,811.49 0.14
2013 2.96 1,078.98 5.91 2,157.97 7,834.21 9,401.05 0.19
2014 3.17 1,155.55 6.33 2,311.10 10,145.31 12,174.38 0.24
2015 3.38 1,232.71 6.75 2,465.44 12,610.75 15,132.91 0.30
2016 3.61 1,318.18 7.22 2,636.36 15,247.11 18,296.53 0.37
2017 3.86 1,408.34 7.72 2,816.69 18,063.80 21,676.56 0.43
2018 4.13 1,507.27 8.26 3,014.53 21,078.33 25,294.00 0.51
2019 4.42 1,612.05 8.83 3,224.09 24,302.42 29,162.91 0.58
2020 4.72 1,722.42 9.44 3,444.85 27,747.27 33,296.73 0.67
2021 5.04 1,839.50 10.08 3,679.01 31,426.28 37,711.54 0.75
2022 5.39 1,967.03 10.78 3,934.06 35,360.34 42,432.41 0.85
2023 5.76 2,101.45 11.51 4,202.89 39,563.23 47,475.88 0.95
2024 6.16 2,247.54 12.32 4,495.08 44,058.31 52,869.97 1.06
2025 6.58 2,402.12 13.16 4,804.24 48,862.56 58,635.07 1.17
96 | CHAPTER 7 | Disposal of Garbage

Integrated Solid Waste Management in Island Regions | 97
One intrinsic factor in the selection of this parameter is the selection of required equipment, taking into account that compaction will be directly related to the equipment’s weight, which is transmitted to the cells by means of its caterpillar tracks. As such, the number of times that the equipment must pass over the waste mass to achieve the required compaction ratio becomes more important.
Another factor that is dependent on the equipment available is the height of the cell. For example, with heavy and powerful equipment such as landfill compactors and heavy trucks, it would not be difficult to build cells of up to five meters in height (with compacted garbage). If the landfill is operated manually, one-meter high cells (made from compacted garbage) would probably work better, built by compacting residues using wood rammers or half-full fifty-five-gallon tanks, etc.6
After defining the type of operations to be carried out at the landfill, its size is estimated to define the required area to build the sanitary landfill.
In Table 10, the estimation of the required area is shown for a manually operated landfill with fifteen years of service life. The height of cells will be one meter, with a maximum landfill height of six meters. It is estimated that 20% of the landfill volume corresponds to the covering material used to cover cells each day. Additionally, 20% of the area will be needed for roads.
According to estimates in the example, a property of 1.2 hectares, or 12,000 m2 would be needed. For the same example, but compacting the garbage using a skid loader that is able to compact 700 kg/m3, the area required would be 0.84 hectares, or 8,400 m2.
6. Defining the Location of the Sanitary Landfill Once the required area has been defined, the landfill’s location can be determined, depending on available options. Two methods are used for this (Collazos, 2005):
• Knowledge about the area• Use of overlapping maps
In the case the method of knowledge about the area, in some places available sites have been already earmarked for building this type of infrastructure. There are municipal employees who have accumulated in-depth knowledge of the region in the course of their work. They will therefore know of possible landfill sites. Obviously, these sites must be submitted for technical analysis before a final decision is made.
6 For additional information on manual landfills, please see Cantanhede y Sandoval 1997

In the method of knowledge about the area option, in some places available sites have been already earmarked for building this type of infrastructure. Frequently, municipal employees have accumulated in-depth knowledge of the region in the course of their work. They will therefore know of possible landfill sites. Obviously, these sites must be submitted for technical analysis before a final decision is made.
The method of overlapping maps is widely used and is based on geographical information about key aspects for the selection of sites, such as land slopes, soil use, location of cities, infrastructure, hydric resources, forests, and protected areas. In each layer, suitable, fairly suitable, or unsuitable sites are specified for the location of a sanitary landfill. Generally, these conditions are established by the legal frameworks of each country or region. Afterwards, through the use of geographical information systems, the data is processed by overlapping the different information layers. Finally, the areas that are suitable or that meet the analyzed criteria can be determined.
The following criteria for the analyses might be used, among others factors:• Location of inhabited centers• Distances to waste production centers• Accessibility and the existence of roads• Available area compared to the results of the estimations chart• Soil slope• Current use of the land• Flood and volcanic risk areas• Geology• Depth of the phreatic layer• Protected areas and forests and wildlife sanctuaries• Types of soil, permeability• Social aspects, including the acceptance of the project by citizens
Finally, potential options for the location of the landfill are identified, and these should be ranked according to technical, environmental, economic, and social advantages. A scoring or weighting system of factors for the analysis is established in order to decide which option offers the greatest advantages.
In the case study of Puerto Ayora on Santa Cruz Island, which is described below, an example is shown of the methodology used for the selection of the landfill site.
At the selected site, several basic engineering studies are carried out in order to have sufficient information for the final designs. In general, the basic required studies are the following:
• Topographical study• Geotechnical study• Geological - hydrogeological study• Waste production and composition study• Leachate production study
98 | CHAPTER 7 | Disposal of Garbage

Integrated Solid Waste Management in Island Regions | 99
7. Sanitary Landfill DesignBased on engineering studies and on decisions about the type of sanitary landfill to be built, the building area of the landfill is decided upon, along with the distribution of its components. The landfill area is determined according to the topographical features of the site. The vertical location is determined by using cross-section views. The transfer of soil must be minimized to decrease project costs. The location and design of the drainage system should be carefully determined in order to avoid great depths for pipes that will transport leachates to treatment sites.
The distribution plan establishes how the implementation of the sanitary landfill will be carried out, defining how cells, platforms and stages will be occupied during the landfill’s service life.
After defining the landfill platforms and leachate treatment areas, the drainage and lining system should be designed. Based on geotechnical, geological, and hydrogeological studies, the design of the base of the site should be determined according to the soil’s permeability. If there is clay, it may be used in compacted layers ranging from twenty to thirty centimeters. In the absence of clay, high-density geomembranes will be used to prevent filtration of leachate into phreatic layers. In some countries, specialist literature and standards recommend a permeability value for the lower layer of 1 x 10⁻⁷ meters/second.
7.1. Cell and Platform Design
As was previously described, in order to design the sanitary landfill site, the type of landfill to be implemented must be previously defined. Based on this decision, the basic unit of the sanitary landfill, which is the daily cell, must be defined. This represents the average daily volume that will be deposited.
One example of these estimates is shown in Table 10, in which the daily deposited volume in 2015 would be 6.75 m3 with a compaction rate of 500 kg/m3. A compaction rate such as the one mentioned is typical for a manual landfill; therefore, the daily cell cannot be too high, since this would complicate its construction. A cell height of one meter is assumed, including the covering material.
Another characteristic to be considered is that cells might have different shapes according to their location within the landfill site. Some cells are located directly on the slope, while other cells are situated in the middle of the landfill, and further cells are on the free edge of the landfill site. Another factor to be considered is the width of the cell, which depends on the number of collection trucks that arrive the same time to unload waste into the landfill. In the example, only sufficient space for one garbage collection vehicle is needed, so the width of the work site should be 2.50

(*)
1m
FRONT
CELL ADVANCE
1m
Intermediate cell
Cell at the edge
18° or 3H: 1VCut
Cut
(*): Depends on the angle of the slope
meters. Finally, a basic design criterion is that cells must have a slope of three horizontal units per each vertical unit (approximately 18°). This slope guarantees the stability of the landfill site, eliminating risks such as landslides, especially if landfills are many meters high. Additionally, there should be a perimeter shoulder between platforms of three or more meters to prevent landslides and to allow access for maintenance work and circulation.
Having determined the values of height and width of the cell, the value of daily cell advance must be estimated.
Figure 24 Typical Cell
Where:
Av = Daily cell advanceV = Daily compacted volume to be deposited 6.75 m3
f = Frontal width of the work site, assumed value: 2.50 metersh = Cell height, assumed value: 1.0 meter
Based on these values, the daily cell advance would be 2.70 meters. After estimating these dimensions, the number of cells to be placed on each level of each platform should be determined. This estimate should be made for all of the other landfill years.
Av = Vf + h
100 | CHAPTER 7 | Disposal of Garbage

Integrated Solid Waste Management in Island Regions | 101
7.2. Design for the Handling of Leachate
In order to design the drainage, storage, and treatment system, the volume of leachate to be handled must be determined. This volume depends on several parameters such as meteorological factors, the type of covering material, cell and platform height, moisture percentages, and the characteristics of confined solid waste. To determine this volume, the following methods are used.
a) The Swiss Method (Paraguassú de Sá, 2002)
In this method, it is assumed that a certain percentage of rainfall that passes through the waste reaches the sealed bottom of the vessel and must be collected and treated. This value depends on the amount of rainfall and the degree of waste compaction.
The Swiss Method can be used to quickly and easily estimate the flow rate of leachate, using the following equation:
Where:
Q = Average flow rate of leachate (liters/second)P = Average annual rainfall (millimeters/year)A = Landfill surface area (m2)t = Number of seconds per year (31,536,000)K = A coefficient that represents the rainfall percentage that
converts into leachate and depends on the degree of garbage compaction whose recommended values are the following:- For weakly compacted landfills, with a specific weight
from 0.4 to 0.7 tons/m3, a leachate production between 25% and 50% is estimated (k = 0.25 to 0.50), related to the average annual rainfall of the landfill zone.
- For strongly compacted landfills, with a specific weight > 0.7 tons/m3, a leachate production between 15% and 25% is estimated (k = 0.15 to 0.25) related to the average annual rainfall of the landfill zone.
Q = 1
P x A x Kt

Source: Röben, 2002.
c) Hydric balance (EPA, 1977)
The following equation is applied for this method:
L = I + As + Ap + R
Where:
I = FilteringAs = Underground water flowAp = Independent production of waterRet = Water retention capacity
The filtering of water downwards through the landfill can be estimated by using this equation:
L = P _ E _ Et
Where:
P = RainfallE = RunoffEt = Actual evaporation-transpiration
b) Table with estimates of leachate production based on rainfall and operation modes (Röben, 2002)
The method is based on the assumption that the leachate production of landfills depends on several parameters including:
• Rainfall• Landfill area• Operation mode (manual or machine compaction)• Type of garbage
Table 11 Leachate Production Based on Rainfall and Types of Compaction
TYPEOFSANITARYLANDFILL PERCENTAGE(%) LEACHATE PRODUCTION (m3/HA*DAY) OFRAINFALLFOR RAINFALL RAINFALL RAINFALL LEACHATEPRODUCTION 700MM/YEAR 1,500MM/YEAR 3,000MM/YEAR
Manual landfill 60 11.51 24.66 49.32
Landfill compacted with 40 7.67 16.44 32.88 light-weight machinery
Landfill compacted with 25 4.79 10.27 20.55 with heavy machinery
102 | CHAPTER 7 | Disposal of Garbage

Integrated Solid Waste Management in Island Regions | 103
Usually, the values included are simplified by excluding the independent production of water, the water retention, and, justifiably, the underground water flow (if provided hydrogeological studies preclude their existence). Likewise, the runoff value can be estimated as a percentage of rainfall, which in turn is based on meteorological reports for the area.
The evaporation-transpiration percentage is obtained by directly measuring such values by using a device called an evaporimeter. Since there are not many evaporimeters at meteorological centers, empirical methods have been used, such as:
• Penman Method• Modified Blaney & Criddle Method• Thornthwaite Method• Truc Method• Hargreaves Method
The hydric balance is used to define the seasons or periods of the year in which there are deficits and surpluses of water in soil, in order to plan the storage and subsequent treatment of these liquids.
d) The Hydrologic Evaluation of Landfill Performance (HELP) program (Paraguassú de Sá, 2002)
This mathematical model, developed by the United States Navy for the U.S. Environmental Protection Agency (EPA), is used to estimate the values of several components of the landfill hydric balance. To use the HELP model, the following input data is needed:
• Meteorological data: Records of daily rainfall, average monthly temperatures, average monthly solar radiation, the leaf area index, the depth of the soil evaporation zone, and the start and finish days of the growth season
• Characteristics of the soil: Porosity, field capacity, withering point, and hydraulic conductivity
• Project specifications: Number and thickness of layers, characteristics of the soil, compaction ratio, initial moisture content of the soil, and types of plants covering the areas
Several authors have drawn up other models with criteria that are similar to the above, such as the Corenostos model (Röben, 2002).
By using the value of the quantity of leachates produced per day or per month, storage volumes should be estimated, especially for those months in which more leachates are produced. For this purpose, storage pools are built, which should be adequately sealed in accordance with the geological and geotechnical studies that have been carried out.

7.3. Biogas Production and Handling
There are several methods for estimating the volume of biogas production. These methods are applied especially to large landfills, where projects of Clean Development Mechanism (CDM) are in place, which allow additional resources to be obtained through the destruction of methane in accordance with the Kyoto Protocol.
EPA’s method is one of the most commonly used methods, and it is based on the following equation (EPA, 2014):
Q = L0 R (e_kc_ e
_kt )
Where:
Q = Methane production rate in m3/yearL0 = Potential methane generating capacity of the waste in
m3/MgR = Average acceptance rate of waste during the service life of
the landfill (Mg/year)k = Methane production rate, which is supposed to be
constant (l/year)c = Time as of the date when the landfill is closed, yeart = Time as of the date when the garbage is deposited in the
landfill, year
Within the landfill site, chimneys must be built to release gases generated from inside the landfill mass. These chimneys may be built using various materials and have to be extended when the volume of the landfill increases. Wood may be used to build a square fence joined by a metallic mesh, and the chimneys may have stones in their interior. In many cases, perforated pipes of granular material can also be installed within these chimneys.
Occasionally, tires and perforated metallic containers have also been used. The main idea is to facilitate the release of gases, which travel from confined pressurized zones to areas of lower pressure that are in contact with the atmosphere. After the landfill reaches its closing level, the biogas must be burned to decrease the volume of greenhouse-effect gases.
104 | CHAPTER 7 | Disposal of Garbage

Integrated Solid Waste Management in Island Regions | 105
Chimney
Boulders3 to 5 cm
Cellcompleted
Chickenwire
Woodensticks
Specialized literature recommends the implementation of chimneys in the vertexes of a twenty-five to thirty meter grid, and the placing of chimneys on the leachate drainage system.
An example of the shape of the chimneys is shown in Figure 25.
Figure 25 Chimneys
7.4. Treatment of Leachate
As was previously described, the leachate, produced in landfills due to the filtering of rainwater, edulcorates the compounds and elements that are generated within the landfill at different stages of degradation. This is shown in Table 12, as determined at a variety of landfills in Latin America.
It can be noted that the concentrations of the mentioned parameters would make them objectionable if they were released directly into the environment (releasable concentrations will depend on the laws of each country or region). It is therefore vital to design treatment facilities that transform undesirable parameters in order to lower their values so that they can be released into the environment.
In general, the following types of treatments may be considered:• Biological processes (biodegradation of organic compounds, elimination
of phosphorus and nitrogen, etc.)• Chemical processes (oxidization with ozone, hydrogen peroxide, etc.)• Physical-chemical processes (flocculation and decantation, filtering of
membranes, and ion exchangers)• Thermal processes (evaporation, drying, and incineration)• Combined processes
Source: Adapted from Jaramillo, 2002.

Table 12 Analyses of Leachate
Physical,Chemical,andBiologicalAnalysesofLeachateofSanitaryLandfills
PARAMETER TYPICALRANGE “LOERRAZURIZ” “BUENOSAIRES” “ELZAPALLAL” STANDARDSOFPUBLIC(UNIT) (OFVALUES) LANDFILL LANDFILL LANDFILL SANITATIONSERVICES (CHILE) (ARGENTINA) (PERÚ) OFTHEUNITEDSTATES
DBO5 (mg/l) 1.5 to 60,000 150 to 49,000 16,036 to 68,500 1,200 to 43,500
DQO (mg/l) 3,287 to 75,000 13,400 to 78,260 19,866 to 63,322
COT (mg/l) 800 to 90,000 1,210 to 27,600 4,320 to 41,100 -
pH (pH) 3.50 to 8.50 5.8 to 7.5 - 7.2 to 8.8
Temperatura (°C) - 16 to 43 5.2 to 8.05 -
N. total (mg/l) 1.50 to 150 530 to 2,290 - -
Coli fecal (mg/l) 100 to 1,006 - - 2.38104
Cloruros (mg/l) 5 to 4,500 - - 10,097 to 19,184 250
Fenol (mg/l) 0.17 to 6.60 - 3.4 to 28 -
S. totales (mg/l) 6 to 4,000 12,410 to 77,590 13,120 to 61,110 29,858 to 65,002
S. sedimentales - < 0.1 to 9 - This cannot be deter- (ml/100ml*h) mined due to the color
Cadmio (mg/l) ND – 1.16 ND – 0.2 0.11 to 0.82 0.06 0.01
Plomo (mg/l) 0.2 to 8.2 0.11 to 40.84 0.11 0.05
Cromo (mg/l) ND – 1.16 0.2 to 1.8 0.14 to 2.2 0.34 0.05
Cobre (mg/l) - 19 to 83.4 0.96 to 13.54 < 0.1
Fierro (mg/l) - 17.6 to 713.6 28,04 to 127.3 - 0,3
Manganeso (mg/l) - 0.8 to 35.8 15.4 to 96.3 - 0.05
Níquel (mg/l) ND – 1.70 - - -
Zinc (mg/l) - 3.2 to 20.2 0.96 to 13.54 0.01 5
Toxiciddad (EQ/m3) - 6.5 to 68.8 - -
Turbiedad (UNT) - 360 to 11,000 - -
N.D.: Not detected - : This parameter was not measuredSource: Paraguassú de Sá, 2002.
106 | CHAPTER 7 | Disposal of Garbage

Integrated Solid Waste Management in Island Regions | 107
Biological processes have the following applications: elimination of organic matter (measured as BOD5), nitrification, denitrification, removal of phosphorus, and the stabilization of sludge. The most commonly used processes of this type are:
• Pools (anaerobic, aerobic, and facultative)• Conventional activated sludge systems• High volume activated sludge systems• Activated sludge with extended aeration• SBR mode activated sludge• Biodiscs• Systems of fixed biological cultures such as trickling filters • Systems of fixed biological cultures in suspension • Anaerobic reactors• UASB systems• Other anaerobic organisms• Trickling filters
Generally, combined methods are used to eliminate the different contaminating products found in leachate.
8. Operation of Sanitary LandfillsThe operation of sanitary landfills is described in Figure 26, with groups’ operations based on the following components:
• Entrance• Internal Traffic• Work site (operating cell)
• Handling of the operating cell, this includes:- Compaction- Covering processes- Gas control- Handling of leachate
• Pest control• Handling of hospital waste
• In the landfill area- Hedge- Enclosure- Other units
• Other aspects to consider- Initial tasks- Safety measures- Maintenance measures- Placement of signs- Training activities

Figure 26 A Diagram of Sanitary Landfill Operations
108 | CHAPTER 7 | Disposal of Garbage
Safety Maintenance Signposting Training
Activities:* Operating cell* Compaction* Obtaining and transporting coverage material* Cell coverage* Gas control* Chimneys* Leachates
3. Work site1. Entrance
2. Internal traffic
6. Handling of:8. Environmental
monitoring 5. Handling of:
Hospitalwaste
7. Control of:
* Fence* Drainage, leachate pool* Dry swamp* Septic tank* Access road
* Statistics* Materials and tools
4. Control of:
* Vectors* Odors* Dust* Noise
UNA VIA
PARE
9. Other aspects to consider

Integrated Solid Waste Management in Island Regions | 109
8.1. Entrance to the Sanitary Landfill Site
Entrance to the landfill site is restricted, and it is completely forbidden for people to enter to recycle garbage deposited within the sanitary landfill. Controls should therefore be established to prevent people and vehicles from entering the landfill facilities.
Security personnel should keep records with the following information:• Date• Time of entrance to the landfill site• Time when the person/vehicle left the facilities• License plate of the vehicle and the company to which it belongs• Name of the person who entered the facilities• Activities he or she will carry out• Verification of the type of solid waste to be deposited
8.2. Entrance to the Work Site
The site assistants should indicate the route that the trucks must follow when they enter the landfill site, depending on the operating cell and the type of garbage to be deposited. They should also inform truck drivers on safety and security measures, given the risk of trucks getting stuck as they pass over platforms filled with waste.
8.3. Operation of Cells
The order in which landfill cells and platforms will be filled is determined in accordance with technical designs regarding the dimensions of daily cells. The methods of construction of cells where waste will be deposited are important, given that they determine the degree of consolidation and stability that the landfill will have.
Waste compaction is vitally important for the correct operation of the sanitary landfill, and also to ensure that the landfill site will be used for its entire specified service life.
To obtain the best results, control mechanisms must be implemented to ensure that the equipment operator follows the following steps:
• The operator must homogenize and distribute waste on the work site and place it in layers that are twenty-five centimeters thick. To do this, the operator may visually check the height of each layer or use measuring sticks as a reference.
• The work site should have a counterslope of three horizontal units to one vertical unit, working uphill by breaking, fitting, and compacting waste on the way to the top.
• The operator will repeat this operation (at least five times) until the waste or garbage has been distributed and the top surface will not be deformed when equipment passes over it.

Source: Adapted from Jaramillo, 2002.
Unloading of waste
PREPARED PLATFORM
• At the end of each workday after the compaction of all the garbage brought to the landfill, a covering layer will be placed on top. The covering layer will be at least ten centimeters thick at all points.
• The entire cycle described has to be repeated.• The height of the cell, including the covering layer, must be estimated
in designs.
The aforementioned process is described in detail in the following steps and figures:
a) The person in charge of landfill operations should indicate the location of the operation cell to the vehicle drivers and give them access for the unloading of the waste.
Figure 27 Unloading of Garbage in the Daily Cell
b) Measuring sticks must be placed in cell corners and paint used to mark the maximum cell height. The equipment spreads the waste evenly and begins to form the daily operation cell. Garbage is distributed in layers of approximately thirty centimeters across the whole cell area, so as to be able to compact it.
110 | CHAPTER 7 | Disposal of Garbage

Integrated Solid Waste Management in Island Regions | 111
Source: Adapted from Jaramillo, 2002.
Source: Adapted from Jaramillo, 2002.
Measuring sticks(marked at
0.90 and 1 m)
Delimitationof the cell area
Compaction of solid waste
Measuring sticks
0.10 m Coverage
0.90 m Waste
Waste delimitation
Spreading of waste
Figure 28 Formation of the Cell
c) The equipment must flatten the surface several times in order to compact the waste. The cell height must be observed in relation to the measuring sticks and slopes at the cell edges.
Figure 29 Compaction Within the Cell

Source: Adapted from Jaramillo, 2002.
Measuring sticks(marked at 0.90 and 1 m)
Delimitationof the cell area
Covering layer
d) For the process of covering the cell, the equipment transports the covering material and unloads it evenly across the compacted cell. The thickness of the covering layer should be 0.10 meters. The equipment operator should check the marks on the measuring sticks to verify the height.
Figure 30 Covering Layer of the Cell
e) When compacting the soil-covered cell, operators should pay special attention to cells that vehicles will have to pass over in order to reach the operation cell, especially during rainy seasons. In such cases, the depth of the covering layer should be increased or wood meshes can be used to prevent the cell collapsing.
f) The covering material is removed and set apart when the soil is removed during the construction of the sanitary landfill, or when the soil is removed to initiate a new cell. The soil should be accumulated in a place close to the upper part of the cell that is being built, or very nearby, from which it will be transported to the surface area to be covered. The equipment will flatten the soil many times (at least five times) until the appropriate compaction is obtained for the ten centimeter covering layer.
At the end of every workday, the cell should be covered in the specified manner. This step is essential for the correct operation of the sanitary landfill; otherwise there is a risk of it becoming a controlled dumpsite. It is essential to cover the cell with earth to control odors, avoid pests and the reproduction of insects and rodents. This step also covers and confines waste to the landfill (so that it will not spill out).
112 | CHAPTER 7 | Disposal of Garbage

Integrated Solid Waste Management in Island Regions | 113
Source: Adapted from Jaramillo, 2002.
Slope 3H and 1V
Compactionof the covering layer
0.10 m
0.90 m
The following measures are needed to prevent a disaggregation of the lateral surfaces due to erosion caused by rain, which would compromise the confinement of the cell:• Avoid extended exposure of lateral surfaces to the exterior areas. If
this is not feasible, repair any damage produced.• Prevent the draining of rainwater onto lateral surfaces in every
possible way. To achieve this, the upper surface should have a 1% slope.
Figure 31 Compaction
Finally, if a cell is to be placed on top of an existing platform, the covering material should be scraped away so that the new cell will be in contact with the existing garbage of the lower platform. This is done to facilitate the drainage of leachate to the bottom and to prevent the lateral emergence of leachate.
g) Chimneys must be built on the secondary drainage component and must be extended as the landfill height increases.
Chimneys are built to collect and subsequently eliminate the landfill gases generated by the degradation of the cells’ organic matter. This will prevent the formation of methane gas pockets or explosive compounds of such gas from within the landfill. Chimneys will be extended vertically as the cell, platform, and landfill heights increase.

Source: Adapted from Jaramillo, 2002.
Chimney
Drainage
Completed cell
8.4. Pest Control
Landfill activities involving the handling of large amounts of garbage attracts pests such as insects, rodents, and carrion-eating birds.
Although the existence of these pests is minimized if the daily cell is correctly covered, certain measures must also be considered to prevent their propagation:
a) Mosquito control: Fumigation should be used at landfill sites to limit mosquito and fly populations. Fumigation work should be carried out in accordance with the manufacturer’s recommendations for the products that are used.
b) Pest control: Pest control for landfills should be achieved through daily compaction and covering of the waste that is deposited; poisons and baits should also be used, in accordance with manufacturer’s recommendations.
8.5. Live Hedges and Enclosure of the Sanitary Landfill
The sanitary landfill should have live hedges to visually isolate it and to partia-lly mitigate odors that might be released towards other properties close to the landfill site. Likewise, the perimeter enclosure may be made from barbed wire along the entire perimeter of the property. These landfill components must be periodically maintained, depending on specific conditions.
Figure 32 Construction of Chimneys
114 | CHAPTER 7 | Disposal of Garbage

Integrated Solid Waste Management in Island Regions | 115
8.6. Control Measures
The following control measures are to be established for the sanitary landfill:• Statistics on the amounts of solid waste brought to the landfill must be
registered. The approximate number of daily tons by type of waste should be accurately recorded.
• The daily height of the growth of the landfill should be estimated.• The growth of the landfill should be determined graphically, and new
construction should be planned for its adequate operation.• The existence of sufficient covering material should be guaranteed.• There should be a stock of sufficient material to build chimneys.• A schedule for the routine maintenance of all infrastructure should be set up.• The components for the treatment of leachate should be verified.• Signage and the conditions of roads should be checked, especially during
rainy seasons.• Equipment maintenance records should be kept.• A sufficient stock of protection equipment, firefighting systems, etc.,
should be kept.• Treatment processes should be monitored to verify the fulfillment of
environmental standards.
In general, parameters that should be monitored include: alkalinity, cyanides, calcium, chlorides, copper, organic components (phenols), specific conductance, total chrome, BOD5, COD, hardness, total phosphorus, iron, magnesium, total nitrogen, pH, potassium, sodium, total solids, suspended solids, dissolved solids, sulphates, temperature, and zinc.
8.7. Maintenance
Maintenance should be carried out periodically and should be based on the usage of the various units and equipment. The landfill’s director should establish the time span for this maintenance work. There are two types of maintenance:
• Civil works, which refers to structural conditions, roofs, and fixtures, and also to cleaning processes and cleanliness of equipment
• Equipment, which refers to preventive maintenance based on the number of hours worked and any minor problems, along with contract work for corrective repairs
8.8. Training
Training is essential to be able to correctly operate a landfill site. Training should be targeted at the following levels:
• Technical personnel, who will receive training on the management of landfills, the setting up of cells and daily operations, environmental monitoring systems, etc.
• Workers, who will receive training on the setting up of cells and platforms, how to correctly use equipment, safety measures, etc.


Integrated Solid Waste Management in Island Regions | 117
CHAPTER 8
Minimization of Solid Waste
As described in Chapter 1 Integrated Solid Waste Management, actions should be prioritized to prevent and minimize the waste production. The following cascading management strategy sets priorities to reduce waste: prevention, minimization, processing, and disposal. Therefore, the best options to achieve waste reduction are: prevent the production of garbage, minimize its production, and, finally, treat waste to decrease its volume. As such, the final disposal of waste becomes a last resort.
Activities relating to the minimization and prevention of waste production facilitate the reduction of costs and efforts in different components of an ISWM, since these actions result in a smaller volume of garbage. They also promote the preservation and rational use of natural resources. The production of waste and pollutants by production and industrial processes generate serious adverse effects such as global warming, climate change, the destruction of the ozone layer, loss of biodiversity, and a deterioration in the quality of life. These problems are the result of the irrational use of certain products that could be reused or reduced at the source, if the consumer model were not based upon an unsustainable model of production.
This situation has set global alarm bells ringing and prompted various measures and good practices to be put forward, all aimed at decreasing and attenuating the aforementioned effects. In the case of the ISWM, the creation of programs that minimize waste have been recommended for an integrated management of municipal solid waste, as well as industrial non-hazardous and hazardous waste.
In all of the above situations, the proposals presented cannot be easily implemented due to their complexity and to the fact that they require the cooperation of all members of society in order to operate effectively.
© W
WF/
Jean
Cla
ude
Con
stan
t
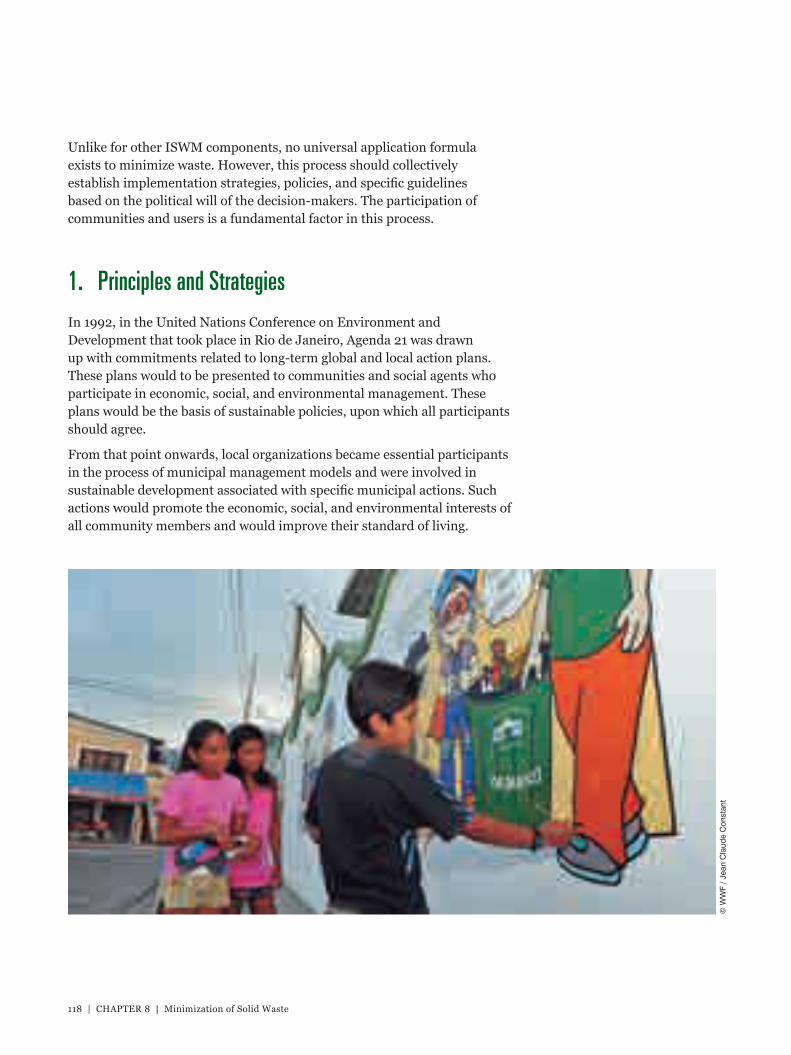
Unlike for other ISWM components, no universal application formula exists to minimize waste. However, this process should collectively establish implementation strategies, policies, and specific guidelines based on the political will of the decision-makers. The participation of communities and users is a fundamental factor in this process.
1. Principles and StrategiesIn 1992, in the United Nations Conference on Environment and Development that took place in Rio de Janeiro, Agenda 21 was drawn up with commitments related to long-term global and local action plans. These plans would to be presented to communities and social agents who participate in economic, social, and environmental management. These plans would be the basis of sustainable policies, upon which all participants should agree.
From that point onwards, local organizations became essential participants in the process of municipal management models and were involved in sustainable development associated with specific municipal actions. Such actions would promote the economic, social, and environmental interests of all community members and would improve their standard of living.
118 | CHAPTER 8 | Minimization of Solid Waste
© W
WF
/ Jea
n C
laud
e C
onst
ant

Integrated Solid Waste Management in Island Regions | 119
Some of the principles of Agenda 21 of the United Nations relating to environmentally appropriate waste management include:
• The source reduction principle. This principle describes the need to minimize waste production both in relation to quantity and characteristics such as environmental contaminants. One of the ways to do this is by using suitable product and process designs.
• The life-cycle inventory principle. This principle states the need to undertake an inventory so that substances and products are designed and managed by minimizing their adverse impacts on the environment in each of the stages of their life cycle, namely generation, use, recovery, and final disposal.
• The precautionary principle. This principle promotes the need to adopt preventive measures, even if there is no watertight scientific evidence relating to whether such activity might release substances, residues, or energy into the environment, adversely affecting health or the environment.
• The integrated pollution control principle. This principle refers to the need to comprehensively manage waste with an integrated approach to prevent the transfer of contaminants from one medium to another one.
• The standardization principle. Standards or regulations should be established for the environmentally appropriate management of waste in all stages of its life cycle.
• The proximity principle. Waste collection, treatment, and final disposal should take place as close as possible to its point of generation and should be technically and economically feasible.
• The polluter pays principle. Those who cause pollution must pay to remedy the consequences of that pollution.
• The principle of public participation. Whenever comprehensive waste management systems are designed and implemented, the public should be informed and involved.
These principles have contributed to many domestic and local environment policies, standards, and legal instruments in various parts of the world.
In the book Solid Waste Minimization and Environmental Management, written by SEMARNAT (1999), regarding the design of environmentally appropriate management policies, the following basic aspects are mentioned:
• Policies should be easily understood by all involved actors.• Policies must reflect the interests of diverse social sectors in a balanced
manner.• Policies should be implemented in a practical manner across the whole
country.• Policies must be accessible to everyone.• The focus of the policies should be comprehensive.• Policies should allow the joint participation of all social sectors.• Policies should promote partnerships and synergies.

• Policies should promote the prevention of waste production and minimization, and appropriate comprehensive waste management.
Additional recommendations include:• Laws and regulations should be drawn up, along with behavior guidelines
and technical standards, to promote appropriate waste management and waste minimization.
• All government levels should be the chosen beneficiaries of environmental training opportunities.
• Environmental legislation must be developed by able, educated, and trained lawmakers in relation to contamination and environment issues.
• The overview process should be based on the abilities and integrity of officials (ethics).
These recommendations aim to affect great change, focusing environmental policies on the promotion of the sustainable use of resources, energy, and water, as well as material savings in processes that transform raw material into products. In addition, the use of recycled materials, which have economic and thermal values, is promoted.
One of the ways in which it has been possible to apply these principles is by means of guidelines and actions that promote the three Rs (reduction, reuse, and recycling), which also suggest the following strategies:
• Reduction at source can be promoted through awareness-raising campaigns. Green taxes may also be created to promote such practices. For example, beverage producers might pay a certain amount to users who return their bottles.
• Medium-term and long-term minimization and recycling goals can be established, in line with the conditions in each city.
• Studies can be carried out to investigate the different markets for recycled materials in order to define which have the greatest demand, and also to find out the preferred format for buyers and referential costs. Based on these studies, the best operating practices will be established for waste sorting, collection, and storage.
• A research project on the supply chain of recycled materials can be undertaken in order to aid informal recycling. Additionally, projects must be established to promote and support informal or formal recycling activities for the recovery of materials.
• With regards to industrial waste, a coordination process related to extended producer responsibility must be developed.7
7 The Extended Producer Responsibility (EPR) is defined as “producer responsibilities extended in the post-consumer stage of a product’s life-cycle.” This concept is based on the premise that a company’s legal responsibility regarding environmental impacts does not come to an end when its products are sold. This means that the producer is involved not only with the creation of a product but also with its disposal, which is also expressed as “cradle to tomb.” Source: www.sinai.cl
120 | CHAPTER 8 | Minimization of Solid Waste

Integrated Solid Waste Management in Island Regions | 121
In order to achieve a smooth-running comprehensive solid waste management system, including the minimization of waste, all of society must agree upon this system, and everyone must assume their responsibilities in relation to the flow of waste. Thus, the producers of raw materials, manufacturers, distributors, traders, consumers, and authorities must take responsibility for the waste they generate, as part of a strategy of shared responsibility.
© W
WF
/ Jea
n C
laud
e C
onst
ant


Integrated Solid Waste Management in Island Regions | 123
CHAPTER 9
Use of Solid Waste
As mentioned in Chapter 8, one of the ways to make waste minimization principles and policies tangible, in order to manage solid waste in an environmentally appropriate manner, is to implement the three Rs system (reduce, reuse, and recycle). This system requires the implementation of variations of the typical collection systems, such as differentiated collection, the installation of waste sorting plants, and the use of recovered materials, either through direct use or as raw materials within other processes.
These methods of valuing waste allow us to take advantage of the resources contained in the waste. But care must be taken to avoid any negative environmental impacts or detrimental effects on the health of inhabitants.
1. Reuse of Solid WasteThe reuse of solid waste includes directly using recovered products or solid waste again without subjecting this waste to any transformation process.
A typical example would be the refilling of bottles with the same products they initially contained or with similar products. In many cases, reusable materials are disposed of after their first use (for example, plastic bags).
According to the European Union’s directive 94/42/EC [94/62/EC], the definition of reuse is:
… any operation by which packaging, which has been conceived of and designed to accomplish a minimum number of trips or rotations within its life cycle, is refilled or used for the same purpose for which it was intended, with or without the aid of auxiliary products on the market which enable the packaging to be refilled; such reused packaging will become packaging waste when no longer reused. (Pardavé Livia, 2007)
© W
WF
/ Mar
celo
Cas
tillo

2. RecyclingRecycling “is the activity of recovering solid waste to reintegrate it into the economic cycle, reusing it as raw material for new products, leading to economic, ecological, and social benefits” (Röben, 2002).
Another definition of recycling states that it is a process of separating waste materials to which costs can be assigned as part of the production-consumption process, and, as such, might generate income (Arnes, 1994). Although this practice is highly recommended, it is not financially attractive due to market instability.
According to the European Union directive 94/62/EC, recycling is the transformation of waste, within a production process, for its final purpose or for other purposes, including organic recycling, but not for the recovery of energy.
Recycling is related to the reincorporation of portions of waste that might otherwise have been disposed of. They will instead be used in new production cycles. This is what capitalizing, or assigning costs to such recycled waste, means. Benefits will initially be economic, but subsequently also environmental and social. Within this context it should be noted that sales values for certain recovered subproducts vary by season due to international market fluctuations.
An additional economic benefit is obtained from the longer service life of sanitary landfills. For example, if organic waste is separated and composted, the service life of the landfill increases up to 40% and the cost of leachate treatment decreases, a significant expense of landfill operations. Even though recycling activities in many island regions may not be directly profitable due to transport logistics and costs, the long-term benefits of recycling for the local government and population are evident due to the abovementioned reasons.
At a global level, recycling practices have become an inherent part of solid waste management and a way to obtain raw material for industrial processes. For example, in some European countries, legislation has been implemented that penalizes the direct disposal of solid waste without pretreatment (even though these countries have extremely modern landfills). This forces European citizens to separate and recycle on a very high level, and only those materials that cannot be recycled are deposited in landfills; in other words, it is cheaper for European citizens to recycle.
In developing countries, recycling is raising a lot of interest, and mechanization processes have been started to improve the efficiency of sorting and to obtain the greatest amount of recovered materials. Progress can be noted if the more common conditions in which the lower classes of society carry out informal recycling activities under insanitary conditions are compared. Sometimes waste is sorted at landfills, even though this is considered a very risky practice. People who conduct informal recycling
124 | CHAPTER 9 | Use of Solid Waste

Integrated Solid Waste Management in Island Regions | 125
activities do not receive salaries and are exploited by middlemen and wholesalers who control the market. Therefore, improving formal recycling programs is one way to confront these social issues and contribute to improving people’s standard of living, as well as achieving the aforementioned environmental benefits.
Within this context, some technical considerations related to mechanized sorting plants equipped with simple technologies are described later in this document, taking into account practical experiences with the operation of plants on remote islands.
3. Waste CharacterizationAn analysis of the composition and quantities of solid waste is essential in order to estimate requirements and sizing of waste characterization, as described in previous chapters. The data obtained from these studies are used to calculate percentages of the different waste components which allows for an estimation of the amount of recyclable materials likely to be separated.
The materials for which there is a demand must therefore be identified, as well as the initial format required for sale (e.g., PET bottles without caps or labels) and the minimum sale amounts and prices. In island regions, it’s desirable to return the highest amount possible of recyclable materials to the mainland for further processing. However, the logistics of sea transportation for recyclable materials pose political and economic challenges in most cases, since boat operators are generally not willing to transport recyclable materials to the mainland without charging for this service.
In general, materials to be sorted are:In general, materials to be sorted are:• Various types of paper:
- Bond paper- Kraft paper- Newsprint
• Cardboard and composite packaging such as Tetra Pak• Various types of plastic (see Table 13)• Glass (see Table 14)• Various types of metals:
- Iron- Steel- Aluminum- Non-ferrous metals, such as copper, nickel, zinc, and lead
• Fabrics

Table 13 Types of Plastics
NAME CODE MEANING APPEARANCE PRODUCTSINWHICH THIS PLASTIC IS FOUND
PET 1 Polyethylene Completely transparent terephthalate clear or green plastic
HDPE (Blow-molded) 2 Blow molded Opaque, soft plastic that high-density can be squeezed by hand polyethylene
PVC 3 Polyvinyl chloride Variable
LDPE (Blow-molded) 4 Low density Variable polyethylene
PP 5 Polypropylene Hard plastic that cannot be compressed by hand and breaks under pressure
Styrofoam (PS) 6 Polystyrene foam Coagulated thick or thin white foam
Others 7 Mixed plastics Variable
HDPE (Bags) - High-density Bags made of hard polyethylene material, which make noise when they are wrinkled
LDPE (Bags) - Low density Soft bag that stretches polyethylene until it breaks and that makes no noise when it is wrinkled
Sponge - Variable
Source: Röben, 2002.
Bottles of mineral waters, Coca Cola, lemonade
Bottles, buckets, tubs, IV bags, food containers
Domestic containers, bottles and food containers, hoses, shielding on electrical wire
Plastic film or foil, other laminated materials
Bottles, buckets, tubs, large containers, food containers, disposable plates
Packing materials used to soften blows (packaging of household appliances, etc.); disposable plates
Variable
Printed supermarket bags; striped bags (colors of the flag, white and red, white and blue, etc.), milk bags, detergent bags, etc.
Bags for food used in markets (single color, white, pastel colors)
Mattresses, household sponges, filling of stuffed animals, pillows, etc.
126 | CHAPTER 9 | Use of Solid Waste

Integrated Solid Waste Management in Island Regions | 127
The following symbols are used to help in the classification of plastics, as sugges-ted by the Society of the Plastics Industry (SPI) (Corporación OIKOS, 2000).
Figure 33 Recycling Symbols by Type of Plastic
Table 14 Quality Criteria for Recyclable Glass
CRITERIA LIMIT
Sortingbycolor Color Contentofwhiteglass(%) Contentofbrownglass(%) Contentofgreenglass(%)
White glass 97 – 100 0 – 3 0 – 1
Brown glass 0 – 5 95 – 100 0 – 5
Green glass 0 – 10 0 – 15 85 – 100
Inorganic and non-magnetic < 0.1 kg/t extraneous materials
Magnetic metals (composed of iron) < 0.005 kg/t Any piece larger than 15 cm * 15 cm * 30 cm
Aluminum < 0.005 kg/t
Lead < 0.001 kg/t
Organic material < 0.5 kg/t
Ceramics, stones, porcelain < 0.025 kg/t
Humidity < 2%
Labels In greater amounts than that considered normal for glass containers
Other extraneous materials < 1 kg/t
Paint on glass It must not contain paint with indigo or ultramarine pigments
Contamination Excessive amounts of garbage, humidity, sand, dirt, concrete, or lime
Size of the ground glass Depends greatly on the criteria of each processing factory. Generally processors prefer homogeneous sizes ranging from 1.8 to 3.5 cm.
Source: Röben, 2002.
In addition, it is important to take into consideration what type of waste collection system exists, given that the sorting efficiencies logically are greater when there has been a separation process at the source.
4LDPE
5PP
1PET
1PETE
6PS
7OTHER
3V
3PVC
2HDPE

4. Manual Material Sorting SystemsManual systems are used for small-scale or artisanal recovery processes. In general, these systems do not process incoming materials in a continuous stream but in bulk or by truckload.
The main areas within this type of facility are:• Reception area• Sorting area• Storage area for recycled items• Area for loading rejects• Baling and compacting • Packing area• Dispatch area
At the very least, the sorting area would need to have a protective covering. The vehicle with the solid residues unloads in the sorting area, and the waste is separated using shovels, gathering the most visible recyclable materials and separating them in different areas to be baled later. The process is repeated until all recyclable material is identified and sorted. Later, the remaining re-jected material is loaded onto transport vehicles in order to transfer it to the sanitary landfill. These activities are facilitated if the sorting area is located close to the landfill site.
Only minor tools are required unless the densification or pressing activities are carried out by mechanical means. A sufficiently large area with a concrete floor and good ventilation is recommended.
For manual systems that have a previous sorting system at the source, the procedures described above are much more expeditious with minimal rejection levels, depending on the grade of separation achieved at source.
5. Mechanized Material Sorting SystemsThese systems work in a continuous, uninterrupted way: The waste is sorted as it arrives at the facility with the support of conveyor belts and other equipment that facilitate the sorting task by taking advantage of the specific characteristics of each material contained in the solid waste.
One of the main aspects to be considered after reviewing the amount of waste to be handled is the location of the facility. For this, it is important to perform a study that compares alternative locations, choosing the site that offers the best advantages. One commonly used alternative is locating the facility within the sanitary landfill site, thereby reducing infrastructure costs (such as roads, electricity, fences, etc.), as well as operational costs (guards, a close location for eliminating rejected items, etc.).
128 | CHAPTER 9 | Use of Solid Waste

Integrated Solid Waste Management in Island Regions | 129
The main areas of a mechanized sorting facility are (Röben, 2002):• Receiving hopper• Drum screen• Recycling belt• Electromagnet• Containers for non-recoverable materials• Compaction, baling, and weighing area• Storage areas
The main characteristics of each unit are described below:
• The receiving hopper is an area with an inclined concrete floor that facilitates the reception of the waste as it moves towards the next unit. In this first unit, it is possible to separate the most voluminous waste that can be recycled or that would be difficult to manage in the next units of the facility.
• The drum screen performs the function of separating the materials by size (Lund, 1996). It can be a trommel screen, which is cylindrical, slightly inclined, and designed to rotate, so that the smaller materials pass through the perforated sides; these materials are then collected for elimination, allowing the sorting process to continue for the remaining larger-sized materials. The other kind of screen is a disc screen, formed by successive rows of rotating vertical discs that form a mobile surface that mixes and transports the materials while allowing fine materials to fall into the space between the discs.
• The recycling belt is the most important part of the facility where the recoverable materials are sorted. It is important to calculate the most suitable width and length of this conveyor belt, the engine power, and the most appropriate speed of the belt. The mechanical specifications for the belt will be calculated according to these criteria.
• Magnets or electromagnets are used to separate ferrous materials. There are three types of these components: driving pulleys, hanging drums, and hanging magnetic tape. In the case of the first component type, the front pulley over which the belt slides has a magnet, which traps the metals. These then fall toward a separate accumulation site than that used for the rest of the rejected waste. The magnetic drum is a stationary magnet within a rotating drum that captures the materials and offloads them onto another conveyor belt for accumulation. The magnetic tape is comprised of a fixed magnet located between two pulleys in a transportation system that is suspended over two sorting belts, either parallel to or crossing the flow, in order to trap the ferrous metals that are being transported.

• The storage containers for recycled materials are used to temporarily store the already sorted materials from other materials, in order to transport them later to the compaction and baling area. The way these storage containers work depends on how the conveyor belt used for sorting has been designed, as shown in Figures 34 and 35. In the first case, the containers are small carts into which the personnel deposit the separated materials directly for further processing and baling. In the case of the elevated conveyor belt, the materials are tossed down chutes into large storage carts on the lower level. The storage carts will be moved then to sites for further processing, baling and storage of the materials.
Figure 34 Floor-Based Conveyor Belt for Sorting
Figure 35 Elevated Conveyor Belt for Sorting
130 | CHAPTER 9 | Use of Solid Waste
Source: Röben, 2002.
Source: Röben, 2002.

Integrated Solid Waste Management in Island Regions | 131
• The separated materials are transported to the hydraulic compactors (for quantities over 500 kg/day) to be baled before weighing and store. The size of the press will depend on the volume of materials. The most common presses are small presses with a power output between five and nine kW, and the large ones have an output of ten to fifteen kW.
• The warehouse areas are used to store bales of recycled materials before their sale. In any case, all areas and facilities should be clearly established, and each area should have a concrete floor and a roof in order to maintain product quality.
6. Dimensioning of the Material Sorting System For dimensioning, the following results of a characterization study are assumed.
Table 15 Example of Urban Solid Waste Composition
SUBPRODUCT PERCENTAGE
Paper 12.67%
Cardboard 5.67%
Plastic bags (low density) 5.67%
Pet bottles 3.67%
High density plastics 3.67%
Clear glass 2.67%
Colored glass 1.33%
Metallics 1.67%
Organic kitchen residue 47.00%
Rejects 16.00%
TOTAL 100%
In the case of a differentiated collection system the values described will depend on the level of citizen cooperation, which will lead to an efficiency percentage at the domestic waste sorting level. In the chosen example, a sorting efficiency of 70% is assumed at the source level. In addition, only those materials that are destined and suitable for the sorting facility are taken into account. Table 16 summarizes the materials that can reach the sorting facility.

Table 16 Example of Materials to be Sorted
MATERIALSTO PERCENTAGE SORTING %OFMATERIAL %OFBERECYCLED INUSW EFFICIENCY TOFACILITY TOTAL HOUSEHOLD
Paper 12.67% 70% 8.9% 34.2%
Cardboard 5.67% 70% 4.0% 15.3%
Low density plastic 5.67% 70% 4.0% 15.3%
High density plastic and pet 3.67% 70% 2.6% 9.9%
Pet 3.67% 70% 2.6% 9.9%
Metals 1.67% 70% 1.2% 4.5%
Clear and colored glass 4.00% 70% 2.8% 10.8%
TOTAL 37% 25.9% 100%
The length and velocity of the sorting conveyor belt are determined based on the quantity of material that enters the facility, as per the yields established at sorting facilities and shown in Table 17.
132 | CHAPTER 9 | Use of Solid Waste
© W
WF/
Jean
Cla
ude
Con
stan
t

Integrated Solid Waste Management in Island Regions | 133
Table 17 Sorting Yields per Type of Material
MATERIAL YIELD1(KG/HOUR) YIELD2(KG/HOUR)
Copy or print-out paper 11.0 7.5
Kraft paper 21.0 75.0
Newsprint 19.0 37.5
Bond paper 10.5 7.5
Duplex board (container for food products, 16.5 37.5 medicines, etc.)
Cardboard 22.0 75.0
Plastic bags 12.0 28.0
PET 50.0 150.0
High density plastic 4.5 - (bottles, containers, etc.)
Glass 120.0 300.0
Aluminum cans - 45.0
Tin cans - 45.0
Yield 1: Sorting facility. City of Loja. Ecuador.Yield 2: European facilities.Source: An adaptation of Table 14, page 45 from Röben, 2002.
As a result, the number of people required for the sorting process of the quantity of material that enters the facility can be calculated based on the amount of waste generated, the percentages of material suitable for recycling, and the sorting yields of the waste. This, in turn, allows the total length of the conveyor belt used for sorting to be estimated. For this process, the total dimensions of the conveyor belt should be calculated based on the amounts of recycling material expected to be sorted at the end of the service life of the facility, or if necessary, various conveyor belt dimensions should be considered.
In the case of the example, it is assumed that thirty tons per day will be sorted by the end of the facility’s service life.

Table 18 Example Calculation of Personnel Requirement
Tons per day: 10
Effective work hours: 8
MATERIALSTOBERECYCLED %OFMATERIAL TONS/DAY YIELD PERSONNEL ASSUMED ATTHISFACILITY (KG/H)* CALCULATED PERSONNEL
Paper (**) 8.9% 0.89 15.40 7.20 8.00
Cardboard 4.0% 0.40 22.00 2.25 3.00
Low density plastic 4.0% 0.40 12.00 4.13 5.00
High density plastic and 2.6% 0.26 4.50 7.13 8.00
Pet 2.6% 0.26 50.00 0.64 1.00
Metals 1.2% 0.12 45.00 0.32 1.00
Clear and colored glass 2.8% 0.28 120.00 0.29
TOTAL 25.9% 2.59 26.00
Explanatory notes:(*): Based on the assumptions expressed as Yield 1, from Table 17.(**): Paper yields are based on the average yields of different types of paper.Assumes one worker for metals and glass.
In order to calculate the number of personnel required, first, tons per day have to be converted in kg/day, then this amount has to be divided by the total number of work hours and the average yield in kg/hour. From past observations at various sorting facilities, a sorting line worker learns to separate two or more materials at once as he or she acquires experience in the sorting work. Respective operational corrections should be made once the real yields of the sorting facility are established and known.
Once the number of workers has been defined, the length of the sorting line can be determined, taking into account that workers can stand on either side of the conveyor belt and that the room required for maneuvering is approximately one meter per worker. In addition, a space should be left between the start of the conveyor belt and the first worker, as well as at the end of the sorting line and the last worker. Therefore one example of the minimum length of the conveyor belt would be:
L = 26/2 + 2 = 15 m.
134 | CHAPTER 9 | Use of Solid Waste

Integrated Solid Waste Management in Island Regions | 135
The power transmission (W) required is calculated according to the following formula (Lund, 1996):
Where:
P = Power in KWSe = Effective stress (N)V = Sorting line speed (m/min)Y = Motor yield
For the example calculation, an effective stress of 30 N is assumed. The range of velocities of the sorting line normally oscillates between three and six m/min, assuming a measurement of 4.5 m/min and a motor yield of approximately 80%. The power would be:
P = 2.81 KW
P = Se x V
60 x Y
P = 30 x 4.560 x 0.80


Integrated Solid Waste Management in Island Regions | 137
CHAPTER 10
Treatment of Organic Waste
Two types of waste are established based on their classification by chemical nature: inorganic or abiogenic, and organic or biogenic waste.
Organic waste refers to all waste materials that have their origin in living beings, be they animal- or plant-based (OPS 1999). The sources of organic waste include farming and livestock activities, agro-industrial activities, the dairy industry, the meat-packing industry, the cereals industry, the oils and oil-seeds industry, the fishing industry, and municipal solid waste. In general, organic residues oscillate between 50% and 70% of the total of municipal solid waste, depending on the place of generation. In comparison with mainland locations, the content of organic waste within the total composition of municipal solid waste in oceanic islands is quite low, since most of the organic products imported from the continent are pre-processed and packaged for transport. Therefore, in comparison to the mainland, the relative amount of organic waste within the overall amount of MSW on islands is less and the relative amount of recyclable materials is higher, and is comparable to the composition of MSW in cities.
In general, the bulk of the organic portion of the municipal solid waste is composed of plant-based materials and in a minor proportion, of animal-based materials. The main difficulty faced in its treatment is the fact that an effective separation of this waste from inorganic waste makes the process more expensive.
In various cases, alternative treatment methods have been used for this organic waste. It can be used as:
• A source of animal feed• An energy source• A source for fertilizers
© W
WF/
Jean
Cla
ude
Con
stan
t

The first option has been used primarily in rural areas, where there is a custom of using organic kitchen waste to feed farm animals, especially pigs. This practice is not recommendable when using municipal solid waste in areas where household sorting is not common practice, due to the presence of many types of waste. In some cases the practice of feeding cattle and pigs directly from garbage dumpsters has been observed, which carries considerable risks for the health of the animals and the people who may later consume their meat. In certain cases, waste from food industries is used and transformed into food for animals of a guaranteed quality that is free of contaminants, such as balanced feed.
Where waste is used as an energy source, the idea is to take advantage of the presence of macromolecules in this waste that have a high energetic potential stored as chemical bonds. If these macromolecules degrade, the bonds break, liberating a chemical bond energy, which can then be used as an energy source, known as biomass.
Energy can be obtained from biomass through dry or wet processing methods. The dry processing methods are of a physical-chemical type, based on transformation through the use of high temperatures, using either direct combustion, carbonization, pyrolysis, or gasification. Wet processing methods comprise biochemical processes in an aqueous medium through the use of microorganisms. These processes can be anaerobic or aerobic.
Regarding the use of organic waste as a raw material for the production of organic fertilizers, it is important to first establish some definitions. Fertilizer is understood to be a substance or compound of abiogenic or biogenic origin that offers some positive property for soils and crops. Mineral fertilizers are chemical compounds that may belong to inorganic chemistry, such as phosphate- and potassium-based fertilizers, or to organic chemistry, such as urea or ammonia.
Organic fertilizers, or biofertilizers, are organic substances or compounds of plant or animal origin that belong to the organic chemistry field and that are generally incorporated directly into the soil without prior treatment. It is important to note that this does not mean that the organic waste can be applied directly to the soil, but rather that the material added to the soil needs to have passed through a mineralization and stabilization phase and has macro- and micronutrients in a more absorbable form for the primary producers.
One of the techniques that permits controlled biodegradation of organic material prior to its being added to the soil is composting. The other is worm composting, which produces a product known as humus. These techniques are described below.
138 | CHAPTER 10 | Treatment of Organic Waste
© W
WF/
Jean
Cla
ude
Con
stan
t
Integrated Solid Waste Management in Island Regions | 139
1. CompostingComposting is defined as the biochemical degradation of fermentable organic matter, which converts it into a biochemically inactive compound called compost (Trejo Vasquez 1996). Compost is a material obtained by controlled microbial action that uses organic waste as a raw material. The process allows organic material to achieve a degree of digestion such that when added to the soil it does not provoke competition between its own microorganisms and the superior plants for the nutrients in the soil that they need. Composting was originally developed as a way to improve soil quality by replacing organic material and micronutrients lost due to overcultivation. The composting process is similar to nature’s own soil renewal process.
1.1. Composting Process and Dimensioning
Composting is performed in the following phases (Röben, 2002):
a) Preconditioning
This phase consists of the organic material (separated from inorganic waste) arriving at the facility; therefore market waste is often used. It is preferable to have a truck scale to control the volumes that are managed.
If necessary, an additional sort can be performed to separate the remaining inorganic waste from the organic waste. Once this sorting process has been finished, the organic waste should be ground and shredded. Grinding eliminates large pieces of organic waste that could stop the biodegradation process.
When the waste is shredded, its specific surface increases, as does its capacity to retain air and water to facilitate the biodegradation process carried out by microorganisms.
It is recommended that the simplest possible grinding system with the lowest energy consumption is used in order to minimize costs. The most commonly systems used are:
• Chippers and shredders• Drum screens• Shredding screens • Cylindrical shredders

70
T °C
Degradationof sugars and amino acids
Bacterias
Acidification
Actinomycetes
Fungi
Phases: Mesophilic Thermophilic
TIME
Maximum temperatureWaxes, polymers, hemicel lu lose
Mesophilic Maturity
Ammonium
Polymerization
Formation of HA?
Mesofauna
Polymer degradation
BacteriaspH
9
8
7
6
5
4
60
50
40
30
20
10
b) Biological process
In this process there is a 50% or greater reduction of the initial amount of organic material, which breaks down during the fermentation phase due to evaporation and microbiological digestion.
Once the organic waste has been shredded, it passes to the biological process phase, which can be either manual or mechanized using natural or mechanical aeration.
In the first phase, the biological composting process begins through the work of mesophilic bacteria, provoking a rapid increase in temperature and the beginning of the biodegradation process. The temperature can reach up to 70°C. This process occurs during the first few days of composting.
In the second phase, the main fermentation process occurs, and due to the microbial activity of the thermophilic bacteria, the temperature remains at reasonably high levels. This phase lasts from two to four weeks in mechanized facilities and from four to eight weeks in manual facilities.
Figure 36 Composting Phases
140 | CHAPTER 10 | Treatment of Organic Waste
Source: University of Wisconsin-Madison, 2010.

Integrated Solid Waste Management in Island Regions | 141
Two areas of the compost heap should be differentiated:• The central area or nucleus of the compost heap, where the most
important thermic changes occur• The cortex or exterior area that surrounds the nucleus, where the
processes are not so evident
In these stages, the emissions and the need for aeration and moistening are more urgent and therefore require ample supervision and checking.
The final phase, consisting of maturation and sanitization, is the slowest, with a decrease in emissions. Although neither aeration nor moistening are strictly necessary, mixing and stirring the material is recommended so that it is ho-mogenous and hygienic, in order to ensure a better quality of the end product.
c) Dimensioning and operations (Rimache Artica, 2008)
Initially, once the number of cubic meters of the organic material that needs to be treated per day is known, the size of the heaps, mounds, or piles to be used should be defined. It should be noted that it is generally not recommended to form composting units with small volumes, since the fluctuations of temperature and humidity in these units will be rather sudden. It is recommended that the width of the base should be not less than two meters, and as a general rule, the height should be at least half the width of the base, a ratio with which one obtains a good surface to volume ratio.
As an example for dimensioning, it is assumed that a community produces about 5 m3 of organic material per day which has already been sorted and shredded. Based on these assumptions, the windrow should be three meters in width and one and a half meters in height. Each running meter of the windrow would then have a volume of 2.25 m3. Thus, the windrow would advance about 2.22 m per day. Consequently, the windrow would reach an overall length of approximately sixteen meters (15.5 m to be exact) when absorbing the organic material generated weekly; occupying an area of approximately 48 m2/week (3 m x 16 m).
The composting time represents the time from the moment the heap or windrow is formed until the compost is stable and ready for use. This time varies depending on the characteristics of the organic material being composted, the weather conditions (temperature, percentage of relative humidity, precipitation, type of weather, etc.), the operation, and the characteristics of the expected final product. This value should be established for each case according to the previously mentioned conditions that make each situation unique, but the time usually ranges between five and twelve months.8 Other experiences mention periods of three months or more in order to achieve high quality compost.
Based on the expected composting time, the required area for the compost plant is estimated. For the site selection, the following aspects should be considered:
8 For further information, consult Röben (2005) “Composting manual for municipalities”, page 35.

56 m
38 m
DrainagePathways
Sift
ing
and
pack
ing
area
• Avoid zones prone to flooding. Locate the composting plant in the higher parts of the land, not in dips or depressions. The land should have a minimum slope of 1% for run-off of surface water and drainage of leachate (consider building ditches to divert runoff water).
• In places where the soil is permeable, the composting area and the leachate drainage channels should be sealed to prevent groundwater contamination.
Once the area where the composting facility will be located has been defined, a drainage system should be built next to each windrow or ridge with a central drainage ditch for the collection of leachate. The layout of the drainage system will depend on the form and topography of the land.
Continuing with the example, the area required for the composting facility will be determined assuming a four-month composting time.
According to the abovementioned data, the first ridge or windrow would need approximately sixteen weeks to achieve the desired quality, as a result of which the net area for the compost ridges alone would be 768 m2 (16 weeks x 48 m2 = 768 m2). One also must consider that for the purpose of turning and aerate the windrows; the piles must be separated by pathways. The width of the pathways depends on the type of operation being implemented. If it is manual, 2 to 2.5 meters is a suitable width. If it is mechanized, however, using a tractor or a skid loader, the minimum width of the pathway must be four m. In the case of this example, we assume a three meters width for an operation using a mini skid-steer loader, which would lead the pathway area to be: 15 x 16 x 3 = 720 m2 (assuming fifteen pathways, multiplied by a sixteen meters length for each windrow and a three meters width).
Figure 37 Example of a Composting Facility Layout
142 | CHAPTER 10 | Treatment of Organic Waste

Integrated Solid Waste Management in Island Regions | 143
Based on this description, the composting facility area would be 1,488 m2, to which an additional area would need to be added for sifting facilities, warehousing, a packing area, and an administrative area, bringing the total area to 2,000 m2.
In areas with high precipitation levels, the composting area should be covered in order to maintain suitable humidity conditions.
A likely design of the hypothetical facility described in the example is shown in Figure 37.
d) Parameters to guarantee an aerobic and thermophilic composting process (Rynk, 1992)
Putting the organic waste directly onto the compost heap is not recommended, especially when it is composed primarily of food wastes. This type of waste is usually too humid and contains too much nitrogen (as is the case for fruits), so it should be mixed with a dry material that has a high carbon content (such as sawdust) in order to create an ideal environment for microorganisms. The section below describes the most important parameters that should be taken into consideration in terms of the composition of the raw materials of the compost.
- C/N ratio: Carbon and nitrogen are the most important elements for the growth of the microorganisms inherent in the composting process. In order to have optimal conditions for population growth, the quantitative relationship between carbon and nitrogen should be approximately C/N = 30:1. When the ratio is heavily weighted towards the carbon side, nitrogen provision is insufficient for optimal growth of the bacterial populations, and the compost remains cold, causing slow decomposition. At the other extreme, the excess nitrogen is eliminated in the form of ammonia gas, which leads to unpleasant odors. In this case, decomposition is also sub-optimal and the final product is of lesser quality. The C/N ratio of materials used for compost is shown in Table 19.
As a rule of thumb, green and fresh materials are rich in nitrogen, while dark and dry materials are rich in carbon. In order to create a compost heap of optimal conditions, one should use a combination of these materials. In the case of municipal organic waste (which is comprised primarily of plant waste) it is easy to see that the C/N relationship could become too heavily nitrogen-based. In this case, mixing this waste with woodchips or sawdust is recommended. In addition, these carbon-rich materials give the heap a spongy consistency that facilitates aeration of the material, which is extremely important. For the same reason, it is not recommended to replace the wood chips or sawdust with paper or cardboard because these materials can become saturated with liquids and form a compact mass.

Table 19 C/N Ratio of Certain Materials
CARBON-RICHMATERIALS C/N
Fall leaves 30-80:1
Straw 40-100:1
Woodchips or sawdust 100-500:1
Paper 150-200:1
Newspaper or corrugated cardboard 560:1
NITROGEN-RICHMATERIALS C/N
Vegetable waste 15-20:1
Coffee 20:1
Grass clippings 15-25:1
Manure 5-25:1
- Nutrient balance: Adequate amounts of P, K, and trace minerals (Ca, Fe, B, Cu, etc.) are essential for microbial growth and also for achieving a high quality end product. These elements are not limiting factors because they are present in the concentrations necessary in the raw materials of the compost, especially in the plant waste.
- pH: An initial pH range of between 5.5 and 8.5 is optimal for the growth of the compost microorganisms. The pH changes during the distinct composting phases (see the prior section, “Biological process”) because as the bacteria and fungi digest the organic material, organic acids are liberated. As a result, there is a drop in pH in the first phases of the composting process that favors the development of the kind of fungi that are generally acidophiles and that work on breaking up the cellulose and the lignin. These organic acids are consumed in later phases. However, if the environment becomes anaerobic and, for example, the heap is covered with plastic, the accumulation of the acid resulting from fermentation can cause the pH to drop below 4.5, which would severely limit microbial activity.
144 | CHAPTER 10 | Treatment of Organic Waste

Integrated Solid Waste Management in Island Regions | 145
Table 20 Summary of Parameters for Aerobic and Thermophillic Composting
PARAMETER ACCEPTABLE OPTIMAL RANGE RANGE
C/N Ratio 20:1 – 40:1 25:1 – 30:1
Humidity 40 – 65% 50 – 60 %
Average size of wood particles or sawdust 3 – 15 mm Variable
pH 5.5 – 9.0 6.5 – 8.0
Temperature in the center of the heap 45 – 65° C 50 – 60° C
© W
WF/
Jean
Cla
ude
Con
stan
t


Integrated Solid Waste Management in Island Regions | 147
CHAPTER 11
International Convention for the Prevention of Sea Pollution from Shipping
On an international scale, the majority of products and merchandise are transported via sea-faring vessels. For example, in the European Union 70% of trade with third-party countries and 41% of regional commerce is conducted by this method. These figures increase when the greater part of the trade materials are crude and derivative oil products of great importance for the region’s economy and production (Cantano 2003).
At the same time, however, this activity generates various types of waste and effluents. These waste products require preventative measures and adequate management in order to avoid serious contamination problems if they are discharged directly into the ocean, especially in the case of oil spills from ships. These spills can be in the form of unprocessed oily mixtures in ballast water from oil ships, contaminated water from the cleaning of holds on cargo vessels, and oily fuel mixtures from engine rooms in various types of vessel.
Due to the abovementioned issues, and in order to prevent these practices, the international convention MARPOL (abbreviation for “marine pollution”) was created in 1973 and modified in 1978 (which is why it is known as MARPOL 73/78) (IMO, 1978). The International Maritime Organization (IMO), whose headquarters are in London, sponsored the convention.
© W
WF
/ Jea
n C
laud
e C
onst
ant
1. Objective and Structure of the MARPOL International Convention
The MARPOL Convention is an international legal instrument that aims to prevent pollution of oceans produced by vessels and other means of maritime transportation, either in the course of their normal activities or due to maritime accidents.
Its objective is to preserve marine environments through the complete elimination of pollution by oil and other harmful substances and the minimization of the possible accidental discharge of such substances. Currently 119 countries around the world have ratified the convention.
The MARPOL convention provides rules for behavior and control, within a series of rules grouped in Appendices as shown below:
Appendix I Rules to prevent oil pollutionAppendix II Rules to prevent pollution by noxious liquid substances
carried in bulkAppendix III Rules to prevent pollution by harmful substances carried in
packaged formAppendix IV Rules to prevent sewage pollution from vesselsAppendix V Rules to prevent garbage pollution from vesselsAppendix VI Rules to prevent air pollution from vessels
2. MARPOL Appendix V: Garbage PollutionThe following is a summary of Appendix V of the MARPOL 73/78 Convention corresponding to garbage pollution (Ibid.).
Regulation 1 of Appendix V, corresponding to definitions, mentions that the term garbage corresponds to “any type of waste from foodstuffs—except for fresh fish and any portion of the same—as well as the waste resulting from domestic wildlife and the routine work on a vessel under normal service conditions, which are usually discharged continuously or periodically.”
Similarly, a special zone is defined as “any area of the ocean in which, for technically recognized reasons relating to oceanographic and ecological conditions and the particular character of its maritime traffic, it becomes necessary to adopt special obligatory procedures to prevent pollution of the ocean due to garbage.”
Regulation 2, regarding the scope of application, indicates that the rules of this Appendix apply to all vessel types.
Regulation 3 specifies the types of waste that can be discharged into the ocean, specifying the pretreatment they must be given, as well as minimum distances from the closest beaches required in order to discharge this waste. It also
148 | CHAPTER 11 | International Convention for the Prevention of Sea Pollution from Shipping

Integrated Solid Waste Management in Island Regions | 149
mentions the need to maintain a record of these discharges. For example, it mentions that food wastes may be discharged after grinding them (to a size smaller than 25 mm) as far as possible from land, but in no case less than twelve nautical miles from the closest landfall. It also mentions that when the waste is mixed with other waste to which other elimination or discharge requirements apply, the more rigorous set of requirements will apply.
Regulation 4 refers to special requirements for the elimination of garbage and specifies how to manage such waste from fixed and floating platforms as well as the vessels related to these platforms.
Regulation 5 refers to the importance of properly stowing and securing harmful substances to minimize the risk of damaging the marine environment and avoid impairing the safety of ships and persons who may be on board.
Regulation 6 provides exceptions to the above rules, such as in case of emergencies, when it is necessary to ensure the safety of the vessel and people, as well as in the case of vessel breakdowns.
Regulation 7, corresponding to the reception installations and services, notes that the signatory governments of the MARPOL Convention commit to offering adequate installations and services at ports and docks for waste reception and management.
Regulation 8, referring to the supervision of operational requirements by the Port State Control, establishes the routine checks to be implemented by the port operators.
Regulation 9 establishes signage issues, garbage management plans, and record maintenance. These numerals establish the signage requirements according to the size of the vessels, as well as the need for ships to have a detailed solid waste management plan for any activities that must be performed by the crew during the various phases. In addition, this rule establishes the need to maintain a record of waste quantities, management, and disposal.
In July 2011, the IMO adopted extensive amendments to Annex V, which entered into force in 2013. The revised Annex V prohibits the discharge of all garbage into the sea, except as provided otherwise under specific circumstances.


Integrated Solid Waste Management in Island Regions | 151
CHAPTER 12
Waste Management on Oceanic Islands: The Case of the Galápagos Islands
The Galápagos Islands are located in the Pacific Ocean, 600 miles off the cost of Ecuador, with a surface area of 788,200 hectares. The archipelago is comprised of nineteen islands, forty-seven islets, and at least twenty-six rocks or promontories of volcanic origin. Of the total surface area, 96.7% (761,844 ha) has been declared a national park; the remaining 3.3% (26,356 ha) is a colonized area comprising urban and agricultural areas on San Cristóbal, Santa Cruz, Isabela, and Floreana islands. Another populated island is Baltra, where a military base and the main airport serving Galápagos are located. The rest of the islands are uninhabited by human beings.
Galápagos is one of Ecuador’s twenty-five provinces. Its capital is Puerto Baquerizo Moreno, located on San Cristóbal Island. The province is divided into three counties: Santa Cruz, San Cristóbal (which includes Floreana), and Isabela.
The Galápagos Islands have achieved worldwide significance and global recognition because of their marine and terrestrial endemic uniqueness, their geological formations, and their geographical location at the convergence of five important marine currents. The islands are also known as the inspiration for Charles Darwin’s theory of natural selection. (WWF & Toyota, 2010)
© W
WF/
Jea
n C
laud
e C
onst
ant

PACIFIC OCEAN
PINTA ISLAND
Lobos Island
RÁBIDA ISLAND
PINZÓN ISLAND
BALTRA ISLAND
NORTH SEYMOUR ISLAND
ALBANIA ISLAND
ISABELA ISLAND
ESPAÑOLA ISLAND
SANTIAGO ISLAND
Beagles Islands
GENOVESA ISLAND
MARCHENA ISLAND
SANTA FE ISLAND
Bartolomé Island
SANTA CRUZ ISLANDFERNANDINA ISLAND
SANTA MARÍA ISLAND
SAN CRISTOBAL ISLAND
Sombrero Chino IslandDaphne Menor Island
LOS CUATRO HERMANOS ISLANDS
Daphne Mayor Island
92°0'0"W
92°0'0"W
91°30'0"W
91°30'0"W
91°0'0"W
91°0'0"W
90°30'0"W
90°30'0"W
90°0'0"W
90°0'0"W
89°30'0"W
89°30'0"W
1°0'0"S 1°0'0"S
0°30'0"S 0°30'0"S
0°30'0"N 0°30'0"N
0°0'0" 0°0'0"
TORT UGA ISLAND
Gardner Island
Caldwell Island
TNC - CLIRSEN
Figure 38 The Galápagos Islands
Key milestones in the modern history of the Galápagos Islands include:
1934: Galápagos Islands designated a wildlife sanctuary1959: 97% of their territory declared a national park1978: Galápagos declared a World Natural Heritage Site by UNESCO1984: Galápagos declared a Biosphere Reserve by UNESCO1986: Galápagos Marine Reserve created1998: Galápagos Special Law created2001: Galápagos Marine Reserve declared a UNESCO World Natural
Heritage Site2002: Isabela Island wetlands declared a protected wetland area by
RAMSAR
The abovementioned characteristics have made the Galápagos Islands an international tourist attraction, to the extent that the annual number of tourists visiting the islands increased from around 18,000 in 1985 to 41,000 in 1990, and to nearly 70,000 in the year 2000. In 2007, almost 162,000 people came to the islands as tourists, and approximately 500,000 tourists are expected to arrive over the next ten years (CDF, 2007).
The continuous growth of tourism and the economic opportunities associated with this sector have given rise to permanent growth in the number of
152 | CHAPTER 12 | Waste Management on Oceanic Islands: the Case of the Galápagos Islands

Integrated Solid Waste Management in Island Regions | 153
immigrants. The current population has been growing at a rate of over 6% per year (WWF, 2003). If this trend continues, the population will double in the next twelve years.
One of the most critical threats for the Galápagos Islands has emerged almost inadvertently over the last two decades: greater waste generation and inadequate waste management. These threats are directly related to the growing number of inhabitants and tourists as well as to new consumption patterns and lifestyles.
Waste affects the land on the inhabited islands and the water on all of the islands. Improperly managed garbage easily becomes marine waste, affecting the fragile marine ecosystem and even the coastlines of uninhabited islands. An unknown number of animals die each year as a result of becoming tangled in pieces of rope or plastic bags, or from consuming floating garbage.
More than 500 tons of everyday consumer products are sent to the islands each month. Ultimately, these products and their containers generate waste. Currently, shipment of this waste back to the mainland is not an option due to high costs and the lack of adequate infrastructure. In the past, the lack of equipment, resources, and technical capacity within the Municipalities of Galapagos resulted in an accumulation of litter in streets and public areas, as well as the uncontrolled burning of garbage in open dumps.
More than 60% of Galápagos’ total household waste is generated on Santa Cruz Island, which is inhabited by around 60% of the population and is the center for touristic infrastructure on the archipelago. Since 2006, WWF and Toyota have collaborated with the Municipality of Santa Cruz to implement an efficient waste management and recycling system. The specific case of Santa Cruz Island is presented below.
1. Case Study: Integrated Solid Waste Management System on Santa Cruz Island, Galápagos, Ecuador
Santa Cruz Island bears its name in honor of Christ’s cross (the direct translation is “Holy Cross”), and its English name is “Indefatigable.” The island accommodates the county of Santa Cruz and has a land area of 986 km² and a maximum altitude of 864 meters. The county’s capital is Puerto Ayora. Santa Cruz has the largest population of all of the islands: approximately 12,559 inhabitants in 2008 (INEC, 2008), with a registered annual growth rate of 6.9% per year against 2001 figures. The county’s population distribution is 84% in the urban area and 16% in the rural area.

The Charles Darwin Research Station and the Galápagos National Park Service headquarters are located on Santa Cruz Island. The rural area has various settlements, including the parishes of Bellavista and Santa Rosa and the following small villages: Salasaca, El Carmen, Occidente, El Camote, and El Cascajo (AME, 2003).
In terms of water service, 77.5% of households receive their water supply through the public network, 5% from wells, 2% from springs, 8.4% from tanker trucks, and 7% by other means. The main problem with this service is its quality, due to the high concentration of chloride (800–1200 mg/Lt) and fecal coliforms, as a result of which the water supplied by this network is used only for cleaning purposes, and the users must purchase bottled water for human consumption. In terms of sewage service, only 3.6% have a connection to the public sewage system, while 88.7% have individual solutions such as latrines or septic tanks. Of the remainder, 6.2% throw the effluents into crevices and 1.6% use other solutions (INGALA, 2006).
The topic of solid waste service on Santa Cruz Island has been the subject of a number of technical studies and management proposals since 1995, of which the following are the most important:
• Cynthia Palmer produced the document “Notes on SANITEC Proposal for Management of Solid Waste, Puerto Ayora and Bellavista. Preliminary notes only,” in December 1995, in which she suggested an alternative management system for the solid waste from vessels.
• With financing from the Ecuadorian State Bank, the INTERGRUPO SANITEC association carried out a “Feasibility Study and Definitive Designs for the Solid Waste Project for the City of Puerto Ayora and Bellavista, Galápagos Province,” from 1995 to 1997.
• Sandra Cointreau–Levine prepared the document “Galápagos Program of Integrated Environmental Management Inter–American Development Bank Project Preparation. Solid Waste Management. First Draft for Local Inputs and Review,” in November 1997.
• USAID, Fundación Carvajal, and Fundación Natura jointly prepared a “Project for the Comprehensive Management of Solid Waste in the Galápagos Islands - Ecuador” from 1997 to 1999.
It is important to mention that in 1995, the street sweeping coverage in Santa Cruz was at around 49% of the 4.4 km of roads that were suitable for swee-ping. In addition, waste collection coverage was 71% of the 6.2 tons/day gene-rated. In order to provide this level of service, the city counted on three street sweepers (two of whom were over seventy years old), one driver, and four collection workers. The collection was performed with an 8 m3 dump truck, model 1990. No recovery, recycling, or organic waste treatment activities were in place (Ltda. 1995), (Fundación Natura).
Until November 1997, the site for final disposal of garbage was located close to the urban area and within the main aquifer’s recharge area for the public water supply of Puerto Ayora. This site had no infrastructure; the organization was typical of an open dump with no supervision and included garbage bur-ning (Fundación Natura et al. 1998).
154 | CHAPTER 12 | Waste Management on Oceanic Islands: the Case of the Galápagos Islands

Integrated Solid Waste Management in Island Regions | 155
La Fe
Salasaca
Isla Edén
Bellavista
Santa Rosa
Los Gemelos
Cerro Núñez
Punta Núñez
Islas Plaza
Puerto Núñez
PUERTO AYORA
Las Palmitas
Bahía Comway
Punta Tamayo
Rocas Gordon
Bahía SeymourPunta Carrión
Cerro Cascajo
Cerro Gallina
Cerro Ballena
Cerro Crocker
Bahía Borrero
Bahía Ballena
Bahía TortugaPunta Estrada
Punta Bowditch
Cerro Salasaca
Bahía Academia
ZÓN
Canal de Itabaca
Cerro Media Luna
Punta Rocafuertembre
Islas Guy Fawkes
CANAL DE SANTA CRUZ
Cerro Granillo Rojo
Bahía Tortuga Negra
Cerro Granillo Negro
Tortuga o Proaño
776 000
776000
786 000
786000
796 000
796000
806 000
806000
816 000
816000
9916
000
9916
000
9926
000
9926
000
9936
000
9936
000
9946
000
9946
000
90°35'0"W
90°35'0"W
90°30'0"W
90°30'0"W
90°25'0"W
90°25'0"W
90°20'0"W
90°20'0"W
90°15'0"W
90°15'0"W
90°10'0"W
90°10'0"W
0°45'0"S 0°45'0"S
0°40'0"S 0°40'0"S
0°35'0"S 0°35'0"S
0°30'0"S 0°30'0"S
ECUADOR ESCALA 1:150.000
PERÚ
COLOMBIA
OCÉ
ANO
PAC
ÍFIC
O
PASTAZA
MANABI
LOJA
NAPO
GUAYAS
ORELLANA
SUCUMBIOS
MORONASANTIAGO
AZUAY
PICHINCHA
ESMERALDAS
LOS
RIO
S
EL ORO
COTOPAX I
ZAM
ORA
CH
INCH
IPE
CARCHI
CH
IMB
OR
AZO
BOLI
VAR
CAÑAR
IMBABURA
TUNGURAHUA
92°W
92°W
90°W
90°W
88°W
88°W
86°W
86°W
84°W
84°W
82°W
82°W 80°W
80°W
78°W
78°W
76°W
76°W
4°S 4°S
2°S 2°S
0° 0°
UBICACIÓN DE LAS ISLAS GALÁPAGOS SEGÚN EL CONTINENTELEYENDA
SUBTIPO Ma BsaP BscP Bsm Bt BhL AslM AsMi AsaM AsaAr AsaC AsaP AscM AscAr AscC AhH AhCh Hlm Hsa Hsc Hh Ppd Pte
Vegetación pionera sobre ceniza volcánica Pcv
Vegetación pionera sobre lava Pl
Vegetación invasora de Guayaba EiG
Vegetación invasora de Poma Rosa EiPr
Vegetación invasora de Cascarilla EiCa
Vegetación invasora de Cedro EiCe
Vegetación invasora de Pastos EiPa
Vegetación invasora de Mora EiM
Vegetación invasora mixta Eim
Área con Cultivos Gc
Área con Pastos Gp
Área con Asociaciones Agrícolas Ga
Lava reciente Rr
Lava antigua Ra
Suelos erosionados Se
Playas Sp
Lagunas Cl
Humedales Ch
Urbana Iu
Portuaria Ip
Aeroportuaria Ia
Otros Io
COBERTURA
CODIGO SUBTIPOCOBERTURA
CODIGO
SIMBOLOGÍA
Línea de costa
Ciudades
Curva intermedia
Curva índiceHidrografía
Camino principalCamino secundarioSendero
CARTOGRAFÍA PLANIMÉTRICA YTEMÁTICA DE LAS ISLAS GALÁPAGOS
FUENTE: IMAGEN SATELITAL SPOT, resolución 5m (año 2005)IMAGEN SATELITAL SPOT, resolución 20m (año 1999-2000)IMAGEN SATELITAL EROS, resolución 1.8m (año 2006)IMAGEN SATELITAL ASTER, resolución 15m (año 2000-2002) Curvas de nivel generadas a partir del SRTM (90 m.)Misión Topográfica de Radar - Transbordador Espacial Información del proyecto SIG-GALAPAGOSTrabajos de campo, febrero - 2006
FECHA:
JUNIO - 2013
Instituto Espacial Ecuatoriano
Manglar
Arbórea seca abierta de Palo SantoArbórea seca cerrada de Palo Santo
Arbórea seca mixta: P. Santo, Pegapega, Matazarno
Arbórea de transición: Guayabillo, Lechoso, U. Gato
Arbórea húmeda de LechosoArbustiva seca en Litoral de Monte Salado
Arbustiva seca mixta: Lechoso, Tuna, Chala
Arbustiva seca abierta de Muyuyo
Arbustiva seca abierta de Algarrobo
Arbustiva seca abierta de Chala
Arbustiva seca abierta de Palo Verde
Arbustiva seca cerrada de Muyuyo
Arbustiva seca cerrada de Algarrobo
Arbustiva seca cerrada de Chala
Arbustiva húmeda de Helecho Arbóreo
Arbustiva húmeda de Chala
Herbácea litoral mixta: Suculentas y pastos
Herbácea seca abierta
Herbácea seca cerrada
Herbácea húmeda
Vegetación pionera sobre playas y dunas
Vegetación pionera sobre tufa y escoria
Figure 39 Santa Cruz Island, Galápagos

In November 1997, the final disposal site was moved to a semi-arid zone twenty-seven kilometers from the center of Puerto Ayora, on the leeward side of the island far from the populated center on the other side of the watershed, which meant a decreased risk of contaminating the subterranean waters. In this site, all of the collected waste was deposited in one and a half to two meter deep trenches, and the practice of incinerating the waste was observed with the presence of waste on both sides of the access road (Ltda., 1995), (Ibid.).
In 1998, USAID, Fundación Natura, and Fundación Carvajal developed an integrated solid waste management project that opened the topic of recycling solid waste, using a differentiated collection system and separation at the source in three neighborhoods of Puerto Ayora. The waste gathered was sent to a small recycling facility, where it was sorted and baled and sent to mainland Ecuador. Approximately 5–8% of the total amount of potentially recyclable materials on the island (0.3 tons/day) was expected to be recycled (Fundación Natura).
At the end of the 1990s, the Galápagos National Park Service, the Galápagos Foundation, and the Municipality of Santa Cruz began the first formal recycling scheme on the island. Since then, the Galápagos Foundation has continually provided funds for the staffing and administration of the municipal recycling center.
Having worked together for several years on conservation issues in the Galápagos Islands, in 2006 WWF and Toyota decided to focus their efforts on the critically important issue of waste management. This work built upon the efforts initiated by the Municipality of Santa Cruz. To date, WWF and Toyota have supported the strengthening of ISWM through technical assessment, donations of equipment, and an education campaign on recycling practices and responsible consumption, among other issues. In addition, in March 2010, WWF and Toyota produced a Waste Management Blueprint for the Galápagos Islands based on the experience gained on Santa Cruz Island, which provides general guidelines for achieving integrated solid waste management and recycling on all the inhabited islands of Galápagos using sustainable practices and systems.
Since 2006 to date, on Santa Cruz Island, differentiated collection has almost 100% coverage with a recycling system in place in the entire service area. Various recycling and composting tasks are performed in the Fabricio Valverde Recycling Center, with an estimated efficiency of 10 m3/day for recycled material and 1–2 m3/day for treatment of organic waste in 2008. In 2012, Santa Cruz Island generated 125 tons/month of organic waste, 75 tons/month of recyclables, and 130 tons/month of non-recyclables.
Similarly, in 2008, WWF and Toyota contracted studies for the Definitive Design of the Santa Cruz Sanitary Landfill9 and the characterization of solid waste. The solid waste classification data is presented below.
9 The construction of the sanitary landfill was completed in 2012, with funds from the Municipality of Santa Cruz, the Ecuadorian State Bank, and the Galápagos National Park, among others.
156 | CHAPTER 12 | Waste Management on Oceanic Islands: the Case of the Galápagos Islands

Integrated Solid Waste Management in Island Regions | 157
1.1. Classification of Solid Waste on Santa Cruz Island
The study used a combination of statistical sampling techniques for the classification of solid wastes. Initially, it calculated the size of the sample using Dr. Sakurai’s simple method for solid waste analysis. In the field, the study used the procedure recommended by Mexican standards, which is random sampling through the distribution of plastic bags, weighing of the samples, applying the quartering method, and the determination of the volumetric weight and subproducts. The results obtained from a sample performed from August 18–23, 2008, are presented below (De la Torre, 2008).
At the outset, a population projection was performed to determine the entire set of households on the island, in order to calculate the number of samples:
Table 21 Population Projection for Santa Cruz Island
POPULATION2006 %GROWTH POPULATION NO.OFURBAN RATE(GR) 2008 HOUSEHOLDS2006
Santa Cruz 11,262 0.056 12,559 3,303
Bellavista 1,608 0.056 1,793
Santa Rosa Parish 446 0.056 497
Puerto Ayora Parish (urban) 9,208 0.056 10,268
Rural Parishes 2,054 0.056 2,291
The application of Dr. Sakurai’s formula for the variables indicated in Table 22 was used to calculate the number of samples in the urban center (Puerto Ayora) and in the rural parishes (Santa Rosa and Bellavista) and the sum that represents the total number of samples taken on the island.
Table 22 Estimation of the Number of Samples
NO.OFHOUSEHOLDS NO.OFSAMPLES NO.OFSAMPLES E V (URBAN)2006 ADOPTED CALCULATED
Santa Cruz 3,303 160 165
Puerto Ayora (urban) 100 93 40 200
Santa Rosa 25 33 60 200
Bellavista 35 39 60 200
Where: E = Sampling error in kg/inhabitant/day. V = standard deviation from the sample.

In the case of Puerto Ayora, the sampling methodology did not divide the city into socioeconomic strata but rather organized it by residential and commercial sectors only. The residential sector was again subdivided between the lower part and upper part of the city.
The information generated on household-commercial type solid waste production per capita (PPC) is presented below, in terms of the main sources of generation: residential areas, commercial areas, rural areas, and touristic vessels. The reliability of the sample is 90%.
Table 23 PPC Values Obtained for Santa Cruz Island
DATAGENERATION PPC(KG/INHABITANT/DAY)
Household area, upper section of Puerto Ayora 0.513
Household area, lower section of Puerto Ayora 0.543
CommercialArea 0.373
Averagewithoutrecyclingforthethreeareas 0.476
Recycling 0.140
TotalPuertoAyora 0.617
OTHER SOURCES
Weeds 0.139
Market and slaughterhouse 0.02
TOTAL PPC 0.776
Table 24 shows the results for the PPC calculation in the rural parishes of the island.
Table 24 PPC Values by Parish, Santa Cruz Island
AREA PPC(KG/INHABITANT/DAY)
Bellavista 0.471
Santa Rosa 0.283
The following results can be seen in terms of solid waste generation on vessels (samples were taken from eight of the sixty-eight tourism vessels that arrive per week) and hotels:
0%
10%
20%
30%
40%
50%
60%
Orgánico Reciclable No reciclable Chatarra Maleza
Zona alta
Zona media
Zona comercial
Promedio
158 | CHAPTER 12 | Waste Management on Oceanic Islands: the Case of the Galápagos Islands
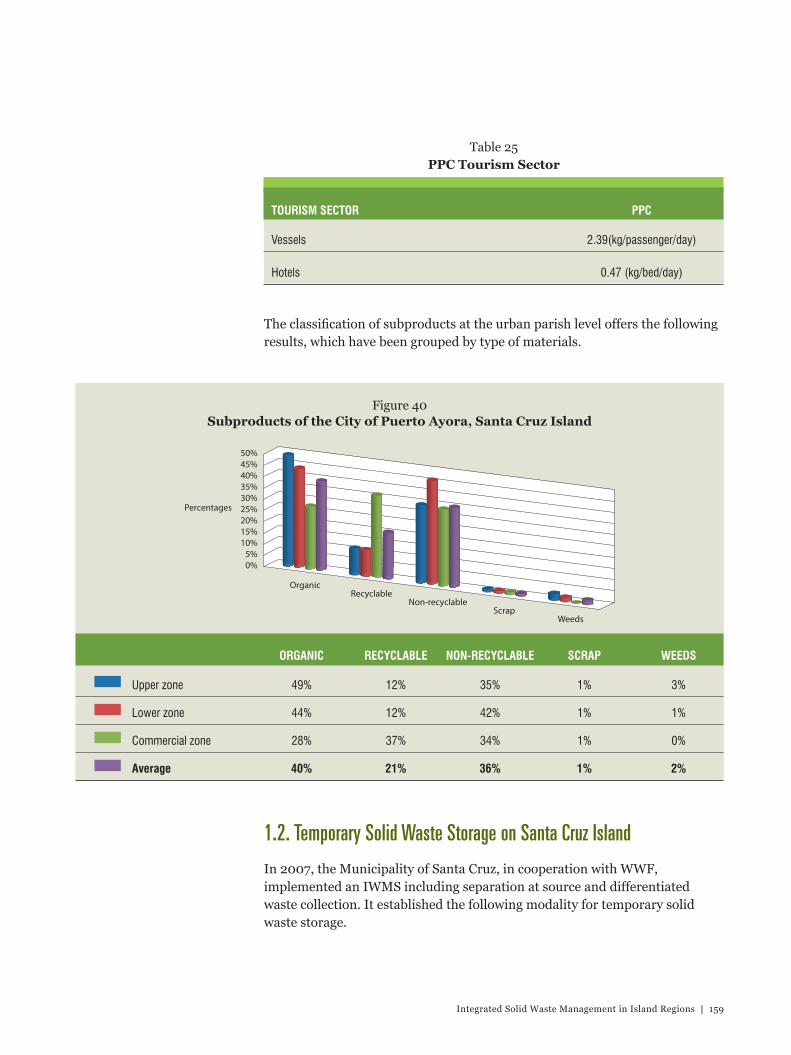
Integrated Solid Waste Management in Island Regions | 159
0%5%
10%15%20%25%30%35%40%45%50%
RecyclableOrganic
Non-recyclableScrap
Weeds
Percentages
Table 25 PPC Tourism Sector
TOURISM SECTOR PPC
Vessels 2.39(kg/passenger/day)
Hotels 0.47 (kg/bed/day)
The classification of subproducts at the urban parish level offers the following results, which have been grouped by type of materials.
Figure 40 Subproducts of the City of Puerto Ayora, Santa Cruz Island
ORGANIC RECYCLABLE NON-RECYCLABLE SCRAP WEEDS
Upper zone 49% 12% 35% 1% 3%
Lower zone 44% 12% 42% 1% 1%
Commercial zone 28% 37% 34% 1% 0%
Average 40% 21% 36% 1% 2%
1.2. Temporary Solid Waste Storage on Santa Cruz Island
In 2007, the Municipality of Santa Cruz, in cooperation with WWF, implemented an IWMS including separation at source and differentiated waste collection. It established the following modality for temporary solid waste storage.

“ORDINANCE FOR INTEGRATED WASTE MANAGEMENT IN THE COUNTY OF SANTA CRUZ”
CHAPTER II. WASTE CLASSIFICATION:
Art. 12.- For purposes of implementation of this ordinance, the waste will be classified as follows, with the possibility of modifying the classification depending on the technically viable treatment options available.
1. ORGANIC WASTE:a. Food scraps, such as fruit rinds, vegetables, food scrapsb. Plant remains, such as gardening wastec. Wood remains: Construction wood, sawdust, shavings, packing materials
2. RECYCLABLE MATERIALS:a. Paper: Office paper, newspaper, magazines, cardstock, notebooks, and booksb. Cardboard: Cardboard boxes for packing, product packagingc. Plastics: Cola, water, and drink containers; beer crates for alcoholic and non-alcoholic beverages;
clean kitchen utensils, furniture, others; plastic bags, buckets, toys, PVC tubes; fruit crates, plastic cords, and other types of plastic.
d. Glass: Beer bottles, cola bottles; clean jars used for jellies, sauces, and other preserved foods.
3. OTHER MATERIALS:a. Metalsb. Clothing and ragsc. Foam articles
4. TOXIC AND DANGEROUS WASTE MATERIALS:a. Plastics and batteriesb. Used oilsc. Hospital wasted. Other toxic wastee. Rubber or gum articlesf. Explosive articles
5. SCRAP AND VOLUMINOUS WASTE:a. Metalsb. Home appliancesc. Computer equipmentd. Cars, spare parts, parts
6. RUBBLE:a. Stone materialsb. Ceramics, etc.
CHAPTER III. ON CONTAINERS, TYPES AND USES
Art. 13.- The containers that will be used for waste collection are the following:1. Green colored plastic container: For organic waste that will be delivered to the collection
vehicle assigned to this material during the corresponding schedule and without any type of plastic or metallic materials or any non-biodegradable residues.
160 | CHAPTER 12 | Waste Management on Oceanic Islands: the Case of the Galápagos Islands
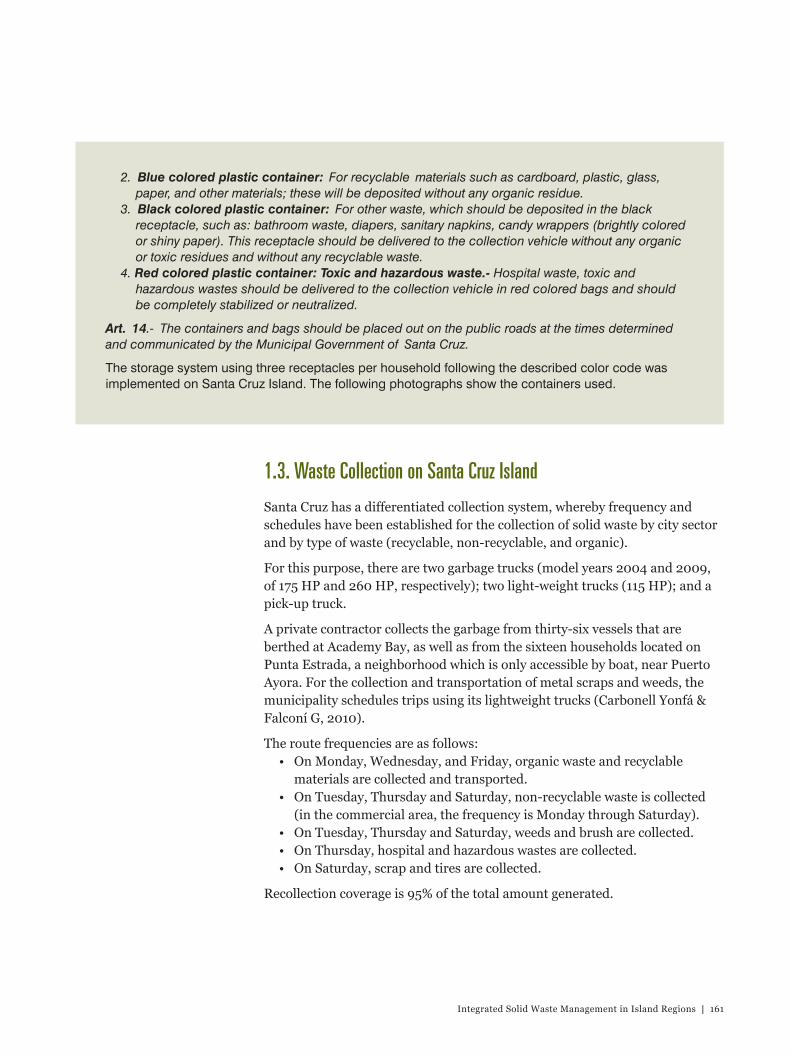
Integrated Solid Waste Management in Island Regions | 161
1.3. Waste Collection on Santa Cruz Island
Santa Cruz has a differentiated collection system, whereby frequency and schedules have been established for the collection of solid waste by city sector and by type of waste (recyclable, non-recyclable, and organic).
For this purpose, there are two garbage trucks (model years 2004 and 2009, of 175 HP and 260 HP, respectively); two light-weight trucks (115 HP); and a pick-up truck.
A private contractor collects the garbage from thirty-six vessels that are berthed at Academy Bay, as well as from the sixteen households located on Punta Estrada, a neighborhood which is only accessible by boat, near Puerto Ayora. For the collection and transportation of metal scraps and weeds, the municipality schedules trips using its lightweight trucks (Carbonell Yonfá & Falconí G, 2010).
The route frequencies are as follows:• On Monday, Wednesday, and Friday, organic waste and recyclable
materials are collected and transported.• On Tuesday, Thursday and Saturday, non-recyclable waste is collected
(in the commercial area, the frequency is Monday through Saturday).• On Tuesday, Thursday and Saturday, weeds and brush are collected.• On Thursday, hospital and hazardous wastes are collected.• On Saturday, scrap and tires are collected.
Recollection coverage is 95% of the total amount generated.
2. Blue colored plastic container: For recyclable materials such as cardboard, plastic, glass, paper, and other materials; these will be deposited without any organic residue.
3. Black colored plastic container: For other waste, which should be deposited in the black receptacle, such as: bathroom waste, diapers, sanitary napkins, candy wrappers (brightly colored or shiny paper). This receptacle should be delivered to the collection vehicle without any organic or toxic residues and without any recyclable waste.
4. Red colored plastic container: Toxic and hazardous waste.- Hospital waste, toxic and hazardous wastes should be delivered to the collection vehicle in red colored bags and should be completely stabilized or neutralized.
Art. 14.- The containers and bags should be placed out on the public roads at the times determined and communicated by the Municipal Government of Santa Cruz.
The storage system using three receptacles per household following the described color code was implemented on Santa Cruz Island. The following photographs show the containers used.

Separationsystem in
householdsand commercial
sector
Collectionsystem
Treatmentsystem
MainlandEcuador
SOLID WASTE GENERATED10.2 ton/day
Recyclable OrganicHospital and
hazardous wasteRefuse
MondayWednesday
Friday
MondayWednesday
FridayThursday
TuesdayThursdaySaturday
Recycling Area* Cardboard* Glass* Paper* Plastic
Inaugurated in December 2012
Composting Area Sanitary landfill Incineration
The monitoring and supervision of the differentiated collection scheme on Santa Cruz is performed using a system of digital radios that are mounted in the cabins of the various vehicles. These units are equipped with GPS devices which send a signal of the vehicle’s location every ten seconds to the base radio. The location/tracking of the vehicles is shown on a digital map of Santa Cruz.
A sketch summarizing the Santa Cruz system is shown in Figure 41.
Figure 41 Drawing of Solid Waste Management on Santa Cruz
A map of the collection vehicle routes and the location of the current garbage dump at kilometer twenty-seven are shown in Figures 42, 43, and 44.
162 | CHAPTER 12 | Waste Management on Oceanic Islands: the Case of the Galápagos Islands

Integrated Solid Waste Management in Island Regions | 163
Figure 42 Waste Collection Vehicle Routes until Final Disposal
Figure 43 Micro-route for Organic and Recyclable Waste Collection
Puerto Ayora
Bella Vista
Santa Rosa
Los Gemelos
S 04
SERIE J821 HOJA CIII-F1b, 1591 IV NE
SIRGAS (WGS 84)EDICIÓN1-IGM
ROUTE
S 01
S 02
Commercial areaResidential area
S 03
S 04
S 04S 04S 04
Punta Estrada neighborhood

Punta Estrada
Academy Bay
In addition, it should be mentioned that a private initiative with municipal sponsorship collects used oils and lubricants for later transfer to mainland Ecuador.
1.4. Street Sweeping on Santa Cruz Island
Puerto Ayora has the following geographic distances (Carbonell Yonfá & Falconí G, 2010):
Paved roads: 7.47 kmBrick-paved roads: 12.71 kmDirt roads: 20.80 km
There are a total of 40.98 km of roads in Puerto Ayora. The roads that are suitable for sweeping measure 20.18 km in total. Regarding the quality of the Municipal service it can be stated that there is 100% coverage of B-type cleaning grade, meaning only a moderate amount of dust can be observed.
Seven workers are assigned to seven sectors to cover the urban area. Every workday the supervisor assigns a route of streets to each worker in his or her respective sector to be cleaned. Depending on the amount of waste found upon sweeping the street, the worker sweeps the area various times in order to keep it clean. As a result, yields are approximately 500 m/person*day. Yields are less than the previously described standard (2.5 km/person*day) because of the quantity of dust that accumulates in the streets of Puerto Ayora, due to the arid climate. Besides, the paving bricks that cover most of the streets of Puerto Ayora make sweeping time consuming.
Figure 44 Waste Collection Route for Vessels in Academy Bay
164 | CHAPTER 12 | Waste Management on Oceanic Islands: the Case of the Galápagos Islands

Integrated Solid Waste Management in Island Regions | 165
Although the average amount that each worker needs to sweep is about 2.88 km, the route is comprehensively served by 500 m partial advances. In other words, on any given day, the workers begins where they left off the day before until they completes their assigned stretch, and then starts again. The conflictive sites, or those that accumulate the greatest quantity of waste, are attended on a daily basis and usually several times per day.
A walk-through of some of the routes verifies the level of street cleanliness, as well as a positive attitude among the citizens with regards to street cleaning. When consulted, citizens stated that they avoid throwing waste into the streets and that they actually chastise those tourists who do so, which helps keep the roads clean.
A drawing of the street sweeping areas in Puerto Ayora is shown in Figure 45.
Figure 45 Map of Street Sweeping Routes of Puerto Ayora
SERIE J821 HOJA CIII-F1b, 1591 IV NESIRGAS (WGS 84) EDICIÓN1-IGM
S1S2S3S4S5S6S7

1.5. Fabricio Valverde Recycling Center
Initially, in the 1990s, a preliminary formal recycling scheme was promoted on Santa Cruz Island with the support of the Galápagos National Park Service, the Galápagos Foundation, and the Municipality of Santa Cruz. Since then, the Galápagos Foundation has continually provided funds for staff to operate the municipal recycling center (WWF, 2010).
Between 2003 and 2006, with funds from the European Union (URB-AL Program), the municipality built a recycling plant and a composting area named the Fabricio Valverde Recycling Center (PAFV, acronym in Spanish). The municipality purchased a compacting truck and hired a consultant to coordinate the launch and execution of the recycling project.
PAFV, which was established thanks to the abovementioned institutional collaboration and with further support of other donor contributions, is comprised of the following units (Carbonell Yonfá & Falconí G, 2010):
• An information center, with educational material regarding the recycling activities that are performed at PAFV
• A conveyor belt used for sorting recyclable materials• Grinding machines for glass and plastic• Cardboard and scrap compacters• An incinerator for hospital and biohazardous waste• A mechanical in vessel composter used to preprocess the organic
material before going into the open-air composting process• A truck scale
1.5.1. Recycling AreaFigures 46 and 47 show the composition and quantity of recycled materials, as determined by the service fee formulation study in June of 2010.
It is worth mentioning that thanks to the educational campaigns that have been implemented, citizen participation in waste separation has increased. This can be observed through the increase of recyclable materials arriving at the PAFV. For example, by December 2006, the weight of recycled materials had risen by 140% (from 12 tons/month to 16.8 tons/month). By December 2007, this indicator climbed significantly by 226% (to 27.1 tons/month) and in December of 2008 and 2009, it rose by 312% and 325% respectively (to 37.4 tons/month and 39 tons/month). As of March 2010, the percentage increase in the weight of recycled materials had climbed 374% (to 45 tons/month). Figure 48 reflects the noted trend.
166 | CHAPTER 12 | Waste Management on Oceanic Islands: the Case of the Galápagos Islands

Integrated Solid Waste Management in Island Regions | 167
Glass: 148,824; 30%
Plastic: 84,234; 13%
Cans: 8,458; 1%
Others: 18,994; 4%
Cardboard: 224,318; 45%
Paper: 37,425; 7%
Cement bags: 9,044;
2%
Tetra Pak:8,030; 1%
Egg trays:3,920; 1%
Glass: 356,009; 24%
Plastic: 135,389.74; 9%
Cans: 11,247.09; 1%
Treta Pak: 10,589.80; 1%
Others: 17,212.87; 1%
Cardboard: 870,784; 58%
Paper: 96,749; 6%
Cementbags:
10,178.20;1%
Egg trays:6,346.76;
0%
Battery:858; 0%
Figure 46 Composition of Recycled Material in the PAFV. 2009
Figure 47 Weights and Percentages of Recycled Material in the PAFV. 2010

Jan-
06
PE
RC
EN
TAG
E O
F G
RO
WTH
10%
100%
200%
May
-06
Jul-0
6
Oct
-06
Jan-
07
Apr
-07
Jul-0
7
Oct
-07
Jan-
08
Apr
-08
Jul-0
8
Oct
-08
Jan-
09
Apr
-09
Jul-0
9
Oct
-09
Jan-
10All of the sorted waste is baled and packed for its return to companies on the mainland that recycle the various materials.
5.1.2. Composting AreaComposting is extremely important on Santa Cruz because the complete transformation of organic waste into compost leaves only non-recyclable and reject waste with very low humidity for final disposal in the sanitary landfill. As a result, there is very little landfill gas and leachate generation in the final disposal phase, which facilitates its management.
Specifically, the Santa Cruz composting plant has a mechanical in-vessel composting machine with a rotating drum imported from the United States that was donated by WWF and Toyota to the Municipality of Santa Cruz in 2008. The machine comprises a helical chopper that mixes the organic waste (a mixture of plant remains and sawdust) to guarantee a consistent mixture and C/N ratio. In addition, it has a round steel drum approximately five meters long and two meters in diameter that is supported on two bases. The drum is propelled by four electric motors with 0.3 kW of power each, and spins at a speed of approximately four revolutions per hour.
Figure 48 Percentage of Growth of Recycled Material in the PAFV
168 | CHAPTER 12 | Waste Management on Oceanic Islands: the Case of the Galápagos Islands
Source: WWF, 2010.

Integrated Solid Waste Management in Island Regions | 169
Currently the Municipality of Santa Cruz and WWF have incorporated a composting process for organic waste that arrives in garbage collection trucks used specifically for that purpose and that discharge on the platform right next to the mechanical composting machine, where a manual separation of the organic waste is performed. Later the organic garbage is distributed uniformly across the floor and mixed with sawdust.
This mixture is then placed inside the mechanical composter, which chops the garbage and mixes it evenly with the sawdust. After a week, the fermented organic waste is placed in heaps on the adjacent land for its maturation over a period of six months, at the end of which it is ready for sifting and packaging. The material is used as fertilizer in municipal green areas and can also be ordered by educational establishments and households.
The mechanical composter makes the organic waste enter an accelerated pre-composting process. Within the tank, the fresh material comes into immediate contact with the organic material that is already in a composting state and is immediately infused with the microorganisms that cause its decomposition. The tank maintains the material in aeration and enclosed, which leads to the ideal heat necessary for the growth of the microorganisms that cause the decomposition.
In the context of Galápagos, and in islands in general, the mechanical composter offers the significant advantage of keeping the organic waste enclosed, therefore not allowing the material to enter into contact with birds or rodents that could spread seeds of invasive species. One of the main threats to the Galápagos’ terrestrial ecosystems are the species that have been brought over from the mainland (as food or seeds for agriculture), which have proliferated in the island environment due to a lack of natural competition and then compete with the highly vulnerable endemic species.
The designated composting area in the PAFV measures 4,414 m2. It includes the mechanical composting section as well as those areas needed to mature the homogenized compost, which covers approximately two-thirds of this area (2,942 m2).
The compost windrows are two meters wide with an initial height of one and a half meters. Their length is approximately thirty meters, and they are turned with the help of a mini skid-steer loader.
1.6. Final Waste Disposal
As on many small islands in the world, the main problem with the quantity of garbage generated every day is the lack of available space for final disposal in the long-term. Another problem is the difficulty of selecting the site’s location.
As explained in Chapter 7, the final disposal site must meet certain characteristics in order to be chosen. On Santa Cruz, the potentially available area under Municipal jurisdiction (non-protected area) is not suitable

for a final disposal site because it is too close to the populated centers. In addition, this area is completely located on the southern part of the island which receives about 90% of the island’s precipitations, which would cause a considerable increase in leachate generation and represents a potential threat for the island’s scarce fresh water resources. The rest of Santa Cruz is protected area and is not accessible, except for the adjacent areas to the road that runs the length of the island from south to north.
In 1998, the Municipality of Santa Cruz reached an agreement with the Galápagos National Park to locate a dump in the northern section of Santa Cruz, two-hundred meters from the road and twenty-seven kilometers away from the most populated urban area Puerto Ayora. The site’s location has various advantages because of its arid characteristics and no groundwater occurrence, availability of covering material and its remote location from the populated centers. Under this agreement the Galápagos National Park handed over an area of ten hectares to the Municipality of Santa Cruz for the purpose of final waste disposal.
This site was managed as an open dump in order to receive all of the waste generated on a daily basis. To perform basic upkeep of the dump, trenches were dug measuring three meters deep, thirty meters long, and four meters wide to serve as the final deposit site for the collected waste. In order to reduce its volume, the waste was burnt. When the trench was full, it was covered with soil excavated from the same site and a new ditch was dug right next to it. Over time, this method created a three ha platform at the dump site.
In 2008, the Municipality of Santa Cruz, in cooperation with WWF, decided to stop the burning of garbage and its open-air disposal, and to begin to take the necessary steps to create a sanitary landfill. That same year, WWF prepared the final designs and the environmental impact assessment for the Santa Cruz landfill.
By applying the methodology for determining the location of a sanitary landfill, it was decided that the best area on the island was an area in the northern part of Santa Cruz, located twenty-five to thirty-five km down the highway and shaped as a two kilometer-wide corridor along the route between Puerto Ayora and the Itabaca Channel.
Based on the current level of waste generation, the calculations estimate that the sanitary landfill will have a useful life of twenty years and will require an area of three hectares.
Since the dump is located within this identified corridor and offers a three hectare platform, it was decided to build the sanitary landfill on this site so as to avoid affecting any more of the protected area.
170 | CHAPTER 12 | Waste Management on Oceanic Islands: the Case of the Galápagos Islands

Integrated Solid Waste Management in Island Regions | 171
Table 26 Meteorological Characteristics of the Santa Cruz Island
Sanitary Landfill Construction Site
METEOROLOGICALCONDITIONS VALUES
Rainfall Annual average 475 mm
Temperature Annual average 25.64º C
Humidity Annual average 87.06%
Evaporation 97.20 mm
Source: INAMHI
1.6.1. Characteristics of the Santa Cruz Sanitary Landfill
a) Leachate collection, drainage, and leachate treatmentIn order to avoid underground contamination by the physical, chemical, and biological components contained in the leachate, the bottom of the sanitary landfill site was sealed with two layers of protection. The first consists of a twenty centimeter layer of clay; the second involves a one millimeter thick HDPE geomembrane. The use of a geomembrane as an additional protection measure is considered suitable and is recommended by the geological studies performed at the site. A ten centimeter layer of sand or gravel from the area is placed on top of the geomembrane.Drains are then installed on top of the sand layer in the platforms in order to capture the leachate. The drainage system includes main and secondary drainage components made of PVC tubes and a filter comprised of rocks and gravel. The filter is essential to maintain drain efficiency and to avoid any clogging of the ducts.A primary decantation system was included in the design for the treatment of the leachate. This system includes dual-chamber sedimentation and an upward-flow granular anaerobic filter. A phytodepuration bed (filter system with an artificial wetland) was used for the disposal of effluents in order to achieve an aerobic polishing effect that will reduce the organic load.
b) Conformation of daily cellsThe cell design takes into consideration an average waste generation over fifteen years of 21.38 tons/day and an expected density in the landfill of 800 kg/m3. This is an acceptable density for a sanitary landfill where there is a prior classification and recycling process and which does not require high levels of supervision for the compaction process. Based on these considerations, the expected daily volume is 26.73 m3.

The daily cells were designed on the basis of a standard cell intended to permit an easy unloading of the collection vehicles, which require an access of about two and a half meters in width. The height of the cell is one meter in order to permit easy distribution and compaction of the solid waste brought in on a daily basis, ensuring little settling. As a result, filling will advance about 10.70 meters in length per day.
Table 27 Characteristics of the Daily Cell
FILLCELL
Fill density Kg/m3 800.00
Daily fill volume m3 21.38
Width m 2.50
Height m 1.00
Length m 10.69
c) Chimneys for gas captureIn order to capture the gases generated in the landfill, the design provides for the construction of chimneys with burners that allow any gases generated to be burnt.
d) Rainwater drainage systemA series of ditches used to intercept rainwater around the landfill operation area prevents this water from entering the landfill site and adding to the volume of leachates.
e) EnclosureThe design includes a perimeter enclosure using wooden posts and five rows of galvanized barbed wire, next to which a live hedge was planted. There is also a wire mesh door for pedestrian and vehicle access.
f) Guard booth and warehouseThis will be used to control the access of people and vehicles. It also has facilities for the personnel, with a bathroom and warehouse for storing small tools.
g) Sewage treatment for the guard and control boothsThis facility consists of an internal sewage line for the management of sewage generated in the various units that discharge directly into the leachate treatment system. The approximate longitude of the network is about twenty meters. The pre-treatment consists of a septic tank and a biological filter, and discharge.
172 | CHAPTER 12 | Waste Management on Oceanic Islands: the Case of the Galápagos Islands

Integrated Solid Waste Management in Island Regions | 173
h) Costs
The collection cost per ton is US$36.68, and the cost for final disposal is US$8.37, equaling a monthly cost per household of US$5.05.
i) Equipment and machinery for the operation
For landfill operations, the project will purchase a mini skid-steer loader with a vibrating roller that compacts the waste and the covering layer to 800 kg/m3. In addition, the project requires a dump truck as support vehicle, temporary support equipment to prepare the covering material, and a backhoe on wheels.
The construction of the sanitary landfill began in November 2011 and was completed in December 2012. The start of its operation was scheduled for 2013
© W
WF
/ Max
imili
an M
artin

1.7. Awareness Campaign on Recycling Practices on Santa Cruz Island
From 2006 to 2012, WWF and Toyota have continuously broadened their scope of work and deepened their knowledge in the field of environmental management in Galápagos in order to mitigate the human impact on the islands. In order to battle the negative trends that have occurred over the last two decades, such as an exponential increased energy consumption and gradual contamination around the human settlements on the islands, WWF and Toyota identified one key element of the utmost importance to drive a profound change toward a sustainable future: improving human capacity to recycle and reduce waste, and to create a sustainable way of life on the islands. As a result, education and outreach became one of the priorities of WWF’s and Toyota’s mission in the Galápagos, as a complement to the efforts to implement an integrated solid waste management and recycling system in all the inhabited islands of the Archipelago.
Since 2006, WWF and Toyota have been cooperating with the Municipality of Santa Cruz to create and implement an ISWM and recycling system on the most populated island on Galápagos. With funding from Toyota, WWF is supporting Santa Cruz with ongoing technical assistance and state-of-the-art equipment. In addition, in cooperation with the Environmental Department of the municipality, WWF implemented a successful recycling outreach campaign to create a culture of best recycling practices and a responsible way of consumption among the local community.
An environmental education campaign began in February 2007 and focused on various target groups and key audiences. As part of the campaign, WWF carried out training visits to over 90% of the households on Santa Cruz Island. The campaign has also successfully targeted the commercial and tourist sectors, including most of the tourist boats, as well as all of the public institutions on Santa Cruz Island. Educational institutions received special attention because the youth are the key to achieving a sustainable future for the Galápagos Islands.
As part of the campaign, training sessions were held for students and teachers at primary and secondary schools in the island’s urban and rural areas. In addition, the students and teachers were taken on organized visits to the Fabricio Valverde Recycling Center to help them understand why separating waste and recycling are so important for a healthy Galápagos.
One of the main factors behind the success of this campaign has been its focus on the individual, as reflected in the main campaign slogan—“I recycle… Do you?”—which is conveyed to the community by distributing informative materials such as t-shirts, calendars, bracelets, and brochures at various events. The campaign has also been continuously promoted through radio and television ads and contests with high local participation. Another factor that has led the local community to participate in the campaign is its continuity and its duration over consecutive years, which has allowed the messages and the positive perception of recycling to become internalized in the collective
174 | CHAPTER 12 | Waste Management on Oceanic Islands: the Case of the Galápagos Islands

Integrated Solid Waste Management in Island Regions | 175
memory. The recycling practices campaign is a key element in the recycling system since it leads to increased waste sorting and more responsible consumption and hopefully, in the future, will minimize the generation of waste.
In 2012, about 50% of the overall waste generated on Santa Cruz Island was recycled. In the near future, in order to replicate this outstanding result, WWF and Toyota are gradually expanding the recycling outreach campaign to Floreana and Isabela Islands. WWF’s and Toyota’s mission is to ensure that, in the future, no waste will be left in the Galápagos.
The Waste Management and Recycling Project on Santa Cruz Island has received two important awards as a result of the joint work among WWF, Toyota, and the Municipality of Santa Cruz:
• In 2010, the project won the Energy Globe Award in the category of National Winner, competing with more than eight-hundred projects from one-hundred and five countries. The contest is sponsored by the United Nations Environment Program (UNEP) and is one of the most important and prestigious environmental awards in the world, with the objective of sharing successful sustainable projects with a broad audience in order to show that many of the environmental problems people face have good and feasible solutions already.
• In 2011, the project was awarded first place in the category Best Environmental Management Practices in the fourth edition of the Best Practices in Public Administration Award. The contest was organized by the Association of Ecuadorian Municipalities (AME), the United Nations Development Program (UNDP), the United States Agency for International Development (USAID), the German Agency for Technical Cooperation (GIZ), and the Spanish Agency for International Development Cooperation (AECID). The award recognizes that the waste management and recycling system on Santa Cruz Island is currently the best of its kind in Ecuador and sets an example of efficiency and quality for waste management on islands.
1.8. Lessons Learned on Santa Cruz Island• Assuring long-term conservation of the Galápagos Islands is only
possible through the involvement of the local population, creating the political will and commitment of the local decision-makers and stakeholders, and then educating and engaging the community.
• It is critical to build local knowledge, expertise, and capacity. This was achieved by providing permanent technical support and training to local technicians by temporarily integrating experts into local institutions to influence decision-making in favor of the environment at an institutional level and to ensure long-term project sustainability.
• Success is measured incrementally over a period of years.• There is a need for on-going community education, as the concept of
waste classification is very new and the population continues to grow.

1.8.1. SustainabilityThe goals and actions of this waste management program for islands are based on proven and commonly accepted principles and strategies of sustainable waste management. Using these, WWF aims to implement an integrated solid waste management and recycling system by the year 2020, which will improve the quality of life on all inhabited islands of Galápagos while living within the carrying capacity of the supporting insular ecosystems.
WWF’s concept of a sustainable waste management and recycling system in the Galápagos Islands is based on the strategies and principles discussed below:
• Waste minimization. Waste minimization is the process and the policy of reducing the amount of waste produced by a person or a society and is the basis for any sustainable waste management system. Waste minimization is aimed at reducing the generation of waste through education and improved consumption patterns. This approach is the most economical, environmentally-friendly and sustainable method of waste management but it also represents a tough challenge. It requires changes in local consumption patterns, paradigms, and behavior on the part of the population and decision-makers as well as political will and commitment. This can only be achieved through long-term educational campaigns and institutional strengthening, and can be combined with a culture of hygiene, public health, and quality of life.
• Reuse. Reuse can be defined as recovering value from a discarded item without completely reprocessing it. This typically means that an item is reused in its original (or similar) capacity or function, but can also include use for another purpose. For example, construction scraps can be reused as filling construction sites and crushed glass can be used as a substitute for sand in construction.
• Recycling and composting. If waste cannot be prevented or reused, it should be recycled or composted, as in the case of organic waste. A system to separate and recycle packaging waste has already been successfully implemented on Santa Cruz Island. This effort, however, must be intensified and expanded to include other items such as electrical and electronic waste. The final goal is to implement and operate one recycling and compost system for all of the inhabited islands in Galápagos.
• Recovering energy from waste is another way for of reuse. Currently, this approach is difficult to implement in the Galápagos, as the amounts of waste generated on the islands are not large enough to implement a cost-efficient plant by applying currently available technology. In Galápagos, however, the recovery of energy from waste is done on a small scale by collecting used oil from tourism boats and mechanics in Santa Cruz and San Cristobal Islands and using the energy from its incineration in the production of cement on the mainland.
176 | CHAPTER 12 | Waste Management on Oceanic Islands: the Case of the Galápagos Islands

Integrated Solid Waste Management in Island Regions | 177
• Disposal/landfilling. Final disposal or landfilling should be the last possible option in waste management and should be applied only for materials that have no practical use at all in a way that guarantees that the disposal site has no impact on the environment. The actual disposal sites in the Galápagos Islands do not fulfill the minimum standards for environmental protection and health safety. Improving these sites requires the development and enforcement of strict guidelines and norms for landfill management, and the creation of monitoring systems to guarantee environmentally-friendly management of these sites.
a) Technical sustainability
It is essential to build technical capacity and proficiency in local institutions in the operation and management of a modern waste management and recycling system by providing continuous technical assistance onsite. Several initiatives and projects have shown that the transferring of technology and concepts alone is not sufficient and must be combined with continuous training and technical assistance. The experience of WWF on Santa Cruz Island demonstrates that sustained technical assistance within the existing municipal structure can create lasting and transferable local knowledge. Working within existing structures allows for flexibility to adapt the implementation of modern waste management and recycling systems to local realities.
It also provides an opportunity for local authorities and the population to learn and recognize the benefits provided by the new initiative. These benefits do appear immediately with the project’s implementation but need time to arise and be recognized.
b) Financial sustainability
Creating financial sustainability of a waste management system in the Galápagos is challenging and probably will not be possible in the near- to mid-term. Commercializing recycled materials alone can contribute but is insufficient by itself. However, there are promising instruments for creating sufficient revenue to cover the operational costs of a waste management system and urge/stimulate consumers to make their habits more sustainable.
The polluter pays principle requires that waste producers assume the costs for waste processing and management. It also requires those who pollute the environment (e.g., by littering or fly-tipping) to be responsible for their actions.
The extended producer responsibility requires the producer or another entity along the value chain of a product to be responsible for the product’s end-of-life, including its packaging.

c) Social sustainability
Another critical component in ensuring the sustainability of proper waste management is the cooperation of the local population. A long-term environmental education campaign that focuses on the prevention principle as a fundamental notion will be expanded beyond recycling practices and reduction of waste as the main tool to achieve a new culture for sustainable waste management and recycling.
178 | CHAPTER 12 | Waste Management on Oceanic Islands: the Case of the Galápagos Islands
Integrated Solid Waste Management in Island Regions | 179Integrated Solid Waste Management in Island Regions | 179
Works Cited
Asociación de Municipalidades del Ecuador (AME). 2003. Plan Estratégico del Cantón Santa Cruz. Puerto Ayora. Diciembre de 2003. (Santa Cruz County Strategic Plan). Quito
Arevelo, Aída; Raymond Briceño. 1983. Manual de Instrucción, Ciclo Gerencia del Servicio de Aseo, Modulo Selección y diseño de unidades recolectoras de residuos sólidos compactadoras y no compactadoras. Programa Regional OPS / EHP / CEPIS de Mejoramiento de la Recolección, Transporte y Disposición Final de Residuos Sólidos.
Cantanhede, Alvaro; Leandro Sandoval. 1997. “Rellenos Sanitarios Manuales”. Guía para el diseño, construcción y operación de rellenos sanitarios manuales. Programa de Salud Ambiental. Serie Técnica No. 28 - Enero de 1997. Organización Panamericana de la Salud - Organización Mundial de la Salud
Cantano, Alis. Ministerio de Medioambiente del Reino Unido. 2003. El Convenio MARPOL 73/78: Un Estudio Detallado.
Carbonell Yonfá, Yolanda; Falconí G, Carlos. 2010. Fee calculations for the integrated waste management and recycling services of Santa Cruz, Galápagos province. Internal report WWF.
Collazos, Héctor. 2005. Diseño y operación de rellenos sanitarios. Escuela Colombiana de Ingeniería.
Comisión Nacional de Medio Ambiente de Chile (National Environmental Comission of Chile). 2005. Lineamientos Planes de Gestión de Residuos Peligrosos. Santiago de Chile.
Congreso General de los Estados Unidos Mexicanos (General Congress of the United Mexican States). 2003. Ley General para la prevención y gestión Integral de los residuos. México: Registro Oficial de la Federación.
--. 2007. Ley General para la Prevención y Gestión Integral de los Residuos. Última Reforma DOF 19-06-2007. Art. 5, fracción XXXII.
Corporación OIKOS. 2000. Manual de Reciclaje de Plásticos.
Decreto Supremo No. 3516 del 27 de diciembre de 2002. Presidencia de la República del Ecuador. 2002. Texto Unificado de Legislación Ambiental Secundaria. Quito: Registro Oficial, 2000.
De la Torre, Francisco. 2008. Characterization of Solid Waste in Santa Cruz, San Cristobal and Isabela, Galápagos. Internal report WWF.
Deutsche Gesellschaft für Technische Zusammenarbeit (GTZ) & Secretaría de Medio Ambiente y Recursos Naturales (SEMARNAT).

180 | Integrated Solid Waste Management in Island Regions
2006. Guía Para La Elaboración De Programas Municipales Para La Prevención Y Gestión Integral De Residuos Sólidos Urbanos. (Guidelines for the Preparation of Municipal Programs for the Prevention and Integrated Management of Urban Solid Waste) México. ISBN: 970-9983-01-6.
Fundación Charles Darwin (FCD), Parque Nacional Galapagos (PNG), & Instituto Nacional Galápagos (INGALA). 2007. INFORME GALÁPAGOS 2006-2007. (Galápagos Report 2006-2007). ISBN: 978-9978-53-028-3.
Fundación Natura, Fundación Carvajal, & U.S. Agency for International Development (USAID). 1998. Proyecto de Manejo Integral de Residuos Sólidos de las Islas Galápagos - Ecuador. (Project on Integrated Solid Waste Management in the Galápagos Islands) Quito.
International Maritime Organization (IMO). 1978. International Convention for the Prevention of Pollution from Ships (MARPOL).
Instituto Nacional de Estadística y Censos (INEC). 2008. Proyecciones.
Instituto Nacional Galápagos (INGALA), & Instituto Nacional de Estadística y Censos (INEC). 2006. Censo de Población y Vivienda del Archipiélago de Galápagos. (Population and household census of the Galápagos archipelago)
Jaramillo, Jorge. 2002. Guía para el diseño, construcción y operación de rellenos sanitarios manuales. (Guide for the Design, Construction and Operation of Manual Sanitary Landfills). OPS, OMS.
Lund, Herbert F. 1996. McGraw-Hill Recycling Manual.
Maine Compost School. 1992. On-Farm Composting Handbook.
Norma Oficial Mexicana NOM-083-SEMARNAT-2003. 2003. Especificaciones de protección ambiental para la selección del sitio, diseño, construcción, operación, monitoreo, clausura y obras complementarias de un sitio de disposición final de residuos sólidos urbanos y de manejo especial. (Environmental protection specification for site selection, design, construction, operation, monitoring, closing and complementary works of a final disposal site for urban solid waste and waste requiring special treatment).
Organización Panamericana de la Salud (OPS). 1999. Manual para la elaboración de compost. Bases conceptuales y procedimientos.
--. 2005. Informe Regional sobre la Evaluación de los Servicios de Manejo de Residuos Sólidos Municipales en la Región de América Latina y el Caribe. ISBN: 92 75 12577 5.
OPS and Organización Mundial de la Salud (OMS). 2005. Evaluación regional de los residuos sólidos en Latinoamérica y el Caribe.
Paraguassú de Sá, Fernando; & Carmen Rojas Rodríguez. 2002. Indicadores para el Gerenciamiento del Servicio de Limpieza Pública. II Curso para encargados de los servicios de aseo urbano del país. Subsecretaría de Saneamiento Ambiental del Ecuador. OPS – OMS. October. 1985.

Integrated Solid Waste Management in Island Regions | 181Integrated Solid Waste Management in Island Regions | 181
Pardavé Livia, Walter. 2007. Estrategias Ambientales de las 3R a las 10R. ECOE Ediciones.
Rimache Artica, Mijail. 2008. Abonos Orgánicos. Lombricultura. Perú.
Röben, Eva. 2002. Diseño, Construcción, Operación y Cierre de Rellenos Sanitarios Municipales. DED/ Ilustre Municipalidad de Loja. Loja, Ecuador.
Röben, Eva. 2002. El Reciclaje. Oportunidades Para Reducir la Generación de los Desechos Sólidos y Reintegrar Materiales Recuperables en el Círculo Económico. Municipio de Loja/DED.
Röben, Eva. 2002. Manual de compostaje para Municipios. DED. Municipio de Loja.
Robles Martínez, Fabián. 2008. Generación de biogás y lixiviados en los rellenos sanitarios. Instituto Politécnico Nacional. Segunda Edición. México.
Runfola, José; Antonio Gallardo. 2009. Análisis comparativo de los diferentes métodos de caracterización de residuos urbanos para su recolección selectiva en comunidades urbanas.
Rynk, Robert, Northeast Resource, Agriculture and Engineering Service (NRAES), & Maine Compost School. 1992. On-Farm Composting Handbook, Maine.
Sakurai, Dr. Kunitoshi. 2000. HDT 17: METODO SENCILLO DEL ANALISIS DE RESIDUOS SOLIDOS. CEPIS/OPS.
SANITEC Cía. Ltda. 1995. Diagnóstico del Servicio de Aseo de Santa Cruz.
Subsecretaría de Saneamiento Ambiental del Ecuador. 1985. II Curso para encargados de los servicios de aseo urbano del país. OPS – OMS.
Trejo Vázquez, Rodolfo. 1996. Procesamiento de la basura urbana. Editorial Trillas.
United States Environmental Protection Agency (EPA). 1974. Heuristic Routing for solid waste collection vehicles.
--. 1977. Procedures manual for ground water monitoring at solid waste disposal facilities.
--. 2014. Landfill Methane Outreach Program. Available at http://www.epa.gov/lmop/publications-tools/
University of Wisconsin-Madison. 2010. Leslie Cooperband. Biology of composting. Soil Sciences Department.
World Wildlife Fund (WWF) & Toyota. 2010. Waste Management Blueprint for the Galápagos Islands Puerto Ayora. Quito: AH, 2010. ISBN-978-9942-02-893-8.
WWF. 2010. Formulación de tasas para el servicio de gestión integral de residuos y reciclaje de Santa Cruz, provincia de Galápagos. Puerto Ayora.

182 | Integrated Solid Waste Management in Island Regions
List of Tables
Table 1. Optimal ISWM Characteristics 16Table 2. Size of the Pre-Sample 23Table 3. Sampling Activity Table 25Table 4. Time and Motion Form 50Table 5. Definition of Degree of Municipal Public Sanitation 60Table 6. Example of Dimensioning of Sweeping Services 63Table 7. Types of Waste Collection 70Table 8. Estimation of Loads and Collection System Design 82Table 9. Example of How to Estimate Service Costs 84Table 10. Estimation of a Landfill’s Area 96Table 11. Leachate Production Based on Rainfall and Types of Compaction 102Table 12. Analyses of Leachate 106Table 13. Types of Plastics 126Table 14. Quality Criteria for Recyclable Glass 127Table 15. Example of Urban Solid Waste Composition 131Table 16. Example of Materials to be Sorted 132Table 17. Sorting Yields per Type of Material 133Table 18. Example Calculation of Personnel Requirement 134Table 19. C/N Ratio of Certain Materials 144Table 20. Summary of Parameters for Aerobic and Thermophillic Composting 145Table 21. Population Projection for Santa Cruz Island 157Table 22. Estimation of the Number of Samples 157Table 23. PPC Values Obtained for Santa Cruz 158Table 24. PPC Values by Parish, Santa Cruz Island 158Table 25. PPC Tourism Sector 159Table 26. Meteorological Characteristics 171 of the Santa Cruz Island Sanitary Landfill Construction Site Table 27. Characteristics of the Daily Cell 172

Integrated Solid Waste Management in Island Regions | 183Integrated Solid Waste Management in Island Regions | 183
List of Figures
Figure 1. Waste Generators 12Figure 2. Integrated Municipal Solid Waste Management 13Figure 3. Integrated Solid Waste Management Prioritization 16Figure 4. Mass Balance 21Figure 5. Example of Location of Groups and Major Generators 22Figure 6. Example of Random Block Selection 24Figure 7. Quartering of Samples 26Figure 8. Selection of the Final Pile for the Sample 29Figure 9. Example of a Sampling Area 30Figure 10. Inefficient Routing Scheme 65Figure 11. Improved Route 66Figure 12. Example of Macro-Zoning 75Figure 13. Example of a Micro-Route with Four Blocks and Two-Way Streets 78Figure 14. Example of a Micro-Route with Three Blocks and Two-Way Streets 79Figure 15. Example of a Modified Micro-Route with Three blocks and Two-Way Streets 79Figure 16. Example of a Micro-Route for an Area that has 4 x 4 Blocks and Two-Way Streets 79Figure 17. Example of a Micro-Route for an Area that has 6 x 4 Blocks and Two-Way Streets 80Figure 18. Example of a Micro-Route for an Area that has 6 x 8 Blocks and Two-Way Streets 80Figure 19. Example of a Micro-Route for an Area that has Irregularly-shaped Blocks and Two-Way Streets 81Figure 20. Example of a Micro-Route for an Area that has Irregularly-shaped Blocks and Two-Way streets 81Figure 21. Types of Landfills 91Figure 22. Components of Landfills 94Figure 23. Some Patterns of Drainage Systems for Leachate 95Figure 24. Typical Cell 100Figure 25. Chimneys 105Figure 26. A Diagram of Landfill Operations 108Figure 27. Unloading of Garbage in the Daily Cell 110Figure 28. Description of How the Cell is Built 111Figure 29. Compaction of Waste of Cells 111Figure 30. Covering Layer of the Cell 112Figure 31. Compaction 113Figure 32. Construction of Chimneys 114Figure 33. Recycling Symbols by Type of Plastic 127Figure 34. Floor-Based Conveyor Belt for Sorting 130Figure 35. Elevated Conveyor Belt for Sorting 130Figure 36. Composting Phases 140Figure 37. Example of a Composting Facility Layout 142Figure 38. The Galápagos Islands 152Figure 39. Santa Cruz Island 155Figure 40. Sub-Poducts of the City of Puerto Ayora, Santa Cruz Island 159Figure 41. Drawing of Solid Waste Management on Santa Cruz 162Figure 42. Waste Collection Vehicle Routes until Final Disposal 163Figure 43. Micro-Route for Organic and Recyclable Waste Collection 163Figure 44. Waste Collection Route for Vessels in Academy Bay 164Figure 45. Map of Puerto Ayora Street Sweeping Routes 165Figure 46. Composition of Recycled Material in the PAFV. 2009 167Figure 47. Weights and Percentages of Recycled Material in the PAFV. 2010 167Figure 48. Percentage Growth of Recycled Material in the PAFV 168

184 | Integrated Solid Waste Management in Island Regions
Acronyms
AME Association of Ecuadorian Municipalities (acronym in Spanish)CDF Charles Darwin FoundationCDM Clean Development MechanismsCEPIS/PAHO Pan American Center for Sanitary Engineering and Environmental SciencesDED German Development Service (acronym in German)EPA US Environmental Protection AgencyGTZ German Agency for International CooperationIMO International Maritime OrganizationINEC Ecuadorian National Institute of Statistics and Census (acronym in Spanish)INGALA National Institute Galápagos (acronym in Spanish)ISWM Integrated Solid Waste ManagementMARPOL International Convention for the Prevention of Pollution from ShipsPAFV Fabricio Valverde Recycling Center (acronym in Spanish)PAHO Pan American Health OrganizationRAMSAR Convention on Wetlands of International Importance, especially as Waterfowl HabitatSEDUE Ministry of Urban Development and Ecology (acronym in Spanish)SEMARNAT Secretariat of Environment and Natural Resources of México (acronym in Spanish)SPI Society of the Plastics IndustryUNESCO United Nations Educational, Scientific and Cultural OrganizationUNEP United Nations Environment ProgramUNFCCC United Nations Framework Convention on Climate ChangeUSAID United States Agency for International DevelopmentUSW Urban solid wasteWHO World Health OrganizationWWF World Wildlife Fund

WWF’s mission is to stop the degradation of the planet’s natural environment and to build a future in which humans live in harmony with nature by:
• Conserving the world's biological diversity• Ensuring that the use of renewable natural resources is sustainable• Promoting the reduction of pollution and wasteful consumption.
World Wildlife Fund 1250 Twenty-Fourth St., NW
Calle Piqueros s/n y 18 de FebreroPuerto Ayora, Santa Cruz IslandGalápagos Islands, EcuadorTelefax: (593 5) 252-6053
WWF EcuadorWWF Programa RegionalAmazonas Norte & Chocó-Darién
Oficina Programa Galápagos
Washington, DC 20037, USA Website: www.worldwidlifefund.org Phone: 202-495-4800
ISBN
978
-994
2-92
4-02
-5