indian journal of science and technology, vol 9(16), doi
TRANSCRIPT
AbstractThe power output of photovoltaic (PV) cells is influenced by the environmental conditions, particularly by solar irradiation level. The irradiation level of light falling on all the cells in the module or the PV modules in an array is uneven under the cloudy weather conditions; this produces multiple peaks in the output of PV modules. It is essential to have a model of PV module in which the partial shading effect can be analyzed so that an effective Maximum Power Point Tracking (MPPT) system can be implemented for a PV system. This paper presents the modeling and performance analysis of PV modules under partial shaded conditions. A generalized PV module model is developed in MATLAB based on the mathematical equation of PV cell. The model is simulated for analysis of partially shaded cells in the PV module and also for partial shaded modules in the PV string for various weather conditions. The obtained results are satisfactory and confirm the accuracy of the developed PV module model. The developed model can be used for simulation and analysis of any PV modules under partially shaded conditions and also for development of PV power system with MPPT.
*Author for correspondence
Indian Journal of Science and Technology, Vol 9(16), DOI: 10.17485/ijst/2016/v9i16/92751, April 2016ISSN (Print) : 0974-6846
ISSN (Online) : 0974-5645
Modeling, Simulation and Analysis of Photovoltaic Modules under Partially Shaded Conditions
S. Sheik Mohammed1*, D. Devaraj2 and T. P. Imthias Ahamed3
1Kalasalingam University, Srivilliputhur - 626126, Tamil Nadu, India; [email protected] 2Department of EEE, Kalasalingam University, Srivilliputhur - 626126, Tamil Nadu, India; [email protected]
3Department of EEE, T. K. M. College of Engineering, Kollam - 691005, Kerala, India; [email protected]
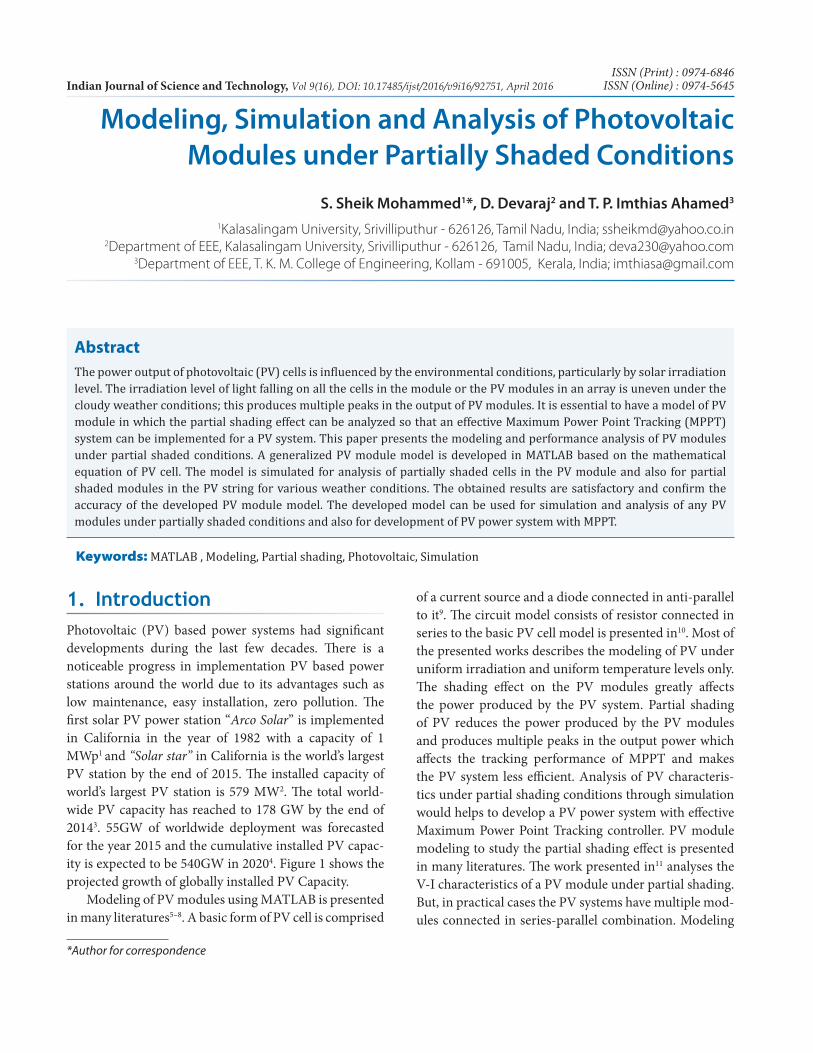
1. IntroductionPhotovoltaic (PV) based power systems had significant developments during the last few decades. There is a noticeable progress in implementation PV based power stations around the world due to its advantages such as low maintenance, easy installation, zero pollution. The first solar PV power station “Arco Solar” is implemented in California in the year of 1982 with a capacity of 1 MWp1 and “Solar star” in California is the world’s largest PV station by the end of 2015. The installed capacity of world’s largest PV station is 579 MW2. The total world-wide PV capacity has reached to 178 GW by the end of 20143. 55GW of worldwide deployment was forecasted for the year 2015 and the cumulative installed PV capac-ity is expected to be 540GW in 20204. Figure 1 shows the projected growth of globally installed PV Capacity.
Modeling of PV modules using MATLAB is presented in many literatures5–8. A basic form of PV cell is comprised
of a current source and a diode connected in anti-parallel to it9. The circuit model consists of resistor connected in series to the basic PV cell model is presented in10. Most of the presented works describes the modeling of PV under uniform irradiation and uniform temperature levels only. The shading effect on the PV modules greatly affects the power produced by the PV system. Partial shading of PV reduces the power produced by the PV modules and produces multiple peaks in the output power which affects the tracking performance of MPPT and makes the PV system less efficient. Analysis of PV characteris-tics under partial shading conditions through simulation would helps to develop a PV power system with effective Maximum Power Point Tracking controller. PV module modeling to study the partial shading effect is presented in many literatures. The work presented in11 analyses the V-I characteristics of a PV module under partial shading. But, in practical cases the PV systems have multiple mod-ules connected in series-parallel combination. Modeling
Keywords: MATLAB , Modeling, Partial shading, Photovoltaic, Simulation
Modeling, Simulation and Analysis of Photovoltaic Modules under Partially Shaded Conditions
Indian Journal of Science and TechnologyVol 9 (16) | April 2016 | www.indjst.org 2
of bypass diode configuration of PV module using Pspice is presented in12. Modeling and simulation of two diode model PV is presented in13,14. A two diode model with Bishop’s model is presented in13. In15, Solar cell model-ing using Simscape tool is presented. This paper presents the modeling of generalized PV module developed using MATLAB/Simulink which can be used to analyze the V-I and P-V characteristics of PV Module, PV string and PV array under uniform irradiation and partial shading con-ditions. The model presented in this paper can be used to analyze the characteristics of any commercial PV module.
This paper presents the modeling and simulation of PV module in detail. Section 2, discusses the fundamentals of PV cell, PV module, PV string and PV array. In Section 3, the PV module development using MATLAB based on the mathematical equation is explained in steps. Simulation of PV module and PV series string under uniform irra-diation and partial shading conditions are carried out, the results are presented and discussed in Section 4. The pre-sented work is concluded in Section 5.
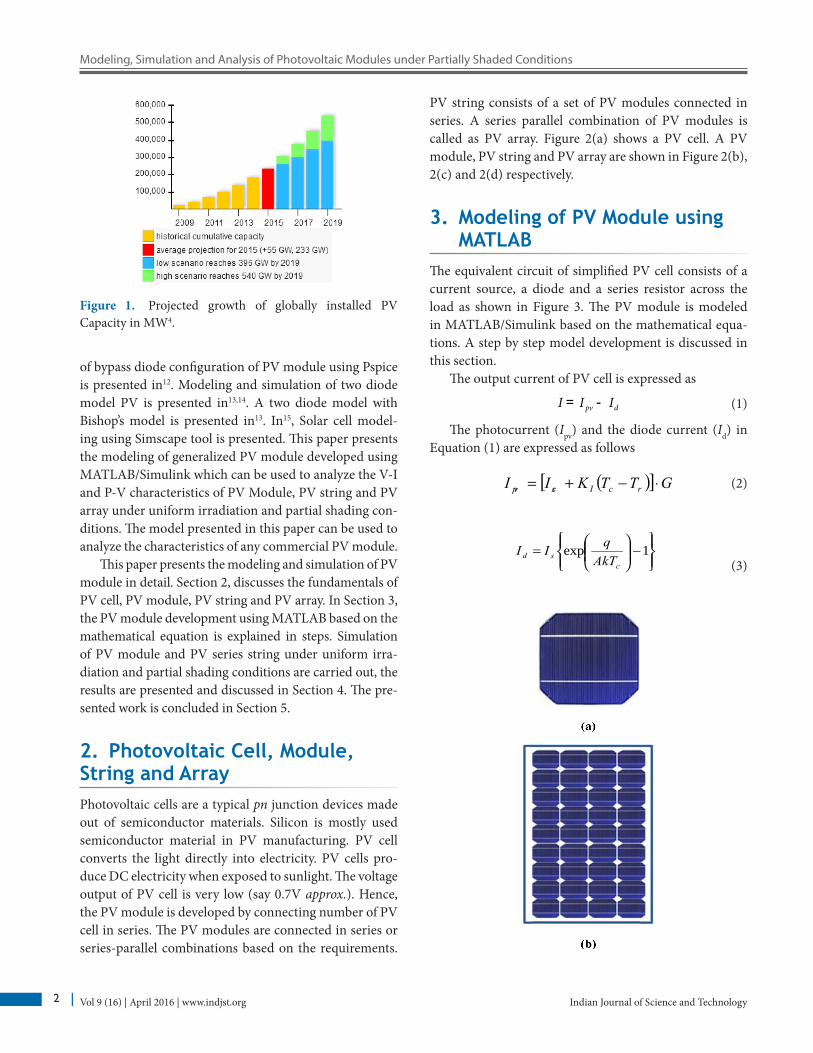
2. Photovoltaic Cell, Module, String and ArrayPhotovoltaic cells are a typical pn junction devices made out of semiconductor materials. Silicon is mostly used semiconductor material in PV manufacturing. PV cell converts the light directly into electricity. PV cells pro-duce DC electricity when exposed to sunlight. The voltage output of PV cell is very low (say 0.7V approx.). Hence, the PV module is developed by connecting number of PV cell in series. The PV modules are connected in series or series-parallel combinations based on the requirements.
Figure 1. Projected growth of globally installed PV Capacity in MW4.
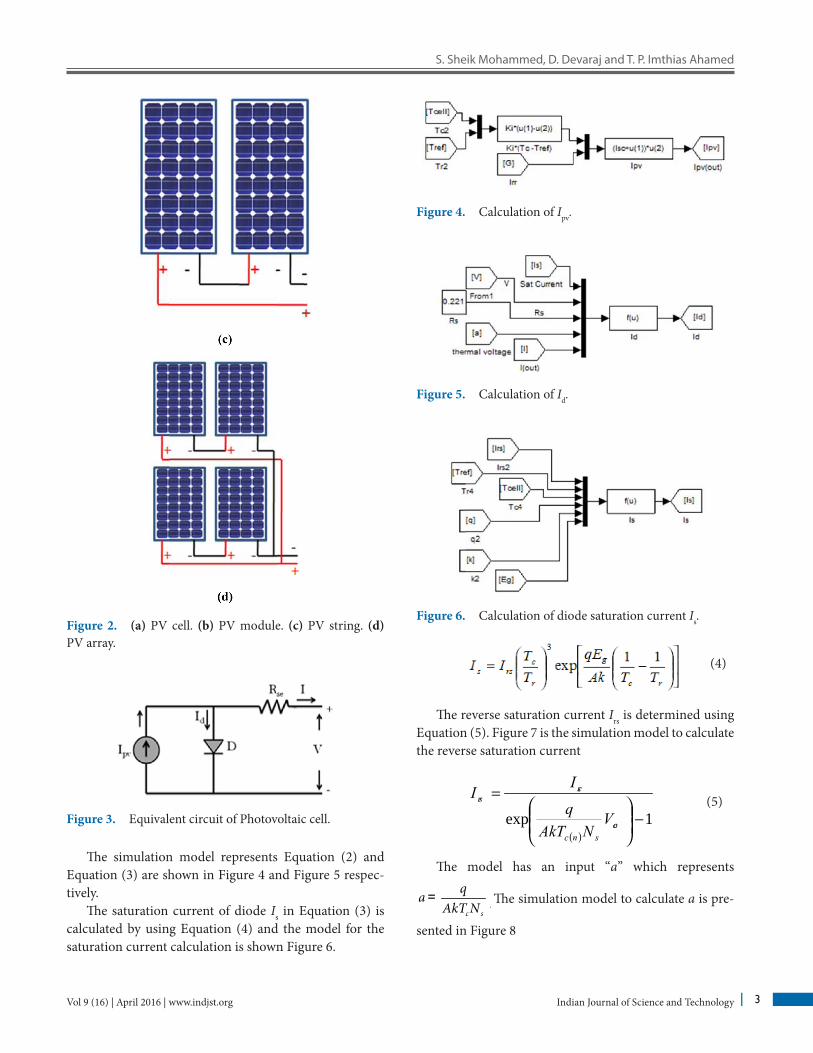
PV string consists of a set of PV modules connected in series. A series parallel combination of PV modules is called as PV array. Figure 2(a) shows a PV cell. A PV module, PV string and PV array are shown in Figure 2(b), 2(c) and 2(d) respectively.
3. Modeling of PV Module using MATLAB
The equivalent circuit of simplified PV cell consists of a current source, a diode and a series resistor across the load as shown in Figure 3. The PV module is modeled in MATLAB/Simulink based on the mathematical equa-tions. A step by step model development is discussed in this section.
The output current of PV cell is expressed as
pv dI I I= - (1)
The photocurrent (Ipv) and the diode current (Id) in Equation (1) are expressed as follows
( )[ ] GTTKII rcIscpv ⋅−+= (2)
−
= 1exp
csd AkT
qII
(3)
S. Sheik Mohammed, D. Devaraj and T. P. Imthias Ahamed
Indian Journal of Science and Technology 3Vol 9 (16) | April 2016 | www.indjst.org
The reverse saturation current Irs is determined using Equation (5). Figure 7 is the simulation model to calculate the reverse saturation current
Figure 2. (a) PV cell. (b) PV module. (c) PV string. (d) PV array.
Figure 3. Equivalent circuit of Photovoltaic cell.
The simulation model represents Equation (2) and Equation (3) are shown in Figure 4 and Figure 5 respec-tively.
The saturation current of diode Is in Equation (3) is calculated by using Equation (4) and the model for the saturation current calculation is shown Figure 6.
Figure 5. Calculation of Id.
Figure 4. Calculation of Ipv.
Figure 6. Calculation of diode saturation current Is.
( )1exp −
=
ocsnc
scrs
VNAkT
q
II
(4)
(5)
The model has an input “a” which represents
c s
qaAkT N
=. The simulation model to calculate a is pre-
sented in Figure 8
Modeling, Simulation and Analysis of Photovoltaic Modules under Partially Shaded Conditions
Indian Journal of Science and TechnologyVol 9 (16) | April 2016 | www.indjst.org 4
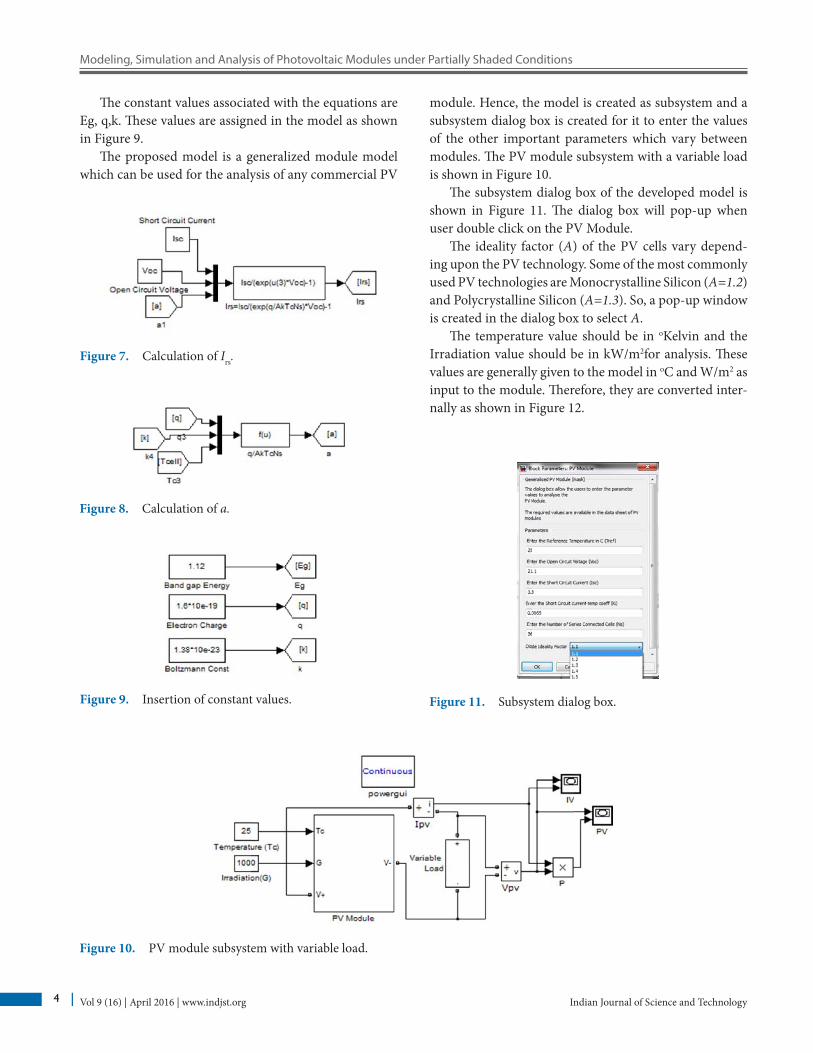
The constant values associated with the equations are Eg, q,k. These values are assigned in the model as shown in Figure 9.
The proposed model is a generalized module model which can be used for the analysis of any commercial PV
Figure 11. Subsystem dialog box.
Figure 10. PV module subsystem with variable load.
Figure 7. Calculation of Irs.
Figure 8. Calculation of a.
Figure 9. Insertion of constant values.
module. Hence, the model is created as subsystem and a subsystem dialog box is created for it to enter the values of the other important parameters which vary between modules. The PV module subsystem with a variable load is shown in Figure 10.
The subsystem dialog box of the developed model is shown in Figure 11. The dialog box will pop-up when user double click on the PV Module.
The ideality factor (A) of the PV cells vary depend-ing upon the PV technology. Some of the most commonly used PV technologies are Monocrystalline Silicon (A=1.2) and Polycrystalline Silicon (A=1.3). So, a pop-up window is created in the dialog box to select A.
The temperature value should be in oKelvin and the Irradiation value should be in kW/m2for analysis. These values are generally given to the model in oC and W/m2 as input to the module. Therefore, they are converted inter-nally as shown in Figure 12.

S. Sheik Mohammed, D. Devaraj and T. P. Imthias Ahamed
Indian Journal of Science and Technology 5Vol 9 (16) | April 2016 | www.indjst.org
The output current of PV expressed in Equation (1) is calculated by the model shown in Figure 13.
The current produced by the cell will be low or there will be no current when a cell in the module is shaded. This causes hotspot heating in a module and leads to damage of module. The hotspot effect can be evaded with the help of bypass diode. Figure 13 represents the connection of bypass diode across the output of PV cell. The variable load is connected across “V+” and “V-” shown in Figure 14.
4. Simulation and AnalysisThe PV module model is simulated for various weather conditions and the resulted are produced. Solarex MSX 60 PV16 Module is selected for this study. The module parameters are given in Table 1.
4.1 Voltage-Power Characteristics of MSX 60 PV Module
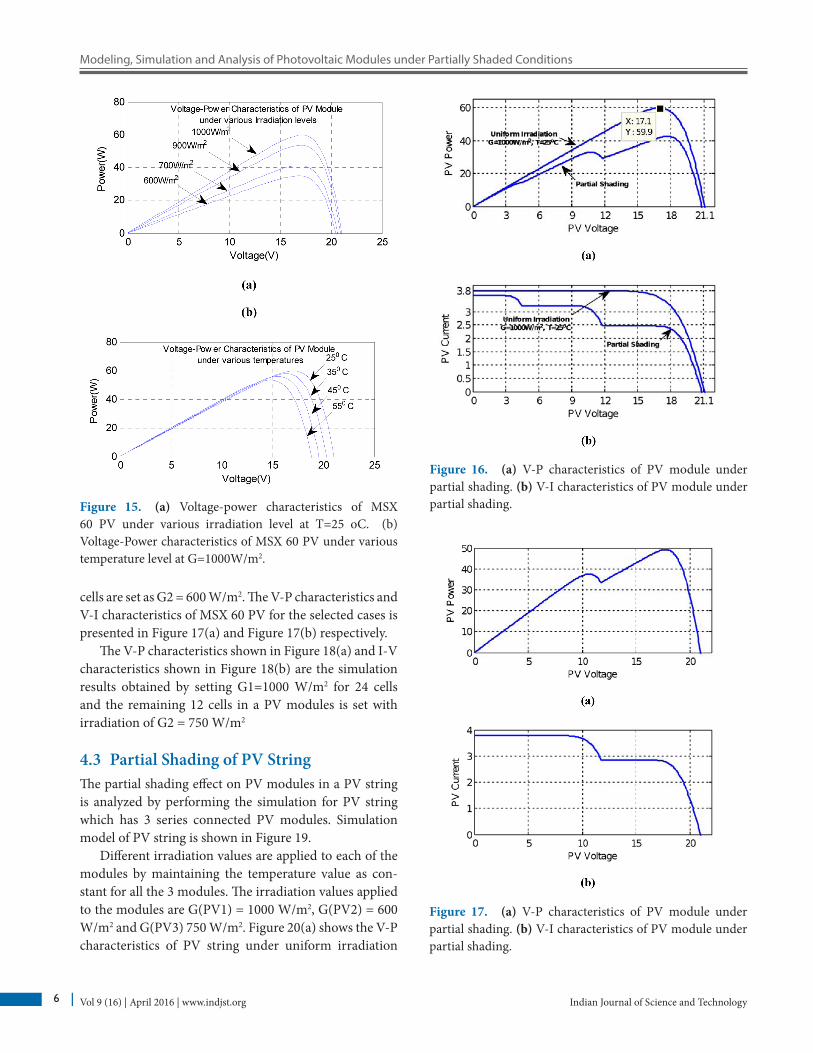
The output characteristics of MSX 60 PV module is validated for uniform irradiation. The Voltage-Power characteristics of MSX 60 PV under various irradia-tion level at T = 25 oC and various temperature level at G = 1000W/m2 are shown in Figure 15(a) and 15(b) respectively.
4.2 Partial Shading of PV ModuleMSX 60 PV module has 36 cells in it. To analyze shad-ing effect on a single PV module, the module is divided into 3 regions (12 cells) and different irradiation values are applied to each region.
The irradiation value is applied as G1 = 650 W/m2, G2 = 850 W/m2, and G3 = 950 W/m2. Figure 16(a) shows the V-P characteristics of PV module under partial shading of cells. The output characteristics of PV module under uniform irradiation for standard test conditions (T=250C and G=1000 W/m2) are also shown in Figure 16(a). It can be noticed that the output power of PV coincides with the data sheet information. Figure 16 (b) shows the V-I characteristics of PV module for the above said partial shading conditions and uniform irradiation.
The partial shading analysis is carried out for 50% shading of PV modules. In this case 18 out 36 cells are set with G1=1000 W/m2 and the irradiation of remaining 18
Figure 12. Unit conversion of T and G.
Figure 13. Output current calculation.
Figure 14. Bypass diode across the output of PV cell.
Table 1. Specification of solarex MSX60 PV
Description MSX 60Maximum Power (Pmax) 60WVoltage @ Pmax (Vmax) 17.1ACurrent at @ Pmax (Imax) 3.5AGuaranteed Minimum Pm 58WShort Circuit current (Isc) 3.8AOpen Circuit voltage (Voc) 21.1ATemperature co-eff of Voc -(80±10) mV/oCTemperature co-eff of Isc (0.065±0.15) %/oC
Modeling, Simulation and Analysis of Photovoltaic Modules under Partially Shaded Conditions
Indian Journal of Science and TechnologyVol 9 (16) | April 2016 | www.indjst.org 6
Figure 15. (a) Voltage-power characteristics of MSX 60 PV under various irradiation level at T=25 oC. (b) Voltage-Power characteristics of MSX 60 PV under various temperature level at G=1000W/m2.
Figure 16. (a) V-P characteristics of PV module under partial shading. (b) V-I characteristics of PV module under partial shading.
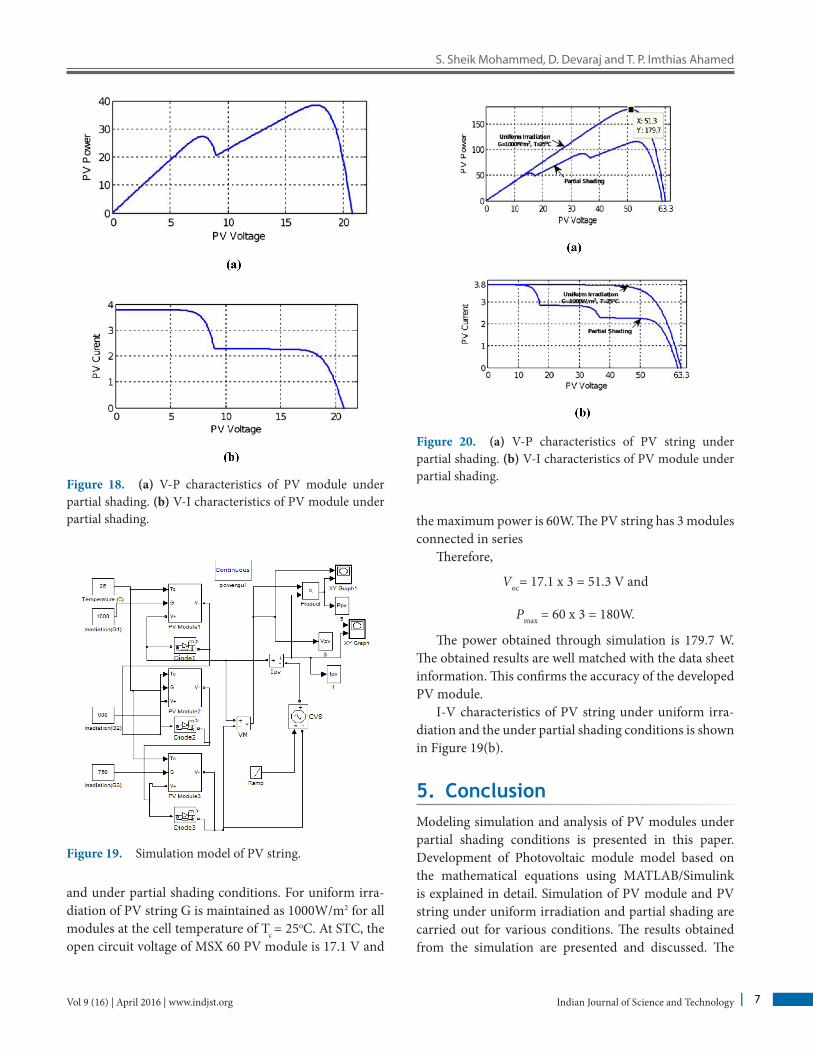
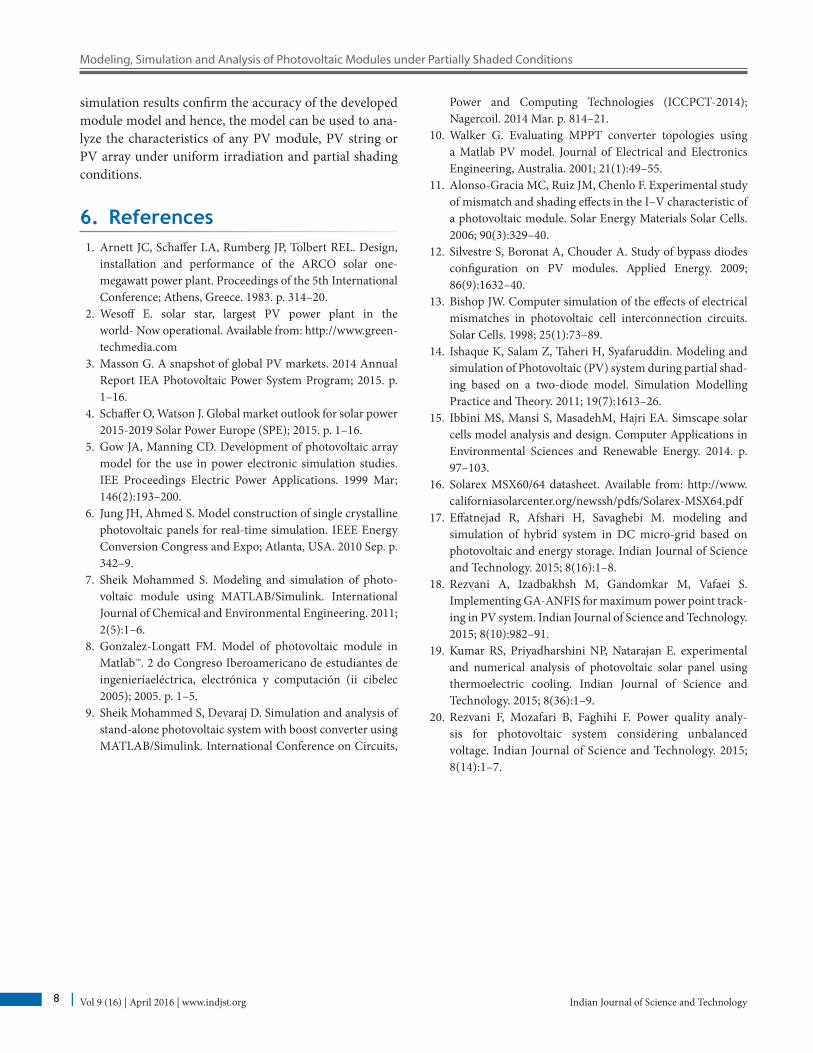
cells are set as G2 = 600 W/m2. The V-P characteristics and V-I characteristics of MSX 60 PV for the selected cases is presented in Figure 17(a) and Figure 17(b) respectively.
The V-P characteristics shown in Figure 18(a) and I-V characteristics shown in Figure 18(b) are the simulation results obtained by setting G1=1000 W/m2 for 24 cells and the remaining 12 cells in a PV modules is set with irradiation of G2 = 750 W/m2
4.3 Partial Shading of PV StringThe partial shading effect on PV modules in a PV string is analyzed by performing the simulation for PV string which has 3 series connected PV modules. Simulation model of PV string is shown in Figure 19.
Different irradiation values are applied to each of the modules by maintaining the temperature value as con-stant for all the 3 modules. The irradiation values applied to the modules are G(PV1) = 1000 W/m2, G(PV2) = 600 W/m2 and G(PV3) 750 W/m2. Figure 20(a) shows the V-P characteristics of PV string under uniform irradiation
Figure 17. (a) V-P characteristics of PV module under partial shading. (b) V-I characteristics of PV module under partial shading.
S. Sheik Mohammed, D. Devaraj and T. P. Imthias Ahamed
Indian Journal of Science and Technology 7Vol 9 (16) | April 2016 | www.indjst.org
the maximum power is 60W. The PV string has 3 modules connected in series
Therefore,
Voc= 17.1 x 3 = 51.3 V and
Pmax = 60 x 3 = 180W.
The power obtained through simulation is 179.7 W. The obtained results are well matched with the data sheet information. This confirms the accuracy of the developed PV module.
I-V characteristics of PV string under uniform irra-diation and the under partial shading conditions is shown in Figure 19(b).
5. ConclusionModeling simulation and analysis of PV modules under partial shading conditions is presented in this paper. Development of Photovoltaic module model based on the mathematical equations using MATLAB/Simulink is explained in detail. Simulation of PV module and PV string under uniform irradiation and partial shading are carried out for various conditions. The results obtained from the simulation are presented and discussed. The
Figure 18. (a) V-P characteristics of PV module under partial shading. (b) V-I characteristics of PV module under partial shading.
Figure 19. Simulation model of PV string.
Figure 20. (a) V-P characteristics of PV string under partial shading. (b) V-I characteristics of PV module under partial shading.
and under partial shading conditions. For uniform irra-diation of PV string G is maintained as 1000W/m2 for all modules at the cell temperature of Tc = 25oC. At STC, the open circuit voltage of MSX 60 PV module is 17.1 V and
Modeling, Simulation and Analysis of Photovoltaic Modules under Partially Shaded Conditions
Indian Journal of Science and TechnologyVol 9 (16) | April 2016 | www.indjst.org 8
simulation results confirm the accuracy of the developed module model and hence, the model can be used to ana-lyze the characteristics of any PV module, PV string or PV array under uniform irradiation and partial shading conditions.
6. References1. Arnett JC, Schaffer LA, Rumberg JP, Tolbert REL. Design,
installation and performance of the ARCO solar one-megawatt power plant. Proceedings of the 5th International Conference; Athens, Greece. 1983. p. 314–20.
2. Wesoff E. solar star, largest PV power plant in the world- Now operational. Available from: http://www.green-techmedia.com
3. Masson G. A snapshot of global PV markets. 2014 Annual Report IEA Photovoltaic Power System Program; 2015. p. 1–16.
4. Schaffer O, Watson J. Global market outlook for solar power 2015-2019 Solar Power Europe (SPE); 2015. p. 1–16.
5. Gow JA, Manning CD. Development of photovoltaic array model for the use in power electronic simulation studies. IEE Proceedings Electric Power Applications. 1999 Mar; 146(2):193–200.
6. Jung JH, Ahmed S. Model construction of single crystalline photovoltaic panels for real-time simulation. IEEE Energy Conversion Congress and Expo; Atlanta, USA. 2010 Sep. p. 342–9.
7. Sheik Mohammed S. Modeling and simulation of photo-voltaic module using MATLAB/Simulink. International Journal of Chemical and Environmental Engineering. 2011; 2(5):1–6.
8. Gonzalez-Longatt FM. Model of photovoltaic module in Matlab™. 2 do Congreso Iberoamericano de estudiantes de ingenieríaeléctrica, electrónica y computación (ii cibelec 2005); 2005. p. 1–5.
9. Sheik Mohammed S, Devaraj D. Simulation and analysis of stand-alone photovoltaic system with boost converter using MATLAB/Simulink. International Conference on Circuits,
Power and Computing Technologies (ICCPCT-2014); Nagercoil. 2014 Mar. p. 814–21.
10. Walker G. Evaluating MPPT converter topologies using a Matlab PV model. Journal of Electrical and Electronics Engineering, Australia. 2001; 21(1):49–55.
11. Alonso-Gracia MC, Ruiz JM, Chenlo F. Experimental study of mismatch and shading effects in the I–V characteristic of a photovoltaic module. Solar Energy Materials Solar Cells. 2006; 90(3):329–40.
12. Silvestre S, Boronat A, Chouder A. Study of bypass diodes configuration on PV modules. Applied Energy. 2009; 86(9):1632–40.
13. Bishop JW. Computer simulation of the effects of electrical mismatches in photovoltaic cell interconnection circuits. Solar Cells. 1998; 25(1):73–89.
14. Ishaque K, Salam Z, Taheri H, Syafaruddin. Modeling and simulation of Photovoltaic (PV) system during partial shad-ing based on a two-diode model. Simulation Modelling Practice and Theory. 2011; 19(7):1613–26.
15. Ibbini MS, Mansi S, MasadehM, Hajri EA. Simscape solar cells model analysis and design. Computer Applications in Environmental Sciences and Renewable Energy. 2014. p. 97–103.
16. Solarex MSX60/64 datasheet. Available from: http://www.californiasolarcenter.org/newssh/pdfs/Solarex-MSX64.pdf
17. Effatnejad R, Afshari H, Savaghebi M. modeling and simulation of hybrid system in DC micro-grid based on photovoltaic and energy storage. Indian Journal of Science and Technology. 2015; 8(16):1–8.
18. Rezvani A, Izadbakhsh M, Gandomkar M, Vafaei S. Implementing GA-ANFIS for maximum power point track-ing in PV system. Indian Journal of Science and Technology. 2015; 8(10):982–91.
19. Kumar RS, Priyadharshini NP, Natarajan E. experimental and numerical analysis of photovoltaic solar panel using thermoelectric cooling. Indian Journal of Science and Technology. 2015; 8(36):1–9.
20. Rezvani F, Mozafari B, Faghihi F. Power quality analy-sis for photovoltaic system considering unbalanced voltage. Indian Journal of Science and Technology. 2015; 8(14):1–7.