indian journal of science and technology, vol 8(28), doi
TRANSCRIPT
AbstractTo improve the traffic flow at the Moolakadai intersection along Grant Northern Trunk road of north Chennai, traffic surveyis conducted which include road inventory and volume count along the various arms towards the intersection. Volumeaccumulation curves are developed and peak volume and peak time is obtained. From the analysis it is found that thepeak volume is of 9556 passenger car equivalence during 18 to 19 hours at this intersection. Volume to capacity ratio isfound greater than one which makes high level of congestion and poor level of service. To manage this Transport SystemManagement concepts are suggested in various scenarios which may reduce the volume lesser than the capacity.
Intersection Improvement at Moolakadai alongGrand Northern Trunk Road in Chennai
V. Sampathkumar*, J. Vanjinathan and Pemmaraju Vaishnavi Rao
Department of Civil Engineering, Sathyabama University, Jeppiaar Nagar, Rajiv Gandhi Road, Chennai – 600119,Tamil Nadu, India; [email protected], [email protected], [email protected]
Keywords: Traffic Congestion, Travel Demand Management, Traffic Survey, Transport System Management, Volume Count
1. IntroductionThe network of roads is used by people as a means oftransport. The traffic is growing at rapid rate in urbanareas of India and this is due to urbanization. The manage-ment of traffic operations on the limited road network ofthe cities has become a big task1.India has the major roadsof more than 4.7 lakhs running km in 20142. The densityof road network in Tamil Nadu (TN) is higher than thenational average. TN has the road length of two lakhs kmout of which 14500km are National and State Highways3.Transport demand in most Indian cities has increasedsubstantially, due to increases in population as a resultof both natural increase and migration from rural areasand smaller towns. India’s urban population is growingat an average rate of around 3% per annum. It has almostdoubled during the period between 1981 and 2011 from160 million to 348 million4. The number and size of citieshas also increased considerably. Chennai is the capital cityof the State of TN located on the south eastern coast of thecountry and also the gateway of South East Asia, needs towrestle itself against the traffic congestion.
The economic base of the Chennai city is a mixedone with small-scale industries and commercial activities
distributed over the space of the city. Developments areobserved mainly along major transportation corridorslike Grand Southern Trunk Road, Grand Western TrunkRoad, Grand Northern Trunk Road (GNT Road), OldMahabalipuram Road and East Coast Road. The quanti-fication of present and future traffic load at Moolakadaiintersection on GNT road in Chennai is highlighted andit is based on the traffic survey carried out at that inter-section, which are expected to help in providing reliefto the existing and growing congestion problems at theintersection. The fundamental approach is to retain pos-sible existing pattern of streets but to alter the pattern oftraffic movement on these, so that the most efficient useis made of the system. Traffic Management is suggestedusing Transport System Management (TSM) concept.
Travel Demand Management (TDM) was appliedwhich includes land use transportation planning to mini-mize need for travel5. TDM was more effective strategy tosolve the problem of urban traffic. Aiming to ease trafficjam through implementing the strategies to guide and reg-ulate the traffic demand. Analysis of adaptability of TDMto urban traffic and methods of evaluation put forwardwould establish a complete comprehensive evaluationsystem6. Intersections of Beijing’s central urban area were
*Author for correspondence
Indian Journal of Science and Technology, Vol 8(28), DOI: 10.17485/ijst/2015/v8i28/82634, October 2015ISSN (Print) : 0974-6846
ISSN (Online) : 0974-5645
Intersection Improvement at Moolakadai along Grand Northern Trunk Road in Chennai
Indian Journal of Science and Technology2 Vol 8 (28) | October 2015 | www.indjst.org
focused. They studied the traffic facilities, motor vehicles volume, pedestrian volume, pedestrian traffic conflict, pedestrian traffic law violation rates. Based on extensive survey data appropriate measures to improve pedestrian safety is recommended. This includes improving pedes-trian traffic compliance rate, adding more crossing streets facilities for pedestrian7. A model was developed to cre-ate a traffic restriction zone and its effects on the network functional factors were investigated then the model was evaluated by simulation8. Traffic operation was improved and took advantage of the space resource, left-turn vehi-cles waiting area and straight vehicles waiting area were adopted separately at intersection such as link delay, queue length, link average speed and passing vehicles, the simula-tion results indicate that the improving effect of following control strategy was superior to the underutilizing con-trol strategy9. Traffic signal synchronization was a traffic engineering technique of matching the green light times for a series of intersections to enable the maximum num-ber of vehicles to pass through, thereby reducing delays. Synchronizing traffic signals ensured a better flow of traffic and minimizes fuel consumption and pollutant emissions. They provided a solution to the traffic signal problem via simulation10. The review of literature extracts the concept of TSM and TDM that are used in various countries.
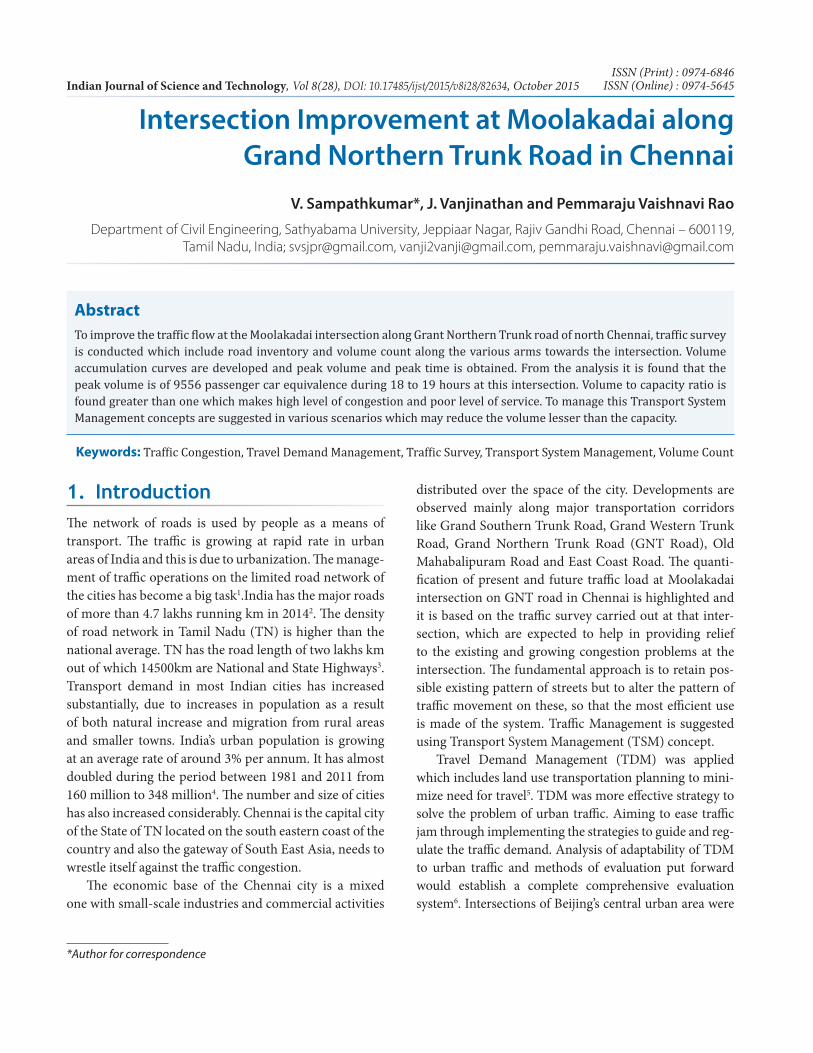
2. Study AreaIntersection is as an area where two or more roadways cross each other. This area is designated for the vehicles to turn to different directions to reach their destination. The study of intersections is very important for the traffic engineers especially in the case of urban scenario. GNT Road consists of three intersections. They are located at Basin Bridge, Vyasarpadi and Moolakadai. Moolakadai is the gateway of North Chennai. Moolakadai intersection is the place where GNT Road (Chennai-Kolkata Highway NH5) and Madhavaram high roads are intersecting. High traffic congestion is found due to large movement of heavy vehicles which has to pass through this intersection to reach Chennai core. Much of the commercial and residen-tial developments affected by this traffic problem occurred in the northern side of the Moolakadai intersection and it is shown in Figure 1. Madhavaram is one of the heavily populated locations at 13.15°N 80.2°E. It is the new con-stituency abutting the city, is an amalgamation of urban middle class and rural population spread across local bod-ies of various grades. The majority of the populations are
reliant on these industries. This area has a large population of casual labours working in non formal sectors. In the interest of the economy and trade and to decongest the Central Business District, CMDA has developed the truck terminal at Madhavaram over an extent about 100 acres which is close to Moolakadai. Presently the authority is building a flyover at this intersection for a length of 450m and 9m wide, with bitumen-topped service lane measur-ing 7.5m wide on both the sides. Hence the movement of heavy vehicles is large in the intersection. It causes heavy traffic at Moolakadai intersection. This intersection is man-ually controlled since the flyover work was started. Roads leading to off the GNT road are unpaved dirt tracks. On the GNT road even pedestrians finding it difficult to cross most of the time. Proposal of short term measures can help to make the flow of traffic smooth on the GNT Road. The congestion in the study area is shown in Figure 2.
3. Traffic SurveyRoad inventory survey and volume count are conducted at the intersection. The traffic volume data is manu-ally recorded in four locations of the intersection and the existing flow are shown in the Figure 3.The volume count is conducted between 8 to 20 hours. The width of the Madhavaram high road is 18 meters, Vyasarpadi and Redhills high road is 24 meters and it has unfinished foot-path of lesser than one meter wide. The road occupied by encroachers and unauthorized parking on both the sides all along the roads which bring down velocity of vehicle flow. Passenger Car Equivalency (PCE) conversion factor is used to bring various vehicles into a single unit as per Indian Road Congress (IRC-106-1990) specification. Conversion factor used for car, van and auto is 1.0, for truck and bus
Figure 1. Moolakadai intersection along GNT road.Figure 1. Moolakadai intersection along GNT road.

V. Sampathkumar, J. Vanjinathan and Pemmaraju Vaishnavi Rao
Indian Journal of Science and Technology 3Vol 8 (28) | October 2015 | www.indjst.org
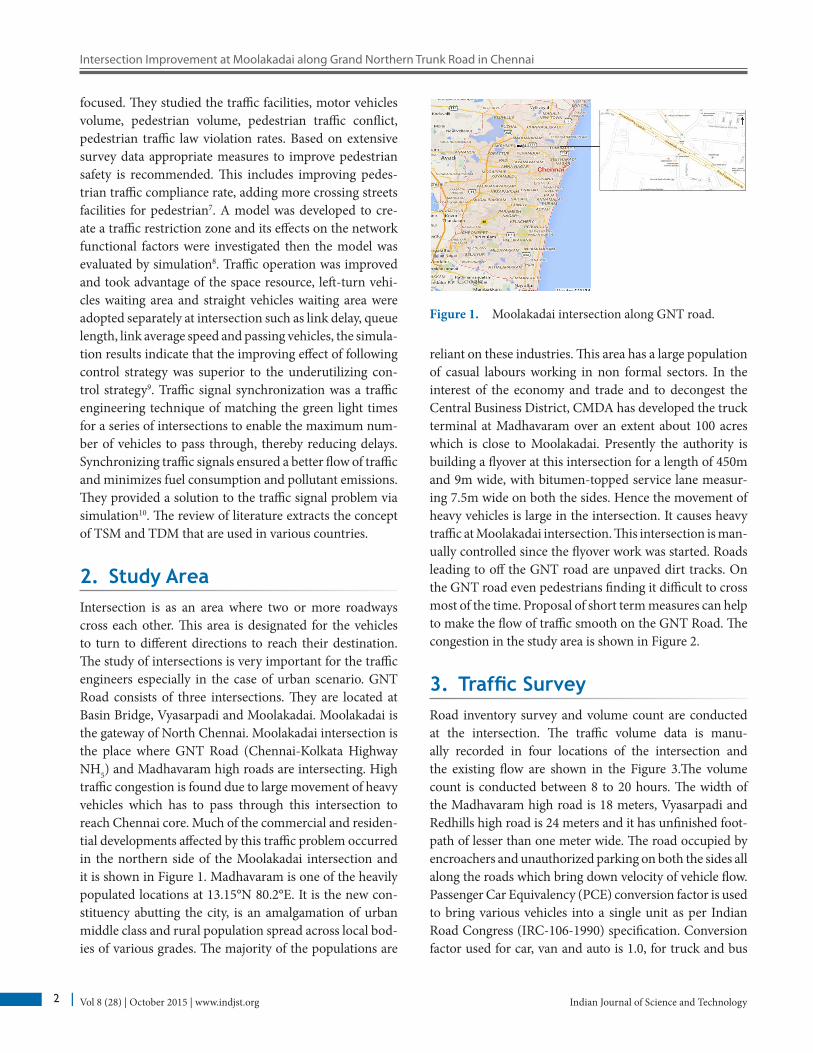
are 2.2 (less than 5% composition in the traffic stream) and for two wheeler it is 0.75 (more than 10% composition in the traffic stream). The volume accumulations are plot-ted as graphs and shown in Figure 4–7. From the graph morning peak is found as 2500 PCE on Redhills road (loca-tion 1), Vyasarpadi road (location 3) and 2200 PCE on Madhavaram road (location 2) Perambur road (location 4), between 9.30 to 10.30 hours and evening peak is found as 2986 PCE on Redhills road (location 1), 1753 PCE on Madhavaram road (location 2), 2844 PCE on Vyasarpadi road (location 3) and 1973 on Perambur road (location 4) between 18 to 19 hours. The peak volume at Moolakadai intersection is of 9556 PCE in the evening hours.
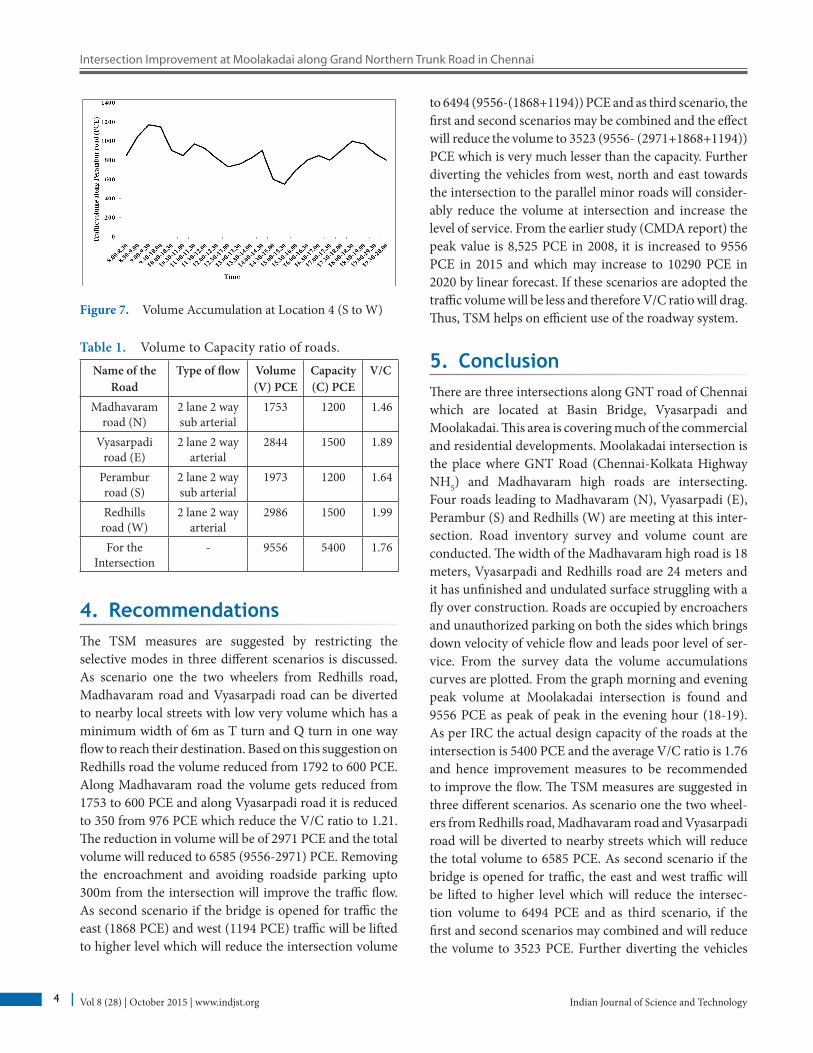
The traffic volume to capacity ratio is calculated to measures the congestion level. As per IRC: 106-1990 states that an intersection is severely congested if the V/C ratio is greater than 1.0. The design capacity of intersection is referred from IRC 86-1983.Volume-to-Capacity ratios of all roads are shown in the Table 1.The peak volume in one
Figure 2. Traffic condition at Moolakadai intersection.Figure 2. Traffic condition at Moolakadai intersection.
Figure 3. Existing traffic flow at Moolakadai intersection.Figure 3. Existing traffic flow at Moolakadai intersection.
Figure 4. Volume Accumulation at Location 1.Figure 4. Volume Accumulation at Location 1.
Figure 5. Volume Accumulation at Location 2 (N to E). Figure 5. Volume Accumulation at Location 2 (N to E).
Figure 6. Volume Accumulation at Location 3. Figure 6. Volume Accumulation at Location 3.
hour at the intersection is 9556 PCE but the actual design capacity of the roads at the intersection is 5400 PCE. The average of V/C ratio is 1.76 and therefore the congestion is severe at this intersection, hence improvement measures have to be recommended to improve the flow.
Intersection Improvement at Moolakadai along Grand Northern Trunk Road in Chennai
Indian Journal of Science and Technology4 Vol 8 (28) | October 2015 | www.indjst.org
4. RecommendationsThe TSM measures are suggested by restricting the selective modes in three different scenarios is discussed. As scenario one the two wheelers from Redhills road, Madhavaram road and Vyasarpadi road can be diverted to nearby local streets with low very volume which has a minimum width of 6m as T turn and Q turn in one way flow to reach their destination. Based on this suggestion on Redhills road the volume reduced from 1792 to 600 PCE. Along Madhavaram road the volume gets reduced from 1753 to 600 PCE and along Vyasarpadi road it is reduced to 350 from 976 PCE which reduce the V/C ratio to 1.21. The reduction in volume will be of 2971 PCE and the total volume will reduced to 6585 (9556-2971) PCE. Removing the encroachment and avoiding roadside parking upto 300m from the intersection will improve the traffic flow. As second scenario if the bridge is opened for traffic the east (1868 PCE) and west (1194 PCE) traffic will be lifted to higher level which will reduce the intersection volume
to 6494 (9556-(1868+1194)) PCE and as third scenario, the first and second scenarios may be combined and the effect will reduce the volume to 3523 (9556- (2971+1868+1194)) PCE which is very much lesser than the capacity. Further diverting the vehicles from west, north and east towards the intersection to the parallel minor roads will consider-ably reduce the volume at intersection and increase the level of service. From the earlier study (CMDA report) the peak value is 8,525 PCE in 2008, it is increased to 9556 PCE in 2015 and which may increase to 10290 PCE in 2020 by linear forecast. If these scenarios are adopted the traffic volume will be less and therefore V/C ratio will drag. Thus, TSM helps on efficient use of the roadway system.
5. ConclusionThere are three intersections along GNT road of Chennai which are located at Basin Bridge, Vyasarpadi and Moolakadai. This area is covering much of the commercial and residential developments. Moolakadai intersection is the place where GNT Road (Chennai-Kolkata Highway NH5) and Madhavaram high roads are intersecting. Four roads leading to Madhavaram (N), Vyasarpadi (E), Perambur (S) and Redhills (W) are meeting at this inter-section. Road inventory survey and volume count are conducted. The width of the Madhavaram high road is 18 meters, Vyasarpadi and Redhills road are 24 meters and it has unfinished and undulated surface struggling with a fly over construction. Roads are occupied by encroachers and unauthorized parking on both the sides which brings down velocity of vehicle flow and leads poor level of ser-vice. From the survey data the volume accumulations curves are plotted. From the graph morning and evening peak volume at Moolakadai intersection is found and 9556 PCE as peak of peak in the evening hour (18-19). As per IRC the actual design capacity of the roads at the intersection is 5400 PCE and the average V/C ratio is 1.76 and hence improvement measures to be recommended to improve the flow. The TSM measures are suggested in three different scenarios. As scenario one the two wheel-ers from Redhills road, Madhavaram road and Vyasarpadi road will be diverted to nearby streets which will reduce the total volume to 6585 PCE. As second scenario if the bridge is opened for traffic, the east and west traffic will be lifted to higher level which will reduce the intersec-tion volume to 6494 PCE and as third scenario, if the first and second scenarios may combined and will reduce the volume to 3523 PCE. Further diverting the vehicles
Table 1. Volume to Capacity ratio of roads.
Name of the Road
Type of flow Volume (V) PCE
Capacity (C) PCE
V/C
Madhavaram road (N)
2 lane 2 way sub arterial
1753 1200 1.46
Vyasarpadi road (E)
2 lane 2 way arterial
2844 1500 1.89
Perambur road (S)
2 lane 2 way sub arterial
1973 1200 1.64
Redhills road (W)
2 lane 2 way arterial
2986 1500 1.99
For the Intersection
- 9556 5400 1.76
Figure 7. Volume Accumulation at Location 4 (S to W)Figure 7. Volume Accumulation at Location 4 (S to W).

V. Sampathkumar, J. Vanjinathan and Pemmaraju Vaishnavi Rao
Indian Journal of Science and Technology 5Vol 8 (28) | October 2015 | www.indjst.org
from west, north and east towards the intersection to the parallel minor roads will considerably reduce the volume at intersection and increase the level of service. Thus, TSM will help in the efficient use of the roadway system.
6. References 1. Velmurugan S, Reddy TS, Prasad Rao I. Traffic operating
characteristics and its impacts on air pollution in an urban area – A case study of Chennai, India. Proceedings of the eastern asia society for transportation studies. 2005; 5:1799–814. Available from: http://www.easts. info/on-line/proceedings_05/1799.pdf
2. Wikipedia. The free encyclopaedia 2015. Indian road net-work; 2015. Available from: http://en.wikipedia.org/wiki/Indian_road_network
3. Sampathkumar V, Siva Shankar S, Vishaka Murthy P. Intersection improvement at sholinganallur in Rajiv Gandhi Road. Indian Journal of Applied Research. 2014; 4(5):2249–555X. Available from: http://www.theglobaljournals.com/ijar/file.php?val=May_2014_1398965044_e9548_63.pdf
4. Sudarsanam, Singh SK. Urbanization and Urban Transport in India. The Sketch for a Policy. 2002; 27:26–44. Available
from: http://www.seas.harvard.edu/TransportAsia/work-shop_papers/Padam-Singh.pdf
5. Menon GP. Travel Demand management in Singapore; 2002. Available from: http://ascelibrary.org/doi/abs/10.1061/41184%28419%2988
6. Phillips S. Strengthening road transport research coopera-tion between Europe and emerging international market; 2006. Available from: http://www.transport-research.info/Upload/Documents/201203/20120320_103 300_47581_D2.1%20National%20RandD%20Policies.pdf
7. Wang S, Yang J. The Study in Diamond Interchange Traffic Organization. 2013; 96:591–98. Available from: www.sci-encedirect.com
8. Naseri A, Mousavi MR. The model of arranging trip demand to the central areas of the cities by creating traf-fic restricted zone. 2012; 2(2):153–7. Available from: http://www. etlibrary. Org/? m=fbookanda =detailsandaid=9729
9. Sun W, Gong J. Traffic impact analysis of urban intersections with comprehensive waiting area on urban intersection based on paramics; 2013. Available from: www.sciencedi-rect.com
10. Adacher L, Gemma A. Decentralized spatial decomposi-tion for traffic signal synchronization; 2014. Available from: www.sciencedirect.com