doi - 10.22270/jmpas.v8i4.820 journal of medical
TRANSCRIPT

DOI - 10.22270/jmpas.v8i4.820
Journal of Medical Pharmaceutical www.jmpas.com
And Allied Sciences ISSN 2320-7418
Journal of Medical Pharmaceutical and Allied Sciences, V 8-I 4, 820. JULY 2019, 2276-2299
2276
RESEARCH STUDY
A PROSPECTIVE STUDY ON DRUG UTILIZATION
AND COST EFFECTIVENESS OF TREATMENTS IN
DIABETES MELLITUS PATIENTS (INPATIENTS
SETTING) IN TEACHING HOSPITAL OF MMIMSR
Dr. Avinash Teli*, Dr. Pawan Kumar, Dr. Akshi Denod,
Dr. Md.Wasiullah
Maharishi Markandeshwar institute of Medical sciences and Research
center, Mullana, Ambala, Haryana, India
Correspondence
Dr. Avinash Teli
Department of Clinical Pharmacology,
Maharishi Markandeshwar institute of
Medical sciences and Research center,
Mullana, Ambala, Haryana, India
Keywords
Antidiabetic, Diabetes Mellitus,
Hypoglycemia, Utilization, Cost-
Effectiveness
Received
02/06/2019
Reviewed
08/06/2019
Revised/ Accepted
15/06/2019
ABSTRACT
To study current treatment practice given by a group of physician according to demographic
details and the patient’s knowledge of correct/safe administration of the anti-diabetic drugs was
determined under the consideration of percentage cost variation of the treatment. A Prospective
observational study. A data Collection form was used to collect data of the patients’
demographic details like sex, duration of diabetes, age, Co morbidity, prescribing pattern for
anti-diabetic drugs and other drugs. The demographic characteristic of the study sample of
(N=55) diabetic patients indicated that the male population were found to be predominantly
having diabetes (52.7%) (n=29). When compared to female population which is only (47.3%)
(n=26. Study revealed that out of (n=55) patients, (n=37) patients were on Mono therapy (67.3%)
followed by (n=11) patients were on double therapy (20%), (n=4) patients were on triple therapy
(7.3%). The focus of this study was to evaluate physician prescribing pattern and patient
utilization patterns associated with pharmacological management of diabetic patients with the
help of studying prescriptions and interviewing the patients. This study was carried out with the
objectives of computing the costs and percentage price variation among oral hypoglycemic
agents across the different brands available in the Indian market. It is observed from our results
that there is a wide (up to 836.20%) variation in prices of drugs manufactured by different
pharmaceuticals.

Internationally powered by www.jmpas.com DOI - 10.22270/jmpas.v8i4.820
2277 Journal of Medical Pharmaceutical and Allied Sciences, V 8-I 4, 820. JULY 2019, 2276-2299
INTRODUCTION
The development of drug utilization
research was sparked by initiatives taken in
Northern Europe and the United Kingdom in
the mid- 1960[1]. The pioneers of this
research understood that a correct
interpretation of data on drug utilization
requires investigations at the patient level.
Diabetes mellitus (madhumeha) has been
known since ages and the sweetness of
diabetic urine has been mentioned in
Ayurveda by Sushruta. Since DM is
metabolic disorder characterized by
hyperglycemia, glycosuria, hyperlipemia,
negative nitrogen balance and sometimes
ketonemia
MAJOR RISK FACTORS IN TYPE 2 DM:
1. Age > 45 years,
2. Race/ethnicity (as south Asian, Asian
American, Hispanics etc.),
3. Obesity (i.e., >20 % of one’s desired body
weight),
4. Family history of DM (i.e., parents or
siblings with DM),
5. Sedentary life styles,
6. H/o GDM or delivery of baby weighing >
4.5kg,
7. Polycystic ovarian syndrome.
PHARMACOLOGICAL TREATMENT:
The treatment of patients with type 1 DM
(approximately 10 % of all patients with
DM) is exogenous insulin to achieve
glycemic control, reduce the risk of diabetic
ketoacidosis (DKA), and sustain life. The
Diabetes Control and Complications Trial
(DCCT) has shown that tight control of
fasting blood glucose levels (i.e., 100–120
mg/dl) in type 1 DM clearly decreases the
incidence of micro- and macro vascular
complications. Unfortunately, tight control
(FPG < 120 mg/dl) also increases the
frequency of hypoglycemic episodes in type
1 DM.
Following oral Antidiabetic agents are used
for the treatment of patients with type 2 DM.
INSULIN THERAPY:
Patients with type I diabetes mellitus depend
on external insulin (most commonly injected
subcutaneously) for their survival because
the hormone is no longer produced
internally. Patients with type II diabetes
mellitus are insulin resistant, have relatively
low insulin production, or both; certain
patients with Type II diabetes may
eventually require insulin if other
medications fail to control blood glucose
levels adequately.

Internationally powered by www.jmpas.com DOI - 10.22270/jmpas.v8i4.820
2278 Journal of Medical Pharmaceutical and Allied Sciences, V 8-I 4, 820. JULY 2019, 2276-2299
➢ Rapid-acting insulin, which starts
working within a few minutes and lasts
for a couple of hours.
➢ Regular- or short-acting insulin, which
takes about 30 minutes to work and lasts
for 3 to 6 hours.
➢ Intermediate-acting insulin, which takes
2 to 4 hours to work and its effects can
last for up to 18 hours.
➢ Long-acting insulin, which takes 6 to 10
hours to reach the blood stream, but it
can keep working for an entire day.
Insulin for diabetes can be injected under the
skin (subcutaneously) or into the vein
(intravenously) [2].
a. Stimulators of insulin release by β cells, e.
g., sulfonylureas, meglitinides.
b. Inhibitors of hepatic gluconeogenesis e.g.,
biguanides.
c. Inhibitors of intestinal α glucosidases e.g.
acarbose and meglitol and
d. Drugs which reduces insulin resistance e.
g. gltitazones [3].
Further these patients are treated with
insulin injection as and when indicated. Diet
and exercise also play an important role in
the treatment of DM. Very mild cases of
type 2 DM may be controlled with diet and
exercise only.
Medicines are part of our everyday lives.
But how many drugs do people take and
what sort, how much do they cost, and who
influences the way they are prescribed and
the way they are actually taken? The
surprising answer is that we still do not
know as much as we should. Further a
serious problem confronting the medical
profession today is the lack of updating their
knowledge about existing and new drugs
and their effects on patients and there is a
need of initiative step in this direction.
Various prescription errors are result of in
effective use of these inputs and are very
common in clinical practice.
However the continuous monitoring of
prescription and drug utilization studies may
help to identify the problems involved in
therapeutic decision and promotes the
rational prescribing. Hence the assessment
of the drug utilization is important for
clinical, educational and Pharmaco-
economic purposes. Monitoring of
prescription and study of drug utilization
could identify the associated problems and
provide feedback to the prescriber so as to
create awareness for the rational use of
drugs.
A survey depicts that 4 % of adults in India
suffer from DM in the year 2000 and it is
expected to increase to 6 % by the year

Internationally powered by www.jmpas.com DOI - 10.22270/jmpas.v8i4.820
2279 Journal of Medical Pharmaceutical and Allied Sciences, V 8-I 4, 820. JULY 2019, 2276-2299
2025. With a reported burden of 32 -35
million diabetics in India, a methodical drug
utilization study is necessary. Hence work of
this type provides a powerful exploratory
tool to documents the role of drugs in
society and thereby to create a sound socio-
medical and health economic basis for
regulatory and other policy decision. So the
primary purpose of Drug Utilization Review
is to evaluate drug prescription on the basis
of what we know about drug.
RESEARCH METHODOLOGY
Study design:
The present study is a prospective
observational study which was attempted to
find out the frequently prescribed drugs by
the physician in diabetic patient.
Place of study:
Maharishi Markandeshwar Institute of
Medical Science and Research hospital
(MMIMSR)
MMIMSR is a multi-specialty teaching
hospital Mullana, (Ambala). It is an 850-
bedded hospital.
Study population:
In the present study, all type of patients from
both genders aging from 1 to 70 years with
type 1 and type 2 diabetes (with or without
co-morbid condition) were studied.
Study period:
Study period was 6 months (Commencing
from September 2015 to March 2016).
Sample size:
In the present Study, Sample size was
(N=50) of DM TYPE 1 & DM TYPE 2
inpatients respectively, that were observed
in the hospital.
Inclusion criteria:
The patients should be:
➢ Proven diabetic.
➢ Patients of both gender
➢ Patients who were admitted to the
MMIMSR Hospital.
Exclusion criteria:
Patients with the following were excluded
from the study:
➢ All psychiatrically ill patients or unable
to communicate verbally.
➢ Gestational diabetic patients.
➢ Patients having DM Type1 and DM
Type2 More than 5 years.
➢ Patients not ready to give informed
consent.
RESULTS
The demographic characteristic of the study
sample of (N=55) diabetic patients indicated
that the male population were found to be
predominantly having diabetes (52.7%)
(n=29). When compared to female
population which is only (47.3%) (n=26).

Internationally powered by www.jmpas.com DOI - 10.22270/jmpas.v8i4.820
2280 Journal of Medical Pharmaceutical and Allied Sciences, V 8-I 4, 820. JULY 2019, 2276-2299
Out of this Type1 DM and Type2 DM
patients found 89.1% (n=89) and 11% (n=6)
respectively .The result showed that more
number of patients were between 40 –60
years, followed by number of patients under
69.1% (n=38). The most predominant age
group was found to be 51-60 yrs. (20%)
(n=11). The duration of diabetes were found
to be 4-5yrs (n=16) 29.1%.
➢ On the basis of data collection in
prospective study following result were
made family history is considered as one
of the genetic factors in development of
DM. Data collected regarding presence
of family history of DM revealed that
61.8% (n=34) of the patients had
positive family history.
➢ The result showed that smoking habit
and alcohol habit 34.5% (n=19) and
36.8% (n=20) respectively.
➢ We found that the majority of patients
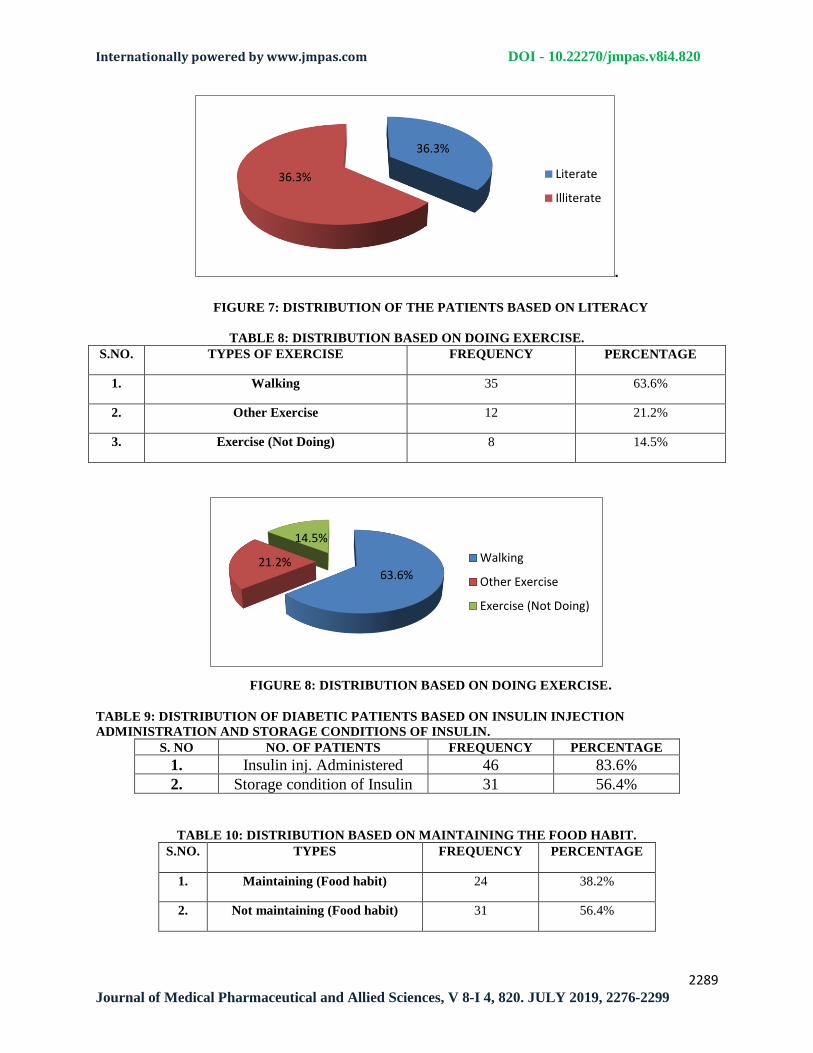
who were illiterate or literate 36.3%
(n=20) and 63.6% (n=35).
➢ The findings show that out of 55 patients
63.6 % (n=35) had sufficient knowledge
on importance of doing exercises while
14.5% (n=8) did not have sufficient
knowledge on the importance of doing
exercises for diabetic patients.
➢ The result showed that 38.2% (n=24)
maintain their food habit and 56.4%
(n=31) not maintain food habit. The
awareness about site of insulin injection
administration and storage conditions of
insulin were also assessed and results
reveals 83.6% (n=46) knew about
insulin injection site and 56.4% (n=31)
knew about storage conditions.
➢ This study showed that 9.1% (n=5) of
diabetic patients had good individual
knowledge of their anti- diabetic
medication. It was also observed that
63.6% (n=35) and 27.3% (n=15) of the
participants had average and poor
individual knowledge respectively.
As for diabetic related approximately 45.2%
and 18.2% of patients knew none of the
early and late complications of diabetes.
One of the early complications of diabetes is
hyperglycemia and 94.5 % (n=52) of
patients knew about it. 89.1% (n=49)
patients does not know cardiovascular
complications as a late complication. The
co-morbidities were found to be
hypertension, COPD, neuropathy, UTI,
asthma, ALD, CKD, hepatitis, tuberculosis,
arthritis, anemia, neuropathy, retinopathy,
and CAD 40%, 7.3%, 14.5%, 7.3%, 1.8%,
7.3%, 16.4%, 3.6%, 7.3%, 5.4%, 3.6%,
7.3%, 1.8%, and 3.6% respectively. (n=50).

Internationally powered by www.jmpas.com DOI - 10.22270/jmpas.v8i4.820
2281 Journal of Medical Pharmaceutical and Allied Sciences, V 8-I 4, 820. JULY 2019, 2276-2299
The most prescribed drug was insulin alone
or in combination with metformin and
insulin with metformin with glimepiride
65.4% (n=36) and 13.4% (n=9) respectively.
Study revealed that out of (n=55) patients,
(n=37) patients were on Mono therapy
(67.3%) followed by (n=11) patients were
on double therapy (20%), (n=4) patients
were on triple therapy (7.3%).
Single drug therapy
In single drug therapy, Table shows the
price variation between sulfonylurea groups
of drugs. In this group, Glimepiride (2 mg)
shows maximum price variation of 836.2%,
while Glipizide (10mg) shows variation of
38.88%.The price variation in Biguanides
(Metformin) & Thiazolidinedione’s
(Pioglitazones) groups of drugs. In these
groups, Metformin (500 mg) & Pioglitazone
(15 mg) show maximum price variation of
308.33% & 542% respectively and price
variation between α- glucosidases inhibitor
group of drugs. In this group, Miglitol
shows maximum price variation of 135.50
%. Table 32 shows the price variation
between Meglitinides group of drugs. In this
group, Rapaglinide (0.5 mg) shows
maximum price variation of 90.95 %.
Combination therapy
In Combination therapy, total seven
combination therapies were analyzed. Out of
which Glipizide & Metformin combination
shows the maximum variation up to 399.04
%.
Relationship between %age price
variation & no. of manufacturing
companies
When we draw a graph showing relationship
between manufacturing companies and %
price variation, it was noted that there is a
linear relationship in between these two
variables. As the no. of manufacturing
companies increases, the percent price
variation also increases.
DISSCUSSION AND CONCLUSION
A Drug utilization study is considered to be
one of the most effective methods to assess
and evaluate the prescribing attitude of
physician and help to promote rational use
of drugs. The prescription ratio of Insulin
injection and oral hypoglycemic agents was
rational. The findings of the study suggest
the need to increase the awareness of
generic prescribing and prescribe from
National list of Essential Medicines
(NLEM).
This study showed that slightly half 67.3%
(n=37) of diabetic patients had good
individual knowledge of their anti- diabetic
medication. It was also observed that 50.9%

Internationally powered by www.jmpas.com DOI - 10.22270/jmpas.v8i4.820
2282 Journal of Medical Pharmaceutical and Allied Sciences, V 8-I 4, 820. JULY 2019, 2276-2299
(n=28) and 27.3% (n=15) of the participants
had average and poor individual knowledge
respectively (Table 3). Patients’ knowledge
of anti-diabetic medication in this study
comprised of five components that is being
able to provide the drug name, drug
administration and purpose of medication,
storage of medication and dose of prescribed
medication. Metformin and sulphonyl ureas
have same glycemic control and lipid profile
but metformin has an improved BMI when
compared to them.
We found that 83.6% (n=46) out of the 55
sampled diabetic patient’s did not store their
anti-diabetic medication correctly, while in a
study done in India (Ramesh et al, 2011),
from the 300 sampled patient’s in the study
21% did not know the storage conditions of
insulin.
It was observed that 67.3% (n=37) of the
patient’s knew the correct administration of
their anti-diabetic medication. In the current
study administration of anti-diabetic
medication comprised of knowledge of
administration with regards to food for all
the anti-diabetic medication and in addition
knowledge of site of administration with
regards to insulin, while the 62% of the
patient’s that were aware of the
administration of their medicines.
Knowledge deficit emphasizes the need for
diabetes education program which is
essential in improving patient’s knowledge
of their anti-diabetic medication which is
one of a key component of diabetes
management and improvement of quality of
life.
The focus of this study was to evaluate
physician prescribing pattern and patient
utilization patterns associated with
pharmacological management of diabetic
patients with the help of studying
prescriptions and interviewing the patients.
Unlike clinical trials that typically address
issues related to safety and efficacy, this
study attempted to provide data on
utilization behavior associated with
antidiabetic agents.
Cost Assessment
This study was carried out with the
objectives of computing the costs and
percentage price variation among oral
hypoglycemic agents across the different
brands available in the Indian market. Drug
prices were captured from CIMS and IDR
because these are regularly updated.
Selection of cost effective brand will
improve the compliance and the
consequence of the treatment. It is observed
from our results that there is a wide (up to
836.20%) variation in prices of drugs
manufactured by different pharmaceutical

Internationally powered by www.jmpas.com DOI - 10.22270/jmpas.v8i4.820
2283 Journal of Medical Pharmaceutical and Allied Sciences, V 8-I 4, 820. JULY 2019, 2276-2299
Companies.
The reasons for this price variation could be
as follows:
1. The existing market structure of the
pharmaceutical industry.
2. Industry costs.
3. Government regulations and pricing
policies.
From our study it is also clear that, price
variation was directly related to the number
of companies manufacturing a particular
drug. So it can be concluded that the price
variation increases because of the increase in
competition among the manufacturing
companies. Pharmacists do not dispense the
same brand as prescribed by the doctor and
try to substitute it with other alternatives,
quoting the reason of non-availability. This
is often done with vested interest for
economic gains as some brands have a
higher profit margin.
It is felt that physicians could provide better
services and reduce costs of drugs if
information about drug prices was readily
available. Studies have shown that providing
a manual of comparative drug prices
annotated with prescribing advice to
physicians reduced their patients’ drug
expense. Due to the long term treatment
duration, diabetes patients usually have
higher than average monthly out-of-pocket
expenses and high out-of-pocket expenses
can be a barrier to adherence to prescription
drug regimens. Many chronically ill adults
cut back on medications due to high
prescription cost. Inadequate prescription
coverage and out of pocket expenses is one
of the strongest predictors of their
medication adherence problems. In the
absence of information on comparative drug
prices and quality, it is difficult for doctors
to prescribe the most economical
prescription.
Most people cut their doses because the
treatment is proven to be out of pocket
expense for them. Physician has knowledge
about that brand only they are prescribing.
They don’t have any information about other
brands and this existence of wide variation
in prices. Government should take some step
in order to regulate and to bring uniformity
in price. So that it can be affordable by a
common man which will ultimately improve
the compliance and reduce the economic
burden.
REFERENCES
1. Wade O, 1984. Drug utilization studies:
implications for medical care. Page
683:7-9.
2. Glasgow RE, Fisher EB, Anderson BJ,
lagreca A, Marrero D, Johnson SB,

Internationally powered by www.jmpas.com DOI - 10.22270/jmpas.v8i4.820
2284 Journal of Medical Pharmaceutical and Allied Sciences, V 8-I 4, 820. JULY 2019, 2276-2299
Rubin RR, Cox DJ, 1999. Behavioral
science and diabetes: contributions and
opportunities. Vol 22 page 832-843.
3. Satoskar RS, Bhandarkar SD, Rege NN,
2005. Pharmacology and Pharmaco
therapeutics. Revised 19th ed. page 871.
4. Mooradian AD, 1996. Drug therapy of
non-insulin dependent diabetes mellitus
in the elderly. Vol (5) page 931-941.
5. King DJ, 1980. Effect of the CURB
Campaign on barbiturate prescribing in
Northern Ireland. Vol (30) page 614 -
618.
6. Ramaiya KL, Kodali VRR, Alberti,
KGMM, 1990. Epidemiology of
Diabetes in Asians of the Indian
subcontitent. Vol (6) page 125-146.
7. Ramachandran A, Snehalatha C, Kapur
A, Vijay V, Mohan V, Das, AK, Rao
PV, 2001. High prevalence of diabetes
and impaired glucose tolerance in India
National Urban Diabetes Survey
(NUDS). Vol (44) page 1094 -1101.
8. Ravi Shankar P, Subish P, Bhandari RB,
Mishra P, Saha AC, 2006. Ambiguous
pricing of topical dermatological
products: A survey of brands from two
South Asian countries. Vol (16) page
134-40.
9. Khushali G Acharya, 2013. Evaluation
of antidiabetic prescriptions, cost and
adherence to treatment guidelines: A
prospective, cross-sectional study at a
tertiary care teaching hospital Year.
Issue 4 Vol (4) Page 82-87.
10. Desai Prachi, Desai Chirag, Panchal
Aarti, Dr. Sandeep Desai, 2015) A Drug
Prescribing Pattern Study in Diabetes
Mellitus. Issue 1 Vol (5) page115-118.
11. Ramachandran G, Rohith V, Isabella
Topno, 2015. Evaluation of prescribing
pattern of anti-diabetic drugs using
WHO prescribing indicators in a tertiary
care hospital in Pondicherry: A cross-
sectional study. Issue 4vol (5) page 76-
80.
12. Harris MI, 1991. Epidemiologic
correlated of NIDDM in Hispanics,
whites and blacks in the US population.
Issue 14vol (l3) page 639-648.
13. Goodpaster B, Detany A, 2010. Effect of
diet and physical activity interventions
in severely obese adults: a randomized
trial. Issue 4 vol (16) page 1795-1802.

Internationally powered by www.jmpas.com DOI - 10.22270/jmpas.v8i4.820
2285 Journal of Medical Pharmaceutical and Allied Sciences, V 8-I 4, 820. JULY 2019, 2276-2299
EXPERIMENTAL TABLES AND FIGURES
TABLE 1: DIABETES DISTRIBUTION PROFILE ON GENDER. S. NO. GENDER NO. OF PATIENTS PERCENTAGE
1. Male 29 52.7%
2. Female 26 47.3%
3. Total 55 100%
FIGURE1: DIABETES DISTRIBUTION PROFILE ON GENDER
TABLE 2: DISTRIBUTION OF DIABETIC PATIENT’S BASED ON TYPES OF DIABETIES.
S.NO. Types Total Percentage
1. Type 1 DM 6 11%
2. Type 2 DM 49 89.1%
0
50
100
0 2 4 6 8 10
NO
OF
MA
NU
FA
CT
UR
ING
CO
MP
AN
Y
% OF PRICE VARIATION
DRUG PRICE VARIATION
52.747.3Male
Female

Internationally powered by www.jmpas.com DOI - 10.22270/jmpas.v8i4.820
2286 Journal of Medical Pharmaceutical and Allied Sciences, V 8-I 4, 820. JULY 2019, 2276-2299
.
FIGURE 2: DISTRIBUTION OF DIABETIC PATIENTS BASED ON
TYPES OF DIABETIES
TABLE 3: DIABETIC PATIENTS DISTRIBUTION PROFILE BASED ON AGE.
S.NO. AGE NO. OF PATIENTS PERCENTAGE
1. Below 20 3 5.4%
2. 20-29 2 3.6%
3. 30-39 1 1.8%
4. 40-49 20 36.3%
5. 50-59 18 32.7%
6. 60 and Above 11 20%
FIGURE 3: DIABETIC PATIENTS DISTRIBUTION PROFILE ON AGE.
11%
89.1%
Type1 DM
Type2 DM
5.4 3.6 1.8
36.332.7
20
0
5
10
15
20
25
30
35
40
Below 20 20-29 30-39 40-49 50-59 60 and Above
% P
OP
UL
AT
ION
AGE (YEARS)

Internationally powered by www.jmpas.com DOI - 10.22270/jmpas.v8i4.820
2287 Journal of Medical Pharmaceutical and Allied Sciences, V 8-I 4, 820. JULY 2019, 2276-2299
TABLE4: DISTRIBUTION OF DM PATIENTS BASED ON BODY WEIGHT.
S. NO BODY WEIGHT NO. OF PATIENTS PERCENTAGE
1. Under weight 5 9.1%
2. Normal 25 45.4%
3. Obese 30 54.5%
FIGURE 4: DISTRIBUTION OF DM PATIENTS BASED ON BODY WEIGHT
TABLE 5: DURATION OF DIABETES PATIENTS.
S. NO. DURATION OF DIABETES FREQUENCY PERCENTAGE
1. <1 yrs 9 16.4%
2. 1-2yrs 12 21.8%
3. 2-3 yrs 12 21.8%
4. 3-4 yrs 6 10.9%
5. 4-5 yrs 16 29.1%
TABLE 6: DISTRIBUTION OF THE PATIENTS BASED ON SMOKING HABIT.
S.NO. TYPES FREQUENCY PERCENTAGE
1. Smoker 19 34.5%
2. Non-Smoker 36 65.4%
9.1
45.4
54.5
0
10
20
30
40
50
60
Under weight Normal Obese
%

Internationally powered by www.jmpas.com DOI - 10.22270/jmpas.v8i4.820
2288 Journal of Medical Pharmaceutical and Allied Sciences, V 8-I 4, 820. JULY 2019, 2276-2299
FIGURE 5: DURATION OF DIABETES PATIENTS
FIGURE 6: DISTRIBUTION OF THE PATIENTS BASED ON SMOKING HABIT
TABLE 7: DISTRIBUTION OF THE PATIENTS BASED ON LITERACY.
S. NO. NO. OF PATIENTS FREQUENCY PERCENTAGE
1. Literate 20 36.3%
2. Illiterates 35 63.6%
16.3%
21.8 21.8
10.9
29.1
0
5
10
15
20
25
30
35
Below 1 year 1-2 yrs 2-3 yrs 3-4 yrs 4-5 yrs
%
AGE (YEARS)
34.5%
65.4%
Smoker
Non smoker
Internationally powered by www.jmpas.com DOI - 10.22270/jmpas.v8i4.820
2289 Journal of Medical Pharmaceutical and Allied Sciences, V 8-I 4, 820. JULY 2019, 2276-2299
.
FIGURE 7: DISTRIBUTION OF THE PATIENTS BASED ON LITERACY
TABLE 8: DISTRIBUTION BASED ON DOING EXERCISE.
S.NO. TYPES OF EXERCISE FREQUENCY PERCENTAGE
1. Walking 35 63.6%
2. Other Exercise 12 21.2%
3. Exercise (Not Doing) 8 14.5%
FIGURE 8: DISTRIBUTION BASED ON DOING EXERCISE.
TABLE 9: DISTRIBUTION OF DIABETIC PATIENTS BASED ON INSULIN INJECTION
ADMINISTRATION AND STORAGE CONDITIONS OF INSULIN.
S. NO NO. OF PATIENTS FREQUENCY PERCENTAGE
1. Insulin inj. Administered 46 83.6%
2. Storage condition of Insulin 31 56.4%
TABLE 10: DISTRIBUTION BASED ON MAINTAINING THE FOOD HABIT.
S.NO. TYPES FREQUENCY PERCENTAGE
1. Maintaining (Food habit) 24 38.2%
2. Not maintaining (Food habit) 31 56.4%
36.3%
36.3% Literate
Illiterate
63.6%21.2%
14.5%
Walking
Other Exercise
Exercise (Not Doing)

Internationally powered by www.jmpas.com DOI - 10.22270/jmpas.v8i4.820
2290 Journal of Medical Pharmaceutical and Allied Sciences, V 8-I 4, 820. JULY 2019, 2276-2299
FIGURE 11: DISTRIBUTION BASED ON MAINTAINING THE FOOD HABIT.
FIGURE 12: DISTRIBUTION OF DIABETIC PATIENTS BASED ON INSULIN INJECTION
ADMINISTRATION AND STORAGE CONDITIONS OF INSULIN.
TABLE 11: PATIENTS INDIVIDUAL KNOWLEDGE OF ANTI-DIABETIC MEDICATION.
S.
NO
KNOWLEDGE OF DIABETES MEDICATION FREQUENCY PERCENTAGE
1. Good knowledge 5 9.1%
2. Average knowledge 35 63.6%
3. Poor knowledge 15 27.3%
FIGURE 13: PATIENTS INDIVIDUAL KNOWLEDGE OF ANTI-DIABETIC MEDICATION.
38.2%
56.4%
Maintaining
Not maintaining
83.6%
56.4
0
20
40
60
80
100
Insulin injection administered Storage condition of insulin
% o
f p
op
ula
tion
0%
20%
40%
60%
80%
100%
Good Knowledge AverageKnowledge
Poor Knowledge
9.1 63.6 27.3
% O
F
PO
PU
LA
TIO
N

Internationally powered by www.jmpas.com DOI - 10.22270/jmpas.v8i4.820
2291 Journal of Medical Pharmaceutical and Allied Sciences, V 8-I 4, 820. JULY 2019, 2276-2299
TABLE 12: DISTRIBUTION OF PATIENTS BASED ON COMPLICATION OF DM.
S. NO. DM COMPLICATION NO. OF PATIENTS PERCENTAGE
1 Early Stage 25 45.4%
2 Late Stage 10 18.2%
FIGURE 14: DISTRIBUTION OF PATIENTS BASED ON COMPLICATION OF DM.
TABLE 13: DISTRIBUTION BASED ON CO-MORBID CONDITION WITH DM.
S. NO CO-MORBID CONDITION WITH DM TOTAL NO. OF PATIENTS PERCENTAGE
1. Hypertension 22 40%
2. COPD 4 7.3%
3. Neuropathy 8 14.5%
4. UTI 4 7.3%
5. Asthma 1 1.8%
6. ALD 4 7.3%
7. CKD 9 16.4%
8. Hepatitis 2 3.6%
9. Tuberculosis 4 7.3%
10. Arthritis 3 5.4%
11. Anemia 2 3.6%
12. Nephropathy 4 7.3%
13. Retinopathy 1 1.8%
14. CAD 2 3.6%
45.4%
18.2%
Early Stage
Late Stage

Internationally powered by www.jmpas.com DOI - 10.22270/jmpas.v8i4.820
2292 Journal of Medical Pharmaceutical and Allied Sciences, V 8-I 4, 820. JULY 2019, 2276-2299
FIGURE 15: DISTRIBUTION BASED ON CO-MORBID CONDITION WITH DM
TABLE 14: VARIOUS ANTIDIABETIC AGENTS USED IN PROSPECTIVE DATA ANALYSIS.
S.NO. NAME OF DRUG FREQUENCY PERCENTAGE
1. Insulin 36 65.4%
2. Metformin 1 1.8%
3. Glimepiride 4 7.3%
4. Insulin+ Metformin 9 13.4%
5.
Insulin+ Metformin+ Glimepiride 4 7.3%
FIGURE 16: VARIOUS ANTIDIABETIC AGENTS USED IN PROSPECTIVE DATA ANALYSIS
40
7.3
14.5
7.3
1.8
7.3
16.4
3.67.3
5.43.6
7.3
1.83.6
0
5
10
15
20
25
30
35
40
45
%
DISEASE CONDITION
65.4
1.87.3
13.47.3
010203040506070
%

Internationally powered by www.jmpas.com DOI - 10.22270/jmpas.v8i4.820
2293 Journal of Medical Pharmaceutical and Allied Sciences, V 8-I 4, 820. JULY 2019, 2276-2299
TABLE 15: MOSTLY PRESCRIBED DRUGS AMONG DIABETIC PATIENTS.
S. NO. DRUGS NO. OF PATIENTS PERCENTAGE
1. Short Acting Insulin
27
47.3% Regular Insulin
2. Rapid Acting Insulin
4
7.3% Basolog (Lispro Insulin)
3. Intermediate Acting Insulin
4
7.3% Nph
4. Long Acting Insulin
2
3.6% Glargine
Mixtard(30/70) 16 29.1%
5. Bigunide
13
23.6% Metformin
6. Sufonulurea
4
7.3% Glimepride
FIGURE 17: MOSTLY PRESCRIBED DRUGS AMONG DIABETIC PATIENTS
TABLE 16: DISTRIBUTION OF THERAPY BASED ON DIFFERENT PHYSICIAN.
PHYSICIAN DRUG THERAPY TOTAL NO. OF PATIENTS PERCENTAGE
A
Mono therapy 12 21.8%
Double therapy 1 1.8%
Triple therapy
B
Mono therapy 16 29.1%
Double therapy 1 1.8%
Triple therapy 2 3.6%
C
Mono therapy 11 20%
Double therapy 6 10.9%
Triple therapy 2 3.6%
47.3
7.3 7.33.6
29.123.6
7.3
0
10
20
30
40
50
RegularInsulin
BasologInsulin
NPH Glargine Mixtard30/70
Metformin Glimepride
%

Internationally powered by www.jmpas.com DOI - 10.22270/jmpas.v8i4.820
2294 Journal of Medical Pharmaceutical and Allied Sciences, V 8-I 4, 820. JULY 2019, 2276-2299
FIGURE 18: DISTRIBUTION OF THERAPY BASED ON DIFFERENT PHYSICIAN.
TABLE 17: ANALYSIS OF TREATMENT THERAPY OF DIABETES.
.
FIGURE 19: ANALYSIS OF TREATMENT THERAPY OF DIABETES
21.8
29.1
20
1.8 1.8
10.9
3.6 3.60
5
10
15
20
25
30
35
Physician A Physician B Physician B
%Mono therapy
duble therapy
Triple therapy
0
10
20
30
40
50
60
70
80
Mono therapy Double therapy Triple therapy
%
S. NO. DRUG THERAPY NO. OF PATIENT PERCENTAGE
1. Mono therapy 37 67.3%
2. Double therapy 11 20%
3. Triple therapy 4 7.3%

Internationally powered by www.jmpas.com DOI - 10.22270/jmpas.v8i4.820
2295 Journal of Medical Pharmaceutical and Allied Sciences, V 8-I 4, 820. JULY 2019, 2276-2299
REFERENCE STANDARD OF COST ANALYSIS FOR COMMONLY USED:
TABLE 18: REFERENCE STANDARD OF COST ANALYSIS FOR INSULIN COMMONLY USED
BRAND NAME COST/ UNIT RS.
Regular Insulin
Human Actrapid 0.49
Insuman rapid 0.41
Human fastact 0.49
Humanmonotard 0.49
Wosulin R 0.32
Biphasic Insulin
Human mixtard 0.49
Huminsulin 30:70 0.36
Huminsulin 50:50 0.36
Human Rapimix 0.47
Insuman 50:50 0.41
Lentisulin HP1 (Pork insulin) 0.27
Insulin Analogues
Novomix 30 1.75
Novorapid 1.75
Humalog 1.02
TABLE 19: REFERENCE STANDARD OF COST ANALYSIS FOR METFORMIN.
BRAND NAME COST/ STRIP OF 10 TAB RS.
STRENGTH. RS
Glycomet 500mg 12.22
850mg 16.44
1gm 18.20
Glycephage 250mg 5.90
500mg 17.94
850mg 14.04
1gm SR 29.95
Bigomet 250mg 4.50
500mg 7.10
850mg 10.73
1gm 17.60
Melmet SR 500mg 19.00
1gm 61.50
Dibeta SR 500Mg 17.41
1gm 33.60
Janumet M 1gm 23.91
Exermet 500mg 81.50
1gm 37.50

Internationally powered by www.jmpas.com DOI - 10.22270/jmpas.v8i4.820
2296 Journal of Medical Pharmaceutical and Allied Sciences, V 8-I 4, 820. JULY 2019, 2276-2299
TABLE 20: REFERENCE STANDARD OF COST ANALYSIS FOR FIXED DOSE COMBINATIONS OF
METFORMIN.
BRAND NAME COST/ STRIP OF 10 TAB RS.
STRENGTH. RS
Diabetrol GB 5mg + M 500mg 19.43
Glycomet GP SR
Exermet GM Forte
GL 1mg + M 500mg 24.00
GL 2mg + M 1000mg 84.50
Glucord forte GB 5mg + M 500mg 15.25
Glycheck M & forte GC 40mg + M 400mg 28.34
GC 80mg + M 500mg 45.78
Exermet GM GL 1mg + M 500mg 81.50
Metaglez forte GP5mg + M500mg 7.56
TABLE 21: REFERENCE STANDARD OF COST ANALYSIS FOR SULFONYLUREAS.
BRAND NAME COST/ STRIP OF 10 TAB RS.
STRENGTH. RS
Glibenclamide
Glybovin 1.25 mg 2.22
2.25mg 2.92
5mg 4.92
Euglucon 2.25mg 6.05
5mg 8.80
Daonil 2.25mg 3.82
5mg 9.15
Semidaonil 2.5mg 5.25
Glipizide
Gliclaz 80mg 19.50
Glizide 40mg 17.65
80mg 30.00
Diamicron 80mg 60.41
Reclide 80mg 60.61
Glimepiride
Amaryl 1mg 63.15
2mg 117.40
3mg 125.00
Glimiprex 1mg 31.00
2mg 36.00
Euglim 1mg 14.20
2mg 33.20
Euglim 1mg 20.50
2mg 36.00
3mg 41.00
4mg 48.00
Glimer 1mg 59.50
2mg 115.50

Internationally powered by www.jmpas.com DOI - 10.22270/jmpas.v8i4.820
2297 Journal of Medical Pharmaceutical and Allied Sciences, V 8-I 4, 820. JULY 2019, 2276-2299
TABLE 22: REFERENCE STANDARD OF COST ANALYSIS FOR THIAZOLIDINEDIONES.
BRAND NAME COST/ STRIP OF 10 TAB RS.
STRENGTH. RS
Pioglitazone
Pioglit 15mg 18.00
30mg 64.50
Piozit 15mg 35.00
30mg 55.00
Pioglar 15mg 64.20
30mg 98.23
Piomed 15mg 10.00
30mg 18.00
Rosiglitazone
Enselin 2mg 35.50
4mg 59.50
8mg 100.00
Rosinorm 2mg 36.00
4mg 62.00
Result 2mg 40.00
4mg 66.00
8mg 100.00
Roglin 2mg 28.00
4mg 55.00
TABLE 23: REFERENCE STANDARD OF COST ANALYSIS FOR MEGLITINIDES.
BRAND NAME COST/ STRIP OF 10 TAB RS.
STRENGTH. RS
Repaglinide
Eurepa 0.5mg 38.00
1mg 62.00
2mg 98.00
Nateglinide
NDS 60mg 45.00
120mg 70.00
Roglin 2mg 28.00
4mg 55.00
TABLE 24: REFERENCE STANDARD OF COST ANALYSIS FOR ACARBOSE
Brand Name Cost/ Strip of 10 tab Rs.
Strength. Rs
Glucobay 25mg 42.00
50mg 88.00
Glubose 50mg 67.0
Abacus 50mg 65.00

Internationally powered by www.jmpas.com DOI - 10.22270/jmpas.v8i4.820
2298 Journal of Medical Pharmaceutical and Allied Sciences, V 8-I 4, 820. JULY 2019, 2276-2299
The percentage variation in price was calculated using the following formula:
Cost variation (%) =
Price of most expensive brand - price of least expensive brand X100
Price of least expensive brand
TABLE25: THE PRICE VARIES BETWEEN A SULFONYLUREA GROUPS OF DRUGS.
Drug Formulations Doses
(mg)
Manufacturing
Companies
Min.
Price (rs)
Max. Price
(rs)
% price
Variation
Glibenclamide 2 2.5 8 2.6 6.05 132.69
5 9 3.6 9.15 154.16
Gliclazide 4 30 12 19 64.9 241.57
40 17 14 27.5 96.43
60 10 35 99.6 184.57
80 39 19.5 70.5 261.54
Glimepiride 4 1 53 8.36 63.15 655.38
2 53 12.54 117.4 836.2
3 12 45 125 177.7
4 20 18.5 103.4 450
Glipizide 3 2.5 6 2.93 9.35 219.11
5 14 4.74 13.3 174.89
10 5 18 25 38.88
TABLE 26: PRICE VARIATION IN BIGUANIDES & THIZOLIDINEDIONES GROUPS OF DRUGS.
Drug Formulations Doses
(mg)
Manufacturing
Companies
Min.
Price (rs)
Max. Price
(rs)
% price
Variation
Metformin 4 250 7 4.6 9 35.65
500 48 6 24.50 308.33
850 18 10 36 260
1000 34 14 41.4 195.71
Pioglitazone 2 15 40 10 64.20 452
30 40 18 98.20 445.55
TABLE 27: PRICE VARIATION AMONG Α-GLUCOSIDASES INHIBITOR GROUP OF DRUGS.
Drug Formulations Doses
(mg)
Manufacturing
companies
Min.
Price (Rs)
Max. Price
(Rs)
% price
variation
Acarbose 2 25 11 32 55 71.87
50 9 62 89 43.55
Miglitol 2 25 8 50 65.82 31.64
50 14 50.3 118.47 135.50
Voglibose 2 0.2 12 36 64 78.5
0.3 9 54 84 56.74

Internationally powered by www.jmpas.com DOI - 10.22270/jmpas.v8i4.820
2299 Journal of Medical Pharmaceutical and Allied Sciences, V 8-I 4, 820. JULY 2019, 2276-2299
TABLE 28: PRICE VARIES BETWEEN MEGLITINIDES GROUP OF DRUGS
Drug Formulations Doses
(mg)
Manufacturing
companies
Min.
Price (Rs)
Max. Price
(Rs)
% price
variation
Nateglinide 2 60 4 30 45 50
120 4 50 70 40
Repaglinide 3 0.5 6 19.90 38 90.95
1 4 39 62 58.97
2 4 75 98 30.66
TABLE 29: PRICE VARIES AMONG COMBINATION THERAPY
Drug Formulations Doses
(mg)
Manufacturing
companies
Min.
Price
(Rs)
Max.
Price
(Rs)
% price
Variation
Glibenclamide
+ Metformin
3 2.5+400 8 8.5 19 133.33
2.5+500 12 16 36 62.50
5+500 19 12 29.9 149.16
Glicazide
+ Metformin
5 80+500 43 18.10 78.25 332.32
60+500 5 39.25 68.50 74.52
40+400 3 28.3 29 2.47
40+500 3 35 60 71.43
30+500 3 32 59 84.37
Glimepiride +
Metformin
5 1+500 50 18 69 283.33
2+500 53 26 120.4 362.07
1+1000 2 38 41.75 9.86
2+100 4 51.8 60 15.83
2+850 2 65 73 12.3
Glipizide +
Metformin
2 5+500 11 6.72 14 108.33
2.5+400 3 5.36 26.25 399.04
Pioglitazone +
Glimepiride
3 15+1 12 17.1 59.3 246.78
15+2 15 41.959.3 70 67.06
30+2 2 69 80 15.94
Pioglitazone +
Metformin
2 15+500 34 19 70.6 271.57
30+500 21 32.40 86 165.43
Pioglitazone +
Metformin +
Glimepiride
2 15+500+1 12 44 80 81.81