in urban areasbetter mobility - mohamed mezghani€¦ · · 2010-11-13electronic ticketing helps...
TRANSCRIPT
Problems Solutions Best Practices
Union Internationale des Transports PublicsInternational Association of Public TransportInternationaler Verband für öffentliches Verkehrswesen
Better Mobility in Urban AreasBetter Mobility in Urban Areas
0-FV Cover (UK) 13/02/02 12:25 Page 1
ContentsProblems
1. More and more people are living in urban areas2. Urban communities are becoming larger and less3. Billions are lost in traffic congestion4. Quicker between cities - but slower in the cities5. Moving cars take up precious urban space6. Parked cars use valuable urban space uneconomically7. The waste of limited urban space8. Cars waste a lot of energy9. Pollution, mainly from car traffic, is destroying the quality of air
in urban areas10. Noise destroys the quality of life in urban communities11. Traffic accidents kill 45,000 people per year in Europe12. Not everyone has a car or access to a car13. The decision maker’s perception of public opinion
The vicious cycle of urban declineSolutions
1. Urban density is more cost-effective than urban sprawl2. Urban development around public transport stations3. Cities become welcoming and dynamic when freed from
congestion4. More trade after pedestrianization5. Strict parking policies in city centres reduces traffic jams6. Park + Ride complements parking restrictions in city centres7. Fast, reliable public transport can attract passengers from other
modes8. Give public transport a reserved right-of-way9. Low floor means easy access10. For heavy traffic demand, metros and suburban rail are the
answer11. Attractive Interchanges are key to successful public transport12. Good passenger information is essential for seamless travel13. Electronic ticketing helps make public transport easier to use14. Urban car journeys should be properly charged
15. Innovative Financing is needed for investing in Public Transport16. Success breeds success
A balanced traffic system in urban areasBest Practices
1. Public transport adds value to developing new or undevelopedareas
2. Light rail regenerates city centres3. Pedestrians, cyclists, buses and trams make a good
combination for inner city centres4. Attractive rail and bus services to out-of-town shopping and
leisures centres5. Fast reliable links from city centres to airports 6. Co-ordination of all modes7. New technology can be used to better inform passengers8. Easy access to all modes by ‘e-ticket’9. Quality Bus Corridors transports 40% to 200% more passengers
at peak times10. High capacity buses networks can successfully transport large
quantities of people11. Light rail can also satisfy heavy demand12. The renaissance of trams13. Tram-train, a new concept using both light and heavy rail lanes14. Metro can rapidly move large number of passengers15. Art brings light underground16. Wealth and public transport go together!
UITP references
This brochure has been prepared by the UITP General Commission for Urban Life. The Editorial team consisted of Peter Scheidegger, Louis Marchand, Gilbert Delva, Michel Quidort, Jean Vivier andHeather Allen. Thanks should be given for the support of manymembers of the UITP General Secretariat, in particular StéphanieLoozen and Thierry Maréchal. May 2001
0-FV Cover (UK) 13/02/02 12:25 Page 2

Better Mobility in Urban AreasThe past fifty years has been characterised by the explosive growth in urban population and car use. Urbanisation isnow heavily influenced by the car and many households have moved out to the ‘green’ suburbs and need severalcars to satisfy their mobility needs. The resulting consequences of this urban sprawl are well known: the degenerationof social and neighbourhood links, greater car dependence, longer journeys and increased transport costs.
Those cities that have been able to keep their historic centres, and maintain their commercial and cultural activities,are now threatened by the unsustainable growth of traffic and congestion. Interurban and intercontinental journeysare becoming quicker but cities themselves are being almost paralysed by traffic. Unrestricted car use in towns andcities has a negative economic impact on efficiency, uses non-renewable energy sources, contributes to the‘greenhouse’ effect and their citizens suffer from high levels of noise and pollution.
Sustainable development of urban areas is therefore no longer a theoretical subject for conferences and debate, butnow needs to be put into practise. Citizens today realise that their future, and that of the next generations, dependson the decisions made by politicians responsible for urban planning and the mobility measures put in place by them.To ensure access to all the activities on offer, even for those without a car, and still respect the environment, car usein cities must be mastered and priority be given to public transport, pedestrians and cyclists - all measures whichwill improve the quality of life in urban areas.
There has been progress and we can see good examples of regenerated areas giving citizens greater pleasure and pride in their city’s heritage, but the process needs to go on. This brochure shows not only the extent of theproblem, but also the solutions that can be applied, as well as success stories from around the world.
The private car has brought undreamed levels of mobility and liberty to individuals, but its unlimited use in urbanareas has a negative effect on society and the economy.
Jean-Paul Bailly Hans RatPresident UITP Secretary General UITP
1-FV cahier compl final (UK) 13/02/02 14:59 Page 1
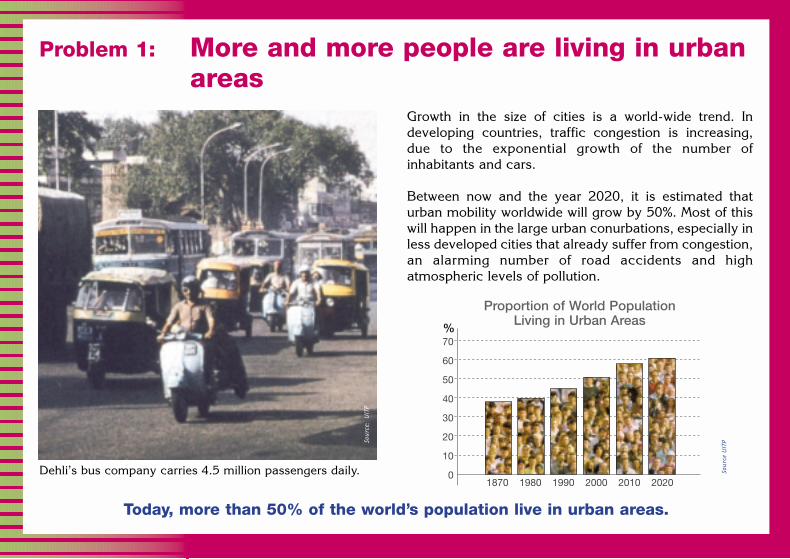
Growth in the size of cities is a world-wide trend. Indeveloping countries, traffic congestion is increasing,due to the exponential growth of the number ofinhabitants and cars.
Between now and the year 2020, it is estimated thaturban mobility worldwide will grow by 50%. Most of thiswill happen in the large urban conurbations, especially inless developed cities that already suffer from congestion,an alarming number of road accidents and highatmospheric levels of pollution.
Dehli’s bus company carries 4.5 million passengers daily.
Today, more than 50% of the world’s population live in urban areas.
Problem 1: More and more people are living in urbanareas
Sour
ce:
UIT
P
Sour
ce U
ITP
0
10
20
30
40
50
60
70
1870 1980 1990 2000 2010 2020
Proportion of World PopulationLiving in Urban Areas
%
1-FV cahier compl final (UK) 13/02/02 14:59 Page 2

In industrialised countries, the rise in the standard ofliving has led to urban sprawl and high levels of cardependency. If city dwellers move from the city to thesuburbs, more frequent and longer journeys are made by car.
In addition, as shown below, the lower the density, themore gasoline is consumed.
The total cost for urban journeys is directly related to density - the lower the density the higher cost. Thisvaries between 5% of the Gross Domestic Product (GDP) fordense cities such as Tokyo, Singapore, Copenhagen orMunich, and 15% for low-density North American cities.
Urban sprawl brings traffic congestion, pollution, and high transport costs for the community.
Problem 2: Urban communities are becoming largerand less dense
Sour
ce: U
ITP
Los
Ange
les
Sour
ce: U
ITP
Mill
enni
um C
itie
s da
taba
se
Density vs Energy Consumption per inhabitants per year for traffic purposes
Ene
rgy
cons
ump
tion
(meg
aJ)
© ISTP-UITP
0� 50� 100� 150� 200� 250� 300� 350� 400�0�
20000�
40000�
60000�
80000�
100000�
120000�
Density (inhab/ha)
1-FV cahier compl final (UK) 13/02/02 14:59 Page 3
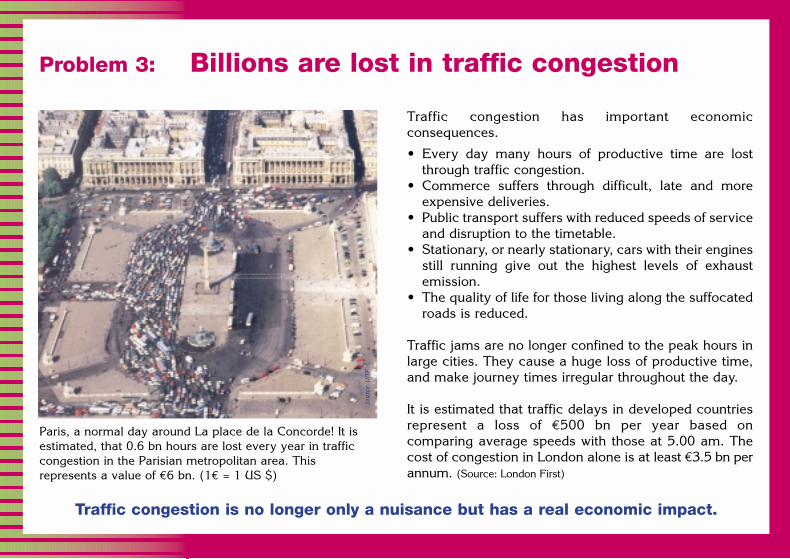
Traffic congestion has important economicconsequences.
• Every day many hours of productive time are lostthrough traffic congestion.
• Commerce suffers through difficult, late and moreexpensive deliveries.
• Public transport suffers with reduced speeds of serviceand disruption to the timetable.
• Stationary, or nearly stationary, cars with their enginesstill running give out the highest levels of exhaustemission.
• The quality of life for those living along the suffocatedroads is reduced.
Traffic jams are no longer confined to the peak hours inlarge cities. They cause a huge loss of productive time,and make journey times irregular throughout the day.
It is estimated that traffic delays in developed countriesrepresent a loss of €500 bn per year based oncomparing average speeds with those at 5.00 am. Thecost of congestion in London alone is at least €3.5 bn perannum. (Source: London First)
Paris, a normal day around La place de la Concorde! It isestimated, that 0.6 bn hours are lost every year in trafficcongestion in the Parisian metropolitan area. Thisrepresents a value of €6 bn. (1€ = 1 US $)
Traffic congestion is no longer only a nuisance but has a real economic impact.
Problem 3: Billions are lost in traffic congestion
Sour
ce: U
ITP
1-FV cahier compl final (UK) 13/02/02 14:59 Page 4
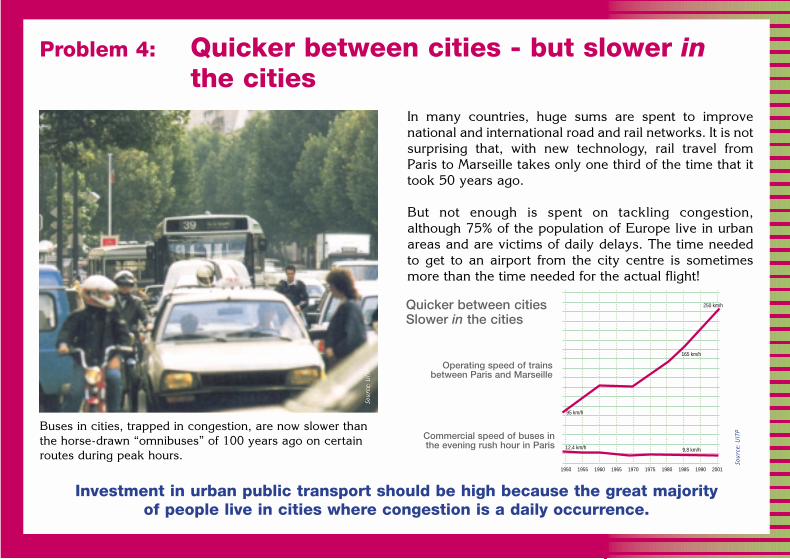
In many countries, huge sums are spent to improvenational and international road and rail networks. It is notsurprising that, with new technology, rail travel fromParis to Marseille takes only one third of the time that ittook 50 years ago.
But not enough is spent on tackling congestion,although 75% of the population of Europe live in urbanareas and are victims of daily delays. The time neededto get to an airport from the city centre is sometimesmore than the time needed for the actual flight!
Buses in cities, trapped in congestion, are now slower thanthe horse-drawn “omnibuses” of 100 years ago on certainroutes during peak hours.
95 km/h
165 km/h
250 km/h
12,4 km/h 9,8 km/h
1950 1955 1960 1965 1970 1975 1980 1985 1990 2001
Investment in urban public transport should be high because the great majority of people live in cities where congestion is a daily occurrence.
Problem 4: Quicker between cities - but slower inthe cities
Sour
ce: U
ITP
Sour
ce: U
ITP
Quicker between cities Slower in the cities
Operating speed of trainsbetween Paris and Marseille
Commercial speed of buses inthe evening rush hour in Paris
1-FV cahier compl final (UK) 13/02/02 14:59 Page 5

Sour
ce:
To carry 50,000 people per hour per direction, you need:
- a 175 m wide road used only by cars, or - a 35 m wide road used only by buses, or - a 9 m wide railway track bed for metro.
A GO Transit suburban train in Toronto, Canada carries thesame number of passengers as 800 – 1000 cars, more carsthan this picture shows.
Should urban roads be built according to traffic demand, or should traffic, with the help of public transport, be adapted to existing urban road space?
Problem 5: Moving cars take up precious urbanspace
1-FV cahier compl final (UK) 13/02/02 14:59 Page 6

Employees need approximately the same amount ofspace to work in their offices as they need to park theircar (about 20m2 per person). But unlike their car, whichstays in a car park all day not serving any purpose,employees have a more productive day!
Office car parks contribute little to the economic viabilityof an area and are also visually unattractive.
Cars are parked for about 95% of their life, and parked carstake up as much space as their driver’s offices.
If everybody travelled to work by car, the total space needed for parking cars would beas great as the space needed for business activities.
Problem 6: Parked cars use valuable urban spaceuneconomically
Sour
ce:
UIT
P
20 m2 20 m2
1-FV cahier compl final (UK) 13/02/02 14:59 Page 7
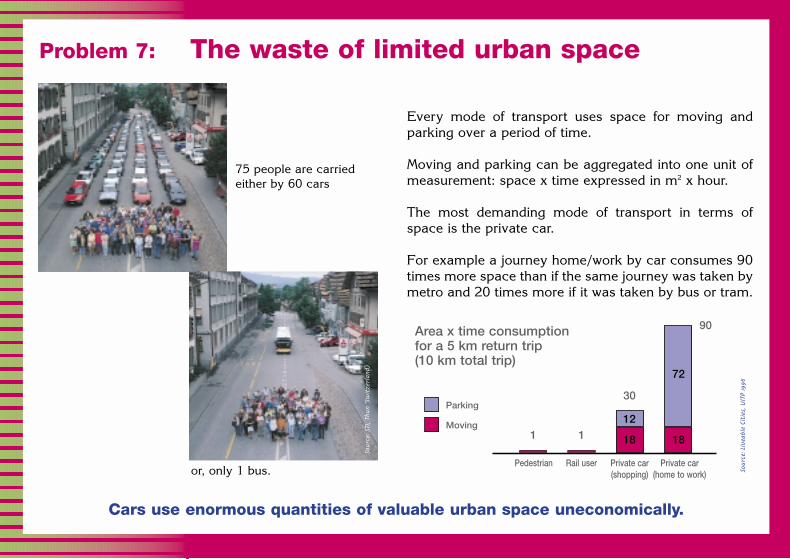
Every mode of transport uses space for moving andparking over a period of time.
Moving and parking can be aggregated into one unit ofmeasurement: space x time expressed in m2 x hour.
The most demanding mode of transport in terms ofspace is the private car.
For example a journey home/work by car consumes 90times more space than if the same journey was taken bymetro and 20 times more if it was taken by bus or tram.
75 people are carriedeither by 60 cars
Cars use enormous quantities of valuable urban space uneconomically.
Problem 7: The waste of limited urban space
Sour
ce: L
ivea
ble
Citi
es, U
ITP
1996
or, only 1 bus.
1 1
90
30
12
18 18
72
Area x time consumption for a 5 km return trip (10 km total trip)
Parking
Moving
Pedestrian Rail user Private car Private car(shopping) (home to work)
Sour
ce: S
TI, T
hun
‘Sw
itze
rlan
d)
1-FV cahier compl final (UK) 13/02/02 15:00 Page 8
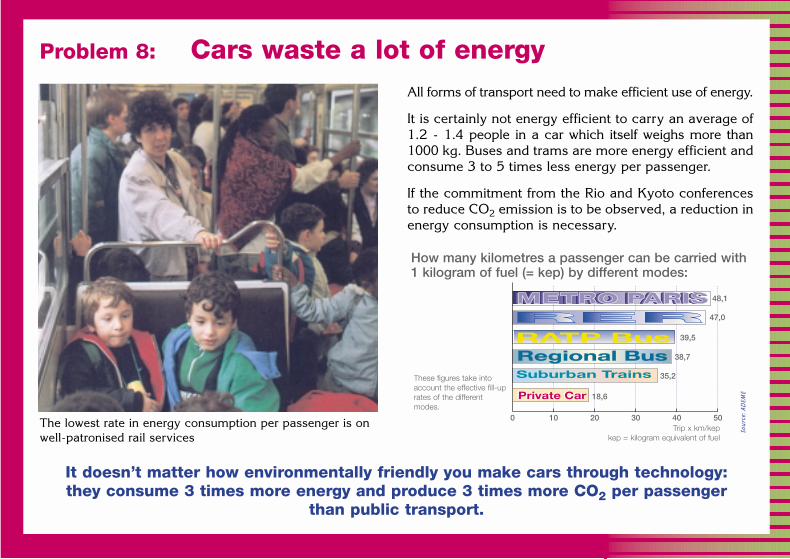
All forms of transport need to make efficient use of energy.
It is certainly not energy efficient to carry an average of1.2 - 1.4 people in a car which itself weighs more than1000 kg. Buses and trams are more energy efficient andconsume 3 to 5 times less energy per passenger.
If the commitment from the Rio and Kyoto conferencesto reduce CO2 emission is to be observed, a reduction inenergy consumption is necessary.
The lowest rate in energy consumption per passenger is onwell-patronised rail services
0 10 20 30 40 50
48,1
47,0
39,5
38,7
35,2
18,6
RATP BusRegional BusSuburban Trains
Private CarPrivate Car
It doesn’t matter how environmentally friendly you make cars through technology:they consume 3 times more energy and produce 3 times more CO2 per passenger
than public transport.
Problem 8: Cars waste a lot of energy
Sour
ce: A
DEM
E
How many kilometres a passenger can be carried with1 kilogram of fuel (= kep) by different modes:
These figures take intoaccount the effective fill-uprates of the differentmodes.
Trip x km/kepkep = kilogram equivalent of fuel
1-FV cahier compl final (UK) 13/02/02 15:00 Page 9

In developed countries, the cost of pollution is between1% and 2% of GDP. The car and lorry industry havemade technical advances to reduce emissions, butnevertheless, road traffic is still the greatest source ofpollution in urban areas. This is due to the increasingtotal number of cars and the length of journeys.
Despite the technological progress over the past fewyears, public transport remains ‘cleaner’ than the car fortransporting large quantities of people.
Only a ‘no growth’ policy for car traffic can reducepollution, health risks and the world-wide greenhouseproblem due to CO2 emissions.
SO2 x 10�
particles x 10�
VOC�
NOx�
CO2/100�
CO/10
0,0 1,0 2,0g/pass x km
Even with the best catalytic converters, the CO2 problem remains.
Problem 9: Pollution, mainly from car traffic, isdestroying the quality of air in urban areas
Sour
ce: U
ITP
Sour
ce: A
DEM
E
Comparison of specific average emissions(grams/passenger x km) of bus and car (all fuels)
bus
private car
ENVIRONNEMENT
1-FV cahier compl final (UK) 13/02/02 15:00 Page 10
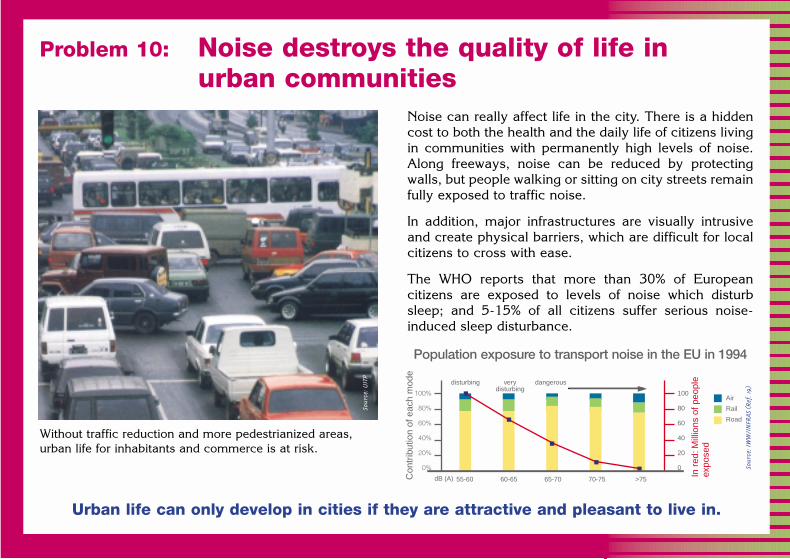
Noise can really affect life in the city. There is a hiddencost to both the health and the daily life of citizens livingin communities with permanently high levels of noise.Along freeways, noise can be reduced by protectingwalls, but people walking or sitting on city streets remainfully exposed to traffic noise.
In addition, major infrastructures are visually intrusiveand create physical barriers, which are difficult for localcitizens to cross with ease.
The WHO reports that more than 30% of Europeancitizens are exposed to levels of noise which disturbsleep; and 5-15% of all citizens suffer serious noise-induced sleep disturbance.
Without traffic reduction and more pedestrianized areas,urban life for inhabitants and commerce is at risk.
100%
80%
60%
40%
20%
0%
55-60 60-65 65-70 70-75 >75
Air�
Rail�
Road
disturbing very�disturbing
dangerous
Con
trib
utio
n of
eac
h m
ode
100�
80�
60�
40�
20�
0�
�
In r
ed: M
illio
ns o
f peo
ple
�ex
pose
d
dB (A)
Urban life can only develop in cities if they are attractive and pleasant to live in.
Problem 10: Noise destroys the quality of life inurban communities
Sour
ce: U
ITP
Sour
ce: I
WW
/IN
FRAS
(Ref
. 19)
Population exposure to transport noise in the EU in 1994
1-FV cahier compl final (UK) 13/02/02 15:00 Page 11

The total number of deaths in Europe per year due totraffic accidents are equivalent to a small war. In urbanareas, pedestrians and cyclists represent nearly half thenumber of victims.
There is a direct relation between the number of peoplekilled on the roads in towns and the number of journeysmade by car. In towns where there are well developedpublic transport systems, the number of deaths are halfas many as in towns where almost all journeys are madeby car. Accident statistics for public transport for badlyinjured or fatal incidents, are between 10 to 20 times lessper passenger x kilometre than for cars.
Public transport has more respect for citizens’ lives than the private car.
Problem 11: Traffic accidents kill 45,000 people peryear in Europe
Traffic accidents are the first cause of death for youngpeople aged 1-25 in European Union countries; far morethan suicide.
UIT
P -
P. G
eluc
k Sa
ve t
he C
ity
60�
50�
40�
30�
20�
10�
0<1 01-04 05-14 15-24 25-34 35-44 45-54 55-64 67-74 75-84 85-94 95+
%
Age
Sour
ce :
AutO
actu
alit
é N
ovem
bre
2000
Traffic accidents
Traffic accidents as cause of death
1-FV cahier compl final (UK) 13/02/02 15:00 Page 12

Although the number of cars is steadily increasing, notevery household has a car. In many developing countriesthe majority of the population still depends on publictransport.
Even in highly industrialised countries, as many as 25%of households have no car and more than 50% of thepopulation has no access to a car at certain times of theday, even if the household owns a car.
Schoolchildren, elderly people, those without a drivinglicense, as well as the socially underprivileged, needcollective transportation.
In addition, if they live in a city well-served by publictransport, more citizens make the choice not to own acar for environmental reasons.
All citizens should have access to a reasonable level ofpublic transport and mobility in urban areas without havingto resort to the car.
Everyone should have access to transport for essential trips such as for work, education and health as well as for shopping and leisure.
Problem 12: Not everyone has a car or access to a car
1-FV cahier compl final (UK) 13/02/02 15:00 Page 13

A large-scale population survey in 12 Europeancountries has shown that:
• Car traffic is the most important local problem.• 59% of the population say car traffic has already
reached unbearable or hardly bearable levels.• 84% of the population would opt for priority for public
transport, even if it conflicts with private traffic needs.
Where citizens can make decisions on transport, as in someUS States or in Switzerland, they generally approveinvestments in public transport and restrictions of privatetraffic in urban areas.
24
26
50
20
45
35
16
36
48
18
36
46
18
35
47
19
33
48
21
30
49
26
30
44
21
26
51
30
24
46
25
22
53
24
22
54
27
16
57
more �favourable �than the �reality
accurately
more hostile�than it really �is
EC 12 +
Denmar
kIre
land
Portug
alFra
nce
Luxe
mbour
g
United
King
dom
Nether
lands
Spain
German
yBelg
iumGre
ece
Italy
Half of the political decision-makers underestimate the wish of their electorate to give buses and trams priority.
Problem 13: The decision maker’s perception ofpublic opinion
Sour
ce: U
ITP
How politicians evaluate the opinion of the publictowards public transport
1-FV cahier compl final (UK) 13/02/02 15:00 Page 14

The vicious cycle of urban decline
More people choose the car
More carsMore road traffic
More traffic jams shortage of parking spaces
Decrease in the PublicTransport Offer
Decrease in the use ofPublic Transport
Buses and trams areslower, less effective
and therefore less attractive
Inner city residentialareas decline and
inhabitants move to the outskirts
The city becomes lesspleasant to live in
Employment possibi-lities move from the city to the outskirts
Urban employmentareas are less accessible
Increase of air pollution,noise, accidents
More investment in road
and parking
1-FV cahier compl final (UK) 13/02/02 15:00 Page 15
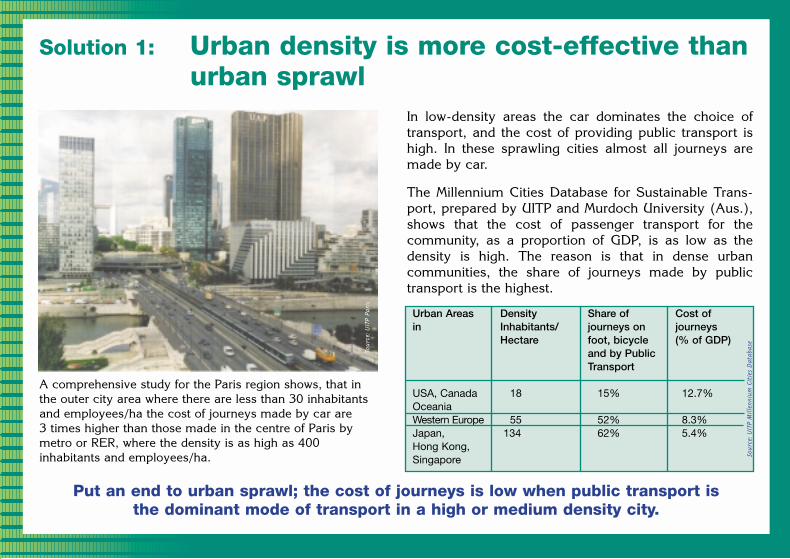
In low-density areas the car dominates the choice oftransport, and the cost of providing public transport ishigh. In these sprawling cities almost all journeys aremade by car.
The Millennium Cities Database for Sustainable Trans-port, prepared by UITP and Murdoch University (Aus.),shows that the cost of passenger transport for thecommunity, as a proportion of GDP, is as low as thedensity is high. The reason is that in dense urbancommunities, the share of journeys made by publictransport is the highest.
A comprehensive study for the Paris region shows, that inthe outer city area where there are less than 30 inhabitantsand employees/ha the cost of journeys made by car are 3 times higher than those made in the centre of Paris bymetro or RER, where the density is as high as 400inhabitants and employees/ha.
Put an end to urban sprawl; the cost of journeys is low when public transport is the dominant mode of transport in a high or medium density city.
Solution 1: Urban density is more cost-effective thanurban sprawl
Urban Areasin
USA, CanadaOceaniaWestern EuropeJapan, Hong Kong,Singapore
DensityInhabitants/Hectare
18
55134
Share ofjourneys onfoot, bicycleand by PublicTransport
15%
52%62%
Cost ofjourneys (% of GDP)
12.7%
8.3%5.4%
Sour
ce: U
ITP
Mill
enni
um C
itie
s D
atab
ase
Sour
ce: U
ITP
Pari
s
1-FV cahier compl final (UK) 13/02/02 15:00 Page 16

Taking public transport into account in urban planningdecisions is an effective way to stop the increase inprivate car traffic and daily traffic congestion. One of thebest incentives for leaving the car at home is a shortwalk to an attractive public transport station.
The graph below, from a small town in Switzerland,shows that the number of public transport users isdoubled when the walking distance to the nearest stop isreduced from 7 minutes to 2 minutes.
Siting offices next to stations reduces walking distances andencourages the use of public transport, as can be seen herein San Diego.
Public transport stops should be no more than a short walk from home and as close as the parking lot to the office.
Solution 2: Urban development around publictransport stations
Phot
o fr
om S
an D
iego
CA/
USA
50�
40�
30�
20�
10�
0
1 2 3 4 5 6 7 8 M
odal
-spl
it (%
)
Walking distance in min.
1-FV cahier compl final (UK) 13/02/02 15:00 Page 17
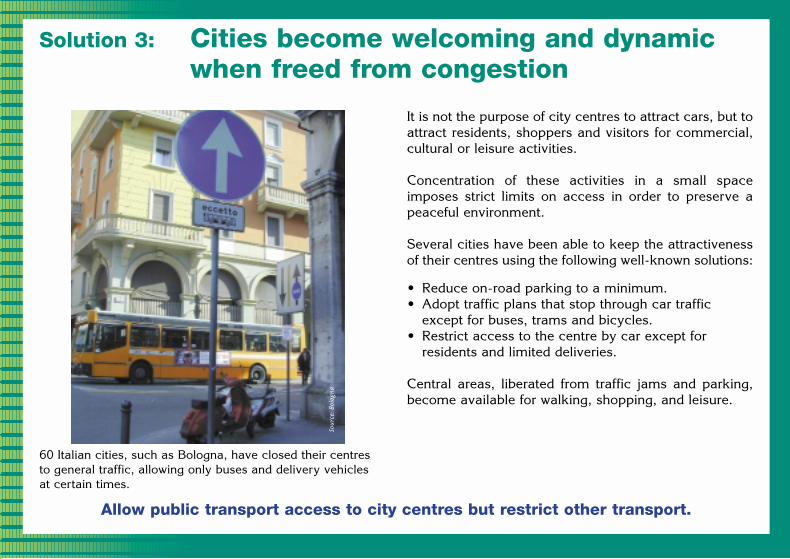
It is not the purpose of city centres to attract cars, but toattract residents, shoppers and visitors for commercial,cultural or leisure activities.
Concentration of these activities in a small spaceimposes strict limits on access in order to preserve apeaceful environment.
Several cities have been able to keep the attractivenessof their centres using the following well-known solutions:
• Reduce on-road parking to a minimum. • Adopt traffic plans that stop through car traffic
except for buses, trams and bicycles. • Restrict access to the centre by car except for
residents and limited deliveries.
Central areas, liberated from traffic jams and parking,become available for walking, shopping, and leisure.
60 Italian cities, such as Bologna, have closed their centresto general traffic, allowing only buses and delivery vehiclesat certain times.
Allow public transport access to city centres but restrict other transport.
Solution 3: Cities become welcoming and dynamicwhen freed from congestion
Sour
ce: B
olog
na
1-FV cahier compl final (UK) 13/02/02 15:00 Page 18
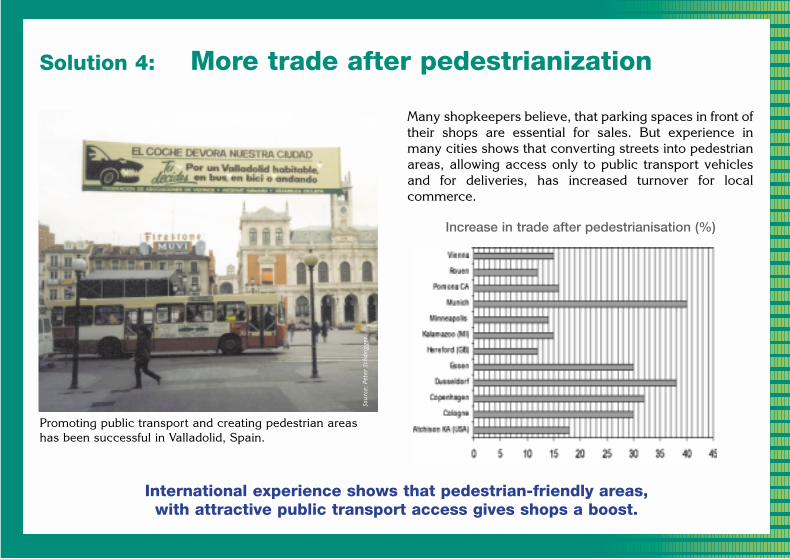
Many shopkeepers believe, that parking spaces in front oftheir shops are essential for sales. But experience inmany cities shows that converting streets into pedestrianareas, allowing access only to public transport vehiclesand for deliveries, has increased turnover for localcommerce.
Promoting public transport and creating pedestrian areashas been successful in Valladolid, Spain.
International experience shows that pedestrian-friendly areas, with attractive public transport access gives shops a boost.
Solution 4: More trade after pedestrianization
Sour
ce: P
eter
Sch
deig
ger
Increase in trade after pedestrianisation (%)
1-FV cahier compl final (UK) 13/02/02 15:00 Page 19

Contrary to popular belief, more parking spaces oftenmeans more traffic congestion. Restricting theavailability of parking - especially for commuters - is themost effective (and cheapest) way to convince drivers toleave their cars at home. They then change to lessspace-consuming modes of transport.
Parking policies are a major tool for successful citytraffic management.
UITP recommends the following actions: limit thecreation of parking spaces in new office buildings;discourage free parking at people’s places of work; limitparking capacity in centres; optimise parking use(eliminate on-road parking for commuters through theuse of time restriction ‘blue’ zones…) and ensure that therestrictions are enforced.
Pedestrianization of a city road (as seen here in LüneburgGermany) enhances local trade, despite the loss of parkingspaces.
Making more parking space available than the road network can handle is as illogical as training the muscles of the body
when the heart does not have the appropriate capacity to cope.
Solution 5: Strict parking policies in city centresreduces traffic jams
Sour
ce: U
ITP
PARKING POLICY
1-FV cahier compl final (UK) 13/02/02 15:00 Page 20

Not everybody lives a short walk from a station, so othermodes need to be used to get to the station. The privatecar is an important feeder to public transportinterchanges and in many countries Park + Ride facilitieshave shown good results getting people to use publictransport to get into the city.
P+R schemes must be consistent with parking measuresin city centres e.g. each new parking place in a P+Rshould mean one parking place in the city centre.
To be attractive, Park + Ride must offer connections tofrequent, fast public transport services and they must bewell managed. Real-time passenger information,comfortable waiting and transfer areas increase theirattraction.
Park + Ride at a light rail terminal in Hanover (Germany).
A car parked in a suburban station means one parking space less in the city and two car journeys less on the access roads.
Solution 6: Park + Ride complements parkingrestrictions in city centres
Sour
ce: G
VH
PARKING POLICY
1-FV cahier compl final (UK) 13/02/02 15:00 Page 21
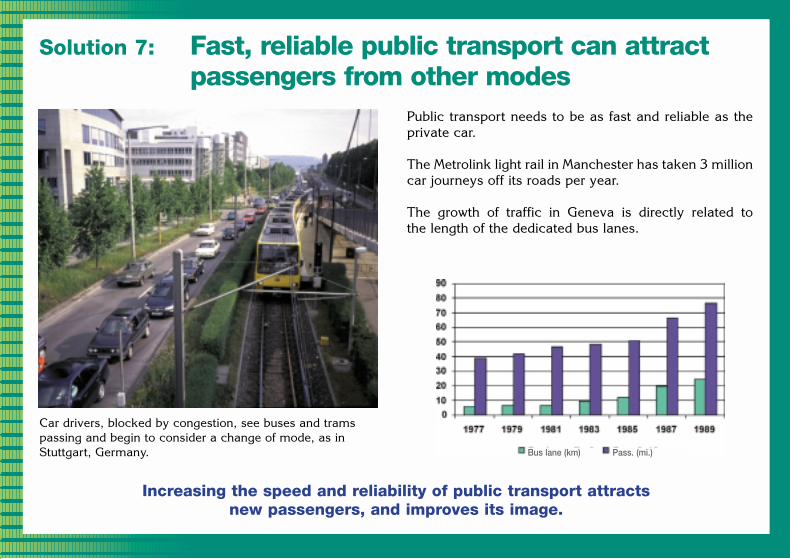
Public transport needs to be as fast and reliable as theprivate car.
The Metrolink light rail in Manchester has taken 3 millioncar journeys off its roads per year.
The growth of traffic in Geneva is directly related to the length of the dedicated bus lanes.
Car drivers, blocked by congestion, see buses and tramspassing and begin to consider a change of mode, as inStuttgart, Germany.
Increasing the speed and reliability of public transport attracts new passengers, and improves its image.
Solution 7: Fast, reliable public transport can attractpassengers from other modes
Bus lane (km) Pass. (mi.)
1-FV cahier compl final (UK) 13/02/02 15:00 Page 22

Space is at a premium in urban areas so it needs to beused sensibly. Buses and trams use nearly 20 times lessspace to transport the same number of people than theprivate car.
One of the most cost effective measures for successfulpublic transport is giving it dedicated rights-of-way.
The resulting increase in speed and reliability:
- Reduces operating costs, mainly through a reductionin the total number of vehicles needed and fewer sparevehicles needed to compensate for running late.
- Improves the frequency of the service.
Increasing the vehicle speed and reducing waiting timesresults in a shorter overall journey time for passengers.
Speed and reliability are important factors to makecustomers change to public transport. Nice, France has adedicated bus lane parallel to the popular beach front.
Giving buses and trams dedicated infrastructure gives a good pay-back by reducing operating costs and increasing farebox revenue.
Solution 8: Give public transport a reserved right-of-way
1-FV cahier compl final (UK) 13/02/02 15:00 Page 23

Easy boarding is a must for all sorts of customers:children, shoppers with heavy bags, parents withstrollers, the elderly. Good accessibility is required tosatisfy the needs of those with reduced mobility.
Level boarding is a long-time feature of undergroundrailways. 15 years ago surface vehicles started to havethis type of access and nearly all new buses and light railvehicles are now low-floor, offering near level-boarding.
Many European cities have low-floor trams and busesallowing quick and easy boarding to and from the platformas shown here in Dresden, Germany.
Public transport vehicles are more accessible than 15 years ago.
Solution 9: Low floor means easy access
Sour
ce:
ACCESSIBILITY
1-FV cahier compl final (UK) 13/02/02 15:00 Page 24

In major cities of the developed world, metros and heavyrail are the least expensive mode of public transport foraccess to and around the city centres.
Although the level of investment in metro, RER or heavyrail is often high, in the long term it offers the mostefficient solution for moving thousands of passengersduring the busy peak hours.
Therefore, the number of metro systems is stillincreasing in large cities and in the emerging nations,whose populations are growing fast.
The large quantity of people travelling by metro inSingapore keeps the roads more clear.
Metros or suburban trains can carry more than 50,000 passengers on one line per hour and direction. No other mode can beat that!
Solution 10: For heavy traffic demand, metros andsuburban rail are the answer
Number of Metros globally 1960-2000
25
34
54
74
100
1960
1970
1980
1990
2000
1-FV cahier compl final (UK) 13/02/02 15:00 Page 25

The larger the city, the more passengers have to changebetween buses, metros, trams or other modes. Thiswaste of time can be a great inconvenience, if theseinterchanges are not well planned and made attractive.
In good interchange areas, passengers should be able touse their time in an enjoyable way, to dine and shop forinstance, and these areas can become a dynamic part ofa city.
An interchange in Vancouver British Colombia, Canadashowing the easy transfer between modes.
Platform 1
Supertram line
Train
Platform 2
Platform 3
Platform 4
P
Meadowhall )Road
Concourse
Sheffield
Doncaster
Barnsley
City Centre
River Don
Meadowhall )Centre
Tyler Street
Foot
bridge
Ramp
RampRamp
Ramp
Ramp
Ramp
Ramp
Interchanges should not be only used for transport purposes, but should be developed as interesting and lively parts of a city.
Solution 11: Attractive Interchanges are key tosuccessful public transport
Public transport interchange and shopping centre in Sheffield, UK.
1-FV cahier compl final (UK) 13/02/02 15:00 Page 26
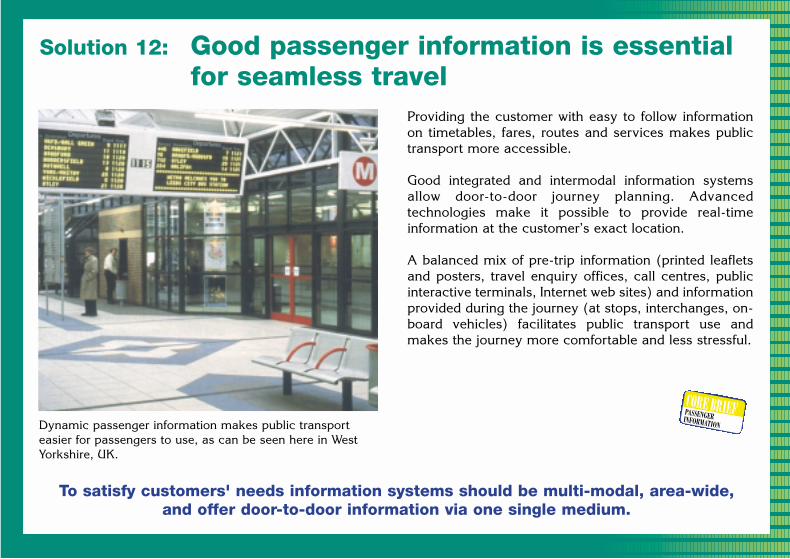
Providing the customer with easy to follow informationon timetables, fares, routes and services makes publictransport more accessible.
Good integrated and intermodal information systemsallow door-to-door journey planning. Advancedtechnologies make it possible to provide real-timeinformation at the customer’s exact location.
A balanced mix of pre-trip information (printed leafletsand posters, travel enquiry offices, call centres, publicinteractive terminals, Internet web sites) and informationprovided during the journey (at stops, interchanges, on-board vehicles) facilitates public transport use andmakes the journey more comfortable and less stressful.
To satisfy customers' needs information systems should be multi-modal, area-wide, and offer door-to-door information via one single medium.
Solution 12: Good passenger information is essentialfor seamless travel
Dynamic passenger information makes public transporteasier for passengers to use, as can be seen here in WestYorkshire, UK.
PASSENGERINFORMATION
1-FV cahier compl final (UK) 13/02/02 15:00 Page 27

Tickets should allow easy transfer between modes andoperators, either over a designated area or country wide.
Developments in electronic ticketing add a newdimension for regular and season ticket holders.
Automatic fare collection systems and contactless smartcards offer high performance alternatives to traditionalticketing. They are simple to use, allow fares based onactual travel length or on period of the day (peak, off-peak), permit transactions in total security, avoidhandling cash, reduce fare evasion, allow inter-modalfares and leave the way clear for new electronic purseapplications.
Smartcards and electronic ticketing make Public Transport easier to use and therefore more attractive.
Solution 13: Electronic ticketing helps make publictransport easier to use
Contactless technology offers significant advantages interms of cost, reliability, security, and speed of transactioncompared to other forms of ticketing.
CONTACTLESSTICKETING
1-FV cahier compl final (UK) 13/02/02 15:00 Page 28
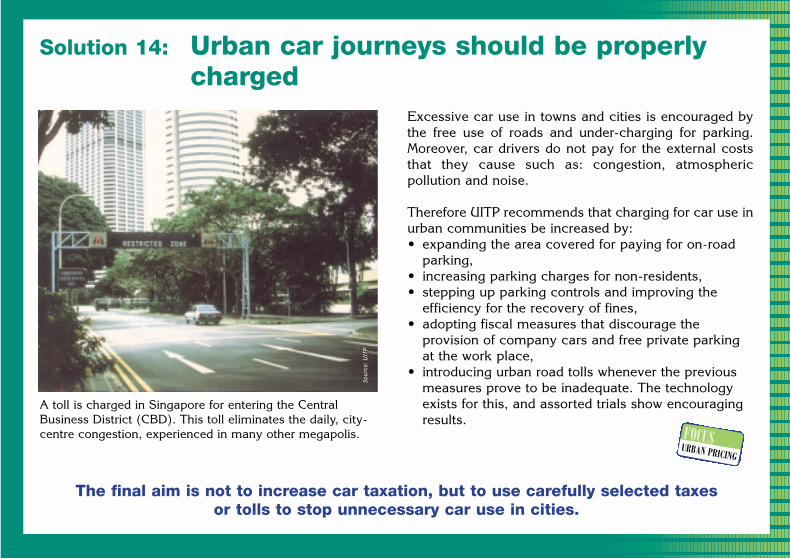
Excessive car use in towns and cities is encouraged bythe free use of roads and under-charging for parking.Moreover, car drivers do not pay for the external coststhat they cause such as: congestion, atmosphericpollution and noise.
Therefore UITP recommends that charging for car use inurban communities be increased by: • expanding the area covered for paying for on-road
parking, • increasing parking charges for non-residents, • stepping up parking controls and improving the
efficiency for the recovery of fines, • adopting fiscal measures that discourage the
provision of company cars and free private parkingat the work place,
• introducing urban road tolls whenever the previousmeasures prove to be inadequate. The technologyexists for this, and assorted trials show encouragingresults.
A toll is charged in Singapore for entering the CentralBusiness District (CBD). This toll eliminates the daily, city-centre congestion, experienced in many other megapolis.
The final aim is not to increase car taxation, but to use carefully selected taxes or tolls to stop unnecessary car use in cities.
Solution 14: Urban car journeys should be properlycharged
Sour
ce: U
ITP
URBAN PRICING
1-FV cahier compl final (UK) 13/02/02 15:01 Page 29
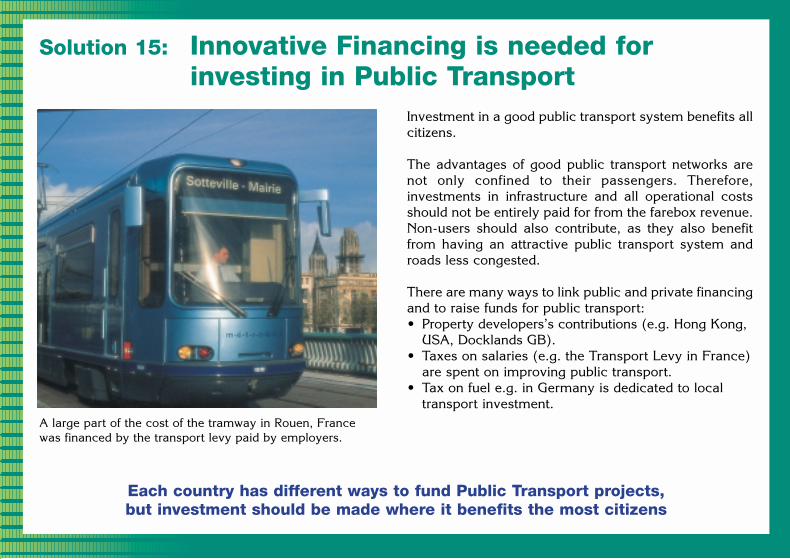
Investment in a good public transport system benefits allcitizens.
The advantages of good public transport networks arenot only confined to their passengers. Therefore,investments in infrastructure and all operational costsshould not be entirely paid for from the farebox revenue.Non-users should also contribute, as they also benefitfrom having an attractive public transport system androads less congested.
There are many ways to link public and private financingand to raise funds for public transport:• Property developers’s contributions (e.g. Hong Kong,
USA, Docklands GB).• Taxes on salaries (e.g. the Transport Levy in France)
are spent on improving public transport.• Tax on fuel e.g. in Germany is dedicated to local
transport investment.A large part of the cost of the tramway in Rouen, Francewas financed by the transport levy paid by employers.
Each country has different ways to fund Public Transport projects, but investment should be made where it benefits the most citizens
Solution 15: Innovative Financing is needed forinvesting in Public Transport
1-FV cahier compl final (UK) 13/02/02 15:01 Page 30
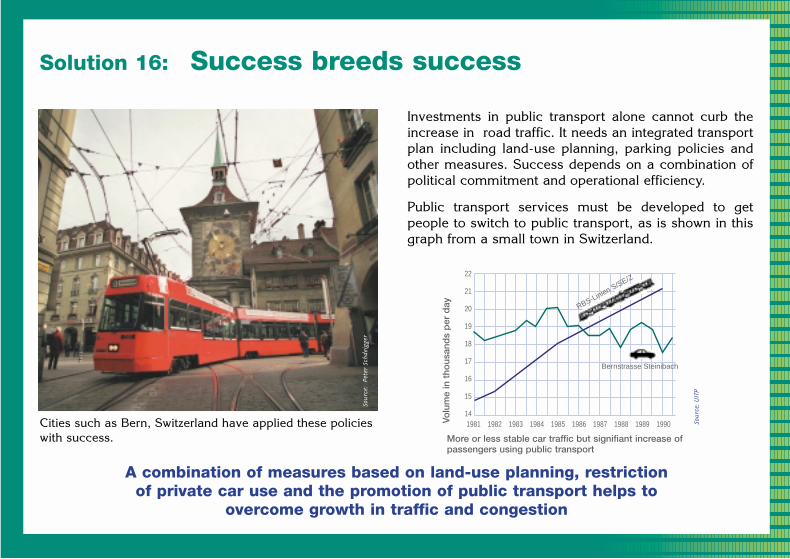
Investments in public transport alone cannot curb theincrease in road traffic. It needs an integrated transportplan including land-use planning, parking policies andother measures. Success depends on a combination ofpolitical commitment and operational efficiency.
Public transport services must be developed to getpeople to switch to public transport, as is shown in thisgraph from a small town in Switzerland.
Cities such as Bern, Switzerland have applied these policieswith success.
22
21
20
19
18
17
16
15
141981 1982 1983 1984 1985 1986 1987 1988 1989 1990
RBS-Linien S/SE/Z
Bernstrasse Steinibach
A combination of measures based on land-use planning, restriction of private car use and the promotion of public transport helps to
overcome growth in traffic and congestion
Solution 16: Success breeds success
Sour
ce:
Pete
r Sc
hdei
gger
Sour
ce: U
ITP
Volu
me
in t
hous
and
s p
er d
ayMore or less stable car traffic but signifiant increase ofpassengers using public transport
1-FV cahier compl final (UK) 13/02/02 15:01 Page 31

BALANCED TRAFFIC SYSTEM
Three pillars for a balanced traffic systemin urban areas
Only a combination of solutions is successful
1-FV cahier compl final (UK) 13/02/02 15:01 Page 32

Sour
ce: U
ITP
In 2002, a new automatic metro line financed by privatefunding will link the new town of Orestad to the centre ofCopenhagen. A company owned jointly by CopenhagenCity and the Government of Denmark is in charge ofbuilding and operating the new metro line. It borrowedcapital based on floating state and city backed bondswhich are paid back by selling the land to propertydevelopers.
The London Docklands light rail was jointly financed by thedevelopers of this new area.
Investment in providing a high quality public transport system increases the value of real-estate
Best Practice 1: Public transport adds value to developing new areas
Sour
ce: D
ockl
ands
Lig
ht R
ail
Finance new public transport investments with the land-owners, who are able to build up
undeveloped areas, as in Copenhagen.
Copenhagen Airport
City Centre
1-FV cahier compl final (UK) 13/02/02 15:01 Page 33

Sour
ce:
Many cities have successfully combined public transportprojects with a policy of revival of its city centre. Welldesigned public transport such as light rail systems aresuccessful and attractive to passengers, even in cardominated low density US and Canadian cities.
In the last 20 years, 14 cities in USA and Canada haveintroduced new light rail systems: Baltimore, Buffalo,Calgary, Dallas, Denver , Edmonton, Los Angeles, NewJersey, Portland, Sacramento, Saint Louis, Salt LakeCity, San Diego, San Jose.
Building ‘transit malls’ with light rail access, trees andpedestrian zones encourages private investment in citycentre office blocks, shops and apartments.
The attractive “transit” mall of prosperous San Jose (CA).
New public transport systems are a good starting point for commercial developmentand a better urban environment.
Best Practice 2: Light rail regenerates city centres
Sour
ce: P
TI /
rep
ort
LIGHT RAIL
1-FV cahier compl final (UK) 13/02/02 15:01 Page 34

Even in narrow streets where cars are banned, pedestrians,cyclists, deliveries, buses and trams can coexist.
In Italy, more than 60 cities have restricted access totheir historic city centres except for buses and trams, formost of the day. In Rome this zone extends from the eastof the Tiber as far as the Termini station, encompassingthe historic city centre, with its high density ofemployment, commerce and habitation.
Prague has used concrete humps in the city centre toseparate car lanes from tram tracks and prevent carsand trucks from driving on the rails. An 800 m sectionwith humps has eliminated former regular delays of 7 -10 minutes and reduced the circuit time of 5 tram routes.
This cost-effective solution together with appropriateparking policies helps:- keeping the track free for trams- delays resulting from congestion- reduction of circuit time- increased smooth flow of tram traffic- energy savings
In Amsterdam, the narrow Leidestraat, is a pedestrianizedzone where trams are allowed.
Trams and buses can adapt to the narrow streets of historic city centres.
Best Practice 3: Pedestrians, cyclists, buses and trams makea good combination for inner city centres
Sour
ce: U
ITP
1-FV cahier compl final (UK) 13/02/02 15:01 Page 35

The car is not the only way to reach out-of-townshopping and leisure centres. Attractive public transportwell adapted to the needs of the visitors to these centrescan offer a good alternative.
Such as in Oberhausen (Germany) where the new out-of-town centre with shopping and leisure activities islinked to the town centre and main station by a right-ofway exclusively dedicated to buses and trams. Most ofthe investment for this was financed from the Germanfederal fuel tax.
In Oberhausen (Germany), 28% of visitors to the big out-of-town shopping and leisure centre arrive by bus and tramdue to the fast dedicated routes.
Out of town facilities should also be served by public transport.
Best Practice 4: Attractive rail and bus services to out-of-town shopping and leisure centres
Sour
ce: P
eter
Sch
eide
gger
1-FV cahier compl final (UK) 13/02/02 15:01 Page 36
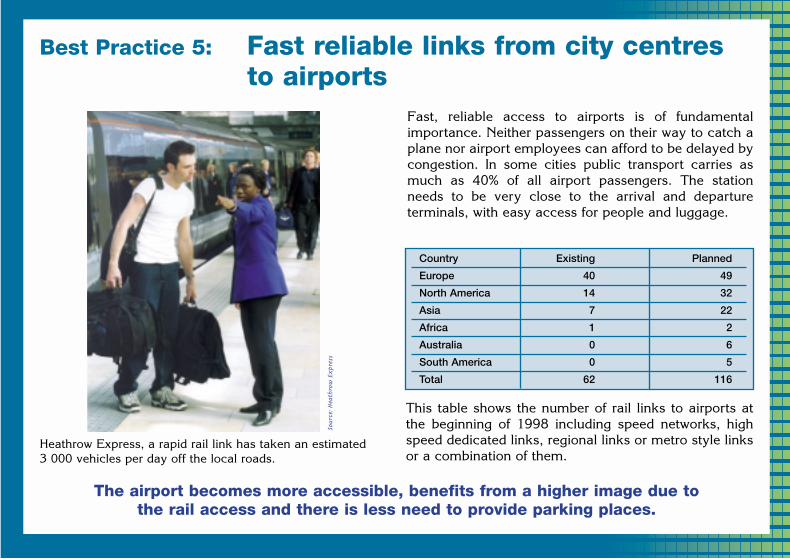
Fast, reliable access to airports is of fundamentalimportance. Neither passengers on their way to catch aplane nor airport employees can afford to be delayed bycongestion. In some cities public transport carries asmuch as 40% of all airport passengers. The stationneeds to be very close to the arrival and departureterminals, with easy access for people and luggage.
Heathrow Express, a rapid rail link has taken an estimated3 000 vehicles per day off the local roads.
The airport becomes more accessible, benefits from a higher image due to the rail access and there is less need to provide parking places.
Best Practice 5: Fast reliable links from city centresto airports
Sour
ce: H
eath
row
Ex
pres
s
Country Existing Planned
Europe 40 49
North America 14 32
Asia 7 22
Africa 1 2
Australia 0 6
South America 0 5
Total 62 116
This table shows the number of rail links to airports atthe beginning of 1998 including speed networks, highspeed dedicated links, regional links or metro style linksor a combination of them.
1-FV cahier compl final (UK) 13/02/02 15:01 Page 37
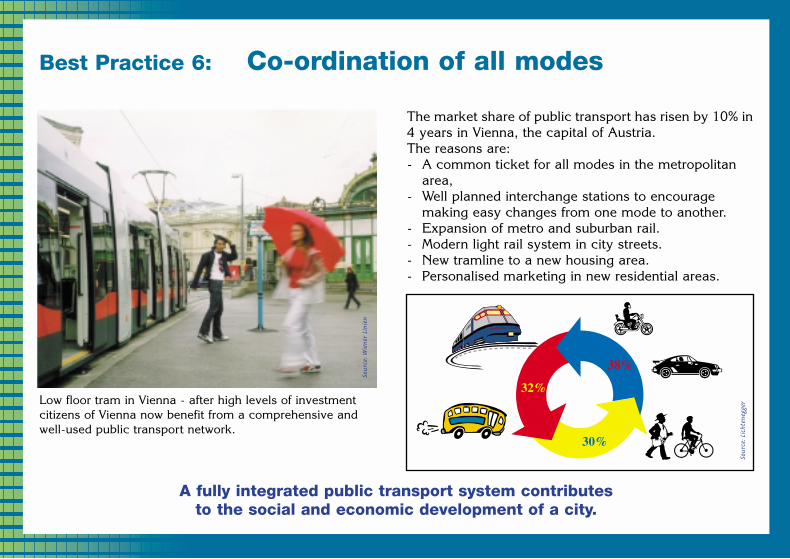
The market share of public transport has risen by 10% in 4 years in Vienna, the capital of Austria. The reasons are:- A common ticket for all modes in the metropolitan
area,- Well planned interchange stations to encourage
making easy changes from one mode to another.- Expansion of metro and suburban rail.- Modern light rail system in city streets.- New tramline to a new housing area.- Personalised marketing in new residential areas.
Low floor tram in Vienna - after high levels of investmentcitizens of Vienna now benefit from a comprehensive andwell-used public transport network.
A fully integrated public transport system contributes to the social and economic development of a city.
Best Practice 6: Co-ordination of all modes
Sour
ce: W
iene
r Li
nien
Sour
ce: L
icht
eneg
ger
1-FV cahier compl final (UK) 13/02/02 15:01 Page 38

OVR, Openbaar Vervoer Reisinformatie, is the intermodalsource of passenger information for The Netherlands. Asingle telephone number for the call centres givesaccess to all the timetables of any mode of publictransport, as well as, a ‘door-to-door’ itinerary showingthe best way to the chosen destination. OVR also takesreservations and payment, and the information it givesout includes taxis and walking or cycling itineraries. OVRreceives more than 10 million calls per year.
Göteborg, Sweden, has a network wide real-timepassenger information system. The information centremonitors the position of vehicles on their routes allowingreal-time information of the next service to be given at stops, including any disruption to service. Thisinformation is also available in the vehicles themselvesand is accessible via the Internet and mobile telephone(WAP – wireless application process).
London Underground is one of the leading transportcompanies in the field of information technology, with itsreal-time information giving next train arrival times.
Good passenger information is a deciding factor to increase the competitiveness of public transport.
Best Practice 7: New technology can be used tobetter inform passengers
1-FV cahier compl final (UK) 13/02/02 15:01 Page 39

A contactless smartcard in Hong-Kong has been inoperation since 1997. This contactless ticketing systemintegrates all modes of public transport (trains, metro,light rail, bus and ferries).
Used by 85% of passengers, the Smartcard reducesaccess time to platforms and vehicles. Its use is notlimited to public transport and electronic purseapplications have been added so that other servicessuch as parking, taxis, and the telephone can also bepaid for. The overwhelming success is attributed to itsconvenience.
New marketing applications and revenue streams arebeing developed and transport applications are beingcalled the ‘killer application’ for contactless smartcards.
Nearly 80% of the total population of Hong Kong possess atleast one smartcard. Each day 4.5 million transactions forpublic transport are made – a remarkable technical successfor improving client service.
New electronic tickets make journeys easier for public transport users.
Best Practice 8: Easy access to all modes by ‘e-ticket’
1-FV cahier compl final (UK) 13/02/02 15:01 Page 40

A key component of Dublin’s Transportation Strategy isthe introduction of Quality Bus Corridors. Twelve suchcorridors comprise the first phase of QBCs, with othersplanned to follow. The package of measures along amain corridor includes:
- priority right of way – dedicated road space forbuses,
- direct alignment of bus route, - a bus every one to three minutes at peak periods,- a modern fully accessible bus fleet, - trained staff committed to quality and customer care,- real-time information with expected time of arrival of
next bus,- illuminated shelters with seats at every stop.
The results so far are very successful. Bus journey timeshave been reduced by 30% to 50% and 60% of thepassengers are new clients who formerly made the tripby car.
The Stillorgan Quality Bus Corridor in Dublin has afrequency of one bus every minute during the critical peakperiods and since its introduction there has been a 200%increase in ridership during the morning peak time band.
Improving bus routes on corridor alignments can be cost effective and produce rapid short-term benefits.
Best Practice 9: Quality Bus Corridor transports 40% to200 % more passengers at peak times
Sour
ce: B
us A
tha
Clia
th
1-FV cahier compl final (UK) 13/02/02 15:01 Page 41

When demand is high but investment funds are scarce,a bus system on dedicated roads provides a goodsolution. Curitiba and Sao Paulo (Brazil) have highquality rapid bus services. Rapid bus systems, such asthe one in Sao Paulo, have a capacity of 20,000passengers in each direction per hour.
This example is being followed by more and moreSouth-American cities. Measures include improvementsin their bus system, reserved roads and speciallydesigned stops.
In Quito (Ecuador), a new trolleybus trunk route hasbeen introduced, serving stations with high platforms foreasy and quick boarding.
Expensive infrastructure is not always possible andadapting existing networks creatively can improve theservice and increase patronage, as in Quito, Ecuador.
Emerging and developing countries need to invest in urban transport systems that are sustainable and respond to their growing needs for mobility.
Best Practice 10: High capacity buses networks cansuccessfully transport largequantities of people
Sour
ce: H
ondi
us
1-FV cahier compl final (UK) 13/02/02 15:01 Page 42
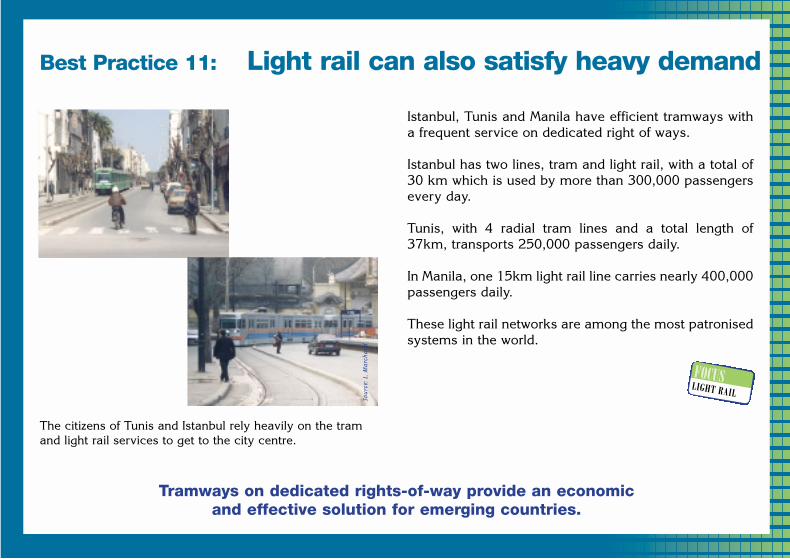
Istanbul, Tunis and Manila have efficient tramways witha frequent service on dedicated right of ways.
Istanbul has two lines, tram and light rail, with a total of30 km which is used by more than 300,000 passengersevery day.
Tunis, with 4 radial tram lines and a total length of 37km, transports 250,000 passengers daily.
In Manila, one 15km light rail line carries nearly 400,000passengers daily.
These light rail networks are among the most patronisedsystems in the world.
The citizens of Tunis and Istanbul rely heavily on the tramand light rail services to get to the city centre.
Tramways on dedicated rights-of-way provide an economic and effective solution for emerging countries.
Best Practice 11: Light rail can also satisfy heavy demand
Sour
ce: L
. Mar
chan
d
LIGHT RAIL
1-FV cahier compl final (UK) 13/02/02 15:01 Page 43

20 years ago, only 3 cities in France still had trams, andeach retained only one line. But many French cities havenow found that they can keep their character andincrease their commercial activities by building amodern tram or in today’s terms light rail system.
Totally new systems have been successfully introducedin: Nantes, Grenoble, Strasbourg, Paris, Rouen,Montpellier, Lyon, and Orléans.
Existing tram networks are being extended and newones are being built such as in Bordeaux. Other cities,such as Nancy, have chosen to invest in the ‘tramway ontyres’.
None of this would have been possible without the‘transport levy’, a tax paid by employers and used forinvestment in and the operation of collective passengertransport.
The new Grenoble light rail system in the city centre. Sittingin a café near an environment-friendly light rail vehicle ismore pleasant than next to a road with heavy traffic.
Light rail can become part of the unique identity of a city and be an object of civic pride for its citizens.
Best Practice 12: The renaissance of trams
LIGHT RAIL
1-FV cahier compl final (UK) 13/02/02 15:01 Page 44
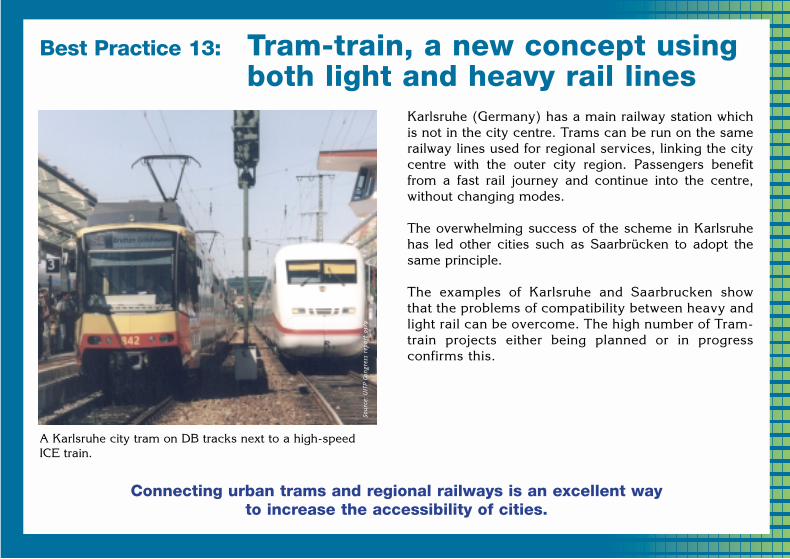
Karlsruhe (Germany) has a main railway station whichis not in the city centre. Trams can be run on the samerailway lines used for regional services, linking the citycentre with the outer city region. Passengers benefitfrom a fast rail journey and continue into the centre,without changing modes.
The overwhelming success of the scheme in Karlsruhehas led other cities such as Saarbrücken to adopt thesame principle.
The examples of Karlsruhe and Saarbrucken showthat the problems of compatibility between heavy andlight rail can be overcome. The high number of Tram-train projects either being planned or in progressconfirms this.
A Karlsruhe city tram on DB tracks next to a high-speedICE train.
Connecting urban trams and regional railways is an excellent way to increase the accessibility of cities.
Best Practice 13: Tram-train, a new concept usingboth light and heavy rail lines
Sour
ce: U
ITP
Cong
ress
rep
ort
95/9
1-FV cahier compl final (UK) 13/02/02 15:01 Page 45
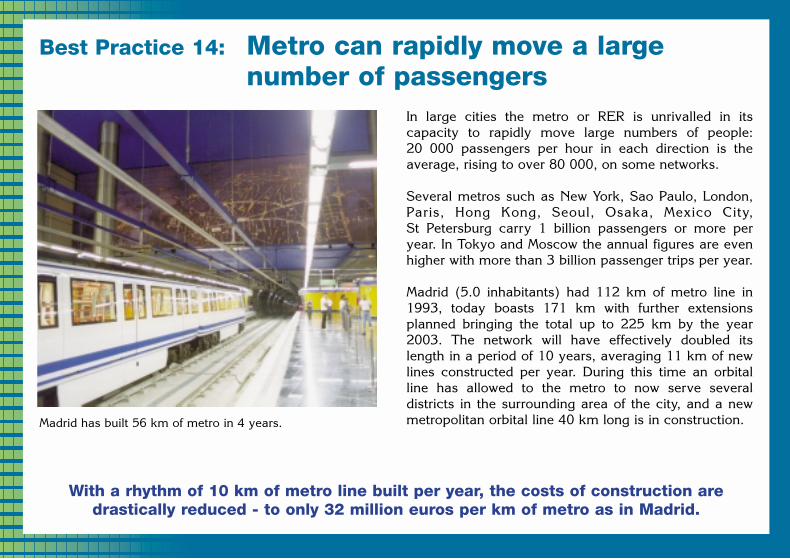
In large cities the metro or RER is unrivalled in itscapacity to rapidly move large numbers of people: 20 000 passengers per hour in each direction is theaverage, rising to over 80 000, on some networks.
Several metros such as New York, Sao Paulo, London,Paris, Hong Kong, Seoul, Osaka, Mexico City, St Petersburg carry 1 billion passengers or more peryear. In Tokyo and Moscow the annual figures are evenhigher with more than 3 billion passenger trips per year.
Madrid (5.0 inhabitants) had 112 km of metro line in1993, today boasts 171 km with further extensionsplanned bringing the total up to 225 km by the year2003. The network will have effectively doubled itslength in a period of 10 years, averaging 11 km of newlines constructed per year. During this time an orbitalline has allowed to the metro to now serve severaldistricts in the surrounding area of the city, and a newmetropolitan orbital line 40 km long is in construction.Madrid has built 56 km of metro in 4 years.
With a rhythm of 10 km of metro line built per year, the costs of construction aredrastically reduced - to only 32 million euros per km of metro as in Madrid.
Best Practice 14: Metro can rapidly move a largenumber of passengers
1-FV cahier compl final (UK) 13/02/02 15:01 Page 46

Sour
ce:
In the nineties, as part of the expansion of the Lisbonmetro extra investment was also made in art andarchitecture to create a modern dynamic environment.This transformed the stations and made each oneradically distinctive showing how art and culture adds anextra dimension to the attractiveness of a system.
As a result, the Lisbon Metro can now be considered tobe a contemporary art gallery with works from architectsand artists from many continents.
Other cities such as Sao Paulo, Stockholm, Paris andBrussels are doing the same.
Art and modern architecture brings new life to undergroundtransport systems.
Citizens look to their Metro systems as a reference of public transport quality and including art improves its positive image.
Best Practice 15: Art brings light underground
1-FV cahier compl final (UK) 13/02/02 15:01 Page 47

In Zurich - as in other banking and service centres world-wide - an attractive public transport system fulfils thedemanding needs of its highly paid managers. Theconcentration of jobs, in financial districts such as WallStreet, New York, The City of London and Frankfurt needhigh capacity attractive transport systems.
Public transport becomes the preferred choice foreveryone if it is quick and comfortable and if parkingcapacity is limited, as is often the case in centralbusiness districts.
Paradeplatz in Zurich, where two world-leading banks havetheir headquarter is reserved for pedestrians and the blueZurich tram.
Public transport is the intelligent choice for all classes of people and can be used for professional as well as for leisure purposes.
Best Practice 16: Wealth and public transport gotogether !
1-FV cahier compl final (UK) 13/02/02 15:01 Page 48
Problems1. Urban mobility: observations and perspectives (demographics,
economics, urban sprawl and car dependency, congestion),BAYLISS D. Mexico Conference, 2000
The growing demand for urban mobility, In: Public Transport - The Challenge, BAYLISS D. 1995
2. Making cities liveable, LACONTE P. 1996
Building more liveable cities through overcoming automobiledependence. An international comparative review, KENWORTHY J.Toronto Congress, 1999
Planification intégrée "urbanisme-transport" et développementdurable des mobilités, BOVY P. H. Mexico Conference, 2000
3. Fighting congestion in city centres, BOURGOIN M. LausanneCongress, 1987
Accessible city-centres for the 21st century, GENTILE P. – HOWARDD. – PETERSON B., Stockholm Congress, 1991
4. Non-user benefitsof public transport, TYSON W., PTI, 1999/5, 40-45
Green light for towns 1991
5. Building more liveable cities through overcoming automobiledependence. An international comparative review, KENWORTHY J.Toronto Congress, 1999
Green light for towns, 1991,
Public transport and land use, In: Public Transport - The Challenge,VIEGAS J. 1995
6. Parking Policy, VIVIER J. - BAYLISS D. - SCHEIDEGGER P. - RAT H.- NOVY M. - MARCHAND L., 1999
Planification intégrée "urbanisme-transport" et développementdurable des mobilités, BOVY P. H., Mexico Conference, 2000
7. Green light for towns, 1991
Coordination of town and transport planning, MARCHAND L.,Singapore Conference, 1988
8. Environmentally sustainable urban transport, SERAGELDIN I., PTI, 1993/2, 17-24
A global review of energy use in urban transport systems and itsimplications for urban transport and land use policy, KENWORTHYJ., Hong Kong Conference, 1998
9. Environmentally sustainable urban transport, SERAGELDIN I., PTI, 1993/2, 17-24
Air quality and urban traffic, HOWARD D. – MARCHAND L. –PETERSON B. – SCHEIDEGGER P., Paris Congress, 1995
Matters at stake within sustainable development , TORODE R.,Mexico Conference, 2000
10. Environmentally sustainable urban transport, SERAGELDIN I., PTI, 1993/2, 17-24
Matters at stake within sustainable development , TORODE R.,Mexico Conference, 2000
11. Matters at stake within sustainable development, TORODE R.,Mexico Conference, 2000
12. Public transport and mobility, In: Public Transport – The Challenge, RAT H., 1995
Green light for towns, 1991
13. Assessment of mobility in Europe, BRÖG W., 1992
Focus Papers are official UITP positions and are available from theGeneral Secretariat.
PTI = Public Transport International
References
1-FV cahier compl final (UK) 13/02/02 15:01 Page 49

Solutions1.-2. Density of urban activity and journey costs, VIVIER J.,
PTI 1999 1/ 4-7
How to reduce car traffic by land-use-planning, PETERSON B., PTI 1999/1 19-21
Millennium cities database for sustainable transport, VIVIER J. -KENWORTHY J. - LAUBE F., PTI 2000/ 4, 43-46
Planification intégrée "urbanisme-transport" et développementdurable des mobilités, BOVY P., Mexico Conference, 2000
Urban structure and modal split, BOVY P. , PTI 1999/ 1
Co-ordinated housing and transport planning, SCHEIDEGGER P.,PTI 1996/ 3
3. Twenty-five years of car restraint in an historic UK city, WILLIAMS R.,Toronto Congress, 1999
Old and new city districts. The impact on the modal split takingthe example of Vienna, LICHTENEGGER M., PTI 1999/ 1, 16-19
4. Revitalizing city centres by public transport, FELZ H., BudapestCongress, 1989
Better use of road capacity - What happens to the traffic, HASS-KLAU C. - CAIRNS S. - GOODWIN P. , TPI 1998/5, 30-33
5. Parking policy, VIVIER J. - BAYLISS D. - SCHEIDEGGER P. -MARCHAND L. - NOVY M. - RAT H., UITP, 1999
6. The importance of multimodal transfer facilities in Hamburg, VON KNOBLOCH A., PTI 1999, 1/ 30-32
It is easy to change modes in Vienna … , SCHEIDEGGER P., PTI 1999 1/ 42-43
Intermodal interchange points, AMAR G., PTI 1999 1/ 38-40
7.-8. Priority for buses serving central zones, HEUNEMANN G. -STÖVEKEN P. - STUCKI C. - WONTORRA K. - MACHALA F. - ABA B. - STABLO J., Sydney Congress, 1993
Priority for light rail at traffic signals, LOHRMANN K-D. -SCHAFFER H. - DE GRAAFF C. J., Sydney Congress, 1993
Green light for towns 1991
Ottawa's transitway. 750 million riders and still counting, SAWKAOXANA, PTI 1999/ 2, 26-27
The bus transit system and its contribution to promoting quality of life, HUSSMANN H., Paris Congress, 1995
"Saubere" öffentliche Verkehrsmittel und geführte Fahrzeuge aufgetrenntem Fahrweg, MÜLLER-HELLMANN A., MexicoConference, 2000
9. Ease of use of light rail systems, CATLING D. - GUILLOSSOU M. -ROVERE G. - STEFANOVIC G., Paris Congress, 1995
Defining the low-floor bus: its advantages and disadvantages,BRECHBÜHL A. - SCHNEIDER W., Stockholm Congress, 1991
10. Funding the Sao Paulo metro: obstacles and opportunities,PEREIRA A. L., PTI 2000/ 1, 4-8
Year one of METEOR operations: an assessment, GRIFFE P., PTI 2000/1, 4-8
11. The importance of multimodal transfer facilities in Hamburg, VON KNOBLOCH A., PTI 1999/1, 30-32
It is easy to change modes in Vienna., SCHEIDEGGER P., PTI 1999/ 1, 42-43
From bus terminals to passenger terminals. 10 years ofdevelopment, NIELSEN B., PTI 1999/ 1, 38-40
References
1-FV cahier compl final (UK) 13/02/02 15:01 Page 50
12. A systems approach to information services in publictransportation, FRANZEN S., Hanover Conference, 2000
Les développements de l'information des voyageurs et de labillétique, AMPELAS A., Conférence de Mexico, 2000
DELFI: The German approach of door-to-door travel information,SCHNITTGER, S., Hanover Conference, 2000
Passenger information in an area-wide, real-time system. Generalexperiences from the GOTIC projects in Gothenburg, KABJÖRNA., Hanover Conference, 2000
Developing a passenger information strategy, WARMAN P.,Hanover Conference, 2000
13. Les développements de l'information des voyageurs et de labillétique, AMPELAS A., Conférence de Mexico, 2000
Smart card ticketing for better statistics on passenger volume and use of these statistics, SO E., Hanover Conference, 2000
The OCTOPUS: Hong Kong’s contactless smartcard project,CHAMBERS B., Bologna Conference, 1998
14. Urban tolls. Dispelling misunderstanding in order to makeheadway, LAUER A., PTI 1996/5, 12-18
Urban transport pricing, VIVIER J., PTI 1999/4, 28-35
La crise du financement des transports publics et ses issuespossibles, BONNAFOUS A., Mexico Conference, 2000
15. Non-user benefits of public transport, TYSON W., PTI 1999, 5, 40-45
Paying for public transport, VIVIER J., In: Public Transport: The Challenge, 1995
Innovative finance. Its contribution to the modernisation of rail-based mass transit, HAGER W., Paris Conference, 1999
16. How to reduce car traffic by land-use-planning, PETERSON B., PTI 1999/1, 19-21
Public transport and land use, VIEGAS J., In: Public Transport: the Challenge, 1995
Co-ordinated housing and transport planning, SCHEIDEGGER P.,PTI 1996/ 3,
PTI = Public Transport International
1-FV cahier compl final (UK) 13/02/02 15:01 Page 51

Best Practice References1. Use of private finance in London and the prospects for using
parking and congestion charging to fund public transportinvestment, MEADS R., Paris Conference , 1999
The funding of Sao Paulo metro lines, SANTOS PEREIRA A. -ALOUCHE P., Paris Conference, 1999
2. Light rail, the city and its people, HUE R., Light rail 1998: Trends
Criteria for the choice of light rail systems, BONZ M. - LOHRMANNK-S. - SCHAFFER H., Budapest Congress, 1989
3. Revitalizing city centres by public transport, FELZ H., BudapestCongress, 1989
Twenty-five years of car restraint in an historic UK city, WILLIAMSR., Toronto Congress, 1999
Accessible city-centres for the 21st century, GENTILE P. –HOWARD D. – PETERSON B., Stockholm Congress, 1991
4 Accessibility to leisure and commercial centres PTI 2001/1
5. Airports as intermodal hubs. The case of Heathrow, DUFF A,Vienna Conference, 1998
Airport rail links: an airport operator’s perspective, GERTLER P. –KIVETT H., Toronto Congress, 1999
Public transport: does an airport need it?, RAZACK K ., Hong KongUITP/APC Congress, 1998
6. It is easy to change modes in Vienna., SCHEIDEGGER P., PTI1999/1, 42-43
Integration of transport modes in the Madrid Region, CRISTOBALPINTO C., Vienna Conference, 1998
Development of an integrated public transport network inLondon’s Docklands, WILLIS J., Toronto Congress, 1999
7. A systems approach to information services in publictransportation, FRANZEN S., Hanover Conference, 2000
Passenger information in an area-wide, real-time system - GOTICprojects in Gothenburg, KABJÖRN A., Hanover Conference, 2000
Les développements de l'information des voyageurs et de labillétique, AMPELAS A., Mexico, 2000
8. Les développements de l'information des voyageurs et de labillétique, AMPELAS A., Mexico Conference, 2000
The OCTOPUS: Hong Kong’s contactless smartcard project,CHAMBER B., Bologna 1998
9.-10.-11.Comparison of light rail transit with bus semi-rapid transit,VUCHIC V., Melbourne LRT Conference, 2000
Kunning Ville phare .... PTI 2000/5
12. Light rail, the city and its people, HUE R., Light rail 1998: Trends
Ease of use of light rail systems, CATLING D. - STEFANOVIC G. -ROVERE G. - GUILLOSSOU M., Paris Congress, 1995
13. The Saarbahn – A new urban and regional rail system in theSaarbrücken area, KLEUDEL W., PTI 1998/4, 25-31
Ease of use of light rail systems, CATLING D. - STEFANOVIC G. -ROVERE G. - GUILLOSSOU M., Paris Congress, 1995
14. Integration of transport modes in the Madrid Region, CRISTOBALPINTO C., Vienna Conference, 1998
Private finance of Madrid metro line 9 extension, PERAL-GUERRAL., Toronto Congress, 1999
15. Who profits from public transport ? Non-user benefits: the hiddentreasures for the community, TYSON W., Stockholm Congress, 1991
Non-user benefits of public transport, TYSON W. , PTI 1999/5, 40-45
PTI = Public Transport International
1-FV cahier compl final (UK) 13/02/02 15:01 Page 52
UITP is the world-wide association of urban and regional passenger transport operators, authorities andsuppliers. With over 2000 members from nearly 80 countries, UITP promotes a better understanding ofpublic transport and acts as the international NETWORK for all transport professionals.
It is a point of REFERENCE for the industry and studies all aspects of mobility to encourage thedevelopment of more efficient and attractive collective passenger transport, and informs its mem-bersof best practises world-wide. It provides research and analysis on all aspects of urban and regionalpassenger transport including infrastructure, rolling stock, organisation and management.
UITP acts as an international FORUM for the transport sector to exchange knowledge and experience tofurther the position of public transport and maintains close contact between the industry, operators andauthorities.
It promotes public transport through close contact with decision-makers and the media to develop afavourable climate of opinion and acts as an ADVOCATE for public transport. It represents the interestsof its members through its dealings with international organisations such as the European Institutions,the UN, the OECD and the World Bank as well as giving its members opportunities to network with othernational and international transport associations.
Further copies of this brochure may be optained from the UUIITTPP GGeenneerraall SSeeccrreettaarriiaattAvenue Herrmann-Debroux 17 •• B-1160 Brussels •• Tel: +32 2 673 61 00 •• Fax: +32 2 660 10 72
E-mail: [email protected] •• Web: http://www.uitp.com
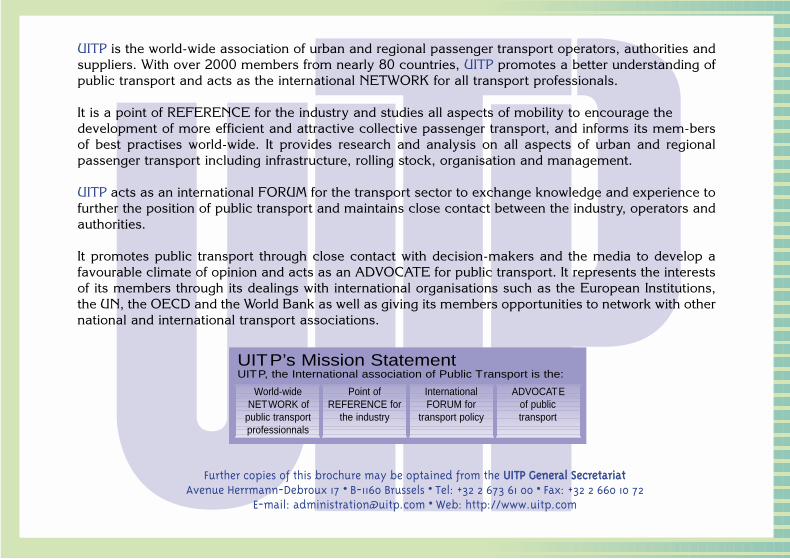
UITP’s Mission StatementUITP, the International association of Public Transport is the:
World-wideNETWORK of
public transportprofessionnals
Point ofREFERENCE for
the industry
InternationalFORUM for
transport policy
ADVOCATE of public transport
0-FV Cover (UK) 13/02/02 12:25 Page 3
Union Internationale des Transports PublicsInternational Association of Public TransportInternationaler Verband für öffentliches Verkehrswesen
Avenue Herrmann-Debroux 17 • B-1160 BrusselsTel: +32 2 673 61 00 • Fax: +32 2 660 10 72E-mail: [email protected] • [email protected] • [email protected]• [email protected] • [email protected]: http://www.uitp.comDépôt légal: D/2001/0105/6
From 15/11/01: rue Sainte Marie 6 • B-1080 Brussels
0-FV Cover (UK) 13/02/02 12:25 Page 4