dynamic stokes shift in green fluorescent protein variants · dynamic stokes shift in green...
TRANSCRIPT
Dynamic Stokes shift in green fluorescentprotein variantsPaul Abbyad, William Childs, Xinghua Shi, and Steven G. Boxer*
Department of Chemistry, Stanford University, Stanford, CA 94305-5080
Edited by Ahmed H. Zewail, California Institute of Technology, Pasadena, CA, and approved October 29, 2007 (received for review July 1, 2007)
Solvent reorganization around the excited state of a chromophoreleads to an emission shift to longer wavelengths during theexcited-state lifetime. This solvation response is absent in wild-type green fluorescent protein, and this has been attributed torigidity in the chromophore’s environment necessary to excludenonradiative transitions to the ground state. The fluorescent pro-tein mPlum was developed via directed evolution by selection forred emission, and we use time-resolved fluorescence to study thedynamic Stokes shift through its evolutionary history. The far-redemission of mPlum is attributed to a picosecond solvation responsethat is observed at all temperatures above the glass transition. Thistime-dependent shift in emission is not observed in its evolution-ary ancestors, suggesting that selective pressure has produced achromophore environment that allows solvent reorganization. Theevolutionary pathway and structures of related fluorescent pro-teins suggest the role of a single residue in close proximity to thechromophore as the primary cause of the solvation response.
GFP � solvation response � ultrafast
The Stokes shift between the absorption and emission of achromophore reflects the displacement in potential surface
between the ground and excited states and loss of vibrationalenergy in the excited state. For chromophores that have a largeincrease in dipole moment between the ground and excited state,the fluorescence emission maximum often depends strongly onsolvent polarity in simple fluid solvents and the emission isobserved to shift to longer wavelengths during the excited-statelifetime. Such dynamic Stokes shifts have been extensivelystudied as a probe of solvent polarity and dynamics (1–3). For achromophore in a protein, the solvent is much more organizedand constrained than in a simple solvent, so the capacity forsolvation is expected to be quite different, yet important forfunction, from that in a simple solvent. There are relatively fewstudies of dynamic Stokes shifts in proteins: a few dye–proteincomplexes (4–7), antibodies bound to fluorescein (8), surfacetryptophan residues as a probe of hydration (9–11), unnaturalamino acids (12, 13), studies on cytochrome c (14, 15), andphotosynthetic antenna complexes (16). In contrast to small-molecule solvents, it should in principle be possible to dissect thecontributions of individual amino acids to the solvation responseof a protein and even its evolutionary history, although such ananalysis has not to our knowledge been reported.
GFPs would seem to be ideal candidates for measurements ofthe dynamic Stokes shift because the chromophore is intrinsic tothe protein and structurally well characterized (17), and the 6- to7-debye change in dipole moment upon excitation of the chro-mophore (18) is as large as for most dyes used to probe solvationdynamics in simple fluid solvents. Furthermore, recent studiesconfirmed that, like conventional solvation probes, the emissionof synthetic GFP chromophores shifts substantially as a functionof solvent polarity (19). Despite these properties, the Stokesshifts in most GFPs are small, suggesting that the environmentin the region around the chromophore is quite rigid. Both thesynthetic GFP chromophore (20) and the chromophore indenatured protein (21) exhibit a very low fluorescence quantumyield, likely because the chromophore undergoes isomerization
and nonfluorescent relaxation when the solvent is f lexible.Consistent with this theory, the isolated chromophore fluores-cence quantum yield increases dramatically if the solvent isfrozen (22), and low temperature and/or high pressure canincrease the quantum yield for GFP variants with intrinsicallylow quantum yields, such as blue fluorescent protein (23). Thus,a high fluorescence quantum yield, which is desirable for nativefunction (and biotechnology), and the conditions of proteinflexibility needed to observe a dynamic Stokes shift appear to bemutually exclusive for GFP variants.
Recently, Wang et al. (24) reported a very red-emittingfluorescent protein named mPlum that was created by a directedevolution strategy. mPlum is derived from DsRed, which wasisolated from Discosoma coral. DsRed displays bright, redfluorescence, but it is a strongly associated tetramer, so its useas a genetic marker is limited. Through a combination of rationaldesign and stepwise random mutagenesis, Tsien and colleagues(10) generated a monomeric version of DsRed known as mo-nomeric red fluorescent protein (mRFP). Wang et al. then usedsomatic hypermutation to generate a huge and diverse library ofmRFP mutants, which were screened for brightness and thereddest possible emission maximum by using a FACS; thereddest populations were subjected to further rounds of directedevolution. In this selection process, the FACS excitation wave-length was fixed at 568 nm, so the selection was not just for a redemitter but also for a large Stokes shift. Interestingly, both mRFPand mPlum absorb maximally at �588 nm, but they emit at 607and 649 nm, respectively. Thus, mPlum has a much larger Stokesshift than is typical for GFPs, and here we investigate the natureof this Stokes shift.
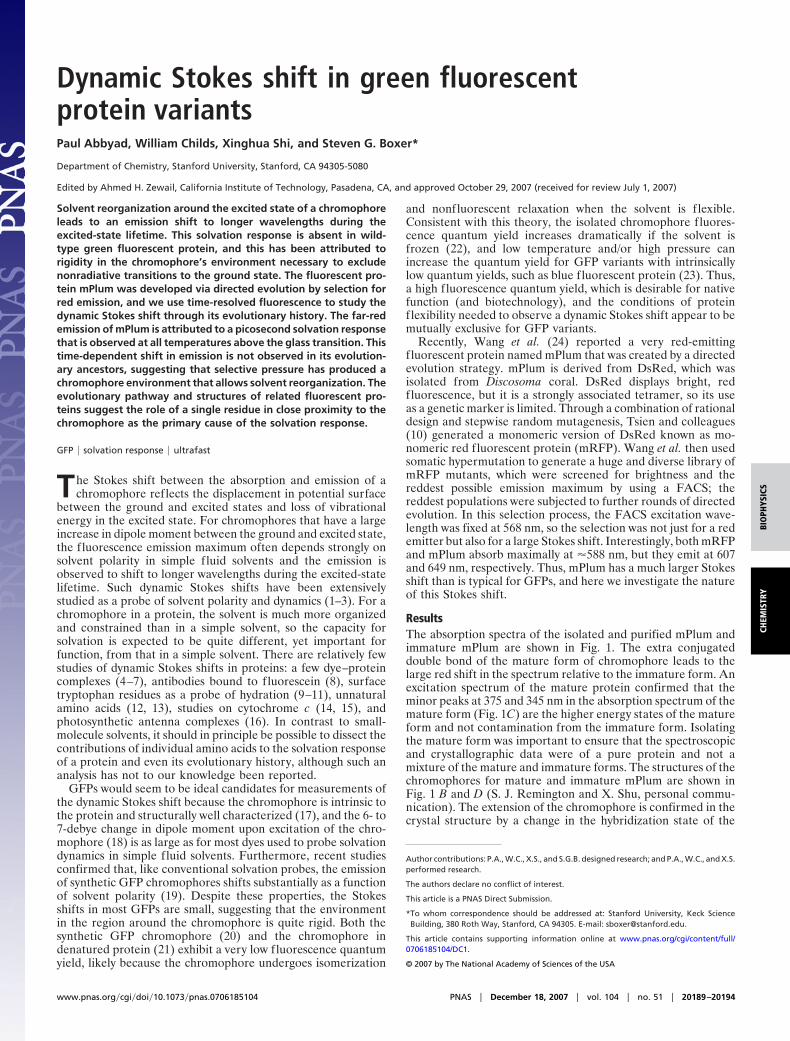
ResultsThe absorption spectra of the isolated and purified mPlum andimmature mPlum are shown in Fig. 1. The extra conjugateddouble bond of the mature form of chromophore leads to thelarge red shift in the spectrum relative to the immature form. Anexcitation spectrum of the mature protein confirmed that theminor peaks at 375 and 345 nm in the absorption spectrum of themature form (Fig. 1C) are the higher energy states of the matureform and not contamination from the immature form. Isolatingthe mature form was important to ensure that the spectroscopicand crystallographic data were of a pure protein and not amixture of the mature and immature forms. The structures of thechromophores for mature and immature mPlum are shown inFig. 1 B and D (S. J. Remington and X. Shu, personal commu-nication). The extension of the chromophore is confirmed in thecrystal structure by a change in the hybridization state of the
Author contributions: P.A., W.C., X.S., and S.G.B. designed research; and P.A., W.C., and X.S.performed research.
The authors declare no conflict of interest.
This article is a PNAS Direct Submission.
*To whom correspondence should be addressed at: Stanford University, Keck ScienceBuilding, 380 Roth Way, Stanford, CA 94305. E-mail: [email protected].
This article contains supporting information online at www.pnas.org/cgi/content/full/0706185104/DC1.
© 2007 by The National Academy of Sciences of the USA
www.pnas.org�cgi�doi�10.1073�pnas.0706185104 PNAS � December 18, 2007 � vol. 104 � no. 51 � 20189–20194
BIO
PHYS
ICS
CHEM
ISTR
Y
exocyclic carbon (indicated by an arrow in Fig. 1) from sp3 to sp2.Neighboring residues to the chromophore, E16 and E215, alsoare shown.
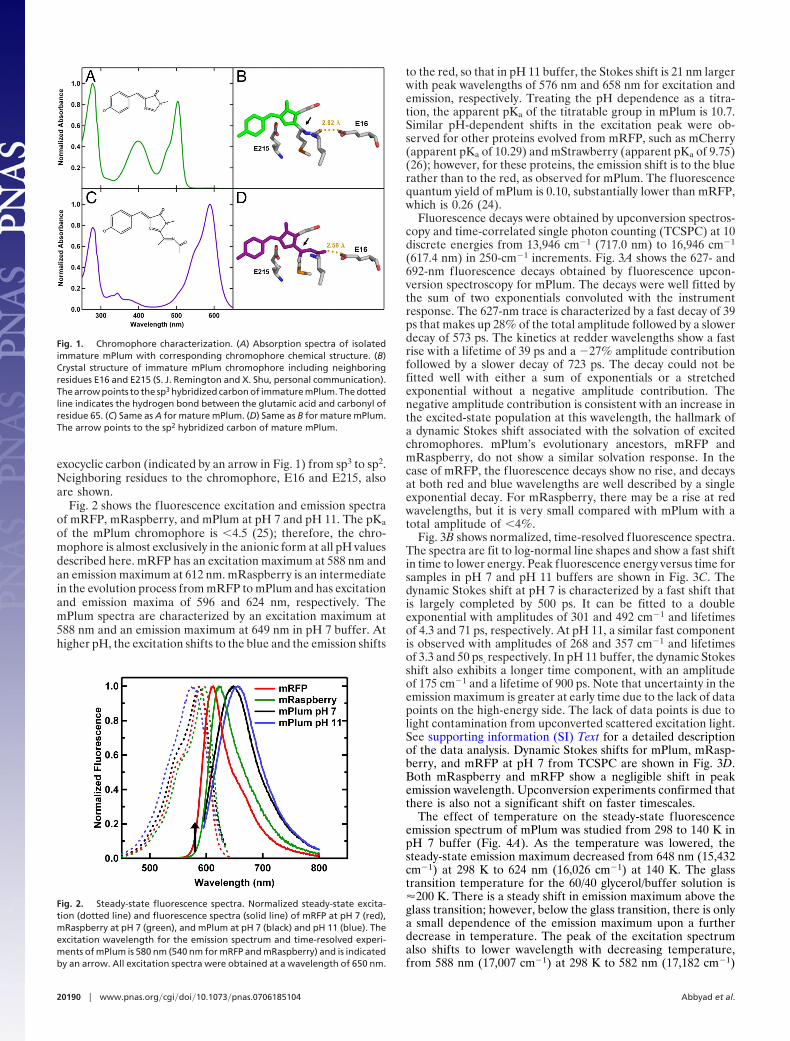
Fig. 2 shows the fluorescence excitation and emission spectraof mRFP, mRaspberry, and mPlum at pH 7 and pH 11. The pKaof the mPlum chromophore is �4.5 (25); therefore, the chro-mophore is almost exclusively in the anionic form at all pH valuesdescribed here. mRFP has an excitation maximum at 588 nm andan emission maximum at 612 nm. mRaspberry is an intermediatein the evolution process from mRFP to mPlum and has excitationand emission maxima of 596 and 624 nm, respectively. ThemPlum spectra are characterized by an excitation maximum at588 nm and an emission maximum at 649 nm in pH 7 buffer. Athigher pH, the excitation shifts to the blue and the emission shifts
to the red, so that in pH 11 buffer, the Stokes shift is 21 nm largerwith peak wavelengths of 576 nm and 658 nm for excitation andemission, respectively. Treating the pH dependence as a titra-tion, the apparent pKa of the titratable group in mPlum is 10.7.Similar pH-dependent shifts in the excitation peak were ob-served for other proteins evolved from mRFP, such as mCherry(apparent pKa of 10.29) and mStrawberry (apparent pKa of 9.75)(26); however, for these proteins, the emission shift is to the bluerather than to the red, as observed for mPlum. The fluorescencequantum yield of mPlum is 0.10, substantially lower than mRFP,which is 0.26 (24).
Fluorescence decays were obtained by upconversion spectros-copy and time-correlated single photon counting (TCSPC) at 10discrete energies from 13,946 cm�1 (717.0 nm) to 16,946 cm�1
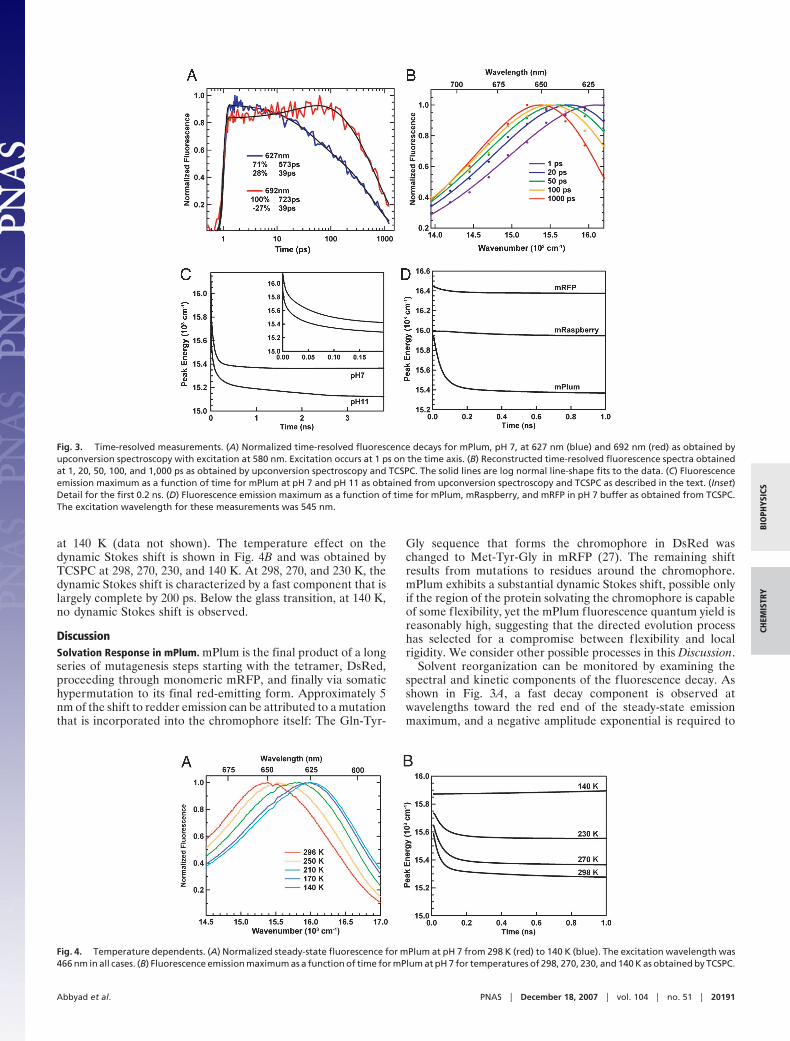
(617.4 nm) in 250-cm�1 increments. Fig. 3A shows the 627- and692-nm fluorescence decays obtained by fluorescence upcon-version spectroscopy for mPlum. The decays were well fitted bythe sum of two exponentials convoluted with the instrumentresponse. The 627-nm trace is characterized by a fast decay of 39ps that makes up 28% of the total amplitude followed by a slowerdecay of 573 ps. The kinetics at redder wavelengths show a fastrise with a lifetime of 39 ps and a �27% amplitude contributionfollowed by a slower decay of 723 ps. The decay could not befitted well with either a sum of exponentials or a stretchedexponential without a negative amplitude contribution. Thenegative amplitude contribution is consistent with an increase inthe excited-state population at this wavelength, the hallmark ofa dynamic Stokes shift associated with the solvation of excitedchromophores. mPlum’s evolutionary ancestors, mRFP andmRaspberry, do not show a similar solvation response. In thecase of mRFP, the fluorescence decays show no rise, and decaysat both red and blue wavelengths are well described by a singleexponential decay. For mRaspberry, there may be a rise at redwavelengths, but it is very small compared with mPlum with atotal amplitude of �4%.
Fig. 3B shows normalized, time-resolved fluorescence spectra.The spectra are fit to log-normal line shapes and show a fast shiftin time to lower energy. Peak fluorescence energy versus time forsamples in pH 7 and pH 11 buffers are shown in Fig. 3C. Thedynamic Stokes shift at pH 7 is characterized by a fast shift thatis largely completed by 500 ps. It can be fitted to a doubleexponential with amplitudes of 301 and 492 cm�1 and lifetimesof 4.3 and 71 ps, respectively. At pH 11, a similar fast componentis observed with amplitudes of 268 and 357 cm�1 and lifetimesof 3.3 and 50 ps, respectively. In pH 11 buffer, the dynamic Stokesshift also exhibits a longer time component, with an amplitudeof 175 cm�1 and a lifetime of 900 ps. Note that uncertainty in theemission maximum is greater at early time due to the lack of datapoints on the high-energy side. The lack of data points is due tolight contamination from upconverted scattered excitation light.See supporting information (SI) Text for a detailed descriptionof the data analysis. Dynamic Stokes shifts for mPlum, mRasp-berry, and mRFP at pH 7 from TCSPC are shown in Fig. 3D.Both mRaspberry and mRFP show a negligible shift in peakemission wavelength. Upconversion experiments confirmed thatthere is also not a significant shift on faster timescales.
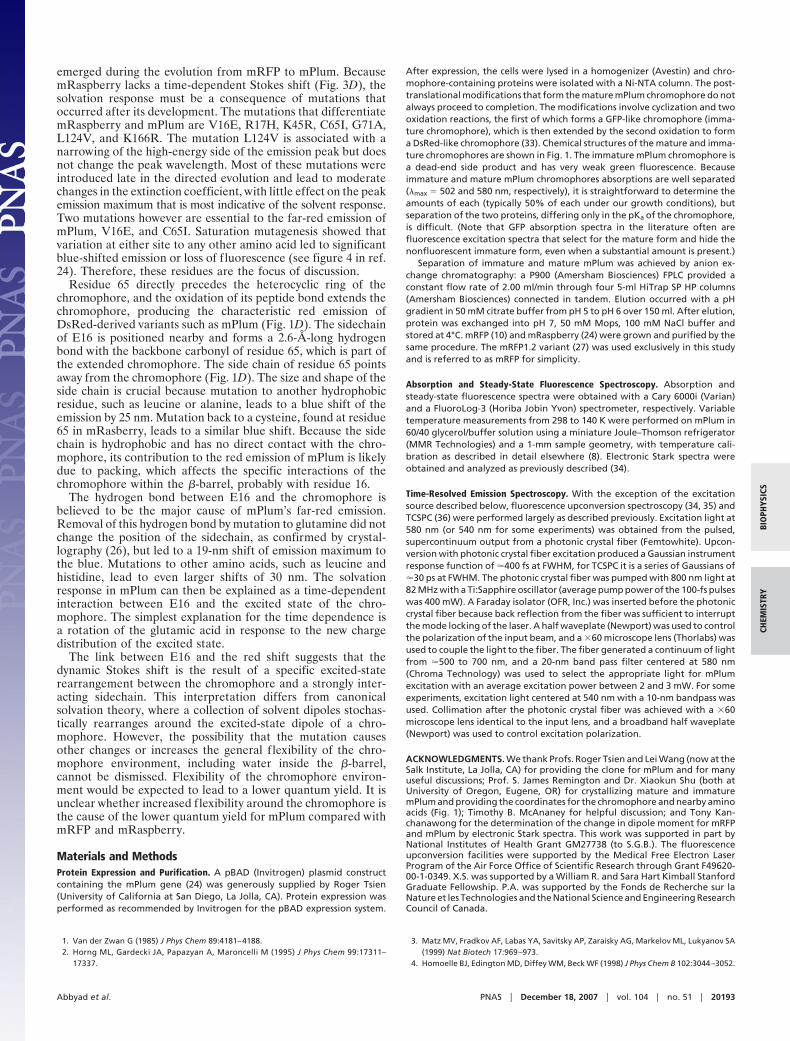
The effect of temperature on the steady-state fluorescenceemission spectrum of mPlum was studied from 298 to 140 K inpH 7 buffer (Fig. 4A). As the temperature was lowered, thesteady-state emission maximum decreased from 648 nm (15,432cm�1) at 298 K to 624 nm (16,026 cm�1) at 140 K. The glasstransition temperature for the 60/40 glycerol/buffer solution is�200 K. There is a steady shift in emission maximum above theglass transition; however, below the glass transition, there is onlya small dependence of the emission maximum upon a furtherdecrease in temperature. The peak of the excitation spectrumalso shifts to lower wavelength with decreasing temperature,from 588 nm (17,007 cm�1) at 298 K to 582 nm (17,182 cm�1)
Fig. 1. Chromophore characterization. (A) Absorption spectra of isolatedimmature mPlum with corresponding chromophore chemical structure. (B)Crystal structure of immature mPlum chromophore including neighboringresidues E16 and E215 (S. J. Remington and X. Shu, personal communication).The arrow points to the sp3 hybridized carbon of immature mPlum. The dottedline indicates the hydrogen bond between the glutamic acid and carbonyl ofresidue 65. (C) Same as A for mature mPlum. (D) Same as B for mature mPlum.The arrow points to the sp2 hybridized carbon of mature mPlum.
Fig. 2. Steady-state fluorescence spectra. Normalized steady-state excita-tion (dotted line) and fluorescence spectra (solid line) of mRFP at pH 7 (red),mRaspberry at pH 7 (green), and mPlum at pH 7 (black) and pH 11 (blue). Theexcitation wavelength for the emission spectrum and time-resolved experi-ments of mPlum is 580 nm (540 nm for mRFP and mRaspberry) and is indicatedby an arrow. All excitation spectra were obtained at a wavelength of 650 nm.
20190 � www.pnas.org�cgi�doi�10.1073�pnas.0706185104 Abbyad et al.
at 140 K (data not shown). The temperature effect on thedynamic Stokes shift is shown in Fig. 4B and was obtained byTCSPC at 298, 270, 230, and 140 K. At 298, 270, and 230 K, thedynamic Stokes shift is characterized by a fast component that islargely complete by 200 ps. Below the glass transition, at 140 K,no dynamic Stokes shift is observed.
DiscussionSolvation Response in mPlum. mPlum is the final product of a longseries of mutagenesis steps starting with the tetramer, DsRed,proceeding through monomeric mRFP, and finally via somatichypermutation to its final red-emitting form. Approximately 5nm of the shift to redder emission can be attributed to a mutationthat is incorporated into the chromophore itself: The Gln-Tyr-
Gly sequence that forms the chromophore in DsRed waschanged to Met-Tyr-Gly in mRFP (27). The remaining shiftresults from mutations to residues around the chromophore.mPlum exhibits a substantial dynamic Stokes shift, possible onlyif the region of the protein solvating the chromophore is capableof some flexibility, yet the mPlum fluorescence quantum yield isreasonably high, suggesting that the directed evolution processhas selected for a compromise between flexibility and localrigidity. We consider other possible processes in this Discussion.
Solvent reorganization can be monitored by examining thespectral and kinetic components of the fluorescence decay. Asshown in Fig. 3A, a fast decay component is observed atwavelengths toward the red end of the steady-state emissionmaximum, and a negative amplitude exponential is required to
Fig. 3. Time-resolved measurements. (A) Normalized time-resolved fluorescence decays for mPlum, pH 7, at 627 nm (blue) and 692 nm (red) as obtained byupconversion spectroscopy with excitation at 580 nm. Excitation occurs at 1 ps on the time axis. (B) Reconstructed time-resolved fluorescence spectra obtainedat 1, 20, 50, 100, and 1,000 ps as obtained by upconversion spectroscopy and TCSPC. The solid lines are log normal line-shape fits to the data. (C) Fluorescenceemission maximum as a function of time for mPlum at pH 7 and pH 11 as obtained from upconversion spectroscopy and TCSPC as described in the text. (Inset)Detail for the first 0.2 ns. (D) Fluorescence emission maximum as a function of time for mPlum, mRaspberry, and mRFP in pH 7 buffer as obtained from TCSPC.The excitation wavelength for these measurements was 545 nm.
Fig. 4. Temperature dependents. (A) Normalized steady-state fluorescence for mPlum at pH 7 from 298 K (red) to 140 K (blue). The excitation wavelength was466 nm in all cases. (B) Fluorescence emission maximum as a function of time for mPlum at pH 7 for temperatures of 298, 270, 230, and 140 K as obtained by TCSPC.
Abbyad et al. PNAS � December 18, 2007 � vol. 104 � no. 51 � 20191
BIO
PHYS
ICS
CHEM
ISTR
Y

accurately fit the data. This rise in fluorescence amplitude on thered side of the band is characteristic of solvent reorganization asthe (protein) environment reorganizes to better solvate thedipolar chromophore excited state. The kinetics are not consis-tent with two noninterconverting species (or species that inter-convert slowly compared with the excited-state lifetime) ofdifferent fluorescence lifetimes because only a population trans-fer, not a difference in lifetime, can produce a rise. Two or morespecies that interconvert on the timescale of the excited-statelifetime could potentially produce the observed kinetics. How-ever, other data argue against this possibility. The shape of theemission spectra (Fig. 2) and the steady-state anisotropy (datanot shown) are the same, irrespective of excitation wavelength.If there were multiple species, it would be likely that each couldbe preferentially excited at different wavelengths, leading tomeasurable differences in fluorescence line shape and/or an-isotropy. The steady-state anisotropy is high (�0.35) and inde-pendent of wavelength; thus, there also is no evidence of a majorreorientation or reaction of the chromophore to a photoactivestate upon excitation. The time-resolved anisotropy obtainedfrom TCSPC that decays with a single exponential lifetime of�14 ns (data not shown) is consistent with the overall rotationalcorrelation time of the protein of 16 ns, which was previouslyreported for WT GFP and S65T GFP (28), and discounts fasterrotation of the entire chromophore with respect to the molecularframe of the protein.
The nature of the fluorescence shift is made clearer by thetime-resolved spectra in Fig. 3B. The data are consistent with achromophore excited state that progresses to lower energy as itbecomes better solvated. Although the shape of the emissionspectrum is largely unchanged as it shifts in energy over time, theFWHM [�(t) in Eq. 7 of SI Text] at pH 7 becomes narrower [from2,350 cm�1 at 10 ps to its final value of �2,000 cm�1 after 500ps; before 10 ps, the lack of data points on the high energy sideof the band leads to poorly defined �(t) and inconsistent resultsbetween data sets]. Some narrowing on a similar time scale andmagnitude also has been observed for a dye in simple solvent (2).This narrowing has been interpreted as an environment that isbecoming more organized and ordered over time, leading toslightly less inhomogeneous broadening (2). Apparently, a sim-ilar process is possible in the interior of a protein.
The dynamic Stokes shift of mPlum at pH 7 occurs on atimescale of tens of picoseconds, with no evidence for furthersolvation on the nanosecond time scale. Fitting the peak energyas a function of time with two exponentials (4.3 ps and 71 ps)(Fig. 3C) yields results that are slower than observed for dyes insimple, f luid, protic solvents (2) and closer to that observed fortryptophan residues on the surface of a protein (10, 29). Thefastest component is likely part of the initial response observedfor dyes in protic solvents (30), a fast reorganization and rotationof the relatively unrestrained solvent and side chains around thechromophore. The magnitude of the initial response is likelyunderestimated given the time resolution of the experiment(instrument response of 400 fs). The solvation response lacks thevery slow components (hundreds of picoseconds to nanosec-onds) reported for some probes buried or partly buried inproteins, such as dye–protein complexes (5, 7, 31) and unnaturalf luorescent amino acids inserted site-specifically at several lo-cations in the sequence of the small protein GB1 (12). However,direct comparison is difficult because, unlike these other sys-tems, mPlum has an intrinsic chromophore that is part of thebackbone and protected deep within the protein’s �-barrel.Therefore, motions that may be possible within a binding pocketor small protein may be inhibited in mPlum at neutral pH. Incontrast, mPlum in pH 11 buffer shows a slow and fast compo-nent. The slow component has a lifetime of �900 ps comparedwith the fast components of 3 and 50 ps. The slower componentat high pH could be caused by the chromophore environment
becoming less rigid as the pH increases. Interestingly, this addedflexibility does not come with a major loss in fluorescencebecause the quantum yield at pH 11 is only slightly lower thanat pH 7.
The solvent response in mPlum that produces its far-redemission is not observed in mRFP, its evolutionary ancestor (Fig.3D). The changes in dipole moment between the ground andexcited state of mRFP and mPlum were determined to be 6 �1 and 5 � 1 debye, respectively, by electronic Stark spectroscopy(data not shown), similar to GFP (18). Therefore, from theperspective of the electrostatic perturbation associated withexcitation, these proteins should be comparable, and the differ-ence in Stokes shift is likely due to the difference in proteinsolvent.
Temperature Dependence. A blue shift in steady-state fluores-cence spectra with decreasing temperature has been attributedto solvation in both small, f luorescent dyes in simple solvents andfluorescent probes in proteins. For dyes in simple solvents, whenthe temperature is decreased, solvation is slowed due to anincrease in viscosity. When the rate of solvation approaches theinverse of the lifetime of the dye, there is a significant contri-bution to the steady-state spectrum from higher-energy, partiallysolvated configurations leading to a blue shift in the steady-statespectra at low temperatures. In the few studies of fluorescentprobes located in the protein interior, the steady-state spectraalso have been shown to shift to higher energy at lower tem-peratures (5, 32); however, in contrast to simple solvents, studieson a dye–apomyglobin complex showed that, within the studiedtemperature range of 243–298 K, the rate and magnitude of thesolvation response was largely independent of temperature (5).Instead, it was the initial and final emission energies that appearto change with temperature.
As the temperature is lowered, the mPlum steady-state fluo-rescence emission maximum shifts to higher energy (Fig. 4A).This observation can be explained by one of two models. Theinitial and long-time emission energy may be temperature-dependent. In this case, the protein structure would change withtemperature, and we would observe the solvation responsebetween different protein conformations at different tempera-tures. Alternatively, the initial emission energy may be temper-ature-independent, but the magnitude of the fast dielectricresponse that occurs on the timescale of our instrument responsemay be temperature-dependent. In this case, we may not observethe very fast solvation component, and it would appear as if thesolvation response originated from a lower energy state. Thetime-zero and long-time emission energies increase with de-creasing temperature (Fig. 4B). However, the rate of the ob-served solvent reorganization is largely temperature-indepen-dent, and a fast solvation component is observed for alltemperatures above the glass transition. At 140 K, below theglass transition, no time-dependent Stokes shift is observed. Thefinal emission energies can be confidently determined as allsolvation occurring in the first few hundreds of picoseconds, wellwithin the 12-ns measurement window. The lack of appreciablechange in the rate of solvation is consistent with a buriedchromophore that is largely isolated from the large change inbulk solvent viscosity. The change in steady-state emissionspectra can be understood as a change in the final emitting statethat is the result of either a temperature-dependent proteinstructure or a temperature-dependent magnitude of the initialsolvation response.
Structural Correlation. Because mPlum was created through acombination of design and in situ evolution and we have severalof its ancestors in hand, this system offers a unique opportunityto dissect the contributions to spectral shifts and the dynamicStokes shift. mRaspberry is particularly useful because it
20192 � www.pnas.org�cgi�doi�10.1073�pnas.0706185104 Abbyad et al.
emerged during the evolution from mRFP to mPlum. BecausemRaspberry lacks a time-dependent Stokes shift (Fig. 3D), thesolvation response must be a consequence of mutations thatoccurred after its development. The mutations that differentiatemRaspberry and mPlum are V16E, R17H, K45R, C65I, G71A,L124V, and K166R. The mutation L124V is associated with anarrowing of the high-energy side of the emission peak but doesnot change the peak wavelength. Most of these mutations wereintroduced late in the directed evolution and lead to moderatechanges in the extinction coefficient, with little effect on the peakemission maximum that is most indicative of the solvent response.Two mutations however are essential to the far-red emission ofmPlum, V16E, and C65I. Saturation mutagenesis showed thatvariation at either site to any other amino acid led to significantblue-shifted emission or loss of fluorescence (see figure 4 in ref.24). Therefore, these residues are the focus of discussion.
Residue 65 directly precedes the heterocyclic ring of thechromophore, and the oxidation of its peptide bond extends thechromophore, producing the characteristic red emission ofDsRed-derived variants such as mPlum (Fig. 1D). The sidechainof E16 is positioned nearby and forms a 2.6-Å-long hydrogenbond with the backbone carbonyl of residue 65, which is part ofthe extended chromophore. The side chain of residue 65 pointsaway from the chromophore (Fig. 1D). The size and shape of theside chain is crucial because mutation to another hydrophobicresidue, such as leucine or alanine, leads to a blue shift of theemission by 25 nm. Mutation back to a cysteine, found at residue65 in mRasberry, leads to a similar blue shift. Because the sidechain is hydrophobic and has no direct contact with the chro-mophore, its contribution to the red emission of mPlum is likelydue to packing, which affects the specific interactions of thechromophore within the �-barrel, probably with residue 16.
The hydrogen bond between E16 and the chromophore isbelieved to be the major cause of mPlum’s far-red emission.Removal of this hydrogen bond by mutation to glutamine did notchange the position of the sidechain, as confirmed by crystal-lography (26), but led to a 19-nm shift of emission maximum tothe blue. Mutations to other amino acids, such as leucine andhistidine, lead to even larger shifts of 30 nm. The solvationresponse in mPlum can then be explained as a time-dependentinteraction between E16 and the excited state of the chro-mophore. The simplest explanation for the time dependence isa rotation of the glutamic acid in response to the new chargedistribution of the excited state.
The link between E16 and the red shift suggests that thedynamic Stokes shift is the result of a specific excited-staterearrangement between the chromophore and a strongly inter-acting sidechain. This interpretation differs from canonicalsolvation theory, where a collection of solvent dipoles stochas-tically rearranges around the excited-state dipole of a chro-mophore. However, the possibility that the mutation causesother changes or increases the general f lexibility of the chro-mophore environment, including water inside the �-barrel,cannot be dismissed. Flexibility of the chromophore environ-ment would be expected to lead to a lower quantum yield. It isunclear whether increased flexibility around the chromophore isthe cause of the lower quantum yield for mPlum compared withmRFP and mRaspberry.
Materials and MethodsProtein Expression and Purification. A pBAD (Invitrogen) plasmid constructcontaining the mPlum gene (24) was generously supplied by Roger Tsien(University of California at San Diego, La Jolla, CA). Protein expression wasperformed as recommended by Invitrogen for the pBAD expression system.
After expression, the cells were lysed in a homogenizer (Avestin) and chro-mophore-containing proteins were isolated with a Ni-NTA column. The post-translational modifications that form the mature mPlum chromophore do notalways proceed to completion. The modifications involve cyclization and twooxidation reactions, the first of which forms a GFP-like chromophore (imma-ture chromophore), which is then extended by the second oxidation to forma DsRed-like chromophore (33). Chemical structures of the mature and imma-ture chromophores are shown in Fig. 1. The immature mPlum chromophore isa dead-end side product and has very weak green fluorescence. Becauseimmature and mature mPlum chromophores absorptions are well separated(�max � 502 and 580 nm, respectively), it is straightforward to determine theamounts of each (typically 50% of each under our growth conditions), butseparation of the two proteins, differing only in the pKa of the chromophore,is difficult. (Note that GFP absorption spectra in the literature often arefluorescence excitation spectra that select for the mature form and hide thenonfluorescent immature form, even when a substantial amount is present.)
Separation of immature and mature mPlum was achieved by anion ex-change chromatography: a P900 (Amersham Biosciences) FPLC provided aconstant flow rate of 2.00 ml/min through four 5-ml HiTrap SP HP columns(Amersham Biosciences) connected in tandem. Elution occurred with a pHgradient in 50 mM citrate buffer from pH 5 to pH 6 over 150 ml. After elution,protein was exchanged into pH 7, 50 mM Mops, 100 mM NaCl buffer andstored at 4°C. mRFP (10) and mRaspberry (24) were grown and purified by thesame procedure. The mRFP1.2 variant (27) was used exclusively in this studyand is referred to as mRFP for simplicity.
Absorption and Steady-State Fluorescence Spectroscopy. Absorption andsteady-state fluorescence spectra were obtained with a Cary 6000i (Varian)and a FluoroLog-3 (Horiba Jobin Yvon) spectrometer, respectively. Variabletemperature measurements from 298 to 140 K were performed on mPlum in60/40 glycerol/buffer solution using a miniature Joule–Thomson refrigerator(MMR Technologies) and a 1-mm sample geometry, with temperature cali-bration as described in detail elsewhere (8). Electronic Stark spectra wereobtained and analyzed as previously described (34).
Time-Resolved Emission Spectroscopy. With the exception of the excitationsource described below, fluorescence upconversion spectroscopy (34, 35) andTCSPC (36) were performed largely as described previously. Excitation light at580 nm (or 540 nm for some experiments) was obtained from the pulsed,supercontinuum output from a photonic crystal fiber (Femtowhite). Upcon-version with photonic crystal fiber excitation produced a Gaussian instrumentresponse function of �400 fs at FWHM, for TCSPC it is a series of Gaussians of�30 ps at FWHM. The photonic crystal fiber was pumped with 800 nm light at82 MHz with a Ti:Sapphire oscillator (average pump power of the 100-fs pulseswas 400 mW). A Faraday isolator (OFR, Inc.) was inserted before the photoniccrystal fiber because back reflection from the fiber was sufficient to interruptthe mode locking of the laser. A half waveplate (Newport) was used to controlthe polarization of the input beam, and a �60 microscope lens (Thorlabs) wasused to couple the light to the fiber. The fiber generated a continuum of lightfrom �500 to 700 nm, and a 20-nm band pass filter centered at 580 nm(Chroma Technology) was used to select the appropriate light for mPlumexcitation with an average excitation power between 2 and 3 mW. For someexperiments, excitation light centered at 540 nm with a 10-nm bandpass wasused. Collimation after the photonic crystal fiber was achieved with a �60microscope lens identical to the input lens, and a broadband half waveplate(Newport) was used to control excitation polarization.
ACKNOWLEDGMENTS. We thank Profs. Roger Tsien and Lei Wang (now at theSalk Institute, La Jolla, CA) for providing the clone for mPlum and for manyuseful discussions; Prof. S. James Remington and Dr. Xiaokun Shu (both atUniversity of Oregon, Eugene, OR) for crystallizing mature and immaturemPlum and providing the coordinates for the chromophore and nearby aminoacids (Fig. 1); Timothy B. McAnaney for helpful discussion; and Tony Kan-chanawong for the determination of the change in dipole moment for mRFPand mPlum by electronic Stark spectra. This work was supported in part byNational Institutes of Health Grant GM27738 (to S.G.B.). The fluorescenceupconversion facilities were supported by the Medical Free Electron LaserProgram of the Air Force Office of Scientific Research through Grant F49620-00-1-0349. X.S. was supported by a William R. and Sara Hart Kimball StanfordGraduate Fellowship. P.A. was supported by the Fonds de Recherche sur laNature et les Technologies and the National Science and Engineering ResearchCouncil of Canada.
1. Van der Zwan G (1985) J Phys Chem 89:4181–4188.2. Horng ML, Gardecki JA, Papazyan A, Maroncelli M (1995) J Phys Chem 99:17311–
17337.
3. Matz MV, Fradkov AF, Labas YA, Savitsky AP, Zaraisky AG, Markelov ML, Lukyanov SA(1999) Nat Biotech 17:969–973.
4. Homoelle BJ, Edington MD, Diffey WM, Beck WF (1998) J Phys Chem B 102:3044–3052.
Abbyad et al. PNAS � December 18, 2007 � vol. 104 � no. 51 � 20193
BIO
PHYS
ICS
CHEM
ISTR
Y

5. Pierce D, Boxer SG (1992) J Phys Chem 96:5560–5566.6. Sahu K, Mondal SK, Ghosh S, Roy D, Bhattacharyya K (2006) J Chem Phys 124:124909.7. Bashkin JS (1990) J Phys Chem 94:4757–4761.8. Zimmermann J, Oakman EL, Thorpe IF, Shi X, Abbyad P, Brooks CL, III, Boxer SG,
Romesberg FE (2006) Proc Natl Acad Sci USA 103:13722–13727.9. Bhattacharyya SM, Wang ZG, Zewail AH (2003) J Phys Chem B 107:13218–13228.
10. Campbell RE, Tour O, Palmer AE, Steinbach PA, Baird GS, Zacharias DA, Tsien RY (2002)Proc Natl Acad Sci USA 99:7877–7882.
11. Lu WY, Kim J, Qiu WH, Zhong DP (2004) Chem Phys Lett 388:120–126.12. Cohen BE, McAnaney TB, Park SE, Jan YN, Boxer SG, Jan LY (2002) Science 296:1700–
1703.13. Abbyad P, Shi X, Childs W, McAnaney TB, Cohen BE, Boxer SG (2007) J Phys Chem B
111:8269–8276.14. Lampa-Pastirk S, Lafuente RC, Beck WF (2004) J Phys Chem B 108:12602–12607.15. Lampa-Pastirk S, Beck WF (2004) J Phys Chem B 108:16288–16294.16. Owens TG, Webb SP, Alberte RS, Mets L, Fleming GR (1988) Biophys J 53:733–745.17. Ormo, M., Cubitt AB, Kallio K, Gross LA, Tsien RY, Remington SJ (1996) Science
273:1392–1395.18. Bublitz G, King BA, Boxer SG (1998) J Am Chem Soc 120:9370–9371.19. Dong J, Solntsev KM, Tolbert LM (2006) J Am Chem Soc 128:12038–12039.20. Webber NM, Litvinenko KL, Meech SR (2001) J Phys Chem B 105:8036–8039.21. Ward WW, Bokman SH (1982) Biochemistry 21:4535–4540.22. Sharafy S, Muszkat KA (1971) J Am Chem Soc 93:4119–4125.
23. Mauring K, Deich J, Rosell FI, McAnaney TB, Moerner WE, Boxer SG (2005) J Phys ChemB 109:12976–12981.
24. Wang L, Jackson WC, Steinbach PA, Tsien RY (2004) Proc Natl Acad Sci USA 101:16745–16749.
25. Shaner NC, Steinbach PA, Tsien RY (2005) Nat Methods 2:905–909.26. Shu X, Shaner NC, Yarbrough CA, Tsien RY, Remington SJ (2006) Biochemistry 45:9639–
9647.27. Shaner NC, Campbell RE, Steinbach PA, Giepmans BNG, Palmer AE, Tsien RY (2004) Nat
Biotech 22:1567–1572.28. Volkmer A, Subramaniam V, Birch DJS, Jovin TM (2000) Biophys J 78:1589–1598.29. Peon J, Pal SK, Zewail AH (2002) Proc Natl Acad Sci USA 99:10964–10969.30. Jimenez R, Fleming GR, Kumar PV, Maroncelli M (1994) Nature 369:471–473.31. Jordanides XJ, Lang MJ, Song XY, Fleming GR (1999) J Phys Chem B 103:7995–8005.32. Vincent M, Gilles AM, Li de laSierra IM, Briozzo P, Barzu O, Gallay J (2000) J Phys Chem
B 104:11286–11295.33. Gross LA, Baird GS, Hoffman RC, Baldridge KK, Tsien RY (2000) Proc Natl Acad Sci USA
97:11990–11995.34. Chattoraj M, King BA, Bublitz GU, Boxer SG (1996) Proc Natl Acad Sci USA 93:8362–
8367.35. Stanley RJ, Boxer SG (1995) J Phys Chem 99:859–863.36. McAnaney TB, Zeng W, Doe CFE, Bhanji N, Wakelin S, Pearson DS, Abbyad P, Shi X,
Boxer SG, Bagshaw CR (2005) Biochemistry 44:5510–5524.
20194 � www.pnas.org�cgi�doi�10.1073�pnas.0706185104 Abbyad et al.