waterlogging in australian agricultural landscapes: a review of plant responses and crop models
TRANSCRIPT

Waterlogging in Australian agricultural landscapes:a review of plant responses and crop models
Ruth E. ShawA,C, Wayne S. MeyerA, Ann McNeillB, and Stephen D. TyermanB
ASchool of Earth & Environmental Sciences, The University of Adelaide, Glen Osmond, SA 5064, Australia.BSchool of Agriculture Food and Wine, The University of Adelaide, Glen Osmond, SA 5064, Australia.CCorresponding author. Email: [email protected]
Abstract. This review summarises reported observations of the effects of waterlogging on agricultural production inAustralia and briefly discusses potential remediation strategies. Inconsistencies are demonstrated in the current indicatorsused for assessment of waterlogging potential across agricultural landscapes as well as in parameters measured inwaterlogging studies. It is suggested that predictions of waterlogging potential for landscapes should be based on aminimum dataset that includes pedological, topographical, and climate data for the defined area, as well as observations ofplant morphological appearance and visible surface water. The review also summarises the effects of low oxygenconcentration in soil on rhizosphere processes, and discusses evidence for direct effects on plant physiology ofreductions in soil oxygen caused by waterlogging. Finally, the review describes current crop growth, water use, andyield simulation models used in Australia (SWAGMAN, DRAINMOD, and APSIM) that incorporate waterloggingstress. It is suggested that there is scope for modifications to these models based on recent improved understanding ofplant physiological responses to waterlogging and on further research. The review concludes that improvements inmodelling waterlogging outcomes to assist growth and yield predictions should ultimately enhance managementcapacity for growers.
Additional keywords: raised bed, drainage, aquaporin, hydraulic conductivity, soil aeration, economics.
Received 4 March 2013, accepted 23 July 2013, published online 30 August 2013
Introduction
Waterlogging in Australia undoubtedly causes economic lossesin all areas of agricultural production, including cotton (Bangeet al. 2004; Reicosky et al. 1985), grains (Grieve et al. 1986;McFarlane et al. 1989), and pastures (Jerrems and Hill 1999).Indeed, potential economic losses in Australia due to effects ofwaterlogging have been reported to be AU$300million perannum for wheat alone (Dennis et al. 2000). However, there issubstantial uncertainty associated with these estimates of yieldloss due to differences in the way that areas affected bywaterlogging are defined. The assessments of areas affectedare often based on direct observations, such as surface water,or are extrapolated using parameters that are indirectly related tooccurrence of waterlogging, such as soil characteristics. Hence,different jurisdictions report assessments of waterlogging indifferent ways. For example in Western Australia’s grain belt,1.8Mha of soils are described as ‘periodically waterlogged’(Khabaz-Saberi et al. 2010), whereas in Victoria ~4Mha ofsoils are considered as having the ‘potential’ to cause cropyield loss as a result of waterlogging (Setter and Waters 2003).Yield loss due to waterlogging may be over- or under-estimated,since ‘susceptible areas’ are highly unlikely to be uniformly orequally affected, and saturated soils are not always apparentfrom surface evaluation.
There is also a scarcity of reported biophysical data inAustralia regarding crop responses to waterlogging, such aswilting or yellowing of leaves or reduced leaf and shootgrowth, and rarely have the same parameters been reportedacross studies. Furthermore, assessments focus on plantobservations only (Reicosky et al. 1985) or solely on soilparameters (Grieve et al. 1986; MacEwan et al. 1992; Davieset al. 2000; Fitzpatrick et al. 2003) and less commonly on thesoil–plant system (Reicosky et al. 1985; Grieve et al. 1986;McDonald and Gardner 1987; McFarlane et al. 1989;MacEwan et al. 1992; McDonald 1995; Jerrems and Hill1999; Davies et al. 2000; Bange et al. 2004; Milroy andBange 2013). Improved assessment may be possible throughthe use of simulation modelling that has the potential to assignyield reductions to particular stresses. The success of thisapproach will depend on the accuracy of the representation ofwaterlogging processes within the models. Common cropgrowth models used in Australia have limited representation ofplant physiological responses under waterlogged conditions.The models use rudimentary knowledge of plant responses towaterlogging that was formulated more than two decades ago,with little evidence of review in recent times. Indeed, the mostrecent Australian review of waterlogging, undertaken >20 yearsago,was limited to theMurrayValley region ofNewSouthWales
Journal compilation � CSIRO 2013 www.publish.csiro.au/journals/cp
CSIRO PUBLISHING
Crop & Pasture Science, 2013, 64, 549–562 Reviewhttp://dx.doi.org/10.1071/CP13080

and focussed solely on the soil system in that irrigated landscape(Grieve et al. 1986).
The condition of waterlogging is commonly described whenthere is obvious saturated soil and/ or water ponded on the soilsurface. Waterlogging can occur either where there is a risingwatertable or from continuous addition of water to the surface,for example during irrigation or high-intensity rainfall wheresoils have slow drainage. Reductions in crop growth and yieldfrom excess water in soil can be broadly attributed to three maininfluences that are discussed in this review: (i) the direct effect onplant physiological processes from low oxygen concentrationsin the soil around roots (rhizosphere); (ii) changes in soilchemistry and reduced nutrient availability resulting intoxicities of some elements and deficiencies of others; and(iii) changes in microbial activity affecting normal rhizosphereprocesses. All three are primarily a consequence of anoxicconditions in soil. Although salinisation of soils can occur inconjunction with waterlogging (Aubertin et al. 1968; West andTaylor 1979), this review focuses on effects of waterloggingper se on plants.
The review first summarises reported observations of theeffects of waterlogging on agricultural production in Australiaand briefly discusses potential remediation strategies. Currentindicators used in assessment of waterlogging potential acrossagricultural landscapes, as well as parameters measured in fieldstudies of waterlogging, are discussed. Second, the reviewcomments on the effects of low soil oxygen concentration onrhizosphere processes, along with evidence for the direct effectsof low oxygen on plant physiology caused by waterlogging,including a proposed link between changed aquaporin activity,a reduction in root hydraulic conductance, and leaf wilting.Third, the review discusses current crop growth, water use,and yield simulation models that can incorporate waterloggingstress, and the potential for modifications given recent improvedunderstanding of root water-uptake processes.
Occurrence and potential for waterlogging in Australia
When water from rainfall or irrigation exceeds the net watermovement out of the soil profile, soil pores will become water-filled, displacing soil air and becoming ‘waterlogged’.Waterlogging can occur in both irrigated and rainfed areas, butit is more prevalent in irrigated areas (Cannell 1977), wherethere is a greater chance of extra water from rain or additionalirrigation on already wet soils. Many irrigated areas developshallow ground water (Grieve et al. 1986), and consequently, thevolume of the unsaturated soil zone is less than in an equivalentrainfed area.
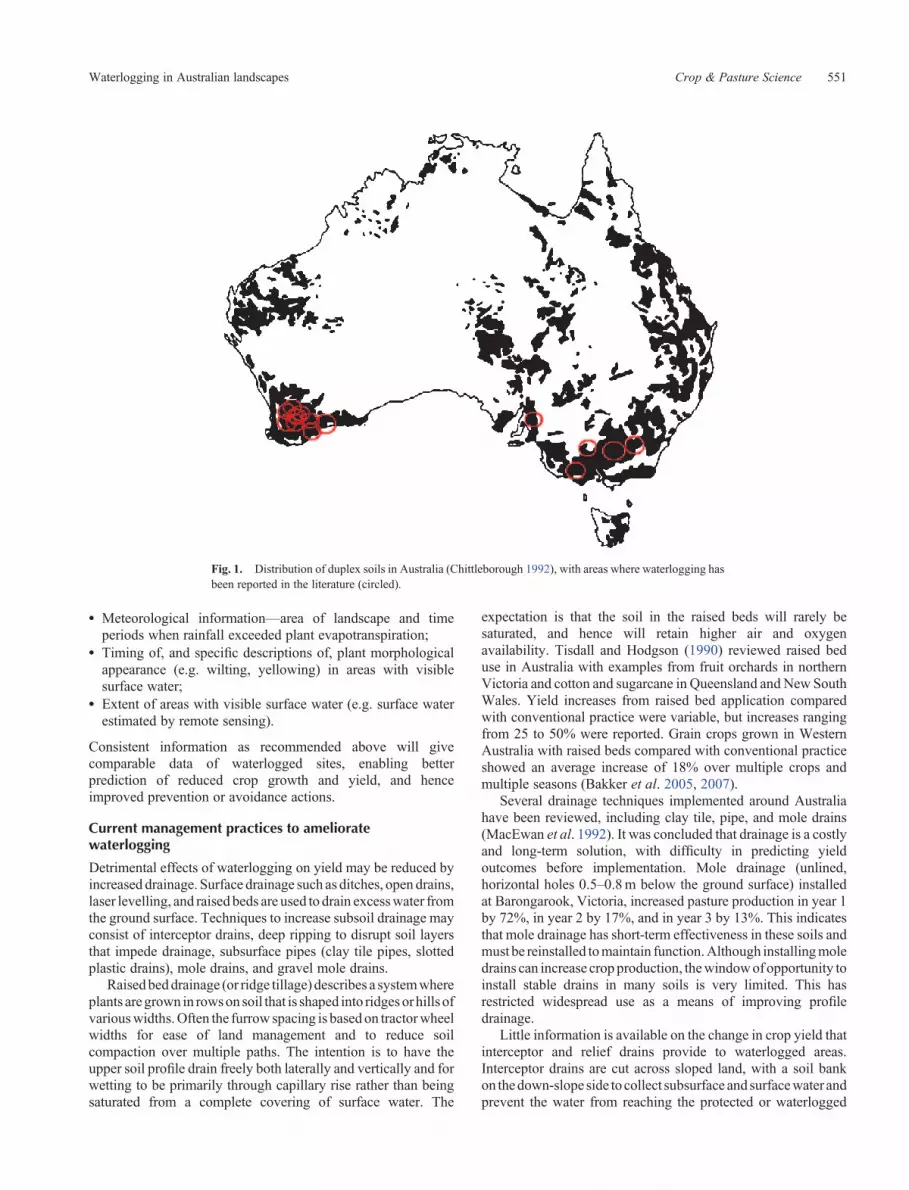
Waterlogging is common in duplex (or texture contrast) soils(Cannell 1977; Dracup et al. 1992; MacEwan et al. 1992;McFarlane and Cox 1992; Hatton et al. 2002; Setter andWaters 2003) due to poor drainage. Duplex soils have a highor moderately high hydraulically conductive soil layer above alow hydraulically conductive soil layer. The extreme example isa coarse sand layer over clay subsoil. Drainage through such asoil profile is controlled by the layer with the lowest hydraulicconductivity, often the clay layer. Duplex soils are widespreadin Australia, covering ~20% of the landscape (Chittleborough1992).These areas with duplex soils correspond closely to those
reported to be prone to waterlogging, as indicated by theoverlying circles depicted in Fig. 1.
Waterlogging effects on crop yield and economics
A comparison of the parameters measured during fieldobservations of waterlogging at locations around Australiaover the past two decades highlights the paucity of consistentdata, with no single measurement common to all studies,surprisingly, not even percentage yield reduction(Table 1). This lack of consistency makes it difficult togeneralise expected crop responses that could subsequently beobserved and linked to measured crop yield reduction. Thesummarised yield reduction and economic loss data(Table 2) are discussed in this section, along with availablepertinent information regarding soil type, rainfall, and plantmorphological observations.
Several common factors are recorded in field studies ofwaterlogging, including soil properties and rainfall events.Details of soil properties and of whether profiles are duplexare commonly reported (Grieve et al. 1986; McFarlane et al.1989; MacEwan et al. 1992; Siddique et al. 1993; Davies et al.2000; Milroy et al. 2009; Milroy and Bange 2013), although thedifferentiation between sloped or flat land is rarely recorded(McDonald 1995; Reicosky et al. 1985). Heavy rainfall(>360mm) during the winter months of June, July, andAugust or rainfall exceeding evapotranspiration (Grieve et al.1986; McDonald and Gardner 1987; McFarlane et al. 1989;Siddique et al. 1993; McDonald 1995; Davies et al. 2000) iscommonly recorded.
A limited number of studies discuss crop morphologicalresponses or observations due to the effects of waterlogging(Table 1). Leaf growth reduction and wilting have beenrecorded (Reicosky et al. 1985), but more commonly recordedis that waterlogging causes crop disease (McFarlane et al. 1989;Siddique et al. 1993); consequently, the disease and change innutrient status results in leaf chlorosis and necrosis (McDonald1995). Differences in waterlogging tolerances between differentspecies have been reported (Davies et al. 2000), as havedifferences even between closely related species; for example,yellow lupin (Lupinus luteus) tolerates waterlogging better thannarrow-leafed lupin (L. angustifolius). Crop yield reductions ashigh as 80% have been recorded (MacEwan et al. 1992), whilstannual economic losses up to $11million in the state of WesternAustralia have been reported (McFarlane et al. 1989).
This review of Australian field research into waterloggingover the last 20 years revealed that there are very fewphysiological criteria routinely used to assess waterlogging inthe field (Table 1). One advantage to measuring such parametersis that the information could be used to improve models thatsimulate effects of waterlogging (as discussed later), and thusimprove the capacity to better predict reduced crop growth andyield. Further, we suggest that predictions of the potential forwaterlogging in landscapes should be based on the followingminimum dataset:
* Soil profile information—proportion of the area underconsideration that has duplex soils;
* Topographical data—slope and proportion of the area on thedownside of slopes;
550 Crop & Pasture Science R. E. Shaw et al.
* Meteorological information—area of landscape and timeperiods when rainfall exceeded plant evapotranspiration;
* Timing of, and specific descriptions of, plant morphologicalappearance (e.g. wilting, yellowing) in areas with visiblesurface water;
* Extent of areas with visible surface water (e.g. surface waterestimated by remote sensing).
Consistent information as recommended above will givecomparable data of waterlogged sites, enabling betterprediction of reduced crop growth and yield, and henceimproved prevention or avoidance actions.
Current management practices to amelioratewaterlogging
Detrimental effects of waterlogging on yield may be reduced byincreased drainage. Surface drainage such as ditches, open drains,laser levelling, and raised beds are used to drain excesswater fromthe ground surface. Techniques to increase subsoil drainage mayconsist of interceptor drains, deep ripping to disrupt soil layersthat impede drainage, subsurface pipes (clay tile pipes, slottedplastic drains), mole drains, and gravel mole drains.
Raisedbeddrainage (or ridge tillage) describes a systemwhereplants aregrown in rowsonsoil that is shaped into ridges orhills ofvariouswidths.Often the furrow spacing is basedon tractorwheelwidths for ease of land management and to reduce soilcompaction over multiple paths. The intention is to have theupper soil profile drain freely both laterally and vertically and forwetting to be primarily through capillary rise rather than beingsaturated from a complete covering of surface water. The
expectation is that the soil in the raised beds will rarely besaturated, and hence will retain higher air and oxygenavailability. Tisdall and Hodgson (1990) reviewed raised beduse in Australia with examples from fruit orchards in northernVictoria and cotton and sugarcane in Queensland and New SouthWales. Yield increases from raised bed application comparedwith conventional practice were variable, but increases rangingfrom 25 to 50% were reported. Grain crops grown in WesternAustralia with raised beds compared with conventional practiceshowed an average increase of 18% over multiple crops andmultiple seasons (Bakker et al. 2005, 2007).
Several drainage techniques implemented around Australiahave been reviewed, including clay tile, pipe, and mole drains(MacEwan et al. 1992). It was concluded that drainage is a costlyand long-term solution, with difficulty in predicting yieldoutcomes before implementation. Mole drainage (unlined,horizontal holes 0.5–0.8m below the ground surface) installedat Barongarook, Victoria, increased pasture production in year 1by 72%, in year 2 by 17%, and in year 3 by 13%. This indicatesthat mole drainage has short-term effectiveness in these soils andmust be reinstalled tomaintain function.Although installingmoledrains can increase crop production, thewindowof opportunity toinstall stable drains in many soils is very limited. This hasrestricted widespread use as a means of improving profiledrainage.
Little information is available on the change in crop yield thatinterceptor and relief drains provide to waterlogged areas.Interceptor drains are cut across sloped land, with a soil bankon thedown-slope side tocollect subsurface andsurfacewater andprevent the water from reaching the protected or waterlogged
Fig. 1. Distribution of duplex soils in Australia (Chittleborough 1992), with areas where waterlogging hasbeen reported in the literature (circled).
Waterlogging in Australian landscapes Crop & Pasture Science 551
area. Relief drains are cut down a slope or on flat land to channelwater. The water intercepted from interceptor drains has beenused to predict crop response down-slope of the drains (Cox andNegus 1985). An increase in oat (Avena sativa L.) yields due tointerceptor drains was recorded and it was noted that drainspacing plays an important role in the efficiency of drains forinterceptingwater and therefore increasing cropyield (McFarlaneand Cox 1990).
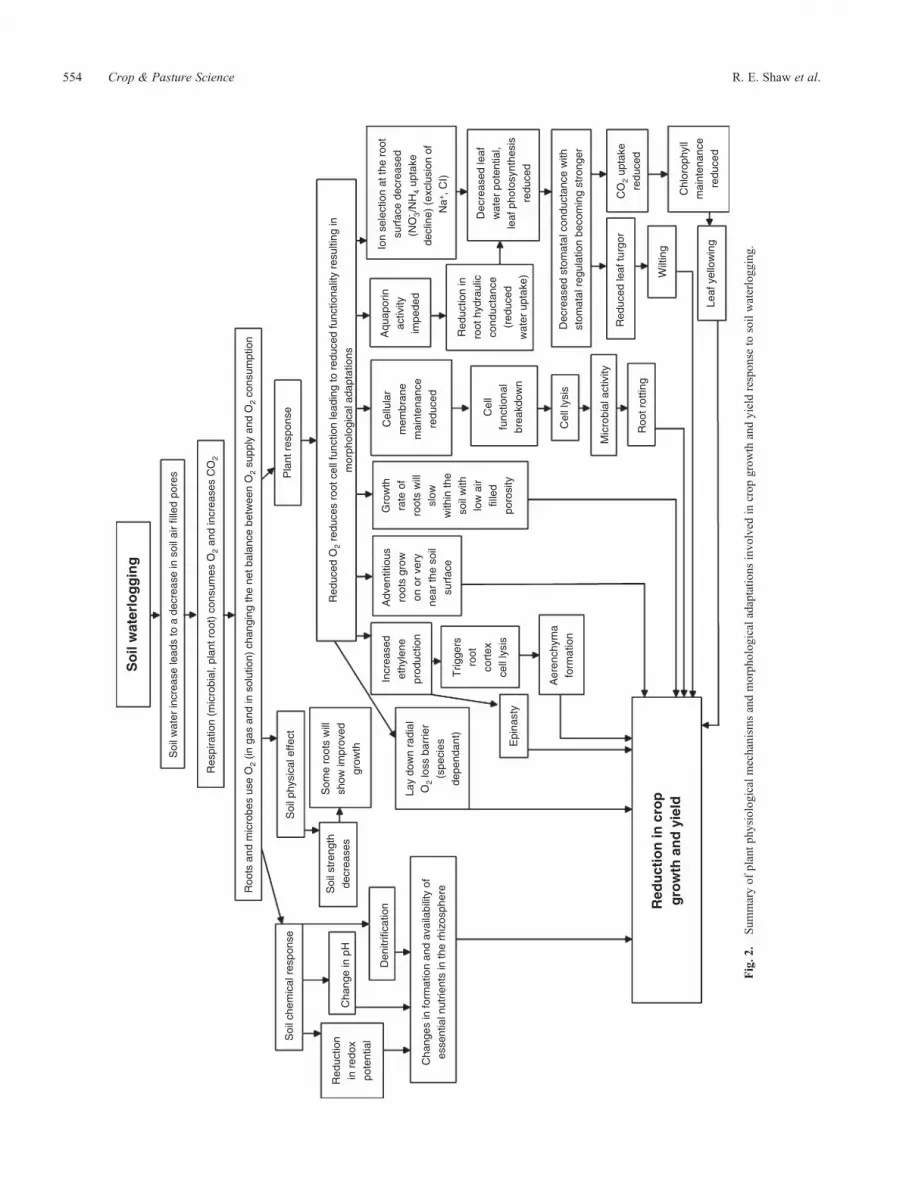
Clearly, regardless of efforts to drain soils, there are situationswhere waterlogging will occur, and our ability to predict theimpact of these occurrences on crop yields will be improved byincreased understanding of soil–plant system responses towaterlogging. The following section presents an overview ofthe chemical and physical changes in soils that becomewaterlogged, as well as the plant physiological mechanismsand the morphological adaptations involved in response towaterlogging (Fig. 2).
Soil response to waterlogging
Soil chemistry and microbial activity change within the soilunder the low oxygen conditions of waterlogging. The processof decomposition of organic matter in waterlogged soils isdifferent from and slower than in aerated soils, resulting indifferent end products within the soil matrix. In well-aeratedsoil, the products from decomposition include carbon dioxide,nitrate, and sulfate, whereas in a waterlogged soil, thedecomposition results are carbon dioxide, hydrogen, methane,ammonia, amines, mercaptans, and hydrogen sulfide(Ponnamperuma 1972).
In an aerated soil, oxygen acts as an electron acceptor, butwhen there is limited oxygen available, as with waterlogging,other compounds become electron acceptors; hence, redoxpotential is reduced. A lowered redox potential affecting O2,NO3
–, Mn4+, Fe3+, SO42–, CO2, and H+ can result in potentially
toxic chemicals accumulating within the rhizosphere (Ohlsson1979).
In waterlogged soils, oxygen deficiency predisposes todenitrification, with the consequent rapid loss of nitrate. Sincenitrate is essential for physiological function, plant growth andappearance are quickly affected. Nutrient availability is alsoaffected by soil pH, as it is an important factor controllingchemical reactions within the soil matrix. Under low oxygen,the pH of acid soil changes towards neutral, whereas for alkalinesoils the pH will decrease (Ponnamperuma 1972). Hence, inwaterlogged anoxic soil, the range and availability of nutrientsavailable to plant roots will also change (Neumann and Romheld2012). Plant shoot concentrations of Na, B, Mn, Fe and Al canincrease and may become toxic (Setter et al. 2009), whileconcentrations of NO3
– and SO42– may become deficient.
Plant responses to waterlogging
Different plant species exhibit different degrees of damage dueto a waterlogging event. Sensitivity of plants to waterloggingmight be expected to vary. During a waterlogging event, theoxygen concentration in stagnant water will decrease throughhypoxic (low soil oxygen concentration) conditions to anoxic(zero soil oxygen concentration) conditions. Experiments havebeen done on a variety of species to determine the ‘critical oxygen
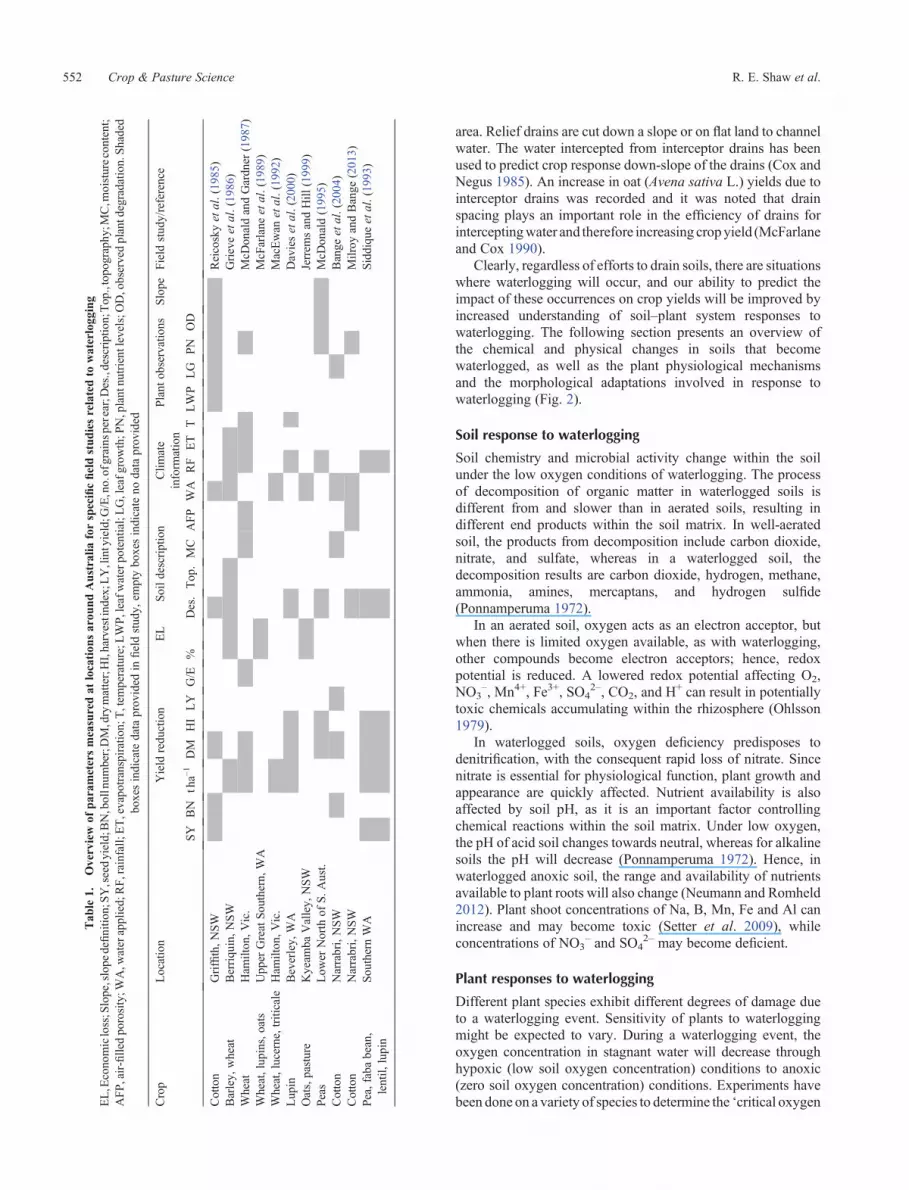
Tab
le1.
Overviewof
parametersmeasuredat
location
sarou
ndAustralia
forspecificfieldstud
iesrelatedto
waterlogging
EL,Economicloss;Slope,slope
definitio
n;SY,seedyield;BN,bollnum
ber;DM,drymatter;HI,harvestind
ex;L
Y,lintyield;G
/E,no.ofgrains
perear;D
es.,description;Top.,topo
graphy;M
C,m
oisturecontent;
AFP,air-filledporosity;W
A,w
aterapplied;RF,rainfall;ET,evapotranspiration;T,tem
perature;L
WP,leafw
aterpotential;LG,leafg
rowth;P
N,plantnutrientlevels;O
D,observedplantdegradatio
n.Shaded
boxesindicatedataprov
ided
infieldstud
y,em
ptybo
xesindicateno
dataprovided
Crop
Location
Yield
reduction
EL
Soildescription
Clim
ate
inform
ation
Plant
observations
Slope
Field
study/reference
SY
BN
tha–
1DM
HILY
G/E
%Des.Top
.MC
AFP
WA
RF
ET
TLWP
LG
PN
OD
Cotton
Griffith,N
SW
Reicoskyetal.(19
85)
Barley,
wheat
Berriquin,N
SW
Grieveetal.(19
86)
Wheat
Ham
ilton,V
ic.
McD
onaldandGardn
er(198
7)Wheat,lup
ins,oats
Upp
erGreatSouthern,
WA
McFarlane
etal.(19
89)
Wheat,lucerne,triticale
Ham
ilton,V
ic.
MacEwan
etal.(19
92)
Lupin
Beverley,
WA
Daviesetal.(20
00)
Oats,pasture
Kyeam
baValley,
NSW
Jerrem
sandHill
(199
9)Peas
Low
erNorth
ofS.A
ust.
McD
onald(199
5)Cotton
Narrabri,NSW
Bange
etal.(20
04)
Cotton
Narrabri,NSW
Milroy
andBange
(201
3)Pea,fababean,
lentil,
lupin
Sou
thernWA
Siddiqu
eetal.(19
93)
552 Crop & Pasture Science R. E. Shaw et al.

pressure’, the minimum oxygen concentration required beforethe plant starts to shows signs of stress (Girton 1979; Saglio et al.1984), and is generally ~10% at 258C (Meyer et al. 1985; Drew1997). Consequently, many plant species undergo adaptationshortly after waterlogging occurs. Aerobic respiration is affectedthrough a change in the glycolysis process in waterlogged plants(Zabalza et al. 2009). Less ATP is produced, resulting infermentation producing only one-eighteenth of the energy(Bramley et al. 2007), implying that adaptation has a cost thatwill most likely lead to reduced growth and yield.
It has been suggested that the magnitude of the effect ofwaterlogging on yield is related to the occurrence at particulardevelopment stages. Setter and Waters (2003) provide athorough review of plant waterlogging tolerances at differentgrowth stages. In their study, wheat and barley were found to bemore tolerant to waterlogging during tillering and grain fillingthan during pre-emergence, seedling growth, and reproductivestages. However, Setter and Waters (2003) note that there arelimited published studies in the area. Observations at Hamilton,south-western Victoria, indicate that waterlogged soils in thearea result from rainfall exceeding evapotranspiration duringwinter and spring, combined with slow-draining duplex soils.Yields of wheat in the area were ~2 t ha–1 and crops showed signsof uneven, stunted growth and pale leaves. It was estimated thatactual yield was reduced by 70% from a potential regional yield,the reduction being attributed to waterlogged conditions duringanthesis (McDonald andGardner 1987). Subsequent experimentsover 2 years with wheat varieties of different seasonal durationand variable sowing dates were only partially successful inshowing increased yields, although the mechanisms were not
discussed. Given the tolerance and the variability of wheatresponse to waterlogging events (Belford 1981; Meyer andBarrs 1988) this lack of clear response is not unexpected.Previous research has shown that waterlogging reduces tillergrowth of wheat (Cannell et al. 1984; Malik et al. 2002).Condon and Giunta (2003) tested wheat varieties withdiffering tillering potential to see if varieties with ‘restrictedtillering’ were less likely to have reduced yield due to transientwaterlogging. Their results provided little support for theirhypothesis.
Plants that are subject to waterlogging often developsymptoms of leaf yellowing, wilting, root rotting, and rootblackening. As discussed in the previous section, waterloggingcan cause a change in microbial activity within the rhizosphere(Ponnamperuma 1972), which can lead to root rotting andblackening. Curiously, leaf wilting, usually strongly associatedwith water deficit, has been observed in several species underwaterlogged conditions. Tomato leaves wilt when waterloggedfor 4–6 h (Jackson 2002). Tobacco plants undergo leaf yellowingand wilting when waterlogged for 2 h (Kramer and Jackson1954). The aboveground symptoms are often the firstindicators that crop yield may be reduced. Almost certainly,the aboveground symptoms are indicating that conditionsbelow the ground are suboptimal.
Despite symptoms of stress becoming apparent, plants mayalso show adaptation responses. Below-ground adaptations caninclude adventitious root, aerenchyma, and radial oxygen-lossbarrier development and a change in root hydraulic conductance.Adventitious roots can appear at, or slightly above, a saturatedsoil, or a free water surface in inundated situations. These roots
Table 2. Summary of observed effects of waterlogging on crop and pasture yields and reported estimates of economic loss for locations aroundAustralia
Blank cells represent unavailable data
Crop Location Irrigated Yieldreduction
Survey area(ha)
Economic loss(AU$ year–1)
Reference
Barley Berriquin, NSW Y 20% 333 300 142 000 Grieve et al. (1986)Wakool, NSW Y 20% 34 000 12 000 Grieve et al. (1986)
Wheat Berriquin, NSW Y 20% 333 300 1.4million Grieve et al. (1986)Wakool, NSW Y 20% 34 000 125 000 Grieve et al. (1986)Hamilton, Vic. – 70% – – McDonald and Gardner (1987)Upper Great Southern, WA – 14% – 11million McFarlane et al. (1989)Hamilton, Vic. Y 65–78% – – MacEwan et al. (1992)
Lupins Upper Great Southern, WA – 8% – 0.5million McFarlane et al. (1989)Yellow lupins Beverley, WA N 10% Experimental field plot – Davies et al. (2000)Narrow leafed lupins Beverley, WA N 61% Experimental field plot – Davies et al. (2000)Oats Upper Great Southern, WA – 12% – 1.6million McFarlane et al. (1989)
Kyeamba Valley, NSW Y 24% 150 500 1.2million Jerrems and Hill (1999)Lucerne Hamilton, Vic. Y 57% – MacEwan et al. (1992)Annual grazing
pastureKyeamba Valley, NSW Y 21% 150 000 – Jerrems and Hill (1999)
Perennial grazingpasture
Kyeamba Valley, NSW Y 24% 150 000 – Jerrems and Hill (1999)
Peas Lower North of South Australia – 2–45% Experimental field plot – McDonald (1995)Cotton Narrabri, NSW Y 37% Experimental field plot – Bange et al. (2004)
Griffith, NSW Y 50% Experimental field plot – Reicosky et al. (1985)Pea Lake Grace, WA – 70% Experimental field plot – Siddique et al. (1993)Lentil Lake Grace, WA – 23% Experimental field plot Siddique et al. (1993)Albus lupin Esperance, WA – 55% Experimental field plot – Siddique et al. (1993)
Waterlogging in Australian landscapes Crop & Pasture Science 553
So
il w
ater
log
gin
g
Soi
l wat
er in
crea
se le
ads
to a
dec
reas
e in
soi
l air
fille
d po
res
Res
pira
tion
(mic
robi
al, p
lant
roo
t) c
onsu
mes
O2
and
incr
ease
s C
O2
Soi
l che
mic
al r
espo
nse
Cha
nge
in p
H
Den
itrifi
catio
n
Red
uctio
nin
red
oxpo
tent
ial
Cha
nges
in fo
rmat
ion
and
avai
labi
lity
ofes
sent
ial n
utrie
nts
in th
e rh
izos
pher
eRoo
ts a
nd m
icro
bes
use
O2
(in g
as a
nd in
sol
utio
n) c
hang
ing
the
net b
alan
ce b
etw
een
O2
supp
ly a
nd O
2 co
nsum
ptio
n
Pla
nt r
espo
nse
Red
uced
O2
redu
ces
root
cel
l fun
ctio
n le
adin
g to
red
uced
func
tiona
lity
resu
lting
inm
orph
olog
ical
ada
ptat
ions
Soi
l phy
sica
l effe
ct
Red
uct
ion
in c
rop
gro
wth
an
d y
ield
Soi
l str
engt
hde
crea
ses
Som
e ro
ots
will
show
impr
oved
grow
th
Wilt
ing
Red
uced
leaf
turg
or
Leaf
yel
low
ing
Roo
t rot
ting
Mic
robi
al a
ctiv
ity
Cel
l lys
is
Cel
lfu
nctio
nal
brea
kdow
n
Lay
dow
n ra
dial
O2
loss
bar
rier
(spe
cies
depe
ndan
t)
Incr
ease
det
hyle
nepr
oduc
tion
Epi
nast
y
Trig
gers
root
cort
exce
ll ly
sis
Aer
ench
yma
form
atio
n
Adv
entit
ious
root
s gr
owon
or
very
near
the
soil
surf
ace
Gro
wth
rate
of
root
s w
illsl
oww
ithin
the
soil
with
low
air
fille
dpo
rosi
ty
Cel
lula
rm
embr
ane
mai
nten
ance
redu
ced
Aqu
apor
inac
tivity
impe
ded
Chl
orop
hyll
mai
nten
ance
redu
ced
CO
2 up
take
redu
ced
Dec
reas
ed s
tom
atal
con
duct
ance
with
stom
atal
reg
ulat
ion
beco
min
g st
rong
er
Red
uctio
n in
root
hyd
raul
icco
nduc
tanc
e(r
educ
edw
ater
upt
ake)
Dec
reas
ed le
afw
ater
pot
entia
l,le
af p
hoto
synt
hesi
sre
duce
d
Ion
sele
ctio
n at
the
root
surf
ace
decr
ease
d(N
O- /N
H4
upta
ke
decl
ine)
(ex
clus
ion
of
Na+
, CI)
3
Fig.2
.Sum
maryof
plantph
ysiologicalmechanism
sandmorph
ologicaladaptatio
nsinvo
lved
incrop
grow
thandyieldrespon
seto
soilwaterlogg
ing.
554 Crop & Pasture Science R. E. Shaw et al.
have greater access to atmospheric oxygen and generally remainviable until the upper soil layers dry. Barley (Garthwaite et al.2003) and wheat (Belford 1981) develop both adventitiousroots and aerenchyma during waterlogging. Aerenchyma canbe formed through two processes. Lysigenous aerenchymaforms in situ through the death of cortex or pith cells withinroots (Colmer 2003), or by new specialist cell growth withinroots called schizogenous aerenchyma. Aerenchyma increasethe gaseous root porosity by 15–50% of the total root volume(Colmer 2003), and hence significantly decrease the resistanceto diffusive oxygen flux from the top of the plant to the root, andpotentially into the rhizosphere. This radial diffusion of oxygenfrom the aerenchyma, through the epidermal root cell layers, andinto the surrounding rhizosphere across the oxygen concentrationgradient is described as the radial oxygen loss (ROL). Armstrong(1980) estimated that 30–40% of the oxygen in the aerenchymacan be lost through this radial diffusion pathway. Some plants(e.g. rice and some barley species; Colmer 2003) form a ROLbarrier (ROLB) in the root basal zone, which decreases theoxygen loss, hence increasing the effectiveness of oxygenmovement longitudinally along the concentration gradienttowards the root apex. The ROLB of rice is formed by a layerof sclerenchymatous fibre with thick secondary walls on theexternal sides of the cortex (Colmer et al. 1998). Theformation of a ROLB seems to be species-specific. Forexample, cultivated barley (Hordeum vulgare L.), whiledeveloping aerenchyma and adventitious roots in low oxygenavailability conditions, does not develop a ROLB (Garthwaiteet al. 2003). In the same genus, wild barley (Hordeum marinumL.) develops adventitious roots, aerenchyma, and a ROLB insimilar conditions.
The ease with which water can move into and through theroots, root hydraulic conductivity, has been shown to change inlow oxygen or waterlogged conditions (reviewed by Bramleyet al. 2007). Root hydraulic conductivity includes the radialflow path from the root surface into the xylem vessels and thelongitudinal or axial flow path through the xylem vessels to thecrown of the plant. The flow J (m3 s–1) is defined as:
J ¼ Dy:L
whereDy is the potential gradient (kPa), andL is the conductivity(m3 s–1 kPa–1).
It should be noted that as in the physical electrical analogue,conductance (K) and resistance (R), and conductivity (L) andresistivity (r), are inversely related and used interchangeably as:
K ¼ 1=R
L ¼ 1=r
R ¼ r:length=area
Theuseof the electrical analogue as the conceptual frameworkto describe water movement in plants promulgated theassumption that L was largely constant (see Meyer 1976), eventhough experimental evidence indicated that this may not betrue (Greacen et al. 1976). The assumption has continued to beused in the implementation of root hydraulic conductance into
crop growth and yield models. With the discovery of a specificprotein, aquaporin (Agre et al. 1993), it was demonstrated thatthe permeability of animal cell membranes (and later plant cellmembranes; Maurel 1997) to water could change by inserting orwithdrawing aquaporins from themembrane. Upon insertion, theaquaporin acts as a channel across the membrane through whichwater can move passively down a potential gradient, henceincreasing water permeability. In plants the situation appearsmore complex, since it has been shown that aquaporins aremore diverse, there being many more genes encoding plantaquaporins, and that the individual protein pores can be openand shut (gated) by a variety of signals (Tyerman et al. 1999). Thisincludes rapid closure under anoxia which is signalled by areduction in the pH of the cell cytoplasm (Tournaire-Rouxet al. 2003). The observation that the presence of mercuricchloride inhibited aquaporin activity, resulting in reducedhydraulic conductivity, supports the causative mechanism(Bramley et al. 2010). Other blockers can be used to show thesame effect, including root acidification with a weak acid, whichreplicates the signal that occurs under anoxia. It follows thenthat any exogenous treatment that inhibits or enhances theexchange of aquaporin with the root cell membranes couldhave a significant effect on L. Variation in L can be as muchas 10-fold in some species and there is generally a linear andpositive correlation with the transpiration rate (Vandeleur et al.2013). Thus:
L ¼ b� E þ C
where E is whole plant transpiration rate, and b and C areparameters determined by the linear regression of theexperimental relationship found by Vandeleur et al. (2013). Insome species (e.g. grapevine), C is close to 0; i.e. at lowtranspiration rates the root L can approach 0. For soybean, C issignificant and positive so that at low E there is still significantroot L. This function connectingE and L needs to be incorporatedinto models to consider a more complete effect of soil andatmospheric conditions on plant performance. Further researchis required comparing physiological effects and hydraulicconductivity reductions under waterlogged conditions, sincepublished results show large differences in L between plantvarieties and the duration of waterlogging (Table 3).
The role that aquaporin activity may play in determining theresponse of plants to waterloggingwarrants further investigation,as stated by Parent et al. (2008) in a recent internationalreview. For example, the observation that some species exhibitwilted leaves when their root systems are oxygen-deprived(Table 4) suggests that L has decreased substantially. Itindicates that for the function above there has been adisruption in the normal signalling that matches shoottranspiration to the capacity of the root to transport water. Theappearance of wilting in waterlogged plants has generally beenascribed to effects of ethylene production by roots rather than toan insufficiency of water to maintain leaf turgor. It has alsobeen shown that ethylene can have an effect on the activity ofaquaporins (Kamaluddin and Zwiazek 2002; Chervin et al. 2008;Tungngoen et al. 2009). However, the observation of alteredaquaporin activity, lower hydraulic conductance, and leafwilting with hypoxic conditions suggests that the leaves of
Waterlogging in Australian landscapes Crop & Pasture Science 555
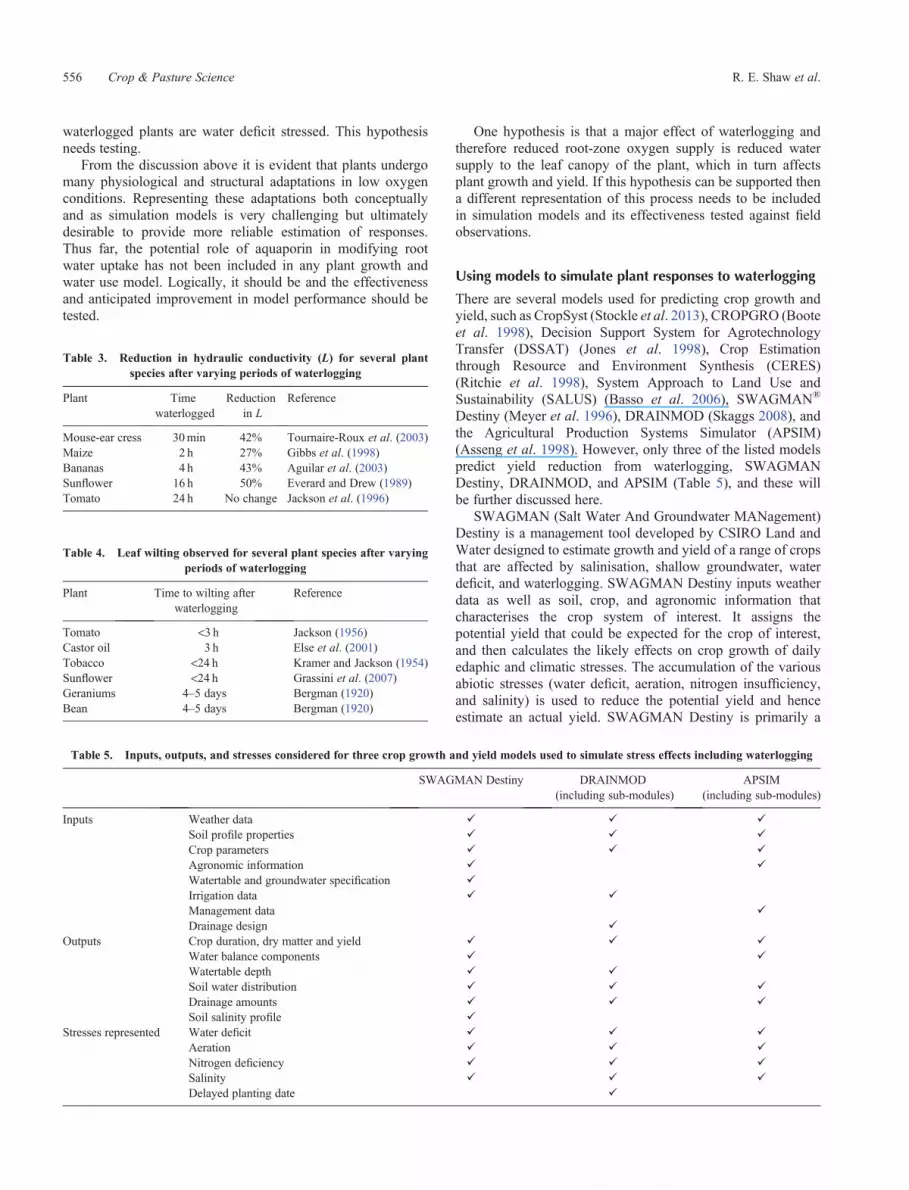
waterlogged plants are water deficit stressed. This hypothesisneeds testing.
From the discussion above it is evident that plants undergomany physiological and structural adaptations in low oxygenconditions. Representing these adaptations both conceptuallyand as simulation models is very challenging but ultimatelydesirable to provide more reliable estimation of responses.Thus far, the potential role of aquaporin in modifying rootwater uptake has not been included in any plant growth andwater use model. Logically, it should be and the effectivenessand anticipated improvement in model performance should betested.
One hypothesis is that a major effect of waterlogging andtherefore reduced root-zone oxygen supply is reduced watersupply to the leaf canopy of the plant, which in turn affectsplant growth and yield. If this hypothesis can be supported thena different representation of this process needs to be includedin simulation models and its effectiveness tested against fieldobservations.
Using models to simulate plant responses to waterlogging
There are several models used for predicting crop growth andyield, such as CropSyst (Stockle et al. 2013), CROPGRO (Booteet al. 1998), Decision Support System for AgrotechnologyTransfer (DSSAT) (Jones et al. 1998), Crop Estimationthrough Resource and Environment Synthesis (CERES)(Ritchie et al. 1998), System Approach to Land Use andSustainability (SALUS) (Basso et al. 2006), SWAGMAN®
Destiny (Meyer et al. 1996), DRAINMOD (Skaggs 2008), andthe Agricultural Production Systems Simulator (APSIM)(Asseng et al. 1998). However, only three of the listed modelspredict yield reduction from waterlogging, SWAGMANDestiny, DRAINMOD, and APSIM (Table 5), and these willbe further discussed here.
SWAGMAN (Salt Water And Groundwater MANagement)Destiny is a management tool developed by CSIRO Land andWater designed to estimate growth and yield of a range of cropsthat are affected by salinisation, shallow groundwater, waterdeficit, and waterlogging. SWAGMAN Destiny inputs weatherdata as well as soil, crop, and agronomic information thatcharacterises the crop system of interest. It assigns thepotential yield that could be expected for the crop of interest,and then calculates the likely effects on crop growth of dailyedaphic and climatic stresses. The accumulation of the variousabiotic stresses (water deficit, aeration, nitrogen insufficiency,and salinity) is used to reduce the potential yield and henceestimate an actual yield. SWAGMAN Destiny is primarily a
Table 3. Reduction in hydraulic conductivity (L) for several plantspecies after varying periods of waterlogging
Plant Timewaterlogged
Reductionin L
Reference
Mouse-ear cress 30min 42% Tournaire-Roux et al. (2003)Maize 2 h 27% Gibbs et al. (1998)Bananas 4 h 43% Aguilar et al. (2003)Sunflower 16 h 50% Everard and Drew (1989)Tomato 24 h No change Jackson et al. (1996)
Table 4. Leaf wilting observed for several plant species after varyingperiods of waterlogging
Plant Time to wilting afterwaterlogging
Reference
Tomato <3 h Jackson (1956)Castor oil 3 h Else et al. (2001)Tobacco <24 h Kramer and Jackson (1954)Sunflower <24 h Grassini et al. (2007)Geraniums 4–5 days Bergman (1920)Bean 4–5 days Bergman (1920)
Table 5. Inputs, outputs, and stresses considered for three crop growth and yield models used to simulate stress effects including waterlogging
SWAGMAN Destiny DRAINMOD(including sub-modules)
APSIM(including sub-modules)
Inputs Weather data � � �Soil profile properties � � �Crop parameters � � �Agronomic information � �Watertable and groundwater specification �Irrigation data � �Management data �Drainage design �
Outputs Crop duration, dry matter and yield � � �Water balance components � �Watertable depth � �Soil water distribution � � �Drainage amounts � � �Soil salinity profile �
Stresses represented Water deficit � � �Aeration � � �Nitrogen deficiency � � �Salinity � � �Delayed planting date �
556 Crop & Pasture Science R. E. Shaw et al.
generic plant growth, water use and yield model. Plant dry matteraccumulation is driven by intercepted radiant energy, whereasplant phasic development is dependent on ambient temperature.Soil water availability is estimated in a layered soil profile withinspecified upper and lower volumetric water content limits.Redistribution of water in the profile uses a modified ‘tippingbucket’ representation, while upflow (capillary rise) fromsaturated lower layers is calculated from a normaliseddiffusivity value and the volumetric water content. Input dailyweather data are used to calculate atmospheric evaporativedemand. Actual plant water use is controlled by the leaf areaindex and expression of any calculated stress caused byinsufficient water availability from the soil root-zone. Themodel runs on a daily time-step and keeps track of potentialgrowth in the absence of any growth-reducing stress. Stresseffects are implemented as normalised zero to unity valuesassociated with water deficit, aeration, nitrogen availability,and salinity. When multiple stresses occur on any day, themost severe of these stresses is used to scale back potentialgrowth to output estimated actual growth values. Final yield,either as dry matter or grain yield (as species appropriate), iseffectively an input potential yield scaled back by the combinedeffects of various stresses accumulated over the growing season.
The current version of SWAGMAN Destiny representswaterlogging by calculating the gas-filled soil pore volume asa function of soil water content and identifying a critical volumeat which point the availability of oxygen is deemed insufficient.A set lag time of 3 days occurs, and if the pores are still filledwith water, an aeration stress index is calculated. If the aerationstress is the most limiting stress then dry matter accumulation bytheplant is reduced, andhenceyield is reduced.Previousworkhasbeen undertaken on SWAGMANDestiny and validated throughcalibration of field data inputs. Throughout the duration of amaize silage crop a close match between estimated andmeasureddata was found for watertable depths and volumetric soil watercontent at different depths (Edraki et al. 2003). However, it wasalso indicated that a more comprehensive investigation of soiltype and salinity, along with different crops and watertablelevels, would be advantageous and therefore the modelrequired further improvement. Observations and SWAGMANDestiny results were compared for three varieties of wheat inboth lysimeter and field conditions in south-eastern Australia(Godwin et al. 2002). A range of soil and crop parameters wasused for a range of site and management conditions, andexcellent agreement between estimated and observed yieldvalues, with good comparisons of soil volumetric watercontent, root length density, evapotranspiration, and leaf areaindex, was found.
DRAINMODsimulates the effectiveness of drainagebasedonthewater balance in the soil profile. DRAINMODwas developedby Dr Wayne Skaggs at the North Carolina State University in1980. It estimates watertable depths, soil water conditions, anddrainage rates by input of soil properties, crop parameters,drainage design parameters, weather parameters, and irrigationdata. It calculates infiltration, evapotranspiration, drainage,surface runoff, sub-irrigation, deep seepage, lateral seepage,watertable depth, and soil water status (Skaggs 2008). Cropyields have been analysed using DRAINMOD, and modelvariations have been written to include crop parameters
(Hardjoamidjojo et al. 1982; Wang et al. 2006; Hassanpouret al. 2011; Kale 2011). As with SWAGMAN, DRAINMODcalculates the relative yield using the assigned potential yieldand the reduced crop yield due to combined stresses. The relativeyield depends on factors specific to individual crops and thewatertable. Crop factors are determined experimentally (Evanset al. 1990). DRAINMOD estimated drain flow, along with cornand soybean yields, at different drainage spacing over a 15-yearperiod for environmental conditions similar to those experiencedin the area between south-western Ohio and southern Illinois(Wang et al. 2006). Input data included weather data, drainagesystem parameters, soil properties, crop parameters, and soiltrafficability parameters. The maximum effective rooting depthand effective rooting depth–time distribution were cropproperties used. Output yields for both corn and soybean wereoverestimated by DRAINMOD when comparing the observedand estimated values. DRAINMOD was used to predict thesurface drainage and yield of canola in waterlogged fields ofIran during cold conditions (Hassanpour et al. 2011). Climatedata, drainage system parameters, and information on soil andplants were inputs. Relative yield was calculated using the StressDay Indexmethod (Hiler 1969). The results again showed anoverestimation of yield compared with observed yield. Additionalmodel research was recommended to improve estimationaccuracy.
APSIM was developed by the Agricultural ProductionSystems Research Unit, a collaborative group of CSIRO andQueensland State Government agencies. APSIM uses acollection of various modules—such as crop growth, soilwater (SOILWAT), surface residue (RESIDUE), soil organicmatter and soil nitrogen supply (SOILN), and soil pH(SOILpH)—to take account of interactions between soil water,nitrogen, and plant residues on crop growth, development, andyield. Weather, soil, crop, and management data are inputs.
The module SOILWAT estimates soil water balance andhas evolved from modifications to the models CERES andPERFECT (Productivity Erosion Runoff Functions to EvaluateConservation Techniques) (Littleboy et al. 1989). The watercharacteristics of lower limit, drained upper limit, saturated,and volumetric water contents and soil layer thickness arespecified. Processes of runoff, evaporation, saturated flow,unsaturated flow, and movement of solutes are represented(Keating et al. 2003). SOILWAT, like SWAGMAN Destiny,uses a ‘tipping bucket’ approach to redistribute water betweenlayers, while a perched watertable is calculated as the proportionof water content between the drained upper limit and saturationin a layer when the immediate layer below is saturated (Assenget al. 1997).
The module NWHEAT is an APSIM-Wheat module used todetermine wheat crop growth and yield. NWHEAT includesthe effects of aeration stress on the root system of wheat(Asseng et al. 1998). Aeration deficit effects are based onassumptions from experiments performed in the 1980s and1990s (experimental data sources listed in Asseng et al.(1998). After 3 days of aeration deficit in the root-zone, anaeration stress is calculated on a zero to unity scale. Athreshold of filled water within a layer is set, and below thatthreshold, root depth is affected and the root length density is setto zero within that saturated layer. The sensitivity to aeration
Waterlogging in Australian landscapes Crop & Pasture Science 557

stress is crop-dependent and based upon the crop growth stage,with crop emergence at maximum sensitivity (zero) and grainfilling at no sensitivity (unity). Implementation of the aerationfactor results in a reduction in root depth by removing all rootsfrom 5 cm below the upper edge of the affected part of a rootsystem in a saturated soil layer (Asseng et al. 1998). Thresholdsbased on the root aeration factor determine the leaf area growthand tillering of the wheat crop and consequently predict yield.
Bassu et al. (2009) used APSIM-Wheat to simulate the effectof waterlogging on durum wheat at various sowing dates andcompared the yield estimates with experimental field work(over 2 years) and past literature (14 years of data from theExperimental Institute for Cereal Crops). To improve theestimates, APSIM-Wheat was modified with a relationshipbetween sowing date (hence ambient temperature) and the
time between leaf appearances (the phyllochron interval) fordifferent cultivars. The simulation results showed that earlysowing in frequently waterlogged areas had no benefit;however, early sowing in areas with low to moderatewaterlogging risk could increase crop yield.
Ageneric cropmodel has beendesigned forAPSIM(GCROP)that takes into account plant physiological processes commonacross crop species (Wang et al. 2002). They noted thatphotosynthetic rate, crop-specific radiation use efficiency, leafarea expansion, root growth and distribution in soil, crop uptakeof water and nitrogen, and potential crop transpiration are allprocesses considered in current crop models and attempted tocombine them into one generic crop model. The uptake of waterby the crop is determined by the crop demand and the availablesupply (potential uptake) from the soil.Whilst GCROP combines
Table 6. Overview of the soil process routines for three crop growth and yield models used to simulate stress effects including waterlogging
SWAGMAN Destiny DRAINMOD (including sub-modules) APSIM (including sub-modules)
Soil water availability Estimated by layers. Volumetric watercontent defined using saturated,drained upper limit and lower limit
Estimated by layers. Soil water statuscalculated using a Richards equationsolution. Inputs needed include soilwater characteristic relations andhydraulic conductivity estimates.Waterbalance calculated on a basic 1 h time-step, but when there is minimummovement of watertable position time-steps are changed to 1 day and whenrainfall exceeds infiltration time stepsare �0.1 h (Skaggs 1991)
Estimated by layers. Volumetric water contentdefined using saturated, drained upper limitand lower limit
Redistribution of water Inferred mass flow using a tippingbucket representation
Uses the drained-to-equilibriumassumption with a two-dimensionalRichards equation for saturated andunsaturated flow (Skaggs 1991)
Inferred mass flow using a tipping bucketrepresentation
Upflow from saturatedlower layers
Calculated from a normaliseddiffusivity value and volumetricwater content
Maximum water movement andwatertable depth are defined for eachsoil by numerically solving an equationrelating unsaturated soil hydraulicconductivity and the pressure head forvertical unsaturated movement due toET on the surface (Skaggs 1978)
Unsaturated water flow is calculated bydiffusivity as a function of volumetric watercontent (Probert et al. 1998)
Process used to inferwaterlogging
Gas filled soil pore volume is afunction of soil water content. Acritical volume is definedwhenO2 isinsufficient for root growth andfunction. A set lag time of 3 daysoccurs and if the soil pores are stillfilled with water a 0–1 aerationfactor is assigned reducing thepotential yield
Predicted yield due to excessive soil wateris dependent on the stress day index(SDI). The SDI is calculated if thewatertable depth is within the root-zone(taken to be the top 30 cm(Hardjoamidjojo et al. 1982; Skaggs1991). The SDI is calculated using cropfactors (determinedexperimentally) andthewatertabledepth (Skaggs1991).SDI<141 relative yield calculated; SDI�141 relative yield is 0 (Skaggs 1991)
Aeration is considered after 3 days for eachlayer containing roots and a 0–1 aerationstress is calculated, based on the saturatedsoil water content, the soil water content,and the drained upper limit. A threshold offilled water within a layer is set and belowthat threshold root depth is affected
Effect of waterloggingon growth and yield
Drymatter accumulation of the plant isreduced, hence reducing thepotential yield. The 0–1 stress (inthis case aeration) factor iscalculated and thenused to influenceroot growth, death, and hencedistribution. It also affects canopygrowth
Effect of waterlogging on yield iscombined with effects of drought anddelayed planting date to reduce thepotential crop yield (Skaggs 1991).Effect of waterlogging on roots is user-controlled with the opportunity to enterknown rooting depths duringwaterlogging conditions. (Cox et al.1994)
Root depth and leaf area growth are reducedand hence predicted crop yield is reduced.Implementationof the aeration factor resultsin a reduction in root depth by removing allroots from 5 cm below the upper edge of theaffected part of a root system in a saturatedsoil layer (Asseng et al. 1998). Stress factorvaries depending on plant stage, frommaximum (0) at emergence to no sensitivity(1) at grainfill (Asseng et al. 1997)
558 Crop & Pasture Science R. E. Shaw et al.

the current plant physiological processes being modelled, it stilldoes not consider detailed physiological adaptations due tospecific environmental stresses such as waterlogging.
Using models with representations of the major physiologicalprocesses and the environmental drivers (radiant energy,temperature, water, nutrients), it is possible to diagnose thecontributing effect of various stresses in a retrospective wayand, importantly, to identify areas and conditions that willlikely lead to yield reduction. With this understanding,improved management for optimised yield outcomes should bepossible, giving farmers the tools to make informed decisionsconcerning cropping in waterlogged areas. However, the successof these models is highly dependent on the adequacy of theprocess representations (compared in Table 6) in the simulationmodel. As better understanding of plant physiological processesdevelops, process representations within the models should bemodified. None of the three models discussed above includes thephysiological adaptations that root systems undergo duringwaterlogging. One of the changes identified most recently is achange in total root system hydraulic conductance (Bramley andTyerman 2010). This change in conductance is the result ofchanges in aquaporin activity that influence water transportacross root cell membranes (Bramley et al. 2010). Inclusion ofthe change in hydraulic conductance of root systems duringwaterlogging as an extra module adaptable to all the cropgrowth and yield models within the simulations may improvemodelling predictability, increasing the accuracy of predictedyield outcomes. An improved diagnostic and managementoption assessment tool would then be available.
Conclusion
It is evident that plants have a range of adaptive features torespond to waterlogging, although they often exhibit reducedgrowth and, ultimately, reduced crop yield. Despiteinconsistencies between studies in the parameters used toassess effects of waterlogging, there is sufficient evidence thatwaterlogging reduces crop growth and yield. Surface and subsoildrainage has been successful in reducing yield loss fromwaterlogging stress. Evidence also shows that it is important tokeep watertables below a critical depth to minimise soil salinity.Effective soil drainage techniques are known to alleviate thegrowth and yield reduction effects of both waterlogging and soilsalinity.
There is enormous scope for improvement in the predictionand measurement of waterlogging in the field. Currently, noconsistent measurements are being recorded to facilitatedecisions regarding drainage and/or crop selections based onthe potential for waterlogging in any defined area; therefore, aminimum dataset should be established. Additionally, muchgreater understanding of the physiological mechanisms behindthe reduction in crop yield is required, such as the relationshipsbetween changes to aquaporin activity, reduced root hydraulicconductance, and wilting.
Combining this information should enable a better predictionof potential waterlogged areas and improve estimates of thelikely extent of reduced crop growth resulting in reduced yielddue to waterlogging. Modifying current models to include aminimum dataset along with updating process representations
to encapsulate the understandings of plant physiologicaladaptations will improve models as diagnostic andmanagement tools. An improved model will greatly enhancethe information available to farmers when they need to makedecisions based on the multitude of effects caused bywaterlogging. Improved estimates of the effects of transientwaterlogging will give growers and advisers a clearerindication of the merit of attempting to decrease effects ofwaterlogging through species and variety selection, surfacedrainage, or subsurface drainage. Combining the bio-physicalprojections with financial information could also indicate whensuch changes could be financially non-viable. Such well-informed decision-making could save industry thousands ofdollars in wasted efforts.
References
Agre P, Sasaki S, ChrispeelsMJ (1993)Aquaporins: a family of waterchannelproteins. The American Journal of Physiology 261, 265, F461.
AguilarEA,TurnerDW,GibbsDJ,ArmstrongW,SivasithamparamK (2003)Oxygen distribution and movement, respiration and nutrient loading inbanana roots subjected to aerated and oxygen-depleted environments.Plant and Soil 253, 91–102. doi:10.1023/A:1024598319404
Armstrong W (1980) Aeration in higher plants. Advances in BotanicalResearch 7, 225–332. doi:10.1016/S0065-2296(08)60089-0
Asseng S, Keating BA, Huth NI, Eastham J (1997) Simulation of perchedwatertables in a duplex soil. In ‘Proceedings of the International Congresson Modelling and Simulation - MODSIM97’. Hobart, Tasmania.pp. 538–543. (Modelling & Simulation Society of Australia: Canberra)
Asseng S, Keating BA, Fillery IPR, Gregory PJ, Bowden JW, Turner NC,Palta JA, Abrecht DG (1998) Performance of the APSIM-wheat modulein Western Australia. Field Crops Research 57, 163–179. doi:10.1016/S0378-4290(97)00117-2
Aubertin GM, Rickman RW, Letey J (1968) Differential salt-oxygen levelsinfluence plant growth. Journal of Agronomy 60, 345–349. doi:10.2134/agronj1968.00021962006000040004x
Bakker DM, Hamilton GJ, Houlbrooke DJ, Spann C (2005) The effects ofraised beds on soil structure, waterlogging and productivity on duplexsoils in Western Australia. Australian Journal of Soil Research 43,575–585. doi:10.1071/SR03118
Bakker DM, Hamilton GJ, Houlbrooke DJ, Spann C, Burgel AV (2007)Productivity of crops grown on raised beds on duplex soils prone towaterlogging in Western Australia. Australian Journal of ExperimentalAgriculture 47, 1368–1376. doi:10.1071/EA06273
Bange MP, Milroy SP, Thongbai P (2004) Growth and yield of cotton inresponse to waterlogging. Field Crops Research 88, 129–142.doi:10.1016/j.fcr.2003.12.002
Basso B, Ritchie JT, Grace PR, Sartori L (2006) Simulation of tillage systemsimpact on soil biophysical properties using the SALUS model. ItalianJournal of Agronomy 4, 677–688.
Bassu S, Asseng S, Motzo R, Giunta F (2009) Optimising sowing dates ofdurum wheat in a variable Mediterranean environment. Field CropsResearch 111, 109–118. doi:10.1016/j.fcr.2008.11.002
Belford RK (1981) Response of winter wheat to prolonged waterloggingunder outdoor conditions. The Journal of Agricultural Science 97,557–568. doi:10.1017/S0021859600036881
Bergman HF (1920) The relation of aeration to the growth and activity ofroots and its influence on the ecesis of plants in swamps.Annals of Botany34, 13–33.
Boote KJ, Jones JW, Hoogenboom G, Pickering NB (1998) The CROPGROmodel for grain legumes. In ‘Understanding options for agriculturalproduction’. (Eds GY Tsuji, G Hoogenboom, PK Thornton) pp. 99–128.(Kluwer Academic Publishers: Wageningen, the Netherlands)
Waterlogging in Australian landscapes Crop & Pasture Science 559

Bramley H, Tyerman SD (2010) Root water transport under waterloggedconditions and the roles of aquaporins. In ‘Waterlogging signalling andtolerance in plants’. (Eds SMancuso, S Shabala) pp. 151–180. (Springer-Verlag: Berlin, Heidelberg)
Bramley H, Turner DW, Tyerman SD, Turner NC (2007) Waterflow in theroots of crop species: the influenceof root structure, aquaporin activity andwaterlogging. Advances in Agronomy 96, 133–196. doi:10.1016/S0065-2113(07)96002-2
Bramley H, Turner NC, Turner DW, Tyerman SD (2010) The contrastinginfluence of short-term hypoxia on the hydraulic properties of cells androots of wheat and lupin. Functional Plant Biology 37, 183–193.doi:10.1071/FP09172
Cannell RQ (1977) Soil aeration and compaction in relation to root growthand soil management. In ‘Applied biology’. (Ed. TH Coaker) pp. 1–86.(Academic Press: London)
CannellRQ,BelfordRK,GalesK,ThomsonRJ,WebsterCP (1984)Effects ofwaterlogging and drought on winter wheat and winter barley grown on aclay and a sandy loam soil. Plant and Soil 80, 53–66. doi:10.1007/BF02232939
Chervin C, Tira-umphon A, Terrier N, Zouine M, Severac D, Roustan JP(2008) Stimulation of the grape berry expansion by ethylene and effectson related gene transcripts, over the ripening phase. PhysiologiaPlantarum 134, 534–546. doi:10.1111/j.1399-3054.2008.01158.x
ChittleboroughDJ (1992)Formationandpedologyof duplex soils.AustralianJournal of Agricultural Research 32, 815–825.
Colmer TD (2003) Long-distance transport of gases in plants: a perspectiveon internal aeration and radial oxygen loss from roots. Plant, Cell &Environment 26, 17–36. doi:10.1046/j.1365-3040.2003.00846.x
Colmer TD, Gibberd MR, Wiengweera A, Tinh TK (1998) The barrier toradial oxygen loss from roots of rice (Oryza sativa L.) is induced bygrowth in stagnant solution. Journal of Experimental Botany 49,1431–1436.
Condon AG, Giunta F (2003) Yield response of restricted-tillering wheat totransientwaterlogging on duplex soils.Australian Journal of AgriculturalResearch 54, 957–967. doi:10.1071/AR03089
Cox JW, Negus TR (1985) Interceptor drains and waterlogging control.Journal of Agriculture, Western Australia 26, 126–127.
Cox JW,McFarlaneDJ, SkaggsRW (1994) Field evaluation ofDRAINMODfor predicting waterlogging intensity and drain performance in south-western Australia. Australian Journal of Soil Research 32, 653–671.doi:10.1071/SR9940653
Davies CL, Turner DW, Dracup M (2000) Yellow lupin (Lupinus luteus)tolerates water logging better than narrow-leafed lupin (L. angustifolius).III Comparison under field conditions.Australian Journal of AgriculturalResearch 51, 721–727. doi:10.1071/AR99075
Dennis ES, Dolferus R, Ellis M, Rahman M, Wu Y, Hoeren FU, Grover A,Ismond KP, Good AG, Peacock WJ (2000) Molecular strategies forimproving waterlogging tolerance in plants. Journal of ExperimentalBotany 51, 89–97. doi:10.1093/jexbot/51.342.89
Dracup M, Belford R, Gregory P (1992) Constraints to root growth of wheatand lupin crops in duplex soils. Australian Journal of ExperimentalAgriculture 32, 947–961. doi:10.1071/EA9920947
Drew MC (1997) Oxygen deficiency and root metabolism: injury andacclimation under hypoxia and anoxia. Annual Review of PlantPhysiology and Plant Molecular Biology 48, 223–250. doi:10.1146/annurev.arplant.48.1.223
Edraki M, Smith D, Humphreys E, Khan S, O’Connell N, Xevi E (2003)Validation of the SWAGMAN Farm and SWAGMAN Destiny models.CSIRO Land and Water, Griffith, Technical Report 44/03, August 2003.Available at: www.clw.csiro.au/publications/technical2003/tr44-03.pdf
Else MA, Coupland D, Dutton L, Jackson MB (2001) Decreased roothydraulic conductivity reduces leaf water potential, initiates stomatalclosure and slows leaf expansion in flooded plants of castor oil(Ricinus communis) despite diminished delivery of ABA from the
roots to shoots in xylem sap. Physiologia Plantarum 111, 46–54.doi:10.1034/j.1399-3054.2001.1110107.x
Evans RO, Skaggs RW, Sneed RE (1990) Normalised crop susceptibilityfactors for corn and soybean to excess water stress. Transactions ofthe American Society of Agricultural Engineers 33, 1153–1161.
Everard JD, Drew MC (1989) Mechanisms controlling changes in watermovement through the roots of Helianthus annuus L. during continuousexposure to oxygen deficiency. Journal of Experimental Botany 40,95–104. doi:10.1093/jxb/40.1.95
Fitzpatrick RW, Cox JW,Munday B, Bourne JF (2003) Development of soil-landscape and vegetation indicators for managing waterlogged and salinecatchments.AustralianJournalofExperimentalAgriculture43, 245–252.doi:10.1071/EA00198
Garthwaite AJ, von Bothmer R, Colmer TD (2003) Diversity in root aerationtraits associated with waterlogging tolerance in the genus Hordeum.Functional Plant Biology 30, 875–889. doi:10.1071/FP03058
Gibbs J, Turner DW,ArmstrongW, SivasithamparamK,GreenwayH (1998)Response to oxygendeficiency in primarymaize roots. II.Development ofoxygen deficiency in the stele has limited short-term impact on radialhydraulic conductivity. Australian Journal of Plant Physiology 25,759–763. doi:10.1071/PP98087
GirtonRE (1979) Effect of oxygen concentration on the respiration of excisedroot tip segments of maize and rice, and germinating grains of rice andbuckwheat. Physiologia Plantarum 46, 58–62. doi:10.1111/j.1399-3054.1979.tb03186.x
Godwin D, Humphreys E, Smith DJ, Timsina J, Xevi E, Meyer WS (2002)Application of SWAGMAN Destiny to rice-wheat cropping systems. In‘Modelling irrigated cropping systems, with special attention torice–wheat sequences and raised bed planting’. Technical Report 25/02. (Eds E Humphreys, J Timsina) pp. 63–81. (CSIRO Land and Water:Griffith) Available at: www.clw.csiro.au/publications/technical2002/tr25-02.pdf
Grassini P, Indaco GV, Pereira ML, Hall AJ, Trápani N (2007) Responses toshort-term waterlogging during grain filling in sunflower. Field CropsResearch 101, 352–363. doi:10.1016/j.fcr.2006.12.009
GreacenEL,PonsanaP,BarleyKP(1976)Resistance towaterflow in the rootsof cereals. In ‘Water and plant life’. (Eds OL Lange, L Kappen, E-DSchulze) pp. 86–100. (Springer-Verlag: Berlin)
Grieve AM, Dunford E, Marston D, Martin RE, Slavich P (1986) Effects ofwater logging and soil salinity on irrigated agriculture in the MurrayValley: a review. Australian Journal of Experimental Agriculture 26,761–777. doi:10.1071/EA9860761
Hardjoamidjojo S, Skaggs RW, Schwab GO (1982) Corn yield response toexcessive soil water conditions. Transactions of the American Society ofAgricultural Engineers 25, 922–927.
Hassanpour B, ParsineejadM, Yazdani MR, Salahshour Dalivand F, KossariH (2011) Evaluation ofmodifiedDRAINMOD in predicting groundwatertable fluctuations and yield of canola in paddy fields under snowyconditions (case study: Rasht, Iran). Irrigation and Drainage Systems60, 660–667. doi:10.1002/ird.614
Hatton TJ, Bartle GA, Silberstein RP, Salama RB, Hodgson G, Ward PR,Lambert P, Williamson DR (2002) Predicting and controlling waterlogging and groundwater flow in sloping duplex soils in westernAustralia. Agricultural Water Management 53, 57–81. doi:10.1016/S0378-3774(01)00156-1
Hiler EA (1969) Quantitative evaluation of crop drainage requirements.Transactions of the American Society of Agricultural Engineers 12,499–505.
JacksonWT(1956)The relative importance of factors causing injury to shootsof flooded tomato plants. American Journal of Botany 43, 637–639.doi:10.2307/2438827
Jackson MB (2002) Long distance signalling from roots to shoots assessed:the flooding story. Journal of Experimental Botany 53, 175–181.doi:10.1093/jexbot/53.367.175
560 Crop & Pasture Science R. E. Shaw et al.
JacksonMB,DaviesWJ, ElseMA (1996) Pressure–flow relationships, xylemsolutes and root hydraulic conductance inflooded tomatoplants.Annals ofBotany 77, 17–24. doi:10.1006/anbo.1996.0003
Jerrems R, Hill C (1999) Kyeamba Valley Landcare area land and watermanagement plan: Economic evaluation. July 1999. Report for Socio-Economic Services Unit, Department of Land and Water Conservation,New South Wales.
Jones JW, Tsuji GY, HoogenboomG, Hunt LA, Thornton PK, Wilkens PW,Imamura DT, Bowen WT, Singh U (1998) Decision support system foragrotechnology transfer: DSSAT v3. In ‘Understanding options foragricultural production’. (Eds GY Tsuji, G Hoogenboom, PKThornton) pp. 157–177. (Kluwer Academic Publishers: Wageningen,the Netherlands)
Kale S (2011) Estimating effects of drainage design parameters on crop yieldsunder irrigated lands using DRAINMOD. Scientific Research and Essays14, 2955–2963.
Kamaluddin M, Zwiazek JJ (2002) Ethylene enhances water transport inhypoxic aspen. Plant Physiology 128, 962–969. doi:10.1104/pp.010791
Keating BA, Carberry PS, Hammer GL, Probert ME, Robertson MJ,Holzworth D, Huth NI, Hargreaves JNG, Meinke H, Hochman Z,McLean G, Verburg K, Snow V, Dimes JP, Silburn M, Wang E,Brown S, Bristow KL, Asseng S, Chapman S, McCown RL, FreebairnDM, Smith CJ (2003) An overview of APSIM, a model designed forfarming systems simulation. European Journal of Agronomy 18,267–288. doi:10.1016/S1161-0301(02)00108-9
Khabaz-SaberiH,RengelZ,WilsonR,SetterTL(2010)Variationof toleranceto manganese toxicity in Australian hexaploid wheat. Journal of PlantNutrition and Soil Science 173, 103–112. doi:10.1002/jpln.200900063
Kramer PJ, Jackson WT (1954) Causes of injury to flooded tobacco plants.Plant Physiology 29, 241–245. doi:10.1104/pp.29.3.241
LittleboyM, Silburn DM, Freebairn DM,Woodruff DR, Hammer GL (1989)‘PERFECT—A computer simulation model of Productivity, Erosion,Runoff Functions to Evaluate Conservation Techniques.’ (QueenslandDepartment of Primary Industries: Brisbane)
MacEwan RJ, Gardner WK, Ellington A, Hopkins DG, Bakker AC (1992)Tile andmoledrainage for control ofwaterlogging induplexsoilsof south-eastern Australia. Australian Journal of Experimental Agriculture 32,865–878. doi:10.1071/EA9920865
Malik AI, Colmer TD, Lambers H, Setter TL, Schortemeyer M (2002) Short-term waterlogging has long-term effects on the growth and physiology ofwheat. New Phytologist 153, 225–236. doi:10.1046/j.0028-646X.2001.00318.x
Maurel C (1997) Aquaporins and water permeability of plant membranes.Annual Review of Plant Physiology and Plant Molecular Biology 48,399–429. doi:10.1146/annurev.arplant.48.1.399
McDonald GK (1995) Growth of field pea on red-brown earth soils in a yearwith high rainfall. Australian Journal of Experimental Agriculture 35,619–628. doi:10.1071/EA9950619
McDonaldGK,GardnerWK (1987) Effect of waterlogging on the grain yieldresponse of wheat to sowing date in South-west Victoria. AustralianJournal of Experimental Agriculture 27, 661–670. doi:10.1071/EA9870661
McFarlane DJ, Cox JW (1990) Seepage interceptor drains for reducingwaterlogging and salinity. Journal of Agriculture, Western Australia31, 66–69.
McFarlane DJ, Cox JW (1992) Management of excess water in duplex soils.Australian Journal of Agricultural Research 32, 857–864.
McFarlaneDJ, Barrett-Lennard EG, Setter TL (1989)Waterlogging: a hiddenconstraint to crop and pasture production in southern regions of Australia.In ‘Proceedings 5th Australian Agronomy Conference’. University ofWestern Australia. (Australian Society of Agronomy/The RegionalInstitute: Gosford, NSW) Available at: www.regional.org.au/au/asa/1989/invited/katanning-symposium/p-01.htm
Meyer WS (1976) Seminal roots of wheat: Manipulation of their geometryto increase the availability of soil water and to improve the efficiency ofwater use. PhD Thesis, University of Adelaide, Adelaide, Australia.
Meyer WS, Barrs HD (1988) Response of wheat to single short-termwaterlogging during and after stem elongation. Australian Journal ofAgricultural Research 39, 11–20. doi:10.1071/AR9880011
MeyerWS, Barrs HD, Smith RCG,White NS, HeritageAD, Short DL (1985)Effect of Irrigation on soil oxygen status and root shoot growth ofwheat ina clay soil. Australian Journal of Agricultural Research 36, 171–185.doi:10.1071/AR9850171
MeyerWS,GodwinDC,White RJG (1996) SWAGMAN®Destiny: A tool topredict productivity change due to salinity, waterlogging and irrigationmanagement In ‘Proceedings of the 8th Australian AgronomyConference’. Toowomba, Qld. pp. 425–428. (Australian Society ofAgronomy/The Regional Institute: Gosford, NSW) Available at: http://regional.org.au/au/asa/1996/contributed/425meyer.htm
Milroy SP, Bange MP (2013) Reduction in radiation use efficiency of cotton(Gossypium hirsutum L.) under repeated transient waterlogging in thefield. Field Crops Research 140, 51–58. doi:10.1016/j.fcr.2012.10.016
Milroy SP, BangeMP, Thongbai P (2009) Cotton leaf nutrient concentrationsin response to waterlogging under field conditions. Field Crops Research113, 246–255. doi:10.1016/j.fcr.2009.05.012
Neumann G, Romheld V (2012) Rhizosphere chemistry in relation to plantnutrition In ‘Marschner’smineral nutrition of higher plants’. 3rd edn. (Ed.P Marschner) pp. 347–368. (Elsevier Limited: UK)
Ohlsson T (1979) Redox reactions in soil sequence of redox reactions in awaterlogged soil. Nordic Hydrology 10, 89–98.
Parent C, Capelli N, Berger A, Crevecoeur M, Dat JF (2008) An overview ofplant responses to soil waterlogging. Plant Stress 2, 20–27.
Ponnamperuma FN (1972) The chemistry of submerged soils. In ‘Advancedagronomy’. pp. 29–95. (Academic Press Inc.: Waltham, MA)
Probert ME, Dimes JP, Keating BA, Dalal RC, StrongWM (1998) APSIM’swater and nitrogen modules and simulation of the dynamics of water andnitrogen in fallow systems. Agricultural Systems 56, 1–28. doi:10.1016/S0308-521X(97)00028-0
Reicosky DC, MeyerWS, Schaefer NL, Sides RD (1985) Cotton response toshort-term waterlogging imposed with a water-table gradient facility.Agricultural Water Management 10, 127–143. doi:10.1016/0378-3774(85)90002-2
Ritchie JT, Singh U, Godwin D, Bowen WT (1998) Cereal growth,development and yield. In ‘Understanding options for agriculturalproduction’. (Ed. GY Tsuji, G Hoogenboom, PK Thornton) pp. 79–98.(Kluwer Academic Publishers: Wageningen, the Netherlands)
Saglio PH, Rancillac F, Bruzen F, Prader A (1984)Critical oxygen for growthand respiration of excised and intact roots.Plant Physiology 76, 151–154.doi:10.1104/pp.76.1.151
Setter TL, Waters I (2003) Review of propects for germplasm improvementfor waterlogging tolerance in wheat, barley and oats. Plant and Soil 253,1–34. doi:10.1023/A:1024573305997
Setter TL, Waters I, Sharma SK, Singh KN, Kulshreshtha N, YaduvanshiNPS, Ram PC, Singh BN, Rane J, McDonald G, Khabaz-Saberi H,Biddulph TB, Wilson R, Barclay I, McLean R, Cakir M (2009)Review of wheat improvement for waterlogging tolerance in Australiaand India: the importanceof anaerobiosis andelement toxicities associatedwith different soils. Annals of Botany 103, 221–235. doi:10.1093/aob/mcn137
Siddique KHM, Walton GH, Seymour M (1993) A comparison of seedyields of winter grain legumes in Western Australia. AustralianJournal of Experimental Agriculture 33, 915–922. doi:10.1071/EA9930915
Skaggs RW (1978) A water management model for shallow watertable soils.Report No. 78-134. North Carolina State University, Water ResourcesResearch Institute, Raleigh, NC.
Waterlogging in Australian landscapes Crop & Pasture Science 561

Skaggs RW (1991) Drainage. In ‘Modeling plant and soil systems’. (Eds JHanks, JT Ritchie) pp. 205–243. (American Society of Agronomy, Inc.:Madison, WI)
SkaggsRW(2008)DRAINMOD:A simulationmodel for shallowwater tablesoils. In ‘South Carolina Water Resources Conference’. (ClemsonUniversity Restoration Institute: Clemson, SC)
Stockle CO, Nelson R, Kemanian A, Donatelli M, Bechini L, Ferrer F, VanEvert F, Campbell GS, McCool D, Debaeke P (2013) CropSyst Abstract.Washington State University. Available at: www.bsyse.wsu.edu/CS_Suite/CropSyst/index.html
Tisdall JM, Hodgson AS (1990) Ridge tillage in Australia: a review.Soil & Tillage Research 18, 127–144. doi:10.1016/0167-1987(90)90055-I
Tournaire-Roux C, Sutka M, Javot H, Gout E, Gerbeau P, Luu D, Bligny R,Maurel C (2003) Cytosolic pH regulates root water transport duringanoxic stress through gating of aquaporins. Nature 425, 393–397.doi:10.1038/nature01853
Tungngoen K, Kongsawadworakul P, Viboonjun U, KatsuharaM, Brunel N,Sakr S, Narangajavana J, Chrestin H (2009) Involvement of HbPIP2;1and HbTIP1;1 aquaporins in ethylene stimulation of latex yield throughregulation of water exchanges between inner liber and latex cells inHevea brasiliensis. Plant Physiology 151, 843–856. doi:10.1104/pp.109.140228
Tyerman SD, Bohnert HJ, Maurel C, Steudle E, Smith JAC (1999) Plantaquaporins: their molecular biology, biophysics and significance for plantwater relations. Journal of Experimental Botany 50, 1055–1071.
Vandeleur RK, Sullivan W, Athman A, Jordans C, Gilliham M, Kaiser BN,Tyerman SD (2013) Rapid shoot-to-root signalling regulates roothydraulic conductivity via aquaporins. Plant Cell & Environment, (inpress).
Wang E, RobertsonMJ, Hammer GL, Carberry PS, Holzworth D,Meinke H,ChapmanSC,Hargreaves JNG,HuthNI,McLeanG (2002)Developmentof a generic crop model template in the cropping system model APSIM.European Journal of Agronomy 18, 121–140. doi:10.1016/S1161-0301(02)00100-4
Wang X, Mosley CT, Frankenberger JR, Kladivko EJ (2006) Subsurfacedrain flow and crop yield predictions for different drain spacingsusing DRAINMOD. Agricultural Water Management 79, 113–136.doi:10.1016/j.agwat.2005.02.002
West DW, Taylor JA (1979) The response of Phaseolus vulgaris L. to root-zone anaerobiosis, waterlogging and high sodium chloride. Annals ofBotany 46, 51–60.
Zabalza A, van Dongen JT, Froehlich A, Oliver SN, Faix B, Gupta KJ,Schmalzlin E, Igal M, Orcaray L, Royuela M, Geigenberger P (2009)Regulation of respiration and fermentation to control the plant internaloxygen concerntration. Plant Physiology 149, 1087–1098. doi:10.1104/pp.108.129288
562 Crop & Pasture Science R. E. Shaw et al.
www.publish.csiro.au/journals/cp