visualization techniques
TRANSCRIPT

71
Emilio Badoer (ed.), Visualization Techniques: From Immunohistochemistry to Magnetic Resonance Imaging, Neuromethods, vol. 70, DOI 10.1007/978-1-61779-897-9_4, © Springer Science+Business Media, LLC 2012
Chapter 4
Visualizing GABA B Receptor Internalization and Intracellular Traf fi cking
Paola Ramoino , Paolo Bianchini , Alberto Diaspro , and Cesare Usai
Abstract
The number of neurotransmitter receptors on the plasma membrane is regulated by the traf fi c of intracellular vesicles. Golgi-derived vesicles provide newly synthesized receptors to the cell surface, whereas clathrin-coated vesicles are the initial vehicles for sequestration of surface receptors, which are ultimately degraded or recycled. Here we use confocal laser scanning microscopy and multiple immuno fl uorescence analysis to study constitutive GABA B receptor internalization and intracellular traf fi cking in the single-celled organ-ism Paramecium primaurelia . GABA B receptors display a dotted vesicular pattern dispersed on the cell surface and throughout the cytoplasm and are internalized via clathrin-dependent and -independent endo-cytosis. Indeed, GABA B receptors colocalize with the adaptin complex AP2, which is implicated in the selective recruitment of integral membrane proteins to clathrin-coated vesicles, and with caveolin 1, which is associated with uncoated membrane invaginations. After internalization, receptors are targeted to the early endosomes, characterized by the molecular markers EEA1 and rab5. Some of these receptors, addressed to recycling back to the plasma membrane, move from the early endosomes to the endosomal recycling compartment that is characterized by the presence of rab4 immunoreactivity. Receptors that are addressed to degradation exit the endosomal pathway at the early endosomes and move to the late endo-some–lysosome pathway. In fact, some of the GABA B -positive compartments were identi fi ed as lysosomal structures by double staining with the lysosomal marker LAMP1. GABA B vesicle structures also colocalize with TGN38- and rab11-immunoreactivity. TGN38 and rab11 proteins are associated with post-Golgi and recycling endosomes, respectively.
Key words: GABA B receptor , Endocytosis , Clathrin , Adaptin complex , Caveolin , Rab proteins , Immuno fl uorescence , Confocal microscopy , Ciliated protozoa
GABA B receptors, the metabotrophic receptors for GABA, are members of the G-protein coupled superfamily of receptors (GPCR) and are made up of a dimer of seven-transmembrane span-ning subunits. GABA B receptors are widely distributed throughout
1. Introduction
1.1. GABA B Receptor Internalization

72 P. Ramoino et al.
the central nervous system where they act postsynaptically to cause a long-lasting hyperpolarization through the activation of a potas-sium conductance. They are also present presynaptically where they act as auto and heteroreceptors to inhibit neurotransmitter release by modulation of Ca 2+ channels. GABA B receptors play a complex role in the regulation of excitatory transmission and their activation can have both inhibitory and disinhibitory effects ( 1 ) .
The classical paradigm of receptor function assumes that recep-tors localize on the cell surface and are activated by the binding of agonist ligands. After activation, most receptors are endocytosed from cell surface and travel to low pH endosomes, allowing the ligand to detach before the receptor is recycled back to the cell surface or sent through late endosomes to lysosomes for degrada-tion ( 2 ) . Increasing evidence shows that some GPCRs are not totally inactive in the absence of ligands but exhibit a constitutive activity, too, with elevated basal levels of intracellular signaling ( 3, 4 ) . It was found that receptor internalization from the neu-ronal surface occurring both constitutively and in response to ago-nist exposure is mediated by clathrin-dependent endocytosis ( 5– 7 ) . Clathrin-coated vesicles are the initial vehicles for sequestration of surface receptors, which are ultimately degraded or recycled. Endocytosis of such membrane proteins involves a series of steps beginning with the clustering of receptors at speci fi c sites of the plasma membrane, regions that later turn into clathrin-coated pits (Fig. 1 ). Receptors do this by recruiting cytosolic AP2 adaptor complexes through their cytoplasmic tails.
AP2 is a key component of the endocytotic machinery that links cargo membrane proteins to the clathrin lattice, selects mol-ecules for sorting into clathrin-coated vesicles and recruits clathrin to the plasma membrane (for reviews, see ( 8– 12 ) ). It is composed of subunits: a , b 2, m 2, and s (Fig. 1 ). The m 2 subunit (AP50) binds the endocytic sequence motif of cargo proteins, whereas the b 2 subunit binds to clathrin and the a region interacts via distinct domains with amphiphysin, AP180 and eps15. In addition to the AP2 adaptor complex, amphiphysin interacts with dynamin and the disruption of dynamin–amphiphysin interaction by recombi-nant amphiphysin src homology 3 (SH3) domain in vivo leads to a potent block in clathrin-mediated endocytosis ( 13 ) . Dynamin, a large GTP-binding protein, pinches off vesicles at constricted clathrin-coated pits by forming a ring-like structure collaring the neck of the vesicle that is thought to drive vesicle separation. Eps15 binds the C-terminal domain of the AP2 adaptor a -subunit and mediates the interaction of AP2 with proteins such as epsin, CALM/AP180 and synaptojanin, implicated in regulation of receptor-mediated endocytosis. Eps15 function in clathrin-dependent endocytosis seems to be restricted to the early events leading to clathrin-coated pit formation: indeed eps15 is not present in clathrin-coated vesicles ( 14 ) .

734 Visualizing GABA B Receptor Internalization and Intracellular Traffi cking
It has been shown that endocytosis of receptors may also occur through other membrane structures, including noncoated mem-brane invaginations and caveolae ( 15– 18 ) . The b 2 -adrenergic receptor, which is endocytosed by clathrin-coated pits in several cell types ( 19, 20 ) , is endocytosed by membrane invaginations resembling to caveolae in other cells ( 21, 22 ) . Cholecystokinin receptors have been observed in both clathrin-coated pits and cav-eolae in the same cells ( 23 ) . Caveolae are cholesterol- and sphingo-lipid-rich smooth invaginations of the plasma membrane that partition into raft fractions and the expression of which is associ-ated with caveolin 1.
Incubation of mammalian cells in media containing either sucrose or chlorpromazine has been shown to inhibit clathrin-mediated endocytosis by interfering with the clathrin-adaptor interaction or by altering the structure of the clathrin itself ( 24– 26 ) . Finally, caveolae-mediated internalization is blocked by nystatin and fi lipin, sterol-binding agents that disrupt caveolar structure and function ( 27, 28 ) .
Endocytosed receptors can be dephosphorylated and then recycled to the plasma membrane, contributing to functional resensitization of signal transduction. Alternatively, they are degraded into lyso-somes, reducing the number of receptors present in the plasma mem-brane and promoting the down-regulation of receptors, a process that leads to functional desensitization of signal transduction ( 2 ) .
1.2. GABA B Receptor Intracellular Traf fi cking After Internalization
Fig. 1. Internalization of receptors by the clathrin-mediated pathway. Clathrin-mediated vesicle endocytosis is divided into four steps: coated pit nucleation (recruitment of AP2, AP180, and clathrin to form a curved membrane), invagination (deep invagination before the formation of the characteristic dynamin neck structure), fi ssion (constriction and clo-sure of the neck), and uncoating. Schematic representation of the AP2 complex ( inset ).

74 P. Ramoino et al.
These processes of receptor regulation are mediated by a continu-ous traf fi c of vesicular and tubular intermediates, which need to be coordinated to ensure proper progression of cargo through the different compartments (Fig. 2 ). Several members of the rab pro-teins family have been localized in distinct compartments of the endocytic pathway and play different roles in endocytosis and recy-cling (for reviews, ( 29– 32 ) ). Rab5 and rab4 are both localized to early endosomes, but exert opposite effects on the uptake of mem-brane-bound proteins. Rab5 plays a role in the formation of clath-rin-coated vesicles at the plasma membrane, in their subsequent fusion with early endosomes, in the homotypic fusion between early endosomes and in the interaction of early endosomes with microtubules. Rab4 has been implicated in the regulation of membrane recycling from the early endosomes to the recycling endosomes or directly to the plasma membrane.
In accordance with its functional diversity, rab5 lies at the cen-tre of a complex machinery made up of several effector proteins.
Fig. 2. Intracellular traf fi cking of receptors and role of Rab GTPases. Receptors on the cell surface can be selectively recruited into clathrin-coated pits that can invaginate inward and pinch off vesicles into the cytoplasm. Clathrin is the main structural component of the coat. Coated pits and vesicles contain adaptor-protein complexes AP2 and several acces-sory proteins. Upon shedding of the clathrin coat, the receptor-containing vesicle fuses with the sorting endosome by action of Rab5 and the aid of accessory endosomal proteins such as EEA1. Receptors can then be recycled via the recycling endosome, an event medi-ated by Rab4 or Rab11, or transported to late endosomes. From late endosomes receptors can be recycled via the Golgi or degraded into the lysosome. The diagram also shows how receptors internalized in a caveolin-dependent manner can join the clathrin endocytic pathway at the level of the sorting endosome and are also dependent on dynamin activity (modi fi ed from ( 40 ) ).

754 Visualizing GABA B Receptor Internalization and Intracellular Traffi cking
Among these proteins, EEA1 was identi fi ed as a core component of the homotypic endosome docking and fusion machinery and was shown to play a role in the docking/tethering of the endo-some membranes ( 29– 32 ) . EEA1 is predominantly localized to early endosomes and is regarded as a speci fi c marker of this com-partment. Because of this localization and given its function in endosome membrane docking it has been proposed that EEA1 may confer directionality to rab5-dependent vesicular transport to the early endosomes. Another effector protein for rab5 is rabap-tin-5. Rabaptin-5 binds directly to the GTP-bound form of rab5 and is recruited to early endosomes by rab5 in a GTP-dependent manner ( 29– 32 ) . It stabilizes rab5 in the GTP-bound active form by down-regulating the GTP hydrolysis and it is required for the homotypic fusion between early endosomes as well as for the het-erotypic fusion of clathrin-coated vesicles with early endosomes in vitro. Rabaptin-5 also interacts with GTP-bound rab4 (via a dis-tinct structural unrelated N-terminal rab-binding domain), but does not appear to interact with rab11, a GTPase that is highly present on the recycling endosome and whose activity is required for receptor recycling through this compartment ( 29– 32 ) . Thus, the same effector interacts with the two rab proteins, which act sequentially in transport through the early endosomes.
The excitable ciliate Paramecium is easily cultured and manipu-lated and has provided an excellent model for studying the com-plexities of membrane traf fi cking (sorting, retrieval, transport, and fusion) in a single-celled organism by both morphological and immunocytochemical techniques ( 33, 34 ) .
The internalization of material in ciliated protozoa occurs via different mechanisms, even if most nutrients, particulate or not, are taken up by phagosomes formed at the bottom of the oral cavity. The endocytosis of small-sized molecules occurs at the parasomal sacs located next to the ciliar basal bodies. Indeed, in ciliates only de fi ned areas on cell surface are potential sites for endocytic uptake since most of the surface is covered internally by an extensive sys-tem of alveoli and an underlying fi brous epiplasm ( 35 ) . This system is interrupted only at the cytopharynx, the cytoproct, contractile vacuole pores and along the junctions of the abutting units of alve-olar membrane sacs. Only the punctuate indentations of the plasma membrane, called parasomal sacs, and pellicular pores are potential endocytic entry ports of all fl uid phase and putative receptor-mediated endocytosis ( 36, 37 ) .
Detailed morphological and tracer studies on endocytosis car-ried out by electron microscopy showed that in Paramecium mul-timicronucleatum fl uid phase markers such as horseradish peroxidase (HRP) and in Tetrahymena pyriformis receptor-mediated markers such as cationized ferritin are internalized via coated pits and are found in coated vesicles ( 36, 37 ) . Both coated pits and vesicles are
1.3. Paramecium as a Model to Study Receptor Internalization

76 P. Ramoino et al.
also labeled in fi xed cells when a monoclonal antibody against the plasma membrane of P. multimicronucleatum (C6 antigen) is applied to cryosections, suggesting that both membrane bound and fl uid phase markers are internalized at the coated pits ( 34 ) . However, there is increasing evidence for clathrin-independent pathways, mediated by caveolae or noncoated vesicles ( 38, 39 ) . It was shown that exogenous fl uid and plasma membrane compo-nents are internalized by vesicles which are fi rst localized in the cortical region of the cell and then migrate in the cytoplasm and fuse with other endosomal compartments, until their content is transferred to the phagosomes ( 39, 40 ) . In the end, denaturation and digestion of both endosome and phagosome contents are completed together (Fig. 3 ).
Antibodies against the protein of interest; here:
1. Monoclonal antibodies anti-clathrin (clone 23; 1:400), -adap-tin b (clone 74; 1:2,000), -AP50 (clone 31; 1:100), -AP180 (clone 34; 1:100), -eps15 (clone 17; 1:100), -dynamin II (clone27; 1:100), -amphiphysin (clone 15; 1:4,000), -caveolin
2. Materials
2.1. Antibodies
Fig. 3. Schematic drawing of the endocytic pathway internalization in Paramecium . Without phagocytosis inhibition, the ingested material is directed by the oral membranelle beating into the buccal cavity (bc), the cytopharynx (cy) and, at last, into the nascent phagosome. As lysosomes fuse with the phagosome (ph), the cargo is digested and pino-cytic vesicles containing digestion products are pinched off. Finally, the indigestible mate-rial is excreted at the cytoproct (cp). Receptor and fl uid-phase endocytosis occurs at the parasomal sacs located next to the ciliar basal bodies. Exogenous fl uid and plasma mem-brane components are internalized by vesicles which fuse with food vacuoles, and the denaturation and digestion of endosome and food vacuole contents are completed together. ( G ) Golgi apparatus; ( asterisk ) receptor and ( fi lled circle ) fl uid-phase endocyto-sis; ( plus ) degraded material (modi fi ed from ( 33 ) ).

774 Visualizing GABA B Receptor Internalization and Intracellular Traffi cking
1 (clone 2297; 1:1,000), -rab4 (clone 7; 1:400), -rab5 (clone 15; 1:100), -rab11 (clone 47; 1:400), -rabaptin-5 (clone 42; 1:200), -EEA1 (clone 14; 1:1,000), -LAMP1 (clone 25; 1:100), and -TGN38 (clone 2; 1:100) were purchased from Transduction Laboratory (BD Biosciences, San Jose, CA, USA).
2. The polyclonal guinea pig anti-GABA B R1 (1:1,000) receptor from Sigma Chemical Co. (St. Louis, MO, USA).
3. The secondary antibodies anti-guinea pig Alexa Fluor 594 (1:300) and anti-mouse Alexa Fluor 488 (1:300) were obtained from Molecular Probes (Invitrogen, Carlsbad, CA, USA).
1. Dilute in distilled water 2 mg/mL 10,000 Mw DXT-TXR. The stock solutions may be stored at 2–6°C for several weeks, with the addition of sodium azide to a fi nal concentration of 2 mM to inhibit bacterial growth. For long-term storage, divide the solution into aliquots and freeze at £ −20°C.
2. Working solution: dilute 1:100 in culture medium.
1. Reconstitute in 1 mL of deionized water to obtain a 5 mg/mL solution in phosphate buffer saline (PBS).
2. Add sodium azide at a fi nal concentration of 2 mM. 3. Store solutions at 2–6°C, protected from light. Do not
freeze.
1. Dilute 51.36 g sucrose in 10 mL distilled H 2 O. 2. Working solution: dilute 1:100 in culture medium.
1. Dilute 2 mg nystatin in 1 mL DMSO. Divide the solution into aliquots and frozen at £ −20°C. They have a shelf life of 24 months when stored frozen.
2. Working solution: dilute 1:1,000 in culture medium. 3. Solutions and aqueous suspensions are stable for 2–3 days.
1. Dilute 0.1 mg fi lipin in 1 mL DMSO. 2. Working solution: dilute 1:1,000 in culture medium. 3. Solutions of fi lipin in aqueous or organic solvents are not con-
sidered to be stable and it is recommended that they be pre-pared fresh and not stored as stock solutions.
1. Dilute 0.2 mg chlorpromazine in 1 mL distilled water. Divide the solution into aliquots and frozen at £ −20°C.
2. Working solution: dilute 1:1,000 in culture medium.
2.2. Solution
2.2.1. Dextran-Coupled Texas-Red (DXT-TXR, Molecular Probes, Invitrogen, Carlsbad, CA, USA)
2.2.2. Alexa Fluor 594 Transferrin (Molecular Probes, Invitrogen, Carlsbad, CA, USA)
2.2.3. Sucrose (Sigma Chemical Co., St Louis, MO, USA)
2.2.4. Nystatin (Sigma Chemical Co., St Louis, MO, USA)
2.2.5. Filipin (Sigma Chemical Co., St Louis, MO, USA)
2.2.6. Chlorpromazine (Sigma Chemical Co., St Louis, MO, USA)
78 P. Ramoino et al.
Stock solutions :
(a) 0.2 M monobasic NaH 2 PO 4 : Dissolve by stirring at room temperature (RT) 27.6 g in –distilled H 2 O to make 1 L.
(b) 0.2 M dibasic Na 2 HPO 4 : Dissolve by stirring at RT 28.4 g in distilled H – 2 O to make 1 L.
Note: Be sure the monobasic and dibasic are anhydrous and not hydrated; the formula weights will be different. PBS working solution : 0.1 M, pH 7.4
1. Mix 95 mL of 0.2 M monobasic (A solution) with 405 mL dibasic (B solution).
2. Add 500 mL water containing 90 g NaCl. 3. Adjust pH to 7.4 by adding dilute 1 N HCl if necessary. 4. Filter through Millipore fi lter, store at 4°C.
Note: PBS buffer is used for routine immunohistochemical staining. PBS is often used for diluting secondary antibodies. PBS-Triton X-100 is often used for washing steps.
1. Dissolve 8 g paraformaldehyde (PFA) in 100 mL of distilled H 2 O.
2. Heat to water (on heated stirrer and stir using magnetic bead) to 55–60°C to partially dissolve PFA.
3. Add 1 M NaOH dropwise (one or two drops) until solution clears.
4. Add 100 mL of 0.2 M PBS, mix. 5. Store at 4°C. Prolonged storage (>1 week) may require that
pH is checked. pH should be around 7.4. For long-term stor-age, divide the solution into aliquots and freeze at £ −20°C.
Do not autoclave! Caution: Formaldehyde is toxic, and the preparation process involving heating results in considerable vapor-ization, which increases the hazard. It is essential to use appropri-ate safety procedures, such as working in a fume hood.
1. Dissolve 3 g of bovine serum albumin (BSA) in 50 mL PBS. 2. Add 10 mL of 10% Triton X-100. 3. Bring volume up to 100 mL PBS. 4. Transfer into 10-mL centrifuge tubes. Keep the working ali-
quot at 2–8°C and freeze the other aliquots for up to 12 months at −20°C. Record the date prepared, expiration date, and the technician’s initials on each tube.
2.2.7. Phosphate Buffer Saline, pH 7.4
2.2.8. 4% Paraformaldehyde in 0.1 M PBS
2.2.9. 3% Bovine Serum Albumin in PBS Plus 1% Triton X-100

794 Visualizing GABA B Receptor Internalization and Intracellular Traffi cking
1. Dissolve 1 g of BSA in 50 mL PBS. 2. Add 1 mL of 10% Triton X-100. 3. Bring volume up to 100 mL PBS. 4. Transfer into 10-mL centrifuge tubes. Keep the working ali-
quot at 2–8°C and freeze the other aliquots for up to 12 months at −20°C. Record the date prepared, expiration date, and the technician’s initials on each tube.
1. Take 10 mL of concentrated HCl. 2. Add enough distilled water to make 120 mL.
Store at 4°C.
1. Dissolve 4 g of NaOH in distilled water. 2. Make up to 100 mL gives 1 N (or 1 M).
Store at 4°C.
1. To block the phagocytic activity, pretreat the cells for 15 min with tri fl uoperazine (2.5–5 m M) in the culture medium.
2. Incubate the cells in a culture medium containing a clathrin (150 mM sucrose or 0.2 m g/mL chlorpromazine) or a caveo-lin (0.1 m g/mL fi lipin or 2 m g/mL nystatin) inhibitor for 15–30 min.
3. Add the polyclonal antibody anti-GABA B -receptor R1 (1:100, fi nal concentration) and incubate at 25°C for 15–30 min.
4. Fix the cells with PAF 4% in PBS 0.2 M for 30 min. 5. Wash in PBS. 6. Process for GABA B immunolabeling.
Controls are cells without inhibitor.
1. Incubate the cells at 4°C for 30 min. 2. Add the prewarmed anti-GABA B receptor antibody (1:100,
fi nal concentration) and incubate at 4°C for other 30 min. 3. Wash in a cold culture medium. 4. Add the inhibitor. 5. Chase for 20 min at 25°C. 6. Fix the cells with PAF 4% in PBS 0.2 M for 30 min.
2.2.10. 1% BSA Plus 0.1% Triton X-100
2.2.11. 1 N HCl
2.2.12. 1 M NaOH
3. Methods
3.1. In Vivo Experiments
3.1.1. Inhibition of GABA B Receptor Internalization
3.1.2. Inhibition of GABA B Receptor Internalization After Receptor Accumulation on the Cell Membrane

80 P. Ramoino et al.
7. Wash in PBS. 8. Process for GABA B immunolabeling.
Controls are cells without inhibitor.
To further assess whether GABA B receptors are internalized by clathrin-dependent and/or -independent mechanisms, cells are incubated for various times both with the antibody anti-GABA B receptors and with a fl uid-phase or a receptor-mediated endocyto-sis marker.
1. Pretreat the cells for 15 min with tri fl uoperazine (2.5–5 m M) in the culture medium.
2. Add the anti-GABA B receptor antibody (1:100, fi nal concen-tration) and the fl uid-phase endocytosis marker dextran (0.02% w/v, fi nal concentration) or the receptor-mediated endocyto-sis marker transferrin (25 m g/mL, fi nal concentration).
3. Incubate at 25°C for 5–10 min. 4. Fix the cells with PAF 4% in PBS 0.2 M for 30 min. 5. Wash in PBS. 6. Process for GABA B immunolabeling.
All steps are carried out in a humidity chamber.
1. Fix the cells in 4% PFA in PBS buffer (0.1 M, pH 7.4) for 30 min.
2. Wash three times with PBS. 3. Incubate for 60 min with 3% BSA and 1% Triton X-100 in
PBS. 4. Remove the blocking permeabilizing buffer. 5. Incubate the cells overnight at 4°C with both the polyclonal
antibody against the GABA B receptor (1:1,000 dilution) and one of the monoclonal antibodies.
6. Wash three times in 1% BSA in PBS plus 0.1% Triton X-100 for 10 min each.
7. Apply a cocktail of the secondary antibodies anti-guinea pig IgG conjugated to Alexa Fluor 594 (dilution 1:300) and anti-mouse IgG conjugated to Alexa Fluor 488 (dilution 1:300) for 2 h at 37°C. Cover to protect from light. Always include a control with secondary antibodies alone.
8. Wash three times with PBS. 9. Mount the cells in glycerol buffer.
Note. The absence of cross-reactivity between the secondary antibodies was veri fi ed by omitting one of the primary antibodies during incubation. Moreover, for every combination of double labeling, single-labeled vesicles can be always observed in the cells.
3.1.3. GABA B Receptor Internalization Visualized by a Double Labeling
3.2. Indirect Immuno- fl uorescence
3.2.1. Immunolabeling for Confocal Microscopy

814 Visualizing GABA B Receptor Internalization and Intracellular Traffi cking
Immuno fl uorescence can be ampli fi ed by using the Alexa Fluor 488 signal ampli fi cation kit for mouse antibody (Molecular Probes).
1. Incubate the cells removed from blocking buffer overnight at 4°C in primary antibodies (anti-caveolin 1 and anti-GABA B receptor).
2. Wash for three times in 1% BSA in PBS plus 0.1% Triton X-100 for 10 min each.
3. Apply 10 m g/mL Alexa Fluor 488 rabbit anti-mouse (compo-nent A) and Alexa Fluor 594 goat anti-guinea pig (dilution 1:300) for 30 min at 37°C.
4. Wash for three times with 1% BSA in PBS plus 0.1% Triton X-100.
5. Incubate for 30 min at 37°C with 10 m g/mL Alexa Fluor 488 goat anti-rabbit (component B) and Alexa Fluor 594 goat antiguinea pig.
6. Wash three times with PBS. 7. Mount the cells in glycerol buffer.
– Acquire images by laser confocal scanning microscopy (CLSM) (for example, Leica TCS SP5 AOBS) equipped with an Ar (457-476-488-514 nm) 100-mW laser and a HeNe (543 nm) 1.5-mW laser using a one Airy disk unit pinhole diameter and an oil immersion HCX PL APO 63×/1.4 objective. Excite Alexa Fluor 488 with the 488-nm line of the Ar laser –and collect its fl uorescence in a spectral window of 500–530 nm. Excite Alexa 594 fl uorescence using the 543-nm excitation –wavelength and collect its fl uorescence in a spectral window of 590–620 nm. Excite Texas-Red fl uorescence using the 543-nm excitation –wavelength and collect its fl uorescence in a spectral window of 620–680 nm. Take serial optical sections through the cell at a – z -step of 50–75 nm with a laser power of 1.5 mW and illumination attenuated by a 50% transmission neutral-density fi lter to reduce photobleaching, a 1 Airy unit pinhole diameter. Acquire the double-stained images through green and red –channels according to a time-sequential protocol to reject pos-sible cross-talk artifacts. Use the software program of CLSM for image acquisition, –storage and analysis.
Image analysis can be performed using different software including those from CLSM or other commercial products such as Bitplane’s Imaris, Molecular Devices’MetaMorph and MatWork’s Matlab soft-wares, or public domain programs such as NIH’s MIPAV and ImageJ
3.2.2. Immuno fl uorescence Staining with Signal Ampli fi cation
3.3. Confocal Image Acquisition
3.4. Image Analysis

82 P. Ramoino et al.
(and its distributors, i.e., Fiji). We have used the ImageJ 1.34f software (Wayne Rasband, National Institute of Health, USA).
Background correction can be done in several ways.
1. Open the red and green images (File/Open); both images must be 8-bit or 16-bit grayscale (Image/Type/8 bit).
2. Choose Process/Subtract background. This menu command removes uneven background from images using a “rolling ball” algorithm.
3. Set the radius to at least the size of the largest object that is not part of the background. Running the command several times may produce better results.
1. Open the red and green images (File/Open); both images must be 8-bit or 16-bit grayscale.
2. Use the selection tools to select an area of background. 3. Run the menu command Plugins/ROI/BG Subtraction from
region of interest (ROI). This macro will subtract the mean of the ROI from the image plus an additional value equal to the standard deviation of the ROI multiplied by the scaling factor you enter (3 by default).
We generated cyto fl uorograms by plotting the gray values of pixels in red and green channel images against each other (ICA plugin of ImageJ).
1. Open the red and green images (File/Open); both images must be 8-bit or 16-bit grayscale.
2. Subtract background (see Sect. 3.4.1 ). 3. Run the ICA plugin (Plugins/Colocalization analysis/Intensity
Correlation analysis). Select red fl uorescent image (Channel 1) and green – fl uorescence image (Channel 2). Select the combination of channel color (Red:Green). – Choose “one” in the ROI box. – Select “Keep merged ROI” to obtain the merged image. – Select “Display color Scattered plot” to obtain a 2D –cyo fl uorogram.
1. Import image sequence of the two stacks. 2. Subtract background. 3. Open Image/Color/RGB merge and select “Keep Source
Image” to obtain a double-labeled image.
3.4.1. Background Correction
Rolling-Ball Background Correction
Region of Interest Background Correction
3.4.2. 2D Cyto fl uorogram
3.4.3. z -Pro fi le of the Fluorescence Intensity of Double-Stained Vesicles

834 Visualizing GABA B Receptor Internalization and Intracellular Traffi cking
4. Select a ROI de fi ning a yellow vesicle on the double-labeled image.
5. Open Analyse/Tools/ROI Manager and select “Add.” 6. Copy the selected ROI separately on green and red stacks. 7. Open Image/Stacks/Plot z -axis pro fi le for each stack. This
generates a plot window with mean intensity. The raw data are available by selecting “list.” This can be easily copied or saved/imported to Excel.
8. Plot the mean intensity vs. the slice number.
The literature is full of different methods for colocalization analy-sis, which probably re fl ects the fact that one approach does not necessarily fi t all circumstances. Here we report one of the analyses present in ImageJ.
The quantitative estimation of colocalized proteins was per-formed calculating the “colocalization coef fi cients” ( 41 ) . They express the fraction of colocalizing molecular species in each com-ponent of dual-color image and are based on the Pearson’s correla-tion coef fi cient, a standard procedure for matching one image with another in pattern recognition ( 42 ) . If two molecular species are colocalized, the overlay of their spatial distribution has a correlation value higher than that expected by chance alone. Costes et al. devel-oped an automated procedure to evaluate the correlation between the green and red channels with a signi fi cance level >95% ( 43 ) . The same procedure automatically determines an intensity threshold for each color channel based on a linear least-square fi t of the green and red intensities in the image’s 2D correlation cyto fl uorogram. Costes’ approach was accomplished by macroroutines integrated as plugins (WCIF Colocalization Plugins, Wright Cell Imaging Facility, Toronto Western Research Institute, Canada).
1. Open the red and green images (File/Open); both images must be 8-bit or 16-bit grayscale.
2. Subtract background (see Sect. 3.4.1 ). 3. Run Plugins/Colocalization Analysis/Colocalization Threshold
to obtain the result window. 4. Select red fl uorescent image (Channel 1) and green fl uorescence
image (Channel 2). 5. Choose “none” in the ROI box. 6. Select the combination of channel color (Red:Green). 7. Click set options to activate the Results Options dialog and to
choose the results to be reported. By default, all results are reported. In results tM1 represents colocalization of red vs. green and tM2 colocalization of green vs. red (tM = Manders colocalization coef fi cient corrected for threshold).
8. Carry out the experiments on at least 15 cells and repeat them on different occasions.
3.4.4. Quantitative Estimation of Colocalized Proteins

84 P. Ramoino et al.
1. Open the image (File/Open). 2. Remove background (see Sect. 3.4.1 ). 3. (a) When a single ROI is used:
Select a ROI de fi ning the area to be analyzed. – Select Analyze/Measure. This generates a window –with the mean fl uorescence intensity value.
(b) When more ROIs are used: Open ROI Manager plugin (Analyze/Tools/Roi –Manager) on toolbar. Select ROIs and “Add” to ROI manager (hotkey: t). –Clicking “Show All” helps avoid analyzing the same cell twice. Once fi nished selecting ROIs to be analyzed, click the –“More>>” button and select “Combine” Click “Measure.” This generates a window with the –mean fl uorescence intensity value.
Value the signi fi cance of differences between means by Student’s t -test (using, for example, GraphPad Prism, GraphPad, San Diego, CA).
In conclusion, using immunolabeling in confocal microscopy and image analysis we have shown the presence in Paramecium of proteins involved in the initiatory steps of endocytosis in mammalian cells.
According to our results, we assume that in Paramecium GABA B receptors undergo constitutive endocytosis by clathrin- and caveolin-dependent mechanisms, then are partly recycled to cell plasma membrane and partly degraded into lysosomes. Furthermore, we have shown that rab-like proteins are involved in the vesicle transport from one compartment to another. Comparing our data with the internalization and recycling mechanisms of other GPCRs observed in mammalian cells, we may deduce that a system typical of mammalian neuronal cells is already present in the single-celled organism Paramecium . Interestingly, this general mechanism has been maintained through evolution.
1. GABA B receptor internalization is mediated by clathrin-coated pits. To show the involvement of clathrin-coated vesicles in constitu-tive endocytosis of GABA B receptors, cells are double labeled with a guinea pig anti-GABA B receptor R1-subunit antibody
3.4.5. Quanti fi cation of Cell Membrane Fluorescence
3.5. Statistical Analysis
3.6. Conclusions
4. Notes

854 Visualizing GABA B Receptor Internalization and Intracellular Traffi cking
(red fl uorescence) and with a monoclonal anti-clathrin antibody (green fl uorescence). Staining with an anti-clathrin antibody led to a punctuate pattern both on cell membrane and inside the cytoplasm, representing endocytic vesicles and exocytic vesicles from the trans-Golgi network (TGN) (Fig. 4a, b ). Importantly, GABA B receptor and clathrin-coated vesicle clus-ters are partly colocalized (yellow fl uorescence). Colocalized pixels are shown in blue in the 2D cyto fl uorogram reported in Fig. 4c, d . The colocalization percentage of GABA B receptors with proteins involved in the endocytosis is given in Table 1 . Colocalization along the z- axes of double-stained vesicles is also demonstrated by the similarity of green and red pro fi les of their fl uorescence intensity. In Fig. 5 , the fi rst (a), middle (b), and last (c) images of a 40-plane 3- m m-thick z- stack (left side) and the z- pro fi le of the fl uorescence intensity of three different double-stained vesicles of each plane (right side) are shown.
Fig. 4. Colocalization of GABA B receptors and clathrin. In cells labeled with a polyclonal antibody against GABA B receptor ( b ) and a monoclonal antibody against clathrin HC ( a ), a clustered distribution of fl uorescence is detected on the plasma membrane and inside the cytoplasm. GABA B receptors and clathrin vesicles are partly colocalized (( c ), yellow fl uorescence). Bar, 20 m m. ( d ) 2D cyto fl uorogram: colocalized pixels are clustered along the diagonal line (visualized in blue ).

Table 1 Colocalization of GABA B receptor labeling with various endocytic protein labeling
Red Green Red/green (%) Green/red (%)
GABA B receptor Clathrin 18 ± 3 19 ± 3
GABA B receptor Caveolin 1 21 ± 6 25 ± 4
Every colocalization value is the average from four optical sections of ten cells. Data were calculated as the mean ± s.e.m. and are given in percent
Fig. 5. z -Stack pro fi le of fl uorescence intensity of double-labeled vesicles. The left side of the fi gure shows three optical planes (( a ), fi rst ; ( b ), middle ; ( c ), last ) from a stack of 40 images (total thickness 3 mm). For each focal plane a sample of three vesicles that show colocalization ( yellow ) of GABA B receptor ( red ) and clathrin ( green ) is selected ( white bars ). The right side of the fi gure shows fl uorescence-intensity distribution along the z -axis for each selected vesicle ( green , open circle ) ( red , fi lled circle ).

874 Visualizing GABA B Receptor Internalization and Intracellular Traffi cking
Treatment of cells with 150 mM sucrose or 0.2 m g/mL chlorpromazine signi fi cantly inhibits the internalization of receptors, as shown by the considerable reduction in receptors inside the cytoplasm (Fig. 6c, d ) when compared with the con-trol (Fig. 6a, b ). This observation strongly suggests that GABA B receptor internalization is mediated by clathrin-dependent endocytosis. In these in vivo experiments phagocytosis was blocked by tri fl uoperazine, a calmodulin antagonist that inhib-its the formation of phagosomes and stimulates endocytosis in Paramecium ( 44 ) .
Fig. 6. GABA B -receptor internalization is mediated by clathrin-coated vesicles. In cells whose phagocytic activity is blocked by tri fl uoperazine, 20-min treatment with 150 mM sucrose ( c ) or 0.2 m g chlorpromazine ( d ) inhibits receptor internalization, which can be seen by receptor accumulation on the cell membrane and receptor reduction inside the cytoplasm. Controls are cells incubated with the anti-GABA B receptor antibody for 1 ( a ) and 20 min ( b ) in the absence of inhibitors; the antibody is localized in endosomes and phagosomes. Incubation temperature, 25°C. Bar, 20 m m.

88 P. Ramoino et al.
2. The clathrin adaptor protein AP2 colocalizes with the GABA B receptor. After observation of a signi fi cant clathrin-mediated endocyto-sis of GABA B receptors, we analyzed the colocalization between the receptor subunits and the endocytic adaptor complex AP2 by using antibodies against the b 2 (adaptin b ) and m 2 (AP50) subunits. All antibodies revealed clusters of fl uorescence on the cell surface and inside the cytoplasm (Fig. 7 ) that represent AP2 in clathrin-coated pits on the plasma membrane and in coated vesicles in their endocytic pathway. Colocalization of some GABA B receptor clusters with AP2 complexes, seen as yellow staining in the merged panel, could be detected on the plasma membrane (Fig. 7a, b ). GABA B receptors also partly colocalized with AP180 (Fig. 7c ), a monomeric assembly protein involved in the organization and assembly of clathrin triskelia in clathrin-coated vesicles. In clathrin-mediated endocytosis, AP180 inter-acts with membrane phospholipids and AP2 complex.
3. Other proteins involved in the GABA B receptor internalization in Paramecium . We analyzed the subcellular localization of amphiphysin, dynamin and eps15. Staining the cell with anti-eps15 antibody results in a clear punctate staining pattern throughout the
Fig. 7. Colocalization of GABA B receptors ( red ) with proteins involved in clathrin-mediated endocytosis ( green ): ( a ) adaptin b , ( b ) AP50, ( c ) AP180, ( d ) eps15, ( e ) dynamin, and ( f ) amphiphysin. Colocalization is seen as a yellow fl uorescence. Bar, 20 m m.

894 Visualizing GABA B Receptor Internalization and Intracellular Traffi cking
whole cell (Fig. 7d ). Staining of the same cells with an anti-dynamin (Fig. 7e ) or with an anti-amphiphysin antibody (Fig. 7f ) revealed a similar punctate pattern representing coated pits, endocytic vesicles, and exocytic vesicles from the TGN. A partial colocalization of eps15, dynamin and amphiphysin (green stain) with GABA B receptors (red stain) was found, vis-ible as a yellow stain (Fig. 7d–f ).
4. GABA B receptor clathrin-independent endocytosis. Constitutive endocytosis of GABA B receptors in Paramecium a lso involves a clathrin-independent mechanism. When observed by confocal microscopy, caveolin 1 was revealed in distinct classes of intracellular endosomes. Colocalization of GABA B receptors and caveolin 1 was observed by indirect immuno fl uorescence of endogenous caveolin 1 and GABA B receptors both on cell surface and throughout the cytoplasm (Fig. 8 ).
Fig. 8. GABA B receptors interact with caveolin 1. Cells labeled with an anti-GABA B receptor antibody ( b ) and an anti-caveolin 1 antibody ( a ). ( c ) Colocalization is seen as a yellow fl uorescence. Bar, 20 m m. ( d ) 2D cyto fl uorogram: colocalized pixels are clustered along the diagonal line (visualized in blue ).

90 P. Ramoino et al.
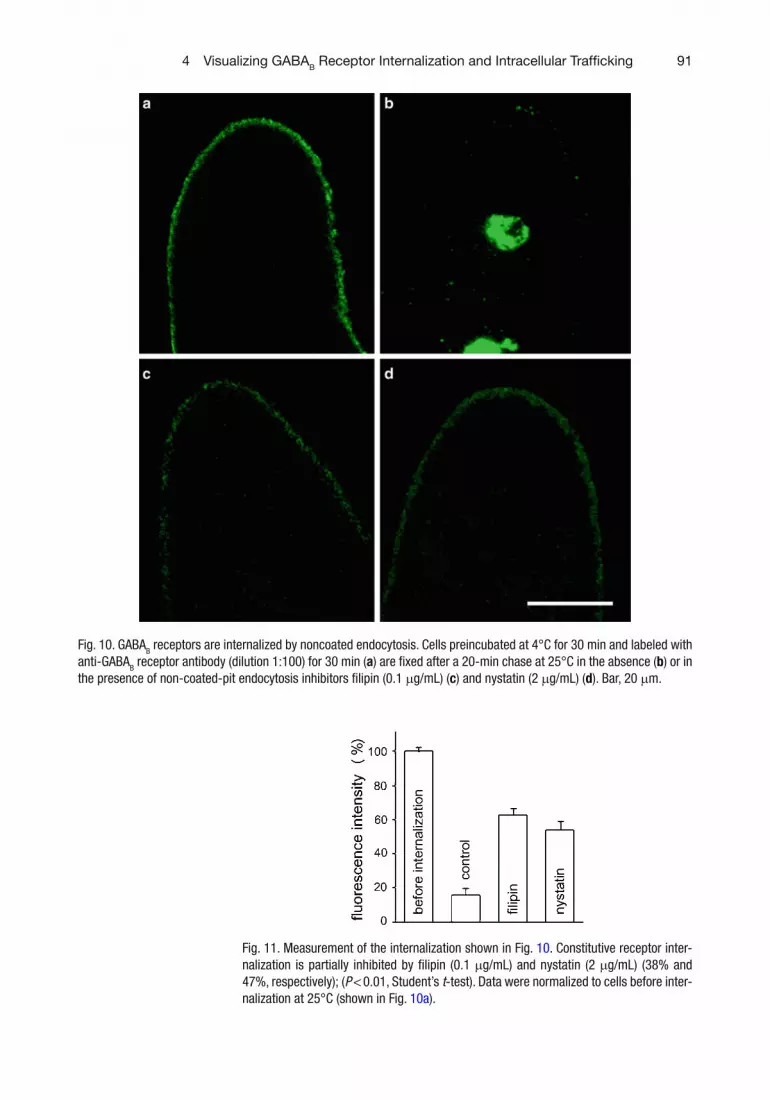
To further assess whether GABA B receptors are internal-ized by clathrin-independent mechanisms, cells were incubated for various times both with the antibody anti-GABA B receptors and with dextran, a fl uid-phase endocytosis marker. This revealed a colocalization of GABA B receptors and dextran in Paramecium cells (Fig. 9 ). Moreover, when endocytosis was blocked by fi lipin (0.1 m g/mL) or by nystatin (2 m g/mL), sterol-binding agents that disrupt caveolar structure and function, the receptor inter-nalization decreased (Fig. 10c , d). In these experiments, cells were incubated in the anti-GABA B receptor antibody for 30 min at 4°C (a temperature inhibiting phagosome and endo-some formation) ( 45 ) , so that receptors were accumulated on the cell membrane (Fig. 10a ). After removal of the excess of antibody, cells were incubated at 25°C. Eighty-four percent receptors were internalized in untreated cells after 20-min incubation at 25°C (Fig. 11 ), as shown both by the reduction of cell membrane fl uorescence intensity and by the fl uorescence localization into endosomes and phagosomes (Fig. 10b ). Only 37 and 46% fl uorescence was internalized in fi lipin ( P < 0.01) and nystatin-treated cells ( P < 0.01), respectively (Fig. 11 ). These results suggest that both endocytic processes (clathrin-dependent and/or -independent) occur in Paramecium and that the amount of receptors internalized through the two pathways is similar (Table 1 ).
5. Intracellular GABA B receptors traf fi cking after internalization: colocalization with endosomal markers. GABA B receptor antibody strongly labeled early endosomes, identi fi ed by antibody immunostaining against the molecular markers EEA1 and rab5. Both GABA B -like receptor and rab5-like immunoreactivities were localized in vesicles showing a
Fig. 9. GABA B receptors are internalized by a clathrin-independent endocytosis. Cells blocked in their phagocytic activity by tri fl uoperazine were incubated for 5 min at 25°C with anti-GABA B receptor antibody (a) and dextran-coupled Texas-Red (b). Colocalization of GABA B receptors and dextran (c) is seen inside the vesicles located on the cell membrane ( yellow ). Bar, 20 m m.
914 Visualizing GABA B Receptor Internalization and Intracellular Traffi cking
Fig. 10. GABA B receptors are internalized by noncoated endocytosis. Cells preincubated at 4°C for 30 min and labeled with anti-GABA B receptor antibody (dilution 1:100) for 30 min ( a ) are fi xed after a 20-min chase at 25°C in the absence ( b ) or in the presence of non-coated-pit endocytosis inhibitors fi lipin (0.1 m g/mL) ( c ) and nystatin (2 m g/mL) ( d ). Bar, 20 m m.
Fig. 11. Measurement of the internalization shown in Fig. 10 . Constitutive receptor inter-nalization is partially inhibited by fi lipin (0.1 m g/mL) and nystatin (2 m g/mL) (38% and 47%, respectively); ( P < 0.01, Student’s t -test). Data were normalized to cells before inter-nalization at 25°C (shown in Fig. 10a ).

92 P. Ramoino et al.
clustered distribution near the cell membrane and in the most inner portion of the cytoplasm; with the double immunolabel-ing method most of the peripheral vesicle clusters appeared yellow because GABA B -like receptors and rab5-like immuno-reactivities partly colocalized (Fig. 12a ). A similar colocaliza-tion pattern was obtained using, together with the anti-GABA B R1 antibody, either the monoclonal antibodies anti-EEA1 (Fig. 12b ) or anti-rabaptin-5 (Fig. 12c ).
6. Retrieval of GABA B receptors by recycling endosomes. Internalized receptors, destined for recycling back to the plasma membrane, that traf fi c from the early endosomes to the endosomal-recycling compartment were characterized by the presence of rab4 and rab11 proteins. To visualize GABA B receptor retrieval, the cells were double labeled with anti-GABA B R1 and, either anti-rab4 or anti-rab11 as primary antibodies, visualized with anti-guinea pig Alexa Fluor 594 and anti-mouse Alexa Fluor 488 secondary antibodies, respec-tively. All immunostained vesicles showed a clustered distribu-tion near the cell membrane and inside the cytoplasm; the yellow immuno fl uorescent vesicles, due to the colocalization of the GABA B -like receptor with either rab4-like or rab11-like immuno fl uorescence, distributed in the peripheral zone is vis-ible in Fig. 13a, b . Rab11 also controls the traf fi c to the TGN, which is gener-ally identi fi ed through the marker TGN38. Moreover, TGN38 protein was shown to undergo constitutive cycling through the cell surface by passing late endosomes as it moves back to the TGN ( 46 ) . Evidence was given for the presence of GABA B receptors in the TGN by the colocalization of GABA B -like with TGN38-like immunoreactivity; the yellow fl uorescence was
Fig. 12. Colocalization of GABA B receptors ( red ) with proteins involved in the intracellular traf fi cking ( green ): ( a ) rab5, ( b ) EEA1, ( c ) rabaptin-5. In all cases examined, most receptors aggregate in clusters and their fl uorescence is localized in spots distributed on the plasma membrane and throughout the cytoplasm. Colocalization is seen as a yellow fl uorescence . Bar, 20 m m.

934 Visualizing GABA B Receptor Internalization and Intracellular Traffi cking
detected in a small number of vesicles located in the cytoplasm (Fig. 13c ). Indeed, the Golgi apparatus of Paramecium is decentralized and occurs as hundreds of small stacks of three or so highly cisternae scattered throughout the cytoplasm ( 47 ) .
7. GABA B receptors are degraded into lysosomes. In addition to receptor recycling, another possible fate for sequestered receptors is their degradation. Receptors destined for degradation exit the endosomal pathway at the early endo-somes and traf fi c to the late endosome–lysosome pathway. We have shown that in Paramecium most of the GABA B -like recep-tor immunostained vesicles were also immunolabeled with the lysosomal marker LAMP1 antibody (Fig. 13d ).
Fig. 13. Internalized GABA B receptors are retrieved to cell membrane or degraded into lysosomes. Colocalization of GABA B recep-tors ( red ) with ( a ) rab4, ( b ) rab11, ( c ) TGN38, and ( d ) LAMP1 proteins ( green ) is seen as a yellow fl uorescence . Bar, 20 m m.

94 P. Ramoino et al.
References
1. Bowery NG, Bettler B, Froestl W, Gallagher JP, Marshall F, Raiteri M et al (2002) International Union of Pharmacology. XXXIII. Mammalian gamma-aminobutyric acid(B) receptors: struc-ture and function. Pharmacol Rev 54:247–264
2. Ferguson SS (2001) Evolving concepts in G protein-coupled receptor endocytosis: the role in receptor desensitization and signaling. Pharmacol Rev 53:1–24
3. Seifert R, Wenzel-Seifert K (2002) Constitutive activity of G-protein-coupled receptors: cause of disease and common property of wild-type receptors. Naunyn Schmiedebergs Arch Pharmacol 366:381–416
4. Royle SJ, Murrell-Lagnado RD (2003) Constitutive cycling: a general mechanism to regulate cell surface proteins. Bioessays 25:39–46
5. Tehrani MHJ, Barnes EM Jr (1997) Sequestration of gamma-aminobutyric acid A receptors on clathrin-coated vesicles during chronic benzodiazepine administration in vivo. J Pharmacol Exp Ther 283:384–390
6. Grampp T, Notz V, Broll I, Fischer N, Benke D (2008) Constitutive, agonist-accelerated, recy-cling and lysosomal degradation of GABA B receptors in cortical neurons. Mol Cell Neurosci 39:628–637
7. Traub LM (2010) Tickets to ride: selecting cargo for clathrin-regulated internalization. Nat Rev Mol Cell Biol 10:583–596
8. Kirchhausen T (1999) Adaptors for clathrin-mediated traf fi c. Annu Rev Cell Dev Biol 15:705–732
9. Takei K, Hauke V (2001) Clathrin-mediated endocytosis: membrane factors pull the trigger. Trends Cell Biol 11:385–391
10. Traub LM (2003) Sorting it out: AP-2 and alternate clathrin adaptors in endocytic cargo selection. J Cell Biol 163:203–208
11. Owen DJ, Collins BM, Evans PR (2004) Adaptors for clathrin coats: structure and func-tion. Annu Rev Cell Dev Biol 20:153–191
12. Rodemer C, Haucke V (2008) Clathrin/AP-2-dependent endocytosis: a novel playground for the pharmacological toolbox? Handb Exp Pharmacol 186:105–122
13. Shupliakov O, Low P, Grabs D, Gad H, Chen H, David C et al (1997) Synaptic vesicle endo-cytosis impaired by disruption of dynamin-SH3 domain interactions. Science 276:259–263
14. Cupers P, Jadhav AP, Kirchhausen T (1998) Assembly of clathrin coats disrupts the associa-tion between Eps15 and AP-2 adaptors. J Biol Chem 23:1847–1850
15. Nichols BJ, Lippincott-Schwartz J (2001) Endocytosis without clathrin coats. Trends Cell Biol 11:406–412
16. Tsao PI, von Zastrow M (2001) Diversity and speci fi city in the regulated endocytic membrane traf fi cking of G-protein-coupled receptors. Pharmacol Ther 89:39–147
17. Johannes L, Lamaze C (2002) Clathrin-dependent or not: is it still the question? Traf fi c 3:443–451
18. Chini B, Parenti M (2004) G-protein coupled receptors in lipid rafts and caveolae: how, when and why do they go there? J Mol Endocrinol 32:325–338
19. von Zastrow M, Kobilka BK (1994) Antagonist-dependent and -independent steps in the mech-anism of andrenergic receptor internalization. J Biol Chem 269:18448–18452
20. Zhang J, Ferguson SS, Barak LS, Menard L, Caron MG (1996) Dynamin and beta-arrestin reveal distinct mechanisms for G protein-cou-pled receptor internalization. J Biol Chem 271:18302–18305
21. Raposo G, Dunia I, Delavier-Klutchko C, Kaveri S, Strosberg AD, Benedetti EL (1989) Internalization of beta–adrenergic receptor in A431 cells involves non-coated vesicles. Eur J Cell Biol 50:340–352
22. Dupree P, Parton RG, Raposo G, Kurzchalia TV, Simons K (1993) Caveolae and sorting in the trans-Golgi network of epithelial cells. EMBO J 12:1597–1605
23. Roettger BF, Rentsch RU, Pinon D, Holicky E, Hadac E, Larkin JM et al (1995) Dual path-ways of internalization of the cholecystokinin receptor. J Cell Biol 128:1029–1041
24. Daukas J, Zigmond SH (1985) Inhibition of receptor-mediated but not fl uid-phase endocy-tosis in polymorphonuclear leukocytes. J Cell Biol 101:1673–1679
25. Heuser JE, Anderson RG (1989) Hypertonic media inhibit receptor-mediated endocytosis by blocking clathrin-coated pit formation. J Cell Biol 108:389–400
26. Wang L-H, Rothberg KG, Anderson RGW (1993) Mis-assembly of clathrin lattices on endosomes reveals regulatory switch for coated pit formation. J Cell Biol 123:1107–1117
27. Schnitzer JE, Oh P, Pinney E, Allard J (1994) Filipin-sensitive caveolae-mediated transport in endothelium: reduced transcytosis, scavenger endocytosis, and capillary permeability of selected macromolecules. J Cell Biol 127:1217–1232

954 Visualizing GABA B Receptor Internalization and Intracellular Traffi cking
28. Lamaze C, Schmid SL (1995) The emergence of clathrin-independent pinocytic pathways. Curr Opin Cell Biol 7:573–580
29. Seabra MC, Mules EH, Hume AN (2002) Rab GTPases, intracellular traf fi c and disease. Trends Mol Med 8:23–30
30. Seachrist JL, Ferguson SSG (2003) Regulation of G protein-coupled receptor endocytosis and traf fi cking by Rab GTPases. Life Sci 74:225–235
31. Grosshans BL, Ortiz D, Novick P (2006) Rabs and their effectors: achieving speci fi city in membrane traf fi c. Proc Natl Acad Sci USA 103:11821–11827
32. Stenmark H (2009) Rab GTPases as coordina-tors of vesicle traf fi c. Nat Rev Mol Cell Biol 10:513–525
33. Allen RD, Fok AK (2000) Membrane traf fi cking and processing in Paramecium . Int Rev Cytol 198:277–318
34. Plattner H, Kissmehl R (2003) Molecular aspects of membrane traf fi cking in Paramecium . Int Rev Cytol 232:185–216
35. Allen RD (1988) Cytology. In: Görtz H-D (ed) Paramecium . Springer, Berlin, pp 4–40
36. Nilsson JR, van Deurs P (1983) Coated pits and pinocytosis in Tetrahymena . J Cell Sci 63:209–222
37. Allen RD, Fok AK (1993) Endosomal mem-brane traf fi c of ciliates. In: Plattner H (ed) Advances in cell and molecular biology of mem-branes, membrane traf fi c in protozoa. JAI Press, Greenwich, CT, pp 283–309
38. Ramoino P, Fronte P, Fato M, Beltrame F, Robello M, Diaspro A (2001) Fluid phase and receptor mediated endocytosis in Paramecium . Eur Biophys J 30:305–312
39. Ramoino P, Gallus L, Beltrame F, Diaspro A, Fato M, Rubini P et al (2006) Endocytosis of GABA B receptors modulates membrane excit-ability in the single-celled organism Paramecium . J Cell Sci 119:2056–2064
40. Ramoino P, Usai C, Beltrame F, Fato M, Gallus L, Tagliaferro G et al (2005) GABA B receptor intracellular traf fi cking after internalization in Paramecium . Microsc Res Tech 68:290–295
41. Manders EM, Verbeek FJ, Aten JA (1993) Measurement of co-localization of objects in dual colour confocal images. J Microsc 169:375–382
42. Gonzalez RC, Wintz P (1987) Digital image processing, 2nd edn. Addison Wesley, Massachusetts
43. Costes SV, Daelemans D, Cho EH, Dobbin Z, Pavlakis G, Lockett S (2004) Automatic and quantitative measurement of protein-protein colocalization in live cells. Biophys J 86:3993–4003
44. Fok AK, Leung SS-K, Chun DP, Allen RD (1985) Modulation of the digestive lysosomal system in Paramecium caudatum . II. Physiological effects of cytochalasin B, colchicine and tri fl uoperazine. Eur J Cell Biol 37:27–34
45. Fok AK, Leung SS-K, Allen RD (1984) Modulation of the digestive lysosomal system in Paramecium caudatum . I. Effects of tem-perature. Eur J Cell Biol 34:265–270
46. Mallet WG, Max fi eld FR (1999) Chimeric forms of furin and TGN38 are transported with the plasma membrane in the trans-Golgi net-work via distinct endosomal pathways. J Cell Biol 146:345–359
47. Estève J-C (1972) L’appareil de Golgi des Ciliés. Ultrastructure, particulièrement chez Paramecium . J Protozool 19:609–618