visualization viewpoints - visualization and 3d data processing in the david restoration
TRANSCRIPT

Visualization and 3D data processing in David’s restoration
M. Callieri, P. Cignoni, F. Ganovelli, G. Impoco,C. Montani, P. Pingi, F. Ponchio, R. Scopigno ∗
Istituto di Scienza e Tecnologie dell’Informazione (ISTI),Consiglio Nazionale delle Ricerche, Pisa, Italy
January 16, 2004
1 Introduction
The David restoration project (started in Florencein 2002) has given several guidelines to the defi-nition and development of innovative solutions toprocess and visualize 3D data in the frameworkof Cultural Heritage (CH) applications. Our maingoal has been to demonstrate the usefulness of dig-ital 3D models and of visualization tools in theframework of a restoration project. 3D modelshave been used in CH mostly for still/interactiverendering and for physical reproduction via rapidprototyping technology. CH restoration is anotherfield where a large number of proficient uses of accu-rate 3D models and visualization can be proposed.Restoration is nowadays a very complex task, wheremultidisciplinary skills and knowledge are required.A complex set of investigations usually precedesthe restoration of a valuable artwork: visual in-spection, chemical analysis, different type of image-based analysis (RGB or colorimetric, UV light re-flection, X-Ray, etc.), structural analysis, histori-cal/archival search, etc. These analysis might alsobe repeated on time to monitor the status of theartwork and the effects of the restoration actions.An emerging quest is how to manage all the re-sulting multimedia data (text/annotations, histori-cal documents, 2D/3D images, vectorial reliefs, nu-meric data coming from the analysis, etc.) in aintegrated framework, making all information ac-cessible to the restoration staff (and, possibly, toexperts and ordinary people as well). The final goalis to guide the restorer in the choice of the properrestoration procedure by the evidence of the analy-
∗For further information: R. Scopigno, ISTI-CNR, v.Moruzzi 1, 56126 Pisa Italy. E-mail: [email protected]
sis performed, and to assess in a objective mannerthe results of the restoration (to compare the pre-and post-restoration status of the artwork, to doc-ument the restoration process). Since most of theinformation is directly related to spatial locationson the artwork surface, 3D models can be valuablemedia to index, store, cross-correlate and obviouslyvisualize all this information. 3D models can alsobe a valuable instrument in the final assessmentphase, supporting the interactive inspection of themultiple digital models (pre- and post-restorationstatus) to check possible shape and color variations.
We experimented different uses of 3D graphics forthe restoration of the David, ranging from the clas-sical scientific visualization tasks to more complexinformation visualization applications. Accordingto our experience, the tools available (either com-mercial or academic systems) do not satisfy allthe potential needs of computer-aided restoration.While in some cases standard visualization featuresare sufficient (e.g. to present a scalar field over a3D surface, see our surface exposure investigation),other applications often require more sophisticatedtools to map multimedia information to the art-work surface and to present those data visually, e.g.joining the capabilities of a 3D GIS with the onesof a multi-media information visualization system.Moreover, the frame buffer cannot be the only com-munication channel with CH people. They still re-quire paper-based documents, and a screen dumpis not a satisfactory answer to users’ needs. Visual-ization instruments should be able to encode infor-mation into printable documents; basic features arethe accuracy of the printed representation (displayresolution is poor when printed on a large paperformat), and the capability to easily select a known
1
scale factor (see the short description of the Cav-alieri system in the section on Physical measuresevaluation).
The David restoration is as an ideal testbed,since a complex set of scientific investigations hasbeen planned both before and after the restora-tion intervention. This gave us the opportunity ofattempting different methodologies to support re-storers/scientists with the use of visualization toolsbased on 3D digital models. In particular, a 3D dig-ital model can be used to support restoration in twodifferent ways: as a tool for the execution of spe-cific investigations, or as a supporting media for thearchival and integration of the restoration-relatedinformation, gathered with the different studies andanalysis performed on the artwork. Let us describein the following two sections the work done (a moredetailed description of the technology used or de-veloped is available in [10]).
– Start of Proposed Side Bar –3D graphics (data acquisitionand processing) in CulturalHeritage
Modern 3D scanning technologies allow recon-structing 3D digital representations of CulturalHeritage artifacts in a semi-automatic way, withvery high accuracy and wealth of details [1, 4].The requirements of Cultural Heritage (CH) appli-cations (high precision and dense sampling in shapereconstruction, joint management of shape and op-tical properties of the surface) make 3D scanning aproper technology. Pioneering activities started inCanada and US [5, 12, 6] and many of these effortsfocused on Italian artistic masterpieces. An exam-ple of what can be obtained is the Michelangelo’sDavid model (56 million triangles, reconstructedfrom 4000 range maps using a distance field with 1mm. cell size), produced by the Stanford’s DigitalMichelangelo Project [6].
The availability of an accurate digital represen-tation opens several possibilities of use to the ex-perts (restorers, archivists, museum curators) or toordinary people (students, museum visitors). Sofar, most 3D scanning results have been used justto produce still images, interactive visualization or
animations: the classical rendering-oriented appli-cations are still predominant. On the other hand,people working in the CH field are initially fas-cinated by the beautiful images we can produce,but quite soon they ask for visualization or dataprocessing tools really useful in their day by daywork. We agree with them: the use of 3D mod-els should go beyond the creation of synthetic im-ages. Projects proposing 3D graphics as an analyt-ical tool are still rare [7, 11, 12].
An exciting opportunity is to introduce thecombined used of 3D digital models together withad-hoc visualization tools in artworks restoration.However, while the cost for acquiring a 3D model ofan artwork is progressively reducing - we recentlyperformed a complete scanning of the Minerva ofArezzo [9] (a bronze statue, 1.60 m. tall) in justone week1, range-maps post-processing included- the main difficulties of the integration rise fromthe lack of visualization tools specifically designedfor this application field.
– End of Proposed Side Bar –
2 3D data as a tool to studyan artwork
As stated before, specific scientific investigationscan be conducted directly on the digital 3D model.In the David restoration, we performed two main“digital” investigations: the characterization of thesurface exposure with respect to the fall of contami-nants, and the computation of a number of physicalmeasures. In both cases, ad-hoc codes have beenimplemented to process data and present the re-sults to the users.
2.1 Surface exposure characteriza-tion
We designed and implemented a tool to evaluatethe exposure of the David’s surface to the fall ofcontaminants (e.g. fall of rain, mist or dust). Thisphenomenon depends on: the direction of fall of the
1See some data on our last Minerva scan-ning by following the Digital Minerva link onhttp://vcg.isti.cnr.it/projects/projects.htm
2

Figure 1: Exposure of David’s surface to dust orother contaminations. This visualization shows, us-ing a false-color ramp, the different classes of expo-sition produced by the simulation (red: absence offall, blue: high density of fall), under a maximal an-gle of fall of 5 degrees (on the left) and 15 degrees(on the right).
contaminant, the surface slope, the self-occlusionand the accessibility of the different surface parcels.Our tool produces several qualitative and quanti-tative results, useful to characterize the artworksurface. The falling directions of the contaminantagents is modelled by assuming a random fall di-rection, uniformly distributed around the verticalaxis of the statue within an angle α which definesthe maximum fall inclination.
Figure 1 shows some results obtained on theDavid. The different exposures are visualized us-ing a false-colour ramp; the digital 3D model istherefore used both to compute the simulation andto present visually the results. Numeric data havealso been produced (tables and graphs).
Figure 2: Spatial location of David’s barycentre,with and without basement and feet (top); zoomedimages of the former.
2.2 Physical measures
Physical measures can be computed directly onthe digital 3D model, e.g.: David’s surface (19.47squared meters) or its volume (2.098 cubic meters).Known the unit weight of the artwork material, thetotal weight can be immediately computed from thevolume measure. Point-to-point distances are alsooften needed, and can be simply computed on the3D model by adding a linear measuring feature tothe browser used to visualize the digital model. Alinear measuring feature has been included in ourvisualization tool (Easy3DView): the user simplyselects two points on David’s surface and the toolcomputes the linear distance between those two
3

Figure 3: Visualization of the projection of the cen-ter of mass (marked by a yellow circle) and of theprofiles of some cut-trough sections (ankles, kneesand groin; see the respective hight in the right-mostimage).
points.One of the issues under evaluation in David’s
restoration is the statics of the statue, since somecracks on the back of the ankles frighten the cura-tors. These cracks could have been generated by awrong distribution of the mass of the statue (thereare historical papers which sustain that the originalbasement was not properly planar, and the statuewas slanting forward). Therefore, an investigationon the statics of the statue was included in the setof investigations to be done before the restoration.The basic data for the static investigation are themass properties (volume, centre of mass and themoments and products of inertia of the centre ofmass), which have been computed directly on thedigital 3D model using an algorithm that exploitsan integration of the whole volume assuming con-
stant density of the mass [8]. From this computa-tion we obtained that the statue’s centre of mass isplaced in the interior of the groin, approximately inthe pelvis (see a visualization in Fig. 2). The verti-cal projection of the centre of mass on the base ofthe statue (i.e. the sculptured rocky base where theDavid stands) is the blue line, which exits from themarble on the high posterior part of the left thighand enters again in the marble on the right foot.We estimated also the centre of mass by remov-ing the basement (cutting the statue at the heightof the main cracks); the new position is again inFigure 2. The projection of the centre of mass onthe statue base has been documented with a largesize plot (see Fig. 3) produced with a proprietaryapplication called Cavalieri [3]. We designed Cava-lieri to support the easy production of large formatprints (orthographic drawings and cut-through sec-tions, produced according with the user-selected re-production scale) from the very high resolution 3Dmodels produced with 3D scanning technology.
3 3D models as a media toindex, archive and visualizedata on the restoration pro-cess
A second important use of 3D models is to con-sider them as an instrument to document, organizeand present the restoration data. During the Davidrestoration campaign, a number of scientific inves-tigations have been performed; some of them will berepeated periodically, in order to monitor the statusof the statue. These investigations include: differ-ent chemical analysis (to find evidence of organicand inorganic substances present on the surface ofthe statue), petrographic and colorimetric charac-terization of the marble, UV imaging, X-Ray, etc.All the results produced by the scientific investiga-tions are going to be organized and made accessiblethrough a system implemented with web technol-ogy. The 3D model of the David is used to build dif-ferent spatial indexes to those data (see Figure 4),pointing out their location on the surface of thestatue and supporting hyperlinks to web pages de-scribing the corresponding investigation and the re-sults obtained.
4

Figure 4: The digital model is used as an index tothe scientific investigations performed on selectedpoints or on sub-regions of the statue’s surface.
Some investigations produced image-based re-sults, which can be directly mapped on the statuesurface and presented in an integrated manner.An example is the case of the Ultra-Violet (UV)imaging investigation. Images produced under UVlighting are very important to give visual evidenceof organic deposits on the marble surface (e.g.wax), which have to be removed with proper sol-vents. The UV investigation performed by the Opi-ficio delle Pietre Dure (a renowned Italian pub-lic restoration institution) produced many 2D im-ages taken from different viewpoints. These imagescan be mapped onto the 3D surface using an ap-proach which computes the inverse projection andthe camera specification from each single photo-graph and combines all the available photographsin a single texture map which is wrapped aroundthe 3D geometry [2]. Using these visualization pro-cesses, we are able to map image-based informationon the corresponding location of the 3D object sur-face and to inspect all of the images at the sametime with the help of an interactive browser (Fig-ure 5).
Another important source of data is the high-resolution photographic survey of the David, per-formed by a professional photographer with digi-
Figure 5: Mapping multiple UV images on the dig-ital 3D model.
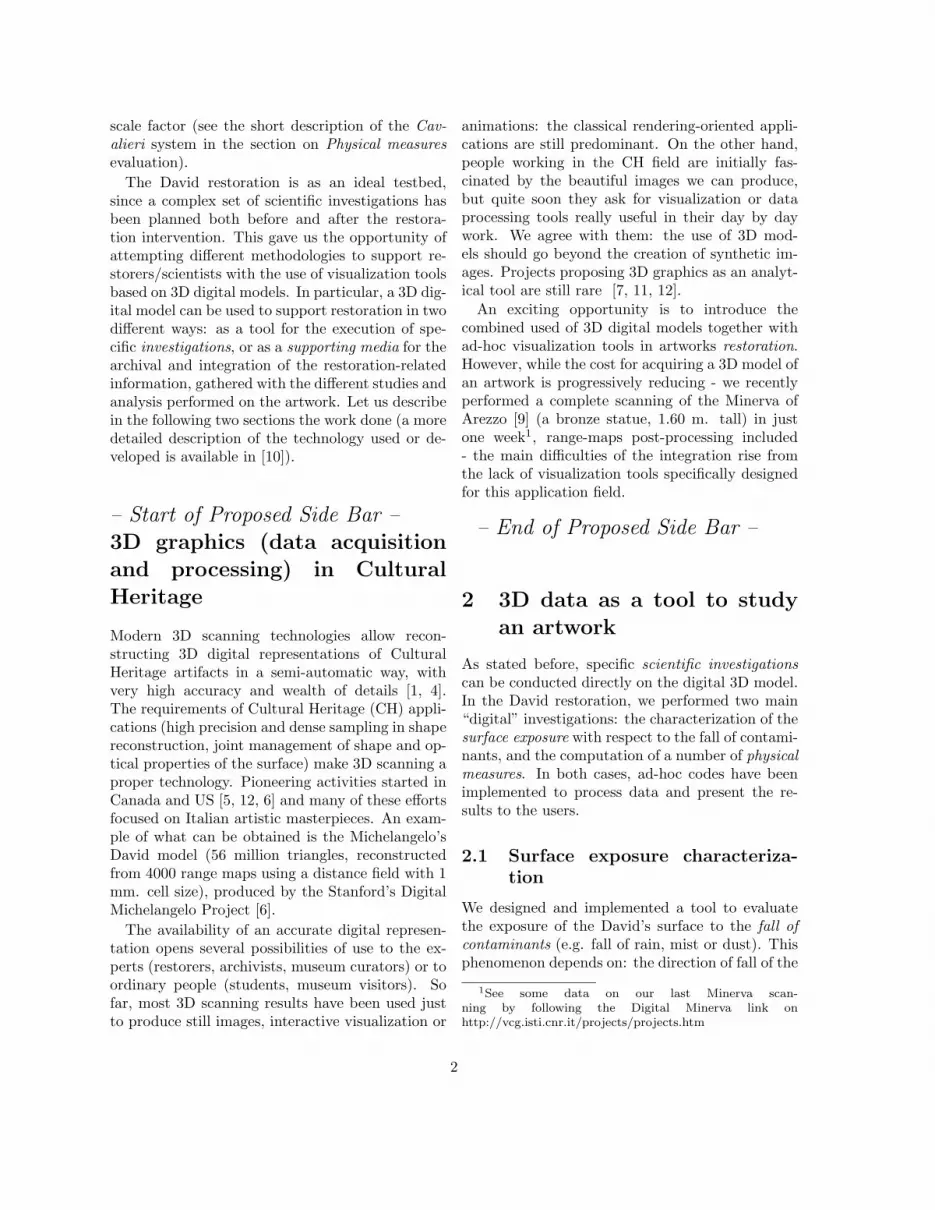
tal technology and according to the specificationsgiven by our group. The photographic samplingwas planned as shown in Figure 6. The reason forplanning these photos is to document the statusof the statue before the restoration. These RGBimages can be mapped as well to the 3D mesh (seeFig. 7) with the same methodology used for the UVimages. Moreover, the restorer Agnese Parronchihas performed a precise graphic survey on the sta-tus of David’s surface. She drew very accurate an-notations on those high resolution photos, coveringall the surface of the statue. These annotations de-scribe in a very detailed manner: the imperfectionsof the marble (small holes or veins); the presenceof deposits and strains (e.g. brown spots or thetraces of straining rain); the surface consumption;the remaining traces of the Michelangelo’s work-manship. Agnese Parronchi drew these annotationson transparent acetate layers positioned onto eachprinted photo (in A3 format). Therefore, we have4 different graphic layers for each one of the 68high-resolution photos. These graphic reliefs havebeen scanned, registered (roto-translation+scaling)on the corresponding RGB image, and saved atthe same resolution of the corresponding RGB im-age. A web-based system has been implementedto browse the RGB images and to plot in overlayany relief layer selected by the user (see Figure 8).We decided to show the reliefs in overlay onto theRGB images, thus to use a 2D-based visualization
5
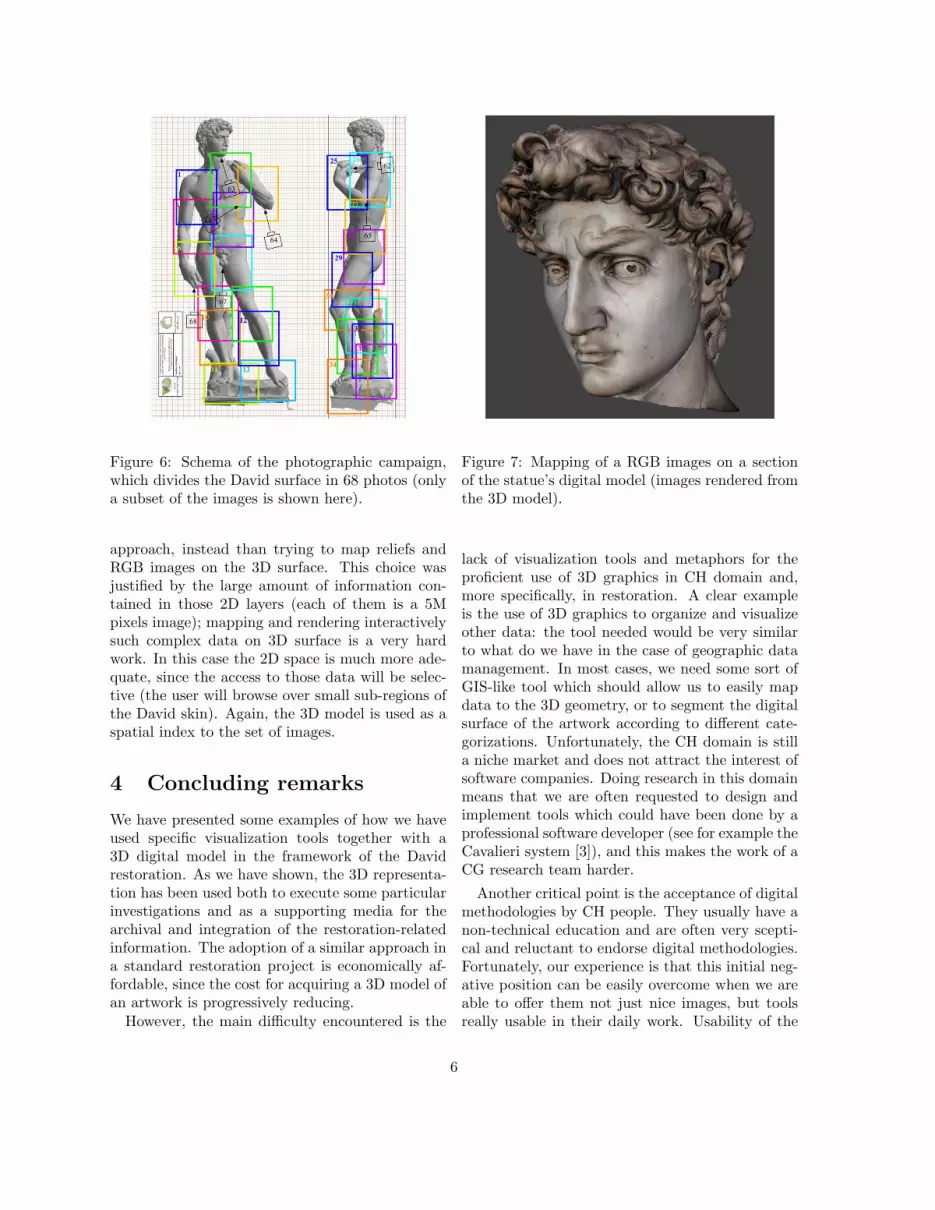
Figure 6: Schema of the photographic campaign,which divides the David surface in 68 photos (onlya subset of the images is shown here).
approach, instead than trying to map reliefs andRGB images on the 3D surface. This choice wasjustified by the large amount of information con-tained in those 2D layers (each of them is a 5Mpixels image); mapping and rendering interactivelysuch complex data on 3D surface is a very hardwork. In this case the 2D space is much more ade-quate, since the access to those data will be selec-tive (the user will browse over small sub-regions ofthe David skin). Again, the 3D model is used as aspatial index to the set of images.
4 Concluding remarks
We have presented some examples of how we haveused specific visualization tools together with a3D digital model in the framework of the Davidrestoration. As we have shown, the 3D representa-tion has been used both to execute some particularinvestigations and as a supporting media for thearchival and integration of the restoration-relatedinformation. The adoption of a similar approach ina standard restoration project is economically af-fordable, since the cost for acquiring a 3D model ofan artwork is progressively reducing.
However, the main difficulty encountered is the
Figure 7: Mapping of a RGB images on a sectionof the statue’s digital model (images rendered fromthe 3D model).
lack of visualization tools and metaphors for theproficient use of 3D graphics in CH domain and,more specifically, in restoration. A clear exampleis the use of 3D graphics to organize and visualizeother data: the tool needed would be very similarto what do we have in the case of geographic datamanagement. In most cases, we need some sort ofGIS-like tool which should allow us to easily mapdata to the 3D geometry, or to segment the digitalsurface of the artwork according to different cate-gorizations. Unfortunately, the CH domain is stilla niche market and does not attract the interest ofsoftware companies. Doing research in this domainmeans that we are often requested to design andimplement tools which could have been done by aprofessional software developer (see for example theCavalieri system [3]), and this makes the work of aCG research team harder.
Another critical point is the acceptance of digitalmethodologies by CH people. They usually have anon-technical education and are often very scepti-cal and reluctant to endorse digital methodologies.Fortunately, our experience is that this initial neg-ative position can be easily overcome when we areable to offer them not just nice images, but toolsreally usable in their daily work. Usability of the
6
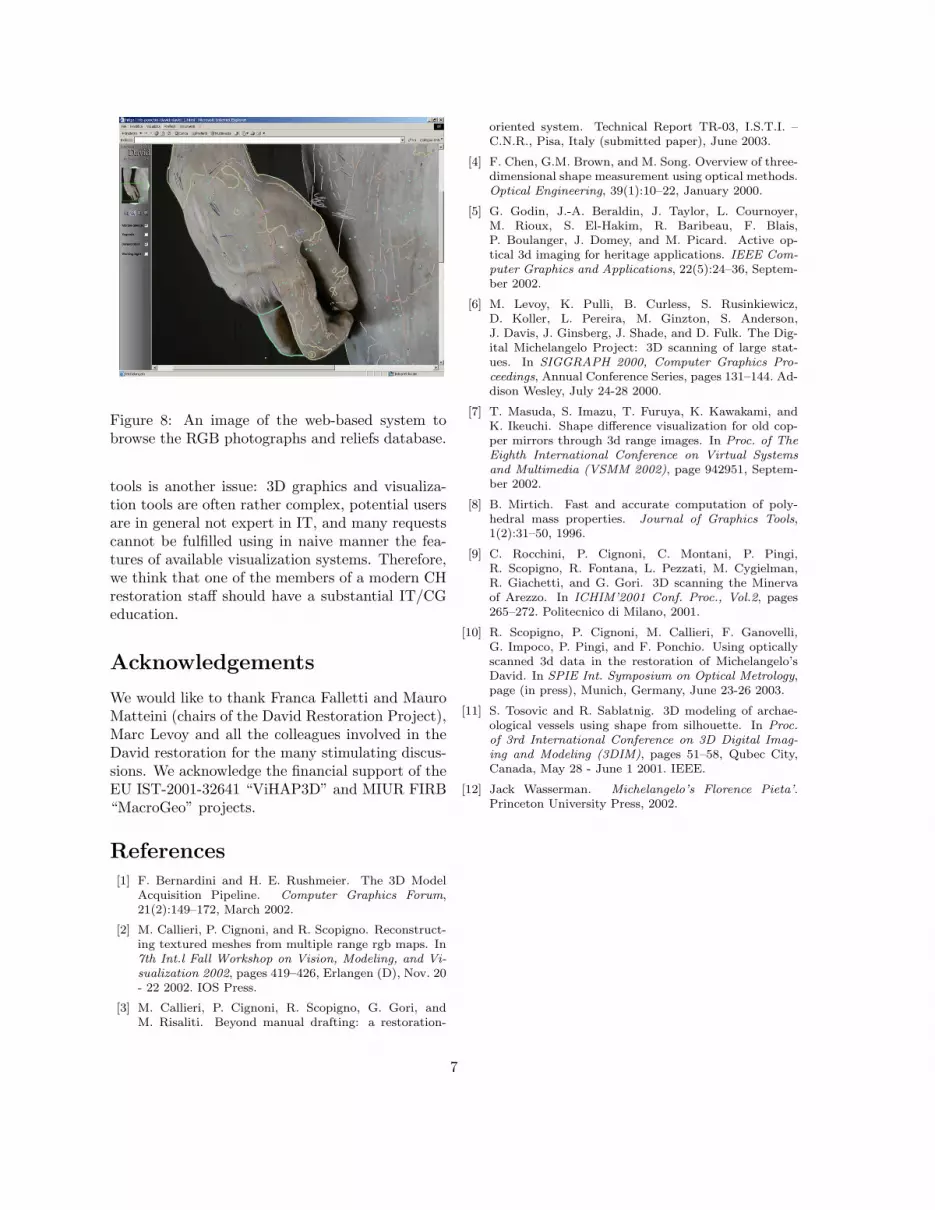
Figure 8: An image of the web-based system tobrowse the RGB photographs and reliefs database.
tools is another issue: 3D graphics and visualiza-tion tools are often rather complex, potential usersare in general not expert in IT, and many requestscannot be fulfilled using in naive manner the fea-tures of available visualization systems. Therefore,we think that one of the members of a modern CHrestoration staff should have a substantial IT/CGeducation.
Acknowledgements
We would like to thank Franca Falletti and MauroMatteini (chairs of the David Restoration Project),Marc Levoy and all the colleagues involved in theDavid restoration for the many stimulating discus-sions. We acknowledge the financial support of theEU IST-2001-32641 “ViHAP3D” and MIUR FIRB“MacroGeo” projects.
References[1] F. Bernardini and H. E. Rushmeier. The 3D Model
Acquisition Pipeline. Computer Graphics Forum,21(2):149–172, March 2002.
[2] M. Callieri, P. Cignoni, and R. Scopigno. Reconstruct-ing textured meshes from multiple range rgb maps. In7th Int.l Fall Workshop on Vision, Modeling, and Vi-sualization 2002, pages 419–426, Erlangen (D), Nov. 20- 22 2002. IOS Press.
[3] M. Callieri, P. Cignoni, R. Scopigno, G. Gori, andM. Risaliti. Beyond manual drafting: a restoration-
oriented system. Technical Report TR-03, I.S.T.I. –C.N.R., Pisa, Italy (submitted paper), June 2003.
[4] F. Chen, G.M. Brown, and M. Song. Overview of three-dimensional shape measurement using optical methods.Optical Engineering, 39(1):10–22, January 2000.
[5] G. Godin, J.-A. Beraldin, J. Taylor, L. Cournoyer,M. Rioux, S. El-Hakim, R. Baribeau, F. Blais,P. Boulanger, J. Domey, and M. Picard. Active op-tical 3d imaging for heritage applications. IEEE Com-puter Graphics and Applications, 22(5):24–36, Septem-ber 2002.
[6] M. Levoy, K. Pulli, B. Curless, S. Rusinkiewicz,D. Koller, L. Pereira, M. Ginzton, S. Anderson,J. Davis, J. Ginsberg, J. Shade, and D. Fulk. The Dig-ital Michelangelo Project: 3D scanning of large stat-ues. In SIGGRAPH 2000, Computer Graphics Pro-ceedings, Annual Conference Series, pages 131–144. Ad-dison Wesley, July 24-28 2000.
[7] T. Masuda, S. Imazu, T. Furuya, K. Kawakami, andK. Ikeuchi. Shape difference visualization for old cop-per mirrors through 3d range images. In Proc. of TheEighth International Conference on Virtual Systemsand Multimedia (VSMM 2002), page 942951, Septem-ber 2002.
[8] B. Mirtich. Fast and accurate computation of poly-hedral mass properties. Journal of Graphics Tools,1(2):31–50, 1996.
[9] C. Rocchini, P. Cignoni, C. Montani, P. Pingi,R. Scopigno, R. Fontana, L. Pezzati, M. Cygielman,R. Giachetti, and G. Gori. 3D scanning the Minervaof Arezzo. In ICHIM’2001 Conf. Proc., Vol.2, pages265–272. Politecnico di Milano, 2001.
[10] R. Scopigno, P. Cignoni, M. Callieri, F. Ganovelli,G. Impoco, P. Pingi, and F. Ponchio. Using opticallyscanned 3d data in the restoration of Michelangelo’sDavid. In SPIE Int. Symposium on Optical Metrology,page (in press), Munich, Germany, June 23-26 2003.
[11] S. Tosovic and R. Sablatnig. 3D modeling of archae-ological vessels using shape from silhouette. In Proc.of 3rd International Conference on 3D Digital Imag-ing and Modeling (3DIM), pages 51–58, Qubec City,Canada, May 28 - June 1 2001. IEEE.
[12] Jack Wasserman. Michelangelo’s Florence Pieta’.Princeton University Press, 2002.
7