collaborative visualization
TRANSCRIPT

Copyright © 2011 by the Association for Computing Machinery, Inc. Permission to make digital or hard copies of part or all of this work for personal or classroom use is granted without fee provided that copies are not made or distributed for commercial advantage and that copies bear this notice and the full citation on the first page. Copyrights for components of this work owned by others than ACM must be honored. Abstracting with credit is permitted. To copy otherwise, to republish, to post on servers, or to redistribute to lists, requires prior specific permission and/or a fee. Request permissions from Permissions Dept, ACM Inc., fax +1 (212) 869-0481 or e-mail [email protected]. I3D 2011, Paris, France, June 20 – 22, 2011. © 2011 ACM 978-1-4503-0774-1/11/0006 $10.00
Collaborative Visualization: Current Systems and Future Trends
Christophe Mouton∗
EDF R&D, Paris, FranceKristian Sons†
DFKI, Saarbrucken, GermanyIan Grimstead‡
Cardiff University, Cardiff, UK
Figure 1: Transatlantic Collaborative Visualization with ParaViewWeb. From left to right: In New York on an iPad (with multi-touchnavigation) and on a MacBook, in Paris on a Desktop PC
Abstract
Collaborative visualization is becoming more and more important,given the distributed and mobile nature of teams. Current visualiza-tion systems are often still monolithic and not flexible enough fortodays users; they have not kept pace with improvements in otherareas of information technology (mobile networking, compute-on-demand). With this in mind, we review current visualization sys-tems (covering CAE collaborative visualization, multi-user onlinegames and solutions to bring collaboration to existing applications/ processes) and contrast against the latest related advances in tech-nology: new hardware platforms, availability of cloud computing,mobile network capabilities and web browser functionality. Wethen analyse how these advances could impact on future collabo-rative visualization systems and discuss potential areas of improve-ment to existing systems.
CR Categories: H.5.3 [Information Interfaces and Presenta-tion]: Group and Organization Interfaces—Computer-supportedcooperative work; I.3.2 [Computer Graphics]: Graphics Systems—Distributed/network graphics
Keywords: CAE, Collaborative, Scientific Visualization, Web3D,3D-Internet
1 Introduction
Over the last year, there has been an explosion in mobilecomputing—making stories from science fiction suddenly everyday reality, such as remotely controlling your house (switchingoff lights, increasing the temperature of the heating) through yoursmartphone, all whilst walking along the street. Suddenly - thereis an app for that. The ubiquitous nature of mobile computing ischanging the way we work and live, whilst being accompanied bynew business models for HPC such as pay per use. Now, we can
∗e-mail:[email protected]†e-mail:[email protected]‡e-mail:[email protected]
easily work remotely with teams of people, pulling in the computepower needed for a special project—without investing in a completeHPC solution of our own. Given the recent advances in mobile net-working, hand-held devices and rendering hardware, it is timely toreview current approaches to collaborative visualization and com-pare against these latest advances. In this paper, we present a re-view in the next section of the current state-of-the-art in collabora-tive visualization, covering CAE collaborative / distributed visual-ization, multi-user online gaming, integration of collaborative sup-port into existing applications / processes, and the common issuesthese systems all face. The next section then examines the recenttrends in technology, covering hardware platform, networks, andweb browsers. This information is reviewed and brought togetherin the following section projecting how these trends will merge withcollaborative visualization to produce the next generation of visu-alization facilities. We then finish our report with our conclusionsregarding the future direction of collaborative visualization.
2 Current Collaborative Visualization Sys-tems
Looking back at a previous review of distributed visualization[Grimstead et al. 2005] taken in 2005 (at the start of Grid/WebService development), it was noted that most systems were de-signed for less than 100 simultaneous users, relying on single ormultiple servers to support the users. This pattern was explainedby providers wishing to ensure quality of service, and to maintainsecurity. The exception was collaborative VR systems, where peer-to-peer networking was often used to support in excess of one thou-sand simultaneous users. Each system required a custom client,with each system operating in isolation and not interoperating withother systems. With this context in mind, we now wish to reviewrecent advances in the field and note significant changes at the endof this section.
2.1 Computer-Aided Engineering (CAE) Collaborative/ Distributed Visualization
The COVISE (COllaborative VIsualization and Simulation Envi-ronment) system has continued to evolve [Wossner et al. 2002;Niebling et al. 2010], moving from a specific client program tothe latest release supporting a WebGL and HTML5 client, whichruns natively in a web browser. The WebGL client requires no localinstallation, and connects to existing COVISE sessions with othermore complex clients. However, the full polygonal scene graphmust be downloaded for display, which is slow due to slow text
101

parsing of AJAX messages, although once received the renderingspeed is very good. COVISE supports per-session access control,and can use multiple servers to distribute the workload.
The Resource-Aware Visualization Environment (RAVE) [Grim-stead et al. 2009] was designed to test the suitability of Web Ser-vices to support collaborative visualization. It used a central dataserver to host sessions, supporting multiple users per session (10sof users) and multiple sessions per server. RAVE differs from mostother systems in that local client resources were examined to selectan appropriate mthod of transport: either the polygonal dataset wastransmitted for viewing, or a service was used to perform the ren-dering for the client, which then received a real-time video feed.Both approaches presented the same experience to the end user -enabling a PDA to view the same dataset simultaneously with ahigh-end workstation, each with unique viewpoints. A Java Ap-plet, embedded in a web page, is used on the client. Since issueswere encountered with firewalls, web services (SOAP) were usedfor initial handshakes and then a binary TCP/IP port was requiredfor scene graph or image transmission.
Web support was further developed in the web based post-processing framework SCOS/V3D. It was developed on two mainconcepts: the remote sharing of post-processed results (via thetransfer of an X3D [Web3D Consortium 2008] data file corre-sponding to the final virtual reality scene) and communicationsbased on HTTP to bypass standard proxy and firewall limita-tions. ShareX3D [Jourdain et al. 2008] was developed as part ofSCOS/V3D to test the possibilities for scientific collaborative visu-alization tools over HTTP.
Visualization tools may not be designed for collaboration, but cansupport distributed viewing, and limited distributed interaction. Forinstance, ParaView is a visualization tool, designed on top of theVTK system but extended to support parallel cluster rendering. Ithas been extended to include JavaScript and Flash support [Jour-dain et al. 2010]. ParaViewWeb can be accessed through a webbrowser over HTTP (negating any firewall issues) as shown in Fig-ure 1 for a transatlantic session on several devices. This approachpermits a user to access a rendering cluster from a web page, with-out collaboration support. The latter could be created with a higher-level application written in JavaScript.
A generic means of visualizing data is presented in [Shu et al.2008], where an ontology is used to abstract away the exact visual-ization method used to display data in a visual manner. Meta-datais given to the system to define the format of input data, with anontology used to identify appropriate visualization techniques (e.g.isosurface for a 3D regular sample set, or a 2D graph for a seriesof 2D coordinates). A portal is presented as the means of accessingthe system, enabling it to be accessed from a web browser and ab-stracting away the various underlying visualization package, whichmay each implement a subset of the methods in the ontology.
In summary, collaborative systems such as those described aboverequire security and user-level access control. Per-user viewpointsare often a requirement (depending on target application). How-ever, multi-modal support is often left to a third party application(such as video conferencing). It should also be noted that a genericHTTP client hosted in a web browser may not support high-speedbinary data transmission, as such generic clients are usually orien-tated around XML (uncompressed ASCII format data, comparedto the requirement of high-speed binary data). The current trendis towards more open interfaces—namely, web access without therestriction shown by specific stand-alone client software or “apps”.
2.2 Generic Collaborative Visualization Tools
Generic tools cannot make any assumption about data format,therefore they rely on sampling the remote systems graphics buffer(i.e. the screen display) and sending it to interested parties in theform a video stream. Such systems can operate at the system/driverlevel, and not interfere with existing applications; they may be con-sidered “screen sharing” tools. In this section we describe some ofthese systems.
Originating from the ITU-T T.128 standard [ITU 2008], MicrosoftRemote Desktop Protocol (RDP) is used to forward complete desk-top access from a machine to a remote client, so a remote accessmechanism rather than distribution to multiple simultaneous view-ers. However, it will remotely forward any application throughframe buffer capture - including audio and file system redirec-tion. RemoteFX [Microsoft 2011] is the successor to RDP, usinghardware-assisted graphics acceleration for Virtual Desktop Infras-tructure (VDI) customers, reaching 15 FPS in interactive tests with20 Mbps networks [Riverbed 2011].
Virtual Network Computing (VNC) [Richardson et al. 1998] is an-other screen capture and forwarding system, although this systemcan be used in a distributed manner by permitting multiple users tolog into the same server. Issues arise when multiple users wish tocontrol the remote mouse/keyboard, as there is no locking mecha-nism or other fine grained security (the server itself, however, canbe securely accessed). As for today, VNC continues to be devel-oped, with many variations now available [Wikipedia 2011]. Inspite of the success of VNC-like technologies, interactive 3D vi-sualization is extremely difficult because of the low framerate thatcould be encoded in the “native” VNC protocol. Funded by SunMicroSystems for their thinClient products, TurboVNC and Vir-tualGL [Commander 2011] produce high framerates and are realchallengers of proprietary software such as IBM DCV/RVN [IBM2009] and HP Remote Graphics Software (RGS) [HP 2011]. How-ever, HP RGS and its HP3 encoding algorithm seems to stay aheadin terms of performance and image quality [Lohnhardt et al. 2010].
The Games@Large project [Nave et al. 2008] is investigating therender instruction capture of an application (i.e. game) whilst it isrunning, and transmitting the commands for remote rendering. Thesystem only sends changes in the scene to the remote client (to re-duce bandwidth consumption), and relies on the remote client torender the graphics locally. This results in high frame rates usingbetween 4 to 40Mbit/sec on a local network; if the available band-width is insufficient or a GPU is not available on the client, thenvideo encoding is used instead.
In a related work as part of the MobiThin project [Dhoedt 2010], thecaptured render data is instead translated into BiFS (Binary Formatfor Scenes, part of the MPEG-4 standard), and then replayed ona standard MPEG-4 player. Local client interactions are then sentupstream to the encoding server for it to react accordingly, with itsonscreen rendering continuously encoded into BiFS for the clientto display. An example application is transcoding an X11 displayinto BiFS for remote interaction. For large graphical changes, VNCencoding was found to be more efficient, whereas for general inter-action (such as using a text editor), BiFS was more efficient.
Capturing the local machines scene graph at the API level isalso used with OpenGL via utilities such as GLIntercept [Trebilco2005]. The frame buffer can thus be captured for remote distri-bution, or the scene graph itself can be captured, by interceptingcalls to the OpenGL library as well as the current state of theOpenGL system. This concept was used in Stanford UniversitysChromium Library [Humphreys et al. 2002] to drive DisplayWallsand is currently implemented in commercial products as Techviz
102

XL to display non-parallel OpenGL-based software on Display-Walls [TechViz 2010].
The systems reviewed here either capture the pixels of the serversdesktop, or they capture the polygons being presented to the render-ing hardware. Games@Large (and RAVE from the previous sec-tion) switches between scene graph transmission and frame buffertransmission, depending on the clients capabilities. However, nohybrid systems appear to have been published, where sections ofthe scene graph can be transmitted (for high local interaction rates)whilst less important information is transmitted as a pixel stream.
2.3 Multi-user Online Gaming Environments
Multi-user Online Games can be considered as collaborative appli-cations where the users pursue a game specific objective. Similarto scientific collaborative visualization, gaming requires per-userunique viewpoints, system security and user-level access control -otherwise, players/participants would be able to modify other play-ers avatars, their environment, etc. Quality of Services must besupported—as players may be paying to use the system. Finally,scalability is required, depending on the system - from 10s of par-ticipants to 10s of thousands. Games often include multi-modalsupport, such as distribution of matching audio with graphics, andpotentially voice conferencing. Such facilities are made possiblebecause the client is domain-specific - extremely so; the client ap-plication cannot be used for any other purpose except to play thegiven game - it cannot view a variety of datasets.
A research platform for collaborative virtual environments, IS-Real [Kapahnke et al. 2010] has been developed which usesXML3D to render the scene directly in a web browser. In addi-tion, object ontologies are used with software agents to control thebehaviour of the system—rendered objects. Such objects are thenregistered against the ontology to enable users and agents to inter-act with the objects in a meaningful way (for instance: definingan object as being of type “door”). The ontology approach showspromise for assisting a user when interacting with the system.
Metaverses such as Second Life are a particular type of multi-uservirtual environments (MUVE). Their functionality is similar to 3Dgames, but unlike these they present a seamless and persistent worldand do not have predefined goals. Each user is represented as anavatar and can enhance and modify the world based on user-levelaccess control. The frameworks provided by metaverse platformssuch as OpenSimulator [OpenSimulator 2011] are also attractivefor scientific visualization. Virtual World platforms have been usedfor collaborative scientific visualization [Lang and Kobilnyk 2009]and for collaborative design [Rosenman et al. 2007].
[Bourke 2008] evaluates whether Second Life can be used to sup-port collaborative scientific visualization. Though considering it asan interesting environment satisfying many of the requirements forcollaborative visualization, Bourke emphasises limitations such asthe low geometric complexity supported and limited interaction ca-pabilities. Second Life was designed as a social game rather thana general-purpose MUVE. However, some of the restrictions couldbe overcome in more recent platforms for virtual worlds such asSirikata. Sirikata is extensible, thus that e.g. arbitrary geometryrepresentations can be used. Sirikata is an open-source, extensi-ble platform for virtual worlds, with an example application KataS-pace [KataLabs 2011] presenting a shared virtual world in a webbrowser, by making use of HTML5 and WebGL.
Another phenomena appeared in gaming is Gaming on Demand—an application of Cloud Computing where games are installed onhigh performance servers. One of the first and probably the mostpopular Gaming on Demand provider is OnLive [OnLive 2011].
The game is running and rendering on the remote server, while theuser just sends his input data and receives a video stream. On-Live developed a proprietary video compression method that runsin hardware on server side. The decompression time depends onthe client platform but OnLive distributes a thin console to decodethe stream and to play games on televisions, smartphones and tabletPCs.
The Otoy company has proposed a Remote Cloud Gaming service,using GPUs to directly run their capture software (ORBX) to en-able 48 first-person shooting games to run at 60fps on a single 1Userver [Waite and Urbach 2010].
The European KUSANAGI project [Eureva 2011] intends to fol-low the same strategy for gaming and high definition professionalvisualization. KUSANAGI is supported by major European telcocompanies, high definition display manufacturers and game com-panies. Remote rendering is particularly challenging for controlroom makers, with the requirement to transmit massive resolutionimagery in real-time. For example, BARCO provides VNC-like IPtools or hardware encoders like the JP2K accelerator card [Barco2010]. This supports, with redundancy for high availability, remotecollaborative use of realtime 3D applications in different resolutionvideo streams for display on DisplayWalls or operators screens.
Gaming on demand is also interesting for the game industry be-cause it prevents cheating, software piracy and enables high-endgaming for audiences without high-end desktop PCs—similar de-sires as collaborative visualization users. With a market of billionsof users, it could explain why the mobile telephone and tablet man-ufacturer HTC has invested $40 million in this sector [HTC 2011].
Peer-to-peer architectures have been used in many collaborative vir-tual environments, ranging from decade-old systems to latest devel-opments [Alma Martınez et al. 2009]; such systems use localisationto only transmit and update information local (near) to the player/-participant. However, peer-to-peer systems seem to only be sup-ported for virtual environments—probably due to their reliance onvirtual participant spatial separation to distribute data amongst par-ticipants, which may not be a sufficient distribution mechanism forscientific visualization.
Video streaming techniques have been shown to be efficient evenfor highly latency-sensitive applications such as games. These tech-niques also demonstrate that it is possible to run applications requir-ing fast resources remotely. Finally it is not necessary to modify theapplication to run it remotely, which can cause issues as discussedin the next section. All of these features are of importance for col-laborative visualization. Nevertheless, gaming on demand does notanswer how to integrate collaborative functionality into existing ap-plications and does not allow the use of services from more than onesource in the sense of a mashup.
2.4 Integration of Collaborative Visualization into Ex-isting Applications/Processes/ IT
As we saw previously, generic collaborative tools could provide“seamless” integration of collaborative applications on a singlenotebook or workstation. Such systems are hampered by local se-curity policies on corporate networks (such as software installation,open network access). Several projects and off-the-shelf productshave appeared in recent years, filling the gap between the serviceprovided by these powerful tools and the needs of secured integra-tion in the IT architecture of companies.
At the Texas Advanced Computing Center, a web portal is the fron-tend for the users: they can book a remote, possibly collaborative,visualization session in the easiest and most secure way possible—
103
Virtualized and Remote Graphics Approach Web 2.0 and 3.0 approach
Embracing the Future
Optimize Business as usual
Extend existing software Add a "Gateway"
Image streaming on server side
3D Interceptionon "source"
side
Web3D Services
A neutral 3D publishing
format
Collaborative Visualisation Strategy
Remote Streaming
Gaming Platforms
Remote Parallel CAE portal
Virtualization Web conferencing HTML5 + Declarative 3D
Remote Image-based SciViz Web
Service
COLLAVIZ Hub PLM Collab Tools
- OnLive,- OTOY,- ...
- X3D binary-based progressive streams for CAD and SciViz 3D scenes
- VISUPORTAL with HP RGS, or TurboVNC/VirtualGL JWS plugin
- RemoteFX,- Adobe Connect with Acrobat 9 Extended 3D Capture tool
- Covise-webGL- ParaviewWeb,- TACC EnVision
- AutoDesk NavisWorks,- SIemens TeamCenter- DS Enovia - 3D Live- VCollab/Marechi
Warning n°1:- Use on LAN recommended,- High bandwith needed,- Sensitive to latency issues
Warning n°2:3D data could be captured on Client side
Warning n°1applied
Warning n°2applied
Watermarking to the rescue?
Warning n°2applied
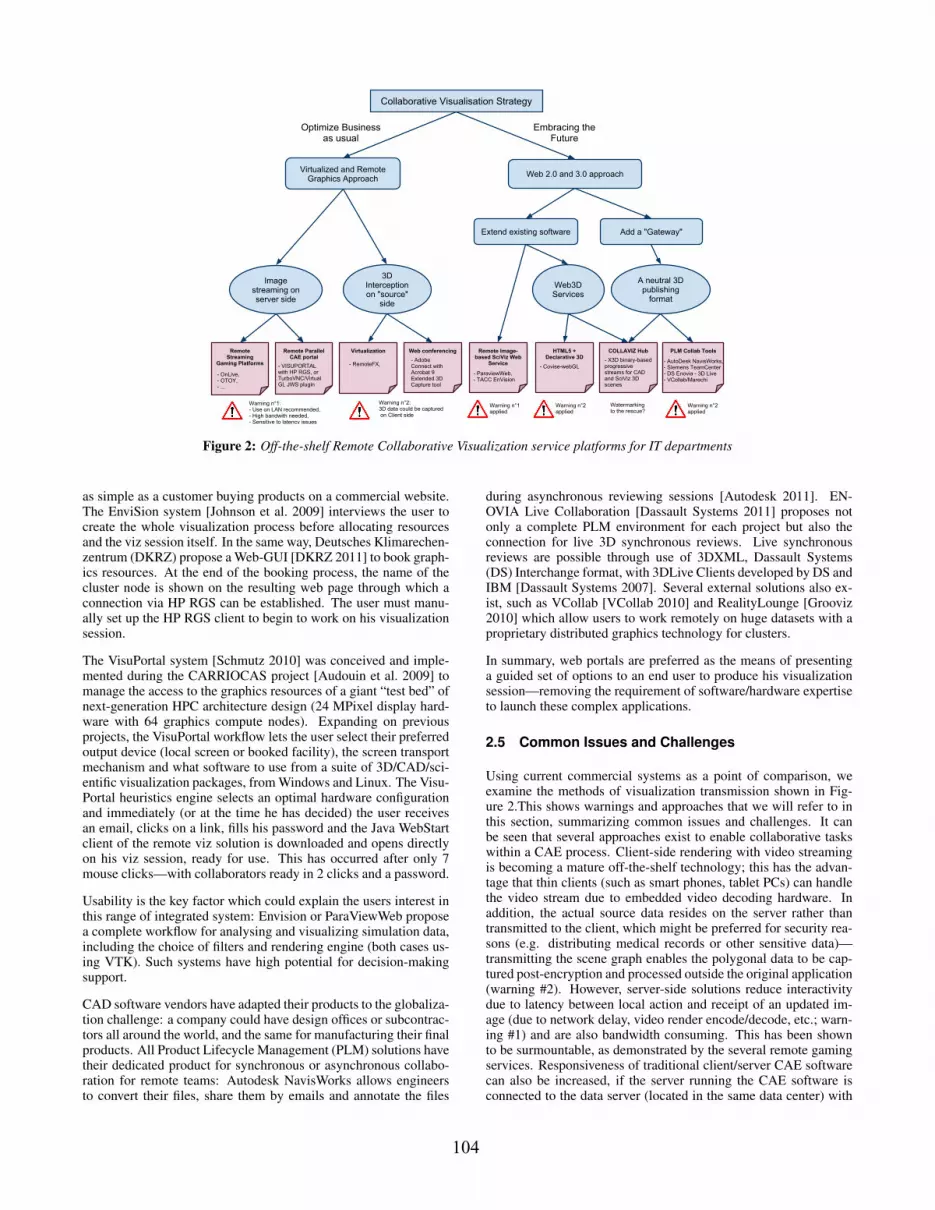
Figure 2: Off-the-shelf Remote Collaborative Visualization service platforms for IT departments
as simple as a customer buying products on a commercial website.The EnviSion system [Johnson et al. 2009] interviews the user tocreate the whole visualization process before allocating resourcesand the viz session itself. In the same way, Deutsches Klimarechen-zentrum (DKRZ) propose a Web-GUI [DKRZ 2011] to book graph-ics resources. At the end of the booking process, the name of thecluster node is shown on the resulting web page through which aconnection via HP RGS can be established. The user must manu-ally set up the HP RGS client to begin to work on his visualizationsession.
The VisuPortal system [Schmutz 2010] was conceived and imple-mented during the CARRIOCAS project [Audouin et al. 2009] tomanage the access to the graphics resources of a giant “test bed” ofnext-generation HPC architecture design (24 MPixel display hard-ware with 64 graphics compute nodes). Expanding on previousprojects, the VisuPortal workflow lets the user select their preferredoutput device (local screen or booked facility), the screen transportmechanism and what software to use from a suite of 3D/CAD/sci-entific visualization packages, from Windows and Linux. The Visu-Portal heuristics engine selects an optimal hardware configurationand immediately (or at the time he has decided) the user receivesan email, clicks on a link, fills his password and the Java WebStartclient of the remote viz solution is downloaded and opens directlyon his viz session, ready for use. This has occurred after only 7mouse clicks—with collaborators ready in 2 clicks and a password.
Usability is the key factor which could explain the users interest inthis range of integrated system: Envision or ParaViewWeb proposea complete workflow for analysing and visualizing simulation data,including the choice of filters and rendering engine (both cases us-ing VTK). Such systems have high potential for decision-makingsupport.
CAD software vendors have adapted their products to the globaliza-tion challenge: a company could have design offices or subcontrac-tors all around the world, and the same for manufacturing their finalproducts. All Product Lifecycle Management (PLM) solutions havetheir dedicated product for synchronous or asynchronous collabo-ration for remote teams: Autodesk NavisWorks allows engineersto convert their files, share them by emails and annotate the files
during asynchronous reviewing sessions [Autodesk 2011]. EN-OVIA Live Collaboration [Dassault Systems 2011] proposes notonly a complete PLM environment for each project but also theconnection for live 3D synchronous reviews. Live synchronousreviews are possible through use of 3DXML, Dassault Systems(DS) Interchange format, with 3DLive Clients developed by DS andIBM [Dassault Systems 2007]. Several external solutions also ex-ist, such as VCollab [VCollab 2010] and RealityLounge [Grooviz2010] which allow users to work remotely on huge datasets with aproprietary distributed graphics technology for clusters.
In summary, web portals are preferred as the means of presentinga guided set of options to an end user to produce his visualizationsession—removing the requirement of software/hardware expertiseto launch these complex applications.
2.5 Common Issues and Challenges
Using current commercial systems as a point of comparison, weexamine the methods of visualization transmission shown in Fig-ure 2.This shows warnings and approaches that we will refer to inthis section, summarizing common issues and challenges. It canbe seen that several approaches exist to enable collaborative taskswithin a CAE process. Client-side rendering with video streamingis becoming a mature off-the-shelf technology; this has the advan-tage that thin clients (such as smart phones, tablet PCs) can handlethe video stream due to embedded video decoding hardware. Inaddition, the actual source data resides on the server rather thantransmitted to the client, which might be preferred for security rea-sons (e.g. distributing medical records or other sensitive data)—transmitting the scene graph enables the polygonal data to be cap-tured post-encryption and processed outside the original application(warning #2). However, server-side solutions reduce interactivitydue to latency between local action and receipt of an updated im-age (due to network delay, video render encode/decode, etc.; warn-ing #1) and are also bandwidth consuming. This has been shownto be surmountable, as demonstrated by the several remote gamingservices. Responsiveness of traditional client/server CAE softwarecan also be increased, if the server running the CAE software isconnected to the data server (located in the same data center) with
104

at least 1GBit/s. This setup can then be accessed remotely by thinclients as shown in [HP 2008], skipping the delay/latency inheritedfrom “internal” data exchange on the public local area network..
Generic Collaborative Visualization Tools provide a quick wayto share and distribute the data, through direct frame buffer cap-ture of existing applications, but provide only limited collabora-tive functionality and no integrated multi-modal support. Systemsshould be designed from the beginning to be truly collaborative—but legacy systems will still need to be supported (“optimize busi-ness as usual”).
MUVE platforms fulfil a rich set of collaborative requirementsbut are seldom generic enough to solve all requirements specificfor scientific visualization—such as large data set support anddomain-specific functionality. However the French ANR Collavizproject [ANR Collaviz Project 2011] aims to answer these specificneeds e.g. by proposing a robust solution to stream binary X3Dscenes progressively [Maglo et al. 2010] for the Collaviz frame-work [Dupont et al. 2010]. When MUVE applications eventu-ally move into the browser, no additional software will be neededand the visualization part can be combined with other collabora-tive modalities such as document editing and video conferencing(“embracing the future”).
”The nice thing about standards is that you have so manyto choose from.”
This quote from Andrew S. Tanenbaum is highly applicable tothe area of distributed graphics and related technologies. TheSC4/TC184 Consortium has led a call for technology in 2009 todefine which formats could be considered as standardized enoughto publish Step files for collaborative review purposes. [SC4 Visual-ization Ad Hoc Group 2009] notices, that among all these standardsthe XML-based format look promising for the future, even if CADnative formats seem very efficient. Many studies [Hartman 2009;Hartman and Lim 2008] show that the quest for a neutral and in-teroperable format could appear vain as each standard format wasbuilt for a specific purpose. Their extension and/or reuse could betruly considered as very difficult. New approaches are studied, suchas processing scene graphs of different formats through an adaptivearchitecture [Rozenn Bouville Berthelot and Arnaldi 2008], whereformats are analyzed to wrap the data into a common scenegraph(“a neutral publishing format”).
With regard to XML formats, the W3C is working to provide newcompression schemes for Efficient XML Interchange (EXI) [W3C2011a]. The Web3D Consortium has proposed X3Db, a binary ver-sion of X3D. X3Db uses Fast Infoset algorithms [ISO 2007] tocompress the X3D XML ASCII encoded files by a factor of 10.Even compressed, 3D content could be intercepted on the clientside (warning #2); methods such as watermarking algorithms areunder active research [Wang et al. 2010] to avoid this risk.
3 Technology Trends
This section examines the current trends in related technology,looking at how they impact on remote / collaborative visualization.
3.1 Trend in Hardware Platforms
The Grid computing concept emerged around 2004, comparingcompute power to electricity, where you may just plug into thecompute grid to obtain compute power without the complexity ofaccess currently associated with HPC systems (such as needing anaccount on each machine). The initial design of distributed, batch-processing on the Grid was then extended into Grid Services andWeb Services (as used by RAVE, for example).
Cloud computing has emerged after the initial surge in Grid com-puting, where the exact location of the compute services is not ina known/static place, instead in a remote cloud of compute devicesupon which a service is running on a subset of available resources.The cloud is instead asked for resources, where a service may behosted. This includes the concept of virtual machines, where a log-ical (virtual) machine may be sharing a physical host with severalother virtual machines—reducing cost of ownership for the serviceprovider. Cloud computing also introduced the on demand aspect -where users can now request as many resources as they need, withshort notice - and then reducing the resources when they no longerneed them (and hence no longer have to pay). Such a pay-per-useapproach has formed a successful commercial model, with compa-nies such as Amazon, Google, IBM and Microsoft offering cloudcomputing services commercially.
Amazon has recently introduced GPGPUs [Amazon 2010] into itsElastic Compute Cloud (EC2) offering. Users can (on-demand) re-quest high-end rendering hardware over the web, enabling a ren-dering cluster to be created on-demand - such as leasing additionalGPGPU nodes when the demand for local hardware exceeds its ca-pability. Suddenly, you can expand your rendering power withoutrequiring a large investment in hardware, and also downscale yourserver if you no longer need such a large system.
In addition to the advent of pay-per-use/on-demand computingpower, the form factors of workstations are changing. The computepower of a modern mobile phone is a dual-core 1GHz CPU [Gwen-nap 2010]; this device has more compute power than that of a multi-million dollar Cray Y-MP C90 supercomputer [Cray Inc. 2010]from the late 1980s. Similar processing power is contained in newwave of lightweight tablet computers following the introduction ofthe Apple iPad, after tablet computers almost vanished from themarket (see [Microsoft 2002]). The advent of touch-screens (ratherthat a radio frequency-based digitizing stylus) has changed the ac-cessibility of such devices—they are no longer seen as a quirkyobject, but now a ubiquitous user interface on consumer devices.
Multi-touch interfaces present a natural interface which makes sucha device accessible to non-technically minded people—the QW-ERTY keyboard has gone, the WIMP has gone—to be replaced bymedia activated by touch. Form factor (slim device, balanced mass,lightweight) and battery life (several days worth of use) similarlyincrease the accessibility of these platforms. Such touch-screen de-vices are described as being used for mobile internet browsing asmuch as mobile phones, with 50% of Fortune 100 companies con-templating using iPads for commercial use [Elding 2010]. Such aneasily accessible device is becoming ubiquitousbe it an Apple iPador an Android based tablet.
3.2 Network Trends
Home networks utilising ADSL technology, such as ADSL 2+(ITU standard G.992.5 [ITU 2009]), can now reach up to 24Mbit/sdownload speed—considering that the maximum bitrate that anH.264 / MPEG-4 decoder can process is 20Mbit/sec (1920x1080 @30fps) [DivX 2010], high quality streaming of full high-definitionvideo is now possible—especially since perfectly acceptable videocan be streamed using around 6Mbit/sec.
Current third generation (3G) mobile telephone networks (suchas High Speed Downlink Packet Access variants) support upto 21Mbit/sec download rates [Ericsson 2009] enabling mobilestreaming of video. 3G is rapidly being replaced with so-calledfourth generation (4G) systems such as Long Term Evolution (LTE)with up to 160Mbit/sec download rates. In comparison, generalWiFi (such as 802.11n, superceding earlier 802.11a/b/g networks)
105

have a theoretical limit of 600Mbit/sec (with multiple simultaneousstreams) [AirMagnet 2008].
The latest generations of networks (3G/4G) can hence support mo-bile visualization with full video and audio streaming capabilities,enabling local consumption of remote resources. Access to datais no longer constrained to wired connectivity, or even basic WiFitechnology; mobile telephony is now sufficient to host such ser-vices.
3.3 Web Browser Trends
With the advent of XMLHttpRequest, which allows the access ofnew data from the server within a web page, the migration of clas-sical desktop applications to the web finally took off. Most of thefeatures of HTML5, such as video and audio support, File API,and client-side-storage are introduced to support this trend. Thesetechniques have also helped to extend classical single user taskswith collaborative functionality. Examples are documentation (e.g.Wikipedia), document editing (e.g. Google docs) and Instant Mes-saging in the browser.
Web Applications have major benefits compared to desktop appli-cations. Browsers are available for all mainstream platforms in-cluding mobile devices and Tablet PCs. It is easy to adapt the pre-sentation to the target media. The deployment of Web Applicationsis easy, in particular they do not require the user to install or updatesoftware other than the browser. Vendors can deploy and distributetheir own software instantly and worldwide—without the relianceon a sales/distribution network.
Additionally Collaborative Web Applications benefit from the richset of networking features. Besides the mentioned XMLHttpRe-quest, the WebSockets API [W3C 2011b] is a W3C draft specifica-tion and allows bi-directional full-duplex communication and willeventually substitute models like Comet for bi-directional commu-nication via XMLHttpRequest. Nevertheless, these networking ca-pabilities still suffer from the lack of a fine grained security modelas described in [Taivalsaari 2009].
Beyond networking capabilities, collaborative Web Applicationscan benefit from a range of existing frameworks that implementessential features such as session management, rights managementand concurrent editing of a data model. Video conferencing as anadditional modality is currently only possible using RIA pluginssuch as Adobe Flash or Microsoft Silverlight. This could changein the short term, if the Media Capture API [W3C 2010] becomesavailable in browsers.
Due to the missing 3D and video capabilities of web browsers, theirusage as a collaborative platform for 3D visualization was limited.With the advent of video capabilities in Flash and HTML5, server-side 3D rendering became available. The recently released We-bGL [Khronos 2011] specification allows browsers to use OpenGLES 2.0 [Khronos 2007] via JavaScript through the canvas Element.Google Chrome 9 is the only non-beta browser to support WebGLbut it’s expected to appear in the next major releases of Apple Sa-fari, Firefox, and Opera. There are previews for WebGL browserson the Android platform.
WebGL has already been used for scientific visualization [Callieriet al. 2010] and science education [Google Labs 2010; Belmonte2011]. As mentioned above, WebGL has already been used forcollaborative scientific visualization in [Niebling et al. 2010]. Al-though these applications are demonstrators rather than fully quali-fied products, considering they were all developed before the recentfinal release of the WebGL specification, results are already promis-ing.
Although WebGL enables 3D capabilities in the Browser, it has alsosome drawbacks; it does not answer the question “How is the datadelivered to the client?”. All works mentioned above use domain-specific data structures[Niebling et al. 2010] or those provided bya JavaScript library above the WebGL layer. Working with struc-tured data on a higher abstraction layer (i.e with a scene graph)means that the rendering logic has to be implemented in JavaScript.Though the performance of JavaScript has significantly increasedover the past few years, the renderer logic will still take a large pro-portion of the available CPU time. This portion of CPU time is thennot available for the application, especially on mobile devices withrestricted CPU resources.
WebGL does not define how and in which format the data is trans-ferred to the client—it has to be defined for each application. Thismakes it hard to use or extend standard collaboration frameworksfor 3D graphics. Last but not least the functionality of WebGL isfixed to OpenGL ES 2.0 from 2007. New features of recent hard-ware of interest to CAE cannot be used; high performance GPU arerestricted to an API designed for embedded systems.
Two declarative approaches based on the browsers DocumentObject Model (DOM) are X3DOM [Behr et al. 2010] andXML3D [Sons et al. 2010]. Both approaches can leverage the re-cent WebGL capabilities to render the scene that is described in theDOM into a HTML5 canvas. X3DOM tries to fit the ISO graph-ics standard X3D into the DOM by streamlining many of its con-cepts. Above that, it adds support for certain HTML elements,DOM Events, and CSS profiles such as CSS3 3D Transforms [W3C2009]. It also offers a fallback model, using a X3D plug-in if avail-able, other 3D capabilities such as WebGL otherwise. In compari-son, XML3D is instead developed as an extension to HTML5 to de-scribe 3D graphics. It focuses on providing only concepts that theyalready known from HTML and CSS and introduces new conceptsonly where necessary. It tries to leverage the available hardwareusing compiler technologies [Karrenberg et al. 2010] along with anintegrated data flow mechanism.
Having 3D objects as first level elements in the DOM is advanta-geous, as it is a well-known data structure. Many frameworks existto manipulate the DOM from client and server side and even DOMevents can be used as protocol to synchronize scenes as shownin [Lowet and Goergen 2009].
4 Future Collaborative Visualization Plat-forms
Given the ubiquity of internet access (over local WiFi or mobiletelephony) at bandwidths which can support streaming video, wesee that mobile access of high-end visualization is now possible andpoised to improve. Mobile handsets / tablet computers have nowreached sufficient compute power to render complex scenes locally,or to be able to marshal and decode video at sufficient quality andrates to be comparable with that of direct rendering on a desktopmachine.
The combination of Cloud Computing with such mobile bandwidthshows that remote rendering of even the most complex datasets isnow achievable without a large investment in infrastructure evenon mobile devices. This suggests that the future will lie withlightweight hand-held computing being used on-site, on-demand tovisualize data rather than remaining at a desk and visually prepar-ing in advance. Data can be taken everywhere, rendered on demandand shared with colleagues—all via mobile network links.
To further the cause of collaborative visualization, the client ap-plications must not require a specific install, or be restricted to aspecific platform. Restriction of this nature reduces take-up, due to
106

basic technical issues such as firewall limitations, local site softwarerestrictions, variations in available hardware, etc. If an applicationuses existing standards (such as HTTPS) for data transport, then thedata will reach the clients screen without any issue. Furthermore, ifnative support can be used in the clients web browser, no local in-stallation is required. Leveraging the latest WebGL standard (nowbeing supported in most major browsers) and HTML5 extensions(such as video objects), a fully-fledged collaborative visualizationpackage can be completely presented in the web browser. This en-ables remote working (on site, or at a remote desk)—especially ofuse when wishing to present results to clients in their offices; fire-walls, software installation restrictions and variation in hardwarewould otherwise prevent a client viewing the same dataset.
If visualization is carried out within the web browser, then it can be-come regarded as a commodity application—a widget to be pulledin to perform a task, alongside other collaborative tools, such asvideo conferencing, shared document editing, etc. We imaginea fully collaborative toolset akin to Google Docs [Google 2011],but going beyond basic text and 2D drawing; instead, an instantlyshared application, with remote rendering support for complex data.Such an application would require research to make better use of re-mote rendering capabilities—at present, a single image is generatedin isolation, rather than scalably recycling the scene graph process-ing as far as possible to reduce repeated work. Approaches such asLumigraph / LightField rendering (e.g. [Okamoto et al. 2009]) maybe beneficial, where rendered results are recycled.
To reduce reliance on bandwidth, such clients should attempt tomake maximum use of local client resources, which should increaselocal interactivity rates and reduce server load. Systems tend toeither stream the entire rendered image or transmit the entire scenegraph; a hybrid system could transmit (at low rate) the backgroundobjects as a video feed, whilst rendering details near the viewerusing the clients rendering resources.
5 Conclusion
We reviewed a selection of recent approaches to enable collabo-rative work on visual data sets. Some approaches leverage newon demand computing, networking and video streaming facilities,whereas the application itself is still monolithic. Other examinedapproaches use recent browser technology and increased client ca-pabilities to produce client-side visualization. However, only afew systems use hybrid client/server rendering approaches; whereasclassical server/client approaches seem to dominate over P2P archi-tectures. No approaches have been found, where applications fromseparate vendors could be used simultaneously on a shared data set,probably due to the lack of common data formats and protocols.
The rapid increase in performance of mobile communications anddevices reveals the potential for visualization hosted natively in amobile web browser—without custom software installation, usingontologies for data interchange. The availability of graphics hard-ware in the cloud and its use for real-time game rendering highlightsthe potential for visualization as a service. For future collaborativevisualization platforms we propose an open web-based architecturethat allows transparent use of server-sided, client-sided or mixedrendering.
Visualization being a service, a company could provide a datastream, another an analysis / processing tool, and another a pre-sentation service, forming a full visualization pipeline—all chargedper use via computing-on-demand in the cloud, or hosted on a com-panys in-house system at lower cost. Hybrid visualization applica-tions (Mashups) could then be produced from multiple services/-sources, following the trend of Web 2.0 service use (as has occurredin other business processes such as enterprise resource planning).
We predict that given the availability of visualization ontologies,compute power on-demand and web browser rendering integrationthat a true collaborative visualization service will now finally hap-pen.
Acknowledgements
This work has been founded by French National Research Agency(ANR) through COSINUS Program (project Collaviz ANR-08-COSI-003). The authors would like to thank the TERATEC as-sociation and the partners of the ANR Collaviz Project.
References
AIRMAGNET. 2008. 802.11n Primer. Tech. rep.,Aug. http://www.airmagnet.com/assets/whitepaper/WP-802.11nPrimer.pdf.
ALMA MARTINEZ, G., HECTOR OROZCO, A., FELIX RAMOS,C., AND SILLER, M. 2009. A peer-to-peer architecture forreal-time distributed visualization of 3d collaborative virtual en-vironments. In Proceedings of the 2009 13th IEEE/ACM Inter-national Symposium on Distributed Simulation and Real TimeApplications, IEEE Computer Society, Washington, DC, USA,DS-RT ’09, 251–254.
AMAZON, 2010. Amazon Elastic Compute Cloud (EC2): High Per-formance Computing. http://aws.amazon.com/ec2/hpc-applications/.
ANR COLLAVIZ PROJECT, 2011. Collaviz. http://www.collaviz.org.
AUDOUIN, O., BARTH, D., GAGNAIRE, M., MOUTON, C.,VICAT-BLANCPRIMET, P., RODRIGUES, D., THUAL, L., ANDVERCHERE, D. 2009. Carriocas project: Towards convergedinternet infrastructures supporting high performance distributedapplications. J. Lightwave Technol. 27, 12 (Jun), 1928–1940.
AUTODESK, 2011. Coordinated, complete control.http://images.autodesk.com/adsk/files/autodesk_navisworks_2011_brochure.pdf.
BARCO, 2010. TransForm N – Universal visualization platform.http://www.barco.com/en/product/2169I.
BEHR, J., JUNG, Y., KEIL, J., DREVENSEK, T., ZOELLNER, M.,ESCHLER, P., AND FELLNER, D. 2010. A scalable architecturefor the html5/x3d integration model x3dom. In Proceedings ofthe 15th International Conference on Web 3D Technology, ACM,New York, NY, USA, Web3D ’10, 185–194.
BELMONTE, N. G., 2011. PhiloGL - Temperature Anoma-lies. http://senchalabs.github.com/philogl/PhiloGL/examples/temperatureAnomalies/.
BOURKE, P., 2008. Evaluating Second Life as a tool for collabora-tive scientific visualisation.
CALLIERI, M., ANDREI, R. M., DI BENEDETTO, M., ZOPPE,M., AND SCOPIGNO, R. 2010. Visualization methods formolecular studies on the web platform. In Proceedings of the15th International Conference on Web 3D Technology, ACM,New York, NY, USA, Web3D ’10, 117–126.
COMMANDER, D., 2011. The VirtualGL Project - 3D withoutBoundaries. http://virtualgl.org/.
CRAY INC., 2010. Cray Timeline, Dec. http://www.cray.com/Assets/PDF/about/CrayTimeline.pdf.
107

DASSAULT SYSTEMS, 2007. IBM and Dassault Systemslaunch 3DLive for Online 3D Collaborative Intelligence.http://www.3ds.com/company/news-media/press-releases-detail/release/-94cf2faf1d/single/1487/?cHash=449b3a2d32.
DASSAULT SYSTEMS, 2011. ENOVIA – Collaborative Prod-uct Lifecycle Management. http://www.3ds.com/products/enovia/welcome/.
DHOEDT, B., 2010. Mobithin d5.7 phase ii experimental val-idation lab trials, June. http://www.mobithin.eu/documents/MobiThin_D5.7_WP5__30June2010_IBBT_V1.0.pdf.
DIVX, 2010. DivX Plus HD. http://www.divx.com/files/DivX_Plus_HD_Brochure.pdf/.
DKRZ, 2011. Web-GUI and Reservation System – VisualizationServer. http://www.dkrz.de/dkrz/services/vis/visserv01.
DUPONT, F., DUVAL, T., FLEURY, C., FOREST, J., GOURAN-TON, V., LANDO, P., LAURENT, T., LAVOUE, G., ANDSCHMUTZ, A. 2010. Collaborative scientific visualization: TheCOLLAVIZ framework. In Proceedings of Joint Virtual RealityConference of EuroVR - EGVE - VEC.
ELDING, R. 2010. The Apple iPad: Trendsand Statistics. Tech. rep., Sept. http://www.yudu.com/item/details/212676/The-Apple-iPad--Trends-and-Statistics.
ERICSSON. 2009. HSPA, the undisputed choice for mobilebroadband. Tech. rep., Feb. http://www1.ericsson.com/news/090201_hspa_and_mobile_Broadband_254740099_c.
EUREVA, 2011. The KUSANAGI Project. http://www.kusanagi.eu/default.htm.
GOOGLE LABS, 2010. Google body browser. http://bodybrowser.googlelabs.com/.
GOOGLE, 2011. Google Docs. https://docs.google.com/.
GRIMSTEAD, I. J., WALKER, D. W., AND AVIS, N. J. 2005.Collaborative Visualization: A Review and Taxonomy. In 9-thIEEE International Symposium on Distributed Simulation andReal Time Applications.
GRIMSTEAD, I. J., AVIS, N. J., AND WALKER, D. W. 2009.Rave: the resource-aware visualization environment. Concur-rency and Computation: Practice and Experience 21, 4, 415–448.
GROOVIZ, 2010. Visualization driving productivity. http://www.grooviz.com/.
GWENNAP, L. 2010. Linley Report on Dual-CoreSnapdragon. Microprocessor Report (July). http://www.qualcomm.com/documents/files/rapport-linley-sur-snapdragon-biprocesseur\---.pdf.
HARTMAN, N. W., AND LIM, A. 2008. Examining neutral formatsfor visualization and data exchange. In Proceedings of The 2008IAJC-IJME International Conference.
HARTMAN, N. W. 2009. Evaluating lightweight 3D graphics for-mats for product visualization and data exchange. Journal ofApplied Science & Engineering Technology (JASET).
HP, 2008. Whitepaper – A Case Study Comparing DataAccess Methods Using Remote Graphics Software andSiemens PLM Softwares Teamcenter 2007 and NX 5.http://newsletter.plmworld.org/Vol7No3/pc-RGS-Whitepaper.pdf.
HP, 2011. HP Remote Graphics System. http://h20331.www2.hp.com/hpsub/cache/286504-0-0-225-121.html.
HTC, 2011. HTC announces partnership and strategic investmentwith OnLive. http://www.htc.com/us/press/.
HUMPHREYS, G., HOUSTON, M., NG, R., FRANK, R., AH-ERN, S., KIRCHNER, P. D., AND KLOSOWSKI, J. T. 2002.Chromium: a stream-processing framework for interactive ren-dering on clusters. In Proceedings of the 29th annual conferenceon Computer graphics and interactive techniques, ACM, NewYork, NY, USA, SIGGRAPH ’02, 693–702.
IBM, 2009. IBM Deep Computing Visualization.http://www.ibm.com/servers/deepcomputing/visualization/.
ISO, 2007. Generic Applications of ASN.1: Fast Infoset.ISO/IEC 24824-1. http://www.iso.org/iso/iso_catalogue/catalogue_tc/catalogue_detail.htm?csnumber=41327.
ITU, 2008. Multipoint application sharing. ITU-T T.128. http://www.itu.int/rec/T-REC-T.128.
ITU, 2009. Asymmetric digital subscriber line (ADSL)transceivers extended bandwidth ADSL2 (ADSL2plus).ITU G.992.5, Jan.
JOHNSON, G. P., MOCK, S. A., WESTING, B. M., AND JOHN-SON, G. S. 2009. Envision: A web-based tool for scientificvisualization. In Proceedings of the 2009 9th IEEE/ACM Inter-national Symposium on Cluster Computing and the Grid, IEEEComputer Society, Washington, DC, USA, CCGRID ’09, 603–608.
JOURDAIN, S., FOREST, J., MOUTON, C., NOUAILHAS, B., MO-NIOT, G., KOLB, F., CHABRIDON, S., SIMATIC, M., ABID,Z., AND MALLET, L. 2008. Sharex3d, a scientific collaborative3d viewer over http. In Proceedings of the 13th internationalsymposium on 3D web technology, ACM, New York, NY, USA,Web3D ’08, 35–41.
JOURDAIN, S., AYACHIT, U., AND GEVECI, B. 2010. Par-aViewWeb, A web framework for 3D Visualization and DataProcessing.
KAPAHNKE, P., LIEDTKE, P., NESBIGALL, S., WARWAS, S.,AND KLUSCH, M. 2010. ISReal: An Open Platform forSemantic-Based 3D Simulations in the 3D Internet. In The Se-mantic Web - ISWC 2010: 9th International Semantic Web Con-ference, Shanghai, China, Revised Selected Papers, Part II. 161–176.
KARRENBERG, R., RUBINSTEIN, D., SLUSALLEK, P., ANDHACK, S. 2010. Anysl: Efficient and portable shading for raytracing. In Proceedings of the Conference on High PerformanceGraphics.
KATALABS, 2011. Kataspace. http://www.sirikata.com/blog/?p=184.
KHRONOS, 2007. OpenGL ES 2.0. http://www.khronos.org/opengles/.
108

KHRONOS, 2011. WebGL Specification Version 1.0. https://www.khronos.org/registry/webgl/specs/1.0/.
LANG, A., AND KOBILNYK, D. 2009. Visualizing atomic orbitalsusing second life. Journal of Virtual Worlds Research 2, 1.
LOHNHARDT, B., HEPPNER, S., DICKMANN, F., KASPAR, M.,QUADE, M., SKROWNY, D., KEPPER, N., KREFTING, D.,STEINKE, T., AND SAX, U. 2010. Evaluation of visualizationapproaches in a biomedical grid environment. e-Science Work-shops, IEEE International Conference on 0, 80–85.
LOWET, D., AND GOERGEN, D. 2009. Co-browsing dynamicweb pages. In Proceedings of the 18th international conferenceon World wide web, ACM, New York, NY, USA, WWW ’09,941–950.
MAGLO, A., LEE, H., LAVOUE, G., MOUTON, C., HUDELOT,C., AND DUPONT, F. 2010. Remote scientific visualization ofprogressive 3D meshes with X3D. In Proceedings of the 15thInternational Conference on Web 3D Technology, ACM, NewYork, NY, USA, Web3D ’10, 109–116.
MICROSOFT, 2002. Windows XP Tablet Edition.http://www.microsoft.com/windowsxp/using/tabletpc/default.mspx.
MICROSOFT, 2011. The RemoteFX ships prod-ucts today. http://blogs.technet.com/b/windowsserver/archive/2011/02/22/industry-support-surrounding-remotefx.aspx.
NAVE, I., DAVID, H., SHANI, A., TZRUYA, Y., LAIKARI, A.,EISERT, P., AND FECHTELER, P. 2008. Games@large graphicsstreaming architecture. In Consumer Electronics, 2008. ISCE2008. IEEE International Symposium on, 1 –4.
NIEBLING, F., KOPECKI, A., AND BECKER, M. 2010. Collab-orative steering and post-processing of simulations on hpc re-sources: everyone, anyti anywhere. In Proceedings of the 15thInternational Conference on Web 3D Technology, ACM, NewYork, NY, USA, Web3D ’10, 101–108.
OKAMOTO, Y., OISHI, T., AND IKEUCHI, K. 2009. Image-basednetwork rendering system for large sized meshes. In ComputerVision Workshops (ICCV Workshops), 2009 IEEE 12th Interna-tional Conference on, 931 –938.
ONLIVE, 2011. OnLive. http://www.onlive.com/.
OPENSIMULATOR, 2011. OpenSimulator. http://opensimulator.org.
RICHARDSON, T., STAFFORD-FRASER, Q., WOOD, K., ANDHOPPER, A. 1998. Virtual network computing. Internet Com-puting, IEEE 2, 1 (01), 33 –38.
RIVERBED, 2011. Delivering local-like performance for remotefxover the wan. http://blog.riverbed.com/2011/02/delivering-local-like-performance-for-remotefx.html.
ROSENMAN, M., SMITH, G., MAHER, M., DING, L., ANDMARCHANT, D. 2007. Multidisciplinary collaborative designin virtual environments. Automation in Construction 16, 1, 37 –44. CAAD Futures, 2005.
ROZENN BOUVILLE BERTHELOT, JEROME ROYAN, T. D., ANDARNALDI, B. 2008. Enabling Interoperability between 3D for-mats through a generic architecture. In International Conferenceon Artificial Reality and Telexistence 2010, University of SouthAustralia, Adelaide, AU.
SC4 VISUALIZATION AD HOC GROUP, 2009. Re-port on Visualisation Candidate Format Assessment,SC4 57th Plenary Meeting Parksville, BC, Canada.http://ng.tc184-sc4.org/index.cfm?PID=80&BID=9&FileID=60019&FID=55271.
SCHMUTZ, A. 2010. Impact of high performance computing.In Economics and Technologies for Inter-Carrier Services, 1stWorkshop, Economics and Technologies for Inter-Carrier Ser-vices, 71–77.
SHU, G., AVIS, N. J., AND RANA, O. F. 2008. Bringing semanticsto visualization services. Advances in Engineering Software 39,6, 514–520.
SONS, K., KLEIN, F., RUBINSTEIN, D., BYELOZYOROV, S., ANDSLUSALLEK, P. 2010. XML3D: Interactive 3D graphics for theweb. In Proceedings of the 15th International Conference onWeb 3D Technology, ACM, New York, NY, USA, Web3D ’10,175–184.
TAIVALSAARI, A. 2009. Mashware: the future ofweb applications. Tech. rep., Mountain View, CA,USA. http://labs.oracle.com/techrep/2009/smli_tr-2009-181.pdf.
TECHVIZ, 2010. TechViz XL and Fusion. http://www.techviz.net.
TREBILCO, D., 2005. GLIntercept v0.5.
VCOLLAB, 2010. Marechi, May. http://marechi.com/.
W3C, 2009. CSS 3D Transforms Module Level 3. http://www.w3.org/TR/css3-3d-transforms/.
W3C, 2010. Media Capture API. http://dev.w3.org/2009/dap/camera/Overview-API.
W3C, 2011. Efficient XML Interchange (EXI). http://www.w3.org/TR/exi/.
W3C, 2011. WebSockets API. http://dev.w3.org/html5/websockets/.
WAITE, S., AND URBACH, J., 2010. Thought Leader Inter-view with Jules Urbach, Founder & CEO OTOY. http://www.research2zero.com/Resources/Documents/R2%20Thought%20Leader%20Interview%20OTOY%20Sept%202010.pdf.
WANG, K., LAVOU, G., DENIS, F., AND BASKURT, A. 2010. Ad-vanced Techniques in Multimedia Watermarking: Image, Videoand Audio Applications. IGI Global, Apr., ch. Blind watermark-ing of three-dimensional meshes: Review, recent advances andfuture opportunities, 200–227.
WEB3D CONSORTIUM, 2008. ISO/IEC 19775-1.2:2008, Ex-tensible 3D (X3D). http://www.web3d.org/x3d/specifications/.
WIKIPEDIA, 2011. Comparison of Remote Desktop Software.http://en.wikipedia.org/wiki/Comparison_of_remote_desktop_software.
WOSSNER, U., SCHULZE-DOBOLD, J., WALZ, S., AND LANG,U. 2002. Evaluation of a Collaborative Volume RenderingApplication in a Distributed Virtual Environment. In Proceed-ings of the 8th Eurographics Workshop on Virtual Environments(EGVE), 113–122.
109

110