multimodal visualization with interactive closeups
TRANSCRIPT

EG UK Theory and Practice of Computer Graphics (2009)Wen Tang, John Collomosse (Editors)
Multimodal Visualization with Interactive Closeups
T. Ropinski1, I. Viola2, M. Biermann3, H. Hauser2 and K. Hinrichs1
1Visuailization and Computer Graphics Group (VisCG), University of Münster, Germany2Visualization Group, University of Bergen, Norway
3Department of Nuclear Medicine, Haukeland University Hospital, Norway
AbstractCloseups are used in illustrations to provide detailed views on regions of interest. They are integrated into therendering of the whole structure in order to reveal their spatial context. In this paper we present the concept ofinteractive closeups for medical reporting. Each closeup is associated with a region of interest and may show asingle modality or a desired combination of the available modalities using different visualization styles. Thus itbecomes possible to visualize multiple modalities simultaneously and to support doctor-to-doctor communicationon the basis of interactive multimodal closeup visualizations. We discuss how to compute a layout for 2D and3D closeups, and how to edit a closeup configuration to prepare a presentation or a subsequent doctor-to-doctorcommunication. Furthermore, we introduce a GPU-based rendering algorithm, which allows to render multiplecloseups at interactive frame rates. We demonstrate the application of the introduced concepts to multimodalPET/CT data sets additionally co-registered with MRI.
Categories and Subject Descriptors (according to ACM CCS): I.3.7 [Computer Graphics]: Three-DimensionalGraphics and Realism
1. Introduction
Recently, multimodal medical scanners have become avail-able to support medical diagnosis. These multimodal scan-ners, e. g., PET/CT, SPECT/CT or, very recently, alsoPET/MRI, generate two automatically co-registered modal-ities of a human subject during a single acquisition proce-dure. In addition to these modalities, sometimes also otherco-registered modalities and/or derived variables are takeninto account. The high potential benefit of having multi-ple different modalities co-registered with each other is un-questioned in medicine as it provides rich information aboutthe patient’s anatomy and physiology. While the scanningtechnology has evolved rapidly over the past years, multi-modal visualization techniques for medical applications arestill rather basic. Most medical workstations support mul-timodal visualization only as side by side views, or as ablended image, exploiting alpha compositing. While bothtechniques constrain the scale of the incorporated visualiza-tions, i. e., the same scale has to be used for all modalities,the alpha compositing also does not support a quantitativevisual analysis, since the shown colors are modulated due to
the blending. Additionally, contrast between pathology andnon-pathology in nuclear medicine and PET-images is oftenlost by alpha blending with anatomical images. For alphacompositing the number is limited by the fact that it can beinterpreted only, if at all, for at most two different colors.
Currently, the communication of diagnostic results is donevia a non-standardized reporting system. Thus, even in caseswhere the surgeon is provided with a detailed text report,sometimes required details about pathologies are not in-cluded in the report. In such a case intra-clinical personalexchange provides further details. Alternatively, the sur-geon may inspect the patient’s screenings available from thePACS data repository. Generation of rapid reports that docu-ment findings and provide overview and detail from multiplemodalities such as PET/CT/MRI has been our primary mo-tivation for visualization techniques presented in this paper.
To develop technologies, that address the discussed clin-ical needs, we have borrowed the concept of closeups, apopular expressive technique from hand-crafted technicaland medical illustration. They allow the visualization of thesame or different data at different scales and/or with differ-
c© The Eurographics Association 2009.

T. Ropinski et al. / Multimodal Visualization with Interactive Closeups
Figure 1: A closeup layout as generated with our system fora PET/CT data set of a patient suffering from three tumors.
ent viewing parameters, while they are integrated into anoverview rendering in order to reveal their spatial context.Our visualization approach shows an overview of the data byvisualizing the reference modality, and it generates closeupviews which provide the user with a more detailed repre-sentation of selected regions of interest (see Figure 1). Eachcloseup can use its own visualization style to display its con-tents, and it may either display a single modality or a particu-lar combination of the available modalities. The importanceof a closeup’s content can be reflected in its screen size. Thephysician can also modify a closeup’s visualization style,viewing direction, size, and position, as well as the shownmodalities. To document and include the diagnostic findings,it is possible to annotate the closeups and save the session tocapture the results of the medical diagnosis in an interactiveway.
2. Related Work
Our work fits into the category of focus+context visualiza-tion techniques [Hau05] and linking through views [Rob07].Both concepts are extensively researched in information vi-sualization for non-spatial abstract data. In volume visualiza-tion a related focus+context technique is the magic volumelens [WZMK05] which differs from closeups by keeping theoriginal spatial location of the focus region.
The concept of closeup illustration has been frequentlyused throughout modern hand-crafted illustration. Thestrength of this illustration technique is in multiscale integra-tion, for example it allows to show the cell level in the con-text of the entire human anatomy. In scientific visualizationthere are few works that directly use the closeup concept forfocus of attention. The first appearance of closeups for vol-ume data was in the VolumeShop framework [BG05]. In thisframework closeups were denoted as fanning and have beenpart of the illustrator’s toolbox. They could be combined for
example with interactive focus brushing and object’s label-ing. The closeup was combined either with a fan or an arrowdepicting its original spatial location in the context volume.The second appearance of closeups in the scientific litera-ture for medical visualization has been focusing on the ap-plication of higher-order reconstruction kernels at interactiveframe rates [TSS∗06]. The aim was to provide super res-olution visual appearance in the closeup region. Both of theprevious works on closeups have been primarily targeting onusing a single closeup + context visualization scenario usingone modality only. In contrast to our work they were not ad-dressing any multimodal, multiscale, or multifocal aspects.
Integration of multiple modalities, possibly of differentscales, through the visual closeup metaphor is the main focusof our work. Although the advanced imaging technologiesare capable of combining several different modalities, thereare only few visualization concepts for multimodal medi-cal visualization. Typical visualization of two co-registeredmodalities is overlaying one modality with another. Thistype of multimodal integration for PET/CT is already imple-mented in most dedicated medical workstations [KCF05].One of the early more advanced multimodal visualizationapproaches for MRI + fMRI integration used the magicmirror metaphor [KDG99]. The anatomical data shown inthe center has been combined with visualization in mirrorsshowing the functional modality as linked mirror reflection.This approach has linked views with closeups in common,however it suggests the spatial location of the functional re-flection by mirror projections, whereas we use explicit helperfanning graphics. Moreover the number of mirrors is con-ceptually limited to three, whereas our technique is not lim-ited to any specific number of closeup views. In some senseour technique exhibits similarity to the profile flags visualmetaphor for MRI T1-T2 visualization of cartilage patholo-gies or breast DCE-MRI [Mle06]. In contrast to the anatom-ical closeups, profile flags are small flag-like views placedon an iso-surface visualization of a T1 scan showing severalnon-spatial profile curves of T2 values over the cartilage tis-sue or perfusion values in breast tissue. They have not beenused for integration of spatial data which is our aim. Re-cently, the cutaway approach has been borrowed from il-lustrative visualization techniques for integration of a co-registered pre-operative modality with an interventional ul-trasound modality [BHW∗07]. This visualization techniqueprovides a clear view on the ultrasound plane in context ofthe rest of the anatomy obtained from the tomography data.Another technique is utilizing various cutting tools for neu-rosurgery planning [MFOF02]. Both works focus on guid-ing the intervention or exploration, whereas our visualizationtechnique aims at assisting the doctor-to-doctor communica-tion.
Supporting intraclinical doctor-to-doctor or doctor-to-patient communication has been recognized as an area wherevisual means of interactive visualization has the potential tobe used as a very effective communication platform. There
c© The Eurographics Association 2009.
T. Ropinski et al. / Multimodal Visualization with Interactive Closeups
Interactive Exploration CommunicationAutomated Pre-Selection
Closeup iscreenPosscreenSizeanchorPosvolumePosvolumeDimensions
Closeup iscreenPosscreenSizeanchorPosvolumePosvolumeDimensions
Closeup iscreenPosscreenSizeanchorPosvolumePosvolumeDimensions
Closeup iscreenPosscreenSizeanchorPosvolumePosvolumeSize
DiagnosticFindings
DomainKnowledge
DiagnosticAgreement
Figure 2: The successive phases of a medical diagnosis: thephysician explores the data and documents and includes thefindings; the diagnostic findings are discussed in a doctor-to-doctor communication.
are first works that are targeting at the communication sup-port. Viewpoint guidance for inspection of specific struc-tures for medical intervention planning is one of these ap-proaches [MNTP07]. In our approach the communicationcan be assisted by both non-interactive as well as interactivevisualization means and allows to focus on several differentstructures at once. We believe that our closeups can be uti-lized in combination with another work for visual communi-cation, i. e., in volumetric storytelling [WH07]. In this workseveral interaction patterns have been discussed from fullypassive story telling to a more interactive approach wherethe user can change attributes of the story. As described inSubsection 3.3, our technique can be used in combinationwith several of these different interaction patterns.
The concept of multiple views on the same data hasalso proven its potential in other domains. For instance,Butkiewicz et al. describe an interface for geospatial visual-ization, where coordinated visualizations are integrated intoso-called probe interfaces [BDW∗08]. These probes are sim-ilar to the closeups described in this paper, since they depictthe local data in user-defined regions-of-interest.
3. Interactive Closeups
Medical diagnoses have to be performed on a daily basis,usually under time pressure. Since medical scanners pro-duce data sets with increasing resolutions, the time requiredfor exploring a single data set is rising. Although automaticsystems can be exploited to accelerate this exploration, theycannot substitute the physician, and thus can only providea computer-generated guess, while the physician must havethe possibility to intervene at all times.
The process of a medical diagnosis as performed in ourradiology department can be seen as a sequence of events(see Figure 2). First, a study is explored. Based on this ex-ploration hypotheses are generated that are checked againstother domains, which included other imaging modalities,samples from body tissues as well as the patient’s medicalhistory. Often this involves discussions with other domain
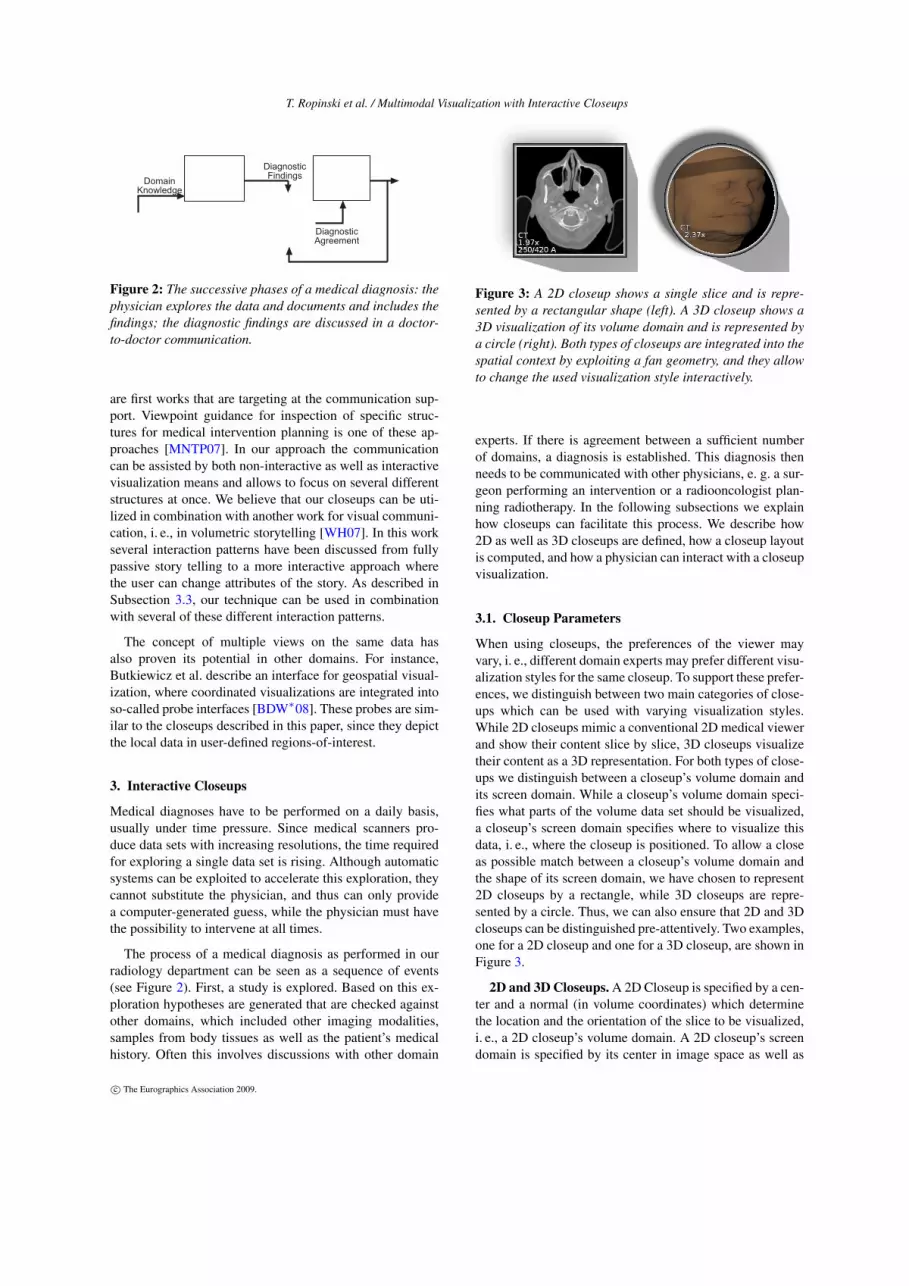
Figure 3: A 2D closeup shows a single slice and is repre-sented by a rectangular shape (left). A 3D closeup shows a3D visualization of its volume domain and is represented bya circle (right). Both types of closeups are integrated into thespatial context by exploiting a fan geometry, and they allowto change the used visualization style interactively.
experts. If there is agreement between a sufficient numberof domains, a diagnosis is established. This diagnosis thenneeds to be communicated with other physicians, e. g. a sur-geon performing an intervention or a radiooncologist plan-ning radiotherapy. In the following subsections we explainhow closeups can facilitate this process. We describe how2D as well as 3D closeups are defined, how a closeup layoutis computed, and how a physician can interact with a closeupvisualization.
3.1. Closeup Parameters
When using closeups, the preferences of the viewer mayvary, i. e., different domain experts may prefer different visu-alization styles for the same closeup. To support these prefer-ences, we distinguish between two main categories of close-ups which can be used with varying visualization styles.While 2D closeups mimic a conventional 2D medical viewerand show their content slice by slice, 3D closeups visualizetheir content as a 3D representation. For both types of close-ups we distinguish between a closeup’s volume domain andits screen domain. While a closeup’s volume domain speci-fies what parts of the volume data set should be visualized,a closeup’s screen domain specifies where to visualize thisdata, i. e., where the closeup is positioned. To allow a closeas possible match between a closeup’s volume domain andthe shape of its screen domain, we have chosen to represent2D closeups by a rectangle, while 3D closeups are repre-sented by a circle. Thus, we can also ensure that 2D and 3Dcloseups can be distinguished pre-attentively. Two examples,one for a 2D closeup and one for a 3D closeup, are shown inFigure 3.
2D and 3D Closeups. A 2D Closeup is specified by a cen-ter and a normal (in volume coordinates) which determinethe location and the orientation of the slice to be visualized,i. e., a 2D closeup’s volume domain. A 2D closeup’s screendomain is specified by its center in image space as well as
c© The Eurographics Association 2009.

T. Ropinski et al. / Multimodal Visualization with Interactive Closeups
its size. A 3D Closeup is specified by a center and a viewingdirection (in volume coordinates) which determine how thelocal camera associated with the closeup is oriented. Besidesits actual content, a closeup display also incorporates a textoverlay as well as a fan geometry. The fan geometry supportsan easy registration within the spatial context by pointing to-wards the center of the associated volume domain within theoverview rendering. The text overlay supports an easy inter-pretation of the individual closeups by depicting the shownmodalities as well as the degree of magnification used forthe volume domain.
Depth Awareness. While the fan geometry gives an ap-propriate cue about the projected position of the anchor pointwithin the overview rendering, it does not provide any depthcues. However, especially when the projections of multipleanchor points overlap each other, at least a relative depth or-der has to be perceivable to support spatial comprehension.Shadows are known to improve spatial cognition by intro-ducing additional depth cues [SSMK05]. Therefore, we havechosen to incorporate shadows into our closeup visualizationwith the goal to provide some extra depth information forthe anchor point. For each closeup we introduce a shadowwhose appearance is proportional to the depth value of thecloseup’s anchor point with respect to the current overvieworientation. For closeups being far away, we want to gen-erate a shadow suggesting that the closeup is close to theimage plane, while for closeups being close to the viewer,we want to generate a shadow which gives the impressionthat the closeup hovers at a certain distance over the imageplane. Therefore we set the translation of the shadow, i. e.,the distance between the closeup’s center and the associatedshadow’s center, as well as its size inversely proportionalto the closeup’s depth value. This results in the impressionthat closeups lying further back and having smaller shadowsare perceived as being closer to the image plane than close-ups being closer to the viewer, which have a greater shadowtranslation. To avoid overlap between a closeup’s fan and itsshadow, we assume that the shadow generating light sourceis located in the closeup’s anchor point.
3.2. Closeup Layout
Multiple closeups as handled by our system need to be ar-ranged in order to generate an adequate layout. For this lay-out process we adhere to three simple guidelines potentiallyleading to a more sophisticated arrangement. The first lay-out guideline addresses optimal visibility of all closeups andtherefore forbids closeups overlapping each other. The sec-ond guideline aims at improved readability of the closeup vi-sualization, which we try to achieve by placing each closeupas close to its anchor point as possible. Finally, in orderto support visual tracing of closeups in different layouts ofthe same visualization, we aim at a coherent layout, whereadding of closeups results in minor changes only. During thewhole layout process, we consider the importance of each
image border
overviewrendering
cu4
cu0
cu1
cu2
cu3
FdFc Fa
Figure 4: To compute the position for the closeups, we ex-ploit a force model. The centering force Fc allows to posi-tion closeups centered between the image border and theoverview rendering, while the distribution force Fd avoidscloseup clustering. To position closeups close to their an-chor points, we apply the anchor force Fa.
closeup in such a way that closeups having a higher impor-tance more likely meet the layout guidelines in cases wherenot all closeups can conform to the guidelines. Since moreimportant closeups should be visually emphasized, we havedecided to provide them more screen space and thereforehave mapped the importance directly to a closeup’s size.
To support the coherent layout as well as to avoid closeupsoverlapping each other, we make use of a physics engine in-troducing a simple force model. The idea of using a physicsengine to arrange the components of a visualization has al-ready been proposed in [BG06], where the layout of the 3Dcomponents of an exploded view is computed. Since in ourcase we have to deal with 2D objects only, namely rectan-gles and circles, using 2D physics is sufficient. Therefore wehave chosen the Box2D physics engine†, which can handlearbitrary convex 2D objects. By exploiting its physics ca-pabilities, we can easily compute an initial layout for eachcloseup and are also able to avoid closeup overlaps duringthe interaction process when moving or resizing closeups(see Subsection 3.3). The initial layout is computed by ex-ploiting the following forces, which affect the positioningof the closeups. The centering force Fc = cc ·N emanatingfrom the image border and the border of the overview ren-dering effects that closeups are positioned halfway betweenthe image border and the overview rendering. cc is a globalconstant influencing the centering force, and N is the normalof the image border resp. the overview rendering. Since theimage border and the overview rendering are treated alike, acentering effect between both is achieved (see Figure 4). In
† www.box2d.org
c© The Eurographics Association 2009.

T. Ropinski et al. / Multimodal Visualization with Interactive Closeups
(a) (b) (c)
Figure 5: A sequence of images showing the same 3Dcloseup after successive interactions have been performed:the intial closeup (a), after shrinking its volume domain (b)and after increasing its importance and changing the cam-era orientation (c).
order to reduce clustering of closeups we ensure that they aredistributed within the available image space by applying arepulsive force Fd(cuk,cu j) = cd · ik ·
Vk j||Vk j|| , which emanates
from a closeup cuk and acts on an adjacent closeup cu j. Vk jis the unique vector p j− pk determined by any pair of pointspk on the border of cuk and p j on the border of cu j whichrealize the minimal distance between cuk and cu j . The nor-malized vector given by the fraction is modulated with theglobal constant cd and the importance ik of the closeup cuk.Thus we can ensure that closeups having a higher impor-tance are positioned with more spacing to other closeups. Toallow the closeups to stay close to their anchor points, we in-troduce an anchor force Fa(cuk) = ca · ik · anchork−centerk
||anchork−centerk||attracting closeup cuk to its anchor point. ca is the global an-chor distance constant which is proportional to the availableimage space, ik again represents the importance of closeupcuk, anchork the position of its anchor point and centerk itsposition in image space. By incorporating ik we force moreimportant closeups to stay closer to their anchor point thanless important closeups in cases of collision.
3.3. Closeup Interaction
To support interactive reporting, we introduce a set of inter-action metaphors, which enable the physician to change thesubset of visualized closeups, their layout as well as theirused visualization style.
3D Closeup Interaction. To configure the views pre-sented in the individual 3D closeups, the user can alsochange the viewing parameters. Therefore, in addition to aset of variables capturing the individual visualization style,a quaternion is associated with each 3D closeup which speci-fies the orientation of the closeup’s camera. This rotation canbe changed by using a trackball metaphor. Furthermore a ro-tation can be transferred from one closeup to another one.The latter can be especially helpful when multiple close-ups show different modalities for the same volume domain.Besides modifying the camera orientation of a 3D closeupalso its volume center can be changed interactively. This
can be done either directly, by dragging the closeup’s anchorpoint, or indirectly by changing the volume center within thecloseup. When changing the volume center indirectly the an-chor point displayed on top of the overview rendering is up-dated automatically. To magnify the content of a 3D closeupthe size of its volume domain can be changed. When shrink-ing the volume domain, less volume data is shown withina closeup of the same size in image space, which resultsin a higher degree of magnification. Figure 5 shows a se-quence of images with the same 3D closeup after successiveinteractions have been performed. In Figure 5(a) the initialcloseup is shown. The volume domain has been shrunk inFigure 5(b). Finally, in Figure 5(c) the importance has beenincreased and the camera orientation has been changed.
2D Closeup Interaction. The interaction techniques forthe 2D closeups are very similar to those used in medicalslice viewers. The domain expert may change the visualiza-tion style, the shown slice, its thickness as well as the shownsection. Furthermore, the alignment of the shown slice maybe changed between axial, sagittal and coronal.
4. Rendering of Multiple Closeups
When using closeups in an interactive visualization, it is es-sential to be able to render at interactive frame rates. Toachieve high quality rendering we exploit GPU-based raycasting [KW03] for both the overview rendering as well asthe 3D closeups. Our C++-implementation uses the OpenGLlibrary together with GLSL for the image generation. Thecloseup visualization algorithm proceeds in two consecutivestages: overview generation and closeup rendering. Whengenerating the overview rendering, arbitrary rendering stylescan be chosen. For creation of the overview rendering, weinitially construct the proxy-geometry and render the entryand exit parameters into 2D textures, which are used duringthe actual ray casting. The ray casting produces an RGBAtexture containing the final rendering, in our case a MIP,as well as the associated alpha values. To enable a user tomanually add closeups by double-clicking onto the overviewrendering, we generate an additional texture, which containsappropriate volume coordinates. For performance enhance-ment we exploit the OpenGL multiple render target exten-sion and generate the overview rendering as well as the vol-ume coordinates in a single rendering pass. While in mostcases the volume coordinates would be given by the coordi-nates of the first point hit by a ray, for a MIP we store thevolume coordinates of the sample having the maximum in-tensity along each ray.
Since several closeups may be rendered simultaneously,it is important to minimize the used memory resources aswell as to reduce the number of context switches, which de-teriorate rendering performance. However, we still have tosupport different visualization styles for the contents of dif-ferent closeups. In order to address the context switch issue,before rendering we sort the closeups lexicographically ac-
c© The Eurographics Association 2009.

T. Ropinski et al. / Multimodal Visualization with Interactive Closeups
cording to the following three keys: (1) type of closeup, i. e.,2D or 3D, (2) displayed modality, e. g., CT, MRI or PET,and (3) type of visualization, e. g., direct volume rendering(DVR), MIP or surface rendering. Thus similar closeups arerendered successively, and the number of context switches isreduced. While the rendering of 2D closeups consists of ren-dering appropriately sized quads with suitable texture coor-dinates, efficient rendering of 3D closeups requires some ex-tra effort. A straightforward approach to rendering 3D close-ups would be to generate a pair of 2D entry and exit pa-rameter textures representing the volume domain of each 3Dcloseup. While this would allow an easy integration of dif-ferent visualization styles, the amount of used resources -in terms of texture memory as well as the number of con-text switches needed for binding these textures prior to raycasting - is too high and does not allow interactive render-ing. Therefore, we propose a rendering technique for mul-tiple closeups, which exploits a single screen-sized textureonly, introduces no additional overhead in terms of contextswitches, and still allows to use different visualization stylesfor the content of different closeups. In a pre-pass, we con-struct a 2D texture which contains the exit parameters of all3D closeups. During this pre-pass we render for each 3Dcloseup a sphere with radius equal to the image space radiusof the 3D closeup. The mapping of the volume coordinatesspecified by the closeup’s volume domain to color-coded co-ordinates as used during the ray casting is done as follows:
RBG = cuvolumePos + vertcur ∗ (cuvolumeSize/cuscreenSize),(1)
where cuvolumePos is the center in volume coordinates for thecurrent closeup, cuvolumeSize is the size of its volume domainand cuscreenSize is its screen radius. vertcur is the currentlyprocessed vertex as it is not transformed by the modelviewmatrix, i. e., the sphere is specified as centered in the ori-gin. Notice that we apply swizzling by assigning the value toRBG in order to deal with the different coordinate axis align-ment used in volume and model space. After processing all3D closeups in this way, we have a single 2D texture contain-ing all exit parameters. During the successive rendering pass,the generated 2D texture is bound and the 3D closeups arerendered in their previously defined order. Therefore, we en-able front face culling and render the spheres using the samemapping between volume coordinates and color as defined inEquation 1. By also binding the volume data sets represent-ing the used modalities as well as enabling the appropriateshader programs, the GPU-based ray casting of the 3D close-ups can be performed. The result of this closeup renderingpass is stored in a closeup buffer, which is composited withthe overview rendering to obtain the final rendering. To al-low easy picking of the closeups we again exploit multiplerender targets to render a unique ID for each closeup into anID buffer during the pre-pass.
After the contents of the closeups have been rendered, wehave to overlay the image space elements as closeup bor-ders, shadows and the fans which are used to associate a
fps1 closeup 332 closeups 294 closeups 278 closeups 1816 closeups 11
Table 1: Average frame rates for a varying number of 3Dcloseups captured on a desktop system with a GeForce8800GTX graphics board.
closeup with the corresponding position in the overview ren-dering. The shadows are generated by rendering a disc resp.quad with the desired shadow size. This shadow proxy istranslated with respect to the depth of the closeup, i. e., forcloseups being further away the translation is smaller, whichmakes the closeup appear to lie closer to the image plane.We improve rendering performance by adding approximatedsoft shadows only. This is done by linearly interpolatingfrom α = 0 to α = 1 along the visible part of the shadowgeometry. As it can be seen in Figure 1 and Figure 6 (b) weare thus able to generate plausible shadows, which allow animproved depth separation. Furthermore, for rendering thefan geometry, we have to compute the attachment points onthe closeups. While we choose the extremal points for rect-angular 2D closeups, we have to compute the two tangentialpoints for the circular 3D closeups. Assuming that the cen-ter of the closeup lies in the origin this calculation can beperformed as follows:
xt =cuapx · cu2
ss± cuapy · cuss ·√
cu2apx + cu2
apy − cu2ss
cu2apx + cu2
apy
,
(2)
where xt denotes the x-coordinate of the tangential point,cuap is the position of the corresponding anchor point andcuss is the image space radius of the closeup. The respec-tive values for yt can be computed by evaluating the circlefunction for the two computed xt values.
We have analyzed the performance of our algorithm byrendering a multimodal PET/CT data set. While the CT dataset has a resolution of 512× 512× 162 voxel, the PET dataset has a resolution of 128×128×162 voxel. The tests havebeen performed on a standard desktop system, having an In-tel Core2 CPU 6600 running at 2.40 GHz, 2 GB of mainmemory, and an nVidia GeForce 8800GTX graphics board.We have rendered the multimodal data set at a resolution of1024× 1024 pixels with a varying number of 3D closeupshaving the maximal possible screen size. The results of ourperformance tests are shown in Table 1 and emphasize theexpected linear scaling. As it can be seen, our technique stillallows interactive frame rates and thus supports user interac-tion as described in Subsection 3.3.
c© The Eurographics Association 2009.

T. Ropinski et al. / Multimodal Visualization with Interactive Closeups
5. Closeups for PET/CT Visualization
While the concept of interactive closeups can also be appliedto other multimodal application scenarios, PET/CT is a goodexample which provides a high quality spatial context givenby the CT data set as well as metabolism activity patternsspecified by the PET data set. Often PET/CT scans are usedfor detecting pathological cell growth, as it occurs in canceraffected regions. During this medical diagnosis, the physi-cian scans usually through the PET data set slice by slice tovisually examine the PET uptake. In regions where an abnor-mal PET uptake is present, the physician examines the datasets in more detail. The CT data set is consulted in order toidentify a corresponding pathological lesion in the morpho-logical domain or to identify structures (such as the ureter)that have confounding physiological uptake. In addition tothe CT data set also a 3D visualization of the PET data setcan be helpful. When examining the urinary bladder, smallactivity spots may be close to the urinary bladder, whichhas a high uptake. In some cases these potentially abnormaluptakes cannot be spatially distinguished from the urinarybladder in a slice visualization. Thus physicians consult a3D PET visualization or even a multimodal fusion visualiza-tion. Besides the standard fusion, we provide a CT visual-ization, in which the opacity is modulated by the intensityof the PET. Thus, we can ensure, that potentially interestingareas with a high PET uptake are clearly visible.
To support nuclear radiologists during the inspection ofPET/CT data sets when scanning for abnormal cancer ac-tivity, we provide a MIP of the PET data set, which servesas the overview rendering. Providing this overview render-ing fits with the medical diagnosis workflow, where the PETdata set is observed slice by slice. By applying a desiredcolor lookup table, areas of high uptake can be visuallyemphasized. By exploiting the interaction metaphors intro-duced in Subsection 3.3, the domain expert can add, modifyand remove closeups. The application of our technique toPET/CT is shown in Figure 1. The patient suffers from threetumors, one in the throat, one in the chest and one in the ab-domen. The three closeups all show a PET/CT visualization,whereas in the 3D closeups ghosting is exploited to make theareas with high PET uptake visible.
6. Case Study
We have also evaluated the proposed concepts on the case ofa 58 years old patient who was diagnosed using F-18-FDG-PET-CT. Preparing a structured report about the diagnosis,though it is very helpful, is a quite lengthy process and cantake more than an hour. During the evaluation, we have re-generated the medical report shown in Figure 6 (a)‡. The re-port can now be generated with only a few mouse clicks. As
‡ The setup process is shown in the accompanying video
shown in Figure 6, the resulting closeup visualization pro-vides a good overview to support the localization of patholo-gies, as well as a detailed view of them. Textual functional-ity allows to write annotations directly next to the images,so that several examiners can include their comments (seeFigure 6 (b)).
A feature which makes the proposed solution distinguish-able from all available commercial software, is the possibil-ity of interactive reporting. Instead of generating a static re-port, we generate a project file, that describes parameters ofthe entire closeup visualization, including closeup positions,viewpoints and visual representations. Using this report thesurgeon can interact with it, and has the opportunity to seekfor information that is not included in the report.
7. Conclusions and Future Work
In this paper we have introduced the concept of interac-tive closeups for multimodal visualization. Closeup visu-alizations introduce a new quality into the communicationof medical findings. They facilitate the diagnostic processby emphasizing potentially relevant regions. Furthermore,they reduce interaction time by supporting intuitive interac-tion and layout concepts. Theoretically, an unlimited numberof modalities as well as scales can be visualized by usinginteractive closeups. Interactive closeups support doctor-to-doctor communication by allowing physicians to perform aninteractive exploration and to save and communicate theirinsights in an intuitive way. We believe, that our systems al-lows to generate interactive reports more efficient, in com-parison to current medical workstations. Thus, discussion,presentation as well as reporting of diagnostic findings canbe performed more efficiently. Since interactive closeups donot constrain the number of incorporated modalities or thedifference in data scale, they can be widely used for differ-ent application cases.
Acknowledgements
This work was partly supported by grants from the DeutscheForschungsgemeinschaft (DFG), SFB 656 MoBil Mün-ster, Germany (project Z1). The presented concepts havebeen integrated into the Voreen volume rendering engine(www.voreen.org). The authors would like to thank FlorianLindemann and Roland Leißa for implementing parts of theproposed concepts as well as Sven Hermann for providingthe data set shown in Figure 1.
References
[BDW∗08] BUTKIEWICZ T., DOU W., WARTELL Z.,RIBARSKY W., CHANG R.: Multi-focused geospatialanalysis using probes. IEEE Transactions on Visualiza-tion and Computer Graphics 14, 6 (2008), 1165–1172.
c© The Eurographics Association 2009.

T. Ropinski et al. / Multimodal Visualization with Interactive Closeups
(a) (b)
Figure 6: (a) A report generated to communicate a medical case. The generation took more than an hour. (b) An interactivecloseup report could be generated in a couple of minutes with the concepts proposed in this paper.
[BG05] BRUCKNER S., GRÖLLER M. E.: VolumeShop:An interactive system for direct volume illustration. InProc. of IEEE Visualization’05 (2005), pp. 671–678.
[BG06] BRUCKNER S., GRÖLLER M. E.: Explodedviews for volume data. IEEE Transactions on Visualiza-tion and Computer Graphics 12, 5 (9 2006), 1077–1084.
[BHW∗07] BURNS M., HAIDACHER M., WEIN W., VI-OLA I., GRÖLLER M. E.: Feature emphasis and contex-tual cutaways for multimodal medical visualization. InProc. of EuroVis ’07 (5 2007), pp. 275–282.
[Hau05] HAUSER H.: Scientific Visualization: The Vi-sual Extraction of Knowledge from Data. Springer, 2005,ch. Generalizing Focus+Context Visualization, pp. 305–327.
[KCF05] KIM J., CAI W., FENG D.: Dual-modality PET-CT visualization using real-time volume rendering andimage fusion with interactive 3D segmentation of anatom-ical structures. In Proc. of IEEE Engineering in Medicineand Biology ’05 (2005), pp. 642–645.
[KDG99] KÖNIG A., DOLEISCH H., GRÖLLER M. E.:Multiple views and magic mirrors - fMRI visualization ofthe human brain. In Proc. of SCCG ’99 (1999), pp. 130–139.
[KW03] KRÜGER J., WESTERMANN R.: Accelerationtechniques for GPU-based volume rendering. In Proc. ofIEEE Visualization ’03 (2003), pp. 287–292.
[MFOF02] MANSSOUR I. H., FURUIE S. S., OLABAR-RIAGA S. D., FREITAS C. M. D. S.: Visualizing in-
ner structures in multimodal volume data. In SIBGRAPI’02: Proc. of the 15th Brazilian Symposium on ComputerGraphics and Image Processing (2002), pp. 51–58.
[Mle06] MLEJNEK M.: Medical Visualization for Ortho-pedic Applications. PhD thesis, Institute of ComputerGraphics and Algorithms, Tu Vienna, 2006.
[MNTP07] MUEHLER K., NEUGEBAUER M., TIETJEN
C., PREIM B.: Viewpoint selection for intervention plan-ning. In Proc. of EuroVis ’07 (2007), pp. 267–274.
[Rob07] ROBERTS J. C.: State of the art: Coordinated &multiple views in exploratory visualization. In Proc. ofIEEE CMV ’07 (2007).
[SSMK05] SATTLER M., SARLETTE R., MÜCKEN T.,KLEIN R.: Exploitation of human shadow perception forfast shadow rendering. In APGV ’05: Proc. of the 2ndsymposium on Applied perception in graphics and visual-ization (2005), pp. 131–134.
[TSS∗06] TAERUM T., SOUSA M. C., SAMAVATI F.,CHAN S., MITCHELL R.: Real-time super resolutioncontextual close-up of clinical volumetric data. In Proc.of EuroVis ’06 (2006), pp. 347–354.
[WH07] WOHLFART M., HAUSER H.: Story telling forpresentation in volume visualization. In Proc. of Euro-Vis ’07 (2007), pp. 91–98.
[WZMK05] WANG L., ZHAO Y., MUELLER K., KAUF-MAN A.: The Magic Volume Lens: An interactive fo-cus+context technique for volume rendering. In Proc. ofIEEE Visualization’05 (2005), pp. 47–54.
c© The Eurographics Association 2009.