visual data exploration to feature space definition
TRANSCRIPT
Visual Data Exploration to Feature Space Definition
Bruno Brandoli, Danilo Eler, Fernando Paulovich, Rosane Minghim, Joao BatistaInstituto de Ciencias Matematicas e de Computacao (ICMC) – University of Sao Paulo (USP)
Sao Carlos, BrazilEmail: {brandoli,eler,paulovic,minghim,jbatista}@icmc.usp.br
Abstract—Many image-related applications rely on the factthat the dataset under investigation is correctly representedby features. However, defining a set of features that properlyrepresents a dataset is still a challenging and, in most cases,an exhausting task. Most of the available techniques, especiallywhen a large number of features is considered, are based onpurely quantitative statistical measures or approaches basedon artificial intelligence, and normally are “black-boxes” to theuser. The approach proposed here seeks to open this “black-box” by means of visual representations, enabling users toget insight about the meaning and representativeness of thefeatures computed from different feature extraction algorithmsand sets of parameters. The results show that, as the combi-nation of sets of features and changes in parameters improvesthe quality of the visual representation, the accuracy of theclassification for the computed features also improves. Theresults strongly suggest that our approach can be successfullyemployed as a guidance to defining and understanding a setof features that properly represents an image dataset.
Keywords-Visual Feature Space Analysis; Feature SpaceVisualization; Feature Space Evaluation; Visual Exploration
I. INTRODUCTION
The extraction of feature vectors is crucial for manyimage-related applications, for instance pattern recognition,content-based image retrieval or image mining, determiningthe accuracy of the results achieved by them [1]. There existseveral algorithms to compute such vectors, each of whichwith their own set of parameters, reflecting different prop-erties of the image dataset under investigation. Therefore,the choice of the set of features that provides the highestclassification rates or the most efficient retrieval poses as achallenging accomplishment. Usually, such task requires apriori knowledge of the image dataset [2]. Also, to build arobust model several experiments may be required and thisis often a very expensive process [3].
In many cases, users start by selecting a pre-labeled setof images and define the parameters for the feature extrac-tion algorithm, which is frequently a tedious and laborioustask. Then, feature vectors are computed and classificationattained. High classification rates will be only achieved if theset of features proves adequate for the image dataset. Thiscan only be assessed after the classification process has beencarried out. In other words, one cannot infer beforehand howeffective the computed features will be for the classificationprocess. Our goal is to provide effective tools to support
feature definition speeding up the setup procedure beforeclassification.
In this paper we propose a new approach to the vi-sual analysis of feature spaces using point placement orprojection techniques [4]. Projection techniques work bymapping high-dimensional data into a lower dimensionalvisual space, whilst retaining, up to an extent, the distancerelationships defined in the original data space. Initially,a set of features is extracted. Then, the computed featurevectors are visualized in a 2D representation that reveals thesimilarity relationships between the images under analysis.This visual representation is used to determine if this set offeatures successfully represents the image dataset, accordingto an expert point of view. If the similarity relationshipsmatch with what is expected by the expert – similar imagesare closely placed and the dissimilar ones are positionedfar apart –, the set of features properly represents thedataset and can be considered for other tasks, such asclassification. Otherwise, the parameters can be changed oranother extraction algorithm can be employed, producinga new set of features which can then be visually exploredto check if it properly represents the dataset. This providesan interactive visual approach which help users to constructbetter models for image processing.
The main contributions of this paper are:• an approach for visual exploration of feature spaces
targeted at converging to useful features for image pro-cessing, according to the expert point of view;
• an interactive visual framework which help users tobetter “understand” different sets of features;
• a method to objectively evaluate the quality of projec-tions which match with the concept that better projec-tions result in more appropriate feature spaces, speciallyfor classification tasks.
The remaining of this paper is organized as follows.Section II describes related work on visual analysis of fea-ture spaces. Section III presents background information onfeature extraction and information visualization techniquesemployed here. Section IV details our approach througha simple example. Section V presents the results of theexperiments performed in order to evaluate the proposedapproach. Finally, conclusions and directions for futureresearch are given in Section VI.

II. RELATED WORK
Employing visualization techniques to explore and todraw knowledge from datasets is an efficient way to combinehuman intelligence with the powerful force of computa-tion [5]. Several visualization techniques and tools have beendeveloped enabling users to interact with abstract data [6],some of which specially designed to explore multidimen-sional spaces resulting from the feature extraction process.
One of these approaches was proposed by Rodrigueset. al. [7] (further extended in [8]). The aim is to givesupport to the analysis of the features employed on similarityqueries for a content-based image retrieval system. Once thefeature space is composed, a visual representation is createdshowing that the best visual representation conveys the bestprecision and recall measures when a query is executed onthe data. However, the visual representation is not used tohelp an user to interactively define the best set of featuresor the best set of parameters to extract the features, but onlyto confirm that the query precision and recall matches withthe visual representation quality. In our approach, the visualrepresentation is meant as an interactive guide to explore,define and refine the set of features, giving insight on howthe extraction algorithm parameters or the weighting of thefeatures affect the similarity relationships between groups orindividual images.
PEx-Image [9] is a similar tool, which employs a pointplacement visual representation to explore image collections.This tool provides interactive visualizations to aid on theexploration of feature spaces, and supports the comparisonbetween different spaces using coordination techniques. Themain difference between PEx-Image and the approach pro-posed is that the former aims at creating the best visualrepresentation given a feature space, while here we seek tocreate a visual representation which best reflects the featurespace, that is, a visual representation that is as good as thefeature space. Therefore, our approach gives more preciseinsight in the similarity relationships between images. Inaddition, in PEx-Image the quality of a visual representationis only defined according to the user’s point of view. Here weuse a well-known measure, borrowed from the data-miningcommunity, to help users assess such quality, thus reducingthe subjectiveness of conclusions based purely on the visualanalysis.
III. BACKGROUND
A. Feature ExtractionFeature extraction is the process of capturing quantitative
characteristics of an <w×h image and place them into a<n dimensional feature vector, in which n is the numberof values extracted, w and h are image width and height,respectively. Several feature extraction methods, also knownas descriptors, have been proposed in the literature [10].In this paper, traditional texture analysis methods as co-occurrence matrix [11] and Gabor filters [12] features are
used. In the former, 5 measures (energy, entropy, inertia,inverse difference moment, and correlation), 5 distancesand 4 directions are considered, summing-up 100 distinctfeatures. In the latter, 16 features using energy of theresponses of Gabor filters are computed (4 orientations - 00,450, 900 and 1350 - and 4 scales). In addition, experimentsare also carried out using features extracted from R, G, Bplane, yielding 48 features.
We also test features extract using the bag-of-visual-features (BoVF) model. The process for constructing a BoVFmodel starts by selecting a set of keypoints over the images.This selection is done sparsely or densely. Several localregions detectors have been proposed in the literature [13].Then, the descriptors are computed around the keypoints. Inthis work, the keypoints are obtained with the Harris-Laplacepoint detector or dense sampling [13]. After the pointsselection and description, each vector is quantized againsta visual codebook or vocabulary. Codebooks are usuallyconstructed by using a method to cluster the keypoints. Inthis work, the visual codebook is created via k-means [14]clustering algorithm. Once the vocabulary is defined, eachkeypoint is assigned to the codebook element that is closestin the Euclidean space. The result is a histogram thatrepresents the BoVF model normalized to sum-up 1.
In this work, a visual representation of the feature spaceis carried out right after feature extraction. Such visualrepresentations are constructed by employing multidimen-sional projections techniques, which are detailed in the nextsection.
B. Multidimensional Projection Techniques
Multidimensional projection techniques, or simply projec-tion techniques, seek to create visual representations thatenable users to employ their visual ability to recognizepatterns and structures present in the dataset. Each datainstance (an image) is represented as a visual element, suchas a circle, point or sphere, and mapped into a visual spacethat may be either 1D, 2D, or 3D. The relative positionsof these elements reflect some type of relationship betweendata instances, the most common being the similarities orneighborhood relationships [15]. In this case, if the elementsare closely placed on the final layout, it indicates that thedata instances they represent are similar according to acertain distance. If the elements are projected far apart, itindicates that the objects they represent are not related.
Currently, there exist a number of different techniquesconsidering different aspects of data distribution, such asthe distance distribution, non-linear relationships among thedimensions, etc. (we refer to [15] for more details). Herewe are interested in a very accurate technique, that is,the one which reflects as much as possible on the visuallayout the distance relationships between the data instancesin the original space. To accomplish that Classical Scalingis considered the best choice. In Classical Scaling, a doubly-

centered distance matrix between all pairs of data instancesis defined, and a spectral decomposition is applied to recoverthe Cartesian coordinates of the elements in the visualspace. It is possible to prove that if the distance function isEuclidean, the projected space presents the smallest meanquadratic deviation from the original space between allpossible reduced spaces. Therefore, preserving as muchas possible the distance relationships amongst the datainstances when they are projected on the visual space [16].Formally, dij is the distance between points xi and xj , andplaced in the position ri and rj in projection, respectively.Finally, the minimum of the Equation 1 is computed.
P =∑i
∑j>i
(dij − ‖ri − rj‖)2
dij(1)
C. Assessing the Projection Quality
The visual analysis approach proposed in this work aimsat verifying whether similar images, according to the user’spoint of view, are also similar according to the extractedset of features used to represent them. Although users mayemploy their visual abilities to determine the quality ofa projection, it is rather difficult to tell small differencesresulted from slightly modified set of features. In orderto reduce this subjectiveness, a measure called silhouettecoefficient [17], which was originally proposed to evaluateresults of clustering algorithms, is employed.
The silhouette coefficient measures both the cohesionand separation between instances of clusters. Consider aninstance i belonging to cluster, its cohesion ai is calculatedas the average of the distances between i and all otherinstances belonging to the same cluster. The separation biis the minimum distance between i and all other instancesbelonging to the other clusters. The silhouette of a projectionis given as the average of the silhouette of all instances,where n is the number of instances. In Equation (2) it isformalized.
S =1
n
n∑i=1
(bi − ai)
max(ai, bi)(2)
The silhouette can vary between −1 ≤ S ≤ 1. Largervalues indicate better cohesion and separation betweenclusters. In our approach, clusters are composed takinginto account the pre-labeled instances, and the silhouetteindicates whether images belonging to the same class aremore similar between themselves than images belonging toother classes.
The usefulness of our approach is presented in the nextsection by means of a simple application.
IV. AN APPROACH TO VISUAL FEATURE SPACEANALYSIS
The diagram of Figure 1 summarizes the approach sug-gested here. First, a set of image features is extracted and
then projected onto a 2D space. Upon user’s agreementon the goodness of the provided result (based on visualinspection or observation of the silhouette coefficient), theset of feature can then be used for other tasks, such asclassification, retrieval or data mining. If significant mis-placement is found, the parameters or extraction methodsused to compute features ought to be changed, and theprocess re-executed. This process is performed until theexpected outcome is reached, that is, until the projectionseparates what is similar from what is not.
Figure 1. Proposed visual exploration of the feature space.
To exemplify our approach we propose an initial experi-ment formed by a set of 70 texture images from the Brodatzdataset [18], grouped into 7 classes with 10 images each.Features are extracted using Gabor filters. The feature spacevisualization is depicted in Figure 2. Images are representedas circles, and are colored according to the class they belongto. For clarity, one image sample of each class is placed nearto its corresponding cluster. In this projection 5 classes arewell separated, but 2 are mixed up (top right-hand corner).This is a clear indication of a limited discriminant powerof the chosen feature set. A closer look, on the other hand,reveals that in terms of texture pattern, both mixed up classesare very similar. Therefore, it is up to the user to decidewhether such classes should in fact be considered as a singleclass. If that is the case, this can be taken as a good set offeatures. Otherwise, a new set should be evaluated.
Figure 2. Analysis of an image dataset containing 7 different classes. 5classes of images are well distinguished, but 2 are mixed-up, indicatingthat the employed features could not separate these 2 classes.
The experiment is extended with the addition of 3 newtexture classes (marble and two wired-frame classes), andthe resulting projection is shown in Figure 3(a). The same setof parameters is used. Observe that the marble class, whose
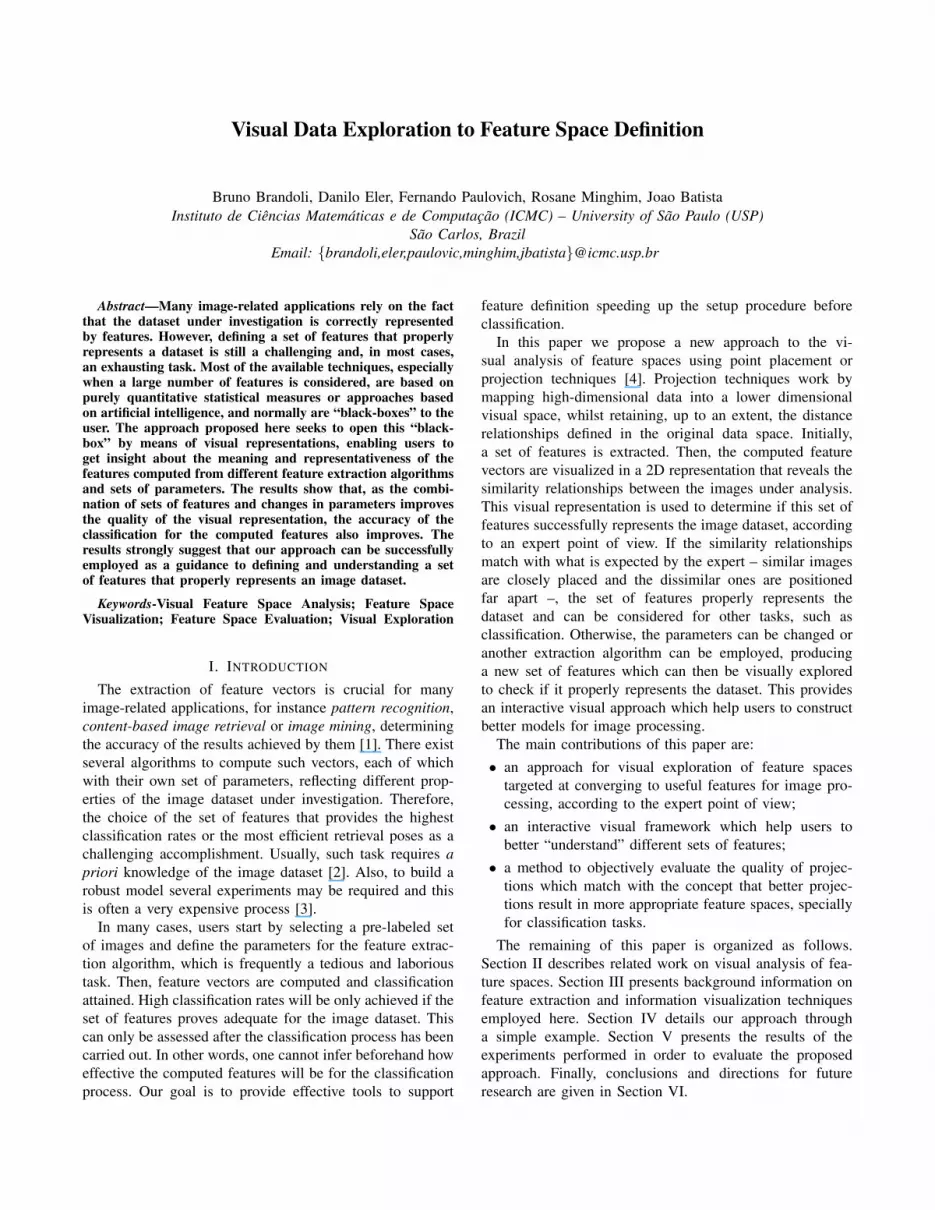
sample is highlighted in red, appears scattered throughoutthe projection. The marble images normally exhibit non-uniform texture elements, which vary both in size andorientation. This behavior is illustrated in Figure 3(b) thatshows the zoomed-in area of the marble class depicted inFigure 3(a). Since a fixed set of Gabor filters parameters(for orientation and scales) is used, it is unlikely that allsubtleties in marble textures with varied sizes and orientationcan possibly be captured.
(a) (b)
Figure 3. Projection of 10 classes image dataset (a) and a zoom in of themarble class (b). The employed features cannot distinguish the differentwire-frame patterns, and do not define a uniform marble class.
For the wired-frame classes, the projected samples aremixed up, as can be observed at the top left-hand cornerof Figure 3(a). To reach better separability, only Gaborfeatures with 900 orientation are now selected and a newprojection is computed, as shown in Figure 4. Notice thatthese two classes are now separated, for texture patternswith 900 orientation are different in each class. However,when compared to the previous projection, the remainingclasses are more spread. In this case, the user can concludethat the orientation 900 is effective in separating these 2new wired-frame classes of images, but the cohesion ofthe other classes is impaired. This conclusion is not easyto reach without feature space visualization. The silhouettecoefficients computed for Figure 4 and Figure 3(a) are0.429 and 0.474, respectively. Although similar, those valuesinidicate that the features explored in Figure 4 are betterthan those explored in Figure 3(a), matching with the visualinspection.
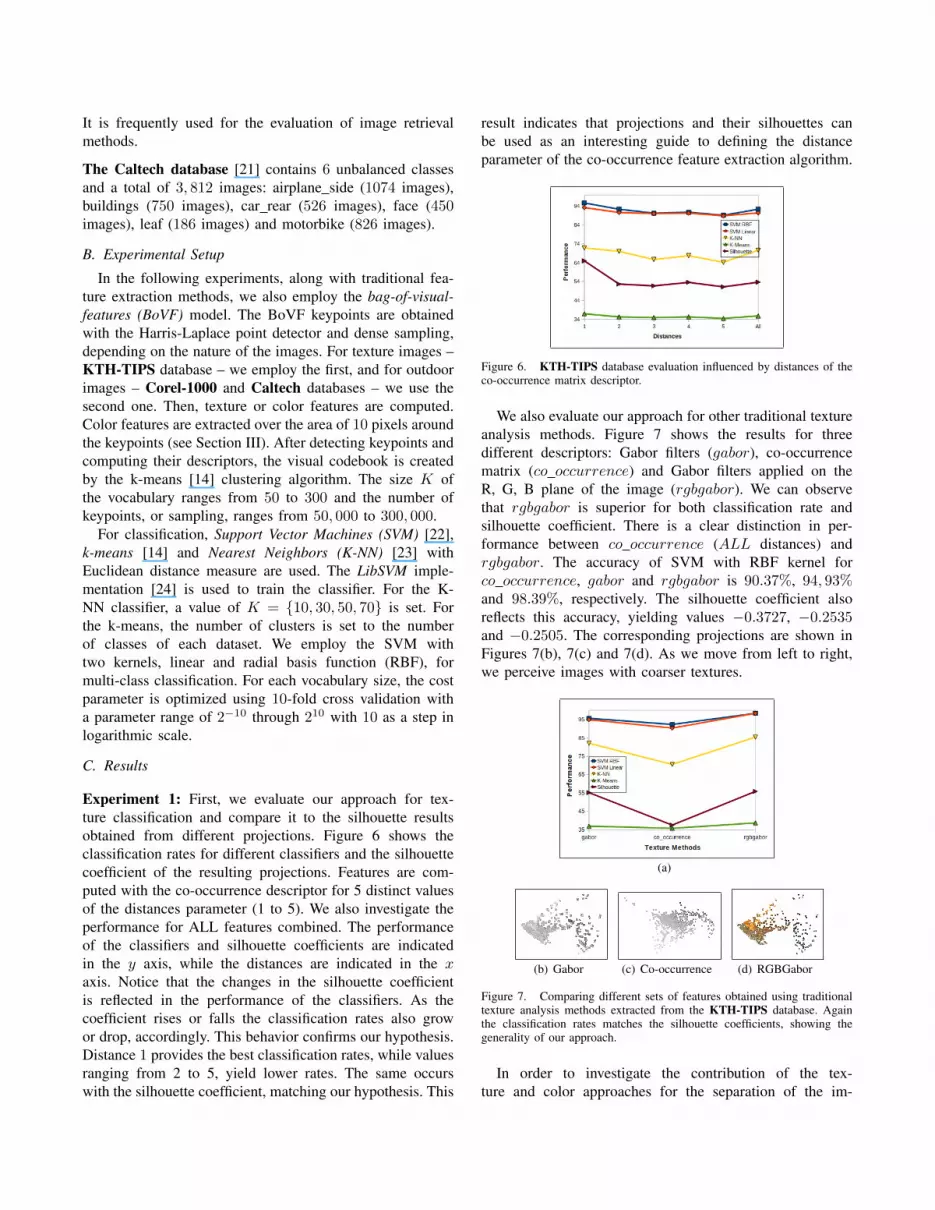
Whichever orientations have been chosen in the previousexperiment, it is possible to notice that Gabor features failedto separate samples of the two Brodatz’s Linen classes. Theirsamples are colored in brown and cyan (top-right cornerof Figure 2). They are also present in Figures 3(a) and 4.These two classes exhibit very similar texture patterns andcloser inspection reveals a slight variation in the pixel inten-sities only. Seeking better separability, we investigate newfeatures produced by the co-occurrence matrix technique,parameterized as described in Section III. The resultingprojection is shown in Figure 5. Notice that the brown
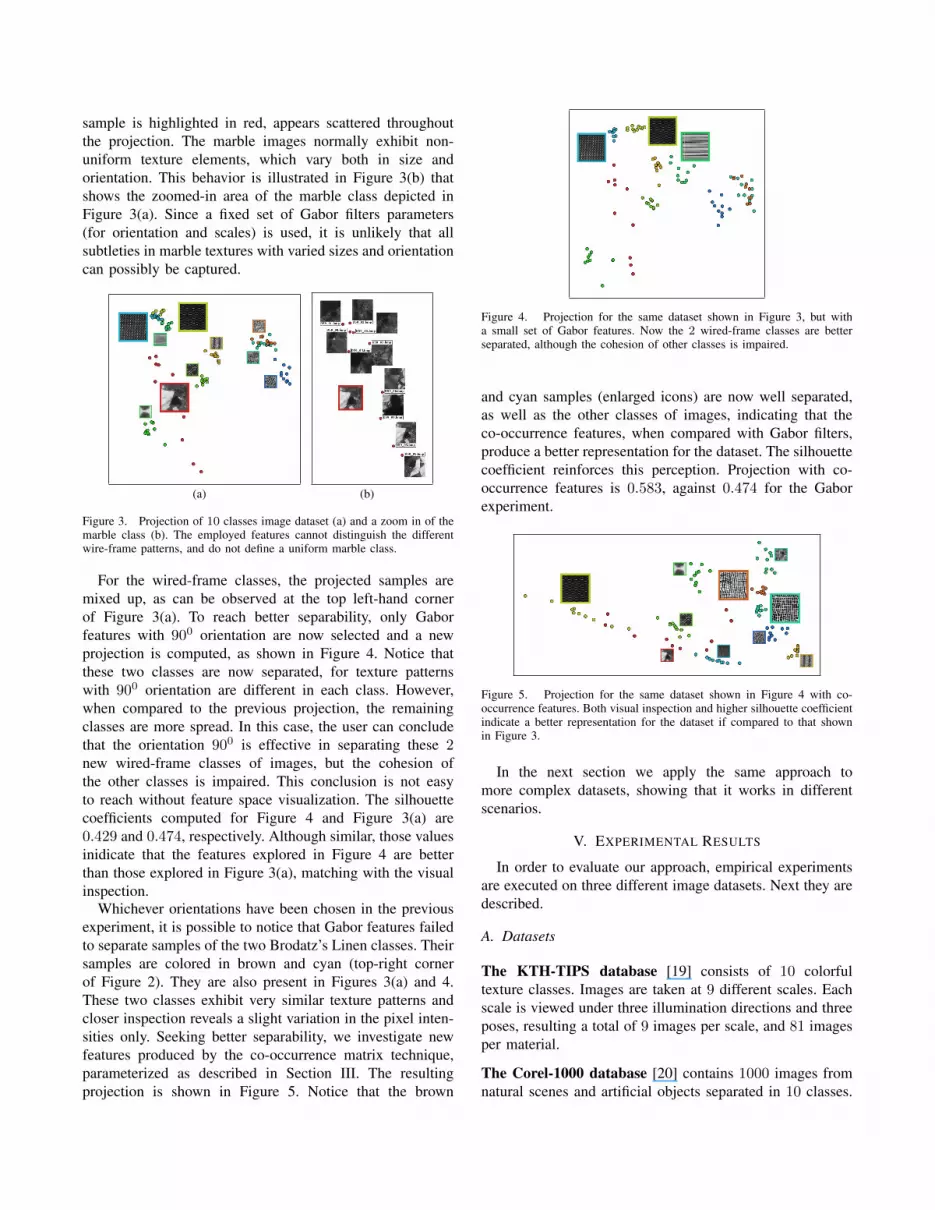
Figure 4. Projection for the same dataset shown in Figure 3, but witha small set of Gabor features. Now the 2 wired-frame classes are betterseparated, although the cohesion of other classes is impaired.
and cyan samples (enlarged icons) are now well separated,as well as the other classes of images, indicating that theco-occurrence features, when compared with Gabor filters,produce a better representation for the dataset. The silhouettecoefficient reinforces this perception. Projection with co-occurrence features is 0.583, against 0.474 for the Gaborexperiment.
Figure 5. Projection for the same dataset shown in Figure 4 with co-occurrence features. Both visual inspection and higher silhouette coefficientindicate a better representation for the dataset if compared to that shownin Figure 3.
In the next section we apply the same approach tomore complex datasets, showing that it works in differentscenarios.
V. EXPERIMENTAL RESULTS
In order to evaluate our approach, empirical experimentsare executed on three different image datasets. Next they aredescribed.
A. Datasets
The KTH-TIPS database [19] consists of 10 colorfultexture classes. Images are taken at 9 different scales. Eachscale is viewed under three illumination directions and threeposes, resulting a total of 9 images per scale, and 81 imagesper material.
The Corel-1000 database [20] contains 1000 images fromnatural scenes and artificial objects separated in 10 classes.
It is frequently used for the evaluation of image retrievalmethods.
The Caltech database [21] contains 6 unbalanced classesand a total of 3, 812 images: airplane side (1074 images),buildings (750 images), car rear (526 images), face (450images), leaf (186 images) and motorbike (826 images).
B. Experimental Setup
In the following experiments, along with traditional fea-ture extraction methods, we also employ the bag-of-visual-features (BoVF) model. The BoVF keypoints are obtainedwith the Harris-Laplace point detector and dense sampling,depending on the nature of the images. For texture images –KTH-TIPS database – we employ the first, and for outdoorimages – Corel-1000 and Caltech databases – we use thesecond one. Then, texture or color features are computed.Color features are extracted over the area of 10 pixels aroundthe keypoints (see Section III). After detecting keypoints andcomputing their descriptors, the visual codebook is createdby the k-means [14] clustering algorithm. The size K ofthe vocabulary ranges from 50 to 300 and the number ofkeypoints, or sampling, ranges from 50, 000 to 300, 000.
For classification, Support Vector Machines (SVM) [22],k-means [14] and Nearest Neighbors (K-NN) [23] withEuclidean distance measure are used. The LibSVM imple-mentation [24] is used to train the classifier. For the K-NN classifier, a value of K = {10, 30, 50, 70} is set. Forthe k-means, the number of clusters is set to the numberof classes of each dataset. We employ the SVM withtwo kernels, linear and radial basis function (RBF), formulti-class classification. For each vocabulary size, the costparameter is optimized using 10-fold cross validation witha parameter range of 2−10 through 210 with 10 as a step inlogarithmic scale.
C. Results
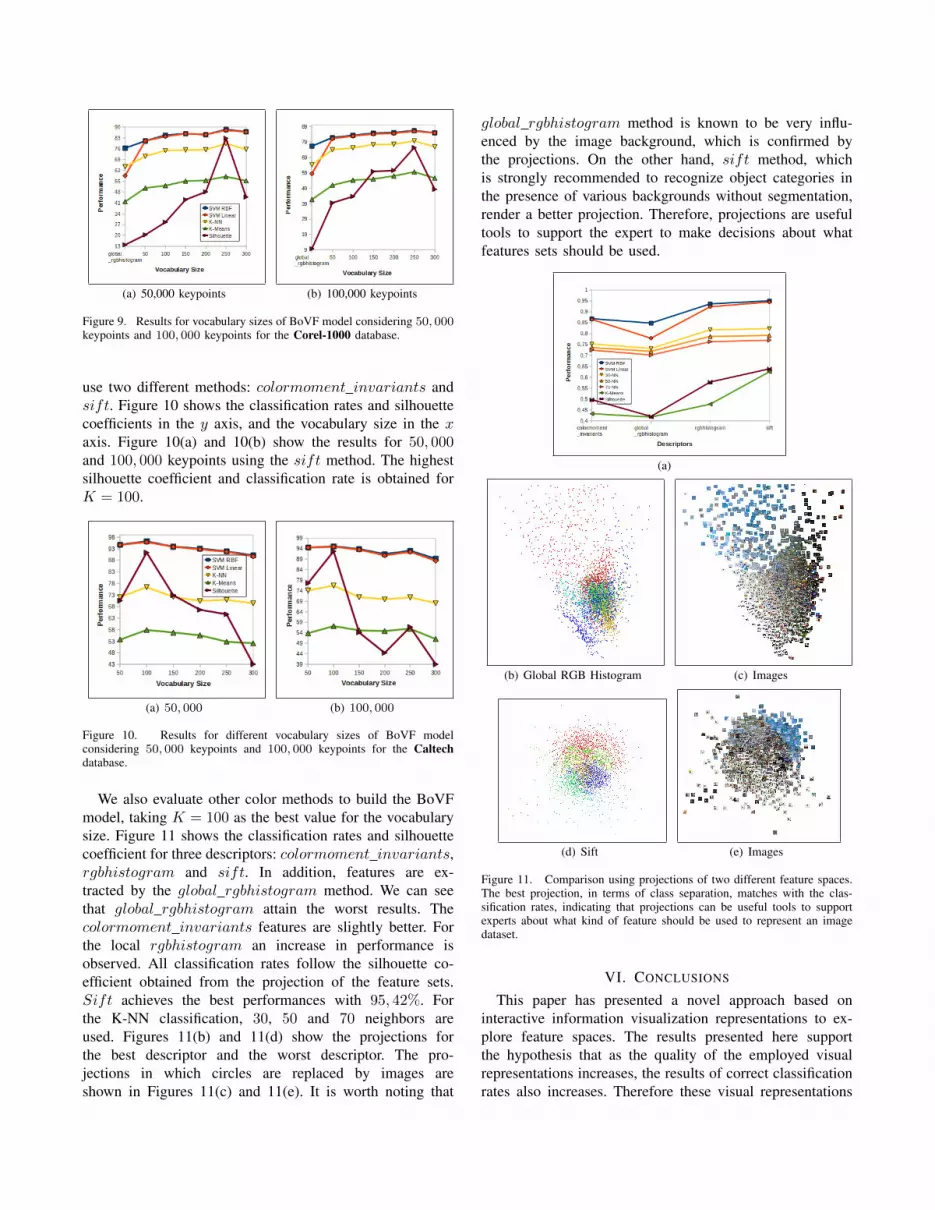
Experiment 1: First, we evaluate our approach for tex-ture classification and compare it to the silhouette resultsobtained from different projections. Figure 6 shows theclassification rates for different classifiers and the silhouettecoefficient of the resulting projections. Features are com-puted with the co-occurrence descriptor for 5 distinct valuesof the distances parameter (1 to 5). We also investigate theperformance for ALL features combined. The performanceof the classifiers and silhouette coefficients are indicatedin the y axis, while the distances are indicated in the xaxis. Notice that the changes in the silhouette coefficientis reflected in the performance of the classifiers. As thecoefficient rises or falls the classification rates also growor drop, accordingly. This behavior confirms our hypothesis.Distance 1 provides the best classification rates, while valuesranging from 2 to 5, yield lower rates. The same occurswith the silhouette coefficient, matching our hypothesis. This
result indicates that projections and their silhouettes canbe used as an interesting guide to defining the distanceparameter of the co-occurrence feature extraction algorithm.
Figure 6. KTH-TIPS database evaluation influenced by distances of theco-occurrence matrix descriptor.
We also evaluate our approach for other traditional textureanalysis methods. Figure 7 shows the results for threedifferent descriptors: Gabor filters (gabor), co-occurrencematrix (co occurrence) and Gabor filters applied on theR, G, B plane of the image (rgbgabor). We can observethat rgbgabor is superior for both classification rate andsilhouette coefficient. There is a clear distinction in per-formance between co occurrence (ALL distances) andrgbgabor. The accuracy of SVM with RBF kernel forco occurrence, gabor and rgbgabor is 90.37%, 94, 93%and 98.39%, respectively. The silhouette coefficient alsoreflects this accuracy, yielding values −0.3727, −0.2535and −0.2505. The corresponding projections are shown inFigures 7(b), 7(c) and 7(d). As we move from left to right,we perceive images with coarser textures.
(a)
(b) Gabor (c) Co-occurrence (d) RGBGabor
Figure 7. Comparing different sets of features obtained using traditionaltexture analysis methods extracted from the KTH-TIPS database. Againthe classification rates matches the silhouette coefficients, showing thegenerality of our approach.
In order to investigate the contribution of the tex-ture and color approaches for the separation of the im-

ages on the KTH-TIPS database, we apply the BoVFmodel with dense sampling and three color descrip-tors: colormoment invariants [25], rgbhistogram andsift [26]. In Figure 8(a), the classification rates and sil-houette coefficients are presented in the y axis, while thedescriptors are presented in the x axis. It can be ob-served that colormoment invariants do not perform well.Rgbhistogram exhibits a slight improvement, followed bythe sift method. Their projections are illustrated in Fig-ures 8(b), 8(d) and 8(e), respectively. Figure 8(c) shows thesame projection of Figure 8(b), with circles replaced by theimages they represent. To overcome the visual overlappingthe center of the projection is zoomed in and shown at thetop right-hand corner with smaller points in Figure 8(e).
Normally, for more complex image datasets it is desirableto combine different feature extraction approaches to captureas much as possible the underlying information present onthe images. However, the resulting feature spaces can beof very high dimensionality, which in most cases impairthe precision of classification tasks. We then combine thethree previous descriptors and introduce an intermediatedimensionality reduction step in our approach with Prin-cipal Component Analysis (PCA) [27] method, reducingthe space to 10 dimensions. The nearest-neighbor classifi-cation rates are 85, 92% and 99.12% for the original andthe reduced space, matching with the silhouette cofficient,−0, 2547 and 0.1290, respectively. Figures 8(f) and 8(g)present the projection for the combined descriptors and theintermediate step using PCA. Finally, it is worth notingthat nearest neighbor classification has a higher accuracycompared to the SVM classifier. This may be associatedto the good separability seen in the projections of theFigures 8(d), 8(e) and 8(g).
Experiment 2: In this experiment, we present a compara-tive study of our approach for evaluating local and globalfeatures. The RGB histogram descriptor is employed forboth approaches. Local features are computed using theBoVF model. Figure 9 shows the classification rates inthe y axis, while global and local features are indicatedin the x axis. We optimize two parameters of the BoVFmodel: the vocabulary size and the number of keypoints.Figure 9(a) and 9(b) show the results for vocabulary sizeswith 50, 000 and 100, 000 keypoints, respectively.
It can be observed that the local approach performs sig-nificantly better than the global one. The highest silhouettecoefficient (K = 250) is 0.0055 for 50, 000 keypoints and−0.0022 for 100, 000 keypoints. The global rgbhistogramsilhouette coefficient significantly reduce to −0.1029. Thesame behavior is observed for the classification rates, whichare 79.3% for 50, 000 keypoints and 79.78% for 100, 000,reducing to 64.30% for global rgbhistogram. With the bestK at hand, we perform two others experiments: 200, 000and 300, 000 keypoints. The result shows that our approach
(a)
(b) Color Moment Invariants (c) Images
(d) RGB Histogram (e) Sift
(f) Combined (ALL) (g) Dimensionality Reduction
Figure 8. Projections of different feature spaces extracted from KTH-TIPSdatabase. Applying the PCA to reduce the dimensionality results in betterclassification rates and silhouette values, matching with class separabilityobserved on the produced projection (colors indicates the classes).
is consistent, being a useful method to reduce the time spentto determine the better vocabulary size on BoVF model.
Experiment 3: In this experiment we again evaluate theoutcome vocabulary size of the BoVF model regardingthe classifications rates and silhouette coefficient. How-ever, in addition to the RGB histogram descriptor, we
(a) 50,000 keypoints (b) 100,000 keypoints
Figure 9. Results for vocabulary sizes of BoVF model considering 50, 000keypoints and 100, 000 keypoints for the Corel-1000 database.
use two different methods: colormoment invariants andsift. Figure 10 shows the classification rates and silhouettecoefficients in the y axis, and the vocabulary size in the xaxis. Figure 10(a) and 10(b) show the results for 50, 000and 100, 000 keypoints using the sift method. The highestsilhouette coefficient and classification rate is obtained forK = 100.
(a) 50, 000 (b) 100, 000
Figure 10. Results for different vocabulary sizes of BoVF modelconsidering 50, 000 keypoints and 100, 000 keypoints for the Caltechdatabase.
We also evaluate other color methods to build the BoVFmodel, taking K = 100 as the best value for the vocabularysize. Figure 11 shows the classification rates and silhouettecoefficient for three descriptors: colormoment invariants,rgbhistogram and sift. In addition, features are ex-tracted by the global rgbhistogram method. We can seethat global rgbhistogram attain the worst results. Thecolormoment invariants features are slightly better. Forthe local rgbhistogram an increase in performance isobserved. All classification rates follow the silhouette co-efficient obtained from the projection of the feature sets.Sift achieves the best performances with 95, 42%. Forthe K-NN classification, 30, 50 and 70 neighbors areused. Figures 11(b) and 11(d) show the projections forthe best descriptor and the worst descriptor. The pro-jections in which circles are replaced by images areshown in Figures 11(c) and 11(e). It is worth noting that
global rgbhistogram method is known to be very influ-enced by the image background, which is confirmed bythe projections. On the other hand, sift method, whichis strongly recommended to recognize object categories inthe presence of various backgrounds without segmentation,render a better projection. Therefore, projections are usefultools to support the expert to make decisions about whatfeatures sets should be used.
(a)
(b) Global RGB Histogram (c) Images
(d) Sift (e) Images
Figure 11. Comparison using projections of two different feature spaces.The best projection, in terms of class separation, matches with the clas-sification rates, indicating that projections can be useful tools to supportexperts about what kind of feature should be used to represent an imagedataset.
VI. CONCLUSIONS
This paper has presented a novel approach based oninteractive information visualization representations to ex-plore feature spaces. The results presented here supportthe hypothesis that as the quality of the employed visualrepresentations increases, the results of correct classificationrates also increases. Therefore these visual representations
can be successfully used as a guide to understanding thefeatures behavior in terms of grouping the similar imagesand separating the dissimilar ones. We also define an index,the silhouette coefficient, to help users assess the visualquality of the projections, overcoming problems related tothe subjectiveness involved in the visual analysis.
Our work does not intend to be an approach for fea-ture selection towards finding the best set of features forclassification. Instead, we are more focused on supportingexperts on the task of understanding the outcome of differentfeature extraction algorithm, and the effect of changing theirparameters. Therefore this can be considered as a pre-stepto the feature selection process, where an expert can prunethe possibilities of choosing the algorithms and parametersfor the feature extraction, speeding-up the whole processof finding the most appropriate space to represent a set ofimages.
VII. ACKNOWLEDGEMENTS
The authors acknowledge the financial support of FAPESPand CNPq.
REFERENCES
[1] S. Theodoridis and K. Koutroumbas, Pattern Recognition.Academic Press, February 2006.
[2] C. C. Aggarwal, “Towards effective and interpretable datamining by visual interaction,” ACM SIGKDD ExplorationsNewsletter, vol. 3, no. 2, pp. 11–22, 2002.
[3] E. Pampalk, W. Goebl, and G. Widmer, “Visualizing changesin the structure of data for exploratory feature selection,” inKDD ’03: Proceedings of the ninth ACM SIGKDD interna-tional conference on Knowledge discovery and data mining.New York, NY, USA: ACM, 2003, pp. 157–166.
[4] F. Paulovich and R. Minghim, “HiPP: A novel hierarchicalpoint placement strategy and its application to the explorationof document collections,” IEEE Transactions on Visualizationand Computer Graphics (Proceedings of Information Visu-alization 2008), vol. 14, no. 6, pp. 1229–1236, November-December 2008.
[5] C. C. Aggarwal, “A human-computer cooperative system foreffective high dimensional clustering,” in KDD ’01: Proceed-ings of the seventh ACM SIGKDD international conferenceon Knowledge discovery and data mining. New York, NY,USA: ACM, 2001, pp. 221–226.
[6] T. Schreck, J. Schneidewind, and D. Keim, “An image-basedapproach to visual feature space analysis,” in WSCG 2008,16th International Conference in Central Europe on Com-puter Graphics, Visualization and Computer Vision, Plzen,Bory, Czech Republic, February 2008, pp. 223–230.
[7] J. F. Rodrigues Jr., C. A. B. Castanon, A. J. M. Traina, andC. Traina Jr., “Using efficient visual exploration techniquesto evaluate features for content-based image retrieval,” inXVI Brazilian Symposium on Computer Graphics and ImageProcessing. Los Alamitos, CA, USA: IEEE ComputerSociety, 2003, pp. 183–190.
[8] J. F. Rodrigues Jr., A. J. M. Traina, and C. Traina Jr.,“Enhanced visual evaluation of feature extractors for imagemining,” in The 3rd ACS/IEEE International Conference onComputer Systems and Applications, vol. 1. Washington,DC, USA: IEEE Computer Society, 2005, pp. 45–I.
[9] D. Eler, M. Nakazaki, F. Paulovich, D. Santos, G. Andery,M. Oliveira, J. Batista, and R. Minghim, “Visual analysis ofimage collections,” The Visual Computer, vol. 25, no. 10, pp.923–937, 2009.
[10] R. Datta, D. Joshi, J. Li, and J. Z. Wang, “Image retrieval:Ideas, influences, and trends of the new age,” ACM ComputingSurveys, vol. 40, no. 2, pp. 1–60, April 2008.
[11] R. M. Haralick, K. Shanmugam, and I. Dinstein, “Texturalfeatures for image classification,” IEEE Transactions on Sys-tems, Man and Cybernetics, vol. 3, no. 6, pp. 610–621, 1973.
[12] F. Bianconi and A. Fernandez, “Evaluation of the effectsof gabor filter parameters on texture classification,” PatternRecognition, vol. 40, no. 12, pp. 3325–3335, 2007.
[13] K. Mikolajczyk, T. Tuytelaars, C. Schmid, A. Zisserman,J. Matas, F. Schaffalitzky, T. Kadir, and L. V. Gool, “Acomparison of affine region detectors,” International Journalof Computer Vision, vol. 65, no. 1-2, pp. 43–72, November2005.
[14] J. B. MacQueen, “Some methods for classification and analy-sis of multivariate observations,” in Proc. of the fifth BerkeleySymposium on Mathematical Statistics and Probability, vol. 1.University of California Press, 1967, pp. 281–297.
[15] F. Paulovich, L. Nonato, R. Minghim, and H. Levkowitz,“Least square projection: a fast high precision multidimen-sional projection technique and its application to documentmapping,” IEEE Transactions on Visualization and ComputerGraphics, vol. 14, no. 3, pp. 564–575, May/Jun 2008.
[16] T. F. Cox and M. A. A. Cox, Multidimensional Scaling,2nd ed. Chapman & Hall/CRC, 2000.
[17] P.-N. Tan, M. Steinbach, and V. Kumar, Introduction to DataMining. Boston, MA, USA: Addison-Wesley LongmanPublishing Co., Inc., 2005.
[18] P. Brodatz, Textures: A Photographic Album for Artists andDesigners. New York: Dover Publications, 1966.
[19] E. Hayman, B. Caputo, M. Fritz, and J.-O. Eklundh, “On thesignificance of real-world conditions for material classifica-tion,” in ECCV04 - 8th European Conference on ComputerVision, vol. 4, 2004, pp. 253–266.
[20] J. Li and J. Z. Wang, “Automatic linguistic indexing of pic-tures by a statistical modeling approach,” IEEE Transactionson Pattern Analysis and Machine Intelligence, vol. 25, no. 9,pp. 1075–1088, 2003.
[21] R. Fergus, P. Perona, and A. Zisserman, “Object class recog-nition by unsupervised scale-invariant learning,” in IEEEComputer Society Conference on Computer Vision and Pat-tern Recognition, vol. 2. Los Alamitos, CA, USA: IEEEComputer Society, June 2003, pp. 264–271.
[22] V. N. Vapnik, The nature of statistical learning theory. NewYork, NY, USA: Springer-Verlag, 1995.
[23] T. Cover and P. Hart, “Nearest neighbor pattern classifica-tion,” IEEE Transactions on Information Theory, vol. 13, pp.21–27, 1967.
[24] C.-C. Chang and C.-J. Lin, LIBSVM: a library for supportvector machines, 2001.
[25] F. Mindru, T. Tuytelaars, L. Van Gool, and T. Moons, “Mo-ment invariants for recognition under changing viewpoint andillumination,” Computer Vision and Image Understanding,vol. 94, no. 1-3, pp. 3–27, 2004.
[26] D. G. Lowe, “Distinctive image features from scale-invariantkeypoints,” International Journal of Computer Vision, vol. 60,no. 2, pp. 91–110, 2004.
[27] I. T. Jolliffe, Principal Component Analysis (second edition).New York, NY, USA: Springer-Verlag, October 2002.