universal standardization of forearm bone densitometry
TRANSCRIPT
Universal Standardization of Forearm Bone Densitometry
JOHN A. SHEPHERD,1 XIAO GUANG CHENG,1 YING LU,1 CHRIS NJEH,1 JORG TOSCHKE,1
KLAUS ENGELKE,2 MICHAEL GRIGORIAN,1 and HARRY K. GENANT1
ABSTRACT
As part of an effort to quantify device-dependent differences in forearm bone density, 101 women, aged 20–80years (�16 women in each age decade), were scanned on six forearm bone densitometers: the AlokaDCS-600EX, the Hologic QDR-4500A, the Lunar PIXI, the Norland pDEXA, the Osteometer DTX-200, andthe Pronosco X-posure System. Regression statistics are reported for all similar regions of interest (ROIs).However, comparisons were confounded because of large differences in the ROI size and placement. Thenumber of ROIs reported for a single scan by each device varied from 1 to 12. The correlation coefficientsranged from 0.7 < r < 0.97, with the highest correlation coefficients and lowest SEs for comparisons betweenthe most similar ROIs. Standardized units of bone mineral density are derived for distal (sdBMD), mid-(smBMD), and proximal (spBMD) ROIs that allow for comparable mean bone densities to be derived forpatient populations. Five phantoms were scanned and characterized on five of the devices and the precisionand mean values were reported. These phantom values will aid in the in vitro cross-calibration betweenmanufacturers to recreate the presented in vivo relationships. Care should be exercised when using theseequations for cross-calibrating patient databases or pooling clinical data from different devices because theleast significant differences detectable from measurements taken on two different machines can be increasedsubstantially. (J Bone Miner Res 2002;17:734–745)
Key words: dual-energy X-ray absorptiometry, digital X-ray radiogrammetry, cross-calibration, osteopo-rosis, peripheral
INTRODUCTION
Bone density is the single-most predictive measure of frac-ture risk. Bone density at virtually any available measure-ment site (spine, proximal femur, forearm, whole body,calcaneus, and tibia) can be used to predict risks of allfractures. Of those bone density measurement sites, in clin-ical practice, the forearm has been used the longest, apply-ing quantitative methods such as dual-energy X-ray absorp-tiometry (DXA), single-energy X-ray absorptiometry (SXA),
or the radioisotope equivalents dual photon absorptiometry(DPA) and single photon absorptiometry (SPA). Duppe etal. showed that a single SPA measurement predicted hipfractures 25 years later with a relative risk of 1.66/SDdecrease in bone mineral density (BMD).(1)
The purpose of this study is to quantify the interrelation-ships of currently marketed devices that measure forearmbone density. The International Committee of Standards inBone Measurement (ICSBM) commissioned the study. Thiscommittee was formed to address issues of accuracy, stan-dardization, and comparability of densitometers from dif-ferent manufacturers. All manufacturers were invited toparticipate with the committee, as were representatives from
Dr. Genant and Dr. Shepherd serve as consultants. All otherauthors have no conflict of interest.
1Osteoporosis and Arthritis Research Group, Department of Radiology, University of California San Francisco, San Francisco,California, USA.
2Institute of Medical Physics, University of Erlangen/Nurnberg, Erlangen, Germany.
JOURNAL OF BONE AND MINERAL RESEARCHVolume 17, Number 4, 2002© 2002 American Society for Bone and Mineral Research
734
academic institutions. The ICSBM has commissioned twoprevious studies, one for the standardization of the antero-posterior (AP) spine BMD as measured by DXA(2) and thesecond for the standardization of the proximal femurBMD.(3) The standardization equations were reported asletters to the editor of selected journals(4–7) and standardizeBMD units are now available on the applicable machines.The committee also has recommended standardized projec-tional density units of milligrams per squared centimeter(sometimes referred to as areal density) to distinguish itfrom the manufacture-specific BMD units typically reportedin grams per squared centimeter.
In the previous spine standardization study, regions of inter-est (ROIs) were found to be very similar. The agreementbetween the three participating manufacturers (Hologic, Inc.Bedford, MA, USA; and Lunar, Madison, WI, USA; andNorland Medical Systems, White Plains, NY, USA) was betterthan r � 0.99 with only slight differences attributable to boneedge detection. The T scores compared well also. In the prox-imal femur, the intermanufacturer definitions of the neck andtotal femur ROIs are larger than in the spine. The BMDagreement between manufacturers ranged from 0.97 � r �0.98 for the total femur and 0.94 � r � 0.96 for the femurneck.(3) In addition, the femur reference data used by the threemanufacturers differed considerably.(8) It was the suggestion ofthe ICSBM to define one reference data set, the Third NationalHealth and Nutrition Examination Survey (NHANES III) totalhip BMD,(9) to be provided in standardized BMD by allmanufacturers to remove the diagnostic differences.(6) To date,reference data have not been standardized for any sites otherthan the femur.
Different forearm densitometers from a single manufacturertend to agree well by design with a unity regression slope, nosignificant mean value offsets, and a small amount of scatteraround the fit line. Intergenerational comparisons have beenpublished for Hologic(10,11) forearm devices. Faulkner et al.(12)
found that although there was high correlation (r � 0.99)between the Hologic QDR-1000 and Lunar DPX-L at theultradistal and 1⁄3 distal sites, the regression slope was up to12% different from unity with offsets of 0.07–0.08 g/cm2.There are no universal standards for the measurement of fore-arm bone density. Consequently, each of the commerciallyavailable densitometers has different ROIs (size, location, andnumber), different calibration standards, and unique racial andethnic reference populations. Yet, practitioners commonly ap-ply the standardized World Health Organization (WHO) orNational Osteoporosis Foundation (NOF) diagnostic criteriaequally to all devices. Thus, there is a strong possibility oftreatment disparities and disagreement in clinical studies. Wereport on the absolute BMD differences, regression relation-ships, and define standardized equations to compare BMDresults of similar ROIs between most of the commerciallyavailable forearm densitometers.
MATERIALS AND METHODS
Subjects
The study goal was to recruit 100 women, aged 20–80years with �16 women in each age decade. One hundred
and one subjects were actually recruited with 13–19 sub-jects in each 10-year period. This population was chosen toprovide a broad range of clinically observed BMD values.The self-declared racial breakdown was 74% white/Hispanic, 18% Asian, 4% black, 4% Pacific Islander/Indian.The following exclusion criteria were used: women knownto be pregnant; women with a history of fracture at the distalradius of either arm; the known presence of generalizedbone diseases of bone other than osteoporosis includinghyperparathyroidism, hypoparathyroidism, Paget’s disease,renal osteodystrophy, Cushing’s disease, and steroid-induced osteoporosis or other metabolic diseases; a historyof malignant diseases localized to bone or treatment by localresection; the presence of rheumatoid arthritis or other ar-thritic processes that severely limit patient mobility; and thepresence of senile dementia severe enough to hinder ade-quate compliance and understanding of the study. The Uni-versity of California San Francisco’s (UCSF’s) local insti-tutional review board approved the study protocol.
Devices
Each manufacturer was asked to identify the device theywould like to include in the study and how each device wasto be used. Some of the manufacturers produce severaldevices that measure forearm densitometry. However, itwas out of the scope of this study to include all of amanufacturer’s offerings or previous scanner generations.Table 1 is a list of the devices used in this study along withthe associated manufacturer. The Hologic QDR-4500A andthe Osteometer DTX-200 (Osteometer MediTech, Haw-thorne, CA, USA) were already on site. The other deviceswere obtained on loan for the course of the study from themanufacturers. Each device acquired an image of both theradius and ulna. All devices except the Pronosco (Vedbaek,Denmark) collected a DXA image from the carpals to aspecified proximal distance on the forearm. The PronoscoX-posure acquires a single-energy radiograph of the handand proximal forearm. When a forearm length was neededfor the calculation of ROI placement, consistent lengthswere used for all devices. ROIs as configured by eachmanufacturer for their specific device were used. TheseROIs are shown graphically in Fig. 1. No attempt was madein this study to alter the default ROIs because this wouldamount to nonstandard analysis and the reference datawould not apply.
The Aloka DCS-600EX (Aloka Co., Ltd., Tokyo, Japan)algorithm automatically placed three 10-mm-long regionson the radius and ulna centered at 1⁄10, 1⁄6, and 1⁄3 of theforearm length measured from the styloid process on theulna.(13) Both the radius and ulna were included in each ofthe BMD calculations.
In the Hologic QDR-4500A, first the user had to place aglobal ROI in which three individual regions were defined:1⁄3 distal, middistal, and ultradistal ROIs.(14) The 1⁄3 distalROI was defined as 20 mm long centered at a distance equalto 1⁄3 of the forearm length measured from the distal tip ofthe ulna. The ultradistal ROI is a region nominally 15 mmin length positioned proximal to the end plate of the radius.The middistal is the region between the 1⁄3 and the ultradis-
735STANDARDIZATION OF FOREARM BMD
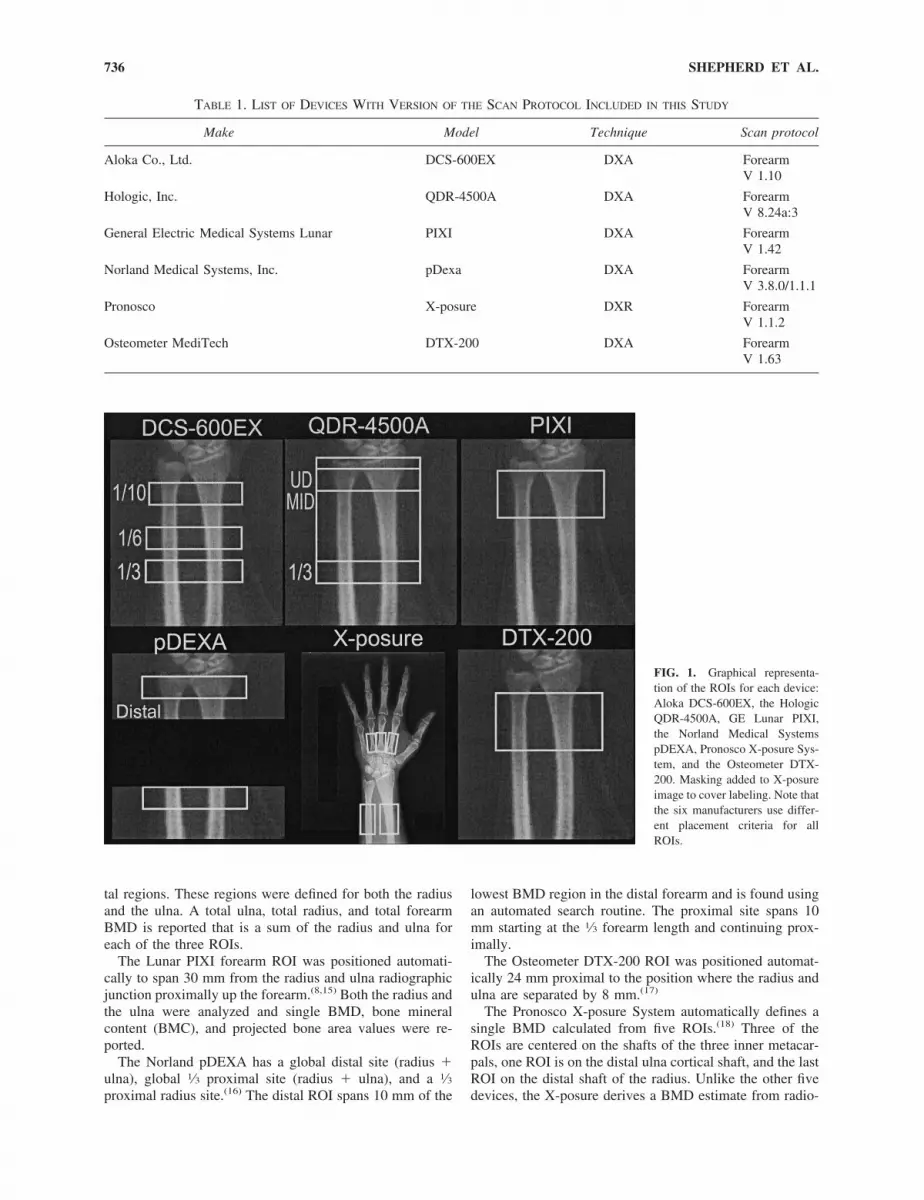
tal regions. These regions were defined for both the radiusand the ulna. A total ulna, total radius, and total forearmBMD is reported that is a sum of the radius and ulna foreach of the three ROIs.
The Lunar PIXI forearm ROI was positioned automati-cally to span 30 mm from the radius and ulna radiographicjunction proximally up the forearm.(8,15) Both the radius andthe ulna were analyzed and single BMD, bone mineralcontent (BMC), and projected bone area values were re-ported.
The Norland pDEXA has a global distal site (radius �ulna), global 1⁄3 proximal site (radius � ulna), and a 1⁄3proximal radius site.(16) The distal ROI spans 10 mm of the
lowest BMD region in the distal forearm and is found usingan automated search routine. The proximal site spans 10mm starting at the 1⁄3 forearm length and continuing prox-imally.
The Osteometer DTX-200 ROI was positioned automat-ically 24 mm proximal to the position where the radius andulna are separated by 8 mm.(17)
The Pronosco X-posure System automatically defines asingle BMD calculated from five ROIs.(18) Three of theROIs are centered on the shafts of the three inner metacar-pals, one ROI is on the distal ulna cortical shaft, and the lastROI on the distal shaft of the radius. Unlike the other fivedevices, the X-posure derives a BMD estimate from radio-
FIG. 1. Graphical representa-tion of the ROIs for each device:Aloka DCS-600EX, the HologicQDR-4500A, GE Lunar PIXI,the Norland Medical SystemspDEXA, Pronosco X-posure Sys-tem, and the Osteometer DTX-200. Masking added to X-posureimage to cover labeling. Note thatthe six manufacturers use differ-ent placement criteria for allROIs.
TABLE 1. LIST OF DEVICES WITH VERSION OF THE SCAN PROTOCOL INCLUDED IN THIS STUDY
Make Model Technique Scan protocol
Aloka Co., Ltd. DCS-600EX DXA ForearmV 1.10
Hologic, Inc. QDR-4500A DXA ForearmV 8.24a:3
General Electric Medical Systems Lunar PIXI DXA ForearmV 1.42
Norland Medical Systems, Inc. pDexa DXA ForearmV 3.8.0/1.1.1
Pronosco X-posure DXR ForearmV 1.1.2
Osteometer MediTech DTX-200 DXA ForearmV 1.63
736 SHEPHERD ET AL.
grammetry applied to the cortical part of the bone (i.e., noreference bone material is used.) The BMD estimate iscalled digital X-ray radiogrammetry–BMD (DXR).
Unique BMD variable names were defined for the ROIsdescribed previously and listed in Table 2. Each scannerwas maintained per manufacturer’s instructions. Data werecollected over a 4-month period beginning in February1999. There were no signs of calibration drifts of �0.5% forany of the devices during the study period.
Interdevice BMD comparison statistics
Because there are a total of 21 reported BMD values,reporting the correlation relationships between all ROIs wasnot practical for this publication. We chose to present theBMD correlations in three groupings most commonly usedfor diagnostic and clinical trial purposes: distal (i.e., theultradistal), mid- (i.e., middistal), and proximal (i.e., 1⁄3
distal) ROIs. The Lunar PIXI, Osteometer DTX-200, andPronosco X-posure each report one BMD value exclusivelyand will be compared in all three groups. The NorlandpDEXA scans and reports a BMD for distal and proximalROIs. Thus, the distal ROI for the Norland pDEXA isincluded in the distal as well as the mid-ROI analysis.Simple linear regression using SAS’s General Linear Modelprocedure, procGLM, (SAS Institute, Cary, NC, USA) wasused to determine a correlation coefficient, slope, intercept,and an SE of the estimate (SEE) for reported combinations.The significance of the intercept was determined using ap value.
Universal standardization equations
Universal standardization equations were calculated us-ing the “optimal conversion” method by Hui et al.(19) Thismethod minimizes a common entropy equation [Eq. (2) in
TABLE 2. VARIABLE NAMES FOR THE SCAN PROTOCOL DEFINED IN THE TEXT
Device Ultradistal ROI Mid-ROI Proximal ROI Total No. of regions
Aloka DCS-600EX ARU10BMD ARU6BMD ARU3BMD 3GE/Lunar PIXI PBMD 1Hologic QDR-4500A HUUBMD HUMBMD HU13BMD HUTOTBMD 12
HRUBMD HRMBMD HR13BMD HRTOTBMDHRUUBMD HRUMBMD HRU13BMD HRUTOTBMD
Norland pDEXA NDBMD NPBMD 3NPRBMD
Osteometer DTX-200 OBMD 1Pronosco X-posure DXR-BMD 1
The Aloka DCS-600EX reports the results for the combined radius and ulna (ARU. . .). Hologic reports a radius (HR. . .), ulna (HU. . .),and radius � ulna (HRU . . .) BMD for each of three ROIs and a global ROI. The Norland distal (NDBMD) is the result for both the radiusand the ulna while the proximal ROI reports both a radius and ulna (NPBMD) or a radius only (NPRBMD). Lunar and Osteometerreported a single BMD value that included both the radius and ulna. Pronosco reported a single BMD estimate from three metacarpalsas well as the radius and ulna.
TABLE 3. FOREARM PHANTOMS IDENTIFIED FOR USE AS EITHER QUALITY CONTROL OR CROSS-CALIBRATION STUDIES
Make Model Description
CIRS CIRS 400 mg 400 mg/cm3 volumetric density, forearm mold of entire radius, ulna, andwater-equivalent soft tissue (no carpals)
CIRS CIRS 600 mg Same as CIRS 400 mg but with 600 mg/cm3
CIRS CIRS 800 mg Same as CIRS 400 mg but with 800 mg/cm3
Kalender/Ruegsegger European forearmPhantom I (EFPI)
Segmented cylindrical phantom, orthoradial representation of approximatelylast 1⁄6 forearm length
Kalender/Engelke European forearmPhantom II (EFPII)
Same as EFPI but with conical shape to distal radius and longer forearmlength (�1⁄2 distal forearm length.)
Lunar PIXI QC Forearm Metal stamp of distal forearm projection potted in acrylic, carpals to �1⁄6distal forearm length
Norland Forearm QC HA anthropomorphic projection potted in acrylic, from carpals to 1⁄2 distalforearm
Osteometer DTX-200 HA anthropomorphic projection potted in acrylic, from carpals to 1⁄2 distalforearm
Note that none of the phantoms were scannable on all devices.HA, hydroxiapatite.
737STANDARDIZATION OF FOREARM BMD
Hui et al.] to simultaneously solve for the best-fit solution ofall devices at once. The result is a set of equations thatconverts each device’s BMD into a BMD in standardizedunits. In addition, the optimal conversion method differsfrom simple linear regressions in that it creates standardizedrelationships that are invertible and it assumes that errorsexist in all variables. For this reason, the standardized
equations are more appropriate for cross-calibrating devicesthan the linear regressions. The optimal conversion stan-dardization equations were solved using the SAS procNONLIN. Because it was not possible to scan a singlephantom on all devices, a common average BMD waspicked by averaging the population means for each device.Standardization equations were calculated for the distal,mid-, and the proximal ROIs with the equations referred toas the sdBMD, smBMD, and the spBMD equations, respec-tively. As in the linear regression, devices with only oneROI were included in all three standardization equations.After applying the standardized BMD equations to the studysubject data, we compared each device using the Bland-Altman analysis to look for systematic residual differenc-es.(20)
Relative BMD value
To look at the equivalence of the standardized BMD as afunction of age, we plotted standardized BMD values versusage for each ROI grouping. The SD for each variable wascalculated independently for each decade. A p value wasused to test for significant differences between similar ROIsfor different age decades. In addition, the manufacturer-specific peak reference BMDs and population SDs wereconverted to standardized BMD units. T-score values of
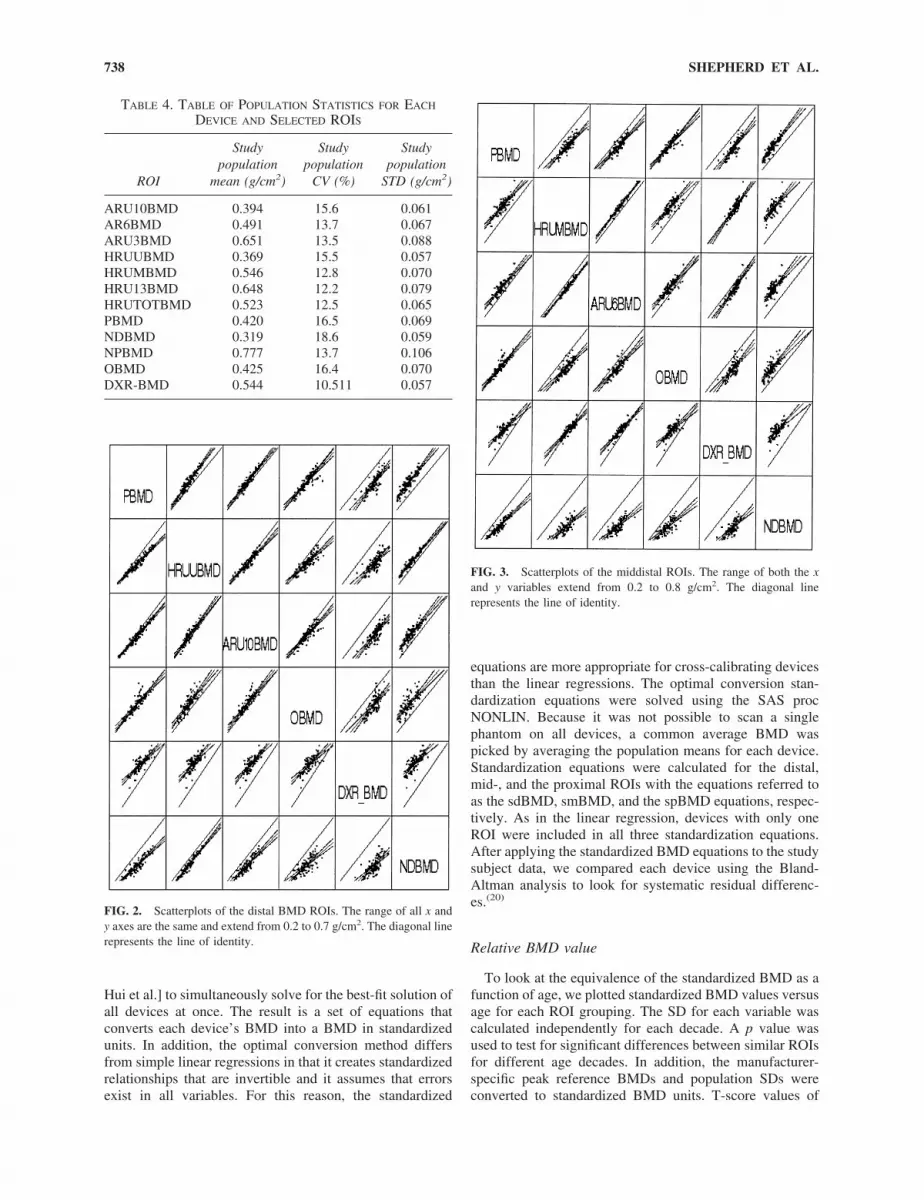
FIG. 2. Scatterplots of the distal BMD ROIs. The range of all x andy axes are the same and extend from 0.2 to 0.7 g/cm2. The diagonal linerepresents the line of identity.
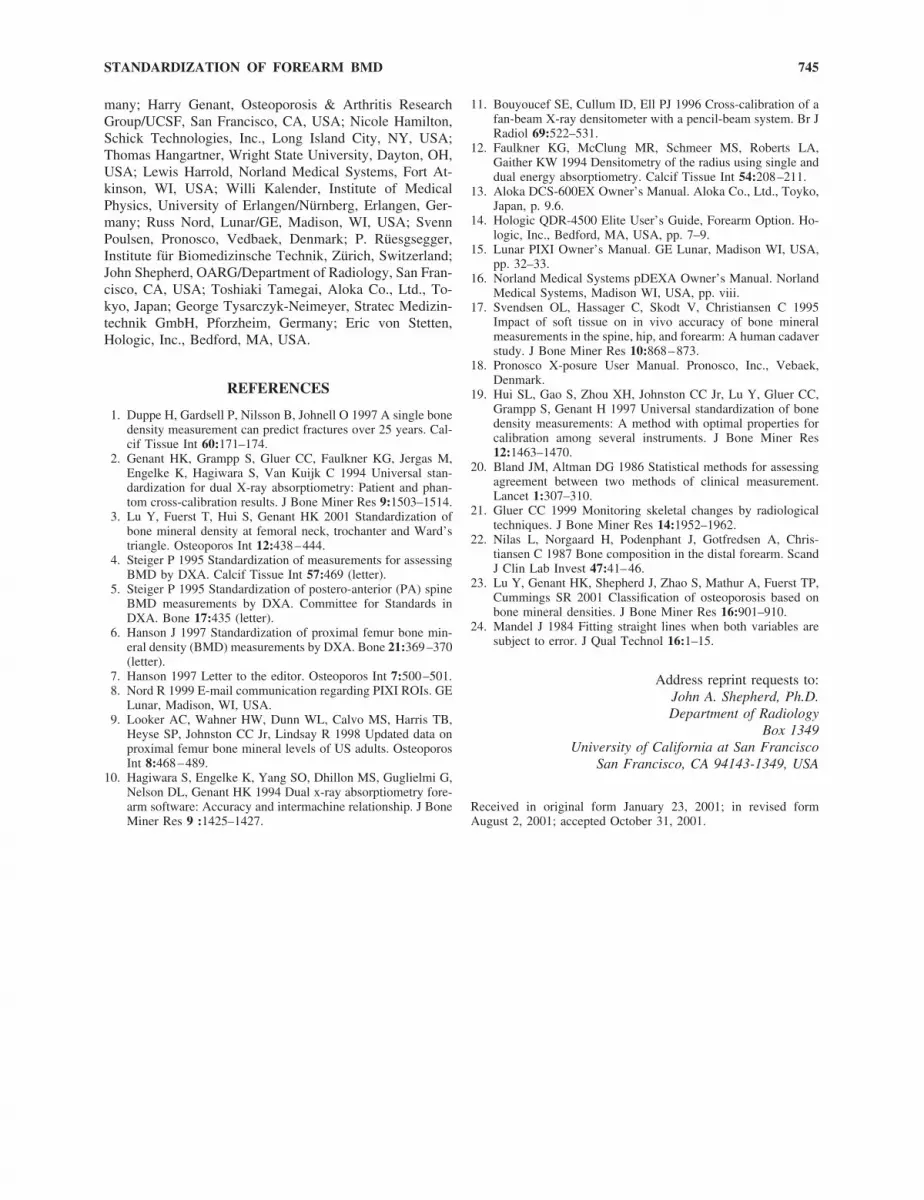
FIG. 3. Scatterplots of the middistal ROIs. The range of both the xand y variables extend from 0.2 to 0.8 g/cm2. The diagonal linerepresents the line of identity.
TABLE 4. TABLE OF POPULATION STATISTICS FOR EACH
DEVICE AND SELECTED ROIS
ROI
Studypopulation
mean (g/cm2)
Studypopulation
CV (%)
Studypopulation
STD (g/cm2)
ARU10BMD 0.394 15.6 0.061AR6BMD 0.491 13.7 0.067ARU3BMD 0.651 13.5 0.088HRUUBMD 0.369 15.5 0.057HRUMBMD 0.546 12.8 0.070HRU13BMD 0.648 12.2 0.079HRUTOTBMD 0.523 12.5 0.065PBMD 0.420 16.5 0.069NDBMD 0.319 18.6 0.059NPBMD 0.777 13.7 0.106OBMD 0.425 16.4 0.070DXR-BMD 0.544 10.511 0.057
738 SHEPHERD ET AL.

�2.5 were calculated and compared to determine diagnosticequivalence.
Phantom measurements
The phantoms in Table 3 were identified for potential usein quality control and cross-calibration procedures. Twoadditional phantoms were made available and considered:the Aloka PHA-8158 and the Leeds phantom used by thePronosco System. The Aloka and Pronosco phantoms weredesigned specifically for the manufacturer-specific machineand could not be analyzed using any of the other manufac-turer’s forearm algorithms. The European Forearm Phantom(EFP) I is not anthropomorphic and could not be analyzedusing the default analysis instructions provided by the man-ufacturers and would have required special analysis. TheEFP II could not be scanned in the default mode on theDCS-600EX. The three CIRS phantoms were designed spe-cially and built for this study. The volumetric bone densityof 400, 600, and 800 mg/cm3 were chosen by CIRS. Be-cause of their anthropomorphic shape and full forearmlength, we had to prop the CIRS phantoms with foam padsto keep the phantoms from rotating during the scan. None ofthe phantoms could be analyzed by the X-posure in vivoalgorithm. Each phantom in Table 3 was scanned on theremaining five devices with repositioning between eachscan. The Aloka DCS-600EX scans were analyzed for radialBMD only. The Aloka device was shipped with radius-onlyanalysis software and upgraded only after the phantomscans were acquired.
RESULTS
Intermanufacturer BMD correlations
The population mean, SD, and CV for each of the chosenBMD variables is shown in Table 4. For qualitative visual-ization, Figs. 2–4 are compilations of the scatterplots for allthe distal, mid-, and proximal ROIs, respectively. Each plotcontains the scatter data, the least square fit line (solid) with95% confidence limits (dotted), and a line of identity (di-agonal). The x variables are in columns and the y variablesare in rows. To simplify visualization, we used the same xand y axis scales for each plot compilation. The x and y axesin Fig. 2 range from 0.2 to 0.7 g/cm2. For Figs. 3 and 4, theaxes range from 0.2 to 0.8 and 0.2 to 1.1, respectively.Tables 5–7 show the linear regression statistics for thedistal, mid-, and proximal sites, respectively. The r valuesranged from 0.70 to 0.97. The SEE ranged from 2.9% to13.1% of the mean.
Standardization relationships between devices
Table 8 shows the standardized BMD equations for eachof the devices for the ultradistal, mid-, and proximal ROIs.Regression of the difference in sBMD values to the meansBMD values for each device (Bland-Altman analysis)showed no systematic differences between mean values.
Standardization BMD values versus age
The standardized BMD versus the average decade age forsimilar ROIs across manufacturers is plotted in Figs. 5–7.The error bars show the SD of the mean for each decademean value independently. For this study population andpresentation method, there was a trend for all BMD valuesto increase relative to the young BMD values before aperimenopausal drop, with this trend becoming more pro-nounced for the more distal ROIs. In general, there was asimilar age-related change in BMD for the ultradistal, mid-,and 1⁄3 proximal sites. For the proximal ROIs, none of thespBMD values of the young (20- to 30-year-old) subjectswere significantly different (p � 0.05) except those betweenPBMD and DXR-BMD, which differed by 30 mg/cm2 (p �0.03). For the mid-ROIs, all smBMDs for the 20- to 30-year-old subjects were equivalent except for a 30-mg/cm2
(p � 0.04) difference between ARU6BMD and NDBMD.For the distal ROIs, no age decade was significantly differ-ent except for a 0.01-g/cm2 (p � 0.044) difference betweenPBMD and ARU3BMD. However, none of the 20- to30-year-old sdBMD values were significantly different forp � 0.01.
Figure 8 is a comparison of the peak reference values andpopulation SDs used to calculate T scores after being con-verted to sBMD. The sBMD values are shown for each ROIgrouping. Note that some of the devices are represented in
FIG. 4. Scatterplots of the proximal ROIs. The range of both the xand y variables extend from 0.2 to 1.1 g/cm2. The diagonal linerepresents the line of identity.
739STANDARDIZATION OF FOREARM BMD

each ROI grouping and thus the peak sBMD values changerelative to the standardization grouping used. T scores cal-culated using sBMD values can now be compared and areshown in Fig. 8. Note that although there is no relativedifference between the sBMD values in each grouping, thepeaks, SDs, and thus the T score are different most likelybecause of the use of different reference populations.
Phantom results
As stated in the methods, six of the available phantomscould be scanned on five machines in the manufacturer’sdefault scan mode. A forearm length of 25 cm was definedwhen the software asked for it. The mean values and CVsare given for the remaining phantoms on each device inTable 9. One Osteometer phantom scan was excluded fromthe DCS-600EX data because of poor positioning. The PIXIphantom was too short to have a distal site available for the
QDR-4500A, the pDEXA, and the DCS-600EX devices.The CIRS and Lunar phantoms did not contain a densitygradient in the ultradistal region for the pDEXA to use tofind the NDBMD ROI. The Osteometer phantom’s handleinterfered with its ability to lay flat on the horizontal scan-ners like the QDR-4500A, PIXI, DCS-600EX, and thepDEXA. All Osteometer phantom scans were done with thephantom propped and a horizontal bone plane.
DISCUSSION
Several principal points can be derived from this study.First, baseline and follow-up examinations must be acquiredon the same make and model of densitometer. The moni-toring of the same patient on a different machine comes upin a variety of situations including device upgrades andwhen a patient moves and/or changes primary care giver.
TABLE 5. LINEAR REGRESSION STATISTICS FOR THE DISTAL SITES
Independentvariable
Dependent variable
DXR-BMD HRUUBMD NDBMD OBMD PBMD
r Value
ARU10BMD 0.82 0.92 0.88 0.89 0.95DXR-BMD 0.76 0.72 0.76 0.83HRUUBMD 0.96 0.86 0.94NDBMD 0.78 0.90OBMD 0.89
Independentvariable
Dependent variable
ARU10BMD DXRBMD HRUUBMD NDBMD OBMD PBMD
Intercept
ARU10BMD 0.252 0.044 �0.005 0.039 0.017DXR-BMD �0.102 �0.044 �0.088 �0.078 �0.128HRUUBMD 0.014 0.266 �0.049 0.037 �0.002NDBMD 0.095 0.325 0.075 0.132 0.084OBMD 0.053 0.280 0.069 0.035 0.046PBMD 0.025 0.258 0.043 �0.006 0.051
Slope
ARU10BMD 0.747 0.831 0.827 0.988 1.031DXR-BMD 0.909 0.760 0.747 0.927 1.007HRUUBMD 1.023 0.754 0.997 1.051 1.144NDBMD 0.931 0.687 0.923 0.919 1.055OBMD 0.798 0.620 0.707 0.668 0.881PBMD 0.872 0.680 0.778 0.774 0.890
SEE
ARU10BMD 0.032 0.022 0.028 0.032 0.021DXR-BMD 0.035 0.038 0.042 0.046 0.039HRUUBMD 0.024 0.038 0.017 0.036 0.023NDBMD 0.030 0.040 0.016 0.044 0.030OBMD 0.028 0.038 0.029 0.037 0.032PBMD 0.020 0.032 0.019 0.026 0.033
Bold represents not significantly different from 0 ( p � 0.05).
740 SHEPHERD ET AL.

One must be certain that the two measurements are compa-rable and how the use of the two different devices changeaffects the least significant change (LSC)(21) in BMD. Whenno change of devices has occurred, the LSC is defined as
LSC � 2.8 � PE,
where PE is the largest precision error of the technique fora 95% statistical confidence that the change in BMD issignificant. However, if two devices are used, the LSC hasto be modified to include the SE of the estimate, the preci-sion of the two devices, and the uncertainty of the slope andintercept relating the two devices. If precision drove theSEE, we would expect the SEE around the fit line to be onthe order of the root mean square combination of theirprecision values. For equal precision on both devices, theSEE would be �2 times the precision. If the precision ontwo devices to be compared is determined by patient posi-
tioning and is �2%, the expected SEE would be �3%. Theactual SEEs varied from �3% to over 13% with the ROIs,most closely matched in position, having the lowest SEE.This implies that biological variations are mostly responsi-ble for the large SEEs on dissimilar ROIs. Unfortunately,the manufacturers do not reveal their specific algorithms, forexample, their method of bone segmentation. Thus, thequantification of the impact on ROI and scanner variationsis difficult. A better comparability of forearm densitometrywould require in particular a standardization of the ROIs tobe used. In addition, the ratio of cortical to trabecular bonemass is known to increase when moving proximally up theforearm.(22) So, one would expect mismatched ROIs to havedifferent rates of loss or gain. Needless to say, if one isfollowing a subject of a clinical trial over time, a change ofdevices during the trial should be strongly avoided.
Another principal point is that monitoring changes in BMDfor populations may be possible on cross calibrated devices for
TABLE 6. LINEAR REGRESSION STATISTICS FOR THE MIDSITES
Independentvariable
Dependent variable
DXR-BMD HRUMBMD NDBMD OBMD PBMD
r Value
ARU6BMD 0.90 0.97 0.78 0.85 0.88DXR-BMD 0.89 0.72 0.76 0.83HRUMBMD 0.78 0.83 0.87NDBMD 0.78 0.90OBMD 0.89
Independentvariable
Dependent variable
ARU6BMD DXR BMD HRUMBMD NDBMD OBMD PBMD
y Intercept
ARU6BMD 0.178 0.055 �0.009 0.003 �0.007DXR-BMD �0.102 �0.049 �0.088 �0.078 �0.128HRUMBMD �0.027 0.148 �0.042 �0.024 �0.049NDBMD 0.200 0.325 0.253 0.132 0.084OBMD 0.134 0.280 0.193 0.035 0.046PBMD 0.117 0.258 0.177 �0.006 0.051
Slope
ARU6BMD 0.748 1.004 0.673 0.864 0.875DXR-BMD 1.086 1.095 0.747 0.927 1.007HRUMBMD 0.945 0.724 0.661 0.822 0.860NDBMD 0.906 0.687 0.920 0.919 1.055OBMD 0.835 0.620 0.830 0.668 0.881PBMD 0.885 0.680 0.877 0.774 0.890
SEE
ARU6BMD 0.024 0.016 0.036 0.036 0.032DXR-BMD 0.029 0.032 0.042 0.046 0.039HRUMBMD 0.015 0.026 0.037 0.040 0.035NDBMD 0.042 0.040 0.044 0.044 0.030OBMD 0.036 0.038 0.040 0.037 0.032PBMD 0.032 0.032 0.035 0.026 0.033
Bold represents not significantly different from 0 ( p � 0.05).
741STANDARDIZATION OF FOREARM BMD

similar ROIs and some devices. This is a common practice toincrease recruitment numbers in clinical trials by drawingsubjects from more than one clinical site. To pool the resultsfrom different machines to look for treatment effects and/ordescribing patient populations, it is imperative to know their invivo cross-calibration relationships. All measures would beconverted into the measure from one device.
There are no guidelines on what r value and SE isappropriate when converting one device’s BMD into anoth-er’s for a clinical trial. This situation can be contrasted topredicting the total femur BMD from the posteroanterior(PA) spine BMD. The r value between comparative spineand hip measures on the same subjects is �0.7 caused bybiological variation and it is never recommended to omit thehip and use only the spine to predict hip BMD. To thecontrary, it has been shown that one can increase the abilityto predict fracture risk by using a combination of hip andspine BMD in determining fracture risk.(23) Thus, we con-
clude that an r value of 0.70 between devices suggests toolarge of an uncertainty between devices to predict data ofone device from another for individual patients. One theother hand, generally, it is accepted that devices that havebeen compared with r values above 0.97 using a clinicallybroad range of values can be pooled reasonably and cross-calibrated. An example of this is the pooling of spine andhip BMD values from across manufacturers. What is notclear is the threshold of acceptability for correlation rela-tionships between the 0.70 and the 0.97 values. One couldargue that an r value of 0.90 could be used as a thresholdbecause this would mean 80% of the data supports the linearrelationship between the two scanners. In addition, an SEEsimilar to the LSC of a single device could be used as anadditional criterion. In this study, �20% of all correlationsresulted in r values of �0.9 and 50% in r values of �0.85.Therefore, excellent comparability exists for some devicesand for certain ROIs.
TABLE 7. LINEAR REGRESSION STATISTICS FOR THE PROXIMAL SITES
Independentvariable
Dependent variable
DXR-BMD HRU13BMD NPBMD OBMD PBMD
r Value
ARU3BMD 0.83 0.97 0.95 0.72 0.74DXR-BMD 0.82 0.83 0.76 0.83HRU13BMD 0.94 0.70 0.73NPBMD 0.69 0.71OBMD 0.89
Independentvariable
Dependent variable
ARU3BMD DXR BMD HRU13BMD NPBMD OBMD PBMD
Intercept
ARU3BMD 0.204 0.086 0.047 0.067 0.061DXR-BMD �0.070 0.026 �0.067 �0.078 �0.128HRU13BMD �0.056 0.162 �0.037 0.030 0.007NPBMD 0.030 0.199 0.106 0.075 0.060OBMD 0.256 0.280 0.311 0.329 0.046PBMD 0.240 0.258 0.297 0.318 0.051
Slope
ARU3BMD 0.525 0.865 1.127 0.553 0.556DXR-BMD 1.321 1.142 1.553 0.927 1.007HRU13BMD 1.089 0.589 1.257 0.611 0.638NPBMD 0.796 0.444 0.697 0.451 0.463OBMD 0.924 0.620 0.791 1.053 0.881PBMD 0.972 0.680 0.834 1.093 0.890
SEE
ARU3BMD 0.031 0.019 0.034 0.048 0.045DXR-BMD 0.049 0.046 0.060 0.046 0.039HRU13BMD 0.021 0.033 0.038 0.050 0.048NPBMD 0.028 0.032 0.028 0.051 0.049OBMD 0.062 0.038 0.057 0.077 0.032PBMD 0.060 0.032 0.055 0.075 0.033
Bold represents not significantly different from 0 ( p � 0.05).
742 SHEPHERD ET AL.

It is interesting to look at mistaken conclusions one coulddraw from uncalibrated BMD comparisons. For example,nonunity slopes between devices could cause confoundingconclusions to be drawn depending on the device used. Onewould expect that a patient scanned on the DTX-200(OBMD), for example, with a change between baseline andfollow-up measurements of say 0.10 g/cm2, would see onlya 0.06-g/cm2 change on the Norland pDEXA (NDBMD).However, even when the sBMD units are used, there stillexist differences in the sBMD value for a T score of �2.5
because different manufacturers use different reference pop-ulations as shown in Fig. 8.
Standard ROIs would simplify interpretation of forearmresults. Early postmenopausal bone loss is monitored mostsensitively using sites high in trabecular bone, like theultradistal forearm. Global loss in skeletal mass is bestmonitored with cortical bone sites like the distal proximalforearm. Standardized ROIs would eliminate biologicalvariation between measures on different devices, reduce theSEE, and increase confidence in cross-calibrating devices,pooling measurements, and monitoring drug therapy.
Because the phantoms are distributed through the clinicalrange, it may be useful to use two or three together whencross-calibrating scanners to get a reasonable slope. TheCIRS phantoms were designed to give three referencepoints for all ROIs but were limited by their difficult posi-tioning and high densities. Based on the experience of thisstudy, an ideal cross-calibration phantom set could be con-
TABLE 8. STANDARDIZATION EQUATIONS FOR THE SUBMD,SMBMD, AND SPBMD ROIS
Standardization equations
Ultradistal
sdBMD � 0.945 � PBMD � 0.015sdBMD � 1.158 � HRUUBMD � 0.019sdBMD � 1.059 � ARU10BMD � 0.005sdBMD � 0.802 � OBMD � 0.071sdBMD � 0.960 � DXR_BMD � 0.110sdBMD � 1.027 � NDBMD � 0.084
Middistal
smBMD � 1.011 � PBMD � 0.033smBMD � 0.894 � HRUMBMD � 0.030smBMD � 0.964 � ARU6BMD � 0.016smBMD � 0.856 � OBMD � 0.094smBMD � 1.137 � DXR_BMD � 0.161smBMD � 1.106 � NDBMD � 0.105
Proximal
spBMD � 1.091 � PBMD � 0.119spBMD � 0.861 � HRU13BMD � 0.020spBMD � 0.712 � ARU3BMD � 0.114spBMD � 0.917 � OBMD � 0.188spBMD � 1.538 � DXR_BMD � 0.259spBMD � 0.596 � NPBMD � 0.114
suBMD, standardization for ultradistal BMD ROIs.
FIG. 5. Age-related change for the distal ROIs. Each point shows thedecade average for age and sdBMD values. The sdBMD variables arerepresented as the variable name with a std suffix for standardized. Theerror bars show the �1 SD range around the mean values.
FIG. 6. Age-related change for the midforearm ROIs. Each pointshows the decade average for age and smBMD values. The smBMDvariables are represented as the variable name with a std suffix forstandardized. The error bars show the �1 SD range around the meanvalues.
FIG. 7. Age-related change for the proximal forearm ROIs. Eachpoint shows the decade average for age and spBMD values. ThespBMD variables are represented as the variable name with a std suffixfor standardized. The error bars show the �1 SD range around themean values.
743STANDARDIZATION OF FOREARM BMD

structed in several ways. The CIRS phantoms could beimproved by shortening to half the forearm length, given asquare shape on the proximal end to limit rotation and addstability, eliminate the 800-mg phantom, and provide a200-mg phantom. Alternatively, two additional Norland orLunar phantoms could be made of half and double theirpresent densities to cover the clinical range. The EFP IIcovers all densities required in a single phantom but is notanthropomorphic enough to be analyzed on all devicesusing the default mode. A more complete anthropomorphicphantom of the hand as well as the forearm that included themedullar canals would be needed for Pronosco X-posurelongitudinal QC. Because the Pronosco X-posure uses ra-diogrammetry instead of mass attenuation to derive bonedensity, it is not obvious how one could create a phantomset that could cross-calibrate the X-posure to the DXAdevices. The fact that none of the phantoms could bescanned on all devices stresses the challenges in cross-calibrating different technologies to each other.
This study has several shortcomings. First, not all devicesfrom all manufacturers were included in this study. GE/
Lunar makes four different devices for forearm densitome-try: Prodigy, DPX-IQ, Expert, and PIXI. The Prodigy, Ex-pert, and IQ have the same X-ray technique but differ fromthe PIXI. The Prodigy, IQ, and Expert have multiple ROIsand the PIXI has only one. Thus, it will be difficult to applythe results of this study to those other devices. Hologicmakes pencil and fan beam devices that have identicallydefined ROIs but different X-ray techniques. Osteometerhas several algorithms for analyzing their scans that differsignificantly from the analysis we used. Also, no peripheralquantitative computed tomography (pQCT) devices wereincluded. Because in vivo precision was not quantified onthis patient population, we could not use regression modelsthat use weighted error corrections such as the model pro-posed by Mandel.(24) Instead, we assumed that the baseprecision of each device was similar. Although the precisionreported in the literature for each device varies, this is areasonable estimate because patient repositioning typicallylimits the precision of most clinical BMD measurements.
CONCLUSIONS
This study describes the regression relationship betweensix forearm densitometers. In general, the agreement be-tween forearm densitometers is high. Standardized unitshave been defined such that the mean BMD values for eachdevice would, on average, agree with one another. Furtherstandardization is necessary in the ROIs to improve theagreement and reduce the SE of the estimate.
ACKNOWLEDGMENTS
We thank Vesta March and Fay Wong for acquiring thescans and David Breazeale for editing. The ISCBM com-missioned this study. Each of the manufacturers that partic-ipated contributed financially in equal amounts to cover theexpense of recruitment, scanning, and data analysis. Theparticipating members of the Forearm Subcommittee of theISCBM at the time of this study are as listed: KlausEngleke, Institute of Medical Physics (IMP), Erlangen, Ger-
FIG. 8. Comparison of the manufacturer-specific peak reference val-ues with �1 population SD in units of sBMD by grouping. These peaksand SDs are used to calculate the sBMD for a T score of �2.5 (circles).Thus, the T scores used for diagnoses still vary because differentmanufacturers use different reference populations. (ARU6BMD has noreference values.)
TABLE 9. PHANTOM MEAN BMD VALUES IN (g/cm2) FOR EACH ROI
ROI
Phantom Mean BMD in g/cm2 (% CV)
CIRS 400 CIRS 600 CIRS 800 Osteometer EFPII Norland Lunar
AR3BMD 0.268 (2.2) 0.391 (1.7) 0.442 (0.6) 0.381 (0.2) NA 0.794 (0.7) NAAR6BMD 0.261 (2.1) 0.380 (0.8) 0.421 (0.4) 0.386 (1.2) NA 0.574 (1.6) 0.412 (0.2)AR10BMD 0.276 (2.3) 0.419 (3.1) 0.467 (1.7) 0.377 (1.2) NA 0.456 (1.2) 0.408 (1.0)HRU3BMD 0.316 (1.3) 0.434 (1.6) 0.563 (1.9) 0.409 (1.4) 0.519 (2.6) 0.825 (0.8) NAHRUMBMD 0.309 (0.8) 0.421 (1.2) 0.541 (1.0) 0.409 (1.5) 0.325 (0.8) 0.610 (1.1) 0.450 (1.1)HRUUBMD 0.400 (2.1) 0.600 (1.3) 0.777 (0.7) 0.416 (1.5) 0.425 (2.6) 0.414 (2.2) 0.464 (1.2)OBMD 0.316 (2.2) 0.447 (1.2) 0.498 (0.9) 0.388 (0.6) 0.264 (0.5) 0.413 (0.7) 0.416 (0.6)NDBMD 0.337 (2.4) 0.454 (1.1) 0.467 (2.1) 0.421 (0.7) 0.598 (1.1) 0.324 (0.9) 0.451 (1.1)NPBMD 0.316 (2.8) 0.472 (1.8) 0.499 (2.7) 0.410 (0.4) 0.292 (0.7) 0.909 (0.5) NAPBMD 0.41 (1.8) 0.583 (1.9) 0.679 (1.1) 0.393 (0.5) 0.336 (1.0) 0.388 (1.1) 0.411 (0.3)
The phantom CV values with repositioning between scans is shown in parentheses as a percentage.
744 SHEPHERD ET AL.
many; Harry Genant, Osteoporosis & Arthritis ResearchGroup/UCSF, San Francisco, CA, USA; Nicole Hamilton,Schick Technologies, Inc., Long Island City, NY, USA;Thomas Hangartner, Wright State University, Dayton, OH,USA; Lewis Harrold, Norland Medical Systems, Fort At-kinson, WI, USA; Willi Kalender, Institute of MedicalPhysics, University of Erlangen/Nurnberg, Erlangen, Ger-many; Russ Nord, Lunar/GE, Madison, WI, USA; SvennPoulsen, Pronosco, Vedbaek, Denmark; P. Ruesgsegger,Institute fur Biomedizinsche Technik, Zurich, Switzerland;John Shepherd, OARG/Department of Radiology, San Fran-cisco, CA, USA; Toshiaki Tamegai, Aloka Co., Ltd., To-kyo, Japan; George Tysarczyk-Neimeyer, Stratec Medizin-technik GmbH, Pforzheim, Germany; Eric von Stetten,Hologic, Inc., Bedford, MA, USA.
REFERENCES
1. Duppe H, Gardsell P, Nilsson B, Johnell O 1997 A single bonedensity measurement can predict fractures over 25 years. Cal-cif Tissue Int 60:171–174.
2. Genant HK, Grampp S, Gluer CC, Faulkner KG, Jergas M,Engelke K, Hagiwara S, Van Kuijk C 1994 Universal stan-dardization for dual X-ray absorptiometry: Patient and phan-tom cross-calibration results. J Bone Miner Res 9:1503–1514.
3. Lu Y, Fuerst T, Hui S, Genant HK 2001 Standardization ofbone mineral density at femoral neck, trochanter and Ward’striangle. Osteoporos Int 12:438–444.
4. Steiger P 1995 Standardization of measurements for assessingBMD by DXA. Calcif Tissue Int 57:469 (letter).
5. Steiger P 1995 Standardization of postero-anterior (PA) spineBMD measurements by DXA. Committee for Standards inDXA. Bone 17:435 (letter).
6. Hanson J 1997 Standardization of proximal femur bone min-eral density (BMD) measurements by DXA. Bone 21:369–370(letter).
7. Hanson 1997 Letter to the editor. Osteoporos Int 7:500–501.8. Nord R 1999 E-mail communication regarding PIXI ROIs. GE
Lunar, Madison, WI, USA.9. Looker AC, Wahner HW, Dunn WL, Calvo MS, Harris TB,
Heyse SP, Johnston CC Jr, Lindsay R 1998 Updated data onproximal femur bone mineral levels of US adults. OsteoporosInt 8:468–489.
10. Hagiwara S, Engelke K, Yang SO, Dhillon MS, Guglielmi G,Nelson DL, Genant HK 1994 Dual x-ray absorptiometry fore-arm software: Accuracy and intermachine relationship. J BoneMiner Res 9 :1425–1427.
11. Bouyoucef SE, Cullum ID, Ell PJ 1996 Cross-calibration of afan-beam X-ray densitometer with a pencil-beam system. Br JRadiol 69:522–531.
12. Faulkner KG, McClung MR, Schmeer MS, Roberts LA,Gaither KW 1994 Densitometry of the radius using single anddual energy absorptiometry. Calcif Tissue Int 54:208–211.
13. Aloka DCS-600EX Owner’s Manual. Aloka Co., Ltd., Toyko,Japan, p. 9.6.
14. Hologic QDR-4500 Elite User’s Guide, Forearm Option. Ho-logic, Inc., Bedford, MA, USA, pp. 7–9.
15. Lunar PIXI Owner’s Manual. GE Lunar, Madison WI, USA,pp. 32–33.
16. Norland Medical Systems pDEXA Owner’s Manual. NorlandMedical Systems, Madison WI, USA, pp. viii.
17. Svendsen OL, Hassager C, Skodt V, Christiansen C 1995Impact of soft tissue on in vivo accuracy of bone mineralmeasurements in the spine, hip, and forearm: A human cadaverstudy. J Bone Miner Res 10:868–873.
18. Pronosco X-posure User Manual. Pronosco, Inc., Vebaek,Denmark.
19. Hui SL, Gao S, Zhou XH, Johnston CC Jr, Lu Y, Gluer CC,Grampp S, Genant H 1997 Universal standardization of bonedensity measurements: A method with optimal properties forcalibration among several instruments. J Bone Miner Res12:1463–1470.
20. Bland JM, Altman DG 1986 Statistical methods for assessingagreement between two methods of clinical measurement.Lancet 1:307–310.
21. Gluer CC 1999 Monitoring skeletal changes by radiologicaltechniques. J Bone Miner Res 14:1952–1962.
22. Nilas L, Norgaard H, Podenphant J, Gotfredsen A, Chris-tiansen C 1987 Bone composition in the distal forearm. ScandJ Clin Lab Invest 47:41–46.
23. Lu Y, Genant HK, Shepherd J, Zhao S, Mathur A, Fuerst TP,Cummings SR 2001 Classification of osteoporosis based onbone mineral densities. J Bone Miner Res 16:901–910.
24. Mandel J 1984 Fitting straight lines when both variables aresubject to error. J Qual Technol 16:1–15.
Address reprint requests to:John A. Shepherd, Ph.D.Department of Radiology
Box 1349University of California at San Francisco
San Francisco, CA 94143-1349, USA
Received in original form January 23, 2001; in revised formAugust 2, 2001; accepted October 31, 2001.
745STANDARDIZATION OF FOREARM BMD