national and international standardization of radiation
TRANSCRIPT
National and International Standardization
of Radiation Dosimetiy ¡PROCEED INGS
OF A SY M P O S IU M ATLANTA
5 - 9 DECEM BER 1977
MlI N T E R N A T I O N A L A T O M I C E N E R G Y A G E N C Y , V I E N N A , 1 9 7 8__¿Ir

N A T IO N A L A N D IN T E R N A T IO N A L S T A N D A R D IZ A T IO N O F R A D IA T IO N D O S IM E T R Y
V O L .I
T h e fo l lo w in g States are M em b ers o f the In tern a tion a l A t o m ic E nergy A g e n cy :
A F G H A N I S T A N
A L B A N I A
A L G E R I A
A R G E N T I N A
A U S T R A L I A
A U S T R I A
B A N G L A D E S H
B E L G I U M
BOLIVIA
B R A Z I L
B U L G A R I A
B U R M A
B Y E L O R U S S I A N SOVIET
SOCIALIST REPU B L I C
C A N A D A
CHILE
C O L O M B I A
C O S T A RICA
C U B A
C Y P R U S
C Z E C H O S L O V A K I A
D E M O C R A T I C K A M P U C H E A
D E M O C R A T I C P E O P L E’S
RE P U B L I C O F K O R E A
D E N M A R K
D O M I N I C A N REPU B L I C
E C U A D O R
E G Y P T
EL S A L V A D O R
ETHIOPIA
F I N L A N D
F R A N C E
G A B O N
G E R M A N D E M O C R A T I C R E P U B L I C
G E R M A N Y , F E D E R A L R E P U B L I C O F
G H A N A
G R E E C E
G U A T E M A L A
HAITI
H O L Y SEE
H U N G A R Y
I C E L A N D
INDIA
I N D O N E S I A
I R A N
I R A Q
I R E L A N D
I SRAEL
ITA L Y
I V O R Y C O A S T
J A M A I C A
J A P A N
J O R D A N
K E N Y A
K O R E A , R E P U B L I C O F
K U W A I T
L E B A N O N
LIBERIA
L I B Y A N A R A B J A M A H I R I Y A
LI E C H T E N S T E I N
L U X E M B O U R G
M A D A G A S C A R
M A L A Y S I A
MALI
M A U R I T I U S
M E X I C O
M O N A C O
M O N G O L I A
M O R O C C O
N E T H E R L A N D S
N E W Z E A L A N D
N I C A R A G U A
N I G E R
NI GERIA
N O R W A Y
P A K I S T A N
P A N A M A
P A R A G U A Y
P E R U
PHILIPPINES
P O L A N D
P O R T U G A L
Q A T A R
R O M A N I A
S A UDI A R A B I A
S E N E G A L
S I E R R A L E O N E
S I N G A P O R E
S O U T H A F R I C A
SPAIN
SRI L A N K A
S U D A N
S W E D E N
S W I T Z E R L A N D
S Y R I A N A R A B R E P U B L I C
T H A I L A N D
TUNISIA
T U R K E Y
U G A N D A
U K R A I N I A N SO V I E T SOCIALIST
REPU B L I C
U N I O N O F SO V I E T SOCIALIST
REPUBLICS
U N I T E D A R A B E M I R A T E S
U N I T E D K I N G D O M O F G R E A T
BRITAIN A N D N O R T H E R N
I R E L A N D
U N I T E D R E P U B L I C O F
C A M E R O O N
U N I T E D R E P U B L I C O F
T A N Z A N I A
U N I T E D S T A T E S O F A M E R I C A
U R U G U A Y
V E N E Z U E L A
VIET N A M
Y U G O S L A V I A
Z A I R E
Z A M B I A
The Agency’s Statute was approved on 23 October 1956 by the Conference on the Statute of the IAEA
held at United Nations Headquarters, N e w York; it entered into force on 29 July 1957. The Headquarters of
the Agency are situated in Vienna. Its principal objective is “to accelerate and enlarge the contribution of
atomic energy to peace, health and prosperity throughout the world”.
Printed by the IAEA in Austria
July 1978
PROCEEDINGS SERIES
NATIONAL AND INTERNATIONAL STANDARDIZATION
OF RADIATION DOSIMETRY
PROCEEDINGS OF AN INTERNATIONAL SYMPOSIUM ON NATIONAL AND INTERNATIONAL STANDARDIZATION
OF RADIATION DOSIMETRY HELD BY THE
INTERNATIONAL ATOMIC ENERGY AGENCY IN ATLAN TA, GEORGIA, 5 - 9 DECEMBER 1977
In tw o volumes
VOL.I
INTERNATIONAL ATOMIC ENERGY AGENCY VIENNA, 1978
EDITORIAL NOTE
T h e p a p e r s a n d d is c u s s io n s h a v e b e e n e d i t e d b y t h e e d i to r ia l s t a f f o f t h e I n te r n a t io n a l
A t o m i c E n e r g y A g e n c y t o t h e e x t e n t c o n s id e r e d n e c e s s a r y f o r t h e r e a d e r ’s a s s is ta n ce . T h e v ie w s
e x p r e s s e d a n d t h e g e n e r a l s t y l e a d o p t e d r e m a in , h o w e v e r , t h e r e s p o n s ib i l i t y o f t h e n a m e d a u th o r s
o r p a r t ic ip a n ts . In a d d it io n , t h e v ie w s a r e n o t n e c e s s a r i l y t h o s e o f t h e g o v e r n m e n t s o f t h e
n o m in a t in g M e m b e r S ta te s o r o f t h e n o m in a t in g o r g a n iz a t io n s .
W h e r e p a p e r s h a v e b e e n in c o r p o r a t e d in t o th e s e P r o c e e d in g s w i t h o u t r e s e t t in g b y t h e A g e n c y ,
th is h a s b e e n d o n e w ith t h e k n o w l e d g e o f th e a u th o r s a n d th e ir g o v e r n m e n t a u th o r i t i e s , a n d th e ir
c o o p e r a t i o n is g r a t e fu l l y a c k n o w l e d g e d . T h e P r o c e e d in g s h a v e b e e n p r i n t e d b y c o m p o s i t i o n
t y p i n g a n d p h o t o - o f f s e t l i th o g r a p h y . W ith in t h e l im ita tio n s i m p o s e d b y th is m e th o d , e v e r y e f f o r t
h a s b e e n m a d e t o m a in ta in a h ig h e d i to r ia l s ta n d a rd , in p a r t icu la r t o a c h ie v e , w h e r e v e r p r a c t ic a b le ,
c o n s i s t e n c y o f u n its a n d s y m b o l s a n d c o n f o r m i t y t o t h e s ta n d a rd s r e c o m m e n d e d b y c o m p e t e n t
in t e r n a t io n a l b o d ie s .
T h e u s e in th e s e P r o c e e d in g s o f p a r t icu la r d e s ig n a t io n s o f c o u n t r i e s o r t e r r i t o r i e s d o e s n o t
i m p ly a n y j u d g e m e n t b y t h e p u b lis h e r , t h e I A E A , a s t o t h e leg a l s ta tu s o f s u c h c o u n t r i e s o r
t e r r i to r i e s , o f th e ir a u th o r i t i e s a n d in s t i tu t io n s o r o f t h e d e l im i ta t io n o f th e ir b o u n d a r ie s .
T h e m e n t io n o f s p e c i f i c c o m p a n i e s o r o f th e ir p r o d u c t s o r b ra n d n a m e s d o e s n o t i m p ly a n y
e n d o r s e m e n t o r r e c o m m e n d a t i o n o n t h e p a r t o f th e I A E A .
A u th o r s a r e t h e m s e lv e s r e s p o n s ib l e f o r o b ta in in g t h e n e c e s s a r y p e r m is s io n t o r e p r o d u c e c o p y r i g h t m a te r ia l f r o m o t h e r s o u r c e s .
NATIONAL AND INTERNATIONAL STANDARDIZATION OF RADIATION DOSIMETRY
IAEA, VIENNA, 1978 STI/PUB/47Í
ISBN 9 2 -0 - 0 1 0 4 7 8 - 9
FOREWORD
Public concern about all aspects o f radiation safety has generated a strong demand for reliable measurement o f ionizing radiation, a demand that applies not only to the protection o f man and his environment but also to those activities in which radiation work plays an essential role — in medicine, nucleàr power, industrial radiation processing and scientific research. All these require regulation o f some kind, and in many countries new or revised rules have been issued concerning the use o f ionizing radiations, leading to a requirement for standardization in dosimetry on both the national and international levels.
The introduction o f the international system o f units (SI) in the field o f radiation measurement has engendered a critical appraisal o f the concepts and quantities as well as o f the units. This has coincided with a period in which a transition in outlook is apparent — there being a movement away from the quantity exposure towards the quantity absorbed dose (or air-kerma) for appropriate radiation qualities. Thus it seemed timely to reconsider and discuss the realization o f the primary radiation units and their dissemination through the entire calibration chain to provide practical units for accurate measurements in the field.
It had also becom e clear that, in order to widen the availability - both geographically and numerically — o f calibrated radiation measuring apparatus, the efforts o f the national primary standards laboratories would have to be supplemented. In some o f the larger industrialized countries, enlarged schemes for providing calibration services have had to be set up, with the national standards laboratory as the primary reference centre. For many countries now entering the field o f nuclear energy, or using radiation in medicine and industry, the setting up o f Secondary Standard Dosimetry Laboratories (SSDLs) appeared to provide the most suitable and econom ic solution to the problem o f disseminating radiation units. The SSDL’s role is to calibrate tertiary and field dose meters and to serve as the necessary link between the primary standards laboratories and the radiation user. The world-wide spread o f such SSDLs — within the frame o f the IAEA/WHO Network o f SSDLs — gives rise to a need for them to collaborate with each other and with primary standards laboratories to ensure that standards are truly uniform.
When preparing the Symposium on the National and International Standardization o f Radiation Dosimetry, it therefore seemed appropriate to discuss, in addition to primary standards and the work o f primary standards laboratories, the specific tasks o f SSDLs, the presentation o f results and uncertainties throughout the calibration chain, as well as the organization and
results o f dose intercomparisons such as those initiated by international, regional and national laboratories. In this context a discussion on national and international standards for the perform ance o f dose meters, and the procedures for verification and type testing also seemed to be very relevant.
It is imperative that work on the basic physics phenomena related to dosimetry be continued and discussed at international meetings. Basic data, characterizing the interaction processes between radiation and matter, enter into the calibration chain; this requires international standardization o f the numerical values. Here again it becomes evident that the task o f the standardizing laboratories cannot be confined to calibrations o f secondary or tertiary standard dose meters against primary or secondary standards, respectively; it must include a follow-up o f the entire chain o f dissemination o f the radiation unit, providing the ultimate user with a clear instruction on how to determine the absorbed dose at a specified point from the reading o f the instrument.
In the field o f medicine, codes o f practice for radiation therapy dosimetry with photon and electron radiation have been issued by a number o f national and international committees. Some o f these recommendations are at present under review or are the subject o f revision. New formalisms have been suggested which might replace the widely used exposure calibration factor and the dose conversion factors. This new approach seems not only to be more consistent and accurate, it leads also to a unified procedure for photon and electron radiation.
Progress in standardization o f radiation dosimetry is closely related to the activities o f the International Commission on Radiation Units and Measurements (ICRU). Involved in this subject ever since 1925, the ICRU has had more impact on standardization in radiation measurement than any other organization. At present, one o f the activities o f ICRU is to provide information on the various factors needed for calculating the basic physical properties o f absolute radiation standards.
O f the ten sessions o f the Symposium, two were devoted to calibration work at the national standardizing laboratories, two to work at SSDLs and related international activities, two to standardization and calibration in radiation protection, one to standardization and calibration o f radioactive sources, one to basic physical aspects, and two to absorbed dose determinations. A total o f 65 papers were presented, nine o f which were given by invited speakers. The 137 participants represented 26 countries and eight international organizations. The Proceedings, published in two volumes, include the papers and the subsequent discussions.
For the convenience o f the reader and to improve the volumes as a reference source, the order o f the papers does not fo llow the order o f the Symposium programme, and participants are advised to consult the A uthor or Preprint-Symbol Indexes in Vol. II to determine the exact location o f a paper o f interest.
CONTENTS OF VOL.I
NATIONAL LABORATO RY ACTIVITIES
Dissémination en France des unités des grandeurs utilisées en métrologiedes rayonnements ionisants (IAEA-SM -222/49) ............................................ 3J.-P. Guiho, J.-P. SimoenDiscussion.................................................................................................................... 19
Etudes dosimétriques menées au LMRI dans le domaine des référencesprimaires et des procédures de transfert (IA E A -SM -222/37)....................... 21J.-P. SimoenDiscussion.................................................................................................................... 32
Current work in the field o f standardization in dosimetry o f photons andelectrons in the Federal Republic o f Germany (IAEA-SM -222/32) .......... 33H. ReichDiscussion.................................................................................................................... 51
A primary standard for determination o f absorbed dose in water forX-rays generated at potentials o f 7.5 to 30 kV (IAEA-SM -222/30) .......... 53J. Bôhm, K. Hohlfeld, H. ReichDiscussion.................................................................................................................... 62
Traceability in ionizing radiation measurements systems(IA E A-SM -222/18) .................................................................................................. 65Lucy Cavallo, Margarete Ehrlich, J.M.R. HutchinsonDiscussion..........;......................................................................................................... 86
Dosimetry standards for industrial radiation processing(IAEA-SM -222/09) .................................................................................................. 89W.L. McLaughlinDiscussion.................................................................................................................... 104
Primary and secondary standards o f dosimetry: Calibration methodsin Hungary (IA E A -SM -222/63)............................................................................. 107K. ZsdánszkyDiscussion.................................................................................................................... 116
Standardization in radiation dosimetry in the United Kingdom(IAEA-SM -222/60) .................................................................................................. 119IV./1. JenningsDiscussion.................................................................................................................... 128
Activities o f the British Calibration Service in the radiological field(IAEA-SM -222/54) ........................................................... ...................................... 133M.J. RossiterDiscussion............................................................................................. ................................................ 138
Current work on dosimetry standards in Japan (IAEA-SM -222/26) .......... . 139Y. MoriuchiDiscussion.................................................................................................................... 157
Medical dosimetry standards programme o f the National Bureauo f Standards (IA E A -S M -222 /58 )......................................................................... 159R. LoevingerDiscussion................................................................................................................. . 173
Reference bank o f exoelectron dose meters (IAEA-SM -222/46) ................... 175R.B. Gammage, J.S. ChekaDiscussion.................................................................................................................... 184
SECONDARY STANDARD DOSIMETRY LABORATORY ACTIVITIES
The Secondary Standard Dosimetry Laboratory - a necessary link inthe dissemination chain (IA E A -S M -222 /53).................................................... 189H. W. Julius, G. van der LugtDiscussion.................................................................... .............................................. 192
Evaluation o f the need for radiotherapy calibrations in the United Stateso f America (I AEA-SM -222/1 3 )............................................................................. 193L.H. Lanzl, M. R ozenfeldDiscussion.................................................................................................................... 197
The Austrian Dosimetry Laboratory: A national standard and routinecalibration centre (IAEA-SM -222/23) ............................................................... 199K.E. DuftschmidDiscussion.................................................................................................................... 211
Exposure intercomparison with ionization chambers — based on threeintercompared check sources (IA E A -SM -222/36)........................................... 213P. Nette, Dagmar Reis, H. Eckerl, G. Drexler, P. PychlauDiscussion.................................................................................................................... 218
The Regional Calibration Laboratory at the M.D. Anderson Hospital(IAEA-SM -222/34) .................................................................................................. 219L.J. Humphries, R.J. Shalek
Primary dosimetric standards at the Memorial Sloan-Kettering CancerCenter (IAEA-SM -222/12) .................................................................................... 229J.G. Holt, J.C. McDonald, A. B u ff a, D. Perry, I. Ma, J.S. Laughlin Discussion.................................................................................................................... 239
The organization and operation o f the Regional Calibration Laboratoryat Victoreen, Cleveland (IA E A -SM -222/61)...................................................... 241W.E. SimonDiscussion...............................................:................................................................... 250
The role o f the secondary standards dosimetry laboratory in a nuclearpower utility (IAEA-SM -222/25) ........................................................................ 251R. W. Clarke, IM . G. ThompsonDiscussion.................................................................................................. !................. 262
Organization o f a Secondary Standard Dosimetry Laboratory for theIndian region (IA E A -S M -222/28)........................................................................ 265G. Subrahmanian, I. S. Sundararao
Evaluation o f dosimetric accuracy and uniformity for 60Co radiationtherapy (IA E A -SM -222/29).............................................................. .................... 273
, I S. Sundararao, S.B. Naik, K.D. Pushpangadan, R. Vadiwala,G. Subrahmanian
INTERNATIONAL DOSIMETRY ACTIVITIES
The role o f ICRU in international radiation standards (IAEA-SM -222/64)... 283H.O. W yck offDiscussion.................................................................................................................... 289
Implications o f dosimetry intercomparisons for standardization in neutron dosimetry for biological and medical applications(IAEA-SM -222/65) .................................................................................................. 291J.J. Broerse, G. Burger, M. CoppolaDiscussion.................................................................................................................... 303
The need for repeated intercomparisons and standardization o f X-ray dosimetry for the co-ordination o f late-effects research in Europe(IAEA-SM -222/70) .......... .•..................................................... ................................ 305J. Zoetelief, J.J. Broerse, K.J. PuiteDiscussion.................................................................................................................... 316
Evaluation o f the 1977 IAEA pilot study o f postal dose intercomparison(TLD) for orthovoltage X-ray therapy (IAEA-SM -222/68) ........................ 319B.E.Bjàrngard, B.-I.Rudén, H.H.Eisenlohr, R .Girzikowsky, J.HaiderDiscussion.................................................................................................................... 333
Dosimetric primary and secondary standardization within the EuropeanCommunities (IAEA-SM -222/62) ........................................................................ 335M. Oberhofer
STANDARDIZATION AND CALIBRATION IN RADIOPROTECTION
International standard reference radiations and their application to thetype testing o f dosimetric apparatus (IAEA-SM -222/24) ............................ 343I.M.G. ThompsonDiscussion.................................................................................................................... 365
NBS standard reference neutron fields for personnel dosimetry calibration(IAEA-SM -222/07) .................................................................................................. 367R.B. Schwartz, J. A. GrundlDiscussion.................................................................................................................... 375
The calibration procedures in the Studsvik standardized personneldosimetry system (IAEA-SM -222/55) ............................................................... 377C.-O. WidellDiscussion.................................................................................................................... 383
Calibration o f ionizing radiation within the Division o f RadiationProtection o f CNEN, Italy (IA E A -SM -222/56)................................................ 385G. Busuoli, R.F. Laitano, L. Lembo, E. Rotondi
Calibration o f personnel dose meters (IA E A -SM -222/04)................................. 399E. Storm, J.R. Cortez, G.J. LittlejohnDiscussion................................................................................................................... 410
Radiation protection instrumentation test and calibration(IAEA-SM -222/06) .................................................................................................. 413J.M. Selby, H. V. Larson, W.T. Bartlett, O.R. Mulhern, D.M. FlemingDiscussion.................................................................................................................... 418
Criteria for testing personnel dosimetry performance in the UnitedStates o f America (IAEA-SM -222/16) ............................................................... 419Margarete EhrlichDiscussion..... .............................................................................................................. 420
Problèmes d ’étalonnage en matière de dosimétrie appliquée à laradioprotection auprès des centrales nucléaires (IAEA-SM -222/39) ......... 421L. Fitoussi, R. GaulardDiscussion.................................................................................................................... 437
Etalonnage en photons des instruments de radioprotection dans un servicede métrologie habilité (IA E A -SM -222/40)............................................ ............ 439J. Giroux, A. Haddad, Yvonne Herbaut, J.B■ Leroux, J. RouillonDiscussion.................................................................................................................... 452
Physical requirements for measurement o f radiation dose and their relationship to personnel dose meter design and use(IAEA-SM -222/17) .................................................................................................. 453G.E. Chabot Jr., M.A. Jimenez, K.W. SkrableDiscussion........................................................................ ........................................... 463
Use o f a phantom in personnel dosimetry photon calibrations(IA E A-SM -222/19) .................................................................................................. 465W. T. Bartlett, J.P. Holland, C.D. Hooker, O.R. Mulhern, D M . FlemingDiscussion.................................................................................................................... 473
Instrument calibrations for environmental surveillance(IAEA-SM -222/10) ............................. .................................................................... 475J.E. McLaughlinDiscussion.................................................................................................................... 489
Personnel dosimetry intercomparison studies at the ORNL HealthPhysics Research Reactor (IA E A -SM -222/45)................................................. 491H. W. Dickson, L. W. GilleyDiscussion.................................................................................................................... 508
Dosimétrie de sources /3 ponctuelles au moyen d ’une chambre à cavité variable: application à l’ étude de la réponse des instruments deradioprotection (IAEA-SM -222/38) ................................................................... 51 1J. Giroux, A. Haddad, Yvonne Herbaut, J.B. Leroux, J. RouillonDiscussion.................................................................................................................... 526
Accuracy and precision in calibration o f low-level radiation monitors(IAEA-SM -222/50) .................................. .............................................................. 527J.G. Ackers
Chairmen and Co-chairmen o f Sessions................................................................... 533Secretariat o f the Symposium ....................................................... ........................... 534

NATIONAL LABORATORY ACTIVITIES

IAEA-SM-222/49
DISSEMINATION EN FRANCEDES UNITES DES GRANDEURS UTILISEESEN METROLOGIE DES RAYONNEMENTS IONISANTSJ.-P. GUIHO*, J.-P. SIMOEN**CEA, Centre d ’études nucléaires de Saclay,Gif-sur-Yvette,France
Abstract-Résumé
THE DISSEMINATION IN FRANCE OF THE UNITS USED IN IONIZING RADIATION METROLOGY.
After reviewing the system of metrology in France the authors describe the working of the ionizing radiation calibration chain. Emphasis is laid on the procedures used for the transfer o f the units of exposure and absorbed dose. Such transfers are carried out either by direct comparison with a standard kept at the calibration centre, or by special procedures involving the use o f transfer dose meters or o f radioactive sources calibrated and supplied by the primary laboratory or the calibration centre. An analysis o f the steps and o f the accumulation of errors is presented for each dosimetric quantity considered. The authors make a preliminary assessment o f the operation of the French ionizing radiation calibration chain.
DISSEMINATION EN FRANCE DES UNITES DES GRANDEURS UTILISEES EN METROLOGIE DES RAYONNEMENTS IONISANTS.
Après avoir rappelé la structure de la métrologie en France, les auteurs décrivent le fonctionnement de la chaîne d’étalonnage des rayonnements ionisants. L’accent est mis sur les procédures mises en oeuvre pour le transfert des unités des grandeurs, exposition et dose absorbée. Ces transferts s’effectuent soit par comparaison directe avec une référence détenue par le centre d’étalonnage, soit au moyen de procédures particulières basées sur l’emploi de dosimètres de transfert ou sur l’utilisation de sources radioactives étalonnées et délivrées par le laboratoire primaire ou le centre d’étalonnage. Une analyse des étapes et de l’accumulation des erreurs est présentée pour chacune des grandeurs dosimétriques considérées. Les auteurs dressent un premier bilan du fonctionnement de la chaîne française d’étalonnage des rayonnements ionisants.
1. STRUCTURE DE LA METROLOGIE EN FRANCE
1.1. Introduction
Le physicien oeuvrant dans un laboratoire d ’application des rayonnements ionisants se trouve confronté à un problème à deux niveaux.
* Laboratoire de contrôle des rayonnements ionisants.** Laboratoire de métrologie des rayonnements ionisants.
3
4 GUIHO et SIMOEN
Le premier concerne le choix d ’un détecteur qui doit être adapté à la mesure de la grandeur physique considérée, et se prêter à un étalonnage précis; il est également important qu ’ il soit d ’une utilisation pratique aisée, et fidèle et peu sensible aux grandeurs d ’influence telle l’énergie du rayonnement par exemple.
Le second niveau concerne le mode d ’obtention et de conservation de l’étalonnage du détecteur choisi. C’est ce dernier aspect que nous allons examiner.
Nous appellerons étalonnage l’ensemble des opérations ayant pour but d ’établir une relation entre l’ information délivrée par le détecteur et l’unité de la grandeur recherchée.
D’une façon tout à fait générale, on peut dire qu ’un facteur d ’étalonnage s’obtient en déterminant l’ erreur entre l’ indication fournie par l’ instrument et la valeur conventionnellement vraie de la grandeur recherchée.
Selon le mode d ’obtention de cette valeur vraie, deux voies sont possibles pour déterminer le facteur d ’ étalonnage:— la première consiste à comparer l’ instrument à la référence nationale directe
ment ou par l’ intermédiaire d ’une procédure de transfert (centre d ’ étalonnage ou instrument),
— la seconde consiste à le comparer à un instrument considéré comm e absolu.Cette seconde voie, qui a priori peut sembler la plus séduisante, n ’est
cependant pas celle qui offre le plus de garanties; elle exige, en outre, de gros investissements en temps et en équipements; on ne l’utilisera donc qu ’en dernier recours lorsqu’ il n’existe pas d ’étalon d ’usage pour la grandeur considérée.
La comparaison — même indirecte — avec une référence nationale validée par des intercomparaisons internationales présentera au contraire la sécurité la plus grande si les procédures et méthodes de transfert sont convenablement choisies.
En France, le Bureau national de métrologie (BNM) [1 ], qui coordonne les activités des laboratoires officiels, a depuis près de dix ans organisé des chaînes qui autorisent pour chaque grandeur la mise en oeuvre de ce dernier processus.
Les types de liaisons existant entre les différents maillons des chaînes d ’ étalonnage dépendent naturellement de la nature des références; cependant, chaque étape correspondant à un niveau d ’étalon et à un organe exécutif bien définis, il est possible de dégager le schéma général des chaînes d ’étalonnage en en distinguant les différents niveaux.
1.2. Schéma général des chaînes d’étalonnage
1.2.1. Le laboratoire primaire
Ce laboratoire remplit plusieurs fonctions:— il est pour un domaine défini le gardien des étalons nationaux; il en assure la
conservation et l’amélioration constante;
IAEA-SM-222/49 5
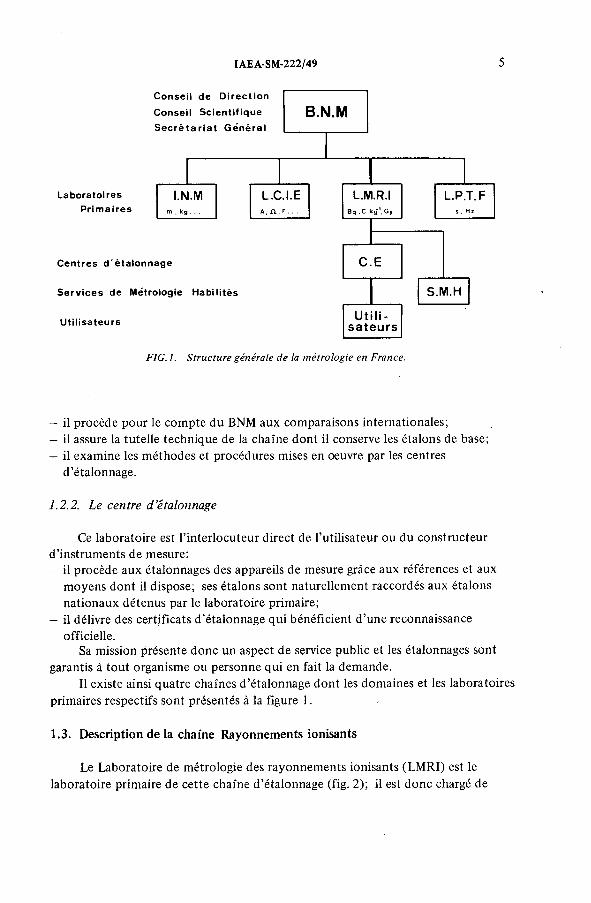
F IG . 1. S t r u c tu r e g é n é r a l e d e la m é t r o l o g i e e n F r a n ce .
— il procède pour le com pte du BNM aux comparaisons internationales;— il assure la tutelle technique de la chaîne dont il conserve les étalons de base;— il examine les méthodes et procédures mises en oeuvre par les centres
d ’étalonnage.
1.2.2. Le centre d ’étalonnage
Ce laboratoire est l’ interlocuteur direct de l’utilisateur ou du constructeur d ’instruments de mesure:— il procède aux étalonnages des appareils de mesure grâce aux références et aux
moyens dont il dispose; ses étalons sont naturellement raccordés aux étalons nationaux détenus par le laboratoire primaire;
— il délivre des certificats d ’étalonnage qui bénéficient d ’une reconnaissance officielle.
Sa mission présente donc un aspect de service public et les étalonnages sont garantis à tout organisme ou personne qui en fait la demande.
Il existe ainsi quatre chaînes d ’ étalonnage dont les domaines et les laboratoires primaires respectifs sont présentés à la figure 1 .
1.3. Description de la chaîne Rayonnements ionisants
Le Laboratoire de métrologie des rayonnements ionisants (LM RI) est le laboratoire primaire de cette chaîne d ’étalonnage (fig. 2 ); il est donc chargé de
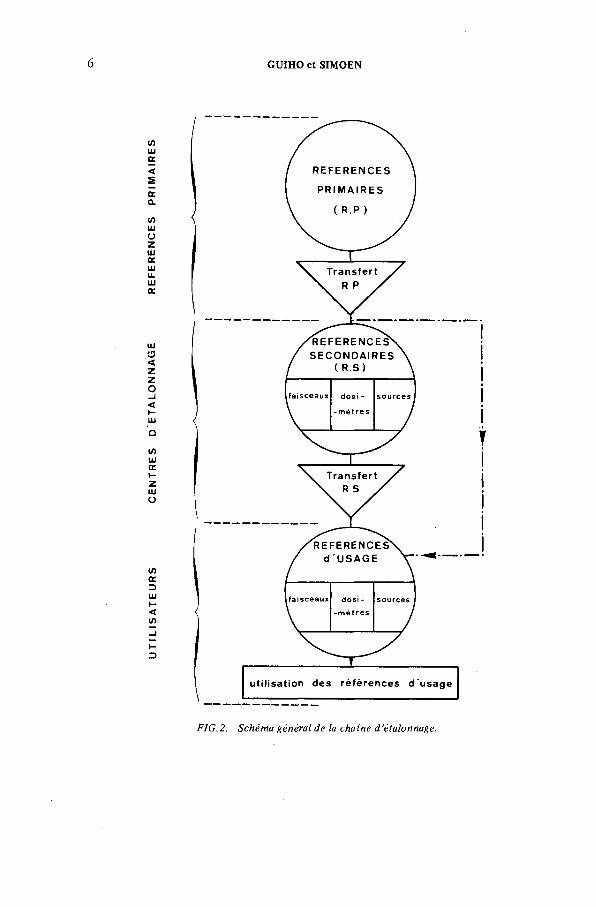
F I G .2 . S c h é m a g é n é r a l d e la c h a în e d ’é ta lo n n a g e .
IAEA-SM-222/49 7
définir, de conserver et de comparer des références primaires pour les rayonnements directement et indirectement ionisants [2 ].
Il doit également chercher à les améliorer; à ce titre, il est amené à entreprendre des études sur les constantes fondamentales — schémas de désintégration, périodes, Wgjj, G - qui permettent d ’améliorer soit la qualité des références primaires, soit le transfert de la connaissance à des références secondaires ou tertiaires.
Il assure la tutelle technique de la chaîne d ’étalonnage. Pour accomplir cette mission, il organise périodiquement des campagnes de contrôles auxquelles participent les laboratoires faisant partie de la chaîne Rayonnements ionisants.
Sauf cas particulier, l’ utilisateur a pour interlocuteur l’un des deux centres d ’étalonnage suivants, aux activités distinctes:— le Laboratoire central des industries électriques (LCIE) à Fontenay-aux-Roses,
s’occupant plus particulièrement de la grandeur exposition pour des faisceaux de tubes radiogènes;
— le Laboratoire de contrôle des rayonnements ionisants (LCRI) implanté sur le Centre d ’études nucléaires de Saclay, concerné par les mesures d ’activité et de spectrométrie et, pour le domaine de la dosimétrie, par les grandeurs exposition et dose absorbée.
Cette description générale étant achevée, nous allons maintenant examiner pour les grandeurs dosimétriques les références et les méthodes de transfert.
2. REFERENCES PRIMAIRES
2.1. Problème d u choix
Avant de décrire les références primaires, il nous semble important de faire observer que le choix de la nature d ’un étalon national ne constitue pas un problème simple. Nous savons en effet qu ’il n’existe pas de concept officiel pour définir ce que doit être un étalon primaire. On peut toutefois considérer qu ’ il possède un certain nombre de qualités, en particulier être exact, universel, immuable et transférable.
— L'exactitude devra bien entendu être optimale. Il est à cet égard souhaitable, pour l’étalon primaire, qu’elle soit d ’un ordre de grandeur meilleure que celle nécessaire aux utilisateurs, et ceci en raison de l’accumulation des erreurs au cours des transferts successifs.
— L ’universalité est un ob jectif à atteindre; en se plaçant sur un plan de coordination et d ’harmonisation des mesures, il est séduisant de chercher à disposer d ’un étalon primaire unique par unité; toutefois, en raison de la variété de nature et d ’énergie des rayonnements ionisants, de la dynamique des domaines de mesure, il semble vain d ’espérer atteindre ce but.
8 GUIHO et SÍMOEN
— L ’immuabilitè est un critère fondamental pour un étalon, encore faut-il s’ entendre sur la signification à donner à ce terme; eu égard à l’évolution permanente de la science, rien n’est immuable, il suffit pour s’en convaincre d ’examiner l’évolution historique des étalons primaires de longueurs; c ’ est pourquoi il semble plus raisonnable de substituer à la notion d ’ immuabilité celle de pérennité satisfaisante.
— Le problème du transfert de l’étalon primaire aux étalons secondaires, puis aux instruments d ’usage, peut sembler a priori moins important que les précédents car, somme toute, le transfert se trouve en aval de l’ étalon primaire et peut être traité de manière quasi indépendante; à notre sens, au contraire, le problème du transfert est fondamental, et toute démarche conduisant à la conception d ’un étalon doit impérativement tenir com pte des possibilités des méthodes de transfert existantes ou concevables.
A partir de ces considérations générales et, comm e il n’ est pas possible d’ envisager, quelles que soient la nature et l’ énergie des rayonnements, une référence unique, il est nécessaire de réaliser pour chacun des domaines la référence qui répond le mieux aux qualités que nous venons d ’examiner.
Pour chacune des grandeurs propres à la métrologie de rayonnements ionisants, il est possible dans certains cas d ’envisager com m e référence soit un détecteur approprié, soit un faisceau de rayonnement issu d ’une source radioactive convenablement choisie.
Lorsque cette alternative existe, le faisceau présente, comparativement à un détecteur, des avantages notables; il permet en effet:— d ’améliorer, au fil du temps, la qualité m étrologique de la référence, par une
multiplication du nombre de détecteurs et par l’ emploi de techniques plus performantes;
— d ’établir des relations entre les diverses façons de décrire un même champ de rayonnements.
Nous allons maintenant présenter les références primaires réalisées en France pour les unités des grandeurs exposition et dose absorbée.
2.2. Cas de l’exposition
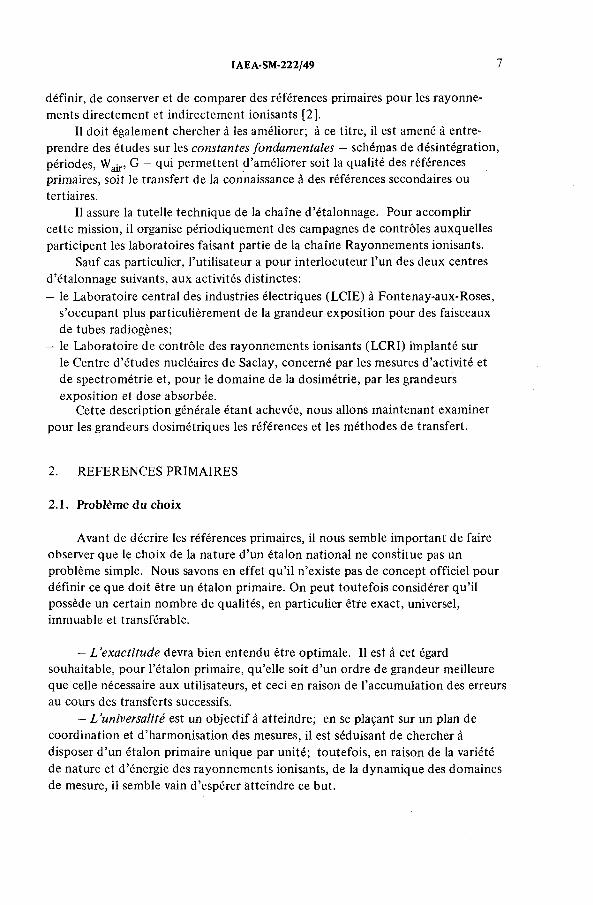
Les références retenues sont des faisceaux de photons [3] ayant pour origine des sources radioactives (fig. 3):
- au cobalt-60; I nominale: 1,25 MeV
- au césium-137; Enomjnaie : 0,662 MeV
- à l’américium-241; Е д о т ^ ^ : 0,059 MeV.
IAEA-SM-222/49 9
RE FE REN C ES PR IMA IRES IN S T R U M E N T S
r . 2 4 1 AFaisceau Am
Faisceaux 137 Cs
6 0
Faisceaux Со
Chambre à parois d 'a ir
Chambre à cavité en graphite
Chambre à cavité en graphite
F I G .3 . R é f é r e n c e s p r im a ir e s d e l ’u n i t é d ’e x p o s i t i o n ( C ' k g l ).
Pour chacun de ces faisceaux nous avons cherché à minimiser la déformation spectrale en choisissant de façon judicieuse:-— les dimensions des sources de rayonnement— les caractéristiques des ensembles de collimation— la nature de l’ environnement.
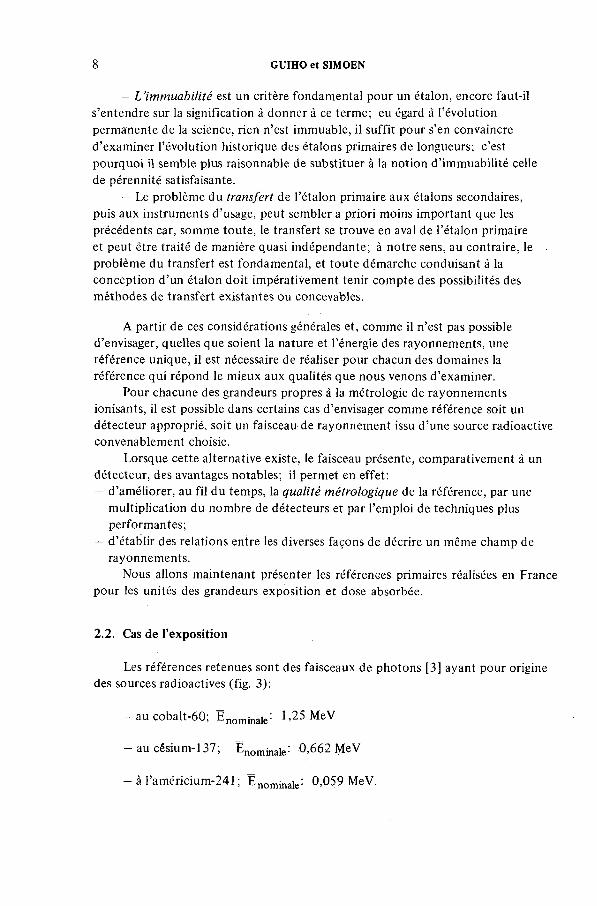
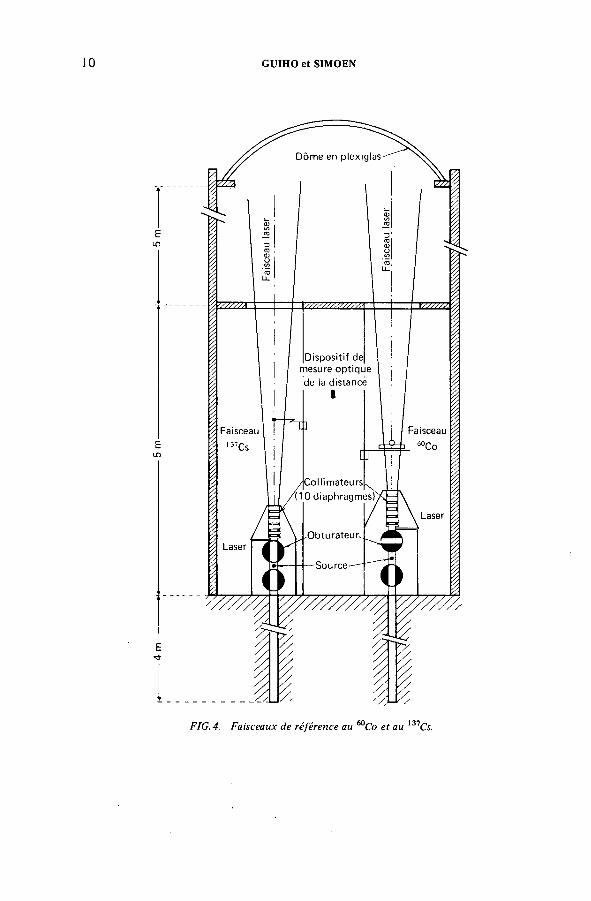
La figure 4 nous donne une vue schématique des faisceaux de référence au 60Co et au 137Cs.
La salle, d ’une hauteur de dix mètres, a un toit constitué d ’une double coupole en plexiglas, ceci dans le but de réduire le nombre de photons rétrodiffusés; dans le même esprit, des puits de cinq mètres de profondeur ont été pratiqués à l’arrière des enceintes de protection.
Les collimateurs sont des cônes ayant les sources pour sommet; leur longeur est de 500 mm. Ils sont composés de dix disques en alliage de tungstène de 15 mm d ’épaisseur chacun.
Des lasers matérialisant l’axe des faisceaux et un système optique permettent de positionner les détecteurs avec une incertitude de l’ordre de ± 1 mm.
Du choix des faisceaux pour références, il résulte que nous avons pu mettre en œuvre plusieurs détecteurs ayant tous des caractéristiques différentes et ainsi nous affranchir d ’éventuelles causes d ’erreurs systématiques. Indiquons, à titre d ’exemple, qu’une quinzaine de chambres à cavité, à parois de graphite, de forme géométrique, volume, épaisseur de paroi différents ont été utilisées pour caractériser en unité d ’exposition le faisceau au cobalt-60 [4].
Les exactitudes sur les références primaires d ’exposition varient de 0,7 à 1% selon les faisceaux. Les incertitudes aléatoires sont estimées pour une probabilité de 0,997, les incertitudes systématiques sont combinées quadratiquement.
2.3. Cas de la dose absorbée
Pour la plupart des applications l’effet du rayonnement est directement lié au dépôt d ’énergie dans le milieu irradié, et par conséquent à la dose absorbée
GUIHO et SIMOEN
F I G .4 . F a is c e a u x d e r é f é r e n c e a u С о e t a u Cs.
,....................................................................................................................7/.
.....................Л:,.
, .
....................................................................................................... t
IAEA-SM-222/49 11
dans ce milieu; on perçoit donc la nécessité de proposer des moyens d ’étalonnage dans ce domaine.
La réalisation d ’étalons de l’unité de dose se heurte toutefois à divers problèmes, tant au plan des conditions de réalisation de cette unité qu ’à celui des techniques de mesure à mettre en œuvre.
Plusieurs techniques permettent en effet la mesure de la dose en exploitant les divers phénomènes physiques induits par les rayonnements dans la matière; les principales sont la calorimétrie, Vionométrie, la dosimëtrie chimique.
Notons cependant que la calorimétrie est la seule méthode de mesure fondamentale puisque, dans un milieu convenable, l’information recueillie est reliée au dépôt d ’énergie sans qu ’il soit nécessaire, comm e pour l’ ionométrie et la dosimétrie chimique, de faire intervenir une constante radiométrologique telle que W ou G.
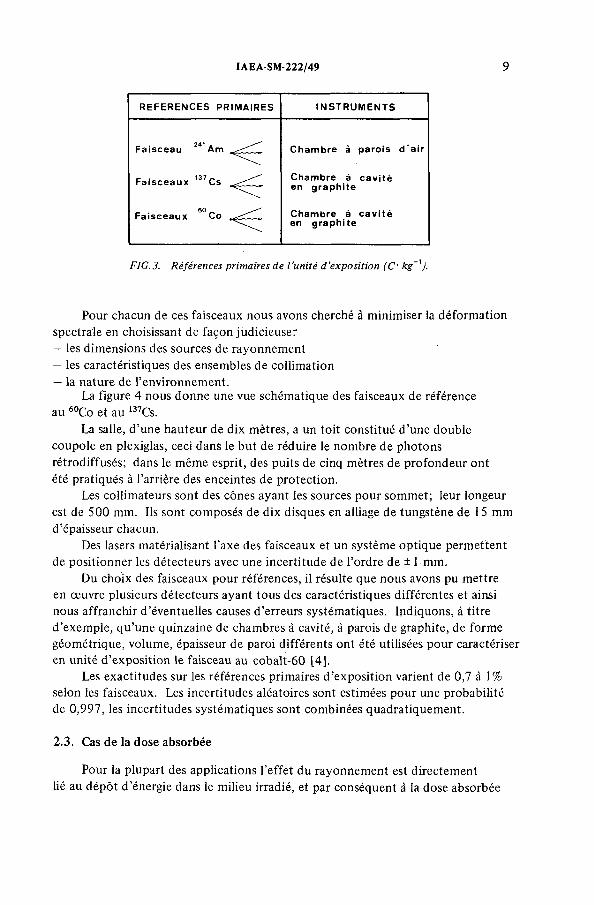
Le LMRI a donc développé depuis maintenant plus de cinq ans [5] la technique calorimétrique et cherché à la mettre en œuvre pour la réalisation des références françaises de l’unité de dose (fig. 5).
2.3.1. Cas des photons de faible énergie
Dans ce domaine, il n’existe pas de références de l’unité de dose; toutefois, à la demande d ’un utilisateur, il est possible de déduire de l’étalon d ’exposition une valeur de référence en terme de kerma dans l’ air, de dose standard, ...
Naturellement, les conditions de définition de telles valeurs de référence sont susceptibles d ’évoluer, notamment en raison des travaux de commissions, tels ceux abordés au sein du Comité international des poids et mesures.
2.3.2. Cas des photons d ’énergie m oyenne
Les faisceaux au 60Co et au I37Cs décrits précédemment ont également été caractérisés en dose absorbée dans un milieu et des conditions géométriques bien définis. Puisque cela est possible dans ce domaine, la technique calorimétrique a bien évidemment été choisie; le calorimètre utilisé, de type quasi adiabatique, est de forme cylindrique, de diamètre 28 mm et de hauteur 15 mm [4, 5].
Pour des raisons tant physiques (problème du défaut de chaleur) que dosi- métriques, le milieu retenu est un graphite de grande pureté et de masse volu- rrlique égale à 1,69 g • cm -3. Le point de référence est le centre de l’absorbeur, la masse surfacique en amont et en aval de ce point est de 0,940 g • cm ’ 2.
Pour les conditions de définition, ces références ont pour ordre de grandeur des débits de quelques mGy • s-1. Les exactitudes sont de l’ordre de 1 %, les incertitudes aléatoires étant estimées pour une probabilité de 0,997 et les incertitudes systématiques étant combinées quadratiquement.
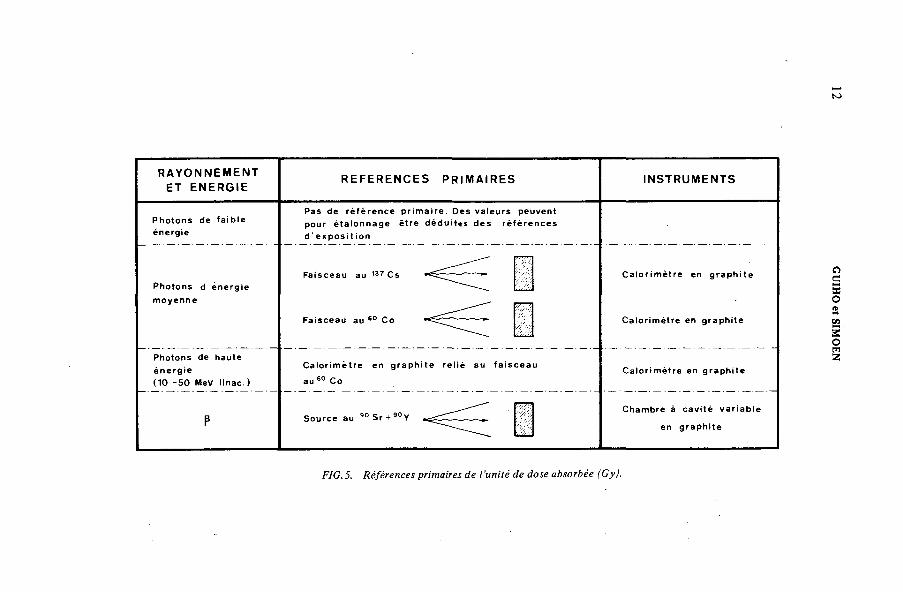
FIG.5. Références primaires de l ’unité de dose absorbée (Gy}.
IAEA-SM-222/49 13
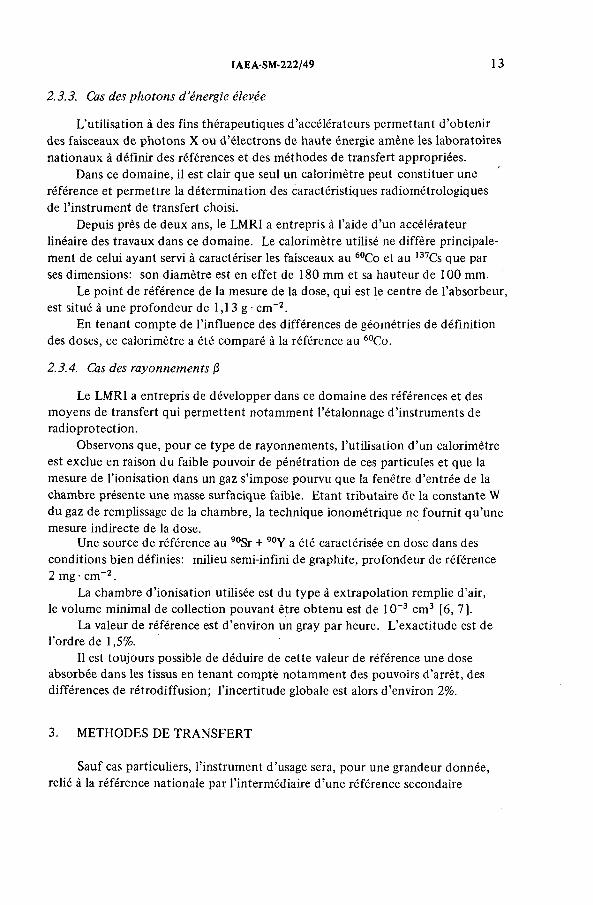
2.3.3. Cas des photons d ’énergie élevée
L’utilisation à des fins thérapeutiques d ’accélérateurs permettant d ’obtenir des faisceaux de photons X ou d ’électrons de haute énergie amène les laboratoires nationaux à définir des références et des méthodes de transfert appropriées.
Dans ce domaine, il est clair que seul un calorimètre peut constituer une référence et permettre la détermination des caractéristiques radiométrologiques de l’ instrument de transfert choisi.
Depuis près de deux ans, le LMRI a entrepris à l’aide d ’un accélérateur linéaire des travaux dans ce domaine. Le calorimètre utilisé ne diffère principalement de celui ayant servi à caractériser les faisceaux au 60Co et au 137Cs que par ses dimensions: son diamètre est en effet de 180 mm et sa hauteur de 100 mm.
Le point de référence de la mesure de la dose, qui est le centre de l’absorbeur, est situé à une profondeur de 1,13 g- cm -2 .
En tenant com pte de l’ influence des différences de géométries de définition des doses, ce calorimètre a été comparé à la référence au 60Co.
2.3.4. Cas des rayonnements fi
Le LMRI a entrepris de développer dans ce domaine des références et des moyens de transfert qui permettent notamment l’étalonnage d ’instruments de radioprotection.
Observons que, pour ce type de rayonnements, l’utilisation d ’un calorimètre est exclue en raison du faible pouvoir de pénétration de ces particules et que la mesure de l’ ionisation dans un gaz s’ impose pourvu que la fenêtre d ’ entrée de la chambre présente une masse surfacique faible. Etant tributaire de la constante W du gaz de remplissage de la chambre, la technique ionométrique ne fournit qu ’une mesure indirecte de la dose.
Une source de référence au 90Sr + 90Y a été caractérisée en dose dans des conditions bien définies: milieu semi-infini de graphite, profondeur de référence 2 mg • cm -2 .
La chambre d ’ionisation utilisée est du type à extrapolation remplie d ’air, le volume minimal de collection pouvant être obtenu est de 10~3 cm 3 [6 , 7].
La valeur de référence est d ’environ un gray par heure. L’exactitude est de l’ordre de 1,5%.
Il est toujours possible de déduire de cette valeur de référence une dose absorbée dans les tissus en tenant com pte notamment des pouvoirs d ’arrêt, des différences de rétrodiffusion; l’incertitude globale est alors d ’environ 2%.
3. METHODES DE TRANSFERT
Sauf cas particuliers, l’ instrument d ’usage sera, pour une grandeur donnée, relié à la référence nationale par l’intermédiaire d ’une référence secondaire
14 GUIHO et SIMOEN
détenue par l’un des deux centres d ’étalonnage. Ceux-ci sont naturellement raccordés au laboratoire primaire, par étalonnage de leurs instruments, sources ou faisceaux, de référence (fig. 2 ).
3.1. Transfert de l’unité d’exposition
Dans ce domaine, les possibilités offertes à l’utilisateur par les centres d ’étalonnage couvrent une large gamme d ’énergie, puisque les dosimètres peuvent être étalonnés: dans des faisceaux de photons y , au 60Co, au 137Cs et au 241 Am; dans des faisceaux de photons X de tubes radiogènes, d ’énergies maximales comprises entre 60 et 200 keV et de filtrations normalisées.
Par ailleurs, et pour le domaine particulier de la radioprotection, sont organisées régulièrement des campagnes de comparaison au cours desquelles les participants ont à caractériser en débit d ’exposition, dans des conditions spécifiées, des sources radioactives (60Co, 137Cs, 241 Am ); les résultats sont comparés aux valeurs de références du LMRI.
Chaque participant a ainsi la possibilité:— de réajuster la valeur du coefficient d ’étalonnage de son appareil;— de procéder, en collaboration avec le laboratoire primaire, à un examen critique
des sources d ’erreurs; l’analyse des résultats de telles comparaisons montrant en effet que les incertitudes revendiquées ne sont pas toujours compatibles avec les écarts constatés, qui se situent dans une fourchette d ’environ ± 6%.
3.2. Transfert de l’unité de dose absorbée
Faisant suite à la réalisation de références primaires, nos efforts ont porté tout naturellement sur la définition de moyens de transfert de l’unité de dose.
Nous examinerons successivement les procédures mises en oeuvre et dresserons un premier bilan des résultats.
3.2.1. Cas des photons et des électrons
Pour les photons y issus de sources au 137Cs et au 60Co, et pour les photons X et les électrons d ’ énergie supérieure à 10 MeV, la procédure mise en œuvre permet l’étalonnage des dosimètres d ’usage en dose absorbée dans l’ eau. Le dosimètre de transfert utilisé est le dosimètre au sulfate ferreux dont les caractéristiques ont été précisées par ailleurs [8 , 9].
Les opérations d ’étalonnage s’effectuent dans les propres faisceaux des utilisateurs, dans des conditions aussi voisines que possible des conditions habituelles d ’utilisation; le dosimètre à étalonner et des dosimètres de transfert sont successivement irradiés dans des conditions strictement identiques, c ’est-à-dire sous un même environnement et mêmes caractéristiques du faisceau.
IAEA-SM-222/49
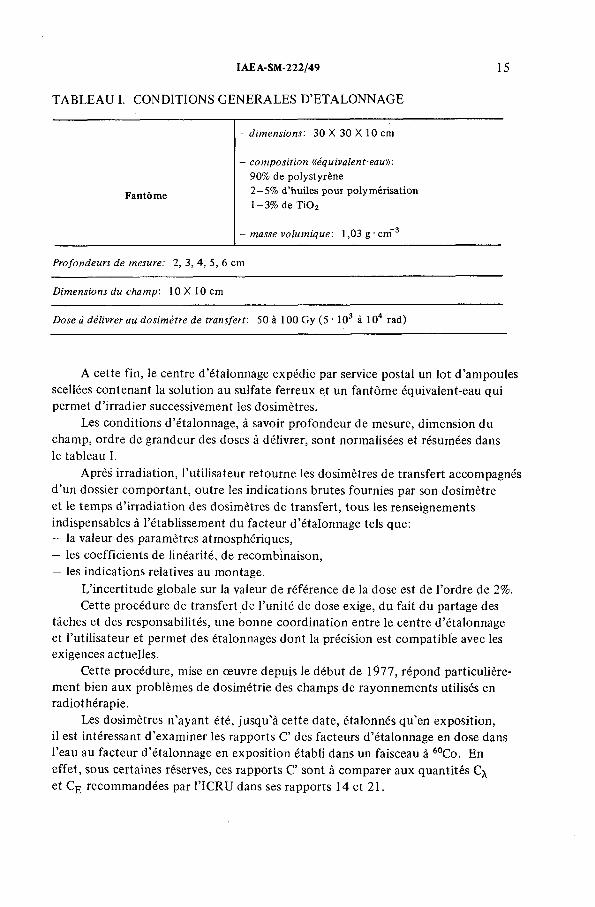
TABLEAU I. CONDITIONS GENERALES D’ETALONNAGE
15
- dimensions: 30 X 30 X 10 cm
- composition «équivalent-eau»:90% de polystyrène
Fantôme 2-5% d’huiles pour polymérisation1-3% de ТЮ2
- masse volumique'. 1,03 g ■ cm-3
Profondeurs de mesure: 2, 3, 4, 5, 6 cm
Dimensions du champ'. 10X 10 cm
Dose à délivrer au dosimètre de transfert: 50 à 100 Gy (5 ■ 103 à 104 rad)
A cette fin, le centre d ’étalonnage expédie par service postal un lot d ’ampoules scellées contenant la solution au sulfate ferreux et un fantôme équivalent-eau qui permet d ’irradier successivement les dosimètres.
Les conditions d ’étalonnage, à savoir profondeur de mesure, dimension du champ, ordre de grandeur des doses à délivrer, sont normalisées et résumées dans le tableau I.
Après irradiation, l’utilisateur retourne les dosimètres de transfert accompagnés d ’un dossier comportant, outre les indications brutes fournies par son dosimètre et le temps d ’irradiation des dosimètres de transfert, tous les renseignements indispensables à l’ établissement du facteur d ’étalonnage tels que:— la valeur des paramètres atmosphériques,— les coefficients de linéarité, de recombinaison,— les indications relatives au montage.
L’incertitude globale sur la valeur de référence de la dose est de l’ordre de 2%.Cette procédure de transfert de l’unité de dose exige, du fait du partage des
tâches et des responsabilités, une bonne coordination entre le centre d ’étalonnage et l’utilisateur et permet des étalonnages dont la précision est compatible avec les exigences actuelles.
Cette procédure, mise en œuvre depuis le début de 1977, répond particulièrement bien aux problèmes de dosimétrie des champs de rayonnements utilisés en radiothérapie.
Les dosimètres n’ayant été, jusqu’à cette date, étalonnés qu ’en exposition, il est intéressant d ’examiner les rapports C’ des facteurs d ’ étalonnage en dose dans l’eau au facteur d ’étalonnage en exposition établi dans un faisceau à 60Co. En effet, sous certaines réserves, ces rapports C’ sont à comparer aux quantités C^ et Ce recommandées par l’ICRU dans ses rapports 14 et 21.
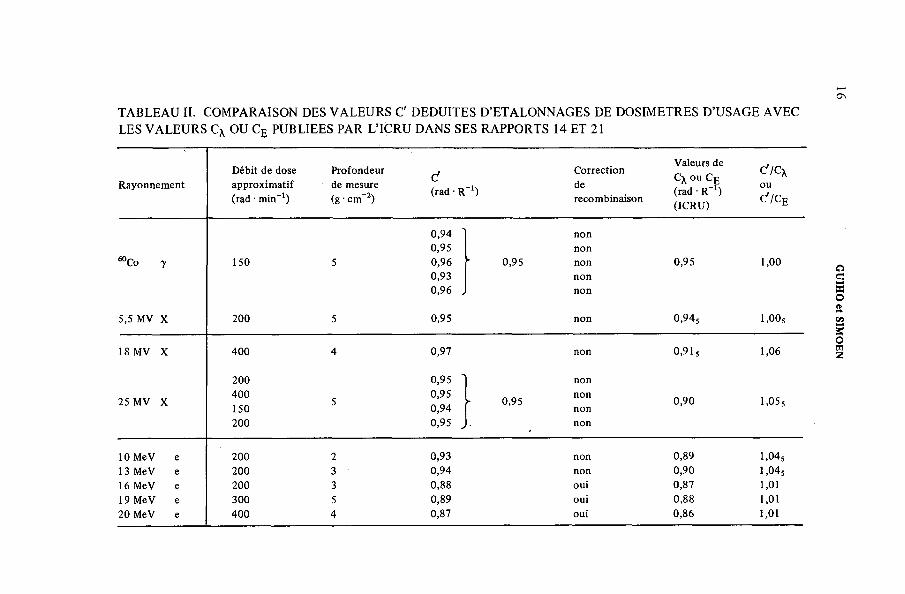
TABLEAU II. COMPARAISON DES VALEURS C' DEDUITES D’ETALONNAGES DE DOSIMETRES D’USAGE AVEC LES VALEURS Cx OU CE PUBLIEES PAR L’ ICRU DANS SES RAPPORTS 14 ET 21
RayonnementDébit de dose approximatif (rad ■ min"1)
Profondeur de mesure (g • cm"2)
d(rad • R- 1)
Correctionderecombinaison
Valeurs de Cx ou Cp(rad-R "1)(ICRU)
cV cxOUo' / се
0,94 non0,95 non
“ Со y 150 5 0,96 ■ 0,95 non 0,95 1,000,93 non0,96 . non
5,5 MV X 200 5 0,95 non 0,945 1,00S
18 MV X 400 4 0,97 non 0,91 s 1,06
200 0,95 ^ non400 0,95 non
25 MV X 5 » 0,95 0,90 1,05;150 0,94 non200 0,95 - non
10 MeV e 200 2 0,93 non 0,89 1,04 s13 MeV e 200 3 ■ 0,94 non 0,90 1,04;16 MeV e 200 3 0,88 oui 0,87 1,0119 MeV e 300 5 0,89 oui 0,88 1,0120 MeV e 400 4 0,87 oui 0,86 1,01
GUIH
O
et SIM
OE
N
IAEA-SM-222/49 17
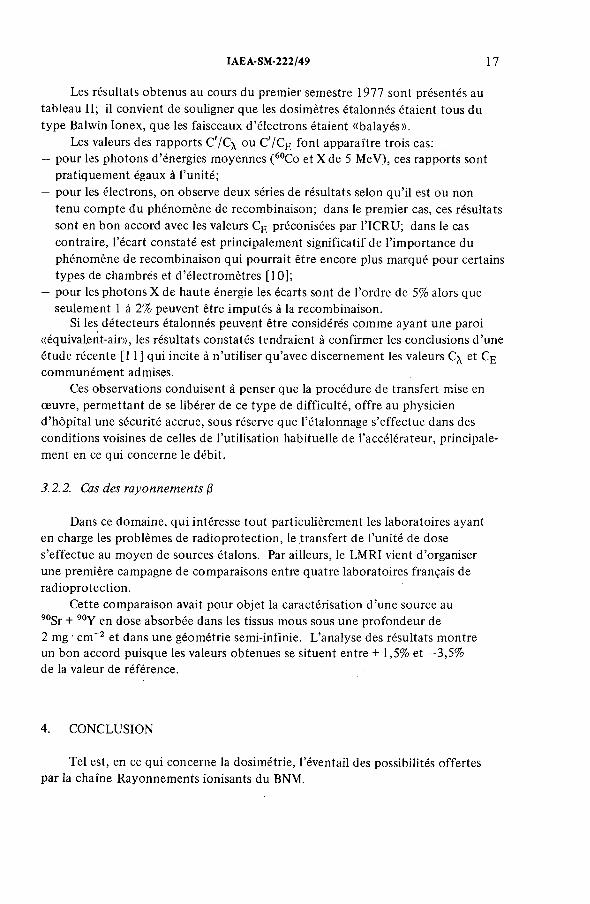
Les résultats obtenus au cours du premier semestre 1977 sont présentés au tableau II; il convient de souligner que les dosimètres étalonnés étaient tous du type Balwin Ionex, que les faisceaux d ’électrons étaient «balayés».
Les valeurs des rapports C'/C^ ou C '/C E font apparaître trois cas:— pour les photons d ’énergies moyennes (60Co et X de 5 MeV), ces rapports sont
pratiquement égaux à l’unité;— pour les électrons, on observe deux séries de résultats selon qu ’il est ou non
tenu com pte du phénomène de recombinaison; dans le premier cas, ces résultats sont en bon accord avec les valeurs Cg préconisées par l’ ICRU; dans le cas contraire, l’écart constaté est principalement significatif de l’ importance du phénomène de recombinaison qui pourrait être encore plus marqué pour certains types de chambres et d ’électromètres [ 10 ];
— pour les photons X de haute énergie les écarts sont de l’ordre de 5% alors que seulement 1 à 2% peuvent être imputés à la recombinaison.
Si les détecteurs étalonnés peuvent être considérés cpmme ayant une paroi «équivalent-air», les résultats constatés tendraient à confirmer les conclusions d ’une étude récente [11] qui incite à n ’utiliser qu ’avec discernement les valeurs C\ et Cj. communément admises.
Ces observations conduisent à penser que la procédure de transfert mise en œuvre, permettant de se libérer de ce type de difficulté, offre au physicien d ’hôpital une sécurité accrue, sous réserve que l’étalonnage s’ effectue dans des conditions voisines de celles de l’utilisation habituelle de l’accélérateur, principalement en ce qui concerne le débit.
3.2.2. Cas des rayonnements /3
Dans ce domaine, qui intéresse tout particulièrement les laboratoires ayant en charge les problèmes de radioprotection, le transfert de l’unité de dose s’effectue au moyen de sources étalons. Par ailleurs, le LMRI vient d ’organiser une première campagne de comparaisons entre quatre laboratoires français de radioprotection.
Cette comparaison avait pour objet la caractérisation d ’une source au 9°Sr + 90y en ,jose absorbée dans les tissus mous sous une profondeur de 2 mg • cm " 2 et dans une géométrie semi-infinie. L’analyse des résultats montre un bon accord puisque les valeurs obtenues se situent entre + 1,5% et —3,5% de la valeur de référence.
4. CONCLUSION
Tel est, en ce qui concerne la dosimétrie, l ’éventail des possibilités offertes par la chaîne Rayonnements ionisants du BNM.
18 GUIHO et SIMOEN
On retiendra que les techniques et procédures de transfert préconisées (fig.2) couvrent une grande partie des besoins et permettent d ’obtenir, au niveau des applications, des exactitudes compatibles avec les exigences formulées par les utilisateurs.
Ceci est particulièrement vrai dans le domaine de la radiothérapie où les laboratoires officiels, laboratoire primaire et centre d ’étalonnage, proposent pour les photons et les électrons des étalonnages en dose absorbée dans l’eau qui sont directement utilisables sans qu ’il y ait lieu de faire intervenir des termes complémentaires résultant d ’un changement de grandeur ou de milieu. Pour le domaine de la radioprotection et avant l’abandon des étalonnages en exposition, il convient que les conditions de références — géométrie, profondeur, milieu — dans lesquelles la dose doit être mesurée soient clairement définies et adoptées au plan international.
Par ailleurs il reste évident que des efforts particuliers devront être consentis par le LMRI pour, d ’une part, mener à bien les études en cours dans le domaine de la métrologie des champs de photons et d ’ électrons de haute énergie et, d ’autre part, entreprendre de nouvelles études pour la dosimétrie des champs de neutrons, des ions lourds, etc., qui présentent un intérêt au plan des applications mais demeurent encore des domaines peu explorés de la métrologie; là encore s’avère nécessaire une concertation entre les laboratoires nationaux pour définir et adopter les conditions de réalisation d ’étalons.
REFERENCES
[1] GRINBERG, B., Le Bureau National de Métrologie, Bull. Inf. Sci. Tech. CEA 163 (1971) 7.[2] GUIHO, J.P., Le GALLIC, Y., Conception et utilisation des références primaires en
dosimétrie, Bull. Inf. Bur. Natl. Métrol. 17 (1974) 15.[3] GUIHO, J.P., Faisceaux primaires de référence photoniques, Bull. Inf. Sci. Tech. CEA
163(1971) 33.[4] GUIHO, J.P., et al., Description et caractérisation en exposition, dose absorbée et fluence
différentielle en énergie des faisceaux de photons constituant les références primaires nationales, Rapport CEA-R-4643 (1974).
[5] SIMOEN, J.P., OSTROWSKY, A., GUIHO, J.P., «Emploi de la calorimétrie comme méthode de mesure fondamentale de la dose absorbée», XVe Réunion de la Société des physiciens des hôpitaux d’expression française, Caen (1976).
[6] HILLION, P., SIMOEN, J.P., GUIHO, J.P., «Détermination de la dose absorbée béta à l’aide d’une chambre à cavité variable», Actes VIIIe Congrès Int. de la Société française de radioprotection, Saclay ( 1976).
[7] HILLION, P., Contribution à la mesure de la dose absorbée (3, Rapport CEA-R-4790 (1976).[8] GUIHO, J.P., SIMOEN, J.P., «Contribution à la connaissance des constantes fondamentales
W et G intervenant dans les mesures de dose absorbée», Biomedical Dosimetry (C.R. Coll. Vienne, 1975), AIEA, Vienne (1975) 611-22.
[9] SIMOEN, J.P., GUIHO, J.P., CHARTIER, M., «Transfert de l’unité de dose absorbée à l’aide du dosimètre au sulfate ferreux», Actes VIIIe Congrès Int. de la Société française de radioprotection, Saclay (1976).
IAEA-SM-222/49 19
[10] MARINELLO, G., DUTREIX, A., CHAPUIS, G., Etude de l’efficacité de collection des chambres d’ionisation cylindriques irradiées dans les faisceaux de rayonnement puisé dans un accélérateur linéaire, J. Radiol., Electrol., Méd. Nucl. 57 11(1976) 789.
[11] ALMOND, P.R., SVENSSON, H., Ionization chamber dosimetry for photon and electron beams, Acta Biol. Therapy Physics Biology ,16 2 (1977).
DISCUSSION
J.C. McDONALD: In the future, does the LMRI plan to use a calorimetric standard or a standard field for the standardization o f fast neutron or other high- LET fields?
J.-P. GUIHO: Details o f the LMRI projects are given in the paper following mine by my colleague J.-P. Simoen (IAEA-SM -222/37). Two separate programmes are planned, one for radiation protection purposes, using a standardized 252C f source for kerma in tissue, and the other for therapy purposes, and for high- energy X-rays and electrons, in which the dose reference will be a calorimeter made o f tissue-equivalent material.
H.H. EISENLOHR (Scientific Secretary): What is the com position o f the ferrous sulphate dose meter solution which you use for your postal dosimetry service?
J.-P. GUIHO: The com position o f the solution will be the one for which we have determined the G-values, namely 1 mmol per litre o f ferrous ammonium sulphate, and 0.4 mol per litre o f sulphuric acid. The com position is thus quite usual except that the solution contains no sodium chloride, because this we find affects the stability o f the system with time.

IAEA-SM-222/37
ETUDES DOSIMETRIQUES MENEES AU LMRI DANS LE DOMAINE DES REFERENCES PRIMAIRES ET DES PROCEDURES DE TRANSFERTJ.-P. SIMOENLaboratoire de métrologie des rayonnements ionisants,Bureau national de métrologie,
• CEA, Centre d ’études nucléaires de Saclay,Gif-sur-Yvette,France
Abstract-Résumé
DOSIMETRIC STUDIES AT THE LMRI ON PRIMARY STANDARDS AND TRANSFER PROCEDURES.
The author describes the primary standards and transfer methods used at the Ionizing Radiation Metrology Laboratory (LMRI), and the work associated with them: calorimetric, ionometric and chemical measurements, and international standards comparisons. Outlining the current study programmes (experiments in high-energy photon and electron fields, production o f standards for /З-dosimetry, and future work on fast neutrons) he reaches the conclusion that the studies undertaken successively at the LMRI are closely related to the evolution of the metrological needs o f users.
ETUDES DOSIMETRIQUES MENEES AU LMRI DANS LE DOMAINE DES REFERENCES PRIMAIRES ET DES PROCEDURES DE TRANSFERT.
L’auteur examine les références primaires et les méthodes de transfert mises en oeuvre au Laboratoire de métrologie des rayonnements ionisants (LMRI), ainsi que les travaux connexes: mesures calorimétriques, ionométriques et chimiques; comparaisons internationales des étalons. Il présente ensuite les programmes d’études en cours: expérimentations dans des champs de photons et d’électrons de haute énergie; réalisation de références en dosimétrie /3; travaux futurs dans le domaine des neutrons rapides. Il conclut que les études entreprises successivement au LMRI sont en étroite relation avec l’évolution des besoins métrologiques des utilisateurs.
1. INTRODUCTION
En tant que laboratoire primaire du Bureau national de métrologie, le LMRI a en charge la réalisation et l’amélioration de références primaires, ainsi que l’ étude et la mise en oeuvre des méthodes de transfert appropriées. Cette double tâche est conçue et accomplie en relation la plus étroite possible avec les utilisateurs, afin que la qualité des références proposées corresponde au mieux aux besoins réels. Cette exigence doit en effet constituer le critère fondamental de choix des études à entreprendre au niveau d ’un laboratoire national de métrologie.
21
22 SIMOEN
Dans le domaine de la dosimétrie, les études et réalisations entreprises se rattachent aux trois secteurs d ’application des rayonnements ionisants: radiothérapie, radioprotection et irradiations à caractère industriel. Pour l’ensemble de ces applications, les rayonnements considérés présentent une grande variété, tant en ce qui concerne les particules (photons X et 7 , électrons, (3, neutrons) qu ’au regard des énergies (quelques keV à quelques dizaines de M eV) ou des ordres de grandeur des doses délivrées (dynamique d ’environ 109). Quant aux exactitudes recherchées, les exigences varient de quelques %, dans le cas de la radiothérapie, à quelques dizaines de %, dans le cas de certaines irradiations industrielles. En raison de cette grande diversité, il n ’est bien sûr pas possible de concevoir un étalon primaire et une méthode de transfert uniques, d ’autant plus que les grandeurs dosimétriques elles-mêmes — exposition, kerma, dose absorbée — ne recouvrent pas les mêmes domaines et que les techniques de mesurage à mettre en oeuvre ne sont pas de la même qualité métrologique. Toute présentation des références primaires et secondaires et des méthodes d ’ étalonnage reflète donc cette inévitable diversité. Les laboratoires de référence doivent cependant s’attacher à réduire le nombre de leurs étalons; à cet égard, il est à noter que la tendance actuelle à ne proposer aux utilisateurs — selon d ’ailleurs leur besoin réel — qu ’une seule grandeur, la dose absorbée, va dans le sens d ’une nécessaire simplification.
Au Groupe d ’études dosimétriques du LMRI, après la réalisation de références primaires pour les photons de basse et moyenne énergie et la mise en oeuvre de méthodes de transfert associées, le domaine des rayonnements j3 a été abordé, en même temps que débutait un programme concernant les champs de photons et d ’électrons de haute énergie. '
Enfin, pour répondre aux besoins présents et futurs dans le domaine des neutrons rapides, il est envisagé de réaliser des références primaires et secondaires autorisant l’ étalonnage des détecteurs de radioprotection et des dosimètres utilisés en neutrothérapie.
De tels objectifs amènent naturellement le métrologue à approfondir certaines techniques de mesure et à concevoir des instruments présentant des caractéristiques particulières. Ainsi ont été étudiées des questions aussi diverses que l’ influence de l’humidité sur l’ ionisation produite dans l’air, les constantes radiométrologiques
et G (Fe3 +), une chambre exposimètre à réponse quasi indépendante de l’énergie, ou le fonctionnem ent d ’une chambre à extrapolation en dosimétrie |3.
2. REFERENCES PRIMAIRES ET METHODES DE TRANSFERT MISES EN OEUVRE
2.1. Références primaires
Sans revenir sur la nature des choix qui ont été effectués [ 1 ], ces références se présentent comm e suit, selon les domaines considérés:
IAEA-SM-222/37 23
— Pour les photons de basse et moyenne énergie, les références primaires sont constituées de faisceaux à l’américium-241, au césium-137 et au cobalt-60 [2, 3]. Chaque faisceau a été caractérisé selon le plus grand nombre possible de grandeurs physiques pouvant décrire un champ de photons — fluence différentielle en énergie, exposition et dose absorbée dans des conditions spécifiées — pourla mesure desquelles ont été mises en oeuvre les techniques de spectrométrie, d ’ionométrie et de calorimétrie [4—6].
— Dans le domaine des rayonnements j3, une source de strontium-90+ yttrium-90 a été caractérisée en dose absorbée dans des conditions spécifiées; l’ instrument utilisé est une chambre d’ionisation en graphite, à cavité variable [7].
— Pour la détermination de doses absorbées de référence dans des champs de photons ou d ’ électrons de haute énergie, un nouveau calorimètre a été réalisé [6 ]; sa conception et son mode de fonctionnement ont été étudiés pour permettre une utilisation dans des conditions thermiques ambiantes plus défavorables qu ’en laboratoire, telles celles rencontrées auprès des accélérateurs.
2.2. Méthodes de transfert
Selon les rayonnements et les grandeurs considérés, le transfert vers un centre d ’ étalonnage ou vers l’utilisateur s’effectue soit à l’aide de sources radioactives, soit en utilisant un instrument approprié.
— Pour la grandeur exposition, le raccordement au laboratoife primaire des centres d ’ étalonnage s’effectue périodiquement par étalonnage dans les faisceaux primaires des chambres d ’ionisation de référence de ces centres; par ailleurs, sont organisés régulièrement par le laboratoire primaire des Programmes de tests interlaboratoires (PTI) — destinés principalement aux services de radioprotection — dans lesquels il est demandé aux participants de mesurer des sources étalonnées.
— En dosimétrie j3, le transfert s’ effectue à l’aide de sources radioactives caractérisées en dose absorbée par le centre d ’étalonnage, selon une méthode de comparaison utilisant une chambre de transfert et une source de référence fournies par le laboratoire primaire; l’utilisateur a également la possibilité, comme pour la grandeur exposition, de participer à des PTI.
— Pour les photons de moyenne et haute énergie et pour les électrons de haute énergie, une procédure d ’étalonnage en dose absorbée dans l’ eau a été mise en oeuvre [8]; plus particulièrement destinée au domaine médical, elle aboutit à l’ étalonnage du dosimètre dans le propre faisceau de l’utilisateur (tête de cobal- thérapie ou accélérateur), c ’ est-à-dire dans des conditions aussi voisines que possible de celles de l’utilisation habituelle du dosimètre; l’ instrument de transfert utilisé est le dosimètre au sulfate ferreux dont les caractéristiques métrologiques ont fait l’objet d ’une étude préalable.
24 SIMOEN
— Enfin, dans le cas particulier des irradiations industrielles utilisant des faisceaux de photons ou d ’ électrons de très forts débits de fluence, le dosimètre de transfert proposé à l’utilisateur est le film au triacétate de cellulose.
2.3. Travaux connexes
Dans le cadre de la réalisation des références et des méthodes de transfert, diverses études ont été effectuées, soit pour approfondir une technique dosimétrique, soit pour déterminer les caractéristiques d ’un instrument. A ces travaux s’ajoutent des activités telles que les comparaisons opérées avec d ’autres laboratoires nationaux, ou les études ponctuelles entreprises pour répondre à des besoins d’ étalonnage n’ entrant pas dans le cadre des procédures normalisées.
Dans le domaine des moyens de mesure, les études peuvent être réparties selon trois secteurs correspondant aux trois techniques de base utilisées: calorimétrie, ionométrie et dosimétrie chimique.
2.3.1. Mesures calorimétriques
Un effort particulier a été apporté à la mise en oeuvre de la calorimétrie, car cette technique offre la voie d ’accès la plus directe à la dose absorbée, mais avec une sensibilité très faible puisque de l’ ordre du m K -G y ' 1 dans le graphite.
Pour des raisons à la fois physiques (problème du défaut de chaleur) et pratiques (milie'ux de référence utiles en dosimétrie appliquée), le matériau retenu pour la construction des calorimètres est le graphite car, en tant que corps simple, il n’ est le siège d ’aucune réaction radiochimique et ses caractéristiques dosimétriques, pour les photons et les électrons, ne sont pas trop éloignées de celles de milieux tels que l’ eau ou les tissus.
Divers calorimètres ont été réalisés [6 ], différant par le nombre de corps les constituant et par leur degré d ’adiabaticité. Les deux principaux, retenus pour les mesures de références primaires, sont du type quasi adiabatique.
Pour la caractérisation des faisceaux de référence au césium-137 et au cobalt-60, le calorimètre utilisé, de forme cylindrique (diamètre 28 mm, hauteur 15 mm), était constitué de trois corps concentriques thermiquement isolés: absorbeur central, écran «flottant» et manteau thermorégulé [3 ,6 ] . Il était placé en position d ’irradiation dans une chambre à vide isolée comportant des fenêtres minces pour le passage des faisceaux.
Le calorimètre construit pour les mesures de référence dans les champs de photons et d ’ électrons de haute énergie est en fait constitué d ’un calorimètre proprement dit analogue au précédent, introduit dans un bouclier en graphite de 180 mm de diamètre et 100 mm de hauteur, thermorégulé, qui constitue le quatrième corps.
IAEA-SM-222/37 25
La principale amélioration apportée concerne l’adiabaticité de la mesure: une réduction supplémentaire des fuites thermiques est obtenue par asservissement de la température de l’écran à celle de l’absorbeur [6 ].
Le dispositif de mesure associé com porte un système automatique d ’acquisition de données autorisant un nombre important de relevés avant, pendant et après irradiation, les résultats pouvant être soit traités en temps réel, soit enregistrés pour traitement ultérieur.
2.3.2. Mesures ionométriques
— L’examen des résultats des mesures de courants d ’ionisation effectuées lors de la caractérisation en exposition des faisceaux de référence ayant montré que l’application de la correction théorique [9, 10] d ’humidité de l’ air augmentait systématiquement la dispersion de chaque série de mesures, une expérimentation a été entreprise [11]. Les résultats obtenus conduisent, pour les photons de moyenne énergie, à une correction de valeur constante (-0 ,3 % ) entre 30 et 70% d ’humidité relative à 21°C et 101,3 kPa, alors que la correction théorique est, pour ces mêmes conditions, respectivement de + 0,2% et + 0,4%. Ainsi, pour un taux d ’humidité de 60%, l’écart entre ces deux types de correction s’élève à 0 ,6%.
— La caractérisation d ’un même faisceau en exposition et en dose absorbée dans des conditions données permet une détermination de l’ énergie moyenne W/e absorbée par charge électrique élémentaire libérée dans l’ air. Le matériau de construction des chambres d ’ionisation et du calorimètre étant le même (graphite), les termes correctifs se réduisent au rapport des pouvoirs d ’arrêt graphite/air età un terme de normalisation géométrique. La valeur obtenue pour le faisceau au cobalt-60 est 33,96 ± 0,34 J -C " 1 [12] dans l’air sec, com pte tenu de la correction expérimentale d ’humidité.
— Pour le transfert de l’ unité d ’ exposition, une chambre d’ ionisation à réponse quasi indépendante de l’ énergie des photons a été étudiée [13]. La paroi m onocoque et l’ électrode centrale sont constituées d ’un mélange de graphite, d ’ oxyde d’aluminium et de résine epoxy. La faible variation de la sensibilité en fonction de l’ énergie (± 1,5% entre 40 keV et 1,25 MeV) résulte essentiellement de la compensation entre, d ’une part, le nombre et l’énergie des électrons générés dans le mélange et, d ’autre part, l’atténuation des photons dans la.paroi (dont l’ épaisseur radiale est de 0,540 g-cirT 2).
— En dosimétrie /3, dans le cadre de la caractérisation en dose absorbée d ’une source de référence primaire, l’ instrument utilisé — chambre à cavité variable —a fait l’objet d ’une étude particulière concernant certains phénomènes de polarisation inhérents à ce type de chambre [14]. L ’arrêt de particules ¡3 dans l’ électrode de mesure provoque en effet un courant direct de polarisation dont l’amplitude dépend non seulement de la taille de la cavité et de la valeur de la tension appliquée à la chambre, mais aussi du signe de cette tension. Il en résulte
26 SIMOEN
que le courant d ’ionisation n’est pas obtenu simplement en prenant la moyenne arithmétique des courants totaux correspondant aux tensions positive et négative; il faut de cette valeur retrancher un terme, dont l’ importance relative peut atteindre 1% pour des cavités de faibles dimensions.
2.3.3. Mesures chimiques
Le dosimètre au sulfate ferreux (dosimètre de Fricke) ayant été retenu com m e instrument de transfert de l’unité de dose absorbée, il convenait de procéder à l’ examen de ses caractéristiques métrologiques fines tant en ce qui concerne la solution chimique que la technique de lecture spectrophotométrique. Ainsi ont été déterminés expérimentalement:— le coefficient d ’extinction molaire pour la longueur d ’onde utilisée pour la
lecture (303 nm); la valeur obtenue à la température de référence 25°C est: 2164 ± 2 l - т о Г 1 - c m '1;
— les corrections de température et de non-linéarité du spectrophotomètre;— la conservation de l’ information dans le temps; cette caractéristique est
particulièrement importante pour l’utilisation faite car les dosimètres chimiques, expédiés par voie postale, ont des durées d ’absence pouvant atteindre plusieurs semaines.
Enfin, le rendement radiochimique G (Fe3+) a fait l’objet d ’une étude particulière: sa valeur a été mesurée dans les faisceaux de référence au cobalt-60 et au césium-137 caractérisés en dose absorbée dans le graphite, et l’ influence sur G de la concentration en chlorure de sodium a été explorée [15].
La solution de base était constituée de:— 1 m m oM " 1 de sulfate de fer (II) et d ’ammonium (NH4)2Fe(S 0 4)26H20— 0,4 mol • Г 1 d ’acide sulfurique H2 S 0 4.
Pour une solution ne contenant pas de chlorure de sodium, les valeurs de G obtenues sont, en (ions Fe3+) • ( 100 eV )-1 :
15,85 ± 0,2 au cobalt-60 (E = 1,15 MeV [3 ])15,35 ± 0,2 au césium-137 (E = 0 ,6 3 MeV [3])
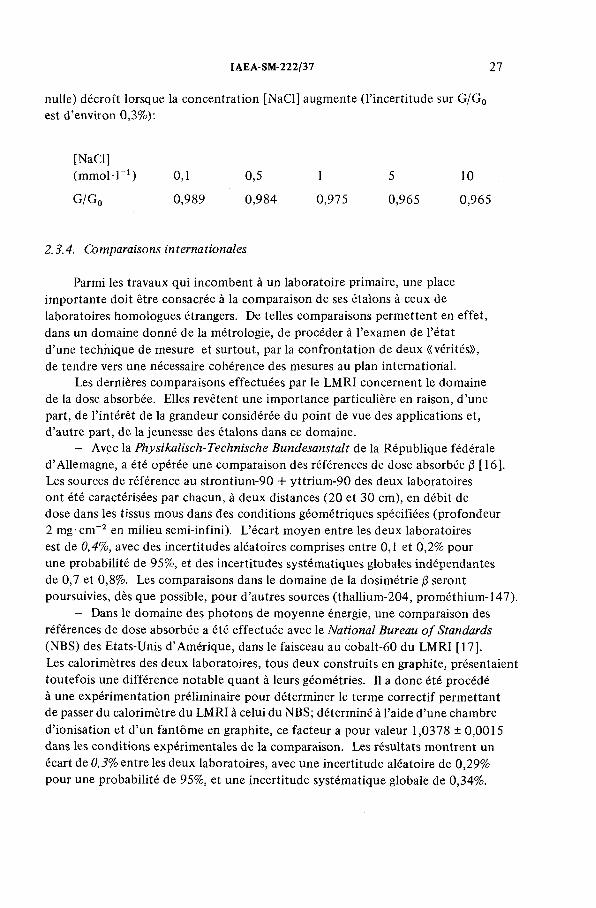
Il a par ailleurs été trouvé que l’adjonction de chlorure de sodium à la solution modifiait significativement les valeurs de G. Les résultats, identiques pour les deux énergies considérées, montrent que le rapport G /G 0 (valeur de G à une concentration [NaCl] donnée, relative à la valeur pour une concentration
IAEA-SM-222/37 27
nulle) décroît lorsque la concentration [NaCl] augmente (l’ incertitude sur G /G 0 est d ’environ 0,3%):
[NaCl](m m o l-r 1) 0,1 0,5 1 5 10
G /G 0 0,989 0,984 0,975 0,965 0,965
2.3.4. Comparaisons internationales
Parmi les travaux qui incombent à un laboratoire primaire, une place importante doit être consacrée à la comparaison de ses étalons à ceux de laboratoires homologues étrangers. De telles comparaisons permettent en effet, dans un domaine donné de la métrologie, de procéder à l’ examen de l’état d’une technique de mesure et surtout, par la confrontation de deux «vérités», de tendre vers une nécessaire cohérence des mesures au plan international.
Les dernières comparaisons effectuées par le LMRI concernent le domaine de la dose absorbée. Elles revêtent une importance particulière en raison, d ’une part, de l’ intérêt de la grandeur considérée du point de vue des applications et, d’autre part, de la jeunesse des étalons dans ce domaine.
— Avec la Physikalisch-Technische Bundesanstalt de la République fédérale d ’ Allemagne, a été opérée une comparaison des références de dose absorbée /3 [16]. Les sources de référence au strontium-90 + yttrium-90 des deux laboratoiresont été caractérisées par chacun, à deux distances (20 et 30 cm), en débit de dose dans les tissus mous dans des conditions géométriques spécifiées (profondeur 2 m g-cirT2 en milieu semi-infini). L’ écart moyen entre les deux laboratoires est de 0,4%, avec des incertitudes aléatoires comprises entre 0,1 et 0,2% pour une probabilité de 95%, et des incertitudes systématiques globales indépendantes de 0,7 et 0,8%. Les comparaisons dans le domaine de la dosimétrie /3 seront poursuivies, dès que possible, pour d ’autres sources (thallium-204, prométhium-147).
— Dans le domaine des photons de moyenne énergie, une comparaison des références de dose absorbée a été effectuée avec le National Bureau o f Standards (NBS) des Etats-Unis d ’ Amérique, dans le faisceau au cobalt-60 du LMRI [17].Les calorimètres des deux laboratoires, tous deux construits en graphite, présentaient toutefois une différence notable quant à leurs géométries. Il a donc été procédé à une expérimentation préliminaire pour déterminer le terme correctif permettant de passer du calorimètre du LMRI à celui du NBS; déterminé à l’aide d’ une chambre d’ionisation et d ’un fantôme en graphite, ce facteur a pour valeur 1,0378 ± 0,0015 dans les conditions expérimentales de la comparaison. Les résultats montrent un écart de 0,3% entre les deux laboratoires, avec une incertitude aléatoire de 0,29% pour une probabilité de 95%, et une incertitude systématique globale de 0,34%.
28 SIMOEN
Les débits de dose obtenus se situaient au niveau du mGy s 1 et, la masse de chaque absorbeur étant de l’ ordre d ’un gramme, les mesures calorimétriques étaient donc au niveau du microwatt.
Notons enfin la participation à l’ intercomparaison en dose absorbée pour les photons du cobalt-60, organisée par le Bureau international des poids et mesures. Les laboratoires ayant à ce jour effectué leurs mesures sont le NBS et le LMRI.
3. PROGRAMMES D’ ETUDES EN COURS
Les principales études entreprises actuellement concernent le domaine des photons et des électrons de haute énergie, la poursuite des travaux de dosimétrie /3 et la préparation des futures expérimentations dans les champs de neutrons rapides.
3.1. Expérimentations dans le domaine des photons et des électronsde haute énergie (10 à 50 MeV)
L’utilisation de plus en plus répandue de faisceaux de photons ou d ’électrons d’énergies élevées à des fins thérapeutiques a nécessité la réalisation, dans ce domaine, de références primaires et secondaires autorisant l’ étalonnage des dosimètres des services hospitaliers.
Parmi les différentes méthodes de transfert envisageables, celle retenue par le LMRI (cf. 2 .2), basée sur l’emploi du dosimètre au sulfate ferreux, offre une qualité et une sécurité convenables pourvu que les caractéristiques d ’utilisation de ce dosimètre soient suffisamment bien connues. Les caractéristiques de la méthode de lecture spectrophotométrique, ainsi que le rendement G (Fe3+) du dosimètre pour les photons de moyenne énergie ayant été mesurés (voir 2.3.2), il restait à déterminer les valeurs du rendement dans le domaine des photons et des électrons de haute énergie car, dans ce domaine, les valeurs publiées présentent une certaine dispersion [18, 19]. C’est la raison pour laquelle a été entreprise au LMRI une étude sur ce sujet. Bien que l’ob jectif principal soit la détermination du rendement G (Fe3+), une telle étude est en fait beaucoup plus générale puisque sont mises en oeuvre, outre la dosimétrie chimique, les techniques de base: ionométrie et calorimétrie. Dans un faisceau donné, la mesure de G est en effet effectuée en comparant résultats chimiques et doses de références déterminées par calorimétrie, dans un fantôme à une profondeur correspondant à la valeur maximale de la dose, profondeur déterminée préalablement à l’aide de chambres d ’ionisation.
Les expérimentations sont menées en utilisant un accélérateur linéaire d ’ électrons d ’énergie maximale 60 MeV. Le faisceau primaire d ’électrons est dévié par un ensemble de deux aimants qui assure une définition et une stabilité en énergie correctes.
IAEA-SM-222/37 29
Le programme com porte deux volets distincts selon les faisceaux mis en oeuvre: photons ou électrons. Dans les deux cas, les dispositifs de réalisation et de contrôle des faisceaux ont été étudiés au laboratoire.
Jusqu’à présent, seul le domaine des photons a été abordé. La réalisation des faisceaux est obtenue à l’ aide de cibles de conversion e/x en tungstène, de différentes épaisseurs, et d ’un ensemble de collimation constitué de neuf diaphragmes circulaires en plom b de 5 cm d ’épaisseur. Le contrôle des faisceaux est assuré par un obturateur placé en amont des cibles et par un dispositif de monitorage constitué, d ’une part, d ’un ensemble de chambres d ’ionisation planes concentriques placé à la sortie du collimateur et, d ’autre part, d ’une chambre plane située à l’arrière du fantôme de référence. Pour faciliter la mise en place des dispositifs de mesure, l’axe du système est «matérialisé» par un faisceau laser.
Les mesures dosimétriques sont effectuées dans un fantôm e en graphite de form e parallélépipédique, de dimensions 30 X 30 X 20 cm, placé à 175 cm de la cible, distance à laquelle la surface du champ est de 100 cm 2.
Diverses expérimentations préliminaires étaient nécessaires avant d ’entreprendre la mesure proprement dite du rendement du dosimètre chimique. Afin de déterminer les profondeurs de référence, les rendements de dose en fonction de la profondeur dans le fantôme ont été mesurés pour différentes énergies (25 à 45 M eV); ces mesures, effectuées avec des chambres d ’ionisation différentes, permettent une étude du phénomène de déplacement. Par ailleurs, le dosimètre chimique étant constitué d ’un certain volume de solution (quelques cm 3) placé dans un conteneur en verre de form e et dimensions données, l’ influence de ces paramètres fait l’ objet d’une étude expérimentale particulière, car le terme correctif correspondant constitue la principale source d ’incertitude de la mesure de G.
3.2. Réalisation de références en dosimétrie /3
Le programme en dosimétrie P a pour objet la réalisation de références primaires et secondaires, dont la principale application est de permettre l’étalonnage de détecteurs de radioprotection dans une large gamme d ’énergies. Les mesures de dose, au niveau primaire, sont effectuées avec la chambre d ’ionisation à cavité variable citée précédemment (voir 2.1 et 2.3.1).
Les expérimentations avec des sources de strontium-90 + yttrium-90 étant terminées, les travaux se poursuivront avec des sources au thallium-204 puis au prométhium-147. Dans chaque cas, il est prévu de caractériser une référence primaire en dose dans les tissus, en milieu semi-infini, à une profondeur donnée (entre 5 et 10 m g-cm -2 ), et de procéder ensuite au transfert à l’aide de sources étalons secondaires.
30 SIMOEN
3.3. Travaux futurs dans le domaine des neutrons rapides
L’utilisation, prévue prochainement en France, de faisceaux de neutrons en radiothérapie et, par ailleurs, les besoins d ’ étalonnage émanant des services de radioprotection conduisent le laboratoire primaire à entreprendre des travaux de dosimétrie fondamentale dans des champs de neutrons rapides. Les études envisagées se répartissent selon deux secteurs.
— Dans une première étape, il est envisagé de caractériser une source de référence au californium-252 en kerma dans les tissus. Les mesures seront effectuées à l’aide de chambres d ’ionisation en matériau «équivalent-tissus» du type Shonka A-l 50, le débit de fluence étant insuffisant pour l’utilisation de la technique calorimétrique. La source considérée constituera par ailleurs une référence primaire de débit de fluence de neutrons dont la fluence différentielle en énergie sera déterminée expérimentalement.
— Dans les faisceaux de neutrons obtenus auprès d’accélérateurs (cyclotrons), le programme d ’étude aura pour objet essentiel le choix et la mise en oeuvre d ’une méthode de transfert de l’unité de dose absorbée, destinée à permettre l’ étalonnage des dosimètres des services hospitaliers de neutronothérapie. Cet ob jectif implique l’étude d ’un dosimètre de transfert et son étalonnage. Pource faire, divers systèmes dosimétriques seront examinés et les doses de référence seront mesurées à l’ aide d ’un calorimètre «équivalent-tissus» (matériau Shonka A-l 50) qui sera construit prochainement.
4. CONCLUSIONS
Les études entreprises successivement au laboratoire sont en étroite relation avec l’évolution des besoins métrologiques des utilisateurs. Ceci est particulièrement vrai pour ce qui concerne le domaine médical, dans lequel ont été progressivement mis en oeuvre, à des fins thérapeutiques, des faisceaux de photons d ’énergie moyenne, puis de photons et d ’électrons de haute énergie, enfin de neutrons rapides. Par ailleurs, le radiothérapeute souhaite que les doses délivrées soient connues avec une exactitude de l’ordre de 3% et une reproductibilité d ’environ 1% [20]. Les références primaires étant définies avec des incertitudes globales rarement inférieures au pourcent, on comprend avec quels soins particuliers doivent être choisis et caractérisés les instruments utilisés pour le transfert. La situation dans le domaine des rayonnements ionisants est ainsi moins confortable que dans d ’autres secteurs de la métrologie pour lesquels, entre instruments primaires et instruments d ’usage, les incertitudes de mesure diffèrent de plusieurs ordres de grandeur.
Il est donc particulièrement important que les physiciens continuent à améliorer la connaissance de quantités telles que constantes radiométrologiques, paramètres caractérisant les dépôts d ’ énergie — pouvoirs d ’arrêt, coefficients
IAEA-SM-222/37 31
d ’absorption — et termes correctifs comm e, par exemple, ceux résultant des phénomènes de perturbation et de déplacement du point de mesure d ’un dosimètre. Enfin, doit être poursuivie la collaboration internationale entre laboratoires primaires, au travers de comparaisons bilatérales et d ’intercomparaisons, principalement dans les domaines «de pointe» tel celui de la mesure de la dose dans les champs de photons ou d’ électrons d’ énergies élevées.
REFERENCES
[1] GUIHO, J.P., LE GALLIC, Y., Conception et utilisation des références primaires en dosimétrie photonique, Bull. Inf. Bur. Natl. Métrol. 17 (1974) 15.
[2] GUIHO, J.P., Faisceaux primaires de référence photonique, Bull. Inf. Sci. Tech., CEA 163 (1971) 33.
[3] GUIHO, J.P., HILLION, H., OSTROWSKY, A., WAGNER, P., Description et caractérisation en exposition, dose absorbée et fluence différentielle en énergie des faisceaux de photons constituant les références primaires nationales, Rapport CEA-R-4643 (1974).
[4] GUIHO, J.P., LEGRAND, J., GRINBERG, B., «Détérioration de la disbribution spectrale de l’émission photonique issue de têtes d’irradiation», Dosimetry in Agriculture, Industry, Biology and Medicine (C.R. Coll. Vienne, 1972), AIEA, Vienne (1973) 121—39.
[5] GUIHO, J.P., OSTROWSKY, A., SIMOEN, J.P., HILLION, P., Mesure des courants faibles au LMRI. Application à la mesure de l’exposition, Rapport CEA-R-4637 (1974).
[6] SIMOEN, J.P., OSTROWSKY, A., GUIHO, J.P., «Emploi de la calorimétrie comme méthode de mesure fondamentale de la dose absorbée», XVe Réunion de la Société des physiciens des hôpitaux d’expression française, Caen (1976).
[7] HILLION, P., SIMOEN, J.P., GUIHO, J.P., «Détermination de la dose absorbée béta à l’aide d’une chambre à cavité variable», Actes VIIIe Congrès int. de la Société française de radioprotection, Saclay (1976).
[8] SIMOEN, J.P., GUIHO, J.P., CHARTIER, M., «Transfert de l’unité de dose absorbée à l’aide du dosimètre au sulfate ferreux», Actes VIIIe Congrès int. de la Société française de radioprotection, Saclay (1976).
[9] BARNARD, G.P., ASTON, G.H., MARSCH, A.R.S., On the effect of variations in the ambient air on the calibration and use o f ionization dosimeters, Br. J. Radiol. 33 (1960) 644.
[10] RAKOW, A., WILL, W., Absolute Darstellung der Roentgeneinheit eines Energiebereichs der 60Co-7-Strahlung mit Hohlraumionisationskammern, Kernenergie 6 10 (1963).
[11] GUIHO, J.P., PAVLICSEK, I., OSTROWSKY, A., GOENVEC, H.; Influence de l’état hygrométrique de l’air sur l’ionisation produite par les rayonnements X ou y, C.R. Hebd. Acad. Sci., Paris, t-278 (1974).
[12] GUIHO, J.P., SIMOEN, J.P., Détermination expérimentale de l’énergie moyenne nécessaire à la production d’une paire d’ions dans l’air, Int. J. Appl. Radiat. Isot. 26 (1975)714.
[13] CONSTANT, M., ECHIVARD, C., GUIHO, J.P., «Chambre d’ionisation à cavité à réponse quasi-indépendante de l’énergie des photons», Actes VIIIe Congrès int. de la Société française de radioprotection, Saclay (1976).
[14] HILLION, P., Contribution à la mesure de la dose absorbée /3. Essai d’interprétation des principales anomalies de fonctionnement de la chambre à cavité variable, Rapport CEA-R-4790 (1976).
32 SIMOEN
[ 15] GUIHO, J.P., SIMOEN, J.P., «Contribution à la connaissance des constantes fondamentales W et G intervenant dans les mesures de dose absorbée», Biomedical Dosimetry (C.R.Coll. Vienne, 1975), AIEA, Vienne (1975) 611-22.
[16] BÔHM, J., HILLION, P., SIMOEN, J.P., «Intercomparison of the PTB and LMRI standards in beta dosimetry», Actes VIIIe Congrès int. de la Société française de radioprotection, Saclay (1976).
[17] GUIHO, J.P., SIMOEN, J.P., DOMEN, S.R., Comparison of BNM-LMRI and NBS absorbed dose standards for “ Со gamma rays, à paraître dans Metrologia.
[ 18] ICRU, Radiation dosimetry: X rays and gamma rays with maximum photon energies between 0.6 and 50 MeV, ICRU Report 14 (1969).
[19] ICRU, Radiation dosimetry: electrons with initial energies between 1 and 50 MeV,ICRU Report 21 (1972).
[20] WAMBERSIE, A., DUTREIX, J., DUTREIX, A., Conséquences concernant le choix et les performances exigées des détecteurs, J. Belge Radiol. 52 2 (1969) 1.
DISCUSSION
K. ZSDÁNSZKY: What kind o f amplifier do you use for your calorimeter, a direct current or a lock-in amplifier?
J.-P. SIMOEN: When the calorimetric measurement chain was set up over five years ago we decided on a direct current amplifier. However, as other possibilities are available, it would be interesting for laboratories using different methods to compare the performance o f their measurement chains.
IAEA-SM-222/32
CURRENT WORK IN THE FIELD OF STANDARDIZATION IN DOSIMETRY OF PHOTONS AND ELECTRONS IN THE FEDERAL REPUBLIC OF GERMANYH. REICHPhysikalisch-Technische Bundesanstalt,Braunschweig,Federal Republic o f Germany
Abstract
CURRENT WORK IN THE FIELD OF STANDARDIZATION IN DOSIMETRY OF PHOTONS AND ELECTRONS IN THE FEDERAL REPUBLIC OF GERMANY.
Since the early 1970s, the activities in the field o f dosimetry have been greatly increased in the Federal Republic o f Germany owing to the formulation of a number of legal regulations. These also led to the development of new primary standard installations and services. The efforts o f thePhysikalisch-Technische Bundesanstalt (PTB) to disseminate units for the quantities absorbed dose in water or dose equivalent in tissue are reported. For photons at very low energies the wall-less extrapolation chamber principle, and for medium energies the extrapolation chamber with air-equivalent walls are used for providing the future primary standards for measuring the chamber equilibrium ion dose. At high photon energies, the unit of absorbed dose in water will be realized in three different ways, namely using calorimetric, ionometric and chemical dosimetry methods. The construction by German firms of an irradiation facility with eight 137Cs and two 60Co sources for use in secondary standard laboratories has been stimulated. The extrapolation chamber primary standard for |3-rays of the PTB shows good agreement with corresponding primary standards of the National Physical Laboratory (NPL, UK) and Laboratoire de Métrologie des Rayonnements Ionisants (LMRI, France). A set of PTB calibrated |3-ray sources, including stand and shutter device for representing secondary standards, is available commercially. A small ionization chamber for high-energy electrons suitable for use as a reference chamber has been developed by Markus at a German institute. Finally a short survey is given of the principles of indicating the uncertainties o f measuring results in test certificates o f the PTB.
1. INTRODUCTION
The great public interest in all aspects o f radiation safety during the past decade has resulted in several new or revised legal regulations for radiation protection and for the handling o f radiation sources o f all kinds being issued in the Federal Republic o f Germany [1 —3]. As a consequence, the dosimetry at the Physikalisch-Technische Bundesanstalt (PTB) and throughout the Federal Republic has received a great impetus.
33
34 REICH
I shall start by giving a short survey o f the legal situation. I shall then report on new developments with primary standards, i.e. on the developments in the period 1973 — 1977, thereby mentioning some new secondary standards and services offered. After reporting on first experience gained with the type-testing o f dose meters for radiation protection, I shall finally discuss, briefly, how the uncertainty o f test results will, in the future, be quoted in certificates o f the PTB.
2. THE LEGAL SITUATION
The Law on Metrology and Verification (Eichgesetz 1969 [4]) provides for legal control o f a great number o f measuring instruments which play a role in trade and industry, public safety or public health. In 1975, by the Second Ordinance on the Legal Control o f Measuring Instruments [5], the obligatory verification was extended to dose meters. This ordinance came into force for radiation protection monitors in January o f 1977, and for therapy-level instruments it will enter into force in January 1980. It does not cover personal monitors like film badges, which are evaluated at regular intervals by official central offices, nor does it refer, for example, to dose meters for monitoring technical processes. At present the ordinance refers only to dose meters for photon radiation with energies up to 3 MeV. Later, an extension to higher energies and other types o f radiation (e.g. electrons, neutrons) is envisaged. A supplement to the Second Ordinance is the Ordinance on the Validity Period o f Verification (Eichgültigkeitsverordnung, 1976 [6 ]) which sets time limits for re-verification.The period varies for radiation protection and therapy-level dose meters and depends on whether or not a radioactive check source for the instrument involved is available.
Two effects o f the Second Ordinance should be mentioned. Firstly, a prerequisite for the admission to verification o f any instruments is type approval.It is connected with tests in which the technical characteristics o f the appliance, in particular causes o f measuring errors, are investigated. The tests are based on written Requirements o f the PTB [7], which are consistent with international standards and will, after some years o f experience, becom e part o f the Verification Order (Eichordnung[8 ]j. The information to be expected from the type evaluations extend well beyond what is presently known about dose meters and will put th e . user in a better position than heretofore to assess the uncertainty o f a measurement. The granting o f type approval will also presume that a clear description and adequate technical information are provided for the instrument.
Secondly, a verification must be provided for the individual instrument. For this purpose three or four verification offices under the authority o f the German States ( Lander) are now installed or will be set up in the Federal Republic. In addition we will have at some German companies verification dispatch offices and
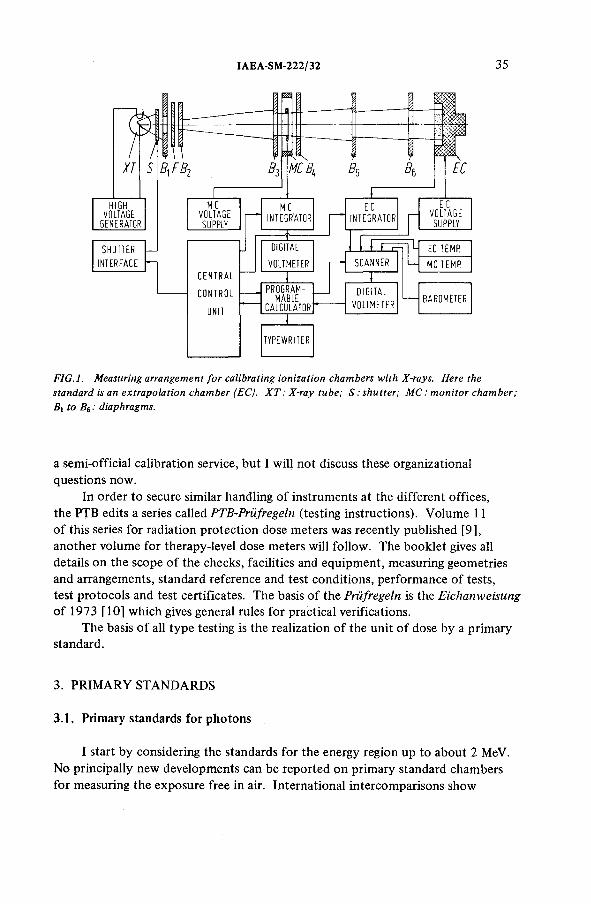
IAEA-SM-222/32 35
FIG.l. Measuring arrangement for calibrating ionization chambers with X-rays. Here the standard is an extrapolation chamber (EC). XT : X-ray tube; S : shutter; MC : monitor chamber ; Bt to B6 : diaphragms.
a semi-official calibration service, but I will not discuss these organizational questions now.
In order to secure similar handling o f instruments at the different offices, the PTB edits a series called PTB-Priifregeln (testing instructions). Volume 11 o f this series for radiation protection dose meters was recently published [9], another volume for therapy-level dose meters will follow . The booklet gives all details on the scope o f the checks, facilities and equipment, measuring geometries and arrangements, standard reference and test conditions, performance o f tests, test protocols and test certificates. The basis o f the Priifregeln is the Eichanweisung o f 1973 [10] which gives general rules for practical verifications.
The basis o f all type testing is the realization o f the unit o f dose by a primary standard.
3. PRIM ARY STANDARDS
3.1, Primary standards for photons
I start by considering the standards for the energy region up to about 2 MeV. No principally new developments can be reported on primary standard chambers for measuring the exposure free in air. International intercomparisons show
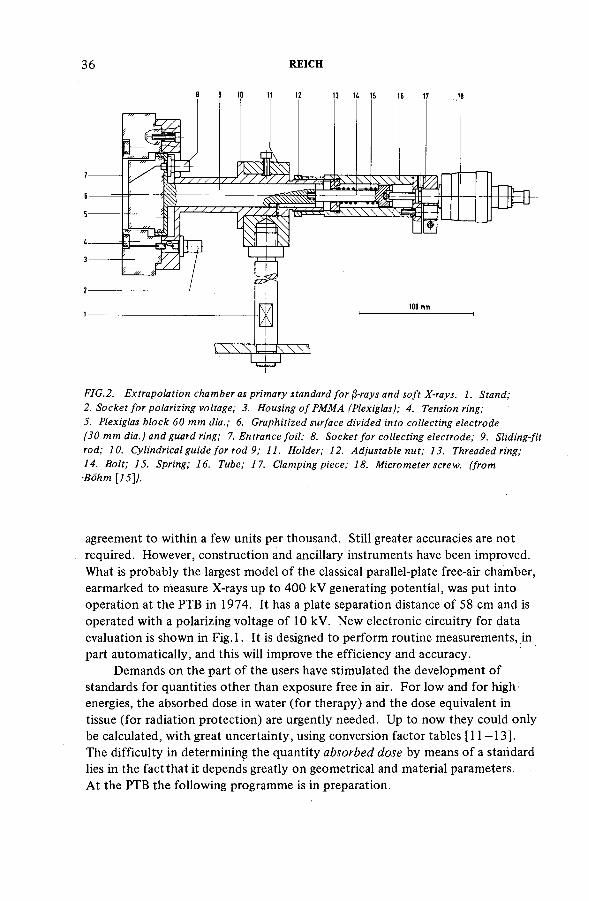
36 REICH
FIG.2. Extrapolation chamber as primary standard for (i-rays and soft X-rays. 1. Stand;2. Socket for polarizing voltage; 3. Housing o f PMMA (Plexiglas); 4. Tension ring;5. Plexiglas block 60 mm dia.; 6. Graphitized surface divided into collecting electrode(30 mm dia.J and guard ring; 7. Entrance foil; 8. Socket for collecting electrode; 9. Sliding-fitrod; 10. Cylindrical guide for rod 9; 11. Holder; 12. Adjustable nut; 13. Threaded ring;14. Bolt; 15. Spring; 16. Tube; 17. Clamping piece; 18. Micrometer screw, (from ■Bôhm \15\).
agreement to within a few units per thousand. Still greater accuracies are not required. However, construction and ancillary instruments have been improved. What is probably the largest model o f the classical parallel-plate free-air chamber, earmarked to measure X-rays up to 400 kV generating potential, was put into operation at the PTB in 1974. It has a plate separation distance o f 58 cm and is operated with a polarizing voltage o f 10 kV. New electronic circuitry for data evaluation is shown in F ig .l. It is designed to perform routine measurements, in part automatically, and this will improve the efficiency and accuracy.
Demands on the part o f the users have stimulated the development o f standards for quantities other than exposure free in air. For low and for high energies, the absorbed dose in water (for therapy) and the dose equivalent in tissue (for radiation protection) are urgently needed. Up to now they could only be calculated, with great uncertainty, using conversion factor tables [11 — 13].The difficulty in determining the quantity absorbed dose by means o f a standard lies in the fact that it depends greatly on geometrical and material parameters.At the PTB the following programme is in preparation.
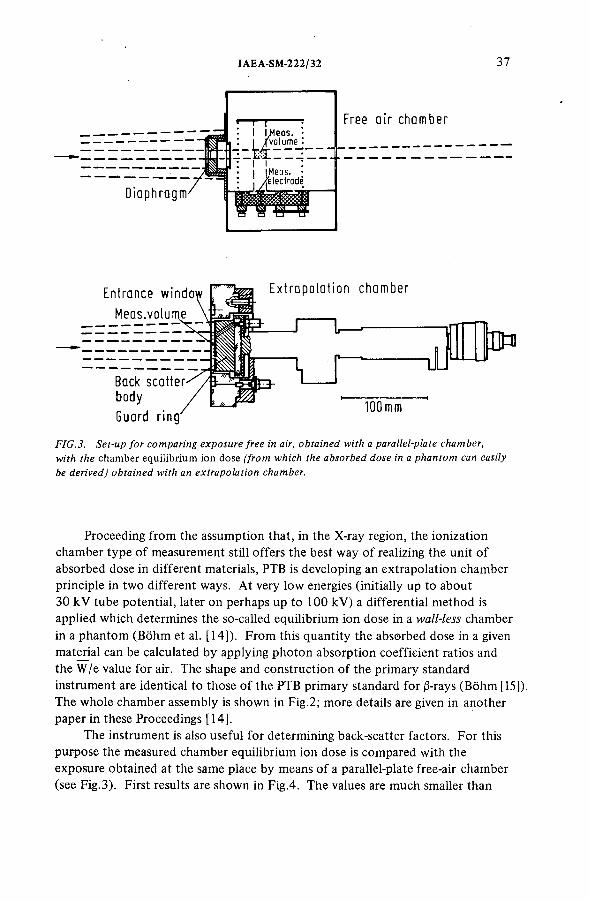
IAEA-SM-222/32 37
FIG.3. Set-up for comparing exposure free in air, obtained with a parallel-plate chamber, with the chamber equilibrium ion dose (from which the absorbed dose in a phantom can easily be derived) obtained with an extrapolation chamber.
Proceeding from the assumption that, in the X-ray region, the ionization chamber type o f measurement still offers the best way o f realizing the unit o f absorbed dose in different materials, PTB is developing an extrapolation chamber principle in two different ways. At very low energies (initially up to about 30 kV tube potential, later on perhaps up to 100 kV ) a differential method is applied which determines the so-called equilibrium ion dose in a wall-less chamber in a phantom (Bôhm et al. [14]). From this quantity the absorbed dose in a given material can be calculated by applying photon absorption coefficient ratios and the W /e value for air. The shape and construction o f the primary standard instrument are identical to those o f the PTB primary standard for j3-rays (Bôhm [15]). The whole chamber assembly is shown in Fig.2; more details are given in another paper in these Proceedings [14].
The instrument is also useful for determining back-scatter factors. For this purpose the measured chamber equilibrium ion dose is compared with the exposure obtained at the same place by means o f a parallel-plate free-air chamber (see Fig.3). First results are shown in Fig.4. The values are much smaller than
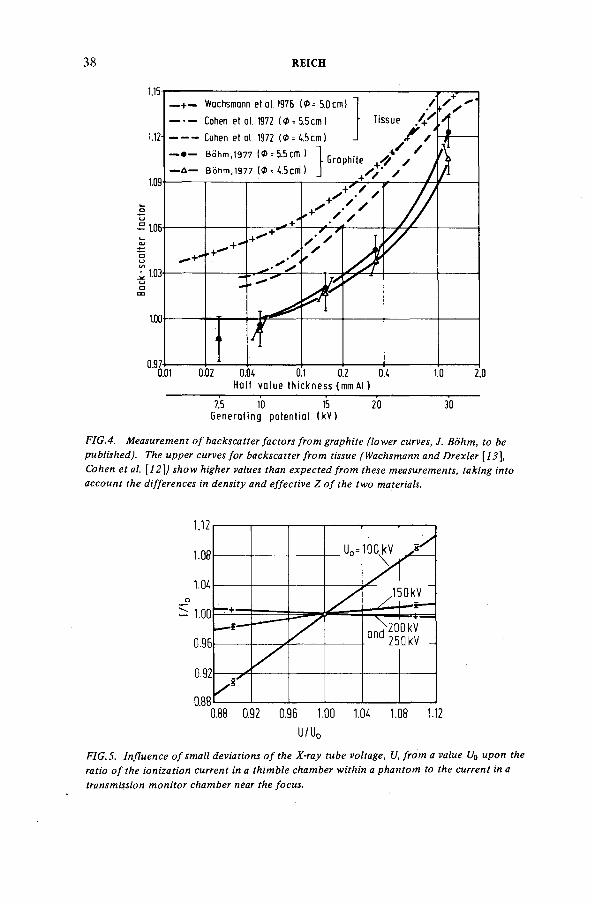
38 REICH
1.15
1.12-
1.09
! 106-
ЮЗ-
1.00
0.970.01
_ + _ Wachsmann etal. 1976 (Ф = 5.0cm l
------- Cohen et al 1972 (Ф = 5.5cm 1
— — — Cohen et al. 1972 ( Ф = 4.5 cm )
— Bohm, 1977 (® = 5.5cm ) 1 r „ . .■ b ra phi— Д — Bohm,1977 (Ф = 4.5cm ) J
/T issue f S
/ ; У '
s s ' /
«\
' / /
/ ir
\+Vft ✓
/ /
41 к ■ г
0.02 0.04 0.1 0.2 0.4H a lf v a lu e t h ic k n e s s (mm Al )
1.0
7.5 10 15G e n e ra t in g p o te n t ia l ( k V )
20 30
2.0
FIG.4. Measurement o f backscatter factors from graphite (lower curves, J. Bohm, to be published). The upper curves for backscatter from tissue (Wachsmann and Drexler [13], Cohen et al. \12\j show higher values than expected from these measurements, taking into account the differences in density and effective Z o f the two materials.
0.88 0.92 0.96 1.00 1.04 1.08 1.12U / U 0
FIG.5. Influence o f small deviations o f the X-ray tube voltage, U, from a value UQ upon the ratio o f the ionization current in a thimble chamber within a phantom to the current in a transmission monitor chamber near the focus.
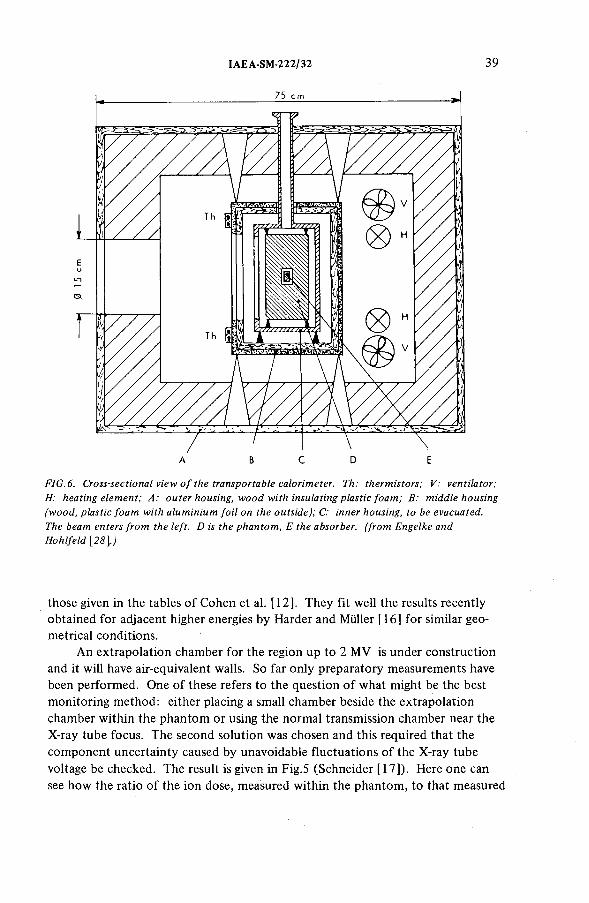
I AEA-SM-222/32 39
FIG. 6. Cross-sectional view o f the transportable calorimeter. Th: thermistors; V: ventilator; H: heating element; A: outer housing, wood with insulating plastic foam; B: middle housing (wood, plastic foam with aluminium foil on the outside); C: inner housing, to be evacuated. The beam enters from the left. D is the phantom, E the absorber, (from Engelke and Hohlfeld [28].)
those given in the tables o f Cohen et al. [12]. They fit well the results recently obtained for adjacent higher energies by Harder and Müller [16] for similar geometrical conditions.
An extrapolation chamber for the region up to 2 MV is under construction and it will have air-equivalent walls. So far only preparatory measurements have been performed. One o f these refers to the question o f what might be the best monitoring method: either placing a small chamber beside the extrapolation chamber within the phantom or using the normal transmission chamber near the X-ray tube focus. The second solution was chosen and this required that the com ponent uncertainty caused by unavoidable fluctuations o f the X-ray tube voltage be checked. The result is given in Fig.5 (Schneider [17]). Here one can see how the ratio o f the ion dose, measured within the phantom, to that measured
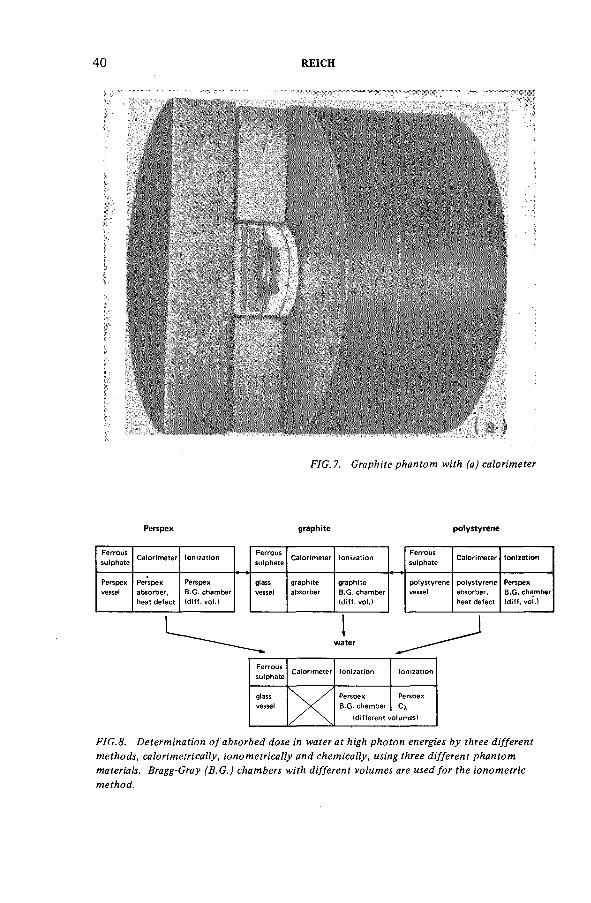
40 REICH
■
FIG. 7. Graphite phantom with (a) calorimeter
Perspex graphite polystyrene
Ferroussulphate
Calorimeter Ionization Ferroussulphate
Calorimeter IonizationFerroussulphate Calorimeter Ionization
Perspexvessel
Perspex absorber, heat defect
Perspex B.G. chamber (cliff, vol.)
glassvessel
graphiteabsorber
graphite B.G. chamber <diff. vol.)
polystyrenevessel
polystyrene absorber, heat defect
Perspex B.G. chamber (diff. vol.)
FIG.8. Determination o f absorbed dose in water at high photon energies by three different methods, calorimetrically, ionometrically and chemically, using three different phantom materials. Bragg-Gray (B.G.j chambers with different volumes are used for the ionometric method.
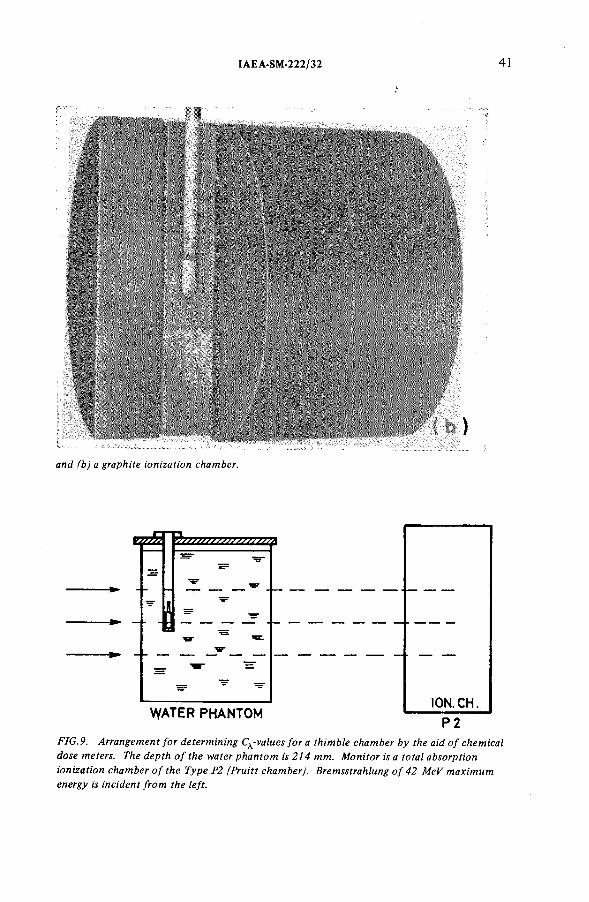
IAEA-SM-222/32 41
i 1
{...'
and (b) a graphite ionization chamber.
FIG. 9. Arrangement for determining Cyvalues for a thimble chamber by the aid o f chemical dose meters. The depth o f the water phantom is 214 mm. Monitor is a total absorption ionization chamber o f the Type P2 (Pruitt chamber). Bremsstrahlung o f 42 MeV maximum energy is incident from the left.
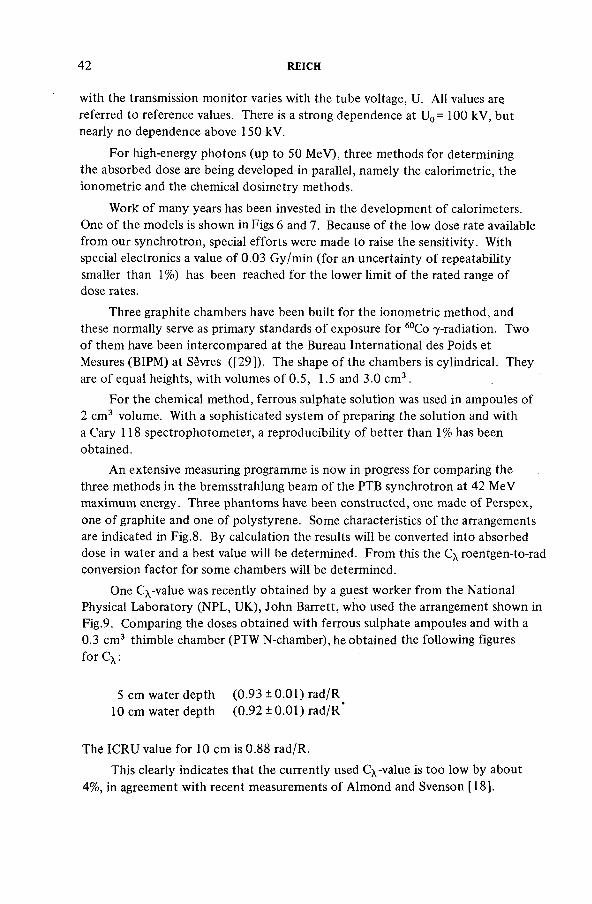
42 REICH
with the transmission monitor varies with the tube voltage, U. All values are referred to reference values. There is a strong dependence at U0= 100 kV, but nearly no dependence above 150 kV.
For high-energy photons (up to 50 MeV), three methods for determining the absorbed dose are being developed in parallel, namely the calorimetric, the ionom etric and the chemical dosimetry methods.
Work o f many years has been invested in the development o f calorimeters.One o f the models is shown in Figs 6 and 7. Because o f the low dose rate available from our synchrotron, special efforts were made to raise the sensitivity. With special electronics a value o f 0.03 G y/m in (for an uncertainty o f repeatability smaller than 1%) has been reached for the lower limit o f the rated range o f dose rates.
Three graphite chambers have been built for the ionometric method, and these normally serve as primary standards o f exposure for 60Co 7 -radiation. Two o f them have been intercompared at the Bureau International des Poids et Mesures (BIPM) at Sèvres ([29 ]). The shape o f the chambers is cylindrical. They are o f equal heights, with volumes o f 0.5, 1.5 and 3.0 cm 3 .
For the chemical m ethod, ferrous sulphate solution was used in ampoules o f2 cm 3 volume. With a sophisticated system o f preparing the solution and with a Cary 118 spectrophotometer, a reproducibility o f better than 1 % has been obtained.
An extensive measuring programme is now in progress for comparing the three methods in the bremsstrahlung beam o f the PTB synchrotron at 42 MeV maximum energy. Three phantoms have been constructed, one made o f Perspex, one o f graphite and one o f polystyrene. Some characteristics o f the arrangements are indicated in Fig.8 . By calculation the results will be converted into absorbed dose in water and a best value will be determined. From this the C\ roentgen-to-rad conversion factor for some chambers will be determined.
One C^-value was recently obtained by a guest worker from the National Physical Laboratory (NPL, UK), John Barrett, who used the arrangement shown in Fig.9. Comparing the doses obtained with ferrous sulphate ampoules and with a 0.3 cm 3 thimble chamber (PTW N-chamber), he obtained the following figures fo r C x :
5 cm water depth (0.93 ± 0.01) rad/R10 cm water depth (0 .92 ± 0.01) rad/R
The ICRU value for 10 cm is 0.88 rad/R.
This clearly indicates that the currently used C^-value is too low by about 4%, in agreement with recent measurements o f Almond and Svenson [18].
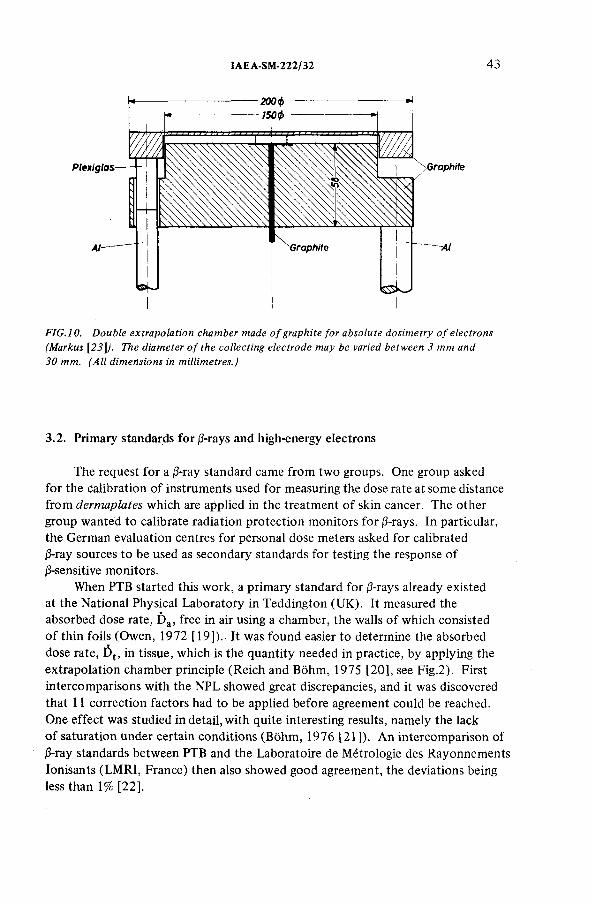
IAEA-SM-222/32 43
FIG.10. Double extrapolation chamber made o f graphite for absolute dosimetry o f electrons (Markus \23]). The diameter o f the collecting electrode may be varied between 3 mm and 30 mm. (All dimensions in millimetres.)
3.2. Primary standards for j3-rays and high-energy electrons
The request for a |3-ray standard came from two groups. One group asked for the calibration o f instruments used for measuring the dose rate at some distance from dermaplates which are applied in the treatment o f skin cancer. The other group wanted to calibrate radiation protection monitors for (3-rays. In particular, the German evaluation centres for personal dose meters asked for calibrated |3-ray sources to be used as secondary standards for testing the response o f0-sensitive monitors.
When PTB started this work, a primary standard for (3-rays already existed at the National Physical Laboratory in Teddington (UK). It measured the absorbed dose rate, Da, free in air using a chamber, the walls o f which consisted o f thin foils (Owen, 1972 [19]). It was found easier to determine the absorbed dose rate, Dt, in tissue, which is the quantity needed in practice, by applying the extrapolation chamber principle (Reich and Bôhm, 1975 [20], see Fig.2). First intercomparisons with the NPL showed great discrepancies, and it was discovered that 11 correction factors had to be applied before agreement could be reached. One effect was studied in detail, with quite interesting results, namely the lack o f saturation under certain conditions (Bôhm , 1976 [21 ]). An intercomparison o f /5-ray standards between PTB and the Laboratoire de Métrologie des Rayonnements Ionisants (LMRI, France) then also showed good agreement, the deviations being less than 1% [2 2 ].
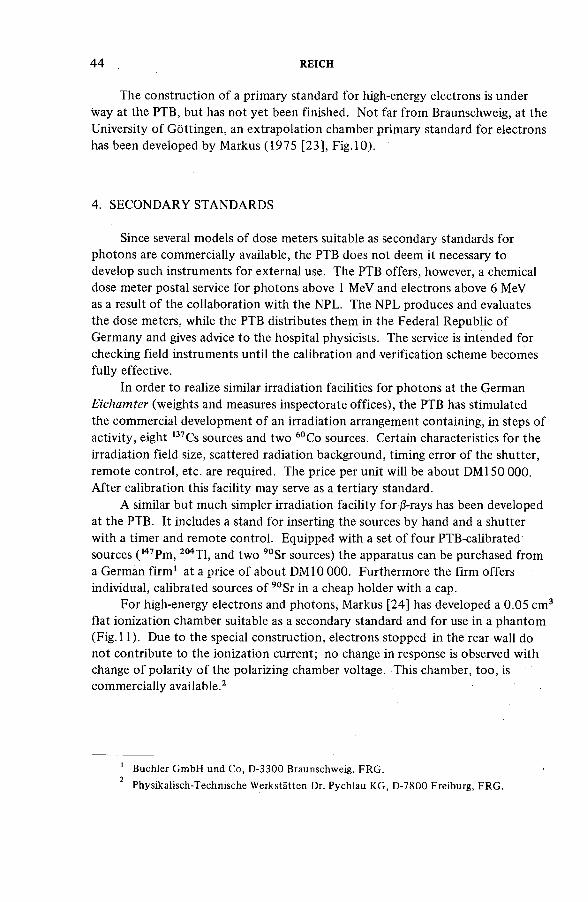
44 REICH
The construction o f a primary standard for high-energy electrons is under way at the PTB, but has not yet been finished. Not far from Braunschweig, at the University o f Gottingen, an extrapolation chamber primary standard for electrons has been developed by Markus (1975 [23], F ig.10).
4. SECONDARY STANDARDS
Since several models o f dose meters suitable as secondary standards for photons are commercially available, the PTB does not deem it necessary to develop such instruments for external use. The PTB offers, however, a chemical dose meter postal service for photons above 1 MeV and electrons above 6 MeV as a result o f the collaboration with the NPL. The NPL produces and evaluates the dose meters, while the PTB distributes them in the Federal Republic o f Germany and gives advice to the hospital physicists. The service is intended for checking field instruments until the calibration and verification scheme becomes fully effective.
In order to realize similar irradiation facilities for photons at the German Eichamter (weights and measures inspectorate offices), the PTB has stimulated the commercial development o f an irradiation arrangement containing, in steps o f activity, eight 137Cs sources and two 60Co sources. Certain characteristics for the irradiation field size, scattered radiation background, timing error o f the shutter, remote control, etc. are required. The price per unit will be about DM150 000. After calibration this facility may serve as a tertiary standard.
A similar but much simpler irradiation facility for (3-rays has been developed at the PTB. It includes a stand for inserting the sources by hand and a shutter with a timer and remote control. Equipped with a set o f four PTB-calibrated sources ( 147Pm, 204T1, and two 90Sr sources) the apparatus can be purchased from a German firm 1 at a price o f about DM10 000. Furthermore the firm offers individual, calibrated sources o f 90Sr in a cheap holder with a cap.
For high-energy electrons and photons, Markus [24] has developed a 0.05 cm 3 flat ionization chamber suitable as a secondary standard and for use in a phantom (F ig.l 1). Due to the special construction, electrons stopped in the rear wall do not contribute to the ionization current; no change in response is observed with change o f polarity o f the polarizing chamber voltage. This chamber, too , is commercially available.2
1 Buchler GmbH und Co, D-3300 Braunschweig, FRG .2 Physikalisch-Technische Werkstatten Dr. Pychlau KG, D-7800 Freiburg, FRG .
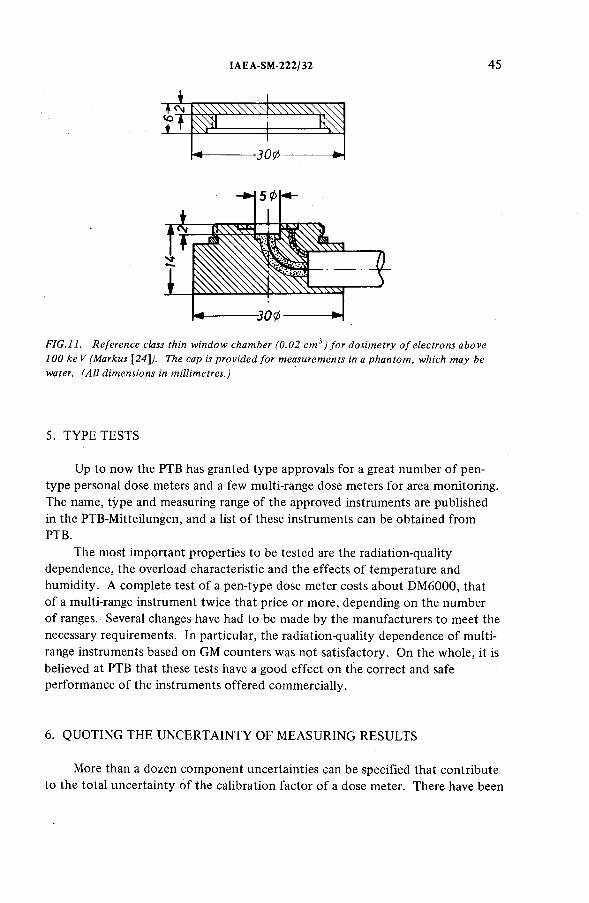
IAE A-SM-222/ 32 45
FIG.11. Reference class thin window chamber (0.02 cm 3 ) for dosimetry o f electrons above 100 k eV (Markus \24]J. The cap is provided for measurements in a phantom, which may be water. (All dimensions in millimetres.)
5. TYPE TESTS
Up to now the PTB has granted type approvals for a great number o f pen- type personal dose meters and a few multi-range dose meters for area monitoring. The name, type and measuring range o f the approved instruments are published in the PTB-Mitteilungen, and a list o f these instruments can be obtained from PTB.
The most important properties to be tested are the radiation-quality dependence, the overload characteristic and the effects o f temperature and humidity. A com plete test o f a pen-type dose meter costs about DM6000, that o f a multi-range instrument twice that price or more, depending on the number o f ranges. Several changes have had to be made by the manufacturers to meet the necessary requirements. In particular, the radiation-quality dependence o f multirange instruments based on GM counters was not satisfactory. On the whole, it is believed at PTB that these tests have a good effect on the correct and safe performance o f the instruments offered commercially.
6 . QUOTING THE UNCERTAINTY OF MEASURING RESULTS
More than a dozen com ponent uncertainties can be specified that contribute to the total uncertainty o f the calibration factor o f a dose meter. There have been
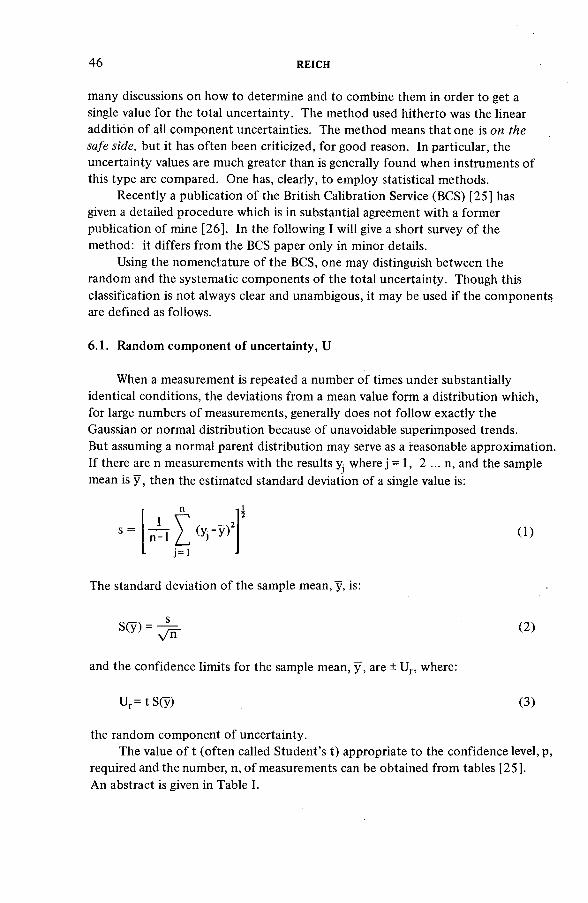
46 REICH
many discussions on how to determine and to combine them in order to get a single value for the total uncertainty. The method used hitherto was the linear addition o f all com ponent uncertainties. The method means that one is on the safe side, but it has often been criticized, for good reason. In particular, the uncertainty values are much greater than is generally found when instruments o f this type are compared. One has, clearly, to employ statistical methods.
Recently a publication o f the British Calibration Service (BCS) [25] has given a detailed procedure which is in substantial agreement with a former publication o f mine [26]. In the following I will give a short survey o f the method: it differs from the BCS paper only in minor details.
Using the nomenclature o f the BCS, one may distinguish between the random and the systematic components o f the total uncertainty. Though this classification is not always clear and unambigous, it may be used if the components are defined as follows.
6.1. Random com ponent o f uncertainty, U
When a measurement is repeated a number o f times under substantially identical conditions, the deviations from a mean value form a distribution which, for large numbers o f measurements, generally does not follow exactly the Gaussian or normal distribution because o f unavoidable superimposed trends.But assuming a normal parent distribution may serve as a reasonable approximation. If there are n measurements with the results yj where j = 1, 2 ... n, and the sample mean is ÿ , then the estimated standard deviation o f a single value is:
( 1 )
j= i
The standard deviation o f the sample mean, y, is:
S(y) = ^ = - ( 2)
and the confidence limits for the sample mean, y , are ± Ur, where:
Ur= tS (y ) (3)
the random com ponent o f uncertainty.The value o f t (often called Student’s t) appropriate to the confidence level, p,
required and the number, n, o f measurements can be obtained from tables [25].An abstract is given in Table I.
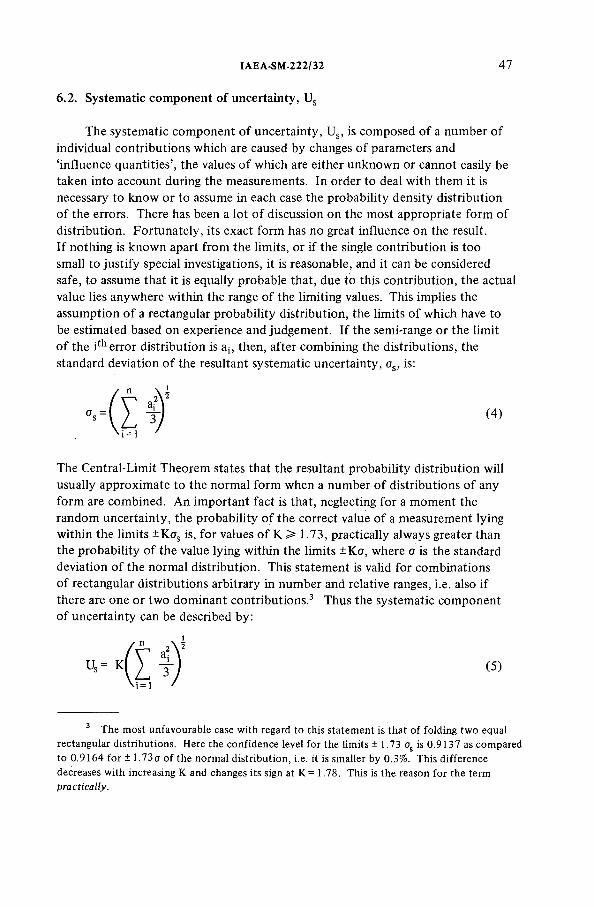
IAEA-SM-222/32 47
The systematic com ponent o f uncertainty, Us, is com posed o f a number o f individual contributions which are caused by changes o f parameters and ‘influence quantities’ , the values o f which are either unknown or cannot easily be taken into account during the measurements. In order to deal with them it is necessary to know or to assume in each case the probability density distribution o f the errors. There has been a lot o f discussion on the most appropriate form o f distribution. Fortunately, its exact form has no great influence on the result.I f nothing is known apart from the limits, or if the single contribution is too small to justify special investigations, it is reasonable, and it can be considered safe, to assume that it is equally probable that, due to this contribution, the actual value lies anywhere within the range o f the limiting values. This implies the assumption o f a rectangular probability distribution, the limits o f which have to be estimated based on experience and judgement. If the semi-range or the limit o f the ith error distribution is a¡, then, after combining the distributions, the standard deviation o f the resultant systematic uncertainty, cts, is:
6.2. Systematic component of uncertainty, Us
The Central-Limit Theorem states that the resultant probability distribution will usually approximate to the normal form when a number o f distributions o f any form are combined. An important fact is that, neglecting for a moment the random uncertainty, the probability o f the correct value o f a measurement lying within the limits ±K as is, for values o f К > 1.73, practically always greater than the probability o f the value lying within the limits ± Ka, where a is the standard deviation o f the normal distribution. This statement is valid for combinations o f rectangular distributions arbitrary in number and relative ranges, i.e. also if there are one or two dominant contributions.3 Thus the systematic com ponent o f uncertainty can be described by:
rectangular distributions. Here the confidence level for the limits ± 1.73 as is 0.9137 as compared to 0.9164 for ± 1.73a of the normal distribution, i.e. it is smaller by 0.3%. This difference decreases with increasing К and changes its sign at K= 1.78. This is the reason for the term practically.
(4)
(5)
3 The most unfavourable case with regard to this statement is that of folding two equal
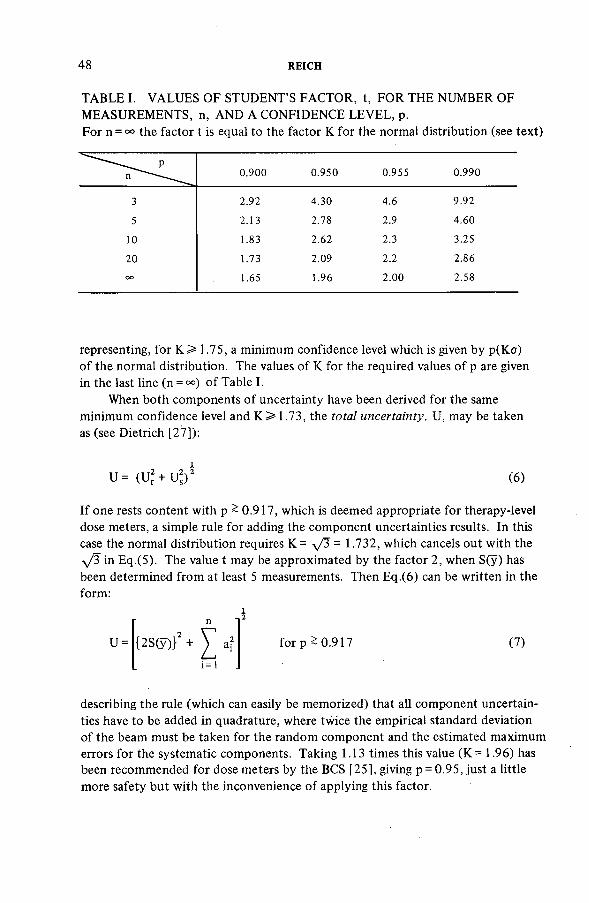
48 REICH
TABLE I. VALUES OF STUDENT’S FACTOR, t, FOR THE NUMBER OF MEASUREMENTS, n, AND A CONFIDENCE LEVEL, p.For n = 00 the factor t is equal to the factor К for the normal distribution (see text)
nP
0.900 0.950 0.955 0.990
3 2.92 4.30 4.6 9.92
5 2.13 2.78 2.9 4.60
10 1.83 2.62 2.3 3.25
20 1.73 2.09 2.2 2.86
O O 1.65 1.96 2.00 2.58
representing, for К > 1.75, a minimum confidence level which is given by р(Кст) o f the normal distribution. The values o f К for the required values o f p are given in the last line (n = °°) o f Table I.
When both components o f uncertainty have been derived for the same minimum confidence level and К > 1.73, the total uncertainty, U, may be taken as (see Dietrich [27]):
U = (Ur + Ug)5 (6)
If one rests content with p ~ 0.917, which is deemed appropriate for therapy-level dose meters, a simple rule for adding the com ponent uncertainties results. In this case the normal distribution requires К = y/5 = 1.732, which cancels out with the л/3 in Eq.(5). The value t may be approximated by the factor 2, when S(y) has been determined from at least 5 measurements. Then E q.(6) can be written in the form:
U = {2S (y )}
11
Ii = l
for p £ 0.917 (7)
describing the rule (which can easily be memorized) that all com ponent uncertainties have to be added in quadrature, where twice the empirical standard deviation o f the beam must be taken for the random com ponent and the estimated maximum errors for the systematic components. Taking 1.13 times this value (K = 1.96) has been recommended for dose meters by the BCS [25], giving p = 0.95, just a little more safety but with the inconvenience o f applying this factor.
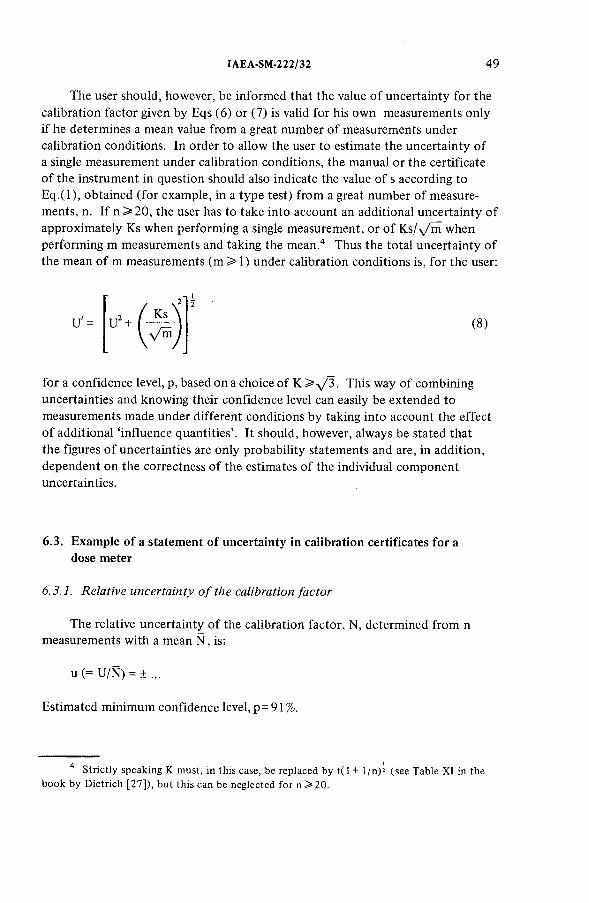
IAEA-SM-222/32 49
The user should, however, be informed that the value o f uncertainty for the calibration factor given by Eqs ( 6) or (7 ) is valid for his own measurements only if he determines a mean value from a great number o f measurements under calibration conditions. In order to allow the user to estimate the uncertainty o f a single measurement under calibration conditions, the manual or the certificate o f the instrument in question should also indicate the value o f s according to E q .(l), obtained (for example, in a type test) from a great number o f measurements, n. If n > 20, the user has to take into account an additional uncertainty o f approximately Ks when performing a single measurement, or o f K s/> /m when performing m measurements and taking the mean.4 Thus the total uncertainty o f the mean o f m measurements ( m > l ) under calibration conditions is, for the user:
for a confidence level, p, based on a choice o f К > > /3 . This way o f combining uncertainties and knowing their confidence level can easily be extended to measurements made under different conditions by taking into account the effect o f additional ‘ influence quantities’ . It should, however, always be stated that the figures o f uncertainties are only probability statements and are, in addition, dependent on the correctness o f the estimates o f the individual com ponent uncertainties.
6.3. Example o f a statement o f uncertainty in calibration certificates for a dose meter
6.3.1. Relative uncertainty o f the calibration factor
The relative uncertainty o f the calibration factor, N, determined from n measurements with a mean N , is:
u (= U/Ñ) = ± ...
Estimated minimum confidence level, p = 91 %.
A 1Strictly speaking К must, in this case, be replaced by t ( l + 1/n)5" (see Table X I in the
book by Dietrich [27]), but this can be neglected for n>20.
2
(8)
50 REICH
The relative uncertainty o f the measured exposure (or absorbed dose), determined as the mean o f m measurements by the user under calibration conditions, is:
± (u2 + r2/m )2
where r = ± ... is the relative uncertainty o f repeatability for a single reading for the confidence level, p, as given above, (r has been determined as ... times the estimated relative standard deviation o f a single reading by n = ... measurements).
6.3.2. Relative uncertainty o f measured exposure
REFERENCES
[1] Atomgesetz, Bundesgesetzblatt, Teil 1 (31 Oct. 1976) 305 3.[2] Rôntgenverordnung, Bundesgesetzblatt, Teil 1 (1 Mar. 1973) 173.[3] Strahlenschutzverordnung, Bundesgesetzblatt, Teil 1 (13 Oct. 1976) 2905; Bundesgesetz
blatt, Teil 1 (1977) 184, 269.[4] Eichgesetz, Bundesgesetzblatt, Teil 1(11 Jul. 1969) 759.[5] Zweite Verordnung über die Eichpflicht von Mefigeraten, Bundesgesetzblatt, Teil 1
(6 Aug. 1975) 2161.[6 ] Eichgültigkeitsverordnung, Bundesgesetzblatt, Teil 1 (5 Aug. 1976) 2082.[7] Anforderungen der Physikalisch-Technischen Bundesanstalt an Strahlenschutzdosimeter
für die Zulassung zur Eichung, PTB Mitt. 84 (1974) 270.[8 ] Eichordnung, Neufassung 1975, Band A V (allgemeine Vorschriften); Erlauteningen zur
Eichordnung AV; Deutscher Eichverlag, D-3300 Braunschweig (1975).[9] Strahlenschutzdosimeter für Photonenstrahlung mit Energien zwischen 5 keV und
3 MeV, PTB-Prüfregeln 11, Ref.S, PTB, D-3300 Braunschweig (1977).[10] Eichanweisung, Allgemeine Vorschriften vom 12. Juni 1973, Bundesanzeiger Verlags-
gesellschaft mbH, D-5000 Kôln (1973).[11] IN T ER N A T IO N A L COMM ISSION ON R AD IA T IO N UN ITS AND M EA SU R EM EN TS ,
Measurement of Absorbed Dose in a Phantom Irradiated by a Single Beam of X or Gamma Rays, IC R U Report 23, ICRU , Washington, DC (1973).
[12] COHEN, М., JO N ES, D.E.A., G R EEN E , D., Eds, Central axis depth dose data for use in radiotherapy, Br. J. Radiol., Suppl. 1 1 (1972).
[13] WACHSMANN, F., D R E X L E R , G., Graphs and Tables for Use in Radiology, Springer Verlag, Berlin, Heidelberg, New York (1976).
[14] BOHM, J., H O H LFELD , K., REIC H , H., these Proceedings, paper IAEA-SM-222/30.[15] BOHM, J., PTB-Jahresber. (1973) 75; (1974) 224.[16] H A R D ER , D., M Ü LL ER , U., private communication, 1977.[17] SC H N EID ER , U., PTB-Jahresber. (1976) 164.[18] ALM OND, P.R., SVENSSO N , H., Acta Radiol. 16 (1977) 177.[19] OWEN, B., Phys. Med. Biol. 17 (1972) 175.[20] REICH , H., BOHM, J., Phys. Med. Biol. 20 (1975) 1031.[21] BOHM, J., Phys. Med. Biol. 21 (1976) 754.
IAE A-SM-222/ 32 51
[22] BOHM, J., H ILL IO N , P., SIM OEN, J.P., “ Intercomparison of the PTB and LM R I standards in beta dosimetry” , 8 e Congr. Int. de la SFR , Saclay, mars 1976.
[23] M ARKUS, B., Strahlentherapie ISO (1975) 307-20.[24] M ARKUS, B., Strahlentherapie 152 (1976) 517-32.[25] B R IT ISH C A L IBR A T IO N SER V IC E , Guidance Publication No.3003, Publisher: National
Physical Laboratory, Teddington (Apr. 1977)); Guidance Publication No.3004, second draft (Aug. 1977).
[26] REICH , H., PTB-Mitt. 86(1976) 421.[27] D IETR IC H , C.F., Uncertainty, Calibration and Probability, Adam Hilger, London (1973).[28] E N G EL K E , B.-A., H O H LFELD , K., PTB-Mitt. 81 (1971) 336.[29] N IA T EL , М.-T., LO FTUS, T.P., OETZM ANN, W., Metrología 11 (1975) 17.
DISCUSSION
H.H. EISENLOHR ( Scientific Secretary): Could you expand a little on the dissemination o f radiological units as organized in the Federal Republic o f Germany?
H. REICH: I should mention four institutions:
(1) The Eichàmter (verification offices) o f the eleven German Federal States may be considered as national SSDLs in accordance with the Eichgesetz (Law on Metrology and Verification). Three o f them have installed, or are going to install, laboratories for the verification o f dose meters;
(2) The so-called Eichabfertigungsstellen (verification dispatch offices) act on behalf o f an Eichamt at manufacturers’ laboratories. At present, there exists only one Eichabfertigungsstelle for radiation protection dose meters, at the firm Frieseke und Hoepfner, Erlangen. This firm calibrates and verifies such instruments under permanent official supervision;
(3) For a transition period o f several years (at least until 1980) there will be about 15 offices acting as parts o f, or under the supervision o f, public health authorities o f the Federal States, and performing calibration control o f dose meters used in radiotherapy facilities, under the X-ray Ordinance o f 1973. Official recognition for this task has also been given to a commercial company (Physikalisch-Technische Werkstâtten Dr. Pychlau KG, Freiburg) because o f its long experience in producing and calibrating therapy-level dose meters;
(4) On the analogy o f the British Calibration Service, a German calibration service has been introduced in which calibrations are performed under the responsibility o f the manufacturers on the basis o f a contract between the PTB and certain manufacturers. The PTB provides advice and some general supervision. This service is primarily for instruments which are to be exported and hence will not be used where German law applies.
52 REICH
All o f these offices and laboratories posses secondary standards which are linked to the standards o f PTB. The PTB gives advice on the setting up o f new laboratories, but it has no supervisory functions besides those I have just mentioned.
K. ZSDANSZKY: What is the time period for the recalibration o f field instruments?
H. REICH: For radiation protection dose meters that are subject to the verification ordinance, the reverification interval is two years i f no radioactive check source is available. When a multi-range instrument and a check source are available for periodic checking o f one measuring range, the interval is six years. No time limit exists when all measuring ranges are checked regularly.
For therapy-level dose meters the availability o f a check source for at least one measuring range is assumed. The re verification interval for instruments which are checked regularly in all measuring ranges is six years. All these intervals are, o f course, subject to change after some years if experience shows a change to be necessary.
Y. NISHIWAKI: What environmental tests are required by law in the Federal Republic o f Germany for radiation protection instruments which may be used under widely different conditions? What ranges o f temperature, pressure, humidity, vibration, electromagnetic interference, capacitance effects and so on are prescribed for the tests o f such instruments?
H. REICH: The article cited as Ref. [7] describes all requirements in detail. For example, the limits o f variation o f response for such effects as temperature, pressure and humidity are ± 20%, ± 5% and ± 20%, respectively, in the rated ranges, as claimed by the manufacturer. No quantitative requirements are given for mechanical vibration or electrostatic or electromagnetic interference.
L.H. LAN ZL: Can you explain why the backscatter factors in your measurements are lower than those in your references? At 7.5 kV your value is less than1.00 although the uncertainty includes 1 .00 .
H. REICH: I have no explanation; we have not studied the possible reasons. The value smaller than unity at 7.5 kV has no physical meaning; it characterizes only the uncertainty.
IAEA-SM-222/30
A PRIMARY STANDARD FOR DETERMINATION OF ABSORBED DOSE IN WATER FOR X-RAYS GENERATED AT POTENTIALS OF 7.5 TO 30 kVJ. BOHM, K. HOHLFELD, H. REICH Physikalisch-Technische Bundesanstalt,Braunschweig,Federal Republic o f Germany
Abstract
A PR IM A R Y STAND ARD FO R D ETER M IN A T IO N OF A BSO R BED DO SE IN W A T ER FO R X-RAYS G EN ER A T ED AT PO T EN T IA LS O F 7.5 TO 30 kV.
An air-filled extrapolation chamber with a thin entrance window and a thick graphite back wall was used as a primary standard measuring device from which the unit of absorbed dose in water could be derived in a more direct and reliable way than by exposure measurements made free in air. The chamber is suitable for low-energy X-rays generated at potentials from 7.5 to 30 kV. The underlying principle, first used by Quimby and Focht in 1943, is to measure the increment of ionization per increment of chamber volume at chamber depths greater than the range of secondary electrons originating in the walls, thereby eliminating the mismatch between the different materials of which the chamber walls and chamber gas consist. The fundamentals for evaluating the extrapolation curves are discussed. The accuracy in determining the so-called equilibrium ion dose (the quantity from which the absorbed dose can be calculated) is sufficient to satisfy the requirements for a primary standard.
1. INTRODUCTION
Therapy-level ionization chambers for soft X-rays, the so-called thin-window chambers that are used in the treatment o f skin cancer, have up to now been calibrated only in terms o f the quantity exposure free in air, because primary standards for the desired quantity, absorbed dose to water in a water phantom, were not available. A com m on way o f obtaining this quantity is to use conversion factors which relate the exposure at the reference point in the absence o f the phantom to the absorbed dose at this point with the phantom in position [ 1 —3]. The lack o f agreement between published conversion factors means that large uncertainties have to be assumed when using these data, and this underlines the importance o f setting up a primary standard which realizes the unit o f the desired quantity more directly.
Absorbed dose measurements o f low-energy X-rays by means o f ionization chambers are influenced by the fact that the electron fluence inside the chamber
53
54 BÔHM et al.
partly stems from the chamber walls and partly from the chamber gas. The mismatch in effective atom ic number between the chamber walls and chamber gas, being the main reason for the lack o f charged-particle equilibrium (CPE, see ICRU Report 10b [4]), impedes the determination o f the absorbed dose. A method o f overcoming this difficulty using extrapolation chamber measurements was, to our knowledge, first proposed by Quimby and Focht in 1943 [5]. Their idea was to get rid o f the wall effect by determining the increment o f ionization per increment o f chamber volume at chamber depths greater than the range o f the secondary electrons originating in the walls. The extrapolation chamber, thereby, represents a wall-less air chamber. This differs significantly from the com m on free-air chamber in that the latter is placed free in air and the photon fluence is not changed by absorption and scattering in its walls and surrounding material. But the contributions o f the wall o f an ionization chamber positioned in a phantom, as well as the contribution o f the phantom itself, are needed for the determination o f absorbed dose in a phantom.
In contrast to the quantity exposure as obtained in free-air chambers,Quimby and Focht determined a quantity which we refer to in the following as the chamber equilibrium ion dose, Ja. From this quantity the required absorbed dose in water may be obtained by applying photon absorption coefficient ratios and the W /e value for air.
Ja is the ion dose in the air-filled cavity o f an ionization chamber surrounded by air-equivalent walls when charged-particle equilibrium (CPE) exists. The ion dose, J (i.e. without a subscript), is defined as the quotient o f dQ by dm, where dQ is the electrical charge o f the ions o f one sign produced within the mass element, dm, o f air. Ja is numerically equal to the exposure X inside a phantom as defined in ICRU Report 19, Ц 16, note (c ) [6 ]. In this paper the method o f Quimby and Focht is first discussed and somewhat improved upon (§2 ). Then measurements are described by which the applicability o f the method for providing a primary standard is checked.
2. EXTRAPOLATION METHOD FOR DETERMINING THE CHAMBEREQUILIBRIUM ION DOSE, Ja
The ion dose J(£,x) inside the chamber is assumed to be com posed o f an undisturbed ion dose Ju(£) occurring in the case o f chamber walls fully matched to the chamber gas and the superimposed, additive ion doses Jf(£,x) and Jb(£,x) describing the influences o f the front wall and back wall, respectively:
J(É,x) = JU(É) + Jf(£,x) + Jb(É,x) (1)
The variable x is the distance o f the back wall from the front wall (the chamber depth), whereas £ denotes the position within the chamber with respect to the
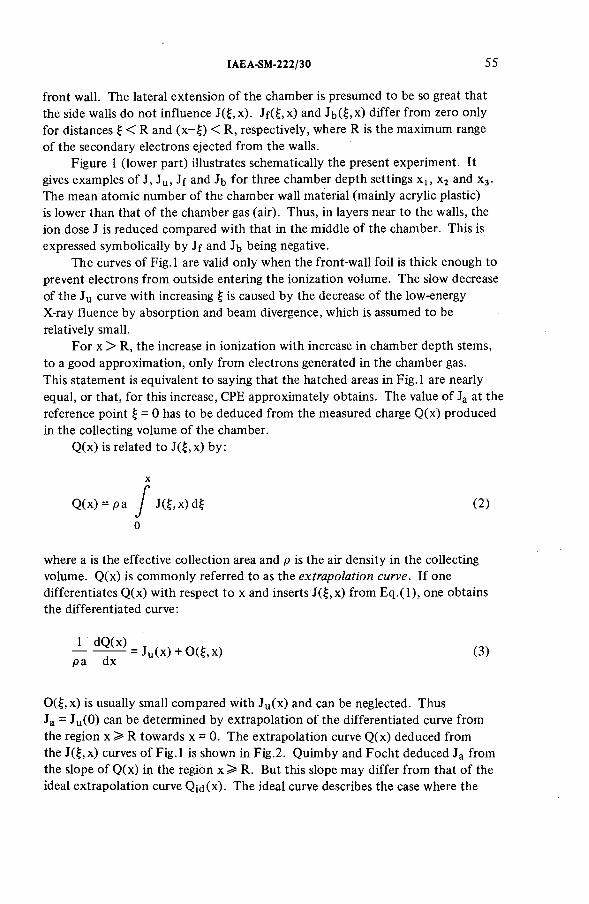
IAEA-SM-222/30 55
front wall. The lateral extension o f the chamber is presumed to be so great that the side walls do not influence J(£,x). Jf(£ ,x) and Jb(£,x) differ from zero only for distances £ < R and (x -£ ) < R , respectively, where R is the maximum range o f the secondary electrons ejected from the walls.
Figure 1 (lower part) illustrates schematically the present experiment. It gives examples o f J, Ju , Jf and Jb for three chamber depth settings , x2 and x 3. The mean atom ic number o f the chamber wall material (mainly acrylic plastic) is lower than that o f the chamber gas (air). Thus, in layers near to the walls, the ion dose J is reduced compared with that in the middle o f the chamber. This is expressed symbolically by Jf and Jb being negative.
The curves o f F ig.l are valid only when the front-wall foil is thick enough to prevent electrons from outside entering the ionization volume. The slow decrease o f the Ju curve with increasing £ is caused by the decrease o f the low-energy X-ray fluence by absorption and beam divergence, which is assumed to be relatively small.
For x > R, the increase in ionization with increase in chamber depth stems, to a good approximation, only from electrons generated in the chamber gas.This statement is equivalent to saying that the hatched areas in Fig.l are nearly equal, or that, for this increase, CPE approximately obtains. The value o f Ja at the reference point £ = 0 has to be deduced from the measured charge Q (x ) produced in the collecting volume o f the chamber.
Q (x ) is related to J(£, x) by:
where a is the effective collection area and p is the air density in the collecting volume. Q (x) is com m only referred to as the extrapolation curve. I f one differentiates Q (x ) with respect to x and inserts J(£,x) from E q .( l ) , one obtains the differentiated curve:
0 (£ ,x ) is usually small compared with Ju(x ) and can be neglected. Thus Ja = Ju(0) can be determined by extrapolation o f the differentiated curve from the region x > R towards x = 0. The extrapolation curve Q (x ) deduced from the J(£,x) curves o f Fig.l is shown in Fig.2. Quimby and Focht deduced Ja from the slope o f Q (x ) in the region x > R. But this slope may differ from that o f the ideal extrapolation curve Q id(x). The ideal curve describes the case where the
x
(2)0
1 dQ (x) pa dx
= Ju(x ) + 0 (£ ,x ) (3)
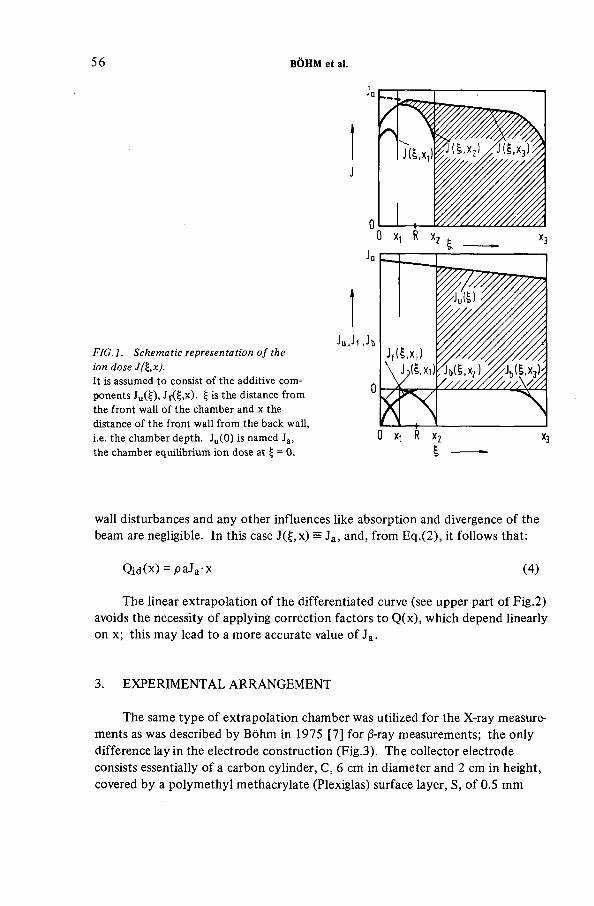
56 BÔHM et al.
Jq
J
0о X, R x2 ̂ _ x3
Jq
J u j J1 . J bFIG .l. Schematic representation o f the ion doseIt is assumed to consist of the additive components J u(i|), Jf(Sj,x)- X is the distance from the front wall of the chamber and x the distance of the front wall from the back wall, i.e. the chamber depth. J u(0 ) is named J a, О X} R X2 X3the chamber equilibrium ion dose at £ = 0 . I -----
wall disturbances and any other influences like absorption and divergence o f the beam are negligible. In this case J(£,x) = Ja, and, from E q.(2), it follow s that:
Qid(x) = paJa-x (4)
The linear extrapolation o f the differentiated curve (see upper part o f Fig.2) avoids the necessity o f applying correction factors to Q (x ), which depend linearly on x; this may lead to a more accurate value o f Ja .
3. EXPERIMENTAL ARRANGEMENT
The same type o f extrapolation chamber was utilized for the X-ray measurements as was described by Bôhm in 1975 [7] for /З-ray measurements; the only difference lay in the electrode construction (Fig.3). The collector electrode consists essentially o f a carbon cylinder, C, 6 cm in diameter and 2 cm in height, covered by a polym ethyl methacrylate (Plexiglas) surface layer, S, o f 0.5 mm
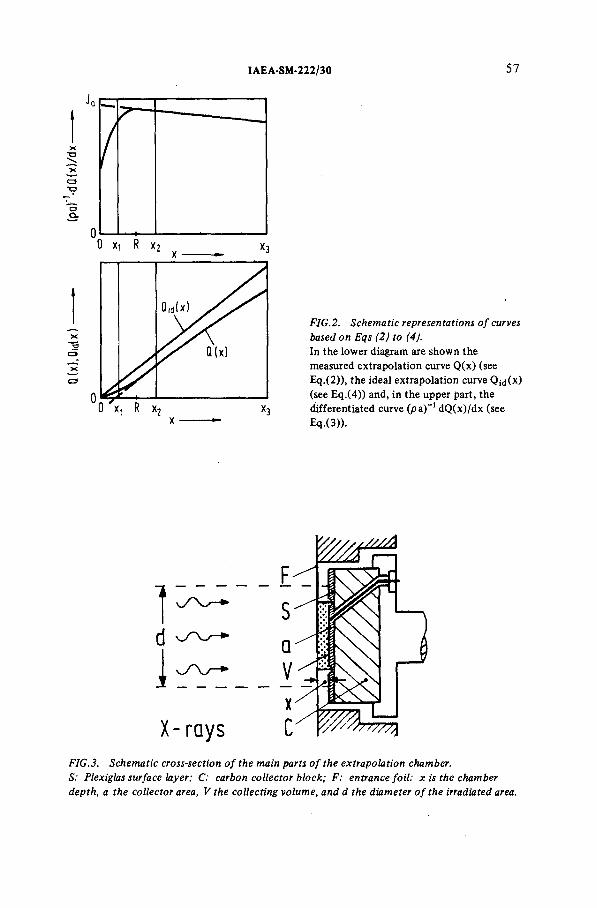
IAEA-SM-222/30 57
FIG.2. Schematic representations o f curves based on Eqs (2) to (4).In the lower diagram are shown the measured extrapolation curve Q(x) (see Eq.(2)), the ideal extrapolation curve Q¡<j(x) (see Eq.(4)) and, in the upper part, the differentiated curve (pa) -1 dQ(x)/dx (see Eq.(3)).
FIG.3. Schematic cross-section o f the main parts o f the extrapolation chamber.S: Plexiglas surface layer; C: carbon collector block; F : entrance fo il: x is the chamber depth, a the collector area, V the collecting volume, and d the diameter o f the irradiated area.
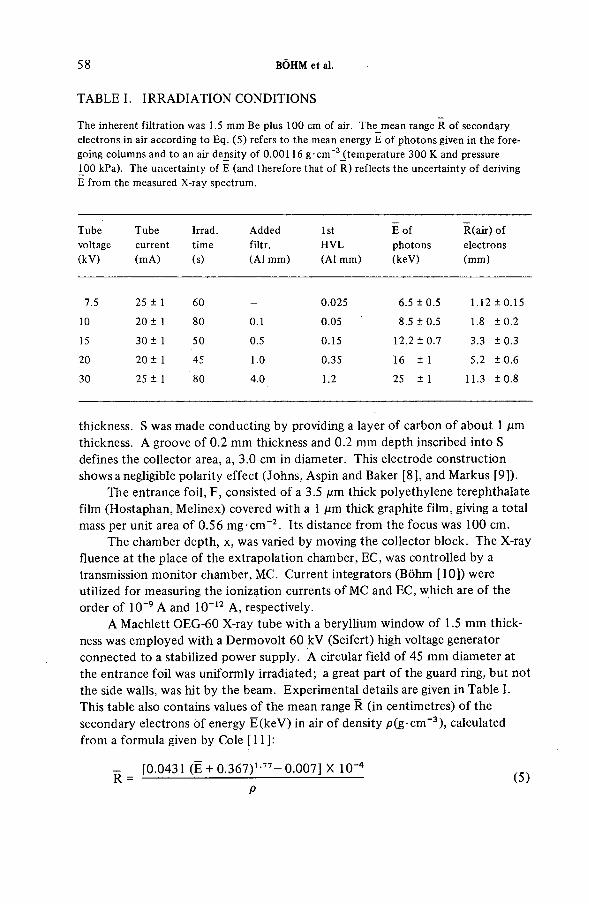
58 BÔHM et al.
The inherent filtration was 1.5 mm Be plus 100 cm of air. The_mean range R of secondary electrons in air according to Eq. (5) refers to the mean energy E of photons given in the foregoing columns and to an air density of 0.00116 g-cm“3_(temperature 300 К and pressure 100 kPa). The uncertainty of E (and therefore that of R ) reflects the uncertainty of deriving E from the measured X-ray spectrum.
TABLE I. IRRADIATION CONDITIONS
Tubevoltage(kV )
Tubecurrent(mA)
Irrad.time(s)
Addedfiltr.(A l mm)
1st H V L (A l mm)
E ofphotons(keV)
R(air) of electrons (mm)
7.5 25 ± 1 60 _ 0.025 6.5 ±0.5 1.12 ±0.15
10 20 ± 1 80 0.1 0.05 8.5 ±0.5 1.8 ± 0.2
15 30 ± 1 50 0.5 0.15 12.2 ± 0.7 3.3 ±0.3
20 20 ± 1 45 1.0 0.35 16 ± 1 5.2 ±0.6
30 25 ± 1 80 4.0 1.2 25 ± 1 11.3 ±0.8
thickness. S was made conducting by providing a layer o f carbon o f about 1 jum thickness. A groove o f 0.2 mm thickness and 0.2 mm depth inscribed into S defines the collector area, a, 3.0 cm in diameter. This electrode construction shows a negligible polarity effect (Johns, Aspin and Baker [8 ], and Markus [9]).
The entrance foil, F, consisted o f a 3.5 Atm thick polyethylene terephthalate film (Hostaphan, Melinex) covered with a 1 цт thick graphite film, giving a total mass per unit area o f 0.56 mg cm -2 . Its distance from the focus was 100 cm.
The chamber depth, x, was varied by moving the collector block. The X-ray fluence at the place o f the extrapolation chamber, EC, was controlled by a transmission m onitor chamber, MC. Current integrators (Bohm [10]) were utilized for measuring the ionization currents o f MC and EC, which are o f the order o f 10" 9 A and 10-12 A , respectively.
A Machlett OEG-60 X-ray tube with a beryllium window o f 1.5 mm thickness was em ployed with a Derm ovolt 60 kV (Seifert) high voltage generator connected to a stabilized power supply. A circular field o f 45 mm diameter at the entrance foil was uniformly irradiated; a great part o f the guard ring, but not the side walls, was hit by the beam. Experimental details are given in Table I. This table also contains values o f the mean range R (in centimetres) o f the secondary electrons o f energy E (keV ) in air o f density p (g -cm -3 ), calculated from a formula given by Cole [11]:
- [0.0431 (E + 0 .367 )1-77- 0.007] X 10 ' 4R —
P(5)
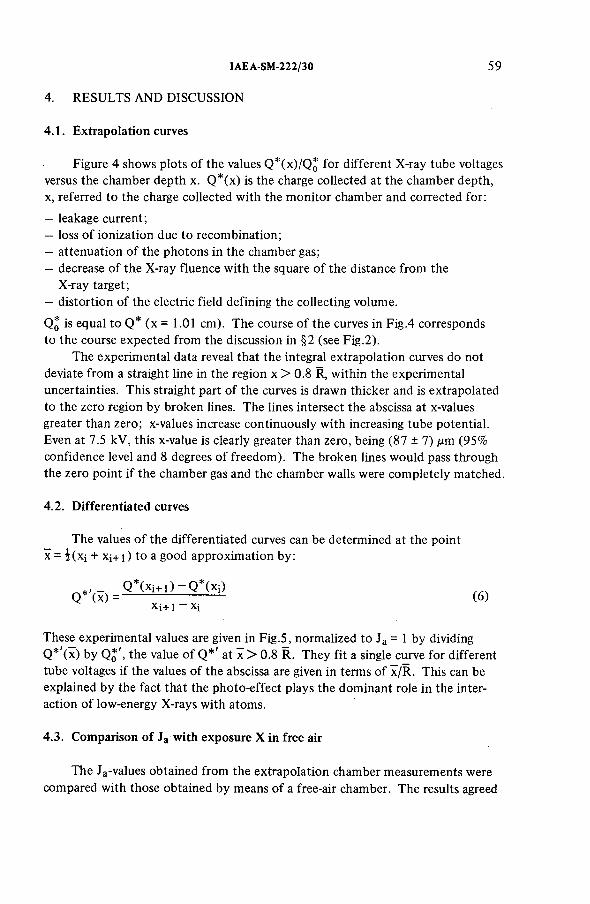
IAEA-SM-222/30 59
4.1. Extrapolation curves
Figure 4 shows plots o f the values Q *(x)/Q g for different X-ray tube voltages versus the chamber depth x. Q *(x ) is the charge collected at the chamber depth, x, referred to the charge collected with the monitor chamber and corrected for:
— leakage current;— loss o f ionization due to recombination;— attenuation o f the photons in the chamber gas;— decrease o f the X-ray fluence with the square o f the distance from the
X-ray target;— distortion o f the electric field defining the collecting volume.
Q q is equal to Q* (x = 1.01 cm). The course o f the curves in Fig.4 corresponds to the course expected from the discussion in §2 (see Fig.2).
The experimental data reveal that the integral extrapolation curves do not deviate from a straight line in the region x > 0.8 R, within the experimental uncertainties. This straight part o f the curves is drawn thicker and is extrapolated to the zero region by broken lines. The lines intersect the abscissa at x-values greater than zero; x-values increase continuously with increasing tube potential. Even at 7.5 kV, this x-value is clearly greater than zero, being (87 ± 7) /ли (95% confidence level and 8 degrees o f freedom ). The broken lines would pass through the zero point if the chamber gas and the chamber walls were completely matched.
4.2. Differentiated curves
The values o f the differentiated curves can be determined at the point x = i ( x ¡ + Xj+ 1 ) to a good approximation by:
Q W WX i+ l-X j
These experimental values are given in Fig.5, normalized to Ja = 1 by dividing Q * '(x ) by Q 0* ', the value o f Q * ’ at x > 0.8 R. They fit a single curve for different tube voltages if the values o f the abscissa are given in terms o f x /R . This can be explained by the fact that the photo-effect plays the dominant role in the interaction o f low-energy X-rays with atoms.
4.3. Comparison o f Ja with exposure X in free air
4. RESULTS AND DISCUSSION
The Ja-values obtained from the extrapolation chamber measurements were compared with those obtained by means o f a free-air chamber. The results agreed
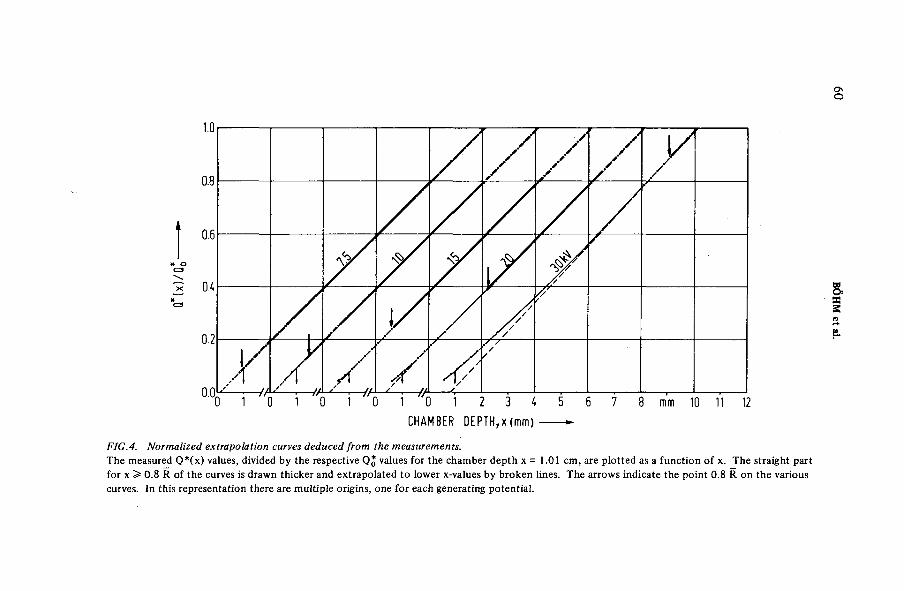
0\о
FIG.4. Normalized extrapolation curves deduced from the measurements.The measured Q*(x) values, divided by the respective Q J values for the chamber depth x = 1.01 cm, are plotted as a function of x. The straight part for x > 0.8 R of the curves is drawn thicker and extrapolated to lower x-values by broken lines. The arrows indicate the point 0.8 R on the various curves. In this representation there are multiple origins, one for each generating potential.
BÓHM
et al.
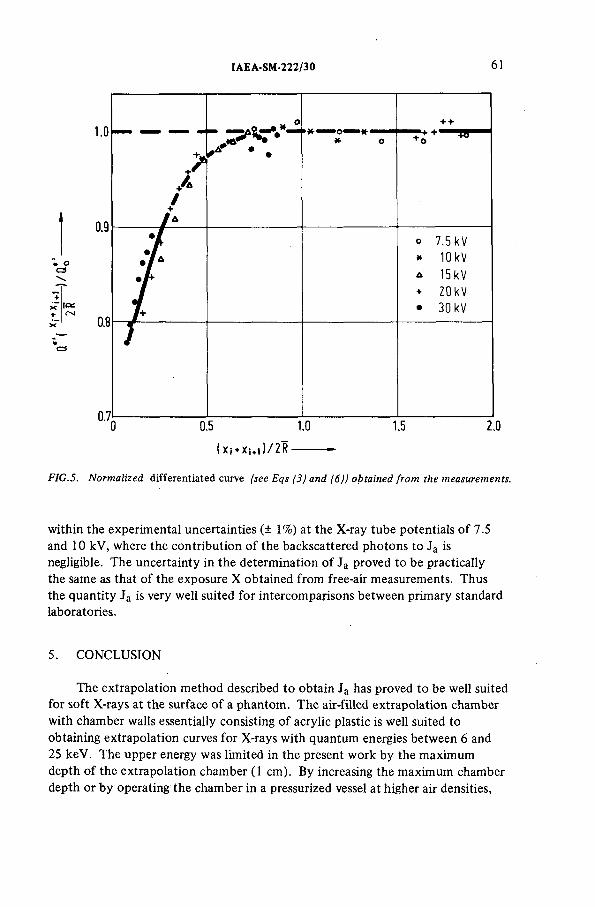
IAEA-SM-222/30 61
FIG.S. Normalized differentiated curve (see Eqs (3) and (6)) obtained from the measurements.
within the experimental uncertainties (± 1%) at the X-ray tube potentials o f 7.5 and 10 kV, where the contribution o f the backscattered photons to Ja is negligible. The uncertainty in the determination o f Ja proved to be practically the same as that o f the exposure X obtained from free-air measurements. Thus the quantity Ja is very well suited for intercomparisons between primary standard laboratories.
5. CONCLUSION
The extrapolation method described to obtain Ja has proved to be well suited for soft X-rays at the surface o f a phantom. The air-filled extrapolation chamber with chamber walls essentially consisting o f acrylic plastic is well suited to obtaining extrapolation curves for X-rays with quantum energies between 6 and 25 keV. The upper energy was limited in the present work by the maximum depth o f the extrapolation chamber (1 cm). By increasing the maximum chamber depth or by operating the chamber in a pressurized vessel at higher air densities,
62 BÔHM et al.
the upper limit o f 25 keV could easily be increased. Thus extrapolation chambers o f the type described are well suited for use as primary standards for determining the absorbed dose in water or in tissue more directly than was possible previously.
REFERENCES
[1] IN T ER N A T IO N A L COMM ISSION ON RA D IA T IO N UN ITS AND M EA SU REM EN TS, Measurement of Absorbed Dose in a Phantom Irradiated by a Single Beam of X or Gamma Rays, IC R U Report 23, ICRU , Washington, DC (1973).
[2] COHEN, М., JO N ES, D.E.A., G R E EN E , D., Eds., Central axis depth dose data for use in radiotherapy. Br. J. Radiol. Suppl. 11 (1972).
[3] WACHSMANN, F., D R E X L E R , G., Graphs and Tables for Use in Radiology, Springer Verlag, Berlin, Heidelberg, New York (1976).
[4] IN T ER N A T IO N A L COMMISSION ON RA D IA T IO N UN ITS AND M EA SU R EM EN TS , Physical Aspects of Irradiation, IC R U Report 10b, ICRU , Washington, DC (1964).
[5] Q U IM BY , E.H., FOCHT, E.F., Dosage measurement in contact roentgen therapy,Am. J. Roentg. SO (1943) 653.
[6 ] IN T ER N A T IO N A L COMM ISSION ON RA D IA T IO N UN ITS AND M EA SU R EM EN TS , Radiation Quantities and Units, IC R U Report 19, IC R U Washington, DC (1971).
[7] BÔHM, J., Die Kalibrierung von Beta-Dosismessgerâten und Beta-Strahlenquellen in der Physikalisch-Technischen Bundesanstalt, Kernforschungszentrum Karlsruhe,Rep. KFK-2185 (1975) 31.
[8 ] JOHNS, H .E., ASPIN , N., B A K ER , R.G., Current induced in the dielectrics of ionization chambers through the action of high energy radiation, Radiat. Res. 9 (1958) 573.
[9] M A R KU S, B., “ Ionization chambers, free of polarity effects, intended for electron dosimetry” , Dosimetry in Agriculture, Industry, Biology and Medicine (Proc. Symp. Vienna, 1972), IA EA , Vienna (1973) 463.
[10] BÔHM, J., A measuring and calibration system for currents down to 10~17 A, Atom- kernenergie 27 (1976) 139.
[11] CO LE, A., Absorption of 20 eV to 50 000 eV electron beams in air and plastic, Radiat. Res. 38(1969) 7.
DISCUSSION
1.5. SUN DARARAO: In converting the ion dose into absorbed dose to Plexiglas (PMMA), is there any correction for the differences in electron stopping powers?
H. REICH: The chamber equilibrium ion dose, Ja, has to be multiplied only by the pertinent ratio o f the photon mass energy absorption coefficients in the material to the coefficient in air (as well as by W /e). The electron stopping powers do not enter into the calculation.
1.5. SU N DARARAO: The back wall o f the chamber is made o f 2 cm graphite with a thin covering o f Plexiglas. Why could the back wall not be made entirely out o f Plexiglas?

IAEA-SM-222/30 63
H. REICH: The choice o f the thick back wall depends on what is to be determined. I f the desired quantity is absorbed dose in water, then the material with an effective atom ic number nearest to that o f water is the most suitable.Our main concern was to study the influence o f the thin layers o f the walls that represent the boundaries o f the measuring volume.
E.L. GEIGER: Have you used this equipment to measure absorbed dose in tissue at 7 m g/cm 2 and 1000 m g/cm 2 and related these measured absorbed doses in tissue to the corresponding exposure (R ) free in air? I f so, are those factors available?
H. REICH: Yes, some data have been obtained and will be published. The relation between absorbed dose in a phantom near to the surface and exposure at the same point free in air may be deduced from the measurements o f back- scatter factors given in the previous paper, IAEA-SM-222/32, Fig.4.
M .A.F. A Y A D : The values o f Jf and Jb in the equation in your paper are affected by the atomic number o f the target material. Y ou used water as a tissue- equivalent material, but the substance normally used as tissue-equivalent material is com posed o f sugar, urea and glycerol; what will the values o f Jf and Jb be when the typical material described in1 ICRP Publication 2, which has a different atomic number from water, is used?
H. REICH: What we strive for with the front and back-wall material is neither water- nor tissue-equivalence, but air-equivalence (i.e. for the walls with thickness equal to the range o f secondary electrons). For air-equivalent walls, Jf and Ja would be zero, but such material — with satisfactory mechanical strength — is not available. What you have in mind is perhaps the material behind the back wall (or in front o f the front wall for depth-dose measurements). Investigations o f this were not the subject o f our present work. For calibrating thin-window chambers in terms o f absorbed dose in tissue at the surface o f a phantom, soft tissue phantoms with a com position like that proposed in2 ICRU Report 19 will probably be used in the future.
R. LOEVINGER: We have found that your method o f calibration can be applied to other wall materials. Some years ago we used the same method to calibrate a 50 keV X-ray beam from a beryllium-window tube .3 When the walls o f the extrapolation chamber were coated with aluminium there was an excess o f current, and when the walls were coated with graphite there was a deficit o f current, for a thin air gap. For a thicker gap, when the wall effect was complete, the slope was independent o f the wall material.
1 IN T ER N A T IO N A L COMM ISSION ON R A D IO LO G IC A L PRO TECTIO N , Report of Committee I I on Permissible Dose for Internal Radiation (1959), Recommendations of the International Commission on Radiological Protection, IC R P Publication 2, Pergamon Press,New York (1959).
2 IN T ER N A T IO N A L COMM ISSION ON RA D IA T IO N UN ITS AND M EA SU R EM EN TS , Radiation Quantities and Units, IC R U Report 19, ICRU , Washington, DC (1971) 17.
3 L O EV IN G ER , R., YAN1V, S.S., Phys. Med. Biol. 10 2(1965) 213.

IAEA-SM-222/18
TRACEABILITY IN IONIZING RADIATION MEASUREMENTS SYSTEMS
Lucy CA VALLO , Margarete EHRLICH, J.M.R. HUTCHINSON National Bureau o f Standards,Washington, DC,United States o f America
Abstract
T R A C E A B IL IT Y IN IO N IZ IN G RA D IA T IO N M EA SU R EM EN T S SYSTEM S.There are many demands for traceability to the national radiation measurements systems
(N RM S) stemming from groups such as the regulatory agencies, state health laboratories, commercial suppliers of radioactive materials and their customers, hospitals and their patients. The United States National Bureau of Standards supervises and administers measurements assurance programmes for radiation therapy departments, the radiopharmaceutical industry, federal agencies charged with radiation and radioactivity monitoring and surveillance, and for manufacturers and users of radioactivity standards, and administers to the radioactivity measurements assurance programme of the College of American Pathologists. These efforts are described and the results are tabulated.
I . Introduction
For the past six years, studies have been made by the National Bureau of Standards (NBS) in collaboration with other U.S. federal, state and industrial laboratories, to establish the traceability of measurements of radioactivity and of absorbed dose to the national measurements system. Traceability as used here refers to the condition in which the measurement of a physical quantity yields results that agree with NBS within an acceptable lim it of uncertainty.
Although NBS has a fundamental interest of its own in the development of traceability, much of the stimulus for these measurements comes from regulatory agencies such as the Nuclear Regulatory Commission (NRC), the Environmental Protection Agency (EPA), the Bureau of Radiological Health (BRH), and professional societies such as the College of American Pathologists (CAP) and the American Association of Physicists in Medicine (AAPM).
I t became clear to responsible organizations such as the U.S. Atomic Energy Commission and CAP almost a decade ago that user measurements of radioactivity in the environment and in medicine, were very often of low quality. As a means of improving these measurements, not only the NRC and EPA, but states and other groups, have instituted programs and licensing procedures that require the traceability of measurements within their scope of interest. Over the past few years the requirements for traceability have increasingly been formalized in public documents.
65
66 CAVALLO et al.
For example, a number of states have formally agreed with NRC to jo in tly monitor radioactive effluent around nuclear reactor sites. The agreement provides that the measurements of the states' laboratories be traceable to NBS. The NRC and EPA have programs of several years standing to develop and maintain the traceability of their quality-control laboratories to NBS. The demonstrated agreement of different calibration techniques established by these programs would then be passed on to the user level through similar quality- control programs organized by the NRC and EPA laboratories.
In the licensing of nuclear-power plants, the traceab ility (or more recently, "re la tab ility " ) of measurements of radioactivity is required by NRC. Standards are being written by the American National Standards Institute (ANSI) and the American Society for Testing and Materials (ASTM) Committees describing acceptable measurements procedures which require traceability of measurements of medical and stan- ards-producing laboratories to the national system.
In order to improve user measurements in the field of dosimetry of electron and photon beams used in radiation therapy, an NBS service for testing the uniformity of dosimetry in high-energy electron beams was started upon the urging of the AAPM more than ten years ago.At that time,clinical tr ia ls were conducted under the auspices of the National Cancer Institute on the effectiveness of such beams in cancer therapy. The current NBS survey of dosimetry performance in this country's 60Co teletherapy beams is being carried out in cooperation with BRH.
In this paper are described the traceability programs in radioactivity and dosimetry measurements that are conducted by NBS at a national level and participated in by NBS at an international level.
I I . Traceability to the National Radiation Measurements SystemsA. Radioactivity
Traceability in radioactivity measurements can be both direct and indirect. When an outside laboratory prepares a series of calibrated radioactivity standards and submits several randomly selected sources to the national standardizing laboratory for confirmation, “ direct" traceability can be said to exist for that radionuclide at that particular time i f the two sets of measurements agree. "Indirect" traceability exists when the national laboratory provides calibrated radioactivity samples of undisclosed ac tiv ity ("blind" samples) to any measurements laboratory which is able to make ac tiv ity measurements of these samples that agree within certain specified lim its with those of the national laboratory.Unless exercises of these types are repeated, a measure of consistency cannot be ascertained, I.e . the competence of a laboratory cannot be demonstrated' 1).
The Radioactivity Section of NBS currently is engaged in 8 national and international measurements quality assurance programs: the researchassociate program of the Atomic Industrial Forum (A IF), an "ANSI-offshoot"
IAEA-SM-222/18 67
project, three others for NRC, EPA and CAP, and three International commitments with the Bureau International des Poids et Mesures (BIPM) and the International Atomic Energy Agency (IAEA). A description of these programs follows.
( i ) Atomic Industrial Forum Program
At the request of two AIF committees, namely the Committee on Radioisotope Production and Distribution and the Committee on Radiopharmaceuticals, NBS and AIF entered into an agreement on a research associate program whereby NBS supervises and administers a measurements assurance program for the radiopharmaceutical industry. Seven radiopharmaceutical suppliers are participating at present.The overall objectives are: to supply standard reference materials(SRM'S) and "blind" samples for those radionuclides most frequently used in nuclear medicine at approximately microcurie and m illicurie1 levels of a c tiv ity ; to achieve industry-wide uniformity of measured quantities; and to assess the decay-scheme parameters necessary for the correct application of the radionuclides.
Concurrently, on authority of an interagency agreement, NBS is providing the Food and Drug Administration (FDA) with services similar to those given AIF. Table I is a summary of all the results reported for the blind samples (H and L refer to m illicurie and microcurie level sources, respectively). Surprisingly, no outstanding differences seem to arise because of d ifficu lties associated with measurements of either the microcurie or m illicurie samples. Some of the prosaic errors encountered are: the miscalculation of decay corrections, the incorrect application of branching ratios (probabilities per decay), incorrect instrument calibration and inaccurate recording of data™).
( i i ) The "ANSI"-Related Quality Assurance Program (QA)
This program in radioactivity measurements evolved from an AIFSubcommittee of Manufacturers of Radioactive Reference Standards.NBS members served on this committee which has since become a subcommittee, N42.2, of ANSI, and is presently called the "Subcommittee on Standard Methods to Calibrate Nuclear Detection Equipment". Under the QA program, NBS distributes each year to the participants reference samples of 4 to 6 different radionuclides of known but undisclosed values, the selection of radionuclides being made by the ANSI N42.2 subconmittee. Any company or laboratory can obtain one of these samples at cost. Each participant in this program is expectedto conplete a questionnaire, giving their measured value of theactiv ity and any observed radionuclidic impurities,stating the method of measurement and the uncertainties associated with i t . Upon receipt and evaluation of the questionnaire, NBS, as coordinator, issues a Report of Measurement to each participant (see figure 1). I f , in the examination of the questionnaire, the coordinator can ascertain sources of d ifficu lties , the participant is contacted and aided. The number of participants involved in this program is small and includes
1 Tens of kilobecquerels to tens of megabecquerels.
68 CAVALLO et al.
some manufacturers, national laboratories, some hospitals and power reactor groups. Table I I gives the results covering the l ife of this program. On the whole, the results are satisfactory and, as before, errors are primarily in data handling, reporting and incorrect application of nuclear-decay-scheme parameters^).
( i i i ) College of American Pathologists Program
Industry has been accustomed to establishing quality controls that govern production with mathematical preciseness, but in medicine, quality control tended to be subjective,based often on peer review.The College of American Pathologists introduced interlaboratory comparison in nuclear medicine. The Nuclear Medicine Subcommittee of the College, through the results of a questionnaire sent to the CAP membership in 1970, was able to identify the radionuclide users and to determine the need or interest in quality assurance. Since 1972, CAP, with assistance from NBS, has offered to their subscribers 10 samples for identification and assay,.2 for assay only, and conducted a p ilo t stucfy of radionuclide measurement, that is , a study to determine how well a prescribed amount of a radiopharmaceutical could be delivered to a serum vial (the patient). The radionuclides distributed in this program were 125if 57co, 20̂ Hg, 75Se,59pe, 60co, 85$r> 133xe, 201j i . Table I I I gives an overview of these endeavors.
( iv ) Nuclear Regulatory Commission's Program
Since January, 1973, the NRC has had a written agreement with NBS to develop the traceability of the NRC quality control laboratory (Health Services Laboratory) in Idaho Falls to the national radioactivity measurements system (NRMS) by means of a well-ordered program of tests. The tests require the NRC laboratory to assay:(1) mixed radionuclides in an NBS prepared solution, (2) NBS prepared solutions or point sources containing a single photon-emitting radionuclide, or a single a-particle or a single 6-particle emitting radionuclide at well established intervals. I t is also required that the NRC Reference Laboratory measure a tritium-con- taining solution once a year. Additionally, NBS measures randomly selected samples from batches of standards produced by the Reference Laboratory. Occasionally, NBS w ill prepare test samples and special sources for distribution to the NRC Reference Laboratory and its users, a ll of whom report back to NBS for evaluation.
I f the Reference Laboratory's value for a measured activ ity is within a specified percentage of the NBS value, there is said to be agreement, and a certificate of traceability for that measurement is issued by NBS. Tables IV, V and VI summarize the results of measurements made over the past 2 years.
(v) Environmental Protection Agency's Program
The EPA's National Environmental Research Center - Las Vegas (NERC-LV) prepares and distributes calibrated low-level radioactivity solution samples to federal, state and private laboratories involved
IAEA-SM-222/18 69
in environmental radioactivity monitoring. In order to establish traceab ility for a ll the participating laboratories to the NRMS, the Quality Assurance Branch of NERC-LV has instituted a continuing intercomparison program with NBS. This program has three phases:(1) measurement by NBS of samples prepared and calibrated by EPA;(2) measurement by EPA of samples prepared and calibrated by NBS;(3) preparation by NBS of special samples as requested by EPA.Thus far, NBS has produced almost 600 special samples including mixed radionuclides, polonium-210, plutonium-239 and radium-228 solutions.In Table V II are the results of the direct and indirect traceability studies covering the past 3 years. These data indicate that the measurements so far reported are within + 5% of the NBS measured value.
B. Radiation Dosimetry
Traceability studies in the fie ld of radiation dosimetry presently are directed in particular toward the application of electron and photon beams in cancer therapy, a field in which the user is faced with the complex task of delivering known radiation doses to a tumor. NBS provides sets of calibrated dosimeters to the participants in the particular study, asking them to irradiate these dosimeters under prescribed conditions, and to return them to NBS for evaluation of dosimeter response in terms of absorbed dose in tissue.
( i ) Electron Dosimetry Test Service
For the past ten years, the NBS Dosimetry Section has been engaged 1n a test service offered to users of electron beams in the energy range from about 5 to 50 MeV. NBS ships ferrous-sulfate (Fricke) dosimeters to the participants bi-annually, on pre-arranged dates. The participants are requested to irradiate the dosimeters in their electron beams, delivering between 4000 and 8000 rads to water according to the instructions given by the AAPM Subcommittee on Radiation Dosimetry,'4) and to return them to NBS for an evaluation of the change in optical absorbance in terms of absorbed dose in water. Details of dosimeter calibration, preparation and evaluation have been published elsewhere.'5 ' The uncertainty of the method has been estimated to be between 3 and4 percent.
Figure 2 shows the results for the performance of some 40 groups that participated in the service either regularly or sporadically during the period from 1967 through 1975. For almost 60 percent of the more than 500 dosimeters irradiated, the NBS dose interpretation was within5 percent of the dose assigned by the participants. However, almost 20 percent differed from NBS by more than 10 percent.
All participants in a given test receive a report of their own performance and also of that of their peers, whose identity however is not divulged. The participants then are free to contact NBS for assistance with their problems. Over the years, the performance of some of the steady participants has inproved; however, that of others has remained p o o r . T h e BRH plans to in itia te a comprehensive performance survey which, in one of its later phases, w ill encompass a ll therapy users of high-energy electron beams and which should enable poor performers to obtain personalized assistance.
( i i ) Survey of Dosimetry in 60Co Teletherapy Beams
7 0 С A VALLO et al.
A three-year dosimetry survey involving about 800 of the roughly 1000 teletherapy units in use in the United States is about to be completed. Sets of individually calibrated CaF2:Mn thermoluminescence dosimeters were mailed to a ll users who had agreed to participate on a voluntary basis, at no cost to them. The participants were instructed to irradiate the dosimeters in a prescribed geometry, giving 300 rads to water, and to mail them back for interpretation of the thermoluminescence response in terms of absorbed dose to water. They also were instructed to give a detailed account of their computations leading to the exposure time used, in order to enable NBS to check on their methods. Details on irradiation geometry and on dosimeter construction, calibration, and evaluation have been published e l s e w h e r e . (7) The uncertainty of the survey method has been estimated to be within 3 percent.
Figure 3 gives the results for the performance of close to 700 of the surveyed ^Co units. More than 80 percent are shown to have deviations of 5 percent or less from the NBS dose interpretation, but deviation of more than 10 percent are observed on a few of the units surveyed. As in the electron-dosimetry service, the results were reported to the participants who then had an opportunity to discuss their problems with NBS. F ina lly, in an effort to ascertain whether the NBS survey brought about an improvement in the dosimetry for participants who had performed poorly, a repeat survey was performed on a sample of participants selected from among those whose performance had been satisfactory. A comprehensive paper on all the results w ill be prepared early next year.
I I I . Traceability to the International Radioactivity Measurements System
A national laboratory has the obligation to maintain measurements systems that are domestically and internationally consistent, and such competence should be periodically demonstrated. NBS seeks to f u l f i l l this obligation through international comparisons under the aegis of the Bureau International des Poids et Mesures (BIPM), and by particiption in both the International Reference System for Measuring Activity of Gamma-Ray-Emitting Nuclides (BIPM) and the International Service of Calibrated Radioactive Solutions (IAEA). International radioactivity measurements had been carried out rather informally from 1946 to 1955 with NBS, Canadian and British laboratories. In 1955, the International Commission of Radiological Units and Measurements (ICRU) recommended that the various national laboratories which issue radioactivity standards should frequently compare them, and a decade of p ro lific intercomparative international measurements on a world-wide basis ensued. In 1960, BIPM became the recognized repository for international radioactivity standards. As an illustration of these detailed studies, see figure 4 which gives the results of the March, 1976, comparison of 139ce which involved 23 national and international laboratories.<8) The results of 22 of the participating laboratories give a spread of only 1.1%; a ll but one of the results were obtained by (e+x,y) coincidence counting using the method of efficiency extrapolation.
IAEA-SM-222/18 71
NBS was nominated in 1974 by the U.S. Government for participation in the International Service of Calibrated Radioactive Solutions. The IAEA laboratory receives standards in solution form, at ar\y time convenient for the calibrating laboratory, measures them in a 4ir reentrant ionization chamber and preserves, with time, the calibration results stated by the submitting laboratory. The ion current produced by the sample is compared to that produced by a radium-226 reference source and an "equivalent activ ity" is calculated for the submitted solution, standard. This is the activ ity of the radionuclide in the submitted standard that would have produced the same ion current as the radium reference source, at a specified date and time. The BIPM maintains a similar reference system. National and international laboratories may submit two or more ampoules of their gamma-ray emitting solution standards to BIPM for measurement. Each of these international organizations then issues a "registration table" for each radionuclide in which is recorded the "equivalent activ ities" for the samples submitted.Not only does this maintain international consistency, but indicates i f the standards of a given radionuclide issued by a laboratory are consistent with time. Tables V I I I and IX consist of data taken from the BIPM and the IAEA registration tables, respectively.
ACKNOWLEDGEMENTS
Programs such as those described herein involve the efforts of many dedicated people and we hereby extend our appreciation to R. L. Ayres,R. P. Colle, B. M. Coursey, D. В. Golas, А. T. Hirshfeld, D. D. Hoppes,P. J . Lamperti, L. L. Lucas, R. W. Medlock, J . R. Noyce, C. G. Soares,M. P. Unterweger, A. C. Walley and to W. B. Mann. In particular we wish to thank Drs. В. M. Coursey and J . R. Noyce for providing the data in tables IV , V, VI and V II.
The R eferences and Discussion fo llow on page 86.
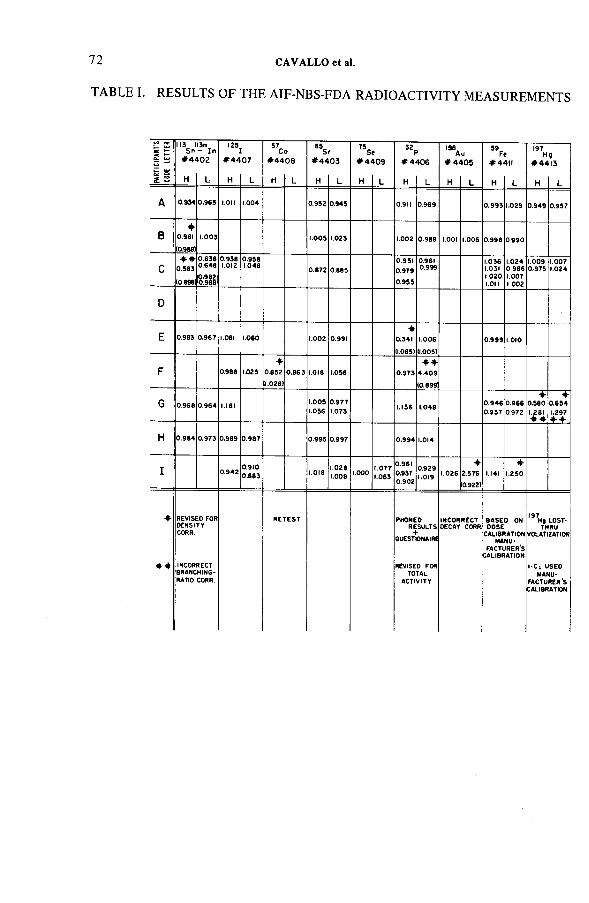
TABLE I. RESULTS OF THE AIF-NBS-FDA RADIOACTIVITY MEASUREMENTS
72 С A VALLO et al.
PART
ICIPA
NT'S
CODE
LETT
ER N3Sr>
# 4 '
H
3m- In 102
L
I25]
# 4 4
H
07
L
57c# 4 4
H
008
L
85s# 4 4
H
r03
L
75s# 4
H
B*09
L
32F
# 4
H
>406
L
13вА# 4
H
0*05
L
59F
# 4
H
f«H
L
197H
# 44
H
g13
L
A 0.934 0.963 (.011 1.004 0.952 0.945 0.911 0.969 0.993 1.029 0.949 0.957
В♦
0.981(Ol988)
1.003 1.005 i.023 1.002 0.988 I.OOI 1.006 0.998 0.990
С+ +
0.583
(0.8981
0.63806480.9820.988
0.9381.012
0.9581.048 0.872 0.885
0.9510.9790.955
0.9610.999
1.036 1.031 1.020 1.011
1.0240.9861.0071.002
1.0090.975
1.0071.024
D
E 0.983 0.967 1.081 1.060 1.002 0.991+
0.341(1.085)
1.006(1.005)
0.999 1.010
F 0.988 1025+
0.852U.028)
0.863 1.018 1.058 0.973+ +
4.409 (0.899
G 0.966 0.964 1.181 1.0051.056
0.9771.073 1.136 1.048 0.946
0.9370.9660.972
■ +0.580 1.281 + +
+ 0.654 1.297 + +
H 0.984 0.973 0.989 0.987 0.995 0.997 0.994 1.014
I 0.942 0.9100.883 1.018 1.028
1.008 1.000 1.0771.063
0.9610.9370.902
0.9291.019 1.026
+2.57610.922)
1.141+
1.250
+
+ +
REVISED FORDENSITYC0RR.
INCORRECT BRANCHING* RATIO CORR.
RETEST PHONEORESULTS+
OUESTIONAlRf
REVISED FOR TOTAL
ACTIVITY
INCORRECT OECAY CORR
BASEO ON DOSE
CALIBRATIONMANU
FACTURERSCALIBRATION
197Hg LOST- THRU
VOLATIZATION
1-C ; USED MANU
FACTURER'S CALIBRATION
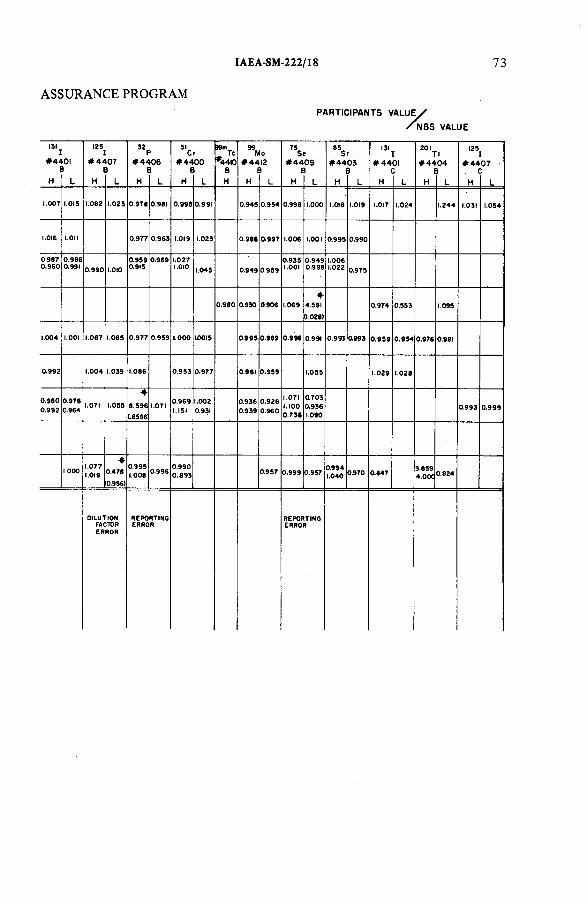
IAEA-SM-222/18 73
PARTICIPANTS VALUE/"/N B S VALUE
ASSURANCE PROGRAM
191I
# 4 A 01J
125
# 4 4 0 7В
32P# 4 4 0 6
В
51Cr
# 4 4 0 0В
*44ЮВ
%# 4 4
0123
75*Se# 4 4 0 9
B
85cSr# 4 4 0 3
B
131I
# 4 4 0 1C
201Tl
# 4 4 0 4B
125I
# 4 4 0 7C
H L H L H L H L H H L H L H L H L H L H L
1.007 1.015 <.082 1.023 0.978 0.981 0.995 0.991 0.945 0.954 0.996 1.000 1.016 1.019 1.017 1.024 1.244 1.031 1.054
1.016 I.Oll 0.977 0.963 1.019 1.023 0.968 0.997 1.006 1.001 0.995 0.990
0.9670.960
0.9860.991 0.990 1.010
0.9590.915
0.969 1.0271.010 1.045 0.949 0959
0.9351.001
0.9490.998
1.0061.022 0.975
0.980 0.930 0.906 1.069+
4.59111.028)
0.974 0.553 1.095
1.004 1.001 1.067 1.065 0.977 0.959 1.000 IjOOIS 0.995 0.969 0.998 0.991 0.993 0.993 0.959 0.954 0.976 0.961
0.992 1.004 1.039 i.086 0.953 0.977 0.961 0.959 1.055 1.029 1.028
0.9600.992
0.9760.964 1.071 1.055
+6.596(.8596
1.071 0.9691.151
1.0020.931
0.9360.939
0.9260.960
1.0711.1000.738
0.7030.9361.090
0.993 0.999
1.000 1.0771.019
+0.4760.956)
0.9951.008 0.996 0.990
0.893 0.957 0.999 0.957 0.9941.040 0.970 0.647 3.859
4.00C 0.824
DILUTIONFACTORERROR
REPORTINGERROR
REPORTINGERROR
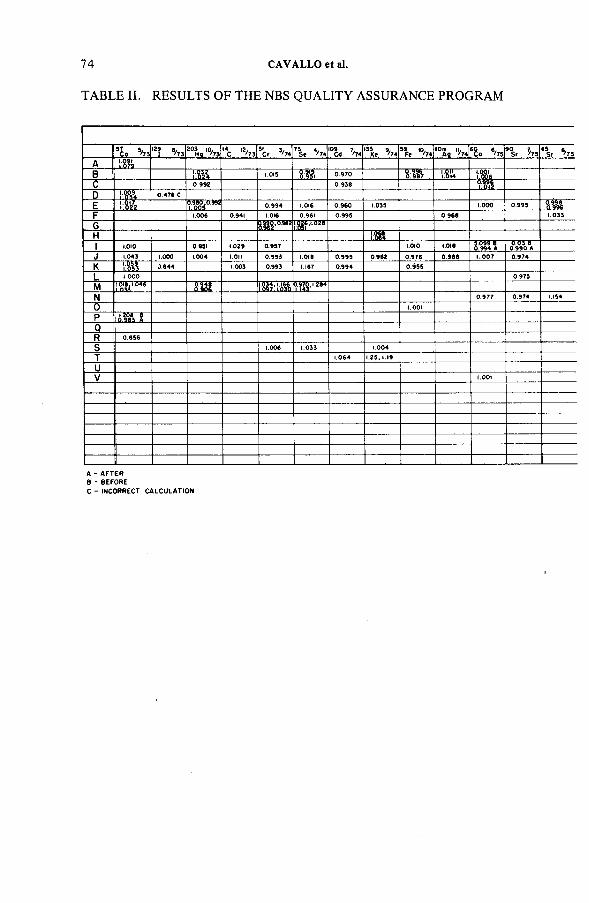
TABLE II. RESULTS OF THE NBS QU ALITY ASSURANCE PROGRAM
74 CAVALLO et al.
A - AFTER В - BEFOREС - INCORRECT CALCULATION
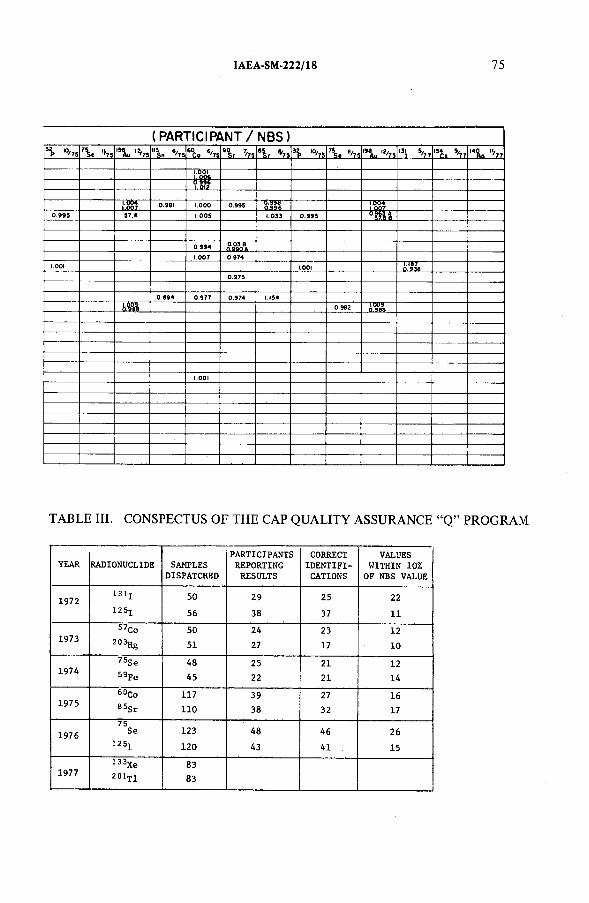
IAEA-SM-222/18 75
TABLE III. CONSPECTUS OF THE CAP QU ALITY ASSURANCE “ Q ” PROGRAM
YEAR RADIONUCLIDE SAMPLESDISPATCHED
PARTICIPANTSREPORTINGRESULTS
CORRECTIDENTIFICATIONS
VALUES WITHIN 10%
OF NBS VALUE
1972131x 50 29 25 22
125j 56 38 37 11
57Co 50 24 23 121973
20 % g 51 27 17 10
75Se 48 25 21 121974
59Fe 45 22 21 14
60Co 117 39 27 161975
85Sr 110 38 32 17
1976
75Se 123 48 46 26
125]; 120 43 41 , 15
1977133Xe
201T183
83
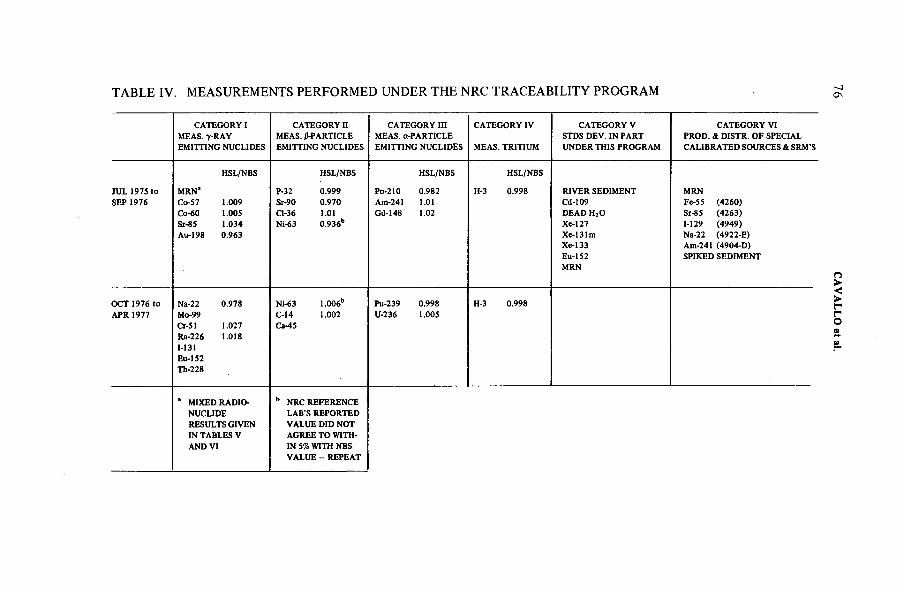
TABLE IV. MEASUREMENTS PERFORMED UNDER THE NRC TRACEABILITY PROGRAM —] ON
CATEGORY I MEAS. 7-RAY EMITTING NUCLIDES
CATEGORY II MEAS. 0-PARTICLE EMITTING NUCLIDES
CATEGORY III MEAS. a-PARTICLE EMITTING NUCLIDES
CATEGORY IV
MEAS. TRITIUM
CATEGORY V STDS DEV. IN PART UNDER THIS PROGRAM
CATEGORY VI PROD. & DISTR. OF SPECIAL CALIBRATED SOURCES & SRM’S
JUL 1975 to SEP 1976
HSL/NBS HSL/NBS
MRN" P-32 0.999Co-57 1.009 Sr-90 0.970Co-60 1.005 Cl-36 1.01Sr-85 1.034 Ni-63 0.936bAu-198 0.963
Po-210 Am-241 Gd-148
HSL/NBS
0.9821.011.02
H-3
HSL/NBS
0.998 RIVER SEDIMENT MRNCd-109 Fe-55 (4260)DEAD H20 Sr-85 (4263)Xe-127 1-129 (4949)Xe-131m Na-22 (4922-E)Xe-133 Am-241 (4904-D)Eu-152 SPIKED SEDIMENTMRN
OCT 1976 to APR 1977
Na-22 0.978 Ni-63Mo-99 C-14Cr-51 1.027 Ca-45Ra-226 1.0181-131Eu-152Th-228
1.006°1.002
Pu-239U-236
0.9981.005
H-3 0.998
MIXED RADIONUCLIDE RESULTS GIVEN IN TABLES V AND VI
b NRC REFERENCE LAB’S REPORTED VALUE DID NOT AGREE TO WITHIN 5% WITH NBS VALUE - REPEAT
CAVALLO et al.
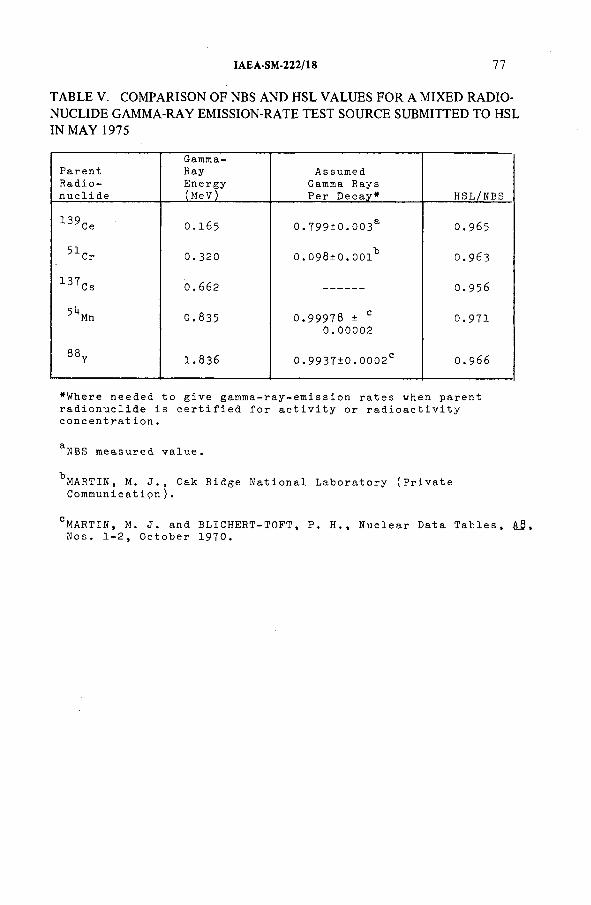
IAEA-SM-222/18 77
TABLE V. COMPARISON OF NBS AND HSL VALUES FOR A MIXED RADIONUCLIDE GAM M A-RAY EMISSION-RATE TEST SOURCE SUBMITTED TO HSL IN M AY 1975
P ar en tR a d i o n u c l i d e
Ga m m a -RayE n e r g y(MeV)
A s s u m e d G a m m a Rays Per De c a y * H S L / N B S
1 3 9 Ce O . 1 6 5 0 . 7 9 9 + 0 . 0 0 3 a O . 965
5 1 Cr 0. 320 0.098±0.001Ъ О.9 6З
13 T Cs 0. 6 6 2 O . 9 56
5 **Mn О. 835 0 . 9 9 9 7 8 ± c 0 . 0 0 0 0 2
0.971
COCO
I . 836 0.9937±0.0002° O . 966
*W h e r e n e e d e d to give g a m m a - r a y - e m i s sion rate s w h e n pa r e n t r a d i o n u c l i d e is c e r t i f i e d for a c t i v i t y or r a d i o a c t i v i t y c o n c e n t r â t ion.
a NB S m e a s u r e d value.
^ M A R T I N , M. J., Oak Ri d g e N a t i o n a l L a b o r a t o r y (Private C o m m u n i c a t i o n ) .
CM A R T I N , M. J. and B L I C H E R T - T O F T , P. H., N u c l e a r D a t a T a bl es , A3 , Nos. 1-2, O c t o b e r 1970.
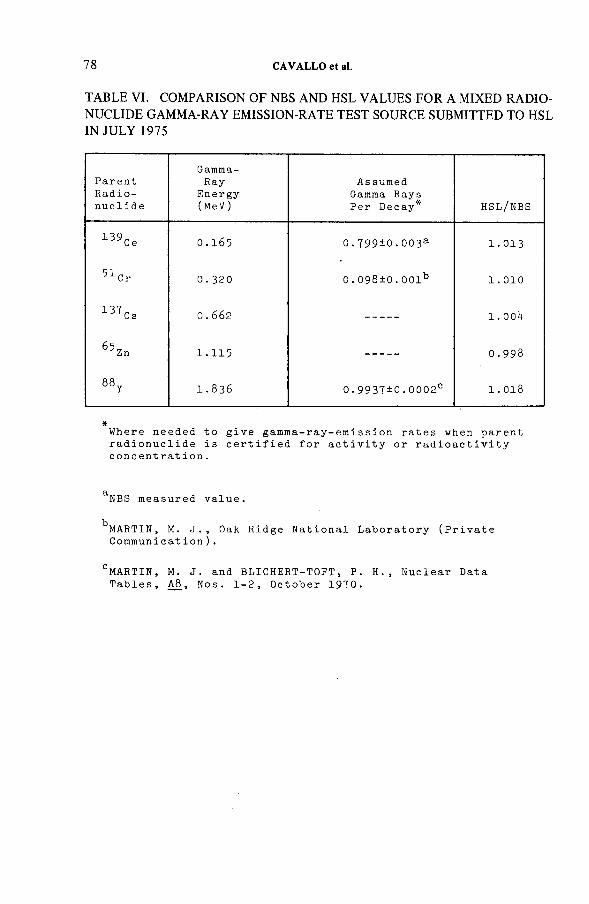
78 CAVALLO et al.
TABLE VI. COMPARISON OF NBS AND HSL VALUES FOR A MIXED RADIONUCLIDE GAM M A-RAY EMISSION-RATE TEST SOURCE SUBMITTED TO HSL IN JULY 1975
ParentRadio-nuclide
Gamma-Ray
Energy(MeV)
As sumed Gamma Rays Per Decay HSL/NBS
139Ce O . I 65 0 . 7 9 9 ±0 . 003a 1 . 0 1 3
5 1 Cr 0 . 320 0 . 098± 0 . 001b 1. 010
137CS 0. 662 1. 00U
65Zn 1 .115 0. 998
>-*coC
O
1 . 8 3 6 0 . 9 9 3 7 ± 0 .0 0 0 2 c 1 . 0 1 8
*Where needed to give gamma-ray-emis sion rates when parent radionuclide is c e r t i f i e d for a c t i v i t y or r a d i o a c t i v i t y concentration.
aNBS measured value.
^MARTIN, M. J . , Oak Ridge National Laboratory (Private Communication).
cMARTIN, M. J. and BLICHERT-TOFT, P. H. , Nuclear Data Tables , A8, Nos. 1 - 2 , October 1970.
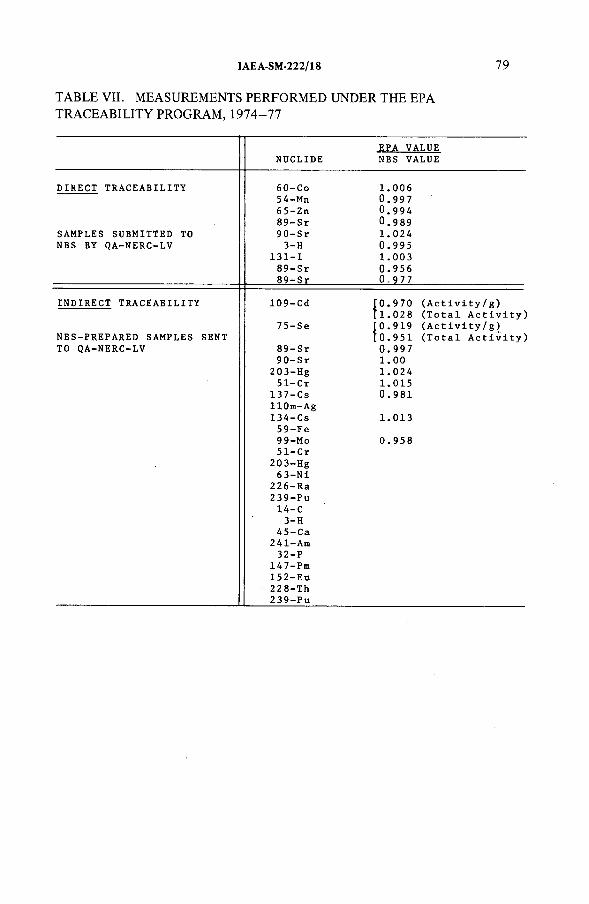
IAEA-SM-222/18 79
TABLE VII. MEASUREMENTS PERFORMED UNDER THE EPA TRACEABILITY PROGRAM, 1 9 7 4 -7 7
N U C L I D EE P A V A L U E NB S V A L U E
D I R E C T T R A C E A B I L I T Y
S A M P L E S S U B M I T T E D TO NBS BY Q A - N E R C - L V
60- Co 1.0065 4-Mn 0.9 9765 -Z n 0.99489- Sr 0.98990 -S r 1.0243-H 0.995
131-1 1.0 0389-Sr 0. 95689 -S r 0.9 77
I N D I R E C T T R A C E A B I L I T Y
N B S - P R E P A R E D S A M P L E S SENT TO Q A - N E R C - L V
1 09 - C d
75-Se
89-Sr90 -S r
20 3- H g51 -C r
137 -Cs 1 1 0 m - A g 134 -Cs 59- Fe 99 -M o 51 -C r
203 -H g 63- Ni
22 6- R a 23 9- P u 14-C 3-H
4 5 - C a 2 4 1-A m 32-P
1 4 7 - P m 1 5 2 - E n 22 8- T h 2 3 9 - P u
[0.970 ( A cti vit y/g ) [1.028 (Tota l A c t i v i t y ) Г0.919 ( A cti vit y/g ) [0.951 (Tota l A c t i v i t y ) 0. 9971.00 1.024 1.015 0. 98 1
1.013
0. 95 8
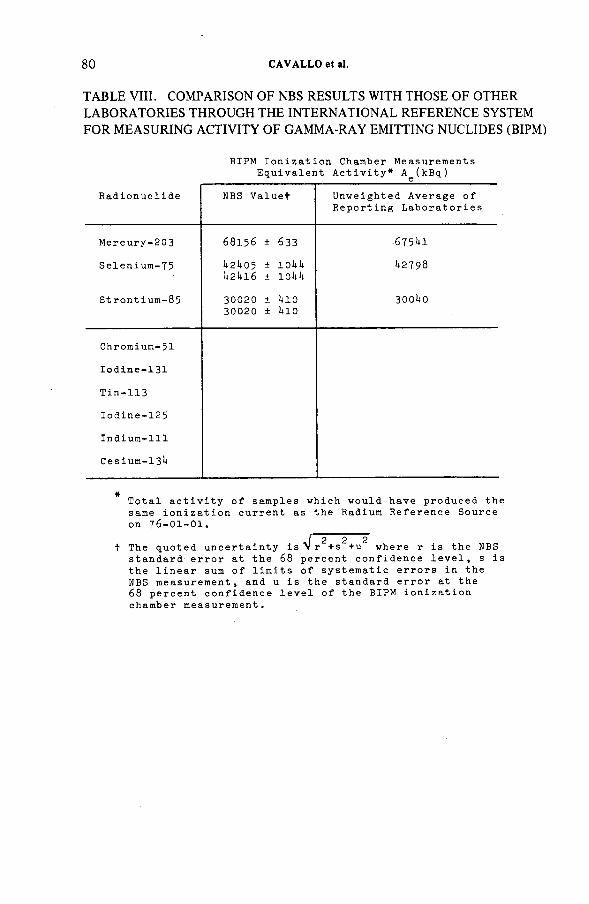
80 CAVALLO et al.
TABLE VIII. COMPARISON OF NBS RESULTS WITH THOSE OF OTHER LABORATORIES THROUGH THE INTERNATIONAL REFERENCE SYSTEM FOR MEASURING ACTIVITY OF GAM M A-RAY EMITTING NUCLIDES (BIPM)
B I P M I o n i z a t i o n C h a m b e r M e a s u r e m e n t s E q u i v a l e n t A c t i v i t y * A g (kBq)
Radionuclide NB S Valuet Unweighted Average of Reporting Laboratories
Mercury-203 68156 ± 63З ■6751*1
Selenium-75 1*21+05 ± ioi*i* 1*27981*21*16 ± 101*1*
Strontium-85 30020 ± 1*10 3001*030020 ± 1*10
Chromium-51
Iodine-131
Tin-113
Iodine-12 5
Indium-111
Ce s ium- 13I*
T o t a l a c t i v i t y of s a m p l e s w h i c h w o u l d h a v e p r o d u c e d the sa me i o n i z a t i o n c u r r e n t as the R a d i u m R e f e r e n c e Sou rce on 76- 0 1 - 0 1 .
I 2 2 2t The q u o t e d u n c e r t a i n t y is \ r +s +u w h e r e r is the NBS
s t a n d a r d e r r o r at the 68 p e r c e n t c o n f i d e n c e le ve l , s is the l i n e a r sum of l i m i t s of s y s t e m a t i c e r r o r s in the NB S m e a s u r e m e n t , an d u is the s t a n d a r d e r r o r at the 68 p e r c e n t c o n f i d e n c e l e v e l of the B I P M i o n i z a t i o n c h a m b e r m e a s u r e m e n t .
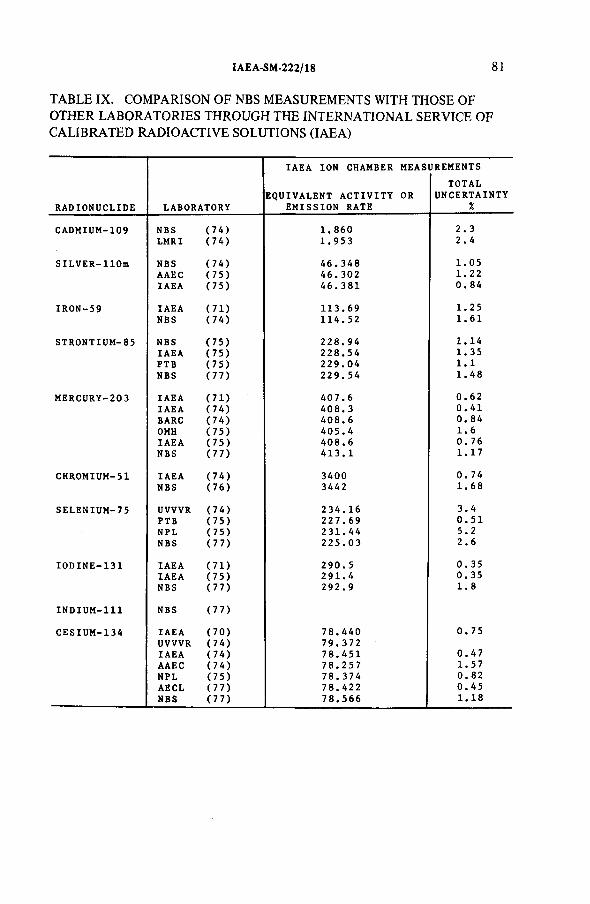
IAEA-SM-222/18 8 1
TABLE IX. COMPARISON OF NBS MEASUREMENTS WITH THOSE OF OTHER LABORATORIES THROUGH THE INTERNATIONAL SERVICE OF CALIBRATED RADIOACTIVE SOLUTIONS (IAEA)
R A D I O N U C L I D E L A B O R A T O R Y
IAEA ION C H A M B E R
E Q U I V A L E N T A C T I V I T Y E M I S S I O N RAT E
M EAS
OR
U R EMEN TS
T O T A LU N C E R T A I N T Y
%
CA D M I U M - 1 0 9 NBS (74) 1. 860 2.3
LMRI (74) 1.953 2.4
S I L V E R - l l O m NBS (74) 46 .348 1.05ААЕС (75) 46.302 1.22
IAEA (75) 46 .381 0. 84
IRO N-59 IAEA (71) 113.69 1.25NBS (74) 114.52 1.61
S T R O N T I U M - 8 5 NBS (75) 228.94 1.14IAEA (75) 228.54 1. 35PTB (75) 229.04 1.1NBS (77) 22 9.54 1.48
M E R C U R Y - 2 0 3 IAEA (71) 407.6 0.62
IAEA (74) 408. 3 0.41
BARC (74) 408.6 0. 84
OMH (75) 405.4 1.6I AEA (75) 408.6 0. 76NBS (77) 41 3.1 1.17
C H R O M I U M - 5 1 IAEA (74) 3400 0. 74NBS (76) 3442 1.68
S E L E N I U M - 7 5 U V V V R (74) 234.1 6 3.4
PTB (75) 227.69 0.51NPL (75) 231.4 4 5.2
NBS (77) 22 5.03 2.6
I O D I N E - 1 3 1 IAEA (71) 290.5 0. 35IAEA (75) 291.4 0. 35
NBS (77) 292 . 9 1.8
I N D I U M - 1 1 1 NBS (77)
C E S I U M - 1 3 4 IAEA (70) 78.440 0. 75
U V V V R (74) 79.372IAEA (74) 78.451 0.47
ААЕС (74) 78.257 1.57NPL (75) 78.374 0. 82A ECL (77) 78.422 0.45
NBS (77) 78.566 1.18
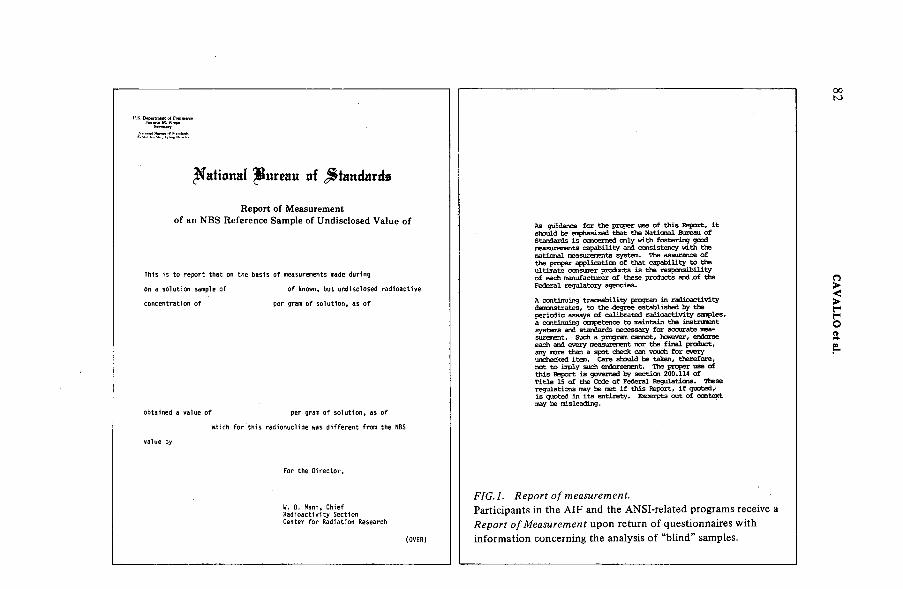
S. DepirtiMiK of Го JuinuM.Kit|
Rational B̂ureau of Standards
Report o f Measurement o f an NBS Reference Sample o f Undisclosed Value o f
This i s to report that on the basis of measurements made during
on a solution sample of of known, but undisclosed radioactive
concentration of per gram of so lution, as of
obtained a value of per gram of so lution, as of
which for th is radionuclide was different from the NBS
value by
For the Director,
W. B. Mann, Chief Radioactivity Section Center for Radiation Research
(OVER)
00Ю
As guidance for the proper use of this Report, it should be emphasized that the National Bureau of Standards is ocncemed only with fostering good measurements capability and consistency with the national measurements system. The assurance of the proper application of that capability to the ultimate consuner products is the responsibility of each manufacturer of these products and of the Federal regulatory agencies.
A continuing traceability program in radioactivity demonstrates, to the degree established by the periodic assays of calibrated radioactivity sanples, a continuing corpetence to maintain the instrument systans and standards necessary for accurate measurement. Such a program cannot, however, endorse each and every measurement nor the final product, any more than a spot check can vouch fen: every unchecked item. Care should be taken, therefore, not to iirply such endorsement. The proper use of this Report, is governed by secticn 200.114 of Title 15 of the Code of Federal Regulations. These regulations may be net if this Report, if quoted,' is quoted in its entirety. Excerpts cut of context may be misleading.
FIG .l. R eport o f measurement.Participants in the A IF and the ANSI-related programs receive a R eport o f Measurement upon return of questionnaires with information concerning the analysis of “blind” samples.
CAVALLO et al.
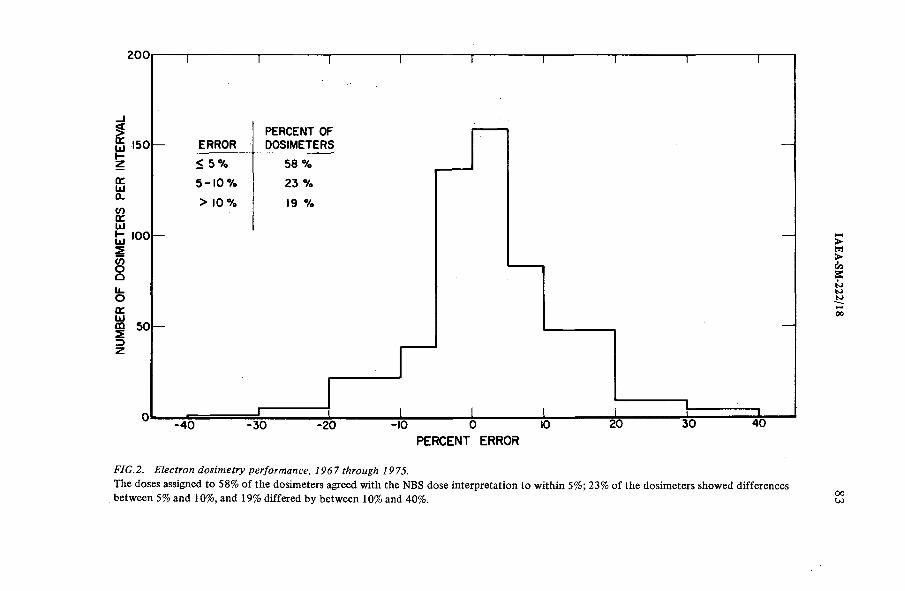
NUMB
ER
OF
DOSI
METE
RS
PER
INTE
RVAL
2 0 0
150
100
ERRORPERCENT OF DOSIMETERS
< 5 % 58 7.5 - 1 0 % 23 7.> 10 7 . 19 7.
50
_L- 4 0 -3 0 -20 -10 0 10
PERCENT ERROR20 30
FIG.2. Electron dosimetry performance, 1967 through 1975.The doses assigned to 58% of the dosimeters agreed with the NBS dose interpretation to within 5%; 23% of the dosimeters showed differences between 5% and 10%, and 19% differed by between 10% and 40%.
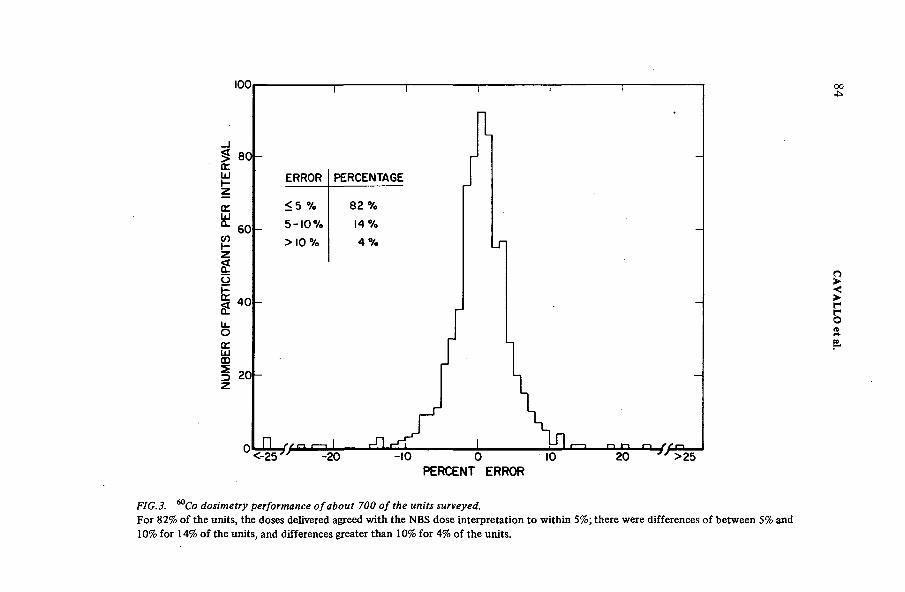
PERCENT ERROR
FIG.3. 60Co dosimetry performance o f about 700 o f the units surveyed.For 82% of the units, the doses delivered agreed with the NBS dose interpretation to within 5%; there were differences of between 5% and 10% for 14% of the units, and differences greater than 10% for 4% of the units.
CAVALLO et al.
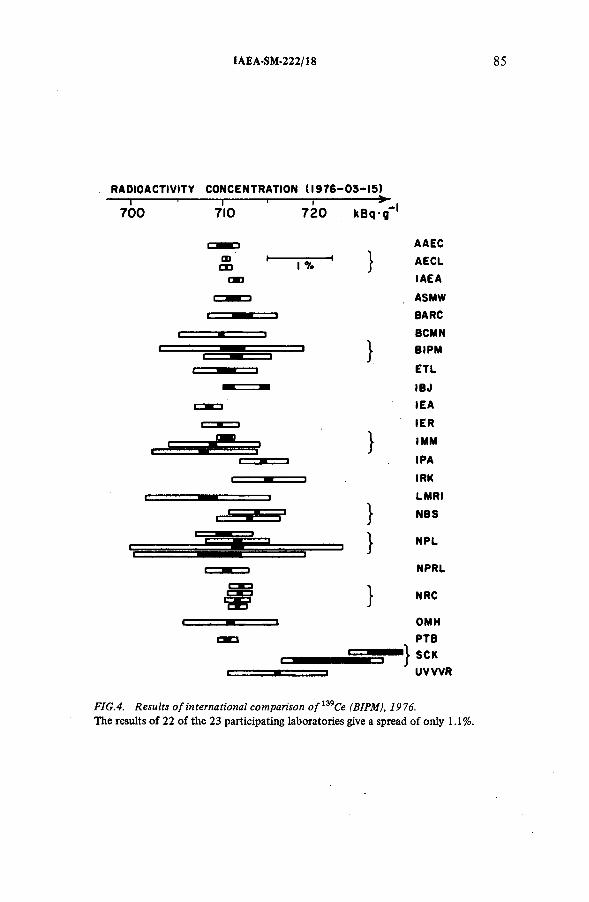
IAEA-SM-222/18
RADIOACTIVITY CONCENTRATION (1976-03-15)
700 710 720 KBq-g-I
CD I %
AAECAECLIAEAASMWBARCBCMNBIPMETLIB JIEA1ERI MMIPAIRKLMRINBS
FIG.4. Results o f international comparison o f l39Ce (BIPM), 1976.The results of 22 of the 23 participating laboratories give a spread of only 1.1%.
8 6 CAVALLO et al.
REFERENCES
[1] CAVALLO, L. M., et a l . , "Needs for Radioactivity Standards andMeasurements in Different Fields", Nucl. Instr. and Meth., 112 (1973)5.
[2] COLLE,R. P ., "Radioactivity Measurements Assurance in the Radiopharmaceutical Industry", NBS Special Publication 456 (1976).
[3] SEIDEL, C. W., HUTCHINSON, J.M .R.H., "ANSI Quality Assurance Program", NBS Special Publication 456 (1976).
[4] Subcommittee on Radiation Dosimetry (SCRAD) of the AAPM, "Protocol for the Dosimetry of High Energy Electrons", Phys. Med. B io l.,Д , (1966) 505.
[5] EHRLICH, М., LAMPERTI, P. J . , "Uniformity of High-Energy Electron- Beam Calibrations", Phys. Med. B io l., 14 (1969) 305.
•
[6] EHRLICH, М., LAMPERTI, P . J . , "Electron-Therapy Dosimetry", NBS Special Publication 456 (1976) 365.
[7] EHRLICH, М., WELTER, G. L . , "Nationwide Survey of 60Co Teletherapy Dosimetry", J . Res. NBS, 80A (1976) 663.
[8] RYTZ, A., “Report on the International Comparison of Activity Measurements of a Solution of 139ce (March 1976)", Rapport BIPM-77/4.
DISCUSSION
M.A.F. A Y A D : Y ou mentioned that you used calcium fluoride and lithium fluoride as dose meters for calibration. Has any work been done using red Perspex, which is one o f the modern dose meters used for super-voltage machines in radiotherapy?
Lucy CAVALLO: Mr. McLaughlin will probably be able to provide you with some information about that.
W.L. McLAUGHLIN: Work has been done at NBS on calibrating red Perspex dose meters for other laboratories, both the type 4034 supplied by the Atom ic Energy Research Establishment, Harwell, UK, and the “ R A D ” system supplied by A tom ic Energy o f Canada, Limited, Ottawa. I am surprised, however, to hear that this dose meter is used in radiotherapy applications, since it is mainly intended for measuring absorbed doses from about 3 to 30 kGy, which is higher than the doses administered in a typical radiotherapy treatment. Red Perspex, because o f its intrinsic instability after irradiation, is not recommended as a transfer dose meter, although it may be calibrated and used effectively within a given laboratory for monitoring large X-ray and gamma-ray absorbed doses. For these applications I refer you to my paper in this Symposium (IAEA-SM -222/09).
IAEA-SM-222/18 87
H. REICH: I believe you said that deviations have generallybeen less than 5% in the chemical dose meter intercomparison service. In our similar service we try to find reasons for discrepancies when the deviations exceed only 2% to 3%. What are the deviations expected when the instruments controlled are correctly calibrated?
Margarete EHRLICH: We cannot guarantee that the accuracy o f our system will be better than 3% to 4%, one o f the reasons being the variation in cell-to-cell growth o f optical absorbance during the five to six weeks between the readouts o f the cells before and after shipment. It should be noted that we are shipping spectrophotometer cells with ground-glass stoppers. Moreover, we do not calibrate our system, but evaluate absorbed dose from optical absorbance using the G-value recommended by the American Association o f Physicists in Medicine for the range o f electron energies from 5 to 50 MeV.We do this in spite o f the fact that the G-value actually is not constant over this electron-energy range.
L.J. GOODMAN: Y ou have reported that although the majority o f laboratories participating in the intercomparisons obtained results within ± 5% o f the standard value, there were nevertheless some results which deviated by 10% or more. This has significant clinical implications. What efforts are made to follow up and possibly correct the measurements performed at laboratories showing large differences from the standard?
Lucy CA VALLO : All participants in a given test receive a report on their own performance and also on that o f their peers, whose identity is not divulged. The participants are then free to contact NBS for assistance with their problems. The Bureau o f Radiological Health plans to initiate a comprehensive performance survey, which, in one o f its later phases, will encompass all users o f high-energy electron beams for therapeutic purposes and should enable poor performers to Qbtain personal assistance.
A.O. FREGENE: I believe that it should be possible in intercomparison measurements With the Fricke dose meter to obtain better accuracies than the 5% reported by you . However, your variations are closer to what one would expect than the 4% figure quoted by Mr. Lanzl (see the discussion to paper IAE A -SM -222/13).

IAEA-SM-222/09
DOSIMETRY STANDARDS FOR INDUSTRIAL RADIATION PROCESSING
W.L. McLAUGHLIN Center for Radiation Research,National Bureau o f Standards,Washington, DC,United States o f America
Abstract
D O SIM ETR Y STAN D ARD S FO R IN D U ST R IA L RA D IA T IO N PRO CESSING .The United States National Bureau of Standards (N BS ) has recently made a series of
calibration services available to the industrial radiation community and to users of large sources of gamma rays, X-rays and electrons. These calibrations contribute to standardizing the measurement of large absorbed doses of ionizing radiation (101 -106 Gy), over the energy range of interest in radiation processing (0.1 — 10 MeV). Since, in practice, a wide variety of dosimetry systems are used for the many industrial applications, special problems have been encountered in developing proper calibration procedures and selecting transfer instruments that supply traceability to primary radiation measurement standards, for example, absorbed dose measurements by calorimetry. Standardized measurement procedures involve the use of a large calibrated cobalt-60 gamma-ray source at NBS, for which the dose rate has been determined calorimetrically. This source is used to calibrate the response of a relatively accurate and reproducible dose meter, namely, a radiochromic dye film covering the dose ranges of interest in radiation processing. Because of the ruggedness and stability of this dose meter and the absence of dose-rate dependence of its response, it can be used as a routine transfer instrument for postal dose intercomparisons and to determine absorbed dose rates from industrial radiation sources, to measure dose distributions, and to calibrate other dosimetry systems for use on a production line or in commissioning a new radiation process.
1. INTRODUCTION
The commercial use o f large ionizing radiation sources has grown rapidly in several industries, particularly in the following [ 1 ] :
(i) Radiation sterilizaton (food and drug containers, biomedical implants,medical supplies, etc.), owing to the phasing out o f ethylene oxide sterilization o f some products;
(ii) Curing o f elastomers, plastics, and paint layers, where conventional chemicaland gas-oven methods cause pollution and are costly in terms o f energy;
89
90 McLAUGHLIN
(iii) Production o f improved and more compact electrical insulation for wires and cables;
(iv) Production o f heat-shrinkable plastic films and tubing;(v) Production o f dry lubricants from certain waste plastics;
(vi) Production o f pressure-sensitive adhesives;(vii) Special applications o f electron beams (welding, microlithography,
microelectronics, etc.).
Other promising applications for radiation processing are [1 ]:
(viii) Recycling solid wastes into fertilizers and animal food ;(ix) Water purification with less dependence on halogen treatment;(x ) Nucleating toxic components o f gas effluents in industrial plants;
(xi) F ood preservation (grain and fruit disinfestation, delayed ripening, partial sterilization, increasing shelf-life o f meats and fish, etc.);
(xii) Production o f improved textiles;(xiii) Production o f flame-resistant and non-smouldering building materials
and fabrics;(xiv) Control o f harmful insect populations (release o f mating insects
previously sterilized by ionizing radiation).Until recently these industries relied mainly on ‘ inbred’ , in-house dosimetry
methods for radiation measurement. In many instances this has resulted in poor quality control o f the process. A typical consequence o f this approach is poor quality control o f the dose meter itself. The user might purchase for routine dosimetry and product release a large batch o f a plastic dose meter system supplied with a calibration, only to find that the radiation sensitivity o f the system changes with shelf-life. Another pitfall is the inherent difficulty an industrial facility may have in maintaining accuracy and precision with impurity- sensitive chemical dose meters, such as acidic aqueous ferrous sulphate or eerie sulphate solutions. Often the processor disdains dosimetry altogether, depending solely on analysis o f the irradiated product, which is generally unreliable — in that not enough o f the product can be tested to give adequate sampling o f extremes o f dose variations.
Calculations o f absorbed dose and dose distributions based on other radiation parameters (e.g. source activity, electron beam power, conveyor speed, product geometry), though useful in ideal situations, are difficult to make. Heterogeneous products and diffuse incidence o f radiations with broad spectral distributions simply do not lend themselves to this approach.
On the other hand, relatively simple and reliable measurement techniques are available for assuring that absorbed dose in a product is standardized by means o f readings within limits o f precision needed in radiation processing, for both photon and electron sources.
IAEA-SM-222/09 91
The sources o f ionizing radiation used in industrial processing are usually one o f the following:(a) Cobalt-60 sources o f gamma rays (1.17 and 1.33 M eV) [2, 3 ];(b) Caesium-137 sources o f gamma-rays (0.661 MeV) [4 ];(c ) Electron accelerators (0.1 — 10 M eV) [5 —8];(d ) Bremsstrahlung X-rays from accelerators (3 —10 MeV) [8 —11 ].
The gamma-ray photons are usually supplied at absorbed dose rates1 from a few kilograys per hour (kG y/h ) upward to over 100 kilograys per hour, by large plaque sources in a single array or a parallel, double array. They are usually stored in a shielding water pool until irradiation is required^at which time the source plaques are raised [2, 3]. A conveyor transports the product past the plaque source, close to its surface, generally with switchbacks or crossovers, so that the product is irradiated from both sides in order to achieve an optimum uniformity o f dose distributions. In the so-called batch irradiator, the source may also have cylindrical geometry, and the product may move on a carousel or remain stationary around the source [12, 13]. Another possibility is a combination o f these various features, so that many kinds o f products may be irradiated either in a revolving batch mode at low capacity or with continuous loading and unloading (manual or automatic) at high capacity [14].
X-rays for radiation processing are mainly produced by intense electron beams striking a water-cooled, high-atomic-number metal target (e.g. tungsten or tantalum), either at the exit end o f a magnetic beam scanner horn or at the end o f a linear accelerator drift tube [8 —11 ]. This X-ray beam has a broad spectrum and is directed mostly forward and approximately parallel to the electron beam direction. X-rays with energies greater than 3 MeV have a somewhat greater penetrating power than do gamma rays from a caesium-137 or cobalt-60 source. Conveyors carry the product, generally in two passes,past the exit window o f the photon beam; for the second pass the product is often rotated through 180° such that it undergoes irradiation from two opposite sides in order to improve the uniformity o f the dose distribution.
Electron beams used for radiation processing are usually accelerated along the drift tube o f an accelerator, and the beams are then, before leaving through a thin metal window facing the product undergoing irradiation, scanned magnetically back and forth at a suitable frequency (e.g. 50 Hz). The product is transported past the electron-beam window in a direction approximately perpendicular to both
2. RADIATION SOURCES
1 1 gray = 1 joule per kilogram =100 rad (i.e. 1 Gy = 1 J/kg =100 rad).
92 McLAUGHLIN
the beam direction and the scan direction. This passage is sometimes repeated with the product turned through 180° in order to optimize the uniformity o f the dose distribution, although with electron beams this may not be necessary.
These arrangements for irradiation are designed to make the most o f the penetrating power o f the radiation, but depend upon correct dosimetry to ascertain whether or not the product will meet specifications, which in turn depends on the dose reaching a prescribed value within certain limits.
3. RADIATION QUANTITIES
Historically, the main radiation quantities o f interest in industrial processing are the absorbed dose, D, and the absorbed dose rate, D, in a given substance, primarily water or hydrocarbons. The main reason for this is that large quantities o f radiation are needed to effect a given process. Methods o f calibrating a given dose meter simulating a material o f interest are usually those involving standard systems such as calorimeters or liquid chemical dose meters [15]. In radiation processing, most routine methods o f dosimetry (e.g. using clear plastic or dyed plastics, solid-state crystalline systems, other chemical dose meters) require calibration against a standard measurement system [13, 14].
The present aim is to describe a practical way in which such calibrations are accomplished as part o f NBS missions:о Establishing traceability o f measurement to national standards; о Providing measurement services that are not available elsewhere; о Satisfying accuracy and precision o f determination o f quantities according
to public and commercial needs.The need for reliable dosimetry is most acute in processing applications
where the'health and safety o f the customer are affected. Radiation sterilization o f medical products is a prime example o f this need. In fact, o f the first 24 users o f the NBS calibration service to radiation processing industries [17], more than half are engaged in radiation sterilization.
Quality assurance in radiation processing can be provided by correct dosimetry standardization. Although commercial sterilization may be largely self-regulated by industry, certain medical products (e.g. surgical sutures) com e under government regulations determined by legislation. Regulatory bodies in the USA have recently moved away from suggesting biological testing as the prime controlling factor in product release, due to its imprecision and impracticality. There are now recommendations that radiation dosimetry be used to determine that a product has been irradiated to a sterilizing dose [18, 19].
Dosimetry, in fact, is used not only in research and development and the commissioning o f many other industrial radiation processes, but also for monitoring radiation parameters in production and for record keeping in product inventory control [16].
IAEA-SM-222/09 93
Reference measurement systems for measuring large radiation doses and dose rates as applied to radiation processing (i.e. calorimeters and standard chemical dose meters) are covered in the literature [15, 16, 20—25], and will not be dealt with here. Nevertheless, it should be pointed out that the intense ionizing photon and electron fields at NBS referred to in this section were calibrated calorimetrically [26—28] and,in the case o f gamma radiation, were checked by standard Fricke (ferrous sulphate) dosimetry.
For radiation processors, a calibration method involving a routine measurement system was needed for large absorbed doses and dose rates. The main difficulty was finding a transfer device that is stable and sufficiently reproducible and accurate to be irradiated to a given absorbed dose over the dose range 101 — 10 6 Gy, with instantaneous dose rates that may vary from 1 to 109 Gy/s, and yet give the correct dose interpretation when mailed and then read some days or weeks afterwards. It had to be small enough to satisfy “ cavity theory” requirements when calibrated under conditions that approximate to electron equilibrium [28], and be capable o f measuring absorbed dose in a product with high spatial resolution [29, 30] and without giving erroneous results due to energy dependence or temperature dependence [31].
From a huge assortment o f candidate dose meter systems for high-dose applications [15, 16, 20, 3 2 —34], a radiochromic dye film system was chosen as best suited to fill the above requirements [16, 28, 29, 31]. This system was developed at NBS [35], with improvements made at the Ris0 National Laboratory, Denmark [36], and it is now commercially available2 in several forms [37]. The main advantages o f this system over other routine kilorad-to-megarad systems are:(i) acceptable reproducibility (± 2%); (ii) large dynamic range ( 10 1 — 10 6 G y);(iii) dose-rate independence o f response (up to 1012 G y/s), such that it can be calibrated in a known gamma-ray field, but used at various dose rates and even in intense, pulsed electron beams without error; (iv) ruggedness and stability at various storage temperatures over many weeks after irradiation, so that it can be mailed and will still give reliable dose readings; (v) variability o f ingredients, so that it can be made to simulate different biological tissues and plastics, thus reducing error due to energy dependence o f response [36, 38]; (vi) compactness and high-resolution imaging characteristics [28, 29].
Certain precautions must be taken in the use o f this system, namely:(a) Each film batch must be calibrated in a standard field or against a standard reference instrument; (b ) it must be shielded from ultraviolet light; (c) the film must be handled without scratching or marring the surface; (d ) it must be protected
2 Far West Technology, Inc., Goleta, California. This identification of a commercialproduct is for the purpose of specifying dose meters for routine use, and does not implyendorsement of their use for such applications by the United States National Bureau of Standards.
4. CALIBRATION MATERIALS AND METHODS
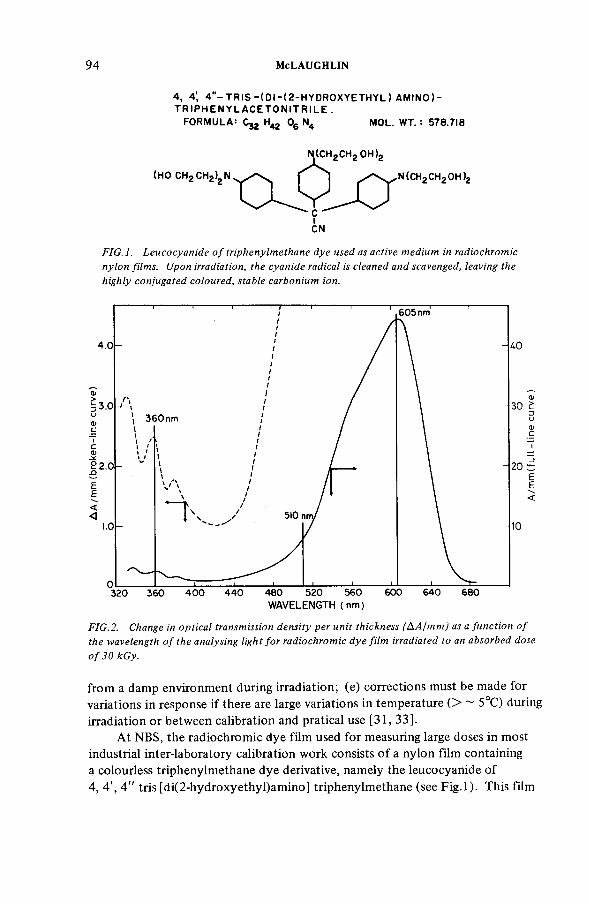
94 McLAUGHLIN
4, 4', 4"- T R IS - (DI -(2-HYDROXYETHYL ) AMINO ) - T R IP H E N Y L A C E T O N IT R IL E .
FORMULA: C j2 H42 06 N4 MOL. WT. : 578.718
FIG.l. L eucocyanide o f triphenylmethane dye used as active medium in radiochromic nylon films. Upon irradiation, the cyanide radical is cleaned and scavenged, leaving the highly conjugated coloured, stable carbonium ion.
WAVELENGTH (nm )
FIG.2. Change in optical transmission density per unit thickness (AA/mmj as a function o f the wavelength o f the analysing light fo r radiochromic dye film irradiated to an absorbed dose o f 30 kGy.
from a damp environment during irradiation; (e) corrections must be made for variations in response if there are large variations in temperature ( > ~ 5°C) during irradiation or between calibration and pratical use [31, 33].
At NBS, the radiochromic dye film used for measuring large doses in most industrial inter-laboratory calibration work consists o f a nylon film containing a colourless triphenylmethane dye derivative, namely the leucocyanide o f4, 4', 4 " tris [di(2-hydroxyethyl)am ino] triphenylmethane (see F ig .l). This film
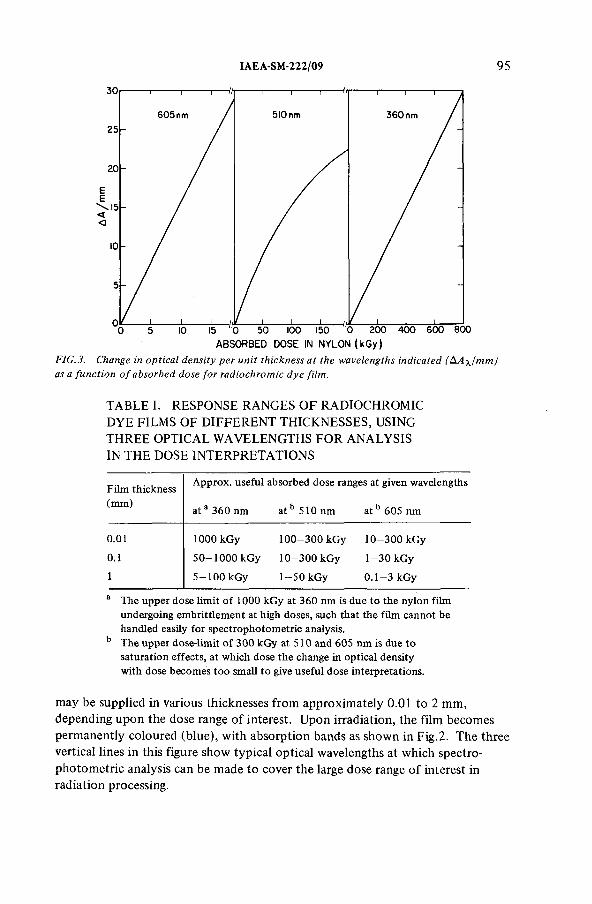
IAEA-SM-222/09 95
FIG.3. Change in optical density per unit thickness at the wavelengths indicated (AA^/mm) as a function o f absorbed dose fo r radiochromic dye film.
TABLE I. RESPONSE RANGES OF RADIOCHROMIC DYE FILMS OF DIFFERENT THICKNESSES, USING THREE OPTICAL WAVELENGTHS FOR ANALYSIS IN THE DOSE INTERPRETATIONS
Film thickness (mm)
Approx. useful absorbed dose ranges at given wavelengths
a ta 360nm a tb 510nm at b 605 nm
0.01 1000 kGy 100-300 kGy 10-300 kGy
0.1 50-1000kGy 10-300 kGy 1-30kGy1 5-100kGy 1-50kGy 0.1-3 kGy
a The upper dose limit of 1000 kGy at 360 nm is due to the nylon film undergoing embrittlement at high doses, such that the film cannot be handled easily for spectrophotometric analysis.
b The upper dose-limit of 300 kGy at 510 and 605 nm is due to saturation effects, at which dose the change in optical density with dose becomes too small to give useful dose interpretations.
may be supplied in various thicknesses from approximately 0.01 to 2 mm, depending upon the dose range o f interest. Upon irradiation, the film becomes permanently coloured (blue), with absorption bands as shown in Fig.2. The three vertical lines in this figure show typical optical wavelengths at which spectrophotom etric analysis can be made to cover the large dose range o f interest in radiation processing.
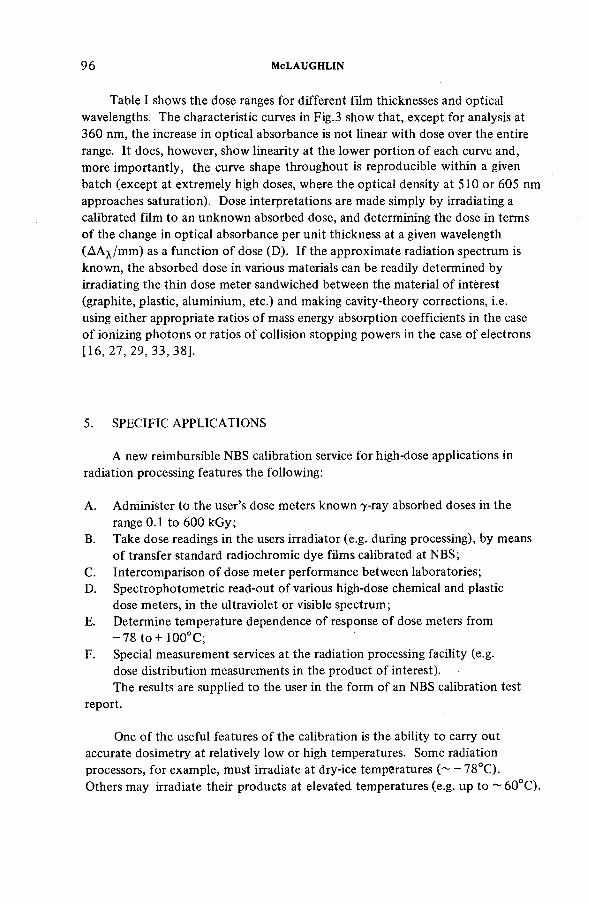
96 McLAUGHLIN
Table I shows the dose ranges for different film thicknesses and optical wavelengths. The characteristic curves in Fig.3 show that, except for analysis at 360 nm, the increase in optical absorbance is not linear with dose over the entire range. It does, however, show linearity at the lower portion o f each curve and, more importantly, the curve shape throughout is reproducible within a given batch (except at extremely high doses, where the optical density at 510 or 605 nm approaches saturation). Dose interpretations are made simply by irradiating a calibrated film to an unknown absorbed dose, and determining the dose in terms o f the change in optical absorbance per unit thickness at a given wavelength (A A ^/m m ) as a function o f dose (D). I f the approximate radiation spectrum is known, the absorbed dose in various materials can be readily determined by irradiating the thin dose meter sandwiched between the material o f interest (graphite, plastic, aluminium, etc.) and making cavity-theory corrections, i.e. using either appropriate ratios o f mass energy absorption coefficients in the case o f ionizing photons or ratios o f collision stopping powers in the case o f electrons [16, 2 7 ,2 9 ,3 3 ,3 8 ] .
5. SPECIFIC APPLICATIONS
A new reimbursible NBS calibration service for high-dose applications in radiation processing features the following:
A. Administer to the user’s dose meters known 7 -ray absorbed doses in the range 0.1 to 600 kGy;
B. Take dose readings in the users irradiator (e.g. during processing), by means o f transfer standard radiochromic dye films calibrated at NBS;
C. Intercomparison o f dose meter performance between laboratories;D. Spectrophotometric read-out o f various high-dose chemical and plastic
dose meters, in the ultraviolet or visible spectrum;E. Determine temperature dependence o f response o f dose meters from
- 7 8 to + 100°C;F. Special measurement services at the radiation processing facility (e.g.
dose distribution measurements in the product o f interest).The results are supplied to the user in the form o f an NBS calibration test
report.
One o f the useful features o f the calibration is the ability to carry out accurate dosimetry at relatively low or high temperatures. Some radiationprocessors, for example, must irradiate at dry-ice temperatures (----- 78°C).Others may irradiate their products at elevated temperatures (e.g. up to ~ 6 0 °C ).
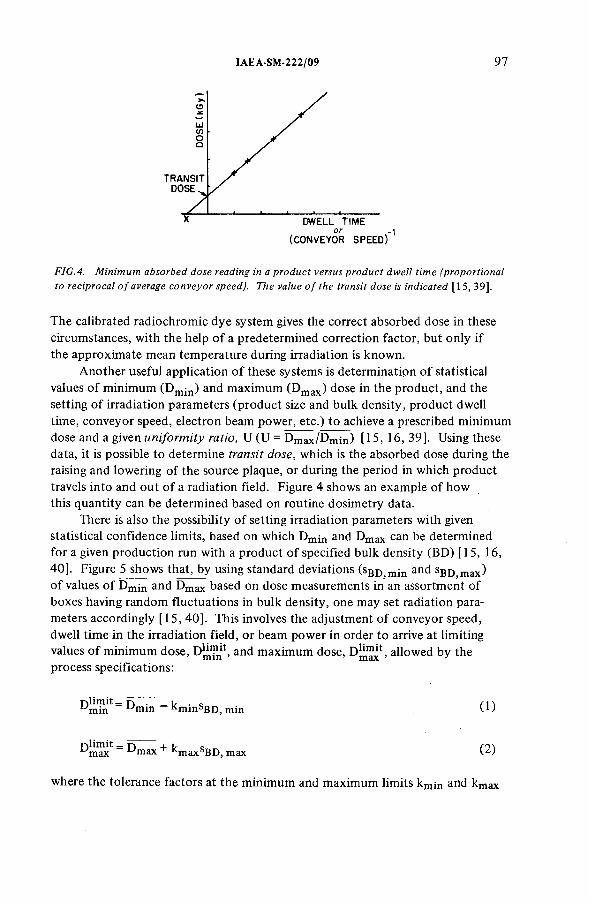
IAEA-SM-222/09 97
FIG.4. Minimum absorbed dose reading in a product versus product dwell time (proportional to reciprocal o f average conveyor speed). The value o f the transit dose is indicated [ 15, 39].
The calibrated radiochromic dye system gives the correct absorbed dose in these circumstances, with the help o f a predetermined correction factor, but only if the approximate mean temperature during irradiation is known.
Another useful application o f these systems is determination o f statistical values o f minimum (Dmin) and maximum (Dmax) dose in the product, and the setting o f irradiation parameters (product size and bulk density, product dwell time, conveyor speed, electron beam power, etc.) to achieve a prescribed minimum dose and a given uniformity ratio, U (U = Dmax/Dmin) [15, 16 ,3 9 ]. Using these data, it is possible to determine transit dose, which is the absorbed dose during the raising and lowering o f the source plaque, or during the period in which producttravels into and out o f a radiation field. Figure 4 shows an example o f howthis quantity can be determined based on routine dosimetry data.
There is also the possibility o f setting irradiation parameters with given statistical confidence limits, based on which Dmjn and Dmax can be determined for a given production run with a product o f specified bulk density (BD) [15, 16, 40]. Figure 5 shows that, by using standard deviations (sgD.mm anc* sBD,m ax) o f values o f Dm¡n and Dmax based on dose measurements in an assortment o f boxes having random fluctuations in bulk density, one may set radiation parameters accordingly [15, 40]. This involves the adjustment o f conveyor speed, dwell time in the irradiation field, or beam power in order to arrive at limiting values o f minimum dose, and maximum dose, allowed by theprocess specifications:
Dmin1 = Dmin ~ kmin sBD) min ( 1 )
° т а х * = D max + ^maxsBD, max ( 2 )
where the tolerance factors at the minimum and maximum limits km¡n and kmax
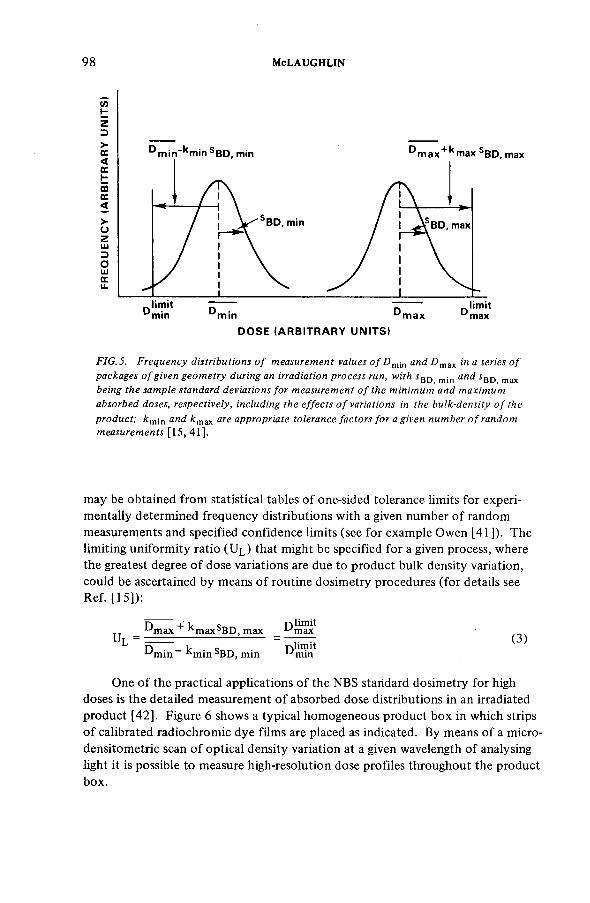
98 McLAUGHUN
DOSE (ARBITRARY UNITS)
FIG.5. Frequency distributions o f measurement values o f D m and D max in a series o f packages o f given geom etry during an irradiation process run, with j bd mjn and j bd max being the sample standard deviations for measurement o f the minimum and maximum absorbed doses, respectively, including the effects o f variations in the bulk-density o f the product; km ¡n and fcmax are appropriate tolerance factors for a given number o f random measurements [15,41]-
may be obtained from statistical tables o f one-sided tolerance limits for experimentally determined frequency distributions with a given number o f random measurements and specified confidence limits (see for example Owen [41 ]). The limiting uniformity ratio (U l ) that might be specified for a given process, where the greatest degree o f dose variations are due to product bulk density variation, could be ascertained by means o f routine dosimetry procedures (for details see Ref. [15]):
Г) + V « тл limitTT _ ^m ax '■max^BD, max ^maxUt ~ ——7. ГТ (3)Г) . _ W . niumt^m in bm in 5BD, mm ^m in
One o f the practical applications o f the NBS standard dosimetry for high doses is the detailed measurement o f absorbed dose distributions in an irradiated product [42]. Figure 6 shows a typical homogeneous product box in which strips o f calibrated radiochromic dye films are placed as indicated. By means o f a micro- densitometric scan o f optical density variation at a given wavelength o f analysing light it is possible to measure high-resolution dose profiles throughout the product box.
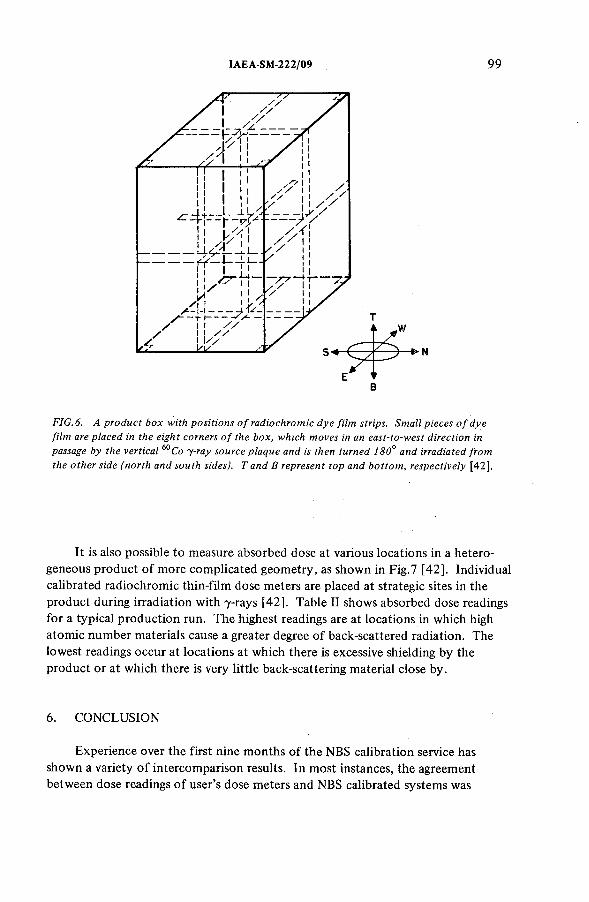
IAEA-SM-222/09 99
FIG. 6. A product box with positions o f radiochromic dye film strips. Small pieces o f dye film are placed in the eight corners o f the box, which moves in an east-to-west direction in passage by the vertical 60Co y-ray source plaque and is then turned 180° and irradiated from the other side (north and south sides). T and В represent top and bottom , respectively [42].
It is also possible to measure absorbed dose at various locations in a heterogeneous product o f more complicated geometry, as shown in Fig.7 [42]. Individual calibrated radiochromic thin-film dose meters are placed at strategic sites in the product during irradiation with 7 -rays [42]. Table II shows absorbed dose readings for a typical production run. The highest readings are at locations in which high atom ic number materials cause a greater degree o f back-scattered radiation. The lowest readings occur at locations at which there is excessive shielding by the product or at which there is very little back-scattering material close by.
6 . CONCLUSION
Experience over the first nine months o f the NBS calibration service has shown a variety o f intercomparison results. In most instances, the agreement between dose readings o f user’s dose meters and NBS calibrated systems was
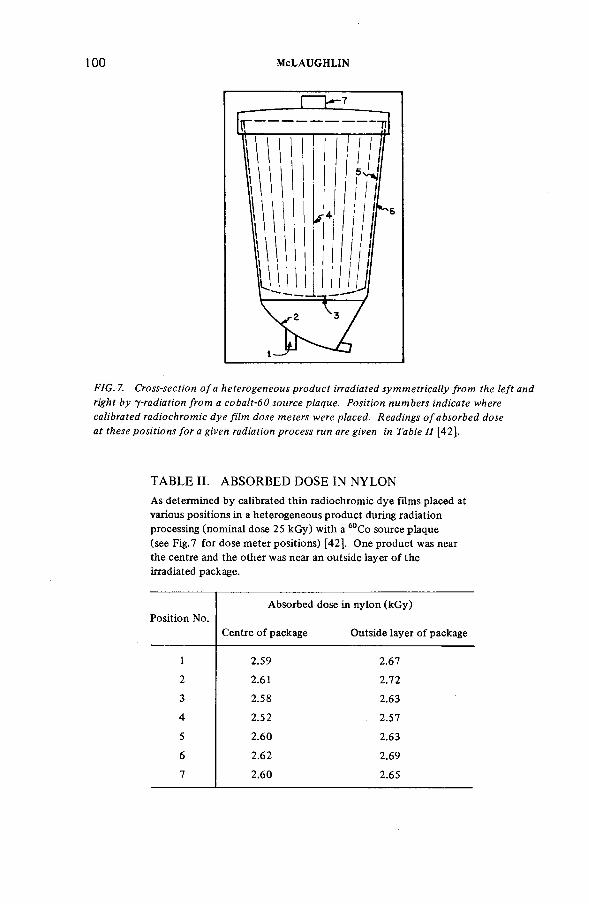
100 McLAUGHLIN
n - 7
FIG. 7. Cross-section o f a heterogeneous product irradiated symmetrically from the left and right by y-radiation from a cobalt-60 source plaque. Position numbers indicate where calibrated radiochromic dye film dose meters were placed. Readings o f absorbed dose at these positions fo r a given radiation process run are given in Table II [42].
TABLE II. ABSORBED DOSE IN NYLONAs determined by calibrated thin radiochromic dye films placed at various positions in a heterogeneous product during radiation processing (nominal dose 25 kGy) with a 60Co source plaque (seeFig.7 for dose meter positions) [42]. One product was near the centre and the other was near an outside layer of the irradiated package.
Position No.Absorbed dose in nylon (kG y)
Centre of package Outside layer of package
1 2.59 2.67
2 2.61 2.72
3 2.58 2.634 2.52 . 2.57
5 2.60 2.63
6 2.62 2.69
7 2.60 2.65
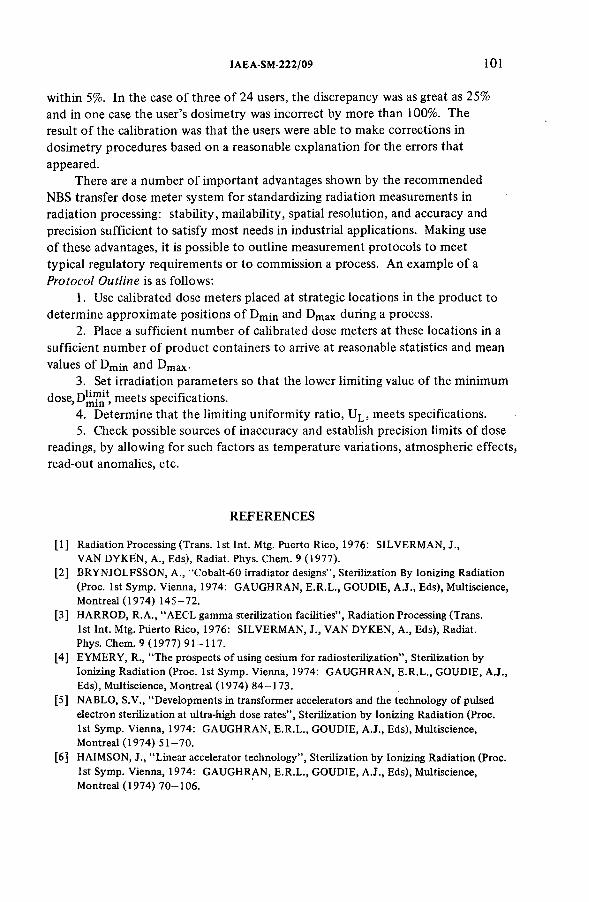
IAEA-SM-222/09 101
within 5%. In the case o f three o f 24 users, the discrepancy was as great as 25% and in one case the user’ s dosimetry was incorrect by more than 100%. The result o f the calibration was that the users were able to make corrections in dosimetry procedures based on a reasonable explanation for the errors that appeared.
There are a number o f important advantages shown by the recommended NBS transfer dose meter system for standardizing radiation measurements in radiation processing: stability, mailability, spatial resolution, and accuracy and precision sufficient to satisfy most needs in industrial applications. Making use o f these advantages, it is possible to outline measurement protocols to meet typical regulatory requirements or to commission a process. An example o f a P rotocol Outline is as follows:
1. Use calibrated dose meters placed at strategic locations in the product to determine approximate positions o f Dmin and Dmax during a process.
2. Place a sufficient number o f calibrated dose meters at these locations in a sufficient number o f product containers to arrive at reasonable statistics and mean values o f Dmin and Dmax.
3. Set irradiation parameters so that the lower limiting value o f the minimum dose, DHmrt, meets specifications.
4. Determine that the limiting uniformity ratio, UL , meets specifications.5. Check possible sources o f inaccuracy and establish precision limits o f dose
readings, by allowing for such factors as temperature variations, atmospheric effects, read-out anomalies, etc.
REFERENCES
[1] Radiation Processing (Trans. 1st Int. Mtg. Puerto Rico, 1976: S ILV ER M A N , J.,VAN D YK ËN , A., Eds), Radiat. Phys. Chem. 9 (1977).
[2] B R Y N JO LFSSO N , A., “ Cobalt-60 irradiator designs” , Sterilization By Ionizing Radiation (Proc. 1st Symp. Vienna, 1974: GA UG H RA N , E .R .L ., GO UD IE, A .J., Eds), Multiscience, Montreal (1974) 145-72.
[3] HARRO D , R.A., “ A EC L gamma sterilization facilities” , Radiation Processing (Trans.1st Int. Mtg. Puerto Rico, 1976: S ILV ER M A N , J., V A N D YK EN , A., Eds), Radiat.Phys. Chem. 9 (1977) 91-117.
[4] E Y M E R Y , R., “ The prospects of using cesium for radiosterilization” , Sterilization by Ionizing Radiation (Proc. 1st Symp. Vienna, 1974: G A UG H RA N , E .R .L ., GO UD IE, A .J., Eds), Multiscience, Montreal (1974) 84-173.
[5] NABLO , S.V., “ Developments in transformer accelerators and the technology of pulsed electron sterilization at ultra-high dose rates” , Sterilization by Ionizing Radiation (Proc.1st Symp. Vienna, 1974: G A UG H RA N , E .R .L ., G O UD IE, A .J., Eds), Multiscience, Montreal (1974) 51-70.
[6 ] HAIMSON, J., “ Linear accelerator technology” , Sterilization by Ionizing Radiation (Proc. 1st Symp. Vienna, 1974: GAUG H RA N , E .R .L ., GO UD IE, A .J., Eds), Multiscience, Montreal (1974) 70-106.
1 0 2 McLAUGHLIN
[7] R A M LER , W .J., “ DC accelerators” , Sterilization by Ionizing Radiation (Proc. 1st Symp. Vienna, 1974: G A UG H RA N , E .R .L ., GO UD IE, A .J., Eds), Multiscience, Montreal (1974) 115-35.
[8 ] G R Ü N EW A LD , T., “ Machine sources in food irradiation” , Food Irradiation (Proc. Symp. Karlsruhe, 1966), IA EA , Vienna (1966) 55.
[9] M IL L E R , C.W., “ Power sources for irradiation processing: The linear accelerator” ,Radiation Sources (C H A R L ESB Y , A., Ed.), Macmillan, New York (1964) 197—219.
[10] R A JE W S K Y , B., “ X-ray equipment for food irradiation” , Food Irradiation (Proc. Symp. Karlsruhe, 1966), IA EA , Vienna (1966) 67.
[11] HAN SEN , J., A 10 MeV Bremsstrahlung Converter, RisçS National Laboratory Report, Roskilde, Denmark (1971).
[12] UM EDA , K., “ Background to the establishment of the first food irradiation plant in Japan” , Requirements for the Irradiation of Food on a Commercial Scale (Proc. Panel Vienna,1974), IA EA , Vienna (1975) 113.
[13] TOM ITA, K., SUG IM OTO, S., “ A commercial gamma-ray irradiation plant in Japan” , Radiation Processing (Trans. 1st Int. Mtg. Puerto Rico, 1976: S ILV ER M A N , J.,V A N D YK EN , Eds), Radiat. Phys. Chem. 9 (1977) 567-73.
[14] M A R KO V ld , V.M., E Y M E R Y , R., YU A N , H.C., “ A new approach to 60Co plant design for introduction of radiation sterilization in developing countries” , Radiation Processing (Trans. 1st Int. Mtg. Puerto Rico, 1976: S ILV ER M A N , J., V A N D Y K EN , A., Eds),Radiat. Phys. Chem. 9 (1977) 625-31.
[15] CHADW ICK, K.H., EH LER M A N N , D.A.E., M cLA U G H LIN , W .L., Manual of Food Irradiation Dosimetry, Technical Reports Series No. 178, IA EA , Vienna (1977).
[16] M cLA UG H LIN , W.L., “ Radiation measurements and quality control” , Radiation Processing (Trans. 1st Int. Mtg. Puerto Rico, 1976: S ILV ER M A N , J., V A N D YK EN , A.,Eds), Radiat. Phys. Chem. 9 (1977) 147—81.
[17] N A T IO N A L B U R E A U O F STANDARDS, NBS Special Publication 250 - Oct 1977 Appendix, US Dept, of Commerce, National Bureau of Standards, Washington, DC (1977) 17.
[18] BRUCH, C.W., “ Sterility assurance in medical supplies sterilized by gamma radiation” , Gamma Radiation Processing (Proc. Seminar Ottawa, 1975), Atomic Energy of Canada,Ltd., Ottawa (1975) 101.
[19] D IER K SH E ID E , W.C., “ Sterility assurance of medical products” , Radiation Processing (Trans. 1st Int. Mtg. Puerto Rico, 1976: S ILV ER M A N , J., VAN D Y K EN , A., Eds),Radiat. Phys. Chem. 9 (1977) 221-24.
[20] HOLM, N.W., “ Dosimetry in industrial processing” , Ch. 33, Radiation Dosimetry (A T T IX , F.H., TO CH IL IN , E., Eds) 3, Academic Press, New York (1969).
[21] F IE L D E N , E.M., HOLM , N.W., “ Dosimetry in accelerator research and processing” ,Ch. 10, Manual on Radiation Processing (HO LM , N.W., B E R R Y , R .J., Eds), Marcel Dekker, New York (1970).
[22] IN T ER N A T IO N A L COMM ISSION ON RA D IA T IO N UN ITS AND M EA SU R EM EN TS , Radiation Dosimetry: X Rays and Gamma Rays with Maximum Photon Energies Between 0.6 and 50 MeV, IC R U Report 14, ICRU , Washington, D.C. (1969).
[23] W E ISS , J., R IZZO , F.X ., “ Cobalt-60 dosimetry in radiation research and processing” ,Ch. 9, Manual on Radiation Dosimetry (HO LM , N.W., B E R R Y , R .J., Eds), Marcel Dekker, New York (1970).
[24] R A D A K , B., M A R K O V ld , V., “ Calorimetry” , Ch. 3, Manual on Radiation Dosimetry (HO LM , N.W., B E R R Y , R .J., Eds), Marcel Dekker, New York (1970).
[25] HOLM, N.W., ZA G O RSK I, Z., “Aqueous chemical dosimetry”, Ch. 4, Manual on Radiation Dosimetry (HO LM , N.W., B E R R Y , R .J., Eds), Marcel Dekker, New York (1970).
IAEA-SM-222/09 103
[26] P E T R E E , В., LA M PER T I, P., A comparison of absorbed dose determinations in graphite by cavity ionization measurements and by calorimetry, Natl. Bur. Stands. J . Res, С 71 (1967) 19-27.
[27] C H A PPELL , S.E., H U M PH REYS, J.C ., The dose rate response of a dye-polychlorostyrene film dosimeter, IE E E Trans. Nucl. Sci. NS-19 (1972) 175—80,
[28] M cLA U G H LIN , W.L., H J O R T EN B ER G , P.E., R A D A K , B.B., “ Absorbed-dose measurements with thin films” , Dosimetry in Agriculture, Industry, Biology and Medicine (Proc. Symp. Vienna, 1972), IA EA , Vienna (1973) 577—97.
[29] M cLA U G H LIN , W .L., “ Radiation dosimetry with thin films” , Industrial Applications of Small Accelerators (Proc. 3rd Conf. Denton, Texas, 1974: M ORGAN, I.L., DUGGAN, J.L ., Eds) 2, NT IS, US Department of Commerce, Washington, DC (1974) 65-85.
[30] M cLA U G H LIN , W .L., H U M PH REYS, J.C., C H A PPELL , S.E., O LE JN IK , T.A., FO X , C.E., “ Physical measurements for quality control in industrial radiation sterilization” , Physicsin Industry (Proc. Int. IU PA P Mtg Dublin, 1976: O’MONGAIN, E., O’TO O LE, C.P., Eds), Pergamon Press, Oxford (1976) 567—74.
[31 ] M IL L E R , A., B JE R G B A K K E , E., M cLA UG H LIN , W .L., Some limitations in the use of plastic and dyed plastic dosimeters, Int. J . Appl. Radiat. Isot. 26 (1976) 611—20.
[32] M cLA UG H LIN , W .L., “ Films, dyes, and photographic systems” , Ch. 6 , Manual on Radiation Dosimetry (HOLM , N.W., B E R R Y , R .J., Eds), Marcel Dekker, New York (1970).
[33] M cLA UG H LIN , W .L., “ Solid-phase chemical dosimeters” , Sterilization by Ionizing Radiation (Proc. 1st Symp. Vienna, 1974: G A U G H RA N , E .R .L ., G O U D IE , A .J., Eds), Multiscience, Montreal (1974) 219—52.
[34] M cLA U G H LIN , W.L., JA R R E T T , R.D., O L E JN IK , T.A., “ Dosimetry” , Ch. 7, Preservation of Food by Ionizing Radiation (JO SEPH SO N , E.S., PET ERSO N , M.S., Eds), CRC Press, Cleveland (1978, in press).
[35] M cLA UG H LIN , W.L., C H A L K L EY , L., Low atomic-number dye systems for ionizing radiation measurement, Photogr. Sci. Eng. 9 (1965) 159—66.
[36] M cLA UG H LIN , W .L., M IL L E R , A., F ID A N , S., P E JT E R S E N , K., B A T SB ER G PET ER SEN , W., Radiochromic plastic film for accurate measurement of radiation absorbed dose and dose distributions, Radiat. Phys. Chem. 10 (1977) 119—27.
[37] KANTZ, A.D., H U M PH ERYS , K.C., “ Radiochromics: A radiation monitoring system” , Radiation Processing (Trans. 1st Int. Mtg. Puerto Rico, 1976: S ILV ER M A N , J.,V A N D YK EN , A., Eds), Radiat. Phys. Chem. 9 (1977) 737-47.
[38] M cLA UG H LIN , W.L., R O SEN ST EIN , М., L E V IN E , H., “ Bone- and muscle-equivalent solid chemical dose meters for photon and electron doses above one kilorad” , Biomedical Dosimetry (Proc. Symp. Vienna, 1975), IA EA , Vienna (1975) 267—81.
[39] CHADW ICK, K.H., “ Dosimetry techniques for commissioning a process” , Sterilizationby Ionizing Radiation (Proc. 1st Symp. Vienna, 1974: G A UG H RA N , E .R .L ., GO UD IE, A .J., Eds), Multiscience, Montreal (1974) 285—98.
[40] CHADW ICK, K.H., “ Facility calibration, the commissioning of a process, and routine monitoring practices” , Radiosterilization of Medical Products 1974 (Proc. Symp.Bombay, 1974), IA EA , Vienna (1975) 69.
[41 ] OWEN, D.B., “ Factors for one-sided tolerance limits and for variables sampling plans” ,Sandia Corp. Rep. SCR-609, NTIS, US Dept, of Commerce, Washington, DC (1963)9 and Table 2.
[42] M cLA UG H LIN , W .L., H U M PH REYS , J.C., C H A PPELL , S.E., O LE JN IK , T.A.,“ Measurement of absorbed dose distributions in a radiation sterilization plant” , NBS report, US Dept, of Commerce, Washington, DC (1978, to be published).
104 McLAUGHLIN
DISCUSSION
S.С. ELLIS: What proportion o f the routine industrial dose meter calibrations carried out by NBS involve direct irradiation o f the routine system at NBS, and what proportion involve the use o f your radiochromic dye films for transfer, i.e. in-plant calibration?
W.L. McLAUGHLIN: So far, about one third o f the measurement services for radiation processing users (primarily radiation sterilization users) have involved the irradiation at NBS o f the users’ dose meters, which in some instances were routine dose meters other than the radiochromic dye film used as the NBS transfer dose meter. Examples o f these systems are red Perspex chips, eerie sulphate solutions, and ferrous-cupric sulphate solutions. In most other cases, the radiation measurement service consisted o f the transfer by post o f the NBS-calibrated radiochromic dye films for the user to irradiate under appropriate conditions (e.g. approximate electron equilibrium conditions in the case o f 60Co 7 -rays) together with the users’ routine dose meter. The radiochromic dose meter is then returned to NBS for dose interpretation. One variable that must be monitored in this case is the temperature during irradiation - if it changes by more than about 5°C. The reason for this is that the radiochromic response function varies slightly with temperature during irradiation.
G. BUSUOLI: What are the accuracy and precision o f the dye systems you described?
W.L. McLAUGHLIN: The radiochromic dye film dose meter used as a transfer system gives, with the assistance o f a calibration curve, absorbed dose interpretations with precision limits o f approximately ± 2% ( 2a), as long as the thickness o f each dose meter is carefully monitored with a thickness gauge capable o f measuring thickness to within ± 1 ¡im. The absorbed dose is then determined in terms o f the change in optical density per unit thickness o f the dose meter as a function o f absorbed dose. The accuracy o f dose interpretation may be specified as ± 5% for most broad spectral distributions encountered in radiation processing, where the absorbed dose o f interest is likely to be in a material different from the dose meter itself, such that corrections for differences in radiation absorption cross-sections must.be made. I f these corrections are unnecessary, as is the case when one needs to know the absorbed dose in the dose meter itself, the accuracy o f the reading by the radiochromic dye film system is considerably better than ± 5%.
J.-P. GUIHO: Essentially, you have been speaking about the sterilization o f various products. However, many now face an important problem connected with the resistance to radiation o f materials used in the construction o f reactors. Tests on such materials involve important thermodynamic constraints in addition to radiation.
The Laboratoire de Métrologie des Rayonnements Ionisants has been working with cellulose triacetate. Is NBS conducting this type o f programme?I f so, how does the response o f your dose meter vary as a function o f temperature?
IAEA-SM-222/09 105
W.L. McLAUGHLIN: There are indeed serious problems in the correct use o f most routine dose meters to determine large absorbed doses when temperature gradients during irradiation are large. The radiochromic dye film dose meter can be used over the temperature range from -8 0 to + 1 0 0 °C, as long as corrections for the temperature dependence o f response are applied. Further details o f the thermal effects which influence the response o f these dose meters and certain other routine dose meters used for determining large radiation doses, including the cellulose triacetate system, are given in Refs [31 ] and [33] o f the paper.
A.C. LUCAS: Vaughn and Miller have discussed the possibility o f using the absorption bands in pure LiF for dosimetry in the range 103 to 107 Gy. Do you think this might be a useful system for calibration and intercomparison?
W.L. McLAUGHLIN: I do indeed. I recently performed dosimetry experiments with Arne Miller o f the Accelerator Department at Ris0 (Denmark) using some LiF supplied to me earlier by Harshaw Chemical Co. as window material for vacuum ultra-violet studies. We found that relatively stable absorption bands are formed in the near ultra-violet and visible spectra similar to those reported by Vaughn and Miller3 and by Claffy4 . Since the number o f absorption centres, such as those represented by the M and R bands in pure LiF, can be determined absolutely as a function o f absorbed dose, with a known relation between concentration o f centres and spectral optical density, this system should make a useful reference dose meter for the absorbed dose range you mention and perhaps even for doses somewhat lower than 103 Gy, if the M-band absorption at about 450 nm is used in conjunction with other absorption bands that appear to be amplified when thermoluminescence centres are annealed at 210°C. I should also mention one other feature o f these potentially useful dose meters. They may be used over and over again if the absorption centres are thoroughly annealed at 500°C for an hour or so. The question that remains is whether or not a manufacturing company such as yours is interested in supplying quality-controlled material for such applications.
J.C. McDONALD: What was the thin foil calorimeter made of, and how was the temperature rise measured?
W.L. McLAUGHLIN: The thin calorimeter used at NBS to calibrate the response o f thin plastic dose meters consisted either o f a graphite wafer or a metal foil, in which were embedded tiny thermocouples. The voltage signal
3 V A U G H N , W .J., M IL L E R , L .O ., D o sim etry using o p tica l d en sity changes in L iF , H ealth Ph ys. 18 (1 9 7 0 ) 578.
4 C L A F F Y , E .W ., “ T h erm o lu m in escen ce and c o lo r cen ters in lith iu m -flu o rid e” ,
Lu m in escen ce D o sim etry (P ro c. Int. C o n f. P alo A lto , C a lifo rn ia , 19 6 5 : A T T I X , F .H ., E d .),
US D ep t, o f E n ergy, W ashington, D C ( 1 9 6 7 ) 74.
106 McLAUGHLIN
representing temperature rise and fall as a function o f time was monitored with the help o f a multichannel analyser. The absorbed dose in the calorimetric body was corrected to that in the dose meter o f interest with the help o f mass collision stopping power ratios weighted over the electron spectra used for the calibration. Details may be found in Ref.[27].
IAEA-SM-222/63
PRIMARY AND SECONDARY STANDARDS OF DOSIMETRY
Calibration methods in Hungary
K. ZSDÁNSZKYNational Office o f Measures (OMH), Budapest,Hungary
Abstract
P R IM A R Y A N D S E C O N D A R Y S T A N D A R D S O F D O S IM E T R Y : C A L IB R A T IO N
M E T H O D S IN H U N G A R Y .
Sin ce 19 6 5 , p rim ary d o sim etry standards have been designed and b u ilt at th e H ungarian
N ation al O ffic e o f M easures (O M H ) fo r exp o su re m easurem ents o f X -rays and gam m a rays.
Th ree p arallel-p late free-air io n izatio n cham bers are the p rim ary standards fo r X -rays in the
ranges 5 to 30 k V , 20 to 80 k V and 50 to 400 k V . F o r 60C o and 137Cs gam m a radiation s, the
prim ary standards are th ree graph ite cy lin d rica l-cav ity io n izatio n cham bers. D irect com p arison s
have b een m ade b e tw e e n th e exp o su re standards o f the In tern ation al B u reau o f W eights and
M easures (B IPM ) and th e O M H fo r 30 and 50 k V X -rays and fo r 60C o gam m a rays. T h e
agreem ent w as b e tte r than 0.3% . F o r m edium en ergy X -rays, in d irect com parison has been
u n dertaken w ith BIPM using tw o O M H transfer-standard io n izatio n cham bers. T h e d ifferen ces
were fo u n d to be less th an 0 .5% fo r X -rays in the range o f 100 to 250 k V . S econ dary-stan dard
io n izatio n cham bers have been designed fo r ca lib ration o f field instrum ents. T h e energy
dep end en ce o f th e seco n d ary standard cham bers is less th an ± 2% in the range 30 k e V to the
energy o f “ C o gam m a rad iatio n ( ~ 1 .2 5 M eV ). Precision d igital current in tegrato rs have been
b u ilt fo r m easurem ent o f th e io n iza tio n current. A u to m a tic in tegration is p erform ed b y a
high-gain op eratio n al am p lifier w ith a m o sfet in p u t. C u rre n tly th e OM H D o sim e try L a b o ra to ry
is engaged in m aking th e m easurem ents a u to m atic . A ca lorim etric standard o f absorbed dose
is in th e design stage. T h e d o sim etry standards o f th e OM H are used fo r th e calib ration o f
secon d ary standards and fie ld instrum ents. T h e la tter m ay b e calibrated in o u tsid e laboratories
that have b een au th o rized to do su ch w o rk b y O M H . P erio d ic ca lib ration s o f th erap y-level and
radiation -p rotection -level dose m eters are o b lig a to ry b y decree in H ungary.
1. INTRODUCTION
The Hungarian National Office o f Measures (Országos Mérésügyi Hivatal, OMH) is the national authority o f metrology in Hungary. As with standardization and dissemination o f other units o f measurement, the OMH has designed primary standards for dosimetry since 1965. Secondary dosimetry standards have been
107
108 ZSDÁNSZKY
built for the dissemination o f the dosimetry units obtained from the primary standards [ 1 ].
The most important activities o f the OMH Dosimetry Laboratory are:(a) Research into and development o f primary and secondary standards;(b) Participation in international comparisons o f national standards;(c) Framing o f calibration procedures;(d) Calibration o f secondary standards and field instruments;(e) Authorization o f other laboratories for the calibration o f field instruments;(f) Tests on measuring apparatus.In addition, the OMH Dosimetry Laboratory co-operates with national and international organizations in the field o f dosimetry. In this manner, for example, the OMH is one o f the Primary Standard Dosimetry Laboratories which — as an affiliated member — provides support for the IAEA/WHO Network o f Secondary Standard Dosimetry Laboratories.
As can be seen from the activities mentioned above, the OMH is responsible for the national standards and, in addition, is the superior authority o f legal metrology in Hungary.
2. PRIMARY STANDARDS OF DOSIMETRY IN OMH
The primary standards o f dosimetry for X-rays are shown in Fig.l together with the calibration arrangement. Three parallel-plate free-air ionization chambers have been built for the X-ray ranges 5 to 30 kV, 20 to 80 kV and 50—400 kV. The chambers have been designed with particular attention paid to the long-term geometric stability o f the electrode positions. Filters o f appropriate purity are mounted on a wheel as close as possible to the X-ray tube. The beam limiting and the shielding diaphragms are fitted directly to the two sides o f the monitor chamber.
Two calibration systems have been assembled: one for low-energy X-ray qualities using an X-ray machine having a tube voltage range from 5 to 60 kV, and another one for medium energy X-ray qualities with a range o f 50 to 400 kV. The mains voltages o f the X-ray generators are stabilized.
Three graphite cylindrical-cavity ionization chambers have been made to be used as primary standards for 60Co and 137Cs gamma radiations. The wall effects o f the chambers were determined by the extrapolation method. Three 4 mm thick caps were placed on top o f one another and attached to the chambers. The ion collecting volumes o f the chambers were obtained from length measurements and by determining the mass o f distilled water that filled the ionization spaces.
The primary standard graphite-cavity ionization chamber with the calibration arrangement for gamma radiation is shown in Fig.2. Stored at 10 metres depth below the floor are two radiation sources, a 60Co and a 137Cs source. The radiation
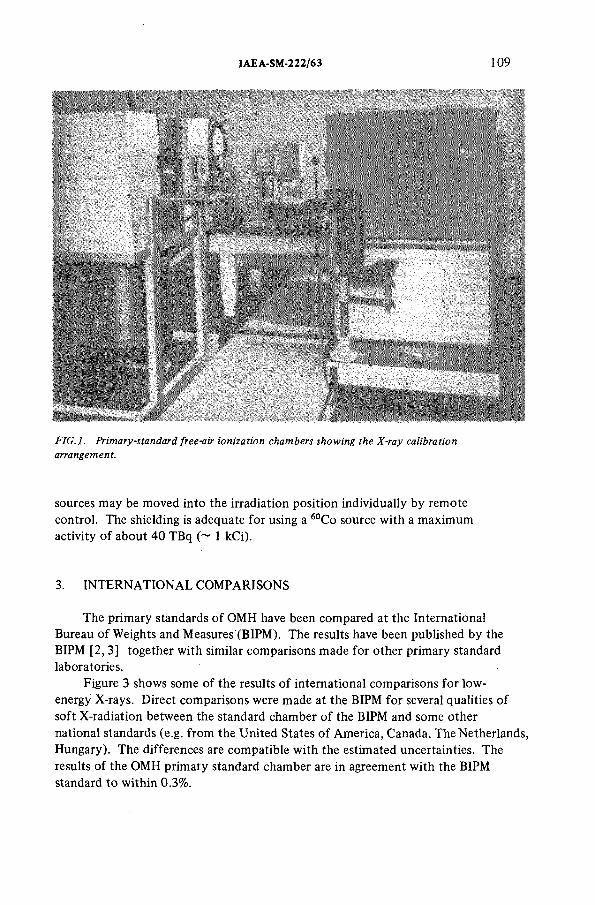
IAEA-SM-222/63 109
FIG.l. Primary-standard free-air ionization chambers showing the X-ray calibration
arrangement.
sources may be moved into the irradiation position individually by remote control. The shielding is adequate for using a 60Co source with a maximum activity o f about 40 TBq (~ 1 kCi).
3. INTERNATIONAL COMPARISONS
The primary standards o f OMH have been compared at the International Bureau o f Weights and Measures (BIPM). The results have been published by the BIPM [2,3] together with similar comparisons made for other primary standard laboratories.
Figure 3 shows some o f the results o f international comparisons for low- energy X-rays. Direct comparisons were made at the BIPM for several qualities o f soft X-radiation between the standard chamber o f the BIPM and some other national standards (e.g. from the United States o f America, Canada, The Netherlands, Hungary). The differences are compatible with the estimated uncertainties. The results o f the OMH primary standard chamber are in agreement with the BIPM standard to within 0.3%.
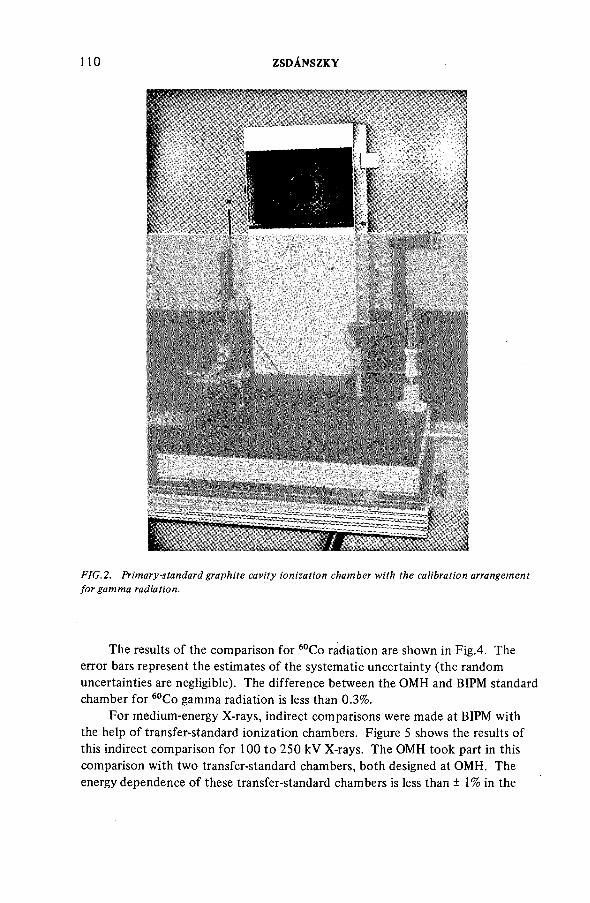
1 1 0 ZSDÁNSZKY
The results o f the comparison for 60Co radiation are shown in Fig.4. The error bars represent the estimates o f the systematic uncertainty (the random uncertainties are negligible). The difference between the OMH and BIPM standard chamber for 60Co gamma radiation is less than 0.3%.
For medium-energy X-rays, indirect comparisons were made at BIPM with the help o f transfer-standard ionization chambers. Figure 5 shows the results o f this indirect comparison for 100 to 250 kV X-rays. The OMH took part in this comparison with two transfer-standard chambers, both designed at OMH. The energy dependence o f these transfer-standard chambers is less than ± 1% in the
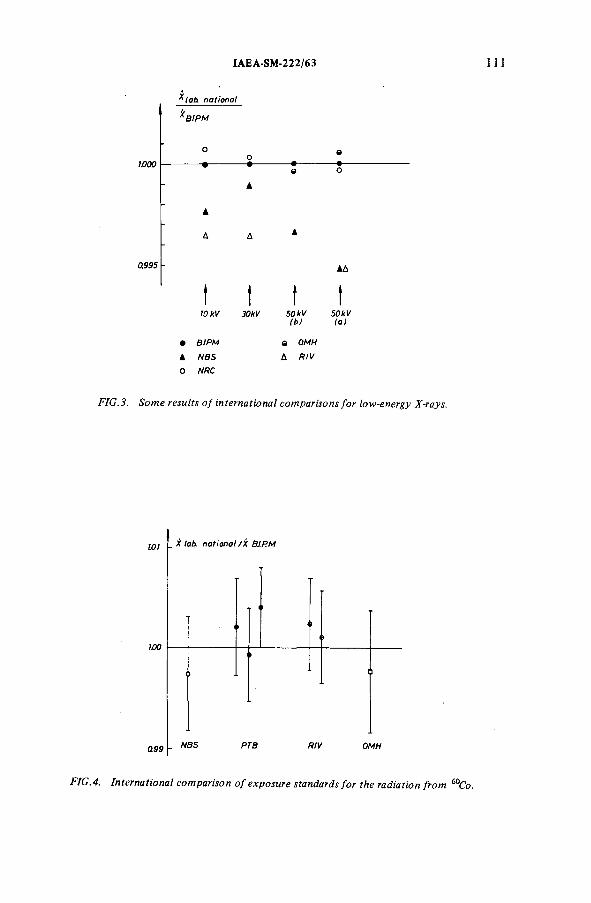
IAEA-SM-222/63
1.000
* la b national
ЛВ1РМ
0995
JO kV 30kV
• BIPM
A NBS
O NRC
AA
t t t t50 kV (b)
Q OMH
Д R fV
50kV(a)
FIG.3. Some results of international comparisons for low-energy X-rays.
Wi , X lab. n a tion a l/X BJ.RM
100
0 9 9 _ NBS PTB RfV OMH
.4. International comparison of exposure standards for the radiation fror
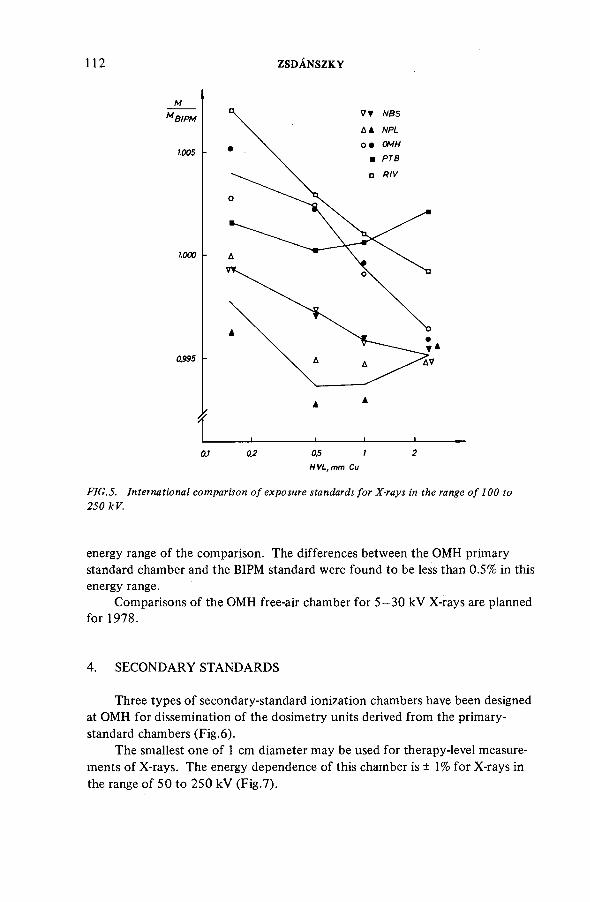
112 ZSDÁNSZKY
M
M BIPM
1.005
1.000
0S95
0.1 О? 0.5 ;HVL,mm Си
FIG.5. International comparison of exposure standards for X-rays in the range of 100 to
250 kV.
energy range o f the comparison. The differences between the OMH primary standard chamber and the BIPM standard were found to be less than 0.5% in this energy range.
Comparisons o f the OMH free-air chamber for 5—30 kV X-rays are planned for 1978.
4. SECONDARY STANDARDS
Three types o f secondary-standard ionization chambers have been designed at OMH for dissemination o f the dosimetry units derived from the primary- standard chambers (Fig.6 ).
The smallest one o f 1 cm diameter may be used for therapy-level measurements o f X-rays. The energy dependence o f this chamber is ± 1% for X-rays in the range o f 50 to 250 kV (Fig.7).
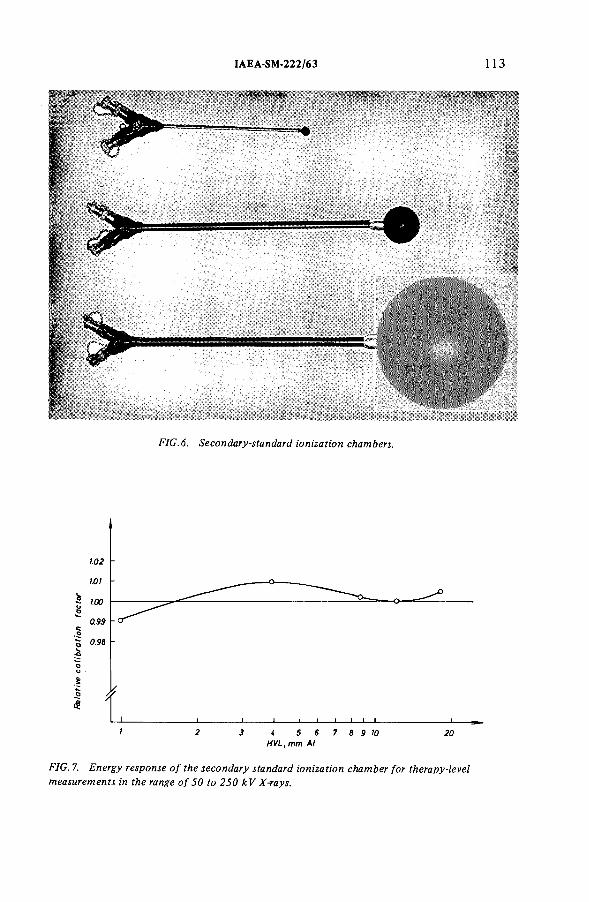
IAEA-SM-222/63 1 1 3
FIG.6. Secondary-standard ionization chambers.
HVL, mm Al
FIG. 7. Energy response of the secondary standard ionization chamber for therapy-level
measurements in the range of 50 to 250 kV X-rays.
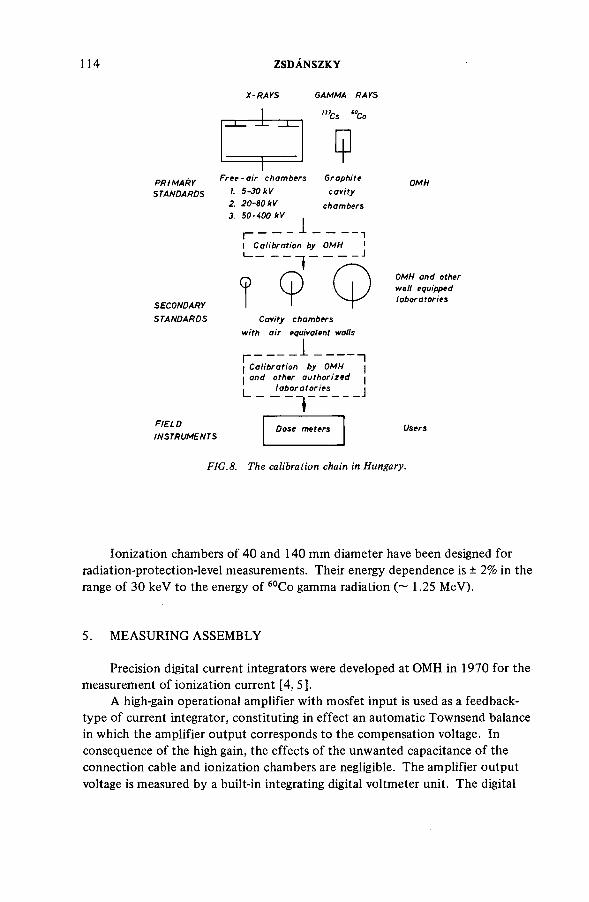
114 ZSDÁNSZKY
X-RAYS GAMMA RAYS
"Cs ’"Со
шPRIM ARYSTANDARDS
SECONDARY
STANDARDS
F r e e -a i r ch a m b ers G raphite
Î. 5 -3 0 kV c a v ity
2. 20-B0kv ch a m bers3. 5 0 -4 0 0 kV
I--------------- -----------I C a libration by OMH
1G> "
FIELDINSTRUMENTS
Cavity ch a m b ers with a ir equivalent walls
I C a libra tion by OMH I and o th er a u th o r iz ed
la b o r a to r ie s j
TD ose m eters
OMH
OMH and other w ell equipped la b ora to r ies
U sers
FIG, 8. The calibration chain in Hungary.
Ionization chambers o f 40 and 140 mm diameter have been designed for radiation-protection-level measurements. Their energy dependence is ± 2% in the range o f 30 keV to the energy o f 60Co gamma radiation (~ 1.25 MeV).
5. MEASURING ASSEMBLY
Precision digital current integrators were developed at OMH in 1970 for the measurement o f ionization current [4, 5].
A high-gain operational amplifier with mosfet input is used as a feedback- type o f current integrator, constituting in effect an automatic Townsend balance in which the amplifier output corresponds to the compensation voltage. In consequence o f the high gain, the effects o f the unwanted capacitance o f the connection cable and ionization chambers are negligible. The amplifier output voltage is measured by a built-in integrating digital voltmeter unit. The digital
IAEA-SM-222/63 115
display obtained is proportional to the dose or the dose rate. A quartz-crystal- controlled timing circuit may be used to measure the time elapsed during dose measurements or to control the integrating time in the case o f dose-rate measurements. Remote control inputs and digital outputs make possible automation o f the measurement process.
The secondary-standard ionization chambers with the digital current integrators may be used either as stationary instruments, or as mobile equipment for calibration o f field instruments.
6 . CALIBRATION SERVICE
The OMH Dosimetry Laboratory provides a calibration service for secondary standards and field instruments. The calibration chain is shown in Fig.8 . Regular calibrations o f therapy-level and radiation-protection-level dose meters are obligatory by decree in Hungary (since 1 July 1976). A calibration is valid for two years.
Hungary is a small country but the increasing number o f dose meters and dose rate meters to be calibrated makes it necessary to authorize other institutions to calibrate field instruments. The calibration must be made according to procedures laid down by OMH. Secondary standards may only be calibrated at OMH.
7. CURRENT WORK
7.1. The current work o f the OMH Dosimetry Laboratory is aimed at automating the calibration systems. A PDP-11 computer is available for processing the calibration data. Automation o f data collection is planned as a first step towards obtaining an automatic calibration system.
7.2. A graphite calorimeter for absorbed dose measurement is under development.
7.3. The SI units o f ionizing radiation have been introduced in Hungary by decree on 1 July 1976. The special units o f ionizing radiation may continue to be used until 1 January 1980. However, new instruments are to be calibrated in SI units after the end o f 1977. The change requires field instruments to be calibrated in absorbed dose in water in the case o f therapy-level dose meters. For radiation protection, the quantity absorbed dose in free air is the unit OMH plans to use for field instrument calibrations.
7.4. As one o f the youngest primary standard laboratories, the OMH Dosimetry Laboratory has concentrated its activities on photon dosimetry. Beta-ray sources, standardized by the National Physical Laboratory (UK), are used as secondary standards for protection-level calibrations. Neutron dosimetry is included in the plans o f future work.
116 ZSDÁNSZKY
REFERENCES
[1] B O Z Ó K Y , L ., Z S D Á N S Z K Y , К ., H IZ Ó , J., “ P rim ary standard d o sim etry in H ungary and
in tern atio n al dose in tercom p arison s since 19 3 8 ” , B io m ed ica l D o sim etry (P ro c. S ym p .
V ien n a, 1 9 7 5 ) , I A E A , V ien n a ( 1 9 7 5 ) 405.
[2] L e B u reau In tern ation al D es Poids e t M esures 18 7 5 — 1 9 7 5 , B IPM , Sèvres ( 1 9 7 5 )
p. 18 7 , 192.
[3] P rocès-verbaux des séances du C o m ité In tern ation al des Poids e t M esures, B IPM , Sèvres,
4 4 ( 1 9 7 6 ) 64.
[4] Z S D Á N S Z K Y , K ., T h e design o f high im p edan ce m easuring circu it o f high a ccu ra cy for
p ico am p ere m easurem ents, IM E K O V , V ersailles, 19 7 0 , B —42 3.
[5] Z S D Á N S Z K Y , К ., Precise m easurem ent o f sm all currents, N ucl. Instrum . M eth od s 1 1 2
( 1 9 7 3 ) 299.
DISCUSSION
H.O. WYCKOFF: The statements in the last section o f your paper require clarification. Certification (or calibration) in terms o f absorbed dose in water for therapy instruments may lead to large errors. The absorbed dose in free air for protection instruments, or in free air as used in exposure measurements, may have little correlation with presumed radiation damage.
K. ZSDÁNSZKY : I agree with you that the conditions should be specified in the calibration certificates to avoid any misunderstanding o f calibrations performed in a water phantom. As to the quantity to be used for the calibration o f radiation protection instruments, we shall be reviewing this problem in the light o f any recommendations which may be made on the subject at the forthcoming meeting o f the Consultative Committee on Standards for the Measurement o f Ionizing Radiations, Section I (CCEMRI).
M.J. HÔFERT: Does anyone know whether it is a general trend to calibrate radiation protection instruments in terms o f absorbed dose in air? Would it not be better to consider an absorbed dose in tissue instead, at the same time specifying the phantom?
H. REICH: General agreement can be expected in the near future concerning the quantity in terms o f which radiation protection dose meters should be calibrated. The ICRU, in its Report 25, recommends the dose equivalent index as a fundamental quantity, and there exist certain proposals - in draft form as yet — concerning ways in which this quantity could be approximated by field dose meters. Until final agreement is reached it would seem best to retain the procedure used so far, i.e. to calibrate the instruments in terms o f exposure free in air and to assume that the numerical value given in roentgens can, to a first approximation, be set equal to the dose equivalent in tissue measured in rem (or in SI units: conversion factor 38.8 J/C). With uni-directional photon radiation
IAEA-SM-222/63 117
the exposure equivalent will underestimate the dose equivalent index by at most 40%; with multidirectional radiation incidence an overestimation is possible.
G. SUBRAHMANIAN: Mr. Zsdánszky, could you say a little bit more about the intention o f authorizing other laboratories to calibrate field instruments? What checks do you have on them?
K. ZSDANSZKY : We intend to authorize two laboratories o f the Ministry o f Health. One o f them is engaged in radiation therapy, the other in radiation protection. They should follow the calibration procedures laid down by the OMH. Their secondary standards will be calibrated every two years at OMH.
H. REICH: What is the compensation error o f your automatic Townsend balance, and what is the lower limit o f response to ionization currents?
K. ZSDÁNSZKY : Owing to the high gain o f the operational amplifier the compensation error is 0.002%, which is negligible. The current sensitivity is limited by the offset current o f the input of the operational amplifier; this is about 10-1S A.

IAEA-SM-222/60
STANDARDIZATION IN RADIATION DOSIMETRY IN THE UNITED KINGDOM
W.A. JENNINGSDivision o f Radiation Science and Acoustics,National Physical Laboratory,Teddington, Middlesex,United Kingdom
Abstract
S T A N D A R D IZ A T IO N IN R A D IA T IO N D O S IM E T R Y IN T H E U N IT E D K IN G D O M .
W hat is m eant b y a m easurem ent standard is first d iscussed, and th e w orld p ictu re in
resp ect o f the establishm ent and com p arison o f n ation al standards fo r rad io lo gica l m easurem ent
b rie fly described. T h e settin g u p o f h ierarchal stru ctu res fo r th e dissem ination o f un its o f
m easurem ent is th en con sid ered , such stru ctu res aim ing to ensure tra ce ab ility to th e n ation al
standards. T h e exp erien ce gained in the U n ited K in gd om in setting-up such dissem ination
schem es is th en presen ted fo r a series o f d ifferen t field s. F o r ra d io th era p y levels, in itia lly w ith
p h o to n s, and la ter w ith e lectro n s also, a com preh en sive n ation -w ide schem e w as developed
b y co n su ltatio n b etw een th e N ation al P h ysica l L a b o ra to ry , th e D epartm en t o f H ealth and
S ocia l S ecu rity , and th e H ospita l P h ysicists ’ A sso ciatio n . T h is schem e in clu d es the d esignation
o f seco n d ary standardizing cen tres, th e d evelo p m en t and a llo ca tio n o f seco n d ary standard
in strum en ts, and th e p rep aration o f C o des o f Practice. S im ilarly , at processing levels, a
com p reh en sive d o sim etry schem e is in o p era tio n to reach plan ts such as th o se engaged in the
steriliza tio n o f p h arm aceu tica l p ro d u cts. T h e establishm ent o f a p arallel com preh en sive schem e
fo r th e dissem ination o f un its fo r b o th p h o to n s and b eta-rays at p ro te ctio n level is less advanced;
in th is in stan ce, th e p artic ip atio n o f th e B ritish C a lib ratio n Service and th e H ealth and S a fe ty
E x ecu tive w ill en tail the d irect supervision o f seco n d ary , and p o ssib ly te rtiary standardizing
lab oratories, and the proposals are su b ject to fu rth er d iscussion. S im ilarly , a com prehensive
schem e has been p rop osed fo r th e dissem ination o f th e u n it o f a c tiv ity , and steps are in hand
fo r its im p lem en tatio n . B rie f m en tion is m ade o f a ‘p en etram eter’ ca lib ratio n service operated
fo r th e b en efit o f d iagn ostic ra d io lo g y , and o f the establishm ent o f n atio n al referen ce standards
fo r n eutro n d o sim etry . F in a lly , a tte n tio n is d raw n to lim itatio n s o f th e presen t system s,
in clu d ing the need fo r ad d itio n al p erfo rm an ce tests, and fo r system atic fee d b a ck o f in fo rm a tio n
to co n firm th e success, or o th erw ise, o f th e dissem ination schem es.
RADIATION MEASUREMENT STANDARDS
In p ractice the word STANDARD i s used fo r several d iffe re n t purposes, including a measurement c a p a b ility , le g a l m etrology, sp e c ific a tio n , ca lib ra tio n and te s t in g , and q u ality co n tro l; indeed, a l l these fa cets a rise in the establishm ent o f good measurement practice in a country. For th is presentation , I have been asked to devote my atten tion prim arily to the establishm ent o f measurement standards, and the dissem ination o f units to the u ser , in the United Kingdom. In describing the experience gained in the UK in th is f i e l d , I sh a ll re fer a lso to the in tern ational scene, since the
119
1 2 0 JENNINGS
ultim ate aim o f a measurement system is the achievement o f world-wide uniform ity, with a view to making experience u sefu l and comparisons meaningful. Thus my subject is e f fe c tiv e ly TRACEABILITY in radiation measurement.
The need for measurement standards a rises for a wide range o f users. At 'p ro tec tio n ' dose le v e ls , c a lib ration s o f instruments against 'recognised' standards are e sse n tia l for regulatory purposes ; s im ila rly the high dose le v e ls employed in radiation processing plants are subject to le g is la t iv e con tro l. In radiotherapy, accuracy in dose control is v i t a l fo r the individual p a tie n t. Recent evidence from a major c l in ic a l centre in London has shown that a 5$ change in treatment dose, a risin g through an arithm etical error made when commissioning a replacement machine, was detected by c lin ic a l observation a lon e , the th ird such report I have seen re la tin g to changes o f under 1%. In the UK, therapeutic output measurements are subject only to Codes o f P ractice ; however, any fa ilu r e to observe the detailed recommendations made is e f fe c tiv e ly equivalent to a lo s t cause in a Court o f Law.
What standards are needed n a tio n a lly , and in tern ation ally? Here one needs to be clear about the deta iled terminology employed, - in particu lar the meaning o f 'p rim a ry ', 'secondary' and 'n a tio n a l' standards. The Vocabulary o f Legal Metrology [ 1 ] , prepared by the International Organisation o f Legal Metrology (OIML) defines a PRIMARY STANDARD as a "standard o f a p articu lar quantity which has the highest m etrological q u a litie s in a given f i e l d " , and th is standard is ABSOLUTE i f "th e values provided have been establish ed in terms o f the relevant base units without recourse to another standard o f the same q u an tity ". A SECONDARY STANDARD i s "a standard, the value o f which is fixed by d irect or in direct comparison with a primary standard"; a NATIONAL STANDARD i s a "standard recognised by a nationaldecision as the b asis fo r fix in g the v a lu e , in a country, o f a l l otherstandards o f the given q u an tity ". Thus a national standard may be either a primary or a secondary standard. P ersonally , I prefer not to include 'in d ire c t comparison' with a primary standard in the d e fin itio n o f a secondary standard, but the OIML d e fin itio n includes th is in order to cover tran sfer instruments in a country where the national standard is already a secondary standard. L a stly , A TRANSFER STANDARD is simply "a measuring device used to compare measurement standards".
RADIOTHERAPY - PHOTON BEAMS
Let us f i r s t consider the po sitio n in respect o f radiotherapy. To thebest o f my knowledge, some 1 9 countries have set up, along with thecorresponding rad iation f a c i l i t i e s , n ation a l, abso lu te , primary standards for the r e a lisa tio n o f the unit o f exposure for radiations generated over the range 6o to 250 kV. In most cases , additional f a c i l i t i e s and standards havea lso been constructed to extend th is range down to 10 kV, and up to 2 MV orcobalt 60 ra d ia tio n s. This is a very expensive undertaking, and in recent y ears, an increasing number o f developing countries have chosen to adopt calib rated secondary standards as national standards, at le a s t as an interim step . These have been commissioned, along with the necessary f a c i l i t i e s , in Secondary Standard Dosimetry Laboratories (SSDLs); a number o f these la b oratories have been establish ed under the auspices o f the World Health Organization (WHO) and International Atomic Energy Agency (IAEA), and they are now coordinated into a world-wide network [2] . To date, some 30 countrieshave expressed in te re st in such a procedure, th e ir lab oratories being atvarious stages o f development.
IAEA-SM-222/60 121
In order to promote world-wide uniform ity in the measurement system, primary standards are compared between national la b o ra to r ie s , or preferably at the International Bureau o f Weights and Measures (BIPM), under the auspices o f the International Committee o f Weights and Measures (CIPM). For 10 - 50 kV and cobalt 6 0 rad ia tio n s , the primary standards themselves are compared with reference standards maintained at the BIPM; fo r the 100 - 250 kV range, tra n sfer devices are used in view o f the bulk o f the apparatus [3 ] . In p rin c ip le , any member country o f the Metre Convention may take i t s national standards to the BIPM, though in p ra ctic e , most SSDLs have r e lie d on c a l i brations from countries with primary standards. CIPM Consultative Committees, with members from national standards la b o ra to r ie s , provide a forum for the exchange o f inform ation, and the coordination o f a c t iv it ie s .
In tern a tio n a lly , with the BIPM and the CIPM Consultative Committees, together with the programme fo r the establishment o f SSDLs, i t may be claimed that the necessary structure e x ists in the f ie ld o f radiation measurement for the comparison o f national standards, though i t s t i l l has a long way to go to be universal in operation.
Turning now to the dissemination o f units within each country, the po sitio n may w ell be le s s clear in many cases. I found much o f in te re st in the Proceedings o f the NBS 75th Anniversary Symposium, held la s t y ear, e n title d "Measurements fo r the Safe Use o f R adiation ". For example, in h is paper on "N ational Ionizing Radiation Standards" [!*] , Dr Leiss o f NBS stresses the lim ited usefulness o f such standards, unless they can be related to measurements made at user le v e l . He l i s t s a series o f hurdles to be overcome, including lack o f user recognition o f need, lack o f adequate national measurement dissemination schemes, and inadequate resources. He a lso mentions the need fo r more procedural documentation, fo llow up and corrective a ction , and certain addition al standards. In regard to follow -up and corrective afction, reference must be made to the excellen t service provided by the R adiological Physics Center in Houston [ 5 ] , a service which c le a r ly serves as a model for other countries.
The UK experience in the establishm ent o f standards, and in the dissemination o f u n its , goes hack many years. I believe that certain factors operated to our advantage in respect o f the establishment o f a national hierarchal stru ctu re ; in p a rtic u la r , the early widespread appointments o f h osp ita l p h y sicists and th e ir nation-wide cooperation through the H ospital P h y sic ists ' Association (HPA); and in regard to radiotherapy, the establishment o f the National Health Service (NHS), and consequent coordination o f a l l deep-therapy p ra ctice . The opportunities provided by these developments w ill soon be apparent in the remainder o f my presentation.
F ir s t , a few words about the National Physical Laboratory (NPL).A b r ie f h isto ry is important, as the dissem ination structure evolved out o f n e c e ssity . The NPL was founded in 1900 as the national standards lab oratory , the apex or focus o f the measurement system in the UK. Its f i r s t services in rad iation measurement began in 1 9 1 2 in respect o f radium standards, and by 1921 certain services re la tin g to the inspection o f X-ray equipment, together with some protection and dosage measurements began. However, i t was in 1931 that the r e a lisa tio n o f the rontgen, by means o f a ' f r e e -a i r ' chamber, was achieved at NPL, follow ing the d e fin itio n o f th is unit by the International Commission on Radiation Units and Measurement (ICRU) in 1 9 2 8 . A ca lib ra tio n service against th is standard, over the range 60 to 200 kV, became operational in 1932. The range was extended to 2 MV in 1956 by reference to cav ity standards, and down to 8 kV in 1959, follow ing the
122 JENNINGS
commissioning o f a smaller fr e e -a ir chamber. Currently, work is in hand to provide d irect ca lib ra tio n services up to 12 and la te r 20 MV against a calorim etric standard during the coming year, employing the NPL lin ear acce lerato r.
A fter the second world war, the demand for ca lib ration s grew s te a d ily , and by 1950, i t was already in excess o f the NPL ca p a b ility to accept a l l the dosemeters being submitted. In consequence, the D irector o f the NPL wrote to the Chief Medical O fficer o f the then M inistry o f Health suggesting that a number o f substandardising centres should be set up within the newly- establish ed (19^8) National Health Service (NHS); these centres would have th e ir instruments calib rated d ir e c tly at the NPL, and would then use them to ca lib ra te a l l other instruments in use in the h osp ita ls in the area. These designated centres would be in h osp ita l physics departments, or physics units attached to radiotherapy departments. I t must be added that the problem arose la rg e ly because o f shortage o f s t a f f at NPL, but a lso p a rtly due to a decision that ca lib ra tio n services would only operate at set periods in the year. The reason fo r th is decision was not simply that the same s t a f f and f a c i l i t i e s were engaged on both development and service work, but that th is ju xtap osition o f the two functions was considered highly desirable in a rapid ly developing f i e l d , thus ensuring that the research work was rooted in u sefu l p r a c t ic a l it ie s , and that the services gained immediate b en efit from new techniques. Indeed, the e ffo r t which was to be devoted la te r to the su ccessfu l development o f secondary standard instrum entation, at the in stig a tio n o f Dr L A W Kemp, has been a consequence o f that p o lic y .
The D ire c to r 's request led to the establishment o f a national scheme, evolved by jo in t consultations between the M inistry o f Health - la te r the Department o f Health and Social Security (DHSS), the HPA and the NPL. I n i t i a l ly , some 20 centres were designated as 'secondary standardising c e n tr e s ', and one dosemeter from each was selected as the tran sfer instrument. This was gen erally accepted, though representations from a number o f centres i n i t i a l ly excluded, and with evidence o f a need fo r d irect a cce ss , la te r led to an agreed t o t a l o f 30 such designated centres in the NHS, with at le a s t one in each adm inistrative Region. With the exception o f some X-ray units used ex clu sive ly fo r dermatology, radiotherapy in the UK is now concentrated into approximately 100 cen tres, a l l within the NHS, and a l l with p h y sicists in attendance. Indeed, the X-ray units used for dermatology are a lso subject to periodic calib ration s by p h y sic is ts . Thus, i t can be claimed that continuing tr a c e a b ility to NPL standards has been establish ed for a l l radiotherapy units in the UK.
The jo in t consultations between the NPL, HPA and DHSS had two other relevant consequences, the introduction o f ( i ) an NPL-designed secondary standard instrum ent, and (.ii) a Code o f P ractice (or Protocol) on i t s use in calib ratin g te r tia r y standards or f ie ld instrum ents. The secondary standard [6] was developed s p e c if ic a lly as the lin k in the NHS dissemination chain , and produced com m ercially.1 Some 30 instruments were c e n tra lly - purchased by DHSS fo r a llo ca tio n to the 30 designated cen tres. This approach helped NPL to stream line i t s own ca lib ration procedures, and made p o ssib le a certain measure o f control in the system. Thus, these instruments are s p e c if ic a lly r e str ic te d fo r use as tran sfer devices o n ly ; they are returned, complete with log-book containing check-source readings, e t c , to NPL for r e -c a lib r a tio n every three y ea rs ; in p ra ctic e , 10 are reca lled each year.
1 By Nuclear Enterprises Ltd.
IAEA-SM-222/60 123
The Code o f Practice [7] provides deta iled guidance in regard to in -a ir and in-phantom comparison measurements, and appropriate phantoms were a lso designed, manufactured, centrally-purchased and d istrib u ted to a l l the designated centres.
I t must be stressed that the NHS secondary standardizing centres are so le ly designated h osp ita l physics departments, who are custodians o f the secondary standard instrument for a region . As the number o f sub-centres is generally sm all, th is instrument may be taken to sub-centres to calib rate lo c a l f ie ld instrum ents, or te r tia r y standards may be calib rated in the designated centre for use in the sub-centres. The m erits o f mobile as against s ta t ic secondary standards require a separate presentation , indeed, these matters have been discussed elsewhere by Dr Kemp [ 8 ] . Unlike the R adiological C alibration Laboratories (RCL) in the USA, there is generally no dedicated X-ray equipment, and no charges en tailed (outside NPL). Moreover, there are no formal c r ite r ia to be met, no inspection or approval mechanism nor regular audit system at presen t, in contrast to the proposals fo r p ro te ctio n -le v e l measurements, to be discussed la te r .
The above schemes re la te s o le ly to NHS requirements fo r calib ration s for photons at radiotherapy le v e ls . I must add that instruments for other u sers , the National R adiological Protection Board (NRPB), the UK Atomic Energy Authority (UKAEA), Medical Research Council (MRC), Central E le c tr ic ity Generating Board (CEGB), M inistry o f Defence (MOD), the u n iv e rsitie s and industry may a lso require c a lib r a tio n s , during the same set p eriods, presently o ffered twice each year. These are accepted provided they are to be used as secondary standards, are o f referen ce-c la ss q u a lity , or there are sp ecia l circum stances, eg a research p ro ject.
RADIOTHERAPY - ELECTRON BEAMS
Let us now turn b r ie f ly to the c a lib ration o f electron beams, a lso for therapeutic use. A ferrous sulphate 'F rick e ' reference service [ 9 ] , based on a sp e cified value o f 'G ' , was launched by NPL in 1970. A l l the radiotherapy centres in the country were n o t if ie d , and to the best o f my knowledge, a l l those using electron beams generated at energies o f 8 MeV and above have taken advantage o f th is serv ice . Repeat measurements are done at the request o f the centres. The 8 MeV lim ita tio n a rises through the use o f g lass ampoules, found to be necessary for precision measurements over a protracted period. I t must be added that both the ampoules, and a su itab le water phantom, are sent through the m ail.
Mention o f a mailed service reminds me to make reference to the application s o f thermoluminescent dosimetry (TLD). The main e ffo r t at NPL has been directed to the study o f TLD m ateria ls , and to the achievement o f high precision by th is approach for comparison purposes, i n i t i a l ly for cobalt 60 ra d ia tio n s , and more recen tly fo r lower energy X-ray beams [1 0 ] .No routine services employing TLD have been operated to date by NPL.
In 1975 > again follow ing jo in t NPL, HPA and DHSS d iscu ssion s, calib ration s o f electron beams generated at lower en ergies, down to 1 MeV, were taken care o f by the design by an NPL/HPA working party o f a new ion chamber [1 1 ] , and produced commercially 2 for central-purchase by DHSS for a llo ca tio n to the 18 centres operating such f a c i l i t i e s in the UK. These
2 By D .A . Pitman Ltd.
124 JE N N IN G S
chambers, which can be used up to 20 MeV, are checked by NPL, and calibrated by reference to cobalt 60 radiations by the user. In addition , Reports were prepared by an NPL/HPA working party to provide guidance in electron dosimetry [1 2 ] .
Following the commissioning o f the NPL lin ea r a cce lerato r, work is in hand to provide ca lib ration s in terms o f absorbed dose fo r electron beams over the range 10 to 20 MeV by d irect comparison with a calorim eter.
PROTECTION-LEVEL MEASUREMENTS - PHOTONS
Next we must consider p ro te ctio n -le v e l measurements ; here, both the evolution and present po sitio n in the UK in respect o f standards d if fe r s from the story so fa x . Because o f the lower accuracy needed, simple means o f c alib ration s were used in many centres for many y ea rs , in sp ite o f the regulatory co n tro ls . Surveys indicated techniques fo r checking the indication o f monitors ranging from extrapolation from higher dose le v e ls to the use o f radium n eedles, for a l l q u a litie s o f rad iation . A number o f specia l dosemeters used fo r photon measurements at p ro te ctio n -le v e ls were calib rated at NPL for responsible organisations such as the R adiological Protection Service (now the NRPB), though i t was not u n til 1971 when Mr J E Burns introduced a comprehensive series o f radiation q u a lit ie s , operated at about 100 mR/min (6 R/h) over the range 10 kV to 2 MV, that a general service was presented from NPL for th is purpose. Further, we have plans to provide fo r d irect calib ration s at higher energies by v irtu e o f a unique low current f a c i l i t y on the lin ea r acce lerato r.
As in the case o f ra d io th era p y -lev els , another new secondary standard instrument [13] has been developed at NPL, and produced commercially3 , as a tra n sfer device at p ro te c tio n -le v e ls . This is able to operate both at dose rates compatible with the ex istin g primary standards, as w ell as at the much lower dose rates en tailed using the q u a litie s recommended by ISO for secondary standardising cen tres. The 'b a llo o n ' employed as the probe is e f fe c tiv e ly energy-independent over the range o f in te r e s t , which is necessary to act as the lin k between beams o f d iffe rin g spectral d is t r i butions. A number o f these instruments have now been calib rated for use at ex istin g ca lib ration cen tres, such as those operated by the NRPB, CEGB and UKAEA, where the proposed ISO q u a litie s are being made a v a ila b le .
The above-named organisations are amongst a number o f o f f i c i a l bod ies, including the NHS, which have r e sp o n s ib ilit ie s fo r p ro te ctio n -le v e l measurements, and in view o f ( i ) regulatory c o n tro ls , and ( i i ) the large number o f f i e ld instruments and monitors - estimated about 10 ,000 , i t became clear that a nation-wide dissemination scheme was needed to ensure t r a c e a b ility . The B ritish Committee on Radiation Units and Measurements (BCRU) took the i n i t ia t iv e , se ttin g up working p arties with representatives from a l l in terested b od ies, to consider the c r ite r ia that secondary standard la b oratories should meet. As a resu lt o f these d e lib era tio n s, the B ritish C alibration Service(BCS), was asked to extend i t s ex istin g range o f services into the ra d io lo g ica l f i e l d , since i t s general remit rendered i t p a rtic u la rly su ita b le fo r th is purpose. The functions o f the BCS, which was establish ed in 1966, and is now part o f NPL, w il l be described in the next contribution to th is Symposium [1**]. S u ffice i t to say that unlike the dissemination scheme for rad iotherapy-level measurements in the NHS, the BCS
3 By Nuclear Enterprises Ltd.
IAEA-SM-222/60 125
scheme includes d irect supervision o f the secondary standard la b o ra to ries . Thus, the centre must meet sp e cified c r it e r ia , be subject to inspection and approval, and to periodic v is i t s and audit measurements. Further, payments are en tailed . Relevant c r ite r ia have now been published, and applications in v ited . However, recent developments resu ltin g from European Economic Community (EEC) d ir e c tiv e s , and the involvement o f the newly establish ed Health and Safety Executive (HSE), have le d to further discussions on the optimal dissemination stru ctu re , and d iv isio n o f r e s p o n s ib ilit ie s , involving both secondary and te r tia r y lab oratories in t h is instance.
PROTECTION-LEVEL MEASUREMENTS - BETA RAYS
In the case o f p ro te c tio n -le v e l beta-ray measurements, the transfer device adopted in the UK is not an instrument, but a set o f beta-ray sources, calib rated against a primary standard chamber at NPL [1 5 ] ; these sources provide a ser ies o f calib rated f i e l d s , covering a range o f 3 energies (0 .2 to 2 MeV), each at 6 dose r a te s , within which any instrument to be calib rated can be located by means o f a j i g . Such sets o f sources, calib rated at NPL, were put into service in 1972 at a number o f secondary standardising cen tres, such as those previously l i s t e d ; indeed, these beta-ray sources, and the NPL p ro te ctio n -le v e l secondary standard, now figure in the BCS c r ite r ia fo r approval o f service la b o ra to ries .
PENETRAMETER CALIBRATIONS
Next, a b r ie f mention o f diagnostic rad iology . NPL's involvement in th is instance has resu lted from the widespread adoption o f the 'penetrameter1 as a device for checking generating p o ten tia ls o f diagnostic X-ray equipment in the f i e ld . Thus, our service con sists in exposing customers' cassettes to radiation generated at a series o f known p o te n tia ls , the cassette being returned to the customer for processing and evaluation . I n i t i a l ly , from 1973, the service covered the range 50 to 120 kV; in 1975 th is was extended downwards to 25 kV to cover the needs o f mammography. Penetrameters have been submitted from a l l over the country ; these are a lso accepted only during a set period each y ear, another service to be dovetailed into the system. Again, NPL collaborated with HPA to produce a guidance document to a s s is t the user [ 1 6 ] .
PROCESSING-LEVEL MEASUREMENTS
Another important service provided by NPL, th is time with separate radiation sources, is the c a lib ration o f integrating dosemeters at megarad, or k ilo g ra y , dose le v e ls [1 7 ] . They are needed fo r the control o f radiation processing p la n ts , such as those used in the s te r il iz a t io n o f pharmaceutical products. Uniform f ie ld s o f radiation are availab le at NPL from two s e lf-sh ie ld e d annular arrays o f cobalt 6 0 rod-sources providing dose rates in water o f up to 1 Mrad, or 10 kGy, per hour; these f ie ld s are calib rated with ferrous sulphate (Fricke) dosem eters, though a calorim eter is presently under construction fo r th is purpose. The dosemeters in use at the plants are generally based on o p tica l absorption changes produced by radiation in a cry lic polymers (eg Perspex. HX, Perspex red 1+031* ) . Such dosemeters require c a lib ration by irra d iation o f a sample to a series o f calib rated d o s e -le v e ls , follow ed by measurement on the read-out system in use at the processing p ian t. Since 1973, a l l cobalt 60 processing plants in the UK have derived th eir c a lib ration eith er from dosemeters d ir e c tly irradiated
126 JE N N IN G S
at NPL, or from cobalt 60 f ie ld s intercompared with those at NPL. Thus a l l the dosimetry fo r processing with cobalt 60 in the UK is traceable to national standards. As a national fo r™ for discussion in th is f i e l d , the 'UK Panel on Gamma and Electron Irradiation-' meets reg u la rly , and coordinates a c t iv it ie s in th is f i e ld . I should add that there is only one processing plant in the UK using e lectro n s, for which there is not yet an NPL standard fo r d irect reference.
RADIOACTIVITY MEASUREMENTS
Let us now turn to the question o f dissemination o f standards o f a c t iv it y . In gen eral, th is e n ta ils the despatch to the user o f a sealed ampoule containing a solution o f a sp ecified a c tiv ity o f a particu lar rad ion uclide; such a se rv ic e , eith er from stock or at set times in the y ear, depending on the radion uclide, is part o f NPL p ra ctice . However, th is procedure i s not w ell suited to sh o rt-liv e d radionuclides, nor is th is convenient for routine use. An a ltern ative approach, in itia te d at NPL in 1951*, con sists in the adoption and use o f a particu lar type o f re-entrant ion iza tio n chamber, manufactured in quantity , within set to leran ces. Then, by using such a chamber with the aid o f calib ration factors from standardizations carried out at NPL with a sim ilar chamber, the user can make accurate measurements in h is own laboratory at any tim e. Such a technique is w ell suited to the ca lib ration o f the sh o rt-liv e d radionuclides produced from lo n g e r-liv ed parents in lo c a l generators.
The chamber presently in widespread use was designed by NPL, and production-engineered at Harwell (AERE), and commercial4 models known as Type 1383А became a vailab le in 1957 [1 8 ] . However, disadvantages o f th is chamber are the need to apply temperature and pressure co rrectio n s, and i t s geom etrical dependence. Other commercial systems are availab le with sealed chambers, but these do not have d irect tra c e a b ility to national standards.With a view to providing an improved and comprehensive national dissemination scheme, an improved model with a sealed chamber and enhanced s e n s it iv ity has been designed at NPL, and th is w ill be manufactured commercially. I t is proposed that through cen tral purchase by DHSS, a number o f fu l ly calibrated chambers w il l be d istrib u ted , with at le a s t one per Region, in support o f a larger number in use in the f ie ld gen erally . The chambers which have been d ir e c tly calibrated at NPL w il l provide for measurements o f higher accuracy, and fo r monitoring the performance o f others in the f i e ld . Provision for the measurement o f r e la tiv e ly large v e s s e ls , plus an electrom eter system for automatic read-out in u n its o f a c t iv it y , w il l be included.
NEUTRON MEASUREMENTS
As neutron standardization has been discussed at other symposia, I w ill confine my b r ie f remarks in th is area to certain questions concerning the dissem ination o f u n its in th is instance. To d ate, the bulk o f NPL ca lib ra tio n s in th is f ie ld comprise ( i ) neutron source measurements,( i i ) neutron flu x density standards, over a series o f energies from thermal energies to 19 MeV, for the ca lib ration o f protection instrum ents, these include the ca lib ration o f de Pangher precision long counters as secondary standards, and ( i i i ) the precision measurement o f neutron cro ss-sectio n s
4 Initially by General Radiological Ltd., and subsequently by GEC-Elliott Automation Ltd.
IAEA-SM-222/60 127
which a lso con stitu te secondary standards. R ecently, the c r ite r ia published by the BCS include those to be met by a secondary standardizing laboratory engaged in the c a lib ration o f p ro te ctio n -le v e l neutron m onitors.
For th erap y -lev el c a lib r a tio n s , NPL is presently engaged in establish in g $ reference service for neutron absorbed dose measurements, employing a tissu e -eq u iv alen t ion ization chamber as the tran sfer device. In addition to the 3 MV Van de Graaff accelerator already in use for flu x density measurements, a 150 kV p o sitiv e ion accelerator i s a va ilab le to produce a collim ated beam o f neutrons with a choice o f f ie ld s ize s ; the energy spectrum o f the beam is being in vestig ated , and i t s gamma component resolved [19] • This reference service w il l enable us to coordinate the dose measurements in use in the U centres in the UK presently engaged in neutron radiotherapy, together with the i n i t i a l needs o f a further 8 centres being establish ed in Western Europe, a f i e ld o f growing importance at th is tim e.
LIMITATIONS OF PRESENT SCHEMES
In th is survey, I have described how, in the UK, we have established nation-wide schemes to ensure tr a c e a b ility in measurement to the NPL standards fo r radiotherapy and processing le v e ls , and how we are engaged in esta b lish in g p a r a lle l schemes at p ro te c tio n -le v e ls and fo r a c t iv ity measurements. In tern a tio n a lly , c r ite r ia along the lin e s o f those published by BCS fo r laboratory approval, though le s s str in g e n t, have been prepared for the IAEA/WHO Network o f Secondary Standard Dosimetry Laboratories (SSDLs).A ll th is is needed, but I know f u l l w ell that th is is not the whole story .The NPL ca lib ration s are not performance t e s t s . For example, X-ray calib ration s and certain a n c illa ry measurements are made under ca refu lly con trolled conditions ; no examination is made o f the dependence o f instrument response on external influences or d iffe re n t irra d iation con d ition s, such as changes in f ie ld s iz e , exposure r a te , or non-uniform beams. I know that the subject o f ty p e -te stin g i s now within the province o f the PTB in the Federal Republic o f Germany; indeed the recognition o f the importance o f q uality control in instrum entation, with the increasing involvement o f the IEC, ISO and OIML is very s ig n if ic a n t , but th is is beyond the scope o f t h is presentation.
One fin a l aspect to which I should lik e to draw a tten tio n , namely, the need fo r feed -back , or audit check-measurements, a s , fo r example, the survey carried out on cobalt 60 dosimetry by Ehrlich and Welter o f the NBS[2 0 ] . The evidence we have on the accuracy o f f ie ld c a lib ration s in the UK has been very s a tis fa c to r y , but such measurements were made fo r p articu lar purposes on ly ; we have at present no systematic means o f checking th erap y-level measurements in the f i e ld . Moreover, such checks do not re la te so le ly to random and systematic u ncertain ties introduced down the c a lib ration chain, but in the f in a l analysis one is faced with actual mistakes in c lin ic a l dosimetry g en era lly , as recen tly summarised, by ICRU in Report No 2k [2 1 ] . However, TRACEABILITY in measurement is a v it a l aspect o f the procedure, and has been my theme. I hope that our experience in the UK may be o f in terest and use to others engaged in such a task .
REFERENCES
[1] INTERNATIONAL ORGANISATION OF LEGAL METROLOGY, Vocabulary o f Legal M etrology, PD 61+61, B r it . Stand. I n s t . , London 1971; tra n sla tion o f o f f i c i a l French v ersio n , International Bureau o f Legal M etrology, P aris.
128 JE N N IN G S
[2] EISENLOHR, H .H ., IAEA B u lle tin , 2 (1977) 2 .[3] BUREAU INTERNATIONAL DES POIDS ET MESURES, Comité C on su ltatif pour le s
Étalons de Mesure des Rayonnements Io n isa n ts , Section I , 2e Reunion, 1972, OFFILIB, Paris (1971* ) .
[1*] LEISS, J .E . , "N ational Ionizing Radiation Standards", Measurements for the Safe Use o f Radiation (Proc. 75th Ann. Symp., SP h ^ 6, National Bureau o f Standards, 1976) NBS, Washington D.C. (1976) 1*03.
[5] SHALEK, R .J . , et a l . , "Q u ality Assurance for Measurements in Therapy", Measurements fo r the Safe Use o f Radiation (P ro c .7 5 ^ Ann. Symp.,SP 1*56, National Bureau o f Standards, 1976) NBS, Washington D.C. (1976) 111.
[6] KEMP, L .A .W ., Br. J . R a d io l ., (1972) 775.[7 ] NATIONAL PHYSICAL LABORATORY, HOSPITAL PHYSICISTS* ASSOCIATION AND
DEPARTMENT OF HEALTH AND SOCIAL SECURITY WORKING PARTY, The Use o f a Secondary Standard X-ray Exposure Meter to Calibrate a F ield Instrument fo r Use in Output Measurements, (National Physical Laboratory Report RS3) NPL, Teddington (197^ ) .
[8] KEMP, L .A .W ., "The Dissemination o f the Rontgen Unit fo r Radiotherapy Purposes", Ion izin g Radiation Metrology (Proc. o f In t . Course, Varenna, 197*0, CASNATI, E. , E d ., E d itrice Compositori Bologna (1977) 227.
[9] ELLIS, S .C ., "The Dissemination o f Absorbed Dose Standards by Chemical Dosimetry, - Mechanism and Use o f the Fricke Dosemeter", Ionizing Radiation Metrology (Proc. o f In t . Course, Varenna, 197^), CASNATI, E . , E d itrice Compositori Bologna (1977) 1 6 3 .
[10] ROSSITER, M .J ., Phys. Med. B i o l . , 20 5 (1975) 735. .[11] MORRIS, W .T ., OWEN, B . , Phys. Med. B i o l . , 20 5 (1975) 718.[12] HOSPITAL PHYSICISTS' ASSOCIATION, A P ractical Guide to Electron
Dosimetry (5 -35 MeV), HPA Report Series No. 1+ (1 9 7 1 ), and A P ractical Guide to Electron Dosimetry below 5 MeV fo r Radiotherapy Purposes, HPA Report Series No. 13 (1 9 7 5 ) , HPA, London.(A new Report, Guide to Electron Dosimetry, HPA S c ie n tific Report Series No". 2 1 , in preparation, w il l superceed the above two rep o rts).
[13] READ, L .R ., KEMP, L .A .W ., Health Phys. 33 2 (1977) 131.[11+] ROSSITER, M .J ., "The A c t iv it ie s o f the B ritish C alibration Service in
the R adiological F ie ld " , International Symposium on National and International Standardization o f Radiation Dosimetry, (Proc. o f IAEA Symp., A tla n ta , 1977) (ttœse Proceeding», paper IAEA-SM-222/54).
[15] OWEN, B . , Phys. Med. B i o l . , Ц , 2 (1972) 175, and _18, 3 (1973) 355.[16] HOSPITAL PHYSICISTS' ASSOCIATION, The Physics o f Radiodiagnosis, HPA
S c ie n tific Report Series No 6 , 2nd ed rev ise d , 1976, HPA, London.[17] ELLIS, S .C . , "Dosimetry in the Megarad Range", S te r iliz a tio n by
Ionizing R adiations, (Proc. In t . Conf. Vienna, 1971* ) , M ultiscience P u b l., Montreal (197*0 205.
[18] DALE, J .W .G ., In t . J . Appl. Radiat. I s o t . , _10 ( 1 9 6 1 ) 6 5 .[19] LEWIS, V .E ., YOUNG, D .J . , Phys. Med. B i o l . , 22 3 (1977) ^76.[20] EHRLICH, М . , WELTER, G .L . , J . Res. o f the NBS, Phys and Chem., 80A h
( 1 9 7 6 ) 663.[21] INTERNATIONAL COMMISSION ON RADIATION UNITS AND MEASUREMENTS, "Errors
in C lin ic a l D osim etry", Determination o f Absorbed Dose in a Patient Irradiated by a Beam o f X or gamma rays in Radiotherapy Procedures, Report 2 k , ICRU, Washington D.C. (1976) ^5-
DISCUSSION
J.C. McDONALD: For the planned neutron dosimetry calibration service (for neutron radiotherapy) what will be the material o f construction and design
IAEA-SM-222/60 129
o f the proposed standard ionization chambers? Will they be constructed o f A-150 plastic?
W.A. JENNINGS: The principal effort in the establishment o f a neutron dosimetry calibration service so far has been setting up the facility itself and measuring the gamma contamination o f the beam, following NPL work on the neutron sensitivity o f gamma Geiger counters. Decisions have not yet been taken regarding the final design and construction o f the standard ionization chambers.
J.J. BROERSE: With regard to the neutron measurements mentioned in your paper, I have two questions: will NPL in the near future provide a standard neutron field which can be used for calibration o f neutron dose meters, and will the dose rate be sufficient for the calibration o f ionization chambers?
W.A. JENNINGS: It is our intention to provide such a field for the calibration o f neutron dose meters at an early date, but we have had some difficulties in achieving an adequate dose rate for this purpose, and I am not able to say at present how soon these problems will be overcome.
T.A. OLEJNIK: It was stated that, in the United Kingdom, radiation processing measurements are traceable to national standards. Since industrial irradiators are designed to maximize the absorption o f emitted radiation, the energy spectra at various product locations can be expected to be quite variable. Furthermore, it is known that the energy absorption characteristics o f dose meters vary with energy spectra, especially at low photon energies. What exactly then are the procedures used to guarantee such traceability? Could you also describe how differences in energy absorption and spectral energy absorption dependence between products and dose meters are reconciled under calibration conditions and under process conditions, how calibration and process conditions are correlated, and o f what order o f magnitude the errors are?
W.A. JENNINGS: My colleague, Mr. Ellis, will answer your questions.S.C. ELLIS: At NPL, routine dosimetry systems are calibrated in the
spectrum arising from an annular array o f cobalt sources in a self-shielded irradiator; the dose is quoted as that to water at the point o f measurement.For dose meters based on acrylic polymers, the variation in the mass energy absorption coefficient ratio water/polymer varies by less than 1 % for photon energies o f 2 to 0.5 MeV and by 5% down to 0.1 MeV.
Probably a more difficult requirement is to match the time, temperature and dose-rate pattern o f the irradiation plant, a matter o f consequence when the routine dose meter shows significant temperature dependence, fading and dose- rate dependence. The magnitude o f the errors introduced by such factors depends on the properties o f the routine dose meter and is best assessed by comparison with a reference system in the particular plant.
G.P. HANSON: In view o f the need for accuracy in dose control for radiotherapy, I would like to know whether the error o f 5% which you mentioned as having been detected by clinical observation was considered a significant factor in the success or failure o f the therapy?
130 JENNINGS
W.A. JENNINGS: The effect consisted in a small increase in certain reactions during the treatment o f certain patients in a routine type o f therapy; the clinician lowered the dose to allow for this. Success or failure o f the treatment could not be said to be at stake.
G.P. HANSON: What is the precision and uncertainty to which you can calibrate the “ penetrameter” for checking potentials o f diagnostic X-ray equipment?
W.A. JENNINGS: The X-ray generating potentials used for the calibration exposures are claimed to have an estimated systematic uncertainty o f ± 1 kV.
A.O. FREGENE: What error margins do you find in your comparisons?W.A. JENNINGS: Mr. Ellis will be able to give you that information.S.C. ELLIS: The reproducibility on each batch o f Fricke dose meters is
determined by irradiation o f a sample at NPL; an uncertainty o f ± 0.2 gray is normally achieved, which gives a relative reproducibility o f about ± y% on the dose o f 40 gray normally measured.
A.O. FREGENE: What theory do you apply in interpreting absorbed dose in rad for the glass-walled ampoules you irradiated?
S.C. ELLIS: No corrections are applied for wall effects. We have found the relative response o f polystyrene-wall dose meters o f the same dimensions to be not significantly different from that o f the glass-wall ampoule at electron energies above 10 MeV, and less than 1% different down to 8 MeV incident energy. Only sealed-glass-ampoule dose meters have been found suited to the requirements o f a postal dosimetry service.
J.-P. GUIHO: Mr. Jennings, you mentioned a postal calibration service using ferrous sulphate as a transfer dose meter. I understood that the secondary centre or the hospital itself irradiated first this transfer dose meter and then its own dose meter. Does the NPL process all these measurements? If not, how far does its responsibility, in fact, extend?
W.A. JENNINGS: The NPL requests the participating centre to complete a form giving the available information concerning radiation quality and irradiation conditions, as well as details about the dose meter and any calibration factors.Any significant deviations between the dose determined by the NPL reference system and that derived from the measurements made by the dose meter in use at the centre are discussed by telephone or letter.
L.J. HUMPHRIES: Does NPL derive financial benefit from the marketing o f NPL-developed instruments by Nuclear Enterprises Ltd?
W.A. JENNINGS: The NPL reference instruments (types 2560 and 2550) were not developed by NPL for financial gain, but specifically for use at the designated secondary standardizing centres as the link between the primary standards and the field instruments, or tertiary standards, particularly in the National Health Service. As NPL is not equipped to manufacture in quantity, a contract was placed with Nuclear Enterprises for production o f the instruments on a commercial basis. In view o f the development costs incurred by NPL in
IAEA-SM-222/60 131
this exercise, subsequent commercial exploitation by the company is subject to small royalty payments in accordance with the practice o f the government department concerned.
L.J. HUMPHRIES: Does NPL routinely make quality assurance checks on the calibrations by Nuclear Enterprises o f NPL-developed instruments? Also, does NPL apply routine quality control in the manufacturing o f these instruments to ensure purity o f materials and conformity o f the manufactured instruments to the prototypes developed by NPL (e.g. energy response o f ionization chamber)?
W.A. JENNINGS: The two NPL-developed instruments are subject to agreed quality control by NPL, and Nuclear Enterprises calibration facilities have received advice from and been subject to inspection by NPL. They have not yet been subject to the new BCS criteria and approval procedures, but it is hoped that this step will be taken — now that the BCS scheme has been launched.


IAEA-SM-222/54
ACTIVITIES OF THE BRITISH CALIBRATION SERVICE IN THE RADIOLOGICAL FIELD
M.J. ROSSITER British Calibration Service, National Physical Laboratory, Teddington, Middlesex,United Kingdom
Abstract
ACTIVITIES OF THE BRITISH CALIBRATION SERVICE IN THE RADIOLOGICAL FIELD.The new role o f the British Calibration Service (BCS) in the approval o f laboratories
to undertake high accuracy calibrations of radiological instruments using secondary standard instruments is described. Approval will establish a high degree o f confidence in the traceability o f such a calibration. The procedures which BCS will follow in the radiological field will be the same as those employed in the approval o f more than 70 laboratories in the fields of electrical, mechanical, optical and thermal measurements. The writing of criteria on which assessments for approval will be based is outlined and the contents of the criteria for instrument calibration are briefly summarized. A list o f criteria for the approval o f personal dosimetry services is also given. Fees are payable to BCS according to the work involved in assessment and supervision. The operation o f the audit scheme, which involves a periodic cross-check of calibrations performed on field instruments in approved laboratories and in the national standardizing laboratory, is described. The method which BCS will recommend for the calculation of the uncertainties of calibration is outlined. It is planned to adopt a common method in each of the measurement areas, with uncertainties quoted on calibration certificates at a minimum 95% confidence level. In the radiological area, the principal involvement of BCS is expected to be in the establishment o f a calibration hierarchy at protection level which will ensure the reliability o f the calibration of routine radiation monitors. The proposed scheme, involving several levels in the calibration chain, is outlined.
INTRODUCTION
The B ritish C alibration Service is now established within the National Physical Laboratory as one o f the prin cip al services o f the Laboratory.The purpose o f the Service is to approve other laboratories around the country, in industry or government establishm ents, to perform calib ration s o f measuring devices and instruments which are d ire c tly traceable to national standards. The a v a ila b ility o f high quality calib ration s from these lab oratories r e lie v e s the work-load at the standards laboratory and enables i t to concentrate i t s lim ited resources on the highest le v e l o f c a lib r a tio n , and on the maintenance, development, and improvement o f the primary standards.
The Service has been active fo r about 10 years and more than 70 lab oratories are approved to undertake ca lib ration s in the e le c t r ic a l ,
133
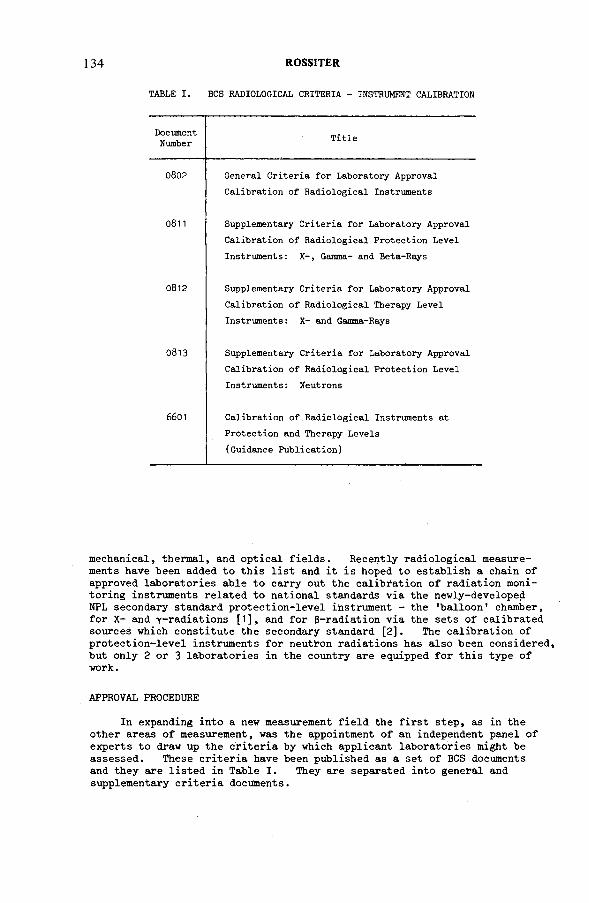
134 ROSSITER
TABLE I. BCS RADIOLOGICAL CRITERIA - INSTRUMENT CALIBRATION
DocumentNumber Title
0802 General Criteria for Laboratory Approval Calibration of Radiological Instruments
0 8 1 1 Supplementary Criteria for Laboratory Approval Calibration of Radiological Protection Level Instruments: X-, Gamma- and Beta-Rays
0 8 1 2 Supplementary Criteria for Laboratory Approval Calibration of Radiological Therapy Level Instruments: X- and Gamma-Rays
0813 Supplementary Criteria for Laboratory Approval Calibration of Radiological Protection Level Instruments: Neutrons
6 6 0 1 Calibration of Radiological Instruments at Protection and Therapy Levels (Guidance Publication)
mechanical, thermal, and o p tic a l f i e ld s . Recently rad io lo g ica l measurements have been added to th is l i s t and i t i s hoped to esta b lish a chain o f approved laboratories able to carry out the c a lib ia tio n o f radiation monitoring instruments related to national standards v ia the newly-developed NPL secondary standard p ro te ctio n -le v e l instrument - the 'b a llo o n ' chamber, fo r X - and y -rad iatio n s [1 ] , and for B-radiation v ia the sets o f calibrated sources which con stitu te the secondary standard [2 ] . The ca lib ration o f p r o te c tio n -le v e l instruments fo r neutron radiations has a lso been considered, but only 2 or 3 lab oratories in the country are equipped fo r th is type o f work.
APPROVAL PROCEDURE
In expanding in to a new measurement f i e ld the f i r s t step , as in the other areas o f measurement, was the appointment o f an independent panel o f experts to draw up the c r ite r ia by which applicant laboratories might be assessed . These c r ite r ia have been published as a set o f BCS documents and they are l is t e d in Table I . They are separated into general and supplementary c r ite r ia documents.
I AEA-SM-222/54 135
In o utlin e the general c r ite r ia deal with laboratory organisation and s t a f f , the accommodation and se rv ic e s , equipment e tc . Thus, fo r example, the head o f the laboratory should have relevant experience and q u a lific a t io n s ; the laboratory should be independent in character so that i t s service is im p artia l; laboratory s t a f f undertaking the measurements should a lso be adequately q u a lified and supervised; working procedures must be properly documented. The laboratory space should be devoted to calib ration work and be free o f e le c tr ic a l in terferen ce, be properly lig h te d , and stable in temperature, e tc .
The assessment team con sists o f the BCS s p e c ia lis t plus one or more independent experts, and they may use th e ir d iscretion in the application o f these general c r it e r ia . I t i s not p ossib le to be as f le x ib le in the case o f the supplementary c r ite r ia which sp ecify that NPL secondary standards must be h eld . Beam uniform ity, d o se -rate , the isotop ic sources, HVL and beam f i l t r a t io n conditions are a lso c lo se ly sp e c ifie d .
I f approval is granted to the applicant laboratory follow ing the assessors rep ort, then the laboratory d e ta ils are added to the BCS D irectory. Here the type and range o f measurement o ffered and claimed accuracy w ill be recorded and be a vailab le for inspection by other laborato r ie s and u sers. Once approved the laboratory may issue o f f i c i a l BCS calib ration c e r t i f ic a t e s , the form o f which is to be standardised for the d iffe re n t measurement areas. The laboratory pays a fee to BCS fo r the work involved in assessment and an annual fee to cover future supervisory work including lia is o n v is i t s and c e rtific a te -c h e c k in g . A proportion o f the la b oratory 's income from ca lib ration work is a lso passed to BCS.
An important feature o f the BCS approval procedure is the audit measurement scheme. In th is scheme, instruments calibrated at the approved laborato r ie s have the ca lib ration figu res compared to those determined fo r the same instrument in the national standardising laboratory. This exercise is conducted p e rio d ica lly using h igh -q u a lity instruments ty p ic a l o f those to be calib rated in the secondary standardising laboratory , and sa tis fa c to ry agreement w il l be required for continuation o f approval. In du stria l organisations should increase th e ir sa les by being able to demonstrate BCS approval, and large government agencies ca lib ratin g instruments fo r the use o f th e ir own organisations w il l be able to demonstrate the tr a c e a b ility o f th eir calib ration s to national standards.
MEASUREMENT UNCERTAINTIES
BCS intends to la y p articu lar emphasis on a clear statement o f measurement uncertainty with associated confidence le v e ls , both on calib ration c e r t if ic a te s and in the approval schedule published in the D irectory. I t is our p o licy to adopt a common method for the calculation o f u ncertainties in the d iffe re n t measurement areas, with these u ncertainties a l l expressed at a minimum 95$ confidence le v e l . Guidance documents have been prepared [ 3 ,1*] to a s s is t the approved lab oratories in th is m atter. B r ie fly o vera ll uncertainty in a measurement at the 95$ confidence le v e l ± U is given by quadrature addition o f the random uncertainties ± Ur , and systematic uncertainties ± Ug
Ur is determined from the standard deviation o f repeated measurements o f the quantity or ca lib ration fa c to r , and Ug is calculated from the conservatively
i . e . U
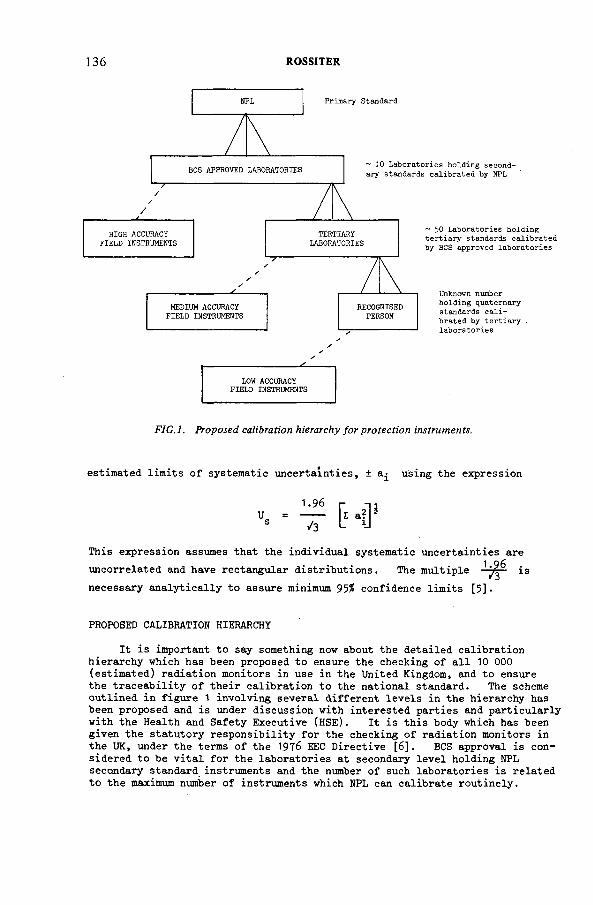
136 ROSSITER
Primary Standard
HIGH ACCURACY TERTIARYFIELD INSTRUMENTS LABORATORIES
✓/
/г / \
MEDIUM ACCURACY RECOGNISEDFIELD INSTRUMENTS PERSON
~ 10 Laboratories holding second
ary standards calibrated by NPL
~ 50 Laboratories holding tertiary standards calibrated
by BCS approved laboratories
Unknown number
holding quaternary standards cali
brated by tertiary
laboratories
LOW ACCURACY FIELD INSTRUMENTS
FIG .l. Proposed calibration hierarchy for protection instruments.
estimated lim its o f systematic u n certa in ties, ± using the expression
This expression assumes that the individual systematic uncertainties are1 96uncorrelated and have rectangular d istr ib u tio n s . The m ultiple — is
necessary a n a ly tic a lly to assure minimum 95% confidence lim its [5 ] .
PROPOSED CALIBRATION HIERARCHY
It is important to say something now about the deta iled calib ration hierarchy which has been proposed to ensure the checking o f a l l 10 000 (estim ated) radiation monitors in use in the United Kingdom, and to ensure the tr a e e a b ility o f th e ir calib ration to the national standard. The scheme outlined in fig u re 1 involving several d iffe re n t le v e ls in the hierarchy has been proposed and is under discussion with in terested p arties and p a rticu la rly with the Health and Safety Executive (HSE). I t i s th is body which has been given the statu tory re sp o n sib ility fo r the checking o f radiation monitors in the UK, under the terms o f the 1976 EEC D irective [6 ] . BCS approval is considered to be v it a l fo r the lab oratories at secondary le v e l holding NPL secondary standard instruments and the number o f such laboratories is related to the maximum number o f instruments which NPL can ca lib rate rou tin ely .
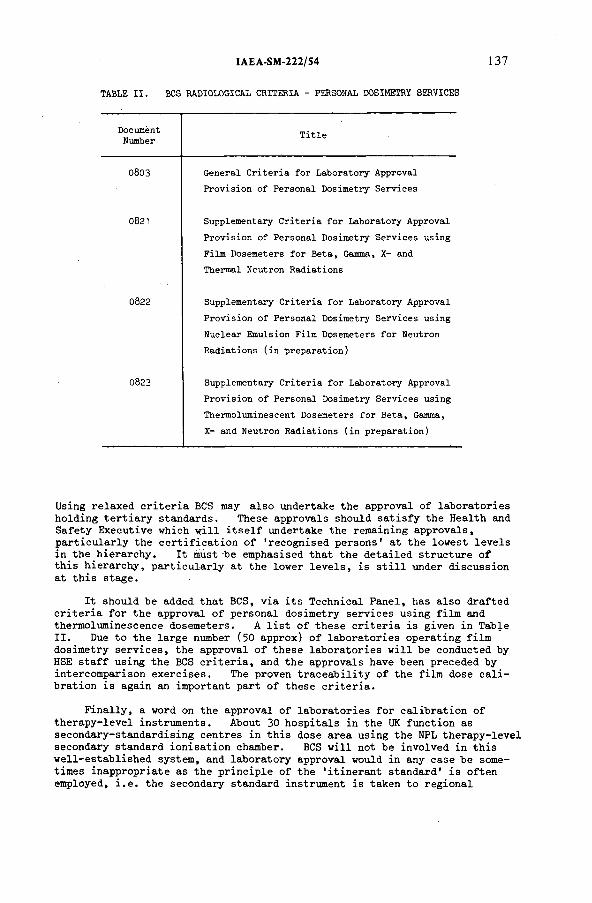
TABLE I I . BCS RADIOLOGICAL CRITERIA - PERSONAL DOSIMETRY SERVICES
IAEA-SM-222/54 137
DocumentNumber Title
0803 General Criteria for Laboratory Approval Provision of Personal Dosimetry Services
0821 Supplementary Criteria for Laboratory Approval Provision of Personal Dosimetry Services using Film Dosemeters for Beta, Gamma, X- and Thermal Neutron Radiations
0 8 2 2 Supplementary Criteria for Laboratory Approval Provision of Personal Dosimetry Services using Nuclear Emulsion Film Dosemeters for Neutron Radiations (in preparation)
0823 Supplementary Criteria for Laboratory Approval Provision of Personal Dosimetry Services using Thermoluminescent Dosemeters for Beta, Gamma, X- and Neutron Radiations (in preparation)
Using relaxed c r ite r ia BCS may a lso undertake the approval o f laboratories holding te r tia r y standards. These approvals should s a t is fy the Health and Safety Executive which w il l i t s e l f undertake the remaining approvals, p a rtic u la rly the c e r t if ic a t io n o f 'recognised persons' at the lowest le v e ls in the hierarchy. I t must be emphasised that the d eta iled structure o f th is hierarchy, p a rtic u la rly at the lower le v e ls , is s t i l l under discussion at th is stage.
It should be added that BCS, v ia i t s Technical Panel, has a lso drafted c r ite r ia fo r the approval o f personal dosimetry services using film and thermoluminescence dosemeters. A l i s t o f these c r ite r ia is given in TableI I . Due to the large number (50 approx) o f lab oratories operating film dosimetry serv ic e s , the approval o f these lab oratories w il l be conducted by HSE s t a f f using the BCS c r it e r ia , and the approvals have been preceded by intercomparison ex ercises . The proven tr a c e a b ility o f the film dose c a l i bration is again an important part o f these c r ite r ia .
F in a lly , a word on the approval o f lab oratories fo r ca lib ration o f th erap y-level instrum ents. About 30 h osp ita ls in the UK function as secondary-standardising centres in th is dose area using the NPL th erap y-level secondary standard ion isa tio n chamber. BCS w ill not be involved in th is w e ll-e sta b lish e d system, and laboratory approval would in any case be sometimes inappropriate as the p rin cip le o f the 'itin e ra n t standard' i s often employed, i . e . the secondary standard instrument is taken to regional
138 ROSSITER
h osp ita ls where the routine ion isation chamber is calibrated using the h o s p ita l 's irra d iation f a c i l i t i e s . I t is expected, however, that instrument manufacturers w il l b en efit by receivin g BCS approval fo r both p ro tection - and th erap y -lev el c a lib ra tio n s .
R E F E R E N C E S
[1] READ, L .R ., KEMP, L .A .W ., The NPL p ro te ctio n -le v e l secondary standard X“ and gamma-ray dose rate m eter, Health Phys. 33 (1977) 131.
[2] OWEN, B . , The beta ca lib ration o f radiation survey instruments at protection le v e ls , Phys. Med. B io l. _T7 (1972) 175.
[3] "The Expression o f Uncertainty in E le c tr ic a l Measurements",BCS guidance publication 3003.
[U] "Statement o f Accuracy for the C alibration o f R adiological Instrumèntsby Approved L aboratories", BCS guidance publication 300U (in preparation).
[5] DIETRICH, C .F ., U ncertainty, Calibration,and Measurement, London.Adam H ilger, 1973.
[6] O ff ic ia l Journal o f the European Communities, ^9. Ы87 ( 1976).
DISCUSSION
R. LOEVINGER: What is the legal basis for the British Calibration Service?Can a laboratory that is not approved by the BCS calibrate instruments for radiation therapy or radiation protection?
M.J. ROSSITER: Mr. Jackson, o f the Health and Safety Executive, should be able to give you that information.
J.H. JACKSON: The BCS has not been set up under any statute and therefore has no legal basis in the strict sense. However, reference to a need for BCS approval can be made in any HSE-approved Codes o f Practice (which are promulgated under our Health and Safety at Work Act), and these have a strong position in law.
Laboratories not approved by BCS may calibrate field instruments; however, employers have an obligation to hold a current calibration certificate for any protection-level field instrument in use, and it is proposed that this should be obtained by one o f the routes described in Mr. Rossiter’s paper. Calibration o f therapy-level instruments does not fall within the scope o f the above Codes o f Practice.
J.-P. SIMOEN : What is the function o f the tertiary laboratory in the calibration chain? In particular, what are its relations on the one hand, with the secondary laboratory, and on the other with the user?
M.J. ROSSITER: We expect that field instruments will be calibrated mainly in tertiary laboratories. These will hold tertiary standard instruments calibrated at secondary laboratories, and perform a simple calibration using isotope sources only. Full-energy-response calibrations will be available only at secondary laboratories. In some cases, secondary and tertiary laboratories will exist together within the same establishment.
IAEA-SM-222/26
CURRENT WORK ON DOSIMETRY STANDARDS IN JAPAN
Y. MORIUCHIElectrotechnical Laboratory (ETL),Tokyo,Japan
Abstract
C U R R E N T W O R K O N D O S IM E T R Y S T A N D A R D S IN J A P A N .
B asic co n cep ts on stand ardization o f radiation d o sim etry are review ed , e sp ecia lly the
c lassification o f radiation qu an tities, th e d osim etric q u an tities in general, and th e necessary
fu n ctio n s o f p rim ary and seco n d ary standards. T h e present situ atio n regarding prim ary
standards in th e E lectro tech n ica l L a b o ra to ry , th e prim ary standard d o sim etry la b o ra to ry in
Japan, is presen ted , considering th e fo llo w in g ; (i) E stablished d osim etric standards o f exp osu re
for so ft and m edium -energy X -rays and gam m a rays. Th is section in cludes m eth o d s o f th eir
stand ardization , and discusses accuracies o f in strum en ts op eratin g as environm ental-
level, p ro tectio n -level, in sp ection -level, th erapy-level, and processing-level m easuring
system s. T h e results o f in tern ation al com parison s b etw een E T L and oth er, foreign
prim ary standard d o sim etry lab oratories are presen ted; (ii) O th er established radiation
standards related to derivation o f radiation absorbed dose. Th ese prim ary standards
in clu d e th ose fo r the n eutron em ission rates, therm al and fast n eutro n flu x densities,
en ergy flu en ces fo r high-energy p h o to n s and e lectron s, and activ ities o f several k in ds o f
radio active m aterial. T h e accuracies and resu lts o f in tern atio n al com parison s re latin g to them
are also presented; (iii) R esearch being carried o u t at E T L . Th is is b rie fly p resented ,
considering esp ecia lly th e absorbed dose stand ardization s o f n eutrons, low -energy and high-
en ergy p h o to n s o r e lectron s, ultra-high dose-rate radiation s, and w o rk on n u clear and a to m ic
in teractio n cross-sections. Th e current status o f th e dissem ination o f radiation standards is
presented considering in particular: (i) Th e ca lib ration services available at E T L , the catego ries
o f th ese services, en ergy and dose rate ranges, m eth ods, accuracies, e tc .; (ii) T h e calib ration
services available in certa in o th er org an izatio n s con sid ered as S S D L s in Japan, the categories
o f such w o rk , m eth od s, a ccuracies e tc .; (iii) Present endeavours tow ards establishing a
system atic and e ffe c tiv e dissem ination system (a so-called T racea b ility S ystem ) in Japan.
1. INTRODUCTION
The recent extensive advances in radiation science and technology have led to a considerable extension in the ranges o f energy and intensity as well as an increase in the types o f radiation which have to be considered in radiation dosimetry. Thus there is an urgent need for development o f dosimetry standards suitable for all work using such radiations. However, the present status o f dosimetry standards in Japan cannot satisfactorily fulfil all needs.
139
140 MORIUCHI
Since unsophisticated extension o f existing standards cannot cope with such a situation, it is necessary to reconsider the fundamental concepts and philosophies relating to radiation dosimetry. For the convenience o f the reader, Table I is presented, as a tentative guide, to assist in obtaining a better understanding o f the relationship between the various quantities relating to ionizing radiation dosimetry. Most o f these physical quantities may be classified into one or other o f the categories shown in Table I. This kind o f classification is considered to be useful for selecting suitable standardizing methods to realize the dosimetric quantities in the proper way with sufficient accuracy.
There is another important aspect o f radiation standards, namely, the necessity o f providing an effective dissemination system o f the standards throughout the country, as well as intercomparison on a world-wide scale.
In this article, I shall be describing the current work in the field o f dosimetry standards, the research projects on radiation dosimetry now in progress at the Electrotechnical Laboratory (ETL), and the current status o f the dissemination system in Japan.
2. CURRENT STATUS OF THE DOSIMETRY STANDARDS IN ETL
As far as direct methods for standardizing the dosimetric quantities in ETL are concerned, primary standards o f exposure have been established in the manner to be described later. A primary standard o f absorbed dose has only been established for the absorbed dose in a water phantom irradiated by the 60Co gamma rays using indirect methods based on the exposure standard.
The absorbed dose for other radiations can be determined using indirect methods based on the other established standards.
2.1. Established primary standards related to radiation dosimetry
As is illustrated by the solid line in Fig. 1, the primary exposure standards have been established [ 1 , 2 ] for ranges o f energy and for the exposure rates shown in Table II. The available ranges o f these standards are estimated from the uncertainties shown in the table, so that the uncertainties given in Table III are always assured. In F ig.l, and Table III, the uncertainties are presented in the forms o f both the arithmetical sums o f the error components and the inquadrature additions o f each uncertainty (shown in the parentheses). In ETL, the former type o f representation o f the uncertainty is officially employed. The range o f the exposure, which is obtained by integrating the exposure rates over the irradiation time, is obviously restricted by the experimental conditions.
Apart from the standards mentioned above, standards which have been calibrated against the primary standards are also available (Table IV). The method o f calibration is based on the following procedures: direct comparison between
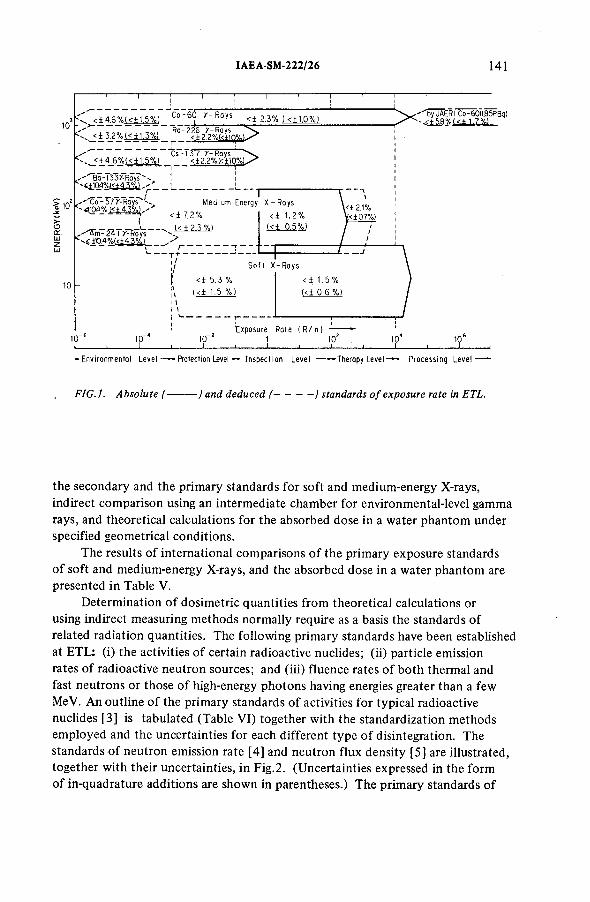
IAEA-SM-222/26 141
_ _ лК _ < ± 3 _ 2 % 1 < 1 Щ 1 _ 2< l? ? % « + iq ° /„
? ю
Со -6 0 У - Roys
R o-22 ’6 У-R ays ч . -------< ± 2.3% I <+1 .0% )
Cs -1 3 7 7 - Roys----- ¡ у щ /
rC o-57 y -R oy s ^ Medium Energy X -R o y s' 4Ю4%^ДЙ4,^ <±72%
кГ- ''Я т т 24 T ÿ-Roys \ М Ш
< ± 1. 2 %
[ < i 0 .5 % )
- ] ! -------------( < ± 5 . 3 %|\ ( <± 1.5 % )I \ t l
S o f t X - R o y s
10"i 10 __L_
<± 1.5%{ < f 0 . 6 % )
'Exposure Rote ( R / h )1
- j _________ l_________ ■ . . _
■'byjAERI Co-60(1.85PBq)
\<± 2 .1% \(<i0.7%)
10i►Environmental Level — —Protection Level-— In spe ct i on L e v e l - —Theropy Leve I - • Processing Level -
FIG.L Absolute (- -) and deduced f-------------) standards of exposure rate in ETL.
the secondary and the primary standards for soft and medium-energy X-rays, indirect comparison using an intermediate chamber for environmental-level gamma rays, and theoretical calculations for the absorbed dose in a water phantom under specified geometrical conditions.
The results o f international comparisons o f the primary exposure standards o f soft and medium-energy X-rays, and the absorbed dose in a water phantom are presented in Table V.
Determination o f dosimetric quantities from theoretical calculations or using indirect measuring methods normally require as a basis the standards o f related radiation quantities. The following primary standards have been established at ETL: (i) the activities o f certain radioactive nuclides; (ii) particle emission rates o f radioactive neutron sources; and (iii) fluence rates o f both thermal and fast neutrons or those o f high-energy photons having energies greater than a few MeV. An outline o f the primary standards o f activities for typical radioactive nuclides [3] is tabulated (Table VI) together with the standardization methods employed and the uncertainties for each different type o f disintegration. The standards o f neutron emission rate [4] and neutron flux density [5] are illustrated, together with their uncertainties, in Fig.2. (Uncertainties expressed in the form o f in-quadrature additions are shown in parentheses.) The primary standards o f
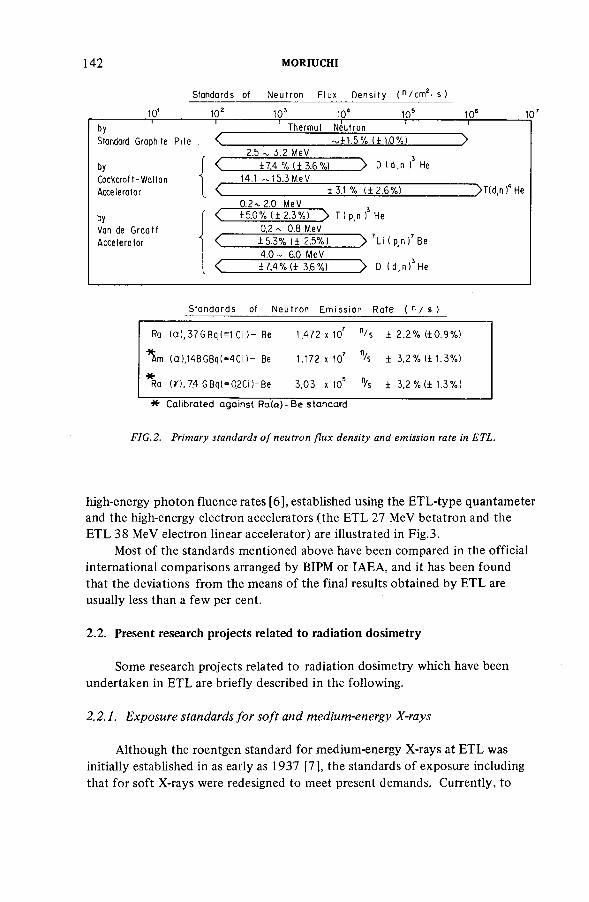
142 MORIUCHI
Standards o f N e u t r o n F l ux D e n s i t y ( n / c m 2 s )
1 0 ' 1 0 2
IDОоKlО
1 0 6 1(
b y 1 T h e r m a l N e u t r o n 1I
S ta n d a r d G r a p h i t e P i l e . < ~ ± 1 . 5 % ( ± 1 . 0 % ) 1 32 . 5 -v. 3 . 2 M e V
by < ± 7 . 4 % ( ± 3 . 6 % ) > D ( d . n ) Не
C o c k c r o f t - W a l t o n 1 4 .1 ~ 1 5 . 3 M e V
A c c e l e r a t o r < ± 3 . 1 % ( ± 2 . 6 % ) > T ( d . n f Н е
0 . 2 ~ 2 . 0 M e V
by < ± 5 . 0 % ( ± 2 . 3 % ) > T ( p n ) Н е
V o n de G r a a t f 0 . 2 - 0 . 8 M e V
A c c e l e r a t o r 1 < ± 5 . 3 % ( ± 2 . 5 % ) > ' L i ( p. n ) ' B e
4 . 0 ~ 6 . 0 M e V
< ± 7 . 4 % ( ± 3 . 6 % ) > D ( d . n ) J H e
S t a n d a r d s of N e u t r o n E m i s s i o n R a t e ( n / s )
Ra ( a ) , 3 7 G B q (= 1 C i ) - B e 1 . 4 7 2 * 1 0 7 n/ s ± 2 . 2 % ( ± 0 . 9 % )
( a ) , 1 4 8 G B q ( — 4 C i ) - Be 1 . 1 7 2 x 1 0 7 r / s ± 3 . 2 % ( ± 1 . 3 % )
* R a ( У ) , 7.4 G B q ( = Q 2 C i ) - B e 3 . 0 3 x 1 0 5 n/ s ± 3 . 2 % ( ± 1 . 3 % )
* Calibrated against R a te )-B e standard
FIG .2. Primary standards o f neutron flux density and emission rate in ETL.
high-energy photon fluence rates [6 ], established using the ETL-type quantameter and the high-energy electron accelerators (the ETL 27 MeV betatron and the ETL 38 MeV electron linear accelerator) are illustrated in Fig.3.
Most o f the standards mentioned above have been compared in the official international comparisons arranged by BIPM or IAEA, and it has been found that the deviations from the means o f the final results obtained by ETL are usually less than a few per cent.
2.2. Present research projects related to radiation dosimetry
Some research projects related to radiation dosimetry which have been undertaken in ETL are briefly described in the following.
2.2.1. Exposure standards for soft and medium-energy X-rays
Although the roentgen standard for medium-energy X-rays at ETL was initially established in as early as 1937 [7], the standards o f exposure including that for soft X-rays were redesigned to meet present demands. Currently, to
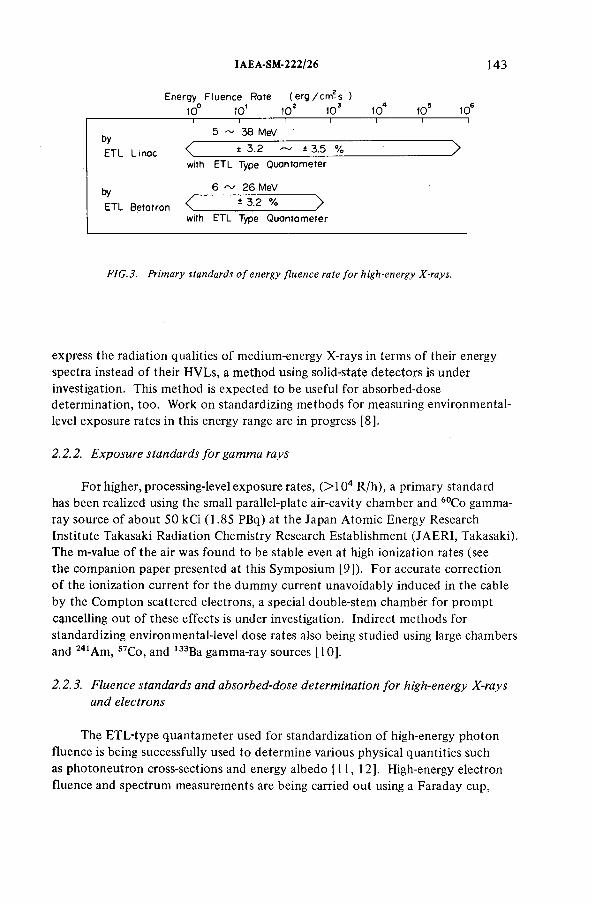
IAEA-SM-222/26 143
Energy Fluence Rote (e rg /c m * s )1 0 ° t o 1 1 0 г ю 3 1 0 4 1 0 ° 1 0 ®
byETL Li пас
5 ~ 38 MeV
>with ETL Type Quantameter
byETL Betatron - 3.2 %
with ETL Type Quontameter
FIG.3. Primary standards o f energy fluence rate for high-energy X-rays.
express the radiation qualities o f medium-energy X-rays in terms o f their energy spectra instead o f their HVLs, a method using solid-state detectors is under investigation. This method is expected to be useful for absorbed-dose determination, too. Work on standardizing methods for measuring environmental- level exposure rates in this energy range are in progress [8 ].
2.2.2. Exposure standards for gamma rays
For higher, processing-level exposure rates, (>10 4 R/h), a primary standard has been realized using the small parallel-plate air-cavity chamber and 60Co gamma- ray source o f about 50 kCi (1.85 PBq) at the Japan Atomic Energy Research Institute Takasaki Radiation Chemistry Research Establishment (JAERI, Takasaki). The m-value o f the air was found to be stable even at high ionization rates (see the companion paper presented at this Symposium [9]). For accurate correction o f the ionization current for the dummy current unavoidably induced in the cable by the Compton scattered electrons, a special double-stem chamber for prompt cancelling out o f these effects is under investigation. Indirect methods for standardizing environmental-level dose rates also being studied using large chambers and 241 Am, 57Co, and 133Ba gamma-ray sources [10].
2.2.3. Fluence standards and absorbed-dose determination for high-energy X-rays and electrons
The ETL-type quantameter used for standardization o f high-energy photon fluence is being successfully used to determine various physical quantities such as photoneutron cross-sections and energy albedo [11, 12]. High-energy electron fluence and spectrum measurements are being carried out using a Faraday cup,
144 MORIUCHI
a 180° double focussing electron energy spectrometer and a toroidal coil transformer, etc. Studies on high-energy electron penetration through thick layers are also being carried out, and anomalous electron energy loss and straggling through single crystals o f silicon and germanium have been investigated [13, 14]. For these measurements on high-energy radiations, it is necessary to have precise information on the beam intensity distributions in energy-absorbing materials.Use has been made o f the junction field effect transistor (J-FET), which can be used for precise absorbed-dose measurements up to 10 Gy [15, 16], and o f TLD materials, etc.; extensive experimental results have been obtained [17].
Absorbed-dose measurements in water, graphite and aluminium for high- energy electrons from the ETL linac are being carried out using TLD, J-FET dose meters, zener diode dose meters and a calorimeter [18, 19].
2.2.4. Absorbed dose determination for gamma rays and neutrons
To establish a primary standard o f absorbed dose in carbon for gamma rays, a method using a calorimeter is under investigation. Efforts have been made to determine the dosimetric quantity for neutrons, and to extend the ranges o f flux density and energy o f the fast neutron fluence standards. Also, using the 300 kV Cockcroft-Walton accelerator and a large gas chamber equipped with an ion energy analyser, experiments designed to give accurate measurements o f such fundamental quantities as ionization yield and stopping cross-section o f various gases (e.g. N2, CH4, C 02) for typical ions o f hydrogen, helium, nitrogen etc. are being carried out [20]. Inelastic energy loss and the energy degradation spectrum o f charged particles in matter, and the mobilities o f some ions are also being investigated [2 1 , 2 2 ].
2.2.5. Standardization o f low-energy photon fluences
Low-energy continuous X-rays (< 1 0 kV) can be monochromatized by crystal diffraction methods (Rowland circle). The fluence rates o f the mono- energetic photons thus obtained are measured by semiconductor detectors. In connection with this, it is very important to estimate the degradation o f the photons by the thin electrode layer o f the detectors. The method o f making precise measurements and o f controlling the depth o f the electrode material is being studied.
2.2.6. Ultra high intensity single-pulse radiation dosimetry
For very high intensity single-pulse radiations o f nanosecond duration at dose rates o f up to about 1013 Gy/s per pulse, methods o f measuring total fluence and absorbed dose are under study using a flash electron and X-ray generator o f 600 kV and vacuum-chamber system.
IAEA-SM-222/26 145
Since, in Japan, there is no organization concerned solely with radiation standards and calibrations, ETL (the primary standard dosimetry laboratory in Japan) is exclusively responsible for the calibration o f secondary standards, measuring instruments in common use, and several kinds o f radioactive material. This system was authorized about 20 years ago to control the use o f ionizing radiations. However, owing to the large increase in the use o f such radiation in the last few years, it has been recognized that the present dissemination system does not satisfy the existing situation. On the one hand, several organizations which have secondary or tertiary standards calibrated against the ETL standards are sharing, to some extent, the calibration work, while performing their proper work, but this is not necessarily authorized nor is it systematically formalized.
In this connection* several fundamental problems that have to be solved in order to establish a fluent and effective system for dissemination o f radiation standards have been widely recognized [23]. Some formal proposals on these problems were submitted to the government by a group o f specialists [24, 25], and some scientific investigations on effective standardizing methods have been carried out in various research committees, such as those concerned with therapeutic radiation dosimetry [26], processing radiation dosimetry [27], environmental radiation dosimetry [28], low-energy space radiation dosimetry, medical diagnostic radiation dosimetry, etc. The government, with an eye to the problems in industry, has recently considered forming a committee on the Promotion o f a traceability system, but a final conclusion has not been reached.
3.1. Dissemination work in ETL
The calibration work in ETL is restricted to the special case in which a request for calibration is accepted from the administrative point o f view. However, continuous efforts have been made to allow calibration work to be extended to the secondary standards installed in some responsible organizations which can, in turn, perform further calibration work for tertiary standards or field devices.The radiation quantities realized in such dissemination work at ETL are mainly exposure (in roentgens), activities o f radioactive nuclides (in microcuries or becquerels (disintegrations per second)), neutron flux density (п -спГ 2 -s-1), and neutron emission rate (n ■ s"1).
Absorbed dose has not been disseminated directly from ETL (neither for any type o f radiation nor for any given material). The calibration work at ETL amounts to some several tens o f measuring devices a year, on average. The methods o f calibration and the way o f expressing the uncertainties o f the results are shown for the case o f exposure calibrations in Table VII.
3. DISSEMINATION OF DOSIMETRY STANDARDS IN JAPAN
146 MORIUCHI
3.2. The present dissemination system in Japan
To meet the most important needs o f calibration work in the fields o f radiation applications and research in Japan, several organizations perform some restricted dissemination work using secondary standard instruments or radioactive materials calibrated against ETL’s standards. The present scope o f such activities in Japan is shown in Table VIII. In the calibration certifications by these organizations, the uncertainties are expressed by a round number larger than the arithmetical sum o f all error components, as shown in Table IX.
3.3. Problems for a future dissemination system in Japan
Owing to the increasing demand for calibration o f radiation measuring instruments and radioactive materials in Japan, it will be necessary to reform the dissemination system so as to make it more fluent and effective. Considering the shortage o f experts and facilities required to perform a large amount o f calibration work in a reliable way, the best solution seems to be to establish additional calibration laboratories to reduce the load on the central standard laboratory. At the same time, emphasis should be placed on the necessity o f solving the related problems, which include training o f those engaging in calibration work and the availability o f fully equipped facilities for the secondary standard calibrations.
ACKNOWLEDGEMENTS
The author would like to express many thanks to Dr. E. Teranishi,Mr. O. Yura, Dr. T. Michikawa, Mr. A. Katoh, Dr. T. Tomimasu, Dr. Y. Kawada and many other colleagues for their valuable comments and contributions. The author is also indebted to Dr. M. Yamashita for much kind advice.
REFERENCES
[1 ] M O R IU C H I, Y ., et a l., Specia l ed ition : E xp osu re m easurem ents, B ull. E T L 38 6 , 7
(1 9 7 4 ) in Japanese.[2] M O R IU C H I, Y ., E stim ation o f general io n reco m b in a tio n loss in high in ten sity radiation
d o sim etry , Res. E T L 7 3 6 ( 1 9 7 3 ) .
[3] K A W A D A , Y ., E xten d ed ap p licatio n s and im p rovem en t o f th e 4 it co in cid en ce
m eth od in the stan d ardizatio n o f radio n u clid es, Res. E T L 7 3 0 (1 9 7 3 ) .
[4] M IC H IK A W A , T ., et a l„ Bull. E T L 23 (1 9 5 9 ) 223.

IAEA-SM-222/26 147
[5] MICHIKAWA, T., TERANISHI, E., et al., On the experiments performed at the Electrotechnical Laboratory for the international intercomparison of flux density measurements for monoenergetic fast neutrons, Bull. ETL 41 9 (1977) 1.
[6] TOMIMASU, T., Absolute measurement of high energy X-ray beam energy and photoneutron cross-sections for natural copper and lead, Res. ETL 679 (1967).
[7] ITOH, G., et al., Memorial Report on 50 Year Anniversary of ETL, ETL, Tokyo (1941).[8] KATOH, A., et al., Research on environmental radiation monitoring near nuclear power
stations, NucLSafety Res. Assoc. 1 (1973) 59 in Japanese.
[9] MORIUCHI, Y., KATOH, A., TAKATA, N., TANAKA, R., TAMURA, N., these Proceedings, Vol.2, paper IAËA-SM-222/44.
[10] KATOH, A., et al., Research on environmental radiation monitoring near nuclear power stations, NucLSafety Res. Assoc. 2 (1974) 119 in Japanese.
[11] TOMIMASU, T., J. Phys. Soc. Jpn. 25(1968) 655.[12] TOMIMASU, T., SUGIYAMA, S., et al., “ Systematic discrepancy in photoneutron
cross-sections for medium and heavy nuclei” , Proc. 4th Conf. Nuclear Cross-Sections and Tech. Vol. 1, Washington, USA (1975) 83.
[13] TOMIMASU, T., MIKADO, T., etal., Phys. Rev., В 10(1974) 2669.[14] MIKADO, T., TOMIMASU, T., et al., J. Appl. Phys. 47 9 (1976) 2669.[15] CHIWAKI, М., TOMIMASU, T., IEEE Trans. Nucl.Sci. NS-22 6 (1975) 2696.[16] TOMIMASU, T., YAMAZAKI, T., J. Appl. Phys. 46 4(1976) 1732.[17] YAMAZAKI, T., TOMIMASU, T., et al., Nucl. Instrum. Meth. 144(1977) 515.[18] TOMIMASU, T., YAMAZAKI, T., et al., Rev. Sci. Instrum. 48 3 (1977) 312.[19] TOMIMASU, T., YAMAZAKI, T., et al., to be published in Bull. ETL (1978).[20] FUKUDA, A., Bull. ETL 40 ( 1976) 12.[21 ] SUZUKI, I.H., Ionization efficiency curves of ethylene, ethane and acethylene by
electron impact, Res. ETL 766 (1977).[22] TAKATA, N., J. Phys. B, 10(1977).[23] MORIUCHI, Y., J. At. Energy Soc. Jpn 19 4 (1977) 218 inJapanese.
[24] NISHINO, O., Report on the necessity to establish the proper standard dissemination laboratory for radiation standards, Research Liaison Council for International Metrology (1971) in Japanese.
[25] NAITO, М., Report on Inspection of the Traceability System for Radiation Standards in Japan, Committee on the Promotion of a Traceability System ( 1975) in Japanese.
[26] HASHIZUME, М., et al., Standard Methods for Measurements of the Absorbed Dose given by High Energy X-Rays in Radiation Therapy, Physicist Group of Japan Radiology Society ( 1971 ) in Japanese.
[27] MORIUCHI, Y., et al., Accurate Methods for Measuring High Dose Rates Radiations, Research Committee on High-Level Radiation Dosimetry, Irradiation Development Association, to be published ( 1977) in Japanese.
[28] KATOH, A., et al., Research on standardization of radiation monitoring methods near nuclear power stations, Nucl. Safety Res. Assoc. 3 (1975) 109 in Japanese.
The Discussion follows on page 157.
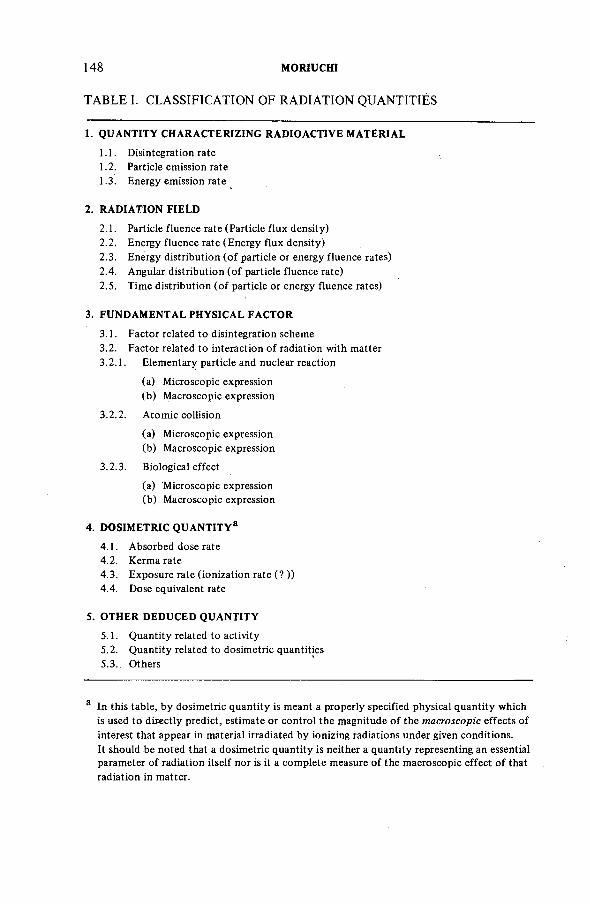
148 MORIUCHI
TABLE I. CLASSIFICATION OF RADIATION QUANTITIES
1. Q U A N T IT Y C H A R A C T E R IZIN G R A D IO A C T IV E M A T E R IA L
1 .1 . D isin tegration rate
1.2 . Particle em ission rate
1 .3 . E n ergy em ission rate
2. R A D IA T IO N FIELD
2 .1 . Particle flu en ce rate (P article flu x den sity)
2.2. E n ergy flu en ce rate (E n erg y flu x d en sity)
2.3. E n ergy d istrib u tio n ( o f p article o r en ergy flu e n ce rates)
2.4. A n gu lar d istrib u tio n ( o f p article flu e n ce rate)
2 .5. T im e d istrib u tio n ( o f p article or en ergy flu en ce rates)
3. F U N D A M E N TA L PH Y SIC A L F A C T O R
3 .1 . F a c to r related to d isin tegratio n schem e
3.2. F a c to r related to in teractio n o f radiation w ith m atter
3 .2 .1 . E lem en tary p article and n u clear reaction
(a) M icroscop ic exp ression
(b) M acroscop ic expression
3 .2.2 . A to m ic co llision
(a) M icroscop ic exp ression
(b) M acroscop ic exp ression
3 .2 .3 . B io lo g ica l e ffe ct
(a) M icro sco p ic exp ression
(b) M acroscop ic exp ression
4. D OSIM ETRIC Q U A N T IT Y 3
4 .1 . A b so rb ed d ose rate
4.2 . K erm a rate
4.3 . E xp o su re rate (io n izatio n rate (? ))
4.4. Dose equivalent rate
5. O TH ER DED U CED Q U A N T IT Y
5 .1 . Q u a n tity related to a ctiv ity
5.2. Q u a n tity related to d o sim etric q u an tities
5 .3 .. O thers
a In th is tab le , b y d osim etric q u a n tity is m eant a p ro p erly sp ecified p h ysica l q u a n tity w h ich
is used to d ire ctly p red ict, estim ate o r co n tro l th e m agnitude o f th e macroscopic e ffe c ts o f
in terest th at appear in m aterial irradiated b y ion izin g radiation s under given con d ition s.
It should be n oted th at a d osim etric q u a n tity is n either a q u a n tity representing an essential p aram eter o f radiation itse lf nor is it a co m p lete m easure o f th e m acro sco p ic e ffe c t o f that
rad iatio n in m atter.
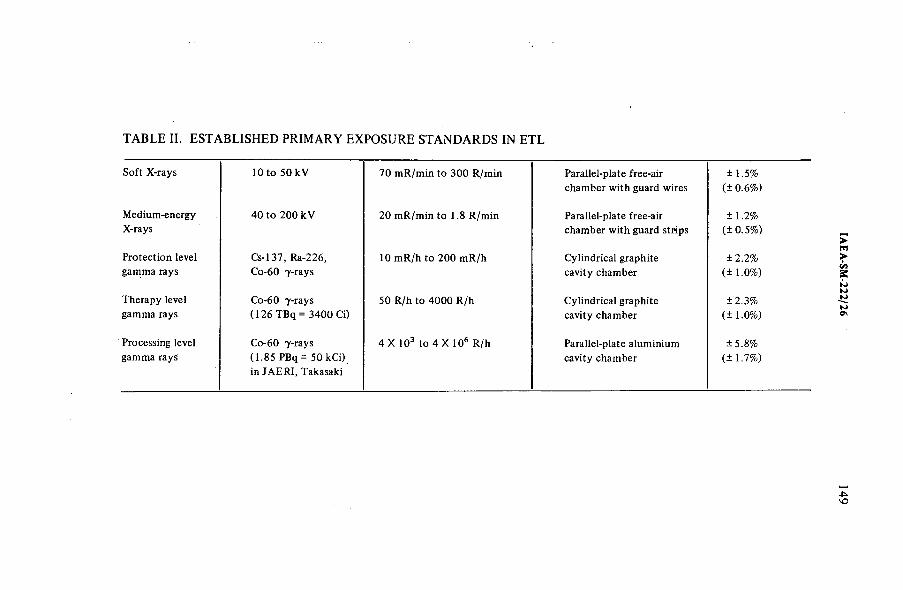
TABLE II. ESTABLISHED PRIMARY EXPOSURE STANDARDS IN ETL
S o ft X -rays 10 to 50 k V 70 m R /m in to 300 R/m in P arallel-plate free-air
ch am b er w ith guard w ires
± 1.5%
(± 0.6%)
M edium -energy
X-rays
40 to 200 k V 20 m R /m in to 1 .8 R /m in P arallel-plate free-air
ch am b er w ith guard strips
± 1 .2%
(± 0 .5 % )
P ro tectio n level C s-13 7 , Ra-226, 10 m R /h to 200 m R /h C ylin d rica l graphite ± 2 .2%gam m a rays Co-60 7 -rays c a v ity ch am b er (± 1 .0%)
T h e ra p y level Co-60 7 -rays 50 R/h to 4000 R /h C y lin d rica l graph ite ± 2 .3 %gam m a rays ( 1 2 6 T B q = 3400 Ci) ca v ity ch am b er ( ± 1 .0%)
Processing level Co-60 7 -rays 4 X 10³ to 4 X 10⁶ R/h P arallel-plate a lum inium ± 5.8%gam m a rays (1 .8 5 PBq = 50 kC i)
in J A E R I, T akasakic a v ity ch am b er (± 1.7% )
IAE
A-SM
-222/26 ] 4
9
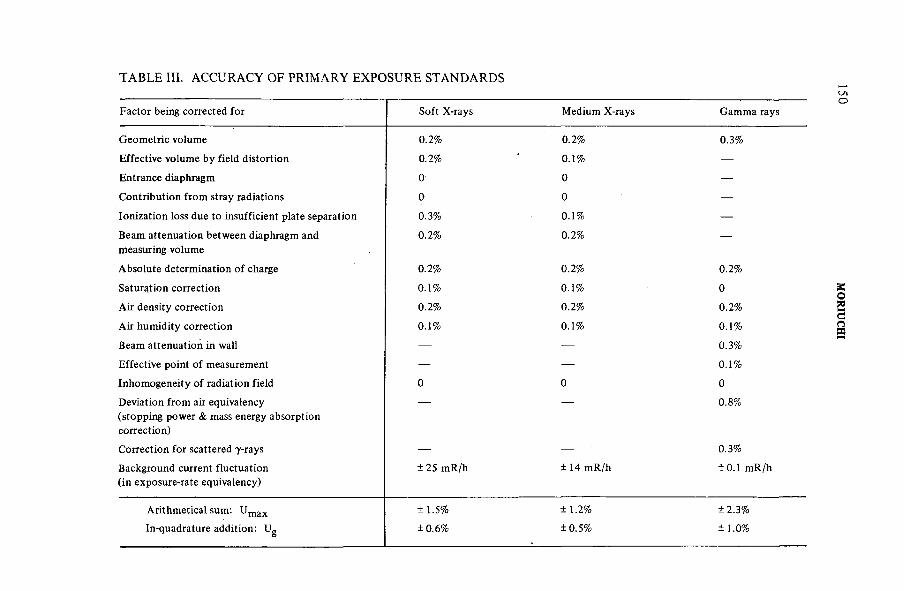
TABLE III. ACCURACY OF PRIMARY EXPOSURE STANDARDS
F a c to r being corrected fo r S o ft X -rays M edium X -rays G am m a rays
G e o m e tr ic volum e 0 .2% 0.2% 0.3%
E ffe c tiv e vo lu m e b y fie ld d istortion 0.2% 0 . 1% —
E n tran ce diaphragm 0 0 —
C o n trib u tio n fro m stray radiation s 0 0 —
Io n iza tio n loss due to in su ffic ien t p late separation 0.3% 0 . 1% —
B eam atten u atio n b etw een diaphragm and
m easuring volu m e
0.2% 0.2% —
A b so lu te d eterm in ation o f charge 0.2% 0 .2% 0 .2%
S atu ration co rrectio n 0 . 1% 0 . 1% 0A ir d en sity co rrectio n 0.2% 0 .2% 0 .2%
A ir h u m id ity co rrectio n 0 . 1% 0 . 1% 0 . 1%
B eam atten u atio n in wall — — 0.3%
E ffe c tiv e p oin t o f m easurem ent — — 0 . 1%
In h o m o g e n eity o f radiatio n fie ld 0 0 0D eviation fro m air eq u iva len cy
(sto p p in g p o w er & mass en ergy abso rp tion
correctio n)
0 .8%
C o rrectio n fo r scattered 7 -rays — — 0.3%
B ackgro un d current flu ctu atio n
(in exp osure-rate eq uivalency)
± 2 5 m R/h ± 14 m R /h ± 0.1 m R /h
A rith m etica l sum : U m ax ± 1.5% ± 1 .2% ± 2.3%
In-quadrature add ition : Ug ± 0.6% ± 0 .5 % ± 1 .0%
MO
RIU
CH
I
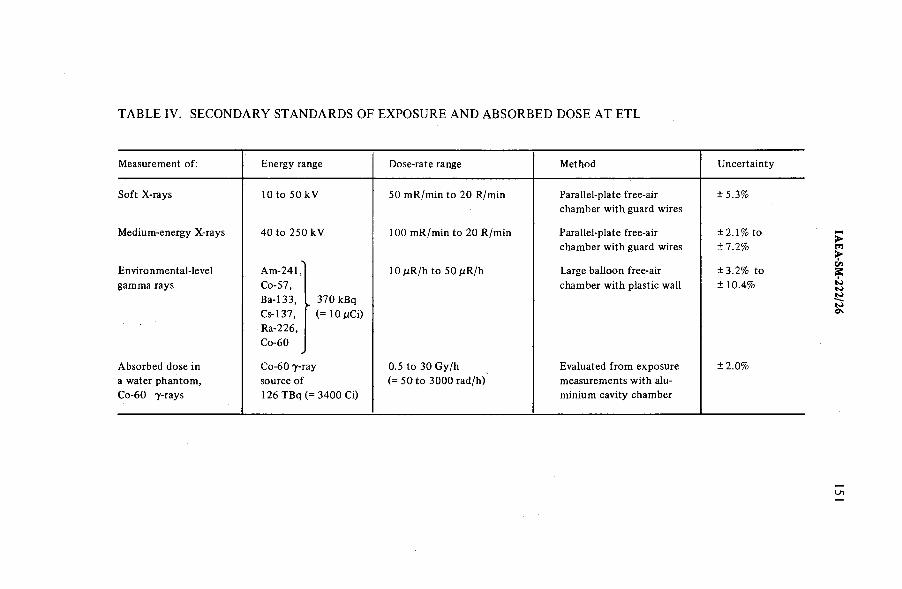
TABLE IV. SECONDARY STANDARDS OF EXPOSURE AND ABSORBED DOSE AT ETL
M easurem ent of: E n ergy range D ose-rate range M ethod U n certa in ty
S o ft X -rays 10 to 50 k V 50 m R /m in to 20 R/m in P arallel-plate free-air
cham ber w ith guard w ires
± 5 .3 %
M edium -energy X -rays 40 to 250 k V 100 m R /m in to 20 R /m in P arallel-plate free-air
ch am b er w ith guard w ires
± 2 . 1% to
± 7.2 %
E nvironm ental-level
gam m a rays
A m -2 4 1,
C o -5 7,
B a-13 3,
C s-13 7 ,
R a-226,
Co-60
, 3 70 kBq
’ (= 10/uCi)
10 jtiR/h to 50 juR/h Large b allo o n free-air
ch am b er w ith p lastic w all
± 3 .2 % to
± 10 .4%
A b so rb ed d ose in
a w ater ph an tom ,
Co-60 7 -rays
Co-60 7 -ray
source o f
126 T B q (= 3400 Ci)
0.5 to 30 G y/h
(= 50 to 3000 rad/h)
E valu ated fro m exp osu re
m easurem ents w ith alu
m inium ca v ity ch am b er
± 2 .0%
IAE
A-S
M-2
22
/26
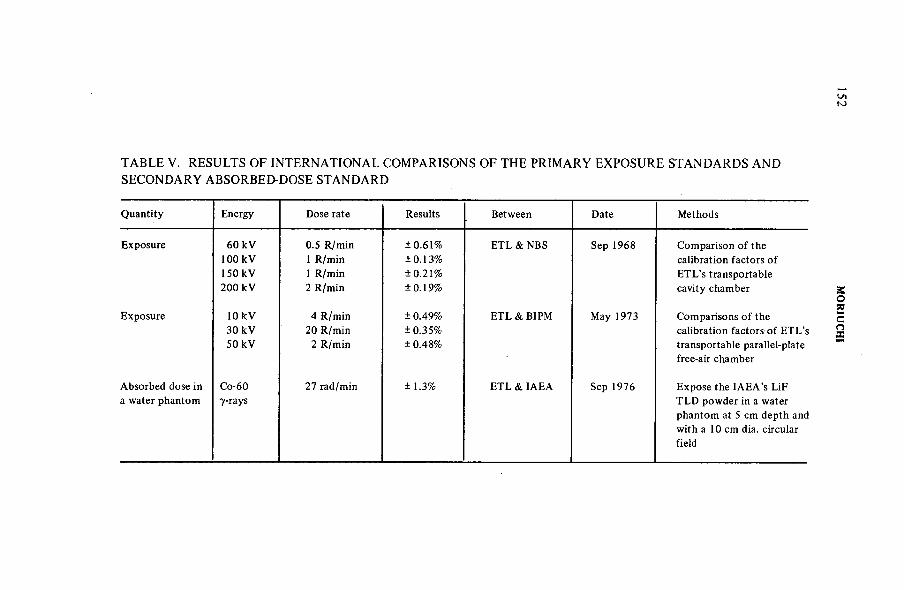
TABLE V. RESULTS OF INTERNATIONAL COMPARISONS OF THE PRIMARY EXPOSURE STANDARDS AND SECONDARY ABSORBED-DOSE STANDARD
Q u an tity E nergy D ose rate R esults B etw een D ate M ethods
E xp osu re 60 k V
100 k V
150 k V
200 k V
0.5 R/m in
1 R/m in
1 R/m in
2 R/m in
± 0 .6 1 %
± 0 .1 3 %
± 0.2 1 %
± 0 .19 %
E T L & N B S S ep 1968 C o m p ariso n o f the
ca lib ratio n fa c to rs o f
E T L ’s transp ortable
c a v ity cham ber
E xp o su re 10 k V
30 k V
50 k V
4 R/m in
20 R/m in
2 R/m in
± 0.49%
± 0.35%
± 0.48%
E T L & BIPM M ay 19 7 3 C o m p arison s o f the
ca lib ration fa cto rs o f E T L ’s
tran sp ortable p arallel-p late
free-air cham ber
A b so rb ed dose in
a w ater ph an tom
Co-60
7 -rays
27 rad/m in ± 1.3% E T L & IA E A Sep 19 7 6 E x p o se th e I A E A ’s L iF
T L D p o w d e r in a w ater
p h an to m at 5 cm d ep th and
w ith a 10 cm dia. circu lar
field
152 M
OR
IUC
HI
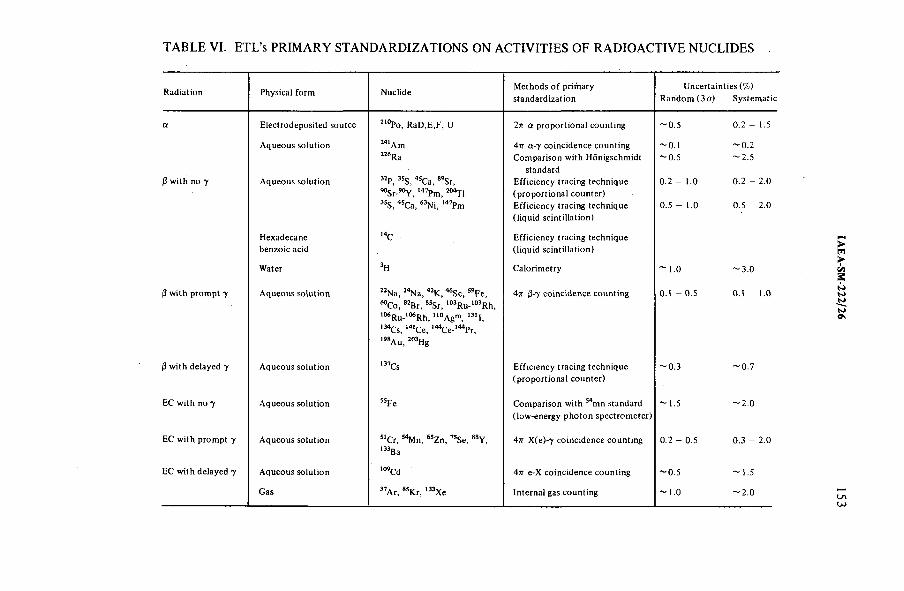
TABLE VI. ETL’s PRIMARY STANDARDIZATIONS ON ACTIVITIES OF RADIOACTIVE NUCLIDES
R a d ia tio n P hysica l fo r m N u clid eM e th o d s o f p r im ary s ta n d a rd iza tio n
U n certa in ties (% ) R a n d o m (3 a ) S y ste m a tic
a E le c tro d e p o s ite d so u rce 2, 0P o , R a D ,E ,F , U 2ir a p r o p o r t io n a l c o u n tin g - 0 . 5 0.2 - 1.5
0 w ith n o y
A q u e o u s so lu t io n
A q u e o u s so lu t io n
H e x a d e ca n e b e n z o ic acid
MIA m226Ra
32p 35ç 4 5 89o
^ S r -^ Y , 147P m , 204T1 3sS, 4sCa, 63Ni, l47Pm
14C
Aft a -7 c o in c id e n c e co u n tin g C o m p a r iso n w ith H o n ig sch m id t
standard E f f ic ie n c y tracing te ch n iq u e (p r o p o r t io n a l c o u n te r ) E f f ic ie n c y tracing te ch n iq u e ( l iq u id sc in tilla t io n )
E f f ic ie n c y tracing te ch n iq u e ( l iq u id s c in tilla t io n )
- 0.1- 0 . 5
0.2 - 1.0
0 .5 - 1 .0
- 0.2- 2 . 5
0.2 -
0 .5 -
2.0
2.0
W ater 3H C a lo r im e try ~ 1.0 - 3 . 0
|3 w ith p r o m p t 7 A q u e o u s so lu t io n 22N a, 24N a , 42K , ^ S c , 59F e , “ C o , 82Br, ssSr, 103R u -103R h, 106R u -l06R h , n 0A g m, 13I I, l34Cs, 14iC e, 144C e -l44Pr, 198A u , 203Hg
4тг $-7 c o in c id e n c e co u n tin g 0 .1 - 0 . 5 0.1 - 1.0
0 w ith d e la y e d y A q u e o u s so lu t io n 137Cs E f fic ie n c y tra cin g te ch n iq u e (p r o p o r t io n a l c o u n te r )
- 0 . 3 - 0 . 7
EC w ith n o 7 A q u e o u s so lu t io n ssFe C o m p a r iso n w ith 54m n standard ( lo w -e n e r g y p h o to n s p e c tro m e te r )
- 1.5 - 2.0
EC w ith p r o m p t y A q u e o u s so lu t io n s lCr, s4M n, 6sZ n , 75Se, 88Y, 133Ba
4 ft X ( e )-7 c o in c id e n c e co u n tin g 0 .2 - 0 .5 0 .3 - 2.0
E C w ith d e la y e d y A q u e o u s so lu t io n i09c d 4 ft e -X c o in c id e n c e c o u n tin g - 0 . 5 - 1.5
G as 31A r, 85K r, 133X e In tern a l gas co u n tin g - 1.0 - 2.0
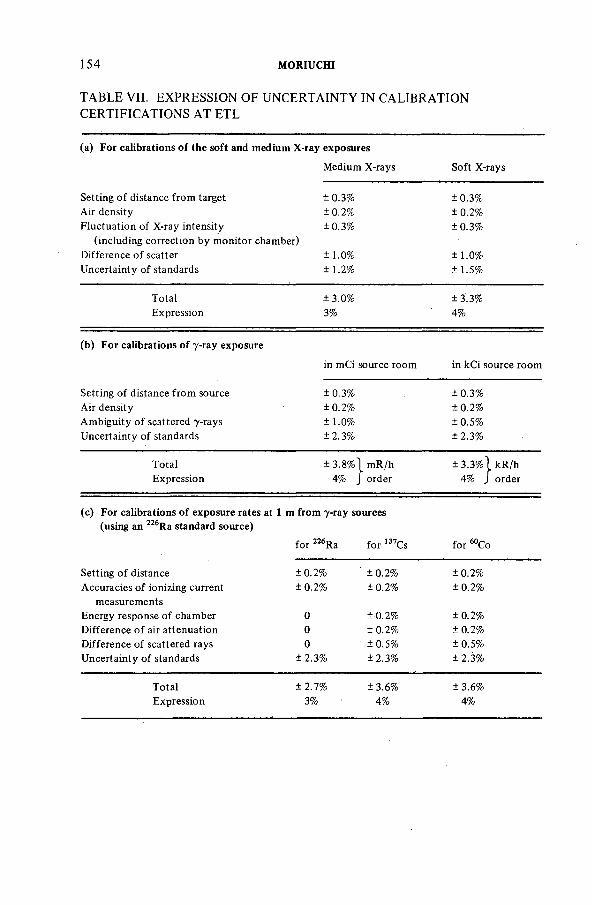
154 MORIUCHI
TABLE VII. EXPRESSION OF UNCERTAINTY IN CALIBRATION CERTIFICATIONS AT ETL
(a) For calibrations o f the soft and medium X-ray exposures
M edium X -rays S o ft X -rays
S ettin g o f d istan ce fro m target ± 0.3% ± 0 .3 %
A ir d en sity ± 0.2% ± 0.2%
F lu ctu a tio n o f X -ray in ten sity ± 0 .3 % ± 0 .3 %
(in clu din g co rrectio n b y m o n ito r cham ber)
D ifferen ce o f scatter ± 1 .0% ± 1 .0%
U n certa in ty o f standards ± 1 .2% ± 1.5%
T o ta l ± 3.0% ± 3 .3 %
E xpression 3% 4%
(b) For calibrations o f 7-ray exposure
in m C i sou rce room in k C i source room
S ettin g o f d istan ce fro m source ± 0 .3 % ± 0.3%
A ir d en sity ± 0.2% ± 0 .2%
A m b ig u ity o f scattered 7 -rays ± 1 .0% ± 0 .5 %
U n certa in ty o f standards ± 2 .3 % ± 2 .3 %
T o ta l ± 3 .8 % ' m R /h ± 3 .3% ' . kR /h
E xpression 4% order 4% ord er
(c) For calibrations of exposure rates at 1 m from 7-ray sources(using an 226Ra standard source)
fo r 226Ra fo r 137Cs fo r 60Co
S ettin g o f d istan ce ± 0.2% ± 0.2% ± 0.2%
A ccu ra c ie s o f io n izin g current ± 0.2% ± 0.2% ± 0.2%
m easurem ents
E n ergy resp onse o f cham ber 0 ± 0.2% ± 0.2%
D ifferen ce o f air a tten u atio n 0 ± 0.2% ± 0.2%
D ifferen ce o f scattered rays 0 ± 0 .5 % ± 0 .5 %
U n ce rta in ty o f standards ± 2 .3 % ± 2 .3 % ± 2 .3 %
T o ta l ± 2 .7 % ± 3.6% ± 3.6%
E xp ression 3% 4% 4%
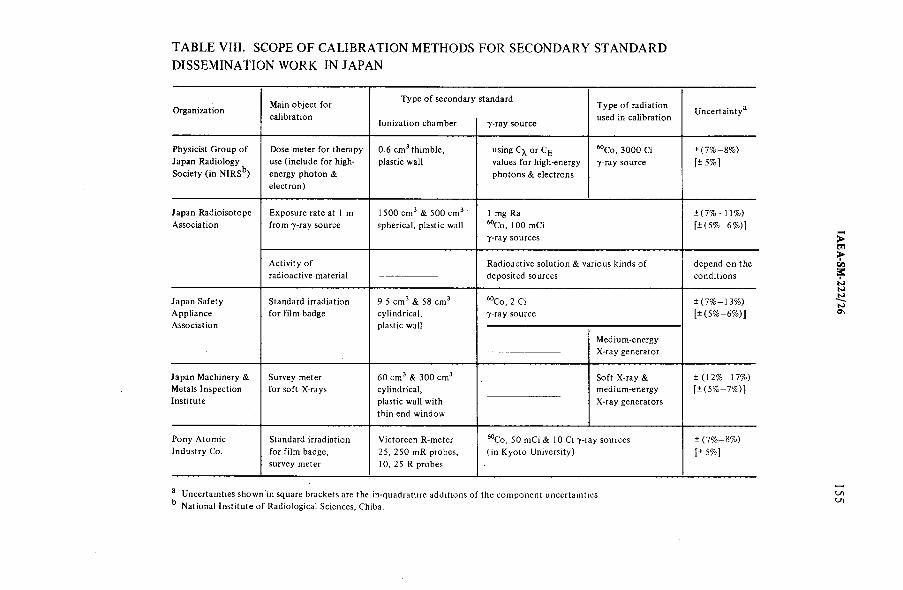
TABLE VIH. SCOPE OF CALIBRATION METHODS FOR SECONDARY STANDARD DISSEMINATION WORK IN JAPAN
O rg an iza tionM ain o b je c t fo r ca lib ra tion
T y p e o f se co n d a ry
Io n iza t io n ch a m b e r
standard
7 -ray so u rce
T y p e o f ra d ia tion used in ca lib ra tio n
U n ce rta in ty 3
P hysic ist G ro u p o f Japan R a d io lo g y S o c ie ty ( in N IRS*3)
D ose m eter fo r th era p y use ( in c lu d e fo r h igh- e n erg y p h o to n & e le c t ro n )
0.6 c m 3 th im b le , p la stic w all
using C ^ o r C E values fo r h igh -en ergy p h o to n s & e le c tro n s
^ C o , 3 0 0 0 Ci 7 -ray so u rce
± ( 7 % —8% ) [± 5 % ]
J ap an R a d io is o to p e A s so c ia t io n
E x p o su re rate at 1 m fr o m 7 -ray so u rce
1 5 0 0 c m 3 & 5 0 0 c m 3 sp h erica l, p la stic wall
1 m g Ra 60C o , i 0 0 m Ci 7 -ray so u rce s
± ( 7 % — 1 1% ) [ ± ( 5 % - 6 % ) ]
A c t iv ity o f ra d io a ctiv e m aterial
R a d io a c t iv e so lu t io n & v ar iou s k in d s o f d e p o s ite d sou rces
d e p e n d o n th e c o n d it io n s
Jap an S a fe tyA p p lia n ceA s so c ia t io n
Standard irra d ia tion f o r fi lm bad ge
9 .5 c m 3 & 5 8 c m 3 cy lin d r ica l, p la stic w all
60C o , 2 Ci 7 -ray so u rce
M ed iu m -e n e rg y X -ra y g e n e ra to r
± ( 7 % — 1 3% ) [ ± ( 5 % - 6% )]
Japan M a ch in e ry & M etals In sp e ctio n In stitu te
S u rv ey m eter fo r s o ft X -rays
6 0 c m 3 & 3 0 0 c m 3 cy lin d r ica l, p la stic w all w ith th in end w in d o w
S o ft X -ra y & m e d iu m -e n e rg y X -ra y g en era tors
± ( 1 2 % - 1 7 % ) [± ( 5 % —7 % )]
P o n y A t o m ic In d u s try C o.
Standard irra d ia tion fo r fi lm b ad ge , su rvey m eter
V ic to re e n R -m e te r2 5 , 2 5 0 m R p ro b e s , 10, 25 R p ro b e s
60C o , 5 0 m C i & 10 Ci 7 -ray so u rce s (in K y o t o U n iversity )
± ( 7 % - 8 % )
[± 5% ]
3 U n certa in ties sh o w n in squ are b ra ck ets are the in*quadrature a d d it io n s o f th e c o m p o n e n t u n certa in ties , k N a tion a l In stitu te o f R a d io lo g ic a l S cie n ce s , C hiba .
L /lLT)
IAE
A-S
M-2
22
/26
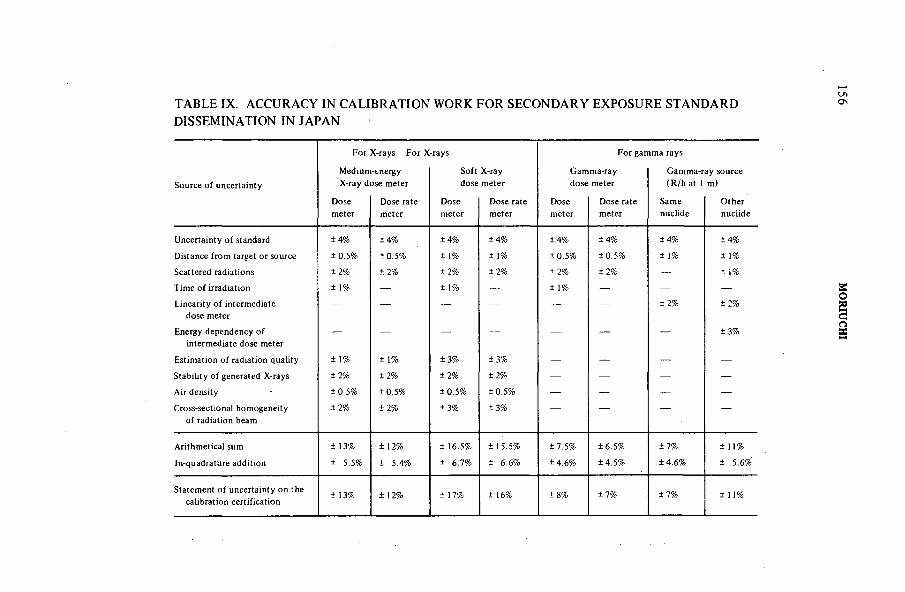
TABLE IX. ACCURACY IN CALIBRATION WORK FOR SECONDARY EXPOSURE STANDARD DISSEMINATION IN JAPAN
илC\
F o r X -ra ys F o r X -rays F o r g am m a rays
M ed iu m -en erg y S o ft X -ra y G am m a -ray G a m m a -ra y so u rce
S o u rc e o f u n ce rta in ty X -ra y d o s e m eter d o s e m e te r d o s e m eter ( R /h at 1 m )
D ose D o se rate D ose D o se rate D o se D o se rate Sam e O th e rm eter m eter m eter m eter m e te r m eter n u c lid e n u c lid e
U n ce rta in ty o f standard ± 4 % ± 4 % ± 4 % ± 4 % ± 4 % ± 4 % ± 4 % ± 4 %
D ista n ce fr o m target o r so u rce ± 0 .5 % ± 0 .5 % ± 1% ± 1% ± 0 .5 % ± 0 .5 % ± 1% ± 1%
S ca ttered rad ia tion s ± 2% ± 2% ± 2% ± 2% ± 2% ± 2% — ± 1%
T im e o f irra d iation ± 1% — ± 1% — ± 1% — — —
L in ea rity o f in term ed ia te — — — — — — ± 2% ± 2%d o s e m eter
E nergy d e p e n d e n c y o f — — — — — — — ± 3 %in term ed ia te d o s e m eter
E stim ation o f ra d ia tion q u a lity ± 1% ± 1% ± 3 % ± 3 % — — — —
S ta b ility o f g en era ted X -ra ys ± 2% ± 2%
C-i+1 ± 2% — — — —
A ir d e n s ity ± 0 .5 % ± 0 .5 % ± 0 .5 % ± 0 .5 % — — — —
C ross-section a l h o m o g e n e ity ± 2% ± 2% ± 3 % ± 3 % — — — —
o f ra d ia tion b eam
A r ith m e tica l sum ± 13% ± 12% ± 1 6 .5 % ± 1 5 .5 % ± 7 .5 % ± 6 .5 % ± 7 % ± 11%
In*quadrature a d d it io n ± 5 .5 % ± 5 .4 % ± 6 .7 % ± 6 .6% ± 4 .6 % ± 4 .5 % ± 4 .6 % ± 5 .6 %
S ta tem en t o f u n ce rta in ty o n the ca lib ra tio n ce r t ifica t io n
± 13% ± 12% ± 1 7 % ± 16%
00+1
;Г-
! +l ± 7 % ± 11%
MO
RIUCH
I
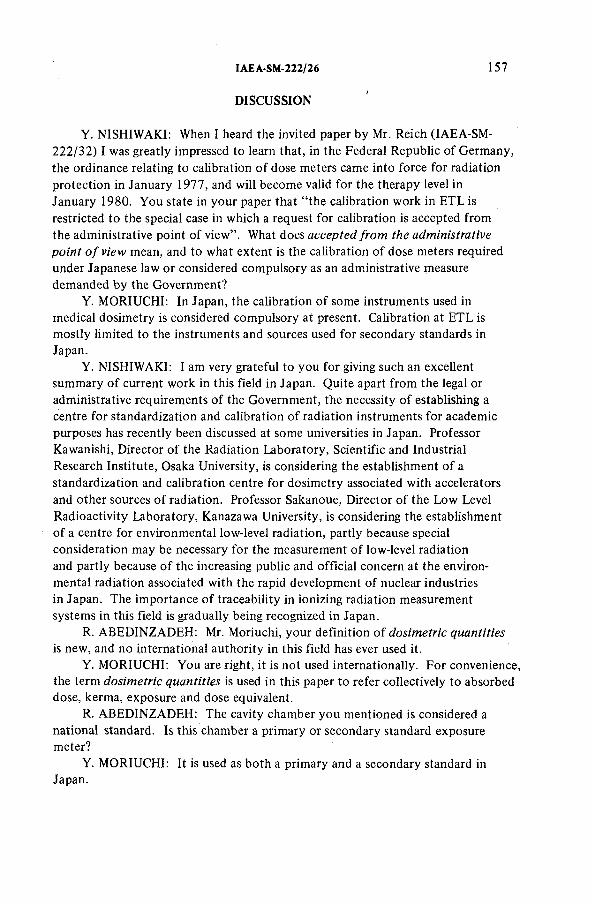
IAEA-SM-222/26 157
DISCUSSION
Y. NISHIWAKI: When I heard the invited paper by Mr. Reich (IAEA-SM- 222/32) I was greatly impressed to learn that, in the Federal Republic o f Germany, the ordinance relating to calibration o f dose meters came into force for radiation protection in January 1977, and will become valid for the therapy level in January 1980. You state in your paper that “ the calibration work in ETL is restricted to the special case in which a request for calibration is accepted from the administrative point o f view” . What does accepted from the administrative point o f view mean, and to what extent is the calibration o f dose meters required under Japanese law or considered compulsory as an administrative measure demanded by the Government?
Y. MORIUCHI: In Japan, the calibration o f some instruments used in medical dosimetry is considered compulsory at present. Calibration at ETL is mostly limited to the instruments and sources used for secondary standards in Japan.
Y. NISHIWAKI: I am very grateful to you for giving such an excellent summary o f current work in this field in Japan. Quite apart from the legal or administrative requirements o f the Government, the necessity o f establishing a centre for standardization and calibration o f radiation instruments for academic purposes has recently been discussed at some universities in Japan. Professor Kawanishi, Director o f the Radiation Laboratory, Scientific and Industrial Research Institute, Osaka University, is considering the establishment o f a standardization and calibration centre for dosimetry associated with accelerators and other sources o f radiation. Professor Sakanoue, Director o f the Low Level Radioactivity Laboratory, Kanazawa University, is considering the establishment o f a centre for environmental low-level radiation, partly because special consideration may be necessary for the measurement o f low-level radiation and partly because o f the increasing public and official concern at the environmental radiation associated with the rapid development o f nuclear industries in Japan. The importance o f traceability in ionizing radiation measurement systems in this field is gradually being recognized in Japan.
R. ABEDINZADEH: Mr. Moriuchi, your definition o f dosimetric quantities is new, and no international authority in this field has ever used it.
Y. MORIUCHI: You are right, it is not used internationally. For convenience, the term dosimetric quantities is used in this paper to refer collectively to absorbed dose, kerma, exposure and dose equivalent.
R. ABEDINZADEH: The cavity chamber you mentioned is considered a national standard. Is this chamber a primary or secondary standard exposure meter?
Y. MORIUCHI: It is used as both a primary and a secondary standard in Japan.
158 MORIUCHI
R. ABEDINZADEH: You mentioned a primary standards comparison for absorbed dose in a water phantom involving a cavity chamber, which was carried out in co-operation with the IAEA dosimetry laboratory. This must be a secondary standards comparison, since the IAEA does not maintain a primary standard for measurement o f absorbed dose in a water phantom, and nor does ETL.
Y. MORIUCHI: You are right. For absorbed dose measurement, the cavity chamber cannot be considered a primary standard.
R. LOEVINGER: It is interesting to note that ETL has standards for a photon field quantity, namely photon energy fluence rate. Who uses these fluence- rate standards, and for what purpose?
Y. MORIUCHI: In Japan, the calibration o f photon energy fluence rate is sometimes (though not frequently) needed by physicists who are using charged- particle accelerators, and who want to know the output o f such machines.
M.A.F. AYAD: What type o f nuclear reaction did you use for neutron flux measurements and calibration?
Y. MORIUCHI: Depending on the neutron energy, BF3 counters, ^ e proportional counters, fission chambers, or n-p or n-a reactions were used.
M.A.F. AYAD: How did you measure mixed radiation fields containing neutrons and gamma-rays? Most neutron sources produce gamma flux as well as neutrons. How did you calibrate the mixed field?
Y. MORIUCHI: Gamma contributions can be determined by a discrimination circuit. Mr.Nishiwaki will explain this to you in detail.
Y. NISHIWAKI: For neutron monitoring in a mixed radiation field with gamma-rays, I think the etch-track detectors are most convenient. This system is based on the principle that heavy ionizing particles produce structural damage along their paths in solids or insulator materials, such as mica, glass and plastics.The surface damage (tracks, pits or holes) can be seen under the ordinary optical microscope after etching the surface o f the detector with suitable chemicals, such as HF, NaOH or KOH. If the detector is placed in contact with a fissionable material such as uranium, the number o f fission-fragment tracks is proportional to the neutron fluence. In the case o f certain plastics, such as polycarbonate, the plastic sheet may be exposed directly to fast neutrons and the recoil tracks on the sheet can be seen under the microscope after etching the surface with NaOH. After proper calibration, the number o f etched tracks per unit area can be used to estimate the neutron fluence or dose. This method is insensitive to gamma-rays and there are no disturbing environmental effects such as fading or fogging at normal temperature. Methods o f automatic counting o f the etched tracks or holes have also been developed.
IAEA-SM-222/58
MEDICAL DOSIMETRY STANDARDS PROGRAMME OF THE NATIONAL BUREAU OF STANDARDS
R. LOEVINGERCenter for Radiation Research,National Bureau o f Standards,Washington, DC,United States o f America
Abstract
M E D IC A L D O S IM E T R Y S T A N D A R D S P R O G R A M M E O F TH E N A T IO N A L
B U R E A U O F S T A N D A R D S .
In the fie ld o f radiation d o sim etry fo r m edicine and radiation p ro te ctio n , th e N ation al
Bureau o f Standards has the resp o n sib ility to establish, v er ify , m aintain and m ake available
su itable m easurem ent standards, and to carry o u t studies to assure th at d o sim etry m easurem ents
m ade in the U nited S tates o f A m erica are in ad eq u ate agreem ent w ith N BS standards. Th e
p h ysica l q u an tities involved are exp o su re and absorbed d ose, and the m easurem ent standards
are free-air cham bers, graph ite ca vity cham bers, ca lorim eters, e x trap o latio n cham bers, and
radium standards. Th ese N B S standards have been verified a fte r co n stru ctio n , and p erio d ica lly
since th at tim e, b y com parison w ith each oth er, and w ith o th er n ation al and in tern ation al
standards. C a lib ratio n services based on the N B S standards are o ffered fo r X -ray and gam m a-
ray m easuring in strum en ts, b eta-p article and gam m a-ray b ra ch y th e rap y sources, and X -ray
p en etram eters; irrad iation o f passive dose m eters is o ffered in p h o to n beam s w ith m axim um
energies fro m 10 k e V to 1 M eV . E xposure-m easuring and absorbed-dose-m easuring instrum ents
are su b jected to a varie ty o f p re-calibration tests. C a lib ratio n data are handled b y an au to m atic
data acq u isitio n system and are p rocessed b y co m p u ter. M easurem ent assurance studies have
been carried o u t fo r cobalt-60 te le th era p y sources and fo r h igh-energy e lectro n beam s b y
m eans o f passive dose m eters irradiated b y the m ed ical user and evaluated at N B S; m easurem ent
assurance studies are b ein g m ade to test the ca lib ratio n o f a lim ited num ber o f m ed ical beam s
b y tak in g the N B S p o rta b le ca lorim eter d ire ctly to th e m ed ical beam and com parin g the
ca lo rim eter m easurem ent w ith a co n ven tio n al ca lib ratio n . T race a b ility to N B S standards
o f th e ca lib ratio n o f in stru m en ts used in m ed icin e and radiation p r o te ctio n is established in
p art b y th ree R egion al C a lib ratio n L ab o rato ries accred ited b y th e A m erican A sso ciatio n
o f P h ysicists in M edicine, in part b y d irect ca lib ration o f fie ld in strum en ts at N B S , and
in part b y in fo rm al ca lib ratio n p roced u res a b o u t w h ich litt le in fo rm atio n is available.
1 . INTRODUCTION
It is the resp o n sib ility of the Dosimetry Section of the National Bureau of Standards (NBS) to esta b lish , maintain, and make available dosimetry measurement standards for the United States, and to perform appropriate measurement assurance studies as needed. E stablishm ent of standards refers to the design, construction, and v er ific a tio n of measurement standards of a quality adequate to serve as primary national standards. V erifica tio n of these standards involves appropriate theoretical and experimental t e s ts , and then comparison with comparable primary standards
159
160 LOEVINGER
of other national and also international lab oratories. Maintenance of standards refers to periodic tests of their constancy and r e l ia b i l i t y , both by means of internal te sts and by occasional comparison with other primary standards. Standards are made a v a ila b le by calib ration of su itable instruments and sources, as needed to meet the needs of the U .S ., and also by bringing the resources of NBS to bear on measurement problems that are of current importance. Measurement assurance refers to the performance of te sts to assure that our constituents are actually performing measurements that are consistent with the national measurement standards to the accuracy needed.
2. DOSIMETRY QUANTITIES AND THEIR MEASUREMENT STANDARDS
2 .1 Free-air chambers (exposure)
Exposure is a point quantity, defined for a photon beam in terms of the expectation value of the quotient of the to ta l charge liberated in free a ir by electrons liberated in a small volume of a ir , and the mass of the small volume I I ] . As is w ell known, the fr e e -a ir chamber measures the charge liberated in air in a direction perpendicular to the photon beam, in accordance with the defin ition of exposure. In a direction p a ra lle l to the photon beam the fr e e -a ir chamber depends on electron compensation to achieve the appropriate charge measurement. The close relationship between the fr e e -a ir chamber and the quantity exposure is not accidental — the la tte r has been carefu lly defined to describe what the former measures. The design and construction of fr e e -a ir chambers has been the subject of an NBS handbook [2 ] .
There are three fr e e -a ir chambers at NBS, covering the x-ray generating poten tials 10 to 60 kV, 20 to 100 kV, and 60 to 250 kV. (These are conveniently referred to as 60-kV, 100-kV, and 250-kV chambers.) The 250-kV chamber was constructed in 1953 by H. 0 . Wyckoff, F. H. A ttix , and L. DeLaVergne. I t was taken to the National Physical Laboratory (NPL) in the U .K ., and comparison with the NPL primary standard chamber showed differences of a few percent [3 ] . Subsequent studies by Wyckoff and A ttix 12], and V. H. Ritz [4] refined the use of the chamber, a fter which comparison in Washington with a new B ritish standard showed agreement to about 0.5%. In 1959 a direct comparison was made in Washington with the newly constructed Canadian standard, from the National Research Council (NRC). Again the instruments agreed to within about 0.5% [5 ] .
Construction and testing of the 100-kV chamber was completed in 1959 by Ritz [4 ] . This chamber has not been compared d irectly with standards from other national laborabories, but comparisons have been made with the other NBS fr e e -a ir chambers, as indicated in Table I .
The 60-kV chamber was constructed in 1963 by P. J . Lamperti following in vestigation of the necessary parameters by Lamperti and Wyckoff [6 ] . In 1963 the chamber was taken to the BIPM at Sevres and compared there with a sim ilar chamber of the BIPM, and one of the NRC [7 ] . Once again, the resu lts agreed to within about 0.5%.
The three NBS fr e e -a ir chambers have been intercompared among themselves a number o f times. It is our present plan to carry out this in tercomparison p e rio d ica lly , about every second year. In Table I are shown the resu lts of the recent comparisons, and also the one ea rlier comparison in which a l l three were intercompared at about the same time. The s ta b ility of the fr e e -a ir chambers is very sa tis fa c to ry . The values given in Table I
IAEA-SM-222/S8
TABLE I. COMPARISON OF NBS FREE-AIR CHAMBERS
161
Date of Free-air chambercomparison 10 to 60 kV 20 to 100 kV 60 to 250 kV
1962 0.11 - 0.24 0.131975 March 0.05 - 0.35 0.281976 Nov. 0.05 - 0.32 0.28
The table gives the difference of the response of each chamberfrom the response of a ll the chambers, expressed in percent.
must not, however, be taken as representing accurately the re la tiv e responses of the chambers, since these are to a lim ited extent a function of the energy of the x-ray beam.
Indirect comparisons of the NBS fr e e -a ir chambers with other national standards have been made on several occasions at the BIPM by means of transfer standards. Once again the NBS standards agreed within about 0.5% with the BIPM standards and with the mean of the other national standards. The spread of the national standards was such however that an occasional d if fe r ence nearly as large as 1% has been observed from another national standard.
2 .2 Graphite cavity chambers (exposure)
For calib ration at m edical-level exposure r a te s , the fr e e -a ir chamber a t atmospheric pressure is lim ited to photon energies le ss than about 300 keV. This lim itation a rises mainly from the fa ct that with increasing photon energy the maximum secondary electron range increases, reaching a value of nearly 5 meters for the photons of co b a lt-6 0 . Since an atmospheric-pressure fr e e -a ir chamber for such photons would be far too large, high-pressure fr e e -a ir chambers are used at several national lab oratories, and were studied at NBS [8 ] . I t is now generally believed that a better solution is the use of graphite cavity ionization chambers as standards of exposure for the gamma rays of cesium-137 (0 .66 MeV) and cob alt-60 (1 .2 MeV). Cavity chambers which serve as primary measurement standards are not calibrated , instead their response is calculated from the measured volume of the chamber and the properties of the wall m aterial. Such cavity-chamber standards do not of course rea lize the unit of exposure according to i t s d e fin itio n — they more nearly rea lize the unit of absorbed dose — nevertheless they are used to determine the unit of the quantity exposure.
The graphite cavity chambers which provide the NBS standard of exposure for gamma radiation are a set of six spherical chambers with active volumes from 1 cm3 to 50 cm3 [9 ] . Several of these chambers were constructed by H. 0 . Wyckoff and h is colleagues during 1958 and 1963, and the remainder were constructed by T. P. Loftus during 1970-71, using the Wyckoff design. A ll the chambers are made of high-purity graphite, including the central electrode. The NBS exposure standard is the mean response of the six chambers.
Intercomparison of the chambers in the NBS cob alt-60 beam showed agreement within 0.1%, except for the 1-cm3 chamber, which showed a response about 0.3% d iffe re n t from the mean response. The 1-cm3 chamber
1 6 2 LOEVINGER
was taken to Paris for comparison with the BIPM standard chamber [1 0], which has i t s e l f been compared with a number of other national standard chambers. In general the agreement between the national standard graphite cavity chambers is about the same as for fr e e -a ir chambers — for the most part they agree within about 0.5%, but there are occasional differences between national standards as large as 0.7%. The NBS cavity chambers have not been compared with other national standards since the in i t ia l comparison, but occasional internal comparison between the chambers gives assurance that the NBS gamma-ray standard has not changed. An uncertainty of 0.7% is assigned to the exposure rate in the cobalt-60 beam, as determined by the graphite cavity ionization chambers [9 ] .
At photon energies above a few m illion electron v o lts , i t becomes d if f ic u lt to make satisfa cto ry standards of exposure, due to the increase in the range of the secondary electrons re la tiv e to the mean free path of the photons. In a wall thickness adequate to provide secondary electron equilibrium, the attenuation of the photon beam would be so great that appropriate wall corrections would be uncertain. Thus at NBS we make no attempt to establish standards for the quantity exposure for photon beams with energies higher than the gamma rays of cob a lt-60 . We turn instead toanother quantity and another measurement standard.
2 .3 Graphite calorimeters (absorbed dose)
Absorbed dose is a lso a point quantity, defined for a photon or part ic le beam in terms of the mean energy imparted per unit mass at the point of interest in some stated material [1 ] . Energy imparted to matter resu lts in a r ise in temperature, and the natural primary standard for rea lizationof the unit of absorbed dose in terms of i t s d efin itio n is then a calo rim eter. For a number of reasons, high-purity graphite is the preferred m aterial, and NBS has two graphite absorbed-dose calorim eters. The f i r s t was designed and constructed by S. R. Domen starting in 1968, and is in a 40x40x30-cm cube of graphite; i t is permanently located in one of the experimental areas of the NBS 100-MeV linear accelerator. The other calorim eter, designed and constructed by Domen a few years la te r , is in a 15-cm diameter by 10-cm deep graphite cylinder [1 1 ] ; i t is the "p ortab le " calorimeter which has been used for a l l NBS calorimeter measurements except those made on the NBS lin a c. These two calorimeters make use of a unique "h e a t -lo s s - compensation" principle discovered by Domen, which provides a method of measuring nearly a l l the heat lo st from the central core to i t s surrounding jacket at the time of calibration [1 2 ].
Interpretation of the response of a calorimeter is in principle simpler than interpretation of the response of a cavity ionization chamber. On the other hand, the calorimeter is considerably more d e licate and complex to build than is a cavity chamber. A comparison of their se n s it iv it ie s is in stru ctive : an absorbed dose of 3 Gy (300 rad) produces a temperature r iseof about 4 mK (4x10 3 °C) in graphite; an exposure of the same magnitude,75 mC/kg (300 R) lib erates in air about 100 nC of charge in an ionization chamber with a volume of 1 cm3. Thus i f we desire to measure th is magnitude of radiation with a precision of 0.1%, we must in e ffe c t be able to detect differen ces of 4 jiK (4x10 ® °C) for the calorim eter, and about 100 pC for the ionization chamber. Those with experimental experience w ill recognize that such a charge measurement is not too d i f f ic u lt , but such a temperature measurement requires complex, sen sitiv e , and expensive equipment, as well as unusual s k i l l , experience, and patience. To repeat: a calorimeter issimpler in p rin cip le , but considerably more complicated in practice than an ionization chamber. The la tte r is of course ju st the reason that the ionization chamber is used for routine dosimetry, while the calorimeter is not.
IAEA-SM-222/58 163
The two NBS calorimeters were intercompared in 20-MeV and 50-MeV electron beams of the NBS lin a c , and were found to agree to within 0 .1 -0 . 2% [1 3 ]. In 1975 the portable calorimeter was taken to the French standards laboratory (LMRI) at Saclay, for comparison with the French standard in a cob alt-60 beam, and the two agreed within 0.3%, which may be in part fo rtu itou s, since the random uncertainty was also 0.3% (m .e .)[1 4 ] . Early in 1977 the portable calorimeter was taken to Sèvres for comparison with the BIPM ionometric absorbed-dose standard, and subsequently the LMRI and the PTB (Cerman) calorimeters were taken to the BIPM for measurement under sim ilar circumstances. The resu lts await fin a l analysis at the time of writing.
The NBS portable calorimeter has been compared with ionometric standards of absorbed dose in graphite phantoms, both at NBS and at BIPM, and the two methods agreed to about 0.3%, which is well within the uncertaint ie s associated with the physical constants necessary for the comparison, namely tjje stopping-power ratio and the mean energy expended in air per unit charge (W /e).
The large NBS calorimeter has been used to study stopping-power ratios in the electron beam of the NBS lin a c , for energies from 15 to 50-MeV [1 5 ,1 6 ] . While these studies help to provide a secure physical basis for high-energy dosimetry, there is no calibration service at these energies at NBS at th is time.
2 .4 Extrapolation chamber (absorbed dose)
NBS is sometimes called on to provide calibration of sealed sources of beta p a rtic le s with energies of a few m illion electron v o lt s . I t is necessary in th is case to provide a standard in terms of absorbed dose, since the quantity exposure does not apply to charged-particle beams. Since the absorbed-dose calorimeter is not su itable — the b eta -p a rtic le range is too short, and the dose gradient too steep — i t is necessary to use a su itable ionization chamber as the MBS primary standard. The most v e rsa tile ionization chamber for th is purpose is an extrapolation chamber, which is a plan e-parallel ionization chamber in which the a ir gap between the c o lle c ting electrode and the polarizing electrode can be varied. The chamber now in use at NBS is a m odification by J. S. Pruitt of an instrument described some years ago [1 7 ]. The air gap of th is chamber can be varied from about 0 .05 mm to 20 mm. The co llectin g electrode can readily be changed, and a number of such electrodes are on hand, made of various low-atomic number m aterials, with co llectin g areas that vary from about 1 mm to 30 mm in diameter. C alibrations performed with the extrapolation chamber are reported in terms of absorbed dose by interpreting the ionization current by means of the well-known Bragg-Gray equation, using convention al values for the mean energy expended per unit charge, and for the stopping-power r a tio s . The HBS extrapolation chamber has not as yet been checked against any other standard instrument.
2 .5 Honigschmid standards (mass of radium)
NBS has two primary radium standards. They were prepared by Prof.0 . HSnigschmid in 1934, in the form of a weighed amount of a radium sa lt sealed in g lass [1 8 ] . They were compared with other primary HSnigschmid standards in Paris and Vienna in 1936. A number of platinum-iridium sources were calibrated against the NBS HSnigschmid standards to serve as working standards (radium sealed in g lass is not a happy thing to work w ith ). Intercomparison in 1955-57 with the B ritish , Canadian, and German standards showed a l l these preparations to be se lf-c o n siste n t within the weighing errors stated by HSnigschmid, about 0.1% [1 9 ].
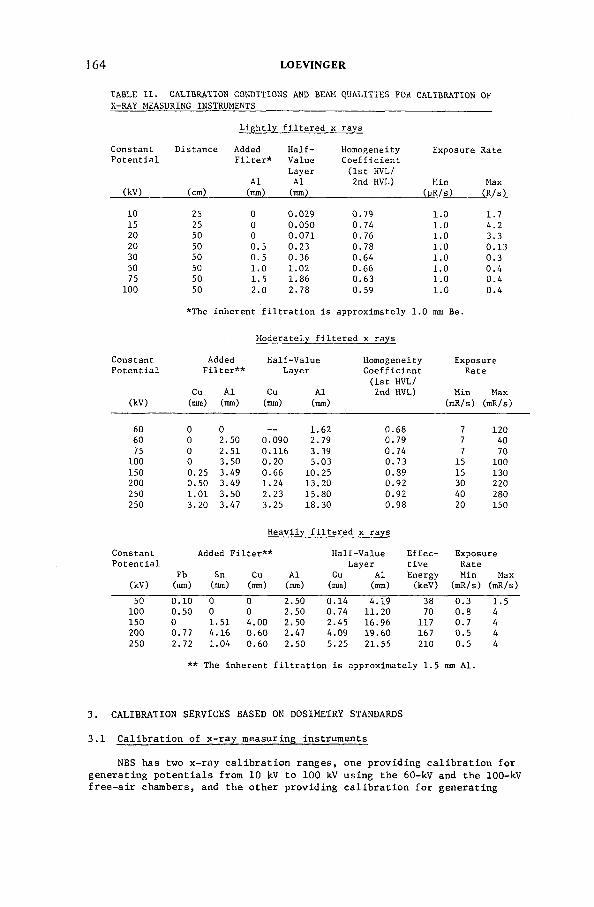
164 LOEVINGER
TABLE I I . C A L IBRA TIO N CO N D ITIO N S AND BEAM Q U A L IT IE S FOR CALIBRA TIO N OF X -R A Y MEASURING INSTRUMENTS _______________
L i g h t l y f i l t e r e d x r a y s
C o n s t a n t D i s t a n c e A d d e d H a l f - H o m o g e n e i t y E x p o s u r e R a t eP o t e n t i a l F i l t e r * V a lu e C o e f f i c i e n t
L a y e r ( 1 s t H V L/A l A l 2 n d HVL) M in M ax
(k V ) (c m ) (nun) (mm) ( p R / s ) ( R / s )
10 25 0 0 .0 2 9 0 . 7 9 1.0 1 . 71 5 2 5 0 0 . 0 5 0 0 . 7 4 1.0 4 . 220 5 0 0 0 . 0 7 1 0 . 7 6 1.0 3 . 320 5 0 0 . 5 0 . 2 3 0 . 7 8 1.0 0 . 1 33 0 5 0 0 . 5 0 . 3 6 0 . 6 4 1.0 0 . 35 0 50 1.0 1 .0 2 0.66 1.0 0 . 475 5 0 1 . 5 1 .8 6 0 . 6 3 1.0 0 . 4
100 5 0 2 . 0 2 . 7 8 0 .5 9 1.0 0 . 4
* T h e i n h e r e n t f i l t r a t i o n i s a p p r o x i m a t e l y 1 . 0 mm B e .
M o d e r a t e l y f i l t e r e d x r a y s
C o n s t a n t A d d e d H a l f - V a l u e H o m o g e n e i t y E x p o s u r eP o t e n t i a l F i l t e r * * L a y e r C o e f f i c i e n t R a t e
( 1 s t H V L /Cu A l C u A l 2 n d HVL) M in M ax
(k V ) (mm) (mm) (mm) (mm) (m R /s ) ( m R /s )
6 0 0 0 — 1 . 6 2 0.68 7 1206 0 0 2 . 5 0 0 . 0 9 0 2 .7 9 0 . 7 9 7 4 075 0 2 . 5 1 0 . 1 1 6 3 .3 9 0 . 7 4 7 7 0
100 0 3 . 5 0 0 . 2 0 5 . 0 3 0 . 7 3 15 1001 5 0 0 .2 5 3 . 4 9 0 . 6 6 1 0 . 2 5 0 . 8 9 15 1 3 0200 0 . 5 0 3 . 4 9 1 . 2 4 1 3 . 2 0 0 . 9 2 30 2202 5 0 1.01 3 . 5 0 2 . 2 3 1 5 . 3 0 0 . 9 2 40 2 8 02 5 0 3 . 2 0 3 . 4 7 3 . 2 5 1 8 . 3 0 0 . 9 8 20 1 5 0
H e a v i l y f i l t e r e d x r a y s
C o n s t a n t A d d e d F i l t e r * * H a l f - V a l u e E f f e c - E x p o s u r eP o t e n t i a l L a y e r t i v e R a t e
P b S n Cu A l iCu A l E n e r g y M in M ax(k V ) (mm) (mm) (mm) (mm) (mm) (mm) (k e V ) (m R /s ) ( m R /s )
5 0 0.10 0 0 2 .5 0 0 . 1 4 4 . 1 9 3 8 0 . 3 1 . 5100 0 . 5 0 0 0 2 .5 0 0 . 7 4 11.20 70 0.8 41 5 0 0 1 .5 1 4 . 0 0 2 .5 0 2 .4 5 1 6 . 9 6 1 1 7 0 . 7 4200 0 . 7 7 4 . 1 6 0 . 6 0 2 .4 7 4 .0 9 1 9 . 6 0 1 6 7 0 . 5 42 5 0 2 .7 2 1 .0 4 0 . 6 0 2 .5 0 5 . 2 5 2 1 . 5 5 210 0 . 5 4
* * T h e i n h e r e n t f i l t r a t i o n i s a p p r o x i m a t e l y ' 1 . 5 mm A l .
3. CALIBRATION SERVICES BASED ON DOSIMETRY STANDARDS
3 .1 Calibration of x -ray measuring instruments
NBS has two x-ray calibration ranges, one providing calibration for generating potentia ls from 10 kV to 100 kV using the 60-kV and the 100-kV fr e e -a ir chambers, and the other providing calibration for generating
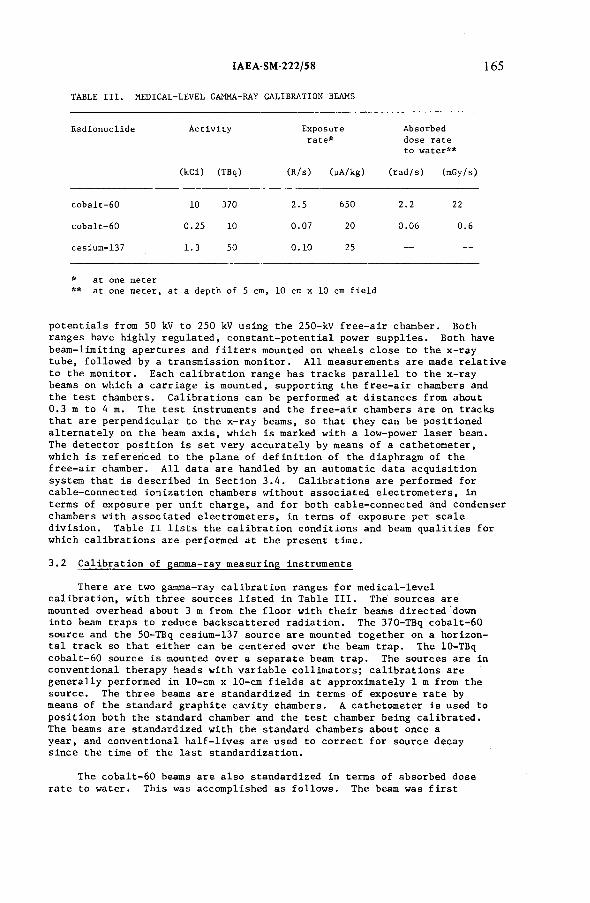
IAEA-SM-222/58
TABLE III. MEDICAL-LEVEL GAMMA-RAY CALIBRATION BEAMS
165
R a d i o n u c l i d e A c t i v i t y E x p o s u r er a t e *
A b s o r b e d d o s e r a t e t o w a t e r * *
( k C i ) (T B q ) ( R / s ) ( p A / k g ) ( r a d / s ) (m G y /s )
c o b a l t - 6 0 10 3 7 0 2 . 5 6 5 0 2.2 22
c o b a l t - 6 0 0 . 2 5 10 0 . 0 7 20 0 . 0 6 0.6
c e s i u m - 1 3 7 1 . 3 5 0 0 . 1 0 25 — —
* a t o n e m e t e r * * a t o n e m e t e r , a t a d e p t h o f 5 cm , 10 cm x 10 cm f i e l d
p oten tials from 50 kV to 250 kV using the 250-kV fr e e -a ir chamber. Both ranges have highly regulated, constant-potential power supplies. Both have beam-limiting apertures and f i l t e r s mounted on wheels c lo se to the x-ray tube, followed by a transmission monitor. A ll measurements are made re la tiv e to the monitor. Each calib ration range has tracks p a ra lle l to the x-ray beams on which a carriage is mounted, supporting the fr e e -a ir chambers and the test chambers. C alibrations can be performed at distances from ahout 0 .3 m to 4 m. The test instruments and the fr e e -a ir chambers are on tracks that are perpendicular to the x-ray beams, so that they can be positioned altern ately on the beam a x is , which is marked with a low-power laser bean.The detector position is set very accurately by means of a cathetometer, which is referenced to the plane of d e fin itio n of the diaphragm of the fr e e -a ir chamber. A ll data are handled by an automatic data acquisition system that is described in Section 3 .4 . Calibrations are performed for cable-connected ionization chambers without associated electrom eters, in terms of exposure per unit charge, and for both cable-connected and condenser chambers with associated electrom eters, in terms of exposure per scale d iv isio n . Table II l i s t s the calibration conditions and beam q u alities for which calibration s are performed at the present time.
3 .2 Calibration of gamma-ray measuring instruments
There are two gamma-ray calibration ranges for m edical-level calib ration , with three sources lis te d in Table I I I . The sources are mounted overhead about 3 m from the flo o r with their beams directed down into beam traps to reduce backscattered radiation . The 370-TBq cobalt-60 source and the 50-TBq cesium-137 source are mounted together on a horizonta l track so that either can be centered over the beam trap. The 10-TBq cobalt-60 source is mounted over a separate beam trap. The sources are in conventional therapy heads with variable collim ators; calibration s are generally performed in 10-cm x 10-cm fie ld s at approximately 1 m from the source. The three beams are standardized in terms of exposure rate by means of the standard graphite cavity chambers. A cathetometer is used to position both the standard chamber and the test chamber being calibrated .The beams are standardized with the standard chambers about once a year, and conventional h a lf - l iv e s are used to correct for source decay since the time of the la s t standardization.
The cob alt-60 beams are a lso standardized in terms of absorbed dose rate to water. This was accomplished as fo llow s. The beam was f i r s t
LOEVINGER
standardized in terms of absorbed dose rate to graphite using the portable graphite calorim eter. A sp e c ia lly -b u ilt graphite transfer chamber [20] was then calibrated in a graphite phantom in terms of absorbed dose to graphite in graphite. The graphite phantom was replaced with a water phantom, and the same chamber then gave absorbed dose rate to graphite in water. Application of the mean energy-absorption c o e ffic ie n t ratio then gave the beam standardization in terms of absorbed dose rate to water.
C alibrations in a water phantom are performed at 1 m from the source, at the center of a 10-cm x 10-cm f ie ld . The ionization chamber to be calibrated is inserted in a horizontal p la stic tube the center lin e of which is 5 çm below the water surface. Any good-quality ionization chamber can be calibrated i f i t s outside diameter is le ss than 25 mm, and i f i ts silh ouette is such that i t can be inserted into the p la stic tube without excessive air gaps. The water phantom is mounted on a cantilevered platform so that i t can readily be moved out of the way when the beam is used for other purposes.
It has been our experience so far that, for a given model chamber, the ratio of the absorbed-dose calibration to the exposure calib ration is a constant, as accurately as we can measure. I t is very lik e ly th at, after we have v erified th is constancy with further measurements, i t w ill be unnecessary to perform both in -a ir and in-phantom calib ration s, since either one alone w ill give the necessary information.
In standardizing the cob alt-60 beam, measurements were made in graphite using the calorimeter and several ionization chambers. The chamber ca lib ra tion factors were independent of depth, to the accuracy of the measurements, from about 1 to 9 g/cm2 . With the p lan e-parallel chamber, using a stopping- power ra_tio of 1 .0068 , we obtained for the mean energy expended per unit charge W/e = 33 .6 + 0 . 2 (m .e .) , in good agreement with the accepted value of 33.7 J/C . These measurements were made on the 10-TBq cob alt-60 source, at a dose rate of about 1 mGy/s; they w ill be reinvestigated using the newly in sta lled 370-TBq source with i t s much higher dose rate .
The overall uncertainty in the calibration of a good-quality cable- connected ionization chamber in the cobalt-60 beam is estimated to be about 0.8% for a calib ration in terms of exposure, traceable to our graphite cavity ionization chambers. The corresponding figure for a calibration in terms of absorbed dose, traceable to the graphite calorim eter, is estimated to be about 1.0%, a figure that we expect to reduce when we have completed standardization of the beam of our new 370-TBq cohalt-60 source.
3 .3 P re-calibration tests of x-ray and gamma-ray measuring instruments
A ll ionization chambers are put through a variety of tests before they are calibrated . These tests are performed in the cable-connected mode using an NBS electrom eter, and condenser chambers are adapted by a special connector for th is purpose. The te sts are performed at a test bench o utfitted with an electrom eter, power supplies, a chart recorder, a small pressure pump with valves and pressure gauge, adaptors for a l l common cable connectors, e tc . Before subjecting the chamber to radiation, the following te sts are performed:
e lec tro sta tic shielding of the central electrode; leakage, central electrode to polarizing electrode; sta b iliza tio n time a fter application of polarizing poten tia l; leakage, central electrode to guard electrode; and leakage, guard electrode to polarizing electrode.
IAEA-SM-222/58 167
The chamber is then placed in a sealed p la stic chamber in a cesium-137 gamma-ray beam where the exposure rate is about 2 R /s . The following te sts are then performed:
sta b iliza tio n time, simultaneous radiation and polarizing poten tia l; saturation test from fu ll-p o te n tia l and h a lf-p o te n tia l currents; and communication to the atmosphere.
Individuals performing such te sts learn to spot a defective chamber very quickly. I f the problem is a minor one, we may choose to remedy i t ourselves a fter consulting with the owner. I f however i t is a serious deficiency that precludes satisfa cto ry c a lib ration , the chamber is returned to the owner. Frequently we radiograph the chamber and stem, i f we suspect some mechanical problem, or i f we are curious about the inner structure of a new chamber. The performance of each ionization chamber at these te sts is recorded on a card which accompanies the chamber to the calib ration range. This serves to a lert the individual performing the calib ration to any aspect of the chamber behavior that needs special attention .
Before these tests were in stitu te d , i t happened on occasion that preparatory work and set-up time would be spent on an instrument that proved to be d efective . I t is a lso possible that some chambers were c a l i brated that would be found unsuitable at th is time. Our motives in establish in g these tests were to avoid these in e ffic ie n t and frustrating oc- currances, to a lert our own personnel to the special ch aracteristics of the instruments we handle, and to inform the owners of the instruments of problems that existed or that they might encounter in their equipment.
3 .4 Automatic data acquisition and processing
X-ray and gamma-ray instrument calib ration reports are processed by computer. Some of the data must of course be entered by hand, but most of the data are recorded by means of an automatic data acquisition system. Analog ( i .e . current) input signals go f i r s t to an analog scanner which transmits them sequentially to the a n a lo g -to -d ig ita l converter ( i . e . d ig ita l voltm eter). These sign a ls , along with d ig ita l input sign a ls , go to a d ig ita l scanner, which transmits them sequentially to a teleprinter that generates a punched-tape record of the data. Data entered by hand are entered d irectly into the te le p rin ter . The data on the punched tape are transferred to magnetic tape and processed on the NBS central computer (Univac 1108). The input data can be categorized as fo llow s:
E ssential d ig ita l input signals Irradiation time Source id e n tifica tio n F ilter id en tifica tio n Chamber station id en tifica tio n Distance (x rays)
Essential analog input signalsVariable collim ator settin g (gamma rays)PressureTemperatureElectrometer feedback poten tia l
168 LOEVINGER
E ssential input data entered by hand Distance (gamma rays)Electrometer feedback capacitance Electrometer reading i f special electrometer
V erifica tio n signalsTube poten tia l (x rays)Tube current (x rays)Beam-limiting aperture (x rays)Monitor, t e s t , fr e e -a ir chamber polarizing potentials + l-v o lt and О-v o lt test on d ig ita l voltmeter
Information about instrument being calibrated , entered by hand OwnerManufacturerName, model, se r ia l numberDate receivedPrevious calibration sOrientation in beamOpen to atmosphere at NBS test?Requested polarizing potential and polarity (+ , - , +)Equilibrium wall inherent or addedVoltage sen sitiv ity (R-meter electrom eters only)
Other information entered by hand F ile id e n tifica tio n number Serial number of NBS electrometer Date and time of day Special notes Person doing calibration
Using these input data, the computer provides four printouts, as fo llow s. Echo of input data with lin e numbers Data reduction and analysis table Calibration summary for NBS records Calibration report for owner of instrument
The lin e numbers are given in the echo of the input data to identify location s for insertion or deletion of data, making i t possible to repeat only part of a calib ration run i f desired. The data reduction and analysis table presents the data in readable form, and gives the resu lts of te sts of the data for reproducibility and for agreement with nominal or expected values; error messages print out i f required data are missing or i f the data spread is outside pre-assigned lim its . The calib ration summary for NBS records gives a l l the important information about the calib ration , some of which is not passed on to the owner of the instrument, since its purpose is only to insure that the calibration has been carried out c o rre c tly .
The calib ration report for the owner con sists of four or more sheets. We try to give a l l information necessary to interpret the calib ration report without ambiguity. We define a l l terms not immediately apparent.We do not make a complete study of each instrument being calibrated , but we state with care what we have and have not done. For example, we state the calibration distance, beam s iz e , and exposure rate for each ionization chamber ca lib ration . I f the owner of the instrument believes that the calib ration factor is dependent on these parameters, he can investigate the dependence for himself and thus u t i l iz e the calib ration factor for other conditions than those for which the instrument was calibrated .
IAEA-SM-222/58 169
3 .5 Irradiation of passive dosimeters
Passive dosimeters are irradiated in terms of exposure in any of the photon beams for which an exposure calibration is offered as a regular service . Such irradiations generally are performed on thermoluminescence dosimeters that are submitted to NBS for irradiation to various exposure le v e ls and at various energies. Irradiation in terms of absorbed dose is also o ffered , but at the present time is lim ited to the cob alt-60 beam and water phantom used for absorbed-dose calib ration .
3 .6 Calibration of gamma-ray brachytherapy sources
Brachytherapy sources of cob alt-60 and cesium-137 are calibrated in terms of exposure rate at one meter in a ir . The method is to calib rate a representative source of each type as a working standard, using open-air geometry and the graphite cavity chambers [2 1 ] . The source to be c a l i brated is then compared to the working standard using a 2 .5 - l i t e r spherical aluminum ionization chamber. The chamber is supported on a track in the radium range. The source to be intercompared, and the working standard, are altern ately placed in a p la stic trough at the same height as the center of the chamber, and at an appropriate distance away, usually about 1 m. The trough can be rotated through 180° to test for possible nonuniform source loading. Radium sources are calibrated in the same manner using a lead- aluminum-walled chamber, except that the working standards have been c a l i brated in terms of mass of radium, as described in Section 2 .5 .
Iridium-192 sources are also calibrated in terms of exposure rate at 1 m in a ir , but the procedures are somewhat d iffe re n t. Iridium-192 seeds are too weak for determination of individual exposure rates using our standard cavity chambers, so i t is necessary to assemble a composite source of adequate strength, in some cases consisting of as many as 50 seeds. The exposure rate of th is composite source is then measured in open-air geometry at 1 m, as for the cobalt-60 and cesium-137 sources. Each iridium-192 seed is then measured individually in a re-entrant ionization chamber designed for th is purpose, and the sum of the individual ionization currents combined with the to ta l exposure rate from the composite source serves to calibrate the re-entrant chamber in terms of exposure rate at 1 m in a ir . Subsequently individual seeds of the same type can be calibrated in the reentrant chamber, as long as one can be confident the chamber retains i ts calib ration . One of the radium working standards is used to 'check the constancy of the re-entrant chamber.
Measurement of radium sources was the f i r s t a ctiv ity in the fie ld of radiation measurement at NBS, starting around 1914. Over the years i t has given way in importance to measurement of x rays, other gamma rays, and p a rtic le beams, u n til now we have fewer c a lls for radium calibration than for any other dosimetry calib ration . We now calib rate perhaps one or two radium sources a year. This is due in part to the long l i f e of radium, since a radium source once calibrated can serve as a r e lia b le lo ca l standard for a very long time. Perhaps equally important is a decline in the use of radium compared to other brachytherapy sources that are believed to be le ss dangerous from the viewpoint of handling and storage. I t is planned to calib rate radium sources in the same manner as other gamma-ray em itters, namely in terms of exposure rate at one meter in a ir .
The overall uncertainty in the calib ration of a gamma-ray source of co b a lt-6 0 , cesium-137, or radium is estimated to be about 0.9%. No e s t i mate has been made of the uncertainty in the calib ration of an iridium-192 source.
170 LOEVINGER
3.7 Calibration of b eta -p a rtic le brachytherapy sources
The b eta -p a rtic le applicators that NBS is called on to calibrate have so far been strontium -yttrium -90 ophthalmic applicators. They are c a l i brated in terms of absorbed dose to water at the applicator surface using an extrapolation ionization chamber with two interchangeable graphite c o llectin g electrodes. The smaller electrode has a diameter of about 1 mm, and is used to scan the applicator surface. I t provides a re la tiv e prof i l e of current per unit mass of a ir across the face of the applicator.The re la tiv e measurements are normalized to true sp ecific current by measurements with the larger co llectin g electrode, that has a diameter of 30 mm, large enough to c o lle c t a l l of the ionization . Specific current is in turn converted to absorbed dose rate using conventional values of the mean energy expended per unit charge in a ir , the mean stopping-power ratio of water to that of a ir , and a correction factor to account for the excess of graphite albedo over that of water.
A ll of the measurements must be made close to the applicator surface, but contact between the applicator and the chamber must be avoided, as i t d isto rts the thin polarizing electrode. This problem is avoided by making measurements at several source distances and several a ir gaps, so that a single extrapolation corrects the measurements to zero source d is tance and zero air gap. There are many problems in these measurements, and we assign an overall uncertainty of 10% to the calib ration factor in terms of dose rate to water at the applicator surface.
3 .8 Calibration of x-ray penetrameters
Penetrameters of the Ardran-Crooks type [22] are special x-ray cassettes that contain a metal step wedge and an op tica l attenuator so arranged th at, a fter exposure to an x-ray beam, the constant potential or the peak potential can be determined by finding on the developed film the p ositions of equal density under the step wedge and under the o p tica l attenuator. The resu lt is independent of development parameters, over a wide range. Penetrameters of th is type can be calibrated at NBS in terms of constant poten tia l up to 250 kV. Penetrameter calibrations performed to date have generally been in the range of 60 to 120 kV. The NBS tube p oten tials are believed known to 1%, based on potential calibration by the NBS High Voltage Measurements Section.
While calib ration of x-ray penetrameters is not based on dosimetry standards, i t is an appropriate calibration service for the Dosimetry Section to o ffe r , since i t is readily performed by our standard x-ray generators with their stable and w ell-calibrated power supplies.
4. MEASUREMENT ASSURANCE STUDIES
"Measurement assurance" is a phrase used at NBS to describe procedures designed to test whether measurements made in the fie ld are in agreement with national measurement standards to the accuracy needed. NBS has carried out two extensive measurement-assurance programs to test the a b ility to deliver a prescribed absorbed dose to water, in both cases using passive dosimeters distributed by common carrier. M. Ehrlich, C. G. Soares, and G. L. Welter have recently made such a survey for cobalt-60 teletherapy beams using thermoluminescence dosimeters, and Ehrlich and P. J. Lamperti have for some years made a biannual survey for high-energy electron-therapy beams using Fricke chemical dosimeters. Since these two programs have been described in d e ta il in another paper in th is Symposium, they need no addition al discussion here.
IAEA-SM-222/58 171
A rather d ifferen t kind of measurement-assurance study is planned using the portable graphite calorim eter. The calorimeter w ill be taken to a lim ited number of medical in stitu tio n s to calibrate the therapy beams directly in terms of absorbed dose. This "primary" calibration w ill then be compared to a calibration performed in the usual manner using a calibrated ionization chamber. We expect that a good-quality ionization chamber, calibrated at NBS in terms of absorbed dose, w ill provide a calibration of a cobalt-60 beam that agrees closely with that of the portable calorim eter. For electron beams, or for photon beams of energy higher than that of cobalt-60 gamma rays, the situ ation is more complex, and is beyond the lim its of this ta lk . We do plan to make such measurements with the calorimeter and with suitable ionization chambers. This program is ju st getting started , the f i r s t measurements outside NBS are now underway, and resu lts must await a future report.
5. DISSEMINATION OF DOSIMETRY UNITS
There ex ists in the United States no o f f ic ia l method for dissemination of the dosimetry units established at NBS. U ntil about 1970, NBS calibrated (against the national standards of exposure) a l l suitable dosimetry instruments submitted to i t , but was otherwise not associated with dissemination a c t iv it ie s . I t became clear that this was inadequate to meet the needs of the country, but there was then and there is now no way in which NBS can c e r t ify , or otherwise authorize dosimetry calibration a c t iv it ie s outside NBS. In 1970 NBS requested the American Association of Physicists in Medicine (AAPM) to organize secondary dosimetry calibration laboratories for m edical-level calib ration . The rationale for th is was that the resp o n sib ility for accrediting the laboratories would be taken by the AAPM, since NBS could not le g a lly do so. The AAPM accepted the resp on sibility and appointed a task group to carry i t out. One representative of NBS is on the task group, but the authority is firm ly held by the AAPM. The task group has written c r ite r ia for requirements that must be met by a Regional Calibration Laboratory (RCL), requires a written application from a prospective RCL, makes a s ite v is i t before accreditation, gives f i r s t a provisional accreditation for six to twelve months, and makes another s ite v is i t before fin a l accreditation. I f at any time there is a major change in personnel or equipment which might impair the quality of the calib ration , the accreditation is dropped to provisional again, and the s ite v is i t s are repeated. (This procedure has in fact been used tw ice.)
The RCLs fu lly accredited by the AAPM are at Memorial Hospital in New York C ity , M.D. Anderson Hospital in Houston, Texas, and at the Victoreen Instrument D ivision in Cleveland, Ohio. Since each is described in a separate paper at th is Symposium, further description here is unnecessary.
The three RCLs have been tested by NBS by sending ionization chambers for them to calib rate and comparing the resu lt with the NBS calib ration .The experience so far has been ex cellen t, their calibration s agreeing to within 1% with NBS. So far these have a l l been open t e s ts , that is each RCL knew that i t was being tested . I t has been proposed that blind te s ts , in which the RCL does not know that i t is being tested , be occasionally performed in the future.
In discussing the dissemination of dosimetry ca lib ra tio n s, we d iffe re n tia te between secondary and tertiary instruments. R e fe r e n c e -c la ss (secon da ry) instrum ents are those whose performance and s ta b ility are su ffic ie n t for calib ration of other instruments, or for measurements of unusually high precision and accuracy. F ie ld -c la s s ( t e r t ia r y ) instrum ents
172 LOEVINGER
are those whose performance and s ta b ility are su ffic ie n t for routine medical beam calib ration s. In p rin cip le , i t is the intention of NBS to lim it i ts dosimetry calibration to referen ce-class instruments, while f ie ld -c la s s instruments are calibrated at accredited RCLs. At present, the three RCLs calib rate perhaps three or four times as many f ie ld -c la s s instruments as does NBS, but about half the calibrations performed at NBS are s t i l l on f ie ld -c la s s instruments. For a variety of reasons, i t has not yet been p ossible for NBS to refuse these instruments, but we hope that in the future i t w ill be possible to divert f ie ld -c la s s instruments to accredited RCLs.
Not a l l f ie ld -c la s s instruments in the United States are calibrated at either NBS or an RCL. I t seems to be the case that many such instruments are calibrated by an informal comparison with another f ie ld -c la s s instrument, using a convenient therapy beam. The resu lt of such a comparison is perhaps a quaternary or a quintenary instrument, surely an undesirable status for so important an instrument. F in ally , going one step further, there may be f ie ld -c la s s instruments that are not calibrated at a l l . We have at present very l i t t l e information about th is situ a tio n , but perhaps more w ill soon be known, since calibration needs in the United States is the subject of another paper in th is Symposium.
ACKNOWLEDGEMENTS
The a c t iv it ie s surveyed in th is paper have been supported in part by the National Cancer In stitu te and the Bureau of Radiological Health. The dosimetry standards program would not have been possible without the fa ith fu l and s k i l l fu l help of many persons. In addition to those whose names have already been mentioned, i t should be noted that H. H. Walker has contributed greatly to dosimetry calib ration procedures.
REFERENCES
[1] ICRU Report 19, Radiation Quantities and U nits, ICRU Publications, Washington DC (1971).
[2] WYCKOFF, H .O ., ATTIX, F .H ., Design of Free-air Ionization Chambers,Nat. Bur. Stand .(U .S .) Handbook 64 (1957).
[3] WYCKOFF, H .O ., ASTON, G .H ., SMITH, E .E ., B r it . J .R adiol. ¿7 (1954) 325.[4] RITZ, V .H ., Radiol. 73 6 (1959) 911; J .R es.N at.B ur.Stand.(U .S .) 64C
1 (1960) 49.[5] AITKEN, J .H ., DELAVERGNE, L ., HENRY, W .H., LOFTUS, T .P ., B rit .J .R a d io l.
35 (1962) 65.[6] LAMPERTI, P .J ., WYCKOFF, H .O ., J .R es.N at. Bur. Stand. (U. S .) 69C 1 (1965)
39.[7] BOUTILLON, М ., HENRY, W.H., LAMPERTI, P .J ., Metrologia _5 1 (1969) 1.[8] WYCKOFF, H .O., J .R es.N at. Bur. Stand. (U. S.) 64Ç 2 (1960) 87.[9] LOFTUS, T .P ., WEAVER, J .T ., J .R es.N at. Bur. Stand. (U. S.) 78A 4 (1974) 465.
[10] NIATEL, М.- T . , LOFTUS, T .P ., OETZMAN, W ., Metrologia П 1 (1975) 17.[11] DOMEN, S .R ., LAMPERTI, P .J ., J .R es.N at. Bur. Stand. (U. S.) 78A 5 (1974)
595.[12] DOMEN, S .R ., J .R es.N at.B ur.Stand .(U .S .) 73C 1 (1969) 17.[13] DOMEN, S .R ., LAMPERTI, P .J ., MIKADO, T ., Direct Comparisons of the NBS
Absorbed Dose Calorimeters Irradiated with 20 and 50 MeV Electrons,Nat.Bur. Stand.(U .S .) Internal Report NBSIR 76-1023 (1976).
[14] GUIHO, J . -P . , SIMOEN, J . -P . , DOMEN, S .R ., M etrologia, in press.[15] BERGER, M .J ., SELTZER, S .M ., DOMEN, S .R ., LAMPERTI, P .J ., "Stopping-
power ratios for electron dosimetry with ionization chambers", Biomedical Dosimetry (Proc.Symp.Vienna 1975), IAEA, Vienna (1975) 589.
IAEA-SM-222/58 173
[16] DOMEN, S .R ., LAMPERTI, P .J ., Med.Phys. _3 5 (1976) 294.[17] LOEVINGER, R ., TROTT, N .G ., In t . J .App.Rad. I s o t . 17 2 (1966) 103.[18] HONIGSCHMID, 0 . , Anz. Akad.Wiss.Wien 82 8 and 9 (1945) 30.[19] LOFTUS, T .P .j MANN, W .B., PAOLELLA, L .F ., STOCKMANN, L .L ., YOUDEN, W .J .,
J.R es.N at.B ur.Stand .(U .S .) 58 4 (1957) 169.[20] PRUITT, J .S . , LOEVINGER, R ., "Ion ization chamber for absorbed-dose
c a lib ra tio n ", Measurements for the Safe Use of Radiation (Proc. Symp. NBS, 1976), N at.B ur.Stand.(U .S .) Spec. Publ. 456 (1976) 37.
[21] LOFTUS, T .P ., J .R es.N at.B ur.Stand .(U .S .) 74A 1 (1970) 1.[22] ARDRAN, G.M., CROOKS, H .E ., B r it . J .R adiol. 41 (1968) 193; 45 (1970) 599.
DISCUSSION
J.C. M cDONALD: How many ionization chambers for medical use have been calibrated in terms o f absorbed dose by NBS so far?
R. LOEVINGER: About ten. Only preliminary calibration factors have been issued, since we want to be very sure that our calibration factors are correct.
Y. MORIUCHI: Is NBS doing anything about the dissemination o f photon energy fluence rate standards?
R. LOEVINGER: No, there is no distribution o f photon fluence standards at NBS. In the past we have constructed P-2 chambers and quantameters and have co-operated with other institutions in using them, but these instruments are now very little used at NBS.
P. NETTE: Y ou assign an uncertainty o f ± 0.8% to the calibration factor o f a reference-class dose meter calibrated for exposure with 60Co in your primary laboratory. The PTB in the Federal Republic o f Germany assigns ± 4% for 60Co. This discrepancy raises difficulties for the secondary laboratories. How can one solve this problem ?
R. LOEVINGER: Unfortunately there are indeed major differences between primary laboratories in the method o f expressing the uncertainty o f calibration factors. The problem has been recognized and will be the subject o f a meeting between representatives o f the national laboratories in the near future. We hope that the differences can be resolved.
G.P. HANSON: To what extent do you think the information you presented concerning the intercomparison study for cobalt-60 radiotherapy units using thermoluminescent dose meters reflects the true situation throughout the USA? Might there not be a bias if the institutions which agree to participate are in fact those which have better dosimetry practices?
R. LOEVINGER: We are quite aware that, in any survey in which participation is voluntary, those who agree to participate form a different statistical population from those who do not. We have selected a random sample o f 10% o f those who declined and are now endeavouring to persuade all members o f the random sample to participate. I f we succeed, it will presumably give us valid information on the form er non-participants.
174 LOEVINGER
D.E. JONES: We were asked by the Nuclear Regulatory Commission to perform a survey o f their licensed 60Co therapy installations that were not participating in the voluntary TLD intercomparison programme. We surveyed approximately 430 installations and found in general that their calibrations were satisfactory. A paper on this subject was presented by Bruce Dicey o f NRC at the Joint Meeting o f the Radiological Society o f North America and the American Association o f Physicists in Medicine, Chicago, 27 November to 2 December 1977. We are currently surveying approximately 300 additional 60Co sources that are covered by state licences in the USA.
IAEA-SM-222/46
REFERENCE BANK OF EXOELECTRON DOSE METERS*
R.B. GAMMAGE, J.S. CHEKA Health and Safety Research Division,Oak Ridge National Laboratory,Oak Ridge, Tennessee,United States o f America
Abstract
REFERENCE BANK OF EXOELECTRON DOSE METERS.Reference exoelectron dose meters of BeO ceramic, called Thermalox 995, have been
distributed to 37 groups in 17 countries. The apparent sensitivity of the dose meters at the standard exposure of 20 mR is compared for different readers in different laboratories and varies by an order of magnitude. Long-term stability of the exoelectron response is a critical issue if this type of dose meter is ever to be used routinely. Suggestions are made for the storage, exposure and reading of detectors in order to examine the stability parameter and compare the experiences of different investigators. One example of reasonably good stability is given for storage in air at 80% relative humidity during a period of one year. Recommendations are made for helping to prevent unnecessary changes in the standardized exoelectron response characteristics. These include annealing the dose meters at temperatures below 500°C , which is the final drying temperature before the detectors leave Oak Ridge, and preventing the condensation of atmospheric moisture onto the BeO at or below the dew-point temperature. Another important recommendation is to avoid exposing the irradiated dose meters to ultraviolet- containing light, otherwise trap-transfer effects will produce erroneous results. The reference exoelectron dose meters serve other useful purposes, such as benchmark dose meters against which to compare the effectiveness of newer types of exoelectron dose meters, and as dose meters for the conduct o f basic investigations in different laboratories but on the same material.
1. INTRODUCTION
In a previous article [1], a reference bank of 500 calibrated BeO ceramic dosimeters (called the E series) was described and an account was given of their common history, together with advice for their operation as thermally stimulated exoelectron (TSEE) and/or thermoluminescence (TL) dosimeters. The disks of BeO ceramic, called Thermalox 995 , 1 have been distributed to 37 groups in 17 countries.
In light of findings reported privately or at the 5th International Symposium on Exoelectron Emission, it is appropriate to summarize these data so that the state of the project can be judged and recommendations made for increasing the value of future experimentation.
* Research sponsored by the United States Department of Energy under contract with Union Carbide Corporation.
1 Available from the Brush Beryllium Company, Elmore, Ohio.
175
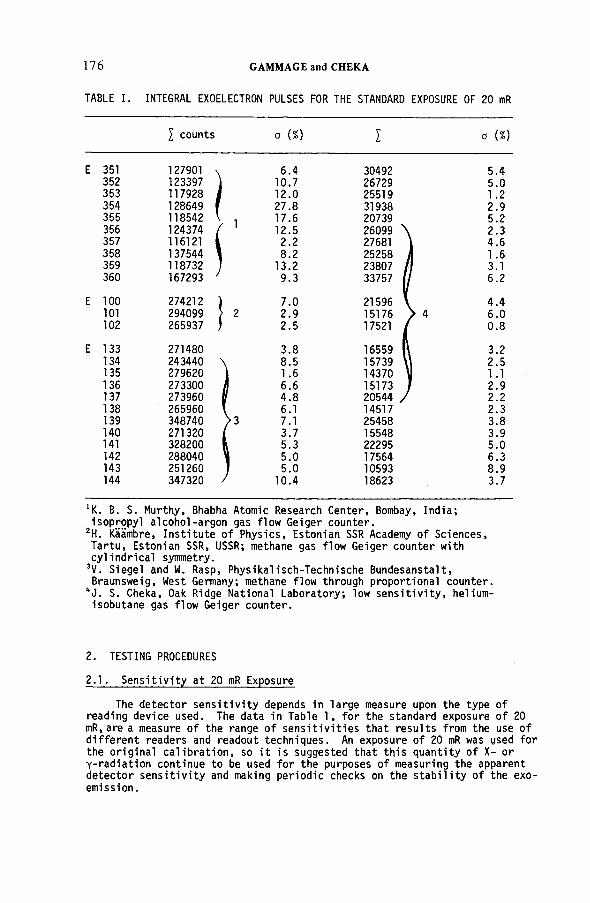
17 6 GAMMAGE and CHEKA
TABLE I. INTEGRAL EXOELECTRON PULSES FOR THE STANDARD EXPOSURE OF 20 mR
I counts a {%) (%)
E 351 127901 n 6.4 30492352 123397 I 10.7 26729353 117928 I 1 2 . 0 25519354 128649 1
f27.8 31938
355 118542 '> 1 17.6 20739356 124374 /
/ 112.5 26099
357 116121 1{ 2. 2 27681358 137544 \ 8. 2 25258359 118732 ; 13.2 23807360 167293 ' 9.3 33757
E 100 274212 7.0 21596101 294099 ! 2 2.9 15176102 265937 .) 2.5 17521
E 133 271480 3.8 16559134 243440 \ 8.5 15739135 279620 1 . 6 14370136 273300 к 6 . 6 15173137 273960 и 4.8 20544138 265960 6. 1 14517139 348740 >3 7.1 25458140 271320 / 3.7 15548141 328200 n 5.3 22295142 288040 V 5.0 17564143 251260 J 5.0 10593144 347320 / 10.4 18623
5.45.0 1.22.95.22.34.61. 63.16.2
4.4 6.0 0.8
3.22.5 1.12.92.22.33.83.9 5.06.38.9 3.7
*K. B. S. Murthy, Bhabha Atomic Research Center, Bombay, India; isopropyl alcohol-argon gas flow Geiger counter.
2H. Kaambre, Institute of Physics, Estonian SSR Academy of Sciences, Tartu, Estonian SSR, USSR; methane gas flow Geiger counter with cylindrical symmetry.
3V. Siegel and W. Rasp, Physikalisch-Technische Bundesanstalt, Braunsweig, West Germany; methane flow through proportional counter.
**J . S. Cheka, Oak Ridge National Laboratory; low sensitivity, helium- isobutane gas flow Geiger counter.
2. TESTING PROCEDURES
2.1. Sensitivity at 20 mR Exposure
The detector sensitivity depends in large measure upon the type of reading device used. The data in Table 1, for the standard exposure of 20 mR, are a measure of the range of sensitivities that results from the use of different readers and readout techniques. An exposure of 20 mR was used for the original calibration, so it is suggested that this quantity of X- or Y-radiation continue to be used for the purposes of measuring the apparent detector sensitivity and making periodic checks on the stability of the exoemission.
IAEA-SM-222/46 177
There is a ten- to twenty-fold reduction in sensitivity between the Geiger counter (GC) reader at Oak Ridge and the Geiger and proportional readers at Tartu and Braunschweig, respectively. Using a higher sensitivity reader for radiation dosimetry is, however, not as advantageous as it might seem at first sight. A small proportional counter (PC) reader operated at Oak Ridge with flowing methane was seven times more efficient for counting exoelectrons than the Oak Ridge GC reader. On the other hand, the background counts produced from the loading and heating of an unirradiated BeO disk were 244 + 42 and 1682 ± 558 for the GC and PC readers, respectively.Thus the advantage of the increased sensitivity of the PC reader is almost exactly offset by an increase in the magnitude and scatter of the background counts. We at Oak Ridge have not been able to extend the lower limit of exposure simply by using a more efficient pulse counting reader. This exposure limit is a few tenths of an mR. Dr. Siegel at Braunschweig has measured the background or zero dose electron response of the twelve reference dosimeters in his possession. The average was 1736 ± 953 pulses compared to about 3 x 10⁵ pulses after an exposure of 20 mR. This result seems to confirm our own experience that the zero dose response is of the order of 1% of the exoelectron pulses resulting from an exposure of 20 mR.It will be valuable to learn whether or not these difficulties of magnification of the background are common to all types of highly sensitive readers. Additional data from other groups concerning signal-to-noise ratios will be welcome.
A peculiarity worth pointing out is that a few of the detectors of the E series were unstable in repetitive exposures and readings in that the sensitivity was always increasing. This causes an unusually high a value for the mean response (E 255 is such a BeO disk, the a value being 19%).Those individual dosimeters with an anomalously high 0 value need to be rejected for dosimetry purposes.
2.2. Dose-Response
With pulse counters, linear response characteristics prevail at low doses. The dose-response curve for detectors E 133-144 as obtained by the researchers at Physikalisch-Technische Bundasanstalt (PTB) for a heating rate of 1.5°C/s, is reproduced in Fig. 1. This reader is a proportional counter with a dead-time of 2 ys [2]. The proportional counting reader at Oak Ridge National Laboratory (ORNL), mentioned in section 2.1, produced a very similar dose-response curve. In general, however, readings at ORNL are made with a Geiger counter reading device with a longer dead-time of 112microseconds .Dead-time losses then make readings above 100 mR impossible for a heating rate of 1.5°C/s if BeO disks as highly radiation sensitive as the reference dosimeters are used.
The various types of exoelectron readers will be assessed more critically when more data are forthcoming on parameters such as the method of electrically grounding the emitting surface, gas composition, anode-to- sample distance, anode size, electrical field gradient, and reader geometry.It is worth mentioning that the dependence of the counting characteristics upon the diameter of the cathode tube of a proportional counter has been examined thoroughly by Brunsmann et al. [3].
2.3. Stability of Exoelectron Response
It is common knowledge that the acceptability of exoelectron dosimeters hinges upon their reliability. Some of the commonly encountered problems, in both indoor and outdoor environments, have been discussed at length [4]. Condensation of atmospheric moisture on the exoemitting surface, when the temperature falls below the dew point, can be particularly ruinous. The TSEE glow curves in Fig. 2 from a single BeO disk subjected to such an event,
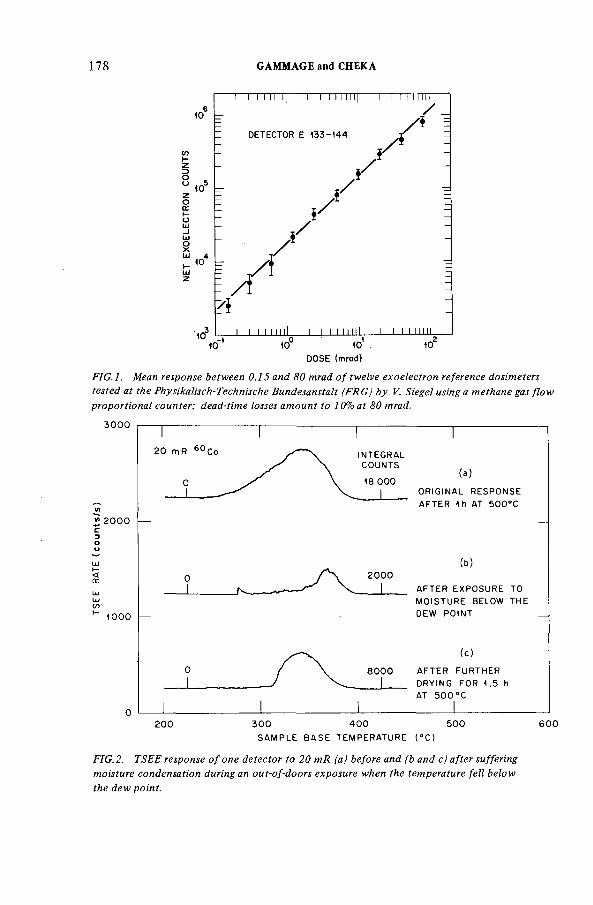
178 GAMMAGE and CHEKA
FIG.l. Mean response between 0.15 and 80 mrad o f twelve exoelectron reference dosimeters tested at the Physikalisch-Technische Bundesanstalt (FRG) by V. Siegel using a methane gas flow proportional counter; dead-time losses amount to 10% at 80 mrad.
SAM PLE BA SE TEMPERATURE ( °C )
FIG. 2. TSEE response o f one detector to 20 mR (a) before and (b and c) after suffering moisture condensation during an out-of-doors exposure when the temperature fell below the dew point.
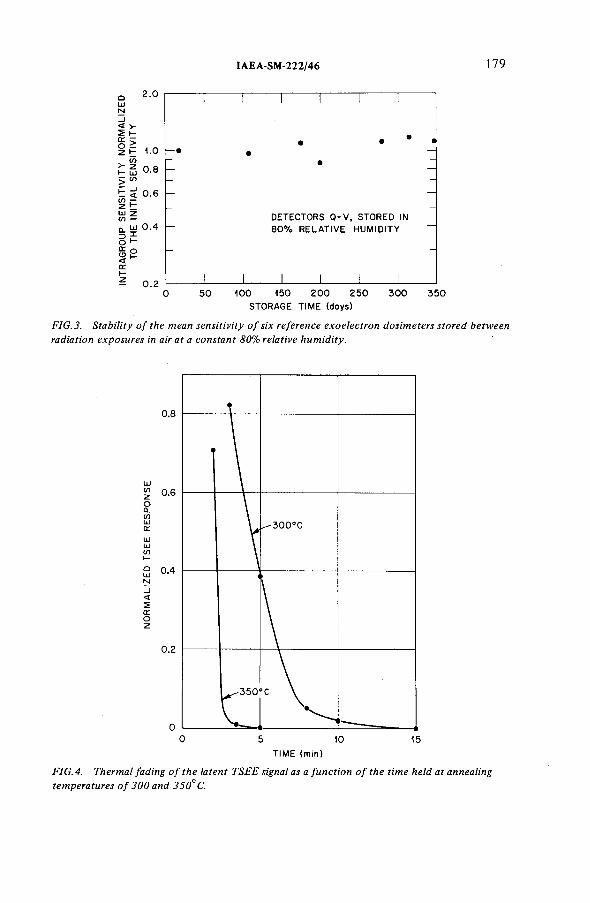
IAEA-SM-222/46 179
оLüM_l
2.0
1.0CC :Оz L
t g 0.8 - =; <лt < 0.6 z EÜJ Z (Л —о. ш 0.4s iœ оcrb- 0.2
DETECTORS 0-V, STORED IN 80 % RELATIVE HUMIDITY
50 100 150 200 250STORAGE TIME (doys)
300 350
FIG.3. Stability o f the mean sensitivity o f six reference exoelectron dosimeters stored between radiation exposures in air at a constant 80% relative humidity.
TIME (min)
FIG. 4. Thermal fading o f the latent TSEE signal as a function o f the time held at annealing temperatures o f 300 and 350°C.
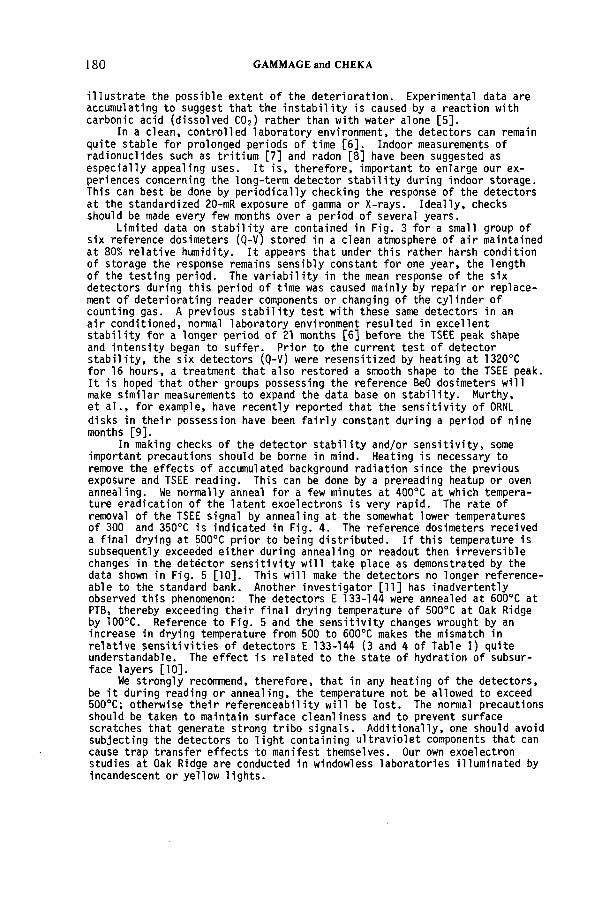
180 GAMMAGE and CHEKA
illustrate the possible extent of the deterioration. Experimental data are accumulating to suggest that the instability is caused by a reaction with carbonic acid (dissolved C02) rather than with water alone [5].
In a clean, controlled laboratory environment, the detectors can remain quite stable for prolonged periods of time [6]. Indoor measurements of radionuclides such as tritium [7] and radon [8] have been suggested as especially appealing uses. It is, therefore, important to enlarge our experiences concerning the long-term detector stability during indoor storage. This can best be done by periodically checking the response of the detectors at the standardized 20-mR exposure of gamma or X-rays. Ideally, checks should be made every few months over a period of several years.
Limited data on stability are contained in Fig. 3 for a small group of six reference dosimeters (Q-V) stored in a clean atmosphere of air maintained at 80% relative humidity. It appears that under this rather harsh condition of storage the response remains sensibly constant for one year, the length of the testing period. The variability in the mean response of the six detectors during this period of time was caused mainly by repair or replacement of deteriorating reader components or changing of the cylinder of counting gas. A previous stability test with these same detectors in an air conditioned, normal laboratory environment resulted in excellent stability for a longer period of 21 months [6] before the TSEE peak shape and intensity began to suffer. Prior to the current test of detector stability, the six detectors (Q-V) were resensitized by heating at 1320°C for 16 hours, a treatment that also restored a smooth shape to the TSEE peak. It is hoped that other groups possessing the reference BeO dosimeters will make similar measurements to expand the data base on stability. Murthy, et al., for example, have recently reported that the sensitivity of ORNL
disks in their possession have been fairly constant during a period of nine months [9].
In making checks of the detector stability and/or sensitivity, some important precautions should be borne in mind. Heating is necessary to remove the effects of accumulated background radiation since the previous exposure and TSEE reading. This can be done by a prereading heatup or oven annealing. We normally anneal for a few minutes at 400°C at which temperature eradication of the latent exoelectrons is very rapid. The rate of removal of the TSEE signal by annealing at the somewhat lower temperatures of 300 and 350°C is indicated in Fig. 4. The reference dosimeters received a final drying at 500°C prior to being distributed. If this temperature is subsequently exceeded either during annealing or readout then irreversible changes in the detector sensitivity will take place as demonstrated by the data shown in Fig. 5 [10]. This will make the detectors no longer reference- able to the standard bank. Another investigator [11] has inadvertently observed this phenomenon: The detectors E 133-144 were annealed at 600°C atPTB, thereby exceeding their final drying temperature of 500°C at Oak Ridge by 100°C. Reference to Fig. 5 and the sensitivity changes wrought by an increase in drying temperature from 500 to 600°C makes the mismatch in relative sensitivities of detectors E 133-144 (3 and 4 of Table I) quite understandable. The effect is related to the state of hydration of subsurface layers [10].
We strongly recommend, therefore, that in any heating of the detectors, be it during reading or annealing, the temperature not be allowed to exceed 500°C; otherwise their referenceability will be lost. The normal precautions should be taken to maintain surface cleanliness and to prevent surface scratches that generate strong tribo signals. Additionally, one should avoid subjecting the detectors to light containing ultraviolet components that can cause trap transfer effects to manifest themselves. Our own exoelectron studies at Oak Ridge are conducted in windowless laboratories illuminated by incandescent or yellow lights.
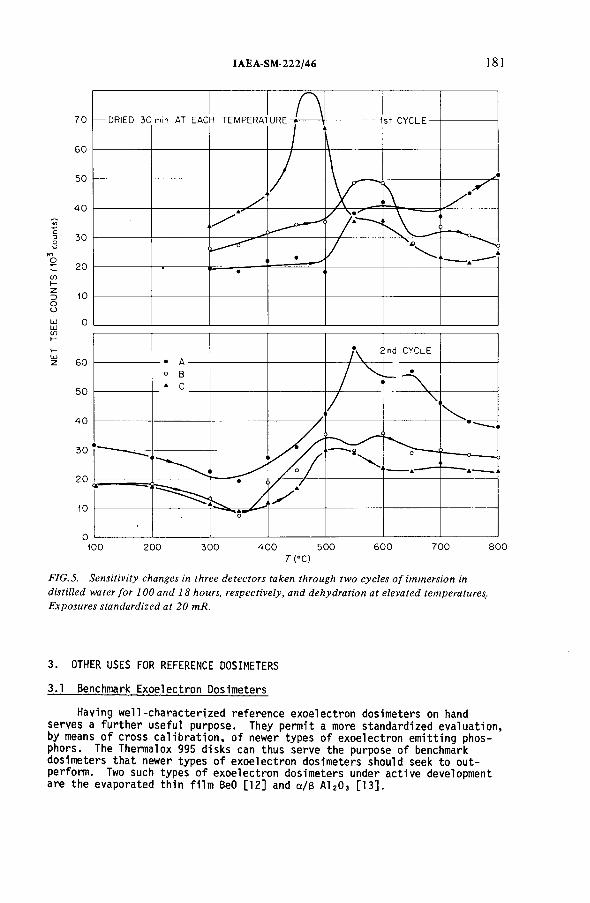
IAEA-SM-222/46 181
Г ( ° С )
FIG. 5. Sensitivity changes in three detectors taken through two cycles o f immersion in distilled water for 100 and 18 hours, respectively, and dehydration at elevated temperatures. Exposures standardized at 20 mR.
3. OTHER USES FOR REFERENCE DOSIMETERS
3.1 Benchmark Exoelectron Dosimeters
Having well-characterized reference exoelectron dosimeters on hand serves a further useful purpose. They permit a more standardized evaluation, by means of cross calibration, of newer types of exoelectron emitting phosphors. The Thermal ox 995 disks can thus serve the purpose of benchmark dosimeters that newer types of exoelectron dosimeters should seek to outperform. Two such types of exoelectron dosimeters under active development are the evaporated thin film BeO [12] and a/B A1 20 3 [13].
3.2. Basic Process of Exoelectron Emission
1 8 2 GAMMAGE and CHEKA
Already some significant progress in unraveling different exoemission processes has been made. Negative ions as well as electrons are emitted' from the BeO surface [14]. In the nearly dehydrated condition, the chemi- sorbed ions of adsorbed gases and vapors localized near lattice defects act as emission centers [14,15]. Exhaustion of the chemisorbed layer by outgas- sing reduces the intensity of the exoemission. In normal dosimetry applications and during heating in gas flow readers, one is dealing with more hydrated conditions involving layers of molecular water. Reduction in the number of these layers causes the reverse effect, that is increases in the exoelectron intensity [16]. Krylova believes that radical species, such as 02ads 5 Play tlie decisive role in exoemission [17]. The more generally held view is that both bulk and surface centers play major roles [18]. That this is the case for ceramic BeO seemed to be indicated from experiments to probe the depth of the exoactive layer with alpha particles of varying energy [19]. Our results indicate the presence of a highly active layer, at or close to the surface, with more weakly emitting elements at depth extending to several ym. If exoelectrons are indeed emerging from such extreme depths, then pyroelectric processes must be accelerating conduction electrons sufficiently to overcome lattice scattering. In fact, during heating, pyroelectric charging of the surface of Thermalox 995 is known to be intense enough to cause field ionization of helium atoms impinging upon the surface [20].
Surface impurities such as Si02 and Li20 and the chemical condition of their binding with BeO bring about dramatic changes in the intensity of exoelectron emission [21,22]. They have been termed secondary activators [23].
Contradictions, however, still abound [19,24], and a self-consistent scheme of exoelectron emission that includes all these different processes is still lacking. The conduct of different basic investigations in different laboratories, but with the same material, is helping to "iron out" several of the impediments that would otherwise exist if less well characterized BeO specimens with dissimilar histories were being used. This approach should continue in the future.
3.3 Thermoluminescence Dosimetry
The Thermalox 995 dosimeter is a highly sensitive and nearly tissue- equivalent TLD. A thermoluminescence effect named pyroelectric incandescence [25] can, however, interfere with the characteristic radiation-induced TL peak at 176°C [26]. The drawback lies in the incomplete resolution of radiation and pyroelectric induced emissions and is especially troublesome at exposures of 20 mR or less. This problem of incomplete resolution has lately been resolved using methods of improved electronic signal recording, discriminating optical filters, and better thermal contact. The lower limit of detection is now 0.1 mR (precent variation equal to 3 a), and at 20 mR, a is 2.8% for a single detector exposed and read repetitively [27].
The significance for this article is that the reference bank of Thermalox 995 disks will serve well for evaluatory work in different laboratories on a TLD material that, after a long period of growing pains, is in a position to prove perhaps as valuable as Li F TLD in carrying out environmental and personnel monitoring measurements. There is also the added attraction of making improved, combined TL-TSEE readings that can be used to measure and discriminate between strongly and weakly penetrating radiations in mixed radiation fields [28].
ACKNOWLEDGMENTS
The authors owe thanks to each of the 37 groups of researchers who possess these reference exoelectron dosimeters and are conducting (or may yet
IAEA-SM-222/46 183
conduct) significant evaluations or basic research. In particular, thisexpression of gratitude is directed towards Drs. Siegel, Murthy, Kaambre, andKrylova for their intense efforts to date in these coordinated studies.
REFERENCES
[1] GAMMAGE, R. B., CHEKA, J. S., "Bank of calibrated BeO ceramic dosimeters for TSEE and TL," Health Phys. 30 (1976) 331.
[2] KRIKS, H. J., "Investigations on exoelectrons with a special proportional counter," Advances in Physical and Biological Radiation Detectors, IAEC, Vienna, STI/PUB/269 (1971) 17.
[3] BRUNSMANN, U., KRIEGSEIS, W., SCHARMANN, A., "Dependence of the characteristics of a cylindrical gas flow counter for TSEE on the cathode diameter," Proc. 5th Int. Symp. on Exoelectron Emission and Dosimetry, Zvikov, Czech., printed in I. Physik. Inst., Univ. Giessen, 6300 Giessen, West Germany, BOHUN, A. and SCHARMANN, A., Eds. (1976)296.
[4] GAMMAGE, R. B., "The present situation and outlook for exoelectrondosimeters," Proc. 5th Int. Symp. on Exoelectron Emission and Dosimetry, Zvikov, Czech., printed in I. Physik. Inst., Univ. Giessen, 6300Giessen, West Germany, BOHUN, A. and SCHARMANN, A., Eds. (1976) 107.
[5] KRIEGSEIS, W., SCHARMANN, A., SCHMIRLER, G., KOTTLER, W., TSCHULENA, G.,"Properties of evaporated BeO film layers for TSEE dosimetry," Proc.5th Int. Conference on Luminescence Dosimetry, Sao Paulo, Brazil, printed in I. Physik. Inst., Univ. Giessen, Heinrich-Buff-Ring 16,D 6300 Giessen, West Germany, SCHARMANN, A., Ed. (1977) 140.
[6] GAMMAGE, R. B., CHEKA, J. S., "A practical TSEE dosimetry system basedon BeO ceramic," Proc. 4th Int. Symp. on Exoelectron Emission and Dosimetry, Czech. Acad. Sci. and A.E.C., BOHUN, A., Ed., Liblice,Czech. (1973) 247.
[7] GAMMAGE, R. B., CHEKA, J. S., "Measuring tritium with exoelectron dosimeters," Nucl. Instrum. Methods 127 (1975) 279.
[8] GAMMAGE, R. B., KERR, G. D., HUSKEY, L., "Exploratory study of the use of TSEE dosimeters in radon monitoring," Health Phys. 30̂ (1976) 145.
[9] MURTHY, К. B. S., SUNTA, С. М., SOMAN, S. D., "Preparation and dosimetric properties of BeO discs using thermally stimulated exoelectron emission," Proc. IV IRPA Int. Congress, Vol. 4, Paris, France (1977) 1285.
[10] GAMMAGE, R. B., CHEKA, J. S., "The importance of surface hydration in exoelectron emission from ceramic BeO," Proc. 5th Int. Symp. on Exoelectron Emission and Dosimetry, Zvikov, Czech., printed in I. Physik. Inst., Univ. Giessen, 6300 Giessen, West Germany, BOHUN, A. and SCHARMANN, A., Eds. (1976) 73.
[11] SIEGEL, V., RASP, W., "Studies of BeO ceramic from ORNL," private communication (1976).
[12] TSCHULENA, G., BONNET, D., "Reactively evaporated BeO films for TSEE dosimetry part II, film preparation and its influence on TSEE,1' Proc.5th Int. Symp. on Exoelectron Emission and Dosimetry, Zvikov, Czech., printed in I. Physik. Inst., Univ. Giessen, 6300 Giessen, West Germany, BOHUN, A. and SCHARMANN, A., Eds. (1976) 127.
[13] PETEL, М., HOLZAPFEL, G., "Alpha/beta - A120 3 exoelectron emitters for dosimetry," Proc. 5th Int. Symp. on Exoelectron Emission and Dosimetry, Zvikov, Czech., printed in I. Physik. Inst., Univ. Giessen, 6300 Giessen, West Germany, BOHUN, A. and SCHARMANN, A., Eds. (1973) 142.
[14] KRYLOVA, I. V., SVITOV, V. I., "The effect of adsorption layers on the parameters of exoelectron emission from BeO ceramic samples," Proc.5th Int. Symp. on Exoelectron Emission and Dosimetry, Zvikov, Czech, printed in I. Physik. Inst., Univ. Giessen, 6300 Giessen, West Germany, BOHUN, A. and SCHARMANN, A.,'Eds. (1976) 54.
184 GAMMAGE and CHEKA
[15] EULER, М., KRIEGSEIS, W., SCHARMANN, A., "The influence of oxygen adsorption centers upon the exoelectron emission of BeO," Phys. Status Sol idi A 15. (1973) 431 .
[16] NAGPAL, J. S., GAMMAGE, R. B., "Adsorbed gases, atmospheric, and temperature effects on TSEE from BeO," Radiat. Eff. 20 (1973) 215.
[17] KRYLOVA, I. V., "Exoelectron emission accompanying physico-chemical conversion on the surface of solids," Proc. 5th Int. Symp. on Exoelectron Emission and Dosimetry, Zvikov, Czech., printed in I. Physik. Inst., Univ. Giessen, 6300 Giessen, West Germany, BOHUN, A. and SCHARMANN, A., Eds. (1976) 40.
[18] SCHARMANN, A., KRIEGSEIS, W., "Influence of surface parameters on exoelectron emission," Proc. .5th Int. Symp. on Exoelectron Emission and Dosimetry, Zvikov, Czech., printed in I. Physik. Inst., Univ. Giessen, 6300 Giessen, West Germany, BOHUN, A. and SCHARMANN, A., Eds. (1976) 5.
[19] GAMMAGE, R. B., THORNGATE, J. H., "Depth of the exoelectron layer inceramic BeO Thermalox 995," Proc. 5th Int. Symp. on Exoelectron Emission and Dosimetry, Zvikov, Czech., printed in I. Physik. Inst., Univ. Giessen, 6300 Giessen, West Germany, BOHUN, A. and SCHARMANN, A., Eds. (1976) 82.
[20] KRIEGSEIS, W., SCHARMANN, A., WIESSLER, U., "Excitation of BeO with gases," Proc. 4th Int. Conf. on Luminescence Dosimetry, Krakow, Poland, printed in Inst, of Nucí. Phys. (NIEWIADOMSKI, T., Ed.) Krakow, Poland 1 (1974) 283.
[21] GAMMAGE, R. B., CRASE, K. W., BECKER, K., "Role of silicon activator inexoelectron emission from BeO," Health Phys. 22^(1972) 57.
[22] MORENO Y MORENO, A., CHEKA, J. S., NAGPAL, J. S., GAMMAGE, R. B.,BECKER, K., "Further studies on TSEE activators in BeO," Revista Mexicana de Fisica 21̂ (1972) 123.
[23] GAMMAGE, R. B., GARRISON, A. K., "Trapping centers and activators in Thermal ox BeO," Proc. 4th Int. Symp. on Exoelectron Emission and Dosimetry, Liblice, Czech. (BOHUN, A., Ed.) Czech. Acad, of Sci. and A.E.C. (1973) 93.
[24] KLUGE, H., SIEGEL, V., "The exoelectron emission from GeO ceramics as a function of alpha-particle energy," Proc. 5th Int. Symp. on Exoelectron Emission and Dosimetry, Zvikov, Czech., printed in I. Physik.Inst., Univ. Giessen, 6300 Giessen, West Germany, BOHUN, A. and SCHARMANN, A., Eds. (1976) 190.
[25] GAMMAGE, R. B., CHEKA, J. S., "Further characteristics important in the operation of ceramic BeO TLD," Health Phys. 32 (1977) 189.
[26] CRASE, K. W., GAMMAGE, R. B., "Improvements in the use of ceramic BeO for TLD," Health Phys. 29 (1975) 739.
[27] GAMMAGE, R. B., CHRISTIAN, D. J., "Bringing BeO ceramic TLD up to scratch," to be published (1977).
[28] GAMMAGE, R. B., GARRISON, A. K., "Investigation of EPR, TLD, and TSEE of BeO ceramic," Proc. 4th Int. Conf. on Luminescence Dosimetry, Krakow, Poland, printed in Inst, of Nucl. Phys., Krakow, Poland (NIEWIADOMSKI, T., Ed.) 1 (1974) 263.
DISCUSSION
G.E. CHABOT Jr.: Have you observed the energy spectrum o f electrons from the BeO detectors, and does the spectral quality change as surface effects occur?
IAEA-SM-222/46 185
R.B. GAMMAGE: I have not observed the spectra myself, but others have. The average electron energy for the dose meters in this reference bank is about1 eV. Depending on the type o f ceramic BeO, energies up to 10 eV and even as high as 1 keV have been observed for single-crystal BeO because o f its pyroelectric nature. Surface effects, such as a change in the state o f hydration, are certain to influence the energy spectrum o f the exoelectrons.
M.N. VARM A: Since the exoelectron cross-sections are strongly dependent on the surface condition o f beryllium oxide, what is the maximum dose at which radiation damage to the surface from irradiation will cause the performance o f the exoelectron dose meter to deteriorate?
R.B. GAMMAGE: I refer to an apparent cross-section for exoelectrons in situations where surface conditions affect the probability o f thermally liberated electrons in the conduction band escaping entirely from the solid. These surface conditions (e.g. hydrated and/or carbonated layers), as they affect exoelectron emission, are not changed by ionizing photons at doses up to 105 rad. This is known because the dose versus exoelectron response is linear up to these high doses. Hence there is no deterioration in performance. On the other hand, similar doses o f high-LET particles, such as deuterons, do cause deterioration o f the response characteristics. This is understandable because new trapping centres are produced within the lattice structure o f the BeO during damage by the heavy particles.


SECONDARY STANDARD DOSIMETRY LABORATORY ACTIVITIES

IAEA-SM-222/53
THE SECONDARY STANDARD DOSIMETRY LABORATORY
A necessary link in the dissemination chain
H.W. JULIUS Radiological Service TNO,Arnhem,
G. van der LUGT KEMA,Anrhem,The Netherlands
Abstract
THE SECONDARY STANDARD DOSIMETRY LABORATO RY - A NECESSARY LINK IN THE DISSEMINATION CHAIN.
A Secondary Standard Dosimetry Laboratory (SSDL) is usually based on an institute or laboratory with a wider scope, for example one involved with radiation protection, medical dosimetry, or other fields of applied dosimetry. Such an institute generally combines practical experience on the one hand, with the necessary insight into the problems of the primary standards laboratory on the other. This situation permits the SSDL to play an important role in the dissemination chain, as a link between a primary standard and the practical application of radiation dosimetry. The SSDL can, as an independent institute, be of substantial assistance to hospitals, field laboratories, industry etc., not only by calibrating instruments, but also by guiding intercomparison studies, performing type tests, and calibrating radiation-therapy and other kinds of sources.
1. INTRODUCTION
As a consequence o f the increasing application o f radiation techniques and the expansion o f nuclear power production, there is a growing need for reliable measurement o f ionizing radiation. Standard dosimetry plays an important role in ensuring the correct calibration o f instruments and the proper use o f radiation units throughout the calibration chain from the primary standard laboratory to the user o f a field instrument.
In this paper the task o f the Secondary Standard Dosimetry Laboratory (SSDL) is outlined, indicating both its relation to the primary standard laboratory and to the user o f the field instrument. Special attention is givén to the way in which the SSDL, through its contacts with the users and supported by its own experience in different fields o f applied dosimetry, can prom ote the proper use o f radiation instruments in the field.
189
190 JULIUS and van der LUGT
Modern requirements for reliability o f measurement o f exposure level and radiation dose to individuals need thorough maintenance and calibration programmes for the various instruments. Such programmes should include both regular calibrations and general checks, and should be undertaken at two levels:
(i) In the field by a maintenance group, using tertiary standards (usually calibrated radioactive sources); and
(ii) At a specialized laboratory, for example an SSDL, the task o f which is to calibrate the field instruments and the tertiary standards.
At the origin o f the calibration chain stands the primary standard dosimetry laboratory. Its task is to maintain the national standard (including making international comparisons with other standards) and to disseminate the quantity determined to the SSDL by calibrating the secondary standard measuring facilities.
For the SSDL the establishment and maintenance o f standards is usually not a goal in itself. The SSDL should be the link between the primary standard laboratory and the user o f the field instrument. It should, therefore, combine insight into the problems o f a primary standard facility on the one hand with the necessary practical experience in applied dosimetry on the other. An SSDL based on a laboratory or institute already involved in various fields o f applied dosimetry, such as radiation protection or medical dosimetry, would have the best prospects o f meeting these requirements.
The main objective o f an SSDL is to calibrate instruments and radiation sources for customers. This includes an advisory task regarding the various aspects and phases o f calibration and application. Am ong the matters that must be considered are:
(a) Discussion o f the specifications on the calibration request: calibrations which are asked for by the customer, but which are not really necessary for the work should be avoided. (As an example, full energy response curves should not be provided for all instruments o f one and the same type).
(b ) Interpretation o f the calibration reports. I f an instrument is calibrated at only one energy (as is usually the case with radiation protection instruments having a well-known energy response), one has the choice o f three calibration energies, namely (i) an energy for which the instrument shows its mean response, (ii) the energy most com m only encountered at the customers workplace, and (iii) a reference energy (usually 60Co or 137Cs gamma radiation). In each o f these situations the customer should be informed (preferably on the calibration report) how his measurements should be interpreted in terms o f the unit or quantity for which calibration hasbeen performed.
2. TASK OF THE SSDL
IAEA-SM-222/53 191
( c ) The state o f the instrument. All instruments should, before and during calibration, be inspected for safety, mechanical defects and electronic malfunction. The customer should be warned in case o f severe defects. The customer should also be informed if internal controls have had to be adjusted.
(d ) Use o f the instrument and interpretation o f the data. The user should be made aware o f the proper way o f handling the instrument and o f interpreting the results. Important factors are, for example, the accuracy and precision o f the instrument, the transfer o f meter value into (surface or depth) absorbed dose value, the energy dependence and any deviations due to the angular dependence o f the response.
( e ) Application o f the proper dosimetry units in the custom er’s practice.
Because o f the experience and knowledge available within the SSDL, it could also be asked to evaluate new instruments (type testing). Such type tests should, apart from measurements o f the response to ionizing radiation, cover at least mechanical properties (such as robustness), electronic properties (such as stability, precision, reliability, etc.) and electrical safety; attention could also be focussed on ergonom ic aspects.
The technical know-how o f an SSDL, gained both from calibration experience for a variety o f measuring instruments and from type testing o f newly developed equipment, may also be used for advising on purchase o f new instruments. Although this is a difficult task and one which needs careful consideration, it leads to substantial improvements in the reliability o f radiation dose measurements. In this context, extensive exchange1 o f information and experience between users and the SSDL is o f great importance.
3. THE TN O -KEM A CO-OPERATION
In order to illustrate the position o f the SSDL and its significance to the user, a few words on our own situation, where two organizations — TNO and KEMA - co-operate, might prove o f value.
The Radiological Service TNO is running a recognized personnel dosimetry service. Am ong its activities is the development o f thermoluminescent dosimetry for large scale application in this service as well as for other dosimetric applications, including short-term personnel dosimetry in the Dutch nuclear power plants and patient dosimetry in both medical X-ray diagnostics and radiation therapy. Moreover, TNO is involved in calibrations o f the output o f radiation therapy units, in whole-body counting, in nuclear medicine and in other activities involving control o f radiation.
1 In both directions!
192 JULIUS and van der LUGT
The KEMA is the central testing, development and research institute for the electric utilities in the Netherlands. It has the facilities and know-how for testing the quality and safety o f electrical components and instruments, under both normal and extreme environmental conditions. Research and development are carried out on the health physics aspects o f nuclear power production. Within this scope, valuable knowledge has been gained on the proper use o f radiation and contamination measuring equipment.
Considering on the one hand the tasks and requirements for an SSDL which have previously been described and on the other hand the activities o f both TNO and KEMA, it seemed logical for them to pool their experience and abilities in jointly setting up a com m on secondary standard calibration service.
This combination o f a certified institute responsible for the radiological calibrations and an institute with experience in reviewing the mechanical and electrical state o f the instruments will guarantee an optimum calibration service.In our Opinion it is not sufficient to calibrate an instrument radiologically; it is o f equal importance to verify that the instrument will continue to do its job for a given period after the date o f calibration.
4. CONCLUSION
The Secondary Standard Dosimetry Laboratory is a necessary link in the dissemination o f standards from the primary dosimetry laboratory to the user o f instruments at the place o f work. Therefore the SSDL should be fully aware o f the problems o f the instrument user in the field if an optimum use o f radiation instruments is to be realized in practice. For this purpose the SSDL cannot but profit by having close connections with institutes working in a broad field o f research, development and testing.
DISCUSSION
L.J. HUMPHRIES: In calibrating ionization chambers used for the calibration o f therapy machines, I have found that quite often the instruments do not have the energy response given by the instrument manufacturer. I am, therefore, , concerned that the suggested calibration o f chambers o f the same type at only one energy might be inadequate.
H.W. JULIUS: I agree entirely with your statement where ionization chambers used for radiation therapy purposes are concerned. My suggestion was meant to apply to the recalibration o f radiation protection monitors. New instruments o f this kind should have their energy response verified by full calibration over their whole energy range, but recalibration o f the same instrument may require only a one- or two-point check.
IAEA-SM-222/13
EVALUATION OF THE NEED FOR RADIOTHERAPY CALIBRATIONS IN THE UNITED STATES OF AMERICAL.H. LAN ZL, M. ROZENFELD Franklin McLean Memorial Research Institute* and
Department o f Radiology, University o f Chicago,Chicago, Illinois,United States o f America
Abstract
EVALUATION OF THE NEED FOR RADIOTHERAPY CALIBRATIONS IN THE UNITED STATES OF AMERICA.
The custody, maintenance, and development of the United States of America’s national standards of measurement, together with the provision of calibration services related to these standards, has been assigned to the National Bureau of Standards (NBS) of the US Department of Commerce. As with all of the national standards, including those for radiation, the Bureau’s principal emphasis is on calibrations and other tests requiring an accuracy that can be obtained only by direct comparison with the standards of NBS. For many years, NBS has been the only organization which was generally available for the calibration of instruments needed for radiation therapy in US hospitals and clinics. In recent years, three regional calibration laboratories, located in New York, Houston and Cleveland, have been accredited by the American Association of Physicists in Medicine (AAPM). The calibration chain between the primary standards of NBS and the field instruments used in the hospitals and clinics of the entire country may be direct, or indirect through the regional calibration laboratories by use of secondary standard or transfer instruments. It may be that this system of promulgation of radiation standards is no longer adequate for the USA. Ionizing radiation is being used increasingly for the treatment of cancer patients. At present, approximately 325 000 new cancer patients per year are given radiation treatment at over 1500 centres. With this growing use of ionizing radiations, an increased awareness o f the importance of accurate and precise dosimetry has developed. To determine the adequacy of these dosimetric needs, the AAPM has initiated a national study which is being conducted by means of a mailed questionnaire, and by a limited number of site visits to individuals who are in charge of radiation therapy centres as well as to those who do the actual calibrations. To date, the questionnaire has been developed, and a mechanism for reaching virtually all therapy centres in the USA has been devised.
The ultimate responsibility for the standardization o f radiation in the United States o f America lies with the National Bureau o f Standards (NBS) o f the US Department o f Commerce o f the US government. The statutory functions which
* Operated by The University of Chicago for the US Department of Energy under Contract No. EY-76-C-02-0069.
193
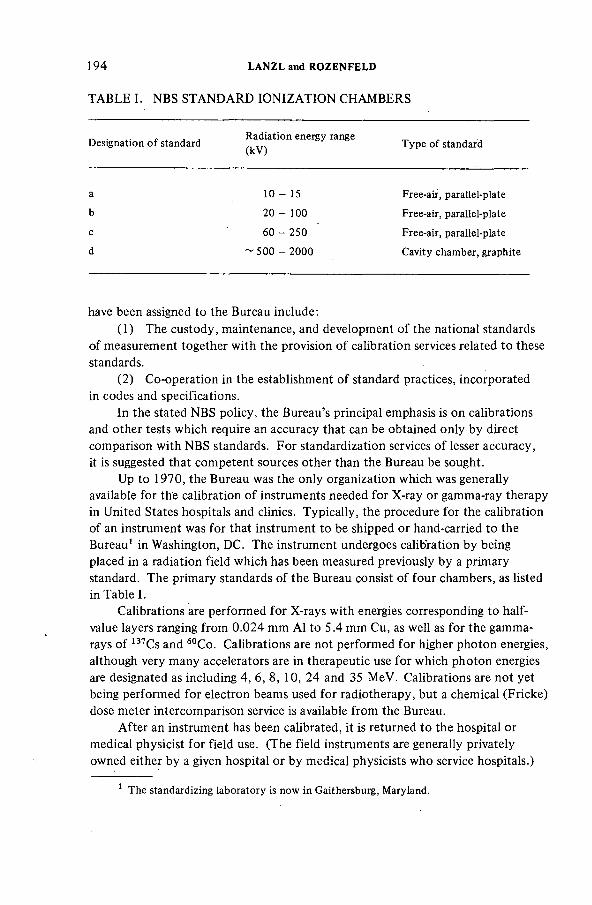
TABLE I. NBS STANDARD IONIZATION CHAMBERS
1 9 4 LANZL and ROZENFELD
Designation of standardRadiation energy range (kV)
Type of standard
a 10 - 15 Free-air, parallel-plate
b 20 - 100 Free-air, parallel-plate
с 60 - 2 5 0 Free-air, parallel-plate
d - 5 0 0 - 2000 Cavity chamber, graphite
have been assigned to the Bureau include:(1) The custody, maintenance, and development o f the national standards
o f measurement together with the provision o f calibration services related to these standards.
(2) Co-operation in the establishment o f standard practices, incorporated in codes and specifications.
In the stated NBS policy, the Bureau’s principal emphasis is on calibrations and other tests.which require an accuracy that can be obtained only by direct comparison with NBS standards. For standardization services o f lesser accuracy, it is suggested that competent sources other than the Bureau be sought.
Up to 1970, the Bureau was the only organization which was generally available for the calibration o f instruments needed for X-ray or gamma-ray therapy in United States hospitals and clinics. Typically, the procedure for the calibration o f an instrument was for that instrument to be shipped or hand-carried to the Bureau1 in Washington, DC. The instrument undergoes calibration by being placed in a radiation field which has been measured previously by a primary standard. The primary standards o f the Bureau consist o f four chambers, as listed in Table I.
Calibrations are performed for X-rays with energies corresponding to halfvalue layers ranging from 0.024 mm A1 to 5.4 mm Cu, as well as for the gamma- rays o f 137Cs and 60Co. Calibrations are not performed for higher photon energies, although very many accelerators are in therapeutic use for which photon energies are designated as including 4, 6 , 8 , 10, 24 and 35 MeV. Calibrations are not yet being performed for electron beams used for radiotherapy, but a chemical (Fricke) dose meter intercomparison service is available from the Bureau.
After an instrument has been calibrated, it is returned to the hospital or medical physicist for field use. (The field instruments are generally privately owned either by a given hospital or by medical physicists who service hospitals.)
1 The standardizing laboratory is now in Gaithersburg, Maryland.
IAEA-SM-222/13 195
The Bureau issues a report on the calibration and charges a fee for the calibration service. This fee does not cover the entire cost o f the service. The calibration report has both medical and legal implications.
If all existing field instruments for the measurement o f radiation from therapy machines were calibrated at two-year intervals, the number o f such calibrations in the USA would far exceed the calibration capacity at NBS. It is partly for this reason, and partly because local laboratories can maintain closer communication with users in the field, that a system o f secondary facilities, called Regional Calibration Laboratories (R CL), has been established for the calibration o f field radiation instruments. The American Association o f Physicists in Medicine (AAPM ) has developed standards for such Regional Calibration Laboratories and has established procedures for their certification. These laboratories are required to maintain their secondary standards in agreement with NBS to within 0.5%. Annual calibration o f instruments used for transferring standards is made by direct comparison with the national standards.
Thus far, three regional calibration laboratories, located in New York,Houston and Cleveland, have been established (the first was established about six years ago). Papers are included in this Symposium by representatives from each o f these laboratories. The calibration chain between the primary standards o f NBS and the field instruments used in the hospitals and clinics o f the entire country may be direct, or it may be indirect — through the regional calibration laboratories and making use o f secondary standard or transfer instruments. A t present, cavity ionization chambers are the most suitable secondary standard or transfer instruments used by the regional laboratories. An instrument may consist o f the chamber alone, or o f the chamber together with the charge-measuring system. Since secondary standard instruments may be used with radiation fields that differ from the field in which they are compared to the primary standard, they should be insensitive to changes in the energy spectrum and in the direction o f the radiation.
Field instruments, that is, the instruments with which the radiation therapy beam from a machine in a hospital or clinic is measured, are calibrated by substitution in a radiation beam measured by either a primary or a secondary standard.
Our Radiation Calibration Laboratories differ from the International A tom ic Energy Agency/W orld Health Organization network o f Secondary Standard Dosimetry Laboratories (SSDL) in that our RCLs perform calibrations only for therapy purposes, whereas the SSDLs may also calibrate instruments for radiation protection purposes, as well as calibrating sources o f radioactivity.
There is sketchy, but growing evidence that this system o f promulgation o f radiation standards is no longer adequate for the USA. Ionizing radiation is being used increasingly for radiation therapy. At present, approximately 325 000 new cancer patients a year are given radiation treatment. With the increasing use o f ionizing radiations, an increased awareness o f the importance o f accurate and precise dosimetry has developed. For example, evidence now exists that differences
196 LANZL and ROZENFELD
as small as 5% in the dose delivered in some types o f radiation therapy may result in appreciable differences in the local control o f malignant tumours.
T o determine the adequacy o f these dosimetric needs, the AAPM has initiated a national study2 in which information will be gathered on:
(a) The number o f institutions where radiation therapy is performed in the United States o f America;
(b) The number and frequency o f calibrations o f therapy units;(c) The number o f calibrations performed by physicists and by physicians
and others;(d) The number o f instruments in use and their geographical distribution;(e) The differences in the patterns o f calibration between the heavily and
sparsely settled parts o f the USA;(f) The prospects for existing and additional regional calibration facilities.
The study is being conducted by means o f a mailed questionnaire, and a limited number o f site visits to individuals who are in charge o f radiation therapy centres, as well as to those who do the actual calibrations.
T o date, the questionnaire has been developed, and a roster o f virtually all therapy centres in the USA has been devised. It is expected that a report o f the study will be available by the middle o f 1978.
Our Federal Government does not maintain a listing o f centres which carry out radiation therapy. However, our Nuclear Regulatory Commission maintains records and issues licences for certain users o f radioactive sources. Thus, there are files on cobalt-60 and caesium-137 teletherapy sources that are or have been in use. Some, but not all, o f our state governments maintain records o f X-ray machines, including therapy accelerators, in use. Since these files are not complete, additional sources o f information have been used in an attempt to obtain a complete list o f all hospitals and clinics which offer radiotherapy services. We have used the following sources:(i) Directory o f High-Energy Radiotherapy Centres, published by the
International A tom ic Energy Agency, Vienna, 1976 Edition;(ii) Membership list o f the American Association o f Physicists in Medicine,
13 April 1977;(iii) Membership list o f the American Society o f Therapeutic Radiologists, 1976;(iv) Facility list o f the Patterns o f Care Study, Dr. Simon Kramer, Chairman,
21 November 1977.
2 This evaluation is being undertaken by the American Association of Physicists in Medicine under the direction of a Steering Committee consisting of three medical physicists, Peter Wootton, Chairman, VaughnC. Moore, and Robert J. Schulz; two radiotherapists,Max M.L. Boone and Lawrence W. Davis; and a Principal Investigator, Lawrence H. Lanzl.E. Eisenhower and R. Loevinger (NBS) are assisting in the work for the committee as well.
IAEA-SM-222/13 197
Thus far, we have been able to identify about 1430 centres in the USA which perform radiotherapy. O f these, about 1015 have megavoltage equipment, i.e. accelerators and/or cobalt-60 or caesium-137 units. The largest chain o f hospitals is that operated by the Veterans Administration o f the Federal Government. Twenty-seven o f these hospitals have a radiation therapy service. Most o f the rest o f the hospitals are not Federal, but are privately owned or owned by a county or city. Although we have not completed our mailings, about 400 questionnaires have now been returned. The responses show that virtually 100% o f the calibrations o f therapy equipment are being performed by medical physicists.
One o f the questions reads: “ Would the provision o f a local calibration facility encourage more frequent calibration o f field instruments? ” This question is very often answered in the affirmative. Another frequent comm ent asserts that we should have additional calibration facilities located within a region o f the country not now serviced by an RCL. Another comm ent concerns the long turn-around time o f instrument calibration.
On the other hand, we find that some o f our regional calibration facilities are underutilized. This situation poses a dilemma, the solution o f which may very well lie in the education o f physicists and physicians concerning the importance o f proper dosimetry for the radiation treatment o f cancer patients.
DISCUSSION
J.E. M cLAUGHLIN: Would you please identify the reference documents for the AAPM standards for regional calibration laboratories and their certification?
L.H. LAN ZL: The documents are available from Task Group III on Regional Calibration Laboratories o f the Scientific Committee on Radiation Therapy o f the AAPM.
A.O. FREGENE: Have direct dose intercomparisons from various machines used in the United States o f America been carried out? I f so, how well do they agree?
L.H. LAN ZL: Quite a few intercomparison studies in the United States o f America over the past twenty years have been reported in the literature. Most such studies show the agreement to be within about 4%. However, on occasion, dose values as far apart as about 35% have been found. In 1976, a tragic situation o f patient over-exposure was discovered by means o f an intercomparison study o f cobalt-60 therapy units.

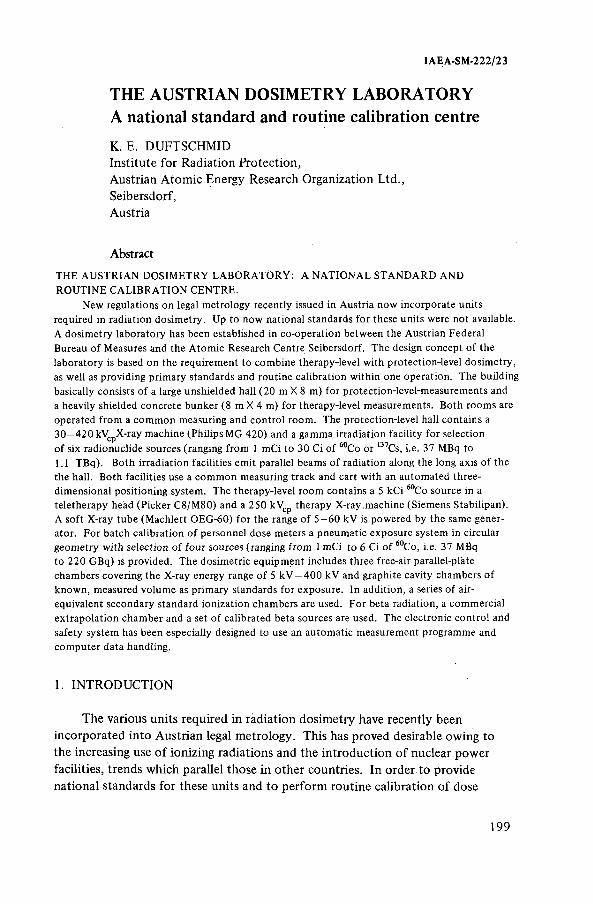
IAEA-SM-222/23
THE AUSTRIAN DOSIMETRY LABORATORY A national standard and routine calibration centreK. E. DUFTSCHMID Institute for Radiation Protection,Austrian A tom ic Energy Research Organization Ltd.,Seibersdorf,Austria
Abstract
THE AUSTRIAN DOSIMETRY LABORATO RY: A NATIONAL STANDARD AND ROUTINE CALIBRATION CENTRE.
New regulations on legal metrology recently issued in Austria now incorporate units required in radiation dosimetry. Up to now national standards for these units were not available. A dosimetry laboratory has been established in co-operation between the Austrian Federal Bureau of Measures and the Atomic Research Centre Seibersdorf. The design concept of the laboratory is based on the requirement to combine therapy-level with protection-level dosimetry, as well as providing primary standards and routine calibration within one operation. The building basically consists of a large unshielded hall (20 m X 8 m) for protection-level-measurements and a heavily shielded concrete bunker (8 m X 4 m) for therapy-level measurements. Both rooms are operated from a common measuring and control room. The protection-level hall contains a 30—4 20 kVcpX-ray machine (Philips MG 420) and a gamma irradiation facility for selection of six radionuclide sources (ranging from 1 mCi to 30 Ci of 60Co or 137Cs, i.e. 37 MBq to 1.1 TBq). Both irradiation facilities emit parallel beams of radiation along the long axis of the the hall. Both facilities use a common measuring track and cart with an automated three- dimensional positioning system. The therapy-level room contains a 5 kCi 60Co source in a teletherapy head (Picker C8/M 80) and a 250 kVcp therapy X-ray.machine (Siemens Stabilipan).A soft X-ray tube (Machlett OEG-60) for the range of 5 - 6 0 kV is powered by the same generator. For batch calibration of personnel dose meters a pneumatic exposure system in circular geometry with selection of four sources (ranging from 1 mCi to 6 Ci of 60Co, i.e. 37 MBq to 220 GBq) is provided. The dosimetric equipment includes three free-air parallel-plate chambers covering the X-ray energy range of 5 kV — 400 kV and graphite cavity chambers of known, measured volume as primary standards for exposure. In addition, a series of air- equivalent secondary standard ionization chambers are used. For beta radiation, a commercial extrapolation chamber and a set of calibrated beta sources are used. The electronic control and safety system has been especially designed to use an automatic measurement programme and computer data handling.
1. INTRODUCTION
The various units required in radiation dosimetry have recently been incorporated into Austrian legal metrology. This has proved desirable owing to the increasing use o f ionizing radiations and the introduction o f nuclear power facilities, trends which parallel those in other countries. In order to provide national standards for these units and to perform routine calibration o f dose
199
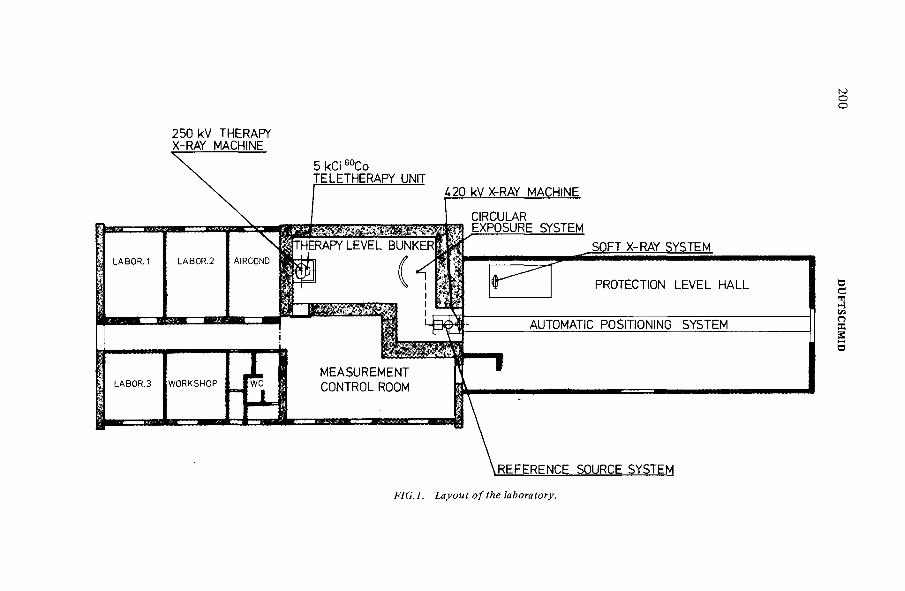
к>оо
250 kV THERAPY X-RAY MACHINE
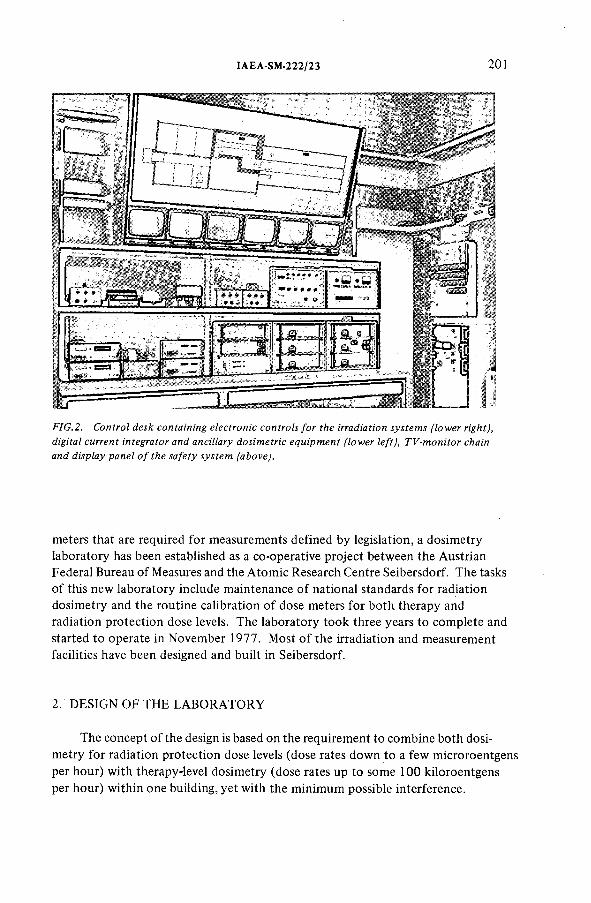
IAEA-SM-222/23 201
FIG.2. Control desk containing electronic controls for the irradiation systems (lower right), digital current integrator and ancillary dosimetric equipment (lower left), TV-monitor chain and display panel o f the safety system (above).
meters that are required for measurements defined by legislation, a dosimetry laboratory has been established as a co-operative project between the Austrian Federal Bureau o f Measures and the Atom ic Research Centre Seibersdorf. The tasks o f this new laboratory include maintenance o f national standards for radiation dosimetry and the routine calibration o f dose meters for both therapy and radiation protection dose levels. The laboratory took three years to complete and started to operate in November 1977. Most o f the irradiation and measurement facilities have been designed and built in Seibersdorf.
2. DESIGN OF THE LABO RATO RY
The concept o f the design is based on the requirement to combine both dosimetry for radiation protection dose levels (dose rates down to a few microroentgens per hour) with therapy-level dosimetry (dose rates up to some 100 kiloroentgens per hour) within one building, yet with the minimum possible interference.
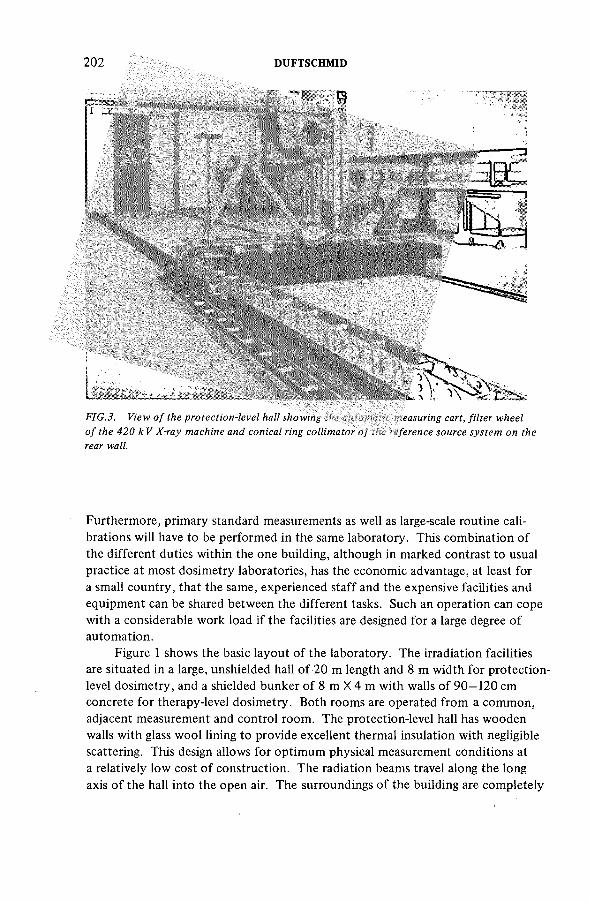
202
В
DUFTSCHMID
FIG.3. View o f the protection-level hall showing the automatic measuring cart, filter wheel o f the 420 kV X-ray machine and conical ring collimator o f the reference source system on the rear wall.
Furthermore, primary standard measurements as well as large-scale routine calibrations will have to be performed in the same laboratory. This combination o f the different duties within the one building, although in marked contrast to usual practice at most dosimetry laboratories, has the econom ic advantage, at least for a small country, that the same, experienced staff and the expensive facilities and equipment can be shared between the different tasks. Such an operation can cope with a considerable work load if the facilities are designed for a large degree o f automation.
Figure 1 shows the basic layout o f the laboratory. The irradiation facilities are situated in a large, unshielded hall o f 20 m length and 8 m width for protection- level dosimetry, and a shielded bunker o f 8 m X 4 m with walls o f 90—120 cm concrete for therapy-level dosimetry. Both room s are operated from a com m on, adjacent measurement and control room . The protection-level hall has w ooden walls with glass w ool lining to provide excellent thermal insulation with negligible scattering. This design allows for optimum physical measurement conditions at a relatively low cost o f construction. The radiation beams travel along the long axis o f the hall into the open air. The surroundings o f the building are completely
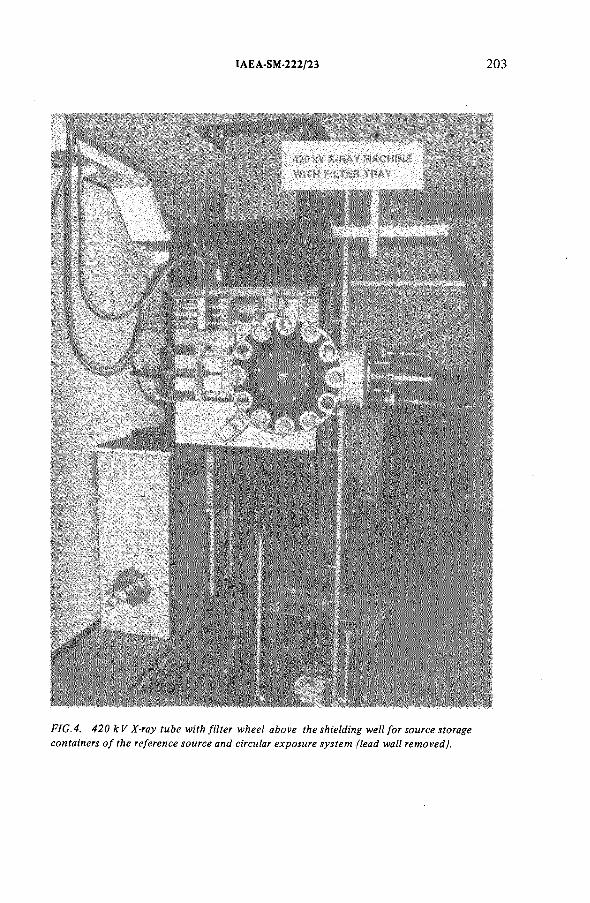
IAEA-SM-222/23 203
FIG.4. 420 kV X-ray tube with filter wheel above the shielding well for source storage containers o f the reference source and circular exposure system (lead wall removed).
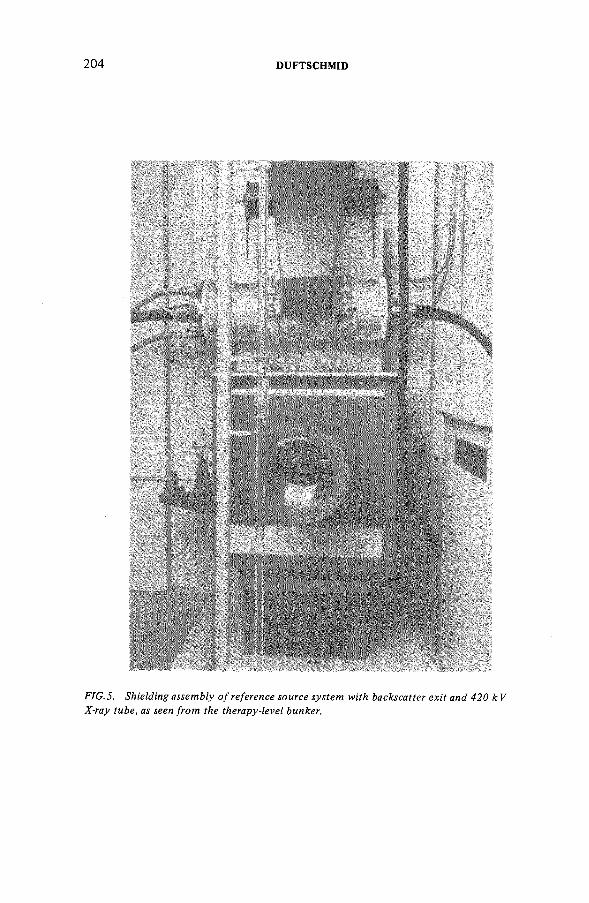
204 DUFTSCHMID
FIG.5. Shielding assembly o f reference source system with backscatter exit and 420 к V X-ray tube, as seen from the therapy-level bunker.
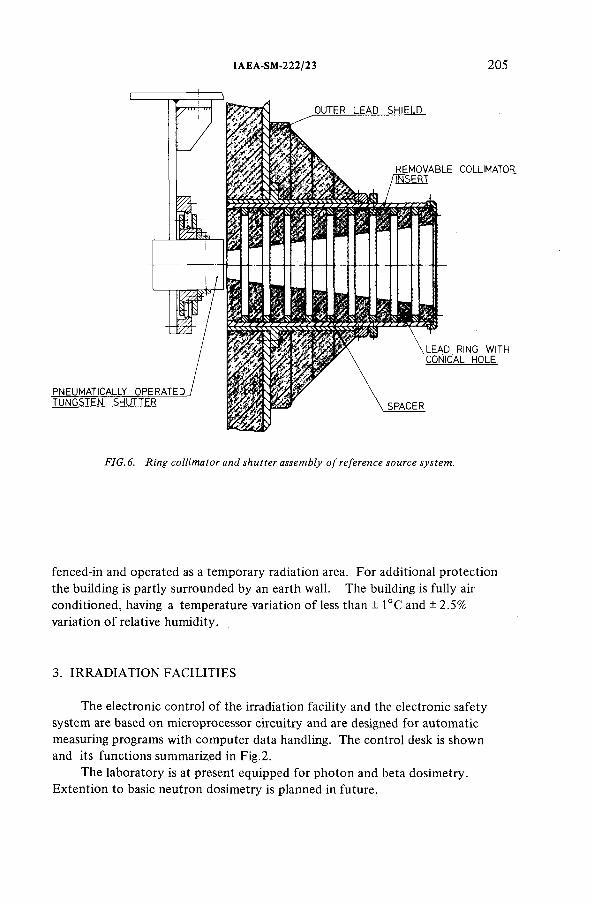
IAEA-SM-222/23 205
FIG.6. Ring collimator and shutter assembly o f reference source system.
fenced-in and operated as a temporary radiation area. For additional protection the building is partly surrounded by an earth wall. The building is fully air conditioned, having a temperature variation o f less than ± 1°C and ± 2.5% variation o f relative humidity.
3. IRRADIATION FACILITIES
The electronic control o f the irradiation facility and the electronic safety system are based on microprocessor circuitry and are designed for automatic measuring programs with com puter data handling. The control desk is shown and its functions summarized in Fig.2.
The laboratory is at present equipped for photon and beta dosimetry. Extention to basic neutron dosimetry is planned in future.
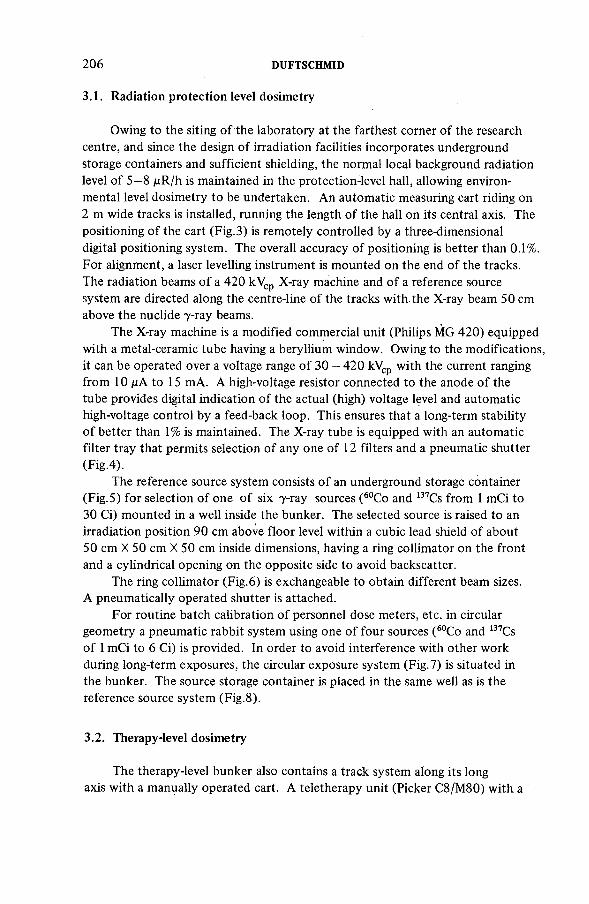
206 DUFTSCHMID
3.1. Radiation protection level dosimetry
Owing to the siting o f the laboratory at the farthest corner o f the research centre, and since the design o f irradiation facilities incorporates underground storage containers and sufficient shielding, the normal local background radiation level o f 5—8 jitR/h is maintained in the protection-level hall, allowing environmental level dosimetry to be undertaken. An automatic measuring cart riding on2 m wide tracks is installed, running the length o f the hall on its central axis. The positioning o f the cart (Fig.3) is remotely controlled by a three-dimensional digital positioning system. The overall accuracy o f positioning is better than 0.1%. For alignment, a laser levelling instrument is mounted on the end o f the tracks.The radiation beams o f a 420 kVcp X-ray machine and o f a reference source system are directed along the centre-line o f the tracks with the X-ray beam 50 cm above the nuclide 7 -ray beams.
The X-ray machine is a m odified commercial unit (Philips MG 420) equipped with a metal-ceramic tube having a beryllium window. Owing to the modifications, it can be operated over a voltage range o f 30 — 420 kVcp with the current ranging from 10 дА to 15 mA. A high-voltage resistor connected to the anode o f the tube provides digital indication o f the actual (high) voltage level and automatic high-voltage control by a feed-back loop. This ensures that a long-term stability o f better than 1% is maintained. The X-ray tube is equipped with an automatic filter tray that permits selection o f any one o f 12 filters and a pneumatic shutter (Fig.4).
The reference source system consists o f an underground storage container (Fig.5) for selection o f one o f six 7 -ray sources (60Co and 137Cs from 1 mCi to 30 Ci) mounted in a well inside the bunker. The selected source is raised to an irradiation position 90 cm above floor level within a cubic lead shield o f about 50 cm X 50 cm X 50 cm inside dimensions, having a ring collimator on the front and a cylindrical opening on the opposite side to avoid backscatter.
The ring collimator (Fig.6) is exchangeable to obtain different beam sizes.A pneumatically operated shutter is attached.
For routine batch calibration o f personnel dose meters, etc. in circular geometry a pneumatic rabbit system using one o f four sources (60Co and 137Cs o f 1 mCi to 6 Ci) is provided. In order to avoid interference with other work during long-term exposures, the circular exposure system (Fig.7) is situated in the bunker. The source storage container is placed in the same well as is the reference source system (Fig.8).
3.2. Therapy-level dosimetry
The therapy-level bunker also contains a track system along its long axis with a manually operated cart. A teletherapy unit (Picker C8/M 80) with a
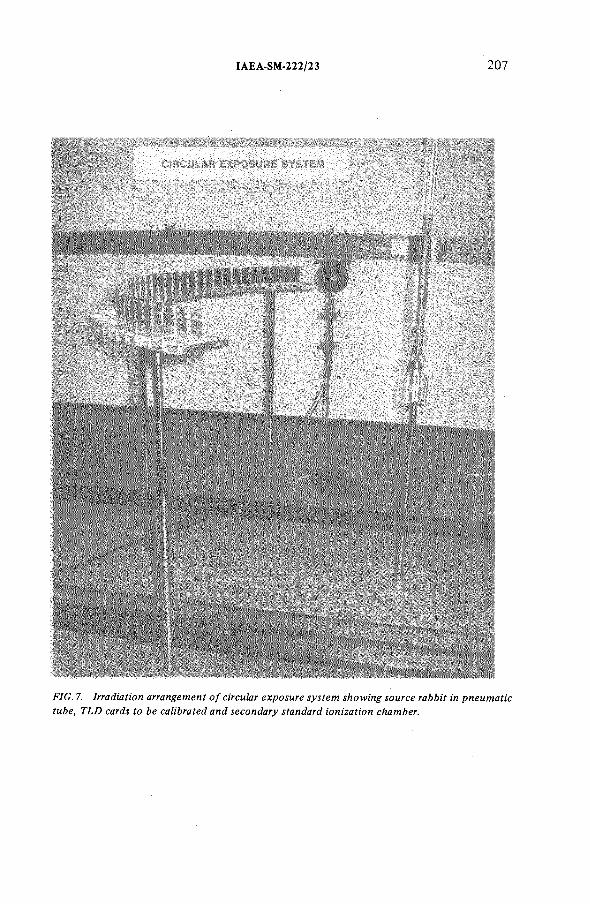
IAEA-SM-222/23 207
FIG. 7. Irradiation arrangement o f circular exposure system showing source rabbit in pneumatic tube, TLD cards to be calibrated and secondary standard ionization chamber.
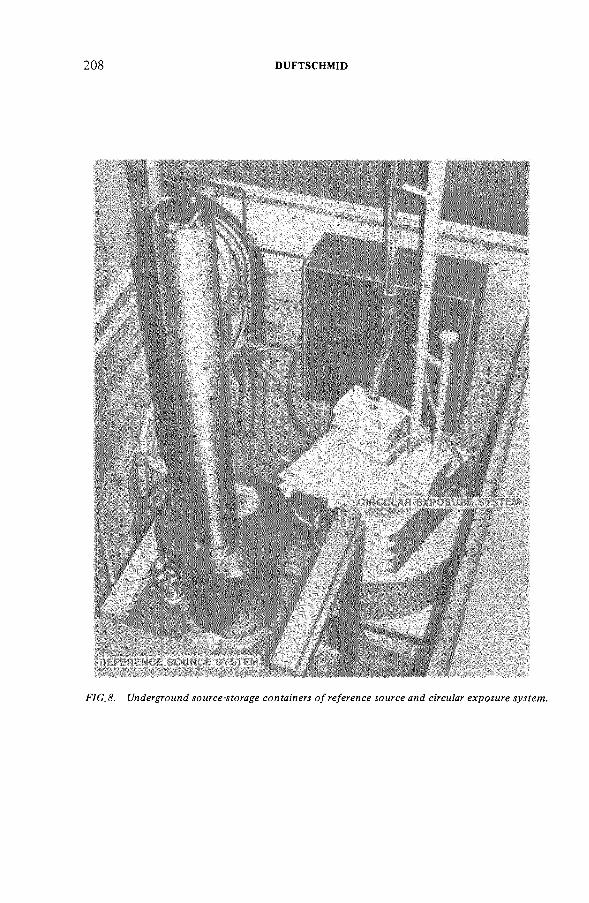
208 DUFTSCHMID
FIG .8. Underground source-storage containers o f reference source and circular exposure system.
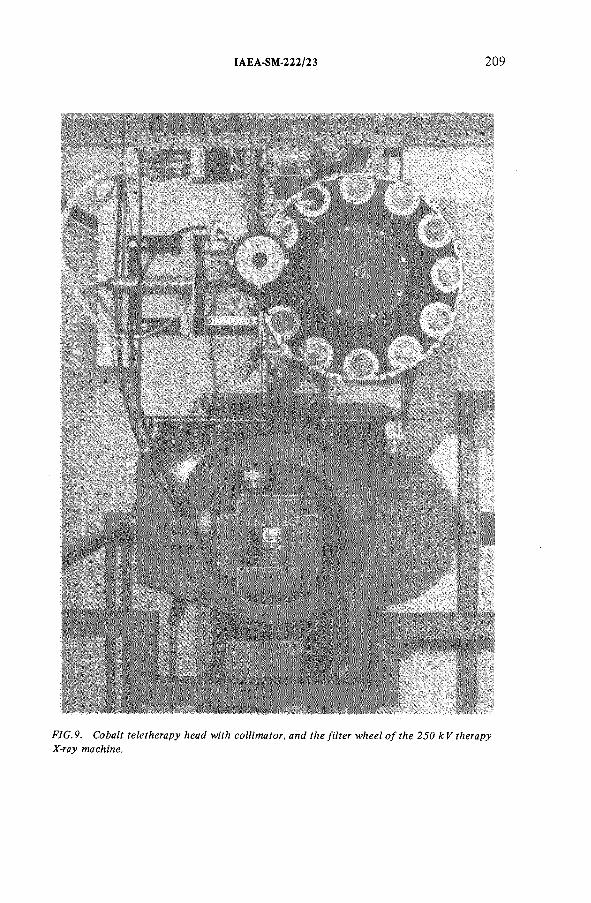
IAEA-SM-222/23 209
FIG.9. Cobalt teletherapy head with collimator, and the filter wheel o f the 250 kV therapy X-ray machine.
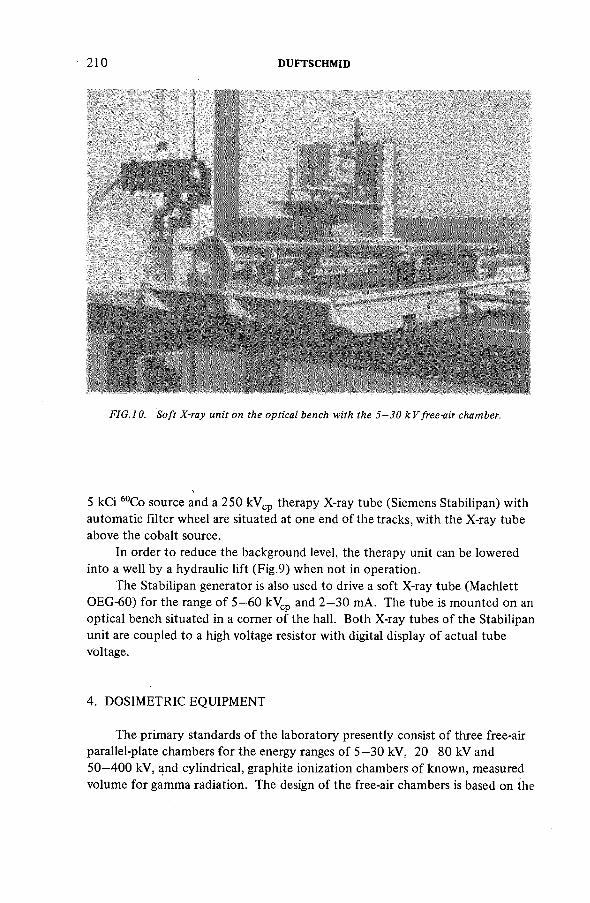
210 DUFTSCHMID
FIG.l 0. Soft X-ray unit on the optical bench with the 5 - 3 0 k V free-air chamber.
5 kCi 60Co source and a 250 kVcp therapy X-ray tube (Siemens Stabilipan) with automatic filter wheel are situated at one end o f the tracks, with the X-ray tube above the cobalt source.
In order to reduce the background level, the therapy unit can be lowered into a well by a hydraulic lift (Fig.9) when not in operation.
The Stabilipan generator is also used to drive a soft X-ray tube (Machlett OEG-60) for the range o f 5—60 kVcp and 2—30 mA. The tube is mounted on an optical bench situated in a corner o f the hall. Both X-ray tubes o f the Stabilipan unit are coupled to a high voltage resistor with digital display o f actual tube voltage.
4. DOSIMETRIC EQUIPMENT
The primary standards o f the laboratory presently consist o f three free-air parallel-plate chambers for the energy ranges o f 5—30 kV, 20—80 kV and 50—400 kV, and cylindrical, graphite ionization chambers o f known, measured volume for gamma radiation. The design o f the free-air chambers is based on the
IAEA-SM-222/23 211
instruments o f the Hungarian National O ffice o f Measures (OMH), Budapest, a result o f co-operation between the two laboratories.
Secondary standard instruments include the National Physical Laboratory (UK) Therapy-Level Secondary Standard and a series o f spherical graphite chambers o f 1 cm to 14 cm diameter manufactured by OMH, Budapest. Due to the special design incorporating interior aluminium coatings, these chambers show excellent energy response (variation ± 2% from 30 keV to 1.25 MeV). Long-term stability tests with radium sources performed over a period o f more than three years indicated a variation o f well below 1% even with the largest chamber.
For current measurement, digital current integrators from OMH (NP-2000) are used. These instruments allow for a wide range o f current values, owing to their variable measurement capacitors ( 100 pF to 10 nF) and variable integration time (10 s to 1000 s). Tw o instruments can be coupled to a com m on printer to give data on X-ray measurements together with simultaneously taken m onitor chamber readings.
For beta radiation dosimetry, a commercial extrapolation chamber (Pychlau) combined with a set o f calibrated beta sources from the Laboratoire de Métrologie des Rayonnements Ionisants (France ) and the Physikalisch-Technische Bundesanstalt (F .R . Germany) are used.
DISCUSSION
L.J. GOODMAN: Y ou have described an elegant radiation calibration facility. How many people will be em ployed in it and how many calibrations will be performed per year?
K.E. DUFTSCHMID: Thank you for that question; it touches on one o f our main problems. Our manpower resources are limited — in fact we have less than ten people for the whole laboratory. Much effort has therefore been directed towards automation. The laboratory will have to maintain and intercompare the national standards for the dose units as well as eventually carrying out routine calibration o f all therapy-level and protection-level dose meters used in Austria. There are approximately 20000 radiation workers in Austria, and thus a couple o f thousand personnel dose meters and a few hundred field monitoring instruments to be calibrated every year.
L.H. LAN ZL: Will your very fine laboratory accept secondary chambers for calibration from hospitals and institutes outside Austria? Will you in the future be able to perform dosimetry intercomparisons with the IAEA Dosimetry Laboratory, which will also be located at Seibersdorf?
K.E. DUFTSCHMID: The new IAEA dosimetry laboratory, which is now being built, is our direct neighbour, only a few hundred metres away; there will certainly be close co-operation, even more than at present. Our laboratory has
212 DUFTSCHMID
been recognized as an SSDL by the IAEA and WHO, and we should certainly appreciate co-operation and intercomparisons with institutions outside Austria.The only limiting factor is the manpower available.
R. LOEVINGER: I gather that the automatic equipment you described is for moving and positioning the instruments being calibrated. How do you propose to handle the calibration data? Will there be automatic data acquisition?
K.E. DUFTSCHMID: The remote control o f the cart assembly is used to position dose meters in the beams from the X-ray tube and from the chosen radioactive source; these beams are parallel, one above the other. In addition, one can exchange the standard and the test chamber without interrupting the beams.
As far as data acquisition is concerned, all parameters o f a calibration, such as the read-out o f the digital current integrators and the readings o f a digital barometer and thermometer, are available as binary coded decimal outputs. We also plan to design microprocessor circuitry which will enable us to obtain calibration factors for the different beam qualities and computer plots o f calibration curves directly.
L.D. STEPHENS: I notice that the cart assembly is massive. What effect does scattered radiation from this cart assembly, and also from the floor and walls, have on the calibration?
K.E. DUFTSCHMID: Wall scattering is minimized by the use o f light wooden walls with high thermal insulation. Scattering from the floor and parts o f the cart does o f course have to be kept negligible for high accuracy measurements, and this is achieved by limiting the beam size — through proper selection o f the conical collimator — to about three times the detector size. For protection-level calibration with lower accuracy one can use the whole range o f the cart assembly with one collimator; otherwise the collimator has to be exchanged according to distance from the source.
IAEA-SM-222/36
EXPOSURE INTERCOMPARISON WITH IONIZATION CHAMBERSBased on three intercompared check sources
P. NETTE, Dagmar REISInstituto de Radioproteçao e Dosimetría,Rio de Janeiro,Brazil
H. ECKERL, G. DREXLER Institut für Strahlenschutz,Gesellschaft für Strahlen- und Umweltforschung mbH, Neuherberg, Munich,Federal Republic o f Germany
P. PYCHLAUPhysikalisch-Technische Werkstàtten Dr. Pychlau KG, Freiburg im Breisgau,Federal Republic o f Germany
Abstract
EXPOSURE INTERCOMPARISON WITH IONIZATION CHAMBERS - BASED ON THREE INTERCOMPARED CHECK SOURCES.
The calibration factor of an ionization chamber can be related to the check reading caused by one or more overall radioactive stability check devices. It will be shown how one ionization chamber can be used for the intercomparison of three SSDLs. Each SSDL has its own radioactive check device which, for one given chamber, is used at each SSDL to normalize the calibration factor on the basis of a check reading. To carry out an intercomparison the chamber alone, i.e. without a radioactive source, can be sent from place to place. This procedure has great advantages from the customs and transport safety regulations point of view.
1. INTRODUCTION
It makes good sensé to support the dissemination o f calibration factors for dose meters in all its stages by undertaking frequent intercomparisons. Even between the Primary Standard Dosimetry Laboratories (PSDL), where the measurement o f the unit o f exposure, the roentgen, is realized by its physical definition, regular intercomparison measurements with transfer chambers via BIPM are adopted for quality assessment.
213
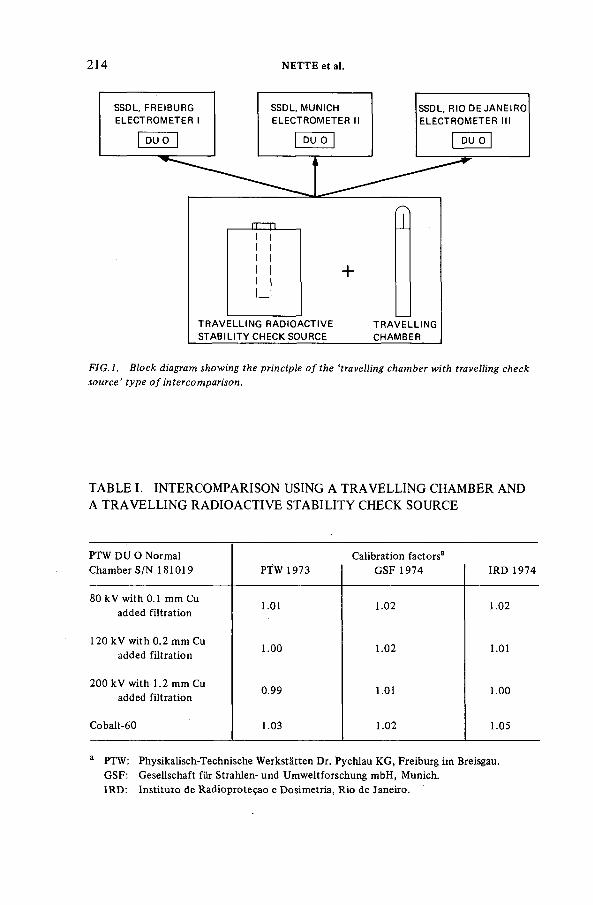
214 NETTE et al.
FIG .l. Block diagram showing the principle o f the ‘travelling chamber with travelling check source’ type o f intercomparison.
TABLE I. INTERCOMPARISON USING A TRAVELLING CHAMBER AND A TRAVELLING RADIOACTIVE STABILITY CHECK SOURCE
PTW DU О Normal Calibration factors3Chamber S/N 181019 PTW 1973 GSF 1974 IRD 1974
80 kV with 0.1 mm Cu1.01 1.02 1.02
added filtration
120 kV with 0.2 mm Cu 1.00 1.02 1.01added filtration
200 kV with 1.2 mm Cu added filtration
0.99 1.01 1.00
Cobalt-60 1.03 1.02 1.05
a PTW: Physikalisch-Technische Werkstâtten Dr. Pychlau KG, Freiburg im Breisgau. GSF: Gesellschaft fiir Strahlen- und Umweltforschung mbH, Munich.IRD: Instituto de Radioproteçao e Dosimetria, Rio de Janeiro.
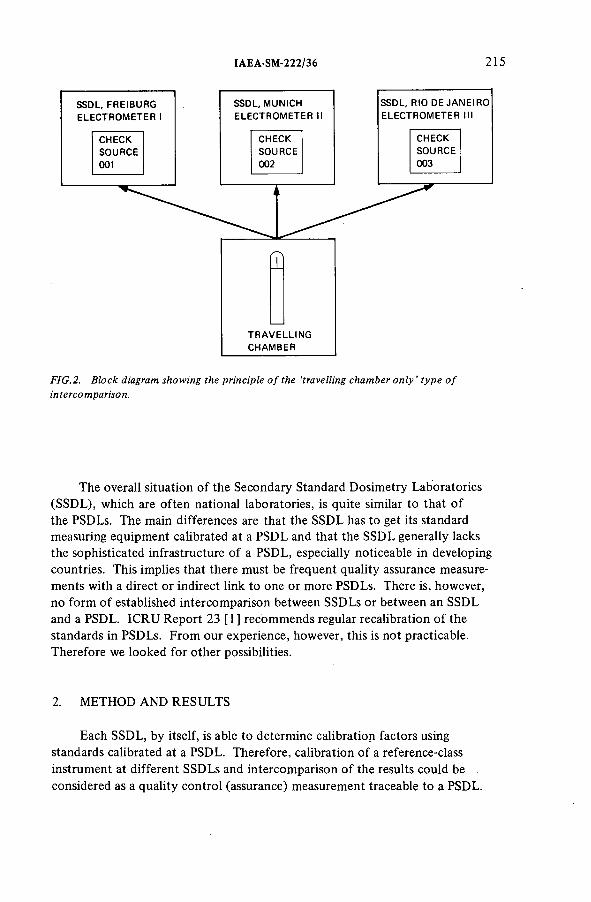
IAEA-SM-222/36 215
FIG .2. Block diagram showing the principle o f the ‘travelling chamber on ly’ type o f in terco mparison.
The overall situation o f the Secondary Standard Dosimetry Laboratories (SSDL), which are often national laboratories, is quite similar to that o f the PSDLs. The main differences are that the SSDL has to get its standard measuring equipment calibrated at a PSDL and that the SSDL generally lacks the sophisticated infrastructure o f a PSDL, especially noticeable in developing countries. This implies that there must be frequent quality assurance measurements with a direct or indirect link to one or more PSDLs. There is, however, no form o f established intercomparison between SSDLs or between an SSDL and a PSDL. ICRU Report 23 [1 ] recommends regular recalibration o f the standards in PSDLs. From our experience, however, this is not practicable. Therefore we looked for other possibilities.
2. METHOD AND RESULTS
Each SSDL, by itself, is able to determine calibration factors using standards calibrated at a PSDL. Therefore, calibration o f a reference-class instrument at different SSDLs and intercomparison o f the results could be considered as a quality control (assurance) measurement traceable to a PSDL.
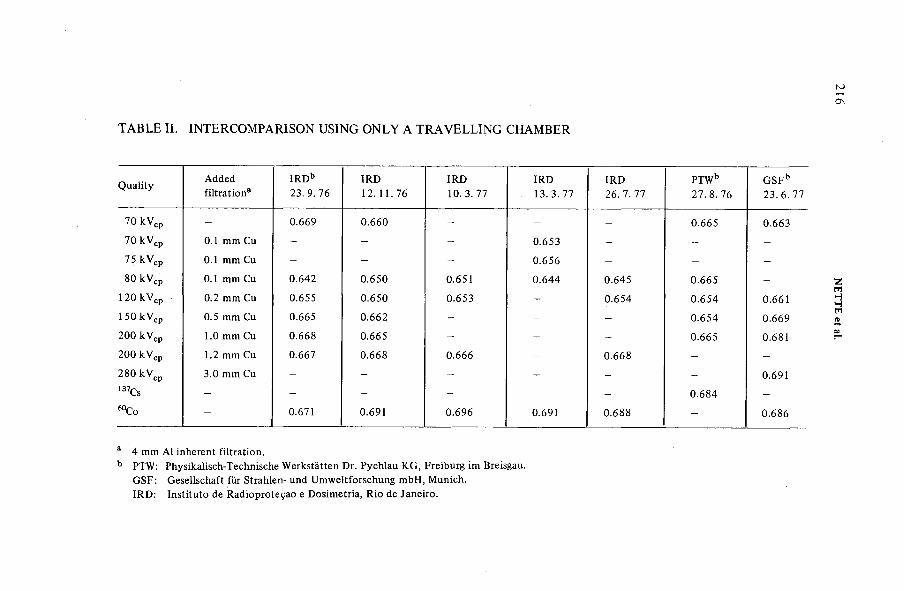
TABLE II. INTERCOMPARISON USING ONLY A TRAVELLING CHAMBER
Quality Addedfiltration3
IRDb23. 9. 76
IRD12. 11.76
IRD10. 3.77
IRD13.3.77
IRD26. 7. 77
PTWb 27.8. 76
GSFb 23. 6. 77
70 kVcp - 0.669 0.660 - - - 0.665 0.66370 kVcp 0.1 mm Cu - - - 0.653 - - -
75 kVcp 0.1 mm Cu - - - 0.656 - - -
80 kVcp 0.1 mm Cu 0.642 0.650 0.651 0.644 0.645 0.665 -120 kVcp 0.2 mm Cu 0.655 0.650 0.653 - 0.654 0.654 0.6611 50 kVcp 0.5 mm Cu 0.665 0.662 - - - 0.654 0.669200 kVcp 1.0 mm Cu 0.668 0.665 - - - 0.665 0.681
200 kVcp 1.2 mm Cu 0.667 0.668 0.666 - 0.668 - -
280 kVcp 3.0 mm Cu - - - - - - 0.691
137Cs - - - - - - 0.684 -
60Co - 0.671 0.691 0.696 0.691 0.688 - 0.686
3 4 mm Al inherent filtration.b PTW: Physikalisch-Technische Werkstàtten Dr. Pychlau KG, Freiburg im Breisgau.
GSF: Gesellschaft für Strahlen- und Umweltforschung mbH, Munich.IRD: Instituto de Radioproteçao e Dosimetría, R io de Janeiro.
216 N
ETTE et
al.
IAEA-SM-222/36 217
We used the reference-class dose-meter1 D u-0 with the ‘Normalkammer’ (normal chamber) and with an overall radioactive stability check source. This dosimetric system employs the stability check source to give a reference reading for adjusting the sensitivity o f the measuring system. Therefore only the check source and the chamber without the measuring system has to be transported to different locations since the different sensitivities o f the various measuring assemblies can be taken care o f by normalizing the response o f the chamber to the check source. Figure 1 demonstrates the procedure adopted. Calibration factors determined in such a way at three SSDLs are given in Table I. The results confirmed the feasibility o f such a type o f quality control.
The main obstacle encountered in the intercomparison that was undertaken, however, was arranging the transport o f the radioactive check source. To carry out the intercomparisons at all, unconventional solutions had, at times, to be adopted.
We therefore initiated a procedure in which only the chamber had to be transported. As an initial step one chamber was calibrated at the SSDL in Freiburg using three check sources. The readings obtained from these check sources were normalized to the calibration factor. Subsequently, each o f the three SSDLs received one o f these check sources.
From then on, the chamber alone was circulated and the reading obtained with the appropriate check source based at a particular SSDL was compared with the reading obtained at the first calibration to obtain a normalized calibration factor. This is then checked for consistency. The resulting intercomparison method is characterized in Fig. 2.
Preliminary results o f calibration factors measured in our SSDLs and based on normalization to intercompared check sources are reported in Table II.
3. DISCUSSION
As can be seen from Table II, the values o f the calibration factors show quite a variation, not only between different laboratories but also within one laboratory. The largest variation observed was 3.8%. Subsequently, a large part o f this variation was traced to movements o f the radioactive stability check source in the prototype holder. This difficulty has since been rectified. Hence, these preliminary measurements should not be considered as a formal intercomparison, nor should the readings be considered typical for the method.
The preliminary results confirm the feasibility o f the method suggested.Furthermore, we could imagine that PSDLs might also participate by having
a similar check source based at the PSDL, this then acting as one link in the
1 Physikalisch-Technische Werkstâtten Dr. Pychlan KG, Federal Republic of Germany.
218 NETTE et al.
intercomparison. Participation by a PSDL in such intercomparisons would establish a direct link (traceability) between the PSDL and SSDLs.
REFERENCES
[ 1 ] INTERNATIONAL COMMISSION ON RADIATION UNITS AND MEASUREMENTS, Measurement of Absorbed Dose in a Phantom Irradiated by a Single Beam of X or Gamma Rays, ICRU Report 23, ICRU, Washington, DC (1973).
DISCUSSION
K.E. DUFTSCHMID: Do you have any information on the precision and long-term stability o f the radioactive check sources you use?
P. NETTE: The short-term stability (relative standard deviation) o f the check source response is about 0.05%, the long-term stability (tw o years) about 0.6%.
IAEA-SM-222/34
THE REGIONAL CALIBRATION LABORATORY AT THE M.D. ANDERSON HOSPITALL.J. HUMPHRIES, R.J. SHALEK Department o f Physics,The University o f Texas System Cancer Center,M.D. Anderson Hospital and Tumor Institute,Houston, Texas,United States o f America
Abstract
THE REGIONAL CALIBRATION LABORATO RY AT THE M.D. ANDERSON HOSPITAL.The Regional Calibration Laboratory located at the University of Texas System Cancer
Center M.D. Anderson Hospital and Tumor Institute in Houston, Texas, has been accredited by the American Association of Physicists in Medicine since 1971. The laboratory is principally involved with the calibration of ionization chambers and electrometers that are used to calibrate therapy machines. Calibrations at beam qualities ranging from 2 mm A1 to 3 mm Cu half-value thickness, plus cobalt-60 radiation are performed for approximately 80 institutions per year. The instrumentation and methods of calibration utilized by the laboratory are described. Several quality assurance checks developed by the laboratory are also presented. These include calibration of cable-connected ionization chambers utilizing both the rate and integrated responses as recorded by a fast-feedback operational-amplifier electrometer. In addition, this laboratory is planning to provide a mailed dose meter check service, which should detect any significant alteration of the instrument sensitivity during transit and a possible incorrect application of the calibration factor on the part of the instrument user.
INTRODUCTION
The Regional Calibration Laboratory (RCL) located at the University of Texas System Cancer Center M. D. Anderson Hospital and Tumor Institute in Houston, Texas, was accredited by the American Association of Physicists in Medicine (AAPM) in 1971.The other two accredited RCL's in the United States are located at the Memorial Sloan-Kettering Cancer Center in New York City and the Victoreen Instrument Division in Cleveland, Ohio. The function of these RCL's is to calibrate field instruments utilizing reference-class instruments that have been calibrated at the National Bureau of Standards in Washington, D. C.
For several years prior to 1971, the M. D. Anderson RCL offered calibration services to nearby physicists under the auspices of an organization called the Texas Regional Medical Physicists. With the AAPM accreditation came recognition which has
219
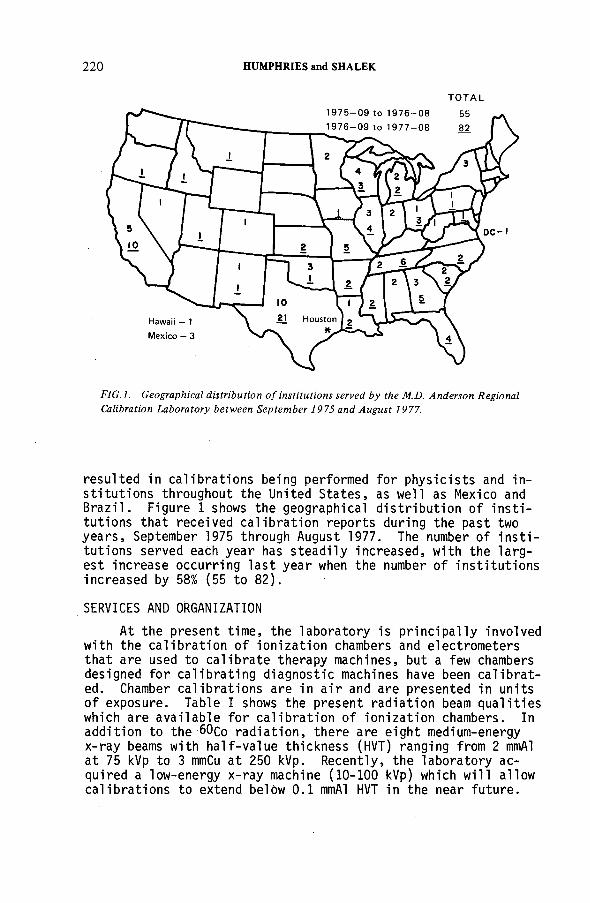
220 HUMPHRIES and SHALEK
T O T A L
FIG .l. Geographical distribution o f institutions served by the M.D. Anderson Regional Calibration Laboratory between September 1975 and August 1977.
resulted in calibrations being performed for physicists and institutions throughout the United States, as well as Mexico and Brazil. Figure 1 shows the geographical distribution of institutions that received calibration reports during the past two years, September 1975 through August 1977. The number of institutions served each year has steadily increased, with the largest increase occurring last year when the number of institutions increased by 58% (55 to 82).
SERVICES AND ORGANIZATION
At the present time, the laboratory is principally involved with the calibration of ionization chambers and electrometers that are used to calibrate therapy machines, but a few chambers designed for calibrating diagnostic machines have been calibrated. Chamber calibrations are in air and are presented in units of exposure. Table I shows the present radiation beam qualities which are available for calibration of ionization chambers. In addition to the 60Co radiation, there are eight medium-energy x-ray beams with half-value thickness (HVT) ranging from 2 mmAl at 75 kVp to 3 mmCu at 250 kVp. Recently, the laboratory acquired a low-energy x-ray machine (10-100 kVp) which will allow calibrations to extend below 0.1 mmAl HVT in the near future.
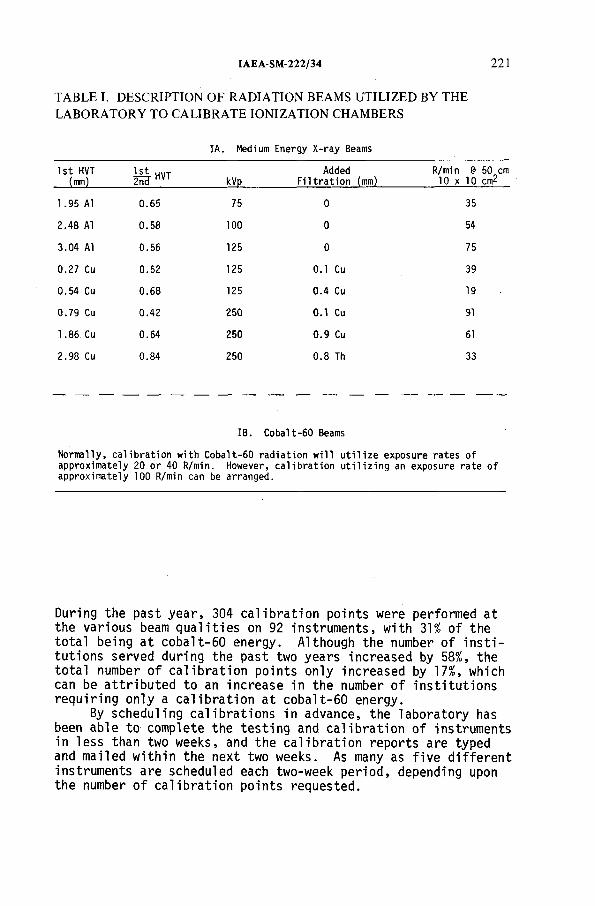
IAEA-SM-222/34 221
TABLE I. DESCRIPTION OF RADIATION BEAMS UTILIZED BY THE LAB O R ATO RY TO CALIBRATE IONIZATION CHAMBERS
IA. Medium Energy X-ray Beams
1st HVT (mm) ш т kVp
Added Filtration (mm)
R/min 1? 10 x 10
1.95 A1 0.65 75 0 35
2.48 A! 0.58 100 0 54
3.04 A1 0.56 125 0 75
0.27 Cu 0.52 125 0.1 Cu 39
0.54 Cu 0.68 125 0.4 Cu 19
0.79 Cu 0.42 250 0.1 Cu 91
1.86 Cu 0.64 250 0.9 Cu 61
2.98 Cu 0.84 250 0.8 Th 33
IB. Cobalt-60 Beams
Normally, calibration with Cobalt-60 radiation will utilize exposure rates of approximately 20 or 40 R/min. However, calibration utilizing an exposure rate of approximately 100 R/min can be arranged.
During the past year, 304 calibration points were performed at the various beam qualities on 92 instruments, with 31% of the total being at cobalt-60 energy. Although the number of institutions served during the past two years increased by 58%, the total number of calibration points only increased by 17%, which can be attributed to an increase in the number of institutions requiring only a calibration at cobalt-60 energy.
By scheduling calibrations in advance, the laboratory has been able to complete the testing and calibration of instruments in less than two weeks, and the calibration reports are typed and mailed within the next two weeks. As many as five different instruments are scheduled each two-week period, depending upon the number of calibration points requested.
222 HUMPHRIES and SHALEK
TABLE II. LIST OF THE REFERENCE-CLASS INSTRUMENTS UTILIZED BY THE LAB O R ATO RY TO TRANSFER CALIBRATION FACTORS FROM THE NATIONAL BUREAU OF STANDARDS TO FIELD INSTRUMENTS
IIA. Exposure Standards: (NBS calibration biennially)(2) Shonka-Wyckoff chamber, 3.6 cc, 0.25 mm air equivalent wall(1) Shonka-Wyckoff chamber, 3.6 cc, 2.54 mm air equivalent wall(1) Exradin Model A-3, 3.6 cc, 2.54 mm air equivalent wall(1) Victoreen Model 415 A, 2 cc, 2 mil mylar end-window
IIB. Capacitance Standards: (NBS traceable calibration biennially)(1) General Radio Type 1404-A, nitrogen sealed, 1000 pF(1) General Radio Type 1404-B, nitrogen sealed, 100 pF
IIC. Voltage Standards: (NBS traceable calibration--*annually, **biennially)(1) Keithley Model 241, Regulated High Voltage Supply, 0-1 kV
*(1) Data Precision Model 3500, 5^ digit, digital multimeter(2) Data Precision Model 245, 4^ digit, digital multimeter
**(1) Eppley Model 100, Standard Cell**(l) Weston Model 3, Type 4, Standard Cell
IID. Other RCL Instruments:(3) Keithley Model 602 electrometer
Keithley Model 261 pi coampere sourceTaylor Model 6204 M aneroid barometer, 0.5 mu Hg/div. 0Fisher Model 15-043A total immersion thermometer, 1-51°C, 0.1 C/div. Aluminized-mylar window transmission monitor chamber
The laboratory staff consists of a quarter-time secretary, a full-time technician, a half-time associate director, and a director who reviews calibration reports and participates in policy decisions. The dedicated space allotted to the laboratory consists of two rooms of approximately 235 square feet each. One room serves as office space for the associate director and technician and also as a laboratory for precalibration testing of the ion chambers and electrometers. The other room houses the beam- producing machines: Picker C-1000 cobalt unit, General ElectricMaximar 250 x-ray machine, and Maximar 100 x-ray machine. However, these machines have only recently been acquired, and they are not yet ready to be used for calibration purposes. Consequently, the calibrations are still being performed with the hospital's clinical machines, which are an AECL Eldorado 8 cobalt unit and a Philips RT-250 x-ray machine.
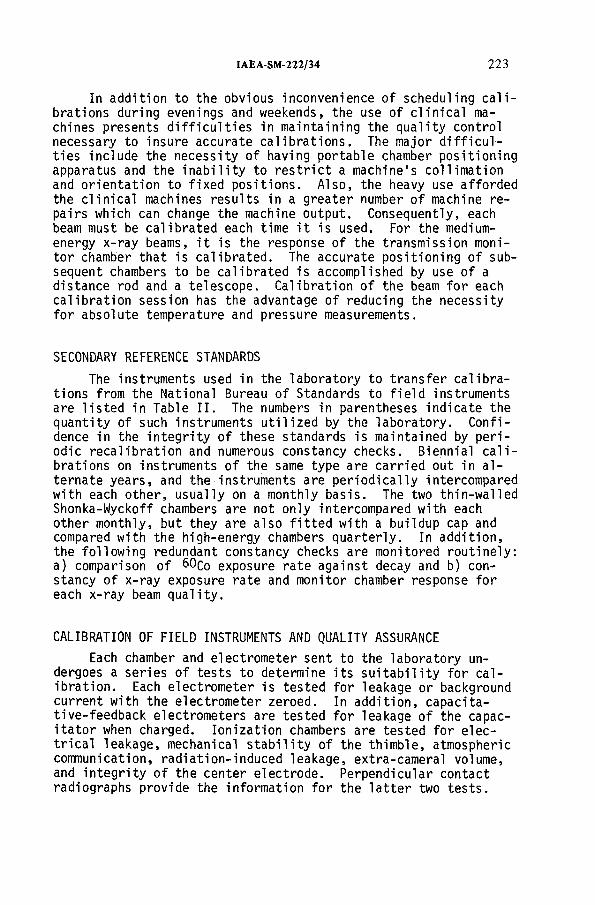
IAEA-SM-222/34 223
In addition to the obvious inconvenience of scheduling calibrations during evenings and weekends, the use of clinical machines presents difficulties in maintaining the quality control necessary to insure accurate calibrations. The major difficulties include the necessity of having portable chamber positioning apparatus and the inability to restrict a machine's collimation and orientation to fixed positions. Also, the heavy use afforded the clinical machines results in a greater number of machine repairs which can change the machine output. Consequently, each beam must be calibrated each time it is used. For the medium- energy x-ray beams, it is the response of the transmission monitor chamber that is calibrated. The accurate positioning of subsequent chambers to be calibrated is accomplished by use of a distance rod and a telescope. Calibration of the beam for each calibration session has the advantage of reducing the necessity for absolute temperature and pressure measurements.
SECONDARY REFERENCE STANDARDS
The instruments used in the laboratory to transfer calibrations from the National Bureau of Standards to field instruments are listed in Table II. The numbers in parentheses indicate the quantity of such instruments utilized by the laboratory. Confidence in the integrity of these standards is maintained by periodic recalibration and numerous constancy checks. Biennial calibrations on instruments of the same type are carried out in alternate years, and the instruments are periodically intercompared with each other, usually on a monthly basis. The two thin-walled Shonka-Wyckoff chambers are not only intercompared with each other monthly, but they are also fitted with a buildup cap and compared with the high-energy chambers quarterly. In addition, the following redundant constancy checks are monitored routinely: a) comparison of 60co exposure rate against decay and b) constancy of x-ray exposure rate and monitor chamber response for each x-ray beam quality.
CALIBRATION OF FIELD INSTRUMENTS AND QUALITY ASSURANCE
Each chamber and electrometer sent to the laboratory undergoes a series of tests to determine its suitability for calibration. Each electrometer is tested for leakage or background current with the electrometer zeroed. In addition, capacita- tive-feedback electrometers are tested for leakage of the capac- itator when charged. Ionization chambers are tested for electrical leakage, mechanical stability of the thimble, atmospheric communication, radiation-induced leakage, extra-cameral volume, and integrity of the center electrode. Perpendicular contact radiographs provide the information for the latter two tests.
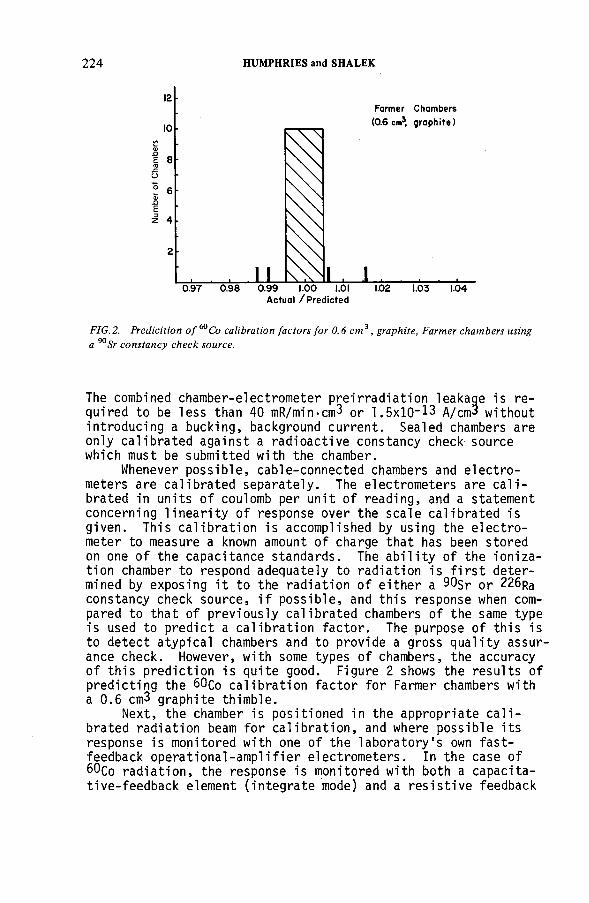
224 HUMPHRIES and SHALEK
Actual / Predicted
FIG.2. Predicition o f 60Co calibration factors for 0.6 c m3 , graphite, Farmer chambers using a 90Sr constancy check source.
The combined chamber-electrometer preirradiation leakage is required to be less than 40 mR/min-cm^ or 1.5x 10”13 д/спн without introducing a bucking, background current. Sealed chambers are only calibrated against a radioactive constancy check source which must be submitted with the chamber.
Whenever possible, cable-connected chambers and electrometers are calibrated separately. The electrometers are calibrated in units of coulomb per unit of reading, and a statement concerning linearity of response over the scale calibrated is given. This calibration is accomplished by using the electrometer to measure a known amount of charge that has been stored on one of the capacitance standards. The ability of the ionization chamber to respond adequately to radiation is first determined by exposing it to the radiation of either a 90$r or 226r9 constancy check source, if possible, and this response when compared to that of previously calibrated chambers of the same type is used to predict a calibration factor. The purpose of this is to detect atypical chambers and to provide a gross quality assurance check. However, with some types of chambers, the accuracy of this prediction is quite good. Figure 2 shows the results of predicting the 60co calibration factor for Farmer chambers with a 0.6 cm3 graphite thimble.
Next, the chamber is positioned in the appropriate calibrated radiation beam for calibration, and where possible its response is monitored with one of the laboratory's own fast- feedback operational-amplifier electrometers. In the case of 60co radiation, the response is monitored with both a capacita- tive-feedback element (integrate mode) and a resistive feedback
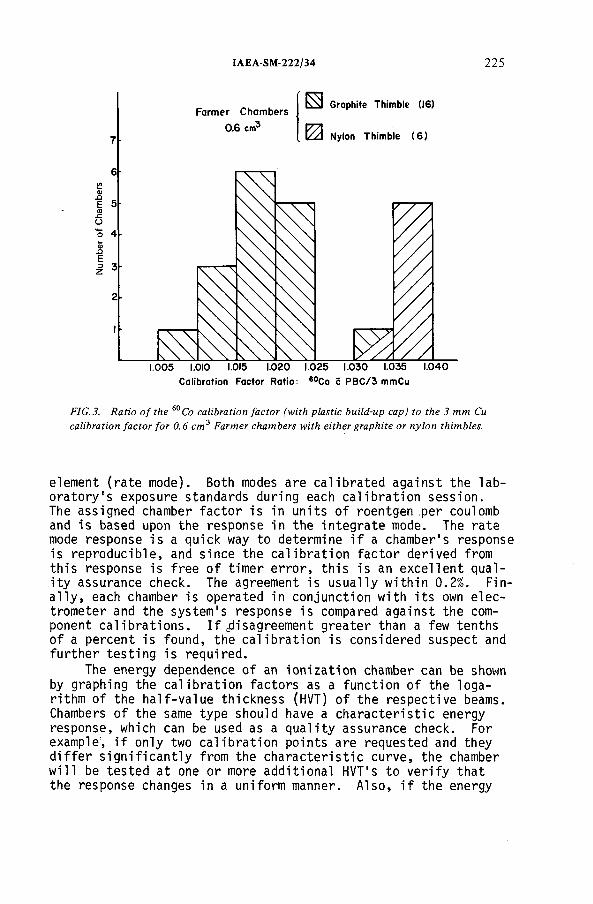
IAEA-SM-222/34 225
Calibration Factor Ratio: eoCo с РВС/3 mmCu
FIG.3. Ratio o f the 60Co calibration factor (with plastic build-up cap) to the 3 mm Cu calibration factor for 0.6 cm3 Farmer chambers with either graphite or nylon thimbles.
element (rate mode). Both modes are calibrated against the laboratory's exposure standards during each calibration session.The assigned chamber factor is in units of roentgen per coulomb and is based upon the response in the integrate mode. The rate mode response is a quick way to determine if a chamber's response is reproducible, and since the calibration factor derived from this response is free of timer error, this is an excellent quality assurance check. The agreement is usually within 0.2%. Finally, each chamber is operated in conjunction with its own electrometer and the system's response is compared against the component calibrations. If ^disagreement greater than a few tenths of a percent is found, the calibration is considered suspect and further testing is required.
The energy dependence of an ionization chamber can be shown by graphing the calibration factors as a function of the logarithm of the half-value thickness (HVT) of the respective beams. Chambers of the same type should have a characteristic energy response, which can be used as a quality assurance check. For example, if only two calibration points are requested and they differ significantly from the characteristic curve, the chamber will be tested at one or more additional HVT's to verify that the response changes in a uniform manner. Also, if the energy
226 HUMPHRIES and SHALEK
DISCLAIMER
Proper function and r e l i a b i l i t y o f th e radiation ma¿ lining devices d escribed in th is document are highly dependent upon handling and use. Therefo r e , th e duration o f r e s p o n s ib il i ty o f The U niversity o f Texas System Caneen Center, М. V. A nderson H ospital and Tumor In s t i tu te , and i t s employeei f on. th e ca lib ra tion r esu lts extendi on ly to th e tim e th e instruments lea v e the М. V. Andeuon Hospital, prem ises, i t i i recommended tha t th e instrument илел esta b lish an appropriate technique o f monitoring th e constancy o f the instrument response b e fore and a l t e r ¿ ts submission to th e Regional Calibration Laboratory and on a regatar b a iii th e r ea fte r . In addition , i t i i th e екргелл r e s p o n s ib il i ty o f th e instrum ent u ier to аллиле him self (by personal communicat io n i f5 песеьлолу) th a t his in terp re ta tio n o f th e inform ation in th i i document i s con s isten t with th e in terp re ta tio n intended by th e Regional Calibration Laboratory.
FIG .4. Disclaimer which is included with each calibration report.
response is not sufficiently defined by the requested calibration points, the calibration report will include a statement warning the instrument user that interpolation or extrapolation of the data may result in significant errors. One quality assurance check which checks for internal consistency between medium- energy x-ray calibrations and the 60co calibration is to monitor the ratio of the 60co factor to the 3 mmCu calibration factor for chambers of the same type. Figure 3 shows this ratio for several 0 .6 cm3 Farmer chambers. Both nylon and graphite thimble chambers exhibit a characteristic ratio. If for a given chamber this ratio differs by more than 1% from the norm, the calibrations will be rechecked.
In addition to the internal quality assurance checks given above, the laboratory also participates once each year in a round-robin intercomparison among the other two AAPM accredited Regional Calibration Laboratories and the National Bureau of Standards. The discrepancy between this laboratory and the Bureau for the last such intercomparison was 0.5% for calibrations at two x-ray beam qualities and less than 0.1% for two calibrations utilizing 60co radiation.
REPORT OF CALIBRATION
The calibration report specifies the instrument calibrated; the switch settings, scales, and output mode utilized; and the calibration conditions which include chamber leakage and orientation, polarization potential, beam quality and exposure rate.
IAEA-SM-222/34 2 2 7
The calibration factors are currently referenced to 295.2 К and 760 torr for chambers which communicate with the atmosphere. The report also contains a disclaimer which states that the responsibility for the validity of the calibration results after the instrument leaves the laboratory is the instrument user's and that the user should establish appropriate constancy check procedures. The disclaimer is shown in Figure 4. However, even though the laboratory disclaims legal responsibility after the instrument leaves the premises, the laboratory is planning to offer a mailed, thermoluminescent dosimeter (TLD) check service, which should detect significant alteration of the instrument sensitivity during transit and incorrect application of the calibration factor on the part of the instrument user. When implemented, the TLD check will utilize TLD-100 Li F throw-away powder capsules, which have a standard deviation for individual readings of 1.2%.
CONCLUSION
The demand for calibration of therapy ionization chambers in the United States continues to increase, but this laboratory has been able to meet the demand while providing a reasonable instrument turn-around time and the quality assurance checks required to insure reliable calibrations.

IAEA-SM-222/12
PRIMARY DOSIMETRIC STANDARDS AT THE MEMORIAL SLOAN-KETTERING CANCER CENTER*
J.G. HOLT, J.C. McDONALD, A. BUFFA, D. PERRY, I. MA, J.S. LAUGHLIN
Memorial Sloan-Kettering Cancer Center, New York, United States o f America
Abstract
PR IM A R Y D O SIM ETR IC STAND ARD S AT T H E M EM O R IA L SLO AN -KETTER IN G CAN CER CENTER.
Ionometric and calorimetric primary standards have been developed at this Center to provide absorbed dose measurements of the radiation fields used for the radiotherapeutic and radiobiological programmes. The radiation sources include “ Co gamma-rays, high energy X-rays, electron beams and cyclotron-produced fast neutrons. Cylindrical, parallel-plate ionization chambers have been constructed of polystyrene with a well-defined, electrically guarded, collection volume. The nominal collection area is 5 cm2, with variable spacing.The physical volume, accurately determined by mechanical measurements, can be compared to electrical capacitance measurements. Radiation measurements are carried out in polystyrene, from which the dose to tissue is calculated. These chambers can be considered primary dosimetric standards since they do not rely on a separate radiological calibration.A tissue-equivalent plastic calorimeter with a central cylindrical absorbing element, or core,2.0 cm in diameter and 0.2 cm thick, has also been developed. Its calibration is carried out by electrical heating of the core, and the dose to tissue is determined directly from electrical, mechanical and thermal measurements. The construction and operation of these instruments is discussed, and an intercomparison of these systems is described. The overall agreement in this set of measurements is within ± 1% for “ Co gamma rays.
1. INTRODUCTION
The initial development of independent methods for the measurement of absorbed dose was necessitated by the absence of national or international standards. It has long been recognized at this Center I1 '2 ! that primary calorimetric and ionometric techniques should be developed and applied to problems in clinical radiotherapy as well as in experimental radiobiology. At present absorbed dose calibrations are available from the National Bureau of Standards (NBS) only for Co-60 radiation. No calibrations are yet available for high energy photon or electron beams. However, high energy photons and electrons are being employed more frequently in the management of human cancer. In addition, there are on-going clinical trials of cyclotron produced fast neutrons.
* This work was supported in part by the United States Department of Energy Contract EY-76-S-02-3522 and by the National Cancer Institute Grant 08748-12.
229
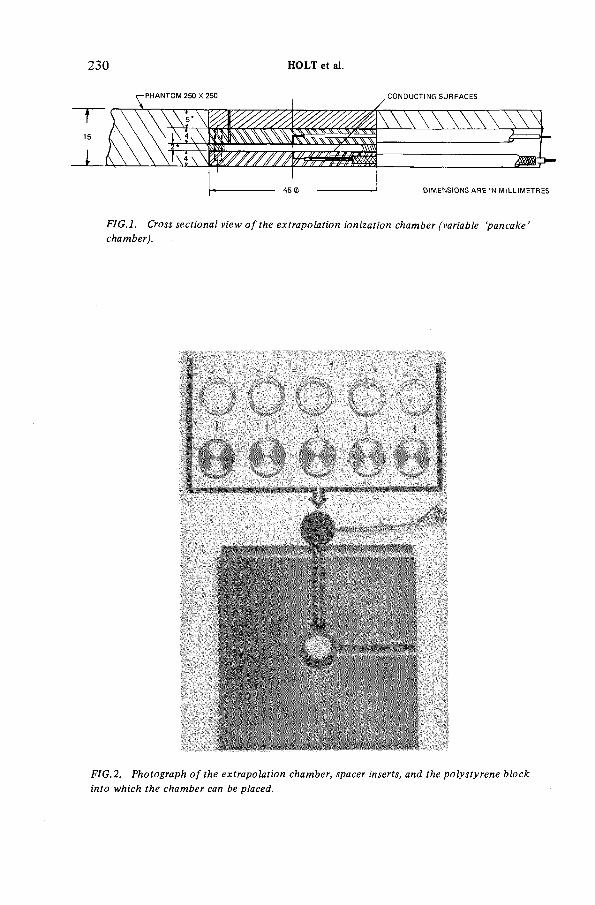
230 HOLT et al.
FIG .l. Cross sectional view o f the extrapolation ionization chamber (variable ‘pancake’ chamber).
FIG.2. Photograph o f the extrapolation chamber, spacer inserts, and the polystyrene block into which the chamber can be placed.
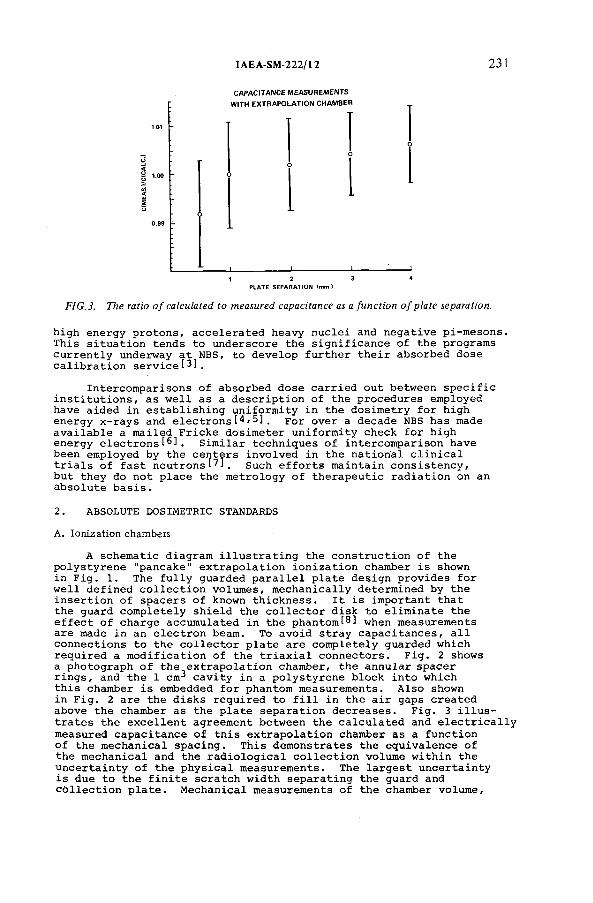
IAEA-SM-222/12 231
CAPACITANCE MEASUREMENTS WITH EXTRAPOLATION CHAMBER
________ ________ I___________________ I------------------------------ 1------------------------------11 2 3 4
P L A T E S E P A R A T I O N ( m m )
FIG.3. The ratio o f calculated to measured capacitance as a function o f plate separation.
high energy protons, accelerated heavy nuclei and negative pi-mesons. This situation tends to underscore the significance of the programs currently underway at NBS, to develop further their absorbed dosec a l i b r a t i o n s e r v i c e ^ ] .
Intercomparisons of absorbed dose carried out between specific institutions, as well as a description of the procedures employed have aided in establishing uniformity in the dosimetry for high energy x-rays and e l e c t r o n s » 5]. For over a decade NBS has made available a mailed Fricke dosimeter uniformity check for high energy electrons 1^1. Similar techniques of intercomparison have been employed by the centers involved in the national clinical trials of fast n e u t r o n s S u c h efforts maintain consistency, but they do not place the metrology of therapeutic radiation on an absolute basis.
2 . ABSOLUTE DOSIMETRIC STANDARDS
A. Ionization chambers
A schematic diagram illustrating the construction of the polystyrene "pancake" extrapolation ionization chamber is shown in Fig. 1. The fully guarded parallel plate design provides for well defined collection volumes, mechanically determined by the insertion of spacers of known thickness. It is important that the guard completely shield the collector disk to eliminate the effect of charge accumulated in the phantom 181 when measurements are made in an electron beam. To avoid stray capacitances, all connections to the collector plate are completely guarded which required a modification of the triaxial connectors. Fig. 2 shows a photograph of the extrapolation chamber, the annular spacer rin g s , and the 1 c m 3 cavity in a polystyrene block into which this chamber is embedded for phantom measurements. Also shown in Fig. 2 are the disks required to fill in the air gaps created above the chamber as the plate separation decreases. Fig. 3 illustrates the excellent agreement between the calculated and electrically measured capacitance of this extrapolation chamber as a function of the mechanical spacing. This demonstrates the equivalence of the mechanical and the radiological collection volume within the uncertainty of the physical measurements. The largest uncertainty is due to the finite scratch width separating the guard and collection plate. Mechanical measurements of the chamber volume,
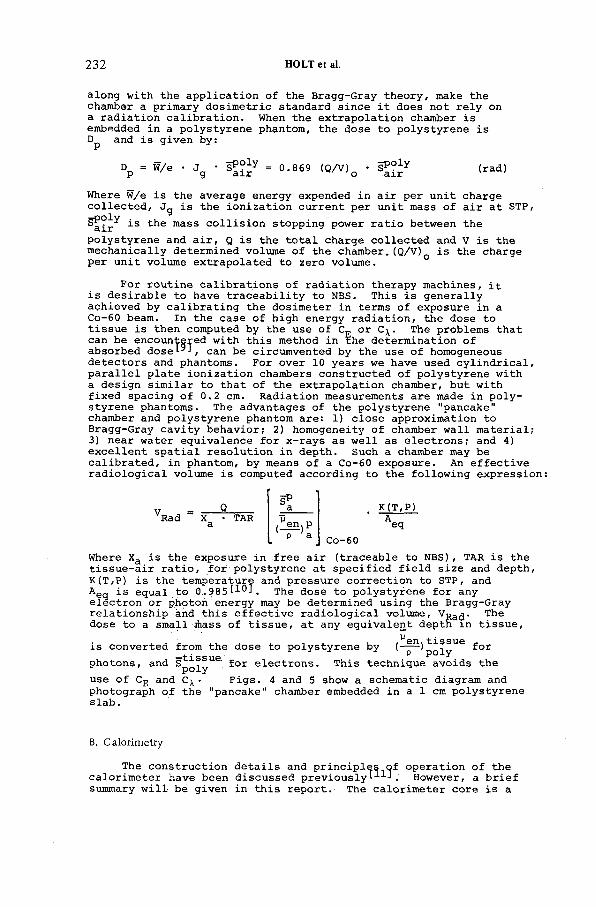
232 HOLT et al.
along with the application of the Bragg-Gray theory, make the chamber a primary dosimetric standard since it does not rely on a radiation calibration. When the extrapolation chamber is embedded in a polystyrene phantom, the dose to polystyrene is
Where W/e is the average energy expended in air per unit charge collected, Jg is the ionization current per unit mass of air at STP,
is the mass collision stopping power ratio between the
polystyrene and air, Q is the total charge collected and V is the mechanically determined volume of the chamber.(Q/V)q is the charge per unit volume extrapolated to zero volume.
For routine calibrations of radiation therapy machines, it is desirable to have traceability to NBS. This is generally achieved by calibrating the dosimeter in terms of exposure in a Co-60 beam. In the case of high energy radiation, the dose to tissue is then computed by the use of CE or C^. The problems that can be encountered with this method in the determination of absorbed doseL ‘, can be circumvented by the use of homogeneous detectors and phantoms. For over 10 years we have used cylindrical, parallel plate ionization chambers constructed of polystyrene with a design similar to that of the extrapolation chamber, but with fixed spacing of 0.2 cm. Radiation measurements are made in polystyrene phantoms. The advantages of the polystyrene "pancake" chamber and polystyrene phantom are: 1) close approximation to Bragg-Gray cavity behavior; 2) homogeneity of chamber wall material; 3) near water equivalence for x-rays as well as electrons; and 4) excellent spatial resolution in depth. Such a chamber may be calibrated, in phantom, by means of a Co-60 exposure. An effective radiological volume is computed according to the following expression
Where Xa is the exposure in free air (traceable to N B S ) , TAR is the tissue-air ratio, for polystyrene at specified field size and depth, K(T,P) is the temperature and pressure correction to STP, and A eq is equal to 0.985 Í-*-®!. The dose to polystyrene for any electron or ghoton energy may be determined using the Bragg-Gray relationship and this effective radiological volume, V p a(j. The dose to a small mass of tissue, at any equivalent depth m tissue,
^en tissueis converted from the dose to polystyrene by (--- )D O iv f°r
— t i ss ue ' P P Уphotons, and spoiy f°r electrons. This technique avoids the
use of CE and C ^ • Figs. 4 and 5 show a schematic diagram andphotograph of the "pancake" chamber embedded in a 1 cm polystyrene slab.
B. Calorimetry
(rad)
V — — Rad X
a
Q K(T,P)
The construction details and principles of operation of the calorimeter have been discussed p r e v i o u s l y . However, a brief summary will be given in this report. The calorimeter core is a
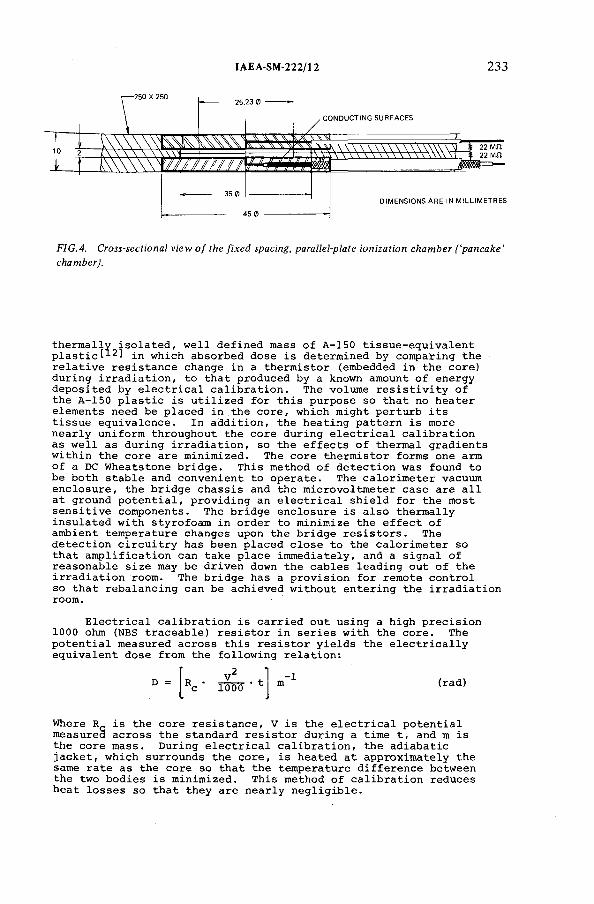
IAEA-SM-222/12 233
FIG.4. Cross-sectional view o f the fixed spacing, parallel-plate ionization chamber ('pancake' chamber}.
thermally isolated, well defined mass of A-150 tissue-equivalent p l a s t i c i n which absorbed dose is determined by comparing the relative resistance change in a thermistor (embedded in the core) during irradiation, to that produced by a known amount of energy deposited by electrical calibration. The volume resistivity of the A-150 plastic is utilized for this purpose so that no heater elements need be placed in the core, which might perturb its tissue equivalence. In addition, the heating pattern is more nearly uniform throughout the core during electrical calibration as well as during irradiation, so the effects of thermal gradients within the core are minimized. The core thermistor forms one arm of a DC Wheatstone bridge. This method of detection was found to be both stable and convenient to operate. The calorimeter vacuum enclosure, the bridge chassis and the microvoltmeter case are all at ground potential, providing an electrical shield for the most sensitive components. The bridge enclosure is also thermally insulated with styrofoam in order to minimize the effect of ambient temperature changes upon the bridge resistors. The detection circuitry has been placed close to the calorimeter so that amplification can take place immediately, and a signal of reasonable size may be driven down the cables leading out of the irradiation room. The bridge has a provision for remote control so that rebalancing can be achieved without entering the irradiation room.
Electrical calibration is carried out using a high precision 1000 ohm (NBS traceable) resistor in series with the core. The potential measured across this resistor yields the electrically equivalent dose from the following relation:
D = V1000
-1(rad)
Where R„ is the core resistance, V is the electrical potential measured across the standard resistor during a time t, and m is the core mass. During electrical calibration, the adiabatic jacket, which surrounds the core, is heated at approximately the same rate as the core so that the temperature difference between the two bodies is minimized. This method of calibration reduces heat losses so that they are nearly negligible.
234 HOLT et al.
FIG.S. Photograph showing the fixed spacing chamber atop a polystyrene phantom in place under the Co-60 teletherapy unit. The 5 cm thick polystyrene block has been removed to show the chamber.
3. INTERCOMPARISON OF STANDARDS
It is generally agreed that a calibration of absorbed dose in a Co-60 field should be carried out at a depth of 5 cm in water or tissue-equivalent material 113]. jt represents a depth which is clinically meaningful'since many tumors are treated at such a depth. In this intercomparison, the ionization chamber
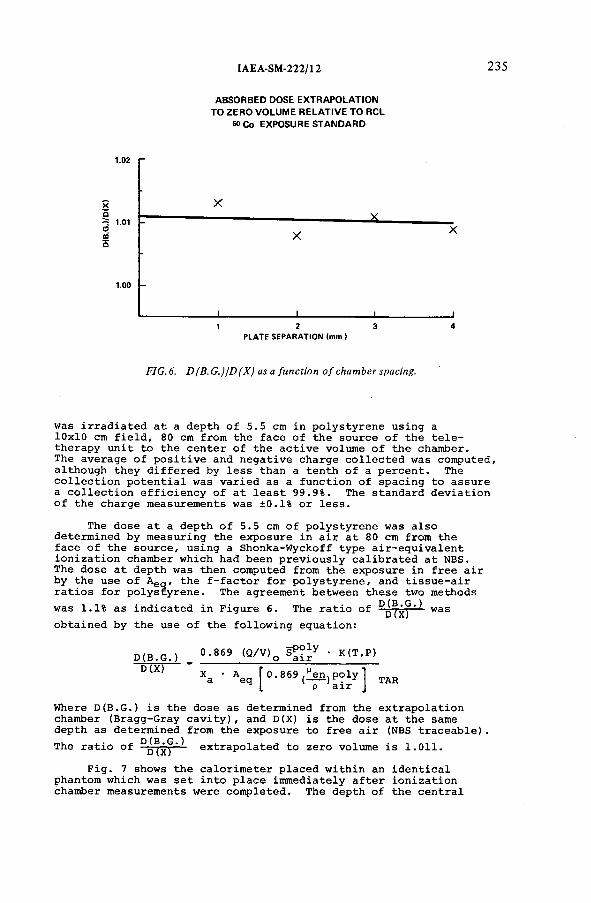
I AEA-SM-222/12 235
ABSORBED DOSE EXTRAPOLATION TO ZERO VOLUME RELATIVE TO RCL
60 Co EXPOSURE STANDARD
P LA TE SE PA RAT IO N (mm )
FIG.6. D(B.G.)/D(X) as a function o f chamber spacing.
was irradiated at a depth of 5.5 cm in polystyrene using a 10x10 cm field, 80 cm from the face of the source of the teletherapy unit to the center of the active volume of the chamber.The average of positive and negative charge collected was computed, although they differed by less than a tenth of a percent. The collection potential was varied as a function of spacing to assure a collection efficiency of at least 99.9%. The standard deviation of the charge measurements was ±0.1% or less.
The dose at a depth of 5.5 cm of polystyrene was also determined by measuring the exposure in air at 80 cm from the face of the source, using a Shonka-Wyckoff type air-equivalent ionization chamber which had been previously calibrated at NBS.The dose at depth was then computed from the exposure in free air by the use of A e g , the f-factor for polystyrene, and tissue-air ratios for polystyrene. The agreement between these two methods
r\ / n p \was 1.1% as indicated in Figure 6. The ratio of ^ ̂ * was
obtained by the use of the following equation:
D (B . G . ) , 0 - 8 6 9 (Q /V ) 0 Si*1/ ■ K ( T ' P)
D(X1 ’ X a • A eq f 0-869 ^en poly I TARL p a ir J
Where D(B.G.) is the dose as determined from the extrapolation chamber (Bragg-Gray cavity), and D(X) is the dose at the same depth as determined from the exposure to free air (NBS traceable).
D (B G )The ratio of extrapolated to zero volume is 1.011.
Fig. 7 shows the calorimeter placed within an identical phantom which was set into place immediately after ionization chamber measurements were completed. The depth of the central
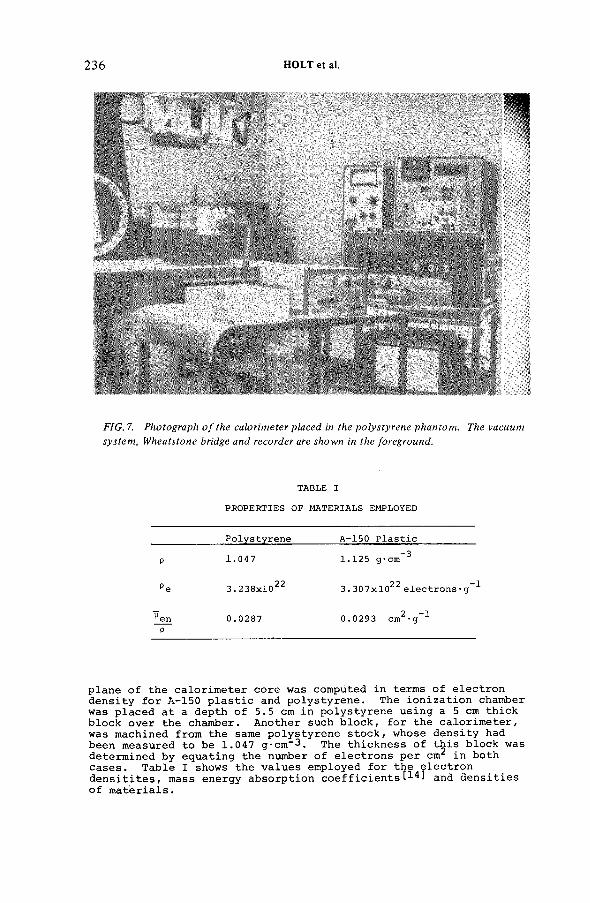
236 HOLT et al.
FIG. 7. Photograph o f the calorimeter placed in the polystyrene phantom. The vacuum system, Wheatstone bridge and recorder are shown in the foreground.
TABLE I
PROPERTIES OF MATERIALS EMPLOYED
Polystyrene A-150 Plastic
p 1.047 1.125 g-cm'3
pe 3.238xl022 3 . 3 0 7 x 1 0 ^ electrons • g
~^enP
0.0287 0.0293 cm 2 -g-1
plane of the calorimeter core was compüted in terms of electron density for A-150 plastic and polystyrene. The ionization chamber was placed at a depth of 5.5 cm in polystyrene using a 5 cm thick block over the chamber. Another such block, for the calorimeter, was machined from the same polystyrene stock, whose density had been measured to be 1.047 g-cm- 3. The thickness of this block was determined by equating the number of electrons per cm in both cases. Table I shows the values employed for the electron densitites, mass energy absorption c o e f f i c i e n t s an¿j densities of materials.
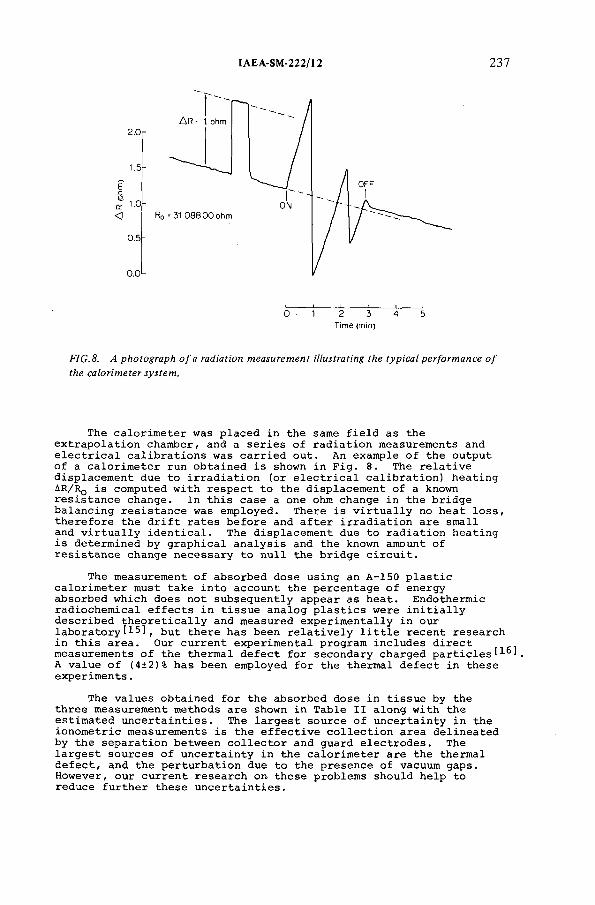
IAEA-SM-222/12 237
0 ~ 1 2 3 4 5Time (min)
F I G .8. A p h o t o g r a p h o f a ra d ia t io n m e a s u r e m e n t i llu s tra tin g t h e t y p i c a l p e r f o r m a n c e o f
t h e c a l o r i m e t e r s y s t e m .
The calorimeter was placed in the same field as the extrapolation chamber, and a series of radiation measurements and electrical calibrations was carried out. An example of the output of a calorimeter run obtained is shown in Fig. 8. The relative displacement due to irradiation (or electrical calibration) heating AR/Rq is computed with respect to the displacement of a known resistance change. In this case a one ohm change in the bridge balancing resistance was employed. There is virtually no heat loss, therefore the drift rates before and after irradiation are small and virtually identical. The displacement due to radiation heating is determined by graphical analysis and the known amount of resistance change necessary to null the bridge circuit.
The measurement of absorbed dose using an A-150 plastic calorimeter must take into account the percentage of energy absorbed which does not subsequently appear as heat. Endothermie radiochemical effects in tissue analog plastics were initially described theoretically and measured experimentally in our l a b o r a t o r y , but there has been relatively little recent research in this area. Our current experimental program includes direct measurements of the thermal defect for secondary charged particles 4 ^. A value of (4±2)% has been employed for the thermal defect in these experiments.
The values obtained for the absorbed dose in tissue by the three measurement methods are shown in Table II along with the estimated uncertainties. The largest source of uncertainty in the ionometric measurements is the effective collection area delineated by the separation between collector and guard electrodes. The largest sources of uncertainty in the calorimeter are the thermal defect, and the perturbation due to the presence of vacuum gaps. However, our current research on these problems should help to reduce further these uncertainties.
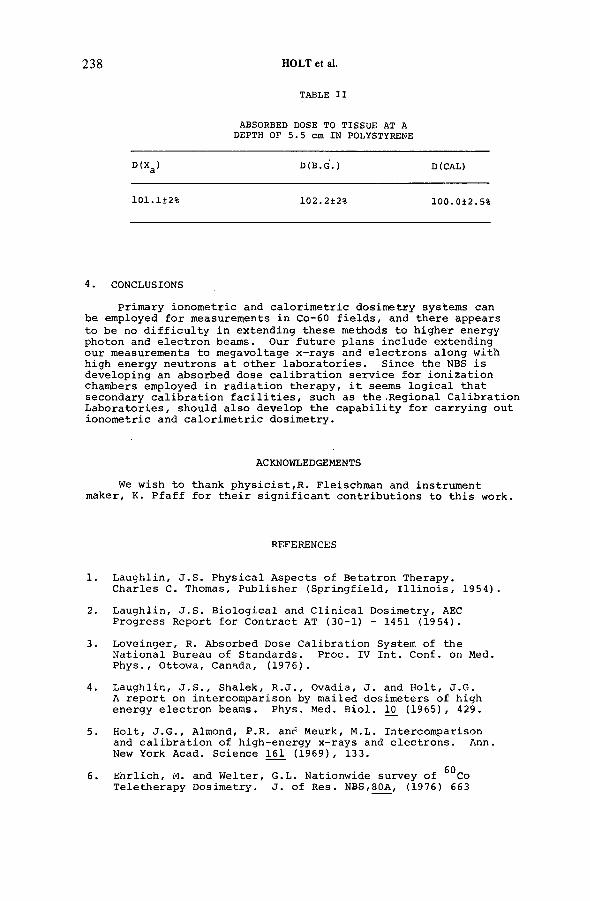
238 HOLT et al.
TABLE II
ABSORBED DOSE TO TISSUE AT A DEPTH OF 5.5 cm IN POLYSTYRENE
D(Xa ) D( B. G.) D (CAL)
101.1+2% 102.2±2% 100.012.5%
4. CONCLUSIONS
Primary ionometric and calorimetric dosimetry systems can be employed for measurements in Co-60 fields, and there appears to be no difficulty in extending these methods to higher energy photon and electron b e a m s . Our future plans include extending our measurements to megavoltage x-rays and electrons along with high energy neutrons at other laboratories. Since the NBS is developing an absorbed dose calibration service for ionization chambers employed in radiation therapy, it seems logical that secondary calibration facilities, such as the .Regional Calibration Laboratories, should also develop the capability for carrying out ionometric and calorimetric dosimetry.
ACKNOWLEDGEMENTS
We wish to thank physicist,R. Fleischman and instrument maker, K. Pfaff for their significant contributions to this work.
REFERENCES
1. Laughlin, J.S. Physical Aspects of Betatron Therapy.Charles C. Thomas, Publisher (Springfield, Illinois, 1954).
2. Laughlin, J.S. Biological and Clinical Dosimetry, AEC Progress Report for Contract AT (30-1) - 1451 (1954).
3. Loveinger, R. Absorbed Dose Calibration System of the National Bureau of Standards. Proc. IV Int. Conf. on Med. Phys., Ottowa, Canada, (1976).
4. Laughlin, J.S., Shalek, R.J., Ovadia, J. and Holt, J.G.A report on intercomparison by mailed dosimeters of high energy electron beams. Phys. Med. Biol. 10_ (1965), 429.
5. Holt, J.G., Almond, P.R. and Meurk, M.L. Intercomparison and calibration of high-energy x-rays and electrons. Ann. New York Acad. Science 161 (1969), 133.
6. Ehrlich, M. and Welter, G.L. Nationwide survey of ^°CoTeletherapy Dosimetry. J. of Res. N B S ,80A, (1976) 663
IAEA-SM-222/12 239
7. Smith, A.R., Almond, P.R., Smathers, J.B. , O t t e , V.A.,Attix, F.H., Theus, R . B . , iîootten P., Bichsel, H . , Eenmaa, J., Williams, D., Bewley, D.K., and Parnell, C.J. Dosimetry intercomparisons between fast-neutron radiotherapy facilities. Med. Phys. 2 (1975).
8. Kessaris, N.D. Penetration of high energy electron beams in water. Phys. Rev. 145, 164.
9. Holt, J.G. and Kessaris, N.D. Discrepancy between C, and C p . Phys. Med. Biol. 22_ (1977) 538.
10. Johns. H.E. and Cunningham, J.R. in The Physics of Radiology, 3rd Edition, Charles Thomas, Publisher, p. 274.
11. McDonald, J.C., Laughlin, J.S. and Freeman, R.E. Portable tissue-equivalent calorimeter. Med. Phys. 3_ (1976) 80.
12. Smathers, J.B., Otte, V.A. , Smith, A.R., Almond, P.P..,Attix, F.H., Spokas, J.J., Quam, W.M. and Goodman, L.J. Composition of A-150 tissue-equivlanet plastic. Med. Phys. £(1977) 74.
13. ICRU Report No. 10b, Physical Aspects of Irradiation, Recommendations of the International Commission on Radiological Units and Measurements (1962), 4.
14. Hubbell, J.H. Photon mass attenuation and mass energy- absorption coefficients for H, C, N, 0, Ar and seven mixtures from 0.1 keV to 20 MeV. Rad. Res. 1_й_ (1977) 58.
15. Milvy, P., Genna, S., Barr, N. and Laughlin, J.S.Calorimétrie determination of local absorbed dose.Proc. 2nd Int. Conf. Peaceful Uses of Atomic Energy, Geneva 1958, p. 142.
16. McDonald, J . C . , Laughlin, J.S. and Goodman, L.J.,Calorimétrie Dose measurements in Fast Neutron and Cobalt-60 Gamma-Ray Fields. Proc. NBS Symp. Meas, for the Safe Useof Rad., NBS SP 456 (1976) 327.
DISCUSSION
S.C. ELLIS: Would you please comment on the principle o f the method for determining the thermal defect o f A-150 plastic used as a calorimetric medium?
J.C. McDONALD: The method we are using at present was developed originally by Fleming and Glass1 and is described in a paper delivered at the Symposium on Measurements for the Safe Use o f Radiation, Gaithersburg, Maryland, 1 - 4 March 1976 (NBS SP-456).
We irradiate either face o f an absorber with a charged-particle beam (protons, - alpha particles or carbon nuclei o f a few MeV); the beam is completely stopped
in the sample. One side o f the absorber can be aluminium, gold or graphite,
1 FLEMING, D.M., GLASS, W.A., Endothermie processes in tissue-equivalent plastic, Radiat. Res. 37(1969) 316.
240 HOLT et al.
which do not appear to have a thermal defect, and the other side is A-150 plastic. The radiation heating should result in the same temperature rise on both faces, but because o f endothermie radiochemical reactions there is less temperature increase in the A-l 50. This work is being done in collaboration with L.J. Goodman at Brookhaven National Laboratory.
A.C. LUCAS: What accuracy would you assign to an absorbed dose calibration at this time?
J.C. McDONALD: We believe that the calorimetric method has an overall uncertainty o f approximately 2.5% at present. This is primarily due to the thermal defect. The uncertainty in absolute dose determined with the ‘pancake’ chambers is better than 2 %.
R. LOEVINGER: Are the absorbed doses delivered to patients at the Memorial Hospital traceable to national standards, to your own primary standards, or to some combination o f the two?
J.C. McDONALD: The patient dose is traceable to NBS standards.
IAEA-SM-222/61
THE ORGANIZATION AND OPERATION OF THE REGIONAL CALIBRATION LABORATORY AT VICTOREEN, CLEVELAND
W.E. SIMONVictoreen Instrument Division,Cleveland, Ohio,United States o f America
Abstract
THE ORGANIZATION AND OPERATION OF THE REGIONAL CALIBRATION LABORATORY AT VICTOREEN, CLEVELAND.
The Regional Calibration Laboratory (RCL) at Victoreen was fully accredited by the American Association o f Physicists in Medicine (AAPM) on 4 August 1977. Two other RCL locations are given and the AAPM protocol for an RCL is outlined. RCL sources at Victoreen consist o f a 60Co range with an exposure rate o f 0.40 R/s at 80 cm on 31 December 1976; a 300 kV, 10mA X-ray range; and a 150 kV, 20mA X-ray range. The Victoreen charge standard is a 3-terminal hermetically sealed N2 capacitor with a precision power supply and a (4+1) digital voltmeter. Dosimetry standards consist o f fully guarded ionization chambers whose charge is measured with mosfet electrometers employing 3-terminal air capacitors for feedback and (4+ 1) digital read-outs. Routine air density corrections are obtained with remote thermistor probes and an aneroid barometer. A pre-calibration check out o f dosimetry equipment includes checking the chamber’s electrical leakage and its response to atmospheric changes. The electrometer’s linearity, charge sensitivity, leakage and decay time constant are checked if possible. The method o f substitution is used for calibration. The RCL’s exposure reference standards are used to calibrate a monitor chamber for X-rays and a digital timer for 60Co before and after the dosimetry equipment is irradiated. Several cross checks are routinely employed. The calibration report describes conditions during calibration and the calibration data and report are checked by a second person.
1. INTRODUCTION
A Regional Calibration Laboratory (RCL) is a secondary standard fac ility accredited by the American Association of Physicists in Medicine (AAPM) for the calibration of photon radiation dosimetry equipment.
The RCL at Victoreen operated under provisional status for two years and was fully accredited on August 4, 1977. Two other RCL's operate, one at Sloan Kettering Hospital in New York under the direction of Garrett Holt and the other at M.D. Anderson Hospital in Houston, Texas, under the direction of Bob Shalek and Leroy Humphries.
241
242 SIMON
Accreditation requirements were set up in a protocol written by the AAPM in 1971. In four sections, the protocol specifies accreditation, standards equipment, ancillary equipment, and operating requirements, which are briefly outlined below.
2.1. Accreditation requirements
2.1.1. The RCL shall receive AAPM approval and operate under the recommendations of the AAPM scientific committee.
2.1.2. The laboratory's X-ray sources shall have beam qualities with halfvalue layers of lrnrn A1 to 2m Cu and a minimum 60Co rate of 10R/min at1 meter.
2.1.3. The laboratory's overall precision shall be within .5% and its accuracy of charge measurement shall be within .5%.
2.1.4. The laboratory's director shall be a physicist with five years of relevant experience.
2.1.5. Record all data in a bound notebook which is open for review by the AAPM.2.1.6. The laboratory shall have a minimum of six months of operating experience before provisional status is granted and a minimum of one year of operating experience before full accreditation is granted.
2.2. Standards equipment
2.2.1. The exposure standard shall be derived from a fully guarded, air equivalent ionization chamber. The charge measurement electrometer shall have .1% precision and .25% accuracy.
2.2.2. Capacitance standard shall be two certified 3-terminal a ir capacitors with values of 100 pF and 1000 pF.
2.2.3. The voltage standard shall be a certified .1% accuracy (4+1) digital voltmeter with .1% precision and a 0 to 1000 V power supply certified to .05% accuracy. Combining this with the capacitor from item 2.2.2. gives the RCL its charge standard.
2.2.4. Air density corrections shall be derived from appropriate temperature and pressure standards.
2.2.5. The A1 and Cu absorbers used for the X-ray beam filtration shall be 99.99% pure.
2.3. Ancillary equipment
2.3.1. X-ray machines shall have monitor chambers and electrometers with .1% precision and excellent short-term stability. There shall be a capab ility of monitoring the temperature of the monitor chamber.
2.3.2. The RCL shall maintain a field dosimeter for constancy checking of calibrations.
2. PROTOCOL
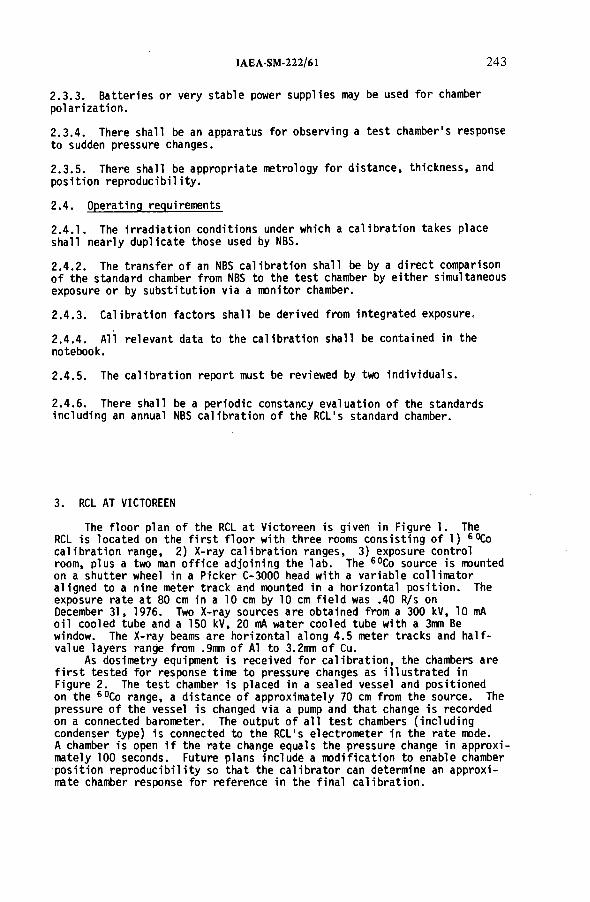
IAE A-SM-222/61 243
2.3.3. Batteries or very stable power supplies may be used for chamber polarization.
2.3.4. There shall be an apparatus for observing a test chamber's response to sudden pressure changes.2.3.5. There shall be appropriate metrology for distance, thickness, and position reproducibility.
2.4. Operating requirements2.4.1. The irradiation conditions under which a calibration takes place shall nearly duplicate those used by NBS.2.4.2. The transfer of an NBS calibration shall be by a direct comparison of the standard chamber from NBS to the test chamber by either simultaneous exposure or by substitution via a monitor chamber.
2.4.3. Calibration factors shall be derived from integrated exposure.
2.4.4. All relevant data to the calibration shall be contained in the notebook.
2.4.5. The calibration report must be reviewed by two individuals.
2.4.6. There shall be a periodic constancy evaluation of the standards including an annual NBS calibration of the RCL's standard chamber.
3. RCL AT VICTOREEN
The floor plan of the RCL at Victoreen is given in Figure 1. The RCL is located on the firs t floor with three rooms consisting of 1) 60Co calibration range, 2) X-ray calibration ranges, 3) exposure control room, plus a two man office adjoining the lab. The 60Co source is mounted on a shutter wheel in a Picker C-3000 head with a variable collimator aligned to a nine meter track and mounted in a horizontal position. The exposure rate at 80 cm in a 10 cm by 10 cm field was .40 R/s on December 31, 1976. Two X-ray sources are obtained from a 300 kV, 10 mA oil cooled tube and a 150 kV, 20 mA water cooled tube with a 3mm Be window. The X-ray beams are horizontal along 4.5 meter tracks and halfvalue layers range from .9mm of Al to 3.2mm of Cu.
As dosimetry equipment is received for calibration, the chambers are f irs t tested for response time to pressure changes as illustrated in Figure 2. The test chamber is placed in a sealed vessel and positioned on the 60Co range, a distance of approximately 70 cm from the source. The pressure of the vessel is changed via a pump and that change is recorded on a connected barometer. The output of all test chambers (including condenser type) is connected to the RCL's electrometer in the rate mode.A chamber is open i f the rate change equals the pressure change in approximately 100 seconds. Future plans include a modification to enable chamber position reproducibility so that the calibrator can determine an approximate chamber response for reference in the final calibration.
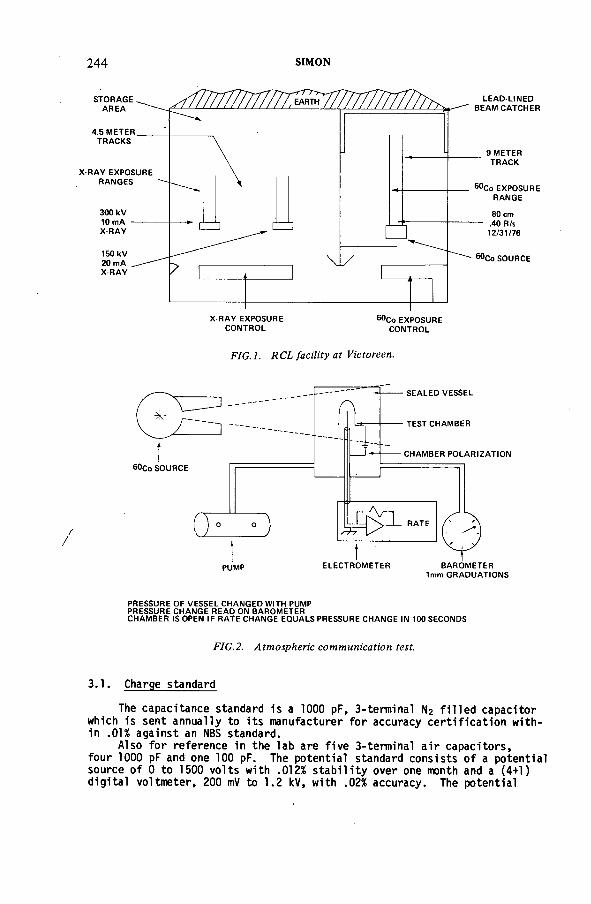
244 SIMON
X R A Y E X P O S U R E 6 0 Co E X P O S U R EC O N T R O L C O N T R O L
F 1 G .1 . R C L f a c i l i t y a t V i c t o r e e n .
P R E S S U R E O F V E S S E L CH A N G E D WITH PUMP P R E S S U R E CH A N G E R E A D ON B A R O M E T E RC H A M B E R IS OPEN IF R A T E CH ANG E E Q U A L S P R E S S U R E CH ANG E IN 1 0 0 SE C O N D S
F I G .2 . A t m o s p h e r i c c o m m u n ic a t i o n te s t .
3.1. Charge standard
The capacitance standard is a 1000 pF, 3-terminal N2 filled capacitor which is sent annually to its manufacturer for accuracy certification within .01% against an NBS standard.
Also for reference in the lab are five 3-terminal a ir capacitors, four 1000 pF and one 100 pF. The potential standard consists of a potential source of 0 to 1500 volts with .012% stability over one month and a (4+1) digital voltmeter, 200 mV to 1.2 kV, with .02% accuracy. The potential
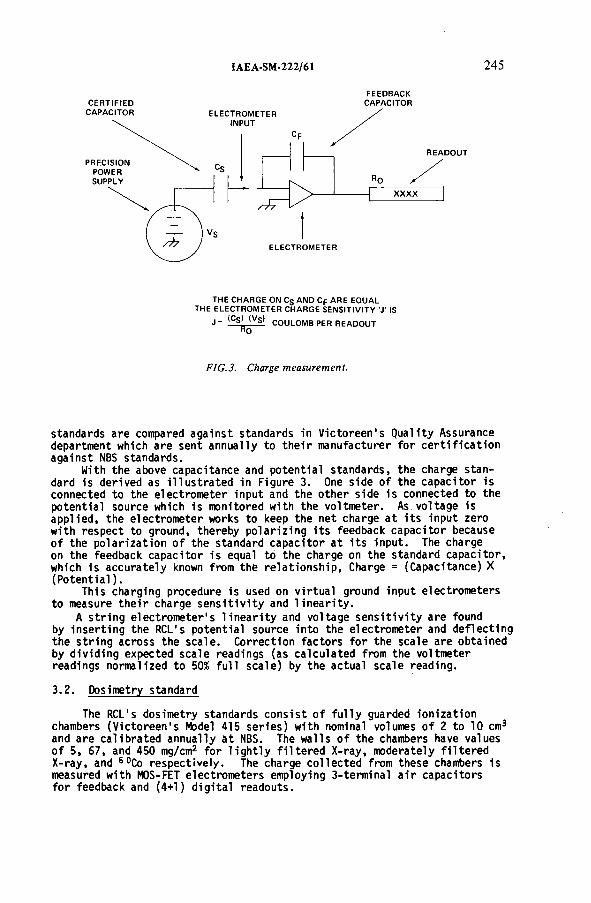
IAEA-SM-222/61 245
C E R T I F I E D C A P A C IT OR
THE C H A R G E ON CS AND C p A R E EQ UA L T H E E L E C T R O M E T E R C H A R G E S E N S I T I V I T Y J ’ IS
j = ( £ g l IVs> C O U L O M B P E R R E A D O U T
FIG.3. Charge measurement.
standards are compared against standards in Victoreen's Quality Assurance department which are sent annually to their manufacturer for certification against NBS standards.
With the above capacitance and potential standards, the charge standard is derived as illustrated in Figure 3. One side of the capacitor is connected to the electrometer input and the other side is connected to the potential source which is monitored with the voltmeter. As voltage is applied, the electrometer works to keep the net charge at its input zero with respect to ground, thereby polarizing its feedback capacitor because of the polarization of the standard capacitor at its input. The charge on the feedback capacitor is equal to the charge on the standard capacitor, which is accurately known from the relationship, Charge = (Capacitance) X (Potential).
This charging procedure is used on virtual ground input electrometers to measure their charge sensitivity and linearity.
A string electrometer's linearity and voltage sensitivity are found by inserting the RCL's potential source into the electrometer and deflecting the string across the scale. Correction factors for the scale are obtained by dividing expected scale readings (as calculated from the voltmeter readings normalized to 50% full scale) by the actual scale reading.
3.2. Dosimetry standard
The RCL's dosimetry standards consist of fully guarded ionization chambers (Victoreen's Model 415 series) with nominal volumes of 2 to 10 cm3 and are calibrated annually at NBS. The walls of the chambers have values of 5, 67, and 450 mg/cm2 for lightly filtered X-ray, moderately filtered X-ray, and 60Co respectively. The charge collected from these chambers is measured with MOS-FET electrometers employing 3-terminal a ir capacitors for feedback and (4+1) digital readouts.
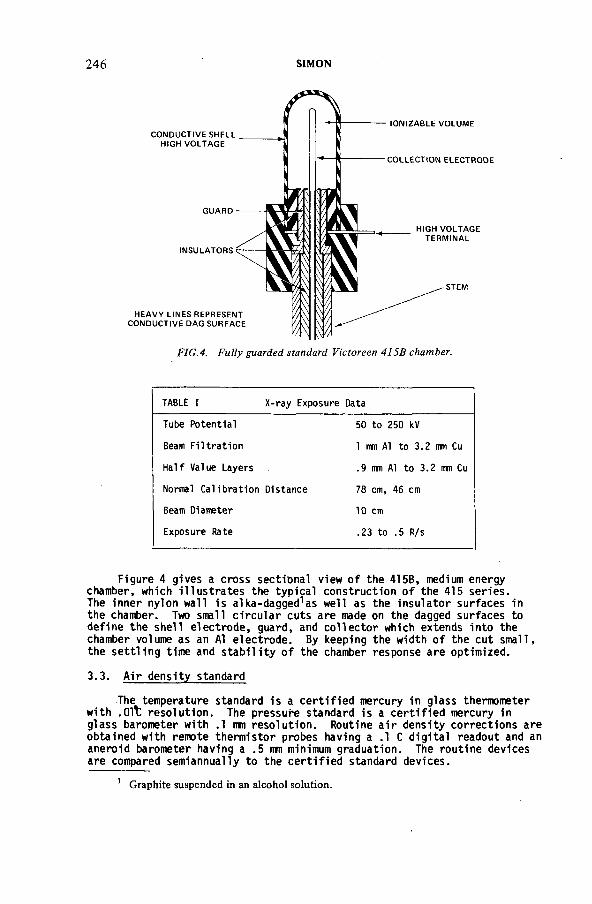
246 SIMON
TABLE I X-ray Exposure Data
Tube Potential 50 to 250 kV
Beam Filtration 1 mm Al to 3.2 mm Cu
Half Value Layers .9 mm Al to 3.2 im Cu
Normal Calibration Distance 78 cm, 46 cm
Beam Diameter 10 cm
Exposure Rate .23 to .5 R/s
Figure 4 gives a cross sectional view of the 415B, medium energy chamber, which illustrates the typical construction of the 415 series.The inner nylon wall is alka-dagged1as well as the insulator surfaces inthe chamber. Two small circular cuts are made on the dagged surfaces todefine the shell electrode, guard, and collector which extends into the chamber volume as an Al electrode. By keeping the width of the cut small,the settling time and stability of the chamber response are optimized.
3.3. Air density standard
The temperature standard is a certified mercury in glass thermometer with .Oft resolution. The pressure standard is a certified mercury in glass barometer with .1 ran resolution. Routine air density corrections are obtained with remote thermistor probes having a .1 С digital readout and an aneroid barometer having a .5 ran minimum graduation. The routine devices are compared semiannually to the certified standard devices.
1 Graphite suspended in an alcohol solution.
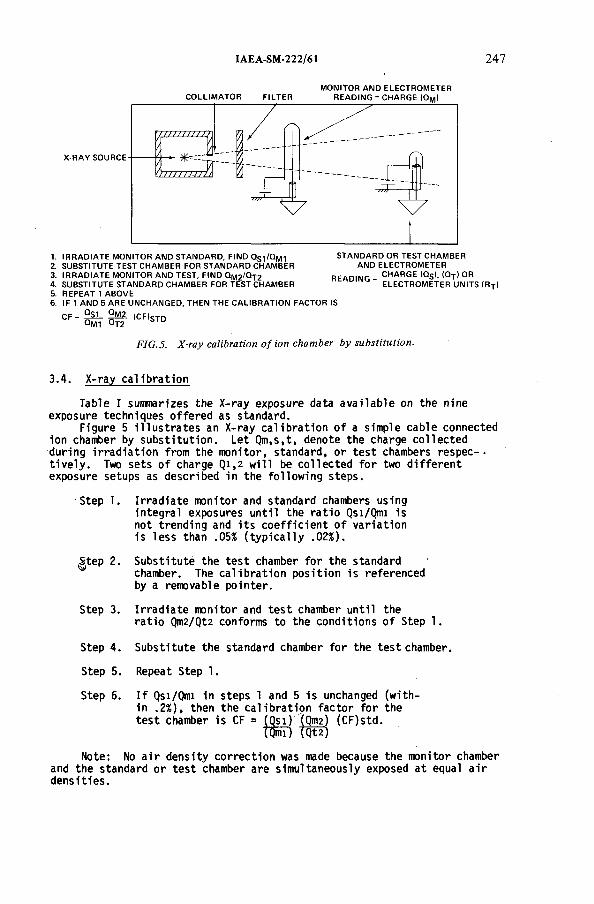
IAEA-SM-222/61 247
C O L L IM A T O R F I L T E RM ON IT O R AN D E L E C T R O M E T E R
R E A D I N G = C H A R G E (Q M >
1. I R R A D I A T E M O N IT O R AN D ST A N D A R D , F IN D QS 1 /Q M12. S U B S T I T U T E T E S T C H A M B E R F O R S T A N D A R D C H A M B E R3. I R R A D I A T E M O N IT O R AND T E S T , F IN D Q m 2 / q T 24. S U B S T I T U T E S T A N D A R D C H A M B E R F O R T E S T C H A M B E R5. R E P E A T 1 A B O V E6. IF 1 AN D 5 A R E UNC H A N G ED , T H E N T H E C A L IB R A T I O N F A C T O R IS
ST A N D A R D O R T E S T C H A M B E R AND E L E C T R O M E T E R
R E A D IN G = C H A R G E <QS>. Ю Т ) O RE L E C T R O M E T E R U N I T S ( R T )
FIG.5. X -r a y c a l ib r a t io n o f io n c h a m b e r b y s u b s t i tu t io n .
3.4. X-ra.y calibration
Table I summarizes the X-ray exposure data available on the nine exposure techniques offered as standard.
Figure 5 illustrates an X-ray calibration of a simple cable connected ion chamber by substitution. Let Qm,s,t, denote the charge collected during irradiation from the monitor, standard, or test chambers respec-. tively. Two sets of charge Qi,2 will be collected for two different exposure setups as described in the following steps.
Step 1. Irradiate monitor and standard chambers usingintegral exposures until the ratio Qsi/Qmi is not trending and its coefficient of variation is less than .05% (typically .02%).
|jtep 2. Substitute the test chamber for the standardchamber. The calibration position is referenced by a removable pointer.
Step 3. Irradiate monitor and test chamber until theratio Qm2/Qt2 conforms to the conditions of Step 1.
Step 4. Substitute the standard chamber for the test chamber.
Step 5. Repeat Step 1.
Step 6. I f Qsi/Qmi in steps 1 and 5 is unchanged (within .2%), then the calibration factor for the test chamber is CF = (Qsi) (Отг) (CF)std.
TOST) ( PNote: No air density correction was made because the monitor chamber
and the standard or test chamber are simultaneously exposed at equal air densities.
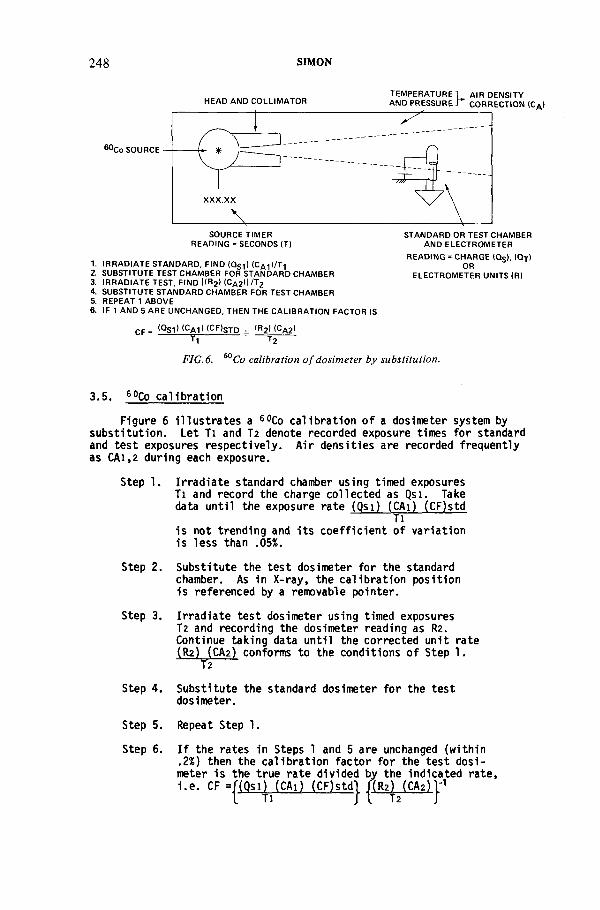
248 SIMON
HEA D AN D C O L L IM A T O R
6 0 Co S O U R C E
T E M P E R A T U R E 1 A IR D E N S I T Y AND P R E S S U R E “ C O R R E C T I O N ( С д )
S O U R C E T I M E R R E A D IN G = S E C O N D S (T)
1. I R R A D I A T E S T A N D A R D , F IN D ( 0 S 1 I (CA 1 )/T-|2. S U B S T I T U T E T E S T C H A M B E R F O R S T A N D A R D C H A M B E R3. I R R A D I A T E T E S T , F IN D [(R2> ( С д г ) ] Я 24. S U B S T I T U T E S T A N D A R D C H A M B E R F O R T E S T C H A M B E R5. R E P E A T 1 A B O V E6. IF 1 AND 5 A R E UNCH ANG ED , THE N THE C A L IB R A T I O N F A C T O R IS
r c = ,QSl) <CA1> tC F >STD i . !R2> <CA2>T , • — T2
S T A N D A R D O R T E S T C H A M B E R AND E L E C T R O M E T E R
R E A D IN G = C H A R G E (Qs ), (QT ) OR
E L E C T R O M E T E R U N IT S (R)
FIG .6. Co calibration o f dosimeter by substitution.
3.5. 60Co calibration
Figure 6 illustrates a 60Co calibration of a dosimeter system by substitution. Let Ti and T2 denote recorded exposure times for standard and test exposures respectively. Air densities are recorded frequently as CAi,2 during each exposure.
Step 1. Irradiate standard chamber using timed exposuresTi and record the charge collected as Qsi. Take data until the exposure rate (Qsi) (CAi) (CF)std
Tiis not trending and its coefficient of variation is less than .05%.
Step 2. Substitute the test dosimeter for the standardchamber. As in X-ray, the calibration position is referenced by a removable pointer.
Step 3. Irradiate test dosimeter using timed exposuresT2 and recording the dosimeter reading as R2.Continue taking data until the corrected unit rate (Rz) (САг) conforms to the conditions of Step 1.
T2
Step 4. Substitute the standard dosimeter for the testdosimeter.
Step 5. Repeat Step 1.
Step 6. I f the rates in Steps 1 and 5 are unchanged (within.2%) then the calibration factor for the test dosimeter is the true rate divided by the indicated rate, i.e. CF = j~(Qsi) (CAi) (CF)stdj j(R2HCA2) j~1
IAEA-SM-222/61 249
3.6. Cross checksWhenever possible, c r o s s checks are made for constancy in a
chamber calibration. Four routinely employed checks are:
3.6.1. The 60Co source is decayed with a 5.27 year half l ife and compared to the rate of the standard.
3.6.2. The standard/monitor chamber response on X-ray is compared to previous values.
3.6.3. The exposure rate on X-ray is compared to previous values.
3.6.4. A reserve condenser chamber is calibrated in each setup and its correction factors are compared to previous ones.3.7. Calibration report
The calibration report normally consists of five pages. The pages and contents are the following:
3.7.1. Title page - defines the calibration procedure and use of the ca libration factor.
3.7.2. Signature page - contains statement of uncertanties and possible errors. Signed by the director.
3.7.3. Explanation page - explains details of calibration parameters.
3.7.4. Electrometer page - provides electrometer data.
3.7.5. Calibration table - provides the chamber calibration factor and calibration parameters. Initialed by data taker and reviewer.
DISCUSSION
H.O. WYCKOFF: In your calibration report, do you specify the size o f the beam field at the calibration point? This may be important because o f possible stem leakage and radiation scattering by the stem.
W.E. SIMON: Yes, information on beam size, chamber distance, exposure rate, and beam quality is given in the calibration report, which is patterned after the National Bureau o f Standards report.

IAEA-SM-222/25
THE ROLE OF THE SECONDARY STANDARDS DOSIMETRY LABORATORY IN A NUCLEAR POWER UTILITYR.W. CLARKE, I.M.G. THOMPSON Central Electricity Generating Board,Berkeley Nuclear Laboratories,Berkeley, Gloucestershire,United Kingdom
Abstract
THE R O LE OF TH E SEC O N D A RY STANDARDS D O SIM ETR Y LA B O R A T O R Y IN A N U C LEA R PO W ER U T IL IT Y .
The Central Electricity Generating Board has operated a service since 1963 for the calibration and assessment of the radiation measuring instruments used in the nuclear power stations in England and Wales. A central, secondary standards dosimetry laboratory was established at the Berkeley Nuclear Laboratories (BN L ) with the objectives of translating national primary standards which were designed for radiotherapy work to levels more suited to health physics protection, and to provide standards for those specific radiations where national ones did not exist, e.g. neutron and beta radiation. During the last decade, when tens of thousands of instruments have been calibrated, the function of the central laboratory has evolved into a complex mixture of standards provision, routine calibration, instrument assessment and standards development rather than the simple provision of secondary standards in the dissemination chain often envisaged. Economic practicalities and the availability of expertise dictate the role of the laboratory. Examples are given of very routine calibrations which nevertheless require facilities far too complex and expensive than can be supported by a ‘tertiary’ laboratory. Instrument assessment also requires facilities which can only be justified at the central laboratory using, in fact, the secondary standards. The economic advantages, such as lower investment in instruments, which come from local routine calibrations are counterbalanced by the disadvantage that important information on instrument performance is scattered and cannot be easily collected centrally. Several serious sporadic defects in certain instruments have been revealed by the accumulation of experience at the central laboratory. Negotiations with manufacturers to rectify such faults or to produce instruments more suited to power station use are more readily conducted when backed by uniquely large statistical evidence. Currently, the dosimetry laboratory at B N L is providing details of calibration procedures and the production of specific radiation qualities for a number of national and international bodies engaged in drafting regulations or carrying out intercomparisons. The expertise has arisen from firstly the necessity to provide such procedures and standards to meet operational requirements and secondly the availability of the most comprehensive equipment for this work in existence in one laboratory.
1. INTRODUCTION
Before the Central Electricity Generating Board (CEGB) could operate its first nuclear power station in 1963 a licence had to be granted by the appropriate Government Ministry. One of the
251
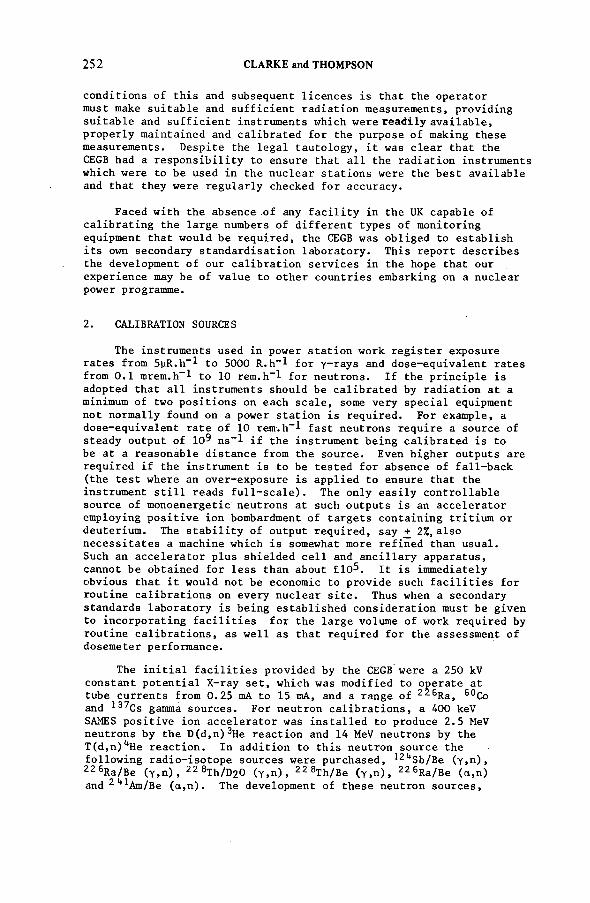
252 CLARKE and THOMPSON
conditions of this and subsequent licences is that the operator must make suitable and sufficient radiation measurements, providing suitable and sufficient instruments which were readily available, properly maintained and calibrated for the purpose of making these measurements. Despite the legal tautology, it was clear that the CEGB had a responsibility to ensure that all the radiation instruments which were to be used in the nuclear stations were the best available and that they were regularly checked for accuracy.
Faced with the absence of any facility in the UK capable of calibrating the large numbers of different types of monitoring equipment that would be required, the CEGB was obliged to establish its own secondary standardisation laboratory. This report describes the development of our calibration services in the hope that our experience may be of value to other countries embarking on a nuclear power programme.
2. CALIBRATION SOURCES
The instruments used in power station work register exposure rates from 5yR.h~l to 5000 R.h“l for y-rays and dose-equivalent rates from 0.1 mrem.h-! to 10 rem.h-! for neutrons. If the principle is adopted that all instruments should be calibrated by radiation at a minimum of two positions on each scale, some very special equipment not normally found on a power station is required. For example, a dose-equivalent rate of 10 rem.h“l fast neutrons require a source of steady output of 10^ ns"l if the instrument being calibrated is to be at a reasonable distance from the source. Even higher outputs are required if the instrument is to be tested for absence of fall-back (the test where an over-exposure is applied to ensure that the instrument still reads full-scale). The only easily controllable source of monoenergetic neutrons at such outputs is an accelerator employing positive ion bombardment of targets containing tritium or deuterium. The stability of output required, say _+ 2%, also necessitates a machine which is somewhat more refined than usual.Such an accelerator plus shielded cell and ancillary apparatus, cannot be obtained for less than about £10^. It is immediately obvious that it would not be economic to provide such facilities for routine calibrations on every nuclear site. Thus when a secondary standards laboratory is being established consideration must be given to incorporating facilities for the large volume of work required by routine calibrations, as well as that required for the assessment of dosemeter performance.
The initial facilities provided by the CEGB were a 250 kV constant potential X-ray set, which was modified to operate at tube currents from 0.25 mA to 15 mA, and a range of 2 *6Ra, 60Co and 137Cs gamma sources. For neutron calibrations, a 400 keV SAMES positive ion accelerator was installed to produce 2.5 MeV neutrons by the D(d,n)3He reaction and 14 MeV neutrons by the T(d,n)4He reaction. In addition to this neutron source the following radio-isotope sources were purchased, 124Sb/Be (y,n),22 6Ra/Be (y,n), 22 8Th/D20 (y,n), 22 8Th/Be (y,n), 22 6Ra/Be (ci,n) and 2 4 1Am/Be (a,n). The development of these neutron sources,
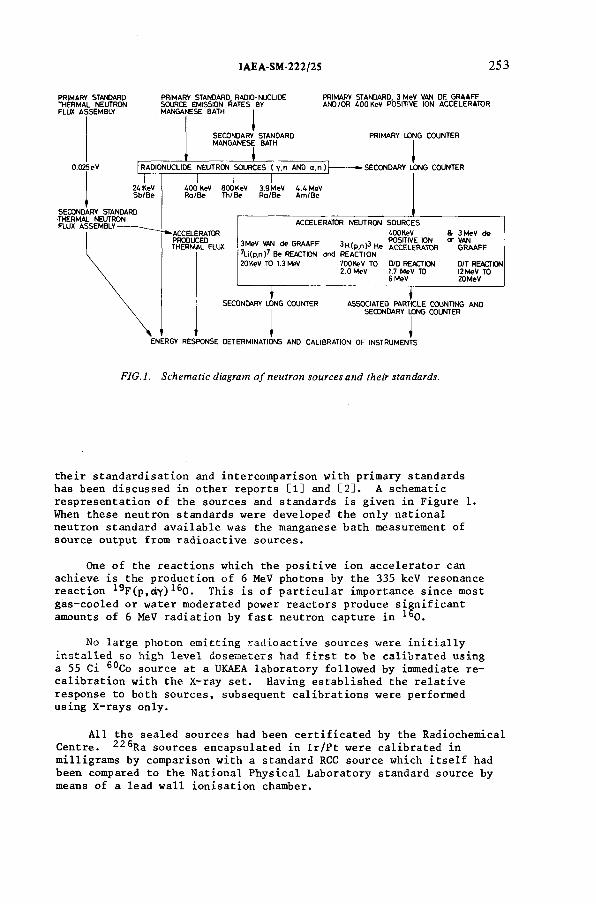
IAEA-SM-222/25 253
PRIMARY STANDARD THERMAL NEUTRON FLUX ASSEMBLY
0.02
PRIMARY STANDARD, RADIO-NUCLIDE SOURCE EMISSION FIATES BY MANGANESE BATH I
1SECONDARY STANDARDMANGANESE BATH
1RADIONUCLIDE NEUTRON SOURCES ( Y.n AND a . n ) }
PRIMAPY STANDARD. 3 MeV VAN DE GRAAFF AND/OR 4 0 0 KeV POSITIVE ION ACCELERATOR
PRIMARY LONG COUNTER
► SECONDARY LONG COUNTER
400 KeV Ra/Be
000 KeV Th/Be
T3.9 MeV Ra/Be
T4.4 MeV Am/Be
SECONDARY STANDARD THERMAL NEUTRON FLUX ASSEMBLY--------
ACCELERATOR PRODUCED THERMAL FLUX
ACCELERATOR NEUTRON SOURCES400KeV & 3 MeV de
3MeV VAN de GRAAFF 3 H(p,n)3 He ^CELERATOR " GRAAFF7Li(p,n)7 Be REACTION and REACTION20KeV TO 1.3 MeV 700KeV TO D/D REACTION D/T REACTION
2.0 MeV 1.7 MeV TO 12MeV TO6 MeV 20MeV
SECONDARY UONG COUNTER ASSOCIATED PARTICLE COUNTING AND SEOONDARY LONG COUNTER
ENERGY RESPONSE DETERMINATIONS AND CALIBRATION OF INSTRUMENTS
F I G . l . S c h e m a t i c d ia g ra m o f n e u t r o n s o u r c e s a n d th e ir s ta n d a rd s .
their standardisation and intercomparison with primary standards has been discussed in other reports [1] and [2]. A schematic respresentation of the sources and standards is given in Figure 1.When these neutron standards were developed the only national neutron standard available was the manganese bath measurement of source output from radioactive sources.
One of the reactions which the positive ion accelerator can achieve is the production of 6 MeV photons by the 335 keV resonance reaction 19F(p,oy)160. This is of particular importance since most gas-cooled or water moderated power reactors produce significant amounts of 6 MeV radiation by fast neutron capture in 160.
No large photon emitting radioactive sources were initially installed so high level dosemeters had first to be calibrated using a 55 Ci 60Co source at a UKAEA laboratory followed by immediate recalibration with the X-ray set. Having established the relative response to both sources, subsequent calibrations were performed using X-rays only.
All the sealed sources had been certificated by the Radiochemical Centre. 226Ra sources encapsulated in Ir/Pt were calibrated in milligrams by comparison with a standard RCC source which itself had been compared to the National Physical Laboratory standard source by means of a lead wall ionisation chamber.
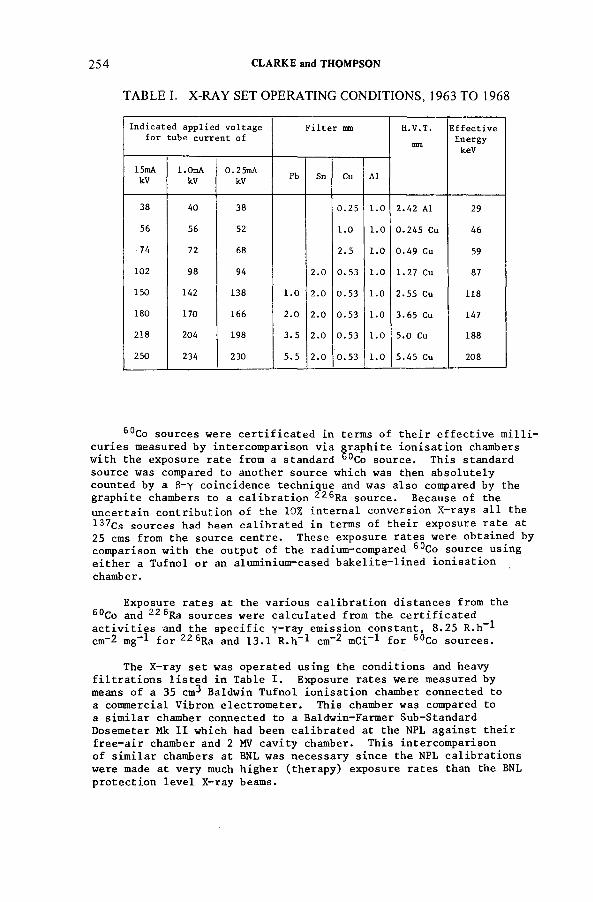
TABLE I. X-RAY SET OPERATING CONDITIONS, 1963 TO 1968
25 4 CLARKE and THOMPSON
I n d i c a t e d ap p l i e d v o l t a g e
for tube c urrent ofF i l t e r m m H.V.T. E f f e c t i v e
E n ergy
keV
15mA
kV
1.0mA
kV
0 . 2 5 m A
kVPb Sn Cu Al
38 40 38 0 . 2 5 1.0 2.42 Al 29
56 56 52 1.0 1.0 0 . 2 4 5 Cu 46
74 72 68 2.5 1.0 0 . 4 9 Cu 59
102 98 94 2.0 0.53 1.0 1.27 Cu 87
150 142 138 1.0 2.0 0 . 5 3 1.0 2.55 Cu 118
180 170 166 2.0 2.0 0.53 1.0 3.65 Cu 147
218 204 198 3.5 2.0 0.53 1.0 5.0 Cu 188
250 234 230 5.5 2.0 0.53 1.0 5.45 Cu 208
60Co sources were certificated in terms of their effective millicuries measured by intercomparison via graphite ionisation chambers with the exposure rate from a standard °°Co source. This standard source was compared to another source which was then absolutely counted by a 3-y coincidence technique and was also compared by the graphite chambers to a calibration 226Ra source. Because of the uncertain contribution of the 10% internal conversion X-rays all the 137Cs sources had been calibrated in terms of their exposure rate at25 cms from the source centre. These exposure rates were obtained by comparison with the output of the radium-compared 60Co source using either a Tufnol or an aluminium-cased bakelite-lined ionisation chamber.
Exposure rates at the various calibration distances from the 60Co and 226Ra sources were calculated from the certificated activities and the specific y-ray emission constant, 8.25 R.h“l cm“2 mg-l f o r 226Ra and 13.1 R.h- ̂ cm-^ mCi-*- for 60Co sources.
The X-ray set was operated using the conditions and heavy filtrations listed in Table X. Exposure rates were measured by means of a 35 cm^ Baldwin Tufnol ionisation chamber connected to a commercial Vibron electrometer. This chamber was compared to a similar chamber connected to a Baldwin-Farmer Sub-Standard Dosemeter Mk IX which had been calibrated at the NPL against their free-air chamber and 2 MV cavity chamber. This intercomparison of similar chambers at BNL was necessary since the NPL calibrations were made at very much higher (therapy) exposure rates than the BNL protection level X-ray beams.
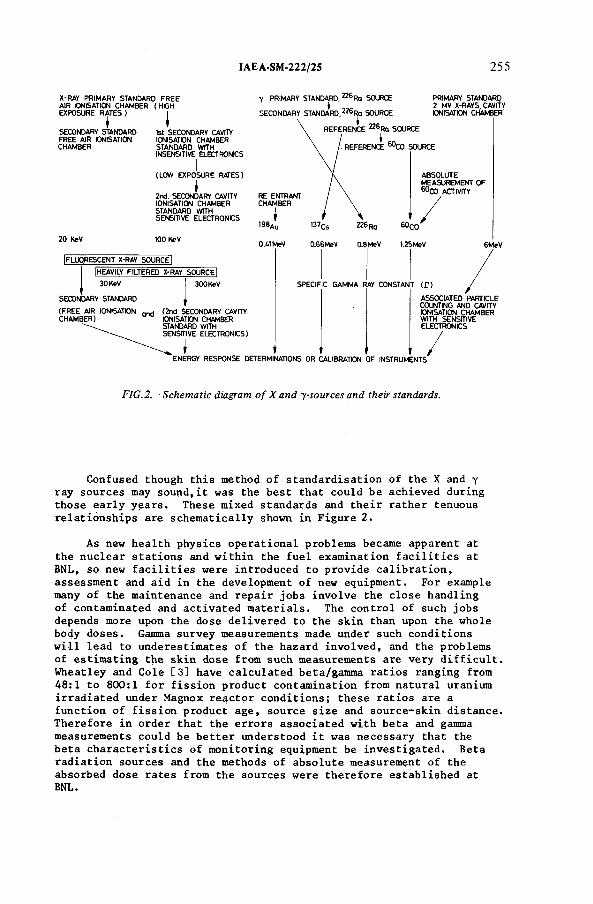
IAEA-SM-222/25 255
X-RAY PRIMARY STANDARD FREE AIR IONISATION CHAMBER ( HIGH EXPOSURE RATES) J
SECONDARY STANDARD FREE AIR IONISATION CHAMBER
1st SECONDARY CAVITY IONISATION CHAMBER STANDARD WITH
[FLUORESCENT X-RAY SOURCE]
[HEAVILY FILTERED X-RAY SOURCE]30KeV
SECONDARY STANDARD
(FREE AIR IONISATION nnei CHAMBER)
PRIMARY STANDARD.226Rq SOURCE *
INSENSITIVE ELECTRONICS
(LOW EXPOSURE RATES)
2nd. SECONDARY CAVITY IONISATION CHAMBER STANDARD WITH SENSITIVE ELECTRONICS
ЮО KeV
SECONDARY STANDARD,226Ra SOURCE
REFERENCE ^ R a SOURCE
REFERENCE ^C O SOURCE
PRIMARY STANDARD 2 MV X-RAYS, CAVITY IONISATION CUMBER
RE ENTRANT CHAMBER
198ди
0.41 MeV
300KeV
(2nd SECONDARY CAVITY IONISATION CHAMBER STANDARD WITH SENSITIVE ELECTRONICS)
ABSOLUTE MEASUREMENT OF бОСО ACTIVITY
60co 125 MeV
SPECIFIC GAMMA RAY CONSTANT (Г )
ASSOCIATED PARTICLE COUNTING AND CAVITY IONISATION CHAMBER WITH SENSITIVE ELECTRONICS
ENERGY RESPONSE DETERMINATIONS OR CALIBRATION OF INSTRUMENTS
FIG.2. Schematic diagram o f X and y-sources and their standards.
Confused though this method of standardisation of the X and у ray sources may sound,it was the best that could be achieved during those early years. These mixed standards and their rather tenuous relationships are schematically shown in Figure 2.
As new health physics operational problems became apparent at the nuclear stations and within the fuel examination facilities at BNL, so new facilities were introduced to provide calibration, assessment and aid in the development of new equipment. For example many of the maintenance and repair jobs involve the close handling of contaminated and activated materials. The control of such jobs depends more upon the dose delivered to the skin than upon the whole body doses. Gamma survey measurements made under such conditions will lead to underestimates of the hazard involved, and the problems of estimating the skin dose from such measurements are very difficult. Wheatley and Cole [3] have calculated beta/gamma ratios ranging from 48:1 to 800:1 for fission product contamination from natural uranium irradiated under Magnox reactor conditions; these ratios are a function of fission product age, source size and source-skin distance. Therefore in order that the errors associated with beta and gamma measurements could be better understood it was necessary that the beta characteristics of monitoring equipment be investigated. Beta radiation sources and the methods of absolute measurement of the absorbed dose rates from the sources were therefore established at BNL.
256 CLARKE and THOMPSON
Other operational requirements have led to the calibration • services being extended to include the following:-
i) A standard thermal neutron flux assembly of (1.871+.021) x 104 cm-2 s-1 for the calibration of TLD devices, photographic dose- meters and foils.
ii) An accelerator thermal neutron flux of variable intensity for the calibration of hand-held thermal neutron survey instruments.
iii) A novel low energy, 0.5 keV, neutron source consisting of an antimony-beryIlium source at the centre of a 4 cm radius water sphere surrounded by a 1 mm thick shell of boron-10.
iv) A 50 kV X-ray set to provide filtered X-ray spectra of 20% resolution and mean energies of 8, 16, 24, 28, 34 and 40 keV, for the testing of the low energy response of photon dosemeters.
v) A complete range of International Standards Organisation (ISO) reference radiations. These comprise three filtered X-radiation series called the "Low Exposure Rate" series of 20% resolution which is a refinement of the initial BNL series mentioned earlier in the text, the "Narrow Spectrum" series of 30% resolution and the "Wide Spectrum" series of 50% resolution.
vi) The ISO fluorescent X-radiations which provide calibration from 8.64 keV up to 98.4 keV.
The latest additions are facilities for the calibration and assessment of equipment to be used for measurements of surface and airborne contamination.
Frequently, the radiation standards developed for this work, in particular the beta and neutron standards, could not be comparedto primary standards since these did not exist or, if they did, weremore applicable to radiation therapy than to protection. To accomplish the independent checks on our methods and standards thatwe considered essential we therefore had to devote considerableeffort encouraging national and international committees to produce protection level standards.
Although the CEGB has a legal obligation to calibrate its radiation monitoring equipment there has never been any internal requirements for such calibration to be made at the BNL Secondary Dosimetry Laboratory. As the operational staff saw the advantages of a centralised service, with its access to national and international standards, the requests for calibration work increased from a few hundred instruments a year to the present figure of about 1,500 per year. The requirement to provide a rapid turn round of large numbers of instruments, plus the need to make calibration adjustments when required, meant that if doses to the calibrators were to be kept reasonably low then the initial simple calibration methods had to be refined. Automated calibration devices were therefore developed [4]. With such devices a wide selection of exposure levels can easily be
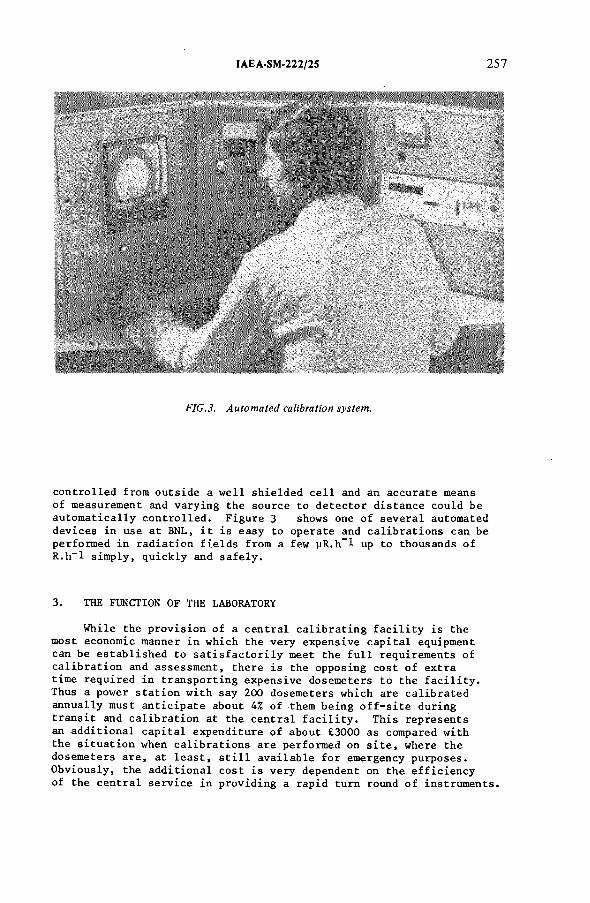
IAEA-SM-222/25 257
FIG.3. Automated calibration system.
controlled from outside a well shielded cell and an accurate means of measurement and varying the source to detector distance could be automatically controlled. Figure 3 shows one of several automated devices in use at BNL, it is easy to operate and calibrations can be performed in radiation fields from a few yR.h-l up to thousands of R.h“l simply, quickly and safely.
3. THE FUNCTION OF THE LABORATORY
While the provision of a central calibrating facility is the most economic manner in which the very expensive capital equipment can be established to satisfactorily meet the full requirements of calibration and assessment, there is the opposing cost of extra time required in transporting expensive dosemeters to the facility. Thus a power station with say 200 dosemeters which are calibrated annually must anticipate about 4% of them being off-site during transit and calibration at the central facility. This represents an additional capital expenditure of about £3000 as compared with the situation when calibrations are performed on site, where the dosemeters are, at least, still available for emergency purposes. Obviously, the additional cost is very dependent on the efficiency of the central service in providing a rapid turn round of instruments.
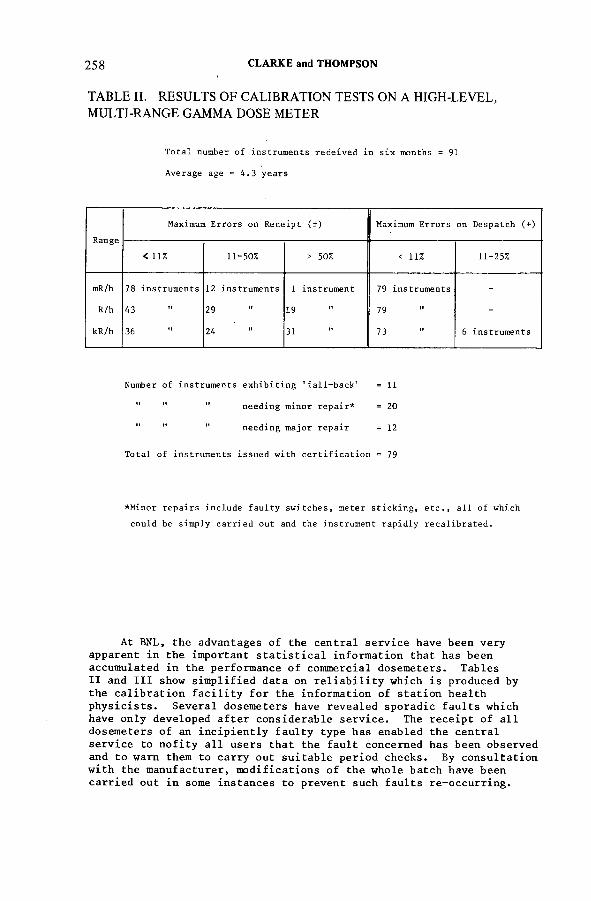
258 CLARKE and THOMPSON
TABLE II. RESULTS OF CALIBRATION TESTS ON A HIGH-LEVEL, MULTI-RANGE GAMMA DOSE METER
Total n u m b e r of i n s t r u m e n t s r e c e i v e d in six m o n t h s = 91
Av e r a g e age = 4 . 3 years
Range
M a x i m u m Errors on Re c e i p t (±) M a x i m u m Errors o n D e s p a t c h (+)
< 11% 11-50% > 50% < 11% 11-25%
mR/h
R/h
kR/h
78 instru m e n t s
43
36
12 i nstruments
29 "
24
1 i n strument
19
31
79 instruments
79 "
73 6 i nstruments
N u m b e r of instru m e n t s e x h i b i t i n g 'fall-back' = 11
" " " n e e d i n g m i n o r re p a i r * = 20
" " n n e e d i n g m a j o r r e pair = 12
Total of i nstruments issued w i t h c e r t i f i c a t i o n = 79
* M i n o r r epairs i nclude faul t y switches, m e t e r sticking, etc., all of w h i c h
could be s i mply c arried out and the inst r u m e n t r apidly recalibrated.
At BNL, the advantages of the central service have been very apparent in the important statistical information that has been accumulated in the performance of commercial dosemeters. TablesII and III show simplified data on reliability which is produced by the calibration facility for the information of station health physicists. Several dosemeters have revealed sporadic faults which have only developed after considerable service. The receipt of all dosemeters of an incipiently faulty type has enabled the central service to nofity all users that the fault concerned has been observed and to warn them to carry out suitable period checks. By consultation with the manufacturer, modifications of the whole batch have been carried out in some instances to prevent such faults re-occurring.
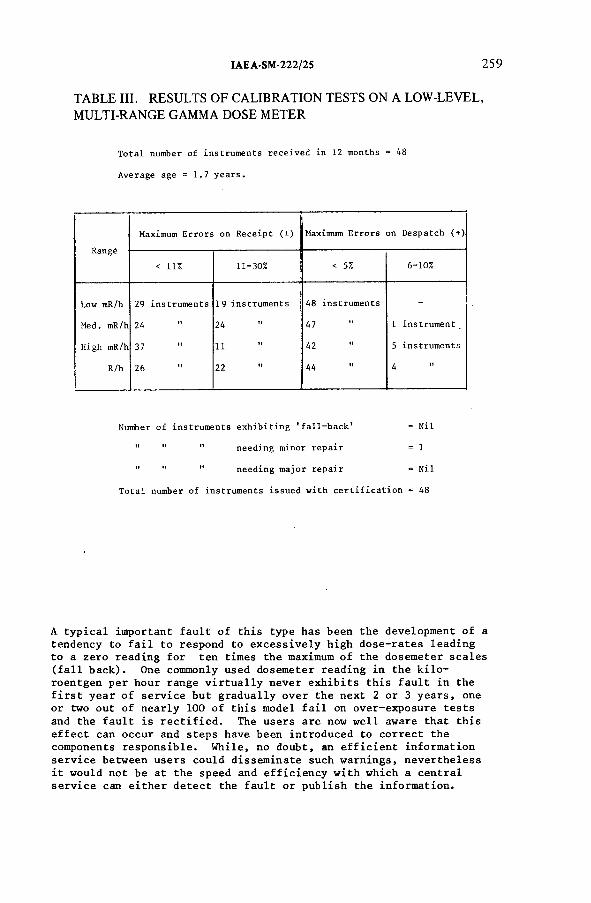
IAEA-SM-222/2S 259
TABLE III. RESULTS OF CALIBRATION TESTS ON A LOW-LEVEL, MULTI-RANGE GAMMA DOSE METER
Total n u m b e r of i n s t r u m e n t s rece i v e d in 12 m o n t h s = 48
A v e r a g e age = 1.7 years.
Rangé
M a x i m u m E r rors o n R eceipt (±) M a x i m u m E r r o r s on Desp a t c h (+)
< 11% 11-30% < 5% 6-10%
L o w mR/h
Med. m R / h
H igh m R / h
R/h
29 instru m e n t s
24
37 "
26 "
1 9 instru m e n t s
24
11
22
48 i nstruments
47
42 "
44
1 i n s trument
5 i n struments
4
N u m b e r of in s t r u m e n t s e x h i b i t i n g 'fall-back' = Nil
" " " n e e d i n g m i n o r r e p a i r = 1
" " " n e e d i n g m a j o r r e p a i r = Nil
Total n u m b e r of i nstruments issued w i t h c e r t i f i c a t i o n = 48
A typical important fault of this type has been the development of a tendency to fail to respond to excessively high dose-rates leading to a zero reading for ten times the maximum of the dosemeter scales (fall back). One commonly used dosemeter reading in the kilo- roentgen per hour range virtually never exhibits this fault in the first year of service but gradually over the next 2 or 3 years, one or two out of nearly 100 of this model fail on over-exposure tests and the fault is rectified. The users are now well aware that this effect can occur and steps have been introduced to correct the components responsible. While, no doubt, an efficient information service between users could disseminate such warnings, nevertheless it would not be at the speed and efficiency with which a central service can either detect the fault or publish the information.
260 CLARKE and THOMPSON
The central calibrating facility can very readily produce the statistical evidence required to convince instrument manufacturers of the need to improve reliability in any existing model or to produce a new instrument more suited to power station needs.
In the early days the nuclear power stations were using a great many types of instruments for the same type of measurement. This was understandable since the only data available to help the choice was provided by the manufacturer. Most of the available instruments had been developed by the UKAEA to suit their requirements and, following an initial development investigation of a prototype, the production models were made under licence by contractors who had little or no resources for further development or even full calibration to the satisfaction of the CEGB. Equipment purchased at each individual CEGB establishment therefore reflected to some extent the persuasiveness of the commercial salesman and the personal preferences of the buyer. Manufacturers did not possess adequate facilities for determining most of the significant characteristics of their instruments and in the competitive commercial world they were in any case hardly likely to draw attention to undesirable characteristics in their advertising literature.
An example of the problems that arose was the fact that the only dosemeter generally available for routine monitoring of the environmental radiation levels around power station sites was a very sensitive instrument originally produced for uranium prospectors. Although a good enough instrument for its original purpose, when exposed to 0.1 MeV photons it responded at 20 times the true dose, and it was obviously not the best that could be produced for this specific CEGB requirement.
A more alarming fault observed is the fall-back referred to earlier. This fault had frequently remained undetected simply because many manufacturers did not have the radiation sources capable of such outputs. It was common practice for them to expose an instrument at a low dose rate from a small radioactive source and, having found the detector to function, to remove it and perform all further calibration by the injection of electric currents or pulses.
Although the Dosemeter Calibration Facility was initially set up to provide statutory calibration of instruments its unique range of calibration facilities were obviously ideal for undertaking evaluation tests on instruments. A significant part of its effort has therefore been devoted to evaluating equipment. These evaluations include carefully controlled testing of the equipment against a large number of standards that themselves have been intercompared at the national and international level. Most commercially available X, gamma, beta and neutron dosemeters have been tested, the program on each type of instrument includes radiological, electrical and environmental evaluation as well as an examination of its design features С5]. When such evaluations show that the available commercial equipment is unsuitable for a particular operational measurement problem, then either a manufacturer is approached to develop a new instrument or one is designed at BNL. To date six
IAEA-SM-222/2S 261
specialised instruments have been developed at BNL for the measurement of environmental levels of radiations in the neighbourhood of nuclear stations, for the measurement of beta doses, and for measurements of photon radiation at levels up to 50,000 R.h”l.
Our present method of selecting equipment is by a CEGB committee consisting of two of the nuclear power station health physicists, a member of staff from both the headquarters Nuclear Health & Safety Department and from the Standards Branch as well as a representative from the Calibration Facility. It meets once or twice a year and uses the calibration evaluation reports and operational experience to produce a list of recommended health physics monitoring instruments and,except for special reasons, normally only listed equipment may be purchased.
The secondary standards laboratory at BNL has acquired a unique experience in the provision of standards for operational dosemeter calibration and in the process has acquired a specialist staff who are currently taking part in national and international committees responsible for the drafting of regulations and carrying out intercomparisons. It is common for such regulatory bodies to propose idealistic standards which just cannot be met in practice, particularly in the specification of commercial instrument performance. The recorded performance of dosemeters during over 15,000 calibrations including about 30 common types provides irrefutable evidence of the actual state of the art which might well be lost or confused if these calibrations had been performed at many different locations.
Although the facilities were initially established for the calibration of equipment to measure external radiation only, the sources and standards have proved useful for assisting the work on contamination monitors and the personal dosimetry service. The personal dosimetry service, which issues some 5,000 dosimeters per month to CEGB classified radiation workers as well as keeping computer records of their doses, requires radiation sources for the routine calibration of the dosimeters and for special investigations.
The calibration facilities are also proving most useful for the assessment of the performance of contamination measuring equipment. Such equipment has frequently to be used in external radiation fields of different photon energies and dose rates. By using the calibration facilities the gamma discrimination of surface or airborne radiation monitors can be checked at most of the energies and dose rates that are encountered in field use. Absolute beta and beta/gamma counters developed for neutron fluence measurements are also now being used as the basic standard against which large area sources to be used for calibrating surface contamination instruments are standardised.
Because of the similar nature of much of the work of the dosemeter calibration, the personal dosimetry service and the contamination assessment program, all three groups are now managed under a single Dosimetry Services Group.
262 CLARKE and THOMPSON
A secondary standards laboratory in a nuclear power utility has not only to provide accurate standards derived from the primary national ones,but it is also the best centre for providing the full range of dose-rates required at all qualities and energies covered by commercial dosemeters because of the high capital cost of radiation-producing equipment.
The routine calibration of large numbers of operational dosemeters provides unique information on reliability and on dangerous faults which can be used to warn users and advise manufacturers.
4. CONCLUSIONS
ACKNOWLEDGEMENTS
This paper is published by permission of the Central Electricity Generating Board.
REFERENCES
[1] Thompson, I.M.G., "Experimental techniques and standards used in evaluating and calibrating neutron survey instruments",Neutron Monitoring. (Proc. Symp. Vienna, 1966), IAEA, Vienna (1967) 639.
[2] Thompson, I.M.G., Lavender, A., "Calibration of the De Pangher Long Counter", Neutron Monitoring for Radiation Protection Purposes (Proc. Symp. Vienna, 1973). IAEA, Vienna (1973) 465.
[3] Wheatley, B.M., Cole, J.S., "Control of doses to skin exposed to external sources". CEGB report RD/B/N608. Berkeley Nuclear Laboratories, (1966).
[4] Lavender, A. , "A new gamma instrument calibration facility at?,BNL". CEGB report RD/B/N2293, Berkeley Nuclear Laboratories,(1972).
[5] Thompson, I.M.G., Clarke, R.W. , Lavender, A., Shipton, R.G. , "Evaluation of the characteristics of radiation survey instruments, Part 1, Assessment techniques". CEGB report RD/B/N2990, Berkeley Nuclear Laboratories, (1974).
DISCUSSION
K.E. DUFTSCHMID: Could you provide some specific information on the low-priced continuous environmental monitor developed in your laboratory?Is it a high-pressure ionization chamber, or what is the principle? Has it been in field use yet?
IAEA-SM-222/2S 263
I.M.G. THOMPSON : The continuous environmental monitor developed at our laboratory uses an energy-compensated Geiger-Miiller detector whose energy response varies by only ±25% over the photon energy region 50 keV to 6 MeV The detector, electronics and digital cassette recorder are housed in a watertight plastic box. The integrated exposure over a preselected period (1 min upwards) is recorded on magnetic tape and the instrument can be left unattended continuously recording the exposure for periods in excess o f two weeks.
Field trials are about to start on the prototype which has just been exhibited at Essen. A commercial version o f this unit is being developed, the cost o f which is likely to be similar to that o f a conventional analogue meter instrument and considerably lower than the cost o f existing continuous recorders.
R. ABEDINZADEH: What is the average number o f neutron dose meters you calibrate per power plant and per year?
I.M.G. THOMPSON: We calibrate approximately 100 neutron survey instruments per year, and each nuclear power plant owns about 1 0 neutron instruments, most o f them being neutron rem counters. Significantly larger numbers o f personal neutron dose meters, fast-neutron film badges and albedo dose meters are evaluated by the personal dosimetry service each year.
Y. NISHIWAKI: You cite two extreme cases o f malfunction o f the instruments. In one case, when the dose meter was exposed to excessively high dose rates, it failed to respond and gave a zero reading, while in the other case, when the instrument was exposed to 0.1 MeV photons, it responded at 20 times the true dose. Could you please say what type o f instruments were involved in these instances and where the trouble lay - in the detector part or in the electronic circuits?
I.M.G. THOMPSON : For obvious reasons I shall not name either o f these instruments, but in both cases the detectors caused the problems. The failure to respond to excessively high dose rates occurred with a Geiger-Miiller detector, where no electronic over-load circuit was provided. This fault was not apparent during the prototype-testing o f the instrument, but only became manifest after the instrument had been in operational use for about two years. The high response to 100 keV photons occurred with an Nal(Tl) detector and was due to the non- air-equivalence o f the detector materials.
Y. NISHIWAKI: Do you in the United Kingdom have any specific requirements concerning the minimum and maximum detection levels and the accuracy o f the instruments used for routine monitoring o f environmental radiation levels around power station sites?
I.M.G. THOMPSON: We have no specific maximum and minimum detection level requirements. There are statutory requirements to measure radiation levels in the area surrounding each nuclear site, and these levels are from 3 ¿/R/h upwards. There are no specific requirements for the accuracy o f the instruments used, other than our policy o f using the best available instrument for each application.

IAEA-SM-222/28
ORGANIZATION OF A SECONDARY STANDARD DOSIMETRY LABORATORY FOR THE INDIAN REGION
G. SUBRAHMANIAN, I.S. SUNDARARAO Division o f Radiological Protection,Bhabha Atomic Research Centre,Bombay,India
Abstract
O RG A N IZA T IO N O F A SEC O N D A RY STAN D ARD D O SIM ETR Y L A B O R A T O R Y FO R TH E IN D IA N REG ION.
The status of radiation dosimetry practised in hospitals in any country depends to a great extent on the availability of dose meter calibration facilities and trained manpower.The practice of radiation dosimetry is all the more important with the very rapid increase in the number of teletherapy units and high-energy accelerators, and the commercial availability of 60Co and 137Cs brachytherapy sources, as well as a variety of radiopharmaceuticals in a big, developing country like India. For this purpose a coherent programme involving all the above aspects was initiated in India less than two decades ago and most of the objectives have been fulfilled. The salient features and success achieved in all the aspects of this programme are described. The role of the Radiological Standards Laboratory which has assumed the additional responsibility of serving as the Secondary Standard Dosimetry Laboratory in India is emphasized. The two main programmes of the Secondary Standard Dosimetry Laboratory are: (1) the continuation of the T LD intercomparison service started by IAEA/WHO, and (2) calibration services for dose meters and radiotherapy beams. The details of the programme and the results are outlined.
1. INTRODUCTION
One o f the immediate benefits that the medical field has derived from the Peaceful Uses o f Atomic Energy Programme, is the large-scale availability o f 60Co teletherapy sources. Since India installed its first 60Co teletherapy unit in the late fifties, the growth in the number o f teletherapy installations in this country has been very rapid. Even though conventional X-ray therapy was popular, the corresponding growth in the number o f X-ray installations is only marginal. Moreover, several o f these X-ray units are now in disuse, either due to lack o f servicing and maintenance facilities or due to preferential diversion o f patients to cobalt teletherapy. The situation in countries around India is similar.
265
266 SUBRAHMANIAN and SUNDARARAO
During the early sixties, radiological protection survey teams visiting these therapy centres have reported a total or a nearly total absence o f radiation dosimetry and treatment planning facilities in these centres. It appeared as if the radiotherapy was being done on an ad hoc basis, depending on the clinical experience o f the radiotherapist concerned. Persons trained in radiotherapy physics and dosimetry were almost non-existent because no such training facilities existed in India. Dose meters were not manufactured locally and many hospitals that had imported dose meters could not use them for long due to non-availability o f special batteries on the local market. Moreover these dose meters were never recalibrated following purchase. Thus there existed an urgent need to develop the necessary infrastructure in India and to provide the hospitals with the basic requirements.
2. EARLY DEVELOPMENTS IN INDIA
The initiative in this regard was taken by the Research Centre at Trombay, and soon a multi-disciplinary programme had been initiated. The salient features o f this programme included: ( 1 ) design, development and fabrication o f radiation measuring devices and dose meters from locally available components and materials to the extent possible; ( 2 ) design and development o f primary standards necessary to establish a dose meter calibration facility; (3) training o f young and enthusiastic graduates to take up positions as medical physicists in hospitals; and (4) research and development in the field o f radiological physics. The success o f this programme can be seen from the fact that, today, as many as 50 radiotherapy centres have employed medical physicists trained by us, and many among them are conducting research and development work in the field o f hospital physics. The training programme initiated by us in 1962 received a welcome boost in the form o f collaboration with WHO and, later, with the Bombay University conferring postgraduate diplomas on the successful canditates.
By 1976, over 40 therapy-level dose meters o f secondary standard category had been fabricated and supplied to various hospitals. In addition, an equivalent number o f other dose meters o f a lower category were supplied. Calibration services were extended to all hospitals soon after the primary standards had been established by the Radiological Standards Laboratory. Up to the present time, over 70 dose meters have been calibrated. Among the other services extended to the hospitals are the planning o f radiation installations from the point o f built-in radiation safety, and advice rendered on various dosimetry and treatment planning aspects o f day-to-day radiotherapy. In the context o f the present paper, the role o f the Radiological Standards Laboratory is further highlighted.
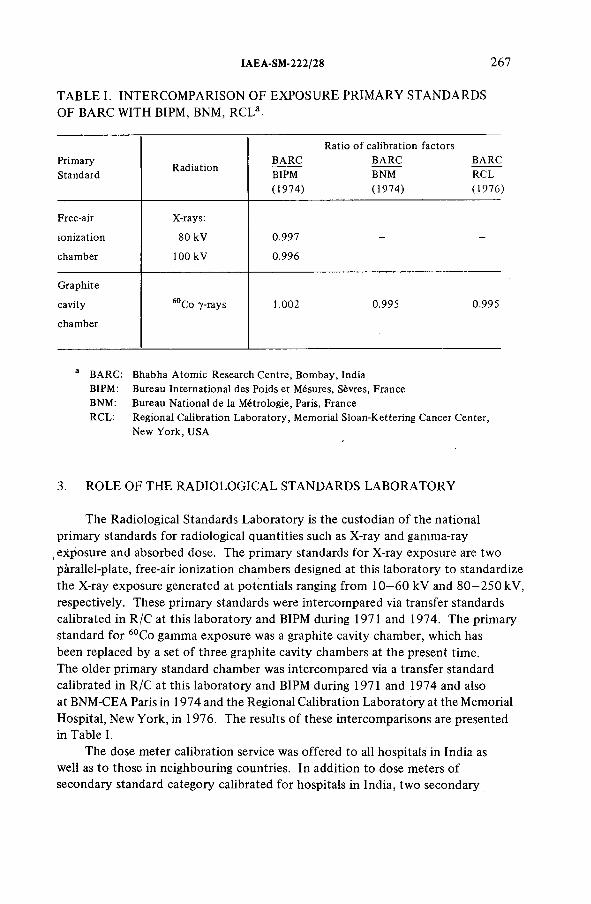
IAEA-SM-222/28 267
TABLE I. INTERCOMPARISON OF EXPOSURE PRIMARY STANDARDS OF BARC WITH BIPM, BNM, RCLa
PrimaryStandard Radiation BARC
BIPM(1974)
Ratio of calibration factors BARC BNM (1974)
BARCRCL(1976)
Free-air X-rays:
ionization 80 kV 0.997 - -
chamber 100 kV 0.996
Graphite
cavity 60Co 7-rays 1.002 0.995 0.995
chamber
BARC: Bhabha Atomic Research Centre, Bombay, IndiaBIPM : Bureau International des Poids et Mésures, Sèvres, FranceBNM: Bureau National de la Métrologie, Paris, FranceRCL: Regional Calibration Laboratory, Memorial Sloan-Kettering Cancer Center,
New York, USA
3. ROLE OF THE RADIOLOGICAL STANDARDS LABORATORY
The Radiological Standards Laboratory is the custodian o f the national primary standards for radiological quantities such as X-ray and gamma-ray exposure and absorbed dose. The primary standards for X-ray exposure are two pàrallel-plate, free-air ionization chambers designed at this laboratory to standardize the X-ray exposure generated at potentials ranging from 10—60 kV and 80—250 kV, respectively. These primary standards were intercompared via transfer standards calibrated in R/C at this laboratory and BIPM during 1971 and 1974. The primary standard for 60Co gamma exposure was a graphite cavity chamber, which has been replaced by a set o f three graphite cavity chambers at the present time.The older primary standard chamber was intercompared via a transfer standard calibrated in R/C at this laboratory and BIPM during 1971 and 1974 and also at BNM-CEA Paris in 1974 and the Regional Calibration Laboratory at the Memorial Hospital, New York, in 1976. The results o f these intercomparisons are presented in Table I.
The dose meter calibration service was offered to all hospitals in India as well as to those in neighbouring countries. In addition to dose meters o f secondary standard category calibrated for hospitals in India, two secondary
268 SUBRAHMANIAN and SUNDARARAO
standard dose meters were also calibrated for Sri Lanka and the Philippines.At present, the recalibrations are done exclusively on demand from the users and no statutory provisions exist in India to recall dose meters for periodic recalibration. All secondary standard dose meters that come for calibration are subjected to a thorough evaluation o f performance characteristics following the OIML specifications o f 1975, and only those dose meters complying with these tests are accepted for detailed radiation calibration. X-ray calibrations are done by a substitution method against a primary standard. Unless requested to do otherwise, all X and gamma dose meters are calibrated at five standardized X-ray energy points and for 60Co gamma radiation. For 60Co calibration, the exposure rate at 1 0 0 cm from the source was established by primary standard measurement, and dose meters are calibrated by positioning them in the standardized radiation field. Certificates o f calibration quoting the calibration factors and uncertainties, as well as the conditions under which the calibration was performed, are issued for every dose meter calibrated.
4. DESIGNATION AS AN IAEA/WHO COLLABORATING CENTRE
At this stage o f development, it was realized that the hospitals had been provided with the necessary manpower and material to perform reasonably good dosimetry for clinical applications. It was further realized that a stage has now been reached where more emphasis in our programme should be given to ensuring that the equipment and expertise made available to the hospitals is put to proper use and that clinical dosimetry performed at those hospitals is sufficiently accurate and consistent with the efforts already made, Therefore, the designation o f our laboratory as an IAEA/WHO Collaborating Centre for Secondary Standard Radiation Dosimetry has not come a day too soon.
It may be recalled that the primary objective in establishing the SSDL network is to establish accuracy and worldwide uniformity o f radiotherapy dosimetry. The success o f this international programme largely depends on the success achieved at the national and regional levels. The SSDLs should therefore ensure that radiotherapy dosimetry within their own region is accurate and uniform. One o f the techniques to check the accuracy and uniformity o f the radiation dose delivered to patients in radiotherapy is by postal dose intercomparison, a technique initiated and perfected by IAEA/WHO for 60Co teletherapy units. This programme has been conducted for over a decade at the international level.
5. TLD INTERCOMPARISON PROGRAMME
One o f the functions o f SSDLs is to carry out this intercomparison within their respective regions and to ensure that each and every radiotherapy centre
IAEA-SM-222/28 269
participates and benefits from this service. Accordingly, SSDL Trombay has taken up this intercomparison programme and has so far covered 32 out o f 57 hospitals in India. The SSDL programme is not intended to supplement the international IAEA/WHO programme but is intended to attain the capability in terms o f technical expertise and organization to enable it to take over that part o f the international programme pertaining to the region. In this context, it is necessary that the two intercomparison programmes are identical, so that the results obtained independently in each programme are comparable and can finally be integrated. Until an SSDL reaches the required level o f perfection, the two programmes run concurrently. With this in view, the SSDL Trombay has not only identified its programme with that o f IAEA/WHO but has combined the IAEA/WHO batch with one o f the SSDL batches. Each o f the 10 participants irradiated the TLD capsules from SSDL Trombay and from IAEA/WHO on the same day, under similar conditions, and returned them to the respective laboratories. The dose meters were independently evaluated at SSDL Trombay and at IAEA, Vienna.
Furthermore, the SSDL Trombay participated in the IAEA experiments intended to check the consistency o f TLD readers used by SSDLs. The result o f the latest intercomparison showed an agreement o f 1% between the dose values read and reported by our SSDL and the values stated by IAEA. The calibration o f 60Co beam output was also checked independently by the visiting IAEA/WHO expert, who performed the measurements using a WHO-owned, NPL-calibrated secondary-standard dose meter. All these checks have established the capability o f SSDL Trombay to conduct a TLD intercomparison service which is accurate and at the same time comparable in quality with that o f the IAEA/WHO service.
The actual conduct o f the intercomparisons at various hospitals was preceded by collecting information from each hospital on the specifications o f each teletherapy unit and its source, the availability and the calibration status o f dose meters, the experience and qualifications o f the physicists and the hospital’s willingness to participate in the SSDL intercomparison programme.This information was entered into questionnaires sent out by SSDL and returned by the hospitals. The questionnaires were also sent to hospitals in Burma,Sri Lanka and Thailand through the courtesy o f WHO, SEARO, and all the participants returned the questionnaires with the information requested.
The common factor for most o f the hospitals in India is the lack o f a recently calibrated dose meter and an undue reliance on the beam output values supplied to these hospitals at the time o f source loading, which was in some cases several years earlier. The results o f the TLD intercomparison have also confirmed that the physicists concerned do not measure the beam output regularly and rely heavily on measurements made earlier either by them or by the staff o f the Trombay research centre. Serious errors in the use o f correction factors for 60Co decay and in the conversion o f the exposure value measured
270 SUBRAHMANIAN and SUNDARARAO
at SSD to that at SSD+0.5 in air were also noticed. The results o f the TLD intercomparison at 25 hospitals show a ‘normal’ trend with many (54%) institutions falling within the ± 5% deviation limits. Errors in the use o f numerical conversion factors are not uncommon, even among these participants. Efforts were made to educate the participants by providing them with the latest values o f numerical factors and by sending them copies o f “ Guidelines for calculating the absorbed dose” . Errors in dosimetry at these hospitals were corrected through protracted correspondence. However, in situations where the deviations were larger than 1 0 %, it was found necessary to perform on the spot measurements o f beam output.
6 . BEAM OUTPUT MEASUREMENT SERVICE
It is realized that a TLD intercomparison alone is not sufficient to achieve accuracy and region-wide uniformity o f absorbed dose measurement in a reasonably short time. Accuracy and uniformity o f radiation dosimetry implies that all basic measurements pertaining to radiation dosimetry performed at each and every radiotherapy centre must be traceable to national standards. This can be achieved if the physicists concerned are conscientious enough to ensure periodic recalibration o f their dose meters and to check for possible changes in their sensitivity by regular measurements using an 90Sr check source. Furthermore, every radiotherapy centre should, ideally, maintain at least two dose meters, one being o f secondary standard category. The other dose meter must be periodically calibrated against the secondary standard by the physicist himself.This second dose meter is then to be used for all the routine measurements, while the secondary standard dose meter should be treated as the ‘local standard’ and used only on special occasions. This practice is generally not followed in India, and the recalibration o f dose meters is ignored. Therefore, the output values o f teletherapy units on which weré based the absorbed dose rates calculated for radiotherapy treatments could be in error by several per cent. Identification o f such institutions from TLD intercomparisons is time-consuming, and correcting the mistakes by correspondence may further reduce the chances o f curing patients, particularly in cases where the dosimetry is very much o ff the mark.
Therefore, concurrently with the TLD intercomparison, a programme for calibrating the beam output o f 60Co teletherapy units was also initiated. A senior physicist o f the SSDL carried with him-a secondary standard dose meter calibrated at the RSL, a 90Sr check source and accessories. He toured all radiotherapy centres in the northern and western region o f the country. He performed beam output measurements for all field sizes and SCDs required by the hospital and also compared the hospital’s dose meter with the SSDL secondary standard
IAEA-SM-222/28 271
in an intercomparison Perspex phantom. Tentative values o f calibration factors were provided instantly and, wherever necessary, the appropriate persons in the hospital were advised to send the dose meter for repair and/or recalibration at the RSL-SSDL. These visits were also utilized to educate the radiotherapist and physicist at each hospital visited regarding the need for accuracy and uniformity in clinical dosimetry. The response shown by the radiotherapists and physicists after the tour bears testimony to the success o f this programme.It is proposed to continue this calibration service and extend it to all hospitals in the geographic region. Simultaneously, TLD intercomparison will also be continued and extended to all centres. Repeat intercomparisons, wherever necessary, have been performed and will be continued in the future, also.
Besides the services offered for 60Co teletherapy, the SSDL was called upon to perform radiation protection and provide dosimetry services to a neighbouring country which had received as a gift 1 0 0 mg o f radium stock from a developing country. It was found that the gift o f radium, in the form o f needles, tubes and applicators, was accepted without making adequate preparations for its storage and end-use. It may not be out o f place here to mention that the motive behind the gift o f such large quantities o f radium sources, it is feared, was not entirely philanthropic, and often unwary users in developing countries are wooed to accept such donations. The type o f hazardous situation that existed in this neighbouring country could have been avoided had the donor or recipient consulted the WHO office in the region concerned well before the transaction took place. It is the responsibility o f the SSDL to ensure that no such situation arises, and the institutions or individuals concerned would do well to inform the WHO and/or the SSDL.
In conclusion, the experience o f SSDL Trombay has shown that achievement o f the objectives can be effectively achieved with the co-operation o f IAEA/WHO and through the concentrated efforts o f the SSDL itself. In addition, the SSDL Trombay has the advantage o f a primary standards laboratory o f its own and various other facilities available at this research centre. Moreover, since the laboratory was performing these functions even earlier, the experience and expertise accumulated over the years are being utilized to reach the target expeditiously.
ACKNOWLEDGEMENT
The authors wish to record their appreciation and thanks to all the members o f RSL-SSDL in general, and Mr. S.B. Naik, K.D. Pushpangadan and Mrs. Vadiwala in particular, for their association in the output calibration and TLD intercomparison aspects o f the programme. The encouragement and support received from Dr. W. Seelentag o f WHO, Geneva, Drs H. Eisenlohr and B. Waldeskog o f the Dosimetry

272 SUBRAHMANIAN and SUNDARARAO
Section, IAEA, and Dr. M. Thangavelu o f WHO, SEARO, New Delhi, is gratefully acknowledged. The authors are grateful to Dr. K.G. Vohra for all the facilities provided to the SSDL.
IAEA-SM-222/29
EVALUATION OF DOSIMETRIC ACCURACY AND UNIFORMITY FOR 60Co RADIATION THERAPY
I.S. SUNDARARAO, S.B. NAIK,K.D. PUSHPANGADAN, R. VADIWALA,G. SUBRAHMANIANIAEA/WHO Collaborating Centre for Secondary Standard Radiation Dosimetry,Division o f Radiological Protection,Bhabha Atomic Research Centre,Bombay,India
Abstract
EV A LU A T IO N OF D O SIM ETR IC A CCURACY AND U N IFO R M IT Y FO R 60Co RA D IA T IO N T H ER A PY .
One of the important factors contributing to the success of radiotherapy is the accuracy with which the stated radiation dose is delivered to the patient. The treatment results and dosimetry should be comparable anywhere in the world. In this context the Secondary Standard Dosimetry Laboratory, Trombay, has taken up a programme to check the accuracy and uniformity of absorbed dose for ^Co therapy units in this geographical région. This dose intercomparison service for “ Co teletherapy units is being conducted using mailed thermoluminescent dose meters (T LD ) and has so far covered 32 out of 57 centres in India. The technical features of the TLD intercomparison are identical to that of the IAEA/W HO programme to ensure easy integration of results obtained by the regional and international programmes. To ensure comparability even more, the TLD reader consistency was checked by measuring T LD capsules irradiated by the IA EA . Similarly, the output measurements of the “ Co teletherapy units were also compared with measurements made by the NPL-calibrated secondary standard dose meter maintained by the World Health Organization. The results of the TLD intercomparison at the 32 institutions have indicated a normal pattern with about 54% of these institutions falling within the ± 5% deviation limits. The follow-up action initiated to correct the dosimetry in certain deserving cases depends upon the extent and nature of error. A beam output measurement programme is also available to expedite the process of achieving region-wide uniformity of dosimetry.All these services are also offered to radiotherapy centres in the neighbouring countries.
1. INTRODUCTION
In a general paper presented at this Symposium [1 ], the various dosimetry services already available to radiotherapy centres in India are outlined. It would
273
274 SUNDARARAO et al.
be idle to pretend that the mere provision o f dose meters, calibration services, expertise and guidance, has resulted in ideal dosimetry in India. The general picture that has emerged from a recent survey conducted at 40 o f the 57 teletherapy centres in India using a mailed questionnaire is very revealing.It appears that, in radiotherapy centres, freshly calibrated dose meters are not available and that the beam output values used in routine radiotherapy are based on measurements made several years earlier. It is not the lack o f awareness o f the need for accurate dosimetry on the part o f the persons concerned; often it is the sheer necessity for the hospitals to treat as many patients as possible in any working day. In this vast country, with a population o f about 600 million, there are only some 70 teletherapy units distributed among 57 radiotherapy centres. Added to this, the patients report for treatment at a very advanced stage o f disease, in which case the treatment result can at best be palliative. However, this does not justify total neglect o f the dosimetry programme, because there are always a sizable number o f patients who, when treated with an ‘optimum dose’ , have abetter chance o f cure.
The value o f the intercomparison o f absorbed dose for 60Co teletherapy units using mailed thermoluminescent dose meters (TLDs) has already been established by IAEA/WHO, who have been conducting such intercomparison services for over a decade. With the organization o f a national and regional SSDL network, it was intended that this intercomparison service should reach each and every radiotherapy centre, so that the achievement o f worldwide uniformity in radiation therapy dosimetry is expedited. Therefore the SSDLs are required to conduct such intercomparison services in their own countries or regions on lines more or less identical to the parent service, thus facilitating an easy integration o f results from each SSDL and enabling IAEA/WHO to draw conclusions at the international level. With this in view, our laboratory at Trombay initiated a gamma dose intercomparison service soon after its designation as an SSDL in 1976.
The actual intercomparison service was preceded by mailing questionnaires to all radiotherapy centres, thus gathering information on the physical features o f the teletherapy units, availability and calibration status o f dose meters, the institutions’ willingness to co-operate in this programme, etc. The intercomparison was started with those institutions who responded promptly to the questionnaire; gradually other institutions were included, as and when they communicated their acceptance. To the end o f 1977, this service was conducted with the co-operation o f 32 institutions in India, grouped into four batches. Needless to say, all the technical features o f the intercomparison, including the format o f reporting results, are strictly comparable with the IAEA/WHO service. Therefore, no attempt is made to describe the technical details o f the inter- comparison except where necessary for an understanding o f this text.
IAEA-SM-222/29 275
The TLD reader system employed for all measurements made at our laboratory comprised a locally fabricated heater/photomultiplier unit enclosed in a brass shell, with a drawer provision, heater-current supply, stabilized EHT power supply for the photomultiplier and a Keithley 6 IOC solid state electrometer with its output connected to Keithley 163 digital voltmeter. A precision microbalance (Mettler H20) is used to determine the mass o f the quantity o f phosphor dispensed (LiF-TLD 100). Each polyethylene capsule contained about 200 mg o f phosphor, which is adequate for 15—20 measurements. A stop watch and a manually operated switch are used to initiate and terminate the heating-measuring cycle.
Since the duration o f measurements for all TLD sets o f a single batch is a few days, it was considered worthwhile to establish the stability and consistency o f the TLD reader. The stabilities o f constituent units like the EHT supply and the electrometer were determined separately. The stability o f the entire TLD measuring system was also checked independently, by measuring reference powder irradiated to a uniform radiation dose. Sets o f 2 0 measurements were made at different times during one day, over a period o f several consecutive days. The results showed a maximum variation o f ± 1 % in any single day and ± 2 % over five consecutive days.
The consistency o f the TLD reader was also checked with the help o f the IAEA. The Agency sent us a set o f 10 calibration capsules and another set o f 5 capsules irradiated to dose values known only to IAEA. The SSDL measured all these capsules in a single day and evaluated, from the calibration data, the dose values received by the 5 capsules. The agreement between the values reported by the SSDL and the true values given by IAEA is very good. This IAEA experiment was conducted twice during 1977. The latest results serve as an assurance that the SSDL TLD reader is consistent to within 1% as compared with the IAEA reader system.
2. TLD READER SYSTEM
3. SSDL CALIBRATION OF TLD CAPSULES
Calibration data were established for each intercomparison batch by irradiating a set o f TLD capsules to precisely known radiation dose values under standard conditions provided for this purpose at the Radiological Standards Laboratory (RSL). A Philips 60Co teletherapy unit was employed for irradiations under vertical beam geometry giving a field size o f 10 cm X 10 cm at a distance o f 60 cm from the source. The exposure rate in air at 60.5 cm from the source was measured using the RSL primary standard to an accuracy
276 SUNDARARAO et al.
estimated to be better than ±1%. A recent intercomparison o f exposure rate measurements made using the RSL primary standard and the WHO-owned, NPL-calibrated secondary standard dose meter has shown an agreement to 0.3%.
The dose rate in water at 5 cm depth on the central axis o f the beam ( 5D\v) for the source-to-water-surface distance o f 60 cm is given by:
s D w = 0 . s X A - B - j ^ - - F
where 0.sXa is the exposure rate in air at 60.5 cm from the source, corresponding to the dose maximum in water. В is the backscatter factor, P is the percentage depth dose, and F is the composite factor incorporating a displacement correction. The numerical values o f В, В /100 and F used under the above conditions o f irradiation are 1.036, 0.759 and 0.95, respectively.
The TLD capsules were positioned at 5 cm depth in a 30 cm X 30 cm X 30 cm Perspex water phantom and were irradiated to dose values ranging from 140 rads to 240 rads. A second set o f 3 capsules was also irradiated to about 200 rads for the purpose o f checking day-to-day consistency o f the TLD reader during the course o f the measurements. A third set o f 3 capsules irradiated to known doses was deliberately introduced into each intercomparison batch without the person making the measurements and dose evaluation knowing the true dose value.This check has proved to be valuable in detecting any unexpected mishap in the dose evaluation chain. All irradiated TLD capsules, including those received from participants, are stored in a desiccator until they are measured. Pains were taken to ensure that the calibration set and the participant’s sets had equal elapsed times between irradiation and measurement, thus minimizing errors due to unequal fading.
The check capsules were measured both at the beginning and the end o f each day’s measurements. All measurements were corrected for any drift in the TLD reader and were normalized to the day on which the calibration set was measured. The calibration graph was obtained by a least-squares fit.
4. ANALYSIS OF RESULTS
The results have been analysed considering both overall deviation and the measured/mean value (Fig. 1 ) The results from the various institutions fall into three familiar categories, in terms o f deviation, namely: (i) institutions with results within ± 5% (where the dosimetry is reasonably adequate); (ii) those with results between ± 5% to ± 10% (where the dosimetry needs improvement, usually by the participant exercising a little more care following advice offered by the SSDL); and (iii) those cases where the deviation exceeded ± 1 0 %, indicating serious errors
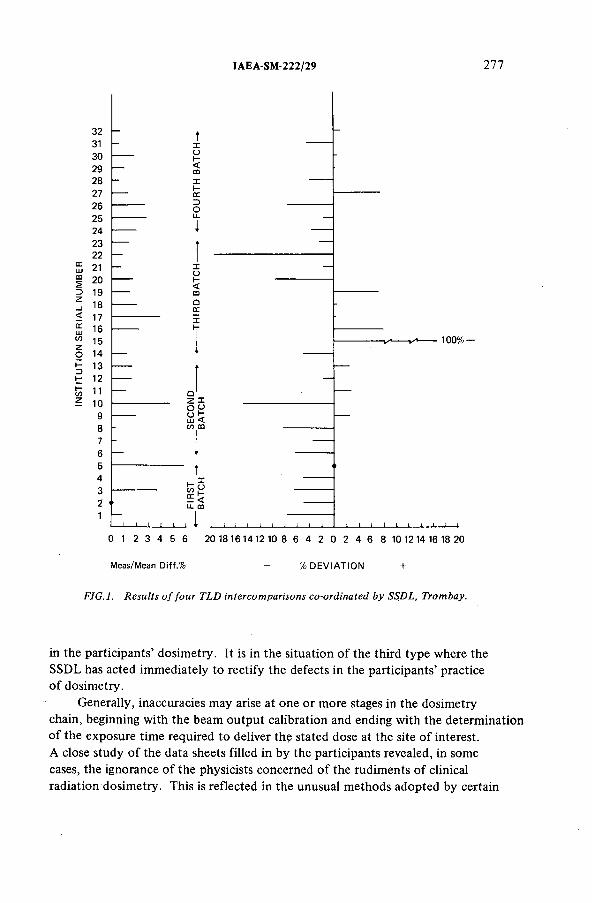
IAEA-SM-222/29 277
323130292827262524232221201918171615141312111098
7654321
Meas/Mean D¡ff.9¡ > D E V IA T IO N
F I G . l . R e s u l t s o f f o u r T L D in t e r c o m p a r i s o n s c o -o r d i n a t e d b y SS .D L, T r o m b a y .
in the participants’ dosimetry. It is in the situation o f the third type where the SSDL has acted immediately to rectify the defects in the participants’ practice o f dosimetry.
Generally, inaccuracies may arise at one or more stages in the dosimetry chain, beginning with the beam output calibration and ending with the determination o f the exposure time required to deliver the stated dose at the site o f interest.A close study o f the data sheets filled in by the participants revealed, in some cases, the ignorance o f the physicists concerned o f the rudiments o f clinical radiation dosimetry. This is reflected in the unusual methods adopted by certain
278 SUNDARARAO et al.
participants in the calculation o f 5 D\v from Хд. For example, one participant multiplied Х д by TAR, В and F and wrongly assumed this product to be sD\y- The use o f wrong or outdated values o f B, TAR, P/100 and F are not uncommon among some o f the participants, including those whose results are within acceptable limits o f deviation. However, this is not a serious problem, because the persons concerned can be educated in the use o f correct data. The common mistake in calculation o f 5 D\y is the ignorance o f the need to convert the measured SSD^A into SSD+0.5XA using the inverse-square law. Errors in applying temperature and pressure corrections are also commonly observed.
Many participants have not cared to measure the exposure rate at the point o f interest in the recent past. These participants have either used the exposure value supplied at the time o f source loading, dating back several years in some cases, or used their own measurements made years earlier. Here again, serious errors in decay corrections are made by participants. All these errors have been corrected by advice and protracted correspondence. It appears from Fig.l that many institutions exhibit negative deviation. However, this trend cannot be substantiated in view o f the small number o f institutions studied so far. Generally, the physicists here have a tendency to under-irradiate whenever their dosimetry is in doubt. This impression was gathered from informal discussions we held with the physicists on various occasions.
5. FOLLOW-UP MEASURES
In all cases where the mistake has been identified from the data sheets and suspected to be due to either one or more o f the factors stated above, the follow-up action o f properly educating the physicist concerned in the correct calculational procedures sufficed. More serious efforts were required only in the case o f three institutions, where deviations larger than 1 0 % could not be accounted for as due to errors in calculations alone. The action taken with these institutions was significantly different.
In case o f the institution with the serial number 10, a physicist from this Division was immediately sent to re-check the calibration o f the beam output.It was found that the beam output calibration differed from the assumed value by less than 5%, which would not explain the larger deviation shown in TLD intercomparison. From a close examination o f the measured/mean difference (4.7%) it can be assumed that the dosimetry at this institute is not only inaccurate but also inconsistent, even in consecutive exposures given to the three TLD capsules. This can be attributed to the lack o f seriousness on the part o f the physicist, and to possible malfunctioning o f the cobalt unit exposure mechanism. This trend was confirmed from the IAEA/WHO results o f the same institute conducted a few months earlier. Therefore, it was decided to repeat the intercomparison at this institute with clear instructions to the physicist to pay special attention to all
IAEA-SM-222/29 279
parameters likely to change during the course o f irradiation. The case o f the institution with the serial No. 15 was even more peculiar. The dose value received by the capsules irradiated by the physicist could not be assessed because it fell beyond the range covered by the calibration data. It is roughly estimated to be + 100% off. The superintendent o f the hospital was immediately informed o f the magnitude o f the error in the radiotherapy o f the patients with emphasis on the likely impact o f this in offsetting the benefits o f the radiotherapy. At the same time, a senior member o f the SSDL Trombay was instructed to visit the institute and report an on-the-spot assessment o f the dosimetric situation in that hospital. On the basis o f this, the TLD intercomparison at this institute was repeated. Happily, the results o f the repeat intercomparison have been very good. In case o f the institution with the serial No.22, the physicist was asked to report on possible reasons for the large deviations. Detailed investigations o f these institutes are still in progress and no clear picture has yet emerged.
Simultaneously a programme was initiated in which a senior physicist o f SSDL Trombay was deputed to visit all radiotherapy centres in the country and to check the beam output calibrations o f teletherapy units. Two groups o f radiotherapy centres in the western and northern regions o f the country have been visited, and the beam outputs o f the telecobalt units at these centres were measured using an SSDL-calibrated dose meter. The dose meter was calibrated against primary standards before departure. The calibration consistency o f the dose meter during the tour was checked with an 90Sr check source carried with the dose meter. The dose meter was again checked for calibration constancy after its return to headquarters.
Besides calibrating the radiation beams, the visiting physicist also compared the institutions’ dose meters against the SSDL dose meter at a depth o f 5 cm in a Perspex intercomparison phantom. Furthermore, the visiting physicist tendered appropriate advice to the persons concerned with radiotherapy in the hospital on matters o f accurate clinical dosimetry. Whenever necessary, the visiting physicist also instructed the hospital authorities either to recalibrate the dose meter or to order a new dose meter. These services and advice have undoubtedly helped in imparting the much needed awareness to physicists, radiotherapists and others on the need as well as the technology to ensure accurate and reliable treatment o f patients and that this depends on proper dosimetry.This is evident from the encouraging response from the authorities at many o f the radiation therapy institutions, welcoming the measures initiated by the SSDL designed to better the uniformity and accuracy o f radiotherapy in this region.
ACKNOWLEDGEMENTS
The SSDL acknowledges the co-operation and encouragement received from Dr. M. Thangavelu, Regional Adviser for Non-communicable Diseases,
280 SUNDARARAO et al.
WHO, SEARO, New Delhi, Dr. W. Seelentag o f WHO, Geneva, and Drs H. Eisenlohr and B.Waldeskog o f the Dosimetry Section, IAEA, in our efforts to improve ratiotherapy dosimetry in this region.
REFERENCES
f l ] SU BRA H M A N IA N , G., SU N D ARARA O , I.S., “ Organization of a Secondary StandardDosimetry Laboratory for the Indian region” , these Proceedings, paper IAEA-SM-222/28.
INTERNATIONAL DOSIMETRY ACTIVITIES

IAEA-SM-222/64
THE ROLE OF ICRU IN INTERNATIONAL RADIATION STANDARDS
H.O. WYCKOFFInternational Commission on Radiation Units and Measurements, Washington, DC
Abstract
T H E R O LE OF IC R U IN IN T ER N A T IO N A L RA D IA T IO N STANDARDS.For the past half-century, the IC R U has provided recommendations on radiation quantities,
units and measurements. In addition to this work, effort has been directed towards providing international standards. This paper summarizes some of this effort.
The International Corrmission on Radiation Units and Measurements (then called the X-Ray Units Canmittee) was formed by the First International Congress of Radiology in 1925. As pointed out by Taylor[11, the most important reason for setting up such a Comdssion was that there was no internationally agreed upon unit (or as we would say now, physical quantity) for the measurement of the radiation involved in therapeutic applications.At that time, it appears that there were only two or possibly three national Standardizing laboratories involved in research with ionizing radiation and there was no international laboratory involved in such activities.
By the time of the Second International Congress of Radiology (1928), the International X Ray Unit Ccranittee had prepared a recommendation regarding the definition and name of the unit to be used for measurement of x rays in radiation therapy.[11 With but minor modification, primarily for purposes of clarification and for extension of the usefulness of the unit to higher energy photons, this unit (roentgen) is essentially the same today. Agreement on the definition of the unit focused the attention of national standardizing laboratories on the development of techniques for its proper measurement.^
1 One should hasten to add that the initial definition of the unit, and even the modification adopted in 1937, did not clearly separate the definition of the unit from the definition of the quantity. While the concept or phenomenon, i.e. the quantity, has not changed, the name for it has changed. One might infer from the initial definition of the unit that the quantity was the “quantity of x radiation” and from the 1937 definition that it was the “quantity or dose of x rays” . Since 1962 this quantity is called “exposure” , so that the word dose could be limited to the concept of energy imparted per unit mass.
283
284 WYCKOFF
International comparison of national standards were reported in 1928 by Behnken‘2] of the Physicalisch Technische Reichsanstalt at Berlin who used a portable cavity chamber. Additional intercomparisons were conducted in 1931 by Taylor[3] of the U.S. National Bureau of Standards by means of a portable "primary standard"^ of the free-air type. Both of these man were members of the X-Ray Units Committee.
While each of the national laboratories refined their measurement capabilities of ionizing radiation and extended these capabilities to higher energy photons during the next two decades, the ICRU - as such- was not involved except for a minor modification in the definition of exposure so that it could be used for higher energy photons.№] instead, the ICRU occupied itself with recamendations on calibration requirements for clinical instruments for measuring photon radiation and on other parameters, such as the quality, that should be recorded for radiation treatment.
The next major step by the ICRU in the development of radiation quantities, units and procedures for their measurement started with their report to the Sixth International Congress of Radiology in 1950 Í5]. Prior to this Congress, the basis for new reconrrendations was prepared by correspondence between the various members. Thus, it was possible to decide at that time on the quantity which we new call absorbed dose. The ICRU pointed out that this quantity is applicable to all types and energies of ionizing radiation, and suggested that it could be measured by ioncmetric techniques using the Bragg-Gray relationship.
During its 1953 meeting, the ICRU recommended the "rad" as the special unit for absorbed dose[6], reviewed the status of national standards for radioactivity and x rays in the Netherlands, Sweden, United Kingdom and United States of America.t?] It also received reports on two interccmpari- sons of national x-ray standards that it had encouraged.t?] Similar reviews were also included in the 1956 and 1959 Reports of the ICRU^S][9]
Prior to the 1956 meeting of the ICRU it became apparent that the shipping of national primary standards to another national laboratory for comparison purposes was expensive and difficult. The free-air national standards - used for x-ray calibrations below 300kV - гиге large and heavy and their possibility of damage during shipment cannot be neglected. As an alternative to this procedure, the 1956 report reccrrmended that a small cavity ionization chamber be developed as a transfer instrument for purposes of comparing national standards.[8] Such chambers, because of their small size and ruggedness, could be readily transported, even by post.
Through the financial assistance of the United Nations Educational, Scientific and Cultural Organization (UNESCO), the use of the shop facilities at the U.S. National Bureau of Standards, and the assistance of the World Health Organization intercomparison equipment was constructed.
2 The words “primary standard” are today not always clearly understood. For example, the “primary standard” of a clinic now may be one that has been carefully calibrated at a national standardizing laboratory and used for the calibration of “working instruments” in that clinic. At the time of these intercomparisons, “primary standards” were meant to be those whose sensitivity was derived from measurements in terms of base quantities — in this case of length and electrical charge. Some authors now use the term “absolute standards” or “ absolute primary standards” .
IAEA-SM-222/64 285
Each set of equipment included a graphite-walled cavity chamber, a tungsten alloy diaphragm for defining the beam of radiation used in a free- air chamber and a carefully insulated, capacitor that could be used in the measurement of the ionization charge produced in a national standard. The cavity chamber was calibrated at NBS for x-ray beams of 50-250 kV and for the gaimia rays from ^Co and 137cs sources. The area of the aperature of the diaphragm and the capacitance of the capacitor was also determined at NBS. The constructional details and the results obtained with these devices is outlined in the 1959 1СШ report. 19]
Later, working with Dr. Francis Shonka who had prepared air equivalent mterials and was one of the pioneers in the precision molding of them, a scmewhat sirrpler but inproved version of these chambers becameavailable. The cross sectional views of these chambers and the calibration factors for them are included in Boag's chapter in Radiation Dosimetry. HO] it may be of interest to note that these chambers are still being used as transfer instruments and as the primary instrument in sane of the secondary standard laboratories. Both the initial and Shonka versions have reproduceabilities of sensitivities at a given quality of radiation that are ccsrparable to those obtained with the national standards.
Of course, it was obvious before the start of the development of such instruments, and the encouragement of the 1СЮ in undertaking intercompar- isons of national standards, that the ICRU could not serve as a focalpoint for such activities on a long-term basis. The Ccranission is a nongovernmental organization and has no laboratory. Such work could only be undertaken on an interim basis and then only with the assistance of the parent organizations of some of its members.
As a step towards identifying organizations that could conduct this work on a long-term basis, the 1СШ invited a number of interested international organizations to discuss this matter in 1958. These organizations included members frcm the Wbrld Health Organization, the United Nations Educational, Scientific and Cultural Organization, the International Atomic Energy Agency, the International Bureau of Weights and Measures, the International Union of Pure and Applied Chemistry, the International Union of Pure and Applied Physics, the International Organization for Standardization and the International Labor Organization. While no formal reocrrmsnd- ations were made at this meeting, all of these organizations supported the idea that an international group should handle this work, that it should preferably be a treaty organization, and that it should have a laboratory to facilitate such interccmparisons. At that time, the parent bodies of the International Bureau of Weights and Measures already had under consideration the possible extension of its activities into the general field of standards of radioactivity. As a result of this discussion, the 1СГО reocmrended that the International Bureau of Weights and Measures (BIPM) extend its activities into the broad range of measurements of ionizing radiation. In October of 1958, the International Canxnittee of Weights and Measures accepted this recommendation and also reccmended that this extended capability be developed at the International Bureau of Weights and Measures. In October 1960 the General Conference of Weights and Measures, the diplomatic organ of this group, approved this action.
The transfer of the intercomparison function frcm the ICRU to the BIFM was facilitated by cormon membership on the ICRU and the advisory body on standards of ionizing radiation of the International Cormittee
286 WYCKOFF
on Weights and Measures. With representation frcm the ICRU on this body, and on the body having to do with units, the ICRU has continued to provide input to this program of the BIPM.
Following this transfer of the intercorrparison function to the BIPM, the ICRU reverted to its more traditional role of (1) providing discussions of basic concepts of interest in ionizing radiation, (2) outlining techniques for determining the quantities of interest and the uncertainties associated with the numerical values obtained with them, (3) promulgating "best" values of parameters needed for accurately determining quantities such as kenta, exposure and absorbed dose, and (4) giving preferred methods of obtaining values of given quantities for specific applications such as absorbed dose in radiation therapy, absorbed dose and dose equivalent in radiation protection and determinations of low-level activity.
With the expanding use of neutrons for radiation therapy in the late 1960's and early 1970's and the lack of calibration facilities for such radiations in the national laboratories and at the BIPM, there appeared again to be a need for seme organization to undertake an international interccmparison of the devices used for such measurements. Here again, a ccmmon measuring stick was needed so that the experience gained by each facility could be readily compared and used by all such facilities.
The ICRU decided to fill this need and organized an interccmparison. Under the joint co-sponsorship of Colurrbia University, the Brookhaven National laboratory and the ICRU, the intercomparison was undertaken in 1973. The highly stabilized output of the facility at the Brookhaven National Laboratory, was used for the intercomparison. The accelerator staff frcm Colunfcia University worked with each of the participants during its intercanparison and the ICRU provided a "steering cantdttee" to select the participants and to review the results. Hie European Economic Comnu- nity assisted by providing travel costs for sane of the participants and for sctne of the steering committee meetings.
While an ICRU report on this intercomparison will soon be available, it might be well to outline briefly the arrangements and results of this interccmparison. The fourteen participating groups consisted of six frcm the U.S.A., toro from the United Kingdom, one from the Netherlands, one frcm France, three frcm Germany and one fran Japan. Neutrons frcm Californium -252 and accelerator produced neutron energies of 15.5,5.5,2.1, and0.67 MeV were provided. Conparisons were conducted for determinations of tissue kerma in free air at a fixed location for each of these energies, and for determinations of the absorbed dose at three depths in a water phantom for the two highest energies. Monitoring of the neutron radiation indicated that reproducibility was within 2 percent during the interoompar- isons.
In order to be able to determine the contributions from the gairma rays and frcm the neutrons separately most groups used two different devices. Eleven groups used homogeneous tissue-equivalent ionization chanters to determine the neutron plus ganma ray kerma or absorbed dose. Nine groups used ionization chanbers that were relatively insensitive to neutrons to determine the garrma ray component of the total radiation. Three of the systems used - polyethylene proportional counter, precision long counter and silicon diodes - are insensitive to garata rays and were used to measure the neutron component alone.
IAEA-SM-222/64 287
While there were no differenœs greater than about 30% from the mean among the determinations of neutron tissue kerma in free air or of neutron absorbed dosé in the phantom, mast of these values were within 5% of the mean when homogeneous, tissue-equivalent ionization chantiers were used. However, even 5% is not generally considered to be acceptable for absorbed dose determinations in radiation therapy. Thus, further investigations seem to be called for on the effect of chamber design and irradiation geometry on instrument sensitivity. More attention may also be required on the adequacy of charge collection and knowledge of gas density. Of course, тэге accurate values of the average energy required to produce an ion pair as well as some of the other parameters are also necessary.Further discussion of the results and conclusions of the interccriparison is contained in the forthcoming ICRU report on this interccmparison t H 1 and on the general problem of neutron measurement in ICRU Report 26 [12] on "Neutron Dosimetry for Biology and Medicine".
It is apparent from the results of this study that further research is needed to provide better values of the parameters affecting such determinations. Periodic neutron dosimetry interccmparisons are also required, e.g., such as those conducted under the European neutron dosimetry inter- conparison project at Rijswijk and Neuherberg in 1975. Routine calibration services by the national laboratories are also necessary.
Recognizing that an in-depth survey of the currently available data on the average energy required to produce an ion pair by different radiations in various gases is necessary for measurements of absorbed dose by the ionization technique, the 1СГО set up a report ccrrmittee to examine this area. The publication of this report is inminent, but it should be thought of only as an analysis of the current state of our knowledge.There are glaring discrepancies between seme of the determinations and there are total voids in our knowledge of sane of the values for critical energies and for heavier charged particles such as for cartoon and nitrogen. It is hoped that the publication of this report will provide an impetus for further research in this area.
Another area of interest in radiation dosimetry is the knowledge of the stopping power of various particles in different materials. The ICRU has now set up a report-writing group in this area, but it is too early to speculate on the results that might be forthcoming from this review.
The ICRU also is a "collaborating organization" to the "secondary standard dosimetry laboratory" network organized jointly by the International Atomic Energy Agency and the World Health Organization. Here the ICRU has contented on the results of in ter comparisons and the information provided by members of the network.
At the moment the ICRU does not envisage additional direct involvement in international interccmparisons, but expects to keep abreast of developments and provide information on the factors needed for calculation of the sensitivity of absolute standards.
REFERENCES
[1] Taylor, L.S., History of the International Ccrmission on RadiologicalUnits and Measurements (ICRU), Health Physics 1, 306-314 (1958)
[2] Behnken, H., Zur Frage der Rontgendosiseinheit, Strahlenther. 29,192-198 (1928) —
288 WYCKOFF
[3] Taylor, L.S., International Comparison of X-ray Standards, Bureau of Standards Journal of Research 8, 9-24 (1932)
[4] Reconmendatians of the International Conmittee for Radiological Units (Chicago 1937), Am. Jour, of Roentgen. XXXIX, 295-298 (1938)
[5] Reconnendations of the International Commission on Radiological Units, Brit. Jour, of Rad. XXIV, 276-278 (1951)
[6] Recormendations of the International Conmission on Radiological Units,Am. Jour, of Roentgen. LXXI, 139-142 (1954)
[7] Reports submitted to the International Conmission on Radiological Units (ICRU) Acta Rad. Supplementing 117 (1954)
[8] Report of the International Corrmission on Radiological Units and Measurements (ICRU) National Bureau of Standards Handbook 62 (1957)
[9] Report of the International Commission on Radiological Units and Measurements (ICRU), National Bureau of Standards Handbook 78 (1961)
[10] Boag, J.W. , Ionization chambers, Chapter in Radiation Dosimetry Vol.II, Eds. Attix, F.H. and Roesch, W.C. , Academic Press N.Y. (1966)
[11] ICRU (to be published), An International Neutron Dosimetry Interccm- parison, ICRU Report 27, International Commission on Radiation Units and Measurements, Washington, D.C.
[12] ICRU (1977), Neutron Dosimetry for Biology and Medicine, ICRU Report 26, International Ccrtmission on Radiation Units and Measurements, Washington, D.C.
J.C. McDONALD: Is it proper to use the expression “tissue kerma free-in-air” for fields other than neutron fields, such as orthovoltage X-rays or cobalt-60 gamma-rays?
H.O. WYCKOFF: It may be used for any indirectly ionizing radiation in any material. Values can be obtained experimentally or by calculation.
L.J. GOODMAN: It is sometimes asserted that the kerma cannot be measured, but only calculated. Would you please comment on the appropriateness o f speaking o f “the measurement o f kerma” .
H.O. WYCKOFF: Kerma can be determined “experimentally” . For example, the kerma, K, in air free-in-air, can be determined from the exposure, X, as follows:
where W is the average energy required to produce an ion pair, e is the electronic charge, is the energy transfer coefficient, деп is the energy absorption coefficient and p is the density. It is true that this (fih/nen) is a “theoretical” correction, but many so-called experimental determinations require theoretical corrections.
B.J. JACKSON: ICRU Report 18 recommended a low-scatter measurement cell for therapy sources (isotopic) to remove the effect o f the therapy unit
DISCUSSION
IAE A-SM-222/64 289
component from the manufacturers’ output specifications. With the demise o f the roentgen, what unit do you think will be recommended for defining source output as opposed to that o f the device?
H.O. WYCKOFF: The recommendation for this will be the subject o f the Fifth Meeting o f Section I, Measurement o f Photons and Electrons, o f the Consultative Committee on Standards for the Measurement o f Ionizing Radiations (CCEMRI), which I hope will make a recommendation on what quantity should be used by national standardizing laboratories.
A.O. FREGENE: Are you, as an ICRU representative, happy about the current theory behind thimble chamber dosimetry and the values recommended by ICRU for Cx and CE?
H.O. WYCKOFF: The value o f C\ is probably wrong for higher-energy photons (10—30 MeV) and CE may be all right, but this is tentative thinking following work by Nahum and Greening published in 1976. The matter is being considered in detail by an ICRU group.

IAEA-SM-222/6S
IMPLICATIONS OF DOSIMETRY INTERCOMPARISONS FOR STANDARDIZATION IN NEUTRON DOSIMETRY FOR BIOLOGICAL AND MEDICAL APPLICATIONS*
J.J. B R O ER SERadiobiological Institute TNO,Rijswijk,The Netherlands
G. B U R G E RInstitute for Radiation Protection,Gesellschaft für Strahlen- und Umweltforschung,Neuherberg, Munich,Federal Republic of Germany
M. COPPOLABiology, Radiation Protection and Medical Research,Commission of the European Communities,Brussels
Abstract
IM P L IC A T IO N S O F D O S IM E T R Y IN T E R C O M P A R IS O N S F O R S T A N D A R D IZ A T IO N
IN N E U T R O N D O S IM E T R Y F O R B IO L O G IC A L A N D M E D IC A L A P P L IC A T IO N S .
N eu tro n d o sim etry in tercom p arison s are o f great im p o rtan ce fo r adequ ate evalu ation and
com p arison o f b io lo g ica l and clin ical results o b tain ed at d iffe re n t research centres. Th e
variation s in the results o b tain ed b y p a rticip an ts in tw o in tern ation al n eutron d o sim etry in ter
com parison s (IN D I and E N D IP ) fo r n eu tro n and to ta l kerm a or absorbed dose are o f the order
o f 7% to 8%. Th ese variation s seem to be in a cco rd an ce w ith the re la tive ly large system atic
u n certain ties q u o te d , w h ich are a ttrib u ted to in su ffic ien t k n o w led ge o f basic p h ysica l para
m eters. In ord er to jle te rm in e the in flu en ce o f the use o f d ifferen t values fo r th e p h ysical
p aram eters such as W , kerm a ratio s and stop p in g p o w e r ratios, the responses o f p articip an ts’
dose m eters w ere also com p ared . T h e varian ces o f q u o te d kerm a and absorbed dose values
are o f the sam e ord er o f m agn itude as th ose o f in stru m en t responses. Th is resu lt im plies th at
there are large system atic d ifferen ces in m easurem ent p ro ced u res applied b y the d ifferen t
p articip an ts. A lth o u g h ad o p tio n o f u n ifo rm basic p aram eters is desirable, it seem s m ore
im p o rtan t to standardize the exp erim en tal tech n iq u es e m p lo yed fo r the d eterm in ation o f
absorbed d ose. W ithin the fram ew o rk o f a C E C sponsored program m e o f C E N D O S (co lle ctio n
and evalu ation o f n eutro n d o sim etry data) a stu d y o f possib le o p eration al errors is being
p erform ed fo r a n um ber o f p a rticip an ts w h o se results sh ow ed large d ifferen ces. T h e purpose
* T h e E N D IP and C E N D O S program m es are p artly supported b y the Co m m ission o f the
E u rop ean C o m m un ities u n der co n tra ct n um bers 1 1 3 -7 2 -1 B IO C and 2 29 -7 6 -10 B IO N .
291
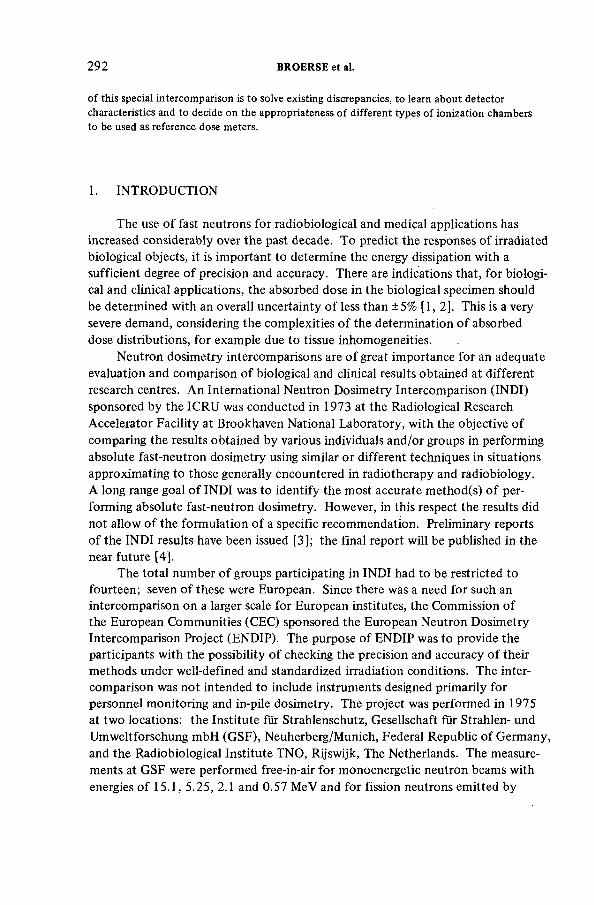
292 BROERSE et al.
o f this special in tercom p arison is to solve existin g discrepan cies, to learn a b o u t d etecto r
ch aracteristics and to d ec id e on the approp riaten ess o f d ifferen t typ es o f io n izatio n cham bers
to be used as re feren ce dose m eters.
1. IN T R O D U C T IO N
The use of fast neutrons for radiobiological and medical applications has increased considerably over the past decade. To predict the responses of irradiated biological objects, it is important to determine the energy dissipation with a sufficient degree of precision and accuracy. There are indications that, for biological and clinical applications, the absorbed dose in the biological specimen should be determined with an overall uncertainty of less than ±5% [1, 2]. This is a very severe demand, considering the complexities of the determination of absorbed dose distributions, for example due to tissue inhomogeneities.
Neutron dosimetry intercomparisons are of great importance for an adequate evaluation and comparison of biological and clinical results obtained at different research centres. An International Neutron Dosimetry Intercomparison (IN D I) sponsored by the IC R U was conducted in 1973 at the Radiological Research Accelerator Facility at Brookhaven National Laboratory, with the objective of comparing the results obtained by various individuals and/or groups in performing absolute fast-neutron dosimetry using similar or different techniques in situations approximating to those generally encountered in radiotherapy and radiobiology.A long range goal of IN D I was to identify the most accurate method(s) of performing absolute fast-neutron dosimetry. However, in this respect the results did not allow of the formulation of a specific recommendation. Preliminary reports of the IN D I results have been issued [3]; the final report will be published in the near future [4].
The total number of groups participating in IN D I had to be restricted to fourteen; seven of these were European. Since there was a need for such an intercomparison on a larger scale for European institutes, the Commission of the European Communities (CEC) sponsored the European Neutron Dosimetry Intercomparison Project (ENDIP). The purpose of EN D IP was to provide the participants with the possibility of checking the precision and accuracy of their methods under well-defined and standardized irradiation conditions. The intercomparison was not intended to include instruments designed primarily for personnel monitoring and in-pile dosimetry. The project was performed in 1975 at two locations: the Institute fur Strahlenschutz, Gesellschaft für Strahlen- und Umweltforschung mbH (GSF), Neuherberg/Munich, Federal Republic of Germany, and the Radiobiological Institute TNO, Rijswijk, The Netherlands. The measurements at G SF were performed free-in-air for monoenergetic neutron beams with energies of 15.1, 5.25, 2.1 and 0.57 MeV and for fission neutrons emitted by
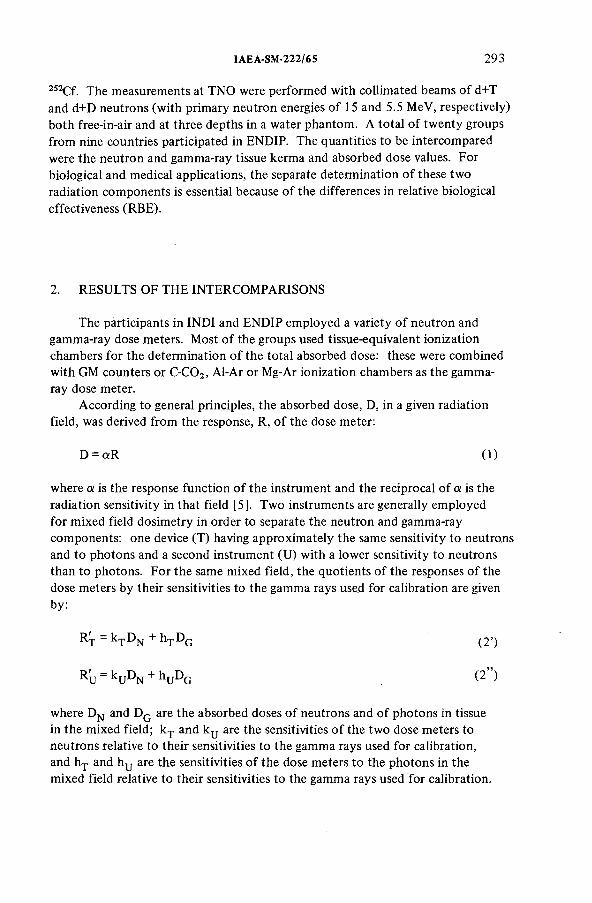
IAEA-SM-222/65 293
252Cf. The measurements at TNO were performed with collimated beams of d+T and d+D neutrons (with primary neutron energies of 15 and 5.5 MeV, respectively) both free-in-air and at three depths in a water phantom. A total of twenty groups from nine countries participated in ENDIP. The quantities to be intercompared were the neutron and gamma-ray tissue kerma and absorbed dose values. For biological and medical applications, the separate determination of these two radiation components is essential because of the differences in relative biological effectiveness (RBE).
2. R ESU LT S OF TH E IN T ER C O M PA R ISO N S
The participants in IN D I and E N D IP employed a variety of neutron and gamma-ray dose meters. Most of the groups used tissue-equivalent ionization chambers for the determination of the total absorbed dose: these were combined with G M counters or C-C02, Al-Ar or Mg-Ar ionization chambers as the gamma- ray dose meter.
According to general principles, the absorbed dose, D, in a given radiation field, was derived from the response, R, of the dose meter:
where a is the response function of the instrument and the reciprocal of a is the radiation sensitivity in that field [5]. Two instruments are generally employed for mixed field dosimetry in order to separate the neutron and gamma-ray components: one device (T) having approximately the same sensitivity to neutrons and to photons and a second instrument (U) with a lower sensitivity to neutrons than to photons. For the same mixed field, the quotients of the responses of the dose meters by their sensitivities to the gamma rays used for calibration are given
where D N and D G are the absorbed doses of neutrons and of photons in tissue in the mixed field; kT and ky are the sensitivities o f the two dose meters to neutrons relative to their sensitivities to the gamma rays used for calibration, and hT and hy are the sensitivities of the dose meters to the photons in the mixed field relative to their sensitivities to the gamma rays used for calibration.
D = a R ( 1)
by:
Rip = kTDN + hTDG (2 ’)
R U k U D N + h U D G
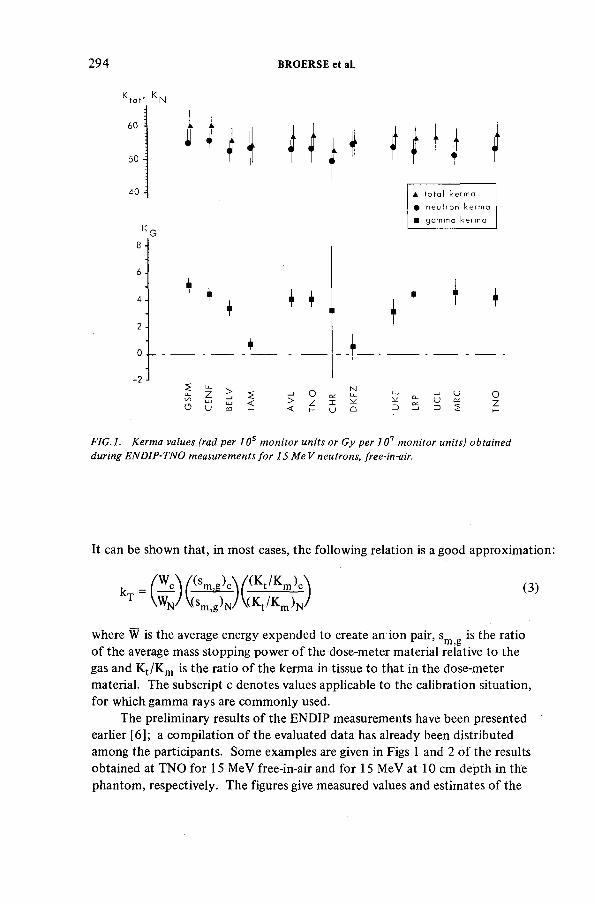
294 BROERSE et al.
К,оГ КГ
60
50
6
4
2
0
-2
U- Z
О и
+ +
><
▲ t o t a l k e r m a
щ n e u t r o n k e r m a
■ g a m m a k e r m a
i t
OZ Xi- и
ш _ j ( J^ £ UЭ 2 ID 5
Oz
FIG.l. Kerma values (rad per 10s monitor units or Gy per 101 monitor unitsj obtained
during ENDIP-TNO measurements for 15 Me V neutrons, free-in-air.
It can be shown that, in most cases, the following relation is a good approximation:
k № ) ( Ъ щаT 4A (sm)g)NA(Kt/Km)N
where W is the average energy expended to create an ion pair, sm is the ratio of the average mass stopping power of the dose-meter material relative to the gas and K t/K m is the ratio of the kerma in tissue to that in the dose-meter material. The subscript с denotes values applicable to the calibration situation, for which gamma rays are commonly used.
The preliminary results of the EN D IP measurements have been presented earlier [6]; a compilation of the evaluated data has already been distributed among the participants. Some examples are given in Figs 1 and 2 of the results obtained at TN O for 15 MeV free-in-air and for 15 MeV at 10 cm depth in the phantom, respectively. The figures give measured values and estimates of the
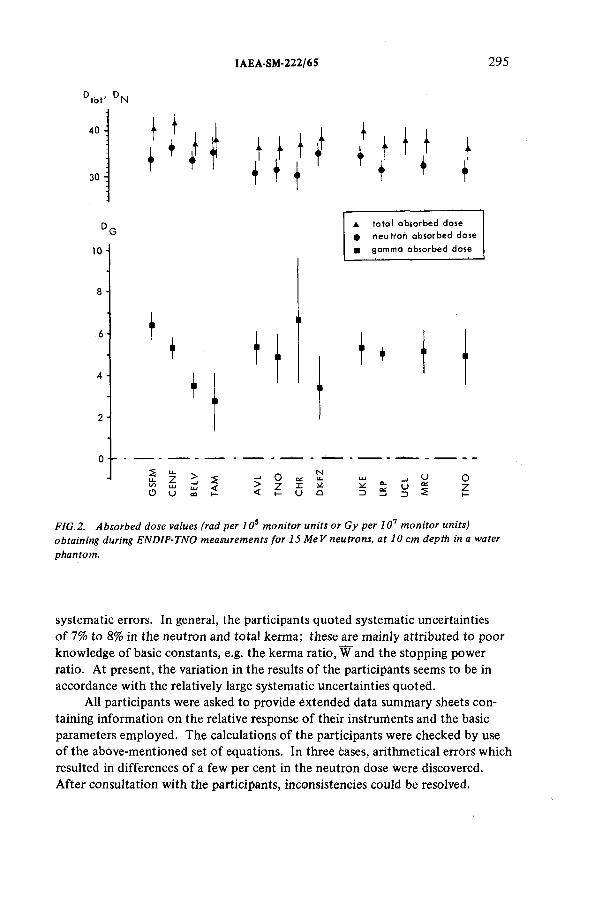
IAEA-SM-222/65 295
D to t ' d n
40
30
и/ I i l H I
10 ■
M
▲ to tal absorbed dose Ф neutron absorbed dose■ gamma absorbed dose
2litoО
Zшu
s<
оz v
QОO í
5Оz
FIG.2, Absorbed dose values (rad per 10s monitor units or Gy per 101 monitor units)
obtaining during ENDIP-TNO measurements for 15 MeV neutrons, at 10 cm depth in a water
phantom.
systematic errors. In general, the participants quoted systematic uncertainties of 7% to 8% in the neutron and total kerma; these are mainly attributed to poor knowledge of basic constants, e.g. the kerma ratio, W and the stopping power ratio. At present, the variation in the results o f the participants seems to be in accordance with the relatively large systematic uncertainties quoted.
All participants were asked to provide extended data summary sheets containing information on the relative response of their instruments and the basic parameters employed. The calculations of the participants were checked by use of the above-mentioned set of equations. In three èàses, arithmetical errors which resulted in differences of a few per cent in the neutron dose Were discovered. After consultation with the participants, inconsistencies could be resolved.
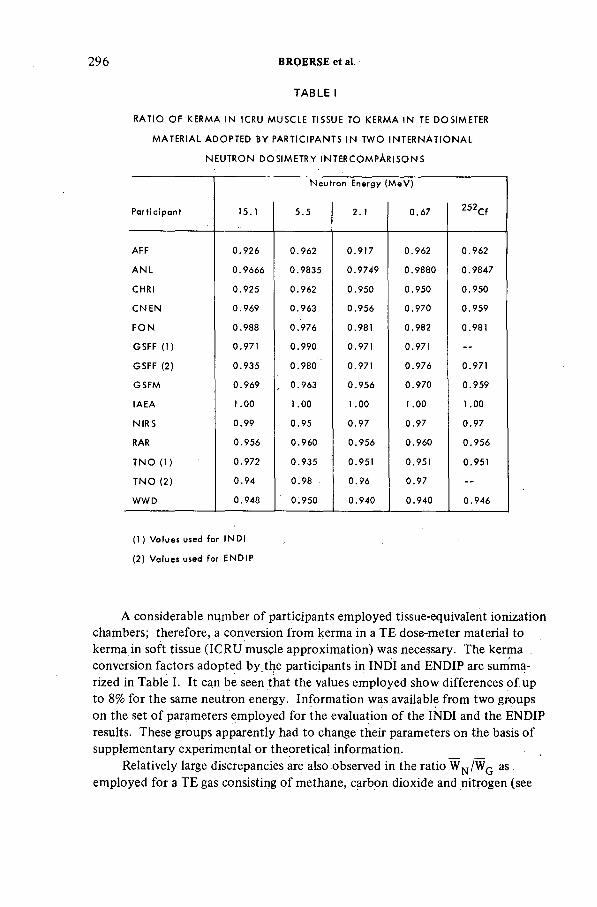
296 BROERSE et al.
TABLE I
RATIO OF KERMA IN ICRU MUSCLE TISSUE TO KERMA IN TE DOSIMETER
MATERIAL ADOPTED BY PARTICIPANTS IN TWO IN TERNATIONAL
NEUTRON DOSIMETRY IN TER COMPARISONS
Neutron Energy (MeV)
Part ic ipant 15.1 5 .5 2.1 0.67 252Cf
AFF 0.926 0.962 0.917 0.962 0.962
A N L 0.9666 0.9835 0.9749 0.9880 0.9847
CHRI 0.925 0.962 0.950 0.950 0.950
CNEN 0.969 0.963 0.956 0.970 0.959
FO N 0.988 0.976 0.981 0.982 0.981
GSFF (1) 0.971 0.990 0.971 0.971 -
GSFF (2) 0.935 0.980 ' 0.971 0.976 0.971
GSFM 0.969 , 0.963 0.956 0.970 0.959
IAEA 1 .00 1.00 1.00 1.00 1 .00
NIRS 0.99 0.95 0.97 0.97 0.97
RAR 0.956 0.960 0.956 0.960 0.956
T N O ( l ) 0.972 0.935 0.951 0.951 0.951
TN O (2) 0.94 0.98 0.96 0.97 —
WWD 0.948 0.950 0.940 0.940 0.946
(1 ) Values used for INDI
(2) Values used for ENDIP
A considerable number of participants employed tissue-equivalent ionization chambers; therefore, a conversion from kerma in a TE dose-meter material to kerma in soft tissue (IC R U muscle approximation) was necessary. The kerma conversion factors adopted by the participants in IN D I and EN D IP are summarized in Table I. It can be seen that the values employed show differences o f up to 8% for the same neutron energy- Information was available from two groups on the set of parameters employed for the evaluation of the IN D I and the EN D IP results. These groups apparently had to change their parameters on the basis of supplementary experimental or theoretical information.
Relatively large discrepancies are also observed in the ratio W N /WG as employed for a T E gas consisting of methane, carbon dioxide and nitrogen (see
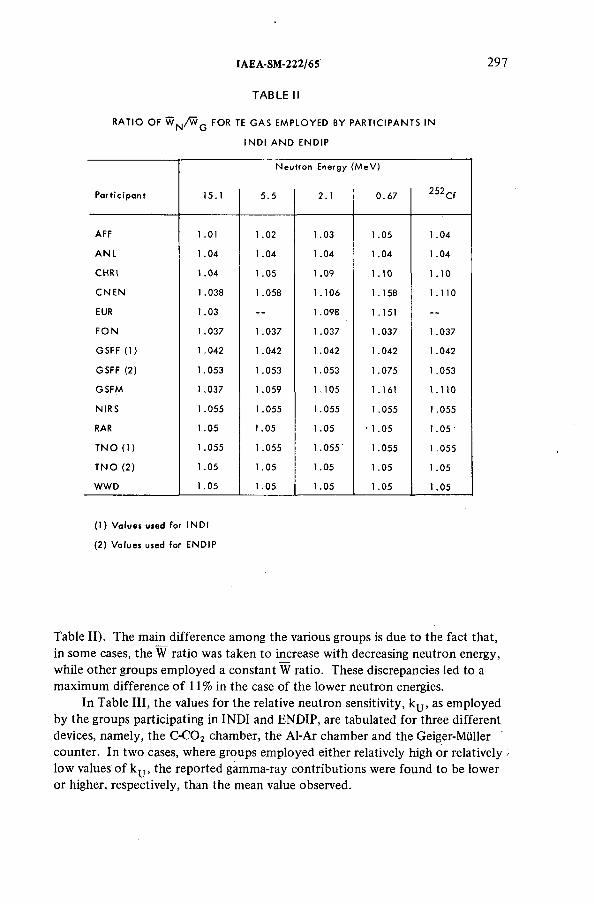
IAEA-SM-222/65 297
TABLE II
RATIO OF W N/ W G FOR TE GAS EMPLOYED BY PARTICIPANTS IN
IN D I A N D ENDIP
Neutron Energy (MeV)
Part ic ipant 15.1 5 .5 2.1 0 .67 252Cf
AFF 1 .01 1 .02 1.03 1 .05 1 .04
A N L 1 .04 1 .04 1 .04 1 .04 1 .04
CHRI 1 .04 1 .05 1 .09 1 .10 1.10
C NEN 1.038 1 .058 1 .106 1 .158 1.110
EUR 1.03 - - 1 .098 1 .151 - -
FO N 1 .037 1 .037 1 .037 1 .037 1 .037
GSFF (1) 1 .042 1 .042 1 .042 1 .042 1 .042
GSFF (2) 1 .053 1 .053 1.053 1 .075 1 .053
GSFM 1 .037 1 .059 1.105 1.161 1.110
NIRS 1 .055 1.055 1.055 1.055 1 .055
RAR 1 .05 1 .05 1 .05 • 1 .05 1.05
T N O (1) 1.055 1.055 1.055' 1 .055 1 .055
T N O (2) 1.05 1.05 1.05 1 .05 1.05
WWD 1 .05 1 .05 1.05 1 .05 1.05
(1) Values used for INDI
(2) Values used for ENDIP
Table II). The main difference among the various groups is due to the fact that, in some cases, the W ratio was taken to increase with decreasing neutron energy, while other groups employed a constant W ratio. These discrepancies led to a maximum difference of 11 % in the case of the lower neutron energies.
In Table III, the values for the relative neutron sensitivity, as employed by the groups participating in IN D I and ENDIP, are tabulated for three different devices, namely, the C -C02 chamber, the Al-Ar chamber and the Geiger-Müller counter. In two cases, where groups employed either relatively high or relatively : low values of k y , the reported gamma-ray contributions were found to be lower or higher, respectively, than the mean value observed.
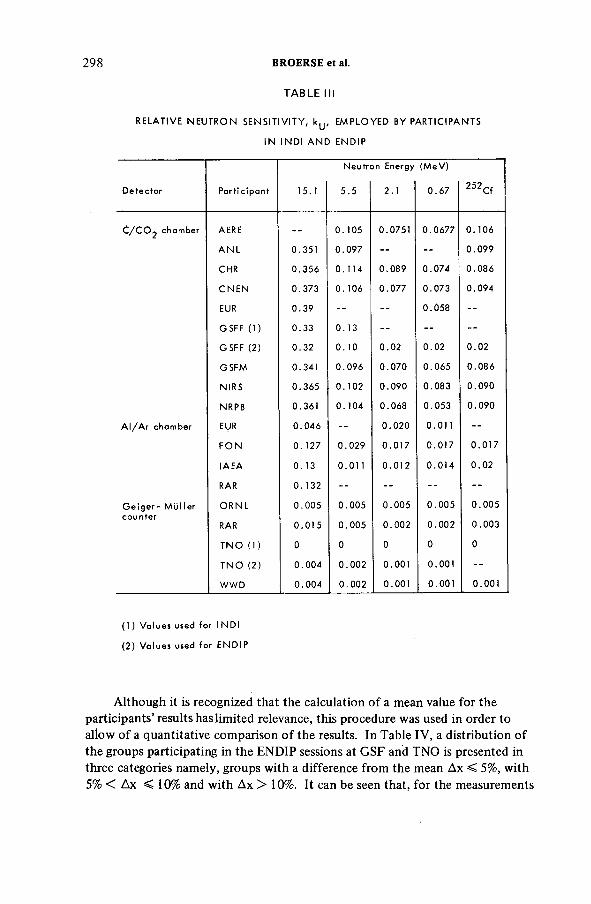
298 BROERSE et al.
TABLE III
RELATIVE NEUTRON SENSITIVITY, к у , EMPLOYED BY PARTICIPANTS
IN IN D I A N D ENDIP
Neutron Energy (MeV)
Detector Part ic ipant 15.1 5 .5 2.1 0 .67 252Cf
C / C O 2 chamber AERE - - 0. 105 0.0751 0.0677 0.106
A N L 0.351 0.097 — — 0.099
С HR 0.356 0.114 0.089 0.074 0 .086
C N EN 0.373 0.106 0.077 0.073 0.094
EUR 0.39 — — 0.058 —
GSFF (1) 0.33 0.13 — — —
GSFF (2) 0.32 0.10 0.02 0.02 0.02
GSFM 0.341 0 .096 0 .070 0 .065 0 .086
NIRS 0.365 0.102 0 .090 0.083 0.090
NRPB 0.361 0.104 0.068 0.053 0 .090
A l / A r chamber EUR 0 .046 — 0.020 0.011 —
F O N 0.127 0 .029 0 .017 0.017 0 .017
IAEA 0.13 0.011 0.012 0 .014 0.02
RAR 0.132 — — - - —
G e ig e r - M ü l le r ORNL 0.005 0.005 0 .005 0 .005 0 .0 05counter
RAR 0.015 0 .005 0.002 0 .002 0 .003
TN O (1 ) 0 0 0 0 0
T N O (2) 0 .004 0 .002 0.001 0.001 —
WWD 0.004 0 .002 0.001 0.001 0.001
(1 ) Values used for IN D I
(2) Values used for ENDIP
Although it is recognized that the calculation of a mean value for the participants’ results has limited relevance, this procedure was used in order to allow of a quantitative comparison o f the results. In Table IV, a distribution of the groups participating in the EN D IP sessions at G SF and TNO is presented in three categories namely, groups with a difference from the mean Дх < 5%, with 5% < Ax < 1 0 % and with Дх > 10%. It can be seen that, for the measurements
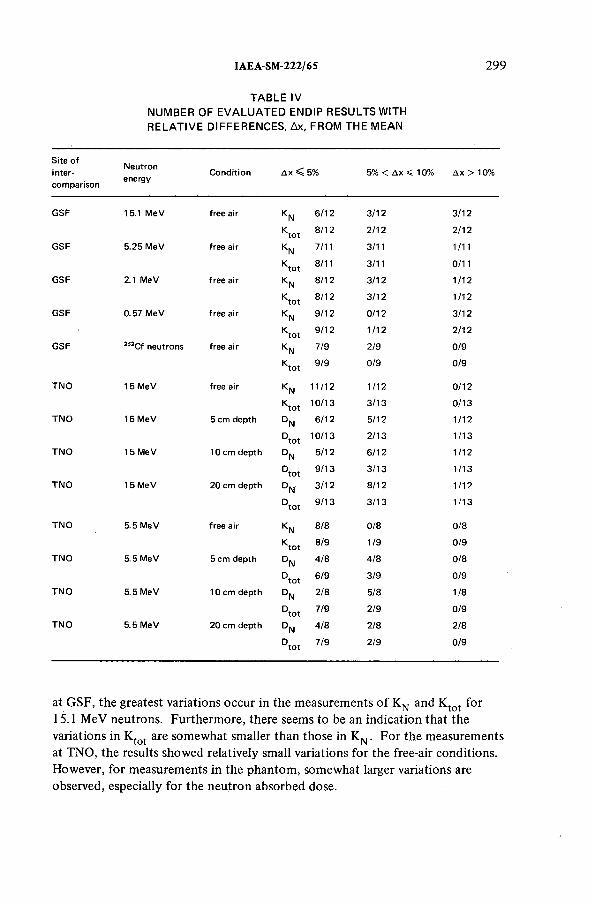
IAEA-SM-222/65 299
TABLE IVNUMBER OF EVALUATED ENDIP RESULTS WITH RELATIVE DIFFERENCES, Ax, FROM THE MEAN
Site of inter-comparison
Neutronenergy Condition Д х < 5% 5% < Дх « 10% Дх > 10%
GSF 15.1 MeV free air KN 6/12 3/12 3/12
Ktot 8/12 2/12 2/12
GSF 5.25 MeV free air KN 7/11 3/11 1/11
Kto t 8/11 3/11 0/11
GSF 2.1 MeV free air KN 8/12 3/12 1/12
K,o t 8/12 3/12 1/12
GSF 0.57 MeV free air KN 9/12 0/12 3/12
Kto« 9/12 1/12 2/12
GSF 252Cf neutrons free air K N 7/9 2/9 0/9
Kto , 9/9 0/9 0/9
TNO 15 MeV free air KN 11/12 1/12 0/12
Kto t 10/13 3/13 0/13
TNO 15 MeV 5 cm depth °N 6/12 5/12 1/12
Dto t 10/13 2/13 1/13
TNO 15 MeV 10 cm depth °N 5/12 6/12 1/12
Dto , 9/13 3/13 1/13
TNO 15 MeV 20 cm depth °N 3/12 8/12 1/12
Dto t 9/13 3/13 1/13
TNO 5.5 MeV free air KN 8/8 0/8 0/8
Kto t 8/9 1/9 0/9
TNO 5.5 MeV 5 cm depth °N 4/8 4/8 0/8
Dto t 6/9 3/9 0/9
TNO 5.5 MeV 10 cm depth °N 2/8 5/8 1/8
Dto t 7/9 2/9 0/9
TNO 5.5 MeV 20 cm depth °N 4/8 2/8 2/8
Dto t 7/9 2/9 0/9
at GSF, the greatest variations occur in the measurements of K N and K tot for 15.1 MeV neutrons. Furthermore, there seems to be an indication that the variations in K tQt are somewhat smaller than those in K N . For the measurements at TNO, the results showed relatively small variations for the free-air conditions. However, for measurements in the phantom, somewhat larger variations are observed, especially for the neutron absorbed dose.
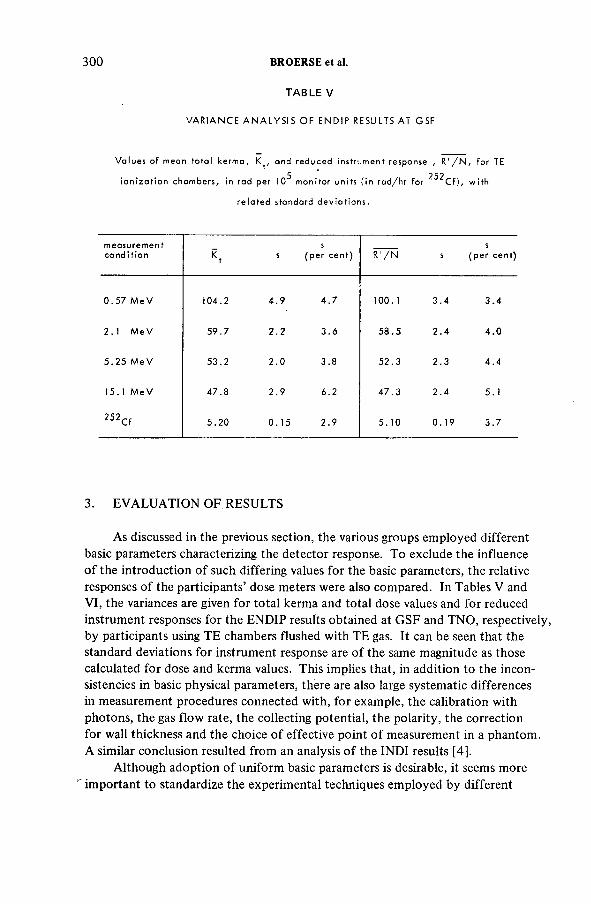
300
T A B L E V
VARIANCE A N A L Y S IS OF ENDIP RESULTS AT GSF
BROERSE et al.
Values of mean total kerma, K^, and reduced instrument response , R ' / N , for TE
5 252ion iza t ion chambers, in rad per 10 monitor units (in ra d /h r for C f) , w ith
re la ted standard devia t ions.
3. E V A L U A T IO N OF R ESU LT S
As discussed in the previous section, the various groups employed different basic parameters characterizing the detector response. To exclude the influence of the introduction of such differing values for the basic parameters, the relative responses of the participants’ dose meters were also compared. In Tables V and VI, the variances are given for total kerma and total dose values and for reduced instrument responses for the EN D IP results obtained at G SF and TNO, respectively, by participants using TE chambers flushed with TE gas. It can be seen that the standard deviations for instrument response are of the same magnitude as those calculated for dose and kerma values. This implies that, in addition to the inconsistencies in basic physical parameters, there are also large systematic differences in measurement procedures connected with, for example, the calibration with photons, the gas flow rate, the collecting potential, the polarity, the correction for wall thickness and the choice of effective point of measurement in a phantom.A similar conclusion resulted from an analysis o f the IN D I results [4].
Although adoption of uniform basic parameters is desirable, it seems more important to standardize the experimental techniques employed by different
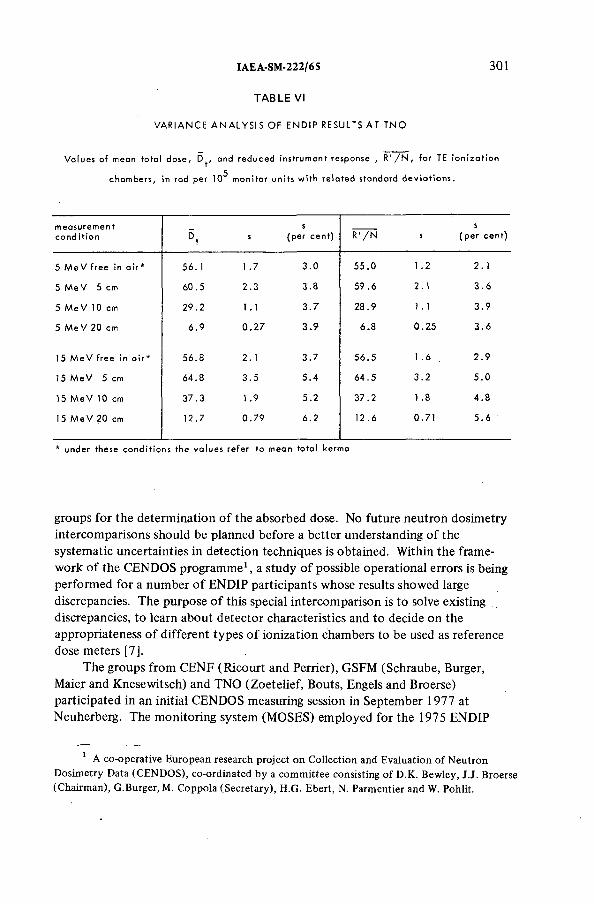
IAEA-SM-222/65
TABLE VI
V A R I A N C E A N A L Y S I S O F E N D I P RESULTS A T T N O
301
V a lu e s o f m e a n to ta l d o s e , D f , a n d r e d u c e d in s t ru m e n t re sp o n se , R ' / Ñ , fo r TE io n i z a t io n
c h a m b e r s , in rad p e r 1 0^ m o n ito r u n it s w it h r e la t e d s ta n d a rd d e v ia t io n s .
m e a su re m e n tc o n d it io n
5 ,s
s(p e r c e n t) s
s( p e r c e n t )R '/ N
5 M e V fre e in a i r * 5 6 . 1 1 .7 3 . 0 5 5 . 0 1 .2 2 .1
5 M e V 5 cm 6 0 . 5 2 . 3 3 . 8 5 9 . 6 2 .1 3 . 6
5 M e V 10 cm 2 9 . 2 t . l 3 . 7 2 8 . 9 1 .1 3 . 9
5 M e V 2 0 cm 6 . 9 0 . 2 7 3 . 9 6 . 8 0 . 2 5 3 . 6
15 M e V fre e in a i r * 5 6 . 8 2 .1 3 . 7 5 6 . 5 1 .6 2 . 9
Î 5 M e V 5 cm 6 4 . 8 3 . 5 5 . 4 6 4 . 5 3 . 2 5 . 0
15 M e V 10 cm 3 7 . 3 1 .9 5 . 2 3 7 . 2 1 .8 4 . 8
15 M e V 2 0 cm 1 2 . 7 0 . 7 9 6 . 2 1 2 . 6 0 . 7 1 5 . 6
* u n d e r the se c o n d it io n s the v a lu e s re fe r to m e a n to ta l ke rm a
groups for the determination of the absorbed dose. No future neutron dosimetry intercomparisons should be planned before a better understanding of the systematic uncertainties in detection techniques is obtained. Within the framework of the C EN D O S programme1, a study of possible operational errors is being performed for a number of EN D IP participants whose results showed large discrepancies. The purpose of this special intercomparison is to solve existing discrepancies, to learn about detector characteristics and to decide on the appropriateness of different types o f ionization chambers to be used as reference dose meters [7].
The groups from CEN F (Ricourt and Perrier), G SFM (Schraube, Burger, Maier and Knesewitsch) and TNO (Zoetelief, Bouts, Engels and Broerse) participated in an initial CEN DO S measuring session in September 1977 at Neuherberg. The monitoring system (M OSES) employed for the 1975 EN D IP
1 A co-op erative E u rop ean research p ro ject on C o lle ctio n and E va lu atio n o f N eutro n
D o sim etry D ata (C E N D O S ), co-ord in ated b y a co m m itte e con sistin g o f D .K . B e w le y , J.J. B roerse
(C h airm an ), G .B u rg er, M. C o p p o la (S e cre tary ), H .G . E b ert, N. P arm entier and W. Pohlit.
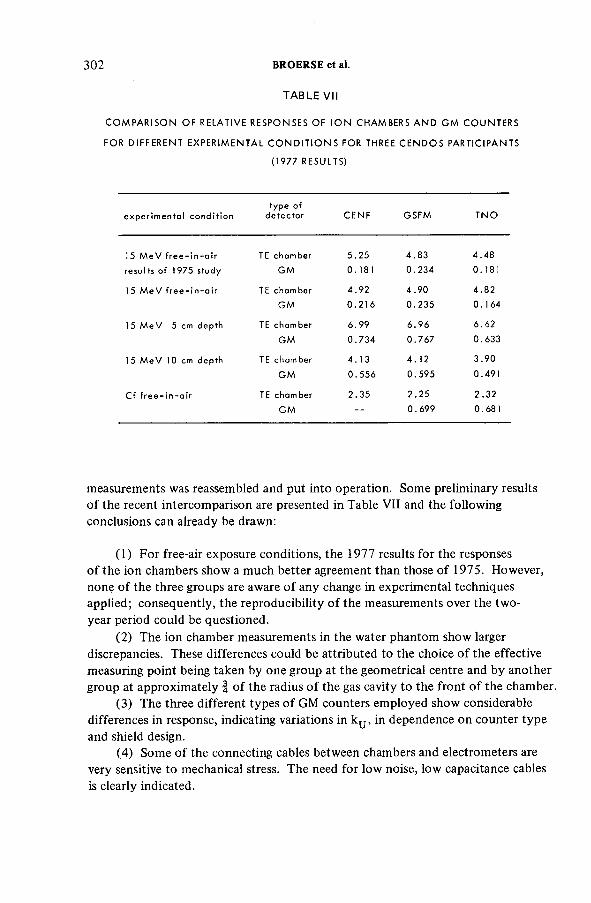
302 BROERSE et al.
T A B L E V I I
COM PARISO N OF RELATIVE RESPONSES OF IO N CHAMBERS A N D GM COUNTERS
FOR DIFFERENT EXPERIMENTAL C O N D IT IO N S FOR THREE CENDOS PARTICIPANTS
(1977 RESULTS)
experimenta l conditiontype of
detector CENF GSFM TN O
15 M e V f re e - in - a i r TE chamber 5 .25 4 .8 3 4.48
results of 1975 study GM 0.181 0 .234 0.181
15 M e V f r e e - in - a i r TE chamber 4 .92 4.90 4.82GM 0 .2 16 0 .235 0 .164
1 5 M e V 5 cm depth TE chamber 6 .99 6.96 6.62
GM 0.734 0 .767 0.633
15 M e V 10 cm depth TE chamber 4 .13 4 .12 3.90
GM 0 .556 0 .595 0.491
Cf f re e - in - a i r TE chamber 2 .35 2.25 2.32
GM - - 0 .699 0.681
measurements was reassembled and put into operation. Some preliminary results of the recent intercomparison are presented in Table V II and the following conclusions can already be drawn:
(1) For free-air exposure conditions, the 1977 results for the responsesof the ion chambers show a much better agreement than those of 1975. However, none of the three groups are aware of any change in experimental techniques applied; consequently, the reproducibility of the measurements over the two- year period could be questioned.
(2) The ion chamber measurements in the water phantom show larger discrepancies. These differences could be attributed to the choice of the effective measuring point being taken by one group at the geometrical centre and by another group at approximately | of the radius of the gas cavity to the front of the chamber.
(3) The three different types of G M counters employed show considerable differences in response, indicating variations in k^, in dependence on counter type and shield design.
(4) Some of the connecting cables between chambers and electrometers are very sensitive to mechanical stress. The need for low noise, low capacitance cables is clearly indicated.
IAEA-SM-222/6S 303
(5) X-ray radiographs of the ionization chambers employed in this intercomparison showed deficiencies in the construction of some chambers, e.g. inadequate positioning of central electrode and imperfections in the connections of the guard electrode.
The C EN D O S measurements will be continued in the near future. The preliminary results once again emphasize the need for uniform procedures and techniques for measuring chamber response and for applying the appropriate corrections. The introduction of a carefully studied secondary standard or a transfer dose meter would be of great importance for the consistency of neutron dosimetry for biological and medical applications [8].
A C K N O W LED G EM EN T S
The authors are very grateful for the effective co-operation of Drs H. Schraube and J. Zoetelief in the evaluation of the EN D IP measurements. The assistance of all E N D IP participants in providing detailed information on their results is gratefully acknowledged.
R E F E R E N C E S
[ 1 ] B R O E R S E , J.J ., Proc. N B S S ym p . N eutro n Standards and A p p lica tio n s , N B S, W ashington,
D C ( 1 9 7 7 , in press).
[2] IN T E R N A T IO N A L C O M M IS S IO N O N R A D IA T IO N U N IT S A N D M E A S U R E M E N T S ,
D eterm in atio n o f A b so rbed D ose in a Patient Irradiated b y Beam s o f X o r G am m a R ays
in R ad io th era p y P rocedures, IC R U R ep o rt 24, IC R U , W ashington, D C (1 9 7 6 ) .
[3] G O O D M A N , L.J., C O L V E T T , R .D ., C A S W E L L , R .S ., Proc. 2nd S ym p . N eu tro n
D o sim etry in B io lo g y and M edicine, C E C , L u x em b o u rg , R ep. E U R -5 2 7 3 ( 1 9 7 5 ) 6 27 .
[4] IN T E R N A T IO N A L C O M M IS S IO N O N R A D IA T IO N U N IT S A N D M E A S U R E M E N T S ,
A n In tern atio n al N eutro n D o sim etry In terco m p arison , IC R U , W ashington, D C ( 1 9 7 7 ,
in press).
[5] I N T E R N A T IO N A L C O M M IS S IO N O N R A D IA T IO N U N IT S A N D M E A S U R E M E N T S ,
N eutron D o sim etry fo r B io lo g y and M edicine, IC R U R e p o rt 26, IC R U , W ashington, D C
(1 9 7 6 ) .
[6] B R O E R S E , J.J ., B U R G E R , G ., C O P P O L A , М., Proc. W orkshop B asic P h ysica l D ata fo r
N eu tro n D o sim etry , C E C , L u x em b o u rg , R ep. E U R -562 9 ( 1 9 7 6 ) 2 5 7 .
[7 ] B R O E R S E , J.J., Proc. 3rd S ym p . N eutro n D o sim etry in B io lo g y and M edicine,
C E C , L u x em b o u rg ( 1 9 7 7 , in press).
[8] B R O E R S E , J .J ., M IJN H E E R , B .J., Proc. W orkshop B asic P h ysica l D ata fo r N eutro n
D o sim etry , C E C , L u x em b o u rg , Rep. E U R -5 6 2 9 ( 1 9 7 6 ) 2 75 .
D ISC U SS IO N
H. L IESEM : Why were two different sets o f parameters sometimes employed for the intercomparison?
304 BROERSE et al.
J.J. BRO ERSE: Information was available from two groups about the parameters applied for the evaluation of the IN D I and EN D IP results. Apparently these groups changed their basic parameters in the light of supplementary experimental or theoretical information.
Y. N ISH IW A K I: I was very much interested in your paper and have a couple of questions concerning WN . In neutron irradiation a number of species of heavy ions may be created. In obtaining the average neutron energy expended to create an ion pair, how many species, or what species, of ions did you take into consideration? Responses of low-energy heavy ions can vary considerably. To what extent are the low-energy heavy ions taken into account in estimating the average value WN ?
J.J. BRO ERSE: The average W-ratio for neutrons, WN , was generally based on an integration of W-values for the complete spectrum of secondaries, including protons, a-particles and heavier recoils. The experimental data on W obtained by different groups show relatively large variations, especially for the lower energies. There is an urgent need for more experimental results on W as a function of particle energy. Until additional data become available it seems most appropriate to follow the recommendation in IC R U Report 26 (Ref. [5] of the paper), namely to use a ratio of 1.05 for WN /WG for neutrons in the energy range 0.1 to 20 MeV.
IAEA-SM-222/70
THE NEED FOR REPEATED INTERCOMPARISONS AND STANDARDIZATION OF X-RAY DOSIMETRY FOR THE CO-ORDINATION OF LATE-EFFECTS RESEARCH IN EUROPE*
J. ZO ETEL IEF , J.J. B R O ER SE Radiobiological Institute TNO,Rijswijk
K.J. PU ITEAssociation Euratom-ITAL,Wageningen,The Netherlands
Abstract
T H E N E E D F O R R E P E A T E D IN T E R C O M P A R IS O N S A N D S T A N D A R D IZ A T IO N O F
X -R A Y D O S IM E T R Y F O R T H E C O -O R D IN A T IO N O F L A T E -E F F E C T S R E S E A R C H
IN E U R O P E .
In 1 9 7 1 , 19 7 3 and 19 7 6 , in tercom p arison s o f absorbed dose and dose d istrib u tion o v e r a
m ouse p h an to m fo r X -rays w ere p erform ed as part o f the program m e o f the E u rop ean Late-
E ffe c ts P ro ject G roup (E U L E P ). S ix teen in stitu tes from eight cou n tries p articip ated in the
sessions o f th e third in tercom p arison . In general, progress has been m ade w ith regard to
a ccu racy and precision o f th e X -ray d o sim etry; in tw o cases, d iscrepancies cou ld be resolved
a fter a dd itio n al m easurem ents. W ith regard to the dose d istrib u tio n over a m ouse p h an to m , the
results are n o t sa tis fa cto ry ; fo u r o u t o f fifte e n p articip an ts are still un able to p erform u n iform
irradiations. It is c learly show n th at it is necessary to u n dertake repeated in tercom p arison s
to allow m ean in gfu l com p arison s o f b io lo g ica l results ob tain ed in a co-op erative research
program m e to b e m ade.
1. IN T R O D U C T IO N
Studies on late somatic effects of ionizing radiation in mammalian organisms are of great importance for assessing the risks of low-level radiation exposure. Since this type of research requires large-scale experiments and long-term commitments of personnel and facilities, a joint project was initiated by a group of institutes co-operating within the European Late-Effects Project Group (EULEP).
* This p ro ject was carried o u t as part o f the program m e o f the E uropean L a te -E ffe cts
P roject G roup (E U L E P ) and w as p a rtly su p p o rted b y the C E C (E u rato m ), Brussels, u n der
co n tra ct N o. 2 0 7 -7 6 -1-В Ю С .
305
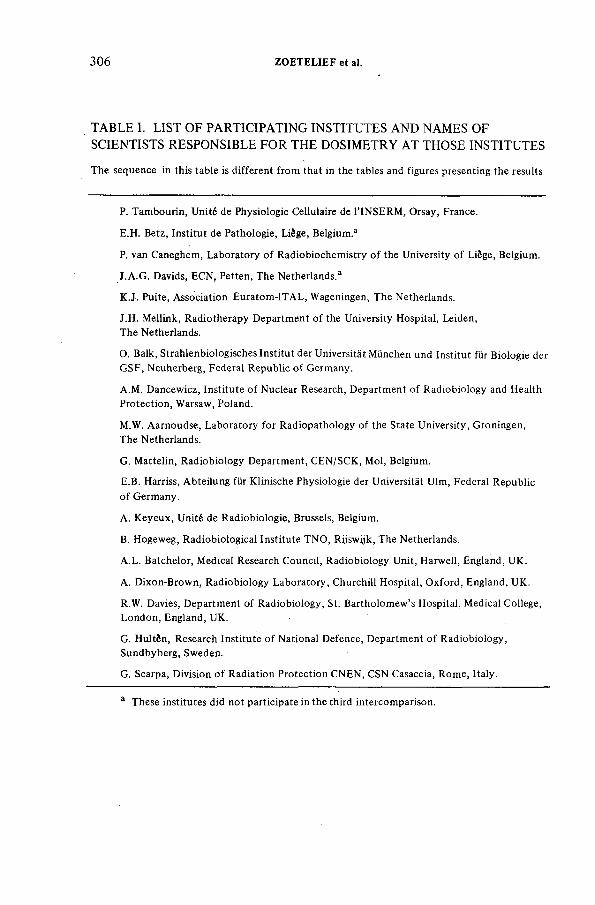
306 ZOETELIEF et al.
T A B L E I. L IST OF P A R T IC IP A T IN G IN ST IT U T ES A N D N A M ES OF SC IEN T ISTS R ESPO N S IB LE FO R TH E D O S IM E T R Y AT THOSE IN ST ITU TES
T h e sequ en ce in this tab le is d ifferen t fro m th at in the tab les and figures p resenting the results
P. T am b o u rin , U nité de P h ysio lo gie C ellulaire de l ’ IN S E R M , O rsay, France.
E.H . B e tz, Institu t de P ath ologie , Liège, B elgium .3
P. van Caneghem , L a b o ra to ry o f R ad io b io ch em istry o f the U niversity o f Liège, B elgium .
J .A .G . Davids, E C N , P etten , Th e N eth erlan ds.3
K .J. Puite, A sso cia tio n E u rato m -IT A L , W ageningen, T h e N etherlands.
J.H . M ellink, R ad io th era p y D ep artm en t o f the U n iversity H ospital, Leiden,
T h e N etherlands.
O. B alk, S trahlen b io log isch es In stitu t der U niversitát M ünchen un d Institu t für B io lo g ie der
G S F , N euherberg, F ederal R ep u b lic o f G erm an y.
A .M . D an cew icz, In stitu te o f N uclear R esearch, D ep artm en t o f R a d io b io lo g y and H ealth
P ro tectio n , W arsaw, Poland.
M.W. A arn o u d se, L a b o ra to ry fo r R a d io p ath o lo g y o f the S tate U n iversity , G ronin gen ,
T h e N etherlands.
G. M attelin , R a d io b io lo g y D epartm en t, C E N /S C K , M ol, B elgium .
E .B . Harriss, A b te ilu n g für K lin ische P h ysio lo gie der U niversitát U lm , F ederal R ep u b lic
o f G erm an y.
A . K e y e u x , U nité de R ad io b io lo g ie , Brussels, Belgium .
B. H ogew eg, R a d io b io lo g ica l In stitu te T N O , R ijsw ijk , T h e N etherlands.
A .L . B atch elo r, M edical R esearch C o u n cil, R a d io b io lo g y U n it, H arw ell, E ngland, U K .
A . D ixo n -B ro w n , R a d io b io lo g y L a b o ra to ry , C h u rch ill H ospital, O x fo rd , E ngland, U K .
R.W . Davies, D ep artm en t o f R a d io b io lo g y , St. B a rth o lo m ew ’ s H ospital, M edical C o llege,
L o n d o n , E ngland , U K .
G . H u ltên, R esearch In stitu te o f N ation al D efen ce, D epartm en t o f R a d io b io lo g y ,
S u n d b yb erg , Sw eden .
G . S carpa, D ivision o f R ad iatio n P ro te ctio n C N E N , C S N C asaccia, R om e, Ita ly .
3 T h ese in stitu tes did n o t p articip ate in th e third in tercom p arison .
IAEA-SM-222/70 307
A prerequisite for co-ordination of research programmes is the standardization of experimental methods and materials, for example the dosimetry, pathology and the quality of experimental animals.
The first EU LEP X-ray dosimetry intercomparison project, performed in 1970 and 1971 [1], indicated several discrepancies concerning the absolute dosimetry and the exposure conditions employed at the participating institutes. The results of this project were evaluated and a protocol for EU LEP X-ray dosimetry, including a code of practice, was prepared [2]. The second series of intercomparisons of absorbed dose and dose distribution was carried out in 1973 [3]; it was performed to check on the improvements made after the first intercomparison. In this project, special emphasis was placed on irradiation of the mouse phantoms in the cages actually in use for the mouse irradiations at the participating institutes. During the period of September 1976 to February 1977, sixteen groups from eight countries (listed in Table I) participated in the three consecutive sessions of the third X-ray dosimetry intercomparison. This third intercomparison was considered to be essential for a periodical check on the X-ray dosimetry procedures and for the benefit of the new groups joining EU LEP in the intervening years. In accordance with previous procedures, the intercomparison was performed by using mailed thermoluminescent dose meters (TLDs).
In this communication, the results of the third intercomparison study are discussed with reference to those of the previous measurement series. Some improvements have been made; however, for some participants the variations in absolute X-ray dosimetry and in dose distribution over the mouse phantom are still considered to be unsatisfactory. The need for repeated X-ray dosimetry intercomparisons seems to be indicated.
2. M A T E R IA L S A N D M ETH O DS
All participants received an acrylic plastic mouse phantom containing three LiF-filled test capsules, together with an irradiated control capsule, for each session. The phantom was to be placed in the central part of the mouse cage used for routine animal exposures, in accordance with the arrangement shown in Fig.l. Additional phantoms equal to the number of mice irradiated simultaneously or an equivalent amount of side scattering material were to surround the test phantom. The participants were asked to perform the irradiations in such a way that the test capsule at the central position of the mouse phantom would receive an absorbed dose of 200 rad in soft tissue and the irradiation could be considered as uniform (a ratio of less than 1.15 between maximum and minimum absorbed
dose, according to the IC R U recommendations [4]). An H V L of at least 1.5 mm Cu was recommended. The irradiated control capsules were added to investigate possible influences of postal transport.
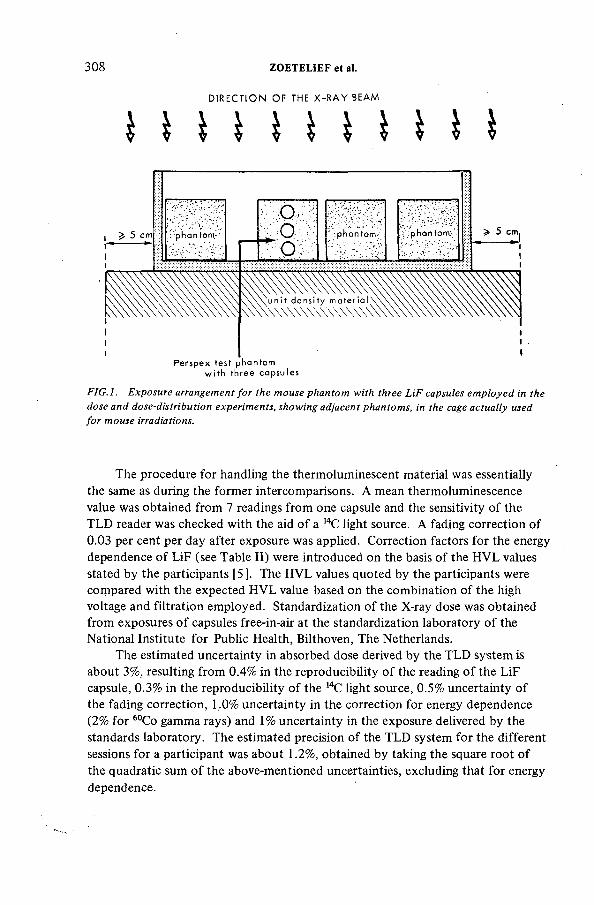
D IRECTION OF THE X -R A Y BEAM
IIIHIIIIH
308 ZOETELIEF et al.
FIG.l. Exposure arrangement for the mouse phantom with three LiF capsules employed in the
dose and dose-distribution experiments, showing adjacent phantoms, in the cage actually used
for mouse irradiations.
The procedure for handling the thermoluminescent material was essentially the same as during the former intercomparisons. A mean thermoluminescence value was obtained from 7 readings from one capsule and the sensitivity of the T LD reader was checked with the aid of a 14C light source. A fading correction of0.03 per cent per day after exposure was applied. Correction factors for the energy dependence of LiF (see Table II) were introduced on the basis of the H V L values stated by the participants [5]. The H V L values quoted by the participants were compared with the expected H V L value based on the combination of the high voltage and filtration employed. Standardization of the X-ray dose was obtained from exposures of capsules free-in-air at the standardization laboratory of the National Institute for Public Health, Bilthoven, The Netherlands.
The estimated uncertainty in absorbed dose derived by the T LD system is about 3%, resulting from 0.4% in the reproducibility of the reading of the LiF capsule, 0.3% in the reproducibility of the 14C light source, 0.5% uncertainty of the fading correction, 1.0% uncertainty in the correction for energy dependence (2% for 60Co gamma rays) and 1 % uncertainty in the exposure delivered by the standards laboratory. The estimated precision of the T LD system for the different sessions for a participant was about 1.2%, obtained by taking the square root of the quadratic sum of the above-mentioned uncertainties, excluding that for energy dependence.
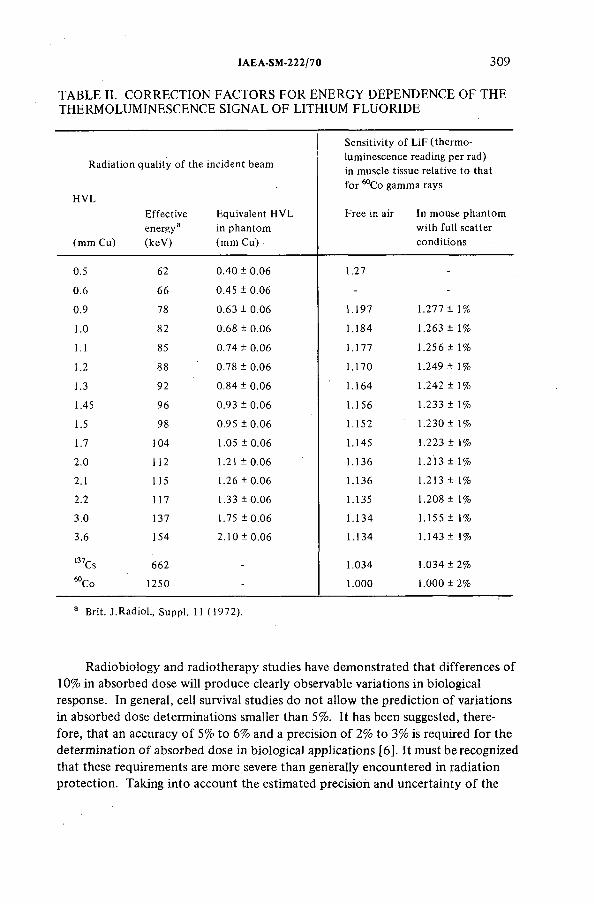
IAEA-SM-222/70 309
T A B LE II. C O R R EC T IO N FA CTO RS FO R E N E R G Y D EPEN D EN C E OF TH E T H E R M O LU M IN ESC E N C E S IG N A L OF L IT H IU M F L U O R ID E
R ad iatio n q u a lity o f the in cid en t beam
H V L
E ffe c tiv e E quivalent H V L
en ergy3 in p h an tom
(m m C u ) (k e V ) (m m C u )
Sen sitiv ity o f L iF (therm o-
lu m inescen ce reading p er rad)
in m uscle tissue relative to th at
fo r “ C o gam m a rays
F ree in air In m ouse p h an to m
w ith fu ll scatter
co n d itio n s
0.5 62 0.40 ± 0.06 1.2 7 -
0.6 66 0.45 ± 0.06 - -
0.9 78 0 .63 ± 0.06 1 .1 9 7 1 .2 7 7 ± 1%
1.0 82 0.68 ± 0.06 1 .1 8 4 1.263 ± 1%
1.1 85 0 .74 ± 0.06 1 .1 7 7 1.2 5 6 ± 1%
1.2 88 0.78 ± 0.06 1 .1 7 0 1.249 ± 1%
1.3 92 0.84 ± 0.06 1 .1 6 4 1.242 ± 1%
1.45 96 0.93 ± 0.06 1 .1 5 6 1.2 3 3 ± 1%
1.5 98 0.95 ± 0.06 1 .1 5 2 1.2 30 ± 1%
1.7 104 1.05 ± 0.06 1 .14 5 1.2 2 3 ± 1%
2.0 112 1.2 1 ± 0 .0 6 1 .1 3 6 1 .2 1 3 ± 1%
2.1 115 1.26 ± 0.06 1 .1 3 6 1 .2 1 3 ± 1%
2.2 1 1 7 1.33 ± 0.06 1.13 5 1.208 ± 1%
3.0 13 7 1.75 ± 0.06 1 .1 3 4 1 .1 5 5 ± 1%
3.6 154 2 .1 0 ± 0.06 1 .1 3 4 1 .1 4 3 ± 1%
137Cs 662 - 1.034 1.0 34 ± 2%
“ C o 1250 - 1.000 1.000 ± 2 %
a B rit. J .R ad io l., Suppl. 11 (1 9 7 2 ) .
Radiobiology and radiotherapy studies have demonstrated that differences of 10% in absorbed dose will produce clearly observable variations in biological response. In general, cell survival studies do not allow the prediction of variations in absorbed dose determinations smaller than 5%. It has been suggested, therefore, that an accuracy of 5% to 6% and a precision of 2% to 3% is required for the determination of absorbed dose in biological applications [6]. It must be recognized that these requirements are more severe than generally encountered in radiation protection. Taking into account the estimated precision and uncertainty of the
310 ZOETELIEF et al.
T LD system, the following recommendations were formulated (for example, see
Ref.[3]):
(a) The accuracy of the dosimetry is considered to be satisfactory when the mean value of the results from a laboratory differs by less than 5% from the standard value.
(b) When a difference between 5% and 10% from the standard value exists, a small discrepancy in the dosimetry is indicated.
(c) If the difference is more than 10%, a recalibration of the X-ray dosimetry system is recommended.
(d) A standard deviation in the relative absorbed dose values below 3% indicates a correct precision.
(e) When the relative standard deviation is between 3% and 5%, some doubts arise about the precision.
(f) If the relative standard deviation is more than 5%, attention must be paid to the reproducibility of the irradiations.
The spread in effective energy for different positions in the mouse phantom is small. The dose distribution may therefore be derived directly from the thermoluminescence response of the LiF dose meters at the entrance, central and exit position in the phantom. A uniform irradiation [4] is obtained when there is a ratio of less than 1.15 between maximum and minimum absorbed dose. When a difference in thermoluminescence reading of entrance and exit capsule relative to the thermoluminescence reading of the central capsule was found to be below 14%, the dose distribution over the mouse phantom was considered to be acceptable according to these recommendations.
3. RESU LT S A N D D ISC U SS IO N
The LiF data from the sixteen participating institutes have been compared with those obtained from the standards laboratory. The results obtained for the relative absorbed dose (derived from the readings of the central capsules) of the three consecutive sessions of the third EU LEP X-ray dosimetry intercomparison are given in Fig.2.
With respect to the accuracy of the relative absorbed dose for the participants in the third intercomparison, it can be concluded that the values of 15 out of 16 institutes are satisfactory and that a small discrepancy is indicated for only one institute. The precision of the dosimetry of 9 out of 16 participants was found to be correct; for 6 out of 16 institutes, the results gave reason for doubts and one participant had to pay attention to the reproducibility. The dose distributions of 11 out of 15 participants could be considered as uniform.
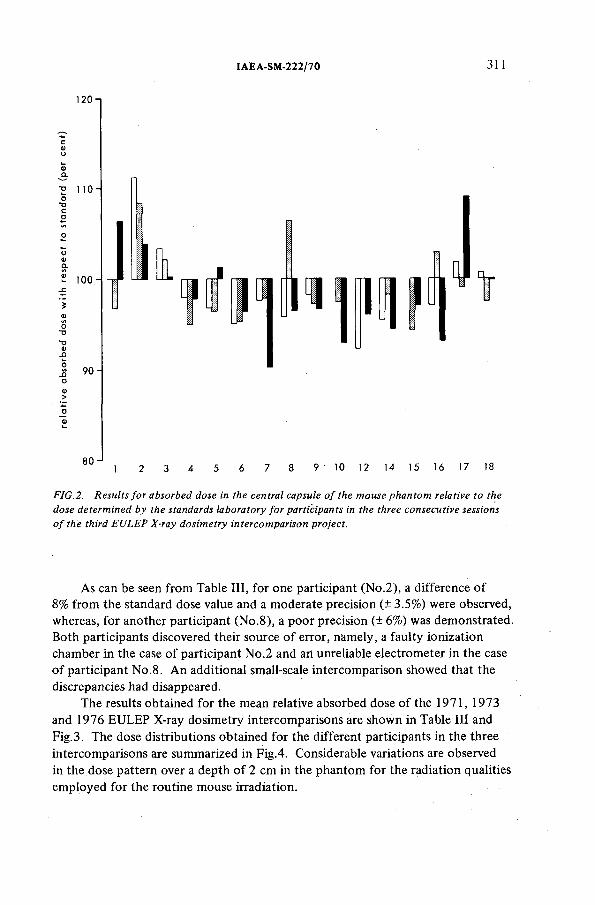
IAEA-SM-222/70 311
120 ■
■D 1 )0 -
100 -
s¡о
90
1 10 12 14 15 16 17 IE
FIG.2. Results for absorbed dose in the central capsule of the mouse phantom relative to the
dose determined by the standards laboratory for participants in the three consecutive sessions
of the third EULEP X-ray dosimetry intercomparison project.
As can be seen from Table III, for one participant (No.2), a difference of 8% from the standard dose value and a moderate precision (± 3.5%) were observed, whereas, for another participant (No.8), a poor precision (± 6%) was demonstrated. Both participants discovered their source of error, namely, a faulty ionization chamber in the case of participant No.2 and an unreliable electrometer in the case of participant No.8. An additional small-scale intercomparison showed that the discrepancies had disappeared.
The results obtained for the mean relative absorbed dose of the 1971, 1973 and 1976 EU LEP X-ray dosimetry intercomparisons are shown in Table I I I and Fig.3. The dose distributions obtained for the different participants in the three intercomparisons are summarized in Fig.4. Considerable variations are observed in the dose pattern over a depth of 2 cm in the phantom for the radiation qualities employed for the routine mouse irradiation.
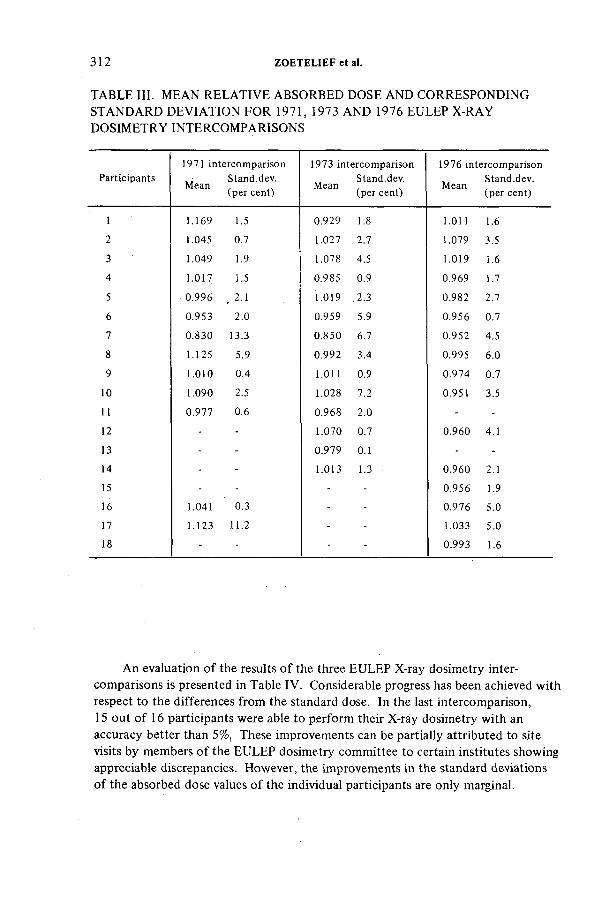
312 ZOETELIEF et al.
T A B LE III. M EA N R E L A T IV E A B SO R B E D DO SE A N D C O R R ESP O N D IN G ST A N D A R D D E V IA T IO N FO R 1971, 1973 A N D 1976 EULEP X -R A Y D O S IM E T R Y IN T ER C O M PA R ISO N S
P articipants
19 7 1 in tercom p arison
Stand.dev. M ean , .
(.per cent)
19 7 3 in tercom p arison
Stand.dev.M ean
(per cent)
19 7 6 in tercom p arison
Stan d.dev.M ean
(per cent)
1 1 .16 9 1.5 0.929 1.8 1 .0 11 1.6
2 1.045 0.7 1.0 27 2.7 1.079 3.5
3 1.049 1.9 1.078 4.5 1.0 19 1.6
4 1 .0 1 7 1.5 0.985 0.9 0.969 1.7
5 0.996 . 2 .1 1.0 19 .2 .3 0.982 2.7
6 0.953 2.0 0.959 5.9 0.956 0.7
7 0.830 13.3 0.850 6.7 0.952 4.5
8 1 .12 5 5.9 0.992 3.4 0.995 6.0
9 1.0 10 0.4 1 .0 11 0.9 0 .97 4 0.7
10 1.090 2.5 1.028 7.2 0 .951 3.5
11 0 .977 0.6 0.968 2.0 - -
12 - - 1.0 70 0.7 0.960 4.1
13 - - 0 .979 0.1 - -
14 - - 1 .0 13 1.3 0.960 2.1
15 - - - - 0 .956 1.9
16 1.0 41 0.3 - - 0 .976 5.0
17 1 .1 2 3 11 .2 - - 1.033 5.0
18 - - - - 0 .993 1.6
An evaluation of the results of the three EU LEP X-ray dosimetry intercomparisons is presented in Table IV. Considerable progress has been achieved with respect to the differences from the standard dose. In the last intercomparison,15 out of 16 participants were able to perform their X-ray dosimetry with an accuracy better than 5%, These improvements can be partially attributed to site visits by members of the EU LEP dosimetry committee to certain institutes showing appreciable discrepancies. However, the improvements in the standard deviations of the absorbed dose values of the individual participants are only marginal.
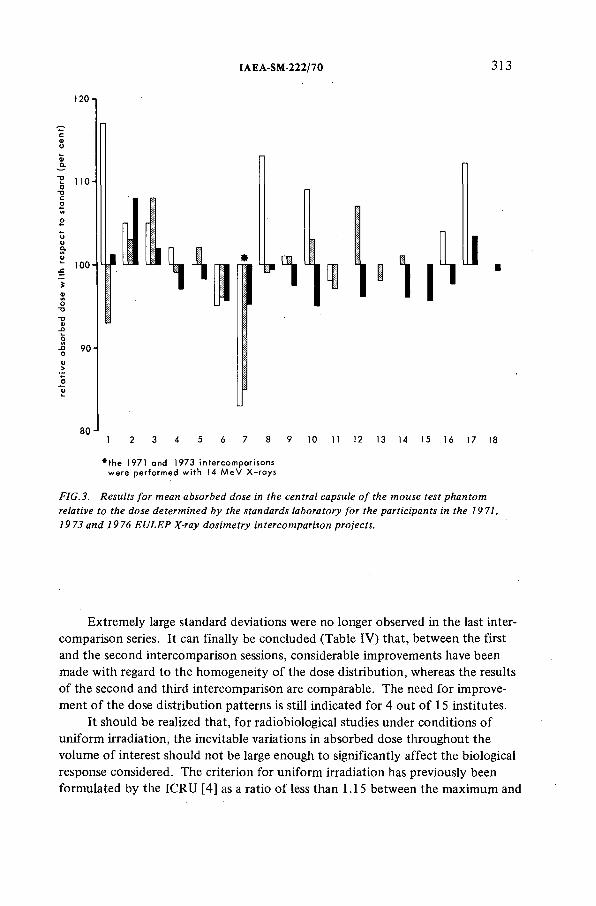
IAEA-SM-222/70 313
120
2 1 1 0 -
100
90-
80
l ' I P
10 11 12 13 14 15 16 17 !£
• th e 1971 and 1973 intercomparisons were performed with 14 M eV X-rays
FIG.3. Results for mean absorbed dose in the central capsule of the mouse test phantom
relative to the dose determined by the standards laboratory for the participants in the 1971,
1973 and 1976 EULEP X-ray dosimetry intercomparison projects.
Extremely large standard deviations were no longer observed in the last intercomparison series. It can finally be concluded (Table IV ) that, between the first and the second intercomparison sessions, considerable improvements have been made with regard to the homogeneity of the dose distribution, whereas the results of the second and third intercomparison are comparable. The need for improvement of the dose distribution patterns is still indicated for 4 out of 15 institutes.
It should be realized that, for radiobiological studies under conditions of uniform irradiation, the inevitable variations in absorbed dose throughout the volume of interest should not be large enough to significantly affect the biological response considered. The criterion for uniform irradiation has previously been formulated by the IC R U [4] as a ratio of less than 1.15 between the maximum and
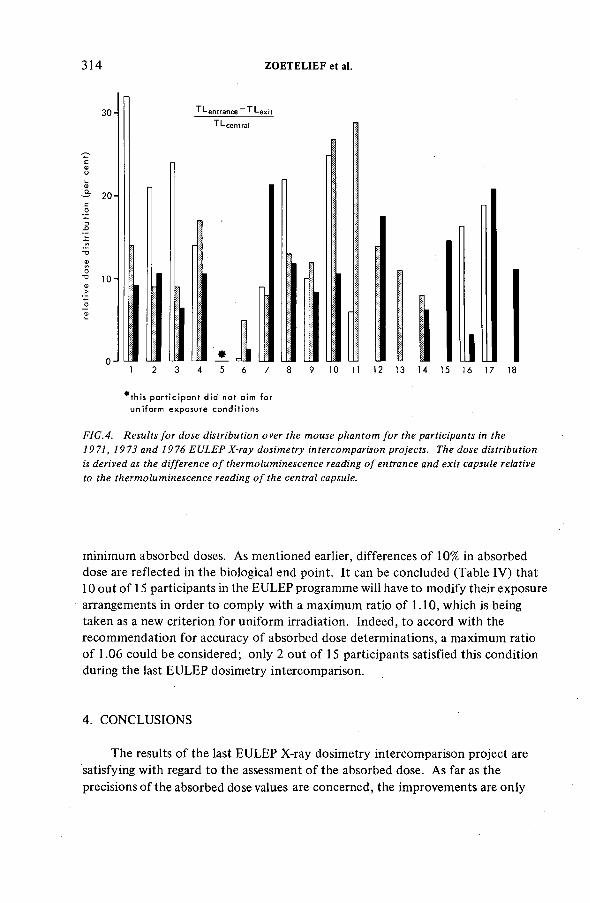
314 ZOETELIEF et al.
3 0 -
20-
1 0 -
TL„ в TLe:T L C
* i l4 5 6 10 11 12 13 14 15 16 17 1E
* th is part ic ipan t did not aim for uniform exposure conditions
FIG.4. Results for dose distribution over the mouse phantom for the participants in the
1971, 1973 and 1976 EULEP X-ray dosimetry intercomparison projects. The dose distribution
is derived as the difference of thermoluminescence reading of entrance and exit capsule relative
to the thermoluminescence reading of the central capsule.
minimum absorbed doses. As mentioned earlier, differences of 10% in absorbed dose are reflected in the biological end point. It can be concluded (Table IV ) that 10 out of 15 participants in the EULEP programme will have to modify their exposure arrangements in order to comply with a maximum ratio of 1.10, which is being taken as a new criterion for uniform irradiation. Indeed, to accord with the recommendation for accuracy of absorbed dose determinations, a maximum ratio of 1.06 could be considered; only 2 out of 15 participants satisfied this condition during the last EU LEP dosimetry intercomparison.
4. CO N CLU SIO N S
The results of the last EU LEP X-ray dosimetry intercomparison project are satisfying with regard to the assessment of the absorbed dose. As far as the
precisions of the absorbed dose values are concerned, the improvements are only
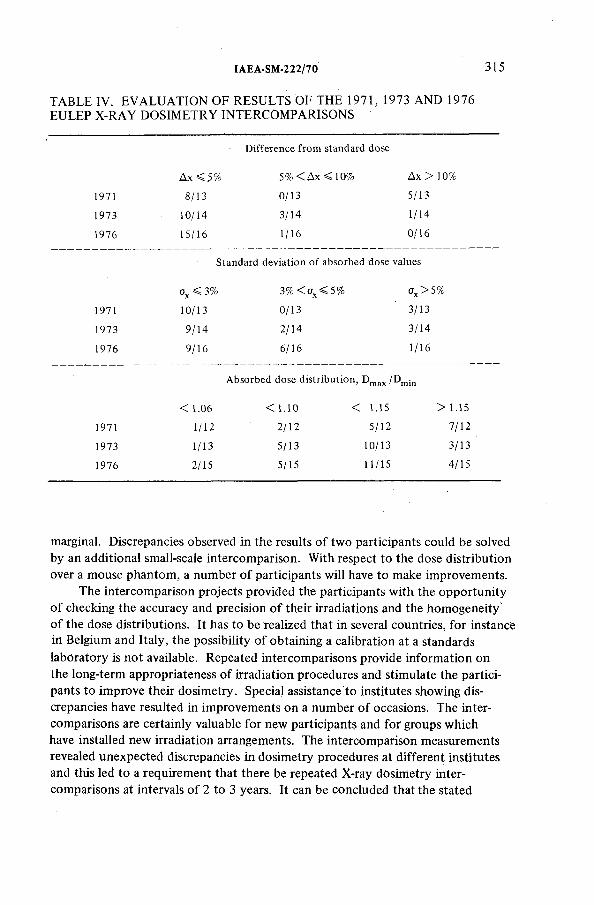
IAEA-SM-222/70 315
T A B LE IV. E V A L U A T IO N OF RESU LT S OF TH E 1971, 1973 A N D 1976 EU LEP X -R A Y D O S IM E T R Y IN T ER C O M PA R ISO N S
D ifferen ce fro m standard dose
Д х < .5 % 5% < A x < 10% A x > 1 0 %
197 1 8/13 0 /13 5/13
197 3 10 /14 3/14 1/14
19 7 6 15 /16 1/16 0/16
Standard d eviation o f absorbed dose values
ax < 3 % 3 % < (T X< 5 % tfx > 5%
19 7 1 10 /13 0/13 3/13
19 7 3 9 /14 2 /14 3/14
19 7 6 9 /16 6 /16 1/16
A b so rb ed dose d istrib u tio n , D maJ( /Dmjn
< 1.06 < 1 . 1 0 < 1 .1 5 > 1 . 1 5
19 7 1 1/12 2 /12 5 /12 7/12
197 3 1/13 5 /13 10 /13 3/13
1976 2/15 5/15 1 1 / 1 5 4/15
marginal. Discrepancies observed in the results of two participants could be solved by an additional small-scale intercomparison. With respect to the dose distribution over a mouse phantom, a number of participants will have to make improvements.
The intercomparison projects provided the participants with the opportunity of checking the accuracy and precision of their irradiations and the homogeneity’ of the dose distributions. It has to be realized that in several countries, for instance in Belgium and Italy, the possibility of obtaining a calibration at a standards laboratory is not available. Repeated intercomparisons provide information on the long-term appropriateness of irradiation procedures and stimulate the participants to improve their dosimetry. Special assistance to institutes showing discrepancies have resulted in improvements on a number of occasions. The intercomparisons are certainly valuable for new participants and for groups which have installed new irradiation arrangements. The intercomparison measurements revealed unexpected discrepancies in dosimetry procedures at different institutes and this led to a requirement that there be repeated X-ray dosimetry intercomparisons at intervals of 2 to 3 years. It can be concluded that the stated
316 ZOETELIEF et ai.
limits for accuracy (5%) and precision (3%) are adequate to discover inconsistencies in X-ray dosimetry. The recommendations for the homogeneity of the irradiations might have to be reconsidered in the near future. Finally, intercomparisons are of value for the development of new energy-independent dosimetry systems.
A C K N O W LED G EM EN T S
The efficient co-operation of the participating institutes is gratefully acknowledged. The authors wish to express their thanks to Mr. D.L.J.M Crebolder for his assistance in handling the thermoluminescent material, Mr. R.E. Vôlke for the construction of the phantoms and Mrs. M.C. von Stein for the secretarial help in the project.
R E F ER E N C E S
[1 ] P U IT E , K .J ., C R E B O L D E R , D .L .J.M ., H O G E W E G , B ., B R O E R S E , J.J ., Phys. Med.
B iol. 1 7 ( 1 9 7 2 ) 390.
[2] E U R O P E A N L A T E E F F E C T S P R O J E C T G R O U P , P ro to co l fo r E U L E P X -ray D o sim etry ,
R ijsw ijk , R a d io b io lo g ica l In stitu te T N O (1 9 7 2 ) .
[3] B R O E R S E , J.J., P U IT E , K .J ., Phys. M ed. B io l. 19 ( 1 9 7 4 ) 732.
[4] IN T E R N A T IO N A L C O M M IS S IO N O N R A D IO L O G IC A L U N IT S A N D M E A S U R E M E N T S ,
R a d io b io lo g ica l D o sim etry , IC R U R ep o rt 10e, N B S H an d b ook 88, N atio n al B ureau o f
Standards, W ashington, D C (19 6 3 ).
[5 ] P U IT E , K .J ., C R E B O L D E R , D .L .J .M ., Phys. M ed. B iol. 19 ( 1 9 7 4 ) 3 4 1 .
[6] B R O E R S E , J.J ., M IJN H E E R , B .J., P roc. 8èm e Congrès Intern ation al de la S o ciété
Française de R a d io p ro te ctio n sur A sp ects F o n d a m en tau x et A p p liq u és de la D osim etrie
(S a c la y , 1 9 7 5 ) , S F R , Paris ( 1 9 7 6 ) 6 4 1.
D ISC U SS IO N
L.J. G O ODM AN: I understand that this EU LEP study was an intercomparison of secondary and tertiary X-ray dose meters. Would it not be advisable for the various institutions to maintain more than one such secondary or tertiary standard? This could result in more reliable measurements within an institution as well as between institutions.
J.J. BRO ERSE: It has to be stressed that although the 18 participating institutes can be considered to be leading in radiobiology and late-effects studies, their dosimetry expertise is sometimes limited. I therefore doubt whether it would be technically possible to introduce an additional type of standard dose meter, such as a calorimeter, at these institutes.
IAEA-SM-222/70 317
L.J. GO ODM AN: I am sorry that my question was not clear. I meant to suggest that two or more dose meters of one type should be maintained at an institution to serve as the local secondary standard. For example, you reported that the intercomparison uncovered a faulty ionization chamber in one case and a defective electrometer in another instance. These malfunctions could have been discovered locally if more than one instrument (dose meter and electrometer) had been employed for the intercomparison measurement.
J.J. B RO ERSE : I certainly agree: that it would be highly desirable to maintain two independent secondary-standard devices, e.g. two ion chambers plus electrometers, at each institute. It will be very useful to include this recommendation in the protocol for EU LEP X-ray dosimetry. During the European Neutron Dosimetry Intercomparison Project, the neutron beams at TNO were monitored by two separate disc-type tissue-equivalent ionization chambers. The use of such a dual monitoring system has proved to be of great value for a continuous check on the constancy of the neutron field.
J.A. A U X IE R : It is clear from these experiments that, as usual, the errors (and uncertainties) decrease as the participants become more experienced, acquire better equipment, and become more aware of the possible sources of error; thus the intercomparisons have an educational effect.
M.A.F. A Y A D : You used lithium fluoride detectors for an X-ray machine below 200 keV; how did you overcome the problem of energy dependence of lithium fluoride detectors?
J.J. BRO ERSE: The energy dependencé of our LiF was determined experimentally (see Table I I of the paper). On the basis of the H V L values quoted by the participants, correction factors were applied for the different radiation qualities employed. The correction factors for the T LD measurements in the phantom were different from those for free-in-air conditions.

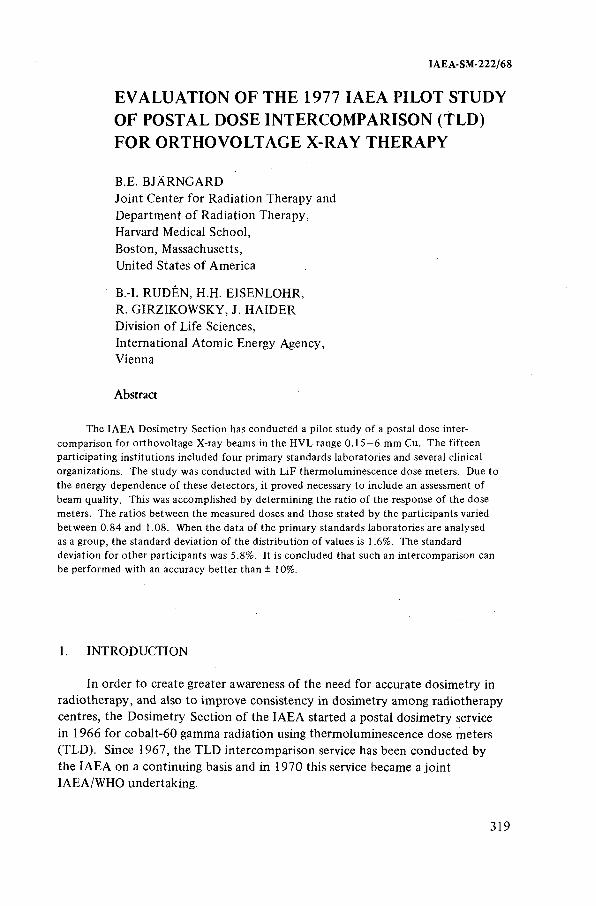
IAEA-SM-222/68
EVALUATION OF THE 1977 IAEA PILOT STUDY OF POSTAL DOSE INTERCOMPARISON (TLD) FOR ORTHOVOLTAGE X-RAY THERAPY
B.E. B JÀ R N G A R DJoint Center for Radiation Therapy and Department of Radiation Therapy,Harvard Medical School,Boston, Massachusetts,United States of America
B.-I. RUDÉN, H.H. E ISEN LO H R,R. G IR Z IK O W SK Y , J. H A ID E R Division of Life Sciences,International Atomic Energy Agency,Vienna
Abstract
Th e I A E A D osim etry S ection has co n d u cted a p ilo t stu dy o f a p o sta l dose inter-
com p arison fo r o rth o vo ltag e X -ray beam s in th e H V L range 0 . 1 5 - 6 m m C u . T h e fifteen
p articip atin g in stitu tio n s in cluded fo u r p rim ary standards lab oratories and several clin ical
organ ization s. Th e stu dy w as co n d u cted w ith L iF th erm o lu m in escen ce dose m eters. D ue to
th e en ergy d ep en d en ce o f these d etecto rs , it proved necessary to in clu d e an assessm ent o f
beam q u ality . Th is was accom p lish ed b y determ in in g the ra tio o f th e response o f th e dose
m eters. T h e ratios b etw een the m easured doses and th ose stated b y th e p a rticip an ts varied
b etw een 0.84 and 1.08. W hen th e data o f th e p rim ary standards lab o rato ries are analysed
as a gro up , the standard deviation o f th e d istrib u tio n o f values is 1.6% . T h e standard
deviation fo r o th er p articip an ts was 5.8% . It is co n clu d ed th at such an in tercom p arison can
be p erform ed w ith an a ccu racy b etter than ± 10%.
1. IN T R O D U C T IO N
In order to create greater awareness of the need for accurate dosimetry in radiotherapy, and also to improve consistency in dosimetry among radiotherapy centres, the Dosimetry Section of the IA E A started a postal dosimetry service in 1966 for cobalt-60 gamma radiation using thermoluminescence dose meters (TLD). Since 1967, the T LD intercomparison service has been conducted by the IA E A on a continuing basis and in 1970 this service became a joint IAEA/W H O undertaking.
319
320 BJÀRNGARD et al.
Previous evaluations [1—8] have clearly demonstrated its usefulness.Moreover, a majority of the participants, responding to an enquiry initiated by WHO, proposed an extension of the programme to include orthovoltage X-ray therapy machines. Therefore, the IA E A and WHO agreed to extend this postal dose intercomparison service to orthovoltage therapy X-rays.
Because of the greater complexity of dosimetry in orthovoltage X-ray therapy, the IA E A and WHO enlisted the co-operation of two research centres to develop suitable methods for a postal dose intercomparison service for these radiations. In addition, the IA E A ’s Dosimetry Laboratory also performed investigations with the same objective, including a first pilot study [8]. As a result of these investigations, various methods [6, 8— 10] are now available, each using thermoluminescent material and providing information on the absorbed dose and radiation quality.
In December 1976, an IA E A Advisory Group met in Vienna to discuss an extension of the IAEA/W H O 60Co gamma radiation postal dose intercomparison to orthovoltage X-ray beams of half-value layers (H VL) greater than 0.5 mm Cu (140—500 kV). The Advisory Group reviewed the different methods that could potentially be used for such a dose intercomparison. It concluded that thermoluminescent LiF was the most suitable dose meter material; it is also the basis for the well established 60Co gamma radiation dose intercomparison. It was stated that such an intercomparison should aim at an accuracy ... “better than ± 10% and preferably ± 5%.” To meet this specification a method for measurement of H V L is needed. The Advisory Group recommended that a pilot study be conducted with participation of national standards laboratories as well as clinical organizations. The primary objective of this pilot study was to determine the precision with which doses in this quality range can be determined with the technique recommended. Several minor technical details were to be evaluated, for example the use of an external filtration technique to determine HVL, developed at the Agency by Rudén and Girzikowsky. The practical aspects of the postal dose intercomparison to be tested in the pilot study included the appropriateness of instruction and data sheets. This pilot study was conducted during the summer of 1977. The purpose of this paper is to describe the results and experience gained, to summarize the dosimetric results and to discuss some aspects of the implementation of a postal dose intercomparison.
2. M ETH O DS
2.1. Design o f the pilot study
Several of the institutions participating in the pilot study had been represented in the 1976 Advisory Group meeting. The primary standards
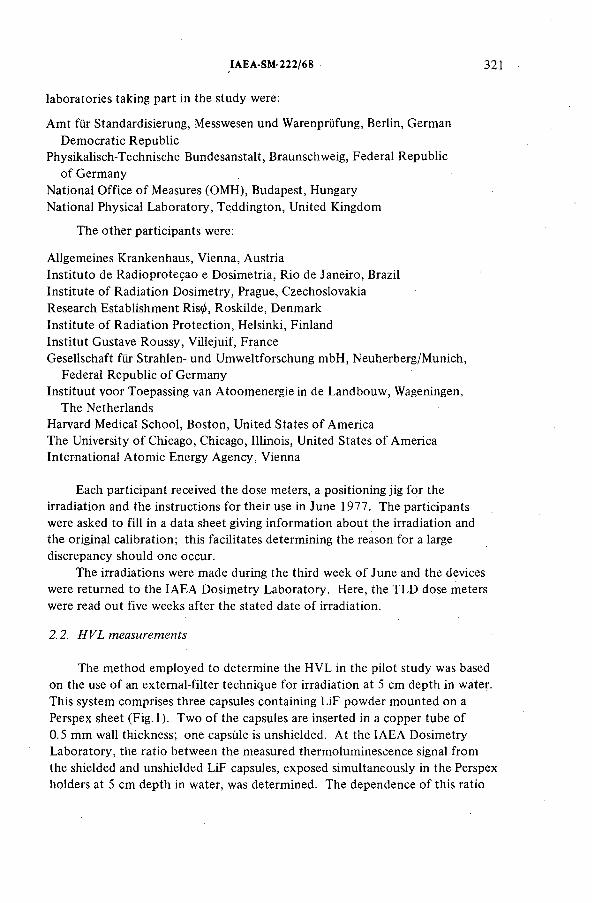
IAEA-SM-222/68 321
Amt für Standardisierung, Messwesen und Warenprüfung, Berlin, German
Democratic Republic Physikalisch-Technische Bundesanstalt, Braunschweig, Federal Republic
of GermanyNational Office of Measures (OMH), Budapest, Hungary National Physical Laboratory, Teddington, United Kingdom
The other participants were:
Allgemeines Krankenhaus, Vienna, AustriaInstituto de Radioproteçao e Dosimetria, Rio de Janeiro, BrazilInstitute of Radiation Dosimetry, Prague, CzechoslovakiaResearch Establishment Ris0, Roskilde, DenmarkInstitute of Radiation Protection, Helsinki, FinlandInstitut Gustave Roussy, Villejuif, FranceGesellschaft für Strahlen- und Umweltforschung mbH, Neuherberg/Munich,
Federal Republic of Germany Instituut voor Toepassing van Atoomenergie in de Landbouw, Wageningen,
The Netherlands Harvard Medical School, Boston, United States of America The University of Chicago, Chicago, Illinois, United States of America International Atomic Energy Agency, Vienna
Each participant received the dose meters, a positioning jig for the irradiation and the instructions for their use in June 1977. The participants were asked to fill in a data sheet giving information about the irradiation and the original calibration; this facilitates determining the reason for a large discrepancy should one occur.
The irradiations were made during the third week of June and the devices were returned to the IA E A Dosimetry Laboratory. Here, the T LD dose meters were read out five weeks after the stated date of irradiation.
2.2. HVL measurements
The method employed to determine the H V L in the pilot study was based on the use of an external-filter technique for irradiation at 5 cm depth in water. This system comprises three capsules containing LiF powder mounted on a Perspex sheet (Fig. 1). Two of the capsules are inserted in a copper tube of0.5 mm wall thickness; one capsule is unshielded. At the IA E A Dosimetry Laboratory, the ratio between the measured thermoluminescence signal from the shielded and unshielded LiF capsules, exposed simultaneously in the Perspex holders at 5 cm depth in water, was determined. The dependence of this ratio
laboratories taking part in the study were:
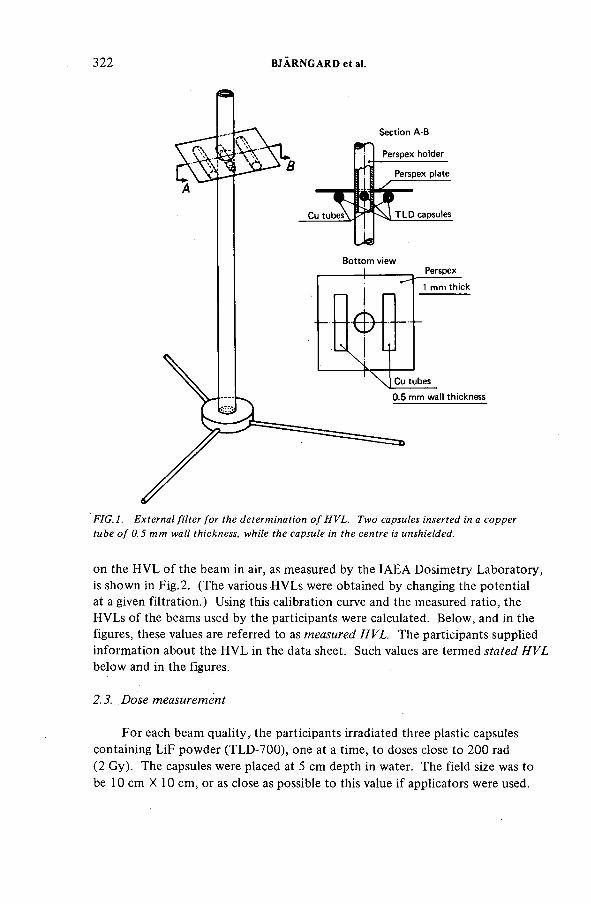
322 BJÀRNGARD et al.
FIG.l. External filter for the determination of HVL. Two capsules inserted in a copper
tube of 0.5 mm wall thickness, while the capsule in the centre is unshielded.
on the H V L of the beam in air, as measured by the IA E A Dosimetry Laboratory, is shown in Fig.2. (The various H VLs were obtained by changing the potential at a given filtration.) Using this calibration curve and the measured ratio, the H VLs of the beams used by the participants were calculated. Below, and in the figures, these values are referred to as measured HVL. The participants supplied information about the H V L in the data sheet. Such values are termed stated HVL below and in the figures.
2.3. . Dose measurement
For each beam quality, the participants irradiated three plastic capsules containing LiF powder (TLD-700), one at a time, to doses close to 200 rad (2 Gy). The capsules were placed at 5 cm depth in water. The field size was to be 10 cm X 10 cm, or as close as possible to this value if applicators were used.
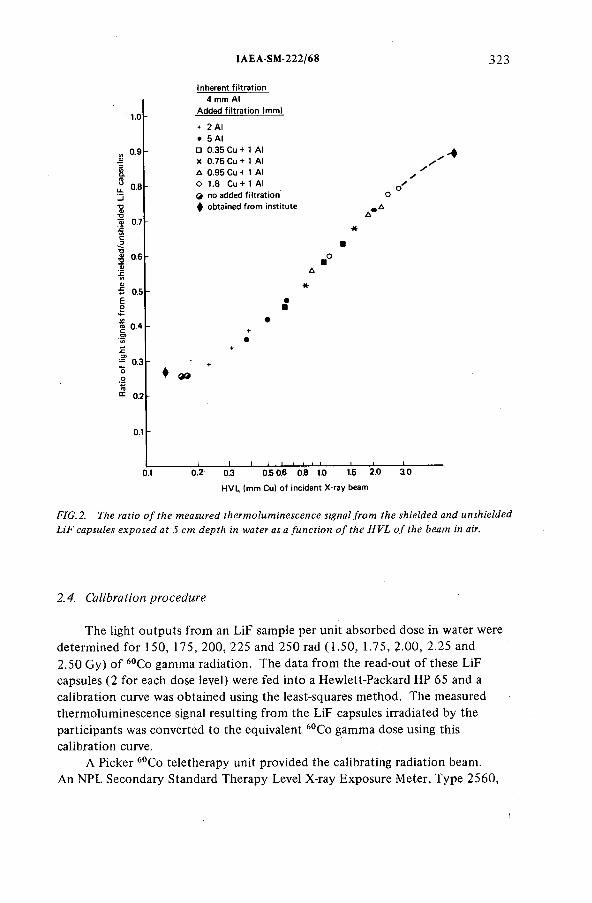
IAEA-SM-222/68 323
1.0
0.9
0.8
0.7
•Я 0.6
0.5
0.4
0.3
0.2
0.1
Inherent filtration
4 mm A l
Added filtration (mm)
♦ 2 A I
• 5 A I
□ 0.35 Cu + 1 A l
x 0.75 Cu + 1 A l
A 0.95 Cu + 1 A l
О 1.8 Cu + 1 A I
О no added filtration
ф obtained from institute
ОЭ
0.1 0.2 0.3 O S 0.6 0.8 1.0 1.5 2.0
H V L (mm Cu) o f incident X-ray beam
ao
FIG. 2. The ratio of the measured thermoluminescence signal from the shielded and unshielded
LiF capsules exposed at 5 cm depth in water as a function of the HVL of the beam in air.
2.4. Calibration procedure
The light outputs from an LiF sample per unit absorbed dose in water were determined for 150, 175, 200, 225 and 250 rad (1.50, 1.75, 2-00, 2.25 and 2.50 Gy) of 60Co gamma radiation. The data from the read-out of these LiF capsules (2 for each dose level) were fed into a Hewlett-Packard HP 65 and a calibration curve was obtained using the least-squares method. The measured thermoluminescence signal resulting from the LiF capsules irradiated by the participants was converted to the equivalent 60Co gamma dose using this calibration curve.
A Picker 60Co teletherapy unit provided the calibrating radiation beam.An NPL Secondary Standard Therapy Level X-ray Exposure Meter, Type 2560,
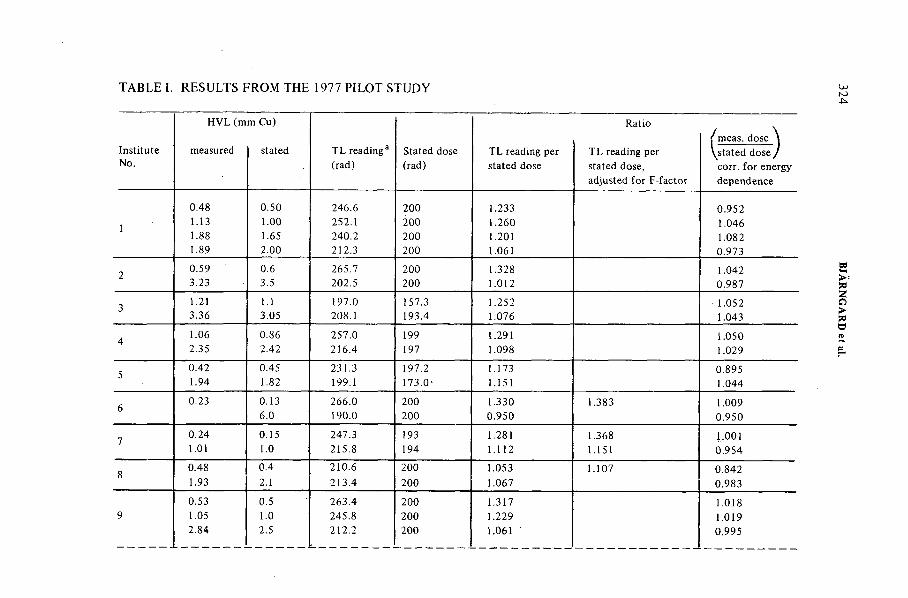
TABLE I. RESULTS FROM THE 1977 PILOT STUDY
H V L (m m Cu) R atio
/ m eas, dose \Institute m easured stated T L rea d in g 3 S tated dose T L reading per T L reading per V stated d o s e /No. (rad) (rad) stated dose stated dose, corr. fo r en ergy
adju sted fo r F -facto r d ep en d en ce
0.48 0.50 246.6 200 1.233 0 .9521.13 1.00 2 52 .1 200 1.260 1.0 461.88 1.65 240.2 200 1.201 1.0821.89 2.00 2 12 .3 200 1.0 61 0.973
0.59 0.6 2 6 5 .7 200 1.328 1.0423.23 3.5 202.5 200 1.0 12 0.98 7
3 1.21 1.1 19 7 .0 15 7 .3 1.2 52 1.0 523.36 3.05 208.1 193.4 1.0 76 1.043
4 1.06 0.86 257 .0 199 1.2 9 1 1.0 502.35 2.42 2 16 .4 197 1.098 1.029
0.42 0.45 2 3 1.3 197 .2 1 .1 7 3 0.8951.94 1.82 199.1 173 .0 - 1 .1 5 1 1.0 44
0.23 0 .13 266.0 200 1.3 30 1.383 1.0096.0 190.0 200 0.950 0.950
7 0.24 0 .15 247.3 193 1.2 8 1 1.368 1.0011.01 1.0 2 15 .8 194 1 .1 1 2 1 .1 5 1 0 .954
0.48 0.4 2 10 .6 200 1.0 53 1 .1 0 7 0.8421.93 2.1 -213.4 200 1.0 67 0.983
0.53 0.5 2 63.4 200 1 .3 1 7 1.0 189 1.05 1.0 245.8 200 1.2 29 1.0 19
2.84 2.5 2 12 .2 200 1.0 61 ' 0.995
324 B
JÀR
NG
AR
D
et al.
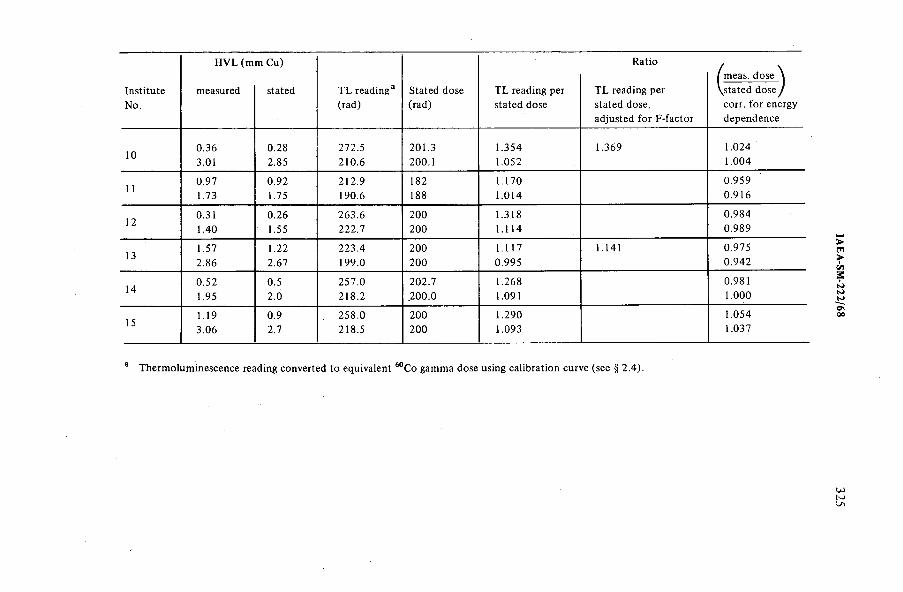
H V L (m m C u ) R atio / \( m eas, dose \
Institute m easured stated T L rea d in g 3 S tated dose T L reading per T L reading per \sta ted dose JNo. (rad) (rad) stated dose stated dose, corr. fo r energy
adjusted fo r F -facto r dep end en ce
0.36 0.28 2 72 .5 2 0 1.3 1 .3 5 4 1.3 69 1.0 24
3.01 2.85 2 10 .6 200.1 1.0 52 1.004
0.97 0.92 2 12 .9 182 1 .1 7 0 0 .959
1.73 1.75 190.6 188 1 .0 14 0 .9 16
0.31 0.26 263.6 200 1.3 18 0.984
1.40 1.55 2 22 .7 200 1 .1 1 4 0.989
1 .5 7 1.22 2 23.4 200 1 .1 1 7 1 .1 4 1 0 .97 5
2.86 2.67 199.0 200 0.995 0 .942
0.52 0.5 2 57 .0 2 0 2.7 1.268 0.981
1.95 2.0 2 18 .2 .200.0 1.0 91 1.000
151 .1 9 0.9 258.0 200 1.290 1.0 54
3.06 2.7 2 18 .5 200 1.093 1.0 37
a Th erm olu m in escen ce reading con verted to equivalent 60C o gam m a dose using ca lib ration curve (see § 2 .4).
IAE
A-S
M-2
22
/68
325
326 BJÀRNGARD et al.
and an N PL Secondary Standard Chamber, Type 2561, with a calibration factor obtained from the National Physical Laboratory (NPL), United Kingdom, were used for exposure measurements.
The irradiation geometry consists of a vertical 60Co beam of field size 10 cm X 10 cm at a distance of 85 cm from the focus. The absorbed dose rate in water at a depth of 5 cm on the central axis of the beam (corresponding to the position of the T LD capsules), with the water surface at 80 cm from the source, is based on exposure measurements at the same position in free air (focus-to-centre of chamber distance, 85 cm). The absorbed dose rate is given by the following equation:
SD = 5X a F T A R
where 5Хд is the measured exposure rate (R/min) in air 85 cm from the source on the central axis beam, F is the conversion coefficient rad/R (IC R U
Report 23 [ l l ] ) 1, and T A R is the central axis tissue-to-air ratio for a10 cm X 10 cm field size at 5 cm depth. The numerical value of F and T A R were taken to be 0.950 and 0.911, respectively. This T A R differs from the one tabulated in the British Journal of Radiology, Supplement 11 [12]. It was determined by measurements on the Agency’s 60Co apparatus [13] and is, therefore, only valid for this apparatus.
Since the sensitivity of the reader system (Harshaw 2000 A and B) may vary with time, an individual control factor is defined as the ratio of the mean reading of the control powder obtained at two different moments in time, namely the time of read-out of the calibration capsules, and the time of read-out of each participant’s capsules. This ratio reflects the variation in the reader performance over the period in question.
3. R ESU LT S A N D D ISCU SS IO N
3.1. HVL measurements
Table I includes the measured and stated HVLs. In Fig.3, the ratios between these values are shown as a function of the stated HVL. The mean value of all 33 data points is 1.10 with a standard deviation of 0.20. However, three points are outside the range of H VLs calibrated by the IAEA . If these are eliminated, and the data for the IA E A laboratory are disregarded, 26 data
1 In th is p aper the term in o lo g y in vo lvin g the “ special u n its” as used in IC R U
R ep o rt 23 [ 1 1 ] has been adhered to . T h ere is at present a term in o lo gica l d iffic u lty in
in ven tin g an u p d ated nam e fo r “ conversion co e ffic ie n t rad/R ” , since o n ly rad has an
SI rep lacem en t!
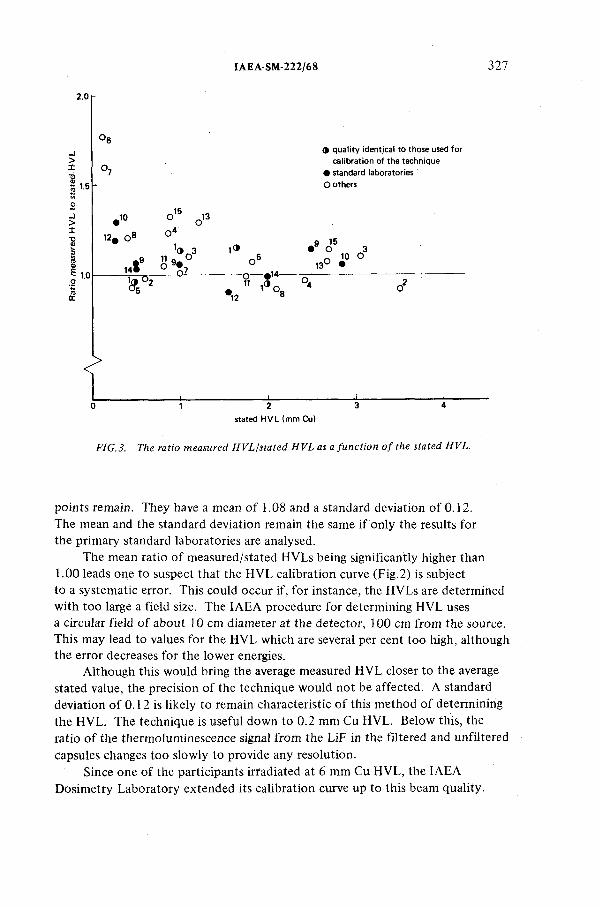
IAEA-SM-222/68 327
2.0
ф quality identical to those used for
calibration of the technique
• standard laboratories
О others
о-j>X
оо4
о
го 2
stated H V L (mm Cu)
3 4
FIG.3. The ratio measured HVL/stated HVL as a function of the stated HVL.
points remain. They have a mean of 1.08 and a standard deviation of 0.12.The mean and the standard deviation remain the same if only the results for the primary standard laboratories are analysed.
The mean ratio of measured/stated H VLs being significantly higher than 1.00 leads one to suspect that the H V L calibration curve (Fig.2) is subject to a systematic error. This could occur if, for instance, the H VLs are determined with too large a field size. The IA E A procedure for determining H V L uses a circular field of about 10 cm diameter at the detector, 100 cm from the source. This may lead to values for the H V L which are several per cent too high, although the error decreases for the lower energies.
Although this would bring the average measured H V L closer to the average stated value, the precision of the technique would not be affected. A standard deviation of 0.12 is likely to remain characteristic of this method of determining the HVL. The technique is useful down to 0.2 mm Cu HVL. Below this, the ratio of the thermoluminescence signal from the LiF in the filtered and unfiltered
capsules changes too slowly to provide any resolution.Since one of the participants irradiated at 6 mm Cu HVL, the IA E A
Dosimetry Laboratory extended its calibration curve up to this beam quality.
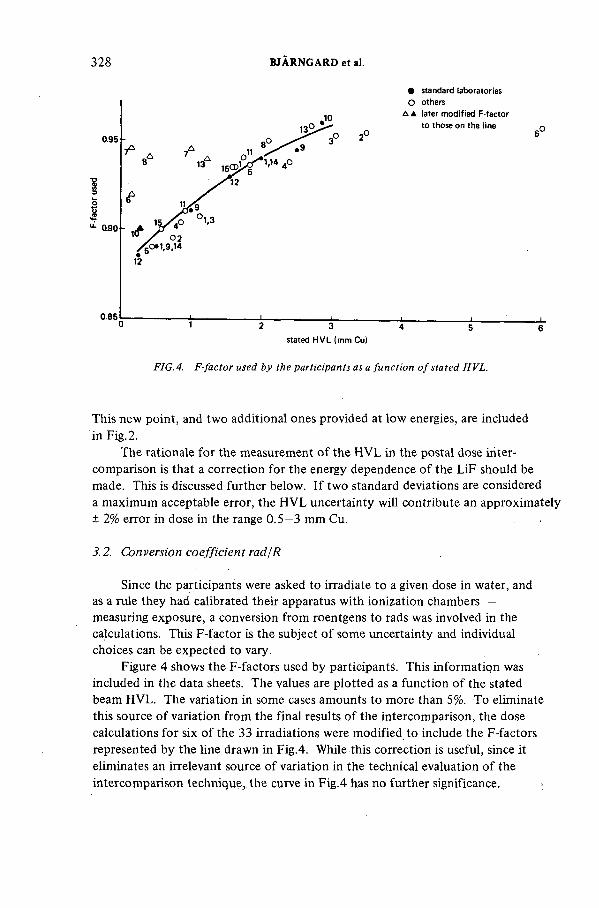
328 BJARNGARD et al.
• standard laboratories
FIG. 4. F-factor used by the participants as a function of stated HVL.
This new point, and two additional ones provided at low energies, are included in Fig.2.
The rationale for the measurement of the H V L in the postal dose iriter- comparison is that a correction for the energy dependence of the LiF should be made. This is discussed further below. If two standard deviations are considered a maximum acceptable error, the H V L uncertainty will contribute an approximately ± 2% error in dose in the range 0.5—3 mm Cu.
3.2. Conversion coefficient rad/R
Since the participants were asked to irradiate to a given dose in water, and as a rule they had calibrated their apparatus with ionization chambers — measuring exposure, a conversion from roentgens to rads was involved in the calculations. This F-factor is the subject of some uncertainty and individual choices can be expected to vary.
Figure 4 shows the F-factors used by participants. This information was included in the data sheets. The values are plotted as a function of the stated beam HVL. The variation in some cases amounts to more than 5%. To eliminate this source of variation from the final results of the intercomparison, the dose calculations for six of the 33 irradiations were modified to include the F-factors represented by the line drawn in Fig.4. While this correction is useful, since it eliminates an irrelevant source of variation in the technical evaluation of the intercomparison technique, the curve in Fig.4 has no further significance. ;
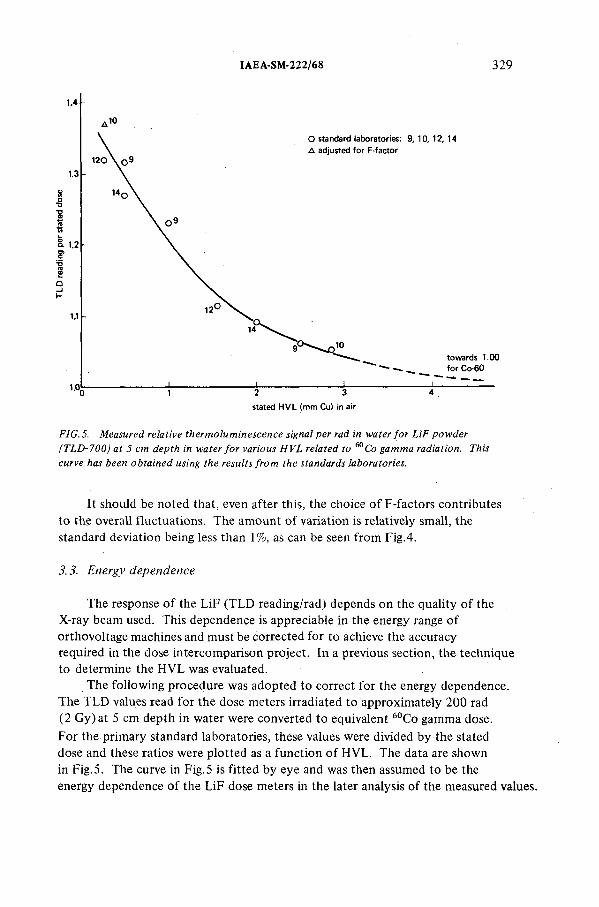
IAEA-SM-222/68 329
FIG.5. Measured relative thermoluminescence signal per rad in water for LiF powder
(TLD-700) at 5 cm depth in water for various HVL related to 60Co gamma radiation. This
curve has been obtained using the results from the standards laboratories.
It should be noted that, even after this, the choice of F-factors contributes to the overall fluctuations. The amount of variation is relatively small, the standard deviation being less than 1%, as can be seen from Fig.4.
3.3. Energy dependence
The response of the LiF (TLD reading/rad) depends on the quality of the X-ray beam used. This dependence is appreciable in the energy range of orthovoltage machines and must be corrected for to achieve the accuracy required in the dose intercomparison project. In a previous section, the technique to determine the H V L was evaluated.
The following procedure was adopted to correct for the energy dependence.The T LD values read for the dose meters irradiated to approximately 200 rad (2 Gy) at 5 cm depth in water were converted to equivalent 60Co gamma dose.
For the primary standard laboratories, these values were divided by the stated dose and these ratios were plotted as a function of HVL. The data are shown in Fig.5. The curve in Fig.5 is fitted by eye and was then assumed to be the energy dependence of the LiF dose meters in the later analysis of the measured values.
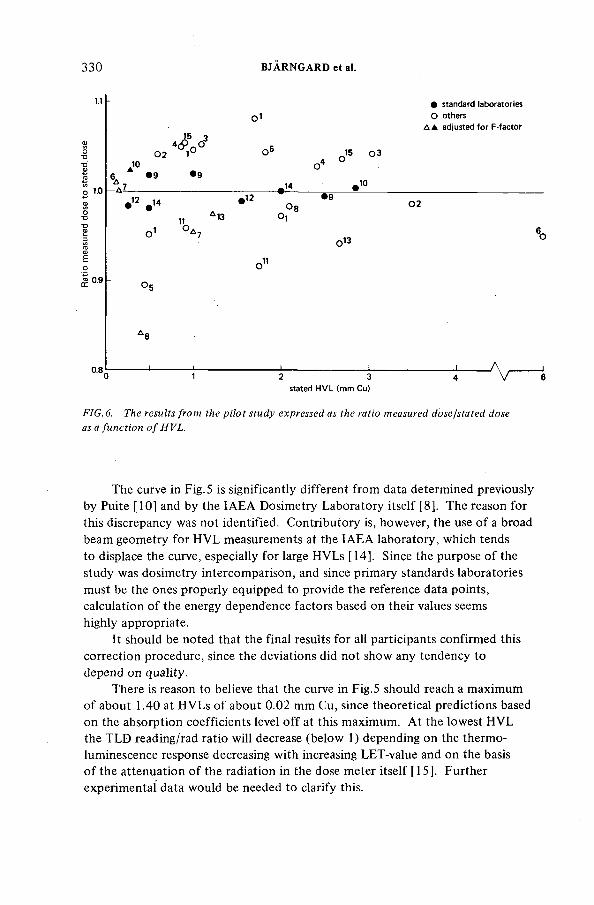
330 BJÀRNGARD et al.
1.0
0.8
• standard laboratories
О others
Д А adjusted for F -factor
0 2 " 1 ° ° ° J 5 0 3JO O4 °
6 * 9 * 9A l____________________ .1 4 .1 0
•12 По * 9• • A ° 8
« О,
о11
-.13
2 3stated H V L (mm Cu)
ArFIG. 6. The results from the pilot study expressed as the ratio measured dose/stated dose
as a function of HVL.
6o
The curve in Fig.5 is significantly different from data determined previously by Puite [10] and by the IA E A Dosimetry Laboratory itself [8]. The reason for this discrepancy was not identified. Contributory is, however, the use of a broad beam geometry for H V L measurements at the IA E A laboratory, which tends to displace the curve, especially for large H VLs [14]. Since the purpose of the study was dosimetry intercomparison, and since primary standards laboratories must be the ones properly equipped to provide the reference data points, calculation of the energy dependence factors based on their values seems highly appropriate.
It should be noted that the final results for all participants confirmed this correction procedure, since the deviations did not show any tendency to depend on quality.
There is reason to believe that the curve in Fig. 5 should reach a maximum of about 1.40 at H VLs of about 0.02 mm Cu, since theoretical predictions based on the absorption coefficients level off at this maximum. At the lowest H V L the T LD reading/rad ratio will decrease (below 1 ) depending on the thermoluminescence response decreasing with increasing LET-value and on the basis of the attenuation of the radiation in the dose meter itself [15]. Further experimental data would be needed to clarify this.
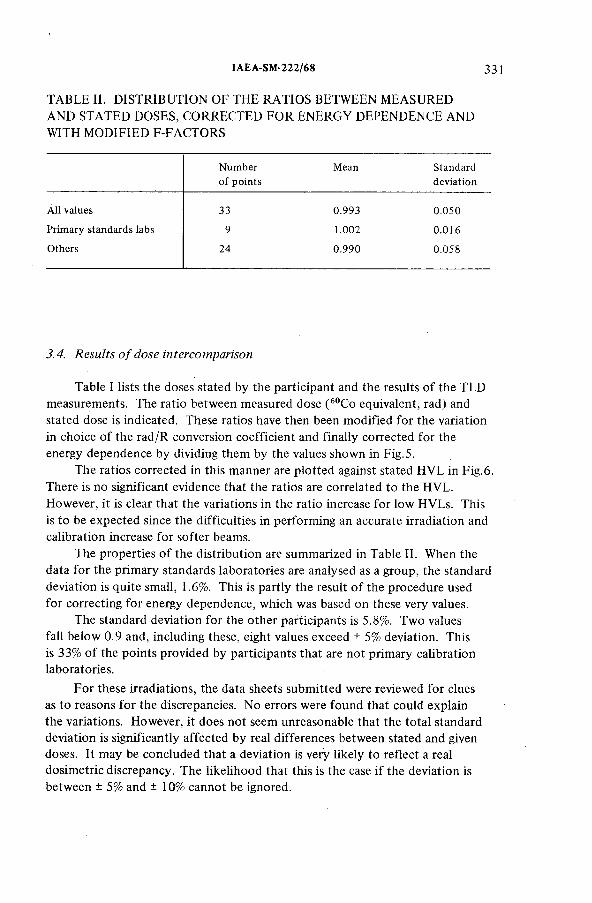
IAEA-SM-222/68 331
T A B LE II. D IST R IB U T IO N OF TH E R A T IO S BETW EEN M EA SU R E D A N D ST A T ED DOSES, C O R R E C T E D F O R E N E R G Y D EPEN D EN C E A N D W ITH M O D IF IE D F-FACTORS
N um ber
o f p o in ts
M ean Standard
d eviation
A ll values 33 0.993 0.050
Prim ary standards labs 9 1.002 0 .0 16
O thers 24 0.990 0.058
3.4. Results o f dose intercomparison
Table I lists the doses stated by the participant and the results of the TLD measurements. The ratio between measured dose (60Co equivalent, rad) and stated dose is indicated. These ratios have then been modified for the variation in choice of the rad/R conversion coefficient and finally corrected for the energy dependence by dividing them by the values shown in Fig. 5.
The ratios corrected in this manner are plotted against stated H V L in Fig.6. There is no significant evidence that the ratios are correlated to the HVL. However, it is clear that the variations in the ratio increase for low HVLs. This is to be expected since the difficulties in performing an accurate irradiation and calibration increase for softer beams.
The properties of the distribution are summarized in Table II, When the data for the primary standards laboratories are analysed as a group, the standard deviation is quite small, 1.6%. This is partly the result of the procedure used for correcting for energy dependence, which was based on these very values.
The standard deviation for the other participants is 5.8%. Two values fall below 0.9 and, including these, eight values exceed ± 5% deviation. This is 33% of the points provided by participants that are not primary calibration laboratories.
For these irradiations, the data sheets submitted were reviewed for clues as to reasons for the discrepancies. No errors were found that could explain the variations. However, it does not seem unreasonable that the total standard deviation is significantly affected by real differences between stated and given doses. It may be concluded that a deviation is very likely to reflect a real dosimetric discrepancy. The likelihood that this is the case if the deviation is between ± 5% and ± 10% cannot be ignored.
332 BJÀRNGARD et al.
(a) Due to the magnitude of the energy correction factor (Fig.5) it is essential that the postal dose intercomparison method includes an assessment of H V L for the purpose of correcting the T LD signals for the energy dependence of LiF.
(b) The external filter technique to determine H V L is a practical method, of sufficient accuracy over the quality range of interest.
(c) The LiF T LD dose measurement technique provides sufficient precision for a meaningful postal dose intercomparison and meets the requirements that “the accuracy ... should be better than ± 10% and preferably ± 5%.”
(d) The pilot study has shown that the postal dose intercomparison is accurate and practicable. A first intercomparison can be conducted.
(d) The participation by several primary standards laboratories provided a firm basis for the intercomparison in this pilot study. In fact, the value of the study would have been in doubt, had they not so generously supported the effort. It is suggested that several reference points over the quality range of interest should be supplied by one or, preferably, several standards laboratories. There are practical reasons for this, in particular the need for energy-dependence correction factors; however, the principle that participants can effect a comparison with recognized standards adds considerably to the value of the intercomparison.
4. CONCLUSIONS
R E F ER E N C E S
[ 1 ] P F A L Z N E R , P.M ., A L V A R E Z , M .S., A c ta R ad io l., T h er., P h ys., B io l. 7 (19 6 8 ) 3 79 .
[2] P F A L Z N E R , P.M ., J A Y A R A M A N , S ., A c ta R ad io l., T h er.,P h ys., B io l. 9 (1 9 7 0 ) 5 0 1.
[3] C L A S S E N , L , S E E L E N T A G , W., W A L D E S K O G , B ., “ Joint IA E A /W H O T L D inter
co m p ariso n program : evalu ation o f th e present situ atio n ” , N ation al and Intern ation al
R adiation Dose Interco m parison s (Proc. Panel V ien n a, 1 9 7 1 ) , IA E A , V ien n a (1 9 7 3 ) 13 7.
[4] E IS E N L O H R , H ., A B E D IN -Z A D E H , R ., C h eck in g D o sim etry A ccu ra cy b y Post, IA E A
B u lletin IS 2 (1 9 7 3 ) 40.
[5] M O O S, W .S., B A L A M U T O V , V .G ., A B E D IN -Z A D E H , R ., “ A m u ltin atio n al survey o f the
statu s o f 60C o radiation th erap y d o sim etry ” , N ation al and In tern ation al R ad iatio n Dose
Interco m p arison s (P roc. Panel V ien n a, 1 9 7 1 ) , IA E A , V ienn a (1 9 7 3 ) 1 17.
[6] A B E D IN -Z A D E H , R ., E IS E N L O H R , H .H ., L E R C H , I .A ., H A ID E R , J., P roc. 4th Int.
C o n f. Lu m in escen ce D osim etry (P roc. S ym p . K rak o w , 19 7 4 ) 3, Inst, o f N uclear P hysics,
C raco w ( 1 9 7 4 ) 9 5 1 .
[7] E IS E N L O H R , H .H ., J A Y A R A M A N , S., Phys. M ed. B iol. 2 2 1 ( 1 9 7 7 ) 18.
[8] E IS E N L O H R , H .H ., H A ID E R , J.G ., R U D Ë N , B.-I., Proc. 5 th Int. C o n f. Lu m in escence
D osim etry (P roc. S ym p . Sao P au lo , 1 9 7 7 : S C H A R M A N N , A ., E d .), Justus-Liebing
U n iversity , G iessen ( 1 9 7 7 ) 350.
[9] R O S S IT E R , M .J .,P h y s . M ed. B iol. 20 5 ( 1 9 7 5 ) 73 5 .
[10 ] P U IT E , K .J ., Phys. M ed. B iol. 21 2 ( 1 9 7 6 ) 2 16 .
IAEA-SM-222/68 333
[ 1 1 ] IN T E R N A T IO N A L C O M M IS S IO N O N R A D IO L O G IC A L U N IT S A N D M E A S U R E M E N T S , M easurem ent o f A b so rbed Dose in a P h an tom Irradiated b y a Single Beam o f X or
G am m a R ays, I C R U R eport 23, IC R U , W ashington, D C ( 1 9 7 5 ) .
[12 ] C en tral a xis d ep th dose d ata fo r use in ra d io th era p y, Br. J. R adio l. Suppl. 11 (1 9 7 2 ) .
[1 3 ] R U D E N , B .-I., O u tp u t m easurem ents in air and in w ater from I A E A ’s Co-60 u n it,
I A E A in tern al rep ort ( 1 9 7 7 ) .
[14 ] IN T E R N A T IO N A L C O M M IS S IO N O N R A D IO L O G IC A L U N IT S A N D M E A S U R E M E N T S ,
P h ysica l A sp ects o f Irradiation, IC R U R ep o rt 10 b, N B S H an d b o o k 85, N B S, W ashington, D C (19 6 2 ).
[1 5 ] R U D É N , B .-I., A c ta R ad io l., T h er., P h ys., B iol. 15 5 ( 1 9 7 6 ) 4 4 7.
D ISC U SS IO N
1.5. SU N D A R A R A O : In the irradiation system described in your paper, two capsules were shielded by 0.5 mm copper and one capsule was unshielded.Is it not sufficient to use only one shielded and one unshielded capsule? In routine intercomparisons that would save a lot of TLD powder.
B.-I RUDÊN: I completely agree with you: one shielded capsule would be enough. To obtain equilibrium we have two copper tubes on the Perspex sheet.
1.5. SU N D A R A R A O : You would keep the second capsule as a dummy without the phosphor in it?
B.I. RUDÉN: Yes.W.J. BR A D Y : The difficulty of providing and measuring low-energy
photons was discussed in your paper. This symposium has been concerned with standardization of radiation dosimetry and calibrations; not much has been said about sources of low-energy photon radiation. Previous remarks by Mr. Wyckoff indicated that К X-rays were unnecessary for dose meter calibration purposes. Ms. Ehrlich stated that N BS uses filtered X-rays only. However,Mr. Storm indicated in his paper IAEA-SM-222/4 that the Los Alamos Scientific Laboratory uses К X-rays. Mr. Fleming indicated that Battelle Pacific Northwest Laboratories also use К X-rays at Hanford, and had problems measuring filtered soft X-ray doses to phantoms. At the Nevada Test Site, we have used К X-rays but have noted large calibration differences between major facilities such as Los Alamos and Hanford. We have also experienced the tube voltage control problems discussed by Fleming. Thus, the question of К X-rays versus filtered X-rays for low-energy photon calibration of dose meters has been raised at this Symposium, but has not been answered. Can you, or anyone here, recommend one of these calibration methods as more advantageous for standardization than the other, or can anyone here comment on the usefulness of continued К fluorescence calibration work?
S.C. E LL IS : As far as I am aware no national laboratory has primary standards suitable for operation in the low-intensity beams produced by К fluorescence sources.

IAEA-SM-222/62
DOSIMETRIC PRIMARY AND SECONDARY STANDARDIZATION WITHIN THE EUROPEAN COMMUNITIES
M. O B ER H O F ER Joint Research Centre,Comission of the European Communities,Ispra
Abstract
D O S IM E T R IC P R IM A R Y A N D S E C O N D A R Y S T A N D A R D IZ A T IO N W IT H IN TH E
E U R O P E A N C O M M U N IT IE S .
A survey is given o f the d osim etric p rim ary and seco n d ary stan d ardizatio n possib ilities
existin g w ith in the nine m em ber states o f the E u rop ean C o m m u n ity , considering in the case
o f seco n d ary standards o n ly the o ff ic ia lly ackn o w led ged and reco gn ized ca lib ratio n laboratories.
1. IN T R O D U C T IO N
The Commission of the European Communities, represented by the Direction General V, Social Affairs, promotes meetings of experts in the field of radiation- protection dose-meter calibration and organizes intercomparisons of dose meters at the European level, the main goal being to obtain comparable dose measurements within the member states.
It is common practice for the Commission to invite its member states to take part in a meeting or in an intercomparison campaign through the permanent representatives of these states, the governments of which then determine who should represent the country. Such nomination reflects the existing situation in the different countries in the field of dose standardization and gives an idea to what extent the problem of dose standardization has already been solved or is being solved at a national level.
For some Community countries the existing situation is outlined by papers to this Symposium [ 1 - 4 ].
A summary is given in this paper of the overall situation at present. At a later date, when the process of setting up calibration chains and the establishment of the first generation of authorized calibration services in the Community has come to an end, a more definitive summary will be published.
335
336 OBERHOFER
There are five Primary Standard Dosimetry Laboratories operating within the Community. Those laboratories are part of:
(a) The Bureau national de la métrologie (BNM ) at Paris in France;(b) The Physikalisch-Technische Bundesanstalt (PTB) at Braunschweig in
the Federal Republic of Germany;(c) The Istituto Superiore di Sanità at Rome in Italy;(d) The Rijksinstituut voor de Volksgezondheid at Bilthoven in The
Netherlands;(e) The National Physical Laboratory (NPL) at Teddington in the United
Kingdom.
These laboratories have been established for a considerable time and have acquired a great deal of expertise. This has been made available to many laboratories involved with radiation dosimetry, both within the Community and outside it.
Four of the Primary Standard Dosimetry Laboratories will be continuing their efforts to maintain primary standards and will also develop new ones as the need arises.
In Italy, this activity will be taken over by the Comitato Nazionale per l’Energia Nucleare (CNEN), following the official agreement which was signed recently by the Istituto di Metrologia G. Colonnetti (IM G C) of the National Research Council (CNR) and the Istituto Elettrotecnico Nazionale G. Ferraris (IEN G F ) with CNEN.
CN EN will, in the future, operate a National Primary Standards Laboratory which will be provided with all the facilities for making absolute measurements of photon and neutron radiations and activity. It has not yet been decided where
this laboratory will be situated.Together with the standards of measurement of ionizing radiations located
at the International Bureau of Weights and Measures (B IPM ) at Sevres in France, the Community has easy access to some of the best standards in radiation dosimetry in the world. Hence, no further establishment of primary standards of the same nature is needed within the Community.
2. PRIMARY STANDARD DOSIMETRY LABORATORIES
3. SE C O N D A R Y S T A N D A R D D O S IM E T R Y LA B O R A T O R IE S
A number of other, non-primary standard dosimetry calibration laboratoriés have also been operating within the Community. These were, in most cases, established to calibrate dose meters used in radiotherapy or radiation-protection
IAEA-SM-222/62 337
instruments used in nuclear energy research. Some were also set up in industry manufacturing radiological dose meters and radiation instruments.
Recently some of these laboratories and certain new ones were officially acknowledged and recognized as offering dose meter calibration services.The impetus frequently came as a consequence of governmental decisions or calibration laws.
Calibration chains were established in some countries, which distinguish between primary, secondary and tertiary calibration laboratories. This development is justified in view of the continuously increasing number of dose-meters and health physics instrumentation that is being employed and the severe radiation protection regulations in force in various countries complying with the Basic Radiation Protection Norms issued by the Commission of the European Communities.
The various countries have adopted slightly different ways of solving the problem of radiotherapy and radiation-protection dose-meter calibration, depending on their governmental, legislative and administrative structures. In summary the present situation is as follows.
3.1. Belgium
In Belgium there is the Dienst voor Fysiche Controle R U G at Ghent, which was recently accepted as a member of the IAEA/W H O Network of SSDLs.
3.2. Denmark
In Denmark, the State Institute of Radiation Hygiene in Copenhagen operates a secondary standard X- and gamma-ray calibration service for all hospitals in the country.
3.3. France
In France, the following laboratories trace their dosimetry standards to the standards of the Category 1 laboratory, the Laboratoire primaire de métrologie des rayonnements ionisants (LM R I), Département des rayonnements ionisants, at the C EA at Saclay:
(a) Two approved calibration centres (Category 2), which deliver certificates recognized officially. The one operating at Saclay is the Centre d’étalonnage des rayonnements ionisants of the Département des rayonnements ionisants. The one at Fontenay-aux-Roses is the Centre d’étalonnage des rayonnements ionisants of the Laboratoire central des industries électriques, which is mostly used by hospitals.
338 OBERHOFER
(b) Three qualified metrology services (SMH) with officially recognized calibration facilities (Category 3). One is at Fontenay-aux-Roses, the Service de métrologie des rayonnements ionisants du STEPPA du Centre d’études nucléaires de Fontenay-aux-Roses. One is at Arcueil, the Service de métrologie des rayonnements ionisants, Etablissement technique central de l’armement (ETCA). The third is at Grenoble, the Service de métrologie du Laboratoire de mesure des rayonnements (LM R ) of the Centre d’études nucléaires de Grenoble.
3.4. Federal Republic of Germany
The situation in the Federal Republic of Germany is characterized by the fact that the Second Ordinance on the Legal Control of Measuring Instruments has now also to be applied to dose meters for photon radiations with energies up to 3 MeV as well as to radiation-protection monitors. A supplement to the Second Ordinance regulates the verification. The calibration work that has to « be undertaken is, at present, being dealt with (or will be dealt with) by verification offices under the authority of the individual federal states, the Lander.In addition, some companies also operate verification dispatch offices (Eichabfertigungsstellen) and semi-official calibration services.
At the moment three verification offices or central calibration laboratories (Eichstellen) are foreseen; one at the Staatliches Materialpriifamt of Nordrhein- Westfalen at Dortmund-Aplerbeck (Landeseichbehôrde Kôln); one at the Nuclear Research Centre Karlsruhe for Baden-Würtemberg, operating on behalf of the Eichaufsicht Stuttgart (already operative); one at the Landesamt für Mass und Gewicht at Munich. There will eventually be another one at the Amt für Mess- und Eichwesen in Berlin.
The calibration laboratories mentioned will operate superregionally, that is they will be available to any dose-meter or health-physics-instrument user in the Federal Republic.
An official verification dispatch office (the calibration laboratory) is operated by the Friesecke and Hoepfner Company in the Erlangen-Nümberg area.
The Gesellschaft für Strahlen- und Umweltforschung mbH in Neuherberg near Munich operates a calibration laboratory that has the character of an SSDL; this service is for medical radiation dose meters. These have to be calibrated at regular intervals according to the X-Ray Ordinance (Rôntgenverordnung) in force since the 9th of March, 1973.
3.5. Ireland
Ireland has the “Oakland” National Radiation Monitoring Service at Dublin: this is not a member of the IAEA/W HO SSD L network.
IAEA-SM-222/62 339
Officially Italy does not have an SSDL. However, C N EN operates, within its Division of Radiation Protection, the Laboratorio di Fisica Sanitaria at Bologna, which fulfils all the prerequisites and requirements for an SSDL.
3.6. Italy
3.7. Luxembourg
There is no dose-meter calibration laboratory in Luxembourg.
3.8. The Netherlands
The Netherlands operates one recognized national personnel dosimetry service. The Radiological Service TNO of the Radiologische Dienst van de Gezondheidsorganisatie at Arnhem may, together with the Research Institute for Electrical Utilities in the Netherlands (KEM A), form a national secondary- standard calibration service in the future.
3.9. United Kingdom
In the United Kingdom, as in the Federal Republic of Germany, one must distinguish between the dissemination schemes set up, or being set up, for the calibration of therapy-level and protection-level instruments, respectively.
In the case of therapeutic dose meters, a nation-wide calibration scheme has been in operation for many years. In this, some 30 hospital physics departments have been officially designated as secondary standardizing centres within the National Health Service. These centres are custodians of secondary standard instruments employed specifically for the calibration of field instruments, but the work of these centres is not subject to external supervision.
In the case of protection instrumentation, certain official organizations, such as the National Radiological Protection Board (NRPB), currently act as secondary standardizing centres, providing calibrations against secondary standard instruments.
The British Calibration Service (BCS), now part of NPL, has recently extended its activities into the radiological field and, in view of the forthcoming, new Ionizing Radiation Regulations, it is anticipated that a nation-wide dissemination scheme will be set up for protection-level calibrations, entailing supervision of all secondary standardizing centres by the British Calibration Service.
340 OBERHOFER
It is certain that more officially recognized and acknowledged Secondary Standard Dosimetry Laboratories will be needed in the near future in order to cope with the demands set out in the various national legislations concerned with the calibration of radiological and radiation-protection instrumentation. For maintaining their secondary standards, these laboratories will regularly have to compare their standards with the ones kept by the Primary Standards Laboratories and will also have to intercompare them amongst themselves, irrespective of the national calibration chains they might belong to. Here the Commission of the
European Communities can assist materially by organizing at proper intervals European intercomparison campaigns.
A C K N O W LED G EM EN T S
The author wishes to thank all those who assisted in preparing the text, in particular, Mr. W.A. Jennings for his information on the present situation in the United Kingdom.
R E F ER E N C E S
[ 1] G U IH O , J.-P., SIM O E N , J.-P., “ D issém ination en F rance des u n ités des grandeurs
utilisées en m étro lo gie des rayo n n em en ts ion isan ts” , these Proceedings, paper
IA E A -S M '2 2 2 /4 9 .
[2] R E IC H , H ., “ C u rrent w o rk in the field o f stand ardization in d o sim etry o f p h oton s
and e lectron s in the F ederal R ep u b lic o f G e rm an y ” , these Proceedings, paper
IA E A -S M -22 2 /32 .
[3] B U S U O L I, G ., L A IT A N O , R .F ., L E M B O , L ., R O T O N D I, E ., “ C alibration o f ion izin g
radiation w ith in the D ivision o f R ad iatio n P ro tectio n o f C N E N , I ta ly ” , these Proceedings,
paper IA E A -S M -22 2 /56 .
[4] JE N N IN G S , -W.A., “ S tan d ardizatio n in radiation d o sim etry in the U nited K in g d o m ” ,
these P roceed in gs, paper IA E A -SM -222/60 .
4. CONCLUDING REMARKS

STANDARDIZATION AND CALIBRATION IN RADIOPROTECTION

IAE A-SM-222/24
INTERNATIONAL STANDARD REFERENCE RADIATIONS AND THEIR APPLICATION TO THE TYPE TESTING OF DOSIMETRIC APPARATUS
I.M.G. THOMPSONCentral Electricity Generating Board,Berkeley Nuclear Laboratories,Berkeley, Gloucestershire,United Kingdom
Abstract
IN T E R N A T IO N A L S T A N D A R D R E F E R E N C E R A D IA T IO N S A N D T H E IR A P P L IC A T IO N
T O T H E T Y P E T E S T IN G O F D O S IM E T R IC A P P A R A T U S .
In recen t years a sign ifican t num ber o f in tern atio n al reco m m en d atio n s have been issued
o r d rafted on the p erfo rm an ce requ irem en ts o f radiation m on itorin g eq u ip m en t and personal
d ose m eters. There has also been an in creasing aw areness at n atio n al level o f the need to
calibrate and evalu ate such eq u ip m en t and in som e cou n tries there are legal requirem en ts fo r
the app roval fo r v er ifica tio n o f radiation p ro te ctio n dose m eters. A ll these reco m m en d atio n s
in clu d e in th eir sp ecificatio n s th e p erm itted variation s o f response to X -rays, gam m a, b eta and
n eutro n radiation s. F o r the eva lu atio n o f eq uip m en t to these sp ecificatio n s to be a d eq u ately
p erfo rm ed it is essential th at n o t o n ly should seco n d ary lab oratories use the sam e radiation s
b u t th at these radiation s shall have been p ro p erly exp lo red and be in tern atio n ally accep ted .
A W orking G ro u p o f the In tern atio n al Standards O rganisation (IS O ) has co m p leted the d raft
d o cu m en t on X and G am m a R efe re n ce R adiatio n s and w o rk is w e ll advanced o n the beta
referen ce radiation s. Prior to ad o p tio n the radiation s w ere p rodu ced at lab oratories in d ifferen t
cou n tries and th e m easured sp ectra w ere in tercom p ared . This rep o rt describes the use o f these
X , y and b eta radiation s fo r the assessm ent o f co m m ercia l d osim etric apparatus. Th e ISO
standard X -radiations can be p ro d u ced b y using filtered X -ray beam s and b y the e xc ita tio n
o f flu o rescen t radiation . A com parison o f in stru m en t resp onses o b tain ed fo r 20% , 30% and
50% reso lu tio n filtered beam s and th e flu o rescen t X -rays is given. T h eir use fo r the assessm ent
o f surface and d ep th dose eq uivalent rate m eters, th e p roblem s o f the m easurem ent o f dose
rate fro m the radiation s and o f relating th e standards to p rim ary standards are also discussed-
S in ce stand ardization fo r its o w n sake is u n accep ta b le , it is im p o rtan t th at the derived b en efits
should b e c lea rly k n o w n b efo re it is un dertaken . W hile the b en efits o f stand ardization in
radiation th erap y and m ed ical d iagnosis are o b v io u s ,'fo r radiation p r o te ctio n th ey are n o t a lw ays
so apparent. T h e advantages and disadvantages o f fo rm u latin g standards fo r the ca lib ratio n and
assessm ent as w e ll as in th e sp ecifica tio n o f h ealth p h ysics in strum en ts are th erefo re discussed,
and con trasted .
343
344 THOMPSON
1. INTRODUCTION
In the field of nuclear detection and measurement there have been, in recent years, a great proliferation of national and international standardising committees. This greater awareness of the need for adequate standards is partly due to the increasing scale of nuclear power operations and medical uses of radiation which have brought about a progressive refinement of the health physics control of the associated radiation hazards- This refinement has led to a more critical interest in the calibration and performance of instruments used to measure radiation exposures.
2. INSTRUMENT PERFORMANCE CRITERIA
A significant number of international recommendations have either been issued or are being drafted on the performance requirements of monitoring equipment and personal dosemeters. Some countries also have legal requirements of varying severity. For example, in the Federal Republic of Germany a regulation states that from January 1st 1977 all radiation protection dosemeters on the market have to be verified if they are used for radiation protection measurements prescribed by law. It is the responsibility of the Physikalisch-Technische Bundesanstalt to perform the tests in which the technical characteristics of the appliance, especially possible causes of measuring errors, will be investigated.
In other countries, such as the UK, the requirements are less specific.An initial draft of possible new UK legislation states, "the employer shall provide and keep readily available for use and properly maintained and appropriately calibrated, sufficient appropriate and efficient radiation dosemeters, contamination monitors, etc., by which appropriate measurements shall be made at such intervals as are necessary for the purpose of ascertaining the efficacy of measures for the restriction of exposure to ionising radiations, contamination, etc". The above was paraphrased from a recent draft and as such had no legal standing at the present time and could possibly be slightly modified.
The frequent reference to appropriate instruments poses the question as to what can be considered as satisfactory instrumentation ánd what constitutes an appropriate calibration. The user should in theory find the answer to these questions in the various international standards that have been or will be issued.
For radioprotection instrumentation we need really only consider the International Organisation for Standardisation (ISO) and the International Electrotechnical Commission (IEC) from amongst the great many organisations involved with standardisation.
The object of both the ISO and the IEC is to facilitate the co-ordination and unification of national standards, mainly with the intention of facilitating international trade. Although their published standards have no legal force as such they are intended to be a guide to the preparation of national standards.
From amongst the many IEC instrumentation standards just two standards have been selected to demonstrate typical requirements. The first one is the IEC 395, 1972 "Portable X or gamma radiation exposure rate meters and monitors" and the other is a Draft Standard on "Beta, X and gamma radiation dose equivalent and dose equivalent rate meters and monitors for use in radiation protection", both are summarised in Table I.This second draft standard has attempted to simplify the International Commission on Radiological Protection requirements to measure doses to different organs by specifying that, for external radiation monitoring, two quantities should be measured.
IAEA-SM-222/24 345
1) The Surface Dose Equivalent rate which is the^average doseequivalent rate between the depth of 5 mg.cm and 10 mg.cmbeneath the surface of a 30 cm sphere of density 1 g. cnT^and of the same atomic composition as soft tissue as defined in the International Commission on Radiation Units and Measurements Report 19.
__2and 2) The Depth Dose Equivalent Rate at a depth of 800 mg. cm for
the same sphere.
The performance requirements for dose equivalent meters and monitors have thus been specified for these two quantities for beta and photon radiations (table I).
If it is considered essential that the monitoring equipment should itself be standardised then it is even more important that the evaluation and calibration techniques should be properly standardised. An evaluation made at one laboratory should yield the same conclusions when the same instrument is evaluated elsewhere. Otherwise it would be possible for a manufacturer to take his equipment from one laboratory to another in the hopes that eventually it will pass the acceptance tests.
3. STANDARD RADIATIONS FOR EVALUATING AND CALIBRATING EQUIPMENT
An earlier ISO Recommendation R1757, 1971, on "Personal Photographic Dosimeters" specifies a series of tests to which the dosimeters should be subjected. An ISO working group was therefore set up to produce a list of reference X and у radiations to be used in these test together with the methods of production. When the terms of reference of the working group were extended to also include radiations for evaluating and calibrating all types of dosemeters, supplementary series for producing lower and higher exposure rates were studied. A document on the beta reference radiations is well advanced and a start has also been made on neutron radiations.
3.1 I.S.Q. X reference radiations
There are two methods adopted for producing X reference radiations.The filtered technique uses filtration of the collimated primary X-ray beam produced by a constant potential X-ray generator. The second method, referred to as the fluorescent technique, uses the same unfiltered primary X-ray beam to excite fluorescent X-rays from different elements (radiators) placed at 45° to the primary beam. A collimated beam of fluorescent radiation is used at right angles to the primary beam and the conventional beam trap surrounding the radiator is removed, the room itself acting as the beam trap.
Prior to the adoption of the reference radiations they were produced at laboratories in France, Germany and the United Kingdom and the measured spectra were intercompared.
3.1.1 I.S.Q. Filtered X Reference Radiations
Three different series have so far been adopted. The first two referred to as the "Narrow Spectrum" and "Wide Spectrum" series were originally developed for the testing of photographic dosimeters. When the terms of reference of the working group were extended to provide radiations for the testing of all dosemeters a more narrow third series, referred to as the "Low Exposure Rate" series, was included. Further work is in hand on a fourth series for calibration at even higher exposure rates.
T h e s e two quantities are:-
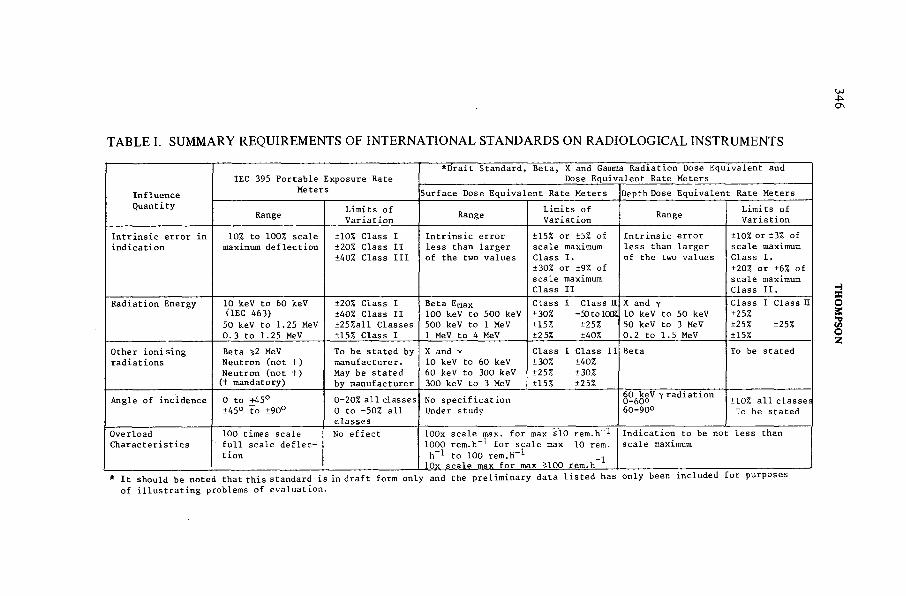
T A B L E I. SU M M A R Y R E Q U IR E M E N T S OF IN T E R N A T IO N A L ST A N D A R D S O N R A D IO L O G IC A L IN ST R U M E N T S
InfluenceQuantity
IEC 395 Portable Exposure Rate Meters
*Draft Standard, Beta, X and Gamma Radiation Dose Equivalent and Dose Equivalent Rate Meters
Surface Dose Equivalent Rate Meters Depth Dose Equivalent Rate Meters
RangeLimits of Variation
RangeLimits of Variation
RangeLimits of Variation
Intrinsic error in indication
10% to 100% scale maximum deflection
±10% Class I ±20% Class II ±40% Class III
Intrinsic error less than larger of the two values
±15% or ±5% of scale maximum Class I.±30% or ±9% of scale maximum Class II
Intrinsic error less than larger of the two values
±10% or ±3% of scale maximum Class I.±20% or ±6% of scale maximum Class II.
Radiation Energy 10 keV to 60 keV (IEC 463)50 keV to 1.25 MeV 0.3 to 1.25 MeV
±20% Class I ±40% Class II ±25%all Classes ±15% Class I
Beta Emax100 keV to 500 keV500 keV to 1 MeV 1 MeV to 4 MeV
Class I Class Я ±30% -50 to 10CK ±15% ±25%±2 5% ±40%
X and у10 keV to 50 keV 50 keV to 3 MeV 0.2 to 1.5 MeV
Class I Class П±25%±25% ±25% ±15%
Other ionising radiations
Beta ^2 MeV Neutron (not t) Neutron (not f) (t mandatory)
To be stated by manufacturer. May be stated by manufacturer
X and у10 keV to 60 keV 60 keV to 300 keV 300 keV to 3 MeV
Class I Class II±30% ±40%±25% ±30%±15% ±25%
Beta To be stated
Angle of incidence 0 to +45° ±45° to ±90°
0-20% all classes 0 to -50% all classes
No specification Under study
60 keV y radiation 0-60°60-90°
±10% all classes To be stated
OverloadCharacteristics
100 times scale full scale deflection
No effect lOOx scale max. for max $10 rem.h”-*- 1000 rem.h"1 for scale max 10 rem.h ̂ to 100 rem.H- ̂lOx scale max for max 5100 rem.h
Indication to be not less than scale maximum
* It should be noted that this standard is in draft form only and the preliminary data listed has only been included for purposes
of illustrating problems of evaluation.
346 T
HO
MP
SO
N
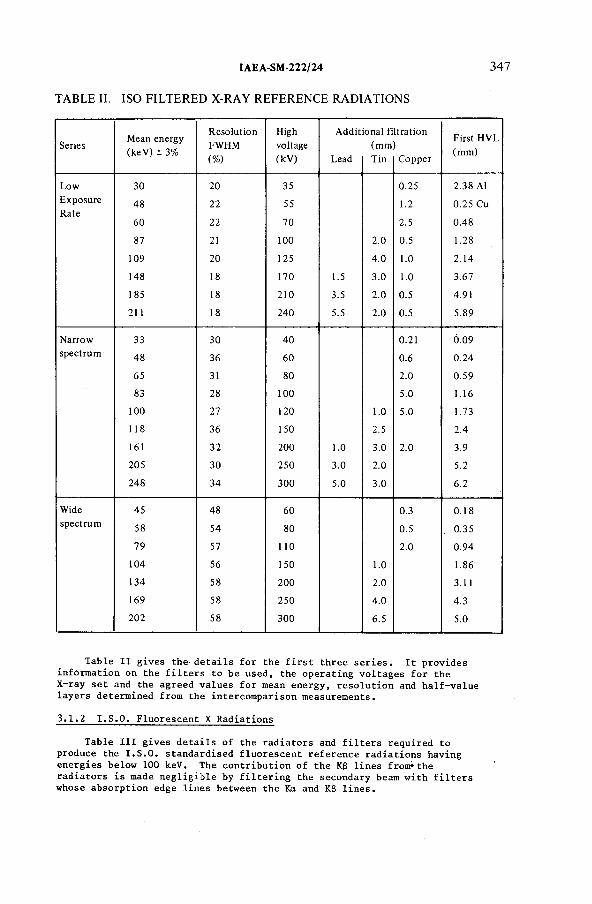
IAEA-SM-222/24
TABLE II. ISO FILTERED X-RAY REFERENCE RADIATIONS
347
SeriesMean energy (keV ) ± 3%
Resolution
FWHM
(%)
High
voltage(kV )
Addit
Lead
Юnal fi
(mm
Tin
Itration
Copper
First H VL
(mm)
Low 30 20 35 0.25 2.38 A l
Exposure 48 22 55 1.2 0.25 CuRate
60 22 70 2.5 0.48
87 21 100 2.0 0.5 1.28
109 20 125 4.0 1.0 2.14
148 18 170 1.5 3.0 1.0 3.67
185 18 210 3.5 2.0 0.5 4.91
211 18 240 5.5 2.0 0.5 5.89
Narrow 33 30 40 0.21 0.09spectrum 48 36 60 0.6 0.24
65 31 80 2.0 0.59
83 28 100 5.0 1.16
100 27 120 1.0 5.0 1.73
118 36 150 2.5 2.4
161 32 200 1.0 3.0 2.0 3.9
205 30 250 3.0 2.0 5.2
248 34 300 5.0 3.0 6.2
Wide 45 48 60 0.3 0.18spectrum 58 54 80 0.5 0.35
79 57 110 2.0 0.94
104 56 150 1.0 1.86
134 58 200 2.0 3 .11
169 58 250 4.0 4.3
202 58 300 6.5 5.0
Table II gives the details for the first three series. It provides information on the filters to be used, the operating voltages for the X-ray set and the agreed values for mean energy, resolution and half-value layers determined from the intercomparison measurements.
3.1.2 I.S.O. Fluorescent X Radiations
Table III gives details of the radiators and filters required to produce the I.S.O. standardised fluorescent reference radiations having energies below 100 keV. The contribution of the K$ lines from*the radiators is made negligible by filtering the secondary beam with filters whose absorption edge lines between the Ka and КЗ lines.
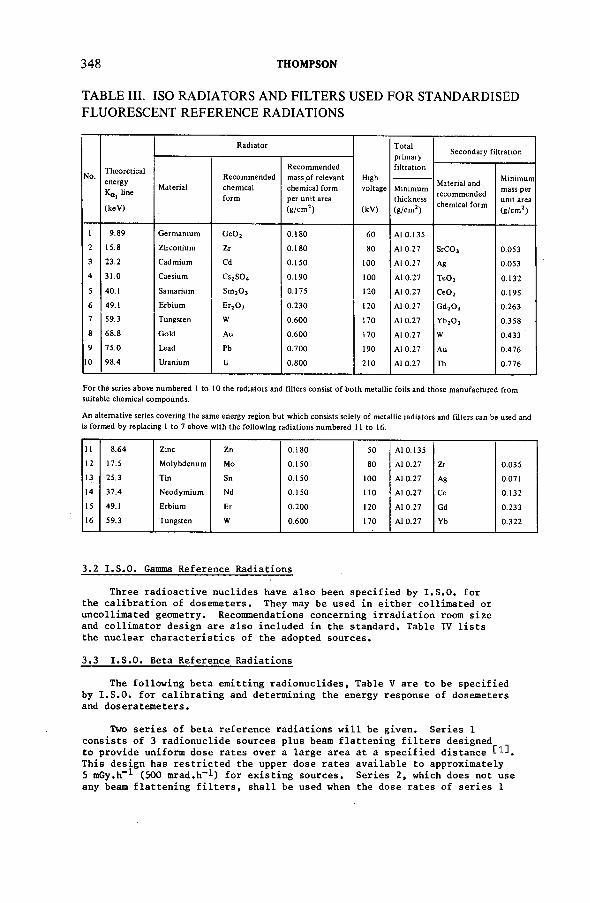
348 THOMPSON
T A B LE III. ISO R A D IA T O R S A N D F ILT E R S U SED FO R ST A N D A R D ISE D F LU O R ESC EN T R E F E R E N C E R A D IA T IO N S
No. Theoreticalenergy
line
(keV)
Radiator
Highvoltage
(kV)
Totalprimaryfiltration
Secondary filtration
MaterialRecommendedchemicalform
Recommended mass o f relevant chemical form per unit area(g/cm 2)
Material and recommended chemical form
Minimum mass per unit area (g/cm 3)
Minimumthickness(g/cm 2)
1 9.89 Germanium GeOj 0.180 60 Al 0.1352 15.8 Zirconium Zr 0.180 80 Al 0.27 SrC03 0.0533 23.2 Cadmium Cd 0.150 100 Al 0.27 Ag 0.0534 31.0 Caesium Cs2S04 0.190 100 Al 0.27 T e02 0.1325 40.1 Samarium SmjOa 0.175 120 Al 0.27 C e02 0.1956 49.1 Erbium Er20 3 0.230 120 Al 0.27 Gd20 3 0.2637 59.3 Tungsten W 0.600 170 Al 0.27 Vb2o 3 0.3588 68.8 Gold Au 0.600 170 Al 0.27 w 0.4339 75.0 Lead Pb 0.700 190 Al 0.27 Au 0.476
10 98.4 Uranium U 0.800 210 Al 0.27 Th 0.776
For the series above numbered 1 to 10 the radiators and filters consist o f both metallic foils and those manufactured from suitable chemical compounds.
An alternative series covering the same energy region but which consists solely o f metallic radiators and filters can be used and is formed by replacing 1 to 7 above with the following radiations numbered 11 to 16.
11 8.64 Zinc Zn 0.180 50 Al 0.13512 17.5 Molybdenum Mo 0.150 80 Al 0.27 Zr 0.03513 25.3 Tin Sn 0.150 too Al 0.27 Ag 0.07114 37.4 Neodymium Nd 0.150 110 Al 0.27 Ce 0.13215 49.1 Erbium Er 0.200 120 Al 0.27 Gd 0.23316 59.3 Tungsten W 0.600 170 Al 0.27 Yb 0.322
3.2 I.S.O. Gamma Reference Radiations
Three radioactive nuclides have also been specified by I.S.O. for the calibration of dosemeters. They may be used in either collimated or uncollimated geometry. Recommendations concerning irradiation room size and collimator design are also included in the standard. Table IV lists the nuclear characteristics of the adopted sources.
3.3 I.S.O. Beta Reference Radiations
The following beta emitting radionuclides, Table V are to be specified by I.S.O. for calibrating and determining the energy response of dosemeters and doseratemeters.
Two series of beta reference radiations will be given. Series 1 consists of 3 radionuclide sources plus beam flattening filters designed to provide uniform dose rates over a large area at a specified distance Е1]. This design has restricted the upper dose rates available to approximately5 mGy.h- ! (500 mrad.h-!) for existing sources. Series 2, which does not use any beam flattening filters, shall be used when the dose rates of series 1
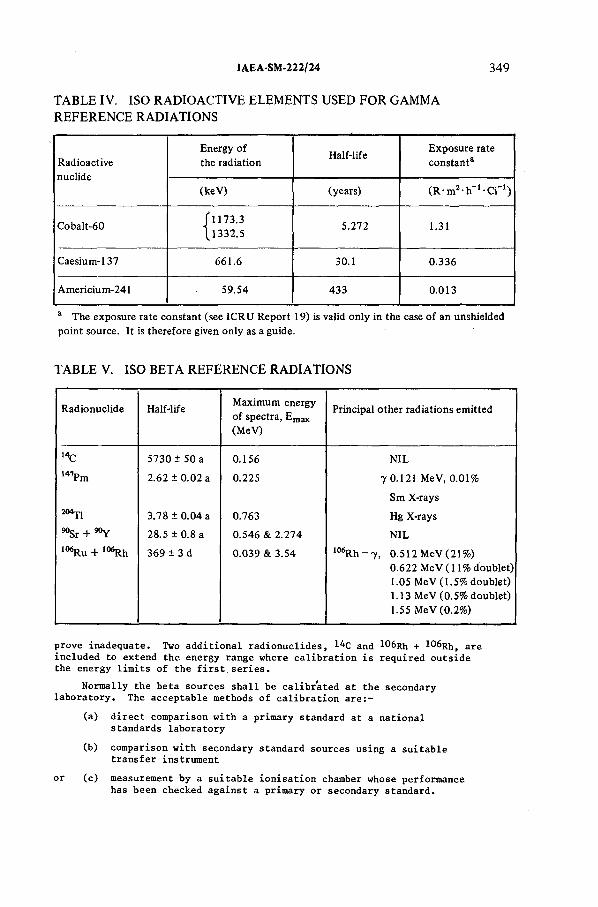
IAEA-SM-222/24 349
T A B L E IV. ISO R A D IO A C T IV E E LEM EN T S U SED FO R G A M M A R E F E R E N C E R A D IA T IO N S
R ad io active
nu clid e
E n ergy o f
the radiationH alf-life
E x p o su re rate
co n stan t3
(k e V ) (years) ( R m 2 - h ' 1 - c r I)
C o balt-60f 1 1 7 3 .3
\ l 3 3 2 . 55 .2 7 2 1.3 1
C aesiu m -13 7 6 6 1 .6 30.1 0 .336
A m ericiu m -2 41 5 9 .5 4 433 0 .0 13
a T h e exp osu re rate co n stan t (see IC R U R ep o rt 19 ) is valid o n ly in the case o f an unshielded
p o in t source. It is th erefo re given o n ly as a guide.
T A B L E V. ISO B ET A R E F E R E N C E R A D IA T IO N S
R ad io n u clid e H alf-lifeM axim um en ergy
o f spectra, E max
(M eV )
Principal o th er rad ia tio n s em itted
14C 5 7 3 0 ± 50 a 0 .15 6 N IL
147Pm 2.62 ± 0 .0 2 a 0.225 y 0 .12 1 M eV , 0 .0 1%
Sm X -rays
2МП 3 .7 8 ± 0 .0 4 a 0.763 Hg X -rays
^ S r + *°Y 28.5 ± 0.8 a 0 .546 & 2 .2 7 4 N IL
106R u + 106R h 369 ± 3 d 0.039 & 3 .54 106R h — 7 , 0 .5 1 2 M eV (2 1 % )
0 .622 M eV ( 1 1 % d o u blet)
1.0 5 M eV (1 .5 % d o u b let)
1 .1 3 M eV (0 .5 % d o u b let)
1 .5 5 M eV (0 .2% )
prove inadequate. Two additional radionuclides, l^C and 106Rh + **^Rh, are included to extend the energy range where calibration is required outside the energy limits of the first series.
Normally the beta sources shall be calibrated at the secondary laboratory. The acceptable methods of calibration are:-
(a) direct comparison with a primary standard at a national standards laboratory
(b) comparison with secondary standard sources using a suitable transfer instrument
or (c) measurement by a suitable ionisation chamber whose performance has been checked against a primary or secondary standard.
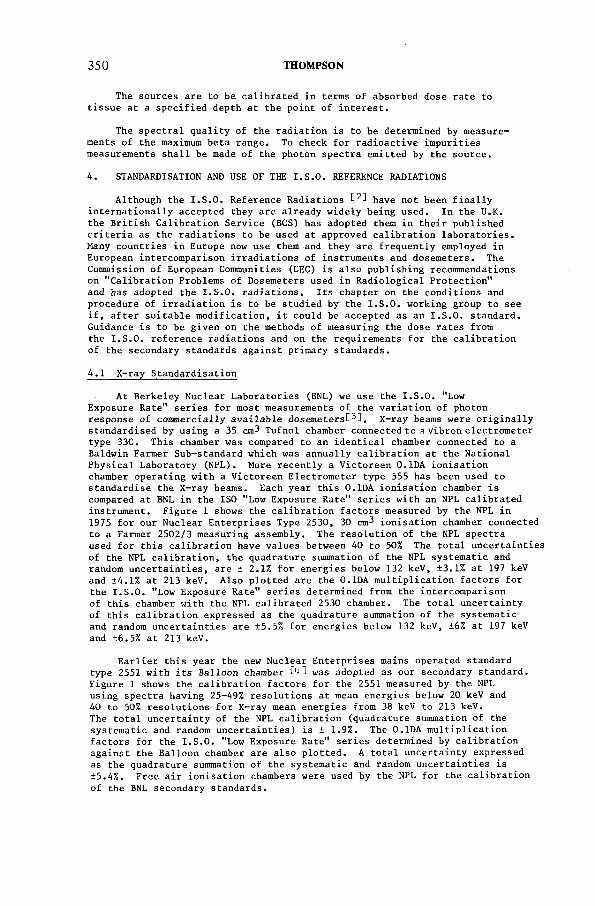
350 THOMPSON
The sources are to be calibrated in terms of absorbed dose rate to tissue at a specified depth at the point of interest.
The spectral quality of the radiation is to be determined by measurements of the maximum beta range* To check for radioactive impurities measurements shall be made of the photon spectra emitted by the source.
4. STANDARDISATION AND USE OF THE I.S.O. REFERENCE RADIATIONS
Although the I.S.O. Reference Radiations have not been finally internationally accepted they are already widely being used. In the U.K. the British Calibration Service (BCS) has adopted them in their published criteria as the radiations to be used at approved calibration laboratories.Many countries in Europe now use them and they are frequently employed in European intercomparison irradiations of instruments and dosemeters. The Commission of European Communities (CEC) is also publishing recommendations on "Calibration Problems of Dosemeters used in Radiological Protection*1 and has adopted the I.S.O. radiations. Its chapter on the conditions and procedure of irradiation is to be studied by the I.S.O. working group to see if, after suitable modification, it could be accepted as an I.S.O. standard. Guidance is to be given on the methods of measuring the dose rates from the I.S.O. reference radiations and on the requirements for the calibration of the secondary standards against primary standards.
4.1 X-ray Standardisation
At Berkeley Nuclear Laboratories (BNL) we use the I.S.O. "Low Exposure Rate" series for most measurements of the variation of photon response of commercially available dosemetersC3^. X-ray beams were originally standardised by using a 35 cm3 Tufnol chamber connected to a Vibron electrometer type 33C. This chamber was compared to an identical chamber connected to a Baldwin Farmer Sub-standard which was annually calibration at the National Physical Laboratory (NPL). More recently a Victoreen 0.1DA ionisation chamber operating with a Victoreen Electrometer type 555 has been used to standardise the X-ray beams. Each year this 0.1DA ionisation chamber is compared at BNL in the ISO "Low Exposure Rate" series with an NPL calibrated instrument. Figure 1 shows the calibration factors measured by the NPL in 1975 for our Nuclear Enterprises Type 2530, 30 cm^ ionisation chamber connected to a Farmer 2502/3 measuring assembly. The resolution of the NPL spectra used for this calibration have values between 40 to 50% The total uncertainties of the NPL calibration, the quadrature summation of the NPL systematic and random uncertainties, are ± 2.1% for energies below 132 keV, ±3.1% at 197 keV and ±4.1% at 213 keV. Also plotted are the 0.1DA multiplication factors for the I.S.O. "Low Exposure Rate" series determined from the intercomparison of this chamber with the NPL calibrated 2530 chamber. The total uncertainty of this calibration expressed as the quadrature summation of the systematic and random uncertainties are ±5.5% for energies below 132 keV, ±6% at 197 keV and ±6.5% at 213 keV.
Earlier this year the new Nuclear Enterprises mains operated standard type 2551 with its Balloon chamber С43 was adopted as our secondary standard. Figure 1 shows the calibration factors for the 2551 measured by the NPL using spectra having 25-49% resolutions at mean energies below 20 keV and 40 to 50% resolutions for X-ray mean energies from 38 keV to 213 keV.The total uncertainty of the NPL calibration (quadrature summation of the systematic and random uncertainties) is ± 1.9%. The 0.1DA multiplication factors for the I.S.O. "Low Exposure Rate" series determined by calibration against the Balloon chamber are also plotted. A total uncertainty expressed as the quadrature summation of the systematic and random uncertainties is ±5.4%. Free air ionisation chambers were used by the NPL for the calibration of the BNL secondary standards.
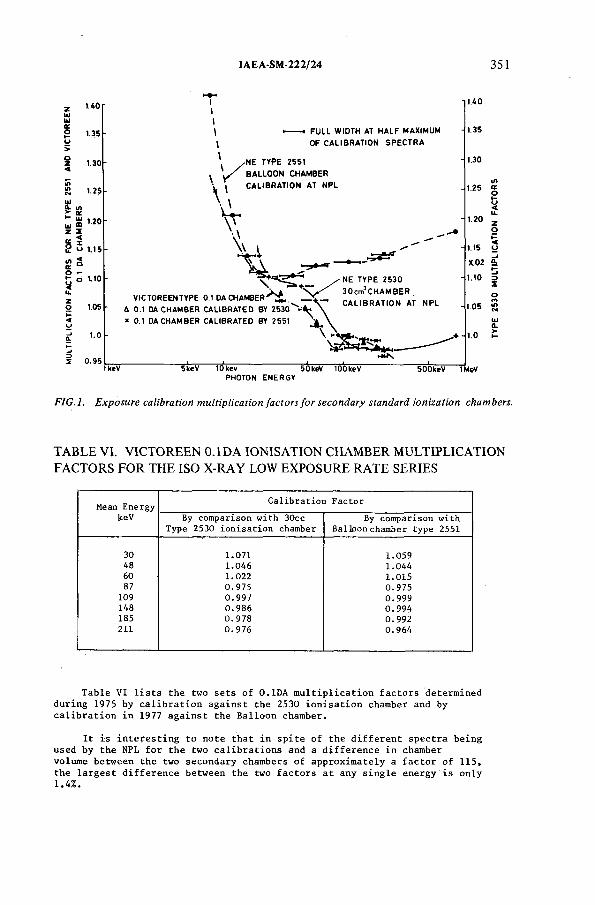
IAEA-SM-222/24 351
FIG.l. Exposure calibration multiplication factors for secondary standard ionization chambers.
T A B L E VI. V IC T O R E E N 0.1 D A IO N ISA T IO N C H A M B E R M U LT IP L IC A T IO N FA CTO RS FO R TH E ISO X -R A Y LOW EX PO SU R E R A T E SE R IE S
Mean Energy keV
Calibration Factor
By comparison with 30cc Type 2530 ionisation chamber
By comparison with Balloon chamber type 2551
30 1.071 1.05948 1.046 1.04460 1.022 1.01587 0.975 0.975
109 0.997 0.999148 0.986 0.994185 0.978 0.992211 0.976 0.964
Table VI lists the two sets of 0.1DA multiplication factors determined during 1975 by calibration against the 2530 ionisation chamber and by calibration in 1977 against the Balloon chamber.
It is interesting to note that in spite of the different spectra being used by the NPL for the two calibrations and a difference in chamber volume between the two secondary chambers of approximately a factor of 115, the largest difference between the two factors at any single energy is only 1.4%.
TYPE
25
30
MU
LTIP
LIC
AT
ION
F
AC
TO
RS
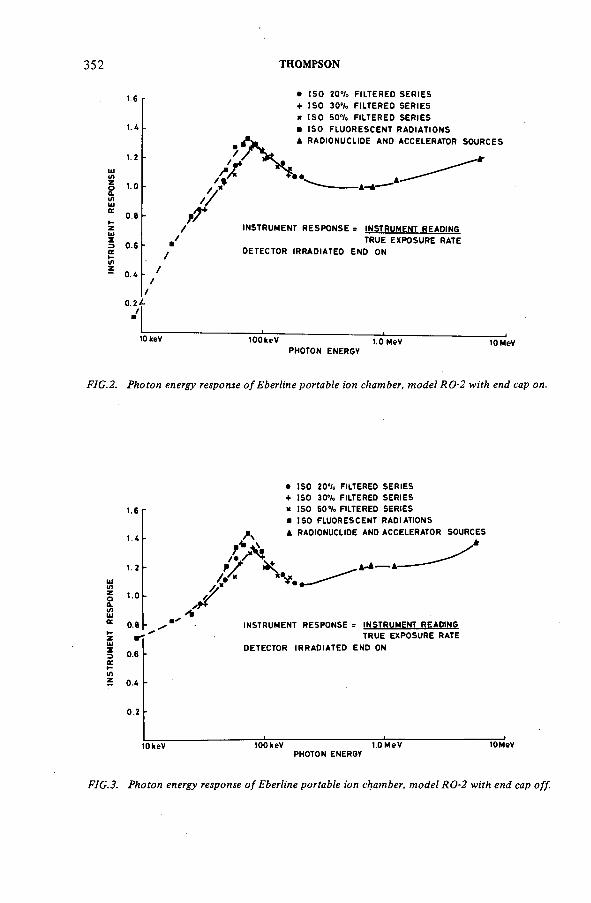
INST
RU
ME
NT
R
ESP
ON
SE
INST
RU
ME
NT
R
ES
PO
NS
E
352 THOMPSON
• I S O 20°/o F IL T E R E D S E R IE S
♦ I S O 3 0 % F IL T E R E D S E R IE S
x I S O 50°/» F IL T E R E D S E R IE S
■ I S O F L U O R E S C E N T R A D IA T IO N S
/ IN ST R U M E N T R E S P O N S E = IN ST R U M EN T R E A D IN G
TRU E E X P O S U R E RATE
D ET E C T O R IR R A D IA T E D E N D ON
/0 .2 -
/■
W keV lO O keV 1.0 MeV lO M eVPHOTON ENERG Y
. Photon energy response of Eberline portable ion chamber, model RO-2 with end cap on.
1.6
1.4
1. 2
1.0
0.8я
0.6
0.4
0.2
AJk
• IS O 20°/. F ILTERED S E R IE S* IS O 30°/° F ILTERED S E R IE S
« IS O 5 0 % F ILTERED S E R IE S
■ IS O F LU O R E SC EN T R A D IA T IO N S
i RAD IO N U CL IDE AND A C CELER A T O R SO U R C E S
/ .
УIN ST R U M EN T R E S P O N S E « IN ST R U M EN T R E A D IN G
T R U E E X P O SU R E RATE
D ETEC TO R IR R A O IA T E D E N D ON
10keV 100keV 1.0 M e VPHOTON ENERGY
lOMeV
FIG.3. Photon energy response of Eberline portable ion chamber, model RO-2 with end cap off.
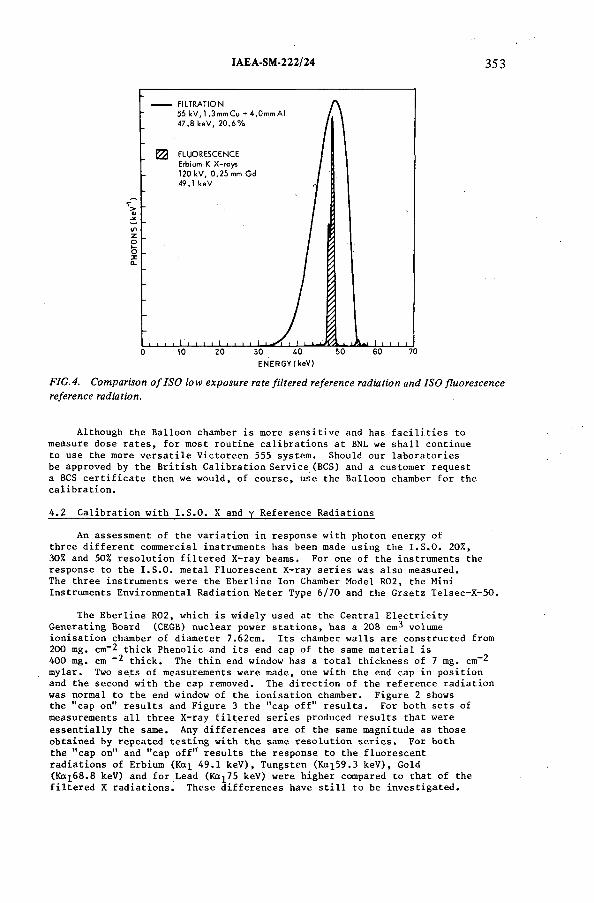
IAEA-SM-222/24 353
F I G . 4. C o m p a r iso n o f I S O lo w e x p o s u r e ra te f i l t e r e d r e fe r e n c e r a d ia tio n a n d I S O f lu o r e s c e n c e
r e fe r e n c e ra d ia tio n .
Although the Balloon chamber is more sensitive and has facilities to measure dose rates, for most routine calibrations at BNL we shall continue to use the more versatile Victoreen 555 system. Should our laboratories be approved by the British Calibration Service (BCS) and a customer request a BCS certificate then we would, of course, use the Balloon chamber for the calibration.
4.2 Calibration with I.S.O. X and y Reference Radiations
An assessment of the variation in response with photon energy ofthree different commercial instruments has been made using the I.S.O. 20%,30% and 50% resolution filtered X-ray beams. For one of the instruments the response to the I.S.O. metal Fluorescent X-ray series was also measured.The three instruments were the Eberline Ion Chamber Model R02, the Mini Instruments Environmental Radiation Meter Type 6/70 and the Graetz Telsec-X-50.
The Eberline R02, which is widely used at the Central ElectricityGenerating Board (CEGB) nuclear power stations, has a 208 cm^ volumeionisation chamber of diameter 7.62cm. Its chamber walls are constructed from 200 mg. cm-2 thick Phenolic and its end cap of the same material is 400 mg. cm ”2 thick. The thin end window has a total thickness of 7 mg. cm~2 mylar. Two sets of measurements were made, one with the end cap in position and the second with the cap removed. The direction of the reference radiation was normal to the end window of the ionisation chamber. Figure 2 shows the "cap on" results and Figure 3 the "cap off" results. For both sets of measurements all three X-ray filtered series produced results that were essentially the same. Any differences are of the same magnitude as those obtained by repeated testing with the same resolution series. For both the "cap on" and "cap off" results the response to the fluorescent radiations of Erbium (Ka^ 49.1 keV), Tungsten (Kai59.3 keV), Gold (Ка̂бв.в keV) and for Lead (Ka^75 keV) were higher compared to that of the filtered X radiations. These differences have still to be investigated.
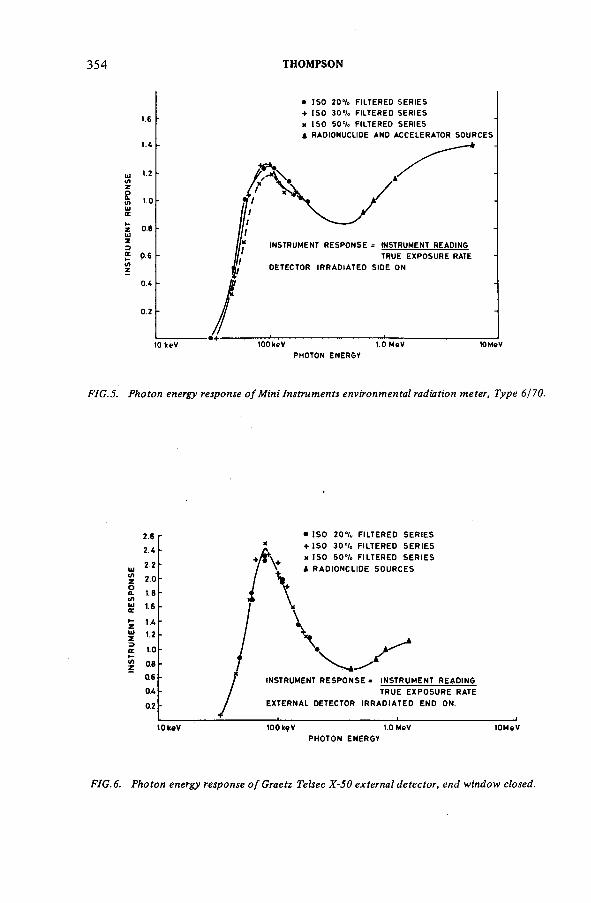
354 THOMPSON
• ISO 20e/e FILTERED SERIES + ISO 30°/e FILTERED SERIES
1 ' x ISO 50% FILTERED SERIES4 RADIONUCLIDE AND ACCELERATOR SOURCES
1.4 - *
tOkeV 100keV 1.0 MeV 10MeVPHOTON ENER&V
F I G . 5. P h o to n en erg y r e sp o n se o f M in i I n str u m e n ts e n v ir o n m e n ta l ra d ia tio n m e te r, T y p e 6 / 7 0.
2.62.4 2.2 2.0 1.6 1.61.4 1.2 1.0 asQ60.40.2
• ISO 20°/o FILTERED SERIES + IS0 307* FILTERED SERIES к ISO 50 е/. FILTERED SERIES á RADIONCLIDE SOURCES
INSTRUMENT RESPONSE « INSTRUMENT READINGTRUE EXPOSURE RATE
EXTERNAL DETECTOR IRRADIATED END ON.
10keV 100 keV 1.0 MeVPHOTON ENERGY
F I G . 6. P h o t o n en erg y r e s p o n s e o f G r a e tz T e ls e c X - 5 0 e x te r n a l d e te c to r , e n d w in d o w c lo s e d .
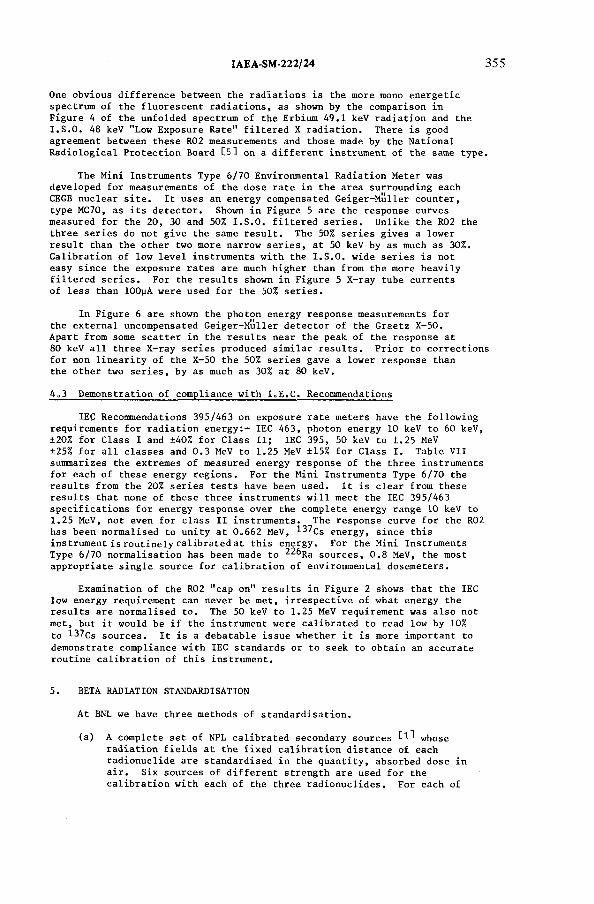
IAEA-SM-222/24 355
One obvious difference between the radiations is the more mono energetic spectrum of the fluorescent radiations, as shown by the comparison in Figure 4 of the unfolded spectrum of the Erbium 49.1 keV radiation and the I.S.O. 48 keV "Low Exposure Rate" filtered X radiation. There is good agreement between these R02 measurements and those made by the National Radiological Protection Board C51 on a different instrument of the same type.
The Mini Instruments Type 6/70 Environmental Radiation Meter was developed for measurements of the dose rate in the area surrounding each CEGB nuclear site. It uses an energy compensated Geiger-Muller counter, type MC70, as its detector. Shown in Figure 5 are the response curves measured for the 20, 30 and 50% I.S.O. filtered series. Unlike the R02 the three series do not give the same result. The 50% series gives a lower result than the other two more narrow series, at 50 keV by as much as 30%. Calibration of low level instruments with the I.S.O. wide series is not easy since the exposure rates are much higher than from the more heavily filtered series. For the results shown in Figure 5 X-ray tube currents of less than lOOyA were used for the 50% series.
In Figure 6 are shown the photon energy response measurements for the external uncompensated Geiger-Muller detector of the Graetz X-50.Apart from some scatter in the results near the peak of the response at 80 keV all three X-ray series produced similar results. Prior to corrections for non linearity of the X-50 the 50% series gave a lower response than the other two series, by as much as 30% at 80 keV.
4o3 Demonstration of compliance with I 0E.C. Recommendations
IEÇ Recommendations 395/463 on exposure rate meters have the following requirements for radiation energy:- IEC 463, photon energy 10 keV to 60 keV, ±20% for Class I and ±40% for Class II; IEC 395, 50 keV to 1.25 MeV±25% for all classes and 0.3 MeV to 1.25 MeV ±15% for Class I. Table VIIsummarizes the extremes of measured energy response of the three instruments for each of these energy regions. For the Mini Instruments Type 6/70 the results from the 20% series tests have been used. It is clear from theseresults that none of these three instruments will meet the IEC 395/463specifications for energy response over the complete energy range 10 keV to 1.25 MeV, not even for class II instruments. The response curve for the R02 has been normalised to unity at O e662 MeV, l ^ C s energy, since this instrument is routinely calibrated at this energy. For the Mini Instruments Type 6/70 normalisation has been made to ^ ^ R a sources> o.8 MeV, the most appropriate single source for calibration of environmental dosemeters.
Examination of the R02 "cap on" results in Figure 2 shows that the IEClow energy requirement can never be met, irrespective of what energy theresults are normalised to. The 50 keV to 1.25 MeV requirement was also not met, but it would be if the instrument were calibrated to read low by 10% to 137Cs sources. It is a debatable issue whether it is more important to demonstrate compliance with IEC standards or to seek to obtain an accurate routine calibration of this instrument.
5. BETA RADIATION STANDARDISATION
At BNL we have three methods of standardisation.
(a) A complete set of NPL calibrated secondary sources whoseradiation fields at the fixed calibration distance of eachradionuclide are standardised in the quantity, absorbed dose in air. Six sources of different strength are used for the calibration with each of the three radionuclides. For each of
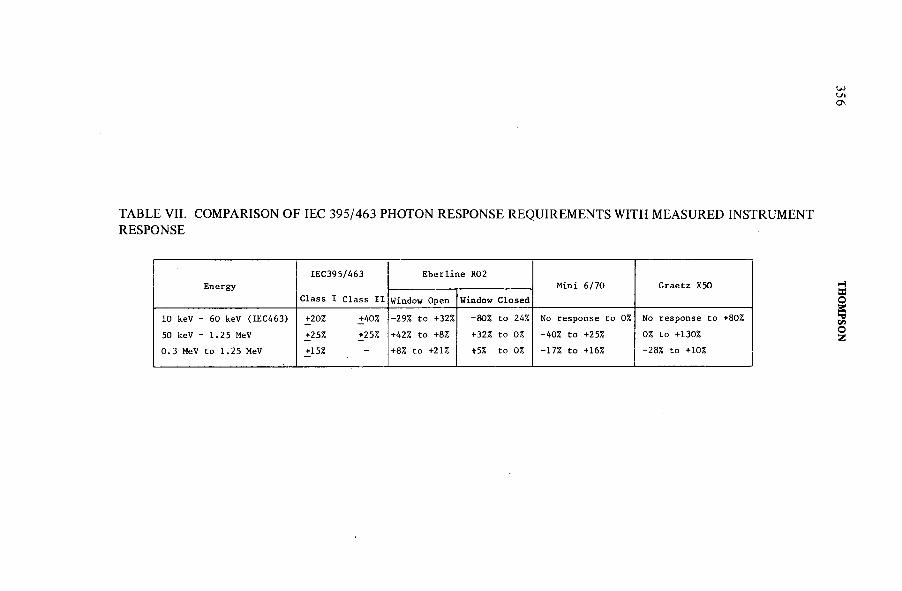
TABLE VII. COMPARISON OF IEC 395/463 PHOTON RESPONSE REQUIREMENTS WITH MEASURED INSTRUMENT RESPONSE
EnergyIEC395/463
Class X Class II
Eberline R02Mini 6/70 Graetz X50
Window Open Window Closed
10 keV - 60 keV (IEC463)
50 keV - 1.25 MeV
0.3 MeV to 1.25 MeV
+20% +40%
+25% +25%
+15%
-29% to +32%
+42% to +8%
+8% to +21%
-80% to 24%
+32% to 0%
+5% to 0%
No response to 0%
-40% to +25%
-17% to +16%
No response to +80%
0% to +130%
-28% to +10%
356 TH
OM
PSON
IAEA-SM-222/24 357
the radionuclides the total random uncertainty at the 99% confidence limits and the total systematic uncertainty of the calibration were as follows. For ^Sr/^Oy sources the random uncertainty varied from ±4.6 to ±0.6% and the systematic was ±2.5%. For 204x i the random uncertainty was from ±5.3% to ±0.9% and the systematic was ±2.5%, whilst for 147pm random uncertainties varied from ±2.9 to ±0.7% with a systematic error of ±3.5%.
(b) A tissue equivalent extrapolation ionisation chamber which has been used to measure the absorbed dose to tissue at varous distances from commercially available sources. Sources calibrated by this chamber have also been calibrated by the NPL. Both the BNL and the NPL calibration have a total uncertainty of ±3.4%for the 90дг/90у sources, ±3.8% for the 204x i sources and +6.0% for 147Pm. The agreement between the calibration at the two laboratories was within these uncertainties.
(c) A unique extrapolation ionisation chamber for the measurement of the dose rate to air that can be readily adapted to measure the dose rate in other media С6] [7].
5.1 Beta Radiation Calibration
The first two methods of standardisation, (a) and (b) have been used for the calibration of the Eberline R02 for the three radionuclides 9 0 s r /9 0 Y , 204ц and 147P m .
For method (a) the R02 was placed with its 7 mg.cm”2 Mylar end window at the fixed NPL calibration distances from the I.S.O. Series 1 reference sources. A calibration distance of 30 cm is used for the 90Sr/90Y and 204T i sources and 20 cm for the 1^7pm sources. Following the detailed calibration procedure given in the NPL certificate corrections are made for the variation of dose rate with effective chamber depth.
This method of calibration derives instrument calibration factors by which the instrument indication must be multiplied to equal the calibrated dose rate in air. For six different R02*s we obtained the following mean calibration factors.
9°sr/90Y 1.04
204T i 2.17
l^7Pm 9.9
For method (b) the R02 was positioned centrally above the commercial Radiochemical Centre sources at various distances from 1 cm to 30 cm from the source surfaces to the front end window of the instrument. The sources have the following active areas 90$г/90у 37.5 cm2, 204x1 12.6 cm2, and 147pm 25 cm2 ancj t{,e r q 2 end window area is 45.4 cm^. The response at each distance has been expressed as the instrument reading in R.h~l divided by the calibration dose rate to tissue in rads.h-! at that distance. Calibration dose rates have been measured by the tissue equivalent extrapolation ionisation chamber which measures the absorbed dose rate at a depth of 7 mg.cm”2.
Figure 7 shows these calibration results. When the R02 end window is closer to the source than 12 cm the response for all three sources falls off rapidly with decreasing distance. This decrease in response is probably due to the larger area of the detector compared to the source areas as well as to the very rapid decrease in dose rate
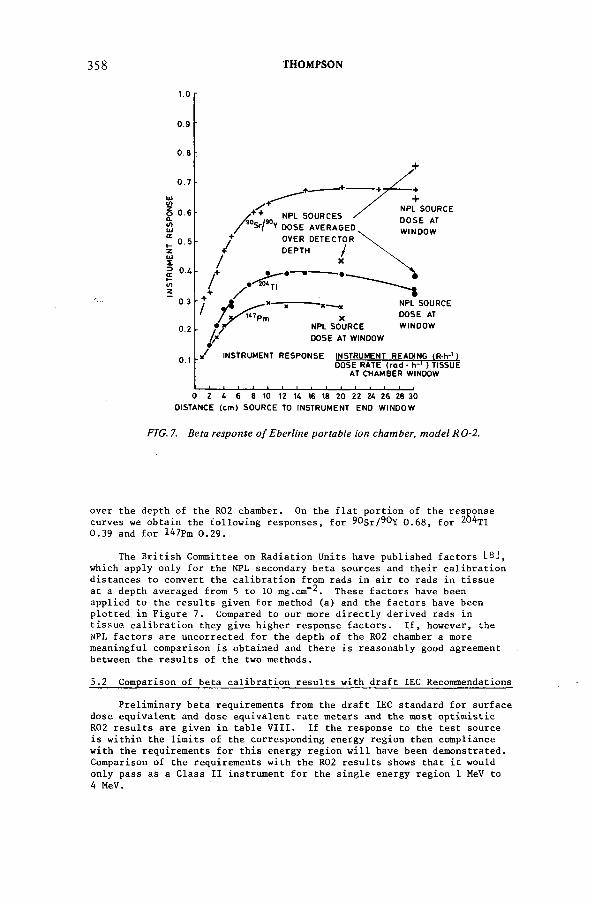
358 THOMPSON
1.0
0.9
0.8
0.7
ô 0.6
0.5
I 0.Л
0.3
0.2
NPL SOURCESOuY OOSE AVERAGED
NPL SOURCE DOSE AT WINDOW
«f+
NPL SOURCE DOSE AT WINDOW
NPL SOURCE DOSE AT WINDOW
INSTRUMENT RESPONSE INSTRUMENT READING (frh-1 ) OOSE RATE (rod • h-1 ) TISSUE
AT CHAMBER WINDOW
О 2 A 6 8 10 12 W 16 18 20 22 24 26 28 30DISTANCE (cm) SOURCE ТО INSTRUMENT END WINDOW
F I G . 7. B e ta r e s p o n s e o f E b e r lin e p o r ta b le io n c h a m b e r, m o d e l R O -2 .
over the depth of the R02 chamber. On the flat portion of the response curves we obtain the following responses, for 90sr/90y 0.68, for0.39 and for 147pm 0.29.
The British Committee on Radiation Units have published factors E8], which apply only for the NPL secondary beta sources and their calibration distances to convert the calibration from rads in air to rads in tissue at a depth averaged from 5 to 10 mg.cm”̂. These factors have been applied to the results given for method (a) and the factors have been plotted in Figure 7. Compared to our more directly derived rads in tissue calibration they give higher response factors. If, however, the NPL factors are uncorrected for the depth of the R02 chamber a more meaningful comparison is obtained and there is reasonably good agreement between the results of the two methods.
5.2 Comparison of beta calibration results with draft IEC Recommendations
Preliminary beta requirements from the draft IEC standard for surface dose equivalent and dose equivalent rate meters and the most optimistic R02 results are given in table VIII. If the response to the test source is within the limits of the corresponding energy region then compliance with the requirements for this energy region will have been demonstrated. Comparison of the requirements with the R02 results shows that it would only pass as a Class II instrument for the single energy region 1 MeV to 4 MeV.
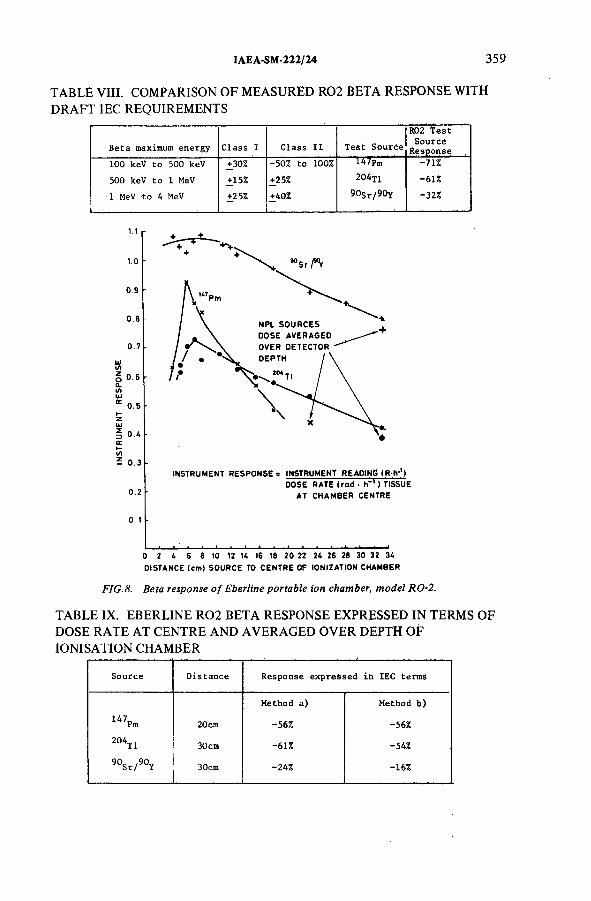
IAEA-SM-222/24 359
TABLE VIII. COMPARISON OF MEASURED R 02 BETA RESPONSE WITH DRAFT IEC REQUIREMENTS
Beta maximum energy Clasô 1 Class II Test Sourte
R02 Test Sourcé
Response
100 keV to 500 keV +30% -50% to 100% l4}pm -71%
500 keV to 1 MeV +15% +25% 2o 4t 1 -61%
+25% +40% 90Sr/90Y -32%
DISTANCE (cm) SOURCE TO CENTRE Of IONIZATION CHAMBER
F I G . 8. B e ta r e s p o n s e o f E b e r lin e p o r ta b le io n ch a m b er , m o d e l R O -2 .
TABLE IX. EBERLINE R 0 2 BETA RESPONSE EXPRESSED IN TERMS OF DOSE RATE AT CENTRE AND AVERAGED OVER DEPTH OE IONISATION CHAMBER
Source Distance Response expressed in IEC terms
Method a) Method b)
U 7 Pm 20 cm -56% -56%
2°4Ti30cm -61% -54%
90Sr/90Y 30cm -24% -16%
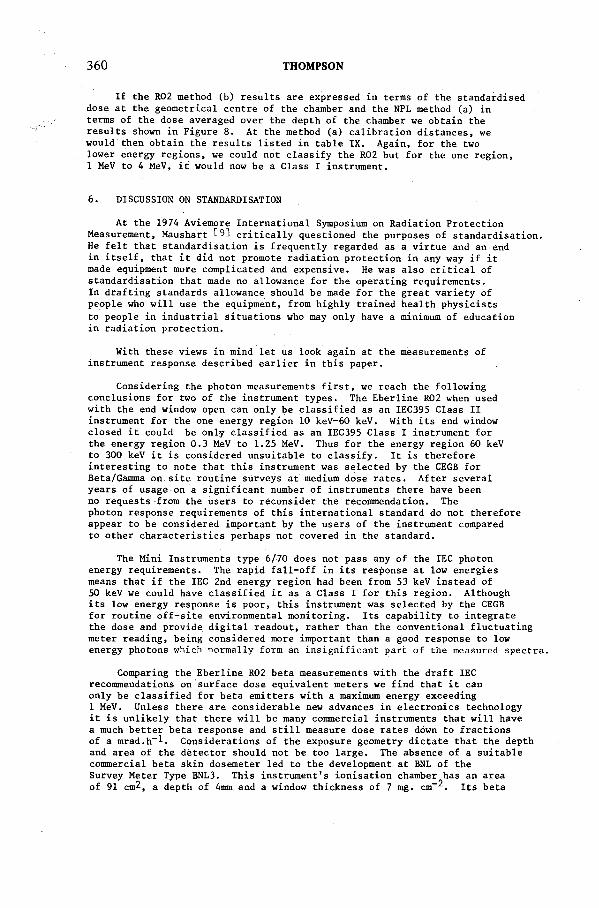
360 THOMPSON
If the R02 method (b) results are expressed in terms of the standardised dose at the geometrical centre of the chamber and the NPL method (a) in terms of the dose averaged over the depth of the chamber we obtain the results shown in Figure 8. At the method (a) calibration distances, we would then obtain the results listed in table IX. Again, for the two lower energy regions, we could not classify the R02 but for the one region,1 MeV to 4 MeV, it would now be a Class I instrument.
6. DISCUSSION ON STANDARDISATION
At the 1974 Aviemore International Symposium on Radiation Protection Measurement, Maushart £93 critically questioned the purposes of standardisation. He felt that standardisation is frequently regarded as a virtue and an end in itself, that it did not promote radiation protection in any way if it made equipment more complicated and expensive. He was also critical of standardisation that made no allowance for the operating requirements.In drafting standards allowance should be made for the great variety of people who will use the equipment, from highly trained health physicists
to people in industrial situations who may only have a minimum of education in radiation protection.
With these views in mind let us look again at the measurements of instrument response described earlier in this paper.
Considering the photon measurements first, we reach the following conclusions for two of the instrument types. The Eberline R02 when used with the end window open can only be classified as an IEC395 Class II instrument for the one energy region 10 keV-60 keV. With its end window closed it could be only classified as an IEC395 Class I instrument for the energy region 0.3 MeV to 1.25 MeV. Thus for the energy region 60 keV to 300 keV it is considered unsuitable to classify. It is therefore interesting to note that this instrument was selected by the CEGB for Beta/Gamma on site routine surveys at medium dose rates. After several years of usage on a significant number of instruments there have been no requests from the users to réconsider the recommendation. The photon response requirements of this international standard do not therefore appear to be considered important by the users of the instrument compared to other characteristics perhaps not covered in the standard.
The Mini Instruments type 6/70 does not pass any of the IEC photon energy requirements. The rapid fall-off in its response at low energies means that if the IEC 2nd energy region had been from 53 keV instead of 50 keV we could have classified it as a Class I for this region. Although its low energy response is poor, this instrument was selected by the CEGB for routine off-site environmental monitoring. Its capability to integrate the dose and provide digital readout, rather than the conventional fluctuating meter reading, being considered more important than a good response to low energy photons which normally form an insignificant part of the measured spectra.
Comparing the Eberline R02 beta measurements with the draft IEC recommendations on surface dose equivalent meters we find that it can only be classified for beta emitters with a maximum energy exceeding 1 MeV. Unless there are considerable new advances in electronics technology it is unlikely that there will be many commercial instruments that will have a much better beta response and still measure dose rates down to fractions of a mrad.h-!. Considerations of the exposure geometry dictate that the depth and area of the dètector should not be too large. The absence of a suitable commercial beta skin dosemeter led to the development at BNL of the Survey Meter Type BNL3. This instrument’s ionisation chamber has an area of 91 cm2, a depth of 4mm and a window thickness of 7 mg. cm“̂. Its beta
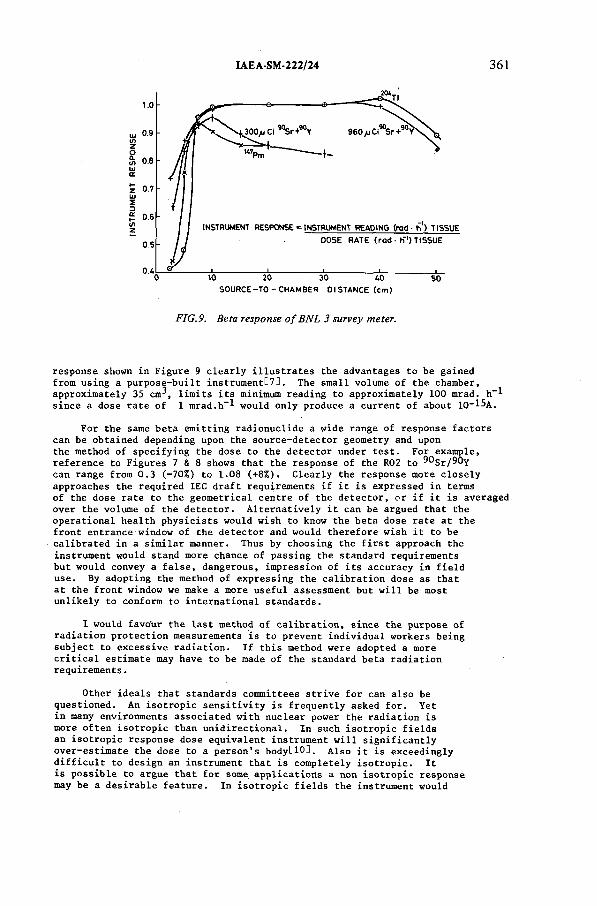
IAEA-SM-222/24 361
F I G . 9. B e ta r e s p o n s e o f B N L 3 su rv ey m eter .
response shown in Figure 9 clearly illustrates the advantages to be gained from using a purpose-built instrument^]. The small volume of the chamber, approximately 35 cm^, limits its minimum reading to approximately 100 mrad. h“* since a dose rate of 1 mrad.h- ̂would only produce a current of about lO^l^A.
For the same beta emitting radionuclide a wide range of response factors can be obtained depending upon the source-detector geometry and upon the method of specifying the dose to the detector under test. For example, reference to Figures 7 & 8 shows that the response of the R02 to ^Sr/ÍJOy can range from 0.3 (-70%) to 1.08 (+8%). Clearly the response more closely approaches the required IEC draft requirements if it is expressed in terms of the dose rate to the geometrical centre of the detector, or if it is averaged over the volume of the detector. Alternatively it can be argued that the operational health physicists would wish to know the beta dose rate at the front entrance window of the detector and would therefore wish it to be calibrated in a similar manner. Thus by choosing the first approach the instrument would stand more chance of passing the standard requirements but would convey a false, dangerous, impression of its accuracy in field use. By adopting the method! of expressing the calibration dose as that at the front window we make a more useful assessment but will be most unlikely to conform to international standards.
I would favour the last method of calibration, since the purpose of radiation protection measurements is to prevent individual workers being subject to excessive radiation. If this method were adopted a more critical estimate may have to be made of the standard beta radiation requirements.
Other ideals that standards committees strive for can also be questioned. An isotropic sensitivity is frequently asked for. Yet in many environments associated with nuclear power the radiation is more often isotropic than unidirectional. In such isotropic fields an isotropic response dose equivalent instrument will significantly over-estimate the dose to a person*s bodytlO]. Also it is exceedingly difficult to design an instrument that is completely isotropic. It is possible to argue that for some applications a non isotropic response may be a desirable feature. In isotropic fields the instrument would
362 THOMPSON
not overestimate the personal dose and since individuals are rarely stationary its directional response could be used to locate the position of unknown sources or to measure weaknesses in shielding.
From 14 years experience of operational protection measurements, calibration and assessment of commercial equipment, we have listed belowmany essential features that instruments should possess, but which are notalways specified in international standards
(a) The instrument must be easy to decontaminate.
(b) It should be easily serviced.
(c) It must be rugged and reliable.
(d) Portable equipment should really be portable, not just forweight-lifters but for the average person.
(e) For nuclear power use it might be required to work attemperatures of +60°C during boiler maintenance.
(f) It should be reasonably easy and not too time consuming tocalibrate. By calibration I mean adjustmênt, for there are very few instruments available whose initial calibration will remain unchanged over many years.
(g) It should be reasonably priced.
(h) It must never "fall back" in high level radiation fields.Although standards documents include tests for "fall back", these are usually performed only on new equipment.It is not uncommon for some types of instruments to suddenly suffer "fall back" after one or two years use.
(i) The detector, handle and display should be correctly positionedon the instrument. Walls, floors and ceilings should be capable of being monitored without having to be a contortionist to read the display.
(j) It must not be possible for unauthorised users to adjust the instrument to read higher or lower.
(k) Supply voltage batteries should be of a readily available type, be easy to change and it should be impossible to insert the battery with the incorrect polarity. Battery test facilities should be mandatory and test all the fitted batteries.
To the operational user any one of these features may be far more desirable and essential in the assessment of the radiological hazards than many of the requirements listed in standards documents. After all it is not that serious if the instruments energy response at 100 keV is 5% above the minimum standard requirement, or if the error of indication exceeds 30% at one point on the scale. Proper assessment of the instrument will in any case ensure that the user is made aware of both these deficiencies.
Too much standardisation can be destructive for it will remove all initiative from responsible operators. If a standard is too comprehensive a purchaser will be forced to buy an instrument that is too complex and very expensive when perhaps he only wishes measurement at one energy and over a very limited range of exposures.
IAEA-SM-222/24 363
I believe that standards should never ask for classification of equipment since this implies that some instruments will be considered second or third rate whilst for any one application the Class II or even an unclassified instrument may be the very best apparatus on the market.
Of course some standardisation is essential, for example, standardised batteries and components can greatly improve availability and reduce repair bills.
Most of the effort on standardisation should be directed towards the methods of testing rather than on individual performance. An evaluation made at one laboratory should yield similar conclusions to tests made on the same instrument evaluated elsewhere. The standard document should include a list of the tests that must be performed on the instrument and give details of the methods of test. If limits of performance are required they should be given only as a guide, be based upon realistic requirements and current technology.
7. CONCLUSIONS
Measurements of the photon energy response have been made on three different types of commercial instruments using the three I.S.O. filtered X-ray series and the I.S.O. fluorescent X-ray reference radiations. For two of the instruments no difference in response could be observed when eachof the different 20%, 30% and 50% resolution filtered spectra were used.Significant differences were observed for the instrument with the energy compensated Geiger-Muller detector, a lower response curve being obtained when using wider resolution series.
Four of the fluorescent radiations with energies from 49.1 to 75 keV gave a higher response than the filtered X radiations of the sameenergy region. This is thought to be possibly due to the mostmonoenergetic nature of the fluorescent radiations.
To measure the variation in instrument response with photon energy the most narrow I.S.O. filtered X-ray series should always be used, provided that the exposure or dose rate from it is sufficient*
With the introduction of the new Balloon secondary ionisation chamber, with its increased sensitivity, calibration at protection levels in the filtered X-ray beams can now be made directly with a chamber that has been calibrated at the NPL against the primary free air chamber standard.Its introduction has still not solved the problems of calibrating the fluorescent radiation beams whose collimated beam area is smaller than the cross sectional area of the balloon chamber. Also for calibration at energies below 30 keV uncertainty still exists over the calibration factors that can be used, since the chamber*s sensitivity decreases rapidly with decreasing energy and the primary and secondary calibration beams have significantly different spectral shapes.
Two series of beta reference radiations have been proposed by I.S.O. Both series have been used to a calibrate a commercial instrument and for identical source to detector distances they have been shown to produce similar results. Although standardisation of the beta radiation field is not easy, greater difficulties are experienced with the choice of methods for calibrating the test instrument.
Fields of beta radiation should be surveyed in terms of dose to the skin at depths of 5-10 mg. cm“2. To ensure that such survey measurements
364 THOMPSON
do not seriously underestimate the dose to a person's skin it is important . to calibrate beta dosemeters in terms of the dose rate at the detectors
entrance window, rather than at its geometrical centre.
The results of the photon and beta calibration of commercial instruments have been compared with the performance requirements of international recommendations. Although the instruments tested did not pass some of these international requirements, two of them have been selected, for protection measurements at the Board's nuclear stations because of characteristics not specified in the standards.
Standardisation is very necessary and can considerably help towards not only improving measureménts but in many cases reducing the cost of equipment. It should never be lightly undertaken and must never be started for its own sake. As users we should all strive to ensure that complete performance data is provided by manufacturers for each equipment so that we, not the standard itself, as responsible persons can choose whether the instrument is appropriate and efficient for the job we have to do.
Acknowledgements
This paper is published by permission of the Central Electricity Generating Board.
REFERENCES
[1] Owen, B., Phys. Med. Biol. Vol 18, 355 (1973)
[2] Draft International Standard ISO/DIS4037, X and y referenceradiations for calibrating and determining the energy response of dosimeters and doserate meters.(1976).
[3] Thompson, I.M.G., Lavender, A., Shipton, R.G. , Goodwin, J.,IAEA Symposium "Advances in Physical and Biological Radiation Detectors", Vienna (1971) 505-531.
[4] Kemp, L.A.W., Read, L.R., Phys. Med. Biol. Vol 13,.451 (1968).
[5] White, D.F., Callowhill, K., Iles, W.J., Speight, D.L.,NRPB report IE3, January (1975).
[6] Harvey, J.R., Macfarlane, B.J., Shipton, R.G., Thompson, I.M.G.,Phys. Med. Biol., Vol 20, 652-656, (1975).
[7] Thompson, I.M.G., Shipton, R.G., Goodwin, J., 2nd IRPA Congress,Brighton, (1970).
[8] BCRU conversion factors. Burns, J.E., Phys. Med. Biol., 101-103October (1976).
[9] Maushart, R., Symposium "Radiation Protection Measurements -Philosophy and Implementation", 143-149 Aviemore (1974).
[10] Harvey, J.R., Phys. Med. Biol. Vol 20, Nos: 6, 1003-1014 (1975).
IAEA-SM-222/24 365
DISCUSSION
H.O. WYCKOFF: I note that the differences between calibrations with fluorescent sources and those with heavily filtered X-radiation are not very great. This raises the question whether fluorescent sources are needed for routine work.
I.M.G. THOMPSON: The agreement between the filtered and the fluorescent calibration is surprisingly good. Most o f the differences observed can probably be attributed to uncertainties in using a secondary standard that was calibrated in relatively broad filtered spectra for measurements o f exposure in mono-energetic fluorescent X-ray beams. It is possible to use filtered X-ray sources for calibration instead o f the fluorescent sources, but the standard is an international one and there are some countries that prefer the fluorescent technique. The fluorescent sources are particularly useful for research purposes, e.g. for the measurement o f X-ray cross-sections.
G.P. HANSON: One o f the essential features o f operational protection measurement instruments which you listed is described as follows:
“It must not be possible for unauthorized users to adjust the instrument toread higher or low er.”
How frequently is interference by unauthorized users observed? Is this a real problem?
I.M.G. THOMPSON: It is a real problem, but fortunately not a com m on one. In cases o f accidental exposure the preformance o f the instrument involved is always questioned. It is therefore important to ensure that instruments used for protection measurements cannot easily be adjusted by unauthorized users.

IAEA-SM-222/07
NBS STANDARD REFERENCE NEUTRON FIELDS FOR PERSONNEL DOSIMETRY CALIBRATION
R.B. SCHWARTZ, J.A. GRUNDL National Bureau o f Standards,Washington, DC,United States o f America
Abstract
NBS STANDARD REFERENCE NEUTRON FIELDS FOR PERSONNEL DOSIMETRY CALIBRATION.
The National Bureau of Standards (NBS) has established and characterized several neutron fields for dose meter calibration. Two of these fields are continuous neutron spectra: the spontaneous fission neutron distribution from 252Cf, and a thermal Maxwellian beam. The other three neutron fields are mono-energetic reactor beams with energies of 2, 24 and 144 keV.The beam from the NBS thermal column is very pure: the cadmium ratio for a 1 /v detector is ~ 104: 1. There is some flexibility in the collimation arrangements at the thermal column and large beams can be obtained by using diverging geometry. Two low-scatter 252Cf irradiation facilities are available. The first is in a large room with the source suspended 2.2 m above a concrete floor; the second is outdoors with the 252Cf mounted on a 5 m mast. Several 2s2Cf sources are available with strengths up to a maximum of ~5 X 10⁹ neutrons per second, giving a neutron dose equivalent rate ~20 rem/h 50 cm from the source. The 2 keV, 24 keV and 144 keV beams are obtained by a combination of resonant scattering and resonant filtering techniques at the NBS reactor. The 2 and 24 keV beams represent new energy points previously unavailable to experimenters; the 144 keV beam provides a convenient overlap with neutron fields generated by accelerators. These beams are approximately 5 cm in diameter. The dose equivalent rates for the 2 keV and 24 keV beams are ~ 150 mrem/h; that for the 144 keV beam is 3 rem/h. A scanning table has been built to move the object being exposed across the beam following a precise pattern, to simulate a broad-beam geometry. Recently mono-energetic beams from the Van de Graaff accelerator have become available at energies from 100 keV to 1.5 MeV.
I n t r o d u c t io n
N eutron f i e l d s f o r p e r s o n n e l d o s im e te r c a l i b r a t i o n have been e s t a b l is h e d and c a l i b r a t e d a t th e N a t io n a l Bureau o f S ta n d a rd s . Two o f th e f i e l d s a r e c o n t in u o u s n e u t r ^ 2sPe c t r a : th e sp on ta n eou s f i s s i o n n eu tron d i s t r i b u t i o n from C f, and a th erm al M axw ellian beam. T hree o th e r n e u tro n f i e l d s a r e m o n o e n e rg e tic r e a c t o r beam s, p rod u ced by f i l t e r t e c h n iq u e s , w ith e n e r g ie s o f 2 , 2 4 , and 144 keV.
367
368 SCHWARTZ and GRUNDL
In a d d i t i o n , m o n o e n e rg e tic n e u tro n f i e l d s in th e ran ge 100 keV t o 1 .5 MeV have becom e a v a i l a b le a t th e NBS Van de G r a a ff L a b o r a to r y , and a 14 MeV beam sh ou ld b e a v a i l a b le s o o n .
The rem ainder o f t h i s paper w i l l d is c u s s th e p r o d u c t io n , c a l i b r a t i o n , and a p p l i c a t i o n o f th e s e f i e l d s .
252 Cf N eutron F ie ld
252Two lo w - s c a t t e r Cf i r r a d i a t i o n f a c i l i t i e s a r e a v a i l a b le . The f i r s t i s in a la r g e room w ith th e s o u r c e suspended 2 .2 m a b ov e th e c o n c r e t e f l o o r . The n e a r e s t w a l l ( c o n c r e t e ) i s 4 .1 m th e s o u r c e . The secon d f a c i l i t y i s o u td o o r s ,w ith th e Cf mounted on a 5 m m ast.
The Cf s o u r c e i t s e l f has a maximum d im en sion o f o n ly1 .5 mm and thus a p p roa ch es an id e a l p o in t s o u r c e . The s o u r c e i s a c c u r a t e ly c e n te r e d w ith in a l i g h t 2g) s t a i n l e s s s t e e l and aluminum c a p s u le w ith a d ia m eter o f g 0 .8 cm. S ou rces a re a v a i l a b le w ith s t r e n g th s up t o ^ 5 x 10 n / s . T h is m eans, f o r exam ple th a t th e f l u x d e n s ity a t a 2d is t a n c e o f 50 cm from th e s o u r c e can be up t o 1 .6 x 10® n /cm * s , g iv in g a n e u tro n d o se e q u iv a le n t r a t e o f a p p ro x im a te ly 20 rem /h . The gamma d o se r a t e a t t h i s d is t a n c e i s a p p ro x im a te ly 2 .5 r a d /h .
Under th e s e c o n d i t i o n s , th e ( c a l c u l a t e d ) epicadm ium s c a t t e r e d r e tu r n f l u x amounts to 7% o f th e in c id e n t f l u x f o r th e s o u r c e in th e l o w - s c a t t e r room , and < 0 .4% f o r th e o u t d o o r s o u r c e 5 m a b ov e th e grou n d . The d o se due t o th e s c a t t e r e d r e tu r n f l u x w i l l be much lo w e r , h ow ever, s in c e th e r e tu r n spectru m i s s o f t e r than th e prim ary sp ectru m .
252The Cf e m is s io n r a t e i s m easured in th e NBS m anganese s u lp h a te b a th t o an a c c u r a c y o f + 1 .2% . [ 1 ]
Therm al Beam
The beam from th e NBS th erm al colum n is ^ v e r y p u re ; th e cadmium r a t i o f o r a 1 /v d e t e c t o r i s ab ou t 10 :1 .
T here i s some f l e x i b i l i t y in th e c o l l im a t in g a rran gem en ts. F or exam ple , a 2 cm d ia m eter p a r a l l e l beam may be used w ith a f l u x d e n s it y o f ^ 4 x 10® n /cm * s , bu t c o n s id e r a b ly la r g e r beams can b e o b ta in e d by u s in g d iv e r g in g g eom etry . The la r g e s t a v a i l a b le beam i s 'v» 30 cm in d ia m eter a t a d is t a n c e o f 5 m from ^ th e r e a c t o r f a c e . The f l u x d e n s it y in t h is c a s e i s ъ 2 x 10 n /cm * s .
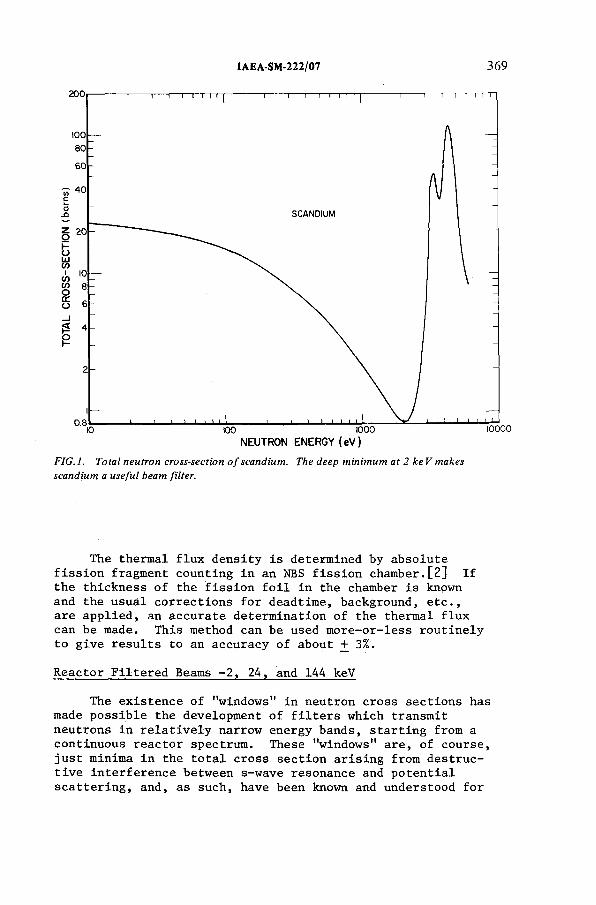
IAEA-SM-222/07 369
F I G . l . T o ta l n e u tr o n cr o s s -se c tio n o f s c a n d iu m . T h e d e e p m in im u m a t 2 k e V m a k es
s c a n d iu m a u s e f u l b ea m fi lte r .
The th erm al f l u x d e n s it y i s d eterm in ed by a b s o lu te f i s s i o n fragm en t co u n t in g in an NBS f i s s i o n ch a m b er .[ 2 ] I f th e th ic k n e s s o f th e f i s s i o n f o i l in th e chamber i s known and th e u s u a l c o r r e c t i o n s f o r d ea d tim e , b a ck g rou n d , e t c . , a r e a p p l i e d , an a c c u r a te d e te r m in a t io n o f th e th erm al f l u x can be made. T h is m ethod can b e used m o r e - o r - l e s s r o u t in e ly t o g iv e r e s u l t s t o an a c c u r a c y o f a b ou t + 3%.
R e a c to r F i l t e r e d Beams - 2 , 2 4 , and 144 keV
The e x is t e n c e o f "w in dow s" in n e u tro n c r o s s s e c t i o n s has made p o s s ib l e th e d evelopm en t o f f i l t e r s w h ich tra n sm it n e u tro n s in r e l a t i v e l y narrow en erg y b a n d s , s t a r t in g from a co n t in u o u s r e a c t o r sp ectru m . These "w in dow s" a r e , o f c o u r s e , j u s t minima in th e t o t a l c r o s s s e c t i o n a r i s i n g from d e s t r u c t i v e in t e r f e r e n c e betw een s-w ave re so n a n ce and p o t e n t i a l s c a t t e r i n g , and , as su ch , have been known and u n d e rs to o d f o r
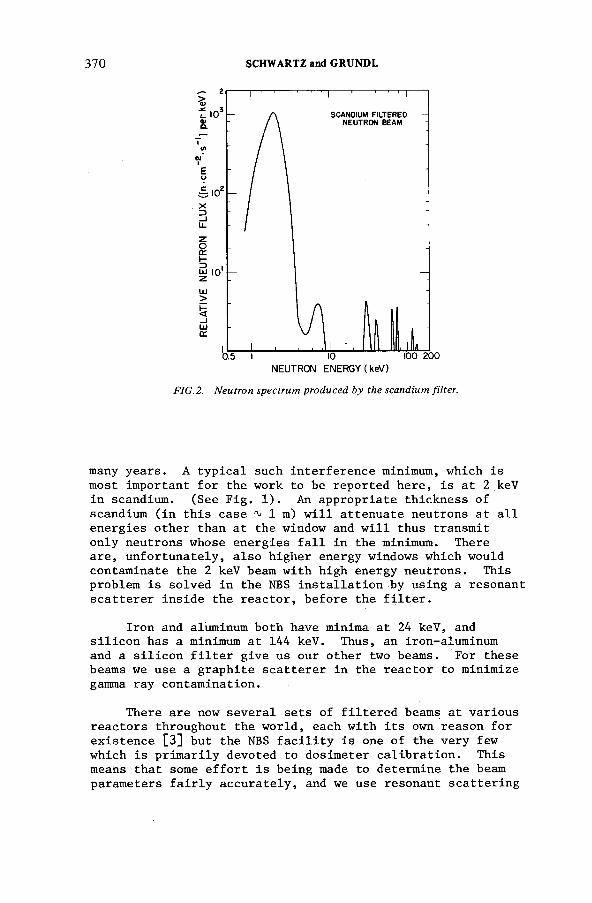
370 SCHWARTZ and GRUNDL
F I G .2. N e u tr o n s p e c tr u m p r o d u c e d b y th e sc a n d iu m fi lte r .
many y e a r s . A t y p i c a l such in t e r f e r e n c e minimum, w h ich i s m ost im p orta n t f o r th e w ork to be r e p o r te d h e r e , i s a t 2 keV in scandium . (S ee F ig . 1 ) . An a p p r o p r ia te th ic k n e s s o f scandium ( i n t h i s c a s e ^ 1 m) w i l l a t t e n u a te n eu tron s a t a l l e n e r g ie s o th e r than a t th e window and w i l l thus tra n sm it o n ly n e u tro n s w hose e n e r g ie s f a l l in th e minimum. There a r e , u n fo r t u n a t e ly , a l s o h ig h e r en erg y windows w h ich w ould con ta m in a te th e 2 keV beam w ith h ig h en erg y n e u tr o n s . T h is p rob lem i s s o lv e d in th e NBS i n s t a l l a t i o n by u s in g a re so n a n t s c a t t e r e r in s i d e th e r e a c t o r , b e f o r e th e f i l t e r .
I r o n and aluminum b o th have minima a t 24 keV , and s i l i c o n has a minimum a t 144 keV . Thus, an iron -a lu m in u m and a s i l i c o n f i l t e r g iv e us ou r o th e r two beam s. For th e se beams we u se a g r a p h ite s c a t t e r e r in th e r e a c t o r to m in im ize gamma ra y co n ta m in a t io n .
T here a r e now s e v e r a l s e t s o f f i l t e r e d beams a t v a r io u s r e a c t o r s th rou g h ou t th e w o r ld , each w ith i t s own re a s o n f o r e x is t e n c e [ 3 ] b u t th e NBS f a c i l i t y i s one o f th e v e r y few w h ich i s p r im a r i ly d e v o te d t o d o s im e te r c a l i b r a t i o n . T h is means th a t some e f f o r t i s b e in g made t o d e te rm in e th e beam p a ra m eters f a i r l y a c c u r a t e ly , and we u se re so n a n t s c a t t e r in g
IAEA-SM-222/07 371
te c h n iq u e s in a d d it io n to th e f i l t e r s to in s u r e th a t th e beams a r e f r e e o f un-w anted n e u tro n s and gammas. The spectru m o f th e 2 keV (scan d iu m f i l t e r e d ) beam i s shown in F ig . 2 . We n o te th a t th e f l u x o f h ig h e r en erg y n e u tro n s amounts to o n ly 3% o f th e 2 keV f l u x : t h i s i s to be com pared w ith h ig h e ren e rg y co n ta m in a t io n o f 25% to 40% a t some o th e r i n s t a l l a t i o n s . [ 4 , 5 ]
The 2 keV and 24 keV beam i n t e n s i t i e s a re d eterm in ed by c o u n t in g w ith on e -a tm osp h ere 10BFg c o u n t e r s . We u se s ta n d a rd com m ercia l c o u n t e r s , 5 cm d ia m e te r , v a r y in g in s e n s i t i v e le n g th from 6 t o 33 cm, em p loy in g a th in (2 mm) ce ra m ic end window .The beam i s b rou g h t in th rou gh th e c e n te r o f th e ce ra m ic w indow , p a r a l l e l t o th e c e n te r w ir e . S in ce th e beams a re2 .5 cm d ia m eter o r l e s s , th e r e is^ginim um w a ll e f f e c t , and i t i s o n ly n e c e s s a r y t o know th e В d e n s it y and th e s e n s i t i v e le n g th t o d e te rm in e th e co u n te r e f f i c i e n c y . The 10B d e n s i t y was d eterm in ed by m easu rin g th e tr a n s m is s io n o f th e co u n te r a lo n g a d ia m e te r , u s in g beams o f 3 .8 6 and 5 4 .4 m i l l i v o l t n e u tro n s p rod u ced by NBS c r y s t a l s p e c tr o m e te r s .The t r a n s m is s io n was m easured r e l a t i v e to an i d e n t i c a l , bu t em pty, c o u n te r t o ta k e in t o a cco u n t th e e f f e c t o f th e 0 .9 mm t h ic k s t a i n l e s s s t e e l w a l l s . At th e s e low n e u tro n e n e r g ie s , th e 10B a b s o r p t io n dom inates th e t r a n s m is s io n , and thus th e 10В c o n te n t can be determ in ed q u it e a c c u r a t e ly . The s e n s i t i v e le n g th o f th e co u n te r was d eterm in ed by s ca n n in g a lo n g i t s le n g th w ith a f i n e l y c o l l im a t e d th erm al beam. The sm a ll c o r r e c t i o n f o r l o s s e s in th e ce ra m ic window was determ in ed by an e x p l i c i t m easurem ent u s in g a dummy w indow . We thus end up w ith c o u n te r s w hose a b s o lu t e e f f i c i e n c i e s a re known in term s o f th e ^°B c r o s s s e c t i o n and th e e x p l i c i t l y m easured p h y s ic a l p r o p e r t ie s o f th e c o u n t e r . M easurem ents o f th e2 keV beam i n t e n s i t y , u s in g 3 c o u n te r s o f le n g th s 6 .4 , 3 1 , and 33 cm, showed a sp rea d in v a lu e s o f l e s s than + 1%, w hich s u g g e s ts a t l e a s t in t e r n a l c o n s is t e n c y in ou r u se o f th e se c o u n t e r s . In th e a b s e n c e , h ow ever, o f any c r o s s ch eck s on th e s e m easurem ents ( e . g . , f o i l a c t i v a t i o n ) we f e e l th a t we can o n ly q u o te an a c c u r a c y o f + 5% f o r th e 2 keV beam in t e n s i t y .
T h is te ch n iq u e i s b e t t e r s u it e d to th e 2 keV than th e 24 keV beam, s in c e th e 10B (n ,a ) c r o s s s e c t i o n i s ^ 3 .5 tim es h ig h e r a t th e lo w e r e n e rg y . H ow ever, a p r o to n r e c o i l c o u n te r can a l s o b e u sed f o r th e 24 keV beam, as w e l l as f o r th e 144 keV beam. In t h i s c a s e , we u se a c o u n te r w h ich i s p h y s i c a l l y s im i la r t o th e 31 cm lo n g BF^ c o u n t e r , b u t f i l l e d w ith h yd rogen t o an a c c u r a t e ly known p r e s s u r e . S in ce th e h yd rogen c r o s s s e c t i o n i s v e r y w e l l known, th e a re a under th e p r o to n r e c o i l spectru m i s a d i r e c t m easure o f th e beam i n t e n s i t y .
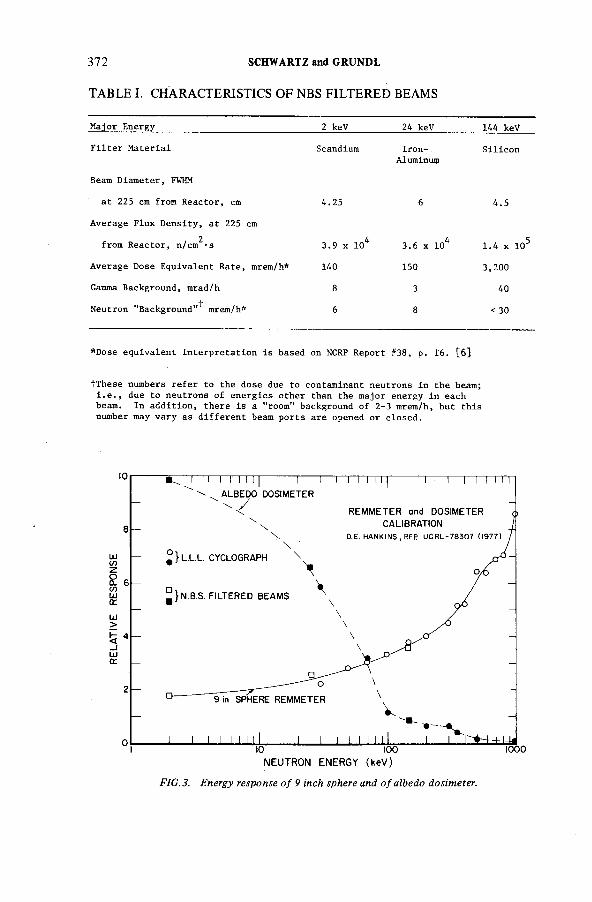
TABLE I. CHARACTERISTICS OF NBS FILTERED BEAMS
372 SCHWARTZ and GRUNDL
Major Energy 2 keV 24 keV 144 keV
Filter Material Scandium Iron-Aluminum
Silicon
Beam Diameter, FWHM
at 225 cm from Reactor, cm A.25 6 4.5
Average Flux Density, at 225 cm
2from Reactor, n/cm *s 3.9 x 10⁴ 3.6 x 10⁴ 1.4 x 10⁵
Average Dose Equivalent Rate, mrem/h* 140 150 3,200
Gamma Background, mrad/h 8 3 40
Neutron "Background"^ mrem/h* 6 8 < 30
*Dose equivalent interpretation is based on NCRP Report #38, p. 16. [6]
tThese numbers refer to the dose due to contaminant neutrons in the beam;i.e., due to neutrons of energies other than the major energy in each beam. In addition, there is a "room” background of 2-3 mrem/h, but this number may vary as different beam ports are opened or closed.
FIG.3. Energy response of 9 inch sphere and of albedo dosimeter.
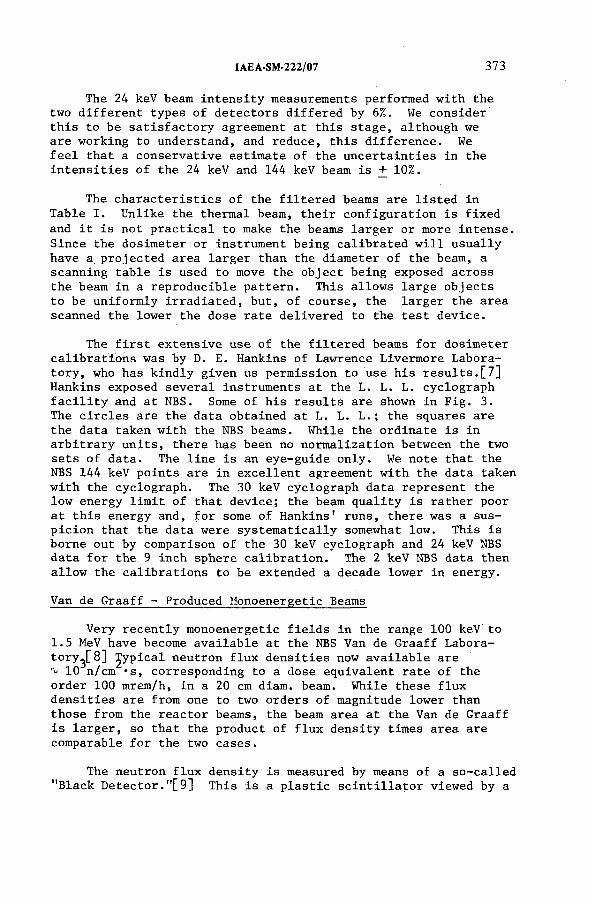
IAEA-SM-222/07 373
The 24 keV beam in t e n s i t y m easurem ents p erform ed w ith th e two d i f f e r e n t ty p e s o f d e t e c t o r s d i f f e r e d by 6%. We c o n s id e r t h i s t o be s a t i s f a c t o r y agreem ent a t t h is s t a g e , a lth o u g h we a r e w ork in g t o u n d ers ta n d , and r e d u c e , t h i s d i f f e r e n c e . We f e e l th a t a c o n s e r v a t iv e e s t im a te o f th e u n c e r t a in t i e s in th e i n t e n s i t i e s o f th e 24 keV and 144 keV beam i s + 10%.
The c h a r a c t e r i s t i c s o f th e f i l t e r e d beams a re l i s t e d in T a b le I . U n lik e th e th erm al beam, t h e i r c o n f ig u r a t i o n i s f i x e d and i t i s n o t p r a c t i c a l to make th e beams la r g e r o r m ore in t e n s e . S in c e th e d o s im e te r o r in stru m en t b e in g c a l ib r a t e d w i l l u s u a l ly have a p r o je c t e d a re a la r g e r than th e d ia m eter o f th e beam, a s ca n n in g t a b le i s used t o move th e o b je c t b e in g ex p osed a c r o s s th e beam in a r e p r o d u c ib le p a t t e r n . T h is a llo w s la r g e o b j e c t s t o be u n ifo r m ly i r r a d i a t e d , b u t , o f c o u r s e , th e la r g e r th e a re a scanned th e lo w e r th e d o se r a t e d e l iv e r e d t o th e t e s t d e v i c e .
The f i r s t e x t e n s iv e u se o f th e f i l t e r e d beams f o r d o s im e te r c a l i b r a t i o n s was by D. E. H ankins o f Law rence L iverm ore L abora t o r y , who has k in d ly g iv e n us p e r m is s io n to u se h is r e s u l t s . [ 7 ] H ankins ex p osed s e v e r a l in stru m en ts a t th e L . L . L . c y c lo g r a p h f a c i l i t y and a t NBS. Some o f h is r e s u l t s a re shown in F ig . 3 .The c i r c l e s a r e th e d a ta o b ta in e d a t L . L . L . ; th e sq u a res a re th e d a ta tak en w ith th e NBS beam s. W h ile th e o r d in a t e i s in a r b i t r a r y u n i t s , th e r e has been no n o r m a liz a t io n betw een th e two s e t s o f d a ta . The l i n e i s an e y e -g u id e o n ly . We n o te th a t th e NBS 144 keV p o in t s a r e in e x c e l l e n t agreem ent w ith th e d a ta taken w ith th e c y c lo g r a p h . The 30 keV c y c lo g r a p h d a ta r e p r e s e n t th e low en erg y l i m i t o f th a t d e v i c e ; th e beam q u a l i t y i s r a th e r p o o r a t t h i s e n e rg y and , f o r some o f H an k in s ' ru n s , th e r e was a su s p i c i o n th a t th e d a ta w ere s y s t e m a t ic a l ly somewhat lo w . T h is i s b o rn e o u t by com p a rison o f th e 30 keV c y c lo g r a p h and 24 keV NBS d a ta f o r th e 9 in c h sp h ere c a l i b r a t i o n . The 2 keV NBS d a ta th en a l lo w th e c a l i b r a t i o n s t o be ex ten d ed a d eca d e low er in en e rg y .
Van de G ra a ff - P roduced M o n o e n e rg e t ic Beams
V ery r e c e n t ly m o n o e n e rg e t ic f i e l d s in th e ran ge 100 keV to1 .5 MeV have becom e a v a i l a b le a t th e NBS Van de G ra a ff L abora t o r y ^ 8 ] J y p ic a l n e u tro n f l u x d e n s i t i e s now a v a i l a b le a re ^ 10 n /cm * s , c o r r e s p o n d in g t o a d ose e q u iv a le n t r a t e o f th e o r d e r 100 m rem /h, in a 20 cm diam . beam. W h ile th e s e f l u x d e n s i t i e s a re from one to two o r d e r s o f m agnitude low er than th o s e from th e r e a c t o r beam s, th e beam a rea a t th e Van de G ra a ff i s l a r g e r , so th a t th e p ro d u c t o f f l u x d e n s it y tim es a re a a re com parab le f o r th e two c a s e s .
The n e u tro n f l u x d e n s it y i s m easured by means o f a s o - c a l l e d "B la c k D e t e c t o r . " [ 9 ] T h is i s a p l a s t i c s c i n t i l l a t o r v iew ed by a
374 SCHWARTZ and GRUNDL
p h o t o m u lt ip l i e r . The s c i n t i l l a t o r i s la r g e enough (1 2 .5 cm diam . 15 cm lo n g ) t o c o m p le te ly a b sorb th e in c id e n t n e u tr o n s ; h en ce th e name. The e f f i c i e n c y o f th e d e v ic e has been m easured d i r e c t l y and a l s o c a lc u la t e d by means o f a M on te -C a rlo program ; th e two m ethods a g re e t o w ith in 1% and show th a t th e e f f i c i e n c y i s g r e a t e r than 90% o v e r m ost o f th e en erg y ran ge o f i n t e r e s t .
U sin g th e d e v i c e , th e f l u x d e n s it y can b e determ in ed to w ith in + 2% f o r n e u tro n e n e r g ie s betw een 200 keV and 1 MeV, w ith th e u n c e r t a in t y in c r e a s in g o u t s id e o f t h is r e g io n .
A 14 MeV n e u tro n beam i s e x p e c te d t o b e ^ a v a il^ b le in s ix m onths. The e x p e c te d f l u x d e n s it y i s 6 x 10 n /cm - s , c o r r e sp on d in g t o a d o se e q u iv a le n t r a t e o f 1 .4 rèm /h .
Summary
C a lib r a t e d r e fe r e n c e n e u tro n f i e l d s a re now a v a i la b le a t NBS w h ich o f f e r a u n iq u e o p p o r tu n ity f o r s t a n d a r d iz a t io n o f n e u tro n d o s im e try a t n e u tro n e n e r g ie s b e lo w 15 MeV.
Ac know ledg ement s
The r e s u l t s r e p o r te d h e re r e p r e s e n t th e w ork o f many p e o p le .
252The e s ta b lis h m e n t and c a l i b r a t i o n o f th e Cf f a c i l i t y was done by V. S p ie g e l , С. M. E isen h a u er , and H. T . H eaton I I .D. M. G i l l ia m i s r e s p o n s ib le f o r th e m easurem ent o f th e th erm al f l u x . The r e a c t o r f i l t e r e d beams w ere e s t a b l is h e d in c o l l a b o r a t i o n w ith I . G. S ch ro d e r . F in a l l y , th e Van de G ra a ff program i s due t o th e e f f o r t s o f 0 . A . W asson and М. M. M e ie r .
R E F E R E N C E S
[ 1 ] HEATON, H. T. I I , e t a l . , N u clea r C ross S e c t io n s andT e ch n o lo g y (P r o c . C on f. W ash in gton , D. C . , 1975) N a t io n a lBureau o f S tan dards S p e c ia l P u b l i c a t io n 4 25 , U. S. G overnment P r in t in g O f f i c e , W ash in gton , D. C. (1 9 7 5 ) 266.
[2 ] GRUNDL, J . A . , e t a l . , N u c l. T ech . 25 (1 9 7 5 ) 237.
[ 3 ] SCHWARTZ, R. B . , N eutron S tan dards and A p p l ic a t io n s (P r o c . I n t . S p e c i a l i s t s Sym p., G a ith e rs b u rg , M d., 1977) N a t io n a l B ureau o f S tan dards S p e c ia l P u b l ic a t i o n 4 9 3 , U. S. G overnment P r in t in g O f f i c e , W ash in gton , D. C. (1 9 7 7 ) 250.
[ 4 ] GREENWOOD, R . C . , CHRIEN, R. E . , N u c l. I n s t r . and M eth. 138 (1 9 7 6 ) .
IAEA-SM-222/07 375
[ 5 ] SIMPSON, О. D . , SMITH, J . R . , and ROGERS, J . W ., N eutron S tan dards and F lu x N o rm a liz a t io n (P r o c . Symp. A rgon n e, 111.1970) U. S. A tom ic E nergy Com m ission (1 9 7 1 ) 362 .
[ 6 ] NCRP R e p o rt No. 3 8 , P r o t e c t i o n A g a in s t N eutron R a d ia t io n (N a t io n a l C o u n c il on R a d ia t io n P r o t e c t i o n and M easurem ents,1 9 7 1 ).
[ 7 ] HANKINS, D. E . , UCRL R ep. 78307 (1 9 7 7 ) , and p r iv a t e comm u n ica t io n .
[ 8 ] WASSON, 0 . A . , N eutron S tan dards and A p p l ic a t i o n (P r o c . I n t . S p e c i a l i s t s Sym p., G a ith e r s b u r g , M d., 1977) N a t io n a l Bureau o f S tan dards S p e c ia l P u b l ic a t i o n 493 , U. S. Government P r in t in g O f f i c e , W ash in gton , D. C. (1 9 7 7 ) 115.
[ 9 ] MEIER, М. М ., N eutron S tan dards and A p p l ic a t io n s (P r o c . I n t . S p e c i a l i s t s Sym p., G a ith e r s b u r g , M d., 1977) N a t io n a l Bureau o f S tan dards S p e c ia l P u b l ic a t i o n 4 9 3 , U. S. Government P r in t in g O f f i c e , W ash in gton , D. C. (1 9 7 7 ) 221 .
DISCUSSION
L.J. GOODMAN: For the calibrated NBS neutron beams to be useful for many applications it will be necessary to have good information on the photons which accompany the neutrons, preferably in terms o f absorbed dose rate. What is known about the photon emissions from the 2s2C f sources, in the filtered beams and in the 14 MeV beam under development, or what plans do you have for obtaining adequate information?
R.B. SCHWARTZ: Table I indicates that the gamma dose in the filtered beams is only 1% to 6% o f the neutron dose equivalent; we have therefore not made any great effort to measure it very accurately. We have, I confess, no such excuse for the other beams, and this remains a problem which we must tackle in the near future.
M.J. HÔFERT: In order to correct for detector response in cases where area or personnel neutron dose meters with poor neutron/gamma discrimination are irradiated, I should think it would be essential to know the photon contamination in the beam.
R.B. SCHWARTZ: O f course. Up to now all our calibrations have been performed on instruments which had intrinsically very good gamma discrimination, so we have never really had to confront, this problem; but we shall be doing so in the near future.
376 SCHWARTZ and GRUNDL
L.D. STEPHENS: I am concerned about the fact that your 252Cf source is only 2.2 ш above a concrete floor. The scatter from the floor will be o f the order o f 15%; in other words, a detector will receive ~ 15% more radiation than would be predicted by the inverse square law. Our experience shows that 4 to 5 m distance from all scattering surfaces is necessary for calibration work. What is your experience?
R.B. SCHWARTZ: Our calculations indicate a return (scattered) flux o f 7% rather than 15%, the dose equivalent being still lower since the spectrum will be degraded in energy upon scattering. I feel that our calculations are good, but we will have to check them.
I.M.G. THOMPSON: I have measured the efficiency o f the De Pangher long counter with respect to an Am /Be (a ,n ) source in several rooms o f different size. By making careful measurements o f the scattered neutron contribution we were able to obtain the same efficiency in rooms measuring from as little as3 m X 3 m X 3 m to larger sizes, as well as outdoors with the counter 7 m above the ground.
It is frequently reported that at nuclear power plants the major contribution to the total neutron dose is from intermediate neutrons with energies below 10 keV. Does the NBS therefore have any plans to produce neutron sources having energies in this important energy region, say from thermal to 1 keV?
R.B. SCHWARTZ: Our filter techniques depend on what nature provides us with in the way o f isolated minima in the neutron cross-section, and nature is not very generous. We would very much like to have a neutron field below 1 keV, and have given the matter much thought, but at the moment we do not know how to do it.
H.O. WYCKOFF: You have used the term “ dose-equivalent rate” and given it in terms o f rem/h. One needs to give the location for such determinations.
R.B. SCHWARTZ: This is the maximum dose-equivalent rate, the fluence to dose-equivalent conversion factors being taken from (US) NCRP report N o.38.
E.L. GEIGER: Figure 3 gives the relative response o f an albedo dose meter and a 9 inch sphere remmeter. Is this relative response per rad?
R.B. SCHWARTZ: I believe that the response is per unit fluence, although Hankins’ paper is not at all clear on this.
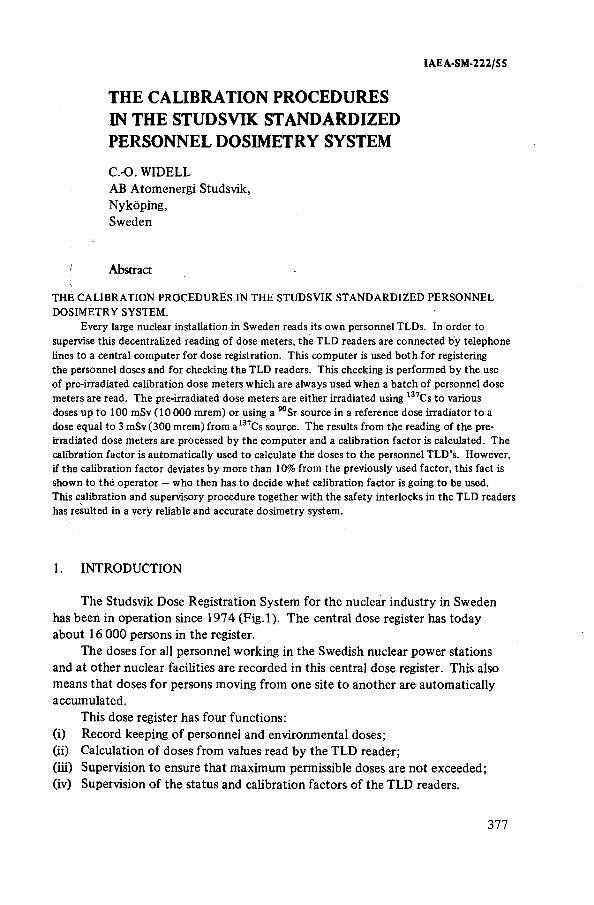
IAEA-SM-222/SS
THE CALIBRATION PROCEDURES IN THE STUDSVIK STANDARDIZED PERSONNEL DOSIMETRY SYSTEM
C.-O. WIDELL AB Atomenergi Studsvik,Nykôping,Sweden
' Abstract
THE CALIBRATION PROCEDURES IN THE STUDSVIK STANDARDIZED PERSONNEL DOSIMETRY SYSTEM.
Every large nuclear installation in Sweden reads its own personnel TLDs. In order to supervise this decentralized reading of dose meters, the TLD readers are connected by telephone lines to a central computer for dose registration. This computer is used both for registering the personnel doses and for checking the TLD readers. This checking is performed by the use of pre-irradiated calibration dose meters which are always used when a batch of personnel dose meters are read. The pre-irradiated dose meters are either irradiated using l31Cs to various doses up to 100 mSv (10 000 mrem) or using a 90Sr source in a reference dose irradiator to a dose equal to 3 mSv (300 mrem) from a137Cs source. The results from the reading of the pre- irradiated dose meters are processed by the computer and a calibration factor is calculated. The calibration factor is automatically used to calculate the doses to the personnel TLD’s. However, if the calibration factor deviates by more than 10% from the previously used factor, this fact is shown to the operator — who then has to decide what calibration factor is going to be used.This calibration and supervisory procedure together with the safety interlocks in the TLD readers has resulted in a very reliable and accurate dosimetry system.
1. INTRODUCTION
The Studsvik Dose Registration System for the nuclear industry in Sweden has been in operation since 1974 (F ig .l). The central dose register has today about 16 000 persons in the register.
The doses for all personnel working in the Swedish nuclear power stations and at other nuclear facilities are recorded in this central dose register. This also means that doses for persons moving from one site to another are automatically accumulated.
This dose register has four functions:(i) Record keeping o f personnel and environmental doses;(ii) Calculation o f doses from values read by the TLD reader;(iii) Supervision to ensure that maximum permissible doses are not exceeded;(iv) Supervision o f the status and calibration factors o f the TLD readers.
377
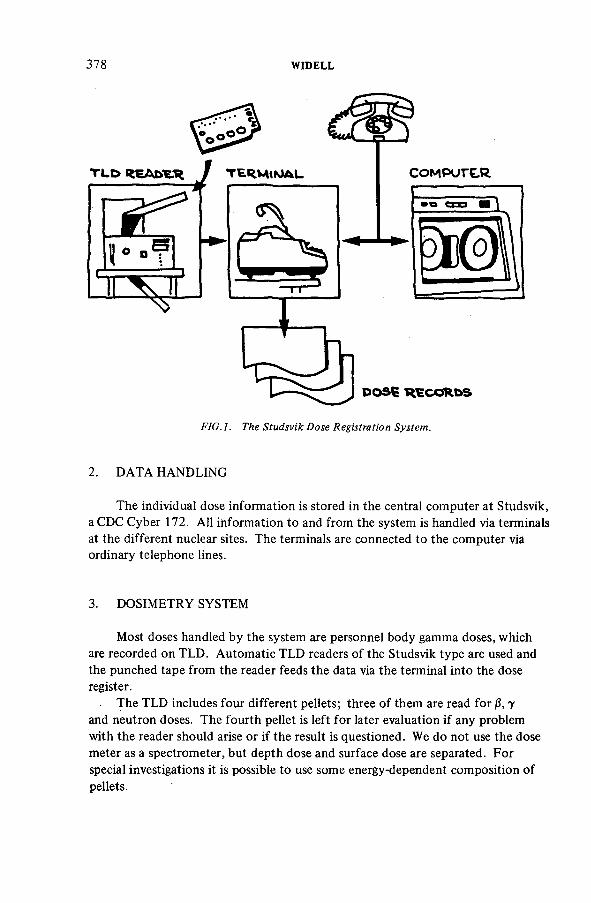
378 WIDELL
F I G . l , T h e S tu d s v ik D o s e R e g is tr a tio n S y s te m .
2. D A TA HANDLING
The individual dose information is stored in the central computer at Studsvik, a CDC Cyber 172. All information to and from the system is handled via terminals at the different nuclear sites. The terminals are connected to the computer via ordinary telephone lines.
3. DOSIMETRY SYSTEM
Most doses handled by the system are personnel body gamma doses, which are recorded on TLD. Autom atic TLD readers o f the Studsvik type are used and the punched tape from the reader feeds the data via the terminal into the dose register.
The TLD includes four different pellets; three o f them are read for /3, 7
and neutron doses. The fourth pellet is left for later evaluation i f any problem with the reader should arise or if the result is questioned. We do not use the dose meter as a spectrometer, but depth dose and surface dose are separated. For special investigations it is possible to use some energy-dependent com position o f pellets.
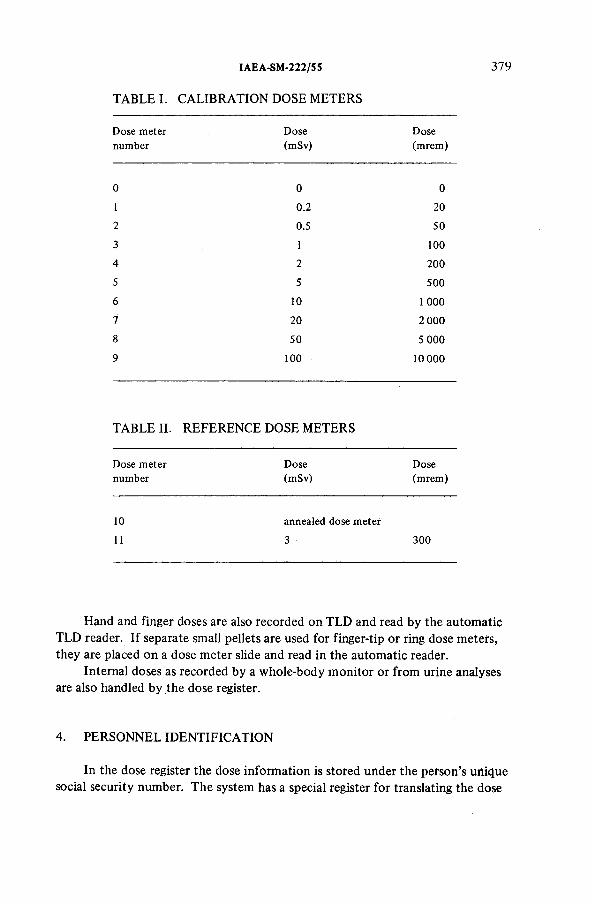
IAEA-SM-222/55
TABLE I. CALIBRATION DOSE METERS
379
Dose meter Dose Dosenumber (mSv) (mrem)
0 0 01 0.2 202 0.5 503 1 О о
4 2 2005 5 5006 10 1 0007 20 2 0008 50 5 0009 100 10 000
TABLE II. REFERENCE DOSE METERS
Dose meter Dose Dosenumber (mSv) (mrem)
10 annealed dose meter11 3 300
Hand and finger doses are also recorded on TLD and read by the automatic TLD reader. I f separate small pellets are used for finger-tip or ring dose meters, they are placed on a dose meter slide and read in the automatic reader.
Internal doses as recorded by a whole-body m onitor or from urine analyses are also handled by the dose register.
4. PERSONNEL IDENTIFICATION
In the dose register the dose information is stored under the person’s unique social security number. The system has a special register for translating the dose
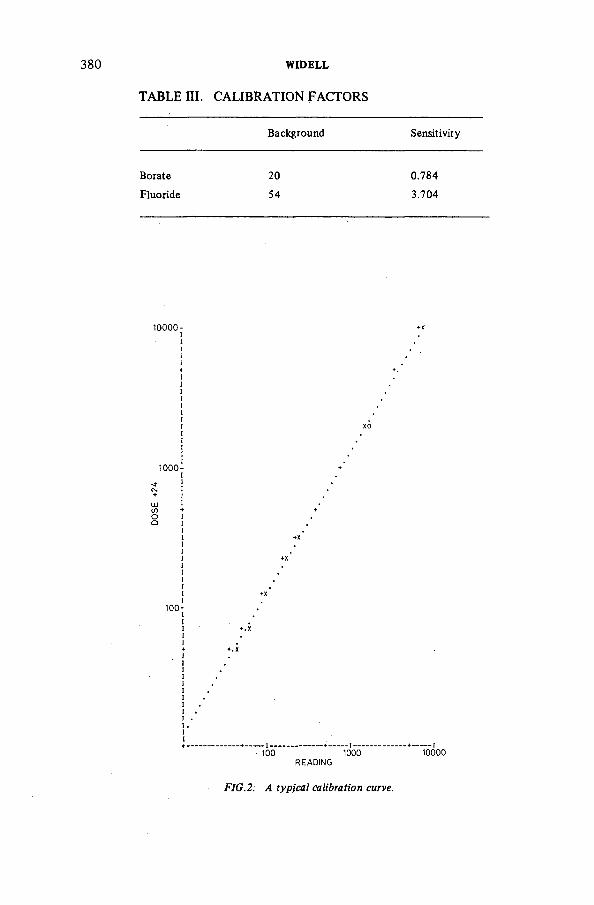
380 WIDELL
TABLE III. CALIBRATION FACTORS
Background Sensitivity
Borate 20 0.784Fluoride 54 3.704
1000
100
100 * 1000 10000 READING
FIG.2. A typical calibration curve.
IAE A-SM-222/5 S 381
meter number to the social security number. For personnel from other countries, their social security number can be used together with the identification o f the country. This identification is taken from the ISO two-letter code for the representation o f names o f countries [ 1 ].
5. CONTROL OF THE CALIBRATION OF THE TLD SYSTEMS
A special routine is used to supervise the status o f the TLD systems. Each month an irradiated series is produced at the Calibration Building at Studsvik for each TLD reader. The doses given range from 0.20 mSv (20 mrem) to 100 mSv (10 000 mrem), as shown in Table I. Calibration dose meters or reference dose meters are read whenever personnel doses are. The reference dose meters are irradiated in the reference dose irradiator (see Table II). In the reference dose irradiator, the dose-meter slide with the pellets is placed on a rotating table. The table is rotated at a constant speed by a synchronous m otor and the TLD pellets are moved in under a 90Sr source with a large surface.
The results from the calibration or reference dose meters are handled by the computer. The computer compares the TLD reading with the nominal value, calculates a calibration factor (Table III) and produces a calibration curve (Fig.2).
This calibration factor is then compared with the previous factor. I f the new factor deviates by more than 10%, a signal is given to the operator, the automatic registration o f doses is stopped and further investigations are made. If the deviation is less than 10%, the new calibration factor is used to calculate the doses.
This calibration control is a necessary safety procedure, since recorded doses are registered without any manual handling.
The monthly calibration series will test the dynamics o f the TLD readers and will, together with the reference dose meters, check the long-term stability o f the dosimetry system.
6 . STANDARDIZATION OF THE CALIBRATION
Twice a year the ionization detectors used for measuring the dose rates in the Calibration Building are checked against sources at the Radiation Protection Institute in Stockholm , the Swedish SSDL.
In the meantime the constancy o f the detectors is checked with a radium source.
Twice each year, the reference dose irradiators are checked using a special series o f dose meters which are irradiated at the Calibration Building at Studsvik
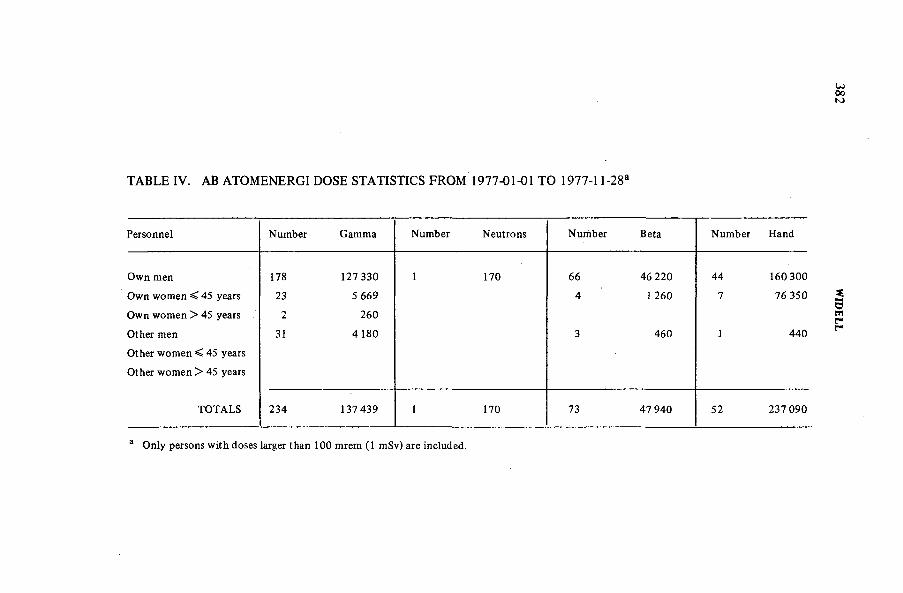
TABLE IV. AB ATOMENERGI DOSE STATISTICS FROM 1977-01-01 TO 1977-1 l-28a
Personnel Number Gamma Number Neutrons Number Beta Number Hand
Own men 178 127 330 1 170 66 46 220 44 160 300Own women < 45 years 23 5 669 4 1 260 7 76 350Own women > 45 years 2 260Other men 31 4180 3 460 1 440Other women < 45 yearsOther women > 45 years
TOTALS 234 137 439 1 170 73 47 940 52 237 090
a Only persons with doses larger than 100 mrem (1 mSv) are included.
382 W
IDELL
IAEA-SM-222/5S 383
The central dose register with all its functions provides a very high degree o f safety in the dosimetry system.
It is ideal for the standardization o f the dosimetry system.As there is no manual handling o f data, the dose register is very reliable.The dose register makes it possible to obtain easily standardized dose
statistics which for any time period show the radiation protection status o f a site (see Table IV).
7. CONCLUSIONS
REFERENCES
[1 ] Codes for the Representation of Names of Countries, International Standard ISO 3166-1974, ISO, Geneva (1974).
DISCUSSION
M.A.F. A Y A D : I should like to know what type o f dose meter was used and what its dimensions were.
C.-O. WIDELL: The pellets are o f lithium borate and lithium fluoride and are 4.8 mm dia. X 1 mm.
. M.A.F. A Y A D : And what was the specification o f the source used for calibration, i.e. how many curies did it have?
C.-O. WIDELL: The dose meters are normally checked against a 100 Ci 137Cs source.
M .A.F. A Y A D : Is the source connected to a synchronized timer?C.-O. WIDELL: Yes, we control the calibration by means o f a timer.M.J. H Ô FERT: Y ou mentioned that depth and surface dose determinations
are possible with your system. What are the respective depths?C.-O. WIDELL: The pellets are covered by 7 m g/cm 2 and 300 m g/cm 2.M.J. HÔFERT : Would it be possible to measure within 7 m g/cm 2 rather than
behind this thickness by employing a thin TLD?C.-O. WIDELL: Yes. It is possible to use 0.1 mm thick LiF in Teflon.H.W. JULIUS: Y our description o f your ‘calibration’ technique dealt mainly
with regular checks on the sensitivity o f the detectors and the reader, the purpose being to maintain reliable operation o f the TLD system. Could you comment on the way the TLD badges are calibrated (and thus evaluated) in terms o f surface and depth dose to an individual? Are these calibrations performed free in air or on a phantom?
384 WIDELL
C.-O. WIDELL: The dose meters are type-tested for the different ISO photon energies. They are also calibrated against the ISO /З-series. The calibrations are performed both free in air and on a phantom.
R. ABEDINZADEH: ICRP Publication 26 describes a new concept o f effective whole-body dose-equivalent registration. Have you considered the problems o f implementing this, and when will the new system be adopted in Sweden?
C.-O. WIDELL: The system has now reached the point where a library o f these different dose-equivalent factors can be introduced. The adoption o f the effective dose equivalents is now under discussion by our governmental authorities.
L.H. LAN ZL: How many persons do you m onitor per month with your system, and how many radiation workers are monitored in Sweden altogether?
C.-O. WIDELL: This depends on whether it is a revision period or not. I f there is no revision, we m onitor about 8000 persons per month. This is about 50% o f all persons m onitored in Sweden.
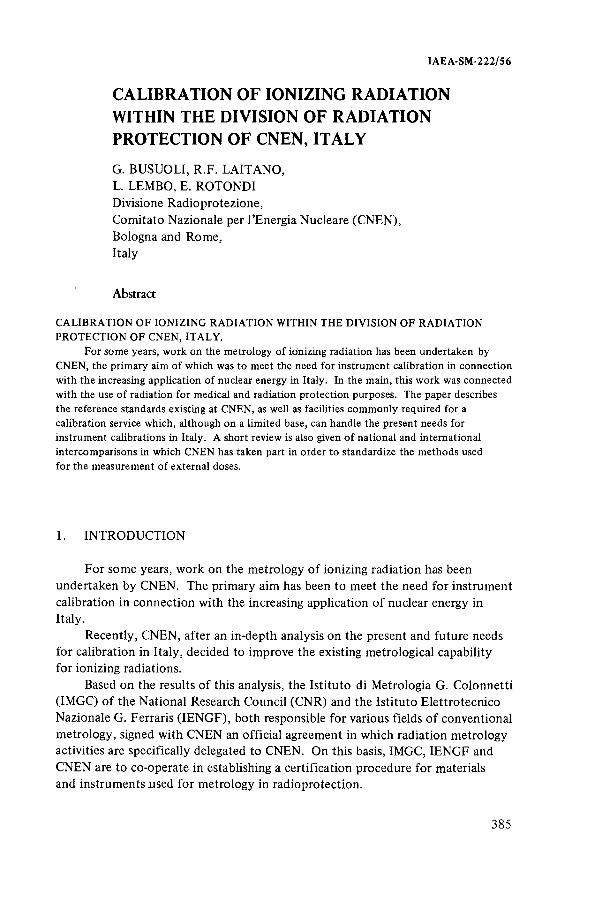
IAEA-SM-222/56
CALIBRATION OF IONIZING RADIATION WITHIN THE DIVISION OF RADIATION PROTECTION OF CNEN, ITALY
G. BUSUOLI, R.F. LAITANO,L. LEMBO, E. ROTONDI Divisione Radioprotezione,Comitato Nazionale per l ’Energia Nucleare (CNEN),Bologna and Rome,Italy
Abstract
CALIBRATION OF IONIZING RADIATION WITHIN THE DIVISION OF RADIATION PROTECTION OF CNEN, ITALY.
For some years, work on the metrology of ionizing radiation has been undertaken by CNEN, the primary aim of which was to meet the need for instrument calibration in connection with the increasing application of nuclear energy in Italy. In the main, this work was connected with the use of radiation for medical and radiation protection purposes. The paper describes the reference standards existing at CNEN, as well as facilities commonly required for a calibration service which, although on a limited base, can handle the present needs for instrument calibrations in Italy. A short review is also given of national and international intercomparisons in which CNEN has taken part in order to standardize the methods used for the measurement of external doses.
1. INTRODUCTION
For some years, work on the metrology o f ionizing radiation has been undertaken by CNEN. The primary aim has been to meet the need for instrument calibration in connection with the increasing application o f nuclear energy in Italy.
Recently, CNEN, after an in-depth analysis on the present and future needs for calibration in Italy, decided to improve the existing metrological capability for ionizing radiations.
Based on the results o f this analysis, the Istituto di Metrologia G. Colonnetti (IMGC) o f the National Research Council (CNR) and the Istituto Elettrotecnico Nazionale G. Ferraris (IENGF), both responsible for various fields o f conventional metrology, signed with CNEN an official agreement in which radiation metrology activities are specifically delegated to CNEN. On this basis, IMGC, IENGF and CNEN are to co-operate in establishing a certification procedure for materials and instruments used for metrology in radioprotection.
385
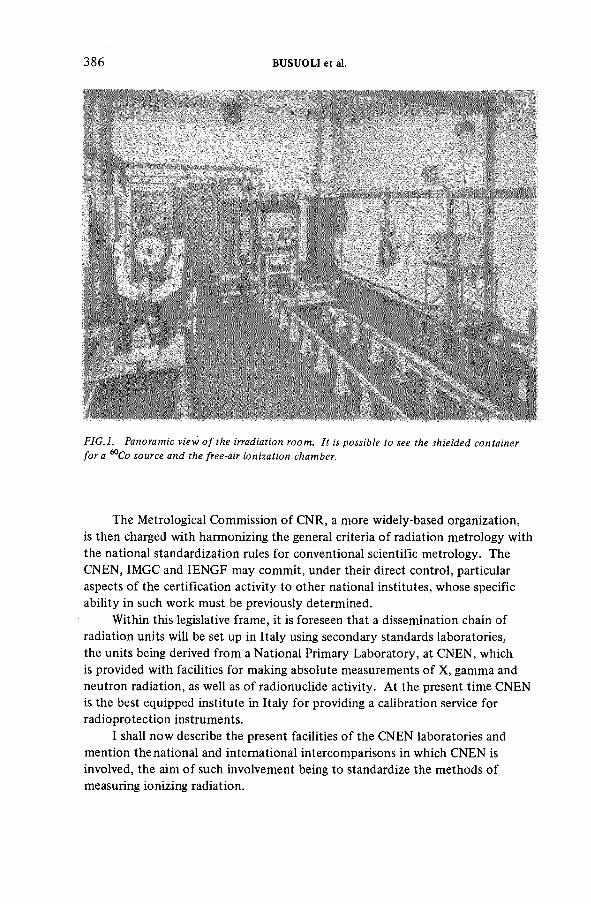
386 BUSUOLI et al.
F I G . l . P a n o r a m ic v iew o f th e irra d ia tio n r o o m . I t is p o s s ib le to see th e s h ie ld e d c o n ta in e r
f o r a 60C o s o u r c e a n d th e fr ee -a ir io n iz a tio n ch a m b er.
The Metrological Commission o f CNR, a more widely-based organization, is then charged with harmonizing the general criteria o f radiation metrology with the national standardization rules for conventional scientific metrology. The CNEN, IMGC and IENGF may com m it, under their direct control, particular aspects o f the certification activity to other national institutes, whose specific ability in such work must be previously determined.
Within this legislative frame, it is foreseen that a dissemination chain o f radiation units will be set up in Italy using secondary standards laboratories, the units being derived from a National Primary Laboratory, at CNEN, which is provided with facilities for making absolute measurements o f X, gamma and neutron radiation, as well as o f radionuclide activity. At the present time CNEN is the best equipped institute in Italy for providing a calibration service for radioprotection instruments.
I shall now describe the present facilities o f the CNEN laboratories and mention the national and international intercomparisons in which CNEN is involved, the aim o f such involvement being to standardize the methods o f measuring ionizing radiation.
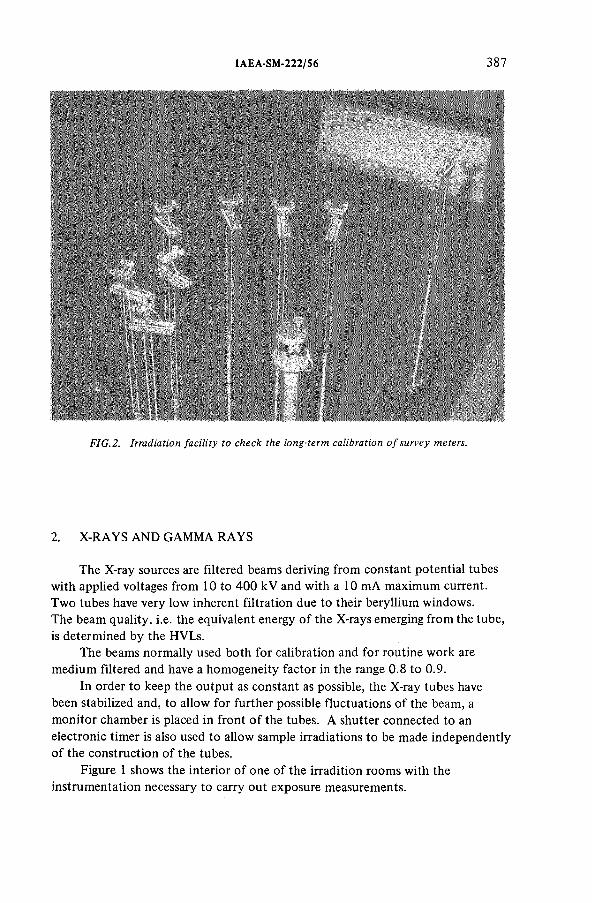
IAEA-SM-222/56 387
F I G .2. Irr a d ia tio n fa c il ity to c h e c k th e lo n g -ter m ca lib ra tio n o f su rv ey m eters.
2. X -RA YS AND GAMMA RAYS
The X-ray sources are filtered beams deriving from constant potential tubes with applied voltages from 10 to 400 kV and with a 10 mA maximum current. Tw o tubes have very low inherent filtration due to their beryllium windows.The beam quality, i.e. the equivalent energy o f the X-rays emerging from the tube, is determined by the HVLs.
The beams normally used both for calibration and for routine work are medium filtered and have a hom ogeneity factor in the range 0.8 to 0.9.
In order to keep the output as constant as possible, the X-ray tubes have been stabilized and, to allow for further possible fluctuations o f the beam, a monitor chamber is placed in front o f the tubes. A shutter connected to an electronic timer is also used to allow sample irradiations to be made independently o f the construction o f the tubes.
Figure 1 shows the interior o f one o f the irradition room s with the instrumentation necessary to carry out exposure measurements.
388 BUSUOLI et al.
TABLE I. RESULTS OF THEINTERCOMPARISON AMONG FREE-AIRIONIZATION CHAMBERS
46 keV 103 keV
BIPM, Sèvres 1.01 -
RIV, Utrecht 1.00 0.99PTB, Braunschweig 0.99 -ISS, Rome - 1.00
Maximum uncertainties: ±2%
ifI
I
FIG.3. Graphite ionization chamber.
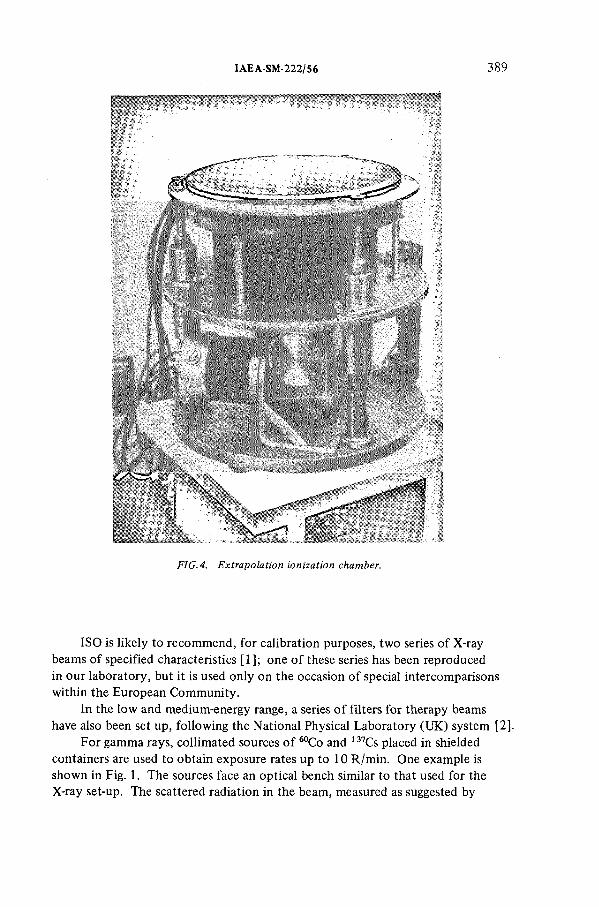
IAEA-SM-222/56 389
ISO is likely to recommend, for calibration purposes, two series o f X-ray beams o f specified characteristics [1 ]; one o f these series has been reproduced in our laboratory, but it is used only on the occasion o f special intercomparisons within the European Community.
In the low and medium-energy range, a series o f filters for therapy beams have also been set up, following the National Physical Laboratory (UK) system [2].
For gamma rays, collimated sources o f 60Co and 137Cs placed in shielded containers are used to obtain exposure rates up to 10 R /m in. One example is shown in Fig. 1. The sources face an optical bench similar to that used for the X-ray set-up. The scattered radiation in the beam, measured as suggested by
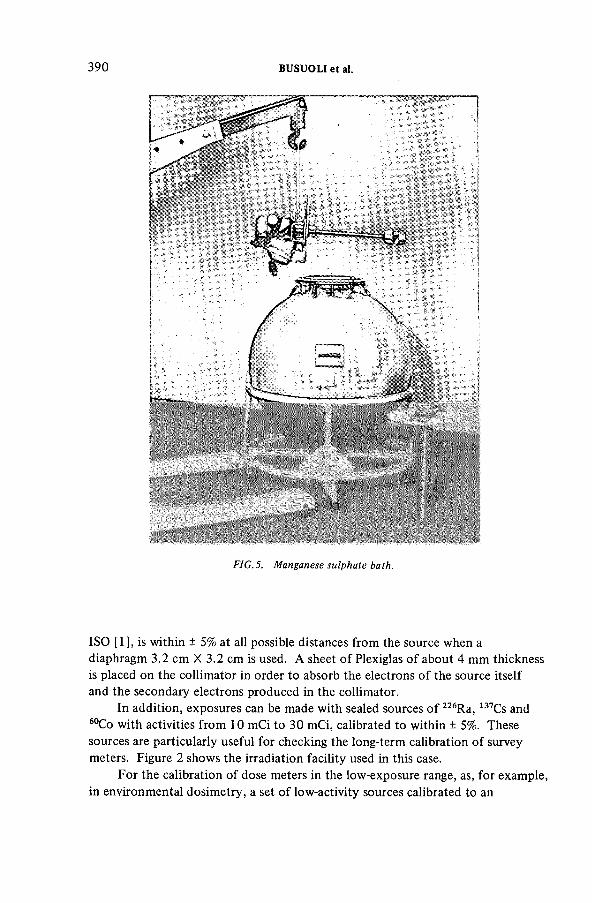
390 BUSUOLI et al.
F I G .5 . M a n g an ese su lp h a te ba th .
ISO [1], is within ± 5% at all possible distances from the source when a diaphragm 3.2 cm X 3.2 cm is used. A sheet o f Plexiglas o f about 4 mm thickness is placed on the collimator in order to absorb the electrons o f the source itself and the secondary electrons produced in the collimator.
In addition, exposures can be made with sealed sources o f 226Ra, 137Cs and 60Co with activities from 10 mCi to 30 mCi, calibrated to within ± 5%. These sources are particularly useful for checking the long-term calibration o f survey meters. Figure 2 shows the irradiation facility used in this case.
For the calibration o f dose meters in the low-exposure range, as, for example, in environmental dosimetry, a set o f low-activity sources calibrated to an
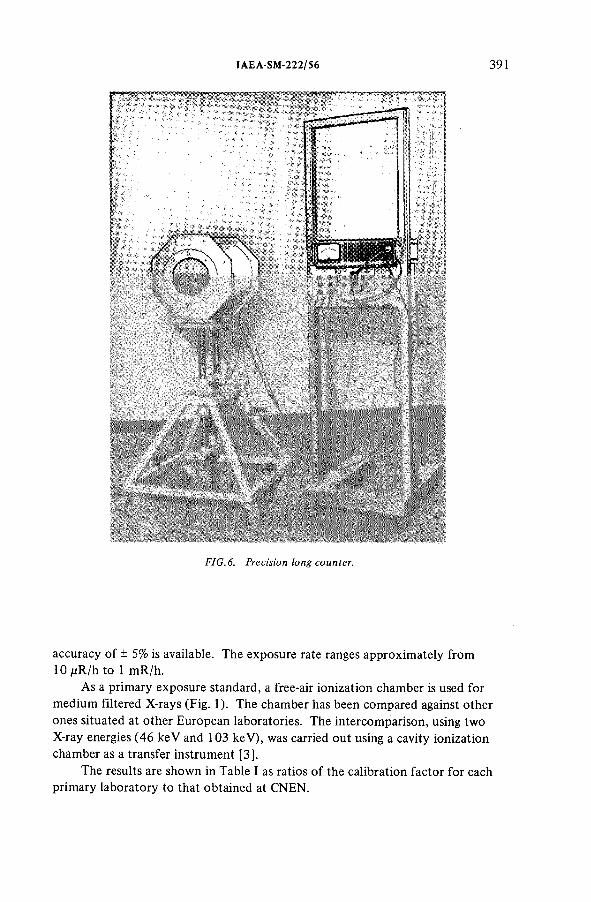
F I G . 6. P r ec is io n lo n g c o u n te r .
accuracy o f ± 5% is available. The exposure rate ranges approximately from 10 ft R /h to 1 m R/h.
As a primary exposure standard, a free-air ionization chamber is used for medium filtered X-rays (Fig. 1). The chamber has been compared against other ones situated at other European laboratories. The intercomparison, using two X-ray energies (46 keV and 103 keV), was carried out using a cavity ionization chamber as a transfer instrument [3].
The results are shown in Table I as ratios o f the calibration factor for each primary laboratory to that obtained at CNEN.
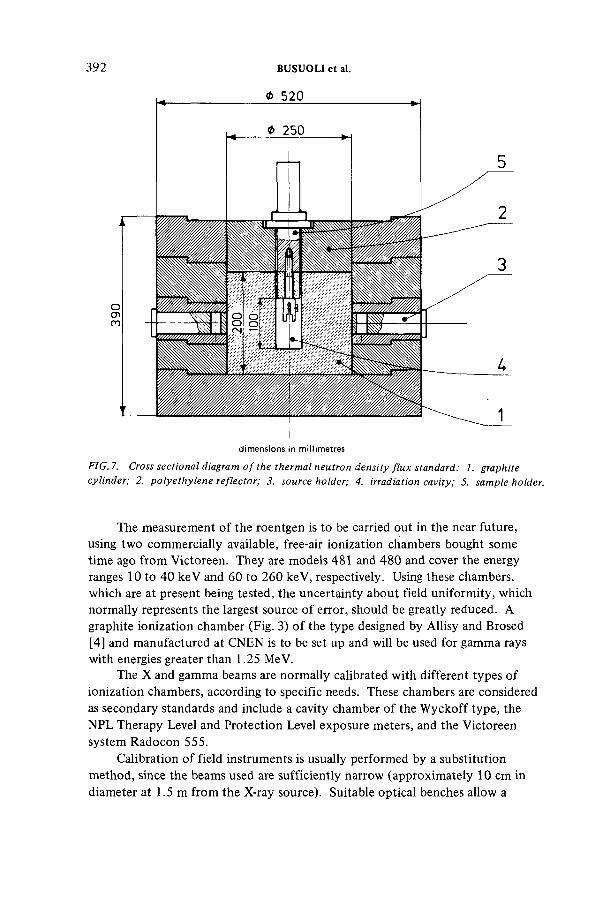
392 BUSUOLI et al.
0 520
0 250
dimensions in millimetresF I G . 7. C ro ss s e c t io n a l diagram o f th e th e r m a l n eu tr o n d e n s ity f l u x sta n d a rd : 1 . g ra p h ite
c y lin d e r ; 2. p o ly e th y le n e r e fle c to r ; 3. s o u r c e h o ld e r ; 4. irra d ia tion ca v ity ; 5. sa m p le h o ld er .
The measurement o f the roentgen is to be carried out in the near future, using two commercially available, free-air ionization chambers bought some time ago from Victoreen. They are models 481 and 480 and cover the energy ranges 10 to 40 keV and 60 to 260 keV, respectively. Using these chambers, which are at present being tested, the uncertainty about field uniformity, which normally represents the largest source o f error, should be greatly reduced. A graphite ionization chamber (Fig. 3) o f the type designed by Allisy and Brosed[4] and manufactured at CNEN is to be set up and will be used for gamma rays with energies greater than 1.25 MeV.
The X and gamma beams are normally calibrated with different types o f ionization chambers, according to specific needs. These chambers are considered as secondary standards and include a cavity chamber o f the W yckoff type, the NPL Therapy Level and Protection Level exposure meters, and the Victoreen system Radocon 555.
Calibration o f field instruments is usually performed by a substitution method, since the beams used are sufficiently narrow (approximately 10 cm in diameter at 1.5 m from the X-ray source). Suitable optical benches allow a
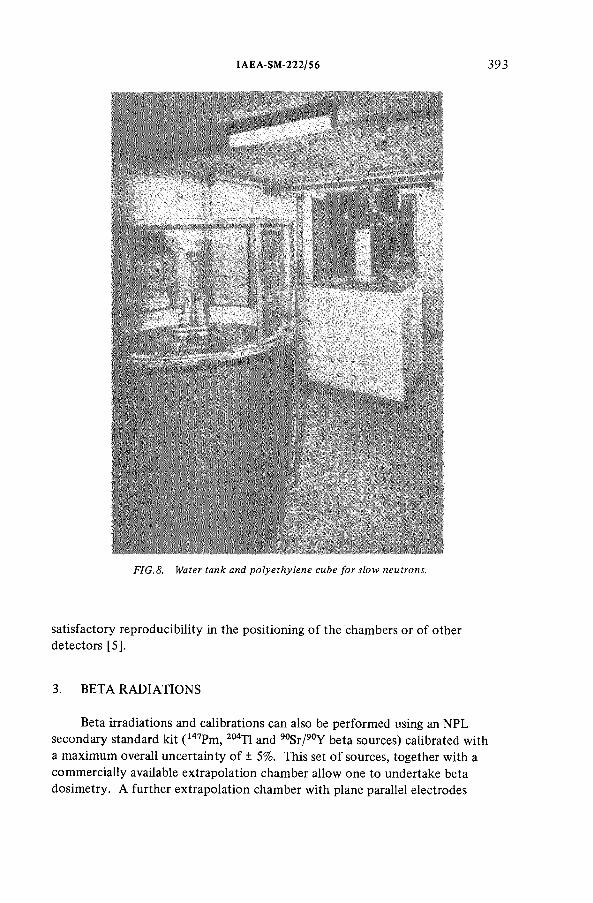
IAEA-SM-222/56 393
F I G . 8. W ater ta n k a n d p o ly e th y le n e c u b e f o r s lo w n eu tr o n s.
satisfactory reproducibility in the positioning o f the chambers or o f other detectors [5].
3. BETA RADIATIONS
Beta irradiations and calibrations can also be performed using an NPL secondary standard kit ( 147Pm, 204T1 and 90Sr/90Y beta sources) calibrated with a maximum overall uncertainty o f ± 5%. This set o f sources, together with a commercially available extrapolation chamber allow one to undertake beta dosimetry. A further extrapolation chamber with plane parallel electrodes
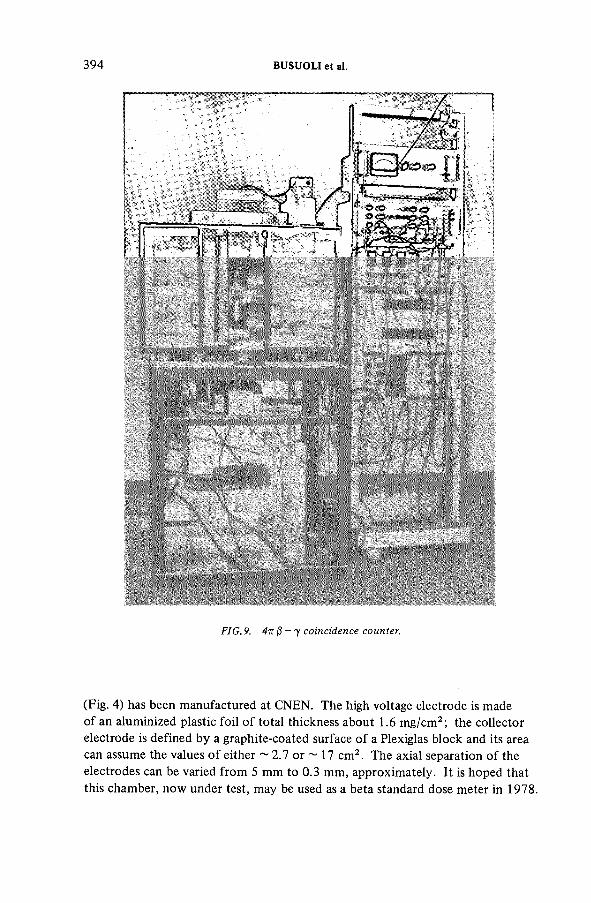
394 BUSUOLI et al.
F I G .9. 4 tï P — y c o in c id e n c e c o u n te r .
(Fig. 4) has been manufactured at CNEN. The high voltage electrode is made o f an aluminized plastic foil o f total thickness about 1.6 m g/cm 2; the collector electrode is defined by a graphite-coated surface o f a Plexiglas block and its area can assume the values o f either ~ 2.7 or ~ 17 cm 2. The axial separation o f the electrodes can be varied from 5 mm to 0.3 mm, approximately. It is hoped that this chamber, now under test, may be used as a beta standard dose meter in 1978
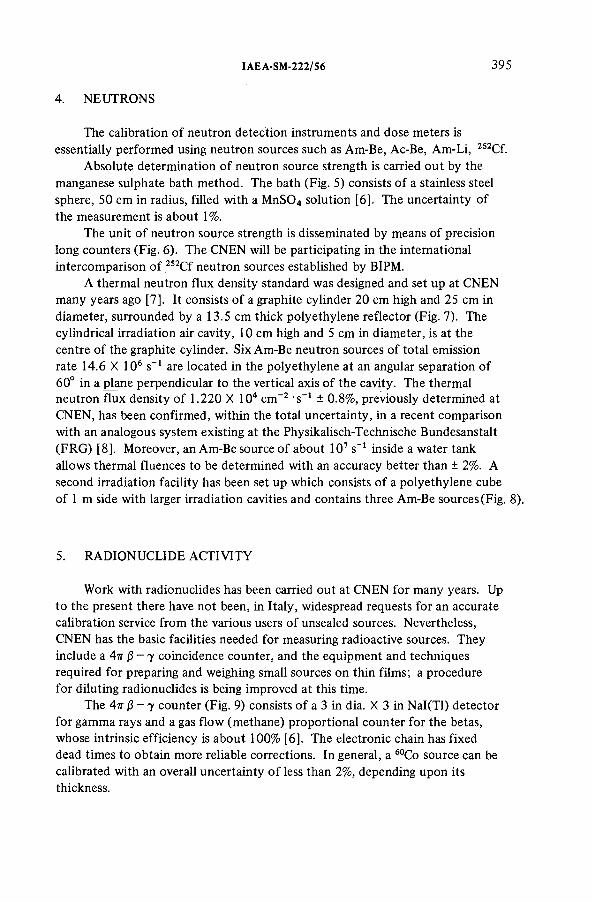
4. NEUTRONS
I AEA-SM-222/56 395
The calibration o f neutron detection instruments and dose meters is essentially performed using neutron sources such as Am-Be, А с-Be, Am-Li, 252Cf.
Absolute determination o f neutron source strength is carried out by the manganese sulphate bath method. The bath (Fig. 5) consists o f a stainless steel sphere, 50 cm in radius, filled with a M nS04 solution [6 ]. The uncertainty o f the measurement is about 1%.
The unit o f neutron source strength is disseminated by means o f precision long counters (Fig. 6). The CNEN will be participating in the international intercomparison o f 252C f neutron sources established by BIPM.
A thermal neutron flux density standard was designed and set up at CNEN many years ago [7]. It consists o f a graphite cylinder 20 cm high and 25 cm in diameter, surrounded by a 13.5 cm thick polyethylene reflector (Fig. 7). The cylindrical irradiation air cavity, 10 cm high and 5 cm in diameter, is at the centre o f the graphite cylinder. Six Am-Be neutron sources o f total emission rate 14.6 X 10⁶ s' 1 are located in the polyethylene at an angular separation o f 60° in a plane perpendicular to the vertical axis o f the cavity. The thermal neutron flux density o f 1.220 X 104 cm -2 's ' 1 ± 0.8%, previously determined at CNEN, has been confirmed, within the total uncertainty, in a recent comparison with an analogous system existing at the Physikalisch-Technische Bundesanstalt (FR G ) [8 ]. Moreover, an Am-Be source o f about 10 7 s_1 inside a water tank allows thermal fluences to be determined with an accuracy better than ± 2%. A second irradiation facility has been set up which consists o f a polyethylene cube o f 1 m side with larger irradiation cavities and contains three Am-Be sources (Fig. 8).
5. RADIONUCLIDE ACTIVITY
Work with radionuclides has been carried out at CNEN for many years. Up to the present there have not been, in Italy, widespread requests for an accurate calibration service from the various users o f unsealed sources. Nevertheless, CNEN has the basic facilities needed for measuring radioactive sources. They include a 4ît /3 - 7 coincidence counter, and the equipment and techniques required for preparing and weighing small sources on thin films; a procedure for diluting radionuclides is being improved at this time.
The 4ir ¡3 - 7 counter (Fig. 9) consists o f a 3 in dia. X 3 in Nal(Tl) detector for gamma rays and a gas flow (methane) proportional counter for the betas, whose intrinsic efficiency is about 100% [6 ]. The electronic chain has fixed dead times to obtain more reliable corrections. In general, a 60Co source can be calibrated with an overall uncertainty o f less than 2%, depending upon its thickness.
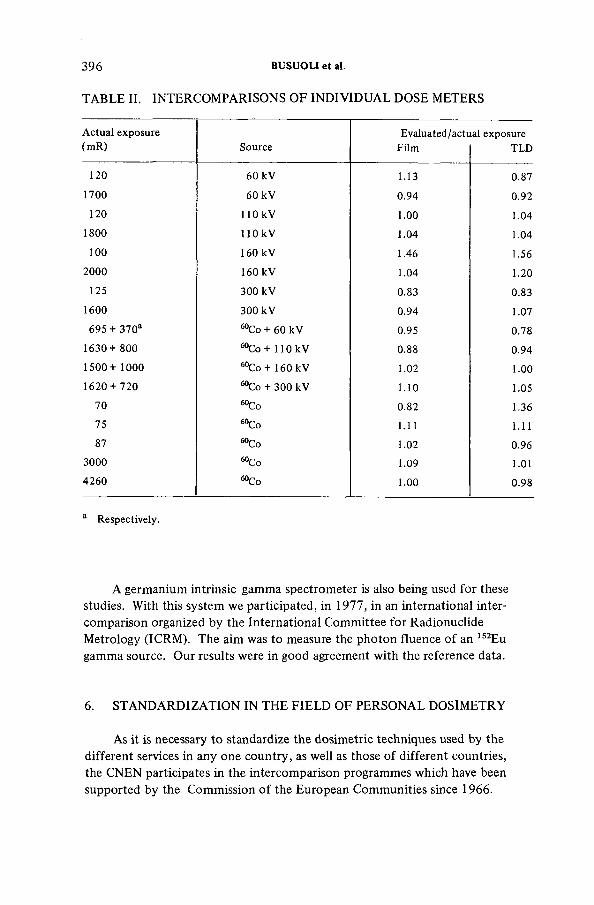
TABLE II. INTERCOMPARISONS OF INDIVIDUAL DOSE METERS
396 BUSUOLI et al.
Actual exposure (mR) Source
Evalua ted/acti Film
tal exposure TLD
120 60 kV 1.13 0.871700 60 kV 0.94 0.92120 110 kV 1.00 1.04
1800 110 kV 1.04 1.04100 160 kV 1.46 1.56
2000 160 kV 1.04 1.20125 300 kV 0.83 0.83
1600 300 kV 0.94 1.07695+ 370a “ Co + 60 kV 0.95 0.78
1630+ 800 “ Co + HOkV 0.88 0.941500+ 1000 60Co + 160 kV 1.02 1.001620 + 720 “ Co + 300 kV 1.10 1.05
70 “ Co 0.82 1.3675 “ Co 1.11 1.1187 “ Co 1.02 0.96
3000 “ Co 1.09 1.014260 “ Co 1.00 0.98
a Respectively.
A germanium intrinsic gamma spectrometer is also being used for these studies. With this system we participated, in 1977, in an international intercomparison organized by the International Committee for Radionuclide Metrology (ICRM). The aim was to measure the photon fluence o f an 152Eu gamma source. Our results were in good agreement with the reference data.
6 . STANDARDIZATION IN THE FIELD OF PERSONAL DOSIMETRY
As it is necessary to standardize the dosimetric techniques used by the different services in any one country, as well as those o f different countries, the CNEN participates in the intercomparison programmes which have been supported by the Commission o f the European Communities since 1966.
IAEA-SM-222/S6 397
Table II gives an example o f the results obtained during an intercomparison o f X and gamma-ray dose meters in the energy range 60 keV up to 1.25 MeV.In this case two different dose meters were employed, one using films and the other using thermoluminescent sintered BeO discs in a two element prototype[8].
In Italy, the CNEN, owing to the experience gained in these intercomparisons, is acting as co-ordinator o f a similar programme among the Italian dosimetric services.
At present the CNEN is carrying out an intercomparison o f a 60Co gamma source with two European laboratories. In this case we are using, as transfer instruments, thermoluminescent dose meters, as they are easy to handle and show, for the purpose o f this comparison, sufficient reliability and accuracy.
Much effort has been put into studying and developing personal neutron dose meters. Particular attention has been paid to the problem o f accident dosimetry and, to this end, the CNEN usually participates in the intercomparisons which have been organized by the IAEA since 1969.
REFERENCES
[1] INTERNATIONAL ORGANIZATION FOR STANDARDIZATION, Draft standard ISO/DIS 4037 (1976).
[2] BRITISH CALIBRATION SERVICE, “Calibration of Radiological Therapy Level Instruments: X- and Gamma-Rays”, Guidance publication sponsored by the Advisory Council on Calibration and Measurements (Jan. 1977).
[3] BUSUOLI, G., CAVALLINI, A., LEMBO, L., Comparison between the free-air ionization chamber of the Health Physics Laboratory of the CNEN of Bologna and the chambersof other European laboratories, G. Fis. Sanit. Prot. Radiaz. IS 1 (1971) 28.
[4] ALLISY, A., BROSED, Procès Verbaux du Comité International des Poids et Mesures,2° Série 35(1967) 64.
[5] BALDINI, G., BUSUOLI, G., CAVALLINI, A., LEMBO, L., SERMENGHI, I.,TADOLINI, V., Attrezzature di taratura e irraggiamento del Laboratorio di Física Sanitaria di Bologna, RT/PROT 9, CNEN (1977).
[6] ROTONDI, E., Calibrazione assoluta di una sorgente di neutroni di AmBe mediante ilmétodo del bagno al solfato di manganese, RT/PROT 36, CNEN (1973).
[7] ROTONDI, E., Lo standard di densitá di flusso di neutroni termici presso il CSN dellaCasaccia, RT/PROT 37, CNEN (1973).
[8] LAITANO, R.F., ROTONDI, E., Risultati di un confronto fra lo standard di neutroni termici del CSN Casaccia (CNEN) e quello del PTB di Braunschweig (RTF), RT/PROT 36, CNEN (1974).

IAEA-SM-222/04
CALIBRATION OF PERSONNEL DOSE METERS*
E. STORM, J.R. CORTEZ, G.J. LITTLEJOHN Los Alamos Scientific Laboratory,University o f California,Los Alamos, New M exico,United States o f America
Abstract
CALIBRATION OF PERSONNEL DOSE METERS.Methods of calibrating both film and thermoluminescent dose meters (TLD) to photon
and electron radiations are described. К fluorescent X-rays, heavily filtered X-ray beams, and isotope gamma rays are used at the Los Alamos calibration facility to measure the energy and angular response of radiation detectors over a photon energy range of 10 to 1000 keV. Beam spectra, alignment, size and uniformity are discussed. The energy and angular response of dose meters to electrons is measured with beta-emitting isotopes varying in maximum energy from 770 to 2300 keV. A free-air ionization chamber is the primary standard used in the measurement of photon radiation. Thimble-sized ionization chambers, calibrated to the free- air chamber, serve as secondary standards. Electron radiation is measured with an end-window ionization chamber having a 7 mg/cm2 approximately tissue-equivalent plastic wall. Photon calibrations are performed with personnel dose meters in air, on a phantom, and in a phantom. If the personnel dose meter and secondary chamber are both in air, or both on or both in a’ phantom, the response of the LiF TLD chip, relative to the secondary chamber, is the same. However, the film dose meter shows a larger relative response on or in the phantom than in air. With beta sources, personnel dose meters are calibrated by exposing the dose meter either in air to a high-dose-rate 90Sr (90Y) source, or in contact with a low-dose-rate uranium source.The differences in personnel dose meter response observed between the two methods are discussed. The personnel dose meters are calibrated to determine penetrating doses by placing the secondary chamber 1 cm deep in a phantom and the personnel dose meter on the surface, with a filter over the TLD to simulate 1 cm depth. Non-penetrating dose calibrations are measured by placing both chamber and dose meter on the surface of the phantom.
1. INTRODUCTION
The photon and electron response o f personnel dose meters varies with the energy o f the photon or electron. The Los Alamos calibration facility was designed to measure dose meter response to photons over the range 10 to 1000 keV and to electrons over the range 770 to 2300 keV in terms o f maximum beta-ray energy.
* Work performed under the auspices of USERDA, Contract W-7405-ENG. 36.
399
400 STORM et al.
2. PHOTON MEASUREMENTS
2.1. Sources
The photon energy range is covered with three types o f sources: ( 1 ) К fluorescent X-rays from 10 to 100 keV; (2) heavily filtered X-ray beams from 100 to 250 keV; and (3 ) isotope gamma rays from above 250 to 1000 keV.
A 300 kV constant potential X-ray unit is the primary source for the 10 to 100 keV energy region. Photons emitted from the primary tungsten target o f the X-ray tube excite К X-rays in secondary targets varying in atomic number from 29 to 92. The radiation emitted by the secondary target consists not only o f К X-rays, but also includes the scattered bremsstrahlung contaminant. L X-rays are removed by aluminium filters. Spectral measurements indicate that the purity (K -photon to K-photon-plus-scatter intensity) o f the secondary beam is > 0.95 for 29 < Z < 64, but gradually decreases for higher Z, reaching a low o f 0.87 for Z = 92.
The fluorescent beam is aligned with respect to an instrument table by means o f pinhole photographs. Beam size and uniformity are also measured by photographic film. The observed intensity is uniform over a circular region and falls o f f gradually at the edges. The diameter, d, o f the central uniform region is proportional to the source-to-detector distance, r, and given by d = 0.08 r. The inverse-square law is obeyed to within 2% for distances greater than 15 cm from the fluorescent diaphragm. Fluorescent dose rates vary from 15 to 60 m R/m in at 50 cm.
Calibration points in the 100 to 250 keV region are obtained with the primary X-ray beam. The potential applied to the X-ray tube is varied, and large amounts o f filtration (8 to 20 g /cm 2 tin) are used to obtain relatively narrow spectrum bands. Spectral widths at half-height vary from 20 to 60 keV. Narrower spectral bands could be obtained by using thicker filters, but sufficient intensity for dose meter calibration is a limiting factor. Although the spectral bands are by no means monoenergetic, they do give a reasonable estimate o f the dose meter energy response in the 100 to 250 keV region, because the Com pton interaction, which dominates, changes slowly with energy, and the personnel dose meter response is relatively flat in this energy region. Diaphragms are used to obtain beam size and uniformity similar to that obtained with the fluorescent sources.Dose rates are approximately 70 m R/m in at 50 cm.
The higher energies are obtained with gamma rays from isotopes. Dose meters are calibrated with the 412 keV line o f 198Au, the 662 keV line o f 137Cs, and the 1170 and 1330 keV lines o f 60Co. The sources are located in polystyrene rods about midway between floor and ceiling o f a large, relatively scatter-free room . Dose rates are approximately 40 m R/m in at 40 cm.
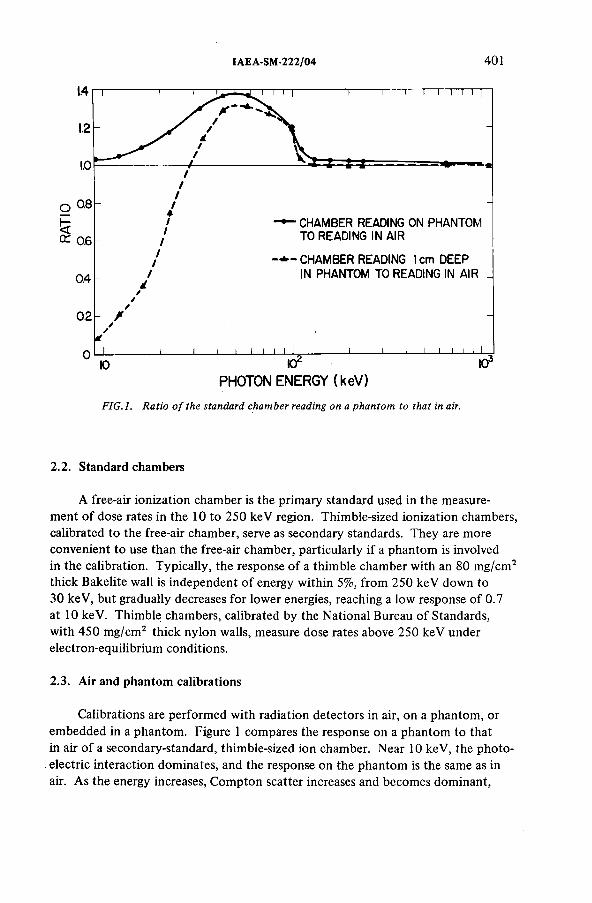
IAEA-SM-222/04 401
F I G . l . R a t io o f th e s ta n d a rd c h a m b e r rea d in g o n a p h a n to m to th a t in air.
2.2. Standard chambers
A free-air ionization chamber is the primary standard used in the measurement o f dose rates in the 10 to 250 keV region. Thimble-sized ionization chambers, calibrated to the free-air chamber, serve as secondary standards. They are more convenient to use than the free-air chamber, particularly if a phantom is involved in the calibration. Typically, the response o f a thimble chamber with an 80 m g/cm 2 thick Bakelite wall is independent o f energy within 5%, from 250 keV down to 30 keV, but gradually decreases for lower energies, reaching a low response o f 0.7 at 10 keV. Thimble; chambers, calibrated by the National Bureau o f Standards, with 450 m g/cm 2 thick nylon walls, measure dose rates above 250 keV under electron-equilibrium conditions.
2.3. Air and phantom calibrations
Calibrations are performed with radiation detectors in air, on a phantom, or embedded in a phantom. Figure 1 compares the response on a phantom to that in air o f a secondary-standard, thimble-sized ion chamber. Near 10 keV, the photoelectric interaction dominates, and the response on the phantom is the same as in air. As the energy increases, Com pton scatter increases and becomes dominant,
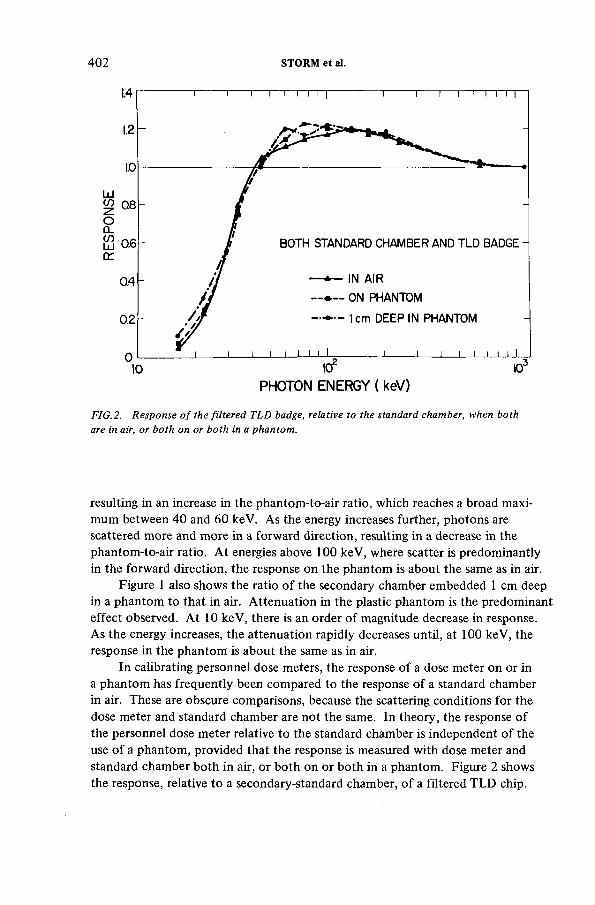
402 STORM et al.
F I G .2 . R e s p o n s e o f th e f i l t e r e d T L D badge, re la tiv e to th e s ta n d a rd c h a m b er , w h en b o th
are in air, o r b o th o n o r b o th in a p h a n to m .
resulting in an increase in the phantom-to-air ratio, which reaches a broad maximum between 40 and 60 keV. As the energy increases further, photons are scattered more and more in a forward direction, resulting in a decrease in the phantom-to-air ratio. A t energies above 100 keV, where scatter is predominantly in the forward direction, the response on the phantom is about the same as in air.
Figure 1 also shows the ratio o f the secondary chamber embedded 1 cm deep in a phantom to that in air. Attenuation in the plastic phantom is the predominant effect observed. At 10 keV, there is an order o f magnitude decrease in response.As the energy increases, the attenuation rapidly decreases until, at 100 keV, the response in the phantom is about the same as in air.
In calibrating personnel dose meters, the response o f a dose meter on or in a phantom has frequently been compared to the response o f a standard chamber in air. These are obscure comparisons, because the scattering conditions for the dose meter and standard chamber are not the same. In theory, the response o f the personnel dose meter relative to the standard chamber is independent o f the use o f a phantom, provided that the response is measured with dose meter and standard chamber both in air, or both on or both in a phantom. Figure 2 shows the response, relative to a secondary-standard chamber, o f a filtered TLD chip.
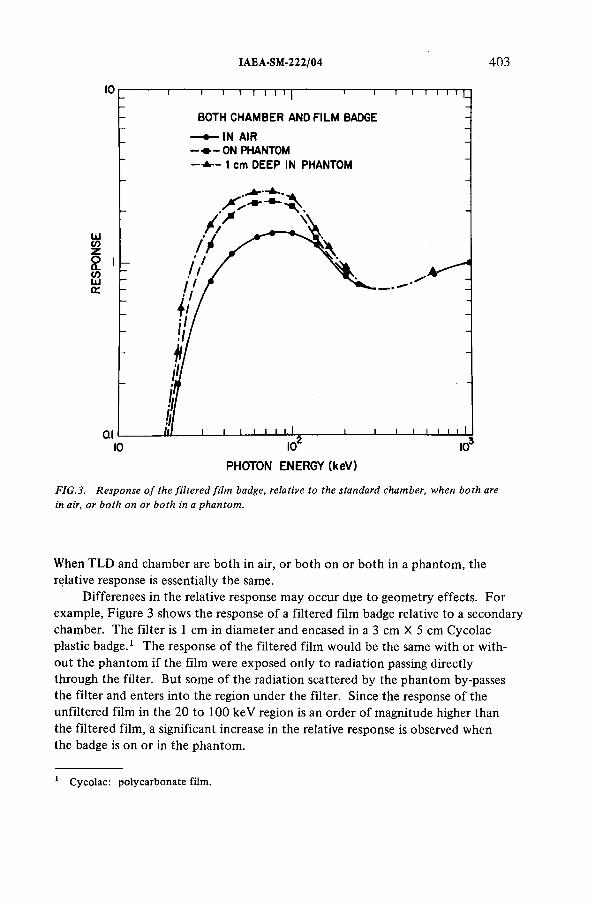
IAEA-SM-222/04 403
F I G .3 . R e s p o n s e o f th e f i l t e r e d f i lm b a d g e, r e la tiv e to th e sta n d a rd c h a m b er , w h en b o th are
in air, o r b o th o n o r b o th in a p h a n to m .
When TLD and chamber are both in air, or both on or both in a phantom, the relative response is essentially the same.
Differences in the relative response may occur due to geometry effects. For example, Figure 3 shows the response o f a filtered film badge relative to a secondary chamber. The filter is 1 cm in diameter and encased in a 3 cm X 5 cm Cycolac plastic badge. 1 The response o f the filtered film would be the same with or without the phantom if the film were exposed only to radiation passing directly through the filter. But some o f the radiation scattered by the phantom by-passes the filter and enters into the region under the filter. Since the response o f the unfiltered film in the 20 to 100 ke V region is an order o f magnitude higher than the filtered film, a significant increase in the relative response is observed when the badge is on or in the phantom.
1 Cycolac: polycarbonate film.
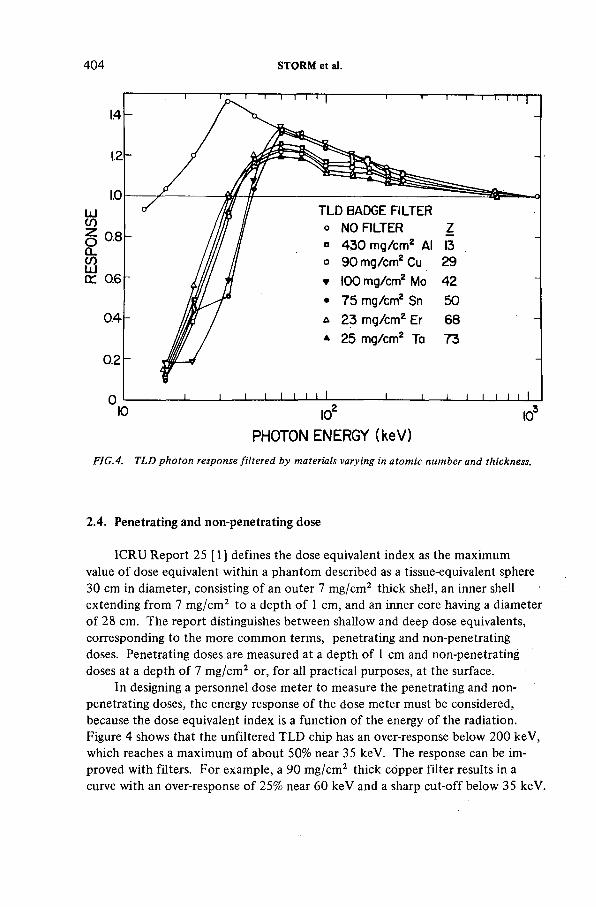
404 STORM et al.
PHOTON ENERGY (keV)jF I G .4. T L D p h o t o n r e sp o n se f i l t e r e d b y m a teria ls varying in a to m ic n u m b e r a n d th ic k n e s s .
2.4. Penetrating and non-penetrating dose
ICRU Report 25 [1] defines the dose equivalent index as the maximum value o f dose equivalent within a phantom described as a tissue-equivalent sphere 30 cm in diameter, consisting o f an outer 7 m g/cm 2 thick shell, an inner shell extending from 7 m g/cm 2 to a depth o f 1 cm, and an inner core having a diameter o f 28 cm. The report distinguishes between shallow and deep dose equivalents, corresponding to the more com m on terms, penetrating and non-penetrating doses. Penetrating doses are measured at a depth o f 1 cm and non-penetrating doses at a depth o f 7 m g/cm 2 or, for all practical purposes, at the surface.
In designing a personnel dose meter to measure the penetrating and nonpenetrating doses, the energy response o f the dose meter must be considered, because the dose equivalent index is a function o f the energy o f the radiation. Figure 4 shows that the unfiltered TLD chip has an over-response below 200 keV, which reaches a maximum o f about 50% near 35 keV. The response can be improved with filters. For example, a 90 m g/cm 2 thick copper filter results in a curve with an over-response o f 25% near 60 keV and a sharp cu t-off below 35 keV.
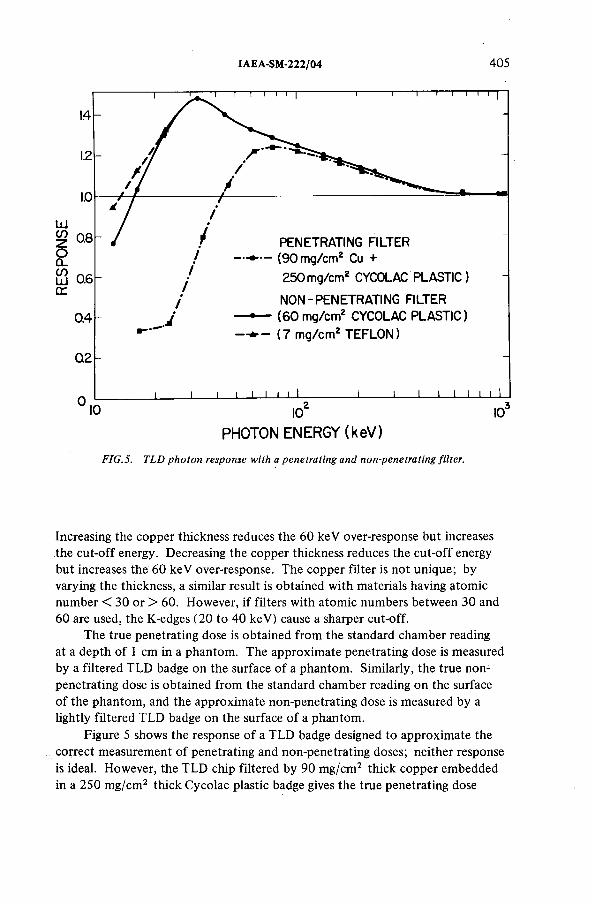
IAEA-SM-222/04 405
0.4
0.2 -
PENETRATING FILTER (90 mg/cm2 Cu + 250 mg/cm2 CYCOLAC PLASTIC )
NON-PENETRATING FILTER ( 6 0 mg/cm2 CYCOLAC PLASTIC) (7 m g/cm 2 TEFLON)
I I I___I__ I I I J______ 1____ I___ 1__ I I I I10 10
PHOTON ENERGY (keV)10
F I G .5 . T L D p h o t o n r e s p o n s e w ith a p e n e tr a tin g a n d n o n -p e n e tr a tin g fi lte r .
Increasing the copper thickness reduces the 60 keV over-response but increases the cu t-off energy. Decreasing the copper thickness reduces the cu t-o ff energy but increases the 60 keV over-response. The copper filter is not unique; by varying the thickness, a similar result is obtained with materials having atomic number < 30 or > 60. However, if filters with atomic numbers between 30 and 60 are used, the K-edges (20 to 40 keV) cause a sharper cut-off.
The true penetrating dose is obtained from the standard chamber reading at a depth o f 1 cm in a phantom. The approximate penetrating dose is measured by a filtered TLD badge on the surface o f a phantom. Similarly, the true nonpenetrating dose is obtained from the standard chamber reading on the surface o f the phantom, and the approximate non-penetrating dose is measured by a lightly filtered TLD badge on the surface o f a phantom.
Figure 5 shows the response o f a TLD badge designed to approximate the correct measurement o f penetrating and non-penetrating doses; neither response is ideal. However, the TLD chip filtered by 90 m g/cm 2 thick copper embedded in a 250 m g/cm 2 thick C ycolac plastic badge gives the true penetrating dose
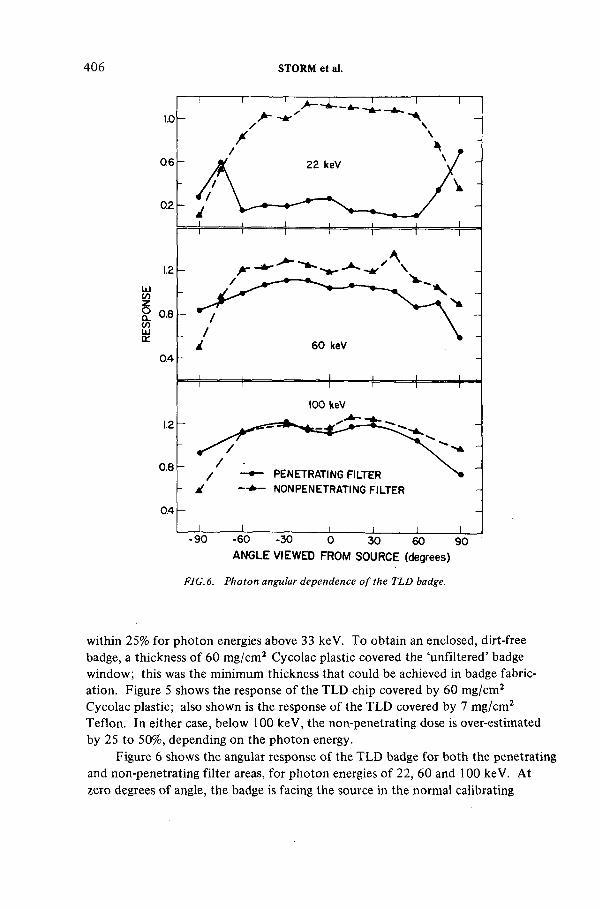
406 STORM et al.
ANGLE VIEWED FROM SOURCE (degrees)
F I G .6 . P h o t o n an gu la r d e p e n d e n c e o f th e T L D badge.
within 25% for photon energies above 33 keV. T o obtain an enclosed, dirt-free badge, a thickness o f 60 m g/cm 2 Cycolac plastic covered the ‘unfiltered’ badge window; this was the minimum thickness that could be achieved in badge fabrication. Figure 5 shows the response o f the TLD chip covered by 60 m g/cm 2 Cycolac plastic; also shown is the response o f the TLD covered by 7 m g/cm 2 Teflon. In either case, below 100 keV, the non-penetrating dose is over-estimated by 25 to 50%, depending on the photon energy.
Figure 6 shows the angular response o f the TLD badge for both the penetrating and non-penetrating filter areas, for photon energies o f 22, 60 and 100 keV. At zero degrees o f angle, the badge is facing the source in the normal calibrating
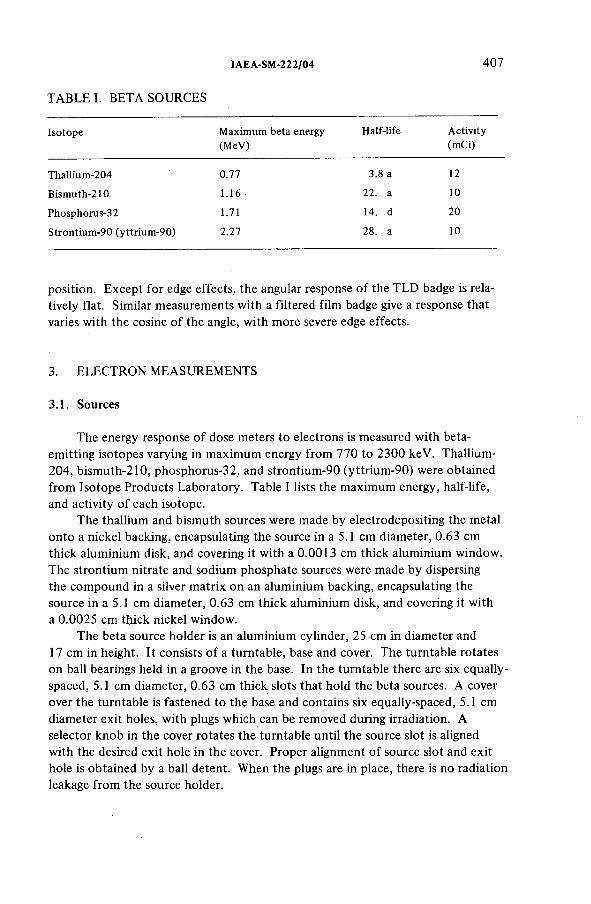
IAEA-SM-222/04 407
TABLE I. BETA SOURCES
Isotope Maximum beta energy (MeV)
Half-life Activity(mCi)
Thallium-204 0.77 3.8 a 12Bismuth-210 1.16 22. a 10Phosphorus-32 1.71 14. d 20Strontium-90 (yttrium-90) 2.27 28. a 10
position. Except for edge effects, the angular response o f the TLD badge is relatively flat. Similar measurements with a filtered film badge give a response that varies with the cosine o f the angle, with more severe edge effects.
3. ELECTRON MEASUREMENTS
3.1. Sources
The energy response o f dose meters to electrons is measured with beta- emitting isotopes varying in maximum energy from 770 to 2300 keV. Thallium- 204, bismuth-210, phosphorus-32, and strontium-90 (yttrium-90) were obtained from Isotope Products Laboratory. Table I lists the maximum energy, half-life, and activity o f each isotope.
The thallium and bismuth sources were made by electrodepositing the metal onto a nickel backing, encapsulating the source in a 5.1 cm diameter, 0.63 cm thick aluminium disk, and covering it with a 0.0013 cm thick aluminium window. The strontium nitrate and sodium phosphate sources were made by dispersing the com pound in a silver matrix on an aluminium backing, encapsulating the source in a 5.1 cm diameter, 0.63 cm thick aluminium disk, and covering it with a 0.0025 cm thick nickel window.
The beta source holder is an aluminium cylinder, 25 cm in diameter and 17 cm in height. It consists o f a turntable, base and cover. The turntable rotates on ball bearings held in a groove in the base. In the turntable there are six equally- spaced, 5.1 cm diameter, 0.63 cm thick slots that hold the beta sources. A cover over the turntable is fastened to the base and contains six equally-spaced, 5.1 cm diameter exit holes, with plugs which can be removed during irradiation. A selector knob in the cover rotates the turntable until the source slot is aligned with the desired exit hole in the cover. Proper alignment o f source slot and exit hole is obtained by a ball detent. When the plugs are in place, there is no radiation leakage from the source holder.
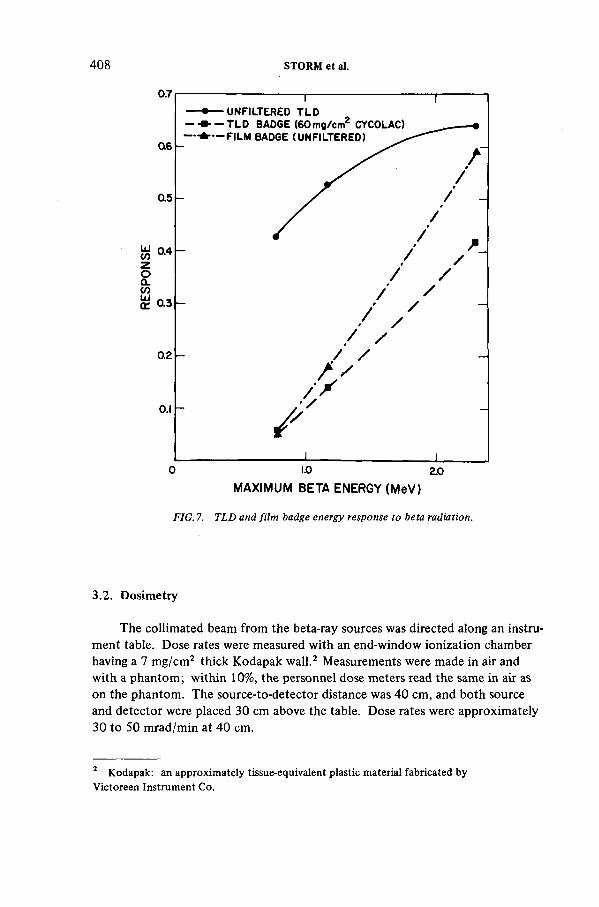
408 STORM et al.
MAXIMUM BETA ENERGY (MeV)
F I G . 7. T L D a n d f i lm b a d g e en erg y r e sp o n se to b eta ra d ia tio n .
3.2. Dosimetry
The collimated beam from the beta-ray sources was directed along an instrument table. Dose rates were measured with an end-window ionization chamber having a 7 m g/cm 2 thick Kodapak wall.2 Measurements were made in air and with a phantom; within 10%, the personnel dose meters read the same in air as on the phantom. The source-to-detector distance was 40 cm, and both source and detector were placed 30 cm above the table. Dose rates were approximately 30 to 50 mrad/min at 40 cm.
2 Kodapak: an approximately tissue-equivalent plastic material fabricated by Victoreen Instrument Co.
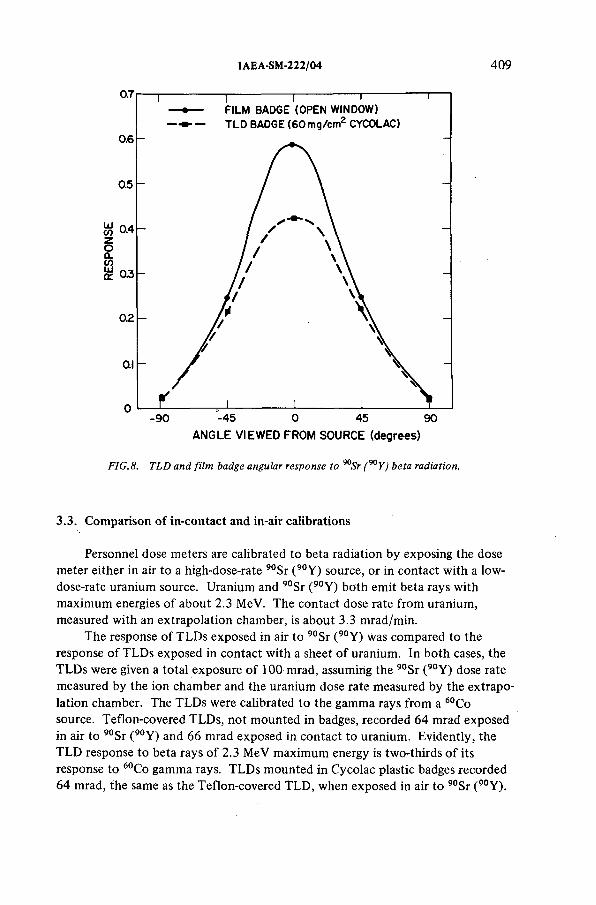
IAEA-SM-222/04 409
F I G . 8. T L D a n d f i lm b a d g e a n gu la r r e sp o n se to 90S r ( ^ Y ) b e ta ra d ia tio n .
3.3. Comparison o f in-contact and in-air calibrations
Personnel dose meters are calibrated to beta radiation by exposing the dose meter either in air to a high-dose-rate 90Sr ( 90Y) source, or in contact with a low- dose-rate uranium source. Uranium and 90Sr ( 90Y) both emit beta rays with maximum energies o f about 2.3 MeV. The contact dose rate from uranium, measured with an extrapolation chamber, is about 3.3 mrad/min.
The response o f TLDs exposed in air to 90Sr (90Y ) was compared to the response o f TLDs exposed in contact with a sheet o f uranium. In both cases, the TLDs were given a total exposure o f 100 mrad, assuming the 90Sr (90Y ) dose rate measured by the ion chamber and the uranium dose rate measured by the extrapolation chamber. The TLDs were calibrated to the gamma rays from a 60Co source. Teflon-covered TLDs, not mounted in badges, recorded 64 mrad exposed in air to 90Sr ( 90Y ) and 66 mrad exposed in contact to uranium. Evidently, the TLD response to beta rays o f 2.3 MeV maximum energy is two-thirds o f its response to 60Co gamma rays. TLDs mounted in Cycolac plastic badges recorded 64 mrad, the same as the Teflon-covered TLD, when exposed in air to 90Sr ( 90Y).
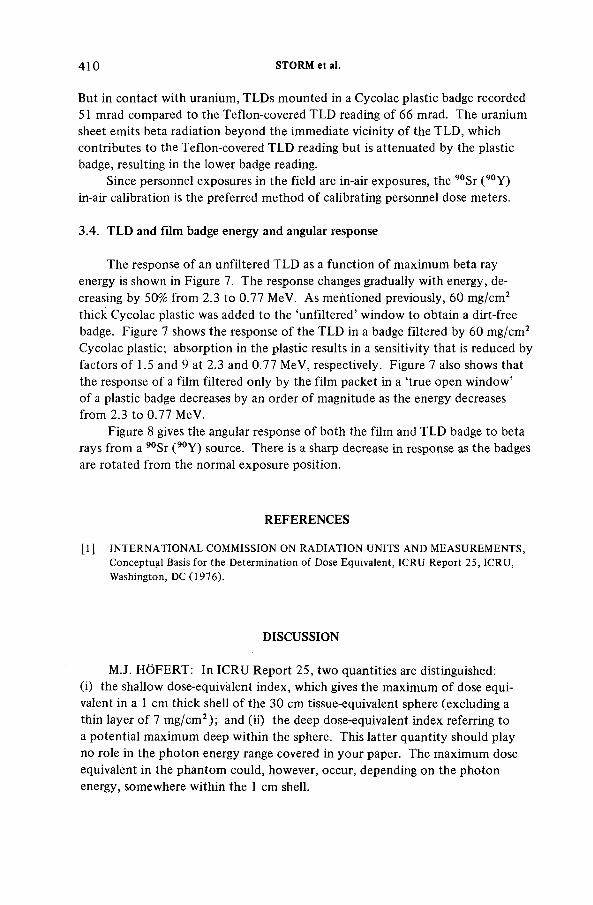
410 STORM et al.
But in contact with uranium, TLDs mounted in a Cycolac plastic badge recorded 51 mrad compared to the Teflon-covered TLD reading o f 66 mrad. The uranium sheet emits beta radiation beyond the immediate vicinity o f the TLD, which contributes to the Teflon-covered TLD reading but is attenuated by the plastic badge, resulting in the lower badge reading.
Since personnel exposures in the field are in-air exposures, the 90Sr ( 90Y) in-air calibration is the preferred method o f calibrating personnel dose meters.
3.4. TLD and film badge energy and angular response
The response o f an unfiltered TLD as a function o f maximum beta ray energy is shown in Figure 7. The response changes gradually with energy, decreasing by 50% from 2.3 to 0.77 MeV. As mentioned previously, 60 m g/cm 2
thick Cycolac plastic was added to the ‘unfiltered’ window to obtain a dirt-free badge. Figure 7 shows the response o f the TLD in a badge filtered by 60 m g/cm 2 Cycolac plastic; absorption in the plastic results in a sensitivity that is reduced by factors o f 1.5 and 9 at 2.3 and 0.77 MeV, respectively. Figure 7 also shows that the response o f a film filtered only by the film packet in a ‘true open window ’ o f a plastic badge decreases by an order o f magnitude as the energy decreases from 2.3 to 0.77 MeV.
Figure 8 gives the angular response o f both the film and TLD badge to beta rays from a 90Sr ( 90Y) source. There is a sharp decrease in response as the badges are rotated from the normal exposure position.
REFERENCES
[1] INTERNATIONAL COMMISSION ON RADIATION UNITS AND MEASUREMENTS, Conceptual Basis for the Determination of Dose Equivalent, ICRU Report 25, ICRU, Washington, DC (1976).
DISCUSSION
M.J. HÔFERT: In ICRU Report 25, two quantities are distinguished:(i) the shallow dose-equivàlent index, which gives the maximum o f dose equivalent in a 1 cm thick shell o f the 30 cm tissue-equivalent sphere (excluding a thin layer o f 7 m g/cm 2); and (ii) the deep dose-equivalent index referring to a potential maximum deep within the sphere. This latter quantity should play no role in the photon energy range covered in your paper. The maximum dose equivalent in the phantom could, however, occur, depending on the photon energy, somewhere within the 1 cm shell.
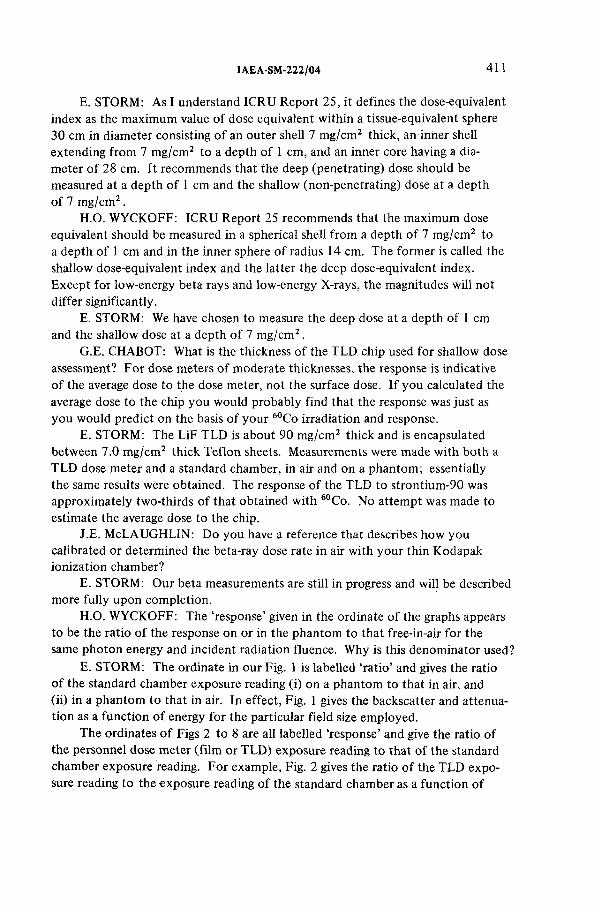
IAEA-SM-222/04 411
E. STORM: As I understand ICRU Report 25, it defines the dose-equivalent index as the maximum value o f dose equivalent within a tissue-equivalent sphere 30 cm in diameter consisting o f an outer shell 7 m g/cm 2 thick, an inner shell extending from 7 m g/cm 2 to a depth o f 1 cm , and an inner core having a diameter o f 28 cm. It recommends that the deep (penetrating) dose should be measured at a depth o f 1 cm and the shallow (non-penetrating) dose at a depth o f 7 m g/cm 2 .
H.O. WYCKOFF: ICRU Report 25 recommends that the maximum dose equivalent should be measured in a spherical shell from a depth o f 7 m g/cm 2 to a depth o f 1 cm and in the inner sphere o f radius 14 cm. The former is called the shallow dose-equivalent index and the latter the deep dose-equivalent index.Except for low-energy beta rays and low-energy X-rays, the magnitudes will not differ significantly.
E. STORM: We have chosen to measure the deep dose at a depth o f 1 cm and the shallow dose at a depth o f 7 m g/cm 2.
G.E. CHABOT : What is the thickness o f the TLD chip used for shallow dose assessment? For dose meters o f moderate thicknesses, the response is indicative o f the average dose to the dose meter, not the surface dose. I f you calculated the average dose to the chip you would probably find that the response was just as you would predict on the basis o f your 60Co irradiation and response.
E. STORM: The LiF TLD is about 90 m g/cm 2 thick and is encapsulated between 7.0 m g/cm 2 thick Teflon sheets. Measurements were made with both a TLD dose meter and a standard chamber, in air and on a phantom; essentially the same results were obtained. The response o f the TLD to strontium-90 was approximately two-thirds o f that obtained with 60Co. No attempt was made to estimate the average dose to the chip.
J.E. McLAUGHLIN: D o you have a reference that describes how you calibrated or determined the beta-ray dose rate in air with your thin Kodapak ionization chamber?
E. STORM: Our beta measurements are still in progress and will be described more fully upon completion.
H.O. WYCKOFF: The ‘response’ given in the ordinate o f the graphs appears to be the ratio o f the response on or in the phantom to that free-in-air for the same photon energy and incident radiation fluence. Why is this denominator used?
E. STORM: The ordinate in our Fig. 1 is labelled ‘ratio’ and gives the ratio o f the standard chamber exposure reading (i) on a phantom to that in air, and(ii) in a phantom to that in air. In effect, Fig. 1 gives the backscatter and attenuation as a function o f energy for the particular field size employed.
The ordinates o f Figs 2 to 8 are all labelled ‘response’ and give the ratio o f the personnel dose meter (film or TLD ) exposure reading to that o f the standard chamber exposure reading. For example, Fig. 2 gives the ratio o f the TLD exposure reading to the exposure reading o f the standard chamber as a function o f
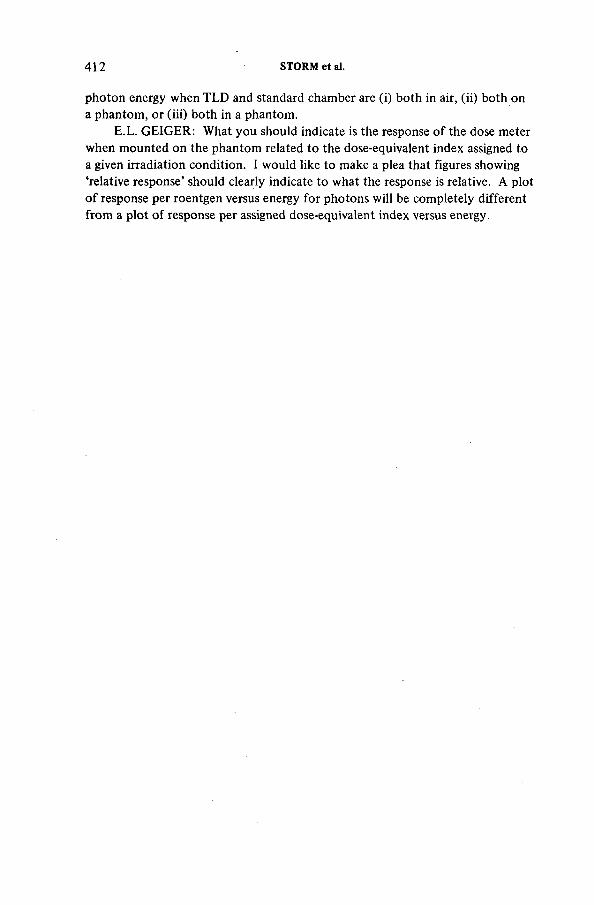
412 STORM et al.
photon energy when TLD and standard chamber are (i) both in air, (ii) both on a phantom, or (iii) both in a phantom.
E.L. GEIGER: What you should indicate is the response o f the dose meter when mounted on the phantom related to the dose-equivalent index assigned to a given irradiation condition. I would like to make a plea that figures showing ‘relative response’ should clearly indicate to what the response is relative. A plot o f response per roentgen versus energy for photons will be completely different from a plot o f response per assigned dose-equivalent index versus energy.
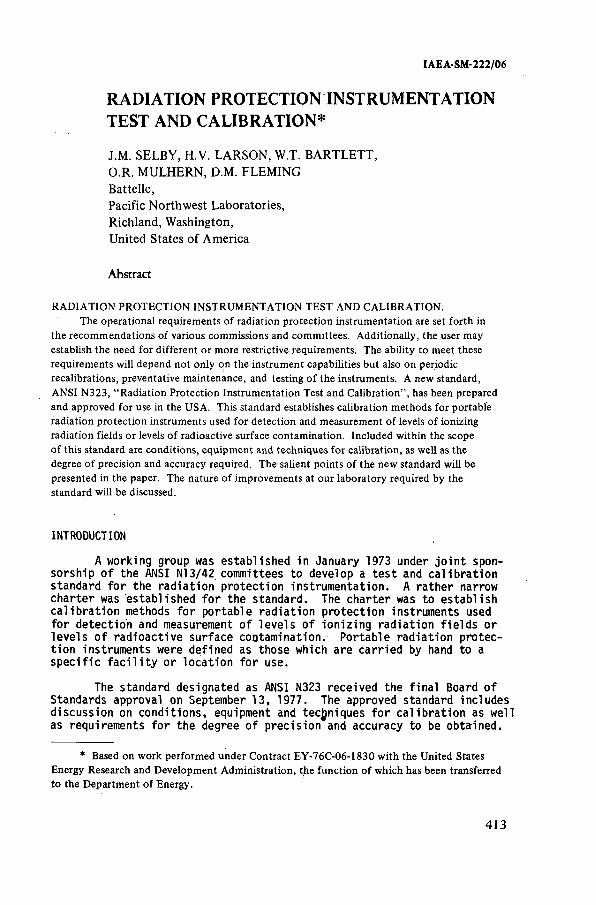
IAEA-SM-222/06
RADIATION PROTECTION INSTRUMENTATION TEST AND CALIBRATION*
J.M. SELBY, H.V. LARSON, W.T. BARTLETT,O.R. MULHERN, D.M. FLEMING Battelle,Pacific Northwest Laboratories,Richland, Washington,United States o f America
Abstract
RADIATION PROTECTION INSTRUMENTATION TEST AND CALIBRATION.The operational requirements of radiation protection instrumentation are set forth in
the recommendations of various commissions and committees. Additionally, the user may establish the need for different or more restrictive requirements. The ability to meet these requirements will depend not only on the instrument capabilities but also on periodic recalibrations, preventative maintenance, and testing of the instruments. A new standard, ANSI N323, “ Radiation Protection Instrumentation Test and Calibration” , has been prepared and approved for use in the USA. This standard establishes calibration methods for portable radiation protection instruments used for detection and measurement of levels of ionizing radiation fields or levels of radioactive surface contamination. Included within the scope of this standard are conditions, equipment and techniques for calibration, as well as the degree of precision and accuracy required. The salient points of the new standard will be presented in the paper. The nature of improvements at our laboratory required by the standard will be discussed.
INTRODUCTION
A w ork in g group was e s t a b l i s h e d in January 1973 under j o i n t spon s o r s h i p o f th e ANSI N13/42 c om m it tees t o d e v e lo p a t e s t and c a l i b r a t i o n s ta n d a rd f o r th e r a d i a t i o n p r o t e c t i o n i n s t r u m e n t a t i o n . A r a t h e r narrow c h a r t e r was e s t a b l i s h e d f o r th e s ta n d a r d . The c h a r t e r was t o e s t a b l i s h c a l i b r a t i o n methods f o r p o r t a b l e r a d i a t i o n p r o t e c t i o n in s t ru m en ts used f o r d e t e c t i o n and measurement o f l e v e l s o f i o n i z i n g r a d i a t i o n f i e l d s o r l e v e l s o f r a d i o a c t i v e s u r f a c e c o n t a m i n a t i o n . P o r t a b l e r a d i a t i o n p r o t e c t i o n in s t ru m en ts were d e f i n e d as t h o s e w hich a r e c a r r i e d by hand t o a s p e c i f i c f a c i l i t y o r l o c a t i o n f o r u se .
The s ta n d a rd d e s ig n a t e d as ANSI N323 r e c e i v e d th e f i n a l Board o f S tan dard s a p p rova l on Septem ber 13, 1977. The app roved s ta n d a rd in c lu d e s d i s c u s s i o n on c o n d i t i o n s , equipm ent and te c h n iq u e s f o r c a l i b r a t i o n as w e l l as re q u ire m e n ts f o r th e d e g r e e o f p r e c i s i o n and a c c u r a c y t o be obta -ined .
* Based on work performed under Contract EY-76C-06-1830 with the United States Energy Research and Development Administration, the function of which has been transferred to the Department of Energy.
413
414 SELBY et al.
ANSI N323 a d d r e s s e s s e v e r a l per fo rm a nce a re a s in a q u a l i t a t i v e n atu re f o r th e c a l i b r a t i o n and t e s t i n g o f p o r t a b l e r a d i a t i o n p r o t e c t i o n in s t r u m e n ts . Com pliance w ith th e s tan d ard w i l l be tough t o a c h i e v e . The B a t t e l l e - N o r t h w e s t l a b has a lw ays sou g h t t o com ply t o th e f u l l e s t w ith th e h i g h e s t re q u ire m e n ts o f in stru m en t t e s t c a l i b r a t i o n . The f u l l implement a t i o n o f t h i s s ta n d a rd a t th e la b w i l l r e q u i r e even h ig h e r l e v e l s o f com peten ce f o r th e a rea o f r a d i o l o g i c a l c a l i b r a t i o n t e s t s and e v a l u a t i o n s .
SALIENT POINTS OF THIS STANDARD
C a l i b r a t i o n s C o n s i d e r a t i o n s
T hroughout th e s t a n d a r d , emphasis i s p la c e d on th e im p ortan ce o f p r o v i d i n g th e n e c e s s a r y c a l i b r a t i o n data t o a s s u r e t h a t th e in stru m en t re a d in g s o b t a i n e d in th e f i e l d a r e a c c u r a t e . I f th e in s t ru m en t i s t o be used under s p e c i a l c o n d i t i o n s , i t e i t h e r s h o u ld be c a l i b r a t e d t o o p e r a t e s p e c i f i c a l l y under t h o s e c o n d i t i o n s o r th e n eeded c o r r e c t i o n f a c t o r s h o u ld be in c lu d e d w ith th e in s t ru m e n t . Instru m ents c a l i b r a t e d f o r s p a c i f i c c o n d i t i o n s such as e n e rg y r e s p o n s e s h ou ld be c l e a r l y l a b e l e d t o p r e v e n t i n a p p r o p r i a t e use u nder o t h e r c o n d i t i o n s . The p e r i o d i c per fo rm a n ce t e s t has been i d e n t i f i e d t o a s s u r e p r o p e r o p e r a t i o n o f th e in stru m en t between c a l i b r a t i o n s . When p o s s i b l e , i t i s s u g g e s te d t h a t a small ch e ck s o u r c e be used in a c o n s t a n t and r e p r o d u c i b l e manner t o d e term in e i f th e i n s t r u ment r e s p o n s e v a r i e s by more than +20%. Requirement f o r th e a c c u r a c y o r r e p r o d u c i b i l i t y o f c a l i b r a t i o n s t a n d a r d s , a s s e m b l ie s and s ta n d a rd i n s t r u ments a r e p r o v i d e d . I t would be d e s i r a b l e t o c a l i b r a t e in stru m en ts a g a i n s t e i t h e r a n a t i o n a l s ta n d a rd o r a d e r iv e d s t a n d a r d ; h ow ever, a l a b o r a t o r y s ta n d a rd i s p e r m i s s i b l e i f a t r a n s f e r in stru m en t hav ing th e r e p r o d u c i b i l i t y o f +2% i s used t o compare th e u s e r ' s s ta n d a rd t o a n a t io n a l o r d e r i v e d s ta n d a r d .
A minimum pr im ary c a l i b r a t i o n f r e q u e n c y o f o n c e a y e a r i s s u g g e s te d as l o n g as th e in s t ru m e n t c o n t in u e s t o resp on d w i t h in +20% o f th e ch eck s o u r c e r e a d in g . M aintenance o f in s t ru m en ts in c l u d e s ch anges o f b a t t e r i e s , w hich in some i n s t a n c e s w a rra nts r e c a l i b r a t i o n . The p e r fo rm a n ce t e s t s h o u ld be made p r i o r t o an in s t r u m e n t ' s use each day . For p r o lo n g e d usage d u r in g th e day th e in s t ru m en t s h o u ld be ch e ck e d s e v e r a l t im e s .
E v a lu a t io n and Use C o n s i d e r a t i o n s
The a b i l i t y o f an in st ru m en t t o meet th e re q u ire m e n ts i n v o l v e s n o t o n ly th e p r o p e r c a l i b r a t i o n and m a in ten a n ce , but a l s o a knowledge o f th e i n s t r u m e n t ' s c a p a b i l i t i e s . T h is knowledge o f in stru m en t c a p a b i l i t y i s e s s e n t i a l in in s t ru m e n t c a l i b r a t i o n but i s n o t r e q u i r e d in a s ta n d a rd o r a r e g u l a t o r y g u id e . Z uern er and K a t h r e n t u d e t a i l e d th e measurements o f th e c h a r a c t e r i s t i c s o f in s t ru m e n ts under d e s ig n c o n d i t i o n s . E v a lu a t io n would in c l u d e d e t e r m i n a t i o n o f some o r a l l o f th e f o l l o w i n g :
N o n r a d i o l o g i c a l C h a r a c t e r i s t i c s
• P h y s ic a l c o n d i t i o n , s a f e t y , u t i l i t y , w e ig h t and e a s e o f d e c o n t a m in a t io n and o t h e r human e n g in e e r i n g c o n s i d e r a t i o n s .
IAEA-SM-222/06 415
• Environmental influences such as e ffect o f shock, sound and v ib ration , e le c tr ic tran sien ts, RF energy, magnetic f ie ld s , high humidity, or other environmental influences.
• Extent o f sw itching tran sien ts, capacitance e ffe c ts, geo- tropism and s ta t ic charge e ffects.
• Power supply including s t a b i l i t y and battery l i f e .
Radio logical C h aracte ristic s
•* Range, s e n s it iv it y , l in e a r ity , detection lim it s , and response to overload conditions.
•* Accuracy and rep rodu c ib ility .
• * Energy dependence.
• Angular dependence.
• Response to ion iz ing rad iations other than those intended to be measured.
•* Temperature and pressure dependence.
The standard suggests that certain te sts indicated by an a s t r is k should be repeated routine ly because o f the aging o f components, changes in ava ilab le power (battery aging) and replacement of components which may a ffec t the ca lib ra tion .
Q uality o f Lab Maintenance
The q u a lity o f the rad iation f ie ld involves the knowledge o f the ch ara cte r istic s of the f ie ld such as extraneous rad ia t ion s, contributions from backscatter, and the degree o f accuracy with which the exposure rates or f lu x density o f the f ie ld s i s known. The standard specified quantita tive lim ita tio n s fo r the ch ara cte r istic s o f the rad iation f ie ld . I t is recommended that the rad iation f ie ld be studied and appropriate correction be developed i f the source-to-detector distance is le ss than seven times the maximum dimension o f the source or detector. The exposure rate or the f lu x density o f the rad iation f ie ld should be known w ithin an estimated uncertainty o f no greater than +10%. The standard c a l ls fo r a continuous monitor to determine i f the rad iation f ie ld has changed. The influence o f such th ings as background rad iation , ambient temperature, re la tive humidity and atmospheric pressure should be noted at a l l times during the instrument ca lib ra tion . I t may be necessary to make continuous ad justments fo r the va ria tio n in these parameters. The maximum lim it s o f uncertainty are described fo r those devices which are to be used as national, derived or laboratory standards in support o f the instrument ca lib ra tion . Properties of ca lib ra tio n sources are a lso described within the standard.
IMPACT OF THE STANDARD ON OUR LABORATORY
The standard id e n t if ie s three major areas fo r improvements needed in our laboratory. These include f a c i l i t ie s , sources and computational ca p a b ilit ie s . Because o f our involvement with rad io lo g ica l ca lib ra tio n s over the la s t 30 years, the laboratory has accrued a large number o f sources. Therefore, the major improvements id e n tifie d by the standard
416 SELBY et al.
which impact us are prim arily in the areas of f a c i l i t ie s and the computa tion a l c a p a b il it ie s . The one major area o f f a c i l i t y deficiency that we experience at th is time involves the use o f an u ltra low-level background area because we are unable to maintain a background below about 15 yR/h. The new generation o f low-level instruments require u ltra low-level ca lib ra tio n f a c i l i t ie s to adequately ca lib ra te the most se n s it ive ranges. M id-scale ca lib ra tio n s are not possib le on the 0-3 pR/h ranges o f some o f the instruments currently being serviced at our laboratory.
The standard id e n tif ie s the need to generate correction factors fo r such items as energy pressure and special geometries. At th is time we may not have a l l o f the special apparatus or equipment which would be required to adequately generate these correction factors.
The standard a lso mentions that ca lib ra tio n s should be performed in conditions m aintaining personnel rad iation exposures as low as practicab le (ALAP). We are generally aware o f our rad io lo g ica l configurations in our laboratory as i s evidenced by our low man-rem commitment fo r the number o f man hours spent in instrument ca lib ra tion . However, a few o f our ca lib ra tio n f a c i l i t i e s may need to be modified fo r ALAP considerations. The standard c a l l s fo r a continuous monitor to determine i f the radiation f ie ld has changed over the course o f the ca lib ra tion . This i s a requirement which the ca lib ra tio n laboratory has been preparing to meet.
The standard c a l ls fo r the use o f check sources with portable survey instruments. We do not supply a check source fo r the portable neutron monitoring instruments prim arily due to p ra c t ic a lity . Further, the check source supplied with the portable alpha meters w ill not check the response on a l l three ranges although a l l three ranges are commonly used.
Nowhere in the standard i s the need for computational equipment specified. However, throughout the standard i t can be inferred that because o f the large number o f parameters which must be handled, the high throughput o f a f a c i l i t y , and the need fo r good records, computational equipment o f a large machine nature may be warranted. A computer can e a s ily handle the correction factors associated with geometry, pressure, temperature, energy and background as they change during the course o f instrument ca lib ra tion . With the advent o f micro-computer controlled operations, many o f our instrument ca lib ra tio n s can be made more accurate. For an example, the main instrument ca lib ra tio n o f current in te re st at our laboratory i s that o f the Cutie Pie (CP). Because o f the fac t that the CP operates with a ir under ambient conditions as i t s detection medium, i t i s affected by va ria tion s in a ir density due to pressure and temperature changes. For instance, i f the CP i s ca librated on a day when the pressure i s 800 mm Hg and the temperature i s 16°C, i t w ill appear to be under responsive by over 10% i f i t i s recalibrated on the day when the pressure i s 740 mm Hg and the temperature i s 27°C. Our proposed so lu tion to th is problem is to in s t a l l a m icro-processor contro lled compensator fo r the pressure/temperature va ria tio n s and autom atically position the source at the proper distance to ca lib ra te the instrum ent's response at standard temperature and pressure regard less o f the e x istin g temperature and pressure at the time. In add ition , the reading o f a chart to determine the po sit ion in g o f the source w ill be elim inated. The
IAEA-SM-222/06 417
operator w ill simply key in the desired exposure rate in mR/h v ia calcula to r keyboard and the computer w ill move the source to the appropriate distance smoothly, accurately, and autom atically.
The appendix o f the standard describes the need to ca lcu late on a constant b asis the correction factors associated with source decay or ingrowth o f alpha em itting daughters in some types o f nuclide sources.A computer would e a s i ly fa c i l i t a te these ca lcu la t io n s which may be o f a tedious nature when done by hand.
GOOD POINTS OF THE STANDARD
The standard id e n t if ie s one outstanding concept; i .e . , a uniform approach to the ca lib ra tio n o f rad iation protection instruments on a wide basis. Many o f the points in the standard give some in s igh t as to the nature o f the equipment and f a c i l i t ie s that would be required by a laboratory. The rigorous app lica tion o f many o f the points brought out in the standard allow fo r great improvements in instrument accuracy and ca lib ra tio n precision.
POINTS THE STANDARD DOES NOT COVER
During the f in a l public review stage, several suggestions were received fo r add itions to the standard. I t was suggested that an in stru ment te st and ca lib ra tio n standard must define methods which elim inate ambiguity and subjective judgments in a sse ssin g and a ss ign in g quantita tive values to physical parameters re lated to the ca lib ra tion . I f aspects o f the ca lib ra tio n have su b tle t ie s not apparent to the inexperienced user or are subject to d iffe r in g interpretations by d iffe ren t users, then a va lid standard should specify or reference methods which abso lute ly elim inate the p o s s ib i l i t y o f d iffe ren t re su lts fo r performance o f a given ca lib ra tio n . In p a rticu la r, a major source o f confusion and error in instrument ca lib ra tio n , i s accurate d e fin it io n o f the ra d iation f ie ld fo r ca lib ra tio n use. The proposed standard mentions energy dependence, sca tte ring , beam d e fin it io n and detector and source- geometry e ffe c ts, but does not define an acceptable method to assure uniform treatment o f these e ffects. I t was fe lt that the proposed standard should introduce or reference sp e c if ic ca lib ra tio n sources, geometries, ca lib ra tio n conditions and ca lcu la tion methods to assure that users, regardless o f th e ir level o f sop h ist ica t ion , would arrive at the same answer in c a lib ra t in g any instrument in accord with the standard. We agree with the reviewers that d e f in it iv e ca lib ra tio n procedures are needed. There are several references[2,3] which provide guidance in th is area. However, there i s no standard on procedures and sources. A dd itio n a lly , the acceptable lim it s o f instrument performance during ca lib ra tio n need to be id e n tified . As stated in the introduction, a narrow charter was estab lished fo r the standard. By necessity, the to p ics o f procedures, sources and lim it s w ill have to be developed as the subject o f another ANSI standard on standard ca lib ra tio n methods and sources.
SUMMARY
The new ANSI Standard N323 provides needed guidance on instrument ca lib ra tio n requirements including frequency and accuracy o f ca lib ra tio n s
418 SELBY et al.
and determination o f needed correction factors fo r variab les. I t helps id e n tify many areas fo r potential improvements in nearly every c a l i bration f a c i l i t y . I t does not provide procedures for performing the ca lib ra tio n nor does i t e stab lish c r ite r ia fo r standardization o f sources. High p r io r ity should be given to develop a standard which covers the la t te r items.
ACKNOWLEDGEMENTS
The authors wish to acknowledge the assistance o f the N323 dra ftin g committee, ANSI N13 and N42 committees, the Health Physics Society Standards Committee and Mr. E. J. V a lla r io , DOE, fo r the ir e ffo rts in development o f th is standard.
REFERENCES
[1] Zuerner, L. V., R. L. Kathren, "Evaluation Program fo r Portable Radiation Monitoring Instrum ents", Health Physics Operational M onitoring, Vol. 2, p. 325-50, C. A. W ill ia and J. S. Handloser, Eds., Gordon and Breach, (1972).
[2] Technical Reports Series No. 133, Handbook on C a lib ra tion of Radiation Protection Monitoring Instrum ents, International Atomic Energy Agency, (1971).
[3] Kathren, R. L ., "Projected Numbers o f Health P h y s ic is ts , 1975- 2000", Health Physics Journal Vol. 31, p. 489-493, Pergamon Press, (1976).
DISCUSSION
B.J. JACKSON: Will the 10 CFR 35 requirement1 for recalibration of survey instruments every three months be revised?
D.M. FLEMING: ANSI N323 gives one year as the maximum period between primary calibrations as long as the instrument continues to respond properly (± 20%) to a check source. It also indicates that shorter periods between calibrations are advisable under many conditions, such as intensive use.I have no idea how the conflict between ANSI N323 and 10 CFR 35 will be resolved in the event that the ANSI standard is adopted by the United States Department o f Energy.
H.O. WYCKOFF: Radiation protection instruments are used for two general purposes: for assessing doses received by personnel and for testing the adequacy with which radiation-emitting devices meet specifications. The accuracy requirements for the two purposes are very different.
1 United States Code of Federal Regulation.
IAEA-SM-222/16
CRITERIA FOR TESTING PERSONNEL DOSIMETRY PERFORMANCE IN THE UNITED STATES OF AMERICA
Margarete EHRLICH National Bureau o f Standards,Washington, DC,United States of America
Abstract
CRITERIA FOR TESTING PERSONNEL DOSIMETRY PERFORMANCE IN THE UNITED STATES OF AMERICA.
Under the auspices of the Health Physics Society Standards Committee, a standard has been developed that specifies procedures for testing the performance of suppliers of personnel- dosimetry services in the United States o f America.
The Health Physics Society Standards Committee has developed a standard embodying criteria for testing the performance of suppliers o f personnel radiation-dosimetry services. The objective o f the standard is to provide a procedure for testing routine personnel-dosimetry performance under laboratory conditions o f dose meter irradiation with photons, beta particles, fast neutrons, and their mixtures, originating from external sources. Specifications are given for (1 ) minimum number o f dose meters required for testing, and the test schedule;(2) test-radiation categories and ranges of test-irradiation levels; (3) types of radiation sources and irradiation geometry; (4) quantities and units to be used for reporting the test results; and (5) performance criteria to be applied to the test results. The choice o f ranges of irradiation levels and o f performance criteria is based on considerations o f radiation protection, modified where necessary to accommodate the limitations o f practical instrumentation. Covered are tests of personnel-dosimetry performance with any type of dose meter whose reading is used to provide a personal irradiation record o f an individual.
The performance criteria form the basis for testing whether the overall uncertainty in the determination o f the quantity o f interest (here the dose- equivalent index) remains within a certain acceptable upper limit. The overall uncertainty is defined here as the sum of the relative average deviation and a suitably chosen multiple o f the relative standard deviation of the reported from the correct value. In the vicinity of maximum permissible levels, 0.3 is chosen as the acceptable upper limit for the overall uncertainty in the case of high- energy photon irradiations. In all other radiation categories, the limit is relaxed
419
420 EHRLICH
to 0.5 because o f limitations in practical instrumentation. For lower irradiation levels, the acceptable upper limit o f overall uncertainty is further relaxed in all radiation categories.
The United States Nuclear Regulatory Commission has initiated a pilot test of about forty suppliers o f personnel-dosimetry services, which will be based on the Health Physics Society standard. The results of this pilot test will furnish information not only on the current status o f personnel dosimetry, but also on the adequacy o f the standard for use in future periodic checks on the performance of all suppliers o f personnel-dosimetry services.
DISCUSSION
M.J. HÔFERT: You mentioned in your oral presentation that both the shallow and the deep dose-equivalent are determined in personnel dosimetry.There will, however, be irradiation conditions where the maximum of the dose equivalent will be neither behind 7 mg/cm2 nor behind 1000 mg/cm2.
Margarete EHRLICH: By definition, the dose-equivalent index, Hj, is the maximum value o f the dose equivalent in a range of depths: (Hi)sh ц is the maximum value in depths between 0.007 and 1.0g/cm2, and (Hi)deep is the largest value in depths o f 1.0 g/cm2 and more. The depths considered cover the entire range o f interest in personnel dosimetry. If personnel dose meters are calibrated properly in terms o f H¡, the actual depth o f irradiation is immaterial.
M.J. HOFERT: The most interesting photon energy range, below 100 keV, is not well covered by the deep dose-equivalent index. Since ICRP recommends reporting only one value o f dose equivalent for the person under dosimetry control, do you use the shallow dose equivalent, or do you always report both index values?
Margarete EHRLICH: For the photon-energy range below 100 keV, the standard gives conversion factors leading to both shallow and deep dose- equivalent index values. The United States Nuclear Regulatory Commission will require reporting o f both the shallow and the deep dose-equivalent index.
IAEA-SM-222/39
PROBLEMES D’ETALONNAGE EN MATIERE DE DOSIMETRIE APPLIQUEE A LA RADIOPROTECTION AUPRES DES CENTRALES NUCLEAIRES
L. FITOUSSIDépartement de protection,CEA, Centre d’études nucléaires de
Fontenay-aux-Roses,Fontenay-aux-Roses
R. GAULARDService Normalisation et brevets,Electricité de France,Paris,France
Abstract-Résumé
DOSIMETRY CALIBRATION PROBLEMS IN CONNECTION WITH RADIATION PROTECTION AROUND NUCLEAR FACILITIES.
The calibration of personnel dose meters or portable dose rate meters is an important problem for the officers responsible for radiation protection around nuclear facilities. These officers require for their task high-quality calibration equipment used in precisely defined and reproducible conditions. The purpose of this paper is to present the problems that arise in absorbed dose calibrations, and to propose the necessary equipment and a general calibration procedure valid for the various types of radiation considered with respect to external irradiation. Any calibration method applied in the user’s standards laboratory must be in accordance with the various recommendations of international organizations such as ICRP, ICRU, IAEA etc.The method proposed by the authors conforms to the above principle and might be made the subject of an international agreement and incorporated in the recommendations of the International Electrotechnical Commission (IEC) for the equipment used in radiation protection. The proposed calibration method may be broken down into three parts, applying respectively to: the choice of the radiation source or sources, in accordance with ISO standards; the geometrical conditions of irradiation; and the calibration procedure. The latter involves the use of a transfer detector and takes into account the absorbed dose values as determined with the 30-cm diameter tissue-equivalent sphere defined by ICRU. The authors present a practical example for an application of this method of calibration used in the standards laboratory of Electricité de France.
PROBLEMES D’ETALONNAGE EN MATIERE DE DOSIMETRIE APPLIQUEE A LA RADIOPROTECTION AUPRES DES CENTRALES NUCLEAIRES.
L’étalonnage des dosimètres individuels ou des débitmètres de dose portatifs constitue un problème important pour les responsables de la radioprotection autour des installations nucléaires. Ces responsables doivent pour cela disposer de moyens d’étalonnage de qualité, utilisés dans des conditions parfaitement définies et reproductibles. L’objet de cet exposé
421
422 FITOUSSI et GAULARD
est de présenter les problèmes qui se posent pour les opérations d’étalonnage en dose absorbée, et de proposer les moyens nécessaires et une procédure d’étalonnage générale valable pour les différents types de rayonnements considérés pour l’irradiation externe.Toute méthode d’étalonnage mise en oeuvre dans le laboratoire de référence de l’utilisateur doit être en accord avec les différentes recommandations des organisations internationales telles que la CIPR, l’ ICRU, l’AIEA, etc. Celle qui est proposée par les auteurs, et qui applique le principe précédent, pourrait faire l’objet d’un accord international et être mise en oeuvre dans les recommandations de la Commission électrotechnique internationale (CEI) pour les appareils utilisés en radioprotection. La méthode d’étalonnage proposée peut se décomposer en trois parties qui concernent respectivement: le choix de la ou des sources de rayonnement, en accord avec les normes de l’ISO; les conditions géométriques de l’irradiation; la procédure de l’étalonnage; celle-ci met en oeuvre un détecteur de transfert et prend en considération les valeurs des doses absorbées telles qu’elles sont déterminées à l’aide de la sphère en matériau équivalent aux tissus de 30 cm de diamètre définie par l’ICRU. Les auteurs proposent un exemple pratique d’application de cette méthode d’étalonnage utilisée au laboratoire de référence d’ Electricité de France.
1. INTRODUCTION
L’étalonnage des dosimètres et des débitmètres de dose constitue un problème pour les responsables de radioprotection des centrales nucléaires qui ont la charge de la mise en oeuvre de ces appareils dans des conditions d’exploitation souvent difficiles:— champs de rayonnement mixtes (7 , |3, neutrons),— débits de doses 7 élevés jusqu’à 20 radh -1 pour certaines zones,— gradients de rayonnement importants,— gamme d’énergie 7 étendue de 80 keV à 6 MeV,— présence de radionucléides émetteurs fi d’énergie élevée.
Cet étalonnage ne doit jamais conduire à une sous-estimation des doses absorbées, ce qui pourrait avoir pour conséquence d’entamer la confiance du personnel travaillant sous rayonnement et créer un risque de-conflit avec la direction de la centrale. Il ne doit pas non plus surestimer les doses absorbées, ce qui rendrait difficile l’ exploitation de la centrale nucléaire, compte tenu de la réduction arbitraire du temps de travail qui en résulterait pour certains agents ayant atteint virtuellement la dose maximale admissible.
Toutes ces raisons militent en faveur d’un étalonnage des appareils dans les conditions qui apportent une garantie acceptable pour l’estimation des doses absorbées avec une précision suffisante, tout particulièrement pour ceux des appareils utilisés dans les zones de travail où le débit de dose absorbée dépasse1 rad 'h '1. Un tel étalonnage représenterait un compromis judicieux permettant en outre de résoudre les problèmes psychologique et économique de la comptabilisation des doses absorbées par les travailleurs.
IAEA-SM-222/39 423
En radioprotection, la grandeur à mesurer est la dose absorbée dans les tissus. En fonctionnement normal, la détermination de la dose effectivement absorbée dans un organe donné exigerait des moyens hors de proportion avec le but poursuivi, qui est principalement de s’assurer du respect des doses maximales admissibles (DMA) qui ont fait l’objet des recommandations de la Commission internationale de protection radiologique (CIPR).
Il n’en est pas de même en cas d’accident si les doses absorbées sont très supérieures aux DMA, car il serait alors nécessaire de mettre en oeuvre des moyens importants pour déterminer a posteriori la dose absorbée, et ce avec une bonne précision (reconstitution de l’ irradiation avec fantôme, calcul des doses à partir de modèles mathématiques, etc.).
Toutefois, il est indispensable d’effectuer une simplification de la géométrie d’étalonnage et de consentir à des approximations pour la détermination des valeurs des doses absorbées qui seront comptabilisées dans les dossiers des agents travaillant sous rayonnement.
Ce qui précède peut être mis en application en utilisant le concept d’index d’équivalent de dose de la Commission internationale des unités et des mesures de radiation (CIUMR), qui représente la valeur maximale que la dose absorbée atteint à une profondeur déterminée dans un fantôme sphérique équivalent-tissus de 30 cm de diamètre.
2. PROBLEMES POSES PAR L’ETALONNAGE DES APPAREILS
2.1. Conditions d’irradiation
Etalonner un dosimètre ou un débitmètre de dose, c’est le placer dans des conditions parfaitement définies et reproductibles et relier son indication à la valeur conventionnellement vraie de la grandeur à mesurer au point considéré.
La principale difficulté pour l’étalonnage est de déterminer les conditions d’irradiation qui devraient recouvrir les conditions réelles d’irradiation des travailleurs, de manière à réduire le plus possible les erreurs systématiques apportées, soit par la géométrie, soit par la nature ou l’énergie du rayonnement. Pour ce faire, il y a lieu de choisir de façon judicieuse les sources d’irradiation et la géométrie du faisceau.
2.1.1. Choix des sources
D’une façon générale sont utilisées des sources scellées spéciales permettant de couvrir la gamme d’énergie y de 60 keV à 1,3 MeV: 241 Am, 137Cs, 60Co. Ces sources ont leurs rayonnements filtrés par un écran de plastique ou d’acier inoxydable.
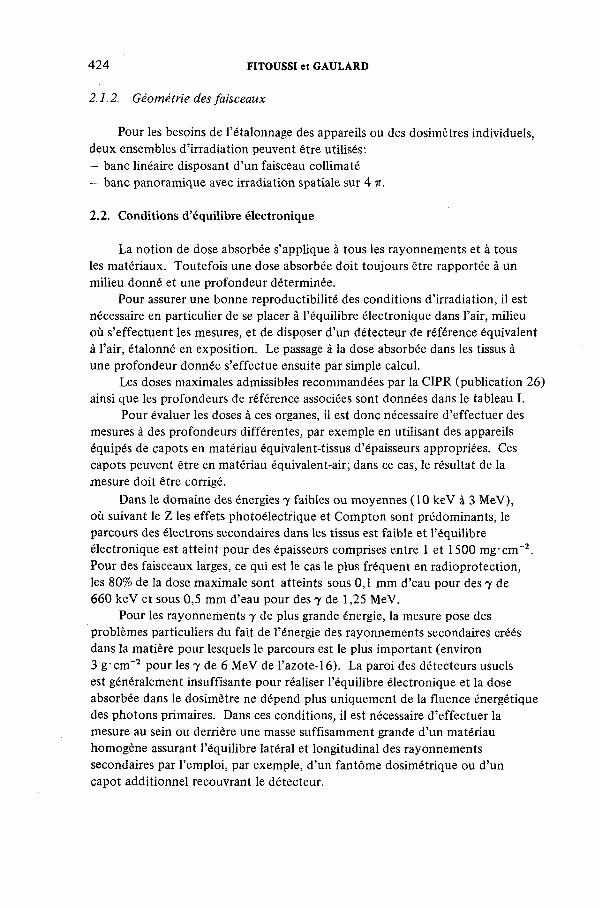
424 FITOUSSI et GAULARD
2.1.2. Géométrie des faisceaux
Pour les besoins de l’étalonnage des appareils ou des dosimètres individuels, deux ensembles d’irradiation peuvent être utilisés:— banc linéaire disposant d’un faisceau collimaté— banc panoramique avec irradiation spatiale sur 4 7Г.
2.2. Conditions d’équilibre électronique
La notion de dose absorbée s’applique à tous les rayonnements et à tous les matériaux. Toutefois une dose absorbée doit toujours être rapportée à un milieu donné et une profondeur déterminée.
Pour assurer une bonne reproductibilité des conditions d’irradiation, il est nécessaire en particulier de se placer à l’équilibre électronique dans l’air, milieu où s’effectuent les mesures, et de disposer d’un détecteur de référence équivalent à l’air, étalonné en exposition. Le passage à la dose absorbée dans les tissus à une profondeur donnée s’effectue ensuite par simple calcul.
Les doses maximales admissibles recommandées par la CIPR (publication 26) ainsi que les profondeurs de référence associées sont données dans le tableau I.
Pour évaluer les doses à ces organes, il est donc nécessaire d’effectuer des mesures à des profondeurs différentes, par exemple en utilisant des appareils équipés de capots en matériau équivalent-tissus d’épaisseurs appropriées. Ces capots peuvent être en matériau équivalent-air; dans ce cas, le résultat de la mesure doit être corrigé.
Dans le domaine des énergies y faibles ou moyennes ( 10 keV à 3 MeV), où suivant le Z les effets photoélectrique et Compton sont prédominants, le parcours des électrons secondaires dans les tissus est faible et l’équilibre électronique est atteint pour des épaisseurs comprises entre 1 et 1500 mg-cm-2. Pour des faisceaux larges, ce qui est le cas le plus fréquent en radioprotection, les 80% de la dose maximale sont atteints sous 0,1 mm d’eau pour des y de 660 keV et sous 0,5 mm d’eau pour des y de 1,25 MeV.
Pour les rayonnements y de plus grande énergie, la mesure pose des problèmes particuliers du fait de l’énergie des rayonnements secondaires créés dans la matière pour lesquels le parcours est le plus important (environ 3 g -cm"2 pour les 7 de 6 MeV de l’azote-16). La paroi des détecteurs usuels est généralement insuffisante pour réaliser l’équilibre électronique et la dose absorbée dans le dosimètre ne dépend plus uniquement de la fluence énergétique des photons primaires. Dans ces conditions, il est nécessaire d’effectuer la mesure au sein ou derrière une masse suffisamment grande d’un matériau homogène assurant l’équilibre latéral et longitudinal des rayonnements secondaires par l’emploi, par exemple, d’un fantôme dosimétrique ou d’un capot additionnel recouvrant le détecteur.
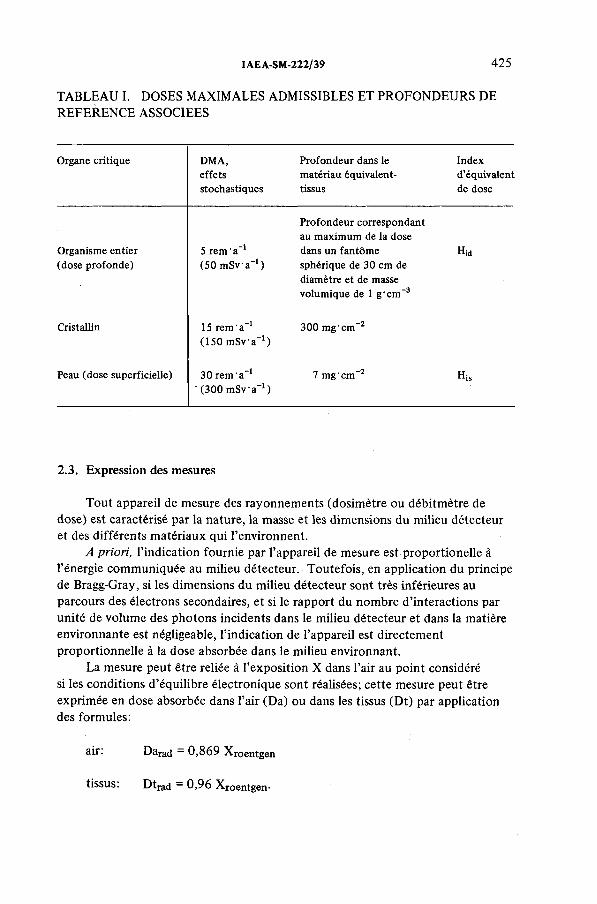
IAEA-SM-222/39 425
TABLEAU I. DOSES MAXIMALES ADMISSIBLES ET PROFONDEURS DE REFERENCE ASSOCIEES
Organe critique DMA,effetsstochastiques
Profondeur dans le matériau équivalent- tissus
Indexd’équivalent de dose
Organisme entier (dose profonde)
5 rem ‘ a"1 (50 m S v a "1)
Profondeur correspondant au maximum de la dose dans un fantôme sphérique de 30 cm de diamètre et de masse volumique de 1 g 'cm -3
Hid
Cristallin 15 rem ' a" 1 (150 m Sv'a"1)
300 mg ’ cm-2
Peau (dose superficielle) 30 rem a-1 ' (300 m S v 'a '1)
7 mg cm“2 His
2.3. Expression des mesures
Tout appareil de mesure des rayonnements (dosimètre ou débitmètre de dose) est caractérisé par la nature, la masse et les dimensions du milieu détecteur et des différents matériaux qui l’environnent.
A priori, l’indication fournie par l’appareil de mesure est proportioned à l’énergie communiquée au milieu détecteur. Toutefois, en application du principe de Bragg-Gray, si les dimensions du milieu détecteur sont très inférieures au parcours des électrons secondaires, et si le rapport du nombre d’interactions par unité de volume des photons incidents dans le milieu détecteur et dans la matière environnante est négligeable, l’indication de l’appareil est directement proportionnelle à la dose absorbée dans le milieu environnant.
La mesure peut être reliée à l’exposition X dans l’air au point considéré si les conditions d’équilibre électronique sont réalisées; cette mesure peut être exprimée en dose absorbée dans l’air (Da) ou dans les tissus (Dt) par application des formules:
air: Darad = 0,869 Xroentgen
tissus: Dtj-ad = 0,96 Xroentgen-
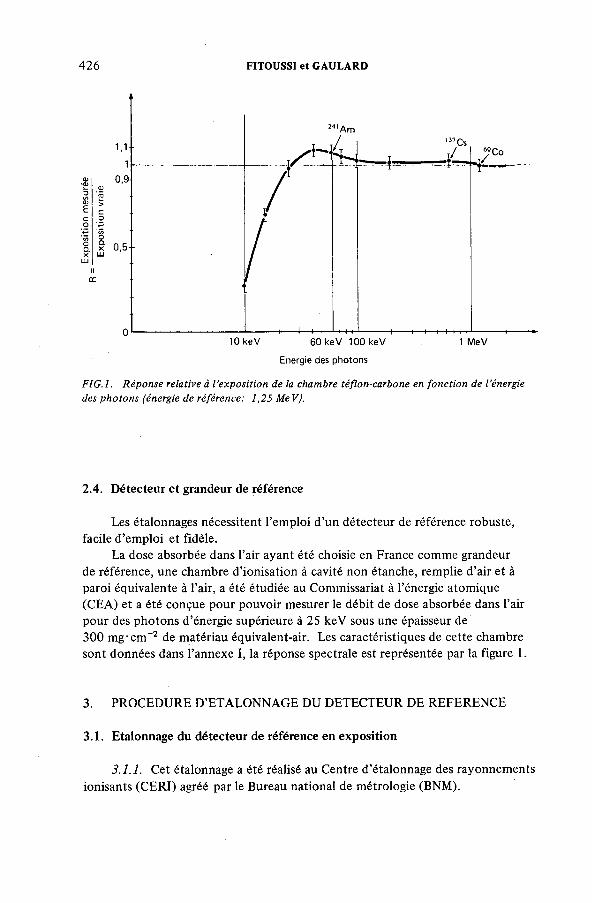
426 FITOUSSI et GAULARD
Energie des photons
FIG.l. Réponse relative à l ’exposition de la chambre téflon-carbone en fonction de l’énergie des photons fénergie de référence: 1,25 MeV).
2.4. Détecteur et grandeur de référence
Les étalonnages nécessitent l’emploi d’un détecteur de référence robuste, facile d’emploi et fidèle.
La dose absorbée dans l’air ayant été choisie en France comme grandeur de référence, une chambre d’ionisation à cavité non étanche, remplie d’air et à paroi équivalente à l’air, a été étudiée au Commissariat à l’énergie atomique (CEA) et a été conçue pour pouvoir mesurer le débit de dose absorbée dans l’air pour des photons d’énergie supérieure à 25 keV sous une épaisseur de 300 mg'cm-2 de matériau équivalent-air. Les caractéristiques de cette chambre sont données dans l’annexe I, la réponse spectrale est représentée par la figure 1.
3. PROCEDURE D’ETALONNAGE DU DETECTEUR DE REFERENCE
3.1. Etalonnage du détecteur de référence en exposition
3.1.1. Cet étalonnage a été réalisé au Centre d’étalonnage des rayonnements ionisants (CERI) agréé par le Bureau national de métrologie (BNM).
IAEA-SM-222/39 427
L’étalonnage est effectué en exposition dans un faisceau collimaté de faible section produit par une source de 60Co. Le débit d’exposition dû aux photons d’énergie moyenne de 1242 keV est voisin de 6 R • h-1 à 1 m de la source.
Le diamètre du champ de pleine illumination varie en fonction de la distance à la source; il est respectivement de 10, 25 et 50 mm à 1, 2 et 3 m de la source.
3.1.2. Le coefficient d’étalonnage Kg exprimé en R-hT1 - A "1 du détecteur de référence est tiré de l’expression dX/dt = Kg -I, dans laquelle dX/dt est la valeur conventionnellement vraie de l’exposition à une distance donnée de la source dans le faisceau de référence, et I le courant en ampère délivré par le détecteur de référence. Les valeurs obtenues sont les suivantes:— sous 300 mg-cm-2 (équilibre électronique non réalisé)
Ke = 2,14-1012 R-1T1 • A' 1
— sous 450 mg-cm-2 (équilibre électronique réalisé)
Ke = 2,07É1012 R h ' 1 ’ A -1 (valeur retenue pour les étalonnages des appareils).
L’exactitude de la mesure est de 4,5%.
3.2. Etalonnage du détecteur de référence en dose absorbée dans l’eau
3.2.1. Cet étalonnage a été réalisé à l’aide d’une source de 40 Ci de 60Co, en plaçant le détecteur de référence dans un fantôme «équivalent-eau»1 de section frontale 30 X 30 cm et 10 cm d’épaisseur. Les conditions d’irradiation pour cet étalonnage sont les suivantes:
— section du faisceau: 30 X 20 cm— distance source-face avant du fantôme: 75 cm— profondeur de mesure dans le fantôme: 5 cm.
La valeur de la dose absorbée dans l’eau dans les conditions de l’étalonnage a été déterminée par une mesure effectuée à l’aide d’un dosimètre chimique au sulfate ferreux (voir annexe II).
3.2.2. La dosimétrie au sulfate ferreux a montré que la valeur conventionnellement vraie du débit de dose absorbée dans l’eau dans les conditions expérimentales est: Dc = 70,65 rad-h-1, à 3,2% près.
1 Composition obtenue par un mélange de polystirène, d’huiles de polymérisation et de T i0 2 présentant une masse volumique égale à 1,03 g "cm"3.
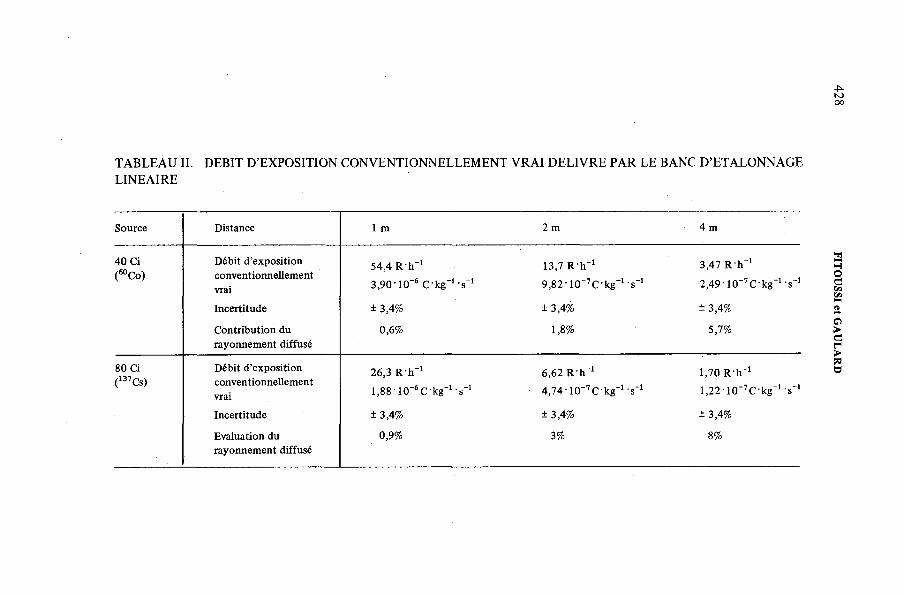
TABLEAU II. DEBIT D’EXPOSITION CONVENTIONNELLEMENT VRAI DELIVRE PAR LE BANC D’ETALONNAGE LINEAIRE
Source Distance 1 m 2 m 4 m
40 Ci (®°Со)
Débit d’expositionconventionnellementvrai
Incertitude
Contribution du rayonnement diffusé
54,4 R h ’ 1
3 ,9 0 ' 10 ' 6 C ’kg’ 1 's -1
± 3,4%
0,6%
13,7 R I T 1
Э .в г -Ю ^ С -к Е " 1 ^ ' 1
± 3,4%
1 ,8%
3,47 R h -1
S ^ - l O ^ C - k g ^ - s ' 1
± 3,4%
5,7%
80 Ci (137Cs)
Débit d’expositionconventionnellementvrai
Incertitude
Evaluation du rayonnement diffusé
26,3 R i ' 1
l .e e - lO ^ C -k g ^ -s ' 1
± 3,4%
0,9%
6,62 R h-1
4 ,7 4 ’ 1 0 "7C 'kg_1 s-1
± 3,4%
3%
1,70 R h ' 1
1,22 • 10“7C 'k g_I s" 1
± 3,4%
8%
428 FITO
USSI
et G
AU
LA
RD
IAE A-SM-222/39 429
, Il en résulte que la valeur du coefficient d’étalonnage Kd en dose absorbée dans l’eau du détecteur de référence a été trouvée égale à
KD = 1,94-1012rad-h' 1 -A-1, à 4,3% près.
Remarques
a) Ce facteur d’étalonnage n’est applicable que pour une même qualité de rayonnement, et ce en tenant compte de différents facteurs de correction.
b) Cette valeur est à comparer à Ke = 2,07' 1012R-h_1 - A -1.
4. MOYENS D’IRRADIATION DU LABORATOIRE D’ETALONNAGE DU DEPARTEMENT DE RADIOPROTECTION D’EDF
Ce laboratoire d’étalonnage du Département de radioprotection d’EDF dispose d’un banc linéaire et d’un banc d’irradiation panoramique dont nous allons examiner les caractéristiques.
4.1. Banc linéaire
Le banc linéaire d’irradiation est implanté dans un «abri» de béton dont les dimensions intérieures sont: longueur: 8,50 m; largeur: 3,95 m; hauteur: 2,85 m.
Un château de plomb contient les sources scellées spéciales de 80 Ci de 137Cs et 40 Ci de 60Co, installées dans un barillet. Un système de télécommande permet de sélectionner l’une des sources et de la placer en position d’irradiation.
Un chariot télécommandé se déplace sur deux rails entre 30 cm et 450 cm par rapport à la source.
Les étalonnages définis dans les conditions normales 1013,25 mbar et 0°C sont donnés dans le tableau II.
Remarques
a) Aux erreurs de mesures près, la loi en l/d 2 est bien vérifiée.b) Un écran de plomb de 55 mm de diamètre et 200 mm de longueur a
été placé entre la source et le détecteur à 50 mm de celui-ci pour évaluer la contribution du rayonnement diffusé.
c) L’incertitude de ± 3,4% comprend une incertitude de ± 2,4% due à l’étalonnage de la chambre d’ionisation de référence.
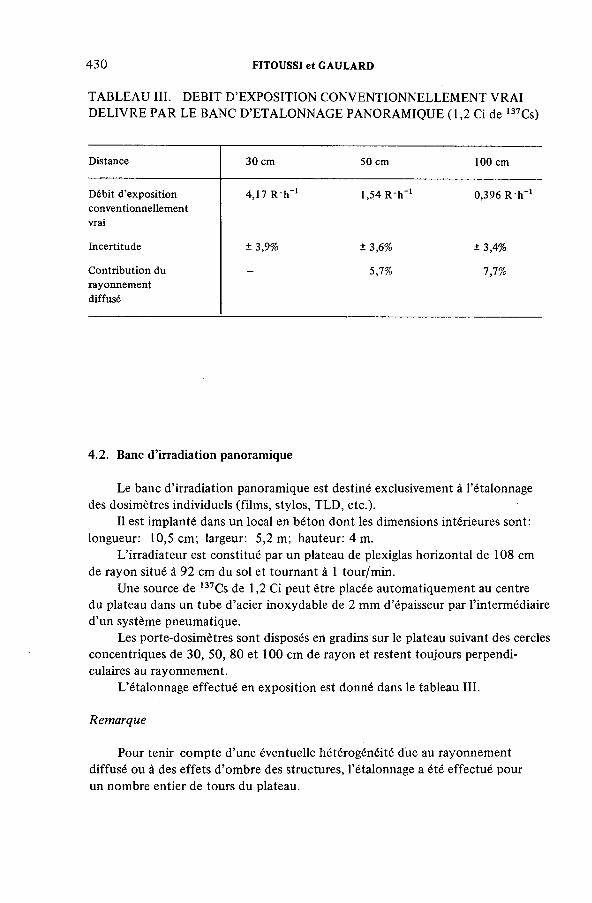
430 FITOUSSI et GAULARD
TABLEAU III. DEBIT D’EXPOSITION CONVENTIONNELLEMENT VRAI DELIVRE PAR LE BANC D’ETALONNAGE PANORAMIQUE (1,2 Ci de 137Cs)
Distance 30 cm 50 cm 100 cm
Débit d’expositionconventionnellementvrai
4,17 R 'h '1 1,54 R h '1 0,396 R h-1
Incertitude ± 3,9% ± 3,6% ± 3,4%
Contribution durayonnementdiffusé
5,7% 7,7%
4.2. Banc d’irradiation panoramique
Le banc d’ irradiation panoramique est destiné exclusivement à l’étalonnage des dosimètres individuels (films, stylos, TLD, etc.).
Il est implanté dans un local en béton dont les dimensions intérieures sont: longueur: 10,5 cm; largeur: 5,2 m; hauteur: 4 m.
L’irradiateur est constitué par un plateau de plexiglas horizontal de 108 cm de rayon situé à 92 cm du sol et tournant à 1 tour/min.
Une source de 137Cs de 1,2 Ci peut être placée automatiquement au centre du plateau dans un tube d’acier inoxydable de 2 mm d’épaisseur par l’intermédiaire d’un système pneumatique.
Les porte-dosimètres sont disposés en gradins sur le plateau suivant des cercles concentriques de 30, 50, 80 et 100 cm de rayon et restent toujours perpendiculaires au rayonnement.
L’étalonnage effectué en exposition est donné dans le tableau III.
Remarque
Pour tenir compte d’une éventuelle hétérogénéité due au rayonnement diffusé ou à des effets d’ombre des structures, l’étalonnage a été effectué pour un nombre entier de tours du plateau.
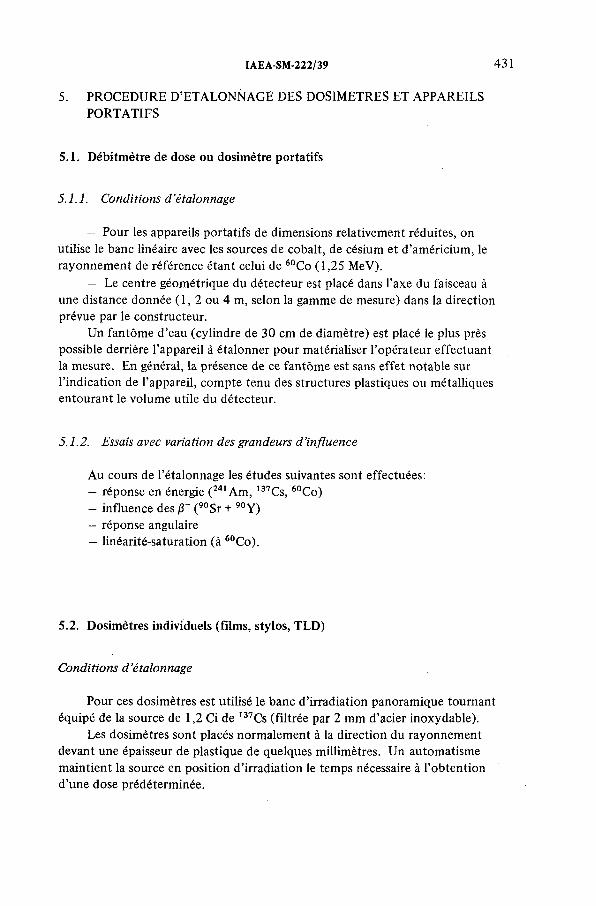
IAE A-SM-222/39 431
5. PROCEDURE D’ETALONNAGE DES DOSIMETRES ET APPAREILS PORTATIFS
5.1. Débitmètre de dose ou dosimètre portatifs
5.1.1. Conditions d ’étalonnage
— Pour les appareils portatifs de dimensions relativement réduites, on utilise le banc linéaire avec les sources de cobalt, de césium et d’américium, le rayonnement de référence étant celui de 60Co (1,25 MeV).
— Le centre géométrique du détecteur est placé dans l’axe du faisceau à une distance donnée ( 1, 2 ou 4 m, selon la gamme de mesure) dans la direction prévue par le constructeur.
Un fantôme d’eau (cylindre de 30 cm de diamètre) est placé le plus près possible derrière l’appareil à étalonner pour matérialiser l’opérateur effectuant la mesure. En général, la présence de ce fantôme est sans effet notable sur l’indication de l’appareil, compte tenu des structures plastiques ou métalliques entourant le volume utile du détecteur.
5.1.2. Essais avec variation des grandeurs d ’influence
Au cours de l’étalonnage les études suivantes sont effectuées:— réponse en énergie (241Am, 137Cs, 60Co)— influence des |3~ (90Sr + 90Y)— réponse angulaire— linéarité-saturation (à 60Co).
5.2. Dosimètres individuels (films, stylos, TLD)
Conditions d ’étalonnage
Pour ces dosimètres est utilisé le banc d’irradiation panoramique tournant équipé de la source de 1,2 Ci de 137Cs (filtrée par 2 mm d’acier inoxydable).
Les dosimètres sont placés normalement à la direction du rayonnement devant une épaisseur de plastique de quelques millimètres. Un automatisme maintient la source en position d’irradiation le temps nécessaire à l’obtention d’une dose prédéterminée.
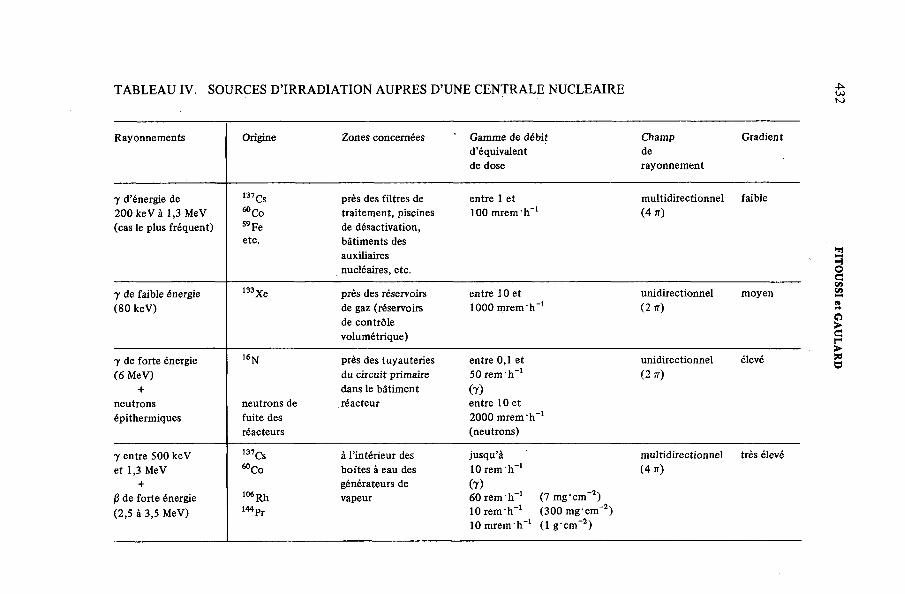
TABLEAU IV. SOURCES D’IRRADIATION AUPRES D’UNE CENTRALE NUCLEAIRE
Rayonnements Origine Zones concernées Gamme de débit d ’équivalent de dose
Champderayonnement
Gradient
y d’énergie de 200 keV à 1,3 MeV (cas le plus fréquent)
137 Cs près des filtres de60 Со traitement, piscines59 Fe de désactivation,etc. bâtiments des
auxiliairesnucléaires, etc.
entre 1 et 100 m rem 'h '
multidirectionnel faible (4 7r)
y de faible énergie (80 keV)
Xe près des réservoirs de gaz (réservoirs de contrôle volumétrique)
entre 10 et 1000 mrem h"
unidirectionnel moyen (2 jt)
y de forte énergie (6 MeV)
+neutronsépithermiques
N
neutrons de fuite des réacteurs
près des tuyauteries du circuit primaire dans le bâtiment réacteur
entre 0,1 et 50 rem h "1 (T)entre 10 et 2000 m rem 'h"1 (neutrons)
unidirectionnel élevé (2 n)
y entre 500 keV et 1,3 MeV
+/3 de forte énergie (2,5 à 3,5 MeV)
137,Cs°Co
Rh*Pr
à l ’intérieur des boîtes à eau des générateurs de vapeur
jusqu a 10 rem h "1(r)60 rem 'h 1 10 rem h” 1 10 mrem h"
multidirectionnel très élevé (4 w)
(7 m g 'cm "2) (300 m g 'cm "2) (1 g cm "2)
IAEA-SM-222/39 433
6. APPLICATION AUX MESURES DE RADIOPROTECTION AUPRESD’UNE CENTRALE NUCLEAIRE
6.1. Les sources de rayonnement /3, y que l’on peut rencontrer auprès d’une centrale nucléaire ont pour origine, soit des produits de fission ( 137Cs,133Xe, 106Rh, 144Pr, etc.), soit des produits d’activation (essentiellement 60Co,59Fe, 16N).
6.2. Compte tenu des principes évoqués dans notre introduction, il résulte que pour déterminer les risques radiologiques auxquels sont soumis les travailleurs il est nécessaire de déterminer les index d’équivalent de dose pour chacune des zones concernées énumérées dans le tableau IV.
Rappelons que l’index d’équivalent de dose Hi en un point est le maximum de l’équivalent de dose absorbée à l’intérieur d’une sphère de 30 cm de diamètre centrée en ce point et constituée par un matériau équivalent-tissus de masse volumique égale à 1 g 'cm -3.
L’index d’équivalent de dose superficiel H¡s en un point est le maximum de l’équivalent de dose absorbée entre les profondeurs de 0,07 mm et 1 cm à l’intérieur d’une sphère équivalent-tissus de 30 cm de diamètre centrée en ce point.
L’index d’équivalent de dose en profondeur H¡d en un point est le maximum de l’équivalent de dose absorbée à partir d’une profondeur de 1 cm à l’intérieur d’une sphère équivalent-tissus de 30 cm de diamètre centrée en ce point.
Pour des rayonnements y d’énergie comprise entre 60 keV et 1,3 MeV et pour des conditions d’irradiation correspondant à l’équilibre électronique dans l’air, la dose absorbée correspondant à H¡s atteint pratiquement son maximum en surface et reste sensiblement constante jusqu’à une profondeur de1 g-cm-2. Dans ces conditions, la chambre de référence avec une paroi de 300 mg-cm"2 de matériau équivalent-air ou tout appareil de mesure à chambre d’ionisation (paroi de 7 mg’ cm-2) donneront une indication proportionnelle à Hid qui est égale à H¡s. La présence d’un fantôme équivalent-tissus (sphère ou cylindre de 30 cm de diamètre) contre la chambre est sans effet pour les rayonnements de 137Cs et de 60Co.
Il n’en est pas de même pour les rayonnements de haute énergie, par exemple pour le rayonnement 7 de 6 MeV de 16N pour lequel le maximum de la dose absorbée correspondant à H¡d est atteint à une profondeur voisine de2,5 g cm"2, ce qui exige que la chambre d’ionisation soit équipée d’un écran d’épaisseur convenable pour assurer l’équilibre électronique.
Le tableau V donne les recommandations nécessaires pour satisfaire à la détermination de Hjs et Hjd dans chacun des cas considérés dans le tableau IV.
6.3. En pratique, auprès des centrales nucléaires, les agents de radioprotection disposent, pour déterminer les débits de dose profond et superficiel, d’une chambre
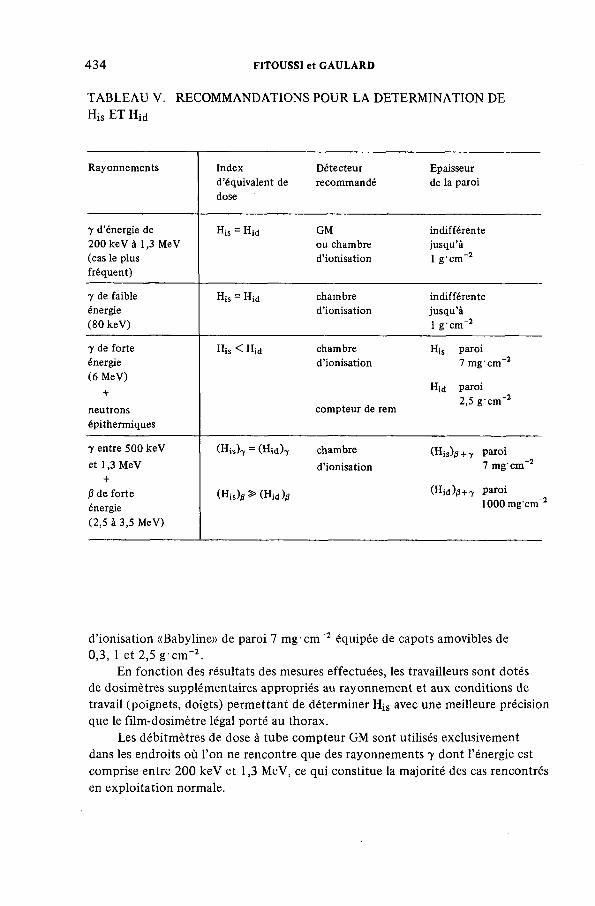
434 FITOUSSI et GAULARD
TABLEAU V. RECOMMANDATIONS POUR LA DETERMINATION DE His ET Hid
Rayonnements Indexd’équivalent de dose
Détecteurrecommandé
Epaisseur de la paroi
7 d’énergie de 200 keV à 1,3 MeV (cas le plus fréquent)
His = H id GMou chambre d’ ionisation
indifférente jusqu’à 1 g 'c m '2
7 de faible énergie (80 keV)
His = Hid chambred’ionisation
indifférente jusqu’à 1 g c m " 2
7 de forte énergie (6 MeV)
+neutronsépithermiques
His < H id chambred’ionisation
compteur de rem
H¡s Paroi7 mg ' c m '2
Hid paroi2,5 g c m '2
7 entre 500 keV et 1,3 MeV
+fi de forte énergie(2,5 à 3,5 MeV)
(His)7 = (Hid)-y
(His),¡ > (Hid)0
chambre
d’ionisation(H is)<3+7 paroi
7 m g 'c m '2
(Hid)(3+T paroi1000 m g'cm '
d’ionisation «Babyline» de paroi 7 mg-спГ2 équipée de capots amovibles de0,3, 1 et 2,5 g cm"2.
En fonction des résultats des mesures effectuées, les travailleurs sont dotés de dosimètres supplémentaires appropriés au rayonnement et aux conditions de travail (poignets, doigts) permettant de déterminer HjS avec une meilleure précision que le film-dosimètre légal porté au thorax.
Les débitmètres de dose à tube compteur GM sont utilisés exclusivement dans les endroits où l’on ne rencontre que des rayonnements y dont l’énergie est comprise entre 200 keV et 1,3 MeV, ce qui constitue la majorité des cas rencontrés en exploitation normale.
IAEAtSM -222/39 435
Pour les interventions près des tuyauteries du circuit primaire ( 16N) ou près des réservoirs susceptibles de contenir des gaz de fission ( 133Xe), les agents de radioprotection utilisent exclusivement des chambres d’ionisation portatives équipées des écrans ad hoc.
6.4. Les problèmes posés par l’étalonnage et la mesure de la dose absorbée due aux rayonnements fi sont beaucoup plus difficiles à résoudre que pour le rayonnement photonique.
En effet, il n’existe pas pour le rayonnement fi de détecteur de référence simple et fiable comme l’est la chambre d’ionisation à cavité; d’autre part, la réalisation de sources fi étalon reproductibles à partir de radionucléides n’a pas encore été parfaitement résolue.
Malgré ces difficultés, il est néanmoins possible d’effectuer des mesures de radioprotection avec une précision acceptable (± 25%) pour les rayonnements fi d’énergie maximale supérieure à 500 keV; il suffit pour cela de disposer d’une chambre d’ionisation à fenêtre d’entrée d’épaisseur et de surface appropriées à la mesure à effectuer.
Pour les rayonnements fi dont l’énergie maximale est inférieure à 1 MeV, la dose dans les tissus est maximale en surface et correspond à Hjs et elle présente une atténuation très rapide. La mesure sous 7 mg'cm-2 est représentative de la dose à la peau et ne pose pas de difficulté d’interprétation, même pour les rayonnements mixtes y + fi.
Par contre, les rayonnements fi dont l’énergie maximale est comprise entre1 et 4 MeV sont beaucoup plus pénétrants et peuvent occasionner des doses importantes à des profondeurs allant jusqu’à 500 mg'cm-2. C’est le cas des rayonnements fi de 106Rh d’énergie maximale de 3,5 MeV, rencontrés dans les générateurs de vapeur des centrales à eau sous pression. La dose fi sous 300 mg- cm-2 vient s’ajouter à la dose y des autres radionucléides présents dans une proportion pouvant atteindre 50%, alors qu’elle devient très faible sous 1000 mg’ cm-2. On voit ici l’importance des profondeurs de référence. La détermination de la dose organisme entier sous 300 m g'cm' 2 actuellement pratiquée en France conduit à surestimer les doses absorbées par certains travailleurs.
L’application du concept d’index d’équivalent de dose en profondeur recommandé par l’ICRU devrait permettre dans l’avenir une comptabilisation plus juste des doses à la peau et à l’organisme entier.
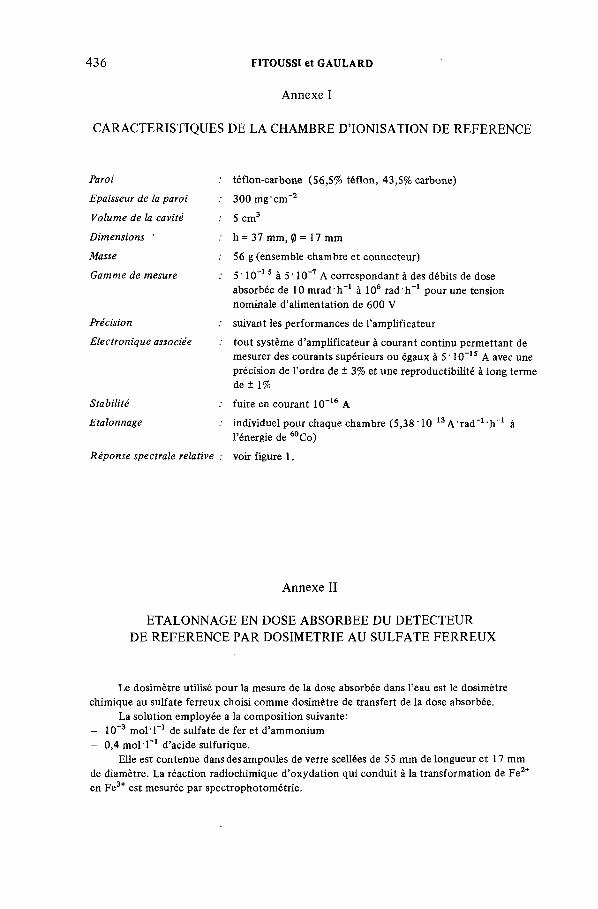
436 FITOUSSI et GAULARD
Annexe I
CARACTERISTIQUES DE LA CHAMBRE D’IONISATION DE REFERENCE
Paroi
Epaisseur de la paroi Volume de la cavité Dimensions 'Masse
Gamme de mesure
PrécisionElectronique associée
StabilitéEtalonnage
Réponse spectrale relative
téflon-carbone (56,5% téflon, 43,5% carbone)
300 mg ' cm -2
5 cm3
h = 37 mm, 0 = 1 7 mm
56 g (ensemble chambre et connecteur)
5 ' 1 0 '1 5 à 5 ' 10~7 A correspondant à des débits de dose absorbée de 10 mrad h-1 à 106 rad 'h "1 pour une tension nominale d’alimentation de 600 V
suivant les performances de l’amplificateur
tout système d ’amplificateur à courant continu permettant de mesurer des courants supérieurs ou égaux à 5 ' 10~15 A avec une précision de l’ordre de ± 3% et une reproductibilité à long terme de ± 1%
fuite en courant 10-16 A
individuel pour chaque chambre (5,38 ' 10~13 A 'ra d -1 h -1 à l’énergie de 60Co)
voir figure 1.
Annexe II
ETALONNAGE EN DOSE ABSORBEE DU DETECTEUR DE REFERENCE PAR DOSIMETRIE AU SULFATE FERREUX
Le dosimètre utilisé pour la mesure de la dose absorbée dans l’eau est le dosimètre chimique au sulfate ferreux choisi comme dosimètre de transfert de la dose absorbée.
La solution employée a la composition suivante:- 10"3 m o l 'l"1 de sulfate de fer et d’ammonium— 0,4 mol Г 1 d’acide sulfurique.
Elle est contenue dans des ampoules de verre scellées de 55 mm de longueur et 17 mm de diamètre. La réaction radiochimique d’oxydation qui conduit à la transformation de Fe2+ en Fe3+ est mesurée par spectrophotométrie.
IAEA-SM-222/39 437
Pour une irradiation donnée, la dose moyenne absorbée dans la solution est donnée par
D = k ‘ Ad/G
k: produit des coefficients et des termes correctifs propres à la technique de mesureAd: variation de la densité optique mesurée au spectrophotomètre G: rendement de la réaction (nombre d’ ions ferreux transformés en ions ferriques pour
une énergie absorbée de 100 eV)G: 15,6 ± 0,3 ions Fe3+ '( 100 eV )” 1.
DISCUSSION
G.E. CHABOT : While, as you indicated, a thick-walled chamber must be used to assess the exposure and dose equivalent from 16N accurately, we have found that at the typical locations o f interest the secondary electron population in air is such that there is little difference between measurements made with thin- and thick-walled detectors. Have you found this to be true?
R. GAULARD: Yes, for medium dose rates there is not much difference, but for high rates, near primary circuit tubing, a slight increase is observed between 300 and 1000 mg cm-2. In any case, the measurement behind 1000 mg ' спГ2 has the advantage o f eliminating the influence o f high-energy (3.5 MeV) 0-rays without affecting the measurement o f the deep dose used for computing the whole-body dose.
M.J. HÔFERT: In daily practice as well as in measurements like yours it is more important to ensure that there is sufficient backscattering than to adjust the wall thickness correctly. This is particularly true o f your instrument over a very wide range o f energies.
R. GAULARD: I agree; nevertheless, we have observed a slight increase in the measurement with an additional 1 g -cm-2 cap for high dose-equivalent rates. This cap is always useful, especially when the radiation includes high-energy j3-rays o f 3 to 4 MeV.

IAEA-SM-222/40
ETALONNAGE EN PHOTONS DES INSTRUMENTS DE RADIOPROTECTION DANS UN SERVICE DE METROLOGIE HABILITE
J. GIROUX, A. HADDAD, Yvonne HERBAUT,J.B. LEROUX, J. ROUILLONService de protection contre les rayonnements,CEA, Centre d’études nucléaires de Grenoble,Grenoble,France
Abstract-Résumé
PHOTON CALIBRATION OF RADIATION PROTECTION INSTRUMENTS IN AN AUTHORIZED METROLOGY SERVICE.
In radiation protection it is necessary to have periodical calibration and verification o f the radiation monitoring instruments and special dosimetric techniques for particular cases. To that end the Radiation Protection Service o f the Grenoble Nuclear Research Centre has developed calibration facilities which comprise 241 Am, 137Cs and 60Co radiation sources, a brief description o f which is given. This laboratory has been accepted as an authorized metrology laboratory within the ionizing radiation calibration chain o f the National Bureau o f Metrology. After describing the transfer detector and the associated electronics, the authors explain the calibration procedure used — a procedure which is standardized within the radiation protection services o f the Commissariat à l’énergie atomique — and indicate what margins o f accuracy are achieved in a calibration at this laboratory, which is on the quaternary level o f the calibration chain.
ETALONNAGE EN PHOTONS DES INSTRUMENTS DE RADIOPROTECTION DANS UN SERVICE DE METROLOGIE HABILITE.
Les besoins de la radioprotection nécessitent l’étalonnage et la vérification périodique des appareils de contrôle de l’irradiation, ainsi que la mise en oeuvre de techniques spéciales de dosimétrie dans certains cas particuliers. Dans ce but, le Service de protection contre les rayonnements du Centre d ’étude nucléaires de Grenoble a développé des installations d’étalonnage qui comprennent des moyens d’ irradiation en 241A m ,137Cs et 60Co, et qui sont brièvement décrites. Dans le cadre de la chaîne d ’étalonnage Rayonnements ionisants du Bureau national de métrologie, ce laboratoire a été agréé en tant que service de métrologie habilité. Après avoir décrit le détecteur de transfert et la chaîne électrométrique qui lui est associée, les auteurs exposent la procédure d ’étalonnage utilisée, procédure normalisée au sein des services de radioprotection du CEA, et montrent quelles sont les marges d ’exactitude obtenues lors d ’une opération d’étalonnage dans ce laboratoire, situé au niveau quaternaire de la chaîne d’étalonnage.
1. INTRODUCTION
Les besoins de la radioprotection nécessitent l’étalonnage et la vérification périodique des appareils de contrôle de l’ irradiation, ainsi que la mise en oeuvre de techniques spéciales de dosimétrie dans certains cas particuliers.
439
440 GIROUX et al.
Dans ce but, le Laboratoire de mesures des rayonnements du Service de protection contre les rayonnements, Centre d’études nucléaires de Grenoble, a développé des installations d’étalonnage en photons (X ,7 ) et en rayonnements |3.
Dans le cadre de la chaîne d’étalonnage Rayonnements ionisants du Bureau national de métrologie, ce laboratoire a été agréé en tant que service de métrologie habilité en ce qui concerne les étalonnages en photons au moyen de sources radioactives (241 Am, I37Cs, 60Co).
2. ROLE DU SERVICE DE METROLOGIE HABILITE [ 1 ]
En France, les actions des laboratoires officiels ayant une activité métro- logique sont coordonnées par le Bureau national de métrologie (BNM). Afin de transmettre les connaissances avec le minimum de perte de précision, le BNM a défini le concept de chaîne d'étalonnage ainsi que les caractéristiques et les missions des laboratoires figurant aux différents niveaux de cette chaîne.
L’étalonnage d’un instrument de mesure consiste à déterminer, soit par comparaison avec une référence, soit par une méthode absolue, les valeurs des erreurs-de cet instrument par rapport à l’étalon de référence national.
La chaîne d’étalonnage se conçoit comme la succession des étapes qui permettent de relier les caractéristiques métrologiques de l’instrument de mesure de série à la référence nationale pour une grandeur déterminée (fig.l).
Aux différents niveaux de cette chaîne se trouvent:— au niveau primaire, le Laboratoire primaire, gardien des étalons de base
nationaux;— au niveau secondaire, les Centres d’étalonnage agréés, interlocuteurs directs de
l’utilisateur ou du constructeur d’instruments de mesure; ils procèdent aux étalonnages couverts par l’Agrément au nom et pour le compte du BNM;
— au niveau tertiaire, les Services de métrologie habilités (SMH) ; pour permettre à certains laboratoires d’obtenir une reconnaissance officielle de leurs moyens d’étalonnage dans le cadre d’une société ou d’un organisme, le BNM a institué la procédure d’habilitation: celle-ci consiste en la reconnaissance par le BNM du potentiel constitué par les moyens, les méthodes, le personnel d’un service de métrologie; les étalonnages effectués par le SMH n’engagent que la seule responsabilité de la société ou de l’organisme, bien que les chaînes d’étalonnage d’un tel laboratoire soient raccordées au Laboratoire primaire.
Dans la chaîne d’étalonnage Rayonnements ionisants, le Laboratoire de mesures des rayonnements a obtenu l’habilitation en ce qui concerne les étalonnages en exposition au moyen de photons émis par des sources radioactives de 60Co,137Cs, 241 Am, et ceci pour les besoins du Commissariat à l’énergie atomique.
L’habilitation est délivrée pour une durée limitée et est soumise à un réexamen périodique. De plus, le laboratoire est tenu de participer aux campagnes d’intercomparaison organisées périodiquement par le Laboratoire primaire.
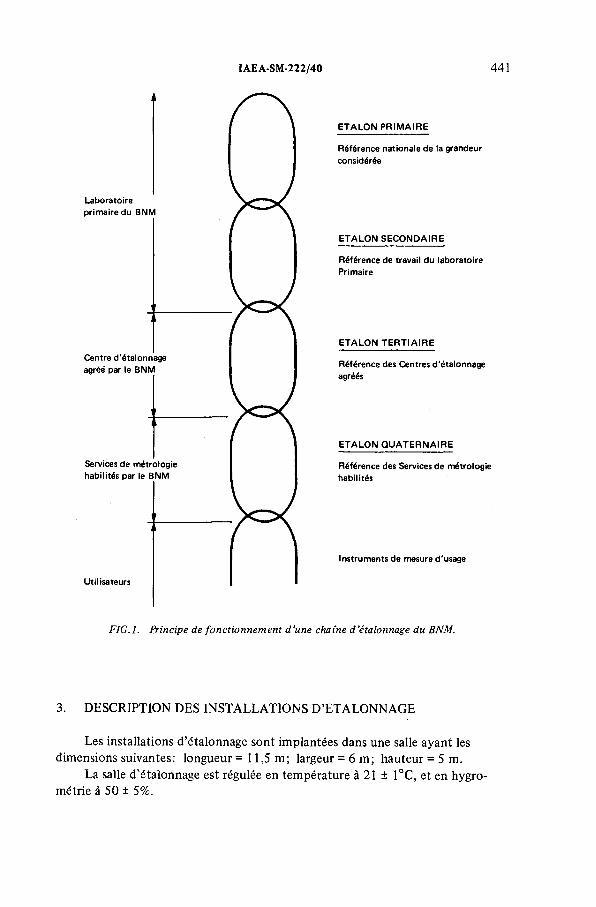
IAEA-SM-222/40 441
ETALON PRIMAIRE
Référence nationale de la grandeur considérée
ETALON SECONDAIRE
Référence de travail du laboratoire Primaire
ETALON TERTIAIRE
Référence des Centres d'étalonnage agréés
ETALON QUATERNAIRE
Référence des Services de métrologie habilités
Instruments de mesure d'usage
FIG.l. Principe de fonctionnement d'une chaîne d'étalonnage du BNM.
3. DESCRIPTION DES INSTALLATIONS D’ETALONNAGE
Les installations d’étalonnage sont implantées dans une salle ayant les dimensions suivantes: longueur = 11,5 m; largeur = 6 m; hauteur = 5 m.
La salle d’étalonnage est régulée en température à 21 ± 1°C, et en hygrométrie à 50 ± 5%.
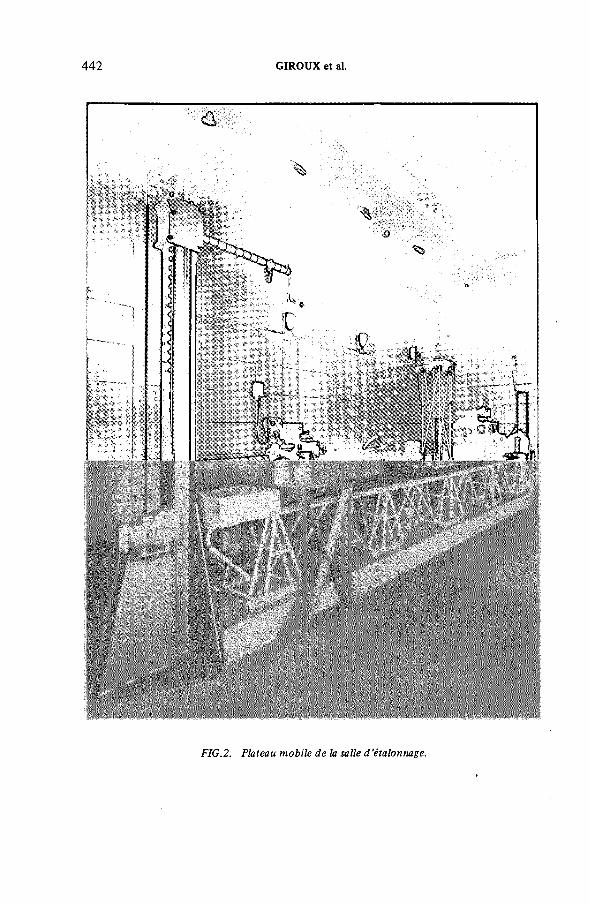
442 GIROUX et al.
FIG.2. Plateau mobile de la salle d ’étalonnage.
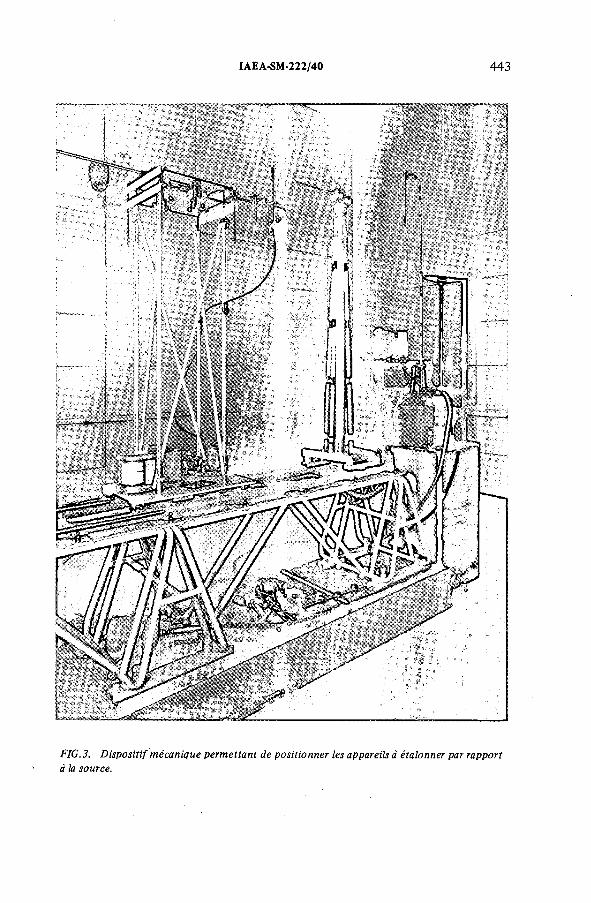
IAEA-SM-222/40 443
FIG.3. Dispositif mécanique permettant de positionner les appareils à étalonner par rapport à la source.
444 GIROUX et al.
Au centre de la salle se trouve un banc de positionnement qui permet de déplacer sur une distance de six mètres l’instrument à étalonner fixé sur un plateau mobile. Le mouvement du plateau est commandé de l’extérieur de la salle. La reproductibilité du positionnement est de 1 mm (fig.2).
Les sources radioactives sont placées dans l’axe du banc, aux deux extrémités de celui-ci, dans des châteaux de stockage en plomb. Elles peuvent être sorties automatiquement depuis l’extérieur de la salle.
L’irradiation est panoramique. En position irradiation, les sources se trouvent à une distance du sol égale à 2,5 m. Les dispositifs de fixation des châteaux de plomb et des cannes de sortie de sources ont été conçus de façon à assurer une reproductibilité d’au moins 1 mm dans le positionnement, dans l’espace, de chaque source lors des irradiations (fig.2).
Un dispositif mécanique visible sur la figure 3 permet de positionner les appareils à étalonner à une distance de 1 m par rapport à chaque source, avec une précision inférieure à 1 mm. Les autres distances source-appareil sont obtenues par déplacement au moyen du banc de positionnement relativement à cette distance de référence.
Les caractéristiques des sources radioactives sont présentées dans le tableau I.
4. RACCORDEMENT DES INSTALLATIONS D’ETALONNAGE AUX REFERENCES NATIONALES D’EXPOSITION
Les faisceaux des sources sont caractérisés en débit d’exposition. Ils ont été raccordés aux références nationales d’exposition:— pour certains faisceaux, par un réétalonnage externe effectué par le Laboratoire
primaire de métrologie des rayonnements ionisants (LPMRI)— pour les autres faisceaux, par un réétalonnage interne effectué par le laboratoire
au moyen d’un détecteur de transfert étalonné lui-même dans les faisceaux précédents.
4.1. Réétalonnage externe [2,3]
Le réétalonnage externe concerne les faisceaux des sources suivantes:60
Со 22 GBq ( s 600 mCi)137Cs 0,16 TBq (= 4 ,3 Ci)241
Am 0,15 TBq ( s 4 Ci).
Il a été effectué par le LPMRI au moyen de ses détecteurs de transfert. Ces détecteurs sont des chambres d’ionisation à cavité ayant servi à caractériser en
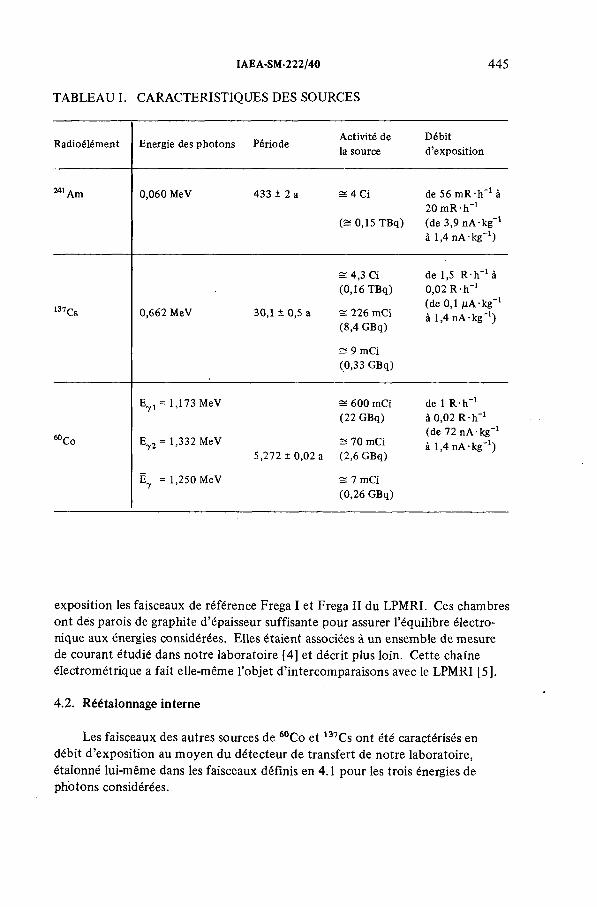
IAEA-SM-222/40
TABLEAU I. CARACTERISTIQUES DES SOURCES
445
Radioélément Energie des photons PériodeActivité de la source
Débitd’exposition
241 Am 0,060 MeV 433 ± 2 a s 4 Ci
( £ 0,15 TBq)
de 56 m R -h ' 1 à 20 m R -h "1 (de 3,9 nA kg" 1 à 1,4 nA k g '1)
a 4,3 Ci de 1,5 R IT1 à(0 ,16 TBq) 0 ,02 R -h-1
137Cs 0,662 MeV 30,1 ± 0 ,5 a = 226 mCi (8 ,4 GBq)
a 9 mCi (0,33 GBq)
(de 0,1 /uA-kg- 1 à 1,4 n A -k g '1)
E7 l = 1,173 MeV s 600 mCi de 1 R -h -1(22 GBq) à 0,02 R -h -1
S О о E72 = 1,332 MeV
Ë7 = 1,250 MeV
5,272 ± 0 ,02 aS 70 mCi (2,6 GBq)
== 7 mCi (0 ,26 GBq)
(de 72 nA -kg -1
à 1,4 nA kg-1)
exposition les faisceaux de référence Frega I et Frega II du LPMRI. Ces chambres ont des parois de graphite d’épaisseur suffisante pour assurer l’équilibre électronique aux énergies considérées. Elles étaient associées à un ensemble de mesure de courant étudié dans notre laboratoire [4] et décrit plus loin. Cette chaîne électrométrique a fait elle-même l’objet d’intercomparaisons avec le LPMRI [5].
4.2. Réétalonnage interne
Les faisceaux des autres sources de 60Co et 137Cs ont été caractérisés en débit d’exposition au moyen du détecteur de transfert de notre laboratoire, étalonné lui-même dans les faisceaux définis en 4.1 pour les trois énergies de photons considérées.
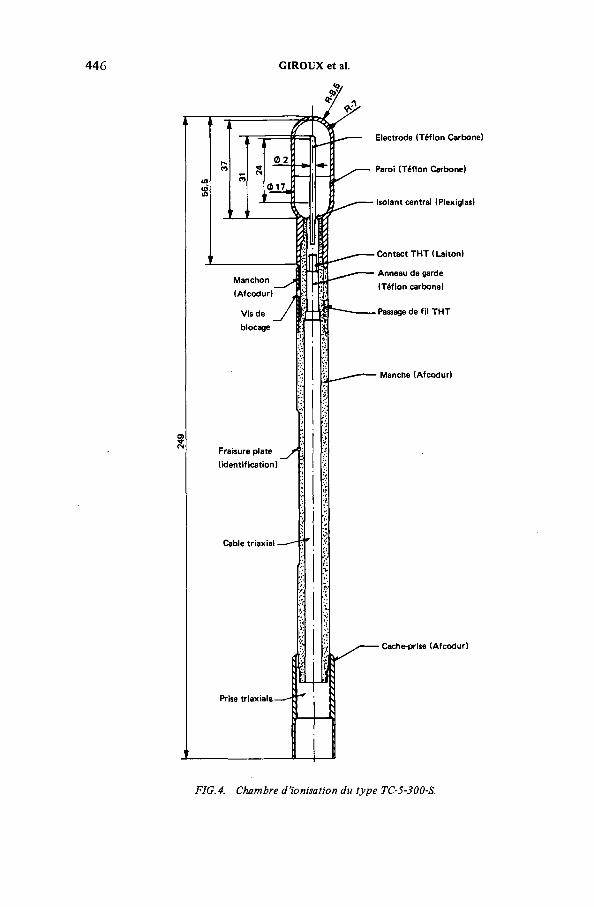
446 GIROUX et al.
FIG.4. Chambre d ’ionisation du type TG-5-300-S.
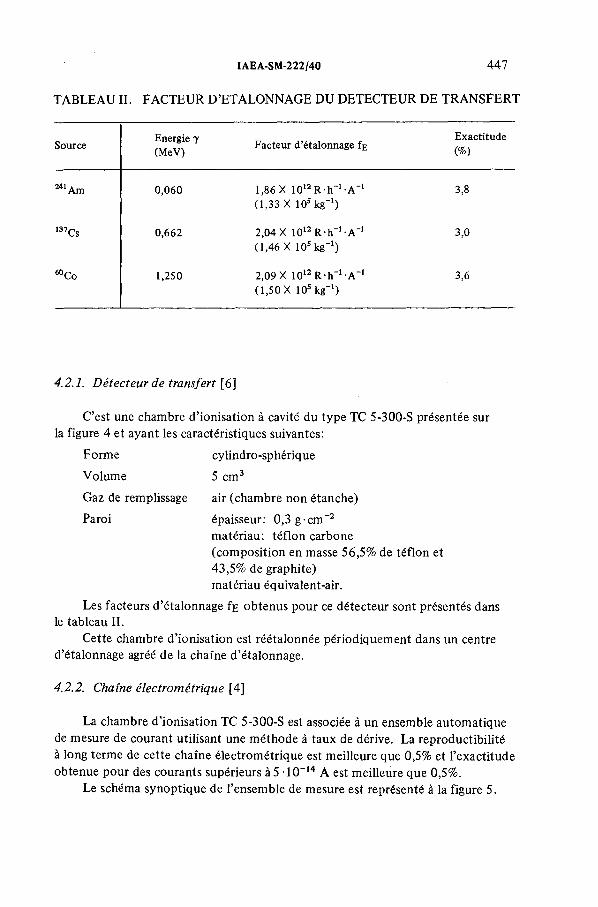
TABLEAU II. FACTEUR D’ETALONNAGE DU DETECTEUR DE TRANSFERT
IAEA-SM-222/40 447
SourceEnergie y (MeV)
Facteur d’étalonnage fgExactitude(%)
241 Ara 0,060 1,86 X 10¹² R h-1 -A " 1 (1 ,33 X 105 kg-1)
3,8
137Cs 0,662 2,04 X 10l î R -h '1 -A ‘ 1 (1 ,46 X 105 kg”1)
3,0
“ Со 1,250 2,09 X 10¹² R -h ” 1 'A -1 (1 ,50 X 105 kg”1)
3,6
4.2.1. Détecteur de transfert [6]
C’est une chambre d’ionisation à cavité du type TC 5-300-S présentée sur la figure 4 et ayant les caractéristiques suivantes:
Forme cylindro-sphériqueVolume 5 cm3
Gaz de remplissage air (chambre non étanche)Paroi épaisseur: 0,3g-cm -2
matériau: téflon carbone (composition en masse 56,5% de téflon et 43,5% de graphite) matériau équivalent-air.
Les facteurs d’étalonnage fE obtenus pour ce détecteur sont présentés dans le tableau II.
Cette chambre d’ionisation est réétalonnée périodiquement dans un centre d’étalonnage agréé de la chaîne d’étalonnage.
4.2.2. Chaîne électrométrique [4]
La chambre d’ionisation TC 5-300-S est associée à un ensemble automatique de mesure de courant utilisant une méthode à taux de dérive. La reproductibilité à long terme de cette chaîne électrométrique est meilleure que 0,5% et l’exactitude obtenue pour des courants supérieurs à 5 10-14 A est meilleure que 0,5%.
Le schéma synoptique de l’ensemble de mesure est représenté à la figure 5.
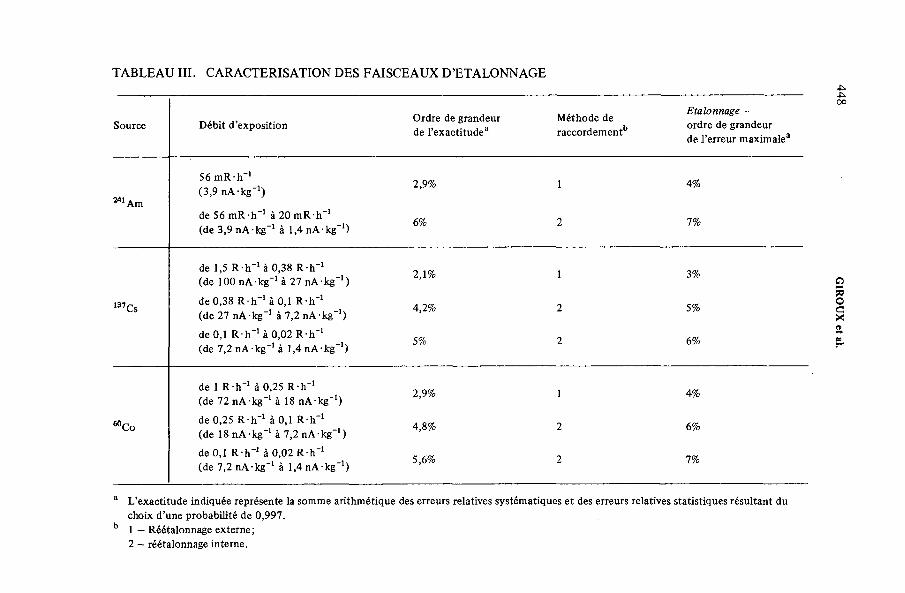
TABLEAU III. CARACTERISATION DES FAISCEAUX D’ETALONNAGE
Source Débit d’expositionOrdre de grandeur de l’exactitude3
Méthode de raccordementb
Étalonnage - ordre de grandeur de l’erreur maximale®
241 Am
56 m R -h ' 1 (3,9 n A -k g"1)
2,9% 1 4%
de 56 m R -h ' 1 à 20 mR h" 16% 7%
(de 3,9 nA-kg" 1 à 1,4 n A -k g"1)
de 1,5 R -h "1 à 0,38 R -h "1 (de 100 nA-kg"1 à 27 n A -k g"1)
2 , 1% 1 3%
137Csde 0,38 R -h ' 1 à 0,1 R -h ' 1 (de 27 nA-kg" 1 à 7,2 n A -k g"1)
4,2% 2 5%
de 0,1 R -h " 1 à 0 ,02 R -h " 15% 2 6%
(de 7,2 nA -kg" 1 à 1,4 n A -k g "1)
de 1 R h"1 à 0,25 R -h ' 12,9% 1
(de 72 nA-kg" 1 à 18 n A -k g"1)
8 О о
de 0,25 R -h "1 à 0,1 R -h " 14,8% 6%
(de 18 nA • kg" 1 à 7,2 nA • kg" 1 )
de 0,1 R -h ' 1 à 0 ,02 R -h "15,6% 7%
(de 7,2 nA-kg" 1 à 1,4 n A -k g"1)
a L’exactitude indiquée représente la somme arithmétique des erreurs relatives systématiques et des erreurs relatives statistiques résultant du choix d’une probabilité de 0,997.
b 1 — Réétalonnage externe;2 — réétalonnage interne.
448 GIROUX
et al.
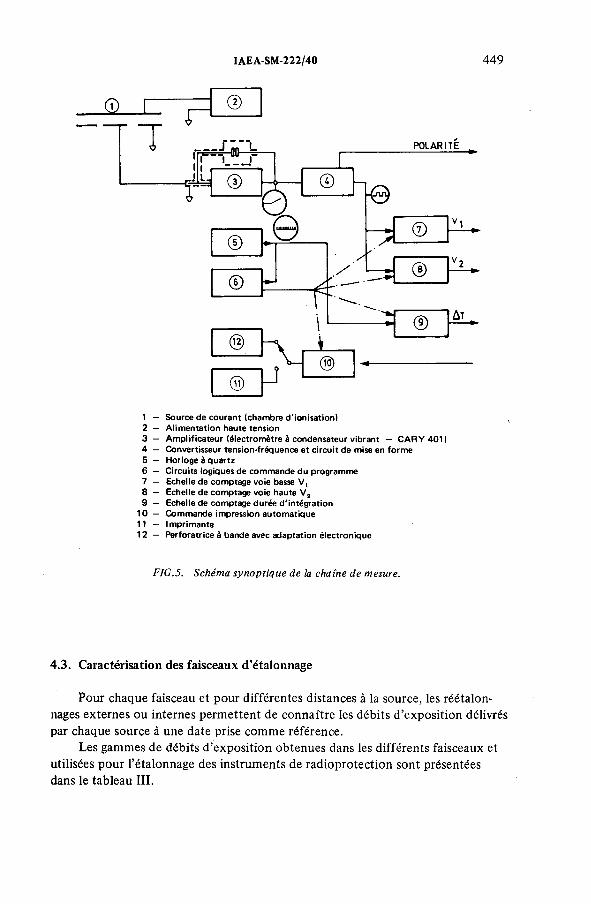
IAEA-SM-222/40 449
1 - Source de courant (chambre d'ionisation)2 — Alimentation haute tension3 — Amplificateur (électromètre à condensateur vibrant — CARY 401)4 — Convertisseur tension-fréquence et circuit de mise en forme5 — Horloge à quartz6 — Circuits logiques de commande du programme7 — Echelle de comptage voie basse V,8 — Echelle de comptage voie haute V a9 — Echelle de comptage durée d'intégration
10 — Commande impression automatique11 — Imprimante12 — Perforatrice à bande avec adaptation électronique
FIG.5. Schéma synoptique de la chaîne de mesure.
4.3. Caractérisation des faisceaux d’étalonnage
Pour chaque faisceau et pour différentes distances à la source, les réétalonnages externes ou internes permettent de connaître les débits d’exposition délivrés par chaque source à une date prise comme référence.
Les gammes de débits d’exposition obtenues dans les différents faisceaux et utilisées pour l’étalonnage des instruments de radioprotection sont présentées dans le tableau III.
450 GIROUX et al.
Les marges d’exactitude dépendent des méthodes de raccordement utilisées, mentionnées au paragraphe 4, et de la gamme des débits d’exposition.
Dans ces débits d’exposition, la contribution due au rayonnement diffusé, mise en évidence à partir de la loi inverse carré, est inférieure à 5%.
5. ETALONNAGE D’INSTRUMENTS DE RADIOPROTECTION
Etalonner un instrument de radioprotection consiste à relier son indication à la valeur réelle de la grandeur à mesurer au point où est placé l’appareil.
Deux cas se présentent selon que la grandeur à mesurer est :— l’exposition ou le débit d’exposition— la dose absorbée ou le débit de dose absorbée.
5.1. Etalonnage en exposition ou débit d ’exposition
Les différents faisceaux de photons sont caractérisés en débit d’exposition à une date prise comme référence, et corrigés de l’atténuation due à la colonne d’air pour chaque distance à la source.
Lors de l’étalonnage d’un instrument, les conditions atmosphériques prises comme référence sont 22°C et 1013 mbar.
Il convient de prendre en compte, outre les erreurs dues à l’instrument lui- même, les erreurs dues:
— à la période de la source— à la distance source-instrument— au facteur de correction nécessaire pour ramener l’ indication de l’instrument
aux conditions atmosphériques de référence— au coefficient d’atténuation massique de l’air pour l’énergie des photons
considérée.La dernière colonne du tableau III donne l’ordre de grandeur de l’erreur
maximale obtenue dans le meilleur des cas lors d’un étalonnage, c’est-à-dire lorsque l’instrument à étalonner n’introduit pas d’erreur sensible.
5.2. Etalonnage en dose absorbée ou débit de dose absorbée dans les tissus
La plupart des instruments de radioprotection ont une échelle de lecture graduée en dose absorbée ou débit de dose absorbée.
Pour un tel appareil, la grandeur de référence, c’est-à-dire le débit de dose absorbée dans les tissus Dt sous une profondeur 1 de tissu, peut être calculé à partir de la valeur du débit d’exposition X à condition que l’épaisseur 1 assure l’équilibre électronique pour l’énergie des photons 'Ey considérée [7]. Dt est donné, suivant le système d’unités, par les relations suivantes:
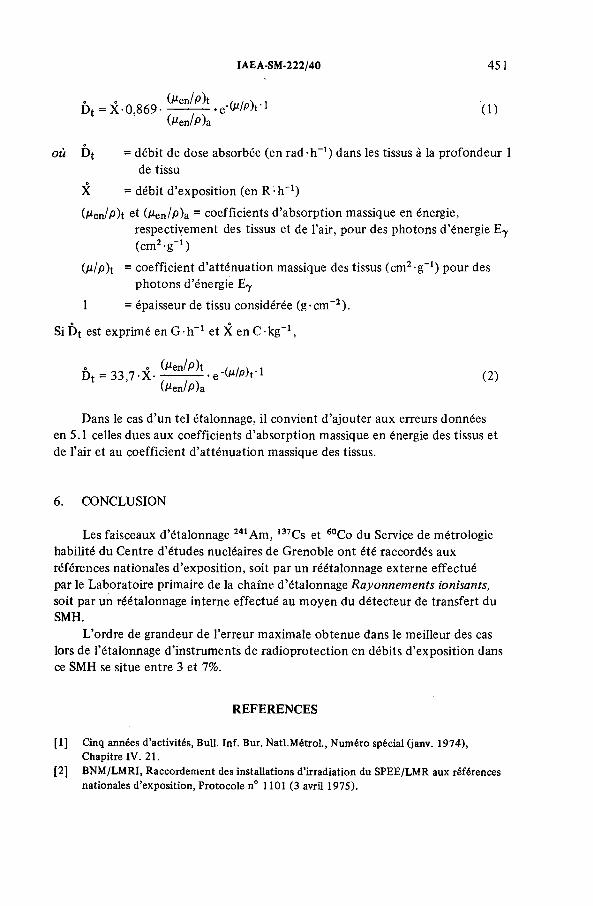
IAEA-SM-222/40 451
(1)
où Dt = débit de dose absorbée (en rad - h ') dans les tissus à la profondeur 1de tissu
X = débit d’exposition (en R ; h"1)(¿(en/p)t et (Men/p)a = coefficients d’absorption massique en énergie,
respectivement des tissus et de l’air, pour des photons d’énergie E-y (cm2-g-1)
(/i/p)t = coefficient d’atténuation massique des tissus (cm2-g-1) pour des photons d’énergie E-y
1 = épaisseur de tissu considérée (g• cm-2).
Si Dt est exprimé en G-h"1 et X en C-kg"1,
Dans le cas d’un tel étalonnage, il convient d’ajouter aux erreurs données en 5.1 celles dues aux coefficients d’absorption massique en énergie des tissus et de l’air et au coefficient d’atténuation massique des tissus.
6. CONCLUSION
Les faisceaux d’étalonnage 241 Am, 137Cs et 60Co du Service de métrologie habilité du Centre d’études nucléaires de Grenoble ont été raccordés aux références nationales d’exposition, soit par un réétalonnage externe effectué par le Laboratoire primaire de la chaîne d’étalonnage Rayonnements ionisants, soit par un réétalonnage interne effectué au moyen du détecteur de transfert du
L’ordre de grandeur de l’erreur maximale obtenue dans le meilleur des cas lors de l’étalonnage d’instruments de radioprotection en débits d’exposition dans ce SMH se situe entre 3 et 7%.
[1] Cinq années d’activités, Bull. Inf. Bur. Natl.Métrol., Numéro spécial (janv. 1974), Chapitre IV. 21.
[2] BNM/LMRI, Raccordement des installations d’irradiation du SPEE/LMR aux références nationales d’exposition, Protocole n° 1101 (3 avril 1975).
. g -CM/P)t -1 (2)
SMH.
REFERENCES
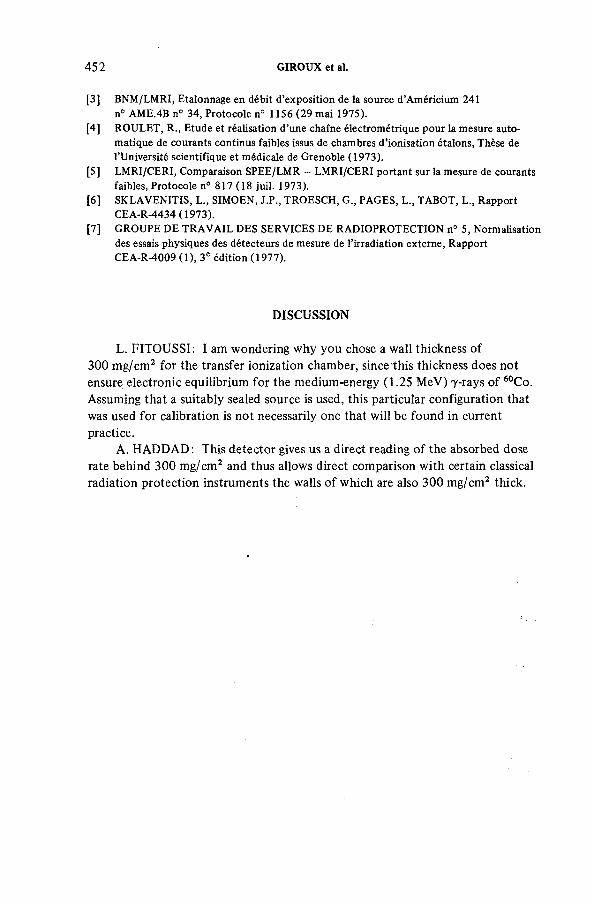
[3] BNM/LMRI, Etalonnage en débit d’exposition de la source d’Américium 241 n° AME.4B n° 34, Protocole n° 1156 (29 mai 1975).
[4] ROULET, R., Etude et réalisation d’une chaîne électrométrique pour la mesure automatique de courants continus faibles issus de chambres d’ionisation étalons, Thèse de l’Université scientifique et médicale de Grenoble (1973).
[5] LMRI/CERI, Comparaison SPEE/LMR — LMRI/CERI portant sur la mesure de courants faibles, Protocole n° 817 (18 juil. 1973).
[6 ] SKLAVENITIS, L., SIMOEN, J.P., TROESCH, G ., PAGES, L., ТАВОТ, L., Rapport CEA-R-4434 (1973).
[7] GROUPE DE TR AV A IL DES SERVICES DE RADIOPROTECTION n° 5, Normalisation des essais physiques des détecteurs de mesure de l’irradiation externe, Rapport CEA-R-4009 (1), 3e édition (1977).
4 5 2 GIROUX et al.
DISCUSSION
L. FITOUSSI: I am wondering why you chose a wall thickness of 300 mg/cm2 for the transfer ionization chamber, since this thickness does not ensure electronic equilibrium for the medium-energy (1.25 MeV) 7 -rays of 60Co. Assuming that a suitably sealed source is used, this particular configuration that was used for calibration is not necessarily one that will be found in current practice.
A. HADDAD : This detector gives us a direct reading of the absorbed dose rate behind 300 mg/cm2 and thus allows direct comparison with certain classical radiation protection instruments the walls of which are also 300 mg/cm2 thick.
IAEA-SM-222/17
PHYSICAL REQUREMENTS FOR MEASUREMENT OF RADIATION DOSE AND THEIR RELATIONSHIP TO PERSONNEL DOSE METER DESIGN AND USE
G.E. CHABOT Jr., M.A. JIMENEZ, K.W. SKRABLE University of Lowell,Lowell, Massachusetts,United States of America
Abstract
PHYSICAL REQUIREMENTS FOR MEASURMENT OF RADIATION DOSE AND THEIR RELATIONSHIP TO PERSONNEL DOSE METER DESIGN AND USE.
This paper stems from the concerns of the authors with both the design of current personnel dose meters and the interpretation of dose information from them in light of the actual physical requirements to measure dose. These concerns have been reinforced, and extended following a comparative study of the responses of particular TLD and film systems and as the result of a recent national survey on personnel dosimetry conducted by the authors. Among the major points discussed are the systems available for penetrating and shallow dose assessment, dose meter calibration, the measurement and interpretation of skin dose, and the deficiencies of neutron albedo dose meters for routine personnel use. Calibration considerations address the questions of whether or not a phantom should be used and the difference in interpretation of responses with and without a phantom; the relationship between calculated and measured doses; and electronic equilibrium considerations in the measurement of photon doses. Matters of importance in relation to skin dose measurement include techniques in use to interpret skin dose from dose meter response; the appropriateness of evaluation of the surface dose to the live skin layer versus the average dose to the live skin layer and the limitations and requirements on dose meter design with respect to the dose being evaluated; and the significance of dose meter response in relationship to currently used beta calibration standards. Regarding the use of TLD albedo type neutron dose meters currently available, considerations are extended to the strong energy spectral dependence of the dose meter response and the possibility of making significant over or underestimations of neutron dose equivalent, depending on the calibration techniques used and the spectral quality encountered.
Introduction
The assessment of radiation doses to individuals from external sources of radiation is not, in general, a particularly simple task. Knowledge of the types and energies of radiation impinging on the body and the distribution of absorbed energy within the body may commonly be required in order to make an accurate assessment of dose equivalent. In routine personnel exposure situations, we commonly use a single dosimeter placed on
453
454 CHABOT et al.
the trunk of the body to provide us with an estimate, frequently the only one, of the dose equivalent to the whole body and/or specific body organs (e.g. skin, eye). Such a device is necessarily limited in its ability to provide all of the information required in all circumstances.
One problem, common to all such devices, is the uncertainty in response interpretation under non ideal conditions of irradiation geometry. Radiations entering the body from directions not initially incident on the dosimeter can produce dosimeter responses not well correlated with actual doses delivered to the body. In the case of "good" geometry, it may still not be possible to extrapolate dosimeter response to a specific organ dose; the economics and practicality of dosimeter design commonly limit the ability to obtain sufficient information as to types and energies of radiations for purposes of depth dose estimations. While difficulties such as the above may be beyond normal control, the problem of obtaining acceptably accurate dose equivalent estimations is commonly aggravated by poor dosimeter design and its relationship to response interpretation.
A dosimeter worn on the trunk of the body and irradiated from the forward direction should, ideally, yield a response which can be correlated directly with the dose quantities of interest. For the majority of cases v the quantities of interest are the dose equivalent to the skin (shallow dose) and the dose equivalent to the whole body (penetrating dose). More specifically, and in the interest of conservatism, the quantities of interest are the respective dose equivalent indices, which per ICRU[1] are the dose equivalents at the points in the shallow and deep layers where the respective dose equivalents are maximum. In cases of routine personnel dosimetry, where information is not available as to energy spectral quality of the radiations, determination of the index quantities is not practical, and dosimeter designs provide information as to the dose at a fixed depth. Dosimeter design and use for the assessment of penetrating and shallow dose equivalents are discussed below.
Penetrating Dose Assessment
For the very great majority of cases, the radiations of concern from a penetrating dose viewpoint are photons and neutrons. It has been the authors' experience [2] and that of many others involved in personnel dosimetry that adequate estimations of whole body dose equivalents from photon exposures over a range of energies from about 50 keV to a few MeV can be obtained from dosimeters currently available and in use. This situation does not currently prevail for routine neutron dose measurements, and considerable care must be taken in the interpretation of neutron
dosimeter responses.
Photon Dose Assessment
Film and thermoluminescent materials (primarily LiF) represent the active components found in most dosimeters in use today. Both of these media appear suitable, in a proper dosimeter design, for evaluation of photon exposures. Most dosimeters in popular use employ a fixed thickness of more or less tissue equivalent material above the active element whose response is indicative of the penetrating photon dose. From one dosimeter user or supplier to another, however, there appears to be considerable variability in the thickness of material provided above the gamma sensitive element with thicknesses ranging from less than 300 mg cm 2 to more than 1000 mg cm 2 [з]. This variability possibly reflects disparate opinions among standard setting, regulating, and recommending agencies. The ICRU [l] recommends that the penetrating dose be determined at or below the
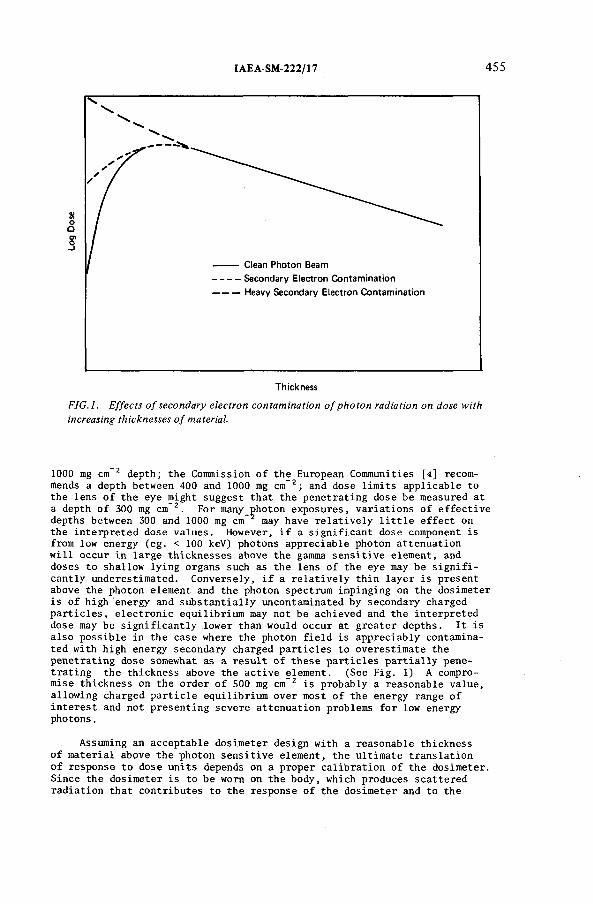
IAEA-SM-222/17 455
T h ic k n e s s
FIG.l. Effects o f secondary electron contamination o f photon radiation on dose with increasing thicknesses o f material.
1000 mg cm 2 depth; the Commission of the European Communities [4 ] recommends a depth between 400 and 1000 mg cm 2 ; and dose limits applicable to the lens of the eye might suggest that the penetrating dose be measured at a depth of 300 mg cm 2 . For many photon exposures, variations of effective depths between 300 and 1000 mg cm may have relatively little effect on the interpreted dose values. However, if a significant dose component is from low energy (eg. < 100 keV) photons appreciable photon attenuation will occur in large thicknesses above the gamma sensitive element, and doses to shallow lying organs such as the lens of the eye may be significantly underestimated. Conversely, if a relatively thin layer is present above the photon element and the photon spectrum impinging on the dosimeter is of high energy and substantially uncontaminated by secondary charged particles, electronic equilibrium may not be achieved and the interpreted dose may be significantly lower than would occur at greater depths. It is also possible in the case where the photon field is appreciably contaminated with high energy secondary charged particles to overestimate the penetrating dose somewhat as a result of these particles partially penetrating the thickness above the active element. (See Fig. 1) A compromise thickness on the order of 500 mg cm 2 is probably a reasonable value, allowing charged particle equilibrium over most of the energy range of interest and not presenting severe attenuation problems for low energy photons.
Assuming an acceptable dosimeter design with a reasonable thickness of material above the photon sensitive element, the ultimate translation of response to dose units depends on a proper calibration of the dosimeter. Since the dosimeter is to be worn on the body, which produces scattered radiation that contributes to the response of the dosimeter and to the
456 CHABOT et al.
dose to the body, it is appropriate to perform calibration irradiations with the dosimeter mounted on a suitable phantom. Information obtained by the authors tends to show that, at least in the U.S.A., such irradiations are typically carried out in air with no phantom [3 ]. Determination of the true value of the absorbed dose and dose equivalent at the dosimeter location on the phantom may be made in a number of ways. Measurement with an appropriate instrument at the surface of the phantom is probably the most direct method although an instrument with a sufficiently small detector, capable of giving an accurate response at the surface of the phantom, may not be commonly available. Alternative techniques are to measure the exposure in air at an appropriate distance from a source or to calculate the exposure from a source of known strength. These exposure values may then be converted to tissue dose units by applying the ratio of tissue to air mass energy absorption coefficients accounting for scattered radiation in the phantom. This scatter correction can be done theoretically but this is tedious, and facilities may not always be available for such calculations. A simple and generally acceptable method is to expose a dosimeter at the appropriate distance first in air and then in place on the phantom to establish the correction factor accounting for scatter. The magnitude of the scatter effect naturally varies with incident photon energy and may represent an increase in dose ranging from a small fraction of a percent for high energy photons (several MeV) to about 15% or more for low energy photons (few hundred keV). The extent of the error in dose estimation which occurs as a consequence of calibrating the dosimeter with no phantom present is, for much of the energy range of common interest, within acceptable limits; however, the error is one which can be reduced with minimal effort and expense and such should be done. Dosimeter calibrations should naturally be carried out with sources whose photon energies are typical of the fields most likely to be encountered in use.
Neutron Dose Assessment
The requirements on a personnel dosimeter for measuring whole body dose equivalent from neutrons are considerably more demanding and difficult to meet than those encountered for photons. The relationship between tissue absorbed dose and dosimeter response for neutron exposures is frequently obscure since the materials and nuclear reactions used to provide a dosimeter response may be quite different from those in tissue. Even if the dosimeter renders a realistic measurement of tissue absorbed dose from neutrons, the extrapolation to units of dose equivalent could not be made without energy spectral information needed to assign reasonable quality factors. In practice, the neutron dose equivalent is often overestimated in such cases by applying the most conservative quality factor. Unlike most photon sources whose spectral quality is usually well known, most neutron sources emit a complicated energy spectrum of neutrons whose energies may be greatly modified by necessary shielding and other material surrounding the source. Thus, energy response of a neutron dosimeter is difficult to assess experimentally. Unlike neutron dosimetry systems, photon systems may be designed so that their response is quite independent of energy over a fairly large energy range.
Systems for Assessing Neutron and Photon Doses
Film and TLD's are the most common dosimetry systems used today to assess the penetrating dose equivalent from neutrons and photons. For assessing photon doses, the detecting element of both systems are covered by an appropriate thickness of tissue equivalent material to assure electronic equilibrium. As indicated earlier, the film system often includes the use of metal filters of varying atomic numbers to correct for the
IAEA-SM-222/17 457
photon energy dependence of film. The photon and neutron detecting active element common to many TLD systems is LiF, whose effective atomic number is close to that of soft tissue. When covered by an appropriate thickness of tissue equivalent material, the LiF integrates, the absorbed dose from photon produced secondary electrons entering and produced in it. The quality factor for all photon energies is assumed to be unity so that the response of the LiF TLD material is then directly indicative of the dose equivalent. The neutron responses of TLD and film are quite different and are discussed as follows:
The systems primarily in use employ either film which is held in an appropriate badge and responds primarily to neutrons directly incident on the badge or thermoluminescent devices which are used as part of an albedo dosimetry system. Progress with track etching techniques in various plastics is promoting more popular use, and such systems will likely soon be available commercially for fast neutron dosimetry. With appropriate badge designs, typically incorporating certain thermal neutron absorbers such as boron or cadmium, both film and thermoluminescent dosimeters (TLD's) can be made to respond differentially to fast and thermal neutrons.Both detectors, however, suffer from pronounced weaknesses which can make dose equivalent interpretation complicated or impossible.
Track production in selected film emulsions is the mechanism primarily relied on for neutron dose assessment. Fast neutrons produce recoil proton tracks upon entering the film badge and, upon development, the observed track density in the film is correlated with neutron fluence and dose. The sensitivity of the overall technique is such that there is a practical cutoff energy of about 0.7 MeV below which response is negligible. Thermal energy neutrons may also be measured by track producing reactions in the emulsion (e.g., IlfN(n,p) 1ЧС) or by exposure of the emulsion to beta and/or gamma radiations resulting from thermal capture in emulsion constituents or in external foils (e.g., cadmium). The reliability of film as a neutron monitor is further weakened by the problem of track fading. The extent of latent image fading depends strongly on the time lapse between exposure and development of the film as well as on environmental conditions. Track fading can lead to appreciable errors in neutron dose assessments; Table 1 provides some representative information in this regard.
TLD's incorporated into simple albedo systems have come into rather popular use for personnel neutron dosimetry. In general, these systems use thermal neutron sensitive thermoluminescent material such as 6LiF or natural lithium borate and rely on the slowing down of fast neutrons in the body to produce some thermal neutrons which are scattered into the dosimeter.As neutron energies increase the extent of forward scatter relative to backward scattering increases, the number of collisions required to thermalize the neutrons increases, and the end result is that the dosimeter response tends to decrease with increasing incident neutron energies. Figure 2 plots the product of the number of collisions needed to thermalize a neutron of energy, E, and the quality factor vs. E; this provides a semiquantitative indication of dosimeter response per unit dose equivalent.
One of the simplest albedo systems currently commercially available uses a 6LiF dosimeter covered on the front side by a piece of cadmium of sufficient thickness to attenuate thermal neutrons which would impinge directly on the dosimeter; a 7LiF dosimeter is also located behind the cadmium to allow for correction of the 6LiF response to gamma radiation.Although this system is insensitive to thermal neutrons entering the badge from the forward direction, it is quite sensitive to thermal neutron reflected into the dosimeter from the body. The sensitivity to fast
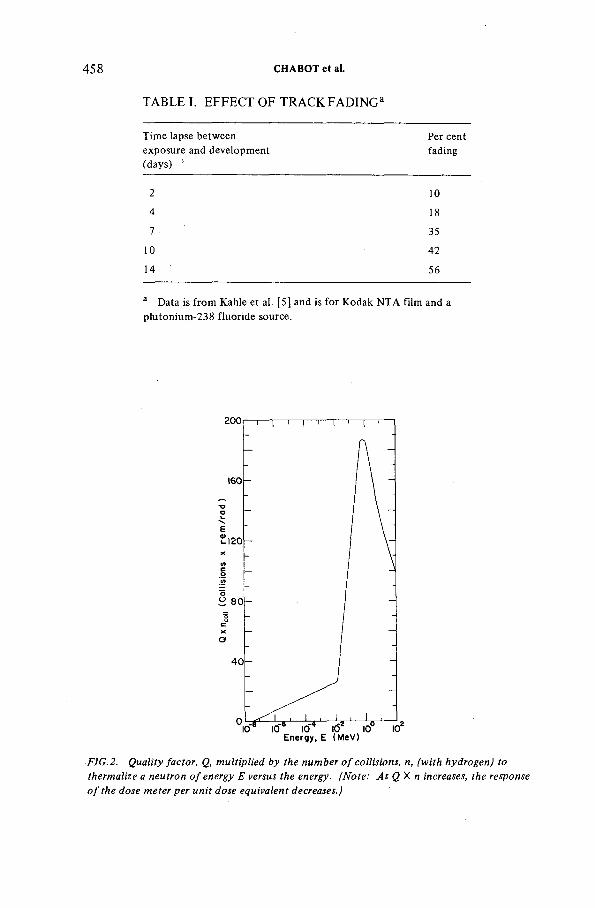
TABLE I. EFFECT OF TRACK FADING3
458 CHABOT et al.
Time lapse between exposure and development (days) *
Per cent fading
2 10
4 18
7 35
10 42
14 56
a Data is from Kahle et al. [5] and is for Kodak NTA film and a plutonium-238 fluoride source.
FIG. 2. Quality factor, Q, multiplied by the number o f collisions, n, (with hydrogen) to thermalize a neutron o f energy E versus the energy. (Note: As QX n increases, the response o f the dose meter per unit dose equivalent decreases.)
IAEA-SM-222/17 459
neutrons is much less than that for thermal neutrons; we have found variations in response per unit mrem of dose equivalent as large as a factor of one thousand comparing response to a rather heavily moderated Pu-Ве source vs. the response to an unmoderated Pu-Ве source in air [a]. In fields of unknown spectral quality such a dosimeter is virtually useless. On the other hand, if exposure situations tend to be constant in terms of the neutron energy spectrum one encounters, a simple dosimeter such as the above has considerable utility when calibrated for the conditions of use. Somewhat more sophisticated albedo thermoluminescent systems for routine personnel dosimetry are in use at some facilities, and two such systems have been discussed in recent publications [e, 7 ]. These systems incorporate two thermal neutron sensitive elements, one facing the incoming neutrons and the second facing the body of the wearer, the two elements being separated by a thermal neutron absorber such as borated plastic.Such a dosimeter provides some information as to the energy spectral quality of the neutron fluence producing a particular response; the ratio of responses of the unshielded element to the shielded dosimeter (i.e., dosimeter behind thermal neutron shield) increases as the spectrum shifts towards lower energies. As Crites [ e ] points out, systems such as this provide acceptably accurate assessments of neutron dose equivalents for a given neutron source and a particular type of moderator since the calibration factor for the system varies in a predictable fashion as the energy spectrum is modified by adding or decreasing amounts of moderating material between the source and the dose point. However, if the neutron source spectrum changes, or if a different type of spectrum modifying material is incorporated between the source and the dose point, large shifts in the calibration factor may result and produce unacceptable estimates of doses. For situations in which the neutron source spectrum is constant and the physical structures which might alter this spectrum do hot change in type, the dosimeter type described above is markedly better than the single element type described earlier since it does allow for wide variation in overall spectral quality. Further sophistications of neutron dosimeters of the types noted above might improve overall ability to measure dose equivalents from a variety of sources although such changes generally make the dosimetry more complicated and expensive.
The calibration and testing of neutron personnel dosimeters is, for most facilities, more complex and difficult to accomplish than that of photon dosimeter calibrations. In order to properly evaluate a neutron dosimeter it may be necessary to use several different sources moderated to varying degrees to produce a variety of neutron spectra for assessing dosimeter response. The determination of the true neutron dose equivalent at the dose point may require the use of rem responding instruments, energy spectral measurements, and/or the application of analytical spectrum unfolding techniques. Since the body is an effective scatterer of neutrons the response of the dosimeter may be greatly affected by neutrons scattered into it from the body, and neutron calibrations should be carried out using a phantom. In the case of albedo dosimeters the body is an integral part of the system, and the requirement for a phantom is absolute.
Shallow Dose Assessment
For most practical and legal purposes, the shallow dose which one
is normally interested in evaluating is the skin dose. This most commonly results from exposure to beta particles and photon induced secondary electrons. While neutrons and high energy charged particles might be of concern for certain situations these are of relatively minor importance and not specifically considered here. The ICRU [ 1 ] recommend that the shallow dose equivalent index be evaluated at a depth between 7 mg cm 2 and
460 CHABOT et al.
1000 mg cm- 2 , While this thickness interval includes the dermal tissue over the entire body it extends considerably below the dermis to include asignificant fraction of the fatty layer over most of the body area. Fromthe point of view of evaluating the skin dose it would seem more appropriate to the authors to limit the depth to about 200 mg cm 2 , which thickness would include the live skin layer over most of the body surface of interest and exclude most of the subcutaneous fatty tissue.
The capabilities of personnel dosimeters presently in use for assessment of skin dose are in many cases limited by poor dosimeter design. One of the most common failings is in the thickness of the layer of material placed above the active dosimeter. Many badge designs include excessive thicknesses, conmionly ranging from 21 to 30 mg cm 2 compared to the desired 7 mg cm 2 [ 3 ]. The effect of the additional thickness is to reduce sharply the response to relatively low energy electrons and to provide appreciable attenuation and spectrum degradation of moderate energy electrons. A
second rather common design flaw is to recess the active element behind asmall opening in the face of the badge. In some cases this results in asignificant geometry dependence such that electrons entering the badge at rather shallow angles with respect to the plane of the badge may be attenuated in the badge holder and not reach the dosimeter. For certain exposure situations, such as that which might be encountered by immersion in a cloud of fi-у emitting radioactivity, underestimates of the shallow dose may occur. A third problem related to dosimeter design is somewhat more subtle and refers to what quantity is actually being measured when one interprets the response of a dosimeter of finite thickness to electrons.In the case where LiF is used, dosimeter thicknesses in common use range from about 10 mg cm 2 to greater than 800 mg cm 2 with a large fraction in the area of a few hundred mg cm 2 . Electrons entering these dosimeters are attenuated to varying degrees depending on their energies and deposit all or a fraction of their energy in the dosimeter. Only in the case where the dosimeter thickness is small compared to the radiation length of the electrons of concern is the energy deposition in the dosimeter uniform; and only under this condition is the response of the dosimeter interpretable as the surface dose to the live skin layer. Otherwise, the response of the dosimeter is actually a measure of the average dose to the dosimeter. Figure 3 shows how the ratio of average dose 1 to live skin surface dose would be expected to vary as a function of increasing dosimeter thickness for exposure to beta emitters of specified maximum energies. It is evident from Figure 3 that large differences may exist between the average dose and surface dose^ For a maximum beta energy of 2 MeV and a dosimeter thickness of 200 mg cm 2 the average dose represents about 52% of the surface dose, and for a lower maximum beta energy of 0.5 MeV the same dosimeter would yield an average dose equal to about 9.3% of the surface dose. This points
up the difficulties which apply to current techniques for estimating skin doses from electrons using available TLD systems.
Calibrations of such systems typically employ irradiation with a high energy beta emitter (e.g., 2 38U and daughters, 90Sr - 90Y) and correlation of response with the surface dose to the dosimeter. Field use of the dosimeter may involve exposure to electron spectra appreciably different from the calibration source spectrum, and significant errors in surface dose appraisal may result. While the surface dose generally provides the most conservative estimate of the skin dose, it is a difficult quantity to measure with available systems. If dosimeters are made sufficiently
1 Average dose calculated for a broad parallel beam of beta particles (see Ref. [14]).
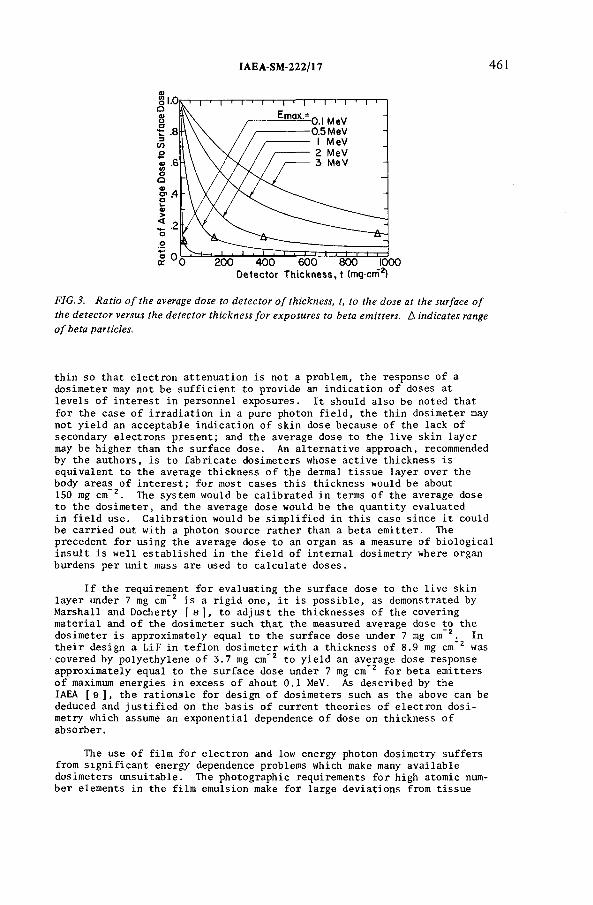
IAEA-SM-222/17 461
FIG.3. Ratio of the average dose to detector of thickness, t, to the dose at the surface of
the detector versus the detector thickness for exposures to beta emitters. Л indicates range of beta particles.
thin so that electron attenuation is not a problem, the response of a dosimeter may not be sufficient to provide ал indication of doses at levels of interest in personnel exposures. It should also be noted that
for the case of irradiation in a pure photon field, the thin dosimeter may not yield an acceptable indication of skin dose because of the lack of secondary electrons present; and the average dose to the live skin layer may be higher than the surface dose. An alternative approach, recommended by the authors, is to fabricate dosimeters whose active thickness is equivalent to the average thickness of the dermal tissue layer over the body areas of interest; for most cases this thickness would be about 150 mg cm 2 . The system would be calibrated in terms of the average dose to the dosimeter, and the average dose would be the quantity evaluated in field use. Calibration would be simplified in this case since it couldbe carried out with a photon source rather than a beta emitter. Theprecedent for using the average dose to an organ as a measure of biological insult is well established in the field of internal dosimetry where organ burdens per unit mass are used to calculate doses.
If the requirement for evaluating the surface dose to the live skin layer under 7 mg cm 2 is a rigid one, it is possible, as demonstrated by Marshall and Docherty [s], to adjust the thicknesses of the covering material and of the dosimeter such that the measured average dose to the dosimeter is approximately equal to the surface dose under 7 mg cm 2 . In their design a LiF in teflon dosimeter with a thickness of 8.9 mg cm 2 was covered by polyethylene of 3.7 mg cm 2 to yield an average dose response approximately equal to the surface dose under 7 mg cm 2 for beta emitters of maximum energies in excess of about 0.1 MeV. As described by the IAEA [9], the rationale for design of dosimeters such as the above can bededuced and justified on the basis of current theories of electron dosimetry which assume an exponential dependence of dose on thickness of absorber.
The use of film for electron and low energy photon dosimetry suffers from significant energy dependence problems which make many available dosimeters unsuitable. The photographic requirements for high atomic number elements in the film emulsion make for large deviations from tissue
462 CHABOT et al.
equivalence and produce a markedly increased response at low energies; beta dosimetry below about 0.2 MeV is impractical. The necessity for maintaining a light tight film packet also frequently leads to heavier than desirable coverings above the film. At least one supplier of commercial film badge services now offers an extended beta dosimetry capability by providing a badge in which selected film areas are covered by varying
thicknesses of plastic, The relative responses under these thicknesses
provide some information as to effective electron energies and allow a more reasonable estimation of dose.
As implied earlier, response calibrations for dosimeters intended to measure the surface dose to the live skin layer are not, in general, as convenient to carry out as those which apply to dosimeters designed to measure the average dose to the skin layer. Appropriate beta emitters (preferably free of other radiations) must be prepared in suitable forms such as infinitely thick slabs or point sources. Dose rates at fixed distances from the sources may be either calculated or measured. Calculations may require corrections for air attenuation and spectrum degradation and typically are more complex, tedious, and subject to error than are dose calculations for a simple photon emitter. Measurements of dose
rates from beta sources are best made with an instrument such as an extrapolation ionization chamber which requires considerably more skill and attention in its application than do many instruments available for photon dosimetry.
Summary
Dosimeters currently available for routine use in personnel monitoring have a variety of limitations in terms of their ability to measure dose equivalent from various radiations. Some of these limitations are inherent in the use of a measuring device, placed on a single location on the surface of the body, from whose response we attempt to extract information as to surface doses and penetrating doses. Errors are, however, sometimes compounded by poor dosimeter designs and misapplications. Ionizing photon dosimeters presently available with a reasonable thickness of material above the active element are capable of providing acceptable dose information over a wide range of photon energies. This situation does not, in general, prevail for neutron and electron (or very low energy photon) dosimeters. A neutron dosimeter for routine personnel monitoring, capable of yielding acceptable information in a variety of neutron fields, does not exist. Knowledge of the neutron spectrum must be available in order to assess the response of the dosimeter. Application of a calibration factor obtained for a particular source spectrum can produce dose estimates in error by orders of magnitude when used for evaluation of exposure to an unknown spectrum. It is possible at present to design a dosimeter for measuring the skin dose from electrons and low energy photons, although a large number of the dosimeters in present use are not appropriate. Excessive thicknesses of material above the dosimeter and unsuitable thicknesses of the dosimeters, themselves, make for severe energy dependence problems in many cases.
In the U.S.A., and probably in other countries as well, ionizing photons represent the greatest concern from the point of view of personnel exposure; evaluation of skin dose is the second greatest requirement; and neutron dose evaluation is carried out with the least frequency [з].From the standpoint of state of the art capabilities in routine personnel monitoring, it is probably fortunate that this is the situation. Present capabilities in photon dosimetry are reasonably good; skin dose measurements are subject to considerable error with many systems in use, but it
IAEA-SM-222/17 463
is possible to design acceptable dosimeters and an effort should be extended in this direction; neutron dosimetry suffers from the greatest problems and adequate dosimeter designs for general use are not available.
REFERENCES
[1] INTERNATIONAL COMMISSION ON RADIATION UNITS AND MEASUREMENTS, Conceptual Basis for the Determination of Dose Equivalent, ICRU Report 25, ICRU, Washington, DC (1976).
[2] JIMENEZ, M .A ., Comparison of the Responses of Film and Thermoluminescent Personnel Dosimeters to Beta, Gamma, and Neutron Radiations, University o f Lowell, Master’s Thesis (1976).
[3] CHABOT, G.E., JIMENEZ, M .A., SKRABLE, K.W., Personnel dosimetry in the USA, Health Phys. (in press).
[4] COMMISSION OF THE EUROPEAN COMMUNITIES, Technical Recommendations for Monitoring the Exposure of Individuals to External Radiation, CEC Rep. EUR 5287e, Luxembourg (1975).
[5] KAHLE, J.B., ARNETT, E.N., MEYER, C.T., Latent image fading in personnel monitoring neutron film, Health Phys. 17 5 (1969) 735.
[6] CRITES, T.R., An experimental study of the spectral dependence of an albedo-type neutron dosimeter, Health Phys. 31 2 (1976) 154.
[7] BRUNSKILL, R.T., Albedo-type neutron dosimeter, Health Phys. 32 5 (1977) 455.[8] MARSHALL, М., DOCHERTY, J., Measurement of skin dose from low-energy beta
and gamma radiation using thermoluminescent discs, Phys. Med. Biol. 16 (1971) 503.[9] INTERNATIONAL ATOMIC ENERGY AGENCY, Measurement of Short-Range
Radiations, Technical Report Series No. 150, IAEA, Vienna (1973) Appendix I.
DISCUSSION
R. GAULARD: In the calibration o f personnel gamma dose meters (film or TLD) we have found no measurable difference for 60Co or 137Cs when the dose meters are irradiated in front o f a phantom. There is a difference o f about ± 5% for 241 Am. Have you observed this, too? And what gamma source do you use to calibrate your dose meters?
G.E. CHABOT: Yes, we have observed pretty much the same thing. For relatively high-energy photons, e.g. 137Cs or 60Co, the backscatter is very slight and produces a negligible change in measured responses. For low-energy photons, the photon fluence may increase significantly because o f backscatter, and the interpreted dose may increase by 4 or 5% (at 50-60 keV) with a phantom in place. Although a 5% change or error is in itself acceptable, it is added to other errors associated with dosimetry, and since it can be reduced fairly easily it is appropriate to do so.
464 CHABOT et al.
A.C. LUCAS: You spoke o f the problem of reduced detectability as TLDs are made thinner and thinner. Ms. Ehrlich has shown that the boundary conditions set down by the ICRP are increasingly generous for small exposures. What is the thinnest TLD you feel is practical?
G.E. CHABOT: I do not feel that the “ thin dose meter-surface dose” approach is the best; it is possible to design a dose meter with an average response equivalent to the surface response (dose) at the live skin layer. Marshall and Docherty have done this in the past, using a thin (~ 8 mg/cm2) TLD coveredby a thickness o f less than 7 mg/cm2 (3 to 4 mg/cm2); such a design is quite delicate and subject ot problems in many rôutine situations. A practical limit to TLD chip thickness for routine use in personnel dosimetry is probably about 10 mg/cm2.
H.O. WYCKOFF: When the ICRU was developing the index quantities, it considered the permissible levels for the skin. It was decided that a separate instrument having a wall thickness of 0.007 cm was not necessary if the annual shallow dose-equivalent index did not exceed the lowest annual dose limit. This is possible because the annual dose-equivalent limit to the skin is much larger than the lowest annual dose limit. This reasoning still holds with the new ICRP recommendation (ICRP Publication 26) that the dose-effect relationship for the skin should be considered to have a threshold.
G.E. CHABOT: Yes, what one selects as an appropriate thickness for the shallow dose assessment or for skin dose evaluation may vary depending on one’s interpretation o f the dose problem and the quantity to be measured (e.g. is skin, for legal purposes, to be considered as the live skin layer only or does it include underlying tissue as well? ).
J.E. McLAUGHLIN: I, o f course, agree with Mr. Wyckoff on the usefulness o f the 7 to 1000 mg/cm2 thickness of absorber for interpreting dose measurements with personnel monitors. However, thin-wall instruments are needed for the accurate determination o f stay times for maintenance workers exposed to high dose rates from distributed sources o f high-energy beta emitters.
IAEA-SM-222/19
USE OF A PHANTOM IN PERSONNEL DOSIMETRY PHOTON CALIBRATIONS*
W.T. BARTLETT, J.P. HOLLAND, C.D. HOOKER, O.R. MULHERN, D.M. FLEMING Battelle, Pacific Northwest Laboratories, Richland, Washington, United States of America
Abstract
USE OF A PHANTOM IN PERSONNEL DOSIMETRY PHOTON CALIBRATIONS.Recent proposed standards require the use of phantom backing in the calibration of
personnel dose meters. This technique better approximates the conditions to which dose meters are exposed when worn on the human body. Changes in calibration methodology resulting from this requirement are discussed. Data are presented to verify the relationship of dose equivalence to photon energy. Measurement of X-ray spectral quality, perturbations due to the positioning of in-beam monitors and phantoms, and variations in beam current measurement are important in determining calibration error. These variables will be discussed with respect to Hanford’s calibration system.
1.0 INTRODUCTION
Photon calibrations of dosimeters have trad ition a lly been accomplished "fre e -in -a ir". The exposure rate has been measured by positioning a transfer standard ionization chamber at the position at which the personnel dosimeter was to be irradiated. The exposure received by the dosimeter was determined using the delivered exposure rate or monitoring the beam with a transmission chamber [1,2]. Recently i t was recognized that exposing a dosimeter free-in a ir does not simulate the conditions in which the personnel dosimeter is worn. Therefore, a standard was drafted by the Health Physics Society Standards Committee (HPSSC WG/15) [3] requiring the use of phantom backing for personnel dosimeter irrad iations. The standard also required that irrad iations be interpreted in terms of dose equivalent index rather than exposure. The WG/15 standard necessitates many changes in x-ray dosimeter calibrations. The changes required by the use of a phantom are discussed in th is paper.
2.0 FREE-IN-AIR X-RAY CALIBRATION
The WG/15 standard requires that the uncertainty in the value of the assigned dose equivalent index doesnot exceed 5 percent. An investigation of the existing free-air calibration techniques was in itiated to determine sources of s ign ifican t experimental error. Some of the potential sources of error are discussed below.
* Based on work performed under contract EY-76-C-06-1830 with USERDA, the functions of which have been transferred to the Department of Energy.
465
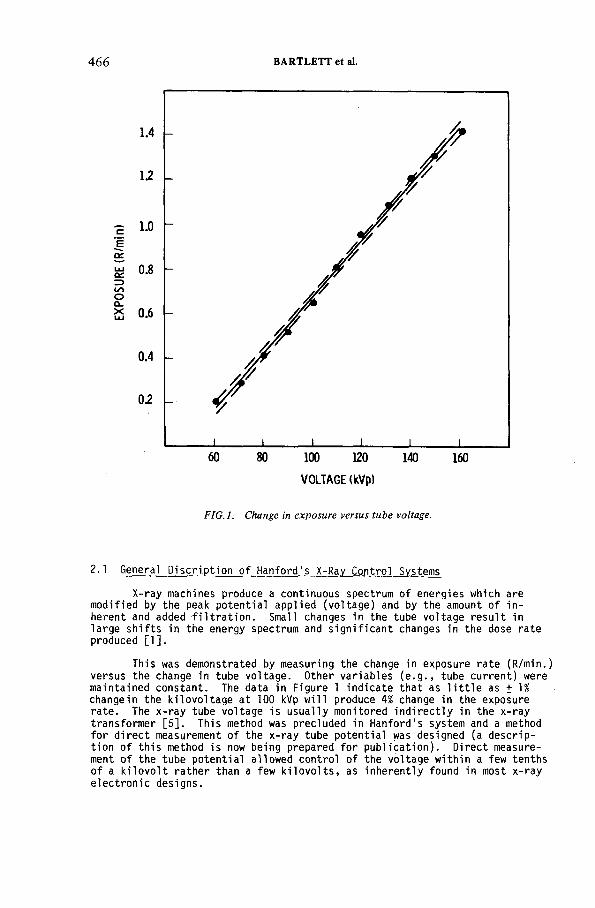
466 BARTLETT et al.
1 .4
12
1.0ES £ °-8 =3 (Лоa 0.6
0 .4
02
2.1 General D isc r iption of Hanford's X-Ray Control Systems
X-ray machines produce a continuous spectrum of energies which are modified by the peak potential applied (voltage) and by the amount of in herent and added f ilt ra t io n . Small changes in the tube voltage result in large sh ifts in the energy spectrum and sign ifican t changes in the dose rate produced [1].
This was demonstrated by measuring the change in exposure rate (R/min.) versus the change in tube voltage. Other variables (e.g., tube current) were maintained constant. The data in Figure 1 indicate that as l i t t le as + 1% changein the kilovoltage at 100 kVp w ill produce 4% change in the exposure rate. The x-ray tube voltage is usually monitored ind irectly in the x-ray transformer [5]. This method was precluded in Hanford's system and a method for d irect measurement of the x-ray tube potential was designed (a description of th is method is now being prepared for publication). Direct measurement of the tube potential allowed control of the voltage within a few tenths of a k ilovo lt rather than a few k ilovo lts, as inherently found in most x-ray electronic designs.
VOLTAGE (kVp)
FIG.l. Change in exposure versus tube voltage.
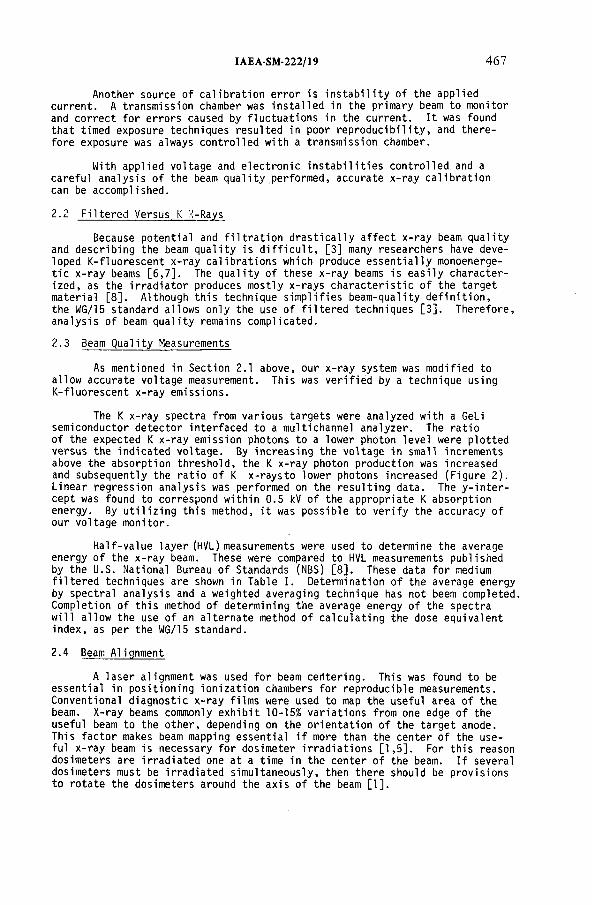
IAEA-SM-222/19 467
Another source of calibration error is in sta b ility of the applied current. A transmission chamber was insta lled in the primary beam to monitor and correct for errors caused by fluctuations in the current. I t was found that timed exposure techniques resulted in poor reproducibility, and therefore exposure was always controlled with a transmission chamber.
With applied voltage and electronic in s ta b ilit ie s controlled and a careful analysis of the beam quality performed, accurate x-ray calibration can be accomplished.
2.2 Filtered Versus К X-Rays
Because potential and f ilt ra t io n d rast ica lly affect x-ray beam quality and describing the beam quality is d if f ic u lt , [3] many researchers have developed K-fluorescent x-ray calibrations which produce e ssentia lly monoenerge- t ic x-ray beams [6,7]. The quality of these x-ray beams is e asily characterized, as the irrad iator produces mostly x-rays characteristic of the target material [8]. Although th is technique sim plifies beam-quality defin ition, the WG/15 standard allows only the use of filtered techniques [3]. Therefore, analysis of beam quality remains complicated.
2.3 Beam Quality Measurements
As mentioned in Section 2.1 above, our x-ray system was modified to allow accurate voltage measurement. This was verified by a technique using K-fluorescent x-ray emissions.
The К x-ray spectra from various targets were analyzed with a Geli semiconductor detector interfaced to a multichannel analyzer. The ratio of the expected К x-ray emission photons to a lower photon level were plotted versus the indicated voltage. By increasing the voltage in small increments above the absorption threshold, the К x-ray photon production was increased and subsequently the ratio of К x-raysto lower photons increased (Figure 2). Linear regression analysis was performed on the resulting data. The y-in ter- cept was found to correspond within 0.5 kV of the appropriate К absorption energy. By u t iliz in g th is method, i t was possible to verify the accuracy of our voltage monitor.
Half-value layer (HVL) measurements were used to determine the average energy of the x-ray beam. These were compared to HVL measurements published by the U.S. National Bureau of Standards (NBS) [8]. These data for medium filtered techniques are shown in Table I. Determination of the average energy by spectral analysis and a weighted averaging technique has not beem completed. Completion of th is method of determining the average energy of the spectra w ill allow the use of an alternate method of calculating the dose equivalent index, as per the WG/15 standard.
2.4 Beam Alignment
A laser alignment was used for beam cerltering. This was found to be essential in positioning ionization chambers for reproducible measurements. Conventional diagnostic x-ray film s were used to map the useful area of the beam. X-ray beams commonly exhibit 10-15% variations from one edge of the useful beam to the other, depending on the orientation of the target anode.This factor makes beam mapping essential i f more than the center of the useful x-ray beam is necessary for dosimeter irrad iations [1,5]. For th is reason dosimeters are irradiated one at a time in the center of the beam. I f several dosimeters must be irradiated simultaneously, then there should be provisions to rotate the dosimeters around the axis of the beam [1].
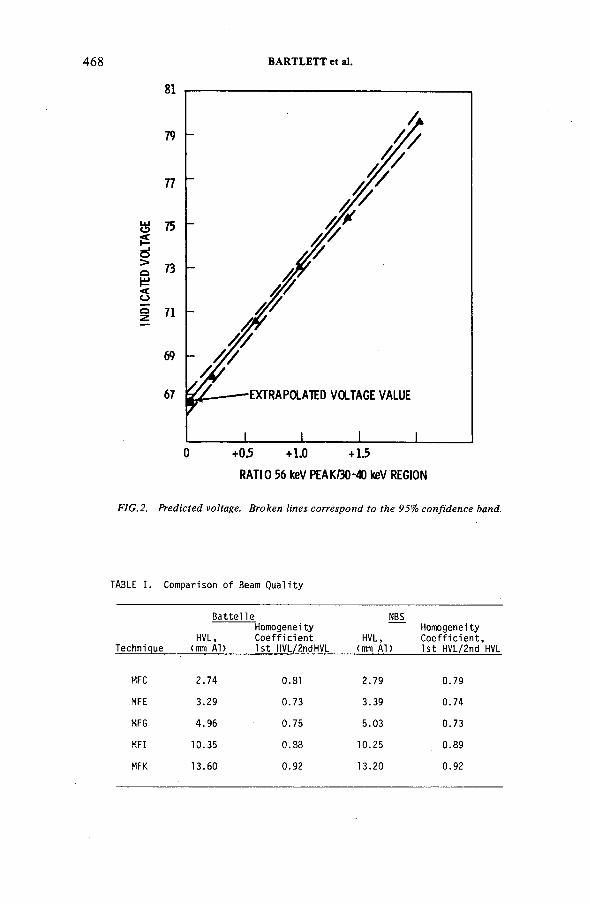
468 BARTLETT et al.
RATIO 56 keV PEAK/30-40 keV REGION
FIG.2. Predicted voltage. Broken lines correspond to the 95% confidence band.
TABLE I. Comparison of Beam Quality
Battel le NBSHomogeneity Homogeneity
HVL, Coefficient HVL, Coefficient,Technique <mm Al>______1st HVL/2ndHVL (rnm Al)_____ 1st HVL/2nd HVL
MFC 2.74 0.81 2.79 0.79
MFE 3.29 0.73 3.39 0.74
MFG 4.96 0.75 5.03 0.73
MFI 10.35 0.83 10.25 0.89
MFK 13.60 0.92 13.20 0.92
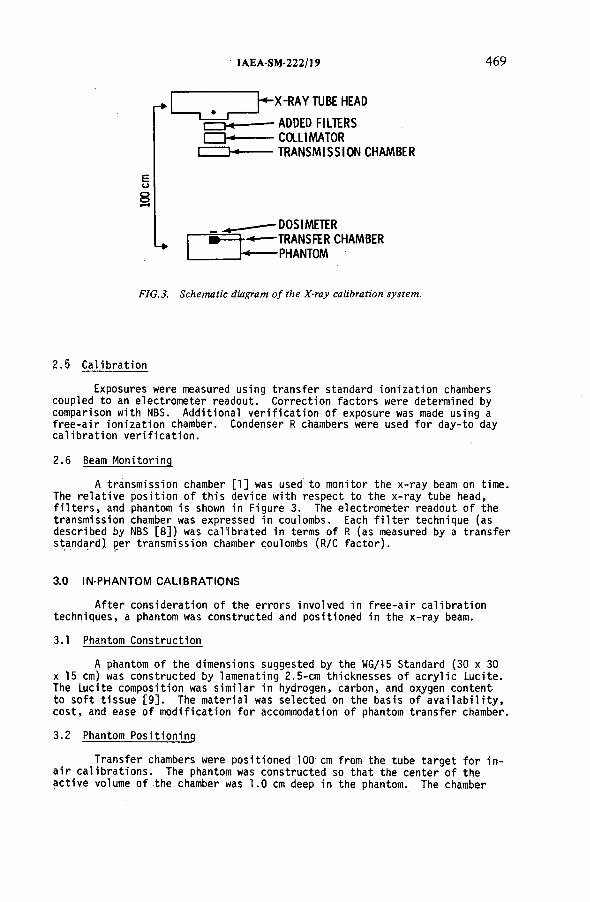
IAEA-SM-222/19 469
Eо8
X-RAY TUBE HEAD
ADDED FILTERS COLLIMATOR TRANSMISSION CHAMBER
-DOSIMETER -TRANSFER CHAMBER -PHANTOM
FIG.3. Schematic diagram o f the X-ray calibration system.
2.5 Calibration
Exposures were measured using transfer standard ionization chambers coupled to an electrometer readout. Correction factors were determined by comparison with NBS. Additional verification of exposure was made using a free-air ionization chamber. Condenser R chambers were used for day-to day calibration verification.
2.6 Beam Monitoring
A transmission chamber [1] was used to monitor the x-ray beam on time. The relative position of th is device with respect to the x-ray tube head, f i lt e r s , and phantom is shown in Figure 3. The electrometer readout of the transmission chamber was expressed in coulombs. Each f i l t e r technique (as described by NBS [8]) was calibrated in terms of R (as measured by a transfer standard) per transmission chamber coulombs (R/C factor).
3.0 IN-PHANTOM CALIBRATIONS
After consideration of the errors involved in free -a ir calibration techniques, a phantom was constructed and positioned in the x-ray beam.
3.1 Phantom Construction
A phantom of the dimensions suggested by the WG/15 Standard (30 x 30 x 15 cm) was constructed by lamenating 2.5-cm thicknesses of acry lic Lucite. The Lucite composition was sim ilar in hydrogen, carbon, and oxygen content- to soft tissue [9]. The material was selected on the basis of a v a ila b ility , cost, and ease of modification for accommodation of phantom transfer chamber
3.2 Phantom Positioning
Transfer chambers were positioned 100 cm from the tube target for in a ir calibrations. The phantom was constructed so that the center of the active volume of the chamber was 1.0 cm deep in the phantom. The chamber
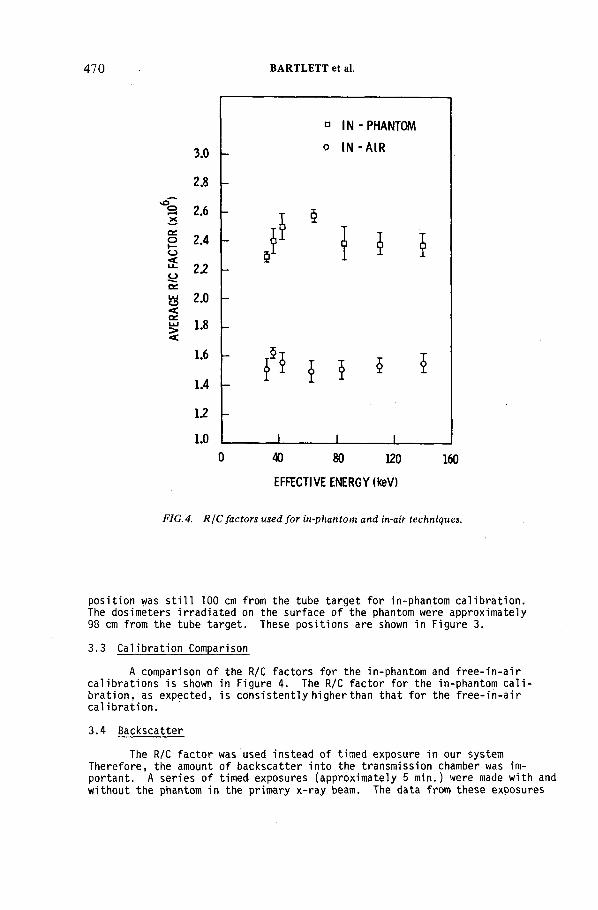
470 BARTLETT et al.
3 .0
2.8
S 2.6X
о 2.4 о
0 22
S М
1 U<
1.6
1.4
U
1.0
0 4 0 8 0 1 2 0 1 60
EFFECTIVE ENERGY (keV)
FIG. 4. R/C factors used for in-phantom and in-air techniques.
-
a IN
о IN
- PHANTOM
-AIR
:
5
1 } Ï
: i‘ l I 5i I
i 1 ......... 1 . ' .
position was s t i l l 100 cm from the tube target for in-phantom calibration.The dosimeters irradiated on the surface of the phantom were approximately 98 cm from the tube target. These positions are shown in Figure 3.
3.3 Calibration Comparison
A comparison of the R/C factors for the in-phantom and free -in -a ir calibrations is shown in Figure 4. The R/C factor for the in-phantom c a l i bration, as expected, is consistently higher than that for the free -in -a ir ca libration.
3.4 Backscatter
The R/C factor was used instead of timed exposure in our system Therefore, the amount of backscatter into the transmission chamber was important. A series of timed exposures (approximately 5 min.) were made with and without the phantom in the primary x-ray beam. The data from these exposures
IAEA-SM-222/19 471
indicate that the phantom can contribute as much as 3% backscatter into the transmission chamber. This suggests the increased importance of developing an R/C factor for each technique, because of variations in beam quality and subsequent variations in these backscatter contributions. In addition, the phantom-to-tube-target distance should remain constant. I f i t is not, c a l i bration at each tube-target-to-phantom distance is necessary.
3.5 Beam Anisotropy
I t has been recommended that dosimeters be irradiated using a device to rotate them within the primary x-ray beam [1]. This mechanism prevents errors due to beam anisotropy. Because of the weight of the phantom, rotation would require manufacturing of a special apparatus. Therefore, dosimeters were irradiated one at a time in the center of the beam.
4.0 DISCUSSION
The requirement of the WG/15 standard to provide an assigned dose equivalent index within a 5 percent certainty has caused our laboratory to reappraise the experimental errors involved in dosimeter irrad iations.Our studies indicated that the error caused by small tolerances in the x-ray tube potential monitoring c ircu it caused s ign ifican t errors in the exposure rate i f f i l t e r techniques were used. These errors were manageable only after extensive modification of the voltage monitoring c ircu it. Errors caused by changes in the beam current were reduced by the traditional method of monitoring the x-ray beam with a transmission chamber. The addition of a phantom in the x-ray beam does not re str ic t the use of a transmission chamber, but the increased scatter into the chamber required that each f i l t e r technique be recalibrated. The use of a phantom is somewhat restrictive in that only one dosimeter is exposed at a time to prevent error introduced by beam anisotropy. A heavy-duty device to rotate the phantom within the x-ray beam would be necessary i f more than one dosimeter were exposed simultaneously.
In calculating the dose equivalency, the WG/15 standard allows two methods. I f the photon source is calibrated in terms of exposure free-in- a ir and irradiated with a phantom backing, then the dose equivalency is determined by multiplying the free -in -a ir exposure by an in -a ir dose equivalent index conversion factor. I f the calibration is in terms of exposure in a phantom, then one of two methods is used, depending on whether spectral information is in terms of average energy or half-value layer.
Three major sources of error in determining the dose equivalent index were considered in th is study. F irst, photon quality, especially at lower energies, was measured very carefully. The potential applied to the x-ray tube was controlled within a few tenths of a k ilovo lt and the accuracy was verified by an independent method (Figure 2). This resulted in beam quality measurements very sim ilar to those published by the NBS (Table I) . Therefore, beam quality measurements were as required by the WG/15 standard. Second, experimental error was considered by applying the same measurement methodology used for x-ray exposures to a '37qs exposures. Exposure was recorded for in a ir and in-phantom techniques, as was done for x-rays. The beam quality for 137Cs was easily characterized [11]. Therefore, dose equivalent index calculations from the WG/15 standard were straightforward. Results of the two dose equivalent index calculations were within 2%. Third, the theoretical calculation of the conversion factors for computing the dose equivalent index from exposure were derived by complex assumptions [4,12,13,14]. The most important of these assumptions is that the composition of the radiation fie ld be adequately known [14]. The use of HVL approximations does not appear to
472 BARTLÉTT et al.
be an appropriate method for fu lly characterizing the quality of the x-ray beams at low energies. Further characterization of beam quality is continuing in our laboratory.
A meticulous approach to measuring many of the variables found in x-ray calibration has been described in th is paper. Yet, i f the dose equivalent in dex is calculated as described in the WG/15 standard, then a difference of approximately 10 to 20% resulted, depending on the method of calibration selected. This variation can be attributed to errors in the determination of photon quality, in experimental methodology, or in the basic assumptions used to determine the dose equivalent index. Although the use of a phantom in photon calibration is straightforward, the choice of methods for determining dose equivalent index as allowed by the WG/15 standard may lead to greater potential differences in assigned dose values among calibration laboratories .
REFERENCES
[1] Handbook on Calibration of Radiation Protection Monitoring Instruments, Technical Reports Series No. 133, IAEA, Vienna (1971).
[2] UNRUH, C.M., LARSON, H.V., BEETLE, T.M., KEENE, A.R., The Establishment and U tilization of Film Dosimeter Performance C rite r ia , Rep. BNWL-52,UC-48, Metals, Ceramics and Materials, Special Distribution (1967).
[3] Proposed Standard C riteria for Testing Personnel Dosimetry Performance,N715, HPSSC WG/15, May (1977).
[4] INTERNATIONAL COMMISSION ON RADIATION UNITS AND MEASUREMENTS, Measurement of Absorbed Dose in a Phantom Irradiated by a Single Beam of X-or Gamma Rays, ICRU Rep. 23, Washington, D.C.(1973)
[5] JOHNS, H .E., CUNNINGHAM, J . R . , The Physics of Radiology, Charles C. Thomas, Publisher, Springfield, IL (1969)
[6] KATHREN, R. L. , RISING, F. L., LARSON, H. V. , Health Phys. 2]_ (1971)285.
[7] STORM, E ., LIER, D. W., ISRAEL, H. I . , Health Phys. 26 (1974) 179.[8] UNITED STATES NATIONAL BUREAU OF STANDARDS, Calibration and Test Services
of the National Bureau of Standards, NBS Special Publication 250, Washington D. C., April (1977).
[9] INTERNATIONAL COMMISSION ON RADIOLOGICAL PROTECTION, Report of the Task Group on Reference Man, Pergamon Press, New York (1975).
[10] JONES, T. D., AUXIER, J . A „ SNYDER, W. S ., WARNER, G. G., Health Phys, 24 (1973) 241.
[11] UNITED STATES DEPARTMENT OF HEALTH, EDUCATION, AND WELFARE, Radiological Health Handbook, Rockville, Maryland (1970).
[12] INTERNATIONAL COMMISSION ON RADIATION UNITS AND MEASUREMENTS, Radiation Dosimetry: X-rays and Gamma Rays with Maximum Photon Energies Between 0.6 and 50 MeV, ICRU Rep. 14, Washington, D.C. (1969).
IAEA-SM-222/19 473
[13] INTERNATIONAL COMMISSION ON RADIATION UNITS 'AND MEASUREMENTS, Determinationof Absorbed Dose in a Patient Irradiated by Beams of X or Gamma Rays inRadiotherapy Procedures, ICRU Rep. 24, Washington, D.C. (1976).
[14] INTERNATIONAL COMMISSION ON RADIATION UNITS AND MEASUREMENTS, ConceptualBasis for the determination of Dose Equivalent, ICRU Rep. 25, Washington,D.C. (1976).
DISCUSSION
H.O. WYCKOFF: I don’t understand your difficulty. Figure 4 o f your paper appears to give data for calculation of the backscatter factor. Are these values different from those in the literature?
D.M. FLEMING: The problem occurred in trying to apply the correction factors listed in the draft o f the HPSSC standard.
J.-P. GUIHO: You mentioned that for calibrations you use filtered or fluorescence X-ray beams obtained in accordance with “ NBS standards” o f filtration, i.e. o f spectrum. Are these standards comparable with those recommended by ISO, which are used in most European countries?
D.M. FLEMING: I am not familiar with the ISO standards.L. FITOUSSI: Could you please tell us more about the X-rays you used?
In your introduction you described the filtered and fluorescence X-rays available to you. However, it would seem that in your measurements you used filtered X-rays having a greater energy dispersion than fluorescence X-rays. Could this not have been the source o f the difficulties you encountered, in particular for low energies?
D.M. FLEMING: The proposed HPSSC standard prohibits the use of fluorescence X-rays, so all measurements were made using NBS filter techniques, as required in the standard. The difficulty could very definitely be the result o f using the broad-band spectra with conversion factors for monoenergetic X-rays.
C.P. WANG: I would like to make a brief remark on the two different calibration configurations shown in Fig.3 and the results in Fig.4 o f your paper.Apart from the problem o f backscattering, the photon spectrum in the phantom will be very different from that immediately outside in air because of degradation. This is discussed in my paper in these Proceedings (IAEA-SM-222/59). Thusone would expect “ in air” and “ in phantom” measurements to differ. However, if one takes this degradation o f the photon spectrum into consideration and corrects for it, then one can calibrate in either configuration, or in any configuration, and obtain results that agree with each other.
D.M. FLEMING: I am very interested in studying your work; the correction factors you mention may be very useful to us. Our immediate problem, however, is to get agreement by using the correction factors contained in the standard,as described in our paper.
474 BARTLETT et al.
Margarete EHRLICH: I should say that “ average energy” had best be used only for narrow-band or line spectra. I mentioned in my paper (IAEA-SM-222/16) that an attempt will be made to provide correction factors, Cx, for the spectra o f all National Bureau of Standards calibration beams.
IAEA-SM-222/10
INSTRUMENT CALIBRATIONS FOR ENVIRONMENTAL SURVEILLANCE
J.E. McLAUGHLINEnvironmental Measurements Laboratory*,United States Department o f Energy,New York,United States o f America
Abstract
INSTRUMENT CALIBRATIONS FOR ENVIRONMENTAL SURVEILLANCE.Environmental radiation measurements are performed in the field to determine radio
nuclide composition, supplement calculated values of dose, and detect any changes from some normal value that can be attributed to a particular source. Instrument calibrations with laboratory sources, while necessary, are generally insufficient for these environmental applications. Account must be taken of the complex radiation field composition, low intensity and source-detector geometry, as well as o f the instrument energy and angle responses. Transport calculations of the radiation field aid in the development of meaningful calibrations. Energy and angle spectra over the ground, the principal environmental source, have been calculated for different source distributions and gamma-ray energies, and verified experimentally. By determining detector responses to background components in this way, one can estimate any excess response to man-made sources. Operationally, consistency of field measurements with different instruments tends to assure good quality results. This paper describes measurement methods developed for studies of natural, nuclear-facility and nuclear-weapon radioactivity. Some of the methods were incorporated into a recent (US) NCRP report, Environmental Radiation Measurements. Possible new monitoring problems are identified.
INTRODUCTION
Years ago, the International Commission on Radiological Protection (ICRP) identified the broad objectives of environmental monitoring.[1 ] While these objectives are implicit in various regulatory requirements in the United States, there remains an unclear understanding of the use and problems of monitoring near nuclear facilities. Much of the data from past monitoring programs has had limited value for quantifying the radiological status of the nearby environment.
Among the reasons for this situation is the small effort that has been expended for developing field instruments and determining appropriate calibration methods; assuring the quality of the field data; and determining how the information might be integrated into the overall environmental program. Some recent developments seem to he aimed at encouraging integrated monitoring programs that include the elements of effluent and
* Formerly the Health and Safety Laboratory.
475
476 McLAUGHLIN
climatological monitoring, computations made for the estimation of man's exposure, sample collection and analysis, and direct field measurements.[2, 3] One discourse on.the relative roles of effluent and environmental monitoring was given in a previous symposium.[A ]
In the areas that pertain to sample and field measurement, there has been some increased effort on developing and maintaining adequate data quality.[5,6] Some views on field calibration, instrument use and quality, and possible new measurement requirements were presented in a recent NCRP report and are extended here on the basis of our experience since 1975. [7]
TYPES OF MEASUREMENTThe Environmental Measurement Laboratory has applied direct field
measurement methods to studies of natural emitters, world-wide fallout and the radiation environment near selected nuclear facilities. This experience has demonstrated the necessity of relying on adequately field-tested instruments, whose responses have been determined for field situations. It has indicated that more intensive, but possibly less extensive, field monitoring should supplement other measurements to form an integrated program and satisfy both the regulatory requirements and the broad objectives of the ICRP.
Direct field measurements of gamma rays are used for determining radionuclide composition, supplementing calculated dose values, and aiding in detecting changes in environmental radioactivity.
Field spectrometry has been successfully employed for determining the contributions to total dose rate by individual nuclides and the concentrations of these nuclides. [8,9 ] As this type of measurement relies on expensive equipment employed by well-qualified technicians or scientists, their use is suited for investigating anomalous areas, providing guidance to sample site selection, and testing ongoing monitoring programs.
For routine monitoring of total gamma radiation, the most popular method is thermoluminescence dosimetry (TLD). Sufficient information exists now for detecting environmental dose with acceptable reliability, providing the measurement is performed with care. [10,11] One cannot measure short-term changes or determine any contribution from the nearby nuclear facility, unless data from other types of monitoring is employed. One can estimate the background component of the TLD response and attribute any excess signal to the facility or one can employ separate, continuous radiation monitoring.[10 ]
One continuous monitor, the high-pressure ionization chamber (HPIC) system, has been thoroughly field-tested and employed for special monitoring experiments.[12 ] Instruments employing scintillation or G.M. counters may also be suitable for monitoring or for rapid surveys, but field evaluations are needed to assure that the monitoring is done reliably. [13,1Д]
The elements of a routine monitoring program are dependent on the character of the site and the facility. They should include the periodic deployment of TLDs plus a few of some type of continuous monitor. TLD, when used alone, is capable of providing estimates of man-made exposure increases greater than about 10 mR/a, although this capability is critically dependent on the attainable precision and the variations in the local natural background. Combinations of integrating monitors and continuous monitors, such as TLDs and HPICs permit the routine determinations of increases of about 5 mR/a or more.
Preliminary investigations on monitoring the beta-emitter, 8sKr, from reprocessing plants with thin-window G.M. counters have shown that reliable continuous field monitoring is feasible, but calibration and data interpretation is difficult. [7 ]
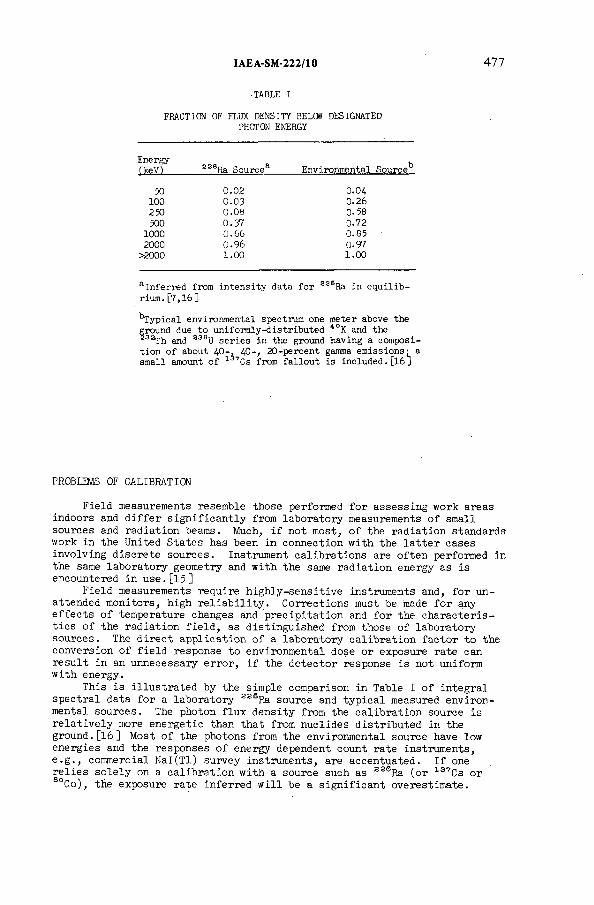
IAEA-SM-2 22/10 477
■TABLE I
FRACTION OF FLUX DENSITY BELCW DESIGNATED PHOTON ENERGY
Energy(keVl 22eRa Source3 Environmental Source*5
50 0.02 0.04100 0.03 0.26250 0.08 0.58500 0.37 0.72
1000 0.66 0.852000 0.96 0.97
>2000 1.00 1.00
aInferred from intensity data for S26Ra in equilibrium. [7,16 ]
^Typical environmental spectrum one meter above the ground due to uniformly-distributed 40K and the
Th and 236U series in the ground having a composition of about 40-, Д0-, 20-percent gamma emissions- a small amount of 1 Cs from fallout is included.[16J
PROBLEMS OF CALIBRATION
Field measurements resemble those performed for assessing work areas indoors and differ significantly from laboratory measurements of small sources and radiation beams. Much, if not most, of the radiation standards work in the United States has been in connection with the latter cases involving discrete sources. Instrument calibrations are often performed in the same laboratory geometry and with the same radiation energy as is encountered in use. [15]
Field measurements require highly-sensitive instruments and, for unattended monitors, high reliability. Corrections must be made for any effects of temperature changes and precipitation and for the characteristics of the radiation field, as distinguished from those of laboratory sources. The direct application of a laboratory calibration factor to the conversion of field response to environmental dose or exposure rate can result in an unnecessary error, if the detector response is not uniform with energy.
This is illustrated by the simple comparison in Table I of integral spectral data for a laboratory 22SRa source and typical measured environmental sources. The photon flux density from the calibration source is relatively more energetic than that from nuclides distributed in the ground.[16 ] Most of the photons from the environmental source have low energies and the responses of energy dependent count rate instruments, e.g., commercial Nal(Tl) survey instruments, are accentuated. If one relies solely on a calibration with a source such as 226Ra (or 137Cs or SoCo), the exposure rate inferred will be a significant overestimate.
478 McLAUGHLIN
While we may deprecate the expression of counting-rate instrument response in exposure or dose rate quantities, the practice is common and the problem should be well understood before attempting quantitative work. The use of survey instruments with D.C. outputs has tended to be more meaningful,[17 ] but some counting rate instruments have been suitably calibrated for field use. [18 ]
The general calibration equation for any instrument can be represented by
R = k F + k F + R . (1)7 у с с a, I ' ■where R represents the observed instrument response; F an appropriate radiation field quantity, e.g., dose rate or exposure rate; к the calibration or sensitivity factor for gamma rays or cosmic rays, respectively, and Rq jj the effects of detector radioactive contamination and leakage or stress currents, respectively, i.e. instrument "background".[7 31 While these effects may be important in some ionization chambers, they can be neglected for small Nal(Tl) detectors. The response to environmental beta rays is negligible, because the detectors are, or should be, adequately shielded.
The calibration equation for small Nal(Tl) detectors reduces to theform
F7 = aR + bFc (2)
where a represents the reciprocal of gamma-ray sensitivity (in uR/h per unit of response) and b the ratio of the gamma- and cosmic-ray sensitivities. Fc corresponds to the cosmic-ray exposure rate, about 3-6 uR/h at sea level for the mid-latitudes. While the factor bF0 should have a small, negative value, poor counting statistics and instrument quality often preclude a quantitative determination.
Several field calibrations of Nal(Tl) survey instruments have shown, with wide variation, that a has a value in the vicinity of 0.5. These instruments, when calibrated with commonly-used laboratory sources, overestimate exposure rate by 30-50 percent. The practical implications are important when one is assessing the status of an environmental field in terms of action levels in a guide, such as that recommended for Colorado in 1972. [19]
A related problem is the deposition of manmade radioactivity on the distributed natural plus pre-existing manmade emitters to form a quasiplane source. A chronic low level deposition would add an exponential distribution to the existing distributed source. This is the type of problem that makes environmental measurements very interesting. An investigation of the responses of selected instruments was made in Poland, a few years ago. [20] The assumed sources were 131I and 22SRa distributed as an infinite plane source, a distributed source that produced isotropic irradiation of the instrument, and a combination of the two.
1 It is sometimes desirable to express the quantitative properties of cosmic rays and
terrestrial g a m m a rays in c o m m o n units. Since F c is rarely measured, but is obtained from
the literature as ionization rate or absorbed dose rate in free air, kc is conveniently expressed
in such units. The conversion of exposure rate to quantities appropriate for the cosmic ray
field can be made by /iR h'1 -* 0.869 juradlT1 -* 0.577 ion pairs-cm_2-s-1 at standard
temperature and pressure, all in free air.
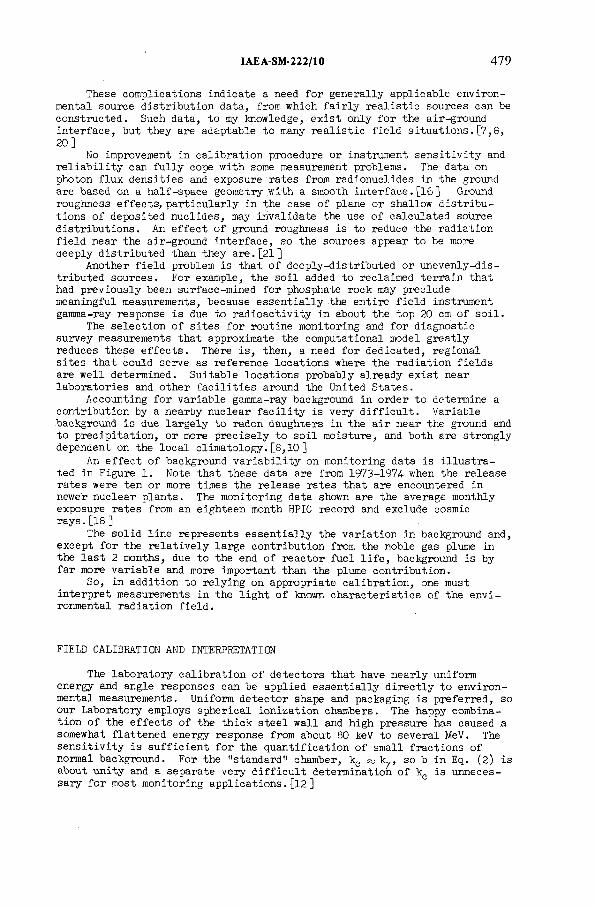
IAE A-SM-222/10 479
These complications indicate a need for generally applicable environmental source distribution data, from which fairly realistic sources can be constructed. Such data, to my knowledge, exist only for the air-ground interface, but they are adaptable to many realistic field situations. [7,8, 20]
No improvement in calibration procedure or instrument sensitivity and reliability can fully cope with some measurement problems. The data on photon flux densities and exposure rates from radionuclides in the ground are based on a half-space geometry with a smooth interface.[16 ] Ground roughness effects, particularly in the case of plane or shallow distributions of deposited nuclides, may invalidate the use of calculated source distributions. An effect of ground roughness is to reduce the radiation field near the air-ground interface, so the sources appear to be more deeply distributed than they are. [21]
Another field problem is that of deeply-distributed or unevenly-distributed sources. For example, the soil added to reclaimed terrain that had previously been surface-mined for phosphate rock may preclude meaningful measurements, because essentially the entire field instrument gamma-ray response is due to radioactivity in about the top 20 cm of soil.
The selection of sites for routine monitoring and for diagnostic survey measurements that approximate the computational model greatly reduces these effects. There is, then, a need for dedicated, regional sites that could serve as reference locations where the radiation fields are well determined. Suitable locations probably already exist near laboratories and other facilities around the United States.
Accounting for variable gamma-ray background in order to determine a contribution by a nearby nuclear facility is very difficult. Variable background is due largely to radon daughters in the air near the ground and to precipitation, or more precisely to soil moisture, and both are strongly dependent on the local climatology.[8,10 ]
An effect of background variability on monitoring data is illustrated in Figure 1. Note that these data are from 1973-197/+ when the release rates were ten or more times the release rates that are encountered in newer nuclear plants. The monitoring data shown are the average monthly exposure rates from an eighteen month HPIC record and exclude cosmic rays.[18 ]
The solid line represents essentially the variation in background and, except for the relatively large contribution from the noble gas plume in the last 2 months, due to the end of reactor fuel life, background is by far more variable and more important than the plume contribution.
So, in addition to relying on appropriate calibration, one must interpret measurements in the light of known characteristics of the environmental radiation field.
FIELD CALIBRATION AND INTERPRETATION
The laboratory calibration of detectors that have nearly uniform energy and angle responses can be applied essentially directly to environmental measurements. Uniform detector shape and packaging is preferred, so our Laboratory employs spherical ionization chambers. The happy combination of the effects of the thick steel wall and high pressure has caused a somewhat flattened energy response from about 80 keV to several MeV. The sensitivity is sufficient for the quantification of small fractions of normal background. For the "standard" chamber, kc « ку , so b in Eq. (2) is about unity and a separate very difficult determination of kc is unnecessary for most monitoring applications.[12 ]
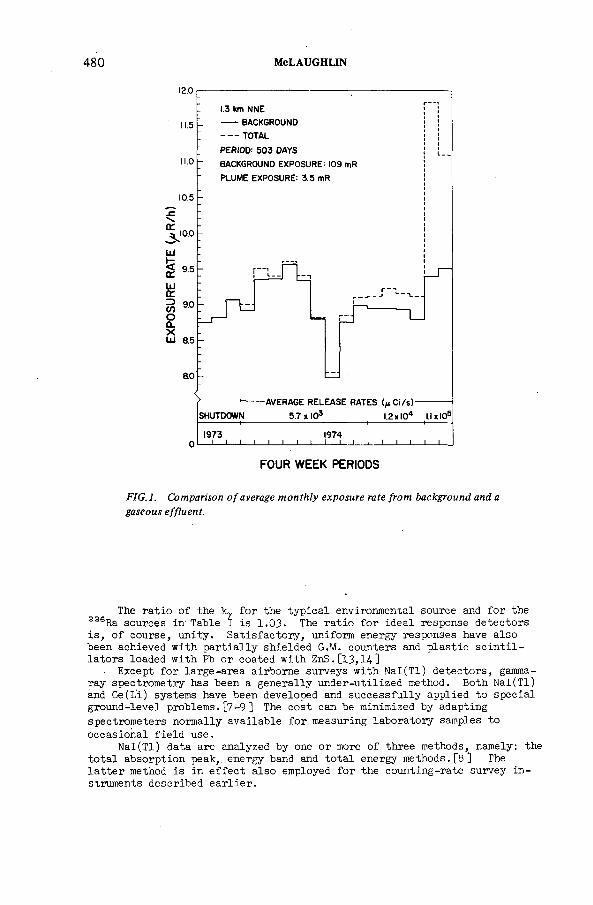
480 McLAUGHLIN
12.0
11.5 -
11.0 -
10.5 -
1.3 km NNE------BACKGROUND------TOTALPERIOD' 503 DAYS BACKGROUND EXPOSURE: 109 mR PLUME EXPOSURE: 3.5 mR
'--------AVERAGE RELEASE RATES 1/j.Ci/s)--------SHUTDOWN 5.7 * I03 1.2 xIO4 I.IxlO5
19730 ---1---L. 1974
J ___I___I___I__ I___I___I__ I___I___I___I__ I___I___L-
FOUR WEEK PERIODS
FIG.l. Comparison of average monthly exposure rate from background and a gaseous effluent.
The ratio of the for the typical environmental source and for the 22eRa sources in'Table I is 1.03. The ratio for ideal response detectors is, of course, unity. Satisfactory, uniform energy responses have also been achieved with partially shielded G.M. counters and plastic scintillators loaded with Pb or coated with ZnS.[l3,l^]
Except for large-area airborne surveys with Nal(Tl) detectors, gamrna- ray spectrometry has been a generally under-utilized method. Both Nal(Tl) and Ge(L'i) systems have been developed and successfully applied to special ground-level problems. [7-9 ] The cost can be minimized by adapting spectrometers normally available for measuring laboratory samples to occasional field use.
Nal(Tl) data are analyzed by one or more of three methods, namely: the total absorption peak,, energy band and total energy methods. [8] The latter method is in effect also employed for the counting-rate survey instruments described earlier.
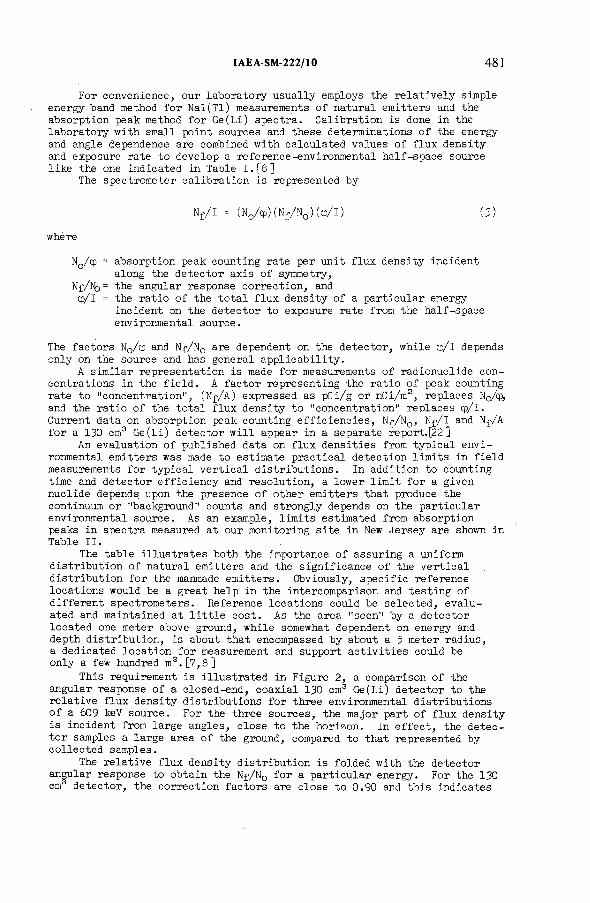
IAEA-SM-222/10 481
For convenience, our Laboratory usually employs the relatively simple energy band method for Nal(Tl) measurements of natural emitters and the absorption peak method for Ge(Li) spectra. Calibration is done in the laboratory with small point sources and these determinations of the energy and angle dependence are combined with calculated values of flux density and exposure rate to develop a reference-environmental half-space source like the one indicated in Table I. [8]
The spectrometer calibration is represented by
Nf/I = (N0/cp)(Nf/N0)(cp/l) (3)
where
N0/cp = absorption peak counting rate per unit flux density incident along the detector axis of symmetry,
NfAb= “the angular response correction, and cp/l = the ratio of the total flux density of a particular energy
incident on the detector to exposure rate from the half-space environmental source.
The factors N0/cp and Nj/N0 are dependent on the detector, while cp/l depends only on the source and has general applicability.
A similar representation is made for measurements of radionuclide concentrations in the field. A factor representing the ratio of peak counting rate to "concentration", (Nf/A) expressed as pCi/g or nCi/т2, replaces N0/cp, and the ratio of the total flux density to "concentration" replaces cp/l. Current data on absorption peak counting efficiencies, Nf/N0, Nf/I and Nf/A for a 130 cm3 Ge(Li) detector will appear in a separate report.[22]
An evaluation of published data on flux densities from typical environmental emitters was made to estimate practical detection limits in field measurements for typical vertical distributions. In addition to counting time and detector efficiency and resolution, a lower limit for a given nuclide depends upon the presence of other emitters that produce the continuum or "background" counts and strongly depends on the particular environmental source. As an example, limits estimated from absorption peaks in spectra measured at our monitoring site in New Jersey are shown in Table II.
The table illustrates both the importance of assuring a uniform distribution of natural emitters and the significance of the vertical distribution for the manmade emitters. Obviously, specific reference locations would be a great help in the intercomparison and testing of different spectrometers. Reference locations could be selected, evaluated and maintained at little cost. As the area "seen" by a detector located one meter above ground, while somewhat dependent on energy and depth distribution, is about that encompassed by about a 5 meter radius, a dedicated location for measurement and support activities could be only a few hundred m3.[7,8]
This requirement is illustrated in Figure 2, a comparison of the angular response of a closed-end, coaxial 130 cm3 Ge(Li) detector to the relative flux density distributions for three environmental distributions of a 609 keV source. For the three sources, the major part of flux density is incident from large angles, close to the horizon. In effect, the detector samples a large area of the ground, compared to that represented by collected samples.
The relative flux density distribution is folded with the detector angular response to obtain the Nf/N0 for a particular energy. For the 130 cm detector, the correction factors are close to 0.90 and this indicates
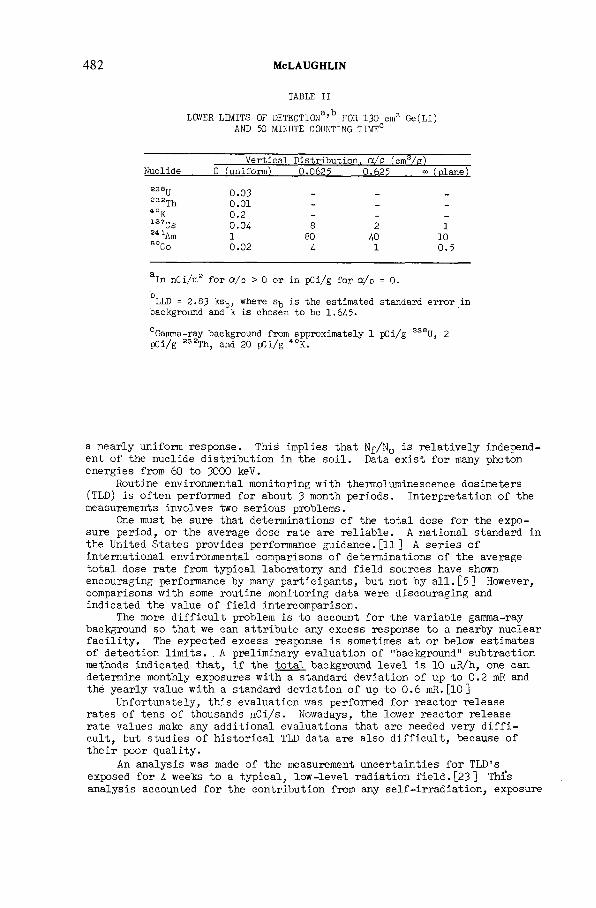
482 MCLAUGHLIN
TABEE II
LCWER LIMITS OF DETECTION3’^ FOR 130 cm3 Ge(Li) AND 50 MINUTE COUNTING TIME0
NuclideVertical Distribution.. a/p (стг/е)
0 (uniform) 0.0625 0.625 (Diane1238y
0.0323 2jji 0.01 _ _ _4°K 0.2 _ _ _137Cs 0.0Д 8 2 1241Am 1 80 ДО 10eoCo 0.02 U 1 0.5
aIn nCi/m2 for a/p > 0 or in pCi/g for а/о - 0.ЪLLD = 2.83 ks^, where is the estimated standard error in
background and к is chosen to be 1.6Л5.
°Gamma-ray background from approximately 1 pCi/g 238U, 2 pCi/g a3ZTh, and 20 pCi/g 4°K.
a nearly uniform response. This implies that Nf/N0 is relatively independent of the nuclide distribution in the soil. Data exist for many photon energies from 60 to 3000 keV.
Routine environmental monitoring with thermoluminescence dosimeters (TLD) is often performed for about 3 month periods. Interpretation of the measurements involves two serious problems.
One must be sure that determinations of the total dose for the exposure period, or the average dose rate are reliable. A national standard in the United States provides performance guidance.[11 ] A series of international environmental comparisons of determinations of the average total dose rate from typical laboratory and field sources have shown encouraging performance by many participants, but not by all.[5] However, comparisons with some routine monitoring data were discouraging and indicated the value of field intercomparison.
The more difficult problem is to account for the variable gamma-ray background so that we can attribute any excess response to a nearby nuclear facility. The expected excess response is sometimes at or below estimates of detection limits. . A preliminary evaluation of "background" subtraction methods indicated that, if the total background level is 10 uR/h, one can determine monthly exposures with a standard deviation of up to 0.2 mR and thé yearly value with a standard deviation of up to 0.6 mR.[10 ]
Unfortunately, this evaluation was performed for reactor release rates of tens of thousands uCi/s. Nowadays, the lower reactor release rate values make any additional evaluations that are needed very difficult, but studies of historical TLD data are also difficult, because of their poor quality.
An analysis was made of the measurement uncertainties for TLD's exposed for Л weeks to a typical, low-level radiation field. [23] This analysis accounted for the contribution from any self-irradiation, exposure
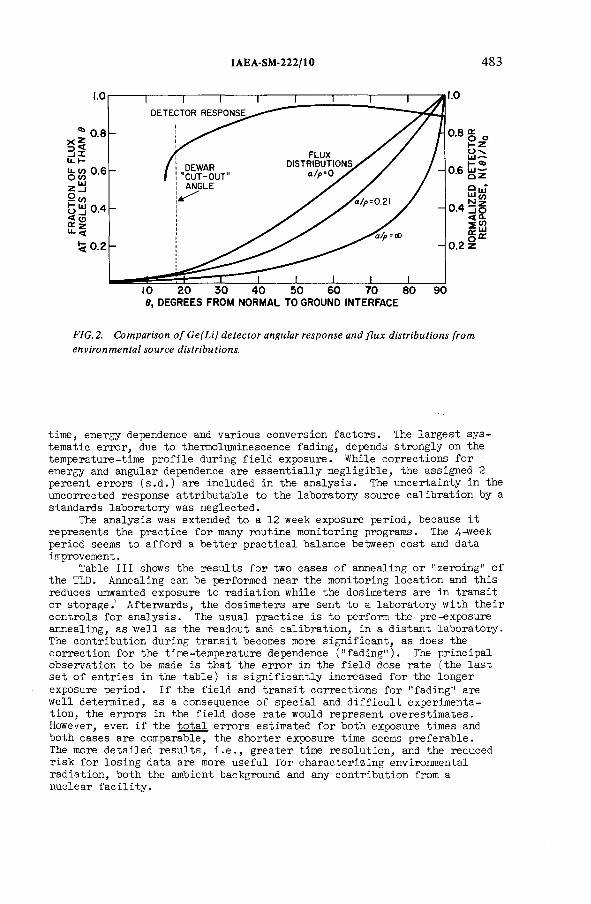
IAEA-SM-222/10 483
1.0 1.0
10 20 30 4 0 50 60 70 80 90в, DEGREES FROM NORMAL TO GROUND INTERFACE
F I G . 2. C o m p a r iso n o f G e ( L i) d e te c t o r an gu la r r e s p o n s e a n d f l u x d is tr ib u tio n s fr o m
e n v ir o n m e n ta l s o u r c e d istr ib u tio n s .
time, energy dependence and various conversion factors. The largest systematic error, due to thermoluminescence fading, depends strongly on the temperature-time profile during field exposure. While corrections for . energy and angular dependence are essentially negligible, the assigned 2 percent errors (s.d.) are included in the analysis. The uncertainty in the uncorrected response attributable to the laboratory source calibration by a standards laboratory was neglected.
The analysis was extended to a 12 week exposure period, because it represents the practice for many routine monitoring programs. The Д-week period seems to afford a better practical balance between cost and data improvement.
Table III shows the results for two cases of annealing or "zeroing" of the TLD. Annealing can be performed near the monitoring location and this reduces unwanted exposure to radiation while the dosimeters are in transit or storage.' Afteiwards, the dosimeters are sent to a laboratory with their controls for analysis. The usual practice is to perform the pre-exposure annealing, as well as the readout and calibration, in a distant laboratory. The contribution during transit becomes more significant, as does the correction for the time-temperature dependence ("fading"). The principal observation to be made is that the e r r o r in the field dose rate (the last set of entries in the table) is significantly increased for the longer exposure period. If the field and transit corrections for "fading" are well determined, as a consequence of special and difficult experimentation, the errors in the field dose rate would represent overestimates. However, even if the total errors estimated for both exposure times and both cases are comparable, the shorter exposure time seems preferable.The more detailed results, i.e., greater time resolution, and the reduced risk for losing data are more useful for characterizing environmental radiation, both the ambient background and any contribution from a nuclear facility.
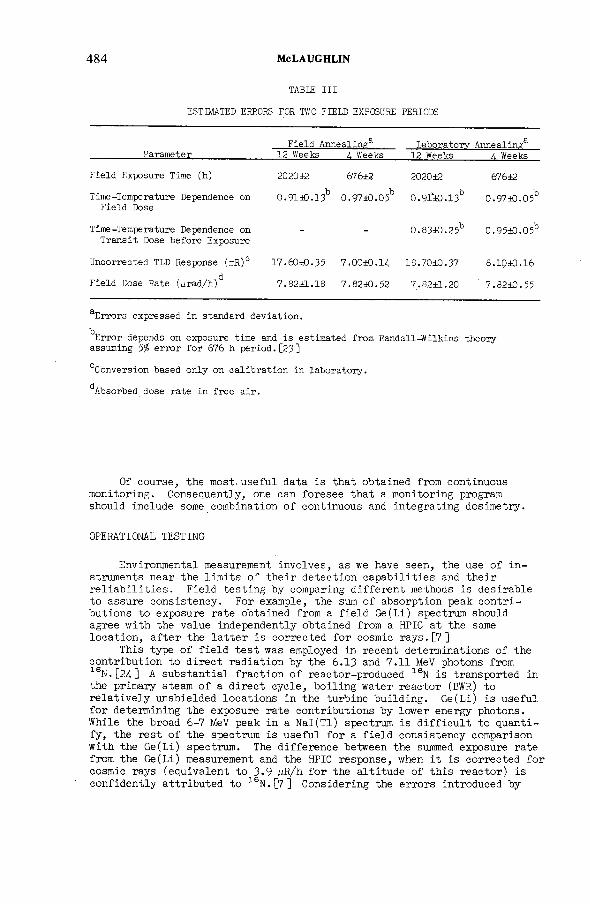
484 McLAUGHLIN
TABLE I I I
ESTIMATED ERRORS FOR TWO FIELD EXPOSURE PERIODS
Field Armealinea Laboratory Annealing3 ■Parameter 12 Weeks Л Weeks 12 Weeks L Weeks
Field Exposure Time (h) 2020¿2 676±2 2020±2 676±2
Time-Temperature Dependence on Field Dose
0.91 JO.13^ 0.97±0.05Ъ 0.911Л0.13Ъ 0.97 JO.05^
Time-Temperature Dependence on Transit Dose before Exposure
- - 0.83J0.25b 0.95Jfl.05b
Uncorrected TLD Response (mR)G 17.60 iO.35 7.00±0.1Д 18.70J0.37 8.10J0.16
Field Dose Rate (yrad/h)d 7.82Й.18 7.82JO. 52 7.82 Л . 20 7.82J0.55
aErrors expressed in standard deviation.
^Error depends on exposure time and is estimated from Randall-Wilkins theory assuming % error for 676 h period. [23]
°Conversion based only on calibration in laboratory.
^Absorbed dose rate in free air.
Of course, the most, useful data is that obtained from continuous monitoring. Consequently, one can foresee that a monitoring program should include some combination of continuous and integrating dosimetry.
OPERATIONAL TESTING
Environmental measurement involves, as we have seen, the use of instruments near the limits of their detection capabilities and their reliabilities. Field testing by comparing different methods is desirable to assure consistency. For example, the sura of absorption peak contributions to exposure rate obtained from a field Ge(Li) spectrum should agree with the value independently obtained from a HPIC at the same location, after the latter is corrected for cosmic rays. [7]
This type of field test was employed in recent determinations of the contribution to direct radiation by the 6.13 and 7.11 MeV photons from ieN.[24] A substantial fraction of reactor-produced leN is transported in the primary steam of a direct cycle, boiling water reactor (BWR) to relatively unshielded locations in the turbine building. Ge(Li) is useful for determining the exposure rate contributions by lower energy photons. While the broad 6-7 MeV peak in a Nal(Tl) spectrum is difficult to quantify, the rest of the spectrum is useful for a field consistency comparison with the Ge(Li) spectrum. The difference between the summed exposure rate from the Ge(Li) measurement and the HPIC response, when it is corrected for cosmic rays (equivalent to 3.9 uR/h for the altitude of this reactor) is confidently attributed to 16N.[7] Considering the errors introduced by
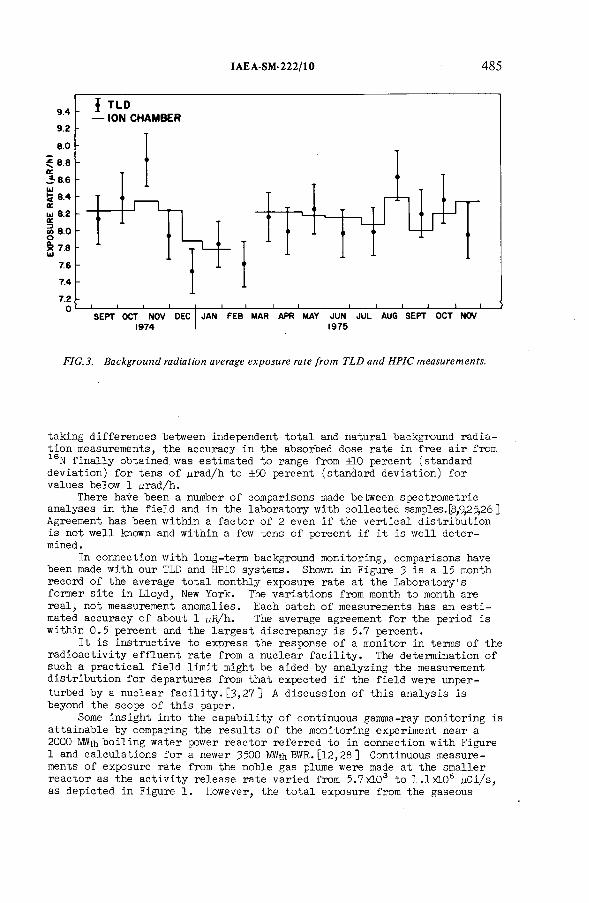
IAEA-SM-222/10 485
F I G .3 . B a c k g r o u n d r a d ia tio n average e x p o s u r e rate fr o m T L D a n d H P I C m ea su rem en ts .
taking differences between independent total and natural background radiation measurements, the accuracy in the absorbed dose rate in free air from 16N finally obtained, was estimated to range from ±10 percent (standard deviation) for tens of urad/h to ±50 percent (standard deviation) for values below 1 urad/h.
There have been a number of comparisons made between spectrometric analyses in the field and in the laboratory with collected samples.[8,9,25,26 ] Agreement has been within a factor of 2 even if the vertical distribution is not well known and within a few tens of percent if it is well determined .
In connection with long-term background monitoring, comparisons have been made with our TLD and HPIC systems. Shown in Figure 3 is a 15 month record of the average total monthly exposure rate at the Laboratory's former site in Lloyd, New York. The variations from month to month are real, not measurement anomalies. Each batch of measurements has an estimated accuracy of about 1 цй/h. The average agreement for the period is within 0.5 percent and the largest discrepancy is 5.7 percent.
It is instructive to express the response of a monitor in terms of the radioactivity effluent rate from a nuclear facility. The determination of such a practical field limit might be aided by analyzing the measurement distribution for departures from that expected if the field were unperturbed by a nuclear facility. [3,27 ] A discussion of this analysis is beyond the scope of this paper.
Some insight into the capability of continuous gamma-ray monitoring is attainable by comparing the results of the monitoring experiment near a 2000 MWth boiling water power reactor referred to in connection with Figure1 and calculations for a newer 3500 MWth BWR. [12,28 ] Continuous measurements of exposure rate from the noble gas plume were made at the smaller reactor as the activity release rate varied from 5.7>d03 to 1.1x10s uCi/s, as depicted in Figure 1. However, the total exposure from the gaseous
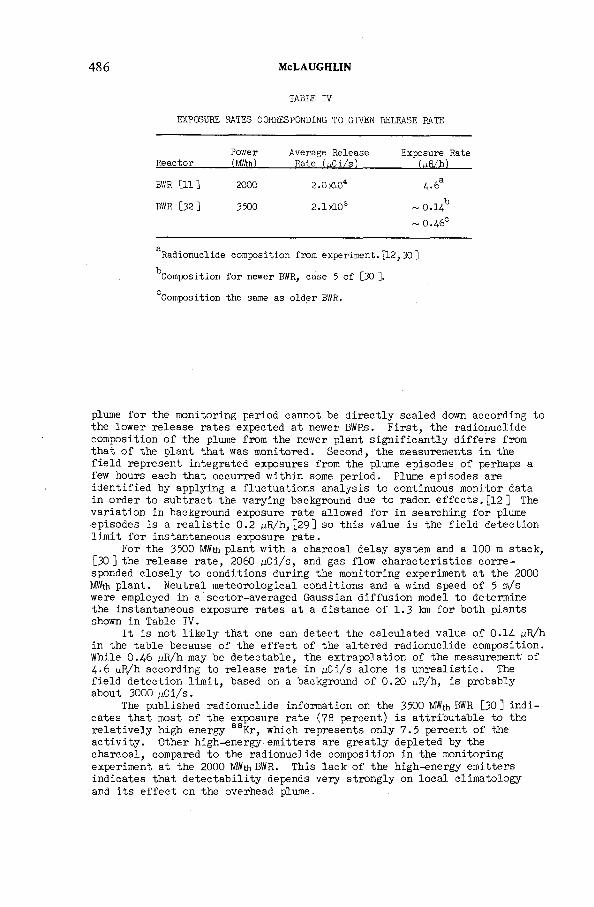
TABLE IV
486 McLAUGHLIN
EXPOSURE RATES CORRESPONDING TO GIVEN RELEASE RATE
ReactorPower(MWth)
Average Release Rate (uCi/s)
Exposure Rate(u.R/h)
BWR [11] 2000 2 . 0Æ 04 д.бa
BWR [32] 3500 2 . 1 Л 0 3 ~ 0 . 1 Д Ъ
~ О.Д60
aRadionuclide composition from experiment.[12,30J
^Composition for newer BWR, case 5 of [30 ].
Composition the same as older BWR.
plume for the monitoring period cannot he directly scaled down according to the lower release rates expected at newer BWRs. First, the radionuclide composition of the plume from the newer plant significantly differs from that of the plant that was monitored. Second, the measurements in the field represent integrated exposures from the plume episodes of perhaps a few hours each that occurred within some period. Plume episodes are identified by applying a fluctuations analysis to continuous monitor data in order to subtract the varying background due to radon effects. [12] The variation in background exposure rate allowed for in searching for plume episodes is a realistic 0.2 uR/h, [29] so this value is the field detection limit for instantaneous exposure rate.
For the 3500 MWth plant with a charcoal delay system and a 100 m stack, [30 ] the release rate, 2060 uCi/s, and gas flow characteristics corresponded closely to conditions during the monitoring experiment at the 2000 MWth plant. Neutral meteorological conditions and a wind speed of 5 m/s were employed in a sector-averaged Gaussian diffusion model to determine the instantaneous exposure rates at a distance of 1 .3 km for both plants shown in Table IV.
It is not likely that one can detect the calculated value of 0.1Д uR/h in the table because of the effect of the altered radionuclide composition. While 0.Д6 aR/h may be detectable, the extrapolation of the measurement' of Д.6 uR/h according to release rate in uCi/s alone is unrealistic. The field detection limit, based on a background of 0.20 u R / b , is probably about 3000 ¡ i d / s .
The published radionuclide information on the 3500 MWth BWR [30] indicates that most of the exposure rate (78 percent) is attributable to the relatively high energy 88Kr, which represents only 7.5 percent of the activity. Other high-energy emitters are greatly depleted by the charcoal, compared to the radionuclide composition in the monitoring experiment at the 2000 MWth BWR. This lack of the high-energy emitters indicates that detectability depends very strongly on local climatology and its effect on the overhead plume.
IAEA-SM-222/10 487
There appears to be a need to improve the quality of environmental radiation measurements that are made in conjunction with facilities monitoring programs or special investigations. Direct field instruments can often supplement the sample collection, preparation and analyses already performed. Methods for continuous or periodic monitoring and gamma-ray spectrometry are fairly well established. Further efforts are needed on instrument development and determining instrument capabilities, i.e., sensitivity and reliability, and calibration. Current efforts on the comparison of measurement methods in the field should be continued and provision for reference field locations suitable for testing monitors and diagnostic instruments encouraged.
CONCLUSIONS
ACKNOWLEDGMENTSThe results of continuing studies by the Radiation Physics Division
investigators are gratefully acknowledged, especially the unpublished results provided by Gail de Planque, Carl Gogolak and Kevin Miller. Thomas Gesell of the University of Texas, School of Public Health also helped in providing unpublished data on the error analysis of thermoluminescence dosimeters.
REFERENCES
[1 ] Principles of Environmental Monitoring Related to the Handling of Radioactive Materials, ICRP Publication 7 (1965).
[2] Environmental Radioactivity Surveillance Guide, USEPA Rep. ORP/SID 72-2 (1972).
[3] CORLEY, J. P., DENHAM, D. H., MICHEIS, D. E., OISEN, A. R., WAITE,D. A., A Guide for Environmental Radiological Surveillance at ERDA Installations, USERDA Rep. ERDA 77-24 (1977).
[4] MITCHELL, N. T., "The roles of effluent and environmental monitoring in surveillance of radioactive wastes released from nuclear installations", Environmental Surveillance Around Nuclear Installations, IAEA, Vienna (197Д)399.
[5] BURKE, G. de P., GESELL, T. F., BECKER, K., "Second internationalcomparison of environmental dosimeters under field and laboratoryconditions", (Proc. Tenth Midyear Topical Symp. Health Phys. Soc., 1976) Rensselaer Polytechnic Institute, Troy, New York (1976)555.
[6 ] Quarterly Report of the Energy Research and Development Administration, Division of Safety Standards and Compliance - Quality Assurance Program, USERDA Rep. HASL-319 (1977).
[7] Environmental Radiation Measurements, NCRP Rep. No. 50 (1976).[8 ] BECK, H. L., DeCAMPO, J. A., GOGOLAK, С. V., In Situ Ge(Li) and Nal
(TI) Gamma-Ray Spectrometry, USAEC Rep. HASL-258 (1972).[9] ANSPAUGH, L. R., PHELPS, P. L., GUDIKSEN, P. H., LINDEKEN, C. L.,
HUCKABAY, G. W., "The in situ measurement of radionuclides in theenvironment with a Ge(Li) spectrometer", The Natural Radiation Environment, USERDA Rep. C0NF-720805 (1972)279.
[10] BURKE, G. de P., Variations in Natural Environmental Gamma Radiation and Its Effects on the Interpretability of TLD Measurements, USERDA Rep. HASL-289 (1975).
488 McLAUGHLIN
[11] Performance, Testing and Procedural Specifications for Thermolunines- cence Dosimetry (Environmental Applications), ANSI N545-1975,American National Standards Institute, New York, New York (1975).
[12] MILLER, К. М., GOGOLAK, С. V., RAFT, P. D., Final Report on Continuous Monitoring with High Pressuré Argon Ionization Chambers Near the Millstone Point Boiling Water Power Reactor, USERDA Rep. HASL-290(1975).
[13] JONES, A. R., Measurement of Low-Level Environmental 7 Doses with TLDs and Geiger Counters, IEEE Trans. Nucl. Sci. NS-21 (197A)456.
[14] CHESTER, J. P., CHASE, R. L., WOOD, S., A Digital Environmental Monitor, USAEC Rep. BNL-16922 (1972).
[15] LEISS, J. E., "National ionizing radiation standards", Measurements for the Safe Use of Radiation, National Bureau of Standards Special Publication SP-456 (1976)403.
[16] BECK, H. L., "The physics of environmental gamma radiation fields", Natural Radiation Environment II, USERDA Rep. C0NF-720805 (1972)101.
[17] KOLB, W., IAUTEKBACH, U., "The improved scintillation dosimeter",PTB 7201 (in German), Radiation Protection and Environmental Protection, Annual Meeting of the Fachverband fuer Strahlenschutz, Helgoland, F. R. Germany (1974)2.
[18] WOLLENBURG, H. A., SMITH, A. R., "Studies in terrestrial 7 radiation", Natural Radiation Environment, University of Chicago Press (1964)513-
[19] Grand Junction Remedial Action Criteria, Title 10 Code of Federal Regulations Part 12, U. S. Atomic Energy Commission (1972).
[20] JAGIELAK, J., GWIAZDCWSKI, B., PENSKO, J., ZAK, A., "Some problems in calibration of instruments for environmental gamma exposure dose measurements", Environmental Surveillance Around Nuclear Installations, IAEA, Vienna (1974)337.
[21] KOGAN, R. М., NAZAROV, I. М., FRIDMAN, Su. D., Gamma Spectrometiy of Natural Environments and Formations, Atomizdat, Moscow [English Translation, Israel Program for Scientific Translations, Jerusalem] (1971).
[22] GOGOLAK, С. V., MILLER, К. М., New Developments in Field Gamma-Ray Spectrometry, DOE Rep. EML-332 (1977).
[2 3] BURKE, G. de P., GESELL, T. F., "Error analysis of environmental radiation measurements with integrating detectors", Measurements for the Safe Use of Radiation, National Bureau of Standards Special Publication Sp-456 (1976)187.
[2Д] LCWDER, W. M. RAFT, P. D., BURKE, G. de P., Determination of 16N Gamma Radiation Fields at BWR Nuclear Power Stations, USERDA Rep. HASL-305 (1976).
[25] RAGSDALE, H. L., COLEMAN, R. N., TANNER, В. K., PAIM3, J. М., "In situ analysis of gamma-emitting radionuclides in southeastern Ecosystems", (Proc. Tenth Midyear Topical Symp. Health Phys. Soc., 1976) Rensselaer Polytechnic Institute, Troy, New York (1976).
[26] HASL Measurements of Fallout Following the September 26, 1976 Chinese Nuclear Test, USERDA Rep. HASL-314 (1976).
[27] WAITE, D. E., BRAMSON, P. E., "Interpretation of near-background environmental surveillance data by distribution analysis", Biological and Environmental Effects of Low-Level Radiation, IAEA .Q (1976)291.
[28] G0G0IAK, С. V., Data Set for Noble Gas Plume Exposure Model Validation, USERDA Rep. HASL-296 (1975).
[29] BECK, H. L., Gamma Radiation from Radon Daughters in the Atmosphere, J. Geophys. Res. 79(1974)215.
[3 0] Numerical Guides for Design Objectives and Limiting Conditions for Operation to the Criterion "ALAP" for Radioactive Material in Light- Water Cooled Nuclear Power Reactor Effluents, USAEC Rep. WASH-1258 1 (1973).
IAEA-SM-222/10 489
DISCUSSION
J.-P. GUIHO: Your paper shows up a new type o f problem connected with the measurement o f very low doses. In various countries work is being done on determining the dose level o f certain sites, and even of construction materials for residential buildings. I feel, however, that we may not always have the appropriate instruments, especially for routine measurements o f this kind.
Y. NISHIWAKI: Nearly ten years ago, when I joined the IAEA, an Intercomparison Programme on Dosimetry o f Gamma Rays for Radiation Protection Purposes using glass dose meters was initiated by Mr. Dorofeev and Mr. Somasundaram of the Division o f Health, Safety and Waste Management. It was intended to assess the accuracy and reliability o f the radiation protection measurements in laboratories o f Member States by mailing radiophotoluminescent glass dose meters to them. As Japanese glass dose meters were used, I also became involved in this programme later, as a staff member o f the Agency.
In order to check the instruments and the methods used, some glasses were irradiated at the Bureau International des Poids et Mesures (BIPM), at Sèvres,France; this provided exposure values with an accuracy better than ± 1%. It was found that the overall accuracy o f the methods is better than ± 4%. This was considered quite adequate for the purpose.
However, it seems obvious that an instrument can, at best, be only as accurate as the measurement o f the radiation field in which it is calibrated, and that the accuracy associated with a measurement made with the instrument in a different field may depend upon a number of factors other than the inherent inaccuracies o f the instrument: different environmental conditions, spectra, exposure rates, secondary electron contributions, and so on. It is often rather difficult to estimate accurately the magnitude o f these errors, which may depend on local conditions. At some Agency meetings on radiation protection, the question has been raised whether or not to use cost/benefit analysis in deciding how far the accuracy o f field measurements o f environmental low-level radiation should be improved. A recent ICRP publication also emphasizes the importance of optimizing the relation o f the probability o f health detriment to the cost of radiation protection while applying the basic principle o f keeping radiation detection levels “ as low as practicable” or “ as low as reasonably achievable” .
Mr. McLaughlin, what do you think the accuracy should be for the measurement o f environmental low-level radiation? In other words, what errors, or what percentage errors, should be considered acceptable for the environmental radiation you described in your paper? What should be the minimum detection level for this purpose?
J.E. McLAUGHLIN: I agree that consideration should be given to the cost effectiveness of determining the best estimate of the overall accuracy of radiation protection instruments, or, more exactly, o f environmental instruments; I do
490 McLAUGHLIN
not, however, think that cost effectiveness should be considered only in the light o f radiation protection purposes. For certain studies, for example, those supporting a routine monitoring programme or pertaining to retrospective studies o f faulty monitoring programmes, we have to use instruments near or at their limit o f capability. Therefore I believe the instrument capability, i.e. the detection limit for the field conditions o f interest, should be determined on a best efforts basis. Then, if the instrument is employed for routine monitoring, one can draw back from this capability as far as one wishes (as is done for laboratory spectrometry).
Other factors in cost effectiveness, such as public concern, may be difficult to quantify.
Off-hand, I should say that routine monitoring should be accurate for assumed field conditions to about 4 to 5%.
IAEA-SM-222/45
PERSONNEL DOSIMETRY INTERCOMPARISON STUDIES AT THE ORNL HEALTH PHYSICS RESEARCH REACTOR*
H.W. DICKSON, L.W. GILLEY Health and Safety Research Division,Oak Ridge National Laboratory,Oak Ridge, Tennessee,United States o f America
Abstract
PERSONNEL DOSIMETRY INTERCOMPARISON STUDIES AT THE ORNL HEALTH PHYSICS RESEARCH REACTOR.
Personnel Dosimetry Intercomparison Studies were held at the Oak Ridge National Laboratory’s DOSAR Facility during May, 1974, February, 1976, and March, 1977. The Health Physics Research Reactor (HPRR), used unshielded, with a 12 cm thick Lucite shield or a 13 cm thick steel shield, provided three neutron and gamma-ray spectra. The characteristics o f these fields, such as neutron energy spectrum, intensity, and uniformity, had been measured previously during nuclear accident dosimetry studies. A number o f private companies as well as national and international laboratories have been represented in these new intercomparison studies. Exposures were made to simulate total exposures likely to be encountered in personnel dosimetry. Neutron dose equivalents o f the order of 500 mrem were produced by controlling the reactor power level and exposure time. Dose meters were mounted on the trunk section o f water-filled phantoms, the front edges o f which were located three metres from the reactor centre. When shields were used they were placed at two metres. Sulphur pellets exposed at a standard locations on the reactor during the intercomparison were used to calculate values of tissue kerma for neutrons at the three-metre position, based on previous measurements. Hurst proportional counter measurements made at the time o f the exposures are in good agreement with these results. The gamma component o f dose, typically of the order of a few tens o f millirad, was measured with IiF thermoluminescent dose meters (TLDs). Using the fission yield and the calculated leakage of the HPRR, the neutron fluence was calculated for each reactor run. Then the dose was calculated based on the HPRR neutron spectra and the dose conversion factors which had been calculated previously for the three spectra. The results o f these personnel dosimetry intercomparison studies reveal that estimates o f dose equivalent vary over a wide range. The standard deviation of the mean of participants data was typically in the range o f ± 30 to ± 40%. There appears to be a steady improvement in the neutron measurements from the first to the last study; however, gamma measurements have not shown the same improvement. It is anticipated that this type o f dosimetry intercomparison study will be worthwhile on an annual basis until the problems in dose meter response and interpretation have been identified and solved.
* Research sponsored by the United States Department o f Energy under Contract with Union Carbide Corporation.
491
492 DICKSON and GILLEY
1. INTRODUCTION
For the p ast tw e lv e y e a rs the annual d os im etry in tercom p a r ison s [ 1 , 2 ] at the Oak Ridge National L a b o r a t o r y 's DOSAR F a c i l i t y have p rov id ed an o p p o r tu n i t y f o r l a b o r a t o r i e s in th e United S t a te s and f o r e i g n c o u n t r i e s t o t e s t d os im etry systems in s im u lated n u c le a r a c c id e n t s i t u a t i o n s . These s tu d ie s have been s u c c e s s fu l in d e v e lo p in g g u id e l in e s in in stru m en ta t ion and p r o ced u res and in e s t a b l i s h i n g "s t a n d a r d iz e d " r a d ia t i o n f i e l d s whose c h a r a c t e r i s t i c s such as energy spectrum , i n t e n s i t y , and u n i fo r m it y have been measured and a c c e p t e d . The Health P h ys ics Research R eactor (HPRR) has been used as th e p u lse r a d ia t i o n so u r c e . The un sh ie ld ed r e a c t o r o r the r e a c t o r used w ith e i t h e r o f two s h i e l d s - - a 1 2 -cm -th ick L u c i t e 1 s h i e l d or a 1 3 -c m -th ic k s t e e l s h i e l d - - p r o v i d e s th re e d i f f e r e n t neutron and gamma-ray s p e c t r a .
Many exp erim en ters o v e r the y e a rs exp ressed i n t e r e s t in using the same " s t a n d a r d iz e d " r a d ia t i o n f i e l d s f o r the com parison o f the respon se o f rou t i n e personnel d os im e te rs used a t low r a d ia t i o n l e v e l s t y p i c a l l y encountered in personnel m o n it o r in g . R e ce n t ly o th e r g ro u p s , in c lu d in g the Nuclear R egu la tory Commission (NRC), became in t e r e s t e d in the same p r o j e c t . As a r e s u l t , th e f i r s t Personnel Dosimetry In tercom parison Study (PDIS) [ 3 ] was conducted during th e p e r io d May 1 4 -1 6 , 1974, w ith ten groups p a r t i c i p a t i n g . The p a r t i c i p a n t s were (1 ) Brookhaven National L a b o ra to ry , (2 ) Dow Chemical Company (Rocky F l a t s , C o lo r a d o ) , (3 ) G e s e l l s c h a f t fu r Kernforschung (GFK), K arlsruh e , Germany, (4 ) Lawrence Livermore L a b o ra to ry , (5 ) Los Alamos S c i e n t i f i c L a b o ra to ry , (6 ) Naval Ordnance L a b o ra to ry , (7 ) Oak Ridge National L aboartory (ORNL), (8 ) R. S. Landauer, J r . , and Company, (9 ) Savannah R iver L a b o ra to ry , and (10 ) Union Carbide N uclear D iv is io n Y-12 P la n t .
S in ce th a t f i r s t PDIS, two a d d i t io n a l in tercom p a r ison s t u d ie s f o r personnel d o s im e te rs have been com pleted a t ORNL [ 4 , 5 ] . The second PDIS was conducted February 1 8 -1 9 , 1976, w ith e le v e n p a r t i c i p a t i n g groups and th e th i r d PDIS was held March 1 5 -1 6 , 1977, w ith s ix p a r t i c i p a t i n g grou ps . Present p lans c a l l f o r a f o u r t h PDIS in the sp r in g o f 1978 w ith an a n t i c i p a t e d p a r t i c i p a t i o n by app rox im ate ly tw e lv e groups .
2. EXPERIMENTAL DETAILS
The HPRR (and a 14-MeV neutron g e n e ra to r in the ca s e o f the f i r s t PDIS) were used to exp ose personnel d os im eters t o mixed neutron and gamma f i e l d s . The r e a c t o r was op erated in a s t e a d y - s t a t e mode a t a c o n sta n t power l e v e l f o r a le n g th o f time n ecessa ry t o produce doses in a range l i k e l y t o be en countered in person nel m o n it o r in g . The neutron g e n e ra to r was operated t o produce a s i m i l a r r a d ia t i o n l e v e l . S in ce dose e q u iv a le n t s o f a few hundred m i l l i r e m are commonly en coun tered in personnel m o n it o r in g , t h i s o r d e r o f magnitude was s e l e c t e d . In o r d e r t o produce t h i s range o f r a d i a t i o n l e v e l s , a f r e e a i r t i s s u e kerma o f ap p rox im ate ly 50 mrad was s e l e c t e d f o r the neutron component and the r e a c t o r o p e r a t in g time was c a l c u la t e d based on t h i s kerma. The r e s u l t a n t r e a c t o r runs were performed as shown ■ in T able It During the f i r s t PDIS, a 14-MeV neutron g e n e ra to r was a v a i l a b le f o r a f o u r t h exp osu re c o n f i g u r a t i o n . This a c c e l e r a t o r was not o p e r a t io n a l f o r subsequent in te r c o m p a r is o n s . G e n e r a l ly , the dos im eters were m ailed o r shipped t o the DOSAR a few days in advance o f the i n t e r com parison . The d o s im e te rs were then re tu rn ed in a s im i l a r manner the day a f t e r th e in tercom p a r ison exp osu res were com pleted .
1 Lucite is an acrylic (methyl methacrylate) resin supplied by E.I. DuPont de Nemours and Company, Inc., Wilmington, Delaware, USA.
* The Tables are to be found at the end of the paper (pp. 505—509).
IAEA-SM-222/45 493
A ll d os im e te rs were p la ced on w a t e r - f i l l e d trunk p o r t i o n s o f phantoms, the le a d in g edges o f which were l o c a t e d th re e meters from the r e a c t o r c o r e ( o r one meter from the t a r g e t in the ca s e o f the 14-MeV e x p o s u r e ) . When s h ie l d s were used , they were p la ce d between th e d e t e c t o r s and the HPRR c o r e and a t a d i s t a n c e o f two m eters . The placem ent o f d os im e te rs on the phantoms i s shown in F ig . 1 , and a t y p i c a l experim enta l arrangement w ith r e a c t o r and s h i e l d in p la c e i s shown in F ig . 2.
I t i s a n t i c i p a t e d th a t fu t u r e in tercom p a r ison s can make use o f two new s h i e l d s th a t have been f a b r i c a t e d and t e s t e d r e c e n t l y [ 6 ] . These s h ie l d s a re a 2 0 -c m -th ic k c o n c r e t e s h ie l d and a com bination 5-cm s t e e l and 15-cm c o n c r e t e s h i e l d . These w i l l p r o v id e r e a l i s t i c t e s t s p e c t r a s in c e c o n c r e t e and s t e e l a re m a t e r ia ls commonly used f o r neutron s h i e l d i n g .
3. REACTOR SPECTRA AND DOSIMETRY
C a lc u la t i o n s o f the HPRR sp e c t r a have been performed using a DOT two- d im ensional t r a n s p o r t cod e which assumed c y l i n d r i c a l symmetry about the v e r t i c a l a x i s o f the HPRR c o r e [ 7 ] . The f i r s t s e t s o f c a l c u l a t i o n s were done f o r the u n sh ie ld ed r e a c t o r and th e r e a c t o r w ith th e s t e e l and L u c i t e s h i e l d s in p la c e [ 8 ] . These c a l c u l a t i o n s were performed using 34 energy groups o f neutrons ranging from thermal t o 14 MeV. The r e s u l t s o f th ese c a l c u l a t i o n s are presen ted in T able II and F ig . 3. The, c a l c u l a t i o n a l model used in th e DOT cod e i s shown in F ig . 4 . The r e a c t o r h e ig h t was f i x e d a t 150 cm above a 3 0 -c m -th ic k c o n c r e t e s l a b . The s h ie l d in g c o n f i g u r a t i o n s were a 1 3 -cm -th ick s t e e l s h i e l d r i s i n g 213 cm above the c o n c r e t e s la b and a 1 2 -cm -th ick L u c i t e s h ie l d r i s i n g 282 cm above the s l a b . These s h ie l d s were p la ced a t 200 cm from the r e a c t o r c e n t e r . In a d d i t i o n to neutron s p e c t r a , th e s e c a l c u l a t i o n s a l s o p r ov id ed neutron dose as a fu n c t i o n o f d i s t a n c e f o r the r e a c t o r ( s e e F ig . 5 ) .
R e c e n t ly , o th e r c a l c u l a t i o n s have been perform ed t o determ ine the neutron s p e c t r a and dose through two new s h i e l d c o n f i g u r a t i o n s - - a 20-cm- th i c k c o n c r e t e s h i e l d and a com bination 5 -c m -th ic k s t e e l and 1 5 -cm -th ick c o n c r e t e s h i e l d . Each o f th e se s h ie l d s i s 213 cm in h e ig h t . These were done usin g the p r e v io u s c a l c u l a t i o n a l model e x c e p t th a t the s h i e l d s were lo c a t e d 100 cm from the c e n t e r o f the r e a c t o r . The r e s u l t s o f the s p e c t r a l c a l c u l a t i o n s using 33 energy groups are presen ted in T able I I I and F ig . 6. Theneutron dose as a fu n c t i o n o f d i s t a n c e from the r e a c t o r i s shown in F ig . 7.
4. REFERENCE DOSIMETRY
In a d d i t i o n to the c a l c u l a t e d neutron d o s e , v a r io u s d o s im e t r i c d e v i c e s were a p p l ie d to o b ta in the t r u e neutron dose d e l i v e r e d during the i n t e r com parison s t u d i e s . These d e v i c e s in c lu d ed the r o u t in e s u l f u r p e l l e t m on itors on the r e a c t o r and Hurst p r o p o r t io n a l c o u n te rs [ 9 ] l o c a t e d at th e p o s i t i o n o f the exposed d o s im e te r s . While s u l f u r p e l l e t s respond o n ly t o the neutron f l u e n c e above a th r e s h o ld o f app rox im ate ly 2 .5 MeV, they may be used t o m on itor the r e a c t o r ou tp u t s in c e a l a r g e p ercenta ge o f the neutrons from th e HPRR (<30%) exceed t h i s en ergy . A l s o , because a co n s t a n t f r a c t i o n o f the neutrons f o r any g iven s h ie ld e d c o n f i g u r a t i o n w i l l have an energy above the s u l f u r t h r e s h o l d , the s u l f u r p e l l e t s can be used to e s t im a te neutron t i s s u e kerma f o r a l l the experim ental c o n d i t i o n s once the c a l i b r a t i o n f a c t o r has been determ ined f o r each o f the s p e c t r a . These c a l i b r a t i o n f a c t o r s have been determ ined p r e v io u s ly from n u c le a r a c c id e n t d os im etry in tercom p a r ison e x p e r ie n c e a t th e HPRR. T h e r e f o r e , the s u l f u r
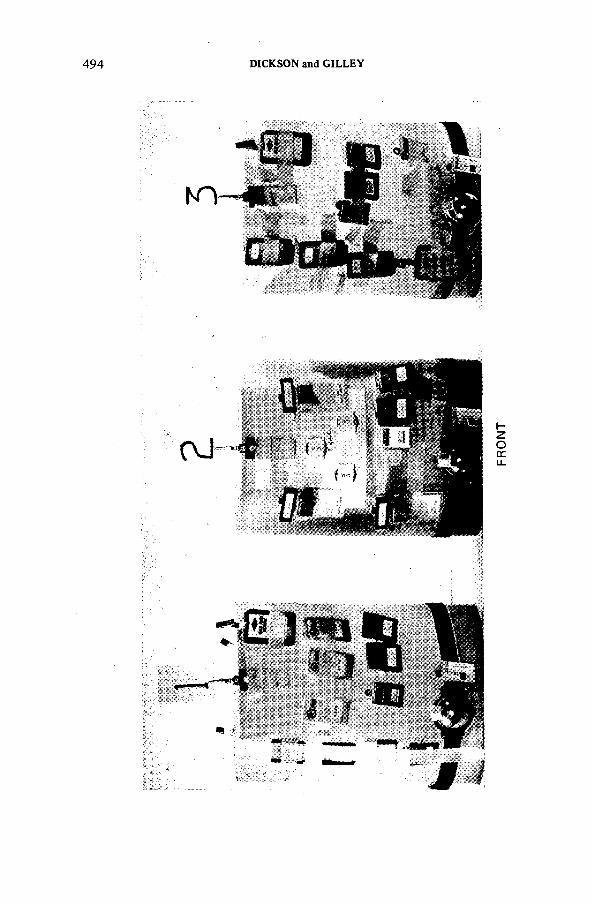
494 DICKSON and GILLEY
FRO
NT
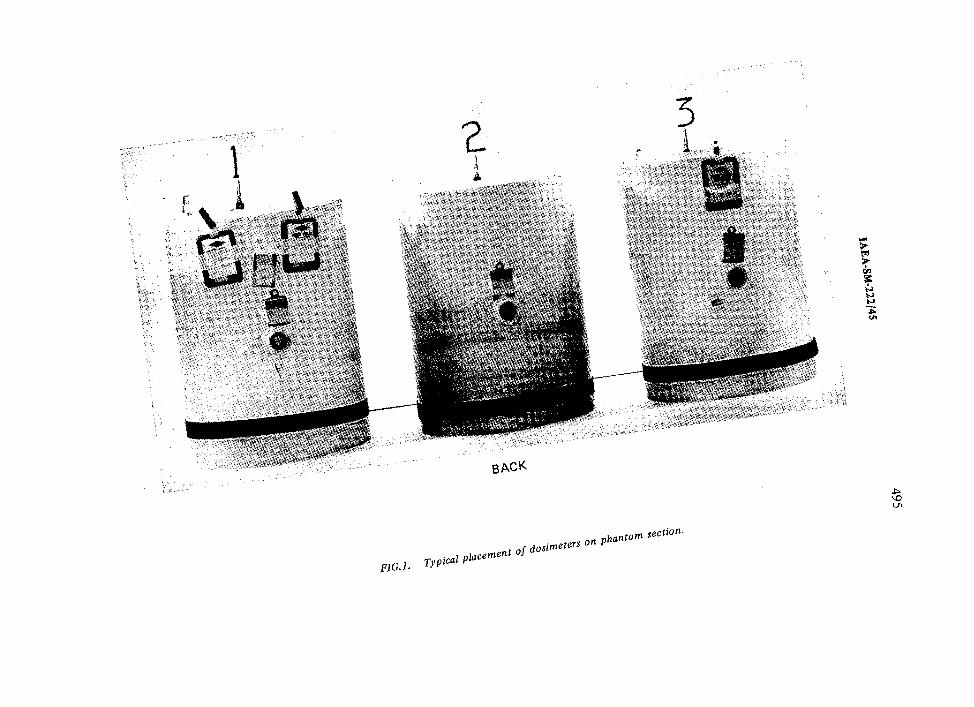
BACK
f ig .lд а |„1
phantom
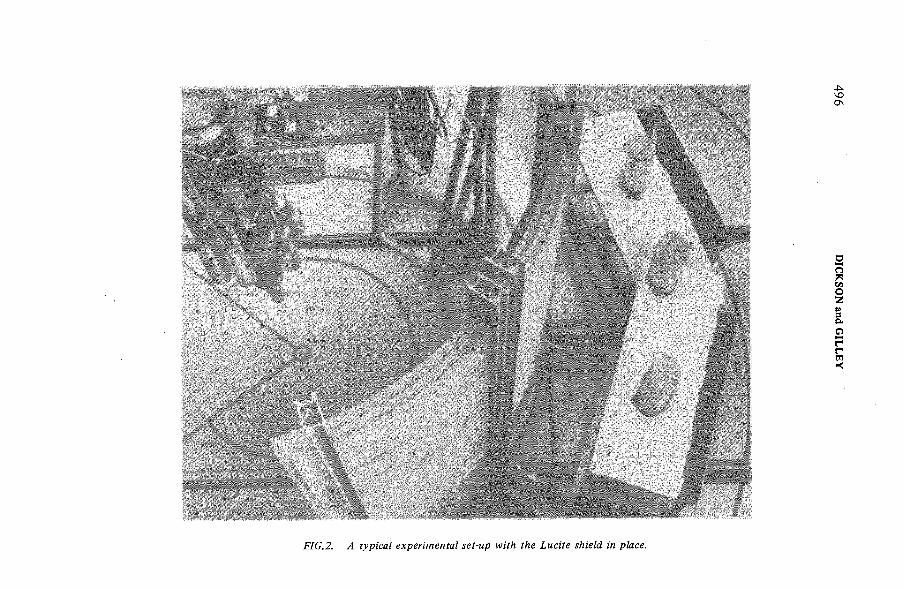
F I G .2 . A ty p ic a l e x p e r im e n ta l se t-u p w ith th e L u c i t e s h ie ld in p la c e .
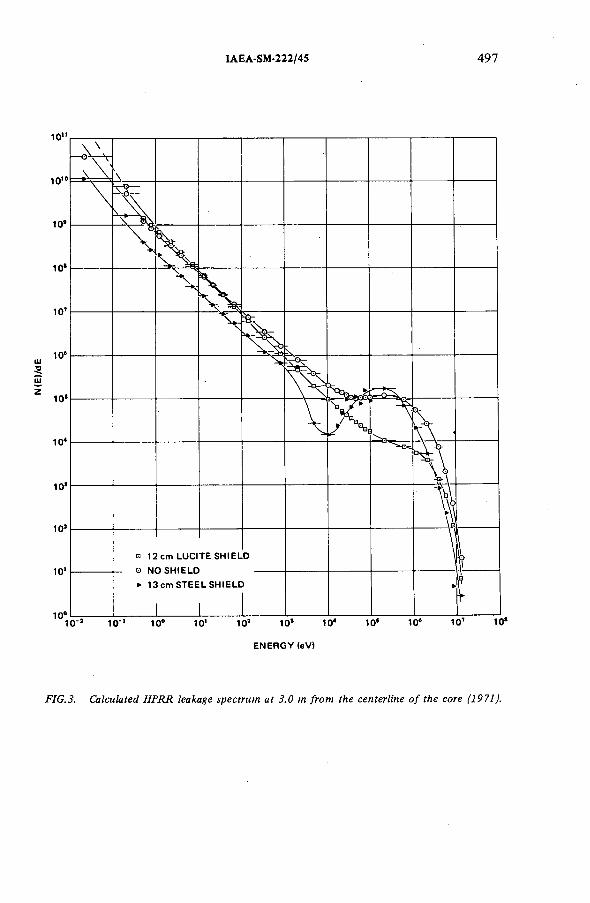
N(E
)/d
E
IAEA-SM-222/45 497
E N E R G Y (e V )
F I G .3 . C a lc u la te d H P R R lea k a g e s p e c tr u m a t 3 .0 m fr o m th e c e n te r lin e o f th e c o r e ( 1 9 7 1 ) .
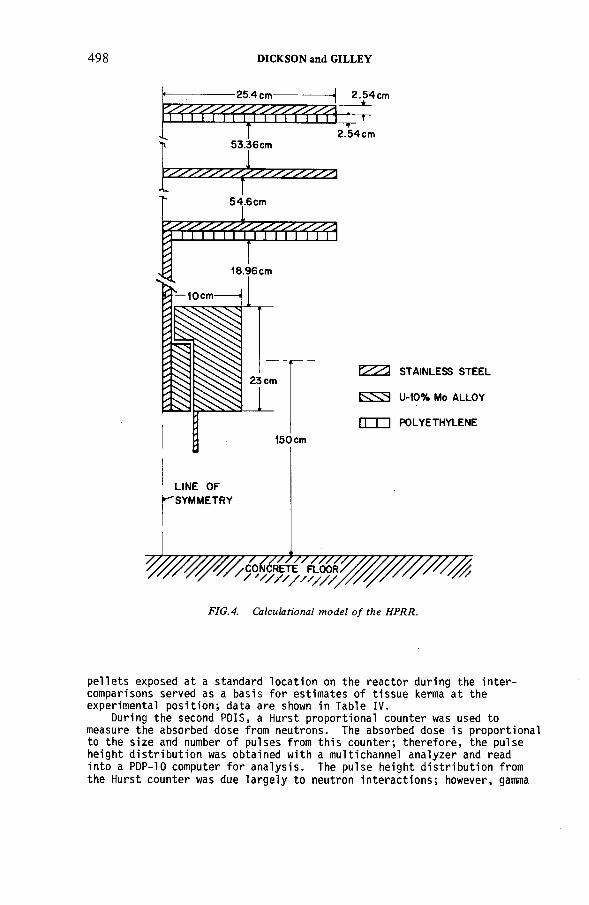
498 DICKSON and GILLEY
p e l l e t s exposed a t a standard l o c a t i o n on the r e a c t o r du rin g the i n t e r com parisons served as a b a s is f o r e s t im a te s o f t i s s u e kerma a t the experim ental p o s i t i o n ; data are shown in Table IV.
During the second PDIS, a Hurst p r o p o r t io n a l co u n te r was used to measure th e absorbed d o se from n eutron s . The absorbed dose i s p r o p o r t io n a l to th e s i z e and number o f p u lse s from t h i s c o u n t e r ; t h e r e f o r e , the pu lse h e ig h t d i s t r i b u t i o n was o b ta in ed w ith a m ultichannel a n a ly z e r and read in t o a PDP-10 computer f o r a n a l y s i s . The p u lse h e ig h t d i s t r i b u t i o n from th e Hurst c o u n t e r was due l a r g e l y t o neutron i n t e r a c t i o n s ; however, gamma
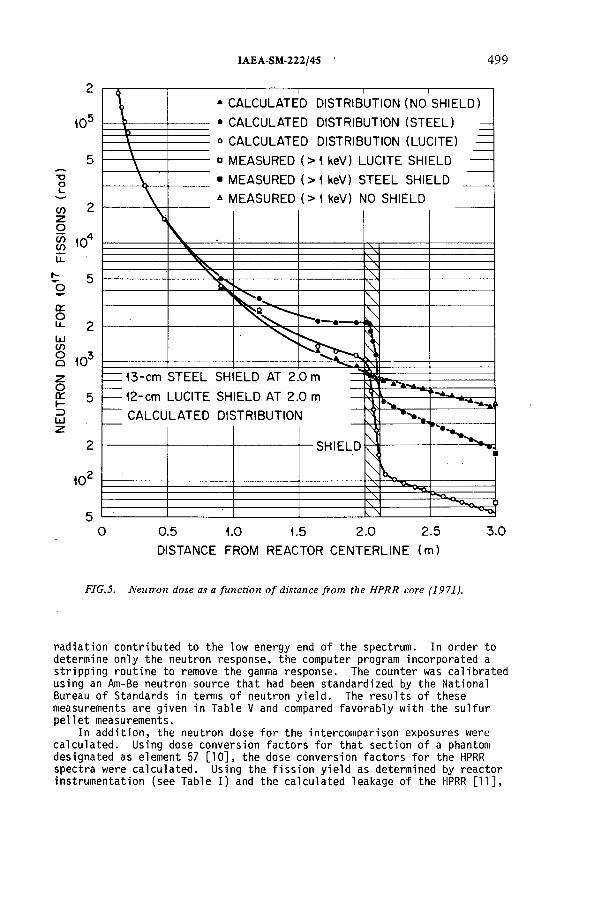
IAEA-SM-222/45 499
ю -
тзо1_
сл
СЛсл
f -Ъсеош(Ооо
gо:
10ч
10'
10
Т--------- 1--------- г* CALCULATED DISTRIBUTION (N0 SHIELD)* CALCULATED DISTRIBUTION (STEEL) - о CALCULATED DISTRIBUTION (LUCITE) £ о MEASURED (>1 keV) LUCITE SHIELD — ■ MEASURED (>1 keV) STEEL SHIELD J H* MEASURED (>1 keV) NO SHIELD
13-cm STEEL SHIELD AT 2.0 m 12-cm LUCITE SHIELD AT 2.0 m CALCULATED DISTRIBUTION
SHIELD
0 0.5 1.0 1.5 2.0 2.5DISTANCE FROM REACTOR CENTERLINE (m)
3.0
F I G .5 . N e u tr o n d o s e as a f u n c t io n o f d ista n c e fr o m th e H P R R c o r e ( 1 9 7 1 ) .
r a d ia t i o n c o n t r ib u t e d t o th e low energy end o f the spectrum. In o rd e r to determ ine o n ly the neutron r e s p o n s e , the computer program in c o r p o r a t e d a s t r i p p in g r o u t in e to remove the gamma re sp o n se . The cou n te r was c a l i b r a t e d u sing an Am-Ве neutron s o u rc e th a t had been sta n d a rd ized by the National Bureau o f Standards in terms o f neutron y i e l d . The r e s u l t s o f th ese measurements a re g iv en in T able V and compared fa v o r a b ly w ith the s u l f u r p e l l e t measurements.
In a d d i t i o n , the neutron dose f o r the in tercom p a r ison exposu res were c a l c u l a t e d . Using dose c o n v e r s io n f a c t o r s f o r th a t s e c t i o n o f a phantom d e s ig n a te d as e lem ent 57 [ 1 0 ] , the dose c o n v e r s io n f a c t o r s f o r the HPRR s p e c t r a were c a l c u l a t e d . Using th e f i s s i o n y i e l d as determ ined by r e a c t o r in stru m en ta t ion ( s e e T ab le I ) and th e c a l c u l a t e d leakage o f the HPRR [ 1 1 ] ,
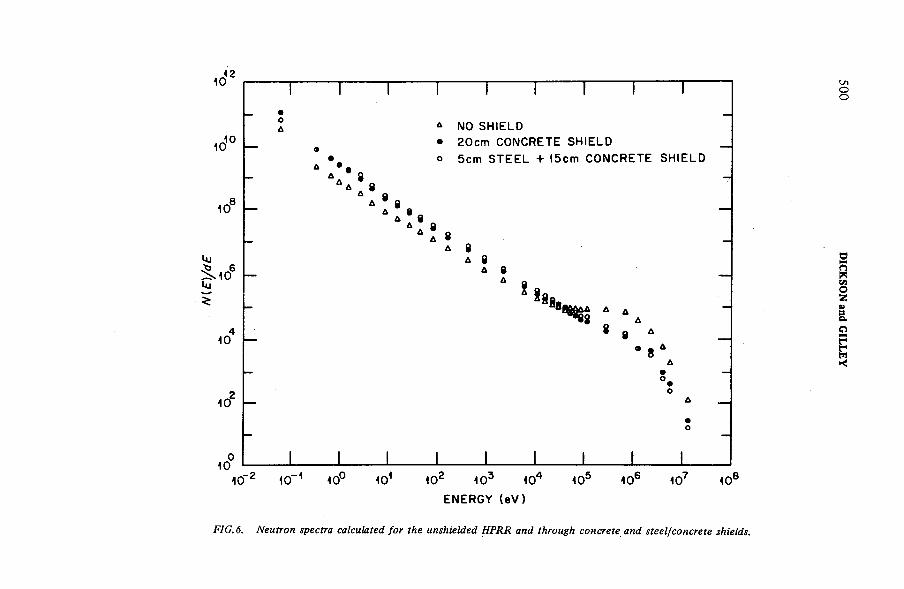
N(E
)/d
E
ю12
10
д л N0 SHIELDí ° I • 20cm CONCRETE SHIELD
10
10
10
* • o 5cm STEEL + 15cm CONCRETE SHIELDдд 8а - 8д.8 1 д 8 8
л в „А 8 д ал в д •А 8
л 8.6 д в
4 t a10 *— 8
ю 2
д* 8 Ад
•<5О д
10"2 Ю-1 10° 101 Ю2 103 Ю4 Ю5 1 06 107 ю 8ENERGY (eV)
FIG. 6. Neutron spectra calculated for the unshielded H P R R and through concrete and steel/concrete shields.
500 DICKSON
and GILLEY
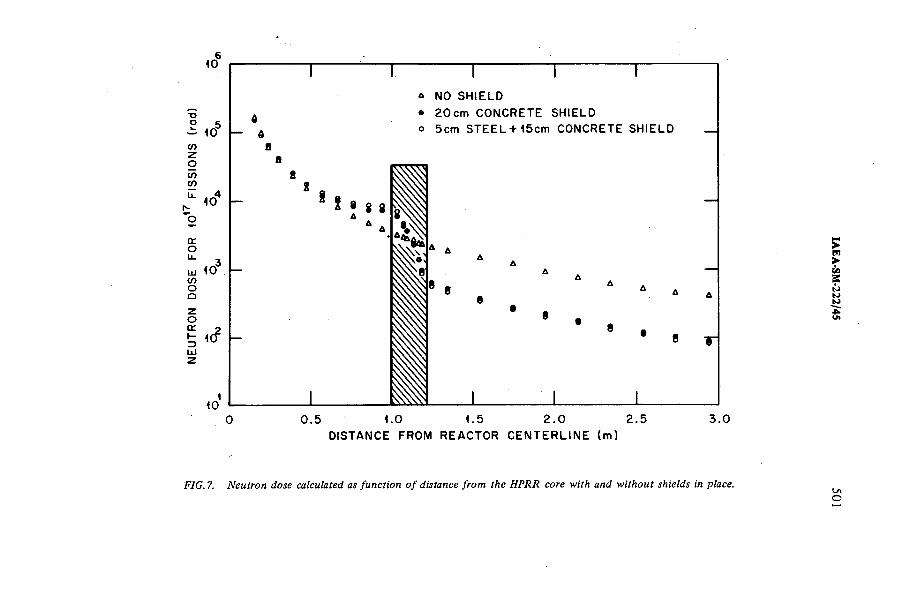
NEUT
RON
DOSE
FO
R 10
1' FIS
SIONS
(ra
d)
DISTANCE FROM REACTOR CENTERLINE (m)
F I G .7 . N e u tr o n d o s e c a lc u la te d as fu n c t io n o f d is ta n c e fr o m t h e H P R R c o r e w ith a n d w ith o u t s h ie ld s in p la c e . ило
IAEA-SM-222/45
502 DICKSON and GILLEY
the neutron f l u e n c e was c a l c u l a t e d f o r each r e a c t o r run. By app ly in g the p r e v io u s ly determ ined dose c o n v e r s io n f a c t o r s and average q u a l i t y f a c t o r s as g iven by Murthy e t a l . [ 1 2 ] , th e dose and dose e q u iv a le n t were c a l c u la te d f o r each run. The r e s u l t s a re g iven in Table VI.
Gamma r a d ia t i o n l e v e l s were measured w ith therm olum inescent dos im eters (T L D 's ) . Lithium f l o r i d e d os im e te rs having normal i s o t o p i c components (TLD-1002 ) and d os im e te rs having an enrichm ent o f 7Li (TLD-7002 ) were used in p a ir s t o o b ta in the gamma-ray exposure in the p resen ce o f n eutron s . The d i f f e r e n t i a l neutron respon se o f th ese d os im eters had been determined p r e v i o u s l y . The TLD's were c a l i b r a t e d f o r gamma exposure using a 137Cs so u r c e . The r e s u l t s o f th e s e measurements a re g iven in T ab le VII f o r the second PDIS.
5. DOSIMETERS USED BY PARTICIPANTS
Several ty p es o f d os im eters have been used by p a r t i c i p a n t s . For measuring the neutron component, TLD a lb ed o and NTA f i l m d os im eters have been the most p o p u la r ; however, t r a c k - e t c h d os im e te rs using p o ly ca rb o n a te f i l m s are g a in in g in p o p u l a r i t y . For measuring the gamma component, o n ly f i l m and TLD's have been used , w ith TLD's be ing used most f r e q u e n t ly .Tab le V III l i s t s th e number o f p a r t i c i p a t i n g groups using each o f the do s im e te rs ty p e s . Some groups used more than one type o f d o s im e t e r s , thus* th e number o f d os im eters v « r e g r e a t e r than th e number o f p a r t i c i p a t i n g groups .
6. INTERCOMPARISON RESULTS
The r e s u l t s o f th e se personnel d os im etry in tercom p a r ison s t u d ie s r e veal th a t e s t im a te s o f dose e q u iv a le n t vary o v e r a wide range. The mean and standard d e v ia t i o n o f the p a r t i c i p a n t s ' measurements f o r each exposure c o n d i t i o n a re g iv en in T a b les IX through XI. There appears t o be a trend toward improved neutron measurements from the f i r s t to the th i r d PDIS; however, gamma measurements have n ot shown the same improvement. The p e r c e n t standard d e v i a t i o n f o r th e neutron and gamma measurements in each o f th e in tercom p a r ison s t u d ie s a re compared in T ab le X II . There has been a s tead y r e d u c t io n o f p er cen t standard d e v ia t i o n f o r a l l the neutron measurements e x ce p t f o r th e L u c i t e s h i e l d s in th e t h ir d PDIS. For same u nexpla ined r e a s o n , th e r e was an a c tu a l d e t e r i o r i a t i o n o f the r e s u l t s f o r th a t p a r t i c u l a r exp osure c o n d i t i o n . The f i r s t PDIS produced the most t i g h t l y grouped gamma measurements. A pp arent ly th e re i s some d i f f i c u l t y in e v a lu a t in g a small gamma dose e q u iv a le n t in the presen ce o f a neutron dose e q u iv a le n t th a t i s an o rd e r o f magnitude g r e a t e r .
For in tercom p a r ison s t u d i e s , i t i s im portant t o see how w ell the p a r t i c ip a n t s ' measurements a gree w ith r e f e r e n c e va lu es o f r a d ia t i o n dose e q u iv a le n t as w ell as w ith each o t h e r s , experim ental r e s u l t s . The neutron dose e q u iv a le n t s f o r each PDIS were c a l c u l a t e d as p r e v io u s ly d e s c r ib e d to serve as th e r e f e r e n c e v a lu e s . These c a l c u l a t e d v a lu es are compared w ith the mean v a lu es o f th e p a r t i c i p a n t s ' measurements in Table X I I I . Without e x c e p t i o n , th e measured mean v a lu es are g r e a t e r than th e co r re sp o n d in g c a l c u l a t e d v a lu e s . The measured and c a l c u l a t e d va lu es do a g r e e , however, w ith in one standard d e v ia t i o n o f the measured v a lu e . A c o n s e r v a t iv e p h i lo s o p h y which pervades person nel d os im etry d i c t a t e s th a t i t i s b e t t e r t o e r r on the high s id e r a th e r than the low s id e when determ in ing r a d ia t i o n doses t o i n d i v i d u a l s . The authors b e l i e v e t h i s p h i lo so p h y may a ccou nt f o r the c o n s i s t e n t l y h igh er measured d oses r e p o r te d by the e x p er im en ters .
2 The dosimeters used were provided by the Harshaw Chemical Company, Solon, Ohio,USA, and designated by them as TLD-100 and TLD-700.
IAEA-SM-222/45 503
This ty p e o f in tercom p a r ison a c t i v i t y was found t o be v a lu a b le t o the p a r t i c i p a n t s , and th e r e s u l t s a re i n d i c a t i v e o f some t r o u b le sp o t s in the i n t e r p r e t a t i o n o f d os im eter re s p o n s e s . Plans are under way t o con t in u e th e s e s t u d ie s in th e fu t u r e w ith th e p r oba b le expansion o f exp osure c o n f i g u r a t i o n s t o in c lu d e the new c o n c r e t e and s t e e l / c o n c r e t e s h i e l d s . The p a r t i c i p a n t s and d os im e te rs have not been th e same from one y e a r ' s study t o th e n e x t , and t h e r e i s no reason t o b e l i e v e th a t the same p a r t i c i p a n t s w i l l c o n t in u e y e a r a f t e r y e a r . Thus, new groups can be helped by o f f e r i n g t h i s a c t i v i t y on a co n t in u in g b a s i s . I t i s a n t i c i p a t e d th a t t h i s type o f in tercom p a r ison study w i l l be w orthw hile on an annual b a s is u n t i l the problems in d o s im e te r respon se and i n t e r p r e t a t i o n have been i d e n t i f i e d and s o lv e d .
REFERENCES
[1] POSTON, J.W ., HAYWOOD, F .F . , 1972 Intercomparison of Nuclear Accident Dosimetry Systems at the Oak Ridge National Laboratory,Oak Ridge National Laboratory Rep. ORNL/TM-4387 (1972).
[2] DICKSON, H.W., HAYWOOD, F .F . , BECKER, K ., Tenth Dosimetry In te rcomparison Study, Oak Ridge National Laboratory Rep. ORNL/TM-4566(1975).
[3] DICKSON, H.W., FOX, W.F., HAYWOOD, F .F . , 1974 Intercomparison of Personnel Dosimetry, Oak Ridge National Laboratory Rep. 0RNL/TM-4786(1976).
[4] GILLEY, L.W., DICKSON, H.W.,. CHRISTIAN, D .J. , 1976 Intercomparison of Personnel Dosimeters, Oak Ridge National Laboratory Rep. ORNL/TM- 5672 (1976).
[5] GILLEY, L.W., DICKSON, H.W., Third Personnel Dosimetry Intercomparison Study, Oak Ridge National Laboratory Rep. ORNL/TM-6114 (in préparation).
[6] DICKSON, H.W., et a l . , "Health Physics Research Reactor," Health Physics Division Annual Progress Report, Oak Ridge National Laboratory Rep. 0RNL-5308 (1977).
[7] MYNATT, F .R ., Development of Two Dimensional Discrete Ordinates Transport Theory for Radiation Shielding, Union Carbide Nuclear Division Computer Technology Center Report CTC-INF-952 (1969).
[8] POSTON, J.W ., KNIGHT, J .R . , WHITESIDES, G .E ., Health Phys. 26 (1974) 217.[9] MILLS, W.A., HURST, G .S ., Nucleonics U 8 (1954) 33.[10] ATTIX, F.H ., ROESCH, W.C., Eds, Radiation Dosimetry, Vol. 1, Academic
Press, New York (1968) 294-298.[11] JOHNSON, D.R., POSTON, J.W ., Radiation Dosimetry Studies at the Health
Physics Research Reactor, Oak Ridge National Laboratory Rep. ORNL-4113 (1967).
[12] MURTHY, M .S.S., BHATT, R.C., SHINDE, S .S ., Health Phys. 27 (1974) 9.
7. CONCLUSION
DISCUSSION
M.A.F. AYAD: Table VIII indicates that you use TLDs for neutron and gamma dosimetry. Is the composition of the TLDs for these two purposes the same or different? I know that TLD-100 for gamma rays contains enriched lithium-7, but what is the composition o f TLDs for neutrons? Do they contain lithium-6, since this element gives a response neutron?
H.W. DICKSON: The dose meters used by ORNL include TLD-100 and TLD-700 supplied by the Harshaw Chemical Company. The isotopic composition
504 DICKSON and GILLEY
of TLD-100 is 7.5% 6Li and 92.5% 7Li, while that o f TLD-700 is 0.007% 6Li and 99.993% 7Li.
M.J. HÔFERT: In your Figs 5 and 7 neutron dose is plotted as a function of distance. What is meant by this neutron dose?
H.W. DICKSON: The neutron dose referred to in Figs 5 and 7 is tissue kerma in free air.
M.J. HÔFERT: In this context it may also be interesting to know the variation of dose equivalent with distance from the reactor core for a well-defined phantom. This should be easy to calculate with your computer code.
H.W. DICKSON: We can calculate the dose equivalent as a function of distance from the reactor. This information will be provided in future reports on these personnel dosimetry intercomparison studies.
J.A. AUXIER: The results o f these intercomparisons represent an anomaly in the usual trend of improvements in successive intercomparisons. This is particularly true o f the gamma results, and I can’t help wondering why it should be so. You mentioned that different groups were involved. Is it likely that those persons who were involved in the later intercomparisons were less experienced and less confident about their systems o f measurement than the first group to participate?
H.W. DICKSON: It is true that one expects to observe an improvement in the results with continued intercomparisons, and we have observed some improvements. But since new participants have been involved in each study the improvement has been less dramatic than one would expect if the same participants repeated the intercomparison each year.
L. FITOUSSI: Your paper clearly showed the difficulties of measuring in mixed fields o f neutrons and 7 -rays; however, it would be useful if we could deduce from such an analysis the characteristics of the dose meters which would be most reliable and hence ought to be used in this type of situation.
Moreover, it should be stressed that over-estimation o f dose equivalents, even if it is acceptable for values of the order of a few tens to hundreds of millirem, may not be acceptable in the case o f accidents. An over-estimation by a factor o f about 2, such as emerges from your results, could certainly not be tolerated for doses of several tens to hundreds o f rem. At these levels of irradiation the medical treatments envisaged are strongly dependent upon the absorbed doses.
H.W. DICKSON: We have conducted two basically different intercomparison studies. The one which I have just described deals with the low levels o f dose equivalent which are likely to be encountered in personnel monitoring. The other, in which we have many more years of experience, is nuclear accident dosimetry, where the dose levels are typically tens to hundreds o f rads. Here, we expect an accuracy of 25% in the final dose evaluations to be within an acceptable range.
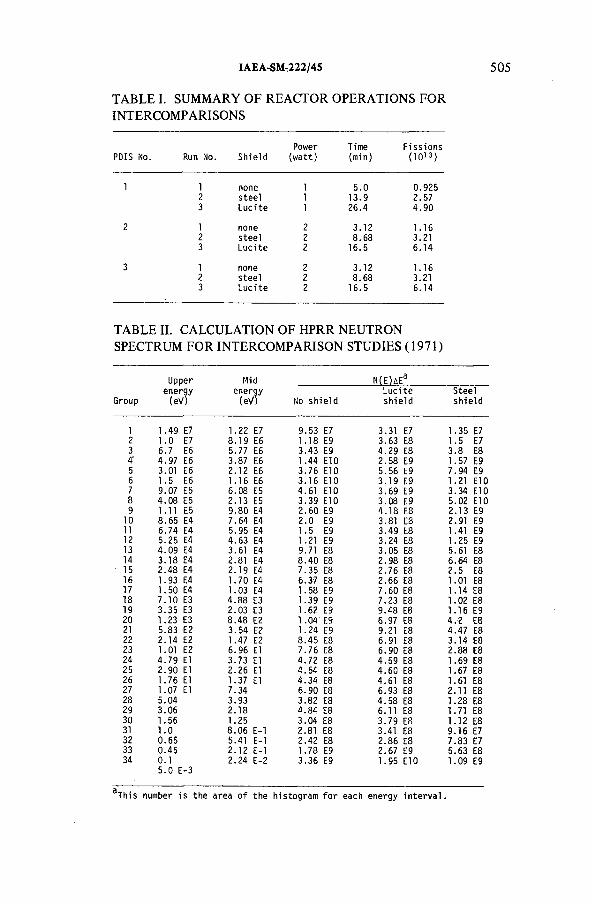
IAEA-SM-222/4S 505
TABLE I. SUMMARY OF REACTOR OPERATIONS FOR INTERCOMPARISONS
PDIS No. Run Ho. S h ie ldPower
( w a t t )T im e(m in )
F is s io n s ( 10 13 )
1 1 none 1 5 .0 0.925
2 s te e l 1 13.9 2.57
3 L u c i te 1 26.4 4 .90
2 1 none 2 3.12 1.162 s te e l 2 8.68 3.21
3 L u c i te 2 16.5 6 .14
3 1 none 2 3.12 1.16
2 s te e l 2 8.68 3.21
3 L u c i te 2 16.5 6.14
TABLE II. CALCULATION OF HPRR NEUTRON SPECTRUM FOR INTERCOMPARISON STUDIES (1971)
U pper M id N (E) ЛЕЭe n e rg y e n e rg y L u c i te S te e l
G roup (eV ) (e V ) No s h ie ld s h ie ld s h ie ld
1 1 .49 E7 1.22 E7 9.53 E7 3.31 E7 1.35 E7
2 1 .0 E7 8 .19 E6 1.18 E9 3.63 E8 1.5 E73 6.7 E6 5.77 E6 3.43 E9 4 .29 E8 3 .8 E8
4' 4.97 E6 3.87 E6 1.44 ЕЮ 2 .58 E9 1.57 E9
5 3.01 E6 2.12 E6 3 .76 ЕЮ 5.56 E9 7 .94 E9
6 1 .5 E6 1.16 E6 3 .16 E10 3 .19 E9 1.21 ЕЮ7 9.07 E5 6.08 E5 4.61 ЕЮ 3.69 E9 3.34 ЕЮ8 4 .08 E5 2.13 E5 3 .39 ЕЮ 3.08 E9 5.02 ЕЮ9 1.11 E5 9.80 E4 2 .60 E9 4 .18 E8 2.13 E9
10 8 .65 E4 7.64 E4 2 .0 E9 3.81 E8 2.91 E911 6.74 E4 5.95 E4 1.5 E9 3.49 E8 1.41 E9
12 5.25 E4 4 .63 E4 1.21 E9 3 .24 E8 1.25 E913 4.09 E4 3.61 E4 9.71 E8 3.05 E8 5.61 E8
14 3.18 E4 2.81 E4 8 .40 E8 2.98 E8 6.64 E815 2.48 E4 2.19 E4 7 .35 E8 2.76 E8 2 .5 E8
16 1.93 E4 1.70 E4 6.37 E8 2.66 E8 1.01 E817 1.50 E4 1.03 E4 1.58 E9 7 .60 E8 1.14 E818 7 .10 E3 4.88 E3 1.39 E9 7 .23 E8 1.02 E819 3 .35 E3 2.03 E3 1.62 E9 9 .48 E8 1 .16 E9
20 1.23 E3 8.48 E2 1.04 E9 6.97 E8 4 .2 E821 5.83 E2 3.54 E2 1.24 E9 9.21 E8 4.47 E8
22 2 .14 E2 1.47 E2 8 .45 E8 6.91 E8 3.14 E823 1.01 E2 6.96 El 7 .76 E8 6.90 E8 2.88 E8
24 4 .79 El 3.73 El 4.72 E8 4 .59 E8 1 .69 E8
25 2.90 El 2 .26 El 4.54 E8 4 .60 E8 1.67 E8
26 1.76 El 1.37 El 4.34 E8 4.61 E8 1.61 E827 1.07 El 7 .34 6 .90 E8 6.93 E8 2.11 E828 5.04 3 .93 3 .82 E8 4 .58 E8 1.28 E8
29 3 .06 2 .18 4.84 E8 6.11 E8 1.71 E8
30 1.56 1 .25 3 .04 E8 3 .79 E8 1.12 E831 1.0 8 .06 E - l 2.81 E8 3.41 E8 9.16 E7
32 0.65 5.41 E - l 2.42 E8 2.86 E8 7 .83 E733 0.45 2 .12 E - l 1.78 E9 2.67 E9 5.63 E834 0.1
5 .0 Í:-з2.24 E-2 3.36 E9 1.95 ЕЮ 1.09 E9
aT h is num ber i s th e a re a o f th e h is to g ra m f o r each e n e rg y i n t e r v a l .
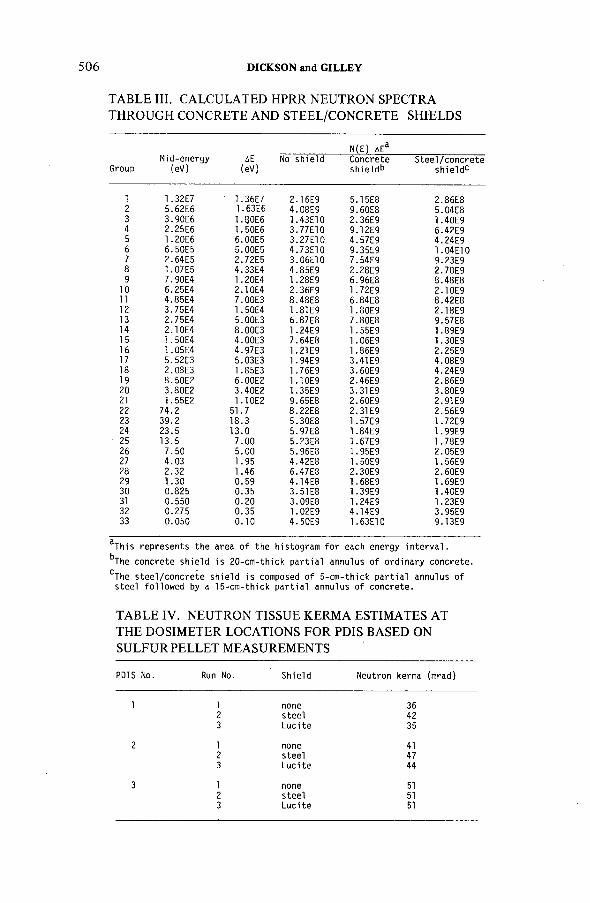
506 DICKSON and GILLEY
TABLE III. CALCULATED HPRR NEUTRON SPECTRA THROUGH CONCRETE AND STEEL/CONCRETE SHIELDS
N (E ) ¿Ea
G roupM id -e n e rg y
(eV )ДЕ
CeV)No s h ie ld C o n c re te
s h ie ld bS t e e l /c o n c r e t e
s h ie ld 0
1 1 . 32E7 1 . 36E7 2 . 16E9 5 . 15E8 2 . 86 E82 5 . 62E6 1 . 63E6 4 . 08E9 9 . 60E8 5 . 04E83 3 . 90E6 1 . 30E6 1 . 43E10 2 . 36E9 1 . 40E94 2 . 25E6 1 . 50E6 3 . 77E10 9 . 12E9 6 . 42E95 1 . 20E6 6 . 00E5 3 . 27E10 4 . 57E9 4 . 24E96 6 . 50E5 5 . 00E5 4 . 73E10 9 . 35E9 1 . 04E107 2 . 64E5 2 . 72E5 3 . 06E10 7 . 54E9 9 . 23E98 1 . 07E5 4 . 33E4 4 . 85E9 2 . 28E9 2 . 78E99 7 . 90E4 1 . 20E4 1 . 28E9 6 . 96E8 8 . 48E8
10 6 . 25E4 2 . 10E4 2 . 36E9 1 . 72E9 2 . 10E911 4 . 85E4 7 . 00E3 8 . 48E8 6 . 84E8 8 . 42E8
12 3 . 75E4 1 .Б 0Е4 1 . 81E9 1 . 80E9 2 . 18E913 2 . 75E4 5 . 00E3 6 . 87E8 7 . 80E8 9 . 57E8
14 2 . 10E4 8 . 00E3 1 . 24E9 1 . 55E9 1 . 89E9
15 1 . 50E4 4 . 00E3 7 . 64E8 1 . 06E9 1 . 30E916 1 . 05E4 4 . 97E3 1 . 21E9 1 . 86E9 2 . 25E9
17 5 . 52E3 5 . 03E3 1 . 94E9 3 . 41E9 4 . 08E918 2 . 08E3 1 . 85E3 1 . 76E9 3 . 60E9 4 . 24E9
19 8 . 50E2 6 . 00E2 1 . 10E9 2 . 46E9 2 . 86E9
20 3 . 80E2 3 . 40E2 1 . 35E9 3 . 31E9 3 . 80E921 1 . 55E2 1 . 10E2 9 . 65E8 2 . 60E9 2 . 91E9
22 74.2 51.7 8 . 22E8 2 . 31E9 2 . 56E9
23 39.2 18.3 5 . 30E8 1 . 57E9 1 . 72E9
24 23.5 13 .0 5 . 97E8 1 . 84E9 1 . 99E9
25 13.5 7 .00 5 . 23E8 1 . 67E9 1 . 78E9
26 7 .50 5 .00 5 . 96E8 1 . 95E9 2 . 05E9
27 4 .03 1.95 4 . 42E8 1 . 50E9 1 . 56E9
28 2.32 1.46 6 . 47E8 2 . 30E9 2 . 60E9
29 1.30 0 .59 4 . 14E8 1 . 68E9 1 . 69E930 0.825 0.35 3 . 51E8 1 - 39E9 1 . 40E9
31 0.550 0 .20 3 . 09E8 1 . 24E9 1 . 23E9
32 0.275 0.35 1 . 02E9 4 . 14E9 3 . 95E9
33 0.050 0 .10 4 . 50E9 1 . 63E10 9 . 13E9
aT h is r e p r e s e n ts th e a re a o f th e h is to g ra m f o r each e n e rg y i n t e r v a l .
^The c o n c re te s h ie ld i s 20- c m - th ic k p a r t i a l a n n u lu s o f o r d in a r y c o n c r e te .
c The s t e e l / c o n c r e t e s h ie ld i s com posed o f 5 - c m - th ic k p a r t i a l a n n u lu s o f s t e e l fo l lo w e d by a 15 - c m - th ic k p a r t i a l a n n u lu s o f c o n c r e te .
TABLE IV. NEUTRON TISSUE KERMA ESTIMATES AT THE DOSIMETER LOCATIONS FOR PDIS BASED ON SULFUR PELLET MEASUREMENTS
PDIS No. Run No. S h ie ld N e u tro n kerma (m ra d )
1 1 none 36
2 s t e e l 42
3 L u c i te 35
2 1 none 41
2 s te e l 47
3 L u c i te 44
3 1 none 51
2 s t e e l 51
3 L u c i te 51
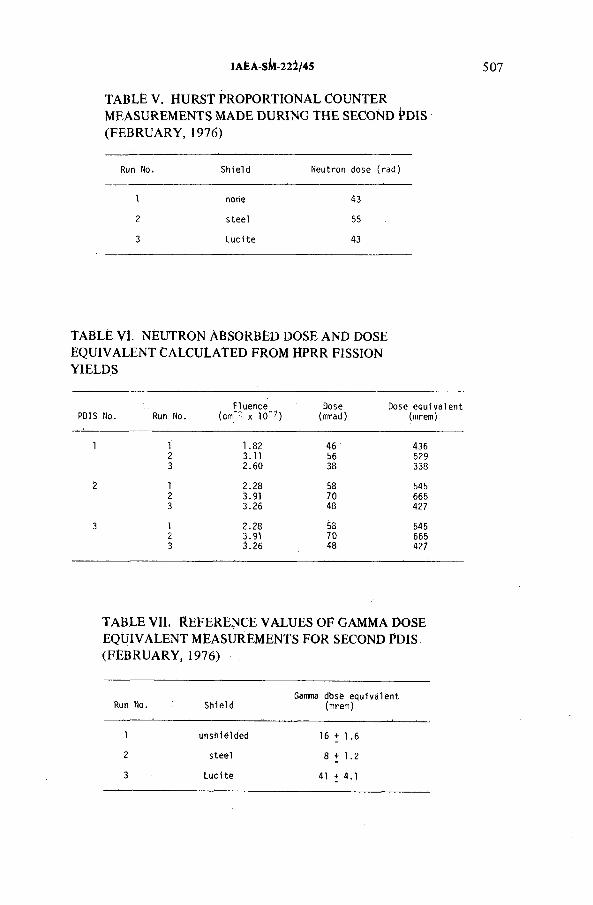
IAEA-SM-22Í/4S 507
TABLÉ V. HURST PROPORTIONAL COUNTER MEASUREMENTS MADE DURING THE SECOND j?DIS (FEBRUARY, 1976)
Run No. S h ie ld N e u tro n dose ( r a d )
i none 43
2 s te e l 55
3 L u c i te 43
TABLÉ VI. NEUTRON ABSORBED DOSE AND DOSE EQUIVALENT CALCULATED FROM HPRR FISSION YIELDS
PDIS No. Run No.F lu e n c e
(cm " 2 x 10 " 7 )Dose
(m ra d )Dose e q u iv a le n t
(mrem)
1 1 1.82 46 436
2 3.11 56 529
3 2 .60 38 338
2 1 2 .28 58 545
2 3.91 70 665
3 3 .26 48 427
3 1 2 ¡28 58 545
2 3.91 70 6653 3 .26 48 427
TABLE VIL REFERENCE VALUES OF GAMMA DOSE EQUIVALENT MEASUREMENTS FOR SECOND PDIS (FEBRUARY, 1976)
Gamma dbse e q u iv a le n t Run Mo. S h ie ld (tnrem )
1 u n s h ie ld e d 16 + 1.6
2 s t e e l 8 + 1.2
3 L u c i te 41 + 4.1
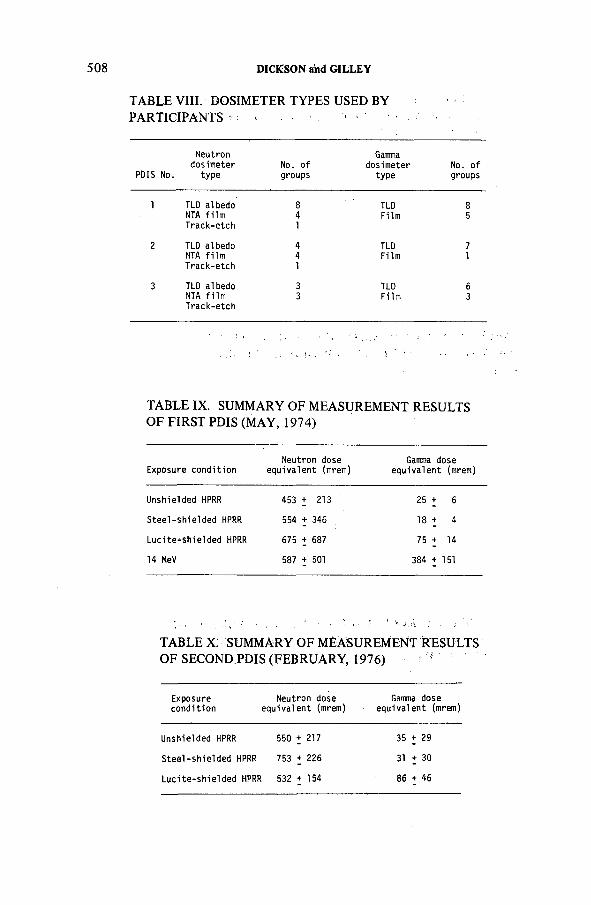
50 8 DICKSON and GILLEY
TABLE VIII. DOSIMETER TYPES USED BY PARTICIPANTS ¡ ■
N e u tro n Gammad o s im e te r No. o f d o s im e te r No. o f
PDIS No. ty p e g ro u p s ty p e g ro u p s
TLD a lb e d o 8 TLD 8
NTA f i l m 4 F ilm 5
T r a c k - e tc h 1
TLD a lb e d o 4 TLD 7
NTA f i l m 4 F i lm 1
T r a c k - e tc h 1
TLD a lb e d o 3 TLD 6
NTA f i l m 3 F i lm 3
T r a c k - e tc h
i ' 1
TABLE IX. SUMMARY OF MEASUREMENT RESULTS OF FIRST PDIS (MAY, 1974)
N e u tro n d ose Gamma doseE xp o su re c o n d i t io n e q u iv a le n t (mrem ) e q u iv a le n t (mrem )
U n s h ie ld e d HPRR 453 + 213 25 + 6
S te e l - s h ie ld e d HPRR 554 + 346 18 t 4
L u c i te - s h ie ld e d HPRR 675 + 687 75 + 14
14 MeV 587 + 501 384 + 151
TABLE X. SUMMARY OF MEASUREMENT RESULTS OF SECOND.PDIS (FEBRUARY, 1976) ! ;
E xp o su rec o n d i t io n
N e u tro n dose e q u iv a le n t (mrem )
Gamma dose e q u iv a le n t (mrem )
U n s h ie ld e d HPRR 550 + 217 35 + 29
S t e e l - s h ie ld e d HPRR 753 + 226 31 + 30
L u c i te - s h ie ld e d HPRR 532 + 154 86 + 46
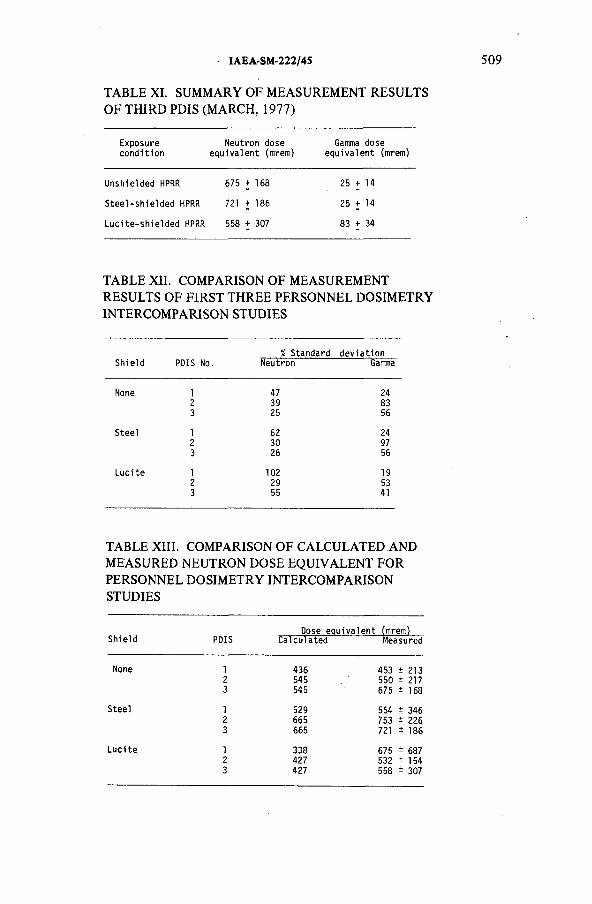
TABLE XI. SUMMARY OF MEASUREMENT RESULTS OF THIRD PDIS (MARCH, 1977)
IAEA-SM-222/45 509
E xp o su re N e u tro n d ose Gamma dosec o n d i t io n e q u iv a le n t (m rem ) e q u iv a le n t (mrem)
U n s h ie ld e d HPRR 675 + 168 25 + 14
S t e e l - s h ie ld e d HPRR 721 + 186 25 + 14
L u c i te - s h ie ld e d HPRR 558 + 307 83 + 34
TABLE XII. COMPARISON OF MEASUREMENT RESULTS OF FIRST THREE PERSONNEL DOSIMETRY INTERCOMPARISON STUDIES
% S ta n d a rd d e v ia t io n S h ie ld PDIS No. N e u tro n Gamma
None 1 47 24
2 39 83
3 25 56
S te e l 1 62 24
2 30 97
3 26 56
L u c i te 1 102 19
2 29 53
3 55 41
TABLE XIII. COMPARISON OF CALCULATED AND MEASURED NEUTRON DOSE EQUIVALENT FOR PERSONNEL DOSIMETRY INTERCOMPARISON STUDIES
Dose e q u iv a le n t (mrem) S h ie ld PDIS C a lc u la te d M easured
None 1 436 453 ± 213
2 545 550 ± 217
3 545 675 ± 168
S te e l 1 529 554 ± 346
2 665 753 ± 226
3 665 721 ± 186
L u c i te 1 338 675 ± 687
2 427 532 ± 154
3 427 558 ± 307

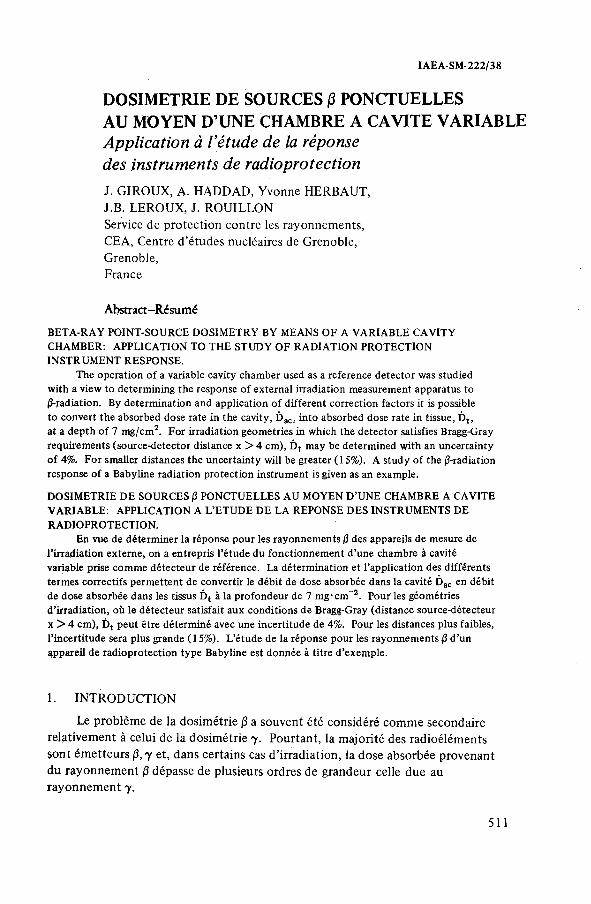
IAEA-SM-222/38
DOSIMETRIE DE SOURCES (3 PONCTUELLES AU MOYEN D’UNE CHAMBRE A CAVITE VARIABLEApplication à l’étude de la réponse des instruments de radioprotection
J. GIROUX, A. HADDAD, Yvonne HERBAUT,J.B. LEROUX, J. ROUILLONService de protection contre les rayonnements,CEA, Centre d’études nucléaires de Grenoble,Grenoble,France
Abstract-RésuméBETA-RAY POINT-SOURCE DOSIMETRY BY MEANS OF A VARIABLE CAVITY CHAMBER: APPLICATION TO THE STUDY OF RADIATION PROTECTION INSTRUMENT RESPONSE.
The operation o f a variable cavity chamber used as a reference detector was studied with a view to determining the response o f external irradiation measurement apparatus to /З-radiation. By determination and application o f different correction factors it is possible to convert the absorbed dose rate in the cavity, Dac, into absorbed dose rate in tissue, Dt, at a depth o f 7 mg/cm2. For irradiation geometries in which the detector satisfies Bragg-Gray requirements (source-detector distance x > 4 cm), D, may be determined with an uncertainty o f 4%. For smaller distances the uncertainty will be greater (15%). A study of the 0-radiation response of a Babyline radiation protection instrument is given as an example.
DOSIMETRIE DE SOURCES 0 PONCTUELLES AU MOYEN D’UNE CHAMBRE A CAVITE VARIABLE: APPLICATION A L’ETUDE DE LA REPONSE DES INSTRUMENTS DE RADIOPROTECTION.
En vue de déterminer la réponse pour les rayonnements /3 des appareils de mesure de l’irradiation externe, on a entrepris l’étude du fonctionnement d’une chambre à cavité variable prise comme détecteur de référence. La détermination et l’application des différents termes correctifs permettent de convertir le débit de dose absorbée dans la cavité Dac en débit de dose absorbée dans les tissus Dt à la profondeur de 7 mg-cm-2. Pour les géométries d’irradiation, où le détecteur satisfait aux conditions de Bragg-Gray (distance source-détecteur x > 4 cm), Dt peut être déterminé avec une incertitude de 4%. Pour les distances plus faibles, l’incertitude sera plus grande (15%). L’étude de la réponse pour les rayonnements 0 d ’un appareil de radioprotection type Babyline est donnée à titre d’exemple.
1. INTRODUCTION
Le problème de la dosimétrie ¡3 a souvent été considéré comme secondaire relativement à celui de la dosimétrie y. Pourtant, la majorité des radioéléments sont émetteurs ¡5, y et, dans certains cas d’irradiation, la dose absorbée provenant du rayonnement /3 dépasse de plusieurs ordres de grandeur celle due au rayonnement y.
511
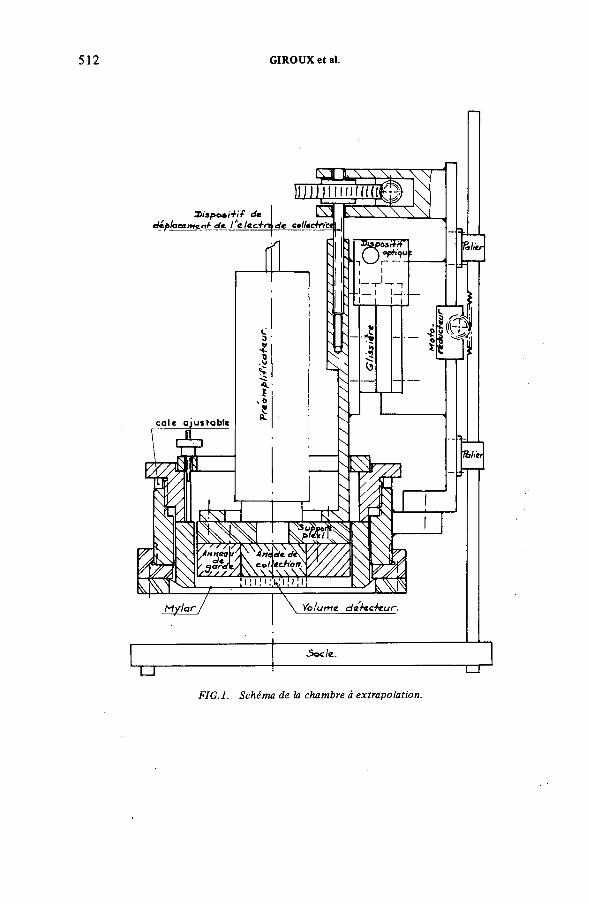
512 GIROUX et al.
L> г г \ s, y c
Hibf>o*i+if de K ]d¿placa.rn<z.nt е/л l'z /а с V-п d€ CofUcfn'Ct M
Г\7
F I G . L S c h é m a d e la ch a m b re à e x tr a p o la tio n .
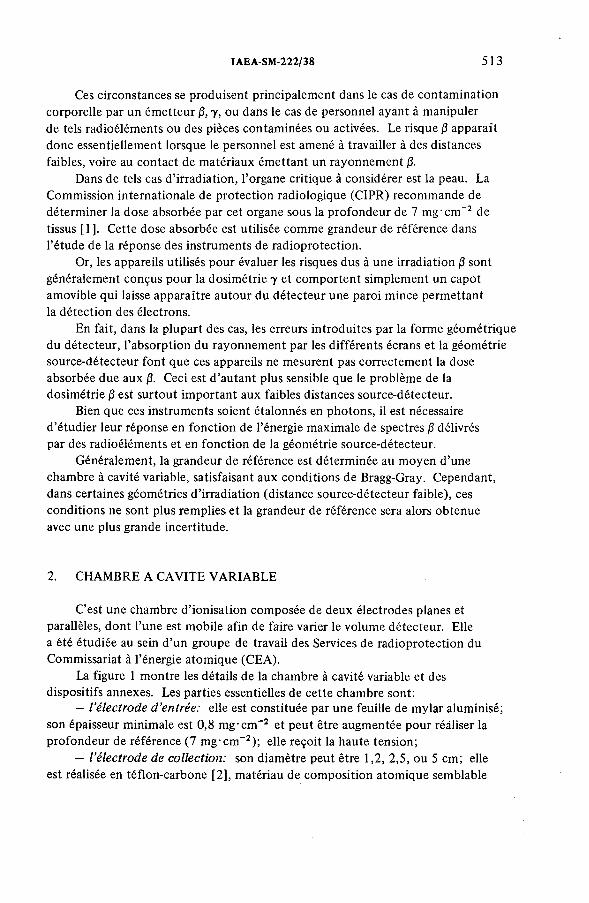
IAEA-SM-222/38 513
Ces circonstances se produisent principalement dans le cas de contamination corporelle par un émetteur p, y, ou dans le cas de personnel ayant à manipuler de tels radioéléments ou des pièces contaminées ou activées. Le risque /3 apparaît donc essentiellement lorsque le personnel est amené à travailler à des distances faibles, voire au contact de matériaux émettant un rayonnement /3.
Dans de tels cas d’irradiation, l’organe critique à considérer est la peau. La Commission internationale de protection radiologique (CIPR) recommande de déterminer la dose absorbée par cet organe sous la profondeur de 7 mg’ cm-2 de tissus [1 ]. Cette dose absorbée est utilisée comme grandeur de référence dans l’étude de la réponse des instruments de radioprotection.
Or, les appareils utilisés pour évaluer les risques dus à une irradiation /3 sont généralement conçus pour la dosimétrie y et comportent simplement un capot amovible qui laisse apparaître autour du détecteur une paroi mince permettant la détection des électrons.
En fait, dans la plupart des cas, les erreurs introduites par la forme géométrique du détecteur, l’absorption du rayonnement par les différents écrans et la géométrie source-détecteur font que ces appareils ne mesurent pas correctement la dose absorbée due aux /3. Ceci est d’autant plus sensible que le problème de la dosimétrie j3 est surtout important aux faibles distances source-détecteur.
Bien que ces instruments soient étalonnés en photons, il est nécessaire d’étudier leur réponse en fonction de l’énergie maximale de spectres |3 délivrés par des radioéléments et en fonction de la géométrie source-détecteur.
Généralement, la grandeur de référence est déterminée au moyen d’une chambre à cavité variable, satisfaisant aux conditions de Bragg-Gray. Cependant, dans certaines géométries d’irradiation (distance source-détecteur faible), ces conditions ne sont plus remplies et la grandeur de référence sera alors obtenue avec une plus grande incertitude.
2. CHAMBRE A CAVITE VARIABLE
C’est une chambre d’ionisation composée de deux électrodes planes et parallèles, dont l’une est mobile afin de faire varier le volume détecteur. Elle a été étudiée au sein d’un groupe de travail des Services de radioprotection du Commissariat à l’énergie atomique (CEA).
La figure 1 montre les détails de la chambre à cavité variable et des dispositifs annexes. Les parties essentielles de cette chambre sont:
- l’électrode d ’entrée: elle est constituée par une feuille de mylar aluminisé; son épaisseur minimale est 0,8 mg-crrT2 et peut être augmentée pour réâliser la profondeur de référence (7 mg-cm-2); elle reçoit la haute tension;
— l’électrode de collection: son diamètre peut être 1,2, 2,5, ou 5 cm; elle est réalisée en téflon-carbone [2], matériau de composition atomique semblable
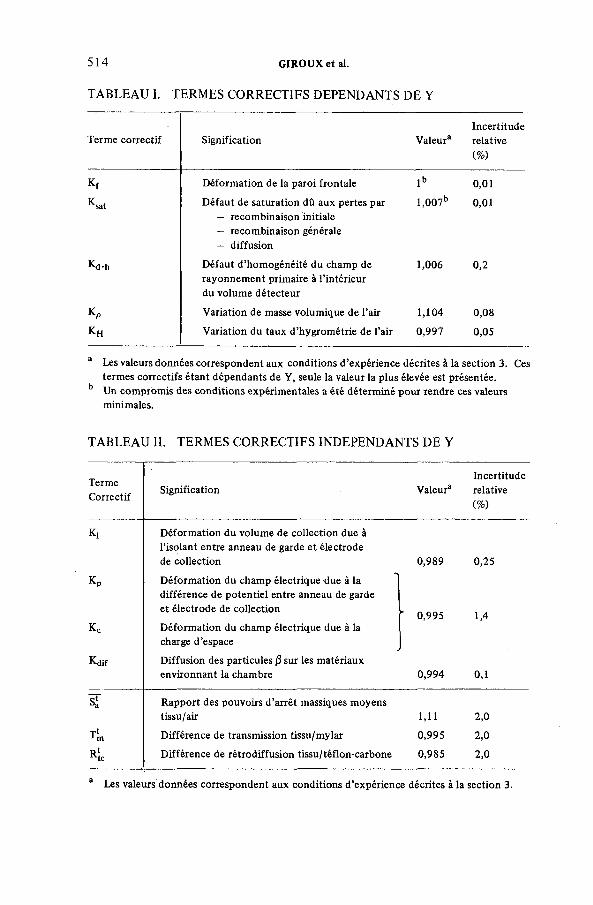
TABLEAU I. TERMES CORRECTIFS DEPENDANTS DE Y
5 14 GIROUX et al.
Terme correctif Signification Valeur3Incertituderelative(%)
Kf Déformation de la paroi frontale l b 0,01
Ksa, Défaut de saturation dû aux pertes par— recombinaison initiale— recombinaison générale— diffusion
l,007b 0,01
Kd-h Défaut d’homogénéité du champ de rayonnement primaire à l’intérieur du volume détecteur
1,006 0,2
Kp Variation de masse volumique de l’air 1,104 0,08
KH Variation du taux d’hygrométrie de l’air 0,997 0,05
a Les valeurs données correspondent aux conditions d’expérience décrites à la section 3. Ces termes correctifs étant dépendants de Y, seule la valeur la plus élevée est présentée.
b Un compromis des conditions expérimentales a été déterminé pour rendre ces valeurs minimales.
TABLEAU II. TERMES CORRECTIFS INDEPENDANTS DE Y
TermeCorrectif
IncertitudeSignification Valeur3 relative
(%)
Ki Déformation du volume de collection due à l’isolant entre anneau de garde et électrodede collection 0,989 0,25
Kp Déformation du champ électrique due à la différence de potentiel entre anneau de gardeet électrode de collection ' 0,995 1.4
Kc Déformation du champ électrique due à la charge d’espace
Kdif Diffusion des particules /3 sur les matériauxenvironnant la chambre 0,994 0,1
etaa Rapport des pouvoirs d’arrêt massiques moyenstissu/air 1,11 2,0
T‘m Différence de transmission tissu/mylar 0,995 2,0
RÎc Différence de rétrodiffusion tissu/téflon-carbone 0,985 2,0
a Les valeurs données correspondent aux conditions d’expérience décrites à la section 3.
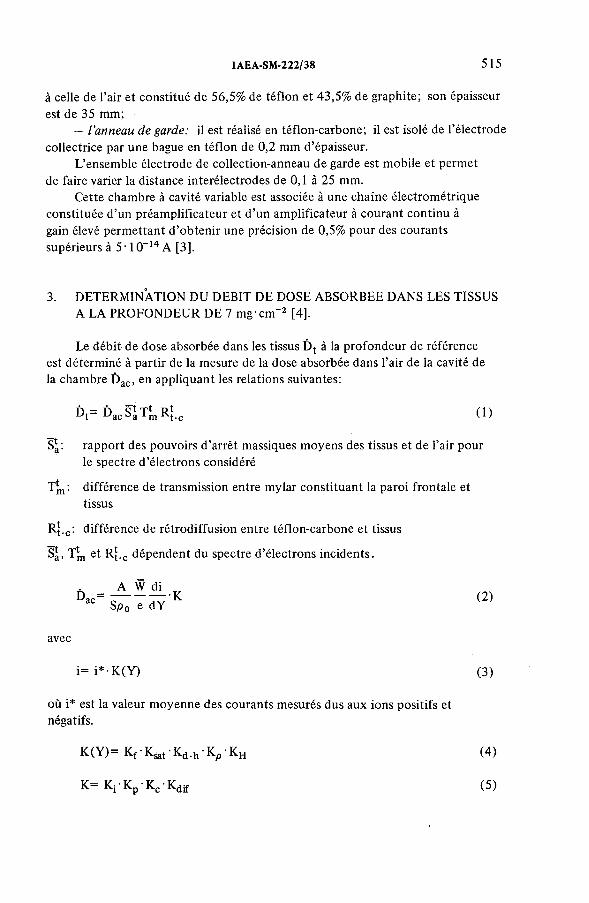
IAEA-SM-222/38 515
à celle de l’air et constitué de 56,5% de téflon et 43,5% de graphite; son épaisseur est de 35 mm;
collectrice par une bague en téflon de 0,2 mm d’épaisseur.L’ensemble électrode de collection-anneau de garde est mobile et permet
de faire varier la distance interélectrodes de 0,1 à 25 mm.Cette chambre à cavité variable est associée à une chaîne électrométrique
constituée d’un préamplificateur et d’un amplificateur à courant continu à gain élevé permettant d’obtenir une précision de 0,5% pour des courants supérieurs à 5 -10~14 A [3].
3. DETERMINATION DU DEBIT DE DOSE ABSORBEE DANS LES TISSUS A LA PROFONDEUR DE 7 mg cm-2 [4].
S*: rapport des pouvoirs d’arrêt massiques moyens des tissus et de l’air pourle spectre d’électrons considéré
TJh : différence de transmission entre mylar constituant la paroi frontale et
où i* est la valeur moyenne des courants mesurés dus aux ions positifs et négatifs.
Vanneau de garde: il est réalisé en téflon-carbone; il est isolé de l’électrode
Le débit de dose absorbée dans les tissus Dt à la profondeur de référence est déterminé à partir de la mesure de la dose absorbée dans l’air de la cavité de la chambre Dac, en appliquant les relations suivantes:
Dt= DanS‘ T‘ R|a cJ a 1m I4t-c ( 1)
tissus
R(.c : différence de rétrodiffusion entre téflon-carbone et tissus
Sg, TJj, et R{.c dépendent du spectre d’électrons incidents.
(2)
avec
i= i* ■ K(Y) (3)
K (Y )= Kf • Kgat ■ Kd.h • Kp • KH (4)
K= Kj • Kp • Kc • Kdif (5)
516 GIROUX et al.
Les termes des équations 2 à 5 sont définis comme suit:
A: constante dépendant des unités
S: surface effective de l’électrode de collection
p0 : masse volumique de l’air dans les conditions normales de pression ettempérature
W: énergie moyenne dépensée pour créer une paire d’ions dans l’air pourles électrons
e: charge élémentaire de l’électron
di/dY: valeur limite du quotient du courant d’ionisation moyen corrigé produitdans la chambre par la profondeur Y de la chambre lorsque celle-ci tend vers zéro; di/dY est calculé à partir de la pente de la fonction i(Y)
K(Y): produit des termes correctifs dépendants de Y et détaillés dans le tableau I
K: produit des termes correctifs indépendants de Y et détaillés dans letableau II.
Certains des termes correctifs sont essentiellement dépendants de la géométrie d’irradiation (distance source-détecteur) et de la nature de la source (énergie, source ponctuelle ou étendue).
Dans les tableaux I et II sont présentées, à titre d’exemple, les valeurs de ces termes correctifs ainsi que leurs incertitudes pour les conditions d’expérience suivantes:
— chambre à cavité variablediamètre de l’électrode de collection épaisseur de la paroi frontale champ électrique
— sourceradioélément 90Sr + 90Ytype SRSB 2fabricant CEA/DRépaisseur de la protection (acier inoxydable) 0,015 cmdiamètre du dépôt actif 1,42 cmdistance sourceTchambre 20 cm
Pour ces mêmes conditions, une intercomparaison a été organisée avec le Laboratoire de métrologie des rayonnements ionisants. Les résultats sont en bon accord (1,5%).
2,44 cm 0,83 mg'cmf2 120 V-cnT1
IAEA-SM -222/3? 517
En utilisant une combinaison quadratique des erreurs systématiques et aléatoires sur les différents termes des équations (1) et (2), Dt peut être déterminé avec une incertitude de l’ordre de 4% pour une probabilité de 95%.
Il faut cependant remarquer qu’il n’est possible d’atteindre de tels résultats que lorsque ce détecteur remplit les conditions de Bragg-Gray, c’est-à-dire lorsque la fluence des électrons est homogène dans tout le volume sensible du détecteur. Dans ce cas, le terme correctif de défaut d’homogénéité de fluence est voisin de 1. Nous déterminons alors une distance source-détecteur minimale (xmjn) telle que cette condition soit satisfaite en se fixant comme limite 1 < < 1,05.
Lorsque x est inférieur à xmin, peut atteindre des valeurs d’autant plus importantes que l’énergie des particules ¡3 est faible et que leur fluence est perturbée par l’atténuation dans les différents écrans. Dans ce cas, la chambre à cavité variable ne peut plus être vraiment considérée comme détecteur de référence, puisque l’ information qu’elle fournit est la dose absorbée moyenne dans le volume sensible.
Nous allons exposer les méthodes de calcul de pour les deux casconsidérés ( 1 < Kdh < 1,05, Kdh > 1,05).
4. TERME CORRECTIF DE DEFAUT D’HOMOGENEITE DE FLUENCEKdh t5]
Soit une source ponctuelle d’activité A située à une distance x de la paroi frontale de la chambre. R est le rayon de l’électrode de collection et Y la distance interélectrodes.
La chambre à cavité variable n’a pas des dimensions radiales assez petites pour remplir parfaitement les conditions de cavité idéale. Le terme correctif de défaut d’homogénéité de fluence permet de corriger le courant moyen mesuré i* pour obtenir le courant i0 qui serait recueilli avec un détecteur ponctuel idéal.
Kdh est composé de deux termes, Ka et Kr.
io $0Kdh= Ka-Kr= - = — an а r j* ф
Ka: correction de défaut d’homogénéité axiale de fluence
Kj! correction de défaut d’homogénéité radiale de fluence
Ф0 : fluence des particules sur l’axe du faisceau dans un détecteur idéal après traversée de la paroi frontale
Ф: fluence moyenne dans la cavité de rayon R et d’épaisseur Y.
Deux cas seront considérés: x > xmin; x < xmin.
518 GIROUX et al.
4.1. x > x m jn
Soit Фа la fluence moyenne axiale dans la cavité d’épaisseur Y
4.1.1. Défaut d ’homogénéité axiale
En admettant une variation de fluence selon la loi de l’ inverse carré de la distance
4.1.2. Défaut d ’homogénéité radiale
Considérons maintenant la variation de fluence dans la section droite S du détecteur, située dans le plan médian, soit à (x + Y/2) de la source en tenant compte d’une atténuation exponentielle des particules j3 dans les différents écrans (paroi frontale; protection de source; distance d’air source-détecteur).
Y
0
(6)
YKa= 1 + -
x
b= 2 /Zjdj
/ij= coefficient d’atténuation de l’écran i
dj= épaisseur orthogonale de l’écran i.
La fluence Фг au rayon r (0 < r < R) est donnée par:
La fluence moyenne sur la section droite est:
IAEA-SM-222/38 5 1 9
4 //=г I I S * rdS
__ A f r „ф = -------- i ---------— --- ----- — ¿j-2ttR2 J x2 + r2
R i - b v ^ + 7exp
0
En posant t= — Vx2 + r2 x
!,(»>= / f dt
u
ф е = - А - | е , (Ь )- е \/x2 + R2̂
(R /x)2e_bKr = -------------- ■■■■■■ (7)
2[E 1( b ) - E 1(b V l + (R2/x2))]
Quand l’atténuation des particules j3 dans les écrans est négligeable,
K ,= (8)Lñ[\ + R 2/x2)]
La résolution des équations (7) et (8) pour Kr < 1,05 permet de déterminer la valeur xmin. Pour les radioéléments l47Pm, 2<MT1 et 90Y, ceci conduit à (x/R) > 6.
Pour notre détecteur, la plus petite électrode ayant un rayon de 0,6 cm, xmin est donc de l’ordre de 4 cm.
4.2. x < x min
Pour de telles géométries, le gradient de dose dans la chambre devient important, surtout pour des particules ¡5 de faible énergie pour lesquelles l’obliquité des trajets dans la paroi frontale devient primordiale.
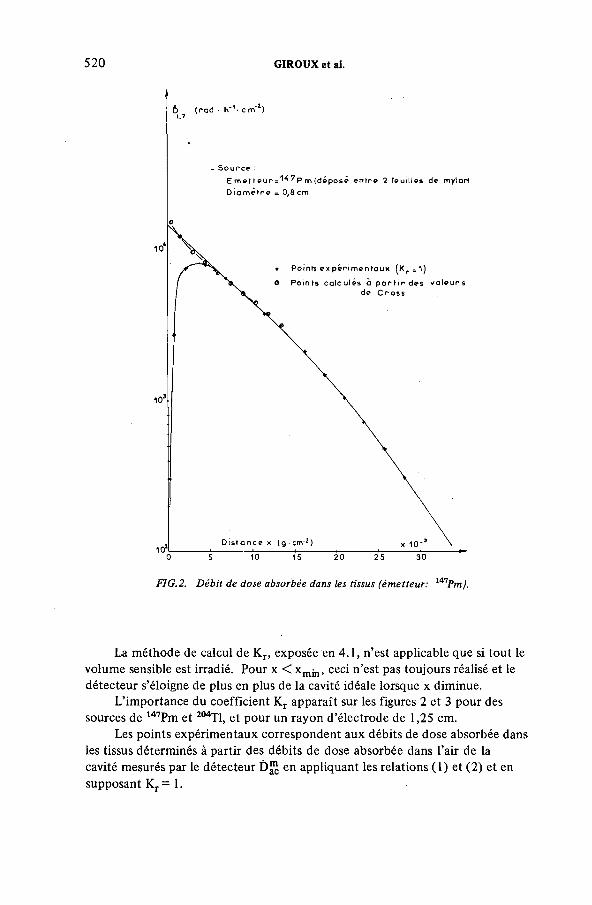
520 GIROUX et al.
La méthode de calcul de Kr, exposée en 4.1, n’est applicable que si tout le volume sensible est irradié. Pour x < xmin, ceci n’est pas toujours réalisé et le détecteur s’éloigne de plus en plus de la cavité idéale lorsque x diminue.
L’importance du coefficient Kr apparaît sur les figures 2 et 3 pour des sources de 147Pm et 204T1, et pour un rayon d’électrode de 1,25 cm.
Les points expérimentaux correspondent aux débits de dose absorbée dans les tissus déterminés à partir des débits de dose absorbée dans l’air de la cavité mesurés par le détecteur D™ en appliquant les relations ( 1) et (2) et en supposant Kr = 1.
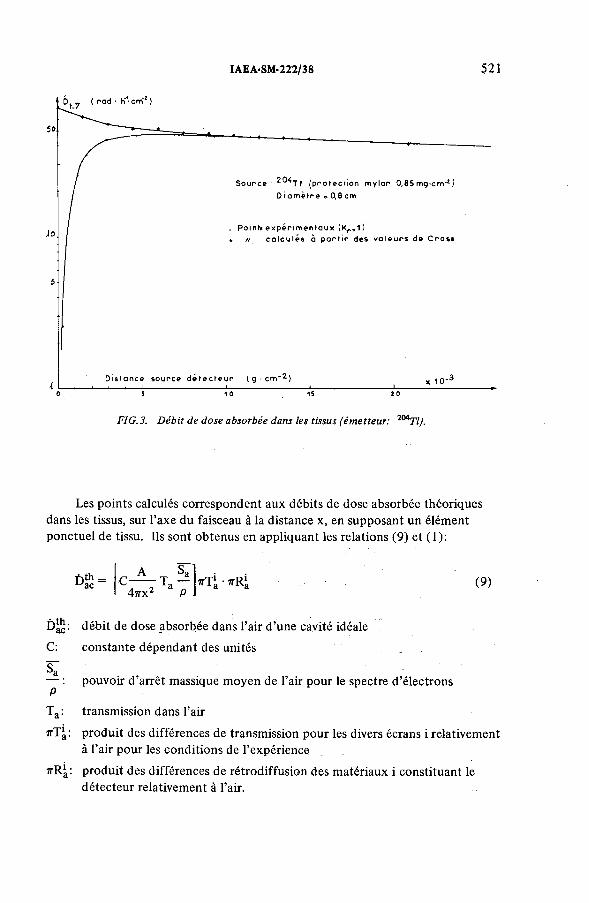
IAEA-SM-222/38 5 2 1
FIG.3. Débit de dose absorbée dans les tissus (émetteur: 2MTl).
Les points calculés correspondent aux débits de dose absorbée théoriques dans les tissus, sur l’axe du faisceau à la distance x, en supposant un élément ponctuel de tissu. Ils sont obtenus en appliquant les relations (9) et (1):
nth.DA Sa
c ------- Ta —47ГХ2 P
тгТ'а • irRi (9)
D^: débit de dose absorbée dans l’air d’une cavité idéale C: constante dépendant des unités
V— : pouvoir d’arrêt massique moyen de l’air pour le spectre d’électronsP
Ta: transmission dans l’airirTa: produit des différences de transmission pour les divers écrans i relativement
à l’air pour les conditions de l’expérience7rRa: produit des différences de rétrodiffusion des matériaux i constituant le
détecteur relativement à l’air.
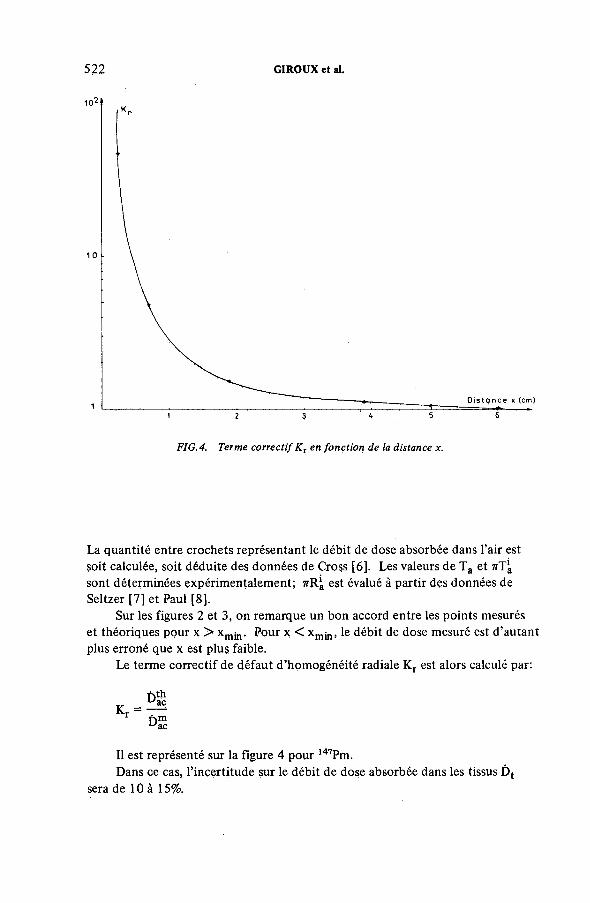
522 GIROUX et al.
FIG.4. Terme correctif K T en fonction de la distance x.
La quantité entre crochets représentant le débit de dose absorbée dans l’air est soit calculée, soit déduite des données de Cross [6]. Les valeurs de Ta et sont déterminées expérimentalement; 7rRa est évalué à partir des données de Seltzer [7] et Paul [8].
Sur les figures 2 et 3, on remarque un bon accord entre les points mesurés et théoriques pour x > хт щ. Pour x < xmjn, le débit de dose mesuré est d’autant plus erroné que x est plus faible.
Le terme correctif de défaut d’homogénéité radiale Kr est alors calculé par:
Il est représenté sur la figure 4 pour 147Pm.Dans ce cas, l’incertitude sur le débit de dose absorbée dans les tissus Dt
sera de 10 à 15%.
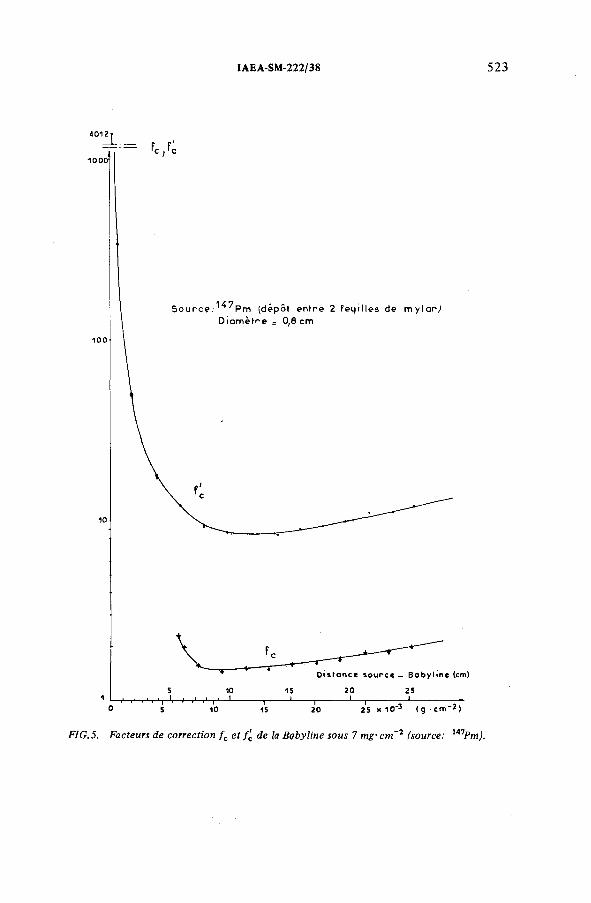
IAEA-SM-222/38
4 0 1 2 j
1000P f' rc / c
S o u r c e .^ ^ P m (dépôt e n tre 2 Fégilles de m y la r,* D ia m è tre s 0,8 cm
_ l _
D i s t a n c e s o u r c e - B o b y l m e (cm)
2 0 2S
0 S 10 15 2 0 25 X 1 0 ‘ 3 ( g c m " 2 )
F I G .5. F a c te u r s d e c o r r e c tio n /c e t f'c d e la B a b y lin e s o u s 7 m g• cm ~ 2 (s o u r c e : ÏAnP m ).
_i— 20
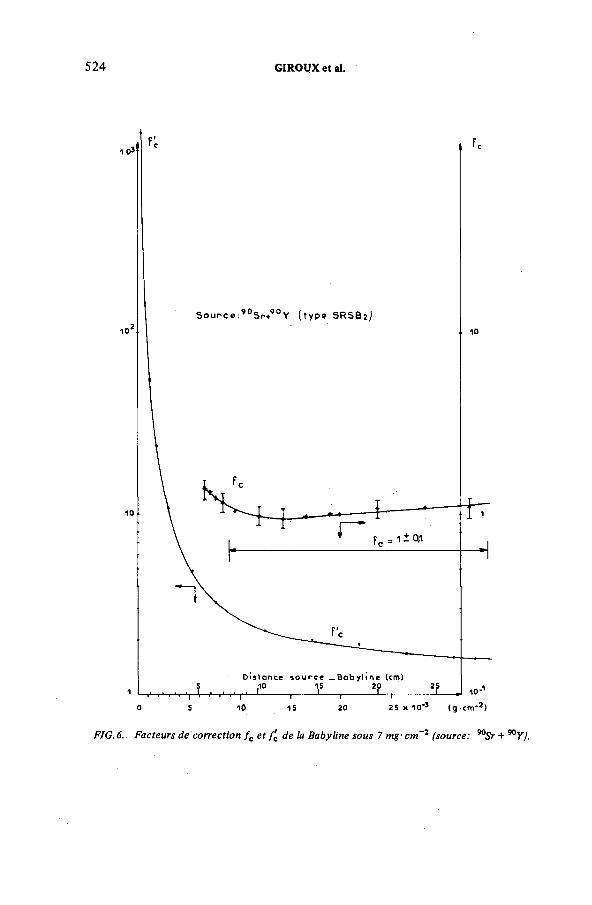
524 GIROUX et al.
F I G .6 . F a c te u r s d e c o r r e c tio n f c e t f'c d e la B a b y lin e s o u s 7 m g ■ cm 2 (so u r c e : 90S r +
IAEA-SM-222/38 525
5. ETUDE DE LA REPONSE D’UN INSTRUMENT DE RADIOPROTECTION
Dt étant déterminé en fonction de x, nous avons étudié la réponse d’un instrument de radioprotection /3, 7 du type Babyline 20 pour des sources ponctuelles de 147Pm, 204T1, et 90Sr 4- 90Y.
La partie détectrice de cet instrument est équipée d’une paroi de 7 mg'cm-2 pour la mesure des électrons et d’un capuchon supplémentaire de 300 mg cm-2 pour les photons.
Les facteurs de correction fc et fc' sont définis par:
, Dose absorbée dans les tissus sous 7 mg'cm-2fc ou fc ---------------------------------------------------------------------------—
Dose absorbée mesurée par l’appareil sous 7 mg'cm
fc : si l’on considère le centre géométrique du volume sensible comme pointde mesure
f¿: si l’on considère le centre de la face avant du volume sensible comme pointde mesure.
Pour la Babyline 20, le volume sensible est constitué par une chambre d’ionisation cylindrique de 11 cm de longueur. Le centre géométrique et le centre de la face avant sont donc distants de 5,5 cm. Les figures 5 et 6 montrent que les valeurs de fc et f¿ sont très différentes et mettent en évidence l’importance du choix du point de référence de l’appareil.
D’autre part, le facteur de correction, variable avec la distance x et l’énergie des particules /3, atteint des valeurs importantes (10 à 1000) pour les faibles distances x dans le cas où l’on considère la face avant comme point de mesure.
6. CONCLUSION
Au moyen de la chambre à cavité variable, là dose absorbée dans les tissus à la profondeur de 7 mg'cm-2 délivrée par des sources |3 ponctuelles peut être • estimée avec une incertitude d’environ 4% pour certainés conditions d’irradiation: distance source-détecteur x supérieure à 4 cm pour un diamètre d’électrode collectrice de 1,2 cm. Pour des conditions géométriques où la relation de Bragg-Gray n’est plus respectée, l’incertitude atteint 15%.
Nous avons déterminé les distributions de dose en fonction de x afin d’étudier la réponse des instruments de radioprotection pour des sources ponctuelles.
En ce qui concerne les sources /3 étendues, l’établissement d’un procédé d’intégration à partir de sources ponctuelles a permis de déterminer les distributions de dose absorbée sous 7 mg'cm-2 [5] et nous conduira à compléter l’étude de la réponse des instruments de radioprotection.

526 GIROUX et al.
REFERENCES
[1 ] COMMISSION INTERNATIONALE DE PROTECTION RADIOLOGIQUE, Publication 9, Pergamon Press ( 1965).
[2] JOFFRE, H., BETCHEN, G., Chambre d’ionisation, Brevet d’invention n° P.V 92 9856 du 29 mars 1963.
[3] ROULET, R., Etude et réalisation d’une chaîne électrométrique pour la mesure automatique de courants continus faibles issus de chambres d’ionisation étalons, Thèse de l’Université scientifique et médicale de Grenoble (1973).
[4] GIROUX, J., Mesures ionométriques avec une chambre à extrapolation de la dose absorbée délivrée par les émetteurs |3, VIIIe Congrès international de la Société française de radioprotection, Saclay, 23 au 26 mars 1976.
[5] GIROUX, J., Thèse à paraître.[6] CROSS, W.G., Tables of beta dose distributions, AECL 2793 (1967).[7] SELTZER, S.M., Transmission of electrons through foils, NBS-COM. 74.11792 (1974).[8] PAUL, W., KNOP, G., Alpha, Beta and Gamma Ray Spectroscopy (SIEGBAHN, K., Ed.)
1, North Holland, Amsterdam (1965).
DISCUSSION
J.-P. GUIHO: Do you hope to derive information from your exoelectron experiments that will be useful in developing a radiation protection dose meter more suitable for measuring beta doses?
A. HADDAD: Yes, the results of our experiments lead us to expect that we will.
I.M.G. THOMPSON: The beta sources used for your measurements have a small diameter (0.8 cm). You have corrected the extrapolation chamber for horizontal variations in dose rate; have you also corrected the Babyline results for this variation, since the Babyline’s cross-sectional area is even larger than that o f the extrapolation chamber?
A. HADDAD: We studied the horizontal variations with our chamber in order to deduce the dose rate from large plane beta sources, and the results obtained will be used to correct the Babyline response in this case.
IAEA-SM-222/50
ACCURACY AND PRECISION IN CALIBRATION OF LOW-LEVEL RADIATION MONITORS
J.G. ACKERSNetherlands Energy Research Foundation (ECN),Petten,The Netherlands
Abstract
ACCURACY AND PRECISION IN CALIBRATION OF LOW-LEVEL RADIATION MONITORS.
The calibration of simple, portable, low-level radiation monitors with emphasis upon systematic error evaluation o f the instrument indication in various radiation fields should only be a part of the work o f a secondary standard dosimetry laboratory. Such a laboratory should also evaluate the precision of the instrument over the total range. In field use, readings from portable gamma exposure-rate meters are frequently used as a basis for decision making. In many cases the user is not aware o f the magnitude of the statistical error in his reading. This will easily lead to wrong conclusions being drawn regarding the accuracy o f the measurements. The calibration laboratory should supply data to make reasonable setting of confidence levels possible. The role of variability in the meter indication, using the results of basic statistics, is pointed out. A simple procedure for estimating the precision o f instrument readings for the case where the reading is taken from a pointer indication on a meter with a scale is proposed. Experimental results are given to illustrate the evaluation.
1. INTRODUCTION
Part o f the task of a secondary standard dosimetry laboratory is to calibrate low-level gamma radiation monitors for field use. Many o f these instruments are portable, battery-operated, exposure-rate meters, with readings taken from a pointer indication on a scale calibrated in цК/h to mR/h.
Using such an instrument, the observer reads a “ mean value” , determined from the oscillations of a moving pointer. His reading has a statistical reliability, the numerical value o f which many observers are not completely aware of. If a guess is made concerning the accuracy of the estimated reading, the observer often has no correct information on which to base his findings.
It should be the task o f the calibration laboratory, not only to evaluate suitable correction factors for the indicated mean value, but also to supply sets o f values from which the standard error o f the mean can be calculated.
527
528 ACKERS
In field use, having an estimate of the statistical error o f a reading is not always o f great importance; in checking the magnitude o f a gamma field relative to a preset upper limit (mostly a few mR/h), in cases where the difference is well on the safe side, exact estimates o f error are of minor importance.
The statistical error o f a reading is, however, important if the readings are to be used as a basis for decision making, e.g. in radioactive waste management — when judgement for permission to transport has to be made.
To estimate the error, a measure o f the precision of the indication is required. The evaluation of the precision by the calibrating laboratory should not be too time consuming and should be made without resorting to a detailed analysis of the electronic design of the instrument and without the experimental interference involved when external data recorders are connected.
In §2, the investigation of the precision as part of the normal procedure for calibration o f accuracy is discussed.
2. PRECISION IN RESPONSE OF A PORTABLE, LOW-LEVEL, GAMMA EXPOSURE-RATE METER
The position o f the pointer on the scale o f the indicating meter is the sum of the following responses o f the instrument :(a) a spurious response not originating from the external radiation fields; this
may cause an average indication o f 1 or 2 tiR/h and is believed to be of a stochastic nature and independent o f the presence of external radiation;
(b) a response caused by natural environmental radiation, i.e. terrestrial and cosmic radiation. This is dependent on geographical location and is affected by the presence of normal building construction materials. In the Netherlands these exposure rates are around \0 nR/h;
(c) a response due to radiation by artificial exposure, e.g. resulting from the presence o f calibration sources.The total response shows statistical fluctuations owing to the discrete nature
of radiation, influenced by the electronic design of the instrument. The response is a continuous indication of values which may be characterized by a mean value and a standard deviation.
Theoretically, the size o f the fluctuations is in inverse proportion to the square root of the number o f events taking place.
A method o f calculating the mean value and the standard deviation involves taking a sample of the continuous indication by reading every five seconds, exactly, the position o f the oscillating pointer, regardless o f the direction and speed o f its movement.
By doing this for about three minutes, a reliable sample (n observations) of the statistically distributed positions o f the pointer is obtained.
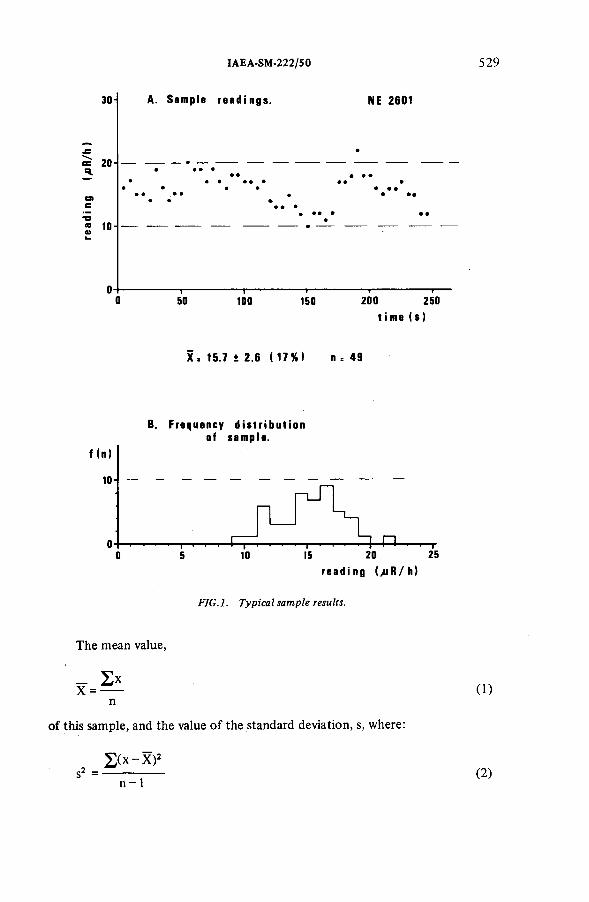
IAEA-SM-222/50
30- A. Sample r ea di ngs . NE 2601
529
20- • • •• •
« 10-
- 1— 50
—i— 100
1 ■ 150 200 250
time (s)
X* 15.7 i 2.6 ( 17S) n = 49
B. Frequency distribution of sample.
FIG. 1. Typical sample results.
The mean value,
n
of this sample, and the value o f the standard deviation, s, where:
£ ( x - X )2S2 = — ----- :-----n - 1
( 1)
(2)
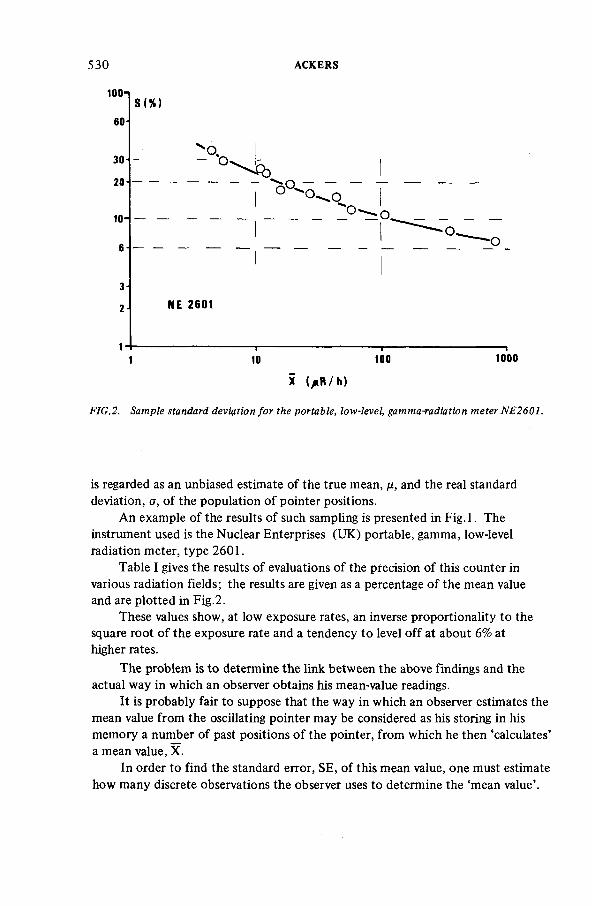
5 3 0 ACKERS
X ( / iR /h)
F I G .2. S a m p le sta n d a rd d e v ia tio n f o r th e p o r ta b le , lo w -le v e l, g a m m a-rad ia tion m e te r N E 2 6 0 1 .
is regarded as an unbiased estimate of the true mean, ¡л, and the real standard deviation, a, of the population o f pointer positions.
An example of the results of such sampling is presented in Fig.l. The instrument used is the Nuclear Enterprises (UK) portable, gamma, low-level radiation meter, type 2601.
Table I gives the results of evaluations of the precision of this counter in various radiation fields; the results are given as a percentage o f the mean value and are plotted in Fig.2.
These values show, at low exposure rates, an inverse proportionality to the square root o f the exposure rate and a tendency to level off at about 6% at higher rates.
The problem is to determine the link between the above findings and the actual way in which an observer obtains his mean-value readings.
It is probably fair to suppose that the way in which an observer estimates the mean value from the oscillating pointer may be considered as his storing in his memory a number of past positions o f the pointer, from which he then ‘calculates’ a mean value, X.
In order to find the standard error, SE, of this mean value, one must estimate how many discrete observations the observer uses to determine the ‘mean value’ .
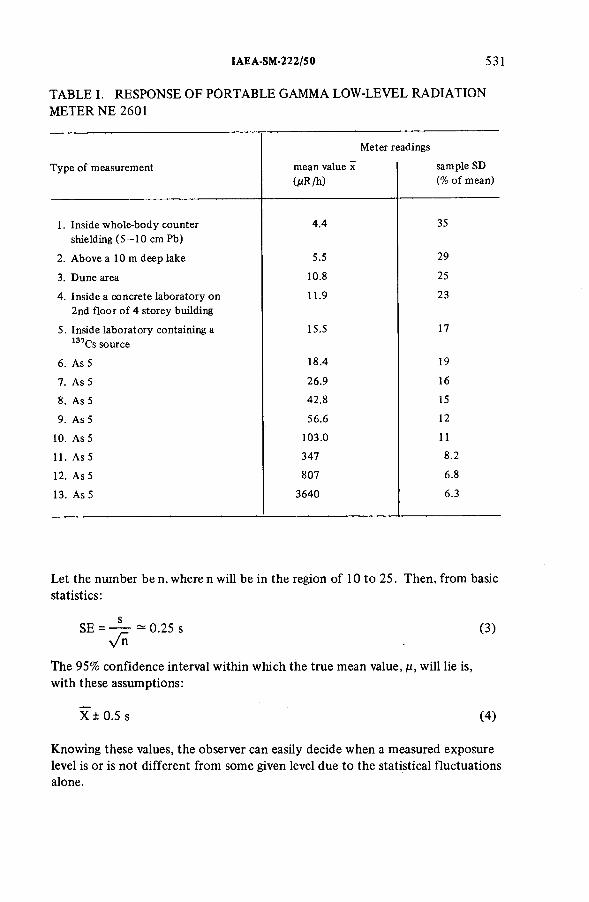
IAE A-SM-222/50 531
TABLE I. RESPONSE OF PORTABLE GAMMA LOW-LEVEL RADIATION METER NE 2601
Meter readings
Type of measurement mean value x (MR/h)
sample SD (% o f mean)
1. Inside whole-body counter shielding (5 -1 0 cm Pb)
4.4 35
2. Above a 10 m deep lake 5.5 29
3. Dune area 10.8 25
4. Inside a concrete laboratory on 2nd floor o f 4 storey building
11.9 23
5. Inside laboratory containing a 137Cs source
15.5 17
6. As 5 18.4 19
7. As 5 26.9 16
8. As 5 42.8 15
9. As 5 56.6 12
10. As 5 103.0 11
11. As 5 347 8.2
12. As 5 807 6.8
13. As 5 3640 6.3
Let the number be n, where n will be in the region of 10 to 25. Then, from basic statistics:
SE = — 0.25 s (3)y/n
The 95% confidence interval within which the true mean value, fi, will lie is, with these assumptions:
X ± 0.5 s (4)
Knowing these values, the observer can easily decide when a measured exposure level is or is not different from some given level due to the statistical fluctuations alone.
532 ACKERS
The same is true for the calibration laboratory assistant: if the mean value estimated from the instrument lies within the given confidence interval around the value dictated by the calibration field, no correction factor should be proposed.
It is suggested that the secondary standard dosimetry laboratory should provide a graph similar to that in Fig.2 with each calibrated instrument for field use. At least two points should be checked regularly, the background level and the mid-scale reading.
3. CONCLUSION
There exists a reliable and relatively simple method for a calibrating laboratory to provide, together with accuracy factors, a set of values describing the precision of those instruments which indicate exposure rates by means of a pointer indication on a scale.
Knowledge of the precision gives the user the possibility of setting confidence levels for his readings, and it will greatly diminish the number o f cases o f misinterpretation o f the response o f such an instrument.
CHAIRMEN AND CO-CHAIRMEN OF SESSIONS
Session I
Session II
Session III
Session IV
Session V
Session VI
Session VII
Session VIII
Session IX
Session X
J.A. AUXIER K. ZSDÁNSZKY
I.S. SUNDARARAO K.E. DUFTSCHMID
H. REICH
R. LOEVINGERI.M.G. THOMPSON
J.-P. GUIHO J.E. McLAUGHLIN
H.O. WYCKOFF
H. SVENSSON
W.A. JENNINGS A.O. FREGENE
Z. REFEROWSKY
M .OBERHOFER
J.J. BROERSE Y. MORIUCHI
A. BROSED SERRETA R. ABEDINZADEH
United States o f America Hungary
IndiaAustria
Federal Republic o f Germany
United States o f America United Kingdom
FranceUnited States o f America
International Commission on Radiation Units and
' Measurements, and International Commission on
Radiological Protection Sweden
United Kingdom Nigeria
International Organization o f Legal Metrology
Commission o f the European Communities
The Netherlands Japan
SpainIran
533
SECRETARIAT OF THE SYMPOSIUM
ScientificSecretary:
AdministrativeSecretary:
Editor:
Records Officer:
Liaison Officer, United States Government:
H.H. EISENLOHR
R. NAJAR
E.R.A. BECK
M. READING
J.H. KANE
Division o f Life Sciences, IAEA
Division o f External Relations, IAEA
Division o f Publications,IAEA
Division of Languages,IAEA
United States Department o f Energy
United States Scientific Advisers:
J.A. AUXIER R. LOEVINGER
Oak Ridge National Laboratory National Bureau o f Standards
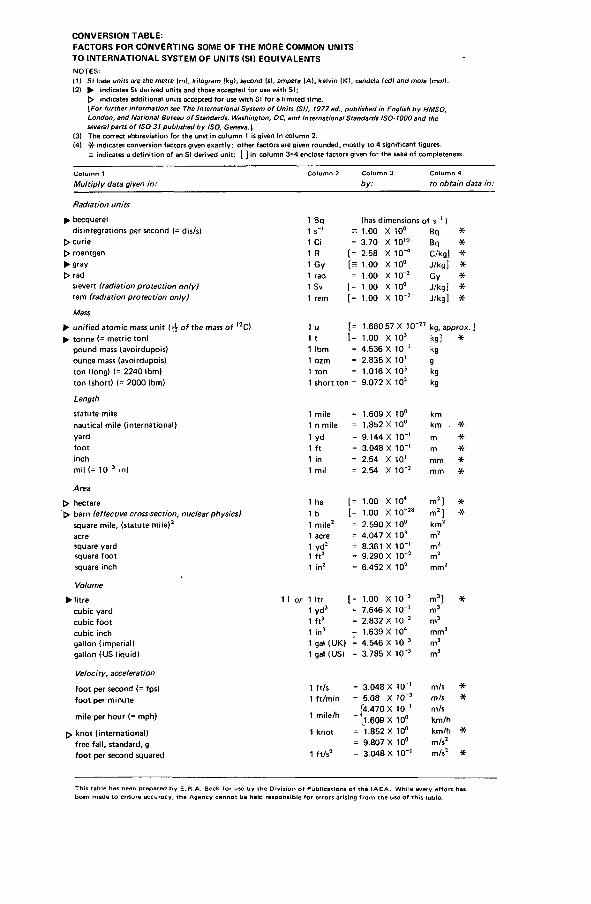
CONVERSION TABLE:FACTORS FOR CONVERTING SOME OF THE MORE COMMON UNITS TO INTERNATIONAL SYSTEM OF UNITS (SI) EQUIVALENTSNOTES:(1Í Si base units are the metre (m), kilogram (kg), second Is), ampere IA), kelvin (К), candela lcd) and mole (mol).(2) ► indicates Si derived units and those accepted for use with SI;
> indicates additional units accepted for use with SI for a limited time.\For further information see The International System of Units (SI), 1977 ed., published in English by HMSO, London, and National Bureau of Standards, Washington, DC, and International Standards ISO-IOOO and the several parts of ISO-31 published by ISO, Geneva. |(3) The correct abbreviation for the unit in column 1 is given in column 2.
(4) -X- indicates conversion factors given exactly; other factors are given rounded, mostly to 4 significant figures.= indicates a definition of an SI derived unit: ( ] in column 3+4 enclose factors given for the sake of completeness.
Column 1M ultiply data given in:
Column 2 Column 3by:
Column 4to obtain data in:
Radiation units
^ becquerel 1 Bq (has d im ens ions o f s~‘ )d is in te g ra tion s per second (= d is/s) 1 s'"1 = 1 .00 X 10° Bq *
> cu rie 1 Ci = 3 .7 0 X 1 0 '° Bq *> roentgen 1 R = 2 .58 X 1 0 -4 C /kg ] *► gray 1 G y = 1 .00 X 10° J /k g ] *> rad 1 rad = 1 .00 X 10“ 2 G y *
sievert (radiation protection only) 1 Sv = 1 .00 X 10° J /k g ] *rem (radiation protection only) 1 rem = 1 .00 X 10 -2 J /k g ] *
Mass
► u n if ie d a to m ic mass u n i t o f th e mass o f l2C) 1 u = 1 .6 6 0 5 7 X 10“ 27 kg, approx. ]^ ton n e (= m e tr ic ton ) 1 t = 1 .00 X 103 kg ] *
p ou nd mass (avo irdupo is ) 1 Ibm = 4 .5 3 6 X 1 0 _1 kgounce mass (avo irdupo is ) 1 ozm = 2 .8 3 5 X 1 0 1 gto n (long) (= 2 24 0 Ibm ) 1 to n = 1 .016 X 103 kgto n (sh o rt) (= 2 00 0 Ibm ) 1 sh o rt to n = 9 .0 7 2 X 10² kg
Length
s ta tu te m ile 1 m ile = 1 .609 X 10° kmnau tica l m ile ( in te rn a tio n a l) 1 n m ile = 1 .852 X 10° km *
ya rd 1 yd = 9 .1 4 4 X 10 _1 m *fo o t 1 f t = 3 .0 4 8 X 1 0 “ ‘ m *inch 1 in = 2 .54 X 10 1 m m *m il (= 10 -3 in) 1 m il = 2 .54 X 1 0 -2 m m *
Area
> hectare 1 ha = 1 .00 X 10" m 2 ] *
> barn (effective cross-section, nuclear physics) 1 b = 1 .00 X 1 0 “ 28 m 2 ] *
square m ile , (s ta tu te m ile )2 1 m ile 2 = 2 .5 9 0 X 10° k m 2
acre 1 acre = 4 .0 4 7 X 10³ m 2square ya rd 1 y d 3 = 8.361 X 10 _1 m 2square fo o t 1 f t 2 = 9 .2 9 0 X 10~2 m 2square inch 1 in 2 = 6 .4 5 2 X 10² m m 2
Volume
► lit re 1 1 o r 1 I t r = 1.00 X 1 0 -3 m 3] *
cu b ic ya rd ̂ y d 3 = 7 .6 4 6 X 1 0 _1 m 3
c u b ic fo o t 1 f t 3 = 2 .8 3 2 X 10⁻² m 3
c u b ic inch 1 in 3 = 1 .639 X 104 m m 3g a llon (im p e ria l) 1 gal (U K ) = 4 .5 4 6 X 10 -3 m 3g a llon (U S liq u id ) 1 gal (US) = 3 .7 8 5 X 1 0 "3 m 3
Velocity, acceleration
fo o t per second (= fps) 1 f t /s = 3 .0 4 8 X 10 “ ‘ m /s *
fo o t per m in u te 1 f t /m in = 5 .0 8 X 10“ 3 m /s *
Í4 .470 X 10 “ ‘ m /sm ile per h o u r (= m ph) 1 m ile /h
[1 .609 X 10° k m /h
k n o t ( in te rn a tio n a l) 1 k n o t = 1 .852 X 10° k m /h *
free fa l l, s tandard, g = 9 .8 0 7 X 10° m /s2
fo o t per second squared 1 f t /s 2 = 3 .0 4 8 X 1 0 '1 m /s2 *
This table has been prepared by E.R.A. Beck for use by the Division o f Publications o f the IAEA. While every e ffort has been made to ensure accuracy, the Agency cannot be held responsible fo r errors arising from the use o f this table.
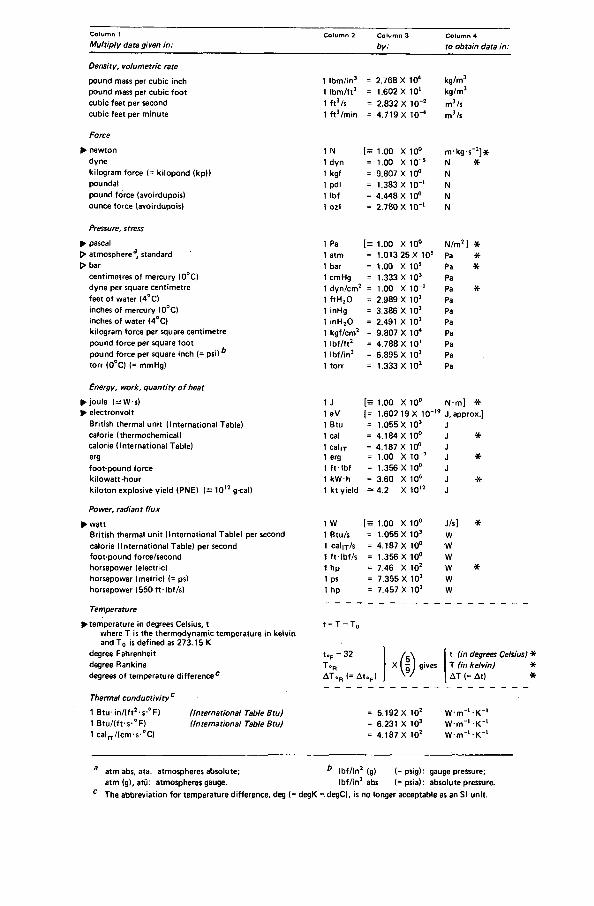
Column 1M ultiply data given in:
Column 2 Column 3 Column 4by: to obtain data in:
Density, volumetric rate
p ou nd mass per c u b ic inch 1 lb m / in 3 = 2 .7 6 8 X 10⁴ k g /m 3
pou nd mass per c u b ic fo o t 1 lb m / f t 3 = 1 .602 X 10 1 k g /m 3cu b ic fee t p e r second 1 f t 3/s = 2 .8 3 2 X 1 0 “ 2 m 3/scu b ic fe e t per m in u te 1 f t 3/m in = 4 .7 1 9 X 10⁻⁴ m 3/s
Force
^ new to n 1 N [ s 1 .00 X 10° m - k g s " 2] ^dyne 1 d y n = 1 .00 X 10~5 N *k ilo g ra m fo rce ( - k ilo p o n d <kp)> 1 kg f = 9 .8 0 7 X 10° Npounda l 1 pdl = 1 .383 X 10 “ l Np ou nd fo rce (avo irdupo is ) 1 Ib f = 4 .4 4 8 X 10° Nounce fo rc e (a vo ird up o is ) 1 o z f = 2 .7 8 0 X 1 0 "1 N
Pressure, stress
^ pascal 1 Pa [ = 1 .00 X 10° N /m 2 ] *> a tm osphere a, standard 1 a tm = 1 .013 25 X 10 s; Pa *> bar 1 bar = 1 .00 X 10s Pa *
ce n tim etre s o f m e rcu ry (0 °C ) 1 cm H g = 1.333 X 10³ Pad yne per square ce n tim e tre 1 d y n /c m 2 = 1.00 X 10 _1 Pa *fee t o f w a te r (4 °C ) 1 f t H 20 = 2 .9 8 9 X 10³ Painches o f m e rc u ry (0°C ) 1 inHg = 3 .3 8 6 X 10³ Painches o f w a te r (4 °C ) 1 in H 20 = 2.491 X 10² Pak ilo g ra m fo rce per square c e n tim e tre 1 k g f/c m 2 = 9 .8 0 7 X 10⁴ Pap o u n d fo rc e per square fo o t 1 lb f / f t 2 = 4 .7 8 8 X 10 ' Pap ou nd fo rce per square in ch (= psi) ^ 1 Ib f / in 2 = 6 .8 9 5 X 10³ Pato r r (0 °C ) (= m m H g) 1 to r r = 1 .333 X 102 Pa
Energy, work, quantity o f heat
^ jo u le (= W -s) 1 J [ = 1 .00 X 10° N -m ] *► e le c tro n v o lt 1 eV [= 1 .602 19 X 1 0 ' 19 J, app ro x .]
B r it is h th e rm a l u n it (In te rn a tio n a l Table) 1 B tu = 1 .055 X 103 Jca lo r ie (th e rm o che m ica l) 1 cal = 4 .1 8 4 X 10° J *ca lo r ie ( In te rn a tio n a l Table) 1 cal и = 4 .1 8 7 X 10° Jerg 1 erg = 1 .00 X 10-7 J *
fo o t-p o u n d fo rce 1 f t - I b f = 1 .356 X 10° Jk ilo w a tt-h o u r 1 k W h = 3 .6 0 X 106 J *k ilo to n exp los ive y ie ld (P N E ) (= 10 12 g*cal) 1 k t y ie ld — 4 .2 X 1 0 '2 J
Power, radiant flux
► w a tt 1 W [ = 1 .00 X 10° J /s ] *B rit is h th e rm a l u n it ( In te rn a tio n a l T ab le ) per second 1 B tu /s = 1 .055 X 103 Wca lo r ie (In te rn a tio n a l T ab le ) per second 1 c a l| j /s = 4 .1 8 7 X 10° Wfo o t-p o u n d force /second 1 f t - Ib f /s = 1 .356 X 10° Whorsepow er (e lec tric ) 1 hp = 7 .46 X 102 W *
h orsepow er (m e tr ic ) (= ps) 1 ps = 7 .3 5 5 X 10² Whorsepow er (5 5 0 f t* Ib f /s ) 1 hp = 7 .457 X 102 wTemperature
► tem pe ra tu re in degrees Celsius, t t = T - T 0w here T is th e th e rm o d y n a m ic tem pe ra tu re in ke lv in and To is d e fin ed as 2 7 3 .1 5 К
degree F a hren he it to F - 32 / \ t (in degrees Celsius) *degree R ankine ToR xir) gives T (in kelvin) *degrees o f tem pe ra tu re d if fe re n c e c A T o R <= A to F ) ' ' Д Т (= A t) *
Thermal conductivity0
1 B tu - in / ( f t 2 -s -°F ) (International Table Btu) = 5 .1 9 2 X 10² W *m -1 - K " 11 B tu / ( f f s - ° F ) (International Table Btu) = 6 .231 X 103 W -m "1 - K _11 c a lry / lc n r rs ^ C ) = 4 .1 8 7 X 10² W -m - l - K _1
8 a tm abs, a ta : a tm ospheres abso lu te ; ^ Ib f / in 2 (g) (= p $ ig ): gauge pressure;a tm (g), atü: a tm ospheres gauge. Ib f / in 2 abs (= p $ ia ): abso lu te pressure.
c T h e a b b re v ia tio n fo r tem pe ra tu re d iffe re n ce , deg (= degK =. degC), is no longe r acceptab le as an SI u n it.
H O W TO ORDER IAEA PUBLICATIONS
Ц I A n e x c l u s i v e s a le s a g e n t f o r I A E A p u b l i c a t i o n s , t o w h o m a l l o r d e r s
a n d i n q u i r i e s s h o u l d b e a d d r e s s e d , h a s b e e n a p p o i n t e d
i n t h e f o l l o w i n g c o u n t r y :
U N IT E D S T A T E S O F A M E R IC A U N IP U B , P .O . B o x 4 3 3 , M u r r a y H i l l S ta t io n , N e w Y o r k , N .Y . 1 0 0 1 6
H ■ I n t h e f o l l o w i n g c o u n t r i e s I A E A p u b l i c a t i o n s m a y b e p u r c h a s e d f r o m t h e
s a le s a g e n t s o r b o o k s e l l e r s l i s t e d o r t h r o u g h y o u r
m a j o r l o c a l b o o k s e l l e r s . P a y m e n t c a n b e m a d e i n l o c a l
c u r r e n c y o r w i t h U N E S C O c o u p o n s .
A R G E N T IN A C o m is ió n N a c io n a l d e E n e rg ía A tó m ic a , A v e n id a d e l L ib e r ta d o r 8 2 5 0 , B u e n o s A ire s
A U S T R A L I A H u n te r P u b lic a t io n s , 5 8 A G ip p s S tr e e t , C o l l in g w o o d , V ic t o r ia 3 0 6 6B E L G IU M S e rv ic e d u C o u r r ie r d e l 'U N E S C O , 1 1 2 , R u e d u T rô n e , B -1 0 5 0 B ru s s e ls
C .S .S .R . S .N .T .L . , S p á le n á 5 1 , C S -1 13 0 2 P ra g u e 1A l f a , P u b lis h e rs , H u rb a n o v o n â m e s tie 6 , C S -8 9 3 31 B ra tis la v a
F R A N C E O f f ic e In te r n a t io n a l d e D o c u m e n ta t io n e t L ib r a i r ie , 4 8 , ru e G a y -L u s s a c , F -7 5 2 4 0 P a r is C e d e x 0 5 .
H U N G A R Y K u l tu r a , B o o k im p o r t , P .O . B o x 1 4 9 , H - 1 3 8 9 B u d a p e s tI N D I A O x f o r d B o o k a n d S ta t io n e r y C o ., 1 7 , P a rk S tr e e t , C a lc u t ta , 7 0 0 0 1 6
O x f o r d B o o k a n d S ta t io n e r y C o ., S c in d ia H o u s e , N e w D e lh i- 1 1 0 0 0 1IS R A E L H e il ig e r a n d C o ., 3 , N a th a n S tra u s s S t r . , J e ru s a le m
I T A L Y L ib r e r ía S c ie n t i f ic a , D o t t . L u c io d e B ia s io "a e io u " . V ia M e ra v ig li 1 6 , 1 -2 0 1 2 3 M i la n
J A P A N M a ru z e n C o m p a n y , L td . , P .O . B o x 5 0 5 0 , 1 0 0 -3 1 T o k y o In te rn a t io n a lN E T H E R L A N D S M a r t in u s N i j h o f f B .V . , L a n g e V o o r h o u t 9 -1 1 , P .O . B o x 2 6 9 , T h e H a g u e
P A K IS T A N M ir z a B o o k A g e n c y , 6 5 , S h a h ra h Q u a id -e -A z a m , P .O . B o x 7 2 9 , L a h o re *3P O L A N D A rs P o lo n a -R u c h , C é n tra la H a n d lu Z a g ra n ic z n e g o ,
K ra k o w s k ie P rz e d m ie s c ie 7 , P L -0 0 -0 6 8 W a rs a wR O M A N IA l le x im , P .O . B o x 1 3 6 -1 3 7 , B u c a re s t
S O U T H A F R I C A V a n S c h a ik 's B o o k s to r e (P ty ) L td . , P .O . B o x 7 2 4 , P re to r ia 0 0 0 1 U n iv e rs ita s B o o k s (P ty ) L td . , P .O . B o x 1 5 5 7 , P re to r ia 0 0 0 1
S P A IN D ia z d e S a n to s , L ag asca 9 5 , M a d r id -6 D ia z d e S a n to s , B a lm e s 4 1 7 , 8 a rc e lo n a -6
S W E D E N A B C .E . F r i tz e s K u n g l. H o v b o k h a n d e l, F re d s g a ta n 2 , P .O . B o x 1 6 3 5 8 S - 1 0 3 2 7 S to c k h o lm
U N I T E D K IN G D O M H e r M a je s ty 's S ta t io n e r y O f f ic e , P .O . B o x 5 6 9 , L o n d o n S E 1 9 N HU .S .S .R . M e z h d u n a ro d n a y a K n ig a , S m o le n s k a y a -S e n n a y a 3 2 -3 4 , M o s c o w G -2 0 0
Y U G O S L A V I A J u g o s lo v e n s k a K n jig a , T e ra z i je 2 7 , P O B 3 6 , Y U - 1 1 0 0 1 B e lg ra d e
■ O r d e r s f r o m c o u n t r i e s w h e r e s a le s a g e n t s h a v e n o t y e t b e e n a p p o i n t e d a n d
r e q u e s t s f o r i n f o r m a t i o n s h o u l d b e a d d r e s s e d d i r e c t l y t o :
D i v i s i o n o f P u b l i c a t i o n s
$ I n t e r n a t i o n a l A t o m i c E n e r g y A g e n c y
K a r n t n e r R i n g 1 1 , P . O . B o x 5 9 0 , A - 1 0 1 1 V i e n n a , A u s t r i a

7 8 - 0 6 1 7 3


У
IN T E R N A T IO N A L A T O M IC EN ER G Y A G E N C Y V IE N N A , 1978
SUBJECT GROUP: I L ife Sciences/Dosim etry PRICE: U S $ 4 3 .0 0