understanding visualization through spatial ability differences
TRANSCRIPT
Understanding Visualization through Spatial Ability Differences
Maria C. Velez* Deborah Silver* Marilyn Tremaine*
Center for Advanced Information Processing Rutgers, the State University of New Jersey
ABSTRACT Little is known about the cognitive abilities which influence the comprehension of scientific and information visualizations and what properties of the visualization affect comprehension. Our goal in this paper is to understand what makes visualizations difficult. We address this goal by examining the spatial ability differences in a diverse population selected for spatial ability variance. For example, how is spatial ability related to visualization comprehension? What makes a particular visualization difficult or time intensive for specific groups of subjects? In this paper, we present the results of an experiment designed to answer these questions. Fifty-six subjects were tested on a basic visualization task and given standard paper tests of spatial abilities. An equal number of males and females were recruited in this study in order to increase spatial ability variance. Our results show that high spatial ability is correlated with accuracy on our three-dimensional visualization test, but not with time. High spatial ability subjects also had less difficulty with object complexity and the hidden properties of an object.
CR Categories: H.1.2 [Models and Principles]: User/Machine
Systems—Human factors H.5.2 [Information Interfaces and Pre-sentation (e.g., HCI)]: User Interfaces—Evaluation/methodology; J.4 [Computer Applications]: Social and Behavioral Sciences—Psychology
Additional Keywords: Gender differences, orthogonal projections, spatial ability, standardized testing
1 INTRODUCTION Three-dimensional (3D) representations are common in virtual reality (VR) applications, scientific visualizations, information visualizations, and other computer-human interfaces. Some examples include VR environments used in rehabilitation, orthogonal projections used in 3D design and manufacturing, VR applied to computer-aided instruction, 3D surface renderings of MRI data, 3D representations of financial data, 3D representations of WWW document collections, and interactive virtual worlds that support the exploration of bibliographic retrieval.
Experiments in some of these areas suggest that visualization comprehension may vary widely depending on the user’s skills and visualization characteristics. Given the prevalence of 3D imaging devices in all medical specialties (CT, MRI, and fMRI) and the use of these technologies by many fields (e.g., physical therapy, psychology, airport luggage screening), as well as the introduction of 3D representations into general user applications (e.g., WWW information search and retrieval), it is important to understand what factors lead to proper comprehension of 3D
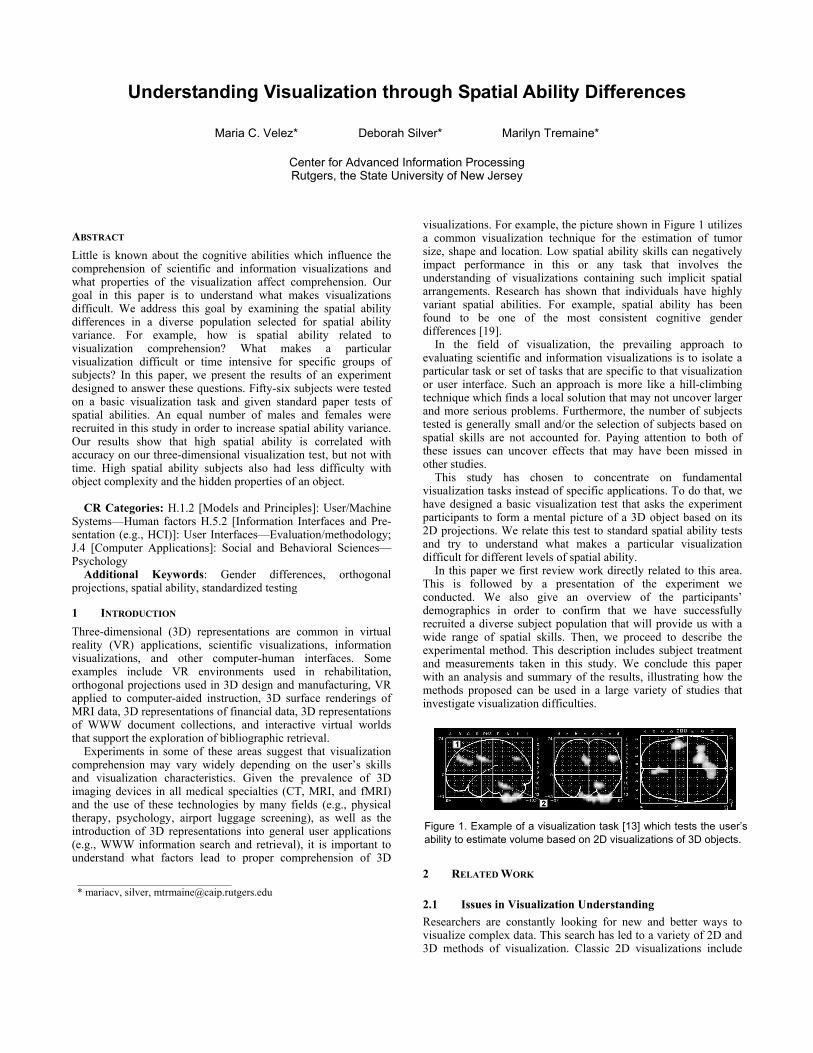
visualizations. For example, the picture shown in Figure 1 utilizes a common visualization technique for the estimation of tumor size, shape and location. Low spatial ability skills can negatively impact performance in this or any task that involves the understanding of visualizations containing such implicit spatial arrangements. Research has shown that individuals have highly variant spatial abilities. For example, spatial ability has been found to be one of the most consistent cognitive gender differences [19].
In the field of visualization, the prevailing approach to evaluating scientific and information visualizations is to isolate a particular task or set of tasks that are specific to that visualization or user interface. Such an approach is more like a hill-climbing technique which finds a local solution that may not uncover larger and more serious problems. Furthermore, the number of subjects tested is generally small and/or the selection of subjects based on spatial skills are not accounted for. Paying attention to both of these issues can uncover effects that may have been missed in other studies.
This study has chosen to concentrate on fundamental visualization tasks instead of specific applications. To do that, we have designed a basic visualization test that asks the experiment participants to form a mental picture of a 3D object based on its 2D projections. We relate this test to standard spatial ability tests and try to understand what makes a particular visualization difficult for different levels of spatial ability.
In this paper we first review work directly related to this area. This is followed by a presentation of the experiment we conducted. We also give an overview of the participants’ demographics in order to confirm that we have successfully recruited a diverse subject population that will provide us with a wide range of spatial skills. Then, we proceed to describe the experimental method. This description includes subject treatment and measurements taken in this study. We conclude this paper with an analysis and summary of the results, illustrating how the methods proposed can be used in a large variety of studies that investigate visualization difficulties.
2 RELATED WORK
2.1 Issues in Visualization Understanding Researchers are constantly looking for new and better ways to visualize complex data. This search has led to a variety of 2D and 3D methods of visualization. Classic 2D visualizations include
Figure 1. Example of a visualization task [13] which tests the user’s ability to estimate volume based on 2D visualizations of 3D objects.
_____________________________ * mariacv, silver, [email protected]
galleries of 2D slices and orthographic projections of 3D volumes. Studies have found that projection and slice visualizations are not optimal for tasks like shape understanding [29] and general understanding of 3D space layout [24]. Therefore, several improvements have been proposed that combine 2D and 3D methods such as clip planes of 3D volumes, cross sections or orthogonal projections combined with 3D position references (i.e., Exovis [29], Cube Corner [24], etc). These studies present particular solutions that improve performance in specific tasks by modifying characteristics of the original orthogonal visualization. Since accurate comprehension of 3D objects based on 2D orthogonal projections is a fundamental skill for fields like mechanical and civil engineering, researchers have developed training techniques to facilitate the understanding of concepts such as orthogonal projections, slices and cutting planes. Osborn and Agogino [21] created an interface that used the metaphor of a “pool of water” to illustrate the effect of a cutting plane in 3D objects. This training application is based on the direct manipulation of a 3D object and the observation of changes in the orthographic views and cutting planes.
Cognitive science and psychology have also studied similar spatial problem-solving skills. One type of extensively studied spatial problem asks subjects to recognize 3D objects seen from different angles (Shepherd and Metzler mental rotation test [26]). The subject is asked to select the rotated object from three additional similar but incorrect objects. Another spatial test [23] evaluates the ability of a subject to determine the result of cutting a 3D object with a plane.
The above studies have indicated that performance can be improved both by modifying the basic projection visualization and by effective training programs that teach users to understand orthogonal projections. We have also pointed out cognitive studies on mental rotation and mental registration illustrate large differences in spatial skills. However, these studies do not explain what makes the projection visualization more difficult for different types of users.
The focus of this work is to identify factors in the visualization that affect people’s ability to create an accurate mental picture of an object. This knowledge can potentially improve existing training techniques as well as the development of new enhancements to existing visualizations.
2.2 Spatial Ability There are many definitions of spatial ability, but it is generally accepted to be related to skills involving the retrieval, retention and transformation of visual information in a spatial context [11]. Researchers have broken apart the concept of spatial ability into specific factors that are believed to contribute to spatial comprehension. Unfortunately, factor labeling and definitions vary from one researcher to another. Kimura [19] defines six spatial factors that have a broad acceptance because they can be distinctly identified by experimental measurement. They are: Spatial Orientation, Spatial Location Memory, Targeting, Spatial Visualization, Disembedding and Spatial Perception. Throughout the rest of the paper we will be using this standard.
Spatial Orientation is the ability to accurately estimate changes in the orientation of an object. This skill is evaluated with tests that present 2D objects (e.g., letters, figures in the center of a clock face, and simple shapes) and 3D objects (e.g., Cubes, sets of cubes, and photos of real objects) rotated in 2D or 3D space.
Spatial Location Memory is the ability to recall the position of objects in an array. The commercial game, Memory Game, is a good test for spatial memory. Tests of spatial location memory present an array of realistic or geometric objects that should be memorized. Then, participants are presented with a second array
or with portions of an array where discrepancies with the original array must be identified.
Targeting refers to the ability to intercept projectiles or throw them at a target. It is difficult to categorize this ability, since it is highly related to motor ability [19]. Targeting is often measured with tests that require throwing a physical object to a target.
Spatial Visualization is the ability to recognize and quantify the orientation changes in a scene. Although this ability looks very similar to mental rotation, this skill does not require mental rotation of objects, but the estimation of one’s position in relation to a static object. Spatial visualization is also defined as the ability to imagine a result after folding or assembling parts of an object. The most characteristic tests of spatial visualization require participants to imagine what the final result is after a piece of paper is folded.
Disembedding is the skill that allows a person to find a simple object when it is embedded in a more complex figure. This factor is also referred to as Flexibility of Closure or Field Independence [19]. Tests of this factor require participants to find a model that is embedded in a distracting pattern.
Spatial Perception refers to a person’s ability to determine what the prevailing horizontal and vertical directions are in a scene where distracting patterns are present. One test of this ability requires participants to draw the water level line inside a transparent jar that has been tilted. Other tests require subjects to align (horizontally or vertically) a pattern that is surrounded by a frame.
In this study, we measured three of the above spatial factors: Spatial Orientation, Spatial Visualization, and Disembedding. We will be measuring them through the Kit of Factor-Reference Cognitive Tests [9] available at ETS1. All the tests are paper-based; they are time-limited and consist of two parts of equal length. The following are the cognitive tests we used in this study:
Cube Comparison Test (S-2). This test measures Spatial Orientation. Two cubes are shown and participants are asked to determine if both cubes can be the same cube in different rotation. The test consists of two 3-minutes sections with 21 questions each.
Paper Folding Test (VZ-2). This is a test of Spatial Visualization. Each test item presents a series of two or three folds to a paper sheet. After the piece is folded, a hole is punched in the paper. The task consists of identifying, from five drawings, the one that corresponds to the unfolded sheet. Participants are given three minutes to solve 10 problems in this test.
Hidden Patterns Test (CF-2). This is a test of the Disembedding spatial skill. Each question asks the participant to determine if a given figure is embedded in a geometric pattern. Each test section has 200 patterns and a test taker is given 3 minutes for the task.
We have also chosen to measure two other cognitive factors: Visual Memory and Perceptual Speed. Even though they are not directly related to spatial ability, we believe they are related to our visualization test. Shape Memory refers to the ability to remember the configuration, location and orientation of irregular shapes or objects. Since our visualization test requires participants to form a mental image of an object, and remember it for a short time, the results from this test should allow us to control for differences in memorization ability. Perceptual Speed is the cognitive ability to rapidly find a target symbol in a set of symbols or patterns. This factor will be used as a control factor in our study since it is likely to affect the time a subject takes to analyze our visualization test. To measure these two factors, we will use two tests from the Kit of Factor-Reference Cognitive Tests:
1 Educational Testing Service. www.ets.org
Shape Memory Test (MV-1). In this test of Visual Memory, participants are asked to identify groups of irregular shapes that were seen in an array on the previous test page. Each part gives the participants four minutes to memorize the array, and four minutes for identifying which of the 16 items were present.
Identical Figures Test (P-3). This is a test of Perceptual Speed. Participants are asked to recognize a figure appearing on the left from a set of five similar objects on the right. Subjects are given one and a half minutes in each part of the test to identify 48 figures.
Our goal in this experiment is to correlate the results obtained in the five cognitive ability tests mentioned above with the participant’s performance (time and accuracy of answers) in our visualization test. We will also use subject test scores, to determine what properties of the visualization affect high and low spatial ability subjects, to divide our population, and to discover what factors affect each group.
2.3 Visualization Comprehension Spatial comprehension is a current research topic in cognitive psychology [20], but the research carried out to date does not generally relate its results to computer-based visualizations, except for few exceptions (such as the research by Po [22]). There is little previous research in understanding what factors make a particular visualization difficult to comprehend for users with low spatial skills. Rizzo et al. [25] showed that individuals that have difficulty with the Shepherd and Metzler mental rotation test [26] can improve their mental rotation ability through training in a VR environment. Czerwinski ([8], [28]) studied the gender differences in 3D virtual environment navigation. She found that larger displays and a wider field of view improved female performance in the navigation tasks so that it equaled male performance.
Other studies that focus on visualization comprehension took a different approach: they evaluated performance when characteristics of the visualization were changed. Kim, Gorla and Interrante ([10], [14], [17], [18]) studied the effect of texture patterns in the assessment of shape information by comparing participants’ judgments of a 3D surface under different texture patterns and orientation methods. Tory et. al. ([29], [30]) compared performance on 2D, 3D and 2D/3D combination visualizations in tasks that required subjects to estimate orientation and relative position. They found that 3D displays with shadows were more effective for tasks requiring relative positioning. They also found that 2D/3D displays are a better choice for relative positioning than 2D or 3D alone. In terms of orientation tasks, their results suggest that 2D/3D displays are useful for precise orientation while 3D displays are effective for approximate orientation.
Unlike the previous studies, other researchers have focused on finding performance differences in gender. Hubona and Shirah [12] asked male and female subjects to perform three spatial tasks: object matching, alignment and resizing. Males performed better on the object matching and resizing tasks, while females outperformed males in the alignment of objects in 3D space. In a study by Cutmore et al. [7], both males and females were found to use landmarks to effectively navigate from the center to the outside of a maze in a virtual environment. However, it took more trials for females to achieve the same level of performance. Those users with superior visual-spatial ability (measured with a block design test from the WAIS-R test battery [34]) were significantly more accurate in distance estimation. Gender was also found to be a good predictor of navigation performance with males outperforming females.
Swan and Allan [27] investigated the usefulness of “Aspect Windows” (a 2D visualization), and 3D visualization of document inter-relationships, e.g., content similarity represented by
closeness. This study found that when subjects searched for documents in the 2D and 3D representations, those with higher spatial ability scores (measured with the Paper Folding Test described in section 2.2) searched faster in the Aspect Windows system than those with lower scores. In addition, the 3D version results were confounded by difficulties with the input device. Westerman and Cribbin [36] represented “semantic distances” between documents in a 2D plane. They then added “newness” of documents in a third dimension. Document search time increased precipitously in the 3D task and was highly correlated with subjects’ spatial ability (measured with the Paper Folding Test). Thus, the cognitive load added by the 3D navigation outweighed the perceived advantage of presenting two related variables simultaneously. Although gender differences have a strong effect in VR navigation, a number of studies emphasize the fact that it is not just females that have difficulty navigating in real [16] and virtual environments [5]. To make VR navigation easier, Vinson [33] proposed establishing landmarks in virtual environments to help users build cognitive maps. Even among females, wide spatial ability differences are found. Kato and Takeuchi [16] found that females with high spatial ability had different navigation strategies than those with low spatial ability.
Cockburn and McKenzy [6] asked subjects to find a web page among paper printouts of web pages taped to a clothesline (3D view of a 3D environment). They found that subjects found web pages much more quickly in the clothesline condition and concluded that the 3D view was better because subjects were able to use spatial memory in their task. However, no standardized spatial ability tests were administered to control for this factor. Allen [1] examined the cognitive load imposed by different 2D visualizations. Names were organized by semantic similarity or simply organized in an alphabetical matrix. Subjects found names in the complex semantically similar search space more quickly than in the matrix organization. High spatial ability subjects performed less quickly in the semantic arrangement than in the matrix arrangement. Spatial ability was measured with the following test from the Kit of Factor-Referenced Cognitive Tests [9]: Maze Tracing Speed Test, Map Planning Test, Number Comparison Test and the Identical Figures Test. Chen and Yu [5] conducted a meta-analysis of a set of search and retrieval studies that used a visual spatial component and measured accuracy and performance time. They concluded that all users, no matter what their spatial ability level, would perform better in simple rather than complex visual spatial interfaces, unlike Allen’s approach.
The aforementioned research illustrates that variables such as task, spatial layout, and dimensionality impose a cognitive load that affects visualization comprehension. Since computerization often leaves out multiple cues that we use in our everyday world, little is known about what features or lack of features add to the cognitive load of users. Our long range goal is to evaluate the visualization tasks and try to distill some common properties that may increase comprehension difficulty. Some of these basic visual tasks include orthogonal projections, gallery of slices, clipping planes, and applications of shading, lighting and texturing techniques. In this paper, we have chosen to start with projections. In the next section, we describe in detail our visualization test as well as outline the factors that shaped the final test design.
3 THE VISUALIZATION TEST To examine the comprehension of an orthogonal projection visualization, we created a classical visualization which represents what we feel is a basic task being asked of viewers in various professional fields (e.g. see Figure 1). Our goal was to design a visualization task that would be simple enough to be used by untrained users.
Screen 1
Screen 2
(a) (b)
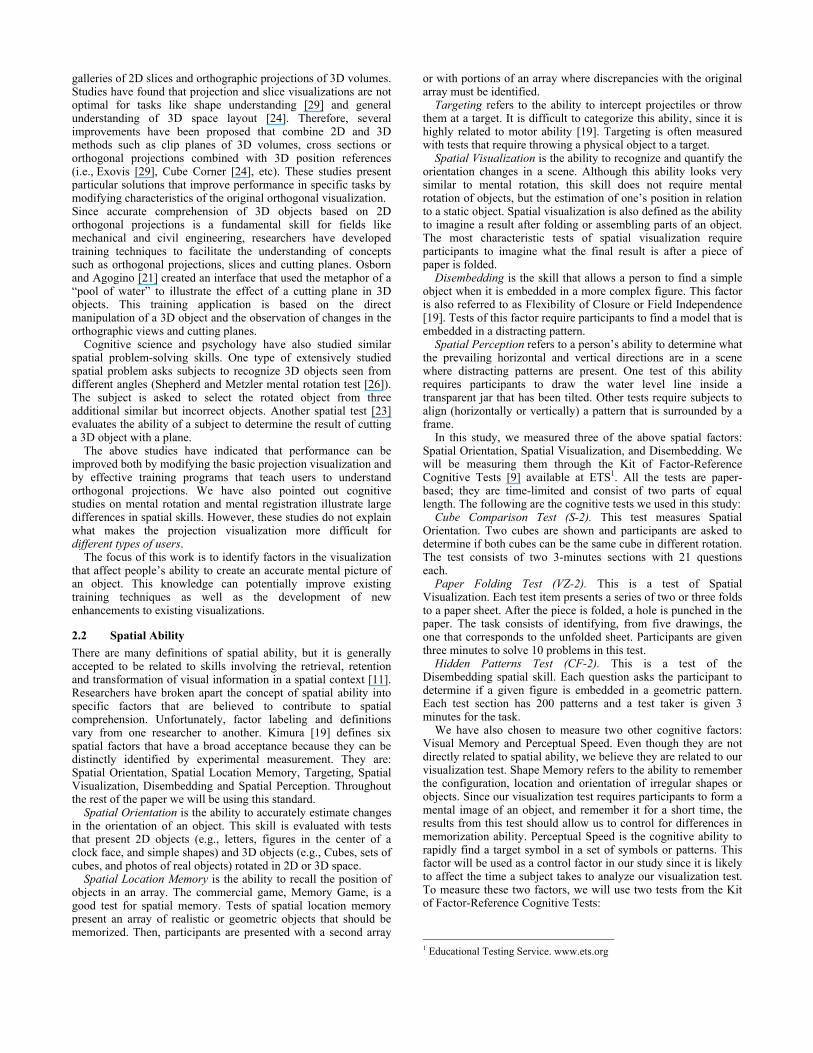
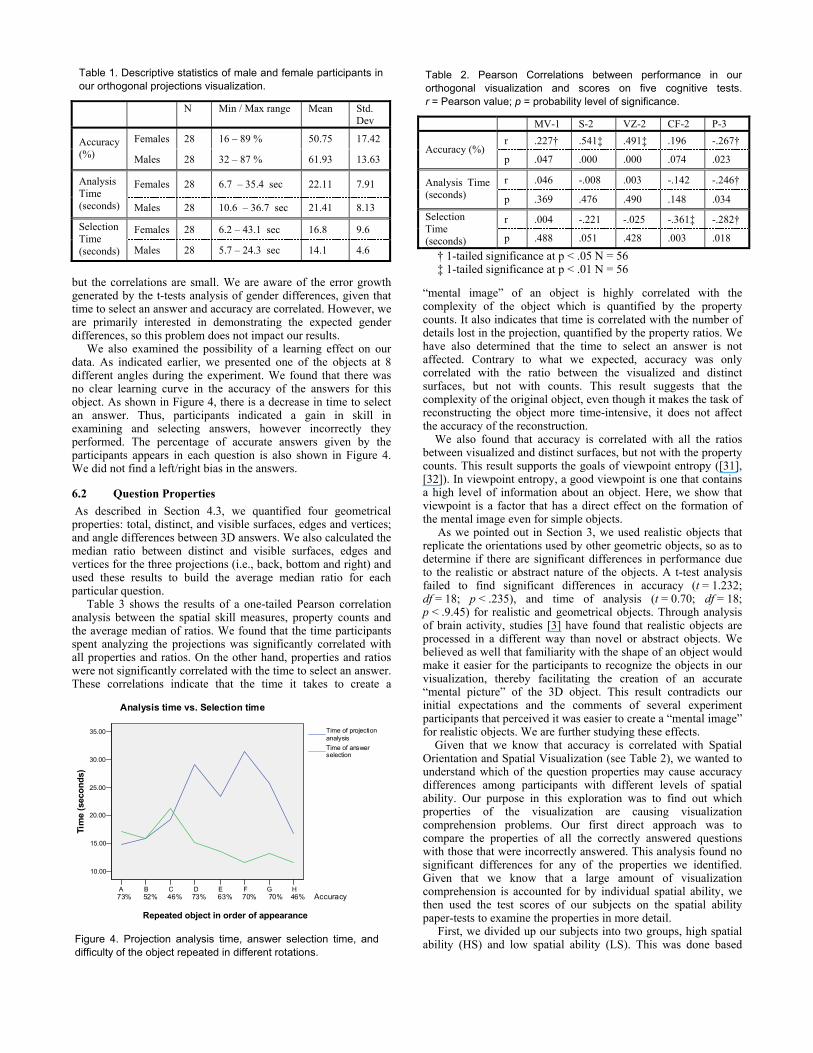
Figure 2. Two examples of objects used in our visualization test. The figures at the top show the orthogonal projections. Below the top figures are the four answers. The correct answer appears highlighted. Figure a) is a geometric object and c) is a realistic object. Subjects first view the projection screen (screen 1), then the answer screen (screen 2). They cannot switch back and forth.
This visualization consists of three orthogonal projections (back, bottom, and right). For the participants, the objective of the test is to analyze the projections and build a “mental picture” of the object. To evaluate the accuracy of the mental picture created by the experiment participants, we ask them to select the object they imagined from a set of four, where only one is the correct answer. Figure 2 illustrates two examples of object projections and the answers. Note that all the answers present the same object with a different rotation. Realistic and geometric objects were used in this study. The subjects where shown the projections and then asked to form a mental image before continuing on to the next screen where the four possible answers are shown. They were not allowed to go back. However, the four possible answers could be rotated (on screen) within ±30 degrees to get rid of any ambiguity. This rotation was enough to allow a participant to recognize the object. The test was purposefully basic and therefore without rendering/display improvements.
The test design was based on certain fundamental findings in the study of cognitive and spatial factors. For instance, reports by Just and Carpenter [15] recorded participants’ eye movements in the Shepard and Metzler Mental Rotation Task [26] and discovered that their eyes moved back and forth between the figure to be rotated and the list of answers to choose from. This indicates that the mental task is not merely a mental rotation, but includes feature matching between the figures. With this “feature matching” behavior in mind, we have designed our test so that once the participants have finished analyzing the projections and are ready to select the object they cognitively constructed; it is not possible to re-view the projections. Note, because this may impact memorization, we administered a Visual Memory test (Shape Memory Test MV-1) to see what correlation, if any, exists between this cognitive factor and performance in our visualization test. As demonstrated in the Results section, a significant but small correlation was found; therefore the cognitive load added to the task by this design choice was small.
The geometric objects selected for the experiment include cubes, boxes, pyramids, prisms, cylinders, cones, tori, c-shapes and l-shapes. The last two shapes are considered compound
objects, since they are created as the union of 2 or more boxes. The realistic objects we included in the visualization test included a guitar, a teapot, an hourglass, a chess knight, a telephone, an airplane, a cow, a trumpet, a chair, and a bottle. The test had 38 questions. Ten involved recognition of real objects. The real objects where interspersed between the abstract ones. In order to measure the learning effect in this experimental setup, we selected one of the objects that showed the lowest performance in our pilot tests and introduced it 8 times throughout the experiment in different rotations. The objects were categorized as easy, medium and hard so that the easy objects were presented at the beginning of the tests and the difficulty level was increased as the test advanced. This categorization was based on the perceptual judgment of the experimenters. As discussed later, this initial categorization was not necessarily correct.
We adopted a similar strategy to Shepard and Metzler [26] to select the position of the objects in the set of answers. For instance, we used mirror objects and objects with close angles as false answers in our tests. It is important to note that we avoided using the term “spatial ability” and other similar terms throughout the experiment description, instructions and training. Research [2] has shown that female results can be biased by the pre-existing notion that all females perform poorly in tests of spatial abilities.
There are three measures of performance in which we are interested: accuracy of the answers, time spent analyzing the object’s projections, and time spent selecting the final answer. Given that participants are not allowed to return to the screen showing the projections, the time to analyze the projections is independent of the time used to select an answer.
4 EXPERIMENT DESIGN Spatial ability differences have been found to be sharply differentiated between males and females. As pointed out by Weiss [35], there are many confounded variables in the origin of gender differences in spatial abilities. There are social and cultural influences, as well as biological differences. Men have been found to have higher mean scores than females in most of the spatial factors mentioned in Section 2.2, except for certain Spatial Memory tests. Spatial Orientation, Spatial Memory and Targeting show strong gender differences (approaching an effect size2 of one). Disembedding, Spatial Visualization and spatial perception show more moderate differences (effect size of about 0.5).
With this in mind, we anticipated finding gender differences in the skill measures for the Spatial Orientation and Spatial Visualization factors, as well as gender performance differences in our visualization test. Therefore, we ensured that half of our experiment participants were women. Thus, subject selection was done to increase our spatial ability variance. In addition to generating spatial ability differences through gender, we also recruited people from a wide variety of fields of study to force these differences to be even larger (However, all of our experiment participants were college students).
We expect to find all five cognitive factors to be related to performance (accuracy and time), but we expect the strength of the correlation to be different for each factor:
Visual Memory: Low or no correlation. Spatial Orientation: High correlation. Spatial Visualization: High correlation. Perceptual Speed: High correlation with time. Disembedding: Low correlation.
2 Effect size is a commonly used measure of magnitude of differences. An effect size of one is interpreted as a complete difference, while effect sizes bellow 0.5 are considered small [19].
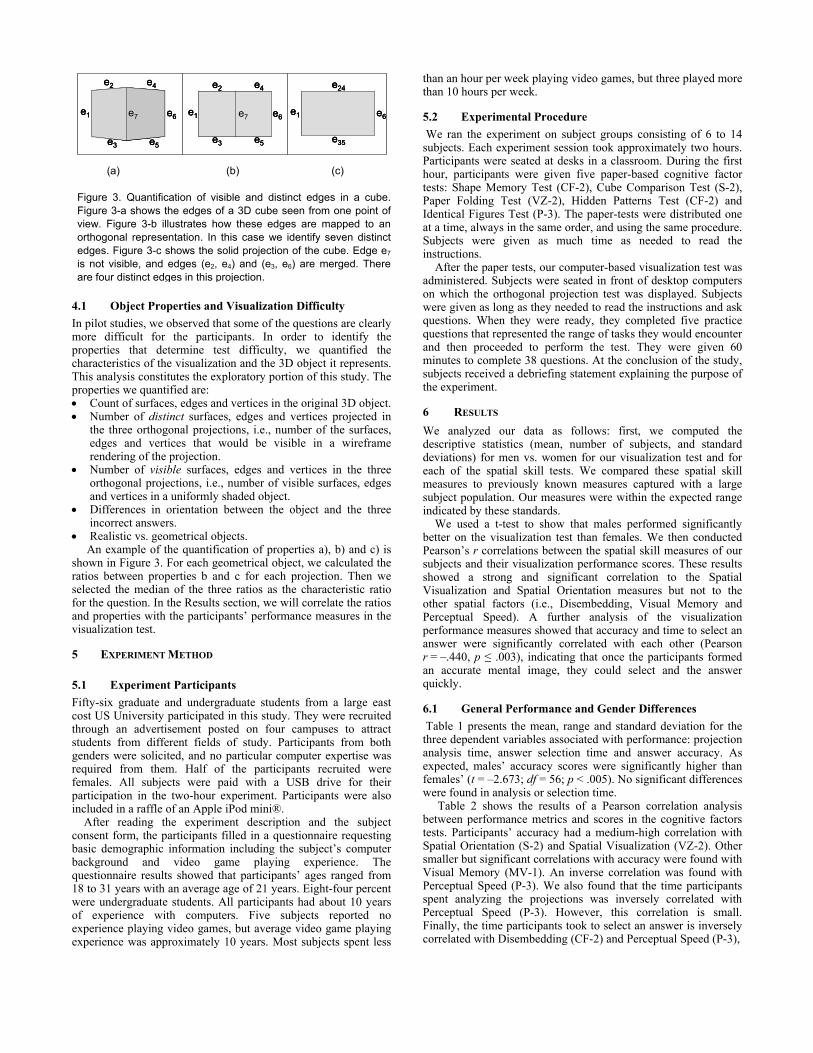
4.1 Object Properties and Visualization Difficulty In pilot studies, we observed that some of the questions are clearly more difficult for the participants. In order to identify the properties that determine test difficulty, we quantified the characteristics of the visualization and the 3D object it represents. This analysis constitutes the exploratory portion of this study. The properties we quantified are: • Count of surfaces, edges and vertices in the original 3D object. • Number of distinct surfaces, edges and vertices projected in
the three orthogonal projections, i.e., number of the surfaces, edges and vertices that would be visible in a wireframe rendering of the projection.
• Number of visible surfaces, edges and vertices in the three orthogonal projections, i.e., number of visible surfaces, edges and vertices in a uniformly shaded object.
• Differences in orientation between the object and the three incorrect answers.
• Realistic vs. geometrical objects. An example of the quantification of properties a), b) and c) is
shown in Figure 3. For each geometrical object, we calculated the ratios between properties b and c for each projection. Then we selected the median of the three ratios as the characteristic ratio for the question. In the Results section, we will correlate the ratios and properties with the participants’ performance measures in the visualization test.
5 EXPERIMENT METHOD
5.1 Experiment Participants Fifty-six graduate and undergraduate students from a large east cost US University participated in this study. They were recruited through an advertisement posted on four campuses to attract students from different fields of study. Participants from both genders were solicited, and no particular computer expertise was required from them. Half of the participants recruited were females. All subjects were paid with a USB drive for their participation in the two-hour experiment. Participants were also included in a raffle of an Apple iPod mini®.
After reading the experiment description and the subject consent form, the participants filled in a questionnaire requesting basic demographic information including the subject’s computer background and video game playing experience. The questionnaire results showed that participants’ ages ranged from 18 to 31 years with an average age of 21 years. Eight-four percent were undergraduate students. All participants had about 10 years of experience with computers. Five subjects reported no experience playing video games, but average video game playing experience was approximately 10 years. Most subjects spent less
than an hour per week playing video games, but three played more than 10 hours per week.
5.2 Experimental Procedure We ran the experiment on subject groups consisting of 6 to 14 subjects. Each experiment session took approximately two hours. Participants were seated at desks in a classroom. During the first hour, participants were given five paper-based cognitive factor tests: Shape Memory Test (CF-2), Cube Comparison Test (S-2), Paper Folding Test (VZ-2), Hidden Patterns Test (CF-2) and Identical Figures Test (P-3). The paper-tests were distributed one at a time, always in the same order, and using the same procedure. Subjects were given as much time as needed to read the instructions.
After the paper tests, our computer-based visualization test was administered. Subjects were seated in front of desktop computers on which the orthogonal projection test was displayed. Subjects were given as long as they needed to read the instructions and ask questions. When they were ready, they completed five practice questions that represented the range of tasks they would encounter and then proceeded to perform the test. They were given 60 minutes to complete 38 questions. At the conclusion of the study, subjects received a debriefing statement explaining the purpose of the experiment.
6 RESULTS We analyzed our data as follows: first, we computed the descriptive statistics (mean, number of subjects, and standard deviations) for men vs. women for our visualization test and for each of the spatial skill tests. We compared these spatial skill measures to previously known measures captured with a large subject population. Our measures were within the expected range indicated by these standards.
We used a t-test to show that males performed significantly better on the visualization test than females. We then conducted Pearson’s r correlations between the spatial skill measures of our subjects and their visualization performance scores. These results showed a strong and significant correlation to the Spatial Visualization and Spatial Orientation measures but not to the other spatial factors (i.e., Disembedding, Visual Memory and Perceptual Speed). A further analysis of the visualization performance measures showed that accuracy and time to select an answer were significantly correlated with each other (Pearson r = –.440, p ≤ .003), indicating that once the participants formed an accurate mental image, they could select and the answer quickly.
6.1 General Performance and Gender Differences Table 1 presents the mean, range and standard deviation for the three dependent variables associated with performance: projection analysis time, answer selection time and answer accuracy. As expected, males’ accuracy scores were significantly higher than females’ (t = –2.673; df = 56; p < .005). No significant differences were found in analysis or selection time.
Table 2 shows the results of a Pearson correlation analysis between performance metrics and scores in the cognitive factors tests. Participants’ accuracy had a medium-high correlation with Spatial Orientation (S-2) and Spatial Visualization (VZ-2). Other smaller but significant correlations with accuracy were found with Visual Memory (MV-1). An inverse correlation was found with Perceptual Speed (P-3). We also found that the time participants spent analyzing the projections was inversely correlated with Perceptual Speed (P-3). However, this correlation is small. Finally, the time participants took to select an answer is inversely correlated with Disembedding (CF-2) and Perceptual Speed (P-3),
e1
e2
e3
e4
e5
e6e7 e1
e2
e3
e4
e5
e6e7 e1
e24
e35
e6e1
e2
e3
e4
e5
e6e7e1
e2
e3
e4
e5
e6e7 e1
e2
e3
e4
e5
e6e7e1
e2
e3
e4
e5
e6e7 e1
e24
e35
e6e1
e24
e35
e6
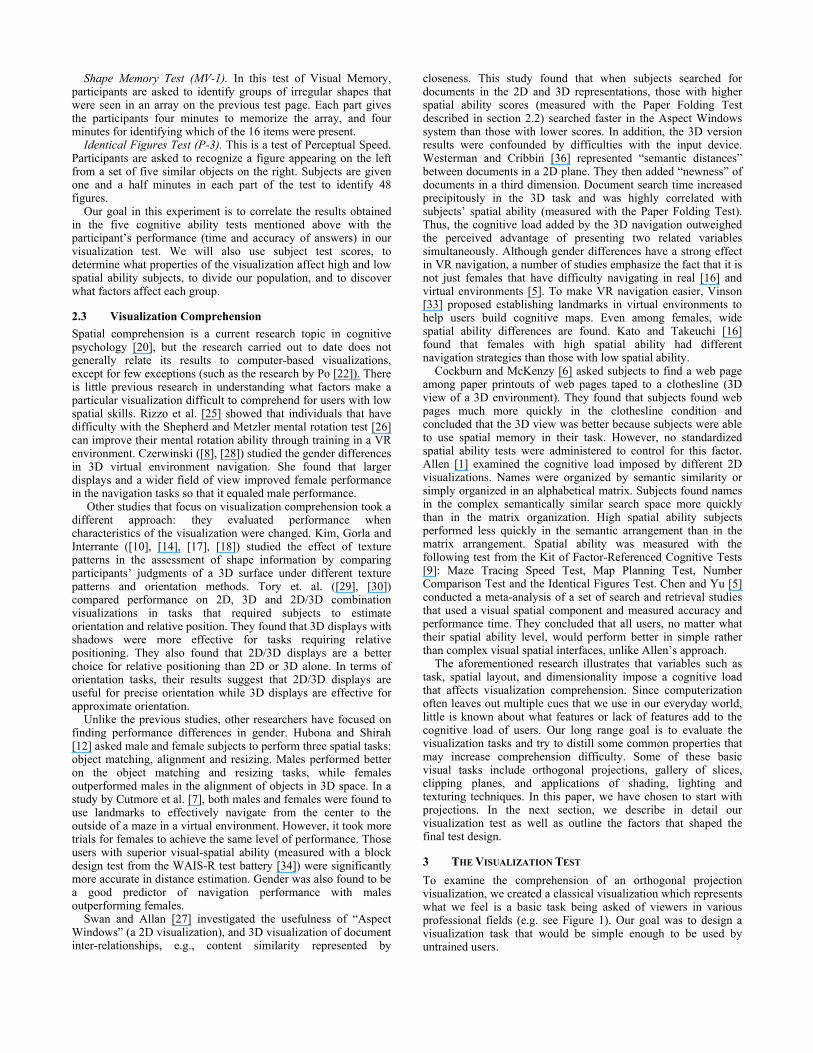
(a) (b) (c) Figure 3. Quantification of visible and distinct edges in a cube. Figure 3-a shows the edges of a 3D cube seen from one point of view. Figure 3-b illustrates how these edges are mapped to an orthogonal representation. In this case we identify seven distinct edges. Figure 3-c shows the solid projection of the cube. Edge e7
is not visible, and edges (e2, e4) and (e3, e6) are merged. There are four distinct edges in this projection.
but the correlations are small. We are aware of the error growth generated by the t-tests analysis of gender differences, given that time to select an answer and accuracy are correlated. However, we are primarily interested in demonstrating the expected gender differences, so this problem does not impact our results.
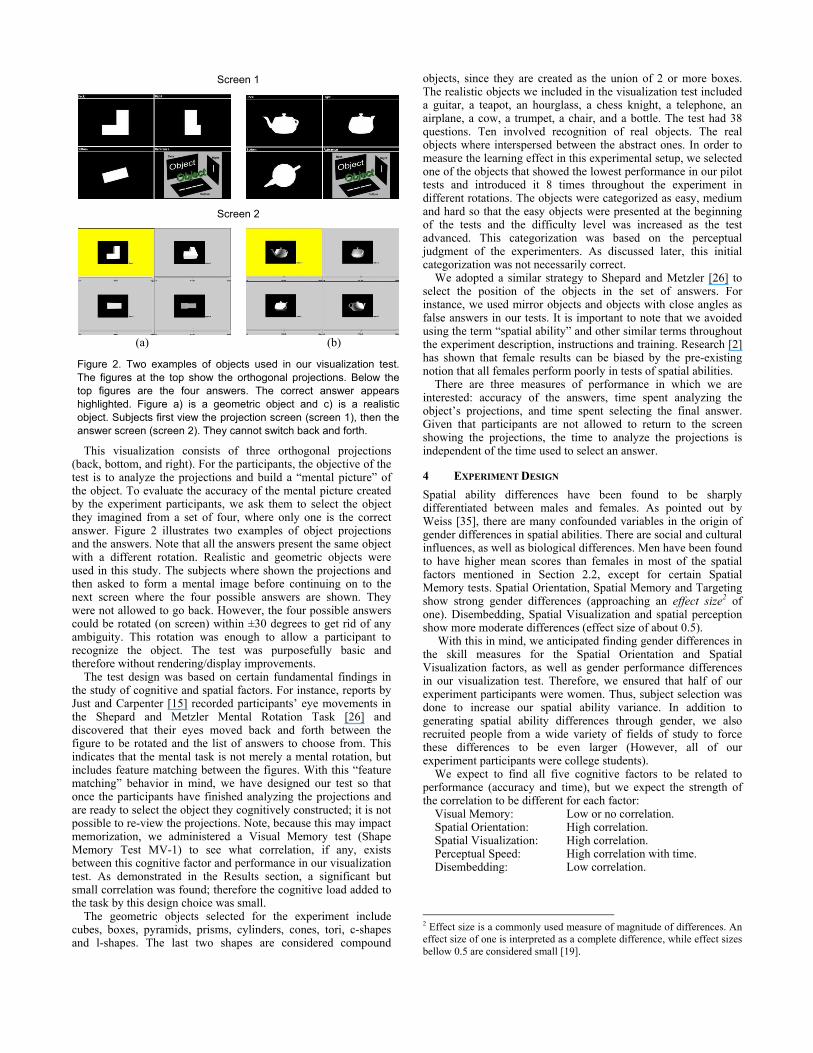
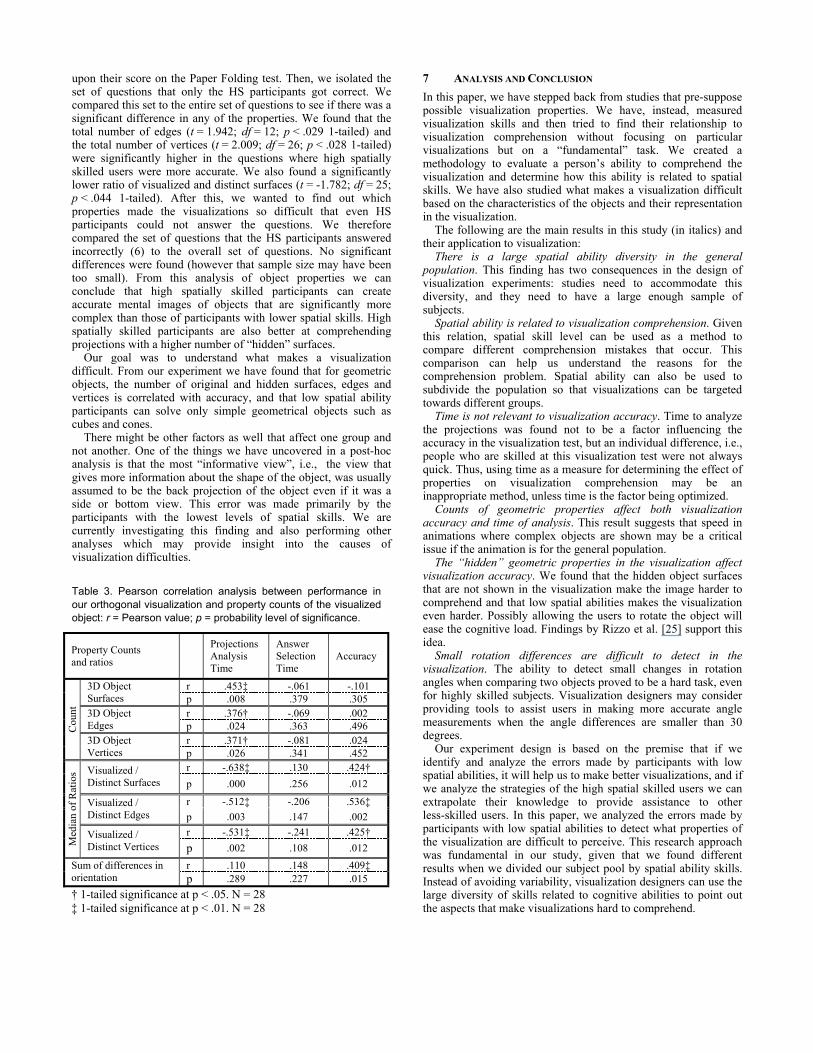
We also examined the possibility of a learning effect on our data. As indicated earlier, we presented one of the objects at 8 different angles during the experiment. We found that there was no clear learning curve in the accuracy of the answers for this object. As shown in Figure 4, there is a decrease in time to select an answer. Thus, participants indicated a gain in skill in examining and selecting answers, however incorrectly they performed. The percentage of accurate answers given by the participants appears in each question is also shown in Figure 4. We did not find a left/right bias in the answers.
6.2 Question Properties As described in Section 4.3, we quantified four geometrical properties: total, distinct, and visible surfaces, edges and vertices; and angle differences between 3D answers. We also calculated the median ratio between distinct and visible surfaces, edges and vertices for the three projections (i.e., back, bottom and right) and used these results to build the average median ratio for each particular question.
Table 3 shows the results of a one-tailed Pearson correlation analysis between the spatial skill measures, property counts and the average median of ratios. We found that the time participants spent analyzing the projections was significantly correlated with all properties and ratios. On the other hand, properties and ratios were not significantly correlated with the time to select an answer. These correlations indicate that the time it takes to create a
“mental image” of an object is highly correlated with the complexity of the object which is quantified by the property counts. It also indicates that time is correlated with the number of details lost in the projection, quantified by the property ratios. We have also determined that the time to select an answer is not affected. Contrary to what we expected, accuracy was only correlated with the ratio between the visualized and distinct surfaces, but not with counts. This result suggests that the complexity of the original object, even though it makes the task of reconstructing the object more time-intensive, it does not affect the accuracy of the reconstruction.
We also found that accuracy is correlated with all the ratios between visualized and distinct surfaces, but not with the property counts. This result supports the goals of viewpoint entropy ([31], [32]). In viewpoint entropy, a good viewpoint is one that contains a high level of information about an object. Here, we show that viewpoint is a factor that has a direct effect on the formation of the mental image even for simple objects.
As we pointed out in Section 3, we used realistic objects that replicate the orientations used by other geometric objects, so as to determine if there are significant differences in performance due to the realistic or abstract nature of the objects. A t-test analysis failed to find significant differences in accuracy (t = 1.232; df = 18; p < .235), and time of analysis (t = 0.70; df = 18; p < .9.45) for realistic and geometrical objects. Through analysis of brain activity, studies [3] have found that realistic objects are processed in a different way than novel or abstract objects. We believed as well that familiarity with the shape of an object would make it easier for the participants to recognize the objects in our visualization, thereby facilitating the creation of an accurate “mental picture” of the 3D object. This result contradicts our initial expectations and the comments of several experiment participants that perceived it was easier to create a “mental image” for realistic objects. We are further studying these effects.
Given that we know that accuracy is correlated with Spatial Orientation and Spatial Visualization (see Table 2), we wanted to understand which of the question properties may cause accuracy differences among participants with different levels of spatial ability. Our purpose in this exploration was to find out which properties of the visualization are causing visualization comprehension problems. Our first direct approach was to compare the properties of all the correctly answered questions with those that were incorrectly answered. This analysis found no significant differences for any of the properties we identified. Given that we know that a large amount of visualization comprehension is accounted for by individual spatial ability, we then used the test scores of our subjects on the spatial ability paper-tests to examine the properties in more detail.
First, we divided up our subjects into two groups, high spatial ability (HS) and low spatial ability (LS). This was done based
Table 2. Pearson Correlations between performance in our orthogonal visualization and scores on five cognitive tests. r = Pearson value; p = probability level of significance.
MV-1 S-2 VZ-2 CF-2 P-3 r .227† .541‡ .491‡ .196 -.267†
Accuracy (%) p .047 .000 .000 .074 .023
r .046 -.008 .003 -.142 -.246† Analysis Time (seconds) p .369 .476 .490 .148 .034
r .004 -.221 -.025 -.361‡ -.282† Selection Time (seconds) p .488 .051 .428 .003 .018
† 1-tailed significance at p < .05 N = 56 ‡ 1-tailed significance at p < .01 N = 56
Table 1. Descriptive statistics of male and female participants in our orthogonal projections visualization.
N Min / Max range Mean Std. Dev
Females 28 16 – 89 % 50.75 17.42 Accuracy (%) Males 28 32 – 87 % 61.93 13.63
Females 28 6.7 – 35.4 sec 22.11 7.91 Analysis Time (seconds) Males 28 10.6 – 36.7 sec 21.41 8.13
Females 28 6.2 – 43.1 sec 16.8 9.6 Selection Time (seconds) Males 28 5.7 – 24.3 sec 14.1 4.6
HGFEDCBA
35.00
30.00
25.00
20.00
15.00
10.00
Tim
e (s
econ
ds)
Time of answerselection
Time of projectionanalysis
Analysis time vs. Selection time
Repeated object in order of appearance
73% 52% 46% 73% 63% 70% 70% 46% Accuracy
Figure 4. Projection analysis time, answer selection time, and difficulty of the object repeated in different rotations.
upon their score on the Paper Folding test. Then, we isolated the set of questions that only the HS participants got correct. We compared this set to the entire set of questions to see if there was a significant difference in any of the properties. We found that the total number of edges (t = 1.942; df = 12; p < .029 1-tailed) and the total number of vertices (t = 2.009; df = 26; p < .028 1-tailed) were significantly higher in the questions where high spatially skilled users were more accurate. We also found a significantly lower ratio of visualized and distinct surfaces (t = -1.782; df = 25; p < .044 1-tailed). After this, we wanted to find out which properties made the visualizations so difficult that even HS participants could not answer the questions. We therefore compared the set of questions that the HS participants answered incorrectly (6) to the overall set of questions. No significant differences were found (however that sample size may have been too small). From this analysis of object properties we can conclude that high spatially skilled participants can create accurate mental images of objects that are significantly more complex than those of participants with lower spatial skills. High spatially skilled participants are also better at comprehending projections with a higher number of “hidden” surfaces.
Our goal was to understand what makes a visualization difficult. From our experiment we have found that for geometric objects, the number of original and hidden surfaces, edges and vertices is correlated with accuracy, and that low spatial ability participants can solve only simple geometrical objects such as cubes and cones.
There might be other factors as well that affect one group and not another. One of the things we have uncovered in a post-hoc analysis is that the most “informative view”, i.e., the view that gives more information about the shape of the object, was usually assumed to be the back projection of the object even if it was a side or bottom view. This error was made primarily by the participants with the lowest levels of spatial skills. We are currently investigating this finding and also performing other analyses which may provide insight into the causes of visualization difficulties.
7 ANALYSIS AND CONCLUSION In this paper, we have stepped back from studies that pre-suppose possible visualization properties. We have, instead, measured visualization skills and then tried to find their relationship to visualization comprehension without focusing on particular visualizations but on a “fundamental” task. We created a methodology to evaluate a person’s ability to comprehend the visualization and determine how this ability is related to spatial skills. We have also studied what makes a visualization difficult based on the characteristics of the objects and their representation in the visualization.
The following are the main results in this study (in italics) and their application to visualization:
There is a large spatial ability diversity in the general population. This finding has two consequences in the design of visualization experiments: studies need to accommodate this diversity, and they need to have a large enough sample of subjects.
Spatial ability is related to visualization comprehension. Given this relation, spatial skill level can be used as a method to compare different comprehension mistakes that occur. This comparison can help us understand the reasons for the comprehension problem. Spatial ability can also be used to subdivide the population so that visualizations can be targeted towards different groups.
Time is not relevant to visualization accuracy. Time to analyze the projections was found not to be a factor influencing the accuracy in the visualization test, but an individual difference, i.e., people who are skilled at this visualization test were not always quick. Thus, using time as a measure for determining the effect of properties on visualization comprehension may be an inappropriate method, unless time is the factor being optimized.
Counts of geometric properties affect both visualization accuracy and time of analysis. This result suggests that speed in animations where complex objects are shown may be a critical issue if the animation is for the general population.
The “hidden” geometric properties in the visualization affect visualization accuracy. We found that the hidden object surfaces that are not shown in the visualization make the image harder to comprehend and that low spatial abilities makes the visualization even harder. Possibly allowing the users to rotate the object will ease the cognitive load. Findings by Rizzo et al. [25] support this idea.
Small rotation differences are difficult to detect in the visualization. The ability to detect small changes in rotation angles when comparing two objects proved to be a hard task, even for highly skilled subjects. Visualization designers may consider providing tools to assist users in making more accurate angle measurements when the angle differences are smaller than 30 degrees.
Our experiment design is based on the premise that if we identify and analyze the errors made by participants with low spatial abilities, it will help us to make better visualizations, and if we analyze the strategies of the high spatial skilled users we can extrapolate their knowledge to provide assistance to other less-skilled users. In this paper, we analyzed the errors made by participants with low spatial abilities to detect what properties of the visualization are difficult to perceive. This research approach was fundamental in our study, given that we found different results when we divided our subject pool by spatial ability skills. Instead of avoiding variability, visualization designers can use the large diversity of skills related to cognitive abilities to point out the aspects that make visualizations hard to comprehend.
Table 3. Pearson correlation analysis between performance in our orthogonal visualization and property counts of the visualized object: r = Pearson value; p = probability level of significance.
Property Counts and ratios
Projections Analysis Time
Answer Selection Time
Accuracy
r .453‡ -.061 -.101 3D Object Surfaces p .008 .379 .305
r .376† -.069 .002 3D Object Edges p .024 .363 .496
r .371† -.081 .024
Cou
nt
3D Object Vertices p .026 .341 .452
r -.638‡ .130 .424† Visualized / Distinct Surfaces p .000 .256 .012
r -.512‡ -.206 .536‡ Visualized / Distinct Edges p .003 .147 .002
r -.531‡ -.241 .425†
Med
ian
of R
atio
s
Visualized / Distinct Vertices p .002 .108 .012
r .110 .148 .409‡ Sum of differences in orientation p .289 .227 .015 † 1-tailed significance at p < .05. N = 28 ‡ 1-tailed significance at p < .01. N = 28
ACKNOWLEDGMENTS This research is supported by the National Science Foundation through the SGER grant # 0503680.
REFERENCES [1] B. Allen, “Information Space Representation in Interactive Systems:
Relationship to Spatial Abilities,” Proceedings of the Third ACM Conference on Digital Libraries, Pittsburgh, PA, pp 1-10, 1998.
[2] M. J. Brosnan, "The Implications for Academic Attainment of Perceived Gender-Appropriateness upon Spatial Task Performance," British Journal of Educational Psychology, 68(2), pp. 203-215, 1998.
[3] L. J. Burton, "Examining the Relation Between Visual Imagery and Spatial Ability Tests," International Journal of Testing, 3(3), pp. 277-291, 2003.
[4] C. Chen, "Individual Differences in a Spatial-Semantic Virtual Environment," Journal of the American Society for Information Science, 51(6), pp. 529-542, 2000.
[5] C. Chen and Y. Yu, "Empirical Studies of Information Visualization: a Meta-Analysis," International Journal of Human-Computer Studies, 53(5), pp. 851-886, 2000.
[6] A. Cockburn and B. McKenzie, "Evaluating the Effectiveness of Spatial Memory in 2D and 3D Physical and Virtual Environments," Proceedings of the SIGCHI Conference on Human Factors in Computing Systems, Minneapolis, MN, pp. 203-210, 2002.
[7] T. R. H. Cutmore, T. J. Hine, K. J. Maberly, N. M. Langford, and G. Hawgood, "Cognitive and Gender Factors Influencing Navigation in a Virtual Environment," International Journal of Human-Computer Studies, 53(2), pp. 223-249, 2000.
[8] M. Czerwinski, D. S. Tan, and G. G. Robertson, "Women Take a Wider View," Proceedings of the SIGCHI Conference on Human Factors in Computing Systems, Minneapolis, MN, pp. 195-202, 2002.
[9] R. B. Ekstrom, J. W. French, H. H. Harman, and D. Dermen, Manual from Kit of Factor-References Cognitive Tests. Princeton, NJ: Educational Testing Service, 1976.
[10] G. Gorla, V. Interrante and G. Sapiro, “Texture Synthesis for 3D Shape Representation", IEEE Transactions on Visualization and Computer Graphics, 9(4), pp. 512-524, 2003.
[11] D. F. Halpern, Sex Differences in Cognitive Abilities, Third edition ed. Lawrence Erlbaum Associates, Mahnawah, NJ, 2000.
[12] G. S. Hubona and G. W. Shirah, "The Gender Factor Performing Visualization Tasks on Computer Media," Proceedings of the 37th Annual Hawaii International Conference on System Sciences (HICSS'04) - Track 4, Big Island, HI, p 40097c, 2004.
[13] International Neuroimaging Consortium (INC) Visual Analysis Testbed. http://www.neurovia.umn.edu/incweb/testbed/
[14] V. Interrante, G. Gorla, S. Kim, H. Hagh-Shenas, and G. Sapiro, "Texture Synthesis for 3d Shape Representation," Journal of Vision, 2, pp. 305a, 2002.
[15] M. A. Just and P. A. Carpenter, "Eye Fixations and Cognitive Processes," Cognitive Psychology, 8(4), pp. 441-480, 1976.
[16] Y. Kato and Y. Takeuchi, "Individual Differences in Wayfinding Strategies," Journal of Environmental Psychology, 23(2), pp. 171-188, 2003.
[17] S. Kim, H. Hagh-Shenas, and V. Interrante, "Conveying Shape with Texture: Experimental Investigations of Texture's Effects on Shape Categorization Judgments," IEEE Transactions on Visualization and Computer Graphics, 10(4), pp. 471-483, 2004.
[18] S. Kim, H. Hagh-Shenas, and V. Interrante, "Conveying Shape with Texture: Experimental Investigations of Texture's Effects on Shape Categorization Judgments," IEEE Symposium on Information Visualization, Seattle, WA, pp. 163-170, 2003.
[19] D. Kimura, Sex and Cognition, First Edition, MIT Press, Cambridge, Mass, 1999.
[20] P. C. Kyllonen and J. Glück, "Spatial Ability: Introduction to the Special Issue," International Journal of Testing, 3(3), pp. 215-217, 2003.
[21] J. R. Osborn, and A. M. Agogino. “An Interface for Interactive Spatial Reasoning and Visualization”. Proceedings of the SIGCHI Conference on Human Factors in Computing Systems, Minneapolis, MN, pp. 75–82, 2002.
[22] B. Po. “A representation Basis for Human-Computer Interaction” Ph.D. Thesis, University of British Columbia, 2005.
[23] C. Quaiser-Pohl, "The Mental Cutting Test "Schnitte" and the Picture Rotation Test-Two New Measures to Assess Spatial Ability," International Journal of Testing, 3(3), pp. 219-231, 2003.
[24] K. Rehm, K. Lakshminaryan, S. Frutiger, K. A. Schaper, D. W. Sumners, S. C. Strother, J. R. Anderson, and D. A. Rottenberg, "A Symbolic Environment for Visualizing Activated Foci in Functional Neuroimaging Datasets," Medical Imaging Analysis, 2(3), pp. 215 - 226, 1998.
[25] A. A. Rizzo, G. J. Buckwalter, J. S. McGee, T. Bowerly, C. V. D. Zaag, U. Neumann, M. Thiebaux, L. Kim, J. Pair, and C. Chua, "Virtual Environments for Assessing and Rehabilitating Cognitive/Functional Performance: A Review of Projects at the USC Integrated Media Systems Center," Presence: Teleoperators & Virtual Environments, 10(4), pp. 359-374, 2001.
[26] R. Shepard and J. Metzler, "Mental Rotation of Three-Dimensional Objects," Science, 171, pp. 701-703, 1971.
[27] R. C. Swan and J. Allan, "Aspect Windows, 3-D Visualizations, and Indirect Comparisons of Information Retrieval Systems," Proceedings of the 21st Annual International ACM SIGIR Conference on Research and Development in Information Retrieval, Melbourne, Australia, pp. 173-181, 1998.
[28] D. S. Tan, M. Czerwinski, and G. Robertson, "Women Go with the (Optical) Flow," Proceedings of the SIGCHI Conference on Human Factors in Computing Systems, Ft. Lauderdale, FL, pp. 209–215, 2003.
[29] M. Tory, "Mental Registration of 2D and 3D Visualizations (An Empirical Study)," Proceedings of the 14th IEEE Visualization Conference, Seattle, WA, pp. 371–378, 2003.
[30] M. Tory, T. Moller, M. S. Atkins, and A. E. Kirkpatrick, "Combining 2D and 3D Views for Orientation and Relative Position Tasks," Proceedings of the SIGCHI Conference on Human Factors in Computing Systems, Vienna, Austria, pp. 371–378, 2004.
[31] P. P. Vázquez, M. Feixas, M. Sbert, and W. Heidrich., "Automatic View Selection Using Viewpoint Entropy and its Application to Image-Based Modelling," Computer Graphics Forum, 22(4), 2003.
[32] P. P. Vazquez, M. Feixas, M. Sbert, and W. Heidrich, "Viewpoint Selection using Viewpoint Entropy," Proceedings of the Vision Modeling and Visualization Conference 2001, pp. 273-280, 2001.
[33] N. G. Vinson, "Design Guidelines for Landmarks to Support Navigation in Virtual Environments," Proceedings of the SIGCHI Conference on Human Factors in Computing Systems, Pittsburgh, PA, pp 278-285, 1999.
[34] D. Wechsler, Wechsler Adult Intelligence Scale - Revised. The Psychological Corp., NY, 1981.
[35] E. M. Weiss, G. Kemmler, E. A. Deisenhammer, W. W. Fleischhacker, and M. Delazer, "Sex Differences in Cognitive Functions," Personality and Individual Differences, 35, pp. 863-875, 2003.
[36] S. J. Westerman and T. Cribbin, "Mapping Semantic Information in Virtual Space: Dimensions, Variance and Individual Differences," International Journal of Human-Computer Studies, 53(5), pp. 765-787, 2000.