copy to pennft ability
TRANSCRIPT
0RNL/TM-7948/V2 Dist. Category UC-20 c,d
Contract No. W-7405-eng-26
FUSION ENERGY DIVISION
FUSION ENGINEERING DEVICE DESIGN DESCRIPTION
C. A. Flanagan, D. Steiner, and G. E. Saith Fusion Engineering Design Center Staff
Volume 2
NOTICE
M i copy to pennft ability.
Date Published: Decoder 1981
OISCUMMER "•.•itiO"* * * A" ' ' M>' iw:'*'"*1 tr •.< im-tcd Sinn S. 'hM • »» 'KI MX^V. • > V « llNI PtMM M ' l " > C r V * ] * w , * * ! I"* MQ* «*.'•»•, 1 3» BCWW . •« jk'. j #•«:»• ••»«»»• wp^aiut p*iidt«t <» CirtHM D*iJ«>w0. if
•*•«< !I v -'f <.«•«••»•* ft****! 'n^ii PrVrv* 14 c——»» • ;,n,j„.• i m i n v i o n i " * fauenrk e» wwww. Son •1 ' i r f « "Vt» -I ftOtr O" bv 'Jftlrt SM*M |< |F, u m ^Wt and io«#i*fH .H aultfln •rnrmwl h#mn f w w ' t e r r • y * * u — G k w - * - ! o» r»y
Prepared by the OAK RIDGE NATIONAL LABORATORY Oak Ridge, Tennessee 37830
operated by UNION CARBIDE CORPORATION
for the DEPARTMENT OF ENERGY
VSTRHIITIOH OF THIS DOCUMENT IS
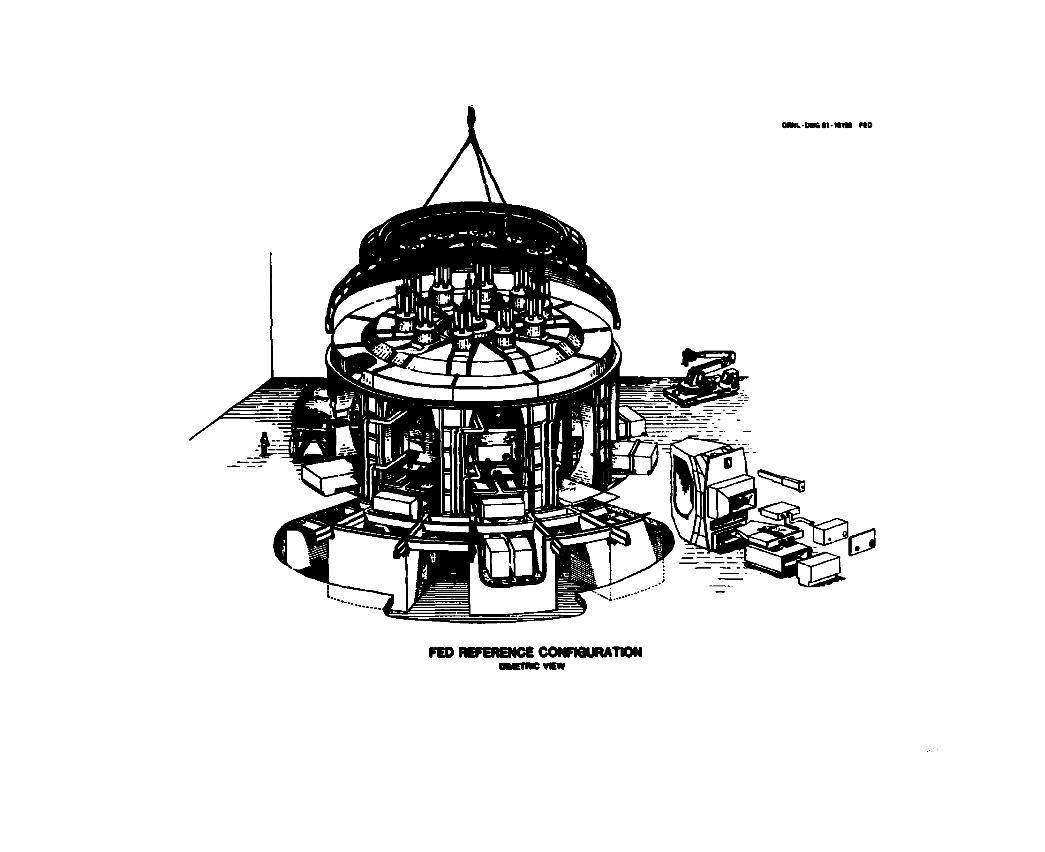
TABLE OF CONTENTS
ABSTRACT x ACKNOWLEDGMENTS xii LIST OF CONTRIBUTORS xiii LIST OF FIGURES xiv LIST OF TABLES xxvi 1. DESIGN OVERVIEW 1-1
1.2 PRINCIPAL DESIGN GUIDELINES 1-3 1.3 DESIGN DESCRIPTION 1-9
1.3.1 Plasma Operation Scenario 1-9 1.3.2 Machine Configuration 1-11 1.3.3 Magnetic Systems Description 1-15 1.3.4 Nuclear Systems Description 1-20 1.3.5 Electrical Systems Description 1-23 1.3.6 Plasma Heating Systems Description 1-24 1.3.7 Auxiliary Systems Description 1-25 1.3.8 Facilities Description 1-27
1.4 MODE OF OPERATIONS AND TEST PROGRAMS 1-27 1.4.1 Integrated Systems Checkout L-30 1.4.2 Tritium-Free Operation 1-30 1.4.3 D-T Plasma Burn 1-33 1.4.4 D-T Engineering Testing 1-33
1.5 COST AND CONSTRUCTION SCHEDULE PROJECTION 1-35 1.5.1 Cost Estimate 1-35 1.5.2 Construction Schedule 1-38
1.6 KEY DESIGN ISSUES FOR FUTURE INVESTIGATION 1-40 1.6.1 Configuration Engineering Design Issues 1-41 1.6.2 Magnetic Systems Design Issues 1-41 1.6.3 Nuclear Systems Design Issues 1-42 1.6.4 Electrical Systems Design Issues 1-43 1.6.5 Plasma Heating System Design Issues 1-43 1.6.6 Facilities Design Issues 1-44
1.7 RESEARCH AND DEVELOPMENT NEEDS 1-44 1.7.1 Magnetic Systems R&D Needs 1-44 1.7.2 Nuclear Systems RgD Needs 1-46 1.7.3 Electrical Systems RftD Needs 1-48 1.7.4 Maintenance R&D Needs 1-50 1.7.5 Safety and Environment R&D Needs ' 1-50
1.8 CONCLUDING REMARKS 1-50 REFERENCES 1-52
iii
2. PLASMA ENGINEERING 2-1 2.1 OPERATING SCENARIO 2-4
2.1.1 Prefill and Ionization (-0.05 s < t < 0.8 s) 2-4
2.1.2 Current Initiation and Ramp-up (0 s < t < 6 S) 2- 7
2.1.3 Bulk Heating (6 s < t < 12 s) 2-7 2.1.4 B u m (12 s < t < 112 s) 2- 8 2.1.5 Shutdown (112 s < t < 122 s) 2-9 2.1.6 Pumpdown (122 s < t < 152 s) 2-9
2.2 RF-ASSISTED CURRENT STARTUP 2-9 2.2.1 Electron Heating and Confinement Prior
to Current Initiation 2-11 2.2.2 Current Initiation and Ramp-up 2-15 2.2.3 Summary - RF-Assisted Startup 2-22
2.3 ICRP HEATING FOR FED 2-23 2.3.1 ICRF Heating Modes on FED 2-24 2.3.2 Nave and Transport ICRF Modeling for FED .... 2-25 2.3.3 Discussion and Conclusions 2-29
2.4 PLASMA PERFORMANCE MODELING WITH NEUTRAL BEAM INJECTION 2-35 2.4.1 The POPCON Method of Analysis 2-36 2.4.2 The Reference Physics Model 2-36 2.4.3 Optimal Heating During Startup 2-53 2.4.4 Beam Energy and Species Mix 2-58 2.4.5 Variations in the Transport Model 2-61 2.4.6 Projections for 10 T Operation 2-66 2.4.7 Control of the Density Profile 2-72 2.4.8 The Heating Profile 2-73 2.4.9 Summary — Plasma Performar.ee Modeling
with Neutral Beam Injection 2-75 2.5 BETA CONSIDERATIONS 2-76
2.5.1 Theoretical Assessments 2-76 2.5.2 Experimental Indications 2-80 2.5.3 Choices of eBp, K, and 6 2-83 2.5.4 Conclusions and Future Work 2-89
2.6 POWER, PARTICLE, AND IMPURITY HANDLING 2-91 2.6.1 FED Pump Limiter/Divertor Requirements 2-91 2.6.2 Puap Limiter Design 2-94 2.6.3 Pump Limiter Analysis 2-100 2.6.4 Cold Plasma-Edge Analysis 2-112 2.6.5 Poloidal Divertor 2-118 2.6.6 Optimization of a Compact Bundle Divertor
for FED 2-129 2.7 POLOIDAL FIELD CONFIGURATION 2-136
2.7.1 Choice of Baseline Configuration 2-137 2.7.2 Poloidal Field Configurations
for Pump Limiter 2-140
iv
2.7.3 Poloidal Field Configurations for Poloidal Divertor 2-144
2.7.4 Sensitivity to Plasma Variations 2-150 2.7.5 Conclusions and Future Work 2-153
2.8 PLASMA DISRUPTIONS 2-155 2.8.1 FED Disruption Characterization 2-15S 2.8.2 Disruption Avoidance and Survival in FED .... 2-162
2.9 SUMMARY - FED PLASMA ENGINEERING 2-167 REFERENCES 2-170 3. SYSTEMS ENGINEERING 3-1
3.1 Configuration Design and Integration 3-2 3.1.1 Design Requirements 3-2 3.1.2 FED Baseline Configuration 3-3 3.1.3 Configuration Options 3-12 3.1.4 Configuration Options for Future
Considerations 3-17 3.2 ASSEMBLY AND MAINTENANCE 3-24
3.2.1 Assembly Sequence of the Device 3-30 3.2.2 Maintenance 3-36 3.2.3 Conclusions 3-70
3.3 AVAILABILITY 3-71 3.3.1 Availability Requirements 3-72 3.3.2 Availability Assessment 3-74 3.3.3 FED System Availabilities 3-76 3.3.4 Reliability( Maintainability,
and Supportability 3-93 3.3.5 Conclusions 3-96
3.4 SYSTEM TRADE STUDIES 3-97 3.4.1 Comparison of FED Mission and Device
Alternatives 3-97 3.4.2 Toroidal Field Coil Configuration 3-104 3.4.3 Copper TF Coil Evaluation 3-106 3.4.4 Effect of TF Coils Designed for 8/10-Tesla
Operation on FED Perfornance and Cost 3-109 3.4.5 Effects of PF Coil Configuration on FED
Perforaance and Capital Cost 3-111 3.4.6 Variation of Capital Cost and Fusion Power as
a Function of Neutron Wall Loading 3-113 3.4.7 Plasaa Minor Radius Variation 3-115 3.4.8 Device Size and Cost Sensitivity to Number
of Pulses 3-116 3.4.9 Impact of e0p and q^ on FED Perforaance 3-118 3.4.10 Inboard Shield Thickness Trade Study
for FED 3-119 3.4.11 Variation in Fusion Power 3-121 3.4.12 Effects of a Circular Plasma and the
Elimination of the OH Solenoid 3-123 REFERENCES 3-126
v
4. MAGNETIC SYSTEMS 4-1 4.1 Toroidal Field Coil System 4-7
4.1.1 TF Coil Major Design Considerations 4-7 4.1.2 TF Coil Layout and Princip l Components 4-11 4.1.3 TF Coil Design Selection 4-41 4.1.4 TF Coil Alternate Structural Concepts 4-58 4.1.5 TF Coil Winding Design Analysis 4-65 4.1.6 TF Coil Structural Design Analysis 4-86 4.1.7 Future Work - TF Coil System 4-102
4.2 POLOIDAL FIELD COIL SYSTEM 4-105 4.2.1 PF Coil System Major Design
Considerations 4-105 4.2.2 Solenoid Layout 4-108 4.2.3 Exterior (Superconducting) Ring Coil
Layout 4-118 4.2.4 Internal (Normal) Ring Coils 4-129 4.2.5 PF Coil System Design 4-134 4.2.6 PF Coil Alternate Concepts 4-140 4.2.7 PF Coil Design Analysis 4-154 4.2.8 Future Work - PF Coil System 4-168
4.3 CRYOSTAT 4-170 4.3.1 Cryostat Major Design Considerations 4-170 4.3.2 Cryostat Layout and Principal Components .... 4-170 4.3.3 Cryostat Alternate Concepts 4-173 4.3.4 Cryostat Design Analysis 4-174 4.3.5 Future Work - FED Cryostat 4-176
REFERENCES 4-177 5. NUCLEAR SYSTEMS 5-1
5.1 KEY GUIDELINES AND REQUIREMENTS 5-5 5.2 TORUS DESIGN 5-14
5.2.1 Torus Requirements and Guidelines 5-16 5.2.2 Torus Baseline Description 5-17 5.2.3 Torus Baseline Performance 5-42 5.2.4 Torus Design Options 5-59 5.2.5 Future Work - Torus 5-76
5.3 FIRST WALL SYSTEM 5-76 5.3.1 First Wall Operating Conditions 5-76 5.3.2 First Wall Baseline Description 5-81 5.3.3 First Wall Baseline Performance 5-85 5.3.4 First Wall Design Options 5-105 5.3.5 Future Work - First Wall 5-118
5.4 MECHANICAL PUMP LIMITER 5-120 5.4.1 Pump LimiteT Requirements 5-122 5.4.2 Pump Limiter Baseline Description 5-124 5.4.3 Pump Limiter Baseline Performance 5-133 5.4.4 Pump Limiter Design Options 5-168 5.4.5 Future Work - P u p Limiter 5-182
vi
5.5 FED NUCLEAR ANALYSIS 5-183 5.5.1 Shield Design Criteria 5-187 5.5.2 Methods and Data 5-191 5.5.3 Bulk Shield Design 5-194 5.5.4 Duct Shield Design 5-241 5.5.5 Component Shield Design 5-251 5.5.6 Radioactivity Inventories and Afterheat 5-252 5.5.7 f Unresolved Issues and Future Needs 5-256
REFERENCES 5-258 6. PLASMA HEATING SYSTEM 6-1
6.1 PLASMA INITIATION AND STARTUP 6-3 6.1.1 Introduction 6-3 6.1.2 Requirements 6-3 6.1.3 Baseline Design Description 6-5 6.1.4 Baseline Design Performance 6-19 6.1.5 Options Considered 6-23 6.1.6 Future Effort — Plasma Initiation
and Startup 6-27 6.2 BULK HEATING 6-27
6.2.1 Introduction 6-27 6.2.2 RF (Baseline) Requirements 6-28 6.2.3 RF (Baseline) Design Description 6-30 6.2.4 RF (Baseline) Design Performance 6-54 6.2.5 Options and Trades 6-64 6.2.6 Future Work 6-70 6.2.7 NBI Alternate 6-72 6.2.8 NBI Requirements 6-73 6.2.9 NBI Design Description 6-77 6.2.10 NBI Performance 6-86 6.2.11 Options and Trades 6-96 6.2.12 Future Effort — Neutral Beam Injection
Heating 6-104 REFERENCES 6-106 7. ELECTRICAL SYSTEMS 7-1
7.1 POWER HANDLING AND CONVERSION 7-4 7.1.1 AC Power Systems 7-4 7.1.2 TF Coil Power Conversion 7-12 7.1.3 PF Coil Power Conversion 7-22 7.1.4 Superconducting Coil Protection 7-46
7.2 ELECTRICAL ENERGY STORAGE SYSTEM 7-70 7.2.1 Requirements 7-71 7.2.2 Baseline Design Description 7-71 7.2.3 Performance 7-74 7.2.4 Other Options 7-75 7.2.5 Conclusions 7-75
vii
7.3 ELECTROMAGNETIC ANALYSIS 7-75 7.3.1 Requirements 7-76 7.3.2 Baseline Design and Performance 7-77 7.3.3 Future Tasks 7-88
7.4 DIAGNOSTICS, INFORMATION, AND CONTROL SYSTEMS 7-90 7.4.1 Introduction 7-90 7.4.2 Diagnostic Requirements 7-93 7.4.3 Signal Levels and Environment 7-96 7.4.4 Baseline Diagnostics — Physical Aspects 7-99 7.4.5 Diagnostics for Control 7-106 7.4.6 Diagnostics for Performance Verification
and Optimization 7-108 7.4.7 Selected Instrument Layouts 7-112 7.4.8 Options to the Baseline 7-125 7.4.9 Future Work - Diagnostics 7-126 7.4.10 Information and Control System —
Introduction 7-126 7.4.11 INFACS Requirements 7-127 7.4.12 Baseline Description 7-128 7.4.13 Future Work - Control and Data Systems 7-139
REFERENCES 7-141 8. AUXILIARY SYSTEMS 8-1
8.1 FUELING SYSTEM 8-1 8.1.1 Fueling System Requirements 8-2 8.1.2 Fueling System Baseline Description 8-2 8.1.3 Fueling System Control and Performance 8-10 8.1.4 Conclusions — Fueling System 8-13
8.2 VACUUM PUMPING SYSTEM 8-13 8.2.1 Vacuum Pumping System Design Requirements ... 8-14 8.2.2 Vacuum Pumping System Baseline Design
Description 8-16 8.2.3 Vacuum Pumping System Performance 8-21 8.2.4 Vacuum Pumping System Design Options
and Basis fox Selection 8-26 8.2.5 Future Work — Vacuum Pumping System 8-28
8.3 TRITIUM SYSTEMS 8-29 8.3.1 Tritium System Design Requirements 8-29 8.3.2 Tritium System Design Description 8-31 8.3.3 Tritium System Design Options 8-38 8.3.4 Future Work — Tritium Systems 8-39
8.4 REFRIGERATION SYSTEM 8-40 8.4.1 Major Design Considerations 8-40 8.4.2 Refrigeration System Baseline
Configuration 8-43 8.4.3 Refrigeration System Alternate Concepts 8-45 8.4.4 Refrigeration System Design Analysis 8-46 8.4.5 Future Work — Refrigeration System 8-53
viii
8.5 REMOTE MAINTENANCE EQUIPMENT 8-55 8.5.1 General Requirements 8-55 8.5.2 Items of Remote Maintenance Equipment 8-55 8.5.3 Remote Maintenance System Options 8-65 8.5.4 Future Work - Remote Maintenance
Equipment 8-65 REFERENCES 8-67 9. FACILITIES DESCRIPTION 9-1
9.1 REACTOR BUILDING AND HOT CELL FACILITY 9-1 9.1.1 Reactor Building 9-1 9.1.2 Hot Cell Facility 9-14
9.2 ADDITIONAL FACILITIES 9-20 9.2.1 Cooling System Structures 9-25 9.2.2 Power Supply and Energy Storage Buildings ... 9-27 9.2.3 Miscellaneous Buildings 9-28 9.2.4 Miscellaneous Structures and Building
Work , ..V : 9-29 9.2.5 Ventilation Stack 9-30
REFERENCE ..... ^ 9-31 10. COST AND CONSTRUCTION SCHEDULE PROJECTION 10-1
10.1 COST PROJECTION 10-1 10.2 CONSTRUCTION SCHEDULE PROJECTION 10-10
11. SAFETY AND ENVIRONMENT ....; II7I 11.1 ENVIRONMENT ' 11-1
; 11.2 SAFETY ; 11-2 11.2.1 Safety Standards and Criteria - 11-2 11.2.2 „ Potential Radiological Consequences 11-11
* • 11.2.3 Protection Systems : 11-13 11.2.4 Lithium Metal Tbst Modules 11-13 1-1.2.5 Natural Phenomena' 11-14
REFERENCES 1 1 - 1 6
APPENDIX A ....;..... A-l APPENDIX B B-l
ix
ABSTRACT
The U.S. Magnetic Fusion Engineering Act of 1980 calls for the operation of a Fusion Engineering Device (FED) by 1990. It is the intent of the Act that the FED, in combination with other testing facilities, will establish the engineering feasibility of magnetic fusion energy. During 1981, the Fusion Engineering Design Center (FEDC), under the guidance of a Technical Management Board (TMB), developed a baseline design for the FED. This design is summarized herein.
The device has a major radius of 5.0 m with a plasma minor radius of 1.3 m elongated by 1.6. Capability is provided for operating the toroidal field coils up to 10 T, but the bulk of the operations is designed for 8 T. At 8-T conditions, the fusion power is ^180 MW
2 (neutron wall loading ^0.4 MW/m ) and a plasma Q of <v5 is expected. At 10-T conditions, which are expected to be limited to about 10% of the
2 total operations, the fusion power is *\450 MW ("x»1.0 MW/m ) and ignition is expected.
Based on constant 1981 dollars, the projected direct capital cost of the FED is $1044 million and the total capital cost (direct plus indirect) is estimated to be $2172 million. The construction schedule from the beginning of preliminary design through the end of pre-operational testing is estimated to take seven years and eight months (92 months).
As presently envisioned, there will be four phases of device operation. These phases are: integrated systems checkout, occupying the first year of operation; a hydrogen or deuterium phase expected to require an addi-tional two years; a D-T plasma bum phase of one-year duration; and the remainder of the presumed 10-year facility life devoted to D-T engineering testing.
Although feasible solutions were developed for each of the major systems and subsystems of the FED baseline, further design effort is expected to yield significant improvement in the design. Key design issues are identified, which if resolved, could enhance the feasibility and/or reduce the cost of FED. In addition, the critical technological research and development required to perform final design and to build the FED are identified.
x
The FY 1981 FED activities focused on the development of a concept and supporting programs for moving ahead with the demonstration of engineering feasibility. The baseline design, along with the supporting information, constitutes a basis upon which a full design effort can be initiated.
xi
ACKNOWLEDGMENTS
We wish to acknowledge the dedication and skill of Linda Caldwell, Shir1ene Dale, Nancy Raulston, Sandra Vaughan, and Kathie Zell, who provided the secretarial services essential to preparation of this report. We appreciate their pleasant and willing attitude which was maintained through numerous retyping efforts. We also wish to thank Paul Fogarty and Bill Kunselman for the high level of cooperation in the preparation of many of the drawings and figures and E. L. Watkin and staff for preparation of all the final artwork for the document. We express our thanks to Christina Sekula and her colleagues for their assistance in final layout, proofing, and processing the document. Without their efforts, this report would not have been possible.
In the technical area, we would like to acknowledge the collabora-tive involvement of the "Resource Physicists" who made significant contributions in the design evolution as well as in the physics analysis of the FED. These individuals and their technical area of involvement are: B. A. Carreras — Disruption Characterization; W. A. Houlberg — Particle and Power Flux; H. C. Howe — Pump Limiter; D. Q. Hwang — ICRH Heating; J. A. Schmidt — Poloidal Divertor; L. D. Stewart — Neutral Beam Heating; M. Ulrickson — Pump Limiter; J. Wesley — Disruption Control. The coordination of the "Resource Physicists" input with Design Center personnel was carried out by J. F. Lyon who also made significant contributions in documenting the Plasma Engineering chapter. The overall guidance of the "Resource Physicists" effort and development of the FED physics basis was provided by Paul H. Rutherford.
Finally, we wish to acknowledge the involvement of J. F. Clarke, Deputy Director of the Office of Fusion Energy, Office of Energy Research, U.S. Department of Energy, and the members of the Technical Management Board who provided guidance for the FED activities in FY 1981.
C. A. Flanagan G. E. Smith D. Steiner - Editors
xii

M. Anderson S. E. Attenberger R. J. Barrett J. F. Baur K. L. Black S. K. Borowski G. Bronner J. N. Brooks T. G. Brown B. A. Carreras B. A. Cramer J. P. Davisson R. W. Derby
B. A. Engholm C. A. Flanagan G. M. Fuller S. K. Ghose G. E. Gorker M. W. Griffin J. R. Haines L. M. Hively J. A. Holmes N. u. Homeyer R. J. Hooper J. C. Hosea
LIST OF CONTRIBUTORS*
W. A. Houlberg H. C. Howe B. L. Hunter D. Q. Hwang G. J. Inukai S. S. Kalsi S. Kim J. Kirchner J. F. Lyon R. McGrath D. K. Metzler D. Mikkelsen J. G. Hurray W. D. Nelson M. Pelovitz Y-K. M. Peng M. Petravic D. E. Post R. L. Reid W. T. Reiersen M. L. Rogers J. A. Rome P. H. Sager J. A. Schmidt J. Schultz
S. W. SchwenteTly T. E. Shannon S. S. Shen
C. E. Singer G. E. Smith P. T. Spampinato V. C. Srivastava
D. Steiner L. D. Stewart N. L. Stirling W. Stodiek D. J. Strickler R. J. Thome S. L. Thomson C. A. Trachsel L. R. Turner M. Ulrickson
H. F. Vogel J. Wesley S. Whitley J. B. Wilgen W. R. Wing K. F. Wu
K. M. Young
'contributor affiliations are footnoted at the beginning of each chapter.
xiii
LIST OF FIGURES
1-1 The FED design evolution process 1-4 1-2 FED reference configuration, elevation view 1-12 1-3 FED reference configuration, plan view 1-13 1-4 Torus support spool 1-16 1-5 Torus assembly 1-17 1-6 FED magnetic system arrangement 1-19 1-7 FF.D first wall system 1-22 1-8 FED facility site layout 1-28 1-9 FED operating phases 1-29 1-10 Timetable for FED testing 1-31 1-11 FED summary construction schedule 1-39 2-1 Typical FED plasma behavior suggested for the 8-T
operation 2-6 2-2 Schematic illustration of electron heating near
the UHR region prior to current initiation 2-13 2-3 Time behavior of I p, Tfi, P Q h , V^, and V r e g in FED
during an expanding radius startup 2-19 2-4 Time behavior of I p, T g, P Q h , and V r g s in FED
during an expanding radius startup 2-20 2-5 Time behavior of I , T , P . , V., and V in FED
p e oh £ res during an expanding radius startup 2-21
2-0 RF power deposition profile obtained from wave theory and used in Baldur transport code 2-28
2-7 Volume averaged 3 for 32 MW of rf power at various pulse length 2-30
2-8 Volume averaged and central ion temperature for 32 MW of rf power at 4.5 s pulse 2-31
2-9 Volume averaged 3 for a 6-s pulse at various power levels 2-32
2-10 Evolution of ion temperature profile for the 26-MW case shown in Fig. 2-9 2-33
2-11 Volume averaged and central ion temperature for a 6-s rf pulse at 28 MW 2-34
2-12 To force a 1-1/2-D time-dependent transport code to scan a prescribed range of <n>-<T> space 2-37
2-13 Equilibrium neutral fraction for a deuterium beam in deuterium gas 2-40
2-14 Supplementary neutral beam power contours for steady-state operation for reference FED physics model 2-41
2-15 Total fusion power output contours for steady-state operation for reference FED physics model 2-43
EO 2-16 Plasma energy multiplication factor, Q = P_ S / P R .
contours for steady-state operation V 2-44 2-17 Average toroidal beta contours, including fast beam
ion and alpha pressure contributions 2-45 2-18 Average poloidal beta contours, including fast beam
ion and alpha pressure contributions 2-46
xiv
2-19 Central electron and ion temperature contours for steady-state operation 2-47
2-20 Example of a steady-state operating regime which meets prescribed physics and engineering constraints 2-48
2-21 Evolution of the electron and ion temperature profiles for a P0PC0N sweep at <ng> = 7.0 x 1013 cm-3 2-50
2-22 Evolution of the electron, deuterium, and tritium density profiles for a POPCON sweep at <ng> = 7.0 x 1013 cm-3 2-51
2-23 Evolution of the normalized heating profiles for the 150-, 75-, and 50-keV neutral beam components 2-52
2-24 Evolution of the total neutral beam, fusion, and beam plus fusion heating profiles 2-54
2-25 Optimal heating path for startup 2-56 2-26 Neutral beam heating time as a function of constant
heating power 2-57 2-27 Power requirements for an optimal 6-s startup, P|,
OO and saddle point powers, Pg 2-59
2-28 Idealized source power requirements for a 6-s startup 2-60
2-29 Power delivered to the plasma, by energy component, as a function of beam energy and species mix 2-62
2-30 Supplementary neutral beam power contours for steady-state operation using a PLT-like transport model for FED 2-64
2-31 Example of a steady-state operating regime for FED with a PLT-like transport model 2-65
2-32 Power requirement for an optimal 6-s startup, P®, OO
and saddle point powers, Pg 2-67 2-33 Idealized source power requirements for a 6-s startup
as a function of species mix and energy 2-68 2-34 Power delivered to the plasma, by energy component,
as a function of beam energy and species mix 2-69 2-35 Supplementary neutral beam power contours for
steady-state operation using BTq = 4.5 T 2-70 2-36 Example of a steady-state operation regime with
B T o = 4.5 T 2-71 2-37 Supplementary power requirements for steady-state
operation 2-74 2-38 Region of ballooning instability for fixed q(\|>) 2-78 2-39 The improved pressure function depicted in the shear
(d£nq/dlnp) and pressure gradient (dp/dip) space 2-79 2-40 Schematic dependences of XP in EB , reflecting
a soft limit in B 77 " 2-82 P 2-41 The value of C in Eq. (2-5) as a function of eB
and q^ 2-84
x v

2-42 The value of C in Eq. (2-5) as a function of e8 and the triangularity 6 ? 2-85
2-43 The dependence of n t E e on eSp and < with constant q^ as expressed in Eq. (2-9) 2-88
2-44 The FED pump limiter configuration 2-95 2-45 The calculated heat and particle loads along the top
surface of the FED pump limiter 2-96 2-46 Plasma parameters in the pump limiter duct for the
high edge flux case 2-98 2-47 Plasma parameters in the pump limiter duct for the
low edge flux case 2-99 2-48 Maximum heat flux (0 ) incident on the flat surface
of the FED limiter 2-105 2-49 (a) Ratio of the leading edge heat flux ( Q ^ ) (b) Ratio
of the maximum possible leading edge heat flux to the design value as a function of 0. 2-109
2-50 ICRF-driven Q = 5 with Fe 7 2-114 2-51 Neutral beam driven Q - 5 with Fe 2-115 2-52 ICRF driven Q = 5 with carbon 2-117 2-S3 Possible poloidal divertor configuration for FED 2-119 2-54 Heat flux distributions of divertor plates 2-120 2-55 Geometry for the FED poloidal divertor calculation 2-122 2-56 Plasma conditions along the field line for the
center of the poloidal divertor 2-123 2-57 Neutral pressure along the center of the poloidal
divertor 2-124 2-58 Plasma flow velocity along the field line for the
center of the poloidal divertor 2-125 2-59 Density profile in the poloidal divertor 2-126 2-60 Ion temperature profile in the FED poloidal
divertor 2-127 2-61 Geometry of the double-T divertor labeled to show
optimizable parameters 2-131 2-62 Contours of constant ripple for the high-beta FED
plasma with an optimized, double-T divertor 2-133 2-63 On-axis ripple (£) versus scrapeoff layer thickness
(T ) for various optimized divertors on FED 2-134 2-64 (a) A puncture plot for a banana-trapped, collisionless
150-keV D + ion (b) Summary of collisionless confinement 2-135
2-65 Possible locations for inboard EF coils in the hybrid PF configurations 2-138
2-66 PF coil concepts omitting the inboard EF coils 2-139 2-67 (a) Baseline poloidal field coil configuration
and a typical sequence of poloidal flux plots 2-141 2-68 Plasma and coil current waveforms for the 8-T operation
with plasma parameters shown in Table 2-12 2-143 2-69 Plasma and EF coil current waveforms for the 10-T
operation 2-146
xvi
2-70 Poloidal field coil configuration for the poloidal divertor option 2 - 1 4 8
2-71 Plasma and coil current waveforms for 8-T poloidal divertor operation 2-149
2-72 Using the baseline EF coil concept, the plasma scrapeoff region is disconnected by the presence of a contained separatrix 2-151
2-73 The closure of the scrapeoff flux surface 2-152 2-74 Using the baseline coil configuration, the scrapeoff
flux surface becomes closed 2-154 2-75 Numerical results of a characteristic disruption
process 2-159 3-1 FED elevation view 3-4 3-2 FED plan view 3-5 3-3 Dedicated torus sectors 3-7 3-4 FED device radial build . 3-8 3-5 Plan view of TF intercoil structure 3-10 3-6 FED torus assembly sequence 3-11 3-7 Vacuum topology options 3-14 3-8 FED configuration options 3-20 3 - 9 FED configuration option to incorporate poloidal
divertor 3-21 3-10 FED configuration option which provides access
space for vacuum pump duct 3-22 3-11 FED isomotric sketch of removable shield module
option 3-23 3-12 Configuration option that locates lower internal EF
coil inside torus spool structure 3-25 3-13 FED configuration option that allows coil access
through the divertor module 3-26 3-14 FED configuration option with shield module design
with floor removed 3-27 3-15 FED configuration option with saddle coils located
in divertor module 3-28 3-16 FED configuration option with saddle coil located
in torus support structure 3-29 3-17 Initial assembly of the FED device 3-32 3-18 The TF coil/cryostat window allows for radial
extraction of the torus sectors 3 - 4 0 3-19 The spool arrangement provides vacuum integrity 3-42 3-20 The poloidal field coil locations are compatible
with the window concept 3-43 3-21 In-vessel manipulator operations are accomplished
through four ports 3 - 4 5 3-22 The disassembly of major components influenced the
configuration design 3 - 4 8 3-23 OH solenoid removal 3-58 3-24 Removal of the cryostat dome 3 - 5 9 3-25 EF coil #2 is stored in the laydown area on top of
the dome 3 - 6 0 3-26 Removal of EF coil #3 is a four-phase operation 3 - 6 2
xvii
3-27 Remote disassembly of EF coil #4 3-<r.6 3-28 FED coil system configuration 3-77 3-29 Coil system availability and FED mission time are
sensitive to the warmup and cooldown time 3-/8 3-30 FED torus system components 3-83 3-31 Torus system availability and mission time are
sensitive to torus pumpdown/bakeout time 3-85 3-32 Candidate PF configurations evaluated for FED
application 3-l 72 4-1 FED 8-T/10-T baseline magnetic system 4-3 4-2 Comparison of FED superconducting size/weight with
on-going DOE coil development programs 4-6 4-3 FED TF coil, intercoil support structure, bucking
cylinder, and pedestal support 4-14 4-4 Perspective cutaway view of TF coil, intercoil
support structure, and bucking cylinder 4-16 4-5 TF coil case cross section 4-18 4-6 TF coil gusset support modules 4-20 4-7 Intercoil support structure, cross section 4-22 4-8 Intercoil support structure, plan view - 4-23 4-9 TF coil pedestal support 4-2S 4-10 Bucking post design 4-27 4-11 Attachment collars on bucking post 4-29 4-12 ICCS conductor dimensions for TF coils 4-30 4-13 Winding pack configuration 4-34 4-14 Winding of TF coil pancakes with three conductors
in parallel 4-3S 4-15 Schematic of coil header region 4-36 4-16 Schematic of current leads routing 4-39 4-17 Main lead assembly 4-40 4-18 Baseline cavity configuration with R 0 - 5 4-42 4-19 NbTi winding cooled with superfluid helium pool 4-45 4-20 NbTi winding internally cooled 4-48 4-21 Nb3Sn winding cooled with helium pool 4-50 4-22 Two coil concept 4-52 4-23 FED 8-T/10-T baseline magnet system concept 4-66 4-24 Poloidal field coil current variation 4-67 4-25 Field distribution at TF coil midsurface at 10 T 4-68 4-26 Plasma field contribution at TF coil midsurface
at 10 T 4-70 4-27 Load distribution on TF coils at 10 T, at the end
of burn phase 4-71 4-28 Coil case losses during startup phase (6 s) 4-74 4-29 Plasma disruption loss profile at 10 T 4-75 4-30 Protection circuit 4-78 4-31 Winding performance during quench 4-80 4-32 Quench characteristics of TF coils for 10-T
and 8-T operation 4-81 4-33 Helium thermal capacity 4-85 4-34 Fracture mechanics allowable stress for 316 LN 4-89
xviii
4-35 PAFEC finite element model of FED TF coil 4-96 4-36 Cooling tube configuration for the TF coil case 4-101 4-37 Cooling tube configuration for the intercoil
support structure 4-103 4-38 PF system configuration 4-107 4-39 Solenoid conceptual design 4-111 4-40 50 kA PF conductor 4-112 4-41 Railroad spacer 4-114 4-42 Typical solenoid double pancake 4-115 4-43 Solenoid support details 4-117 4-44 Superconducting ring coil concept 4-120 4-45 Coil EF2 winding pack layout 4-122 4-46 Superconducting ring coil case concept 4-123 4-47 Coil EF2 case cross section 4-124 4-48 Flanged joint seals 4-127 4-49 Sliding pedestal supports 4-128 4-50 Coil EFi winding layout 4-132 4-51 Normal coil joint design 4-133 4-52 Normal coil coolant line layout 4-135 4-53 PF coil configuration development 4-139 4-54 Alternate PF coil concepts for 0.3 triangularity 4-141 4-55 Superconducting ring coil case options 4-146 4-56 100-kA channel type conductor 4-150 4-57 100-kA conductor channel support 4-152 4-58 Cryostat concept 4-171 5-1 Nuclear system components 5-2 5-2 FED radial buildup 5-15 5-3 Torus components 5-18 5-4 Torus spool 5-19 5-5 Torus spool construction 5-21 5-6 Torus shield sector 5-22 5-7 Sector-to-soctor gaps 5-24 5-8 Shield sector construction 5-25 5-9 Material distribution in FED outboard shield 5-26 5-10 Material distribution in FED inboard shield 5-27 5-11 Coolant flow manifolding concept 5-29 5-12 Shield sector extraction 5-30 5-13 Sector-to-sector electrical contact 5-34 5-14 Primary vacuum seal 5-35 5-15 Test module installation in outboard shield 5-37 5-16 TWo types of test module installation 5-38 5-17 Spool structure leak test 5-40 5-18 Configuration of helium puffer units required
for leak testing 5-41 5-19 Pressurized shield sector design 5-43 5-20 Amount of water required for cooling shield
sectors 5-45 5-21 Thermal response of first wall and shield to after-
heat for loss-of-coolant flow 5-48 5-22 Time required to reach bakeout temperature 5-49
xix
5-23 Effect of nitrogen flow rate on pumping power 5-5? 5-24 Loads applied for spool sizing 5-53 5-25 Spool finite element model 5-55 5-26 Top spool panel radial bending moment 5-56 1 *>7 Spool deflected shape under atmospheric and
shield load 5-58 S S p o o l structure material candidates 5-62 5-29 Shield sector coolant flow concepts 5-65 5-30 Separate tube concept penalizes shielding
effectiveness 5-67 5-31 Alternate design for pressurized sector 5-69 5-32 Dielectric break and seal concept 5-72 5-33 Alternate vacuum seal concepts 5-73 5-34 Configuration for an arcing contact 5-75 5-35 FED first^wall design concepts .. 5-77 5-36 Heatii^conditions during startup 5-80 5-37 Pa^srxvely cooled armor tile 5-82 5-38 ^ A c t i v e l y cooled outboard first wall panels 5-84 5-39-^ Boundary conditions for thermal model of plasma ^ ^ chamber 5-86 5-40 Maximum temperatures of graphite armor tiles 5-88 5-41 Thermal response of graphite tiles 5-89 5-42 Temperature distributions in graphite tiles 5-90 5-43 Effect of plasma edge condition on graphite tile
tenperatuvds 5-91 5-44 Relationship between surface heat flux and outboard
first wall thickness 5-93 5-45 Thermal response of outboard wall panels 5-94 5-46 Graphite erosion sensitivity to uncertainty
in thermal energy deposited 5-100 5-47 Armor tile erosion for various disruption
parameters - 5-102 5-48 Graphite armor erosion history 5-104 5-49 First wall temperatures 5-106 5-50 Armor tile attachment options 5-107 5-51 Tongue and groove armor attachment concept 5-109 5-52 Outboard first wall concepts 5-110 5-53 Thermal response of graphite tile outboard wall
to startup conditions 5-113 5-54' Movable startup limiter configuration 5-114 5-55 Thermal response of movable startup limiter 5-116 5-56 Effect of thickness on armor tile temperature 5-117 5-57 Erosion of a bare inboard wall concept 5-119 5-58 Mechanical pump limiter configuration 5-121 5-59 Plasma disruption heat loads on limiter 5-123 5-60 Mechanical puap limiter assembly 5-126 5-61 Pump limiter coolant manifolding arrangement 5-127 5-62 Puap limiter expendable protective surface
attachment 5-128 5-63 Fabrication features of pump limiter blade 5-129 5-64 Technique for brazing graphite to copper substrate 5-131 5-65 Limiter-to-limiter electrical contacts 5-132
xx
5-66 Heat flux and particle energy distributions along limiter surface 5-135
5-67 Maximum temperatures for limiter 5-137 5-68 Limiter tile temperature histories 5-138 5-69 Geometry for particle trapping model 5-142 5-70 Computational mesh for divertor cliannel code model 5-147 5-71 Central neutral pressure profile in limiter slot 5-148 5-72 Electron density in limiter slot 5-149 5-73 Physical sputtering yield for graphite 5-152 5-74 Physical sputtering erosion rate 5-153 5-75 Chemical erosion sputtering yield for
graphite 5-156 5-76 Distribution erosion of limiter graphite tiles 5-158 5-77 Sensitivity of limiter tile life to plasma edge
conditions 5-161 5-78 Potential impact of carbon deposition on net
erosion rate 5-162 5-79 Inlet pressure requirement for 10 T at leading
edge ..... 5-166 5-80 Inlet pressure requirement for 10 T at flat
surface 5-167 5-81 Limiter coolant inlet pressure requirement for
10 T 5-169 5-82 Options for mechanical pump limiter blade location 5-170 5-83 Sensitivity of heat and particle fluxes to e-fold
distance 5-172 5-84 Option for increasing limiter blade area 5-173 5-85 Pump limiter with neutralizing deflector plates 5-175 5-86 Thermal response of limiter blade tile/substrate
material options 5-179 5-87 FED neutronics concerns 5-184 5-88 Geometry for shield optimization study 5-197 5-89 FED outboard shield arrangements and resulting
external fluxes 5-200 5-90 Schematic, of the one-dimensional fusion reactor
blanket models for neutronic calculations 5-202 5-91 FED inboard shield schematic 5-203 5-92 Total neutron flux — FED inboard regions 5-205 5-93 Total photon flux — FED inboard regions 5-206 5-94 Nuclear heating rates in FED inboard regions
(shield water unborated) 5-209 5-95 Nuclear heating rates in FED inboard regions
(shield water borated) 5-210 5-96 Dpa in copper stabilizer in FED inboard TF coils 5-211 5-97 Radiation exposure of G10CR insulation in FED
inboard TF coils (shield water unborated) 5-212 5-98 FED outboard shield calculational model 5-213 5-99 First wall geometry 5-214 5-100 FED first wall neutron spectrum 5-216 5-101 FED first wall gamma spectrum 5-217 5-102 Neutron spectrum outside FED outboard shield 5-218
xxi
5-103 Gamma spectrum outside FED outboard shield 5-219 5-104 SS dpa in FED outboard shield 5-221 5-105 SS appm lie in FED outboard shield 5-222 5-106 Nuclear heating rates in FED outboard shield 5-223 5-107 Typical radionuclide distributions through
outboard regions 5-227 5-108 Geometry for path calculation 5-231 5-109 FED shutdown dose rate 1.15 m Nitronic 33/water bulk
shield plus 5 cm lead cladding 5-236 5-110 Inboard shield gap showing estimated neutron
fluxes 5-239 S-lll Gap streaming problems 5-240 5-112 Duct streaming problem 5-243 5-113 Total neutron flux in ETF duct shield 5-245 5-114 Shield for NBI alternate 5-246 5-115 ICRH launcher shield 5-247 5-116 Vacuum duct shield 5-248 5-117 Fuel injector shielding 5-250 5-118 FED operating level (rad/s in G10CR) 5-253 5-119 FED operating level in diagnostic penetrations
(rad/s in G10CR) 5-254 6-1 Plasma initiation and startup system
configuration 6-6 6-2 ECRH startup parameter tradeoffs of position,
frequency, and toroidal field 6-7 6-3 ECRH launcher interface stresses nuclear hardness
and ease of maintenance 6-10 6-4 Polarization rotation and refraction effects
of edge plasma . 6-11 6-5 ECRH transmission system configuration 6-13 6-6 ECRH rf generator configuration 6-15 6-7 12 pulse transformer-rectifier design 6-17 6-8 Summary of ECRH system power levels and
efficiencies 6-20 6-9 Summary of ECRH transmission system losses 6-21 6-10 ECRH optical transmission concept 6-26 6-11 Elevation view of the FED (with launcher exploded) 6-31 6-12 Plan view of the FED showing four launcher locations
and exploded view 6-32 6-13 16-MW module block diagram 6-34 6-14 ICRH system is modular 6-35 6-15 ICRH launchcr concept 6-37 6-16 ICRH transmission line system 6-38 6-17 4-MW combiner and frequency switching assembly 6-39 6-18 ICRH power amplifier - 4-MW module 6-41 6-19 Driver amplifier IPA chain 6-43 6-20 ICRH frequency generator 6-44 6-21 One phase of the three-phase 13.8-kV prime power 6-46 6-22 ICRH instrumentation and control 6-47 6-23 Process control interface unit 6-48
xxii
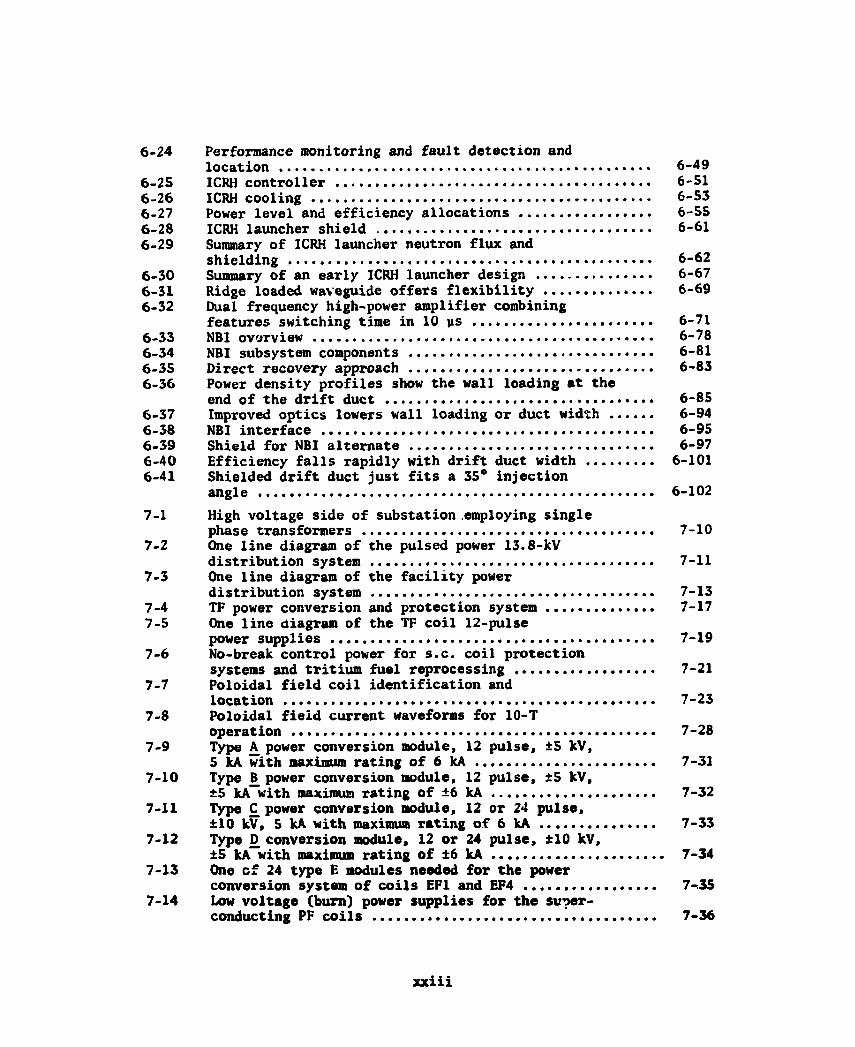
6-24 Performance monitoring and fault detection and location 6-49
6-25 ICRH controller 6-51 6-26 ICRH cooling 6-53 6-27 Power level and efficiency allocations 6-55 6-28 ICRH launcher shield 6-61 6-29 Summary of ICRH launcher neutron flux and
shielding 6-62 6-30 Summary of an early ICRH launcher design 6-67 6-31 Ridge loaded waveguide offers flexibility 6-69 6-32 Dual frequency high-power amplifier combining
features switching time in 10 ys 6-71 6-33 NBI ovorview 6-78 6-34 NBI subsystem components 6-81 6-35 Direct recovery approach 6-83 6-36 Power density profiles show the wall loading at the
end of the drift duct 6-85 6-37 Improved optics lowers wall loading or duct width 6-94 6-38 NBI interface 6-95 6-39 Shield for NBI alternate 6-97 6-40 Efficiency falls rapidly with drift duct width 6-101 6-41 Shielded drift duct just fits a 35° injection
angle 6-102 7-1 High voltage side of substation .employing single
phase transformers 7-10 7-2 One line diagram of the pulsed power 13.8-kV
distribution system 7-11 7-3 One line diagram of the facility power
distribution system 7-13 7-4 TF power conversion and protection system 7-17 7-5 One line diagram of the TF coil 12-pulse
power supplies 7-19 7-6 No-break control power for s.c. coil protection
systems and tritium fuel reprocessing 7-21 7-7 Poloidal field coil identification and
location 7-23 7-8 Poloidal field current waveforms for 10-T
operation 7-28 7-9 Type A power conversion module, 12 pulse, ±5 kV,
5 kA with maximum rating of 6 kA 7-31 7-10 Type B^power conversion module, 12 pulse, ±5 kV,
±5 kA with maximum rating of ±6 kA 7-32 7-11 Type £ power conversion module, 12 or 24 pulse,
±10 kV, 5 kA with maximum rating of 6 kA 7-33 7-12 Type D conversion module, 12 or 24 pulse, ±10 kV,
±5 kA with maximum rating of ±6 kA 7-34 7-13 One cf 24 type E modules needed for the power
conversion system of coils EF1 and EF4 7-35 7-14 Low voltage (burn) power supplies for the super-
conducting PF coils 7-36
xxiii
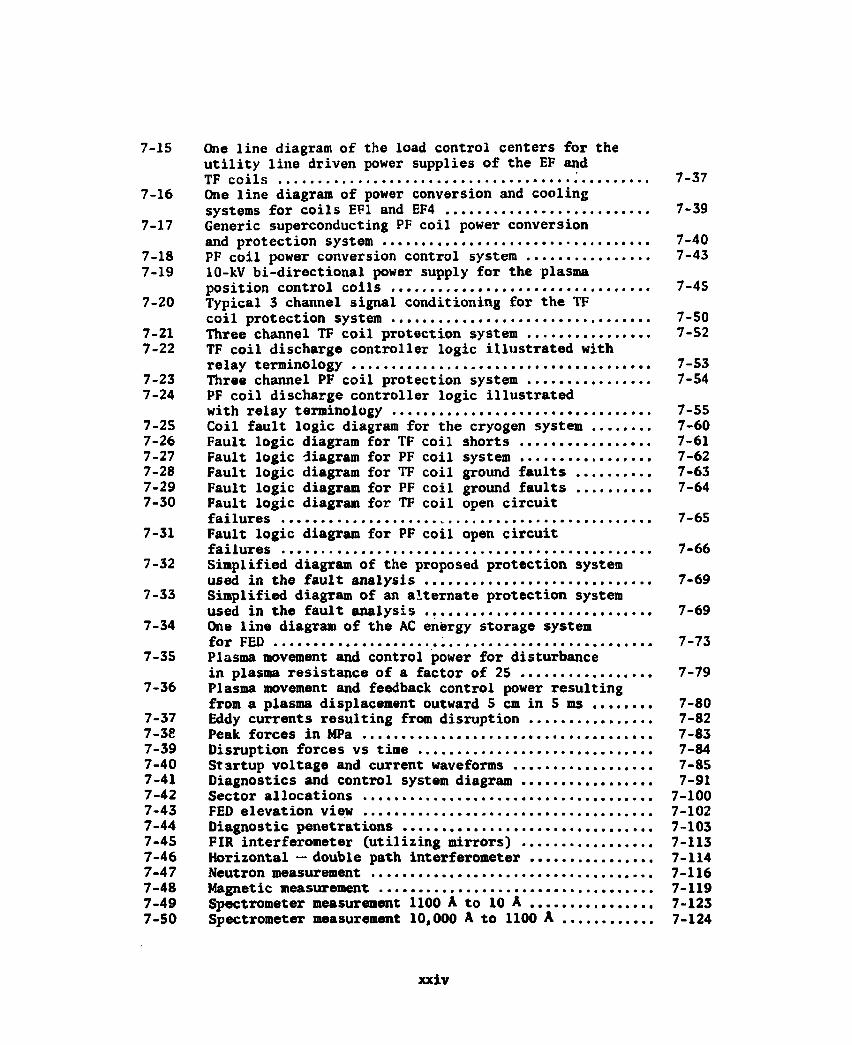
7-15 One line diagram of the load control centers for the utility line driven power supplies of the EF and TF coils 7-37
7-16 One line diagram of power conversion and cooling systems for coils EF1 and EF4 7-39
7-17 Generic superconducting PF coil power conversion and protection system 7-40
7-18 PF coil power conversion control system 7-43 7-19 10-kV bi-directional power supply for the plasma
position control coils 7-45 7-20 Typical 3 channel signal conditioning for the TF
coil protection system 7-50 7-21 Three channel TF coil protection system 7-52 7-22 TF coil discharge controller logic illustrated with
relay terminology 7-53 7-23 Three channel PF coil protection system 7-54 7-24 PF coil discharge controller logic illustrated
with relay terminology 7-55 7-25 Coil fault logic diagram for the cryogen system 7-60 7-26 Fault logic diagram for TF coil shorts 7-61 7-27 Fault logic diagram for PF coil system 7-62 7-28 Fault logic diagram for TF coil ground faults 7-63 7-29 Fault logic diagram for PF coil ground faults 7-64 7-30 Fault logic diagram for TF coil open circuit
failures 7-65 7-31 Fault logic diagram for PF coil open circuit
failures 7-66 7-32 Simplified diagram of the proposed protection system
used in the fault analysis 7-69 7-33 Simplified diagram of an alternate protection system
used in the fault analysis 7-69 7-34 One line diagram of the AC energy storage system
for FED 7-73 7-35 Plasma movement and control power for disturbance
in plasma resistance of a factor of 25 7-79 7-36 Plasma movement and feedback control power resulting
from a plasma displacement outward 5 cm in 5 ms 7-80 7-37 Eddy currents resulting from disruption 7-82 7-38 Peak forces in MPa 7-83 7-39 Disruption forces vs time 7-84 7-40 Startup voltage and current waveforms 7-85 7-41 Diagnostics and control system diagram 7-91 7-42 Sector allocations 7-100 7-43 FED elevation view 7-102 7-44 Diagnostic penetrations 7-103 7-45 FIR interferometer (utilizing mirrors) 7-113 7-46 Horizontal — double path interferometer 7-114 7-47 Neutron measurement 7-116 7-48 Magnetic measurement 7-119 7-49 Spectrometer measurement 1100 A to 10 A 7-123 7-50 Spectrometer measurement 10,000 A to 1100 A 7-124
xxiv
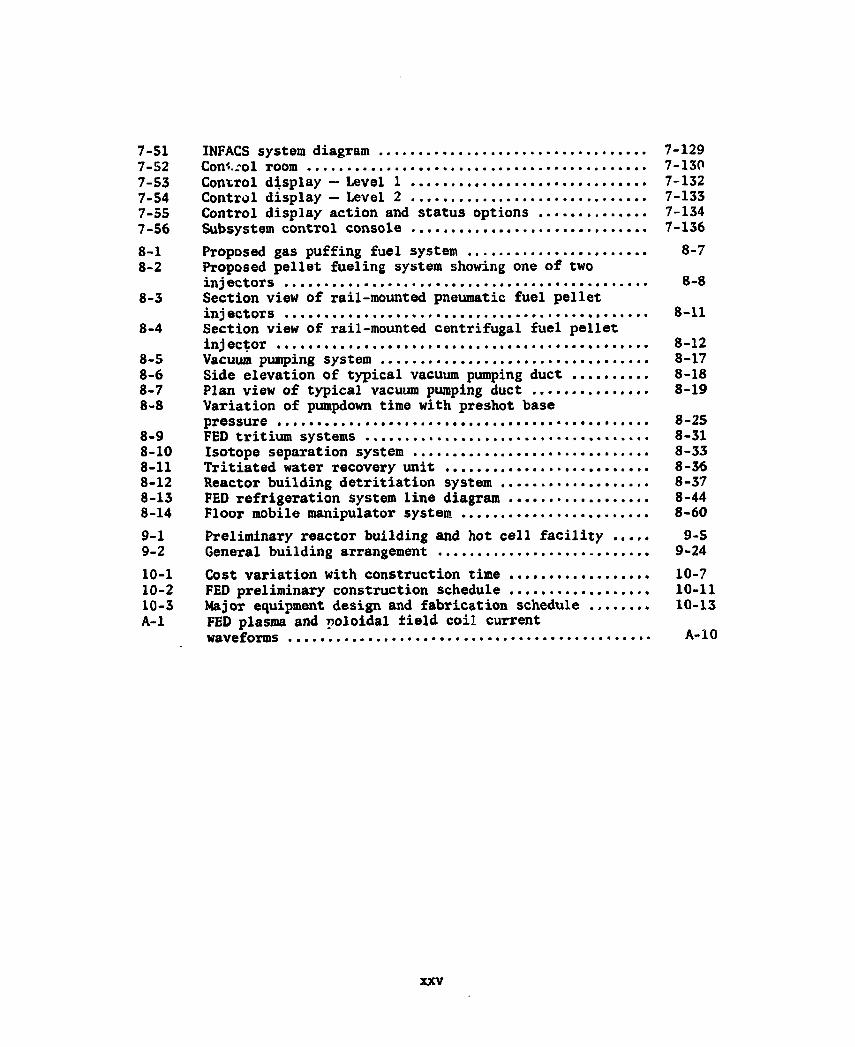
7-51 INFACS system diagram 7-129 7-52 Control room 7-130 7-53 Control display - Level 1 7-132 7-54 Control display - Level 2 7-133 7-55 Control display action and status options 7-134 7-56 Subsystem control console 7-136 8-1 Proposed gas puffing fuel system 8-7 8-2 Proposed pellet fueling system showing one of two
injectors 8-8 8-3 Section view of rail-mounted pneumatic fuel pellet
injectors 8-11 8-4 Section view of rail-mounted centrifugal fuel pellet
injector 8-12 8-5 Vacuum pumping system 8-17 8-6 Side elevation of typical vacuum pumping duct 8-18 8-7 Plan view of typical vacuum pumping duct 8-19 8-8 Variation of pumpdown time with preshot base
pressure 8-25 8-9 FED tritium systems 8-31 8-10 Isotope separation system 8-33 8-11 Tritiated water recovery unit 8-36 8-12 Reactor building detritiation system 8-37 8-13 FED refrigeration system line diagram 8-44 8-14 Floor mobile manipulator system 8-60 9-1 Preliminary reactor building and hot cell facility ..... 9-5 9-2 General building arrangement 9-24
10-1 Cost variation with construction time 10-7 10-2 FED preliminary construction schedule 10-11 10-3 Major equipment design and fabrication schedule 10-13 A-l FED plasma and poloidal field coil current
waveforms A-10
XXV
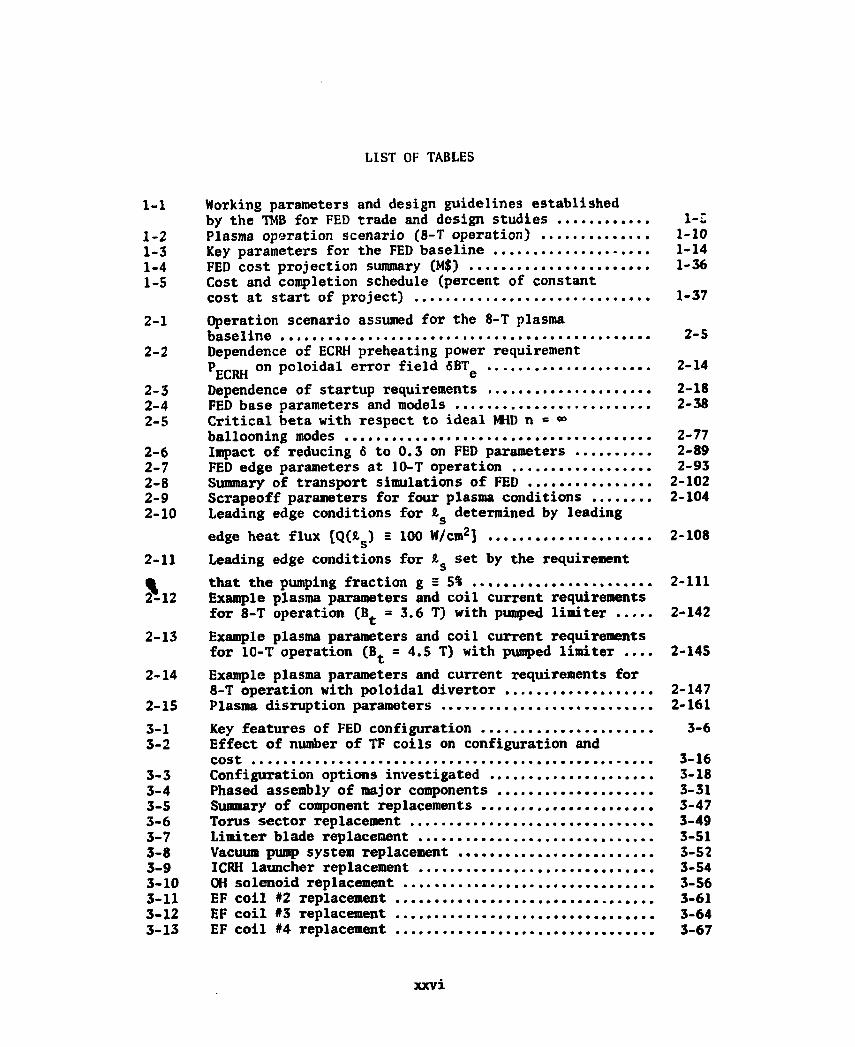
LIST OF TABLES
1-1 Working parameters and design guidelines established by the TMB for FED trade and design studies 1-C
1-2 Plasma operation scenario (8-T operation) 1-10 1-3 Key parameters for the FED baseline 1-14 1-4 FED cost projection summary (M$) 1-36 1-5 Cost and completion schedule (percent of constant
cost at start of project) 1-37 2-1 Operation scenario assumed for the 8-T plasma
baseline 2-5 2-2 Dependence of ECRH preheating power requirement
P__ D l l on poloidal error field SBT 2-14 b L K H e
2-3 Dependence of startup requirements 2-18 2-4 FED base parameters and models 2-38 2-5 Critical beta with respect to ideal MID n = «»
ballooning modes 2-77 2-6 Impact of reducing 6 to 0.3 on FED parameters 2-89 2-7 FED edge parameters at 10-T operation 2-93 2-8 Summary of transport simulations of FED 2-102 2-9 Scrapeoff parameters for four plasma conditions 2-104 2-10 Leading edge conditions for & s determined by leading
edge heat flux [Q(*s) = 100 W/cm2] 2-108 2-11 Leading edge conditions for £>s set by the requirement • that the pumping fraction g = 5% 2-111 2-12 Example plasma parameters and coil current requirements
for 8-T operation (Bt = 3.6 T) with punped limiter 2-142 2-13 Example plasma parameters and coil current requirements
for 10-T operation (Bt = 4.5 T) with pumped limiter .... 2-145 2-14 Example plasma parameters and current requirements for
8-T operation with poloidal divertor 2-147 2-15 Plasma disruption parameters 2-161 3-1 Key features of FED configuration 3-6 3-2 Effect of number of TF coils on configuration and
cost 3-16 3-3 Configuration options investigated 3-18 3-4 Phased assembly of major components 3-31 3-5 Summary of component replacements 3-47 3-6 Torus sector replacement 3-49 3-7 Limiter blade replacement 3-51 3-8 Vacuum pump system replacement 3-52 3-9 ICRH launcher replacement 3-54 3-10 OH solenoid replacement 3-56 3-11 EF coil #2 replacement 3-61 3-12 EF coil #3 replacement 3-64 3-13 EF coil #4 replacement 3-67
xxvi
3-14 TF coil replacement 3-69 3-15 FED plan of operations 3-73 3-16 FED system availabilities 3-75 3-17 Coil system availability drivers 3-79 3-18 FED coil failure rates 3-80 3-19 Torus system availability drivers 3-86 3-20 FED control diagnostics 3-91 3-21 Ex-reactor system availabilities 3-92 3-22 FED spares costs and associated parameters for
selected components 3-95 3-23 Trade studies conducted for FED 3-98 3-24 Mission alternatives for the FED 3-99 3-25 Features and requirements of devices associated with
the FED mission alternatives 3-101 3-26 Device parameters for alternative FED missions 3-102 3-27 Effects of number of TF coils on configuration and
cost (access limited) 3-105 3-28 Effect of number of TF coils on configuration and cost
(2% ripple) 3-105 3-29 Selected parameters for a copper TF device compared
to FED 3-107 3-30 Relative capital costs for copper TF coil device
compared to FED 3-108 3-31 Electrical power cost for 800 MM 3-108 3-32 Performance and cost of candidate FED configuration .... 3-110 3-33 Cost and performance for alternate PF configurations ... 3-114 3-34 Trade study results 3-124
4-1 FED magnetic system parameters 4-4 4-2 FED TF coil requirements and parameters 4-9 4-3 FED structural design criteria 4-12 4-4 TF coil case wall thicknesses 4-17 4-5 Internally cooled cable supercondcutor (ICCS)
parameters 4-31 4-6 TF coil data for 8-T and 10-T operation 4-33 4-7 Summary of losses in alternate TF coil concept
(Losses averaged over one cycle period) 4-46 4-8 Weight and cost estimates for three configurations 4-54 4-9 Cost comparison among various FED TF coil concepts 4-56 4-10 Alternate design options 4-57 4-11 Comparison of structural alternatives 4-59 4-12 Summary of TF coil heat loads (time averaged over
152-s pulse period) 4-72 4-13 Winding ac losses (time averaged over 152-s pulse
period) 4-76 4-14 TF coil discharge data 4-79 4-15 TF coil winding stability data 4-84 4-16 Mechanical properties of TF coil structural metals 4-87 4-17 Mechanical properties and fatigue stress limit for
G-10 epoxy fiberglass at 4 K 4-88 4-18 Fatigue life of winding insulation 4-91 4-19 Summary of TF coil system structural analysis
result 4-99
xxvii
4-20 PF system configuration 4-106 4-21 Central solenoid design parameters 4-110 4-22 Superconducting ring coil design parameter 4-119 4-23 Normal ring coil design parameters 4-130 4-24 Cost of EF coil concepts 4-142 4-2S Alternate design studies 4-143 4-26 Comparison of solenoid conductor designs 4-153 4-27 Forces on central solenoid at time zero 4-156 4-28 Net forces on ring coils at time 112 s (end of
b u m phase) 4-157 4-29 Summary superconducting ring coil structural
evaluation 4-162 4-30 PF coil discharge voltages 4-166 4-31 Peak temperature reached in a shorted PF coil turn 4-167 4-32 Required wall thickness for cryostat 4-175 5-1 Four-phase operating scenario for FED 5-6 5-2 FED nuclear systems parameters 5-7 5-3 Plasma edge models 5-10 5-4 Disruption parameters (phases II or IV, or 100-MJ
plasma thermal energy) 5-12 5-5 Variation of disruption characteristics with
operating phase 5-13 5-6 Baseline design coolant passage spacings 5-44 S-7 Shield coolant flow requirements 5-46 5-8 FED vacuum chamber bakeout parameters 5-51 5-9 Shield coolant flow system performance at 10 T 5-60 5-10 Chemical composition and sone physical properties 5-63 5-11 Coolant passage spacings 5-66 5-12 First wall conditions during normal operation 5-78 5-13 First wall coolant flow parameters 5-92 5-14 Comparison of first wall armor tile erosion rates
for nominal and worst-case parameter values 5-101 5-15 Comparison of start-up limiter configurations 5-112 5-16 Design conditions for limiter 5-122 5-17 Coolant system performance 5-139 5-18 Disruption erosion 5-157 5-19 Limiter surface erosion rates 5-159 5-20 Protective surface design options 5-176 5-21 Comparison of limiter tile material candidates 5-177 5-22 Braze cycle stresses 5-180 5-23 FED working parameters and bulk shield performance 5-185 5-24 FED shield design criteria 5-188 5-25 DLC-41 25/21 energy-group structure 5-192 5-26 LASL 30/12 energy-group structure 5-193 5-27 Activation cross sections (barns) for onedant runs 5-195 5-28 Effect of angular quadrature 5-198 5-29 Effect of albedo value at external boundary 5-198 5-30 Effect of removing boron from water 5-199 5-31 Dimensions and compositions for FED inboard shield
problem 5-204
xxviii
5-32 Nuclear heating by inboard region (W/cm) 5-208 5-33 Total nuclear heating rates per cm of torus 5-220 5-34 Compositions used in neutronics study ••(»•••••••«••(••• 5-225 5-35 Half lifes and emissions of troublesome activation
products 5-228 5-36 FED parameters for activation study 5-229 5-37 Twenty-four-hour shutdown dose rates 5-232 5-38 Twenty-four-hour shutdown dose rates 5-234 5-39 TWenty-four-hour shutdown dose rates 5-235 5-40 Radioactivity inventories 5-255 5-41 FED nuclear analysis 5-256 6-1 Rf requirements for startup 6-4 6-2 Supply parameters for gyrotron oscillator 6-16 6-3 Instrumentation and control data 6-18 6-4 Rf bulk heating parameters/requirements 6-29 6-5 ICRH bulk heating system features 6-33 6-6 Example startup microschedule sequence 6-52 6-7 Loss budget 6-56 6-8 Freon system parameter 6-58 6-9 NBI requirements for NBI task team studies 6-74 6-10 Parameters for use in positive ion neutral beam
studies on FED 6-75 6-11 Constraints and guidelines 6-76 6-12 NBI characteristics 6-79 6-13 Code input parameters 6-87 6-14 Example code output for four beamline injecting
M O Mil 6-88 6-15 NBI issues 6-90 6-16 Source size trade study data 6-98 7-1 Estimate of major FED loads on the pulsed line 7-6 7-2 Estimate of facility power loads 7-7 7-3 Utility line and backup power requirements 7-9 7-4 TF coil power converter and protection requirements.
data 7-15 7-5 TF converter and protection system design data 7-16 7-6 PF power conversion systems requirements data 7-25 7-7 Poloidal field coil data 7-26 7-8 Poloidal field coil inductance/resistance matrix
(inductance — millihenries, resistence — milliohms) .... 7-27 7-9 Poloidal field power conversion and protection
system data 7-29 7-10 PF coil power supply modules and synthesis 7-41 7-11 TF and PF coil protection system logic 7-57 7-12 TF and PF coil protection system logic 7-58 7-13 SC coil protection parameters 7-59 7-14 MGF energy storage requirements data 7-67 7-15 Energy storage system design data 7-72 7-16 Maximum currents in structures 7-81 7-17 Induced voltages during disruptions 7-81 7-18 Energy expenditure during first 55 ms of startup 7-81
xxix
7-19 Areas of instrument need 7-95 7-20 FED phases of operation 7-95 7-21 First wall signal levels and environment 7-97 7-22 Threshold damage levels, permanent damage effects 7-105 7-23 Diagnostics for real time control 7-107 7-24 Diagnostics for analyzing and optimizing performance ... 7-109 8-1 Data base for fuel system design 8-3 8-2 Pellet injector requirements data 8-4 8-3 Gas puffer design data „ 8-5 8-4 Nomenclature used in Figs. 8-1 and 8-2 8-9 8-5 Vacuum system requirements 8-15 8-6 Vacuum system parameters 8-20 8-7 Vacuum system performance 8-22 8-8 Reference FED tritium parameters 8-30 8-9 Cryogenic loads on the FED system and helium
coolant flows 8-42 8-10 Temperatures and pressures in the FED cryogenic
refrigeration system 8-48 8-11 Entropy inventory — FED refrigerator 8-50 8-12 FED remote maintenance equipment list 8-56 9-1 Tokamak building characteristics 9-6 9-2 Summary of tokamak building size estimate 9-7 9-3 Summary of possible design objectives to reduce the
probability and consequences of tritium release 9-9 9-4 Major equipment for hot cell maintenance 9-16 9-5 Hot cell description and sizes 9-17 9-6 Hot cell facility characteristics 9-18 9-7 Hot cell maintenance equipment list 9-19 9-8 Building sizes 9-21 9-9 Construction type 9-23 9-10 Approximate peak thermal power 9-27 10-1 Cost estimate summary 10-2 10-2 Cost and completion schedule 10-5 10-3 Cost workshop summary 10-9 10-4 Summary of major construction and installation
assumptions 10-16 10-5 Schedule drivers 10-17 11-1 Summary of the suggested FED operating conditions ^ 11-4 11-2 Suggested radiological consequences guidelines
for FED 11-5 11-3 Suggested general confinement characteristics 11-8
XXX

5. NUCLEAR SYSTEMS
P. H. Sager* G. M. Fuller1" M. W. Griffin + +
K. L. Black + + J. R. Haines^ J. N. Brooks* G. J. Inukai^* B. A. Cramer J.
f Kirchner
J. P. Davisson^ R. McGrath** B. A.
§ Engholm C. A. Trachsel**
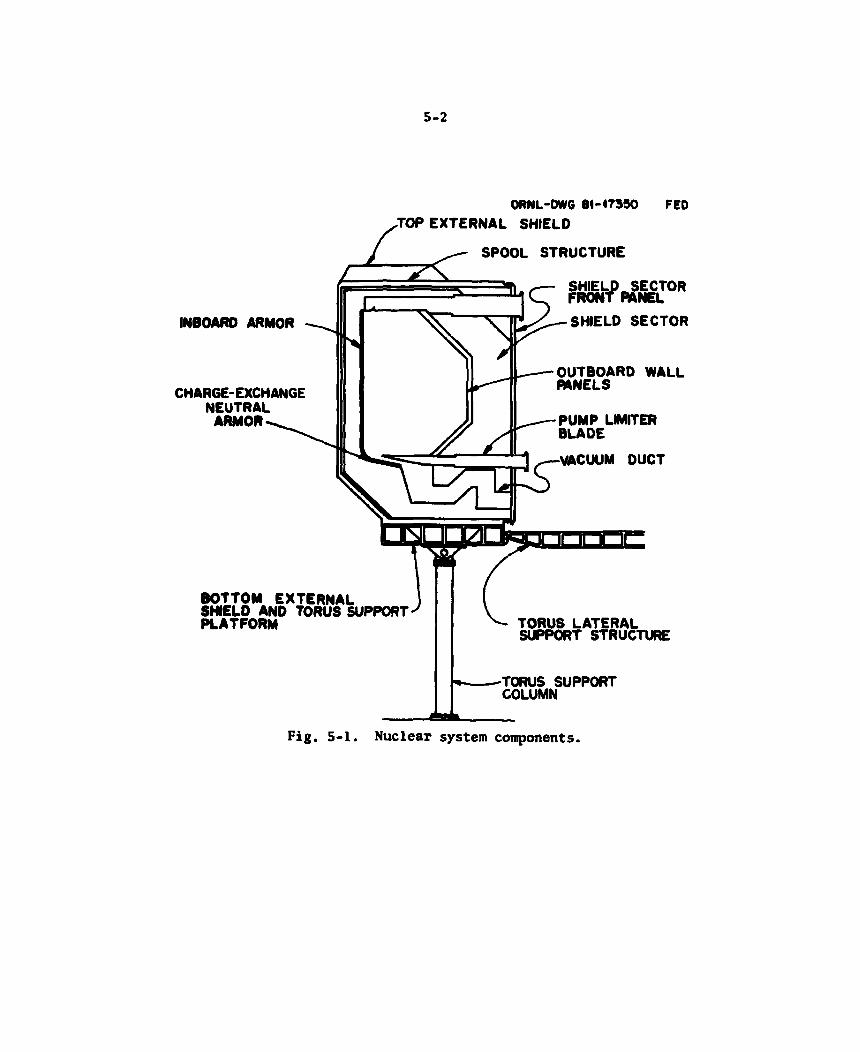
The nuclear systems components (Fig. 5-1) discussed in this section include the torus spool assembly, the shield sectors, the torus support structure, the first wall armor and actively cooled outboard wall panels, and the mechanical pump limiter. In addition, the nuclear analyses are discussed in this section.
Design objectives employed in the conceptual definition are asso-ciated with establishing engineering feasibility. These are:
• High inherent safety • A level of reliability corresponding to trouble-free operation
for the device
• Maintainability characteristics that can accommodate scheduled
and unscheduled events
To achieve these objectives, it is necessary to develop a design which can perform adequately within a full range of uncertainties in some of the plasma parameters, such as plasma edge parameters and plasma dis-ruption parameters. Maintainability has been stressed in every step of the concept evolution. This Is particularly evident in the torus
* Fusion Engineering Design Center/General Atomic Company. 4.
Fusion Engineering Design Center/McDonnell Douglas Astronautics
Company. * Argonne National Laboratory. §
General Atomic Company. **Argonne National Laboratory/Pennsylvania State University, tt McDonnell Douglas Astronautics Company.
5-1
5-2
Z ORNL-OWG 81-17350
•TOP EXTERNAL SHIELO FED
INBOARO ARMOR
CHARGE-EXCHANGE NEUTRAL ARMOR
SPOOL STRUCTURE
SHIELD SECTOR FRONT AANEL SHIELD SECTOR
OUTBOARD WALL PANELS
PUMP LIMITER BLADE
VACUUM DUCT
BOTTOM EXTERNAL SHIELO AND TORUS SUPPORT PLATFORM TORUS LATERAL
SUPPORT STRUCTURE
-TORUS SUPPORT COLUMN
Fig. 5-1. Nuclear system components.
5-3
sector segmentation concept, which features direct radial extraction of each of the ten sectors. For the inboard wall, which must endure some 2,000 disruptions, careful attention has been given to designing the armor with capability to endure high heat-flux environments. In addi-tion, the ability to replace individual armor tile in-situ was incor-porated as a requirement.
Maintainability of the mechanical pump limiter blade was another area receiving emphasis because of the anticipated severe life-limiting factors associated with operation at the edge of the plasma. Hence, a key feature of this design is the ability to remove a limiter blade without removing a torus sector or without disconnecting the vacuum duct. In addition, the blade may be refurbished in the hot cell by removing the protective surface in the form of a sleeve and installing a new surface.
Other key features of the FED nuclear systems design are as follows:
Spool structure
This component must provide vacuum integrity and high electrical resistance. The design approach adopted is similar to that employed for minimum weight structures and results in an Inconel sandwich panel configuration with radial beams in the top panels to carry the atmos-pheric pressure loads. Radial frames are employed to transfer the loads into the floor structure.
Shield sector
This component must achieve the required nuclear protection with minimum thickness. Key nuclear requirements are a total accumulated dose of less than 109 rads in the TF coil insulation (inner leg) and an activation limit of 2.5 nrem/h 24 h after shutdown following a series of 8-T shots (top, bottom, and outboard walls). The selected shield materials are Nitronic 33 stainless steel and water.
5-4
Inboard and top first wall
These components must be capable of handling the plasma disruption energy without replacement over the life of the device. To this end, protective armor tiles are provided. These tiles are 15-cm square graphite, 5-cm thick, and attached with a graphite bolt whose head is recessed flush with the tile surface. Analysis indicates that the stress levels are well within graphite capability. Temperatures are <1200°C for 8-T operation and <1300°C for 10-T operation. It is desirable to keep temperatures below these levels to avoid significant generation of acetylene. Tiles are coated with titanium carbide to limit chemical erosion in areas not affected by disruptions.
Outboard first wall
The primary function of this component is to remove heat. The design approach makes use of an actively cooled bare stainless steel panel. The panel on the vertical outboard facet is also employed as a start-up limiter. The panels have the capability for accommodating the start-up heat loads and have a predicted life equal to the device lifetime. Equilibrium temperatures for 10-T operation are 330°C.
Mechanical pump limiter
The pump limiter removes the major portion of the plasma heat load and also provides for plasma pumping and particle control. The bottom location for the toroidal limiter configuration was selected to provide a high degree of maintainability and low sensitivity to plasma edge uncertainties. The protective surface is comprised of graphite tile brazed to a water-cooled copper substrate. The lifetime of the limiter protective surface is estimated to be from over four years to approximately two months for 8-T operation, depending on the plasma edge conditions.
S-5
5.1 KEY GUIDELINES AND REQUIREMENTS
The purpose of this section is to summarize the key guidelines and requirements which drive the design of the nuclear components. Because of uncertainties in the characterization of plasma phenomena, the requirements, in some cases, are not precise; instead of unique param-eters, ranges in the parameters are defined.
Machine operation and working parameters
The FED is designed to operate in two modes. In the base mode, the toroidal field coil maximum field strength is 8 T, and the plasma is driven at an energy gain, Q, of ^5. Operation in this mode will consist of a total of ^250,000 shots for all test phases. In the second mode, the toroidal field coils will be operated at a maximum field strength of 10 T, and the plasma is ignited. Testing in this mode will consist of ^25,000 shots. These guidelines and requirements are discussed in terms of machine operation and working parameters, plasma edge conditions, plasma disruption characteristics, seismic events, and maintenance requirements. The four-stage operating scenario planned for FED is summarized in Table 5-1. The 10-T operation is performed in the fourth stage.
The design effort has focused on the base, 8-T mode of operation. The 10-T conditions were examined in the context of the 8-T design, and the impact of 10-T operation is noted. Future design refinement of the FED should examine the benefits of optimizing the design for a specific combination of 8-T and 10-T shots.
A summary of those working parameters which are directly related to the torus design is presented in Table 5-2; a more complete list is pre-sented in Appendix A. Additional characteristics are presented in sub-sequent sections as appropriate for the particular nuclear system being discussed.
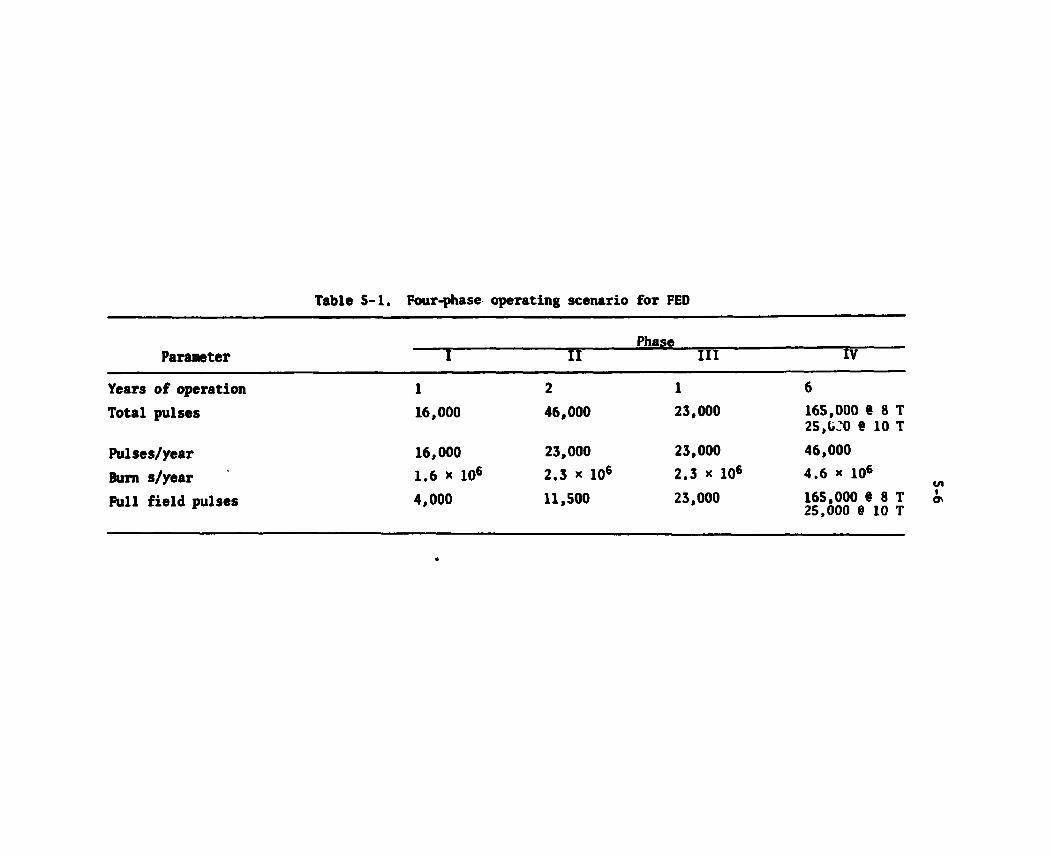
Table S-l. Four-phase operating scenario for FED
Phase Parameter I II III I V
Years of operation Total pulses
1
1 6 , 0 0 0
2
4 6 , 0 0 0
1
2 3 , 0 0 0
6
1 6 5 , 0 0 0 8 8 T 2 5 , b ~ 0 e 10 T
Pulses/year Burn s/year Full field pulses
1 6 , 0 0 0
1 . 6 x 10 6
4 , 0 0 0
2 3 , 0 0 0
2 . 3 * 10 6
1 1 , 5 0 0
2 3 , 0 0 0
2 . 3 x 10 6
2 3 , 0 0 0
4 6 , 0 0 0
4 . 6 x 1 0 6
1 6 5 , 0 0 0 ® 8 T 2 5 , 0 0 0 8 10 T
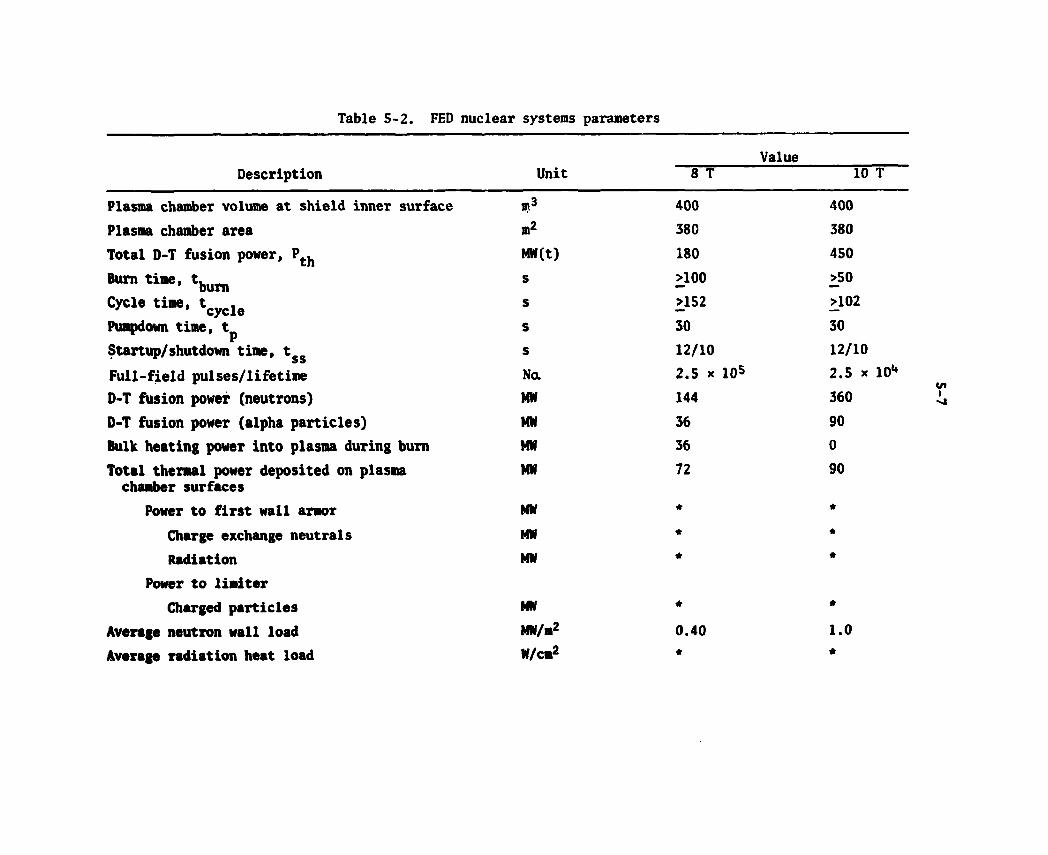
Table 5-2. FED nuclear systems parameters
Value Description Unit 8 T 10 T
Plasma chamber volume at shield inner surface in3 400 400
Plasma chamber area m2 380 380 Total D-T fusion power, P t h MW(t) 180 450 Burn time, t b u r n s >100 >50 Cycle time, t c y c l e s >152 >102 Pumpdown time, t p s 30 30 Startup/shutdown time, t s 12/10 12/10 Full-field pulses/lifetime Na 2.5 x 10⁵ 2.5 x 10* D-T fusion power (neutrons) MW 144 360 D-T fusion power (alpha particles) MW 36 90 Bulk heating power into plasma during burn MW 36 0 Total thermal power deposited on plasma MW 72 90 chamber surfaces
Power to first wall armor MW * * Charge exchange neutrals MW * * Radiation MW * *
Power to liaiter Charged particles MW * *
Average neutron wall load MN/m2 0.40 1.0 Average radiation heat load W/cm2 * *
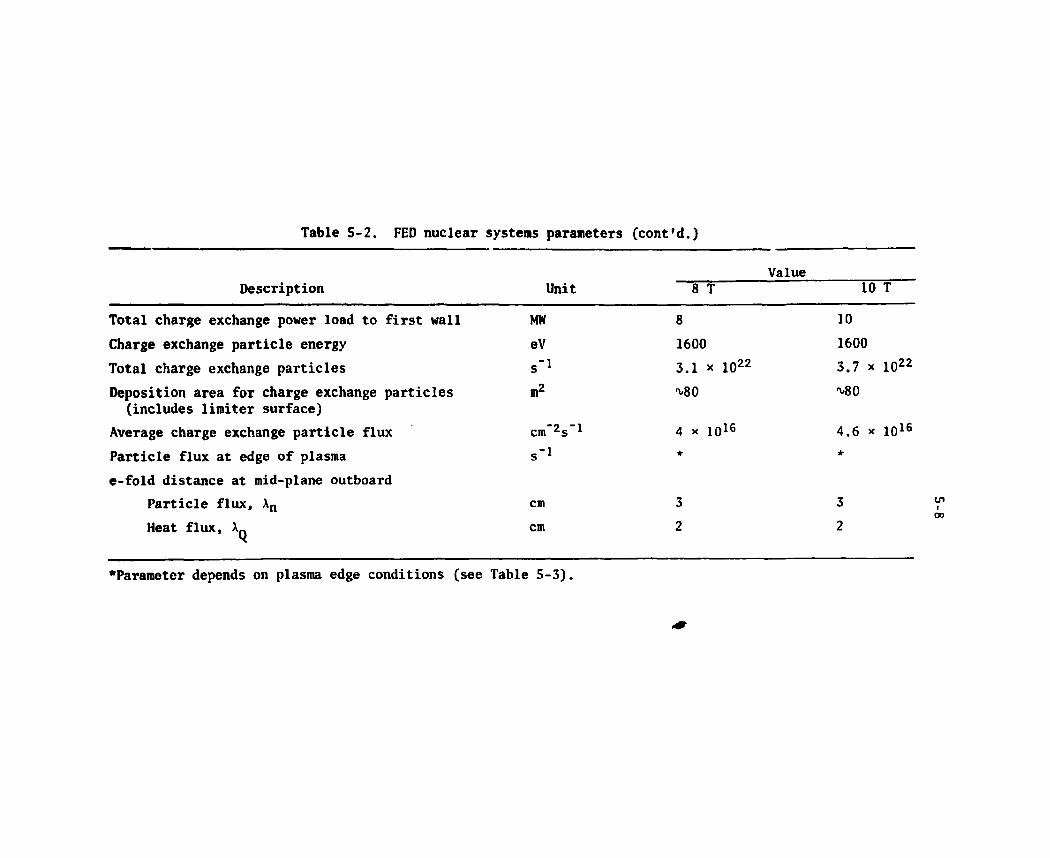
Table 5-2. FED nuclear systems parameters (cont'd.)
Value Description Unit 8 T 10 T
Total charge exchange power load to first wall MW 8 10
Charge exchange particle energy eV 1600 1600
Total charge exchange particles s"1 3.1 x 10 2 2 3.7 x 10 2 2
Deposition area for charge exchange particles (includes limiter surface)
m2 ^80 ^80
Average charge exchange particle flux cm 2s 1 4 x 10 1 6 4.6 x 10" Particle flux at edge of plasma s"1 * *
e-fold distance at mid-plane outboard Particle flux, An cm 3 3
Heat flux, Xq cm 2 2
'Parameter depends on plasma edge conditions (see Table 5-3).

5-9
Plasma edge conditions
Four plasma edge conditions were examined (Table 5-3). These conditions represent the potential range of heat flux and particle flux values to the pump limiter. Cases A and B correspond to a situation in which the plasma edge is "clean" and the energy leaving the plasma is in the form of particle kinetic energy. The ionized particles follow the magnetic field lines and are scraped off by the limiter blade. Conse-quently, most of the energy is deposited on the limiter blade. In order to provide margin in the design, Case A is employed as the limiter design case because of the higher particle flux and, hence, higher erosion rate.
Cases C and I) correspond to a "cold" plasma edge condition in which edge particles are at relatively low energy. Energy transport in this case is primarily by means of thermal radiation and is deposited uni-formly
over the first wall and limiter. Cases C and D represent the highest heat load to the first wall, and this heat load was employed to provide margin in the design of the first wall.
Plasma disruption scenario
Plasma disruptions will also cause erosion of the first wall and limiter components. For disruptions, the erosion may be by vaporization and/or melting and results from a high heat flux to the wall and/or to the limiter surfaces. The parameters of importance are:
• Frequency of occurrence • Total energy deposited • Duration of energy deposition • Area of deposition • Distribution of energy
The disruption scenario appears to consist of a thermal quench phase followed by a current quench phase. The thermal quench phase is characterized experimentally by a voltage spike and a general expansion of the plasma minor radius. It is estimated that 25% of the plasma thermal energy in the thermal quench phase (about 80% of the total
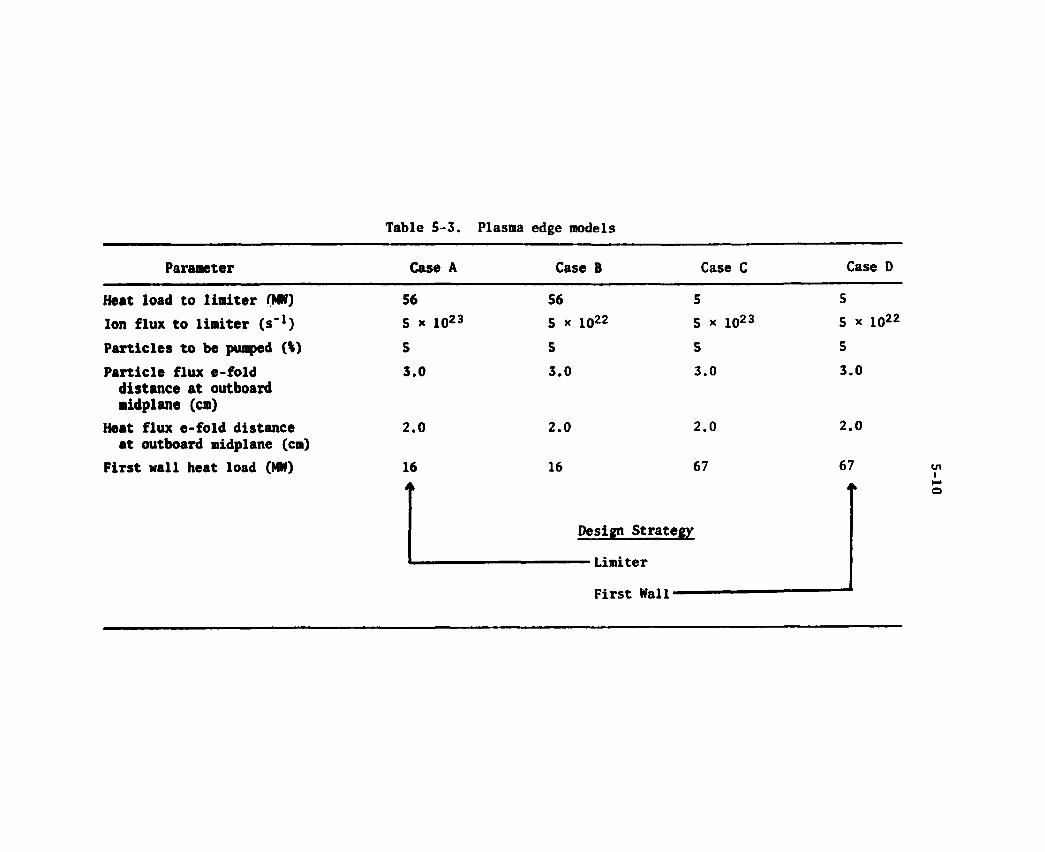
Table 5-3. Plasma edge models
Parameter Case A
Heat load to limiter fMW) 56
Ion flux to limiter (s _ l) S x 10 2 3
Particles to be pumped (t) 5
Particle flux e-fold 3.0 distance at outboard aidplane (cm)
Heat flux e-fold distance 2.0 at outboard midplane (cm)
First wall heat load (MW) 16
Case B Case C Case D
56 5 5
5 x 10 2 2 5 x 10 2 3 5 x io 2 2
5 5 5
3.0 3.0 3.0
2.0 2.0 2.0
16 67 67
Design Strategy
Limiter
First Wall

5-11
plasma thermal energy) is deposited at the first wall and 75% at the limiter. The subsequent current quench phase is characterized by a reduction in plasma current and a movement of the plasma toward the inboard top or bottom surfaces. The remaining plasma thermal energy (^20% of thermal energy) is deposited over these surfaces. A signif-icant fraction of the magnetic energy in the plasma is converted to ohmic (I2R) losses and also is deposited on the inboard top or bottom surfaces. The predicted nominal values of the key parameters, together with their expected ranges, are presented in Table 5-4 for both the thermal and current quench phases.
It was assumed that the values of the parameters occur in a random fashion. Erosion rates due to vaporization and melt layer losses were calculated for the maximum value of each parameter while holding the other parameters at their nominal value. These incremental erosion rates were root-sum-squared. The design case erosion is defined as the ratio of the root-sum-squared value to the nominal value. Specific erosion rates are discussed in the component design sections.
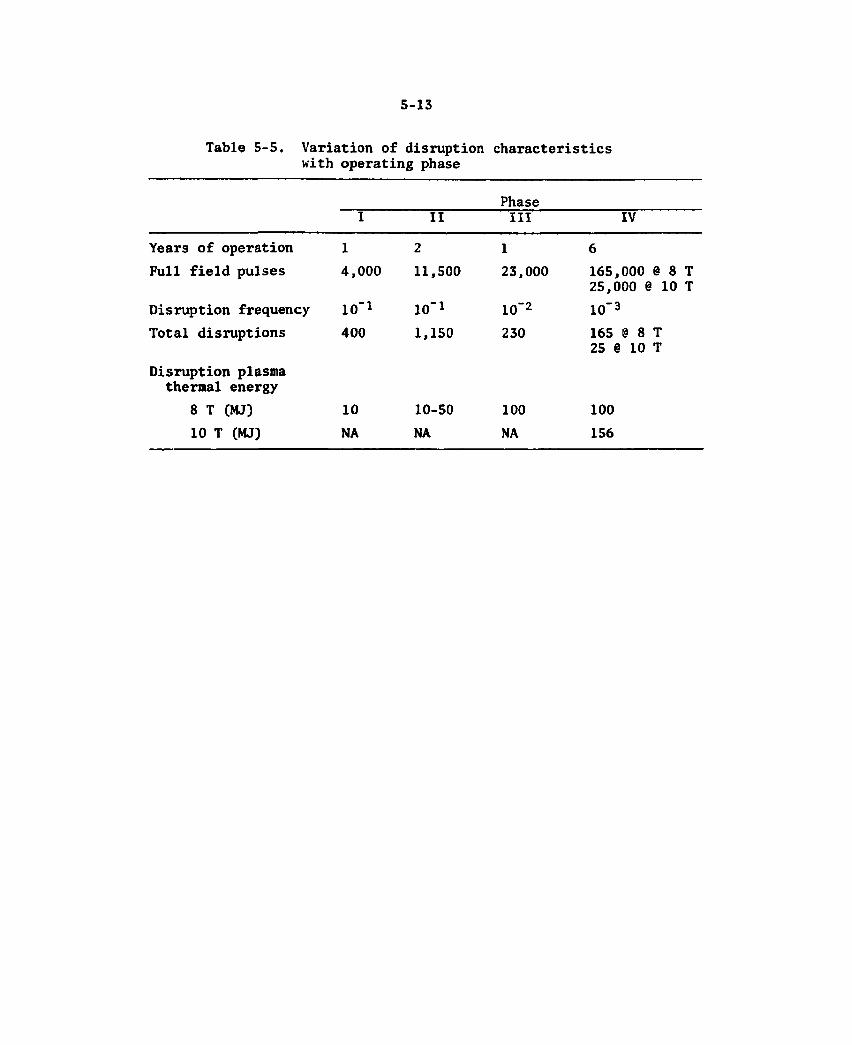
It is also noted that the disruption and the total energy involved depend on the operating stage of FED and are shown in Table 5-5.
Seismic events
Current FED site screening criteria suggest a value for the free-field ground acceleration of 0.25 g. Seismic analysis, presently under way, is required to determine lateral and vertical seismic design loads for nuclear system components. FED nuclear system structures will have to withstand these loads and limit deflections to acceptable levels.
Maintenance requirements
It is recognized that those components which are located in the proximity of the plasma will be subjected to life-limiting conditions. Hence, provisions are made to replace these components. Replaceable components include the armor tiles on the inboard and top walls, the outboard first wall, the charge-exchange armor, and the pump liadter.
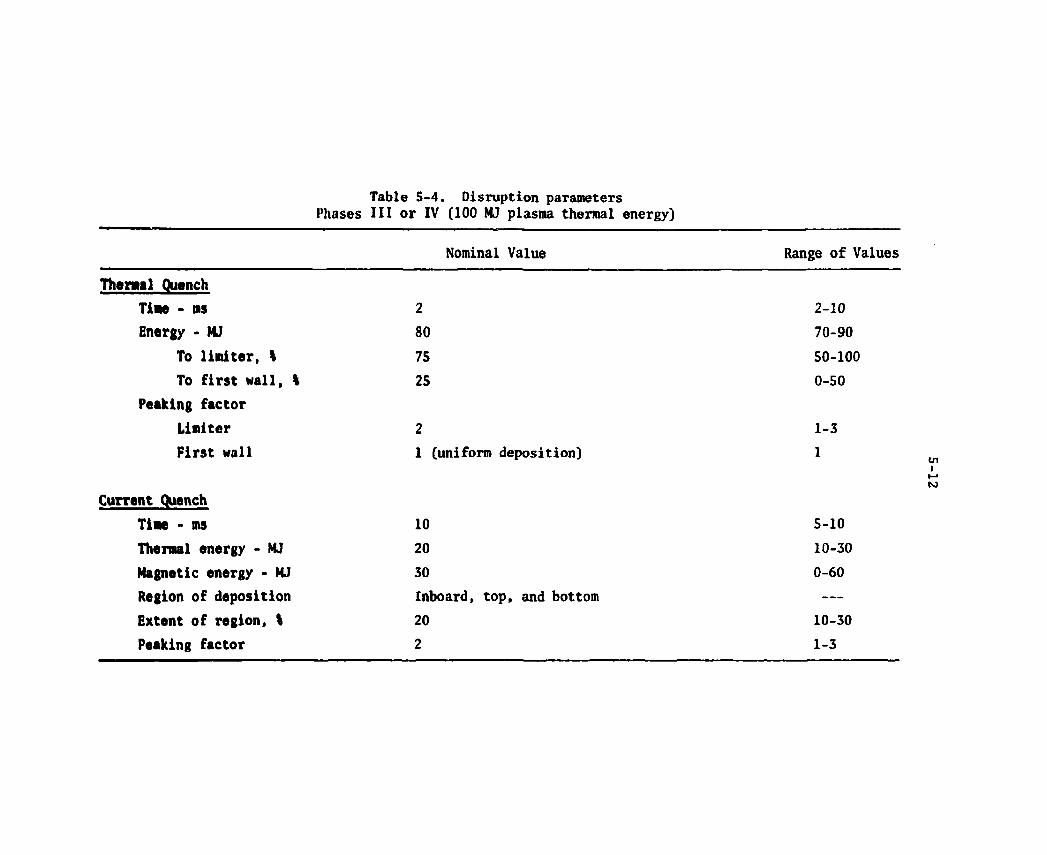
Table 5-4. Disruption parameters Phases III or IV (100 MJ plasma thermal energy)
Nominal Value Range of Values
Thermal Quench
Time - ms
Energy - MJ
To limiter, %
To first wall,
Peaking factor
Limiter
First wall
2
80 75 25
1 (uniform deposition)
2-10
70-90 50-100 0-50
1-3 1
Current Quench
Time - ms
Thermal energy - MJ
Magnetic energy - MJ
Region of deposition
Extent of region, %
Peaking factor
10 20
30 Inboard, top, and bottom 20
2
5-10 10-30 0-60
10-30 1-3
5-13
Table 5-5. Variation of disruption characteristics with operating phase
Phase I II III IV
Years of operation 1 2 1 6 Full field pulses 4,000 11,500 23,000 165,000 § 8 T
25,000 0 10 T Disruption frequency io"i lO'l 10"2 10"3
Total disruptions 400 1,150 230 165 @ 8 T 25 @ 10 T
Disruption plasma thermal energy
8 T (MJ) 10 10-50 100 100 10 T (MJ) NA NA NA 156

5-14
It is considered highly desirable that remote activities in the reactor room be limited to those employing only the most rudimentary manipulations. These include pushing, pulling, lifting, rotating, etc. More complex maneuvers and manipulations will be relegated, if pos-sible, to the hot cell.
Contact maintenance tasks may be performed when the bulk shield is in place and where those types of procedures result in improved reli-ability of task performance and shortened down times. Shielding designs will limit activation of materials outside of the torus to levels com-mensurate with safe, human activity within 24 hours after the device shutdown for 8-T operation and 36 hours after shutdown for 10-T operation.
5.2 TORUS DESIGN
The major torus functions are as follows:
• Support a vacuum environment for the plasma • Convert the kinetic energy of the 14-MeV neutrons to thermal
energy • Remove heat generated by plasma operation • Provide nuclear shielding for component and personnel
protection • Safely and reliably react the mechanical and electromagnetic
loads • Provide a supporting interface for the plasma heating system,
the fueling system, the pump limiter system, and instrumentation
• Provide for installation and support of test modules • Support the first wall and armor
Protect the poloidal coils from excessive induced currents upon plasma disruption
The torus system and its relationship to the otheT major components in the reactor are shown in Fig. 1-2, FED elevation view. The radial buildup of the machine is shown in Fig. 5-2. This section addresses
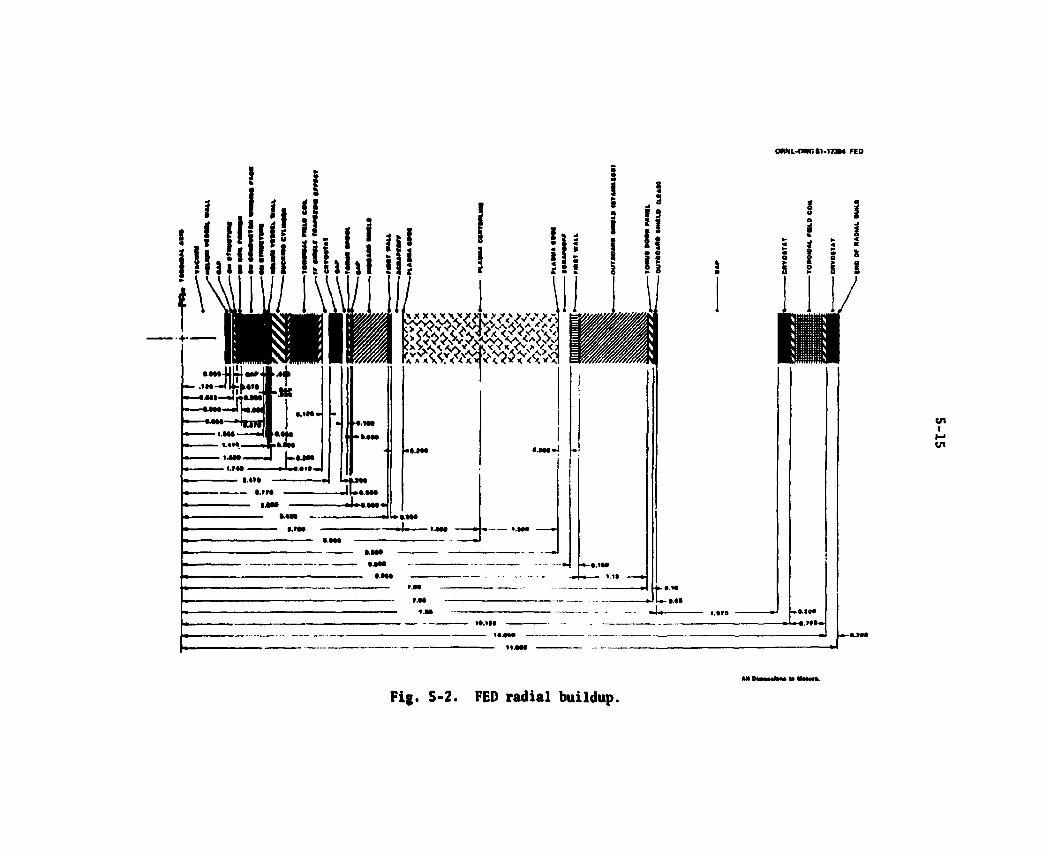
Pig. 5-2. FED radial buildup.
ORNL-OWGI1-173M FED
5-16
that portion of the torus which serves the functions of nuclear shield-ing and vacuum integrity. The first wall components are discussed in Section 5.3, the mechanical pump limiter in Section 5.4, and the vacuum pumping system in Section 8.2.
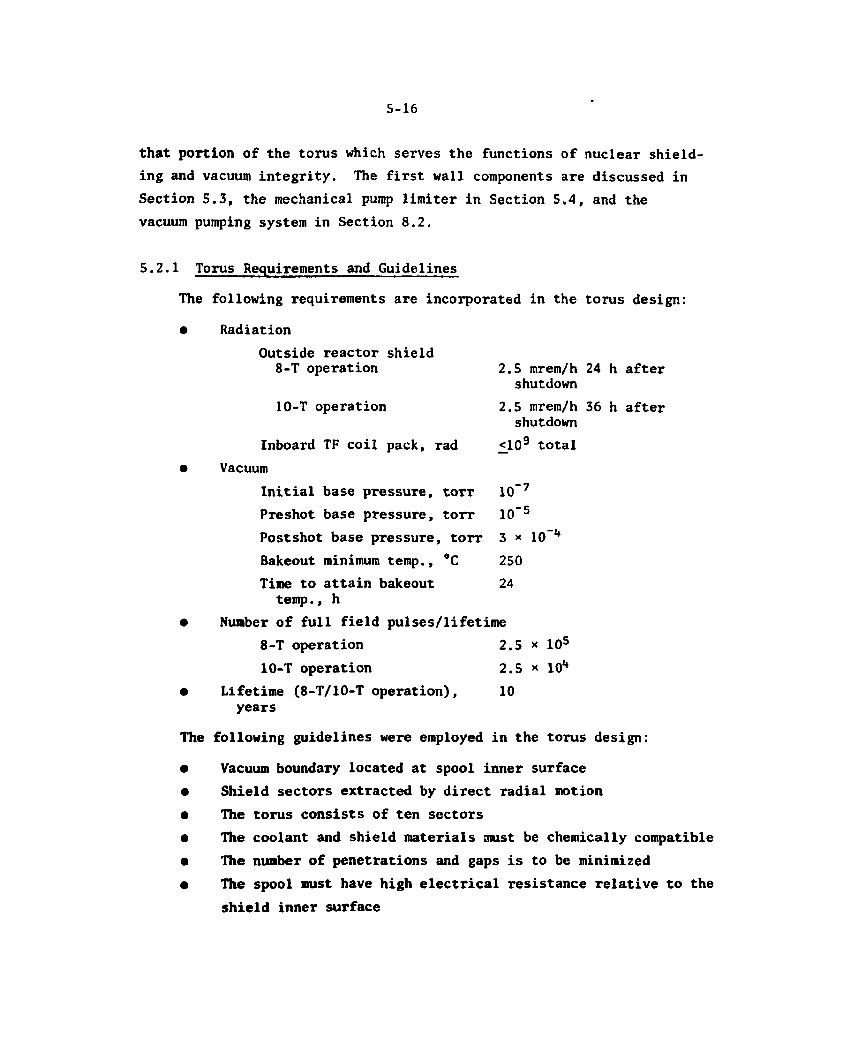
5.2.1 Torus Requirements and Guidelines
The following requirements are incorporated in the torus design:
e Radiation Outside reactor shield
8-T operation 2.5 mrem/h 24 h after shutdown
10-T operation 2.5 mrem/h 36 h after shutdown
Inboard TF coil pack, rad <109 total • Vacuum
Initial base pressure, torr 10" 7
Preshot base pressure, torr 10"5
Postshot base pressure, , torr 3 x 10 Bakeout minimum temp., 250 Time to attain bakeout 24
temp., h e Number of full field pulses/lifetime
8-T operation 2.5 * 105
10-T operation 2.5 * 101* • Lifetime (8-T/10-T operation), 10
years
The following guidelines were employed in the torus design:
• Vacuum boundary located at spool inner surface e Shield sectors extracted by direct radial motion • The torus consists of ten sectors • The coolant and shield materials must be chemically compatible • The number of penetrations and gaps is to be minimized • The spool must have high electrical resistance relative to the
shield inner surface
5-17
• The sectors must be electrically isolated at the inner surface • A continuous toroidal electrical path must be provided during
disrup:Ions • The torus system is supported independent of the TF coil
system
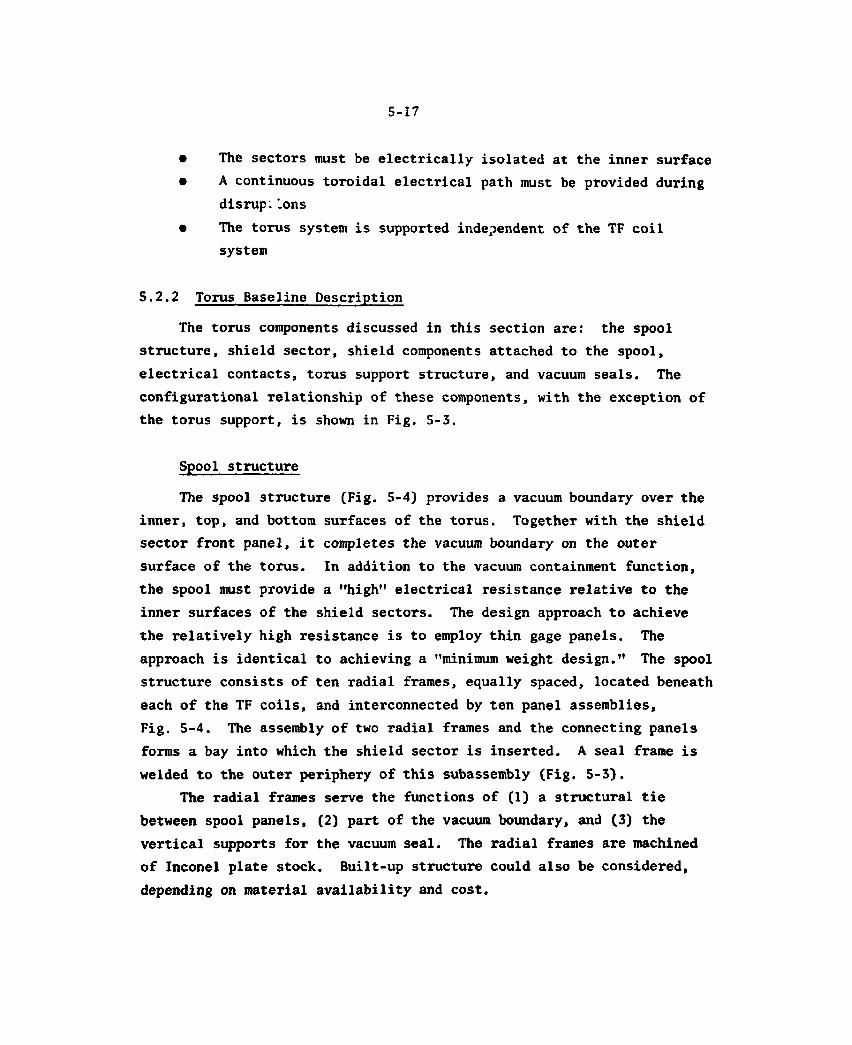
5.2.2 Torus Baseline Description
The torus components discussed in this section are: the spool structure, shield sector, shield components attached to the spool, electrical contacts, torus support structure, and vacuum seals. The configurational relationship of these components, with the exception of the torus support, is shown in Fig. 5-3.
Spool structure
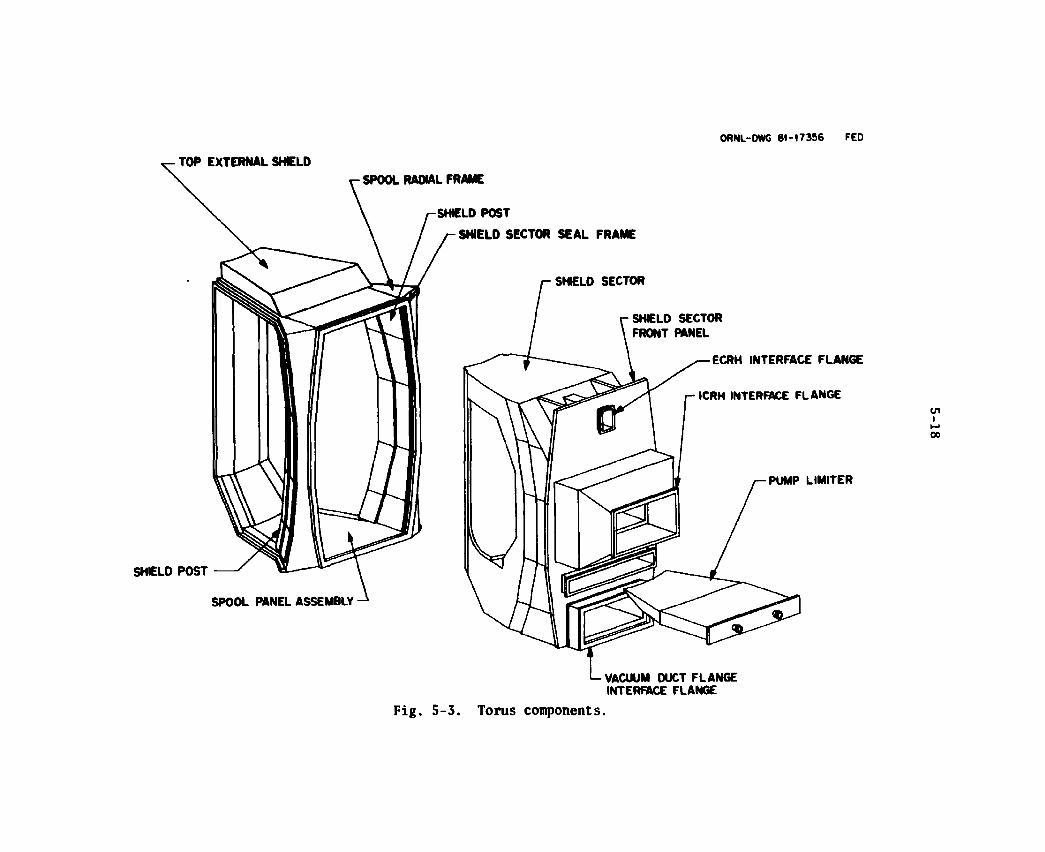
The spool structure (Fig. 5-4) provides a vacuum boundary over the inner, top, and bottom surfaces of the torus. Together with the shield sector front panel, it completes the vacuum boundary on the outer surface of the torus. In addition to the vacuum containment function, the spool must provide a "high" electrical resistance relative to the inner surfaces of the shield sectors. The design approach to achieve the relatively high resistance is to employ thin gage panels. The approach is identical to achieving a "minimum weight design." The spool structure consists of ten radial frames, equally spaced, located beneath each of the TF coils, and interconnected by ten panel assemblies, Fig. 5-4. The assembly of two radial frames and the connecting panels forms a bay into which the shield sector is inserted. A seal frame is welded to the outer periphery of this subassembly (Fig. 5-3).
The radial frames serve the functions of (1) a structural tie between spool panels, (2) part of the vacuum boundary, and (3) the vertical supports for the vacuum seal. The radial frames are machined of Inconel plate stock. Built-up structure could also be considered, depending on material availability and cost.
ORNL-DWG 8 1 - 1 7 3 5 6 FED
TOP EXTERNAL SHIELD SPOOL RAOIAL FRAME
SHIELD POST
SHIELD SECTOR SEAL FRAME
SHIELD SECTOR
POST
SHIELD SECTOR FRONT PANEL
SPOOL PANEL ASSEMBLY
-ECRH INTERFACE FLANGE
ICRH INTERFACE FLANGE
PUMP LIMITER
>- VACUUM DUCT FLANGE INTERFACE FLANGE
Fig. 5-3. Torus components.
SHIELD SECTOR SEAL
FRAME
BOTTOM SPOOL PANEL
ORNL-DWG 81-17355 FED
TOP SPOOL PANEL
SPOOL RADIAL FRAME
V
INBOARD SPOOL PANEL

5-20
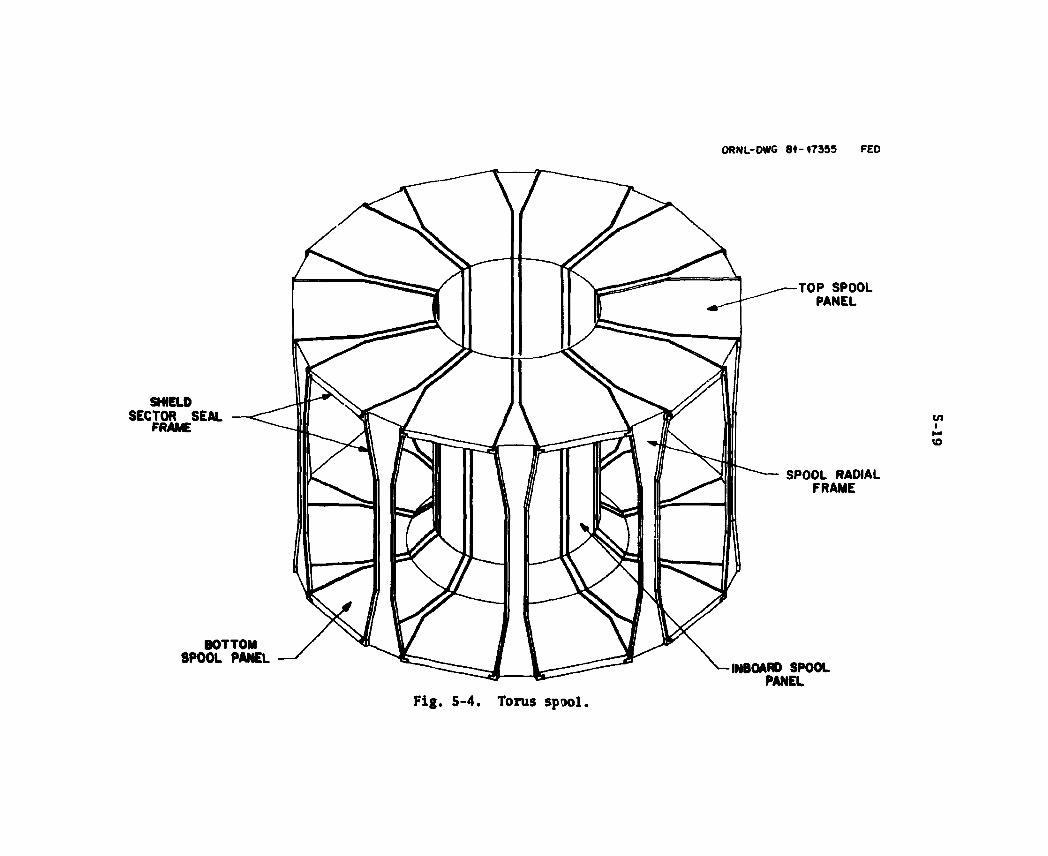
The spool panel assembly, shown in Fig. 5-5, consists of three panels (top, inboard, and bottom) of Inconel sandwich-type construction. The top panel consists of thin outer and inner skins which are stiffened by radial beams, peripheral frames, and thin corrugated toroidal stif-feners, Fig. 5-5 (A) and (B). The inboard panel consists of thin inner and outer skins with thin corrugated vertical stiffeners and a machined edge frame. Fig. 5-5 (C). The bottom panel is a thin, double-skin sandwich construction with beams located to carry the shield sector dead weight and rolling loads (during sector installation/removal), Fig. 5-5 (D) and (E).
Further design and analysis will be needed to fully define the requirements for the spool structure. For example, additional stif-feners (not shown) will be required for the thin skins. However, since it has been assumed that toroidal stiffeners can be provided with electrical breaks, design of these elements has not been emphasized because they do not affect the overall electrical resistance calculations.
For eddy current control and electrical isolation of the bulk shield from the spool structure, key surfaces of the spool are coated with a dielectric material. The baseline coating is AI2O3 and is applied to the inboard and outboard surfaces of the bottom spool flange, outboard surface of the top spool flange, and inboard surface of the outboard leg of the radial frame. The spool structure is considered to be semipermanent (good for the life of the reactor) and requires a minimum of active cooling. Cooling is provided only in the spool structure bottom flange, which due to the vacuum duct design is pro-tected by a bottom shield thickness of only 0.3 m in the area with direct plasma view.
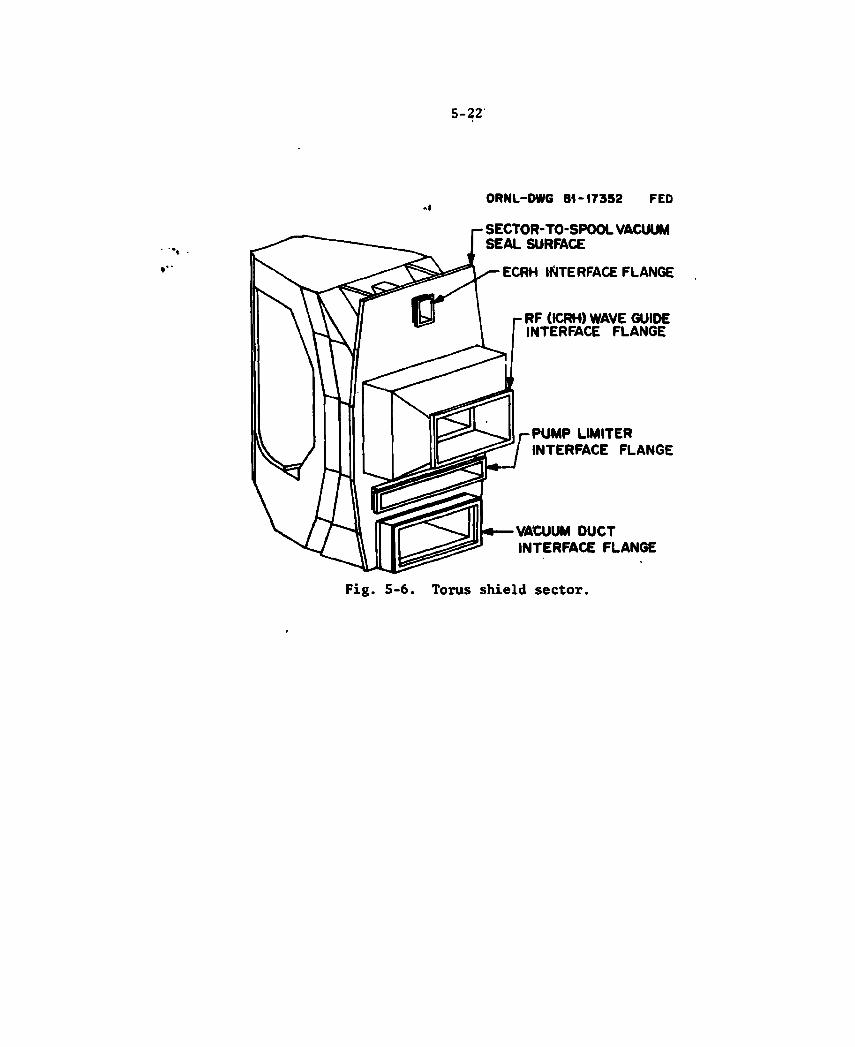
Shield sector
The torus shield is segmented into ten, 36° sectors. A torus shield sector is shown in Fig. 5-6. Each sector can be removed with a single radial movement. The shield segmentation concept provides
ORNl-OWG 84-17396R FEO
Fig. 5-5. Torus spool construction.
5-22
ORNL-DWG 81-17385R FED
SECTOR-TO-SPOOL V A C U U M SEAL SURFACE
ECRH INTERFACE FLANGE
r R F (ICRH) W A V E GUIDE INTERFACE F L A N G E
P U M P LIMITER INTERFACE F L A N G E
V A C U U M D U C T INTERFACE F L A N G E
Fig. 5-6. Torus shield sector.
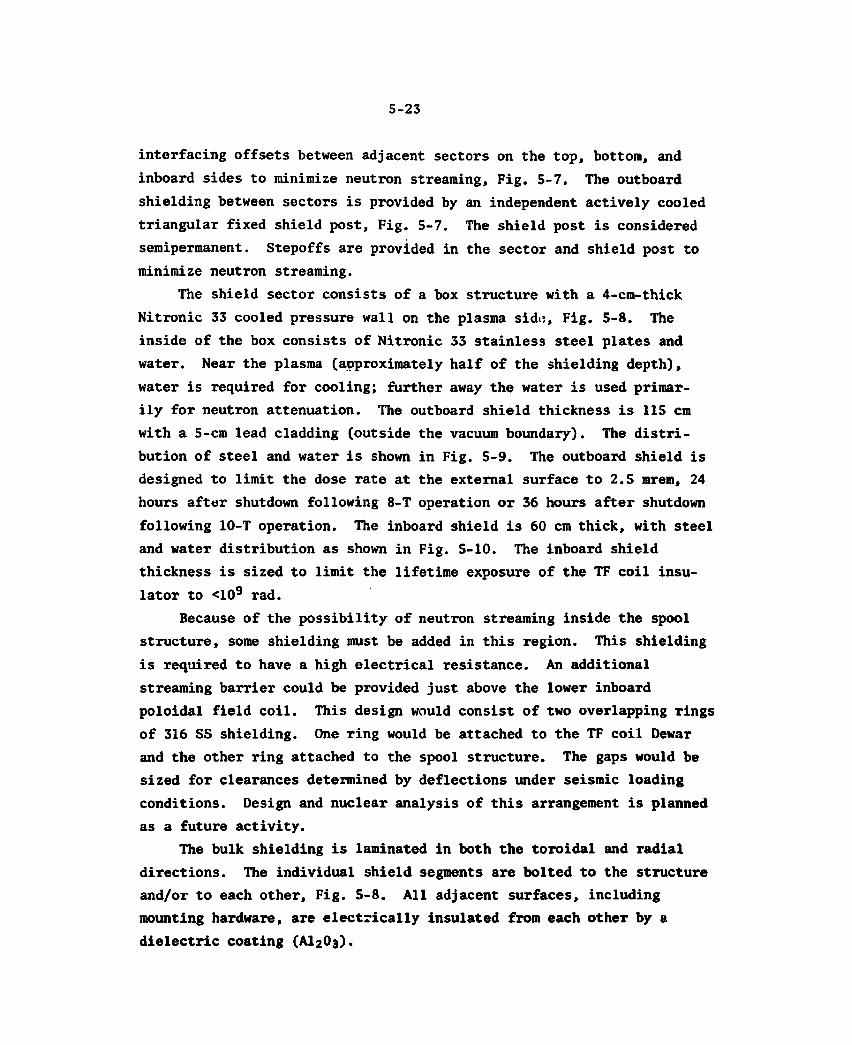
5-23
interfacing offsets between adjacent sectors on the top, bottom, and inboard sides to minimize neutron streaming, Fig. 5-7. The outboard shielding between sectors is provided by an independent actively cooled triangular fixed shield post, Fig. 5-7. The shield post is considered semipermanent. Stepoffs are provided in the sector and shield post to minimize neutron streaming.
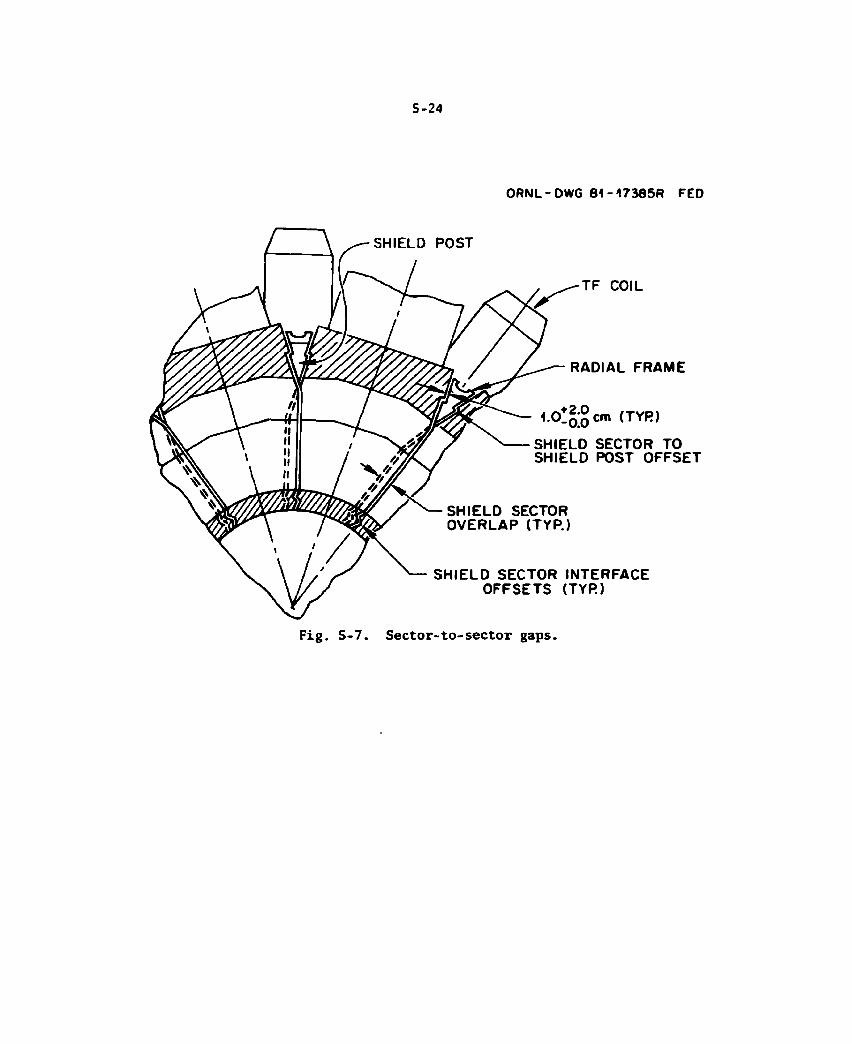
The shield sector consists of a box structure with a 4-cm-thick Nitronic 33 cooled pressure wall on the plasma sidu, Fig. 5-8. The inside of the box consists of Nitronic 33 stainless steel plates and water. Near the plasma (approximately half of the shielding depth), water is required for cooling; further away the water is used primar-ily for neutron attenuation. The outboard shield thickness is 115 cm with a 5-cm lead cladding (outside the vacuum boundary). The distri-bution of steel and water is shown in Fig. 5-9. The outboard shield is designed to limit the dose rate at the external surface to 2.5 mrem, 24 hours after shutdown following 8-T operation or 36 hours after shutdown following 10-T operation. The inboard shield is 60 cm thick, with steel and water distribution as shown in Fig. 5-10. The inboard shield thickness is sized to limit the lifetime exposure of the TF coil insu-lator to <109 rad.
Because of the possibility of neutron streaming inside the spool structure, some shielding must be added in this region. This shielding is required to have a high electrical resistance. An additional streaming barrier could be provided just above the lower inboard poloidal field coil. This design would consist of two overlapping rings of 316 SS shielding. One ring would be attached to the TF coil Dewar and the other ring attached to the spool structure. The gaps would be sized for clearances determined by deflections under seismic loading conditions. Design and nuclear analysis of this arrangement is planned as a future activity.
The bulk shielding is laminated in both the toroidal and radial directions. The individual shield segments are bolted to the structure and/or to each other, Fig. 5-8. All adjacent surfaces, including mounting hardware, are electrically insulated from each other by a dielectric coating (AI2O3).
5-24
ORNL-DWG 81-17385R FED
Fig. 5-7. Sector-to-sector gaps.
5-25
OdNL-OWa 81-17300 FED
SHIELDING WATER
OUTBOARD PRESSURE
W A L L - s i
NITRONIC 33 BULK SHIELD
MATERIAL
Fig. 5-8. Shield sector construction.
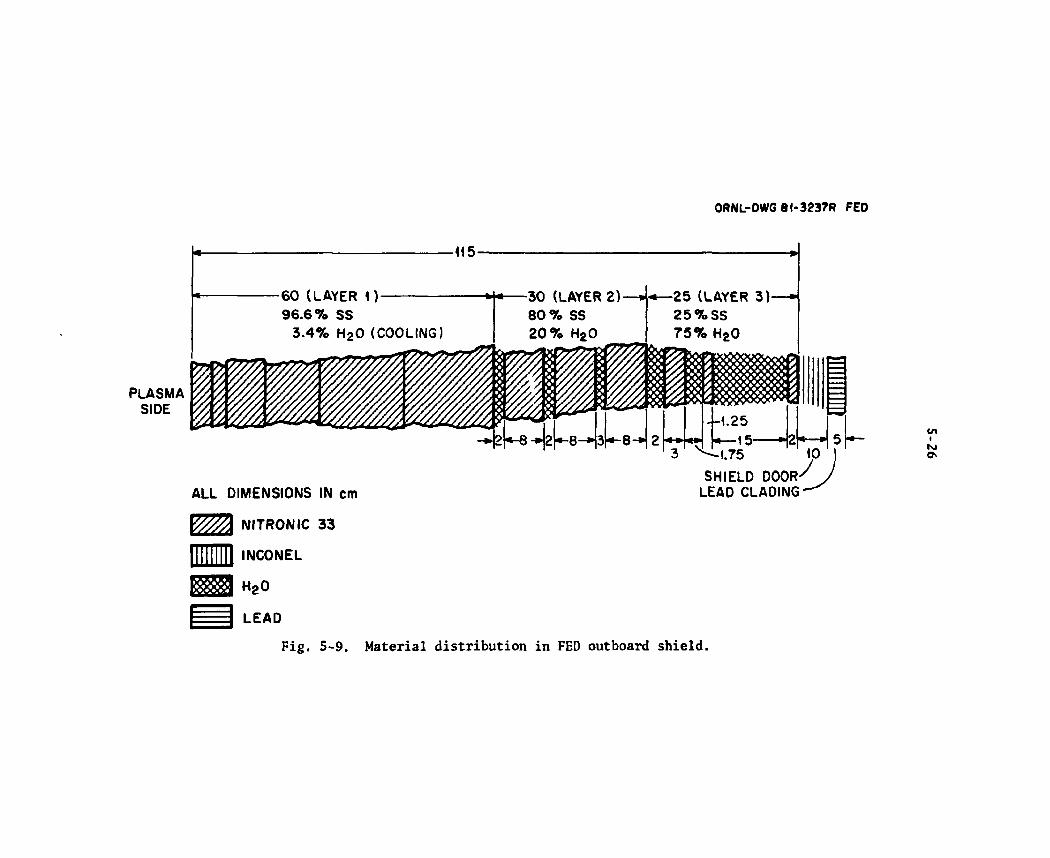
ORNL-DWG 81-3237R FED
PLASMA SIDE
-<15-
60 (LAYER 1) 96.6% SS
3.4% H 2 0 (COOLING)
-30 (LAYER 2)-80% SS 20% H20
-25 (LAYER 3)-25%SS 75% H20
2^-8 8— jsi*—8—
ALL DIMENSIONS IN cm
\ / / / / A NITRON IC 33
f 1NC0NEL
H 2 O
LEAD
Fig. S-9. Material distribution in FED outboard shield.
1.25 15
3' 10 SHIELD DOOR'
LEAD CLADING'
•k cn i Ni &
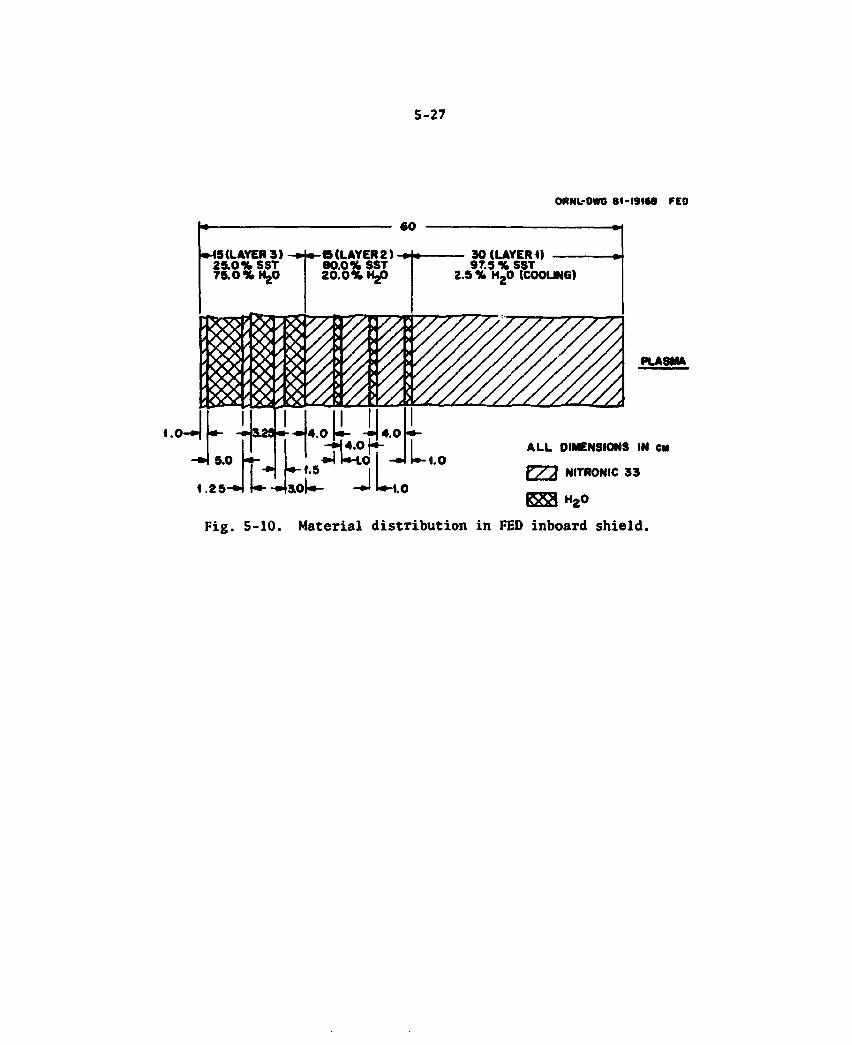
5-27
ORNL-OWG 81-1916® FED
PLASMA
ALL DIMENSIONS IN CM
FT7~X NITRONIC 33
K K B H2O
Fig. 5-10. Material distribution in FED inboard shield.
5-28
External forces such as disruption forces applied to the shield sectors are reacted through brackets which connect or bridge the sector to the radial frame. Four brackets are provided for each sector and are attached in the region of the radial frame where it is widest (near the top and bottom rims of the spool). Sizing of the brackets has not been accomplished as yet.
Each shield sector has a separate coolant inlet and outlet. After the coolant enters the sector, it is manifolded to achieve a nearly optimum distribution. The coolant flow and manifolding concept is schematically shown in Fig. 5-11. Coolant headers for each sector run laterally across the sector immediately above each row of cooling pas-sages, shown in Fig. 5-8. The headers are staggered in poloidal locations to prevent neutron streaming, and each header is orificed to meter the flow for a particular coolant row. Additional headering is provided at the sides of the sectors and is collected at the outer surface to a single inlet and outlet at each sector side.
The torus shield is designed to allow independent removal of the pump limiter (Section 5.4), vacuum duct (Section 8.2), and ECRH and ICRH launchers (Sections 7.2 and 7.3). The shield sector removal is accomplished with the use of an extractor pallet, Fig. 5-12. After the vacuum seal is cut, the extractor/transporter is deployed into position. The sector is mechanically coupled to the pallet, and extraction is initiated. The pallet contains recessed roller assemblies that are raised into position after the seal flange is clear, providing a stable rolling surface to complete extraction.
Access ports are provided in the vertical outboard facets at four toroidal locations. They are sized to permit a floor-mounted manipu-lator device to reach through the port and, in addition, the entrance plasma chamber wall within a toroidal span off + 4 5 ° of the port center-line. Sectors are assigned individual functions. These are:
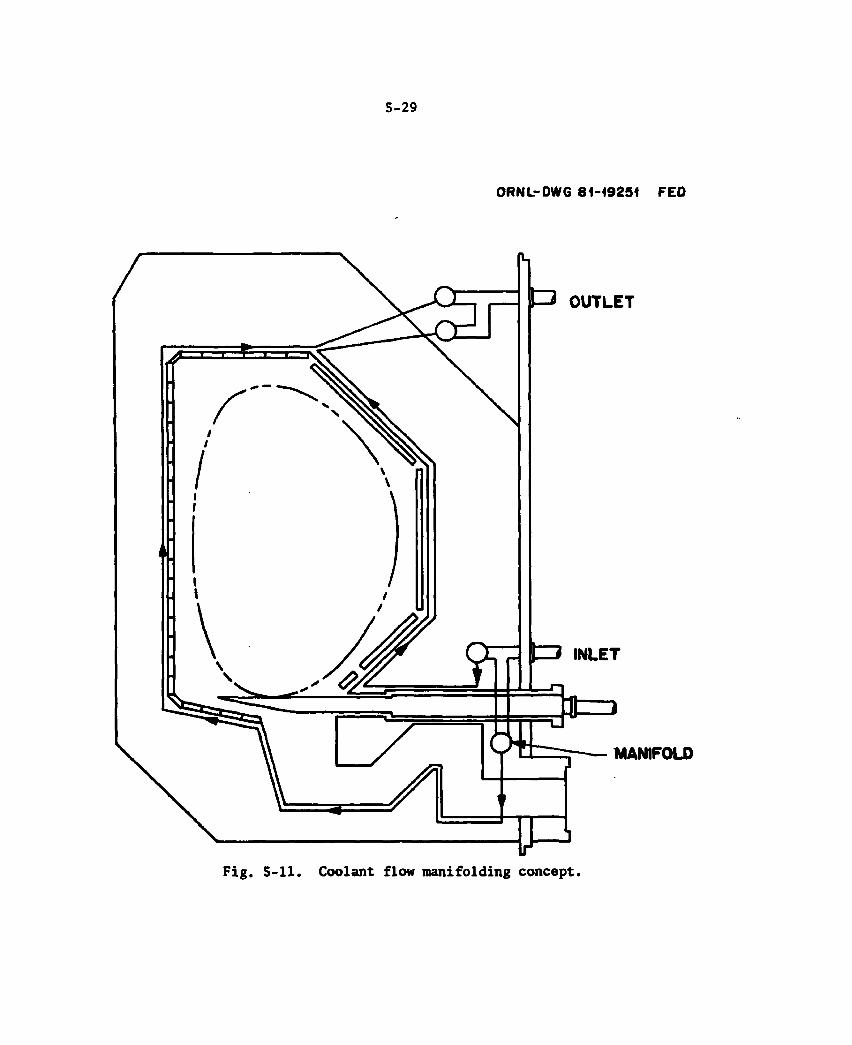
5-29
ORNL-DWG 81-17385R FED
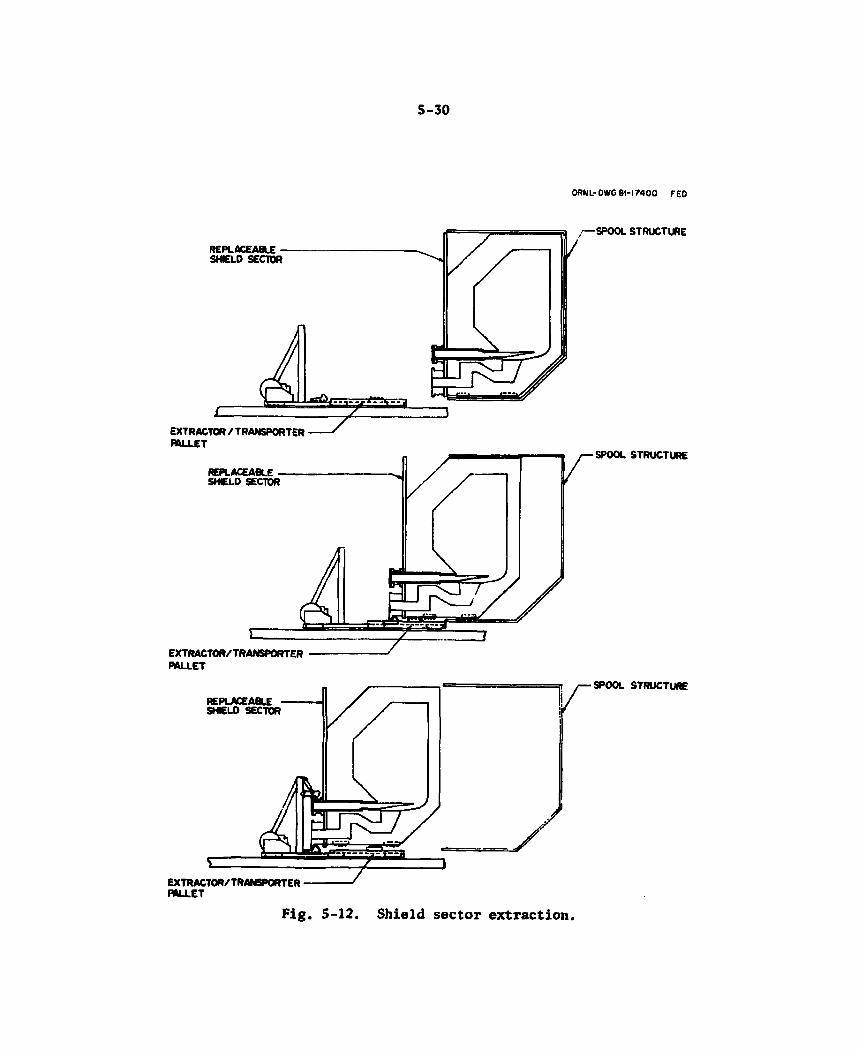
5-30
OANL-OWCBI-17400 FED
Fig. 5-12. Shield sector extraction.
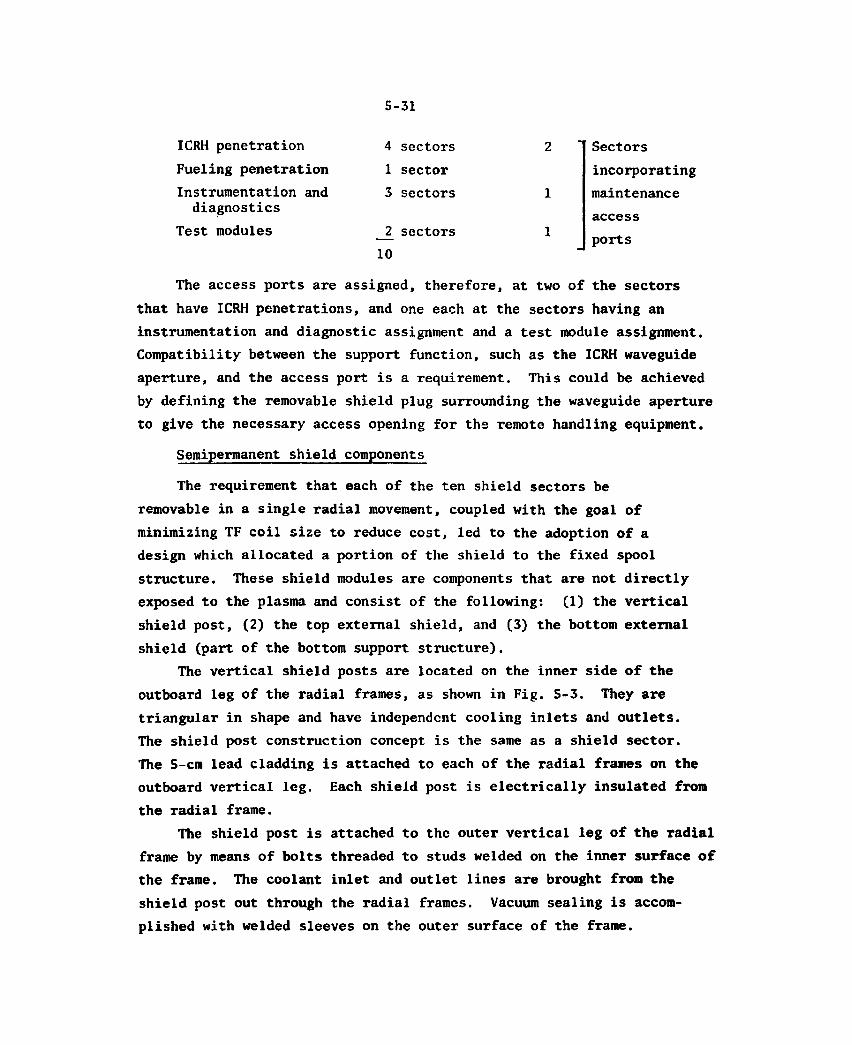
5-31
ICRH penetration Fueling penetration Instrumentation and
4 sectors 1 sector 3 sectors
2 Sectors incorporating
1 maintenance diagnostics
Test modules 2 sectors 1 access ports
10
The access ports are assigned, therefore, at two of the sectors that have ICRH penetrations, and one each at the sectors having an instrumentation and diagnostic assignment and a test module assignment. Compatibility between the support function, such as the ICRH waveguide aperture, and the access port is a requirement. This could be achieved by defining the removable shield plug surrounding the waveguide aperture to give the necessary access opening for the remote handling equipment.
Semipermanent shield components
The requirement that each of the ten shield sectors be removable in a single radial movement, coupled with the goal of minimizing TF coil size to reduce cost, led to the adoption of a design which allocated a portion of the shield to the fixed spool structure. These shield modules are components that are not directly exposed to the plasma and consist of the following: (1) the vertical shield post, (2) the top external shield, and (3) the bottom external shield (part of the bottom support structure).
The vertical shield posts are located on the inner side of the outboard leg of the radial frames, as shown in Fig. 5-3. They are triangular in shape and have independent cooling inlets and outlets. The shield post construction concept is the same as a shield sector. The 5-cm lead cladding is attached to each of the radial frames on the outboard vertical leg. Each shield post is electrically insulated from the radial frame.
The shield post is attached to the outer vertical leg of the radial frame by means of bolts threaded to studs welded on the inner surface of the frame. The coolant inlet and outlet lines are brought from the shield post out through the radial frames. Vacuum sealing is accom-plished with welded sleeves on the outer surface of the frame.
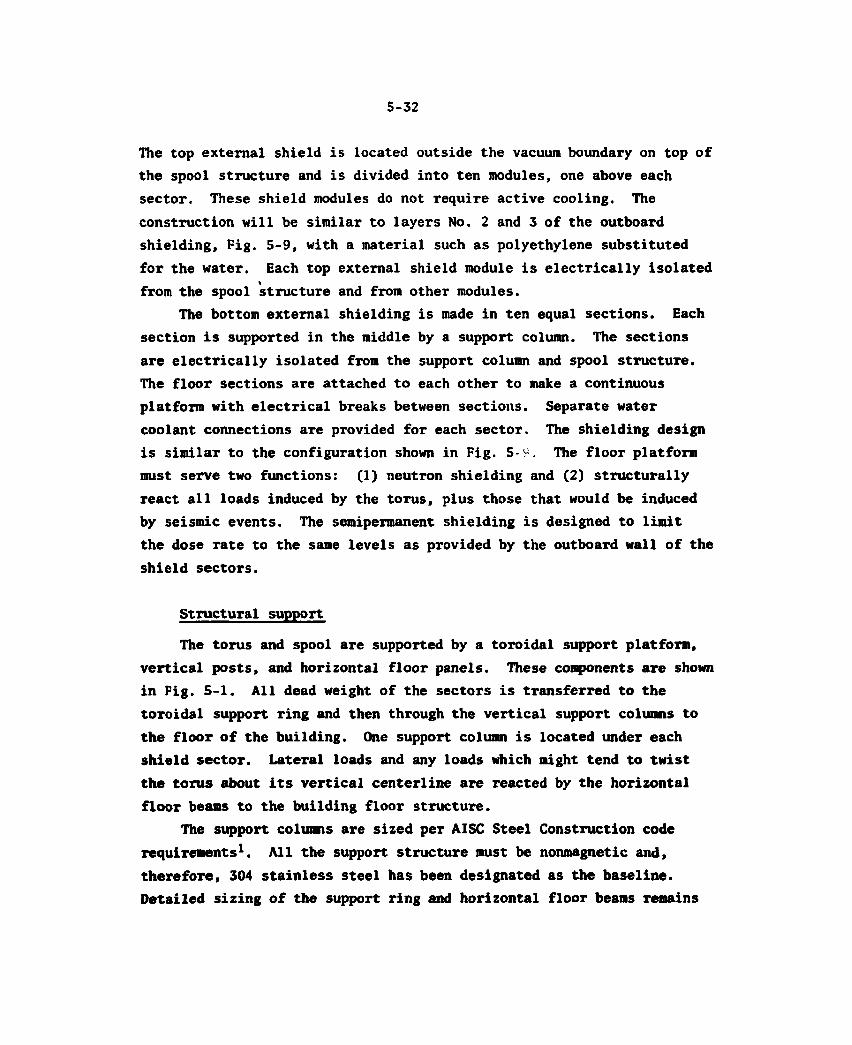
5-32
The top external shield is located outside the vacuum boundary on top of the spool structure and is divided into ten modules, one above each sector. These shield modules do not require active cooling. The construction will be similar to layers No. 2 and 3 of the outboard shielding, Fig. 5-9, with a material such as polyethylene substituted for the water. Each top external shield module is electrically isolated from the spool structure and from other modules.
The bottom external shielding is made in ten equal sections. Each section is supported in the middle by a support column. The sections are electrically isolated from the support column and spool structure. The floor sections are attached to each other to make a continuous platform with electrical breaks between sections. Separate water coolant connections are provided for each sector. The shielding design is similar to the configuration shown in Fig. 5-9. The floor platform must serve two functions: (1) neutron shielding and (2) structurally react all loads induced by the torus, plus those that would be induced by seismic events. The semipermanent shielding is designed to limit the dose rate to the same levels as provided by the outboard wall of the shield sectors.
Structural support
The torus and spool are supported by a toroidal support platform, vertical posts, and horizontal floor panels. These components are shown in Fig. 5-1. All dead weight of the sectors is transferred to the toroidal support ring and then through the vertical support columns to the floor of the building. One support column is located under each shield sector. Lateral loads and any loads which might tend to twist the torus about its vertical centerline are reacted by the horizontal floor beams to the building floor structure.
The support columns are sized per AISC Steel Construction code requirements 1. All the support structure must be nonmagnetic and, therefore, 304 stainless steel has been designated as the baseline. Detailed sizing of the support ring and horizontal floor beams remains

5-33
to be accomplished, although no problems are foreseen associated with these components.
Electrical contacts
Electromagnetic analysis of disruptions, discussed in Section 6.4, has indicated the requirement for a current path around the inside of shield sectors to minimize loads induced by electromagnetic forces and to reduce the potential for arcing. Since a continuous surface is not practical, a system of discrete electrical contacts was adopted. The contacts are designed to provide a low resistance path, thereby pre-venting arcing. Analysis has shown that approximately 164 cm 2 of contact area is required at 100 psi contact pressure using Ag/Mo as the contact material. The contact area is divided into approximately equal intervals along the inner periphery of the shield sectors. The contact spacing should not exceed 1 m. The FED baseline concept, Fig. 5-13, is a hydraulically pressurized bellows fixed to one shield sector and making contact with the adjacent sector. The pressurizing fluid is water. The electrical conductor concept is yet to be developed. The bellows concept allows for continuous and repeated use, provides self-alignment, and accommodates sector relative movement in all directions.
Retraction of the bellows contacts is accomplished by evacuating the water and then applying a vacuum on the diaphragm side of the contacts. Other features which also favored this selection are:
e Self-aligning contact surfaces e High tolerance to sector misalignment e Retraction capability
Vacuum seals
The primary vacuum seal is designed as a single convolution bellows seal, Fig. 5-14. It has a single planar seal surface which results in a relatively simple design for the welder/cutter machine. The initial seal weld is made to attach the bellows to the sector front panel. After mating the shield sector front panel to the spool surface, a
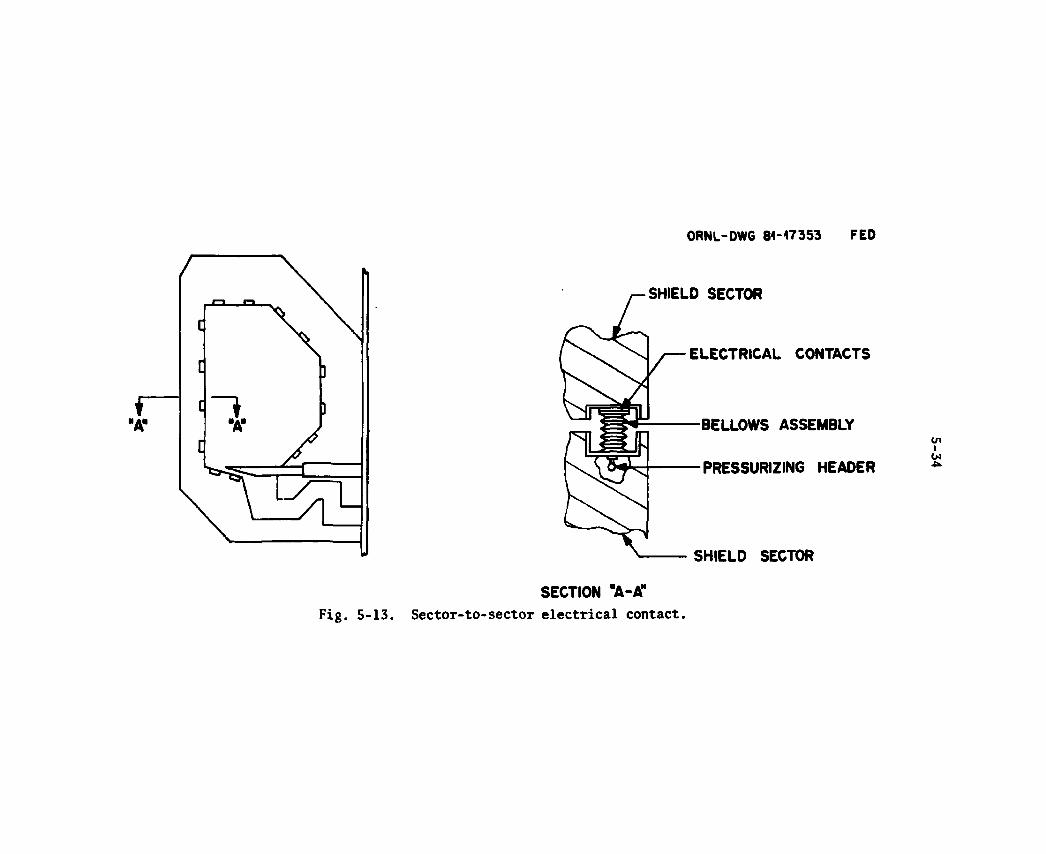
ORNL-DWG 84-17353 FED
SECTION "A-A" Fig. 5-13. Sector-to-sector electrical contact.
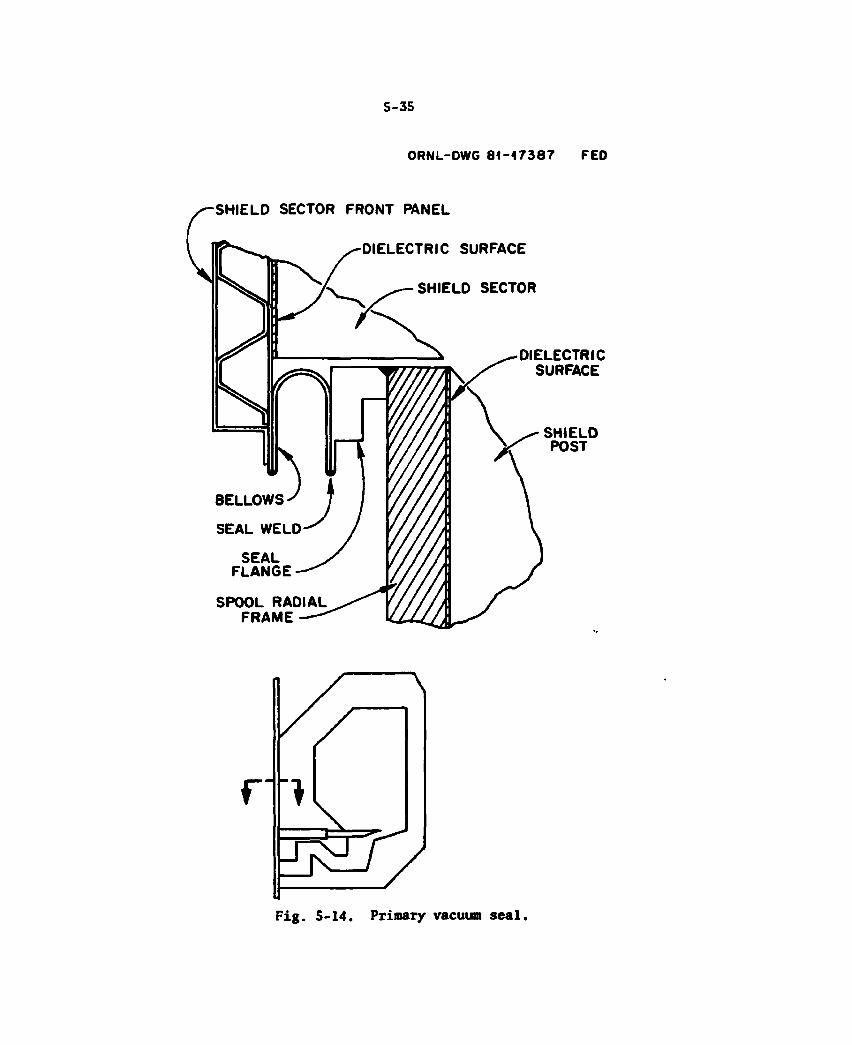
5-35
ORNL-DWG 81-17385R FED
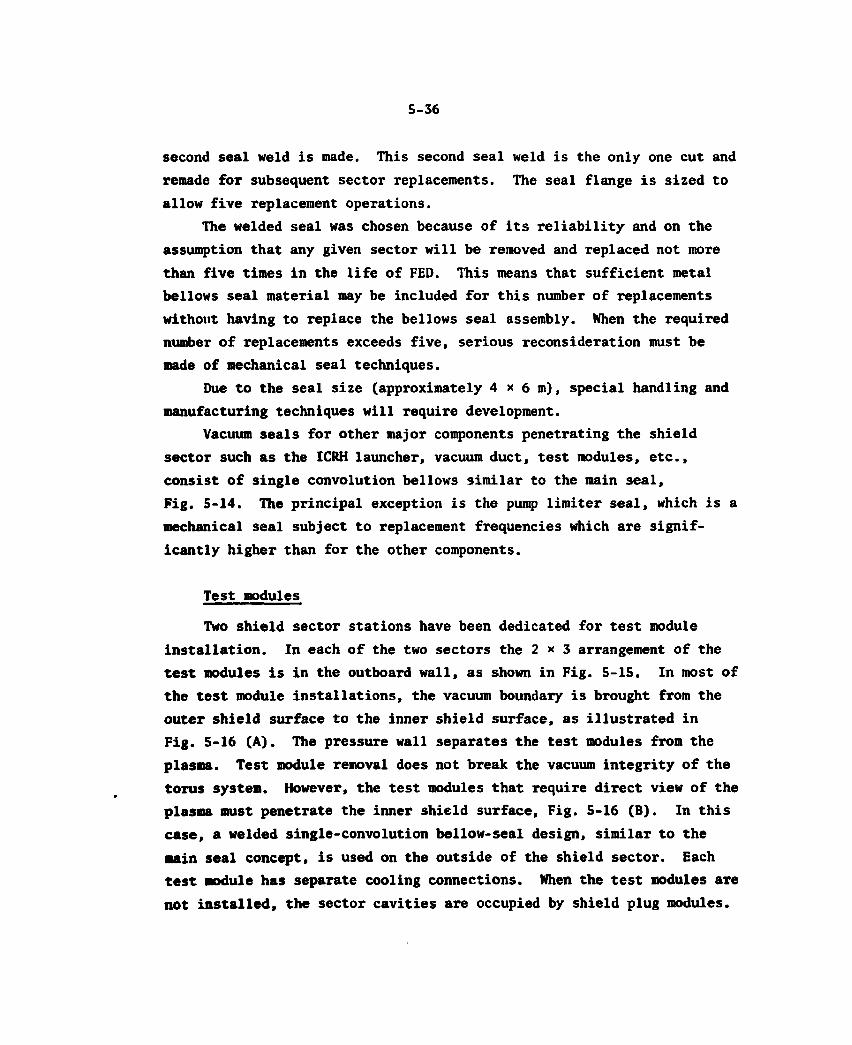
5-36
second seal weld is made. This second seal weld is the only one cut and remade for subsequent sector replacements. The seal flange is sized to allow five replacement operations.
The welded seal was chosen because of its reliability and on the assumption that any given sector will be removed and replaced not more than five times in the life of FED. This means that sufficient metal bellows seal material may be included for this number of replacements without having to replace the bellows seal assembly. When the required number of replacements exceeds five, serious reconsideration must be made of mechanical seal techniques.
Due to the seal size (approximately 4 x 6 m), special handling and manufacturing techniques will require development.
Vacuum seals for other major components penetrating the shield sector such as the ICRH launcher, vacuum duct, test modules, etc., consist of single convolution bellows similar to the main seal, Fig. 5-14. The principal exception is the pump limiter seal, which is a mechanical seal subject to replacement frequencies which are signif-icantly higher than for the other components.
Test modules
Two shield sector stations have been dedicated for test module installation. In each of the two sectors the 2 x 3 arrangement of the test modules is in the outboard wall, as shown in Fig. 5-15. In most of the test module installations, the vacuum boundary is brought from the outer shield surface to the inner shield surface, as illustrated in Fig. 5-16 (A). The pressure wall separates the test modules from the plasma. Test module removal does not break the vacuum integrity of the torus system. However, the test modules that require direct view of the plasma must penetrate the inner shield surface, Fig. 5-16 (B). In this case, a welded single-convolution bellow-seal design, similar to the main seal concept, is used on the outside of the shield sector. Each test module has separate cooling connections. When the test modules are not installed, the sector cavities are occupied by shield plug modules.
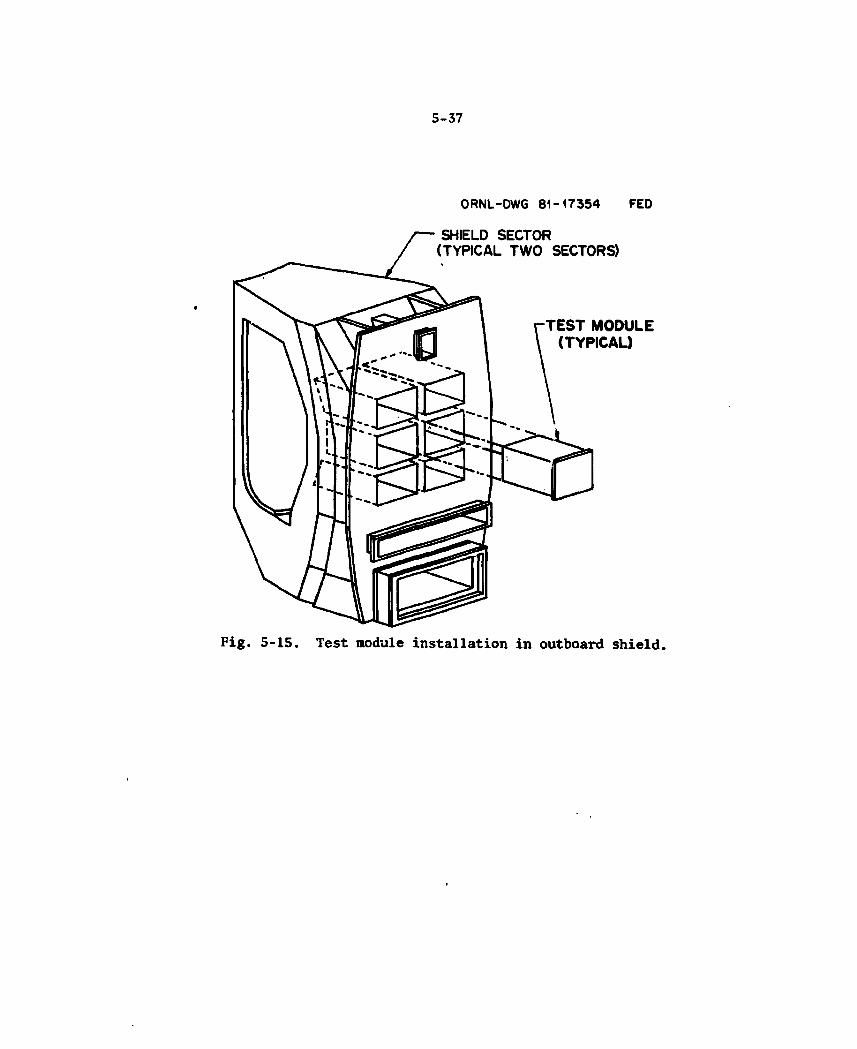
5-37
ORNL-DWG 81-17385R FED
SHIELD SECTOR (TYPICAL TWO SECTORS)
TEST MODULE (TYPICAL)
Fig. 5-15. Test module installation in outboard shield.
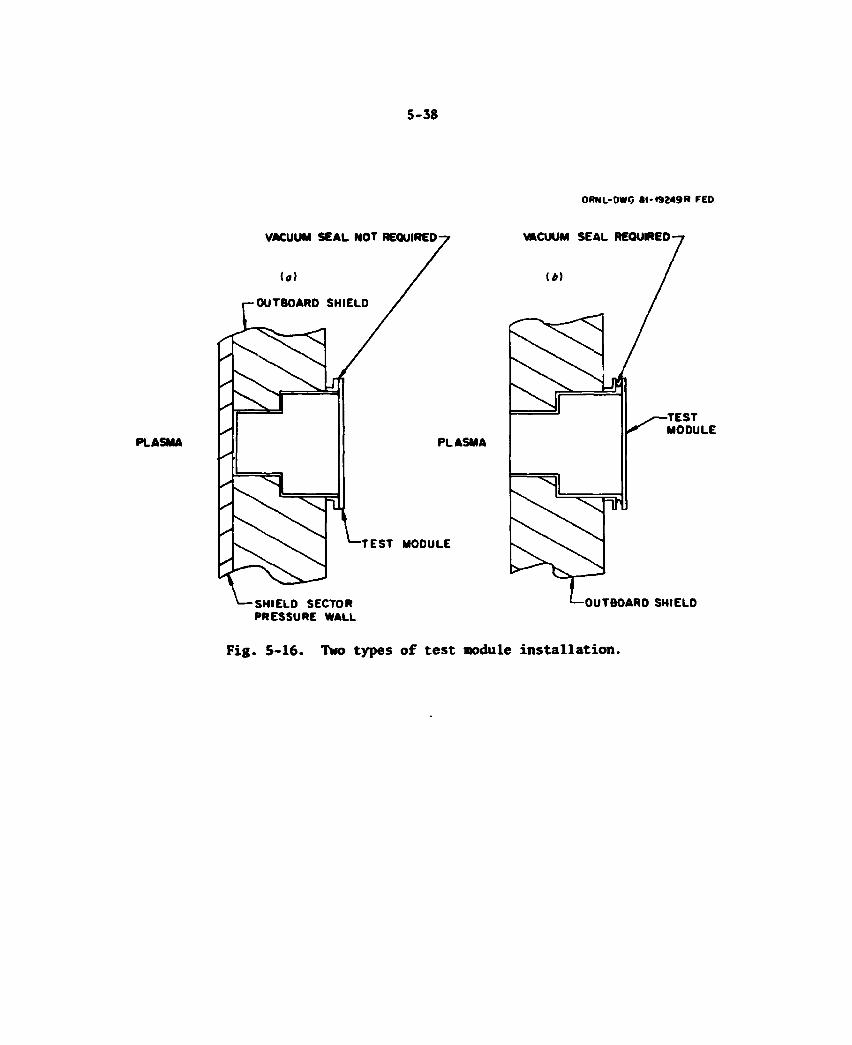
5-38
ORNL-OWO 8I-49249R FED
Fig. 5-16. Two types of test nodule installation.

5-39
Leak checking
Bach component is designed so as to allow leak testing by the manufacturer prior to shipment. By following this procedure, field verification and test equipment is minimized. The components checked by this method are:
• Individual spool panels prior to assembly (vacuum) • Spool panel assembly (vacuum)
e Radial frame assembly (corner welds - vacuum) e Shield sector, including front panel (fluid and vacuum) e Vacuum ducts (fluid and vacuum) e Top external shield sector (fluid) e Bottom/floor shield sector (fluid)
• First wall panels (fluid) • Pump limiter assembly (fluid and vacuum) e Shield plugs (fluid and vacuum)
Leak testing of the spool structure assembly welds should start whenever two radial frames and the connecting spool panel assembly are erected; the test concept is shown in Fig. 5-17. Moving the required pressure test panels after each test will reduce the test equipment inventory. Also, by qualifying the seal welds early, the installation of the shield sector can start before the whole spool structure is completed. The leak test requires that a helium puffer unit, Fig. 5-18, travel along each weld and a mass spectrometer be used in the vacuum pumping system for helium detection. By correlating the mass spectrome-ter signal with the calibrated position of the helium puffer unit, the location of a leak is identified accurately.
A similar procedure can be followed to test the shield front panel seal, vacuum duct seal, etc.
The leak testing during operation will be time consuming because the assembly welds will be covered up by other components, i.e., spool structure welds, etc. A similar procedure such as outlined for leak testing during erection can be followed.
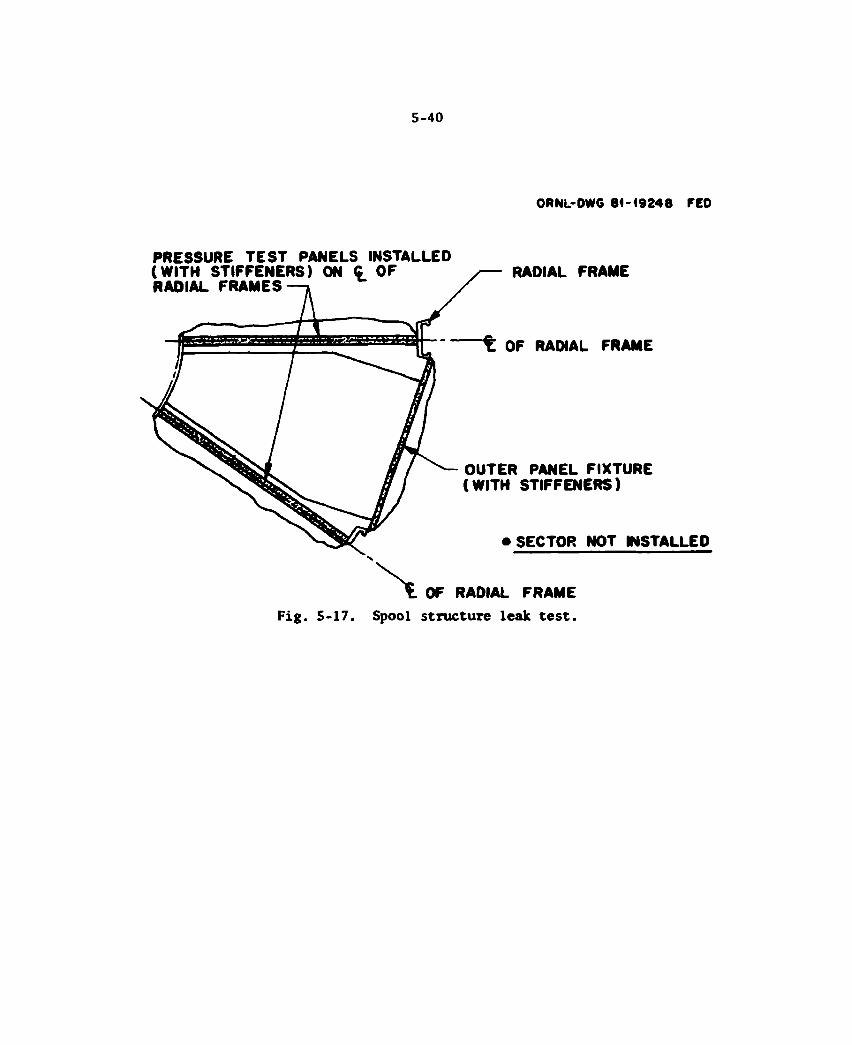
5-40
ORNL-DWG 8 1 - 1 9 2 4 8 FEO
PRESSURE TEST PANELS INSTALLED (WITH STIFFENERS) ON C OF RADIAL FRAMES
RADIAL FRAME
t OF RADIAL FRAME
OUTER PANEL FIXTURE (WITH STIFFENERS)
• SECTOR NOT INSTALLED
Fig. 5-17. OF RADIAL FRAME
Spool structure leak test.
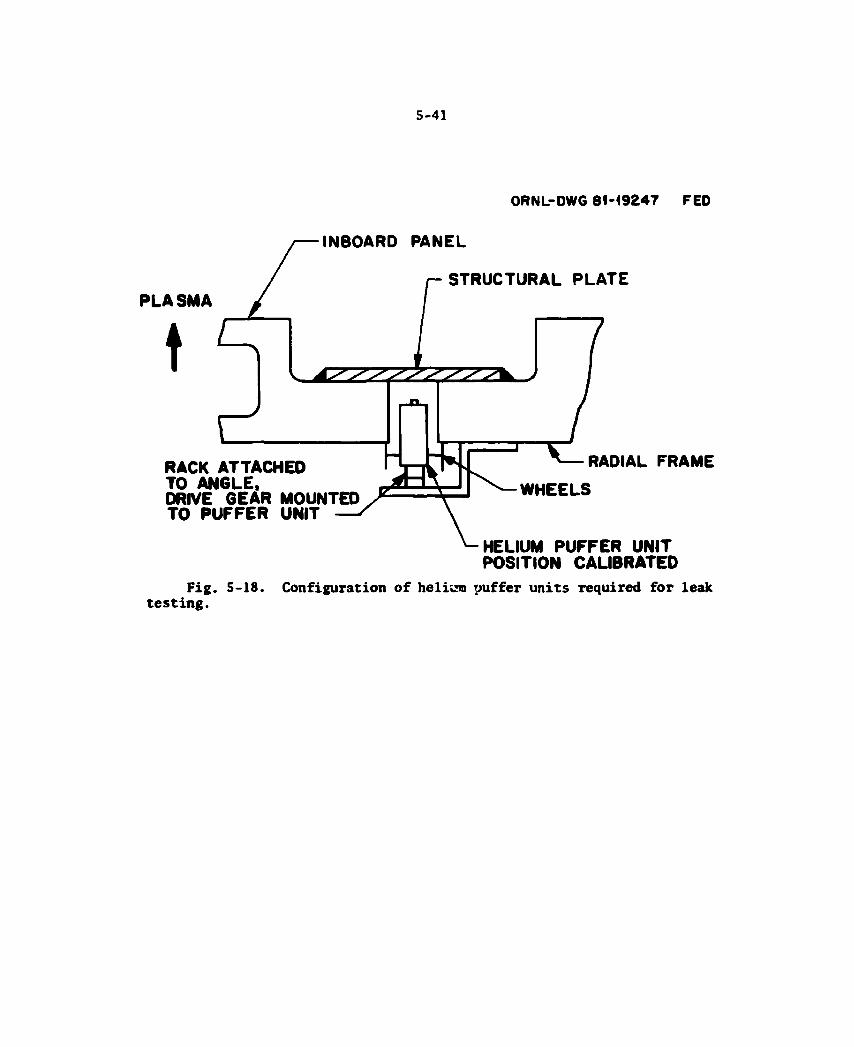
5-41
O R N L - D W G 8 1 - 1 7 3 8 5 R F E D
INBOARD PANEL
STRUCTURAL PLATE PLASMA
RACK ATTACHED TO ANGLE. DRIVE GEAR MOUNTED TO PUFFER UNIT
RADIAL FRAME WHEELS
HELIUM PUFFER UNIT POSITION CALIBRATED
Fig. 5-18. testing.
Configuration of helium puffer units required for leak
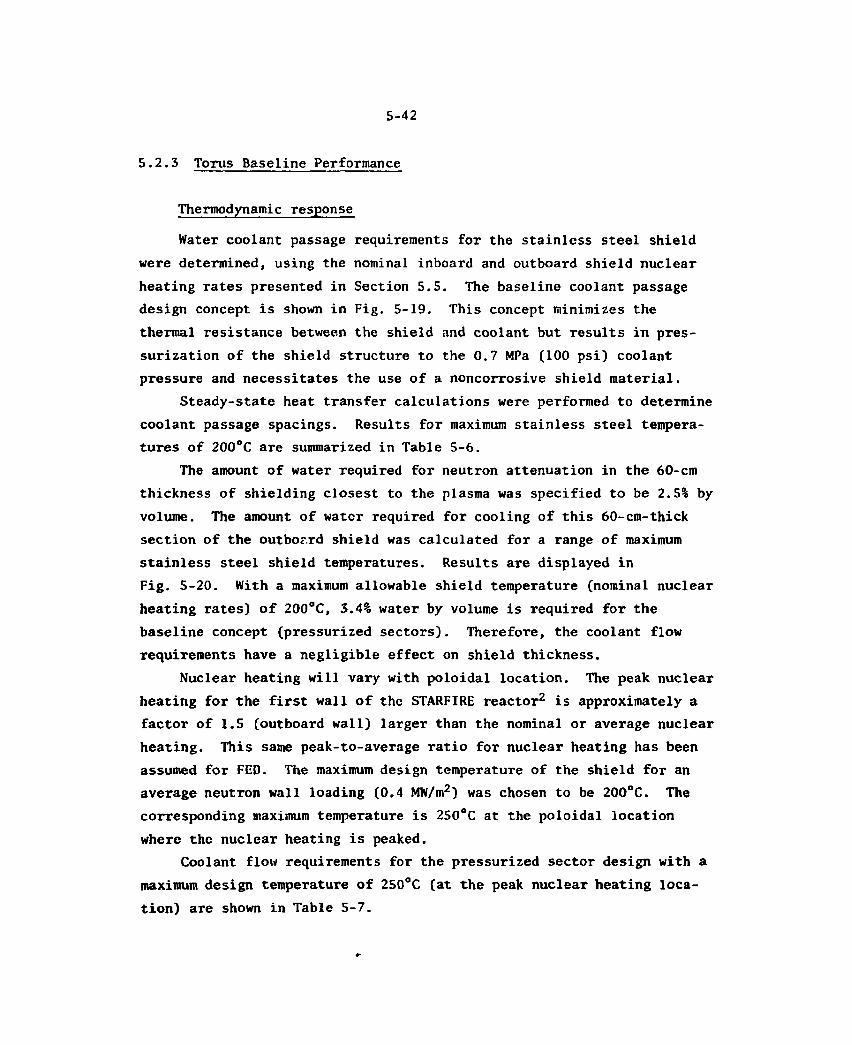
5-42
5.2.3 Torus Baseline Performance
Thermodynamic response
Water coolant passage requirements for the stainless steel shield were determined, using the nominal inboard and outboard shield nuclear heating rates presented in Section 5.5. The baseline coolant passage design concept is shown in Fig. 5-19. This concept minimizes the thermal resistance between the shield and coolant but results in pres-surization of the shield structure to the 0.7 MPa (100 psi) coolant pressure and necessitates the use of a noncorrosive shield material.
Steady-state heat transfer calculations were performed to determine coolant passage spacings. Results for maximum stainless steel tempera-tures of 200°C are summarized in Table 5-6.
The amount of water required for neutron attenuation in the 60-cm thickness of shielding closest to the plasma was specified to be 2.5% by volume. The amount of water required for cooling of this 60-cm-thick section of the outbor.rd shield was calculated for a range of maximum stainless steel shield temperatures. Results are displayed in Fig. 5-20. With a maximum allowable shield temperature (nominal nuclear heating rates) of 200°C, 3.4% water by volume is required for the baseline concept (pressurized sectors). Therefore, the coolant flow requirements have a negligible effect on shield thickness.
Nuclear heating will vary with poloidal location. The peak nuclear heating for the first wall of the STARFIRE reactor2 is approximately a factor of 1.5 (outboard wall) larger than the nominal or average nuclear heating. This same peak-to-average ratio for nuclear heating has been assumed for FED. The maximum design temperature of the shield for an average neutron wall loading (0.4 MW/m2) was chosen to be 200°C. The corresponding maximum temperature is 250°C at the poloidal location where the nuclear heating is peaked.
Coolant flow requirements for the pressurized sector design with a maximum design temperature of 250°C (at the peak nuclear heating loca-tion) are shown in Table 5-7.
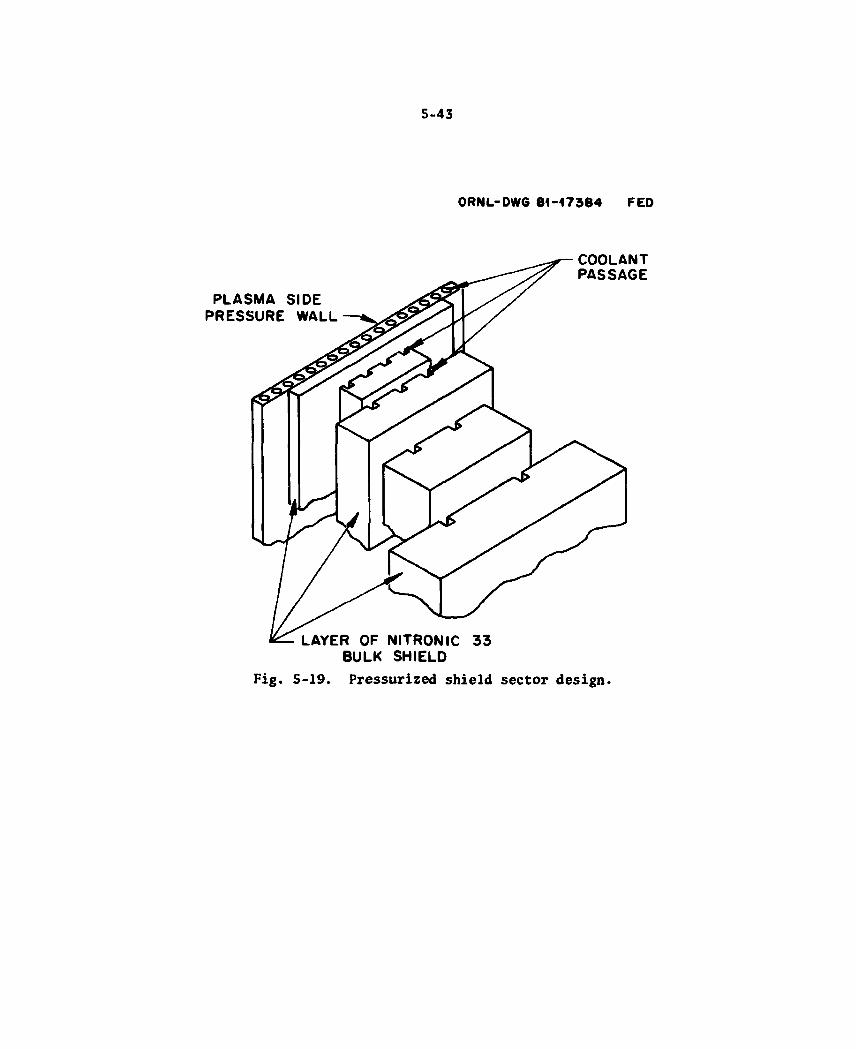
5-43
ORNL-DWG 8 1 - 1 7 3 8 5 R FED
Fig. 5-19. Pressurized shield sector design.
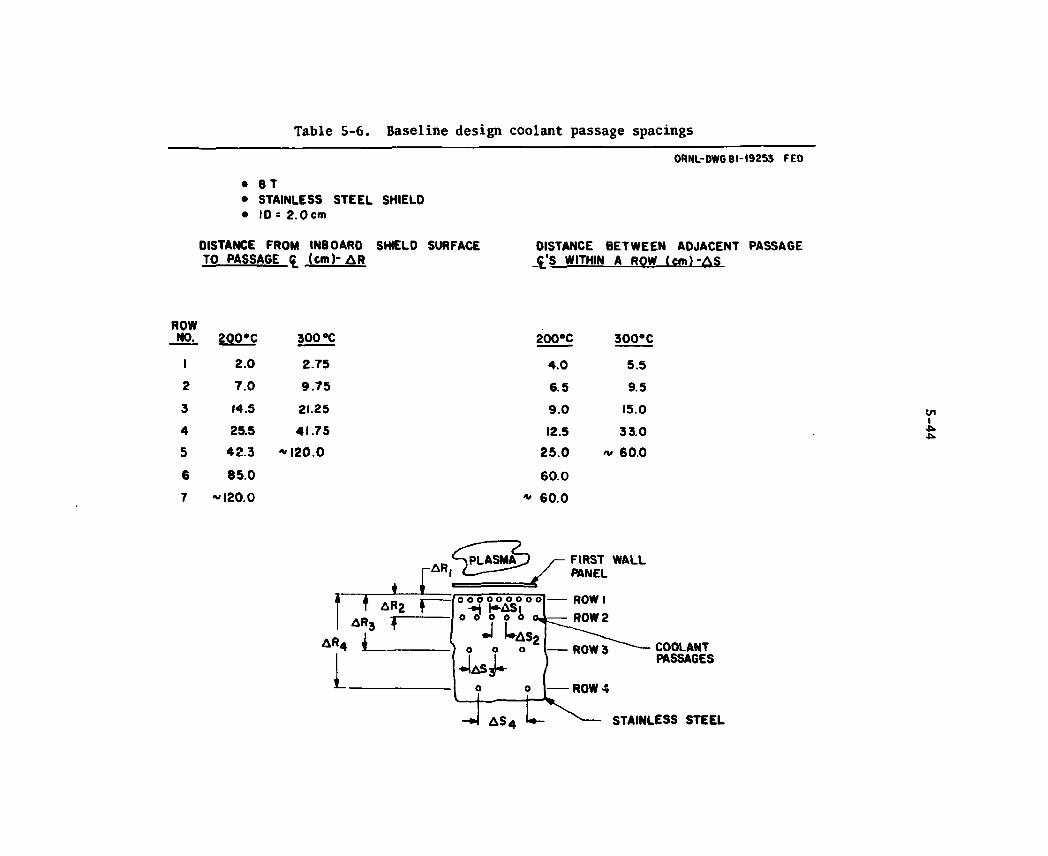
Table 5-6. Baseline design coolant passage spacings ORNL-DWG 81-19253 FED
• BT • STAINLESS STEEL SHIELO • ID » 2 .0cm
DISTANCE FROM INBOARD SHIELD SURFACE DISTANCE BETWEEN ADJACENT PASSAGE TO PASSAGE (cm)- AR <g/S WITHIN A ROW ( c m ) - A S
ROW NO. 200*C 300 °C 200*C 300°C
1 2.0 2-75 4.0 5.5
2 7 .0 9 . 7 5 6.5 9.5
3 14.5 21.25 9 .0 15.0
4 25.5 41.75 12.5 33.0
5 42 .3 "V 120.0 2 5 . 0 F 60.0
6 85 .0 60 .0
7 -V 120.0 * 60 .0
FIRST WALL PANEL
COOLANT PASSAGES
STAINLESS STEEL
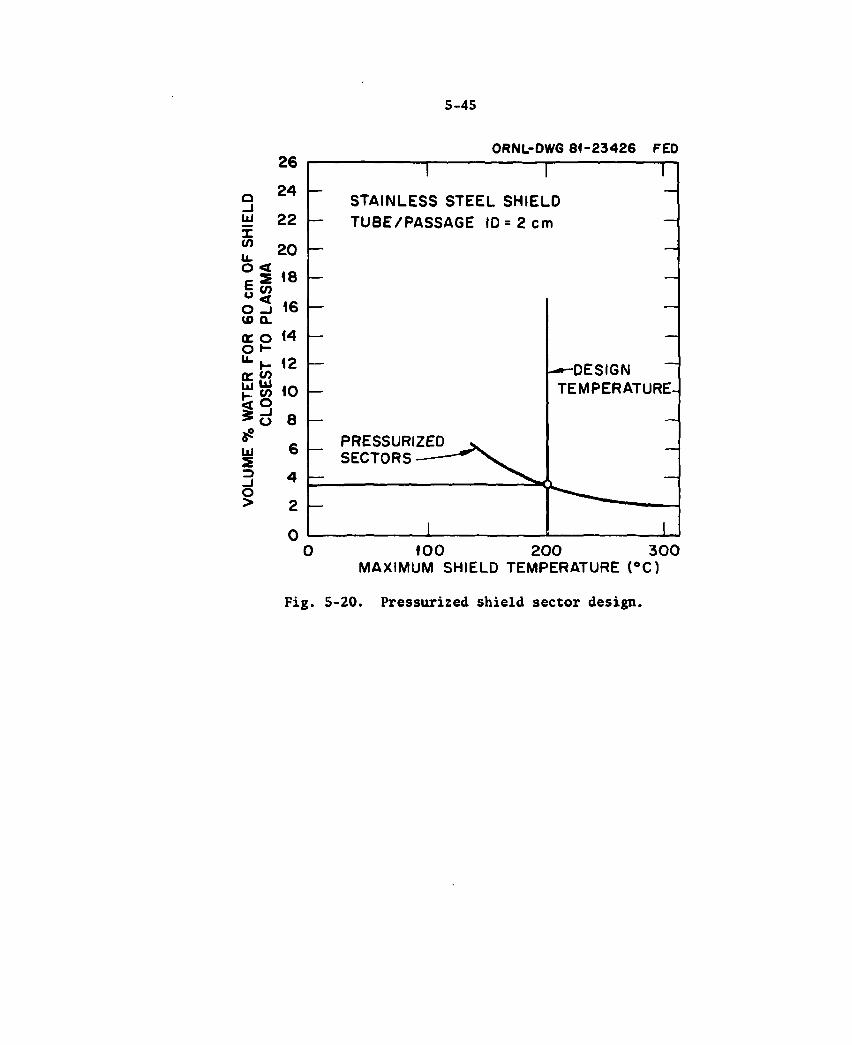
5-45
ORNL-DWG 8 1 - 2 3 4 2 6 FED
1 1
STAINLESS STEEL SHIELD - TUBE/PASSAGE I D = 2 cm ~
—
- - -DESIGN ~ — TEMPERATURE-
PRESSURIZED ^ SECTORS
1 1 1 0 0 2 0 0 3 0 0
MAXIMUM SHIELD TEMPERATURE ( °C)
Fig. 5-20. Pressurized shield sector design.
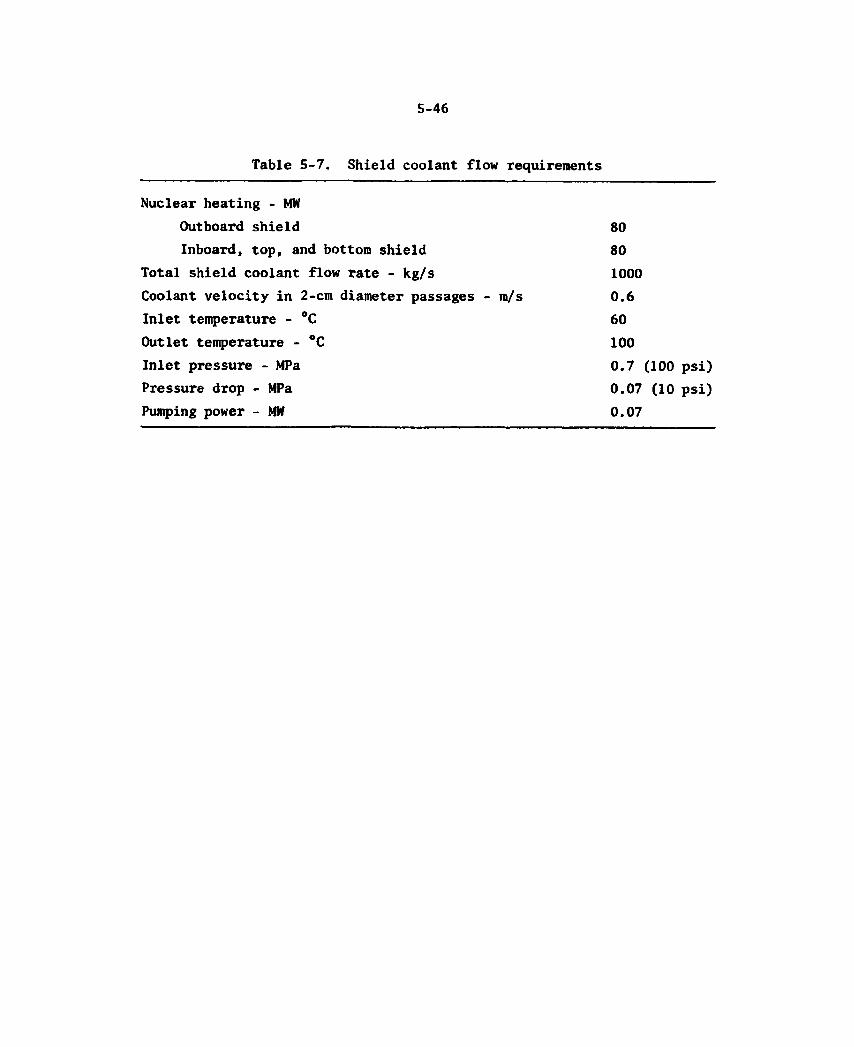
5-46
Table 5-7. Shield coolant flow requirements
Nuclear heating - MW Outboard shield 80 Inboard, top, and bottom shield 80
Total shield coolant flow rate - kg/s 1000 Coolant velocity in 2-cm diameter passages - m/s 0.6 Inlet temperature - °C 60 Outlet temperature - °C 100 Inlet pressure - MPa 0.7 (100 psi) Pressure drop - MPa 0.07 (10 psi) Pumping power - MW 0.07
5-47
Afterheat
The consequences of afterheat on temperatures in the first wall and bulk shield have been analyzed. Worst-case assumptions used for the analysis include complete loss of coolant flow to the first wall, as well as adjacent shield sectors. The volumetric heating in the first wall immediately after shutdown is 0.1 W/cm3. This heating rate is derived from the FED nuclear analysis documented in Section 5.5. The time decay of the afterheat in the STARFIRE reactor2 stainless steel first wall was assumed to apply to the FED first wall. Variation of the heating through the depth of the shield was assumed to follow the same decay as that of the saturated activity of the radionuclides (Section 5.5). The transient thermal response of the FED first wall associated with afterheat in the event of loss-of-coolant flow is shown in Fig. 5-21. The maximum temperature of the first wall is 430°C and occurs 17 hours after shutdown. The shield inner surface maximum temperature is 400°C and also occurs about 17 hours after shutdown. Acceptability of these temperatures from a structural reliability standpoint remains to be evaluated.
Bakeout
Bakeout of the FED vacuum chamber is required for outgassing after each exposure of the surfaces located inside the vacuum boundary to atmospheric conditions and before opening the chamber to remove tritium. The torus assembly is heated during bakeout by flowing hot nitrogen gas through the water coolant passages located in the bulk shield and first wall components. The desired initial base pressure after bakeout is 10"7 torr.
Required input powers and flow rates have been determined for a range of bakeout conditions. The times required to reach specific bakeout temperatures are shown in Fig. 5-22 for input heating powers up to 25 MW. If the input power to the nitrogen gas is 10 MW, then a bakeout temperature of 250°C is reached in 18.5 hours, thereby satisfy-ing the FED requirement of bakeout to 250°C in less than 24 hours.
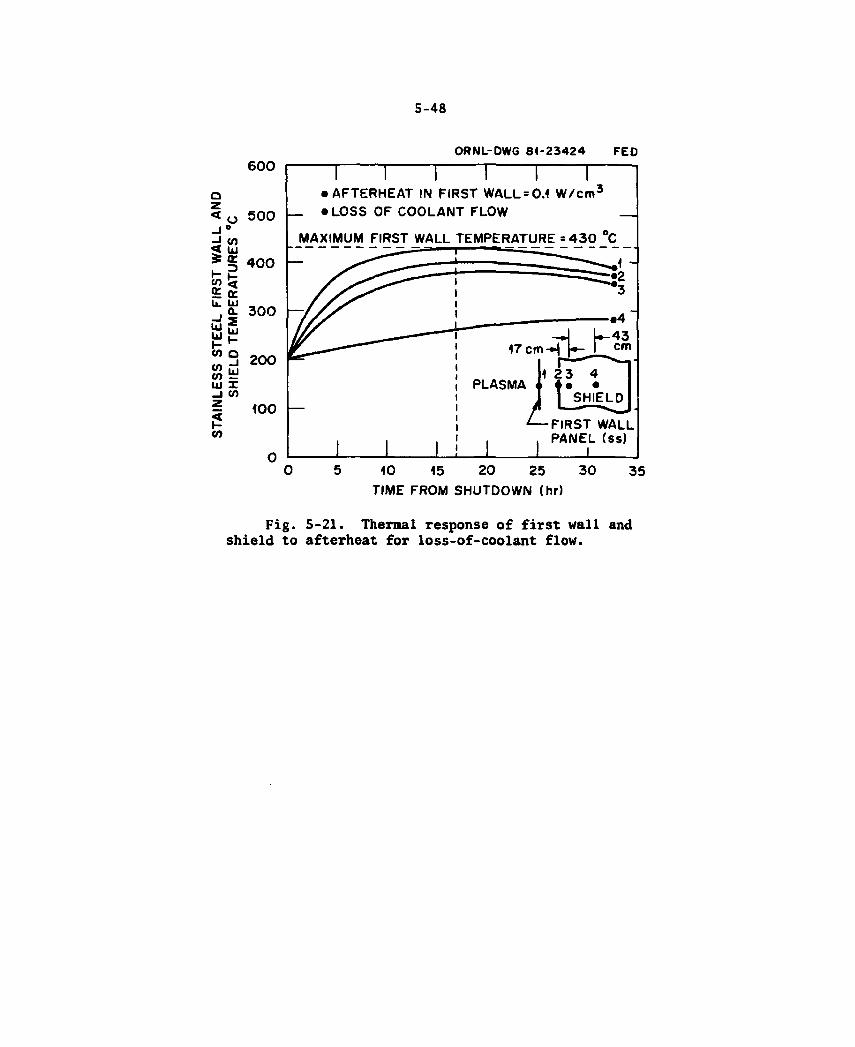
5-48
ORNL-DWG 84-23424 FEO 6 0 0
500
400
300
200
= 100
1 1 1 1 1 1 • AFTERHEAT IN FIRST WALL = 0.1 W/cm 3
_ • LOSS OF COOLANT FLOW _ MAXIMUM FIRST WALL TEMPERATURE =430 °C
" -
I I I
— ^ »4 "
-H h - 4 3 1 7 c m H r - J _ f m
1 23 4 1 PLASMA .. • | SHIELD
L — FIRST WALL , , PANEL (ss) 1 1 1
10 15 20 25 30 TIME FROM SHUTDOWN (hr)
35
Fig. 5-21. Thermal response of first wall and shield to afterheat for loss-of-coolant flow.
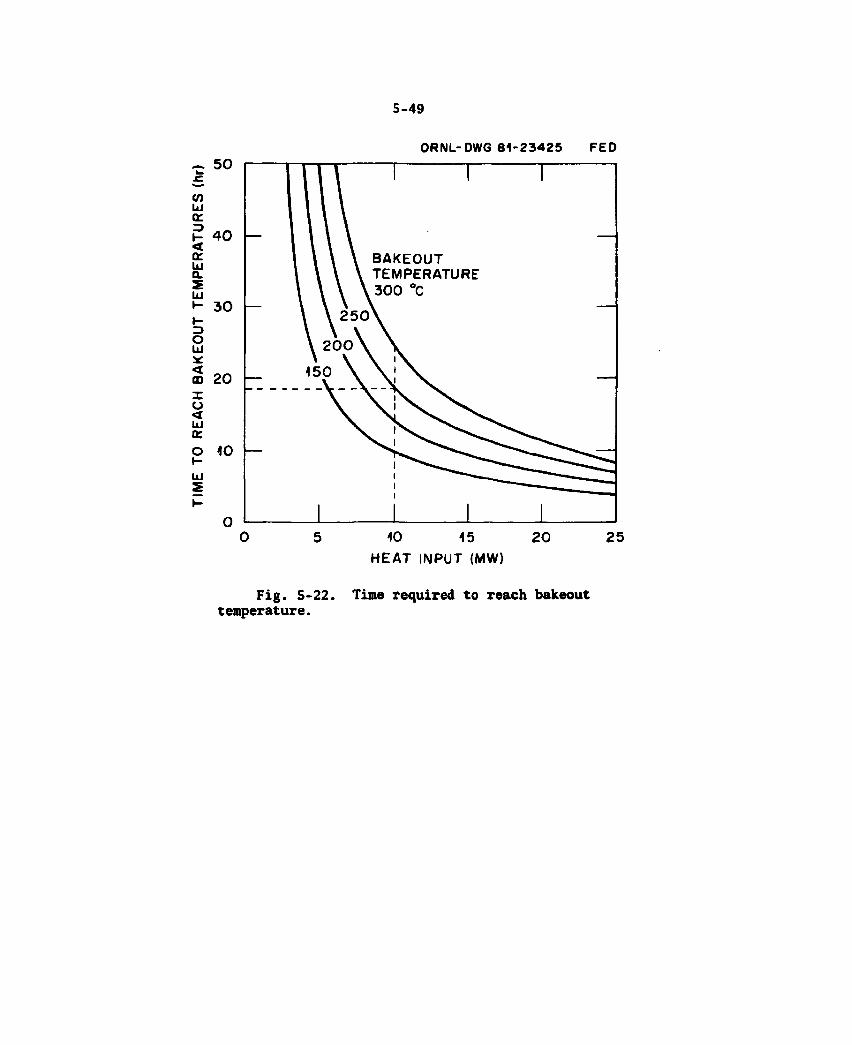
5-49
ORNL-DWG 8 1 - 2 3 4 2 5 FED
H E A T INPUT ( M W )
Fig. 5-22. Time required to reach bakeout temperature.
5-50
The effects of nitrogen flow rates on pumping powers and maximum stainless steel shield temperatures are shown in Fig. 5-23 for a bakeout temperature of 250°C and an input heating power of 10 MW. The flow rate must be greater than 100 kg/s tc maintain the temperature of the stainless steel shield at the sur^~:e of the coolant passages below 300°C. A flow rate of 100 kg/r- -requires a pumping power of less than 2 MW.
The recommended parameters for FED vacuum chamber bakeout are summarized in Table 5-8. Ten MW ~>? input heating power and a nitrogen flow rate of 100 kg/s were selected for bakeout to 250°C. The torus will reach 250°C (average) after 18.5 hours, and a pumping power of 1.7 MW is required. The maximum shield temperature is 300°C. After reaching the 250°C bakeout temperature, a continuous heating power of about 1.0 MW is required for the duration of bakeout. This power is required to balance the 1-MW convective heat loss to the 25°C sur-roundings and could be provided by utilizing the heat dissipated from the frictional losses in flowing the gas (2-MW heat loss for maximum flow conditions).
The first wall can be heated by radiation from the shield. Hence, hot Nj flow is not required for this component. However, a tritium purge may be required. If nitrogen is not a satisfactory medium for tritium purge, helium can be used.
Structural analysis of spool
Loads used for sizing the spool structure are shown in Fig. 5-24. Combined atmospheric pressure and disruption hoop loads of 0.3 MPa (3 atm) provided the basis for preliminary definition of the inboard cylinder membrane thickness requirements. The reversal of the dis-ruption load due to a dynamic response can result in a net compres-sive force of 0.1 MPa (1 atm). This hoop compression load provided a basis for determining the inboard cylinder depth required to preclude buckling. Details of the resulting corrugation configuration were shown previously in Fig. 5-5(c).
\
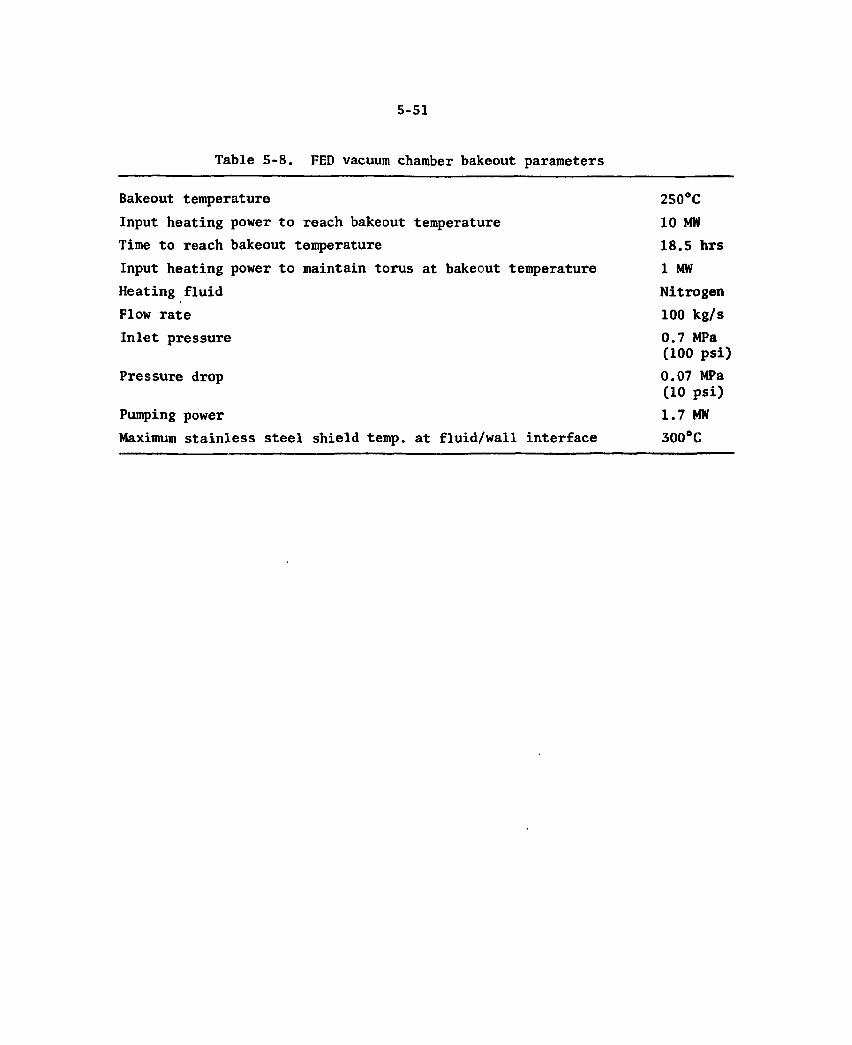
5-51
Table 5-8. FED vacuum chamber bakeout parameters
Bakeout temperature 250°C Input heating power to reach bakeout temperature 10 MW Time to reach bakeout temperature 18.5 hrs Input heating power to maintain torus at bakeout temperature 1 MW Heating fluid Nitrogen Flow rate 100 kg/s Inlet pressure 0.7 MPa
(100 psi) Pressure drop 0.07 MPa Pressure drop
(10 psi) Pumping power 1.7 MW Maximum stainless steel shield temp, at fluid/wall interface 300°C
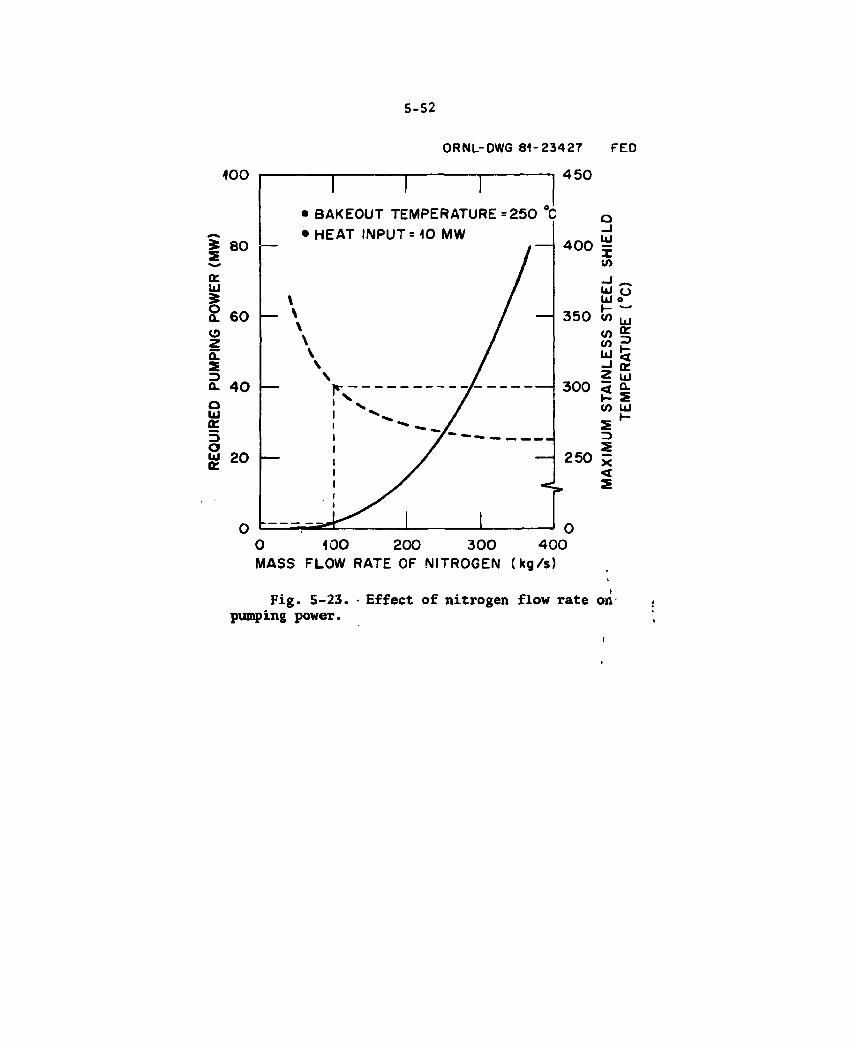
5-52
ORNL-OWG 8 1 - 2 3 4 2 7 FED
4 5 0
• BAKEOUT TEMPERATURE=250 C • HEAT INPUT = 10 MW
0 100 200 300 4 0 0 MASS FLOW RATE OF NITROGEN (kg/s)
Fig. 5-23. • Effect of nitrogen flow rate on-pumping power.
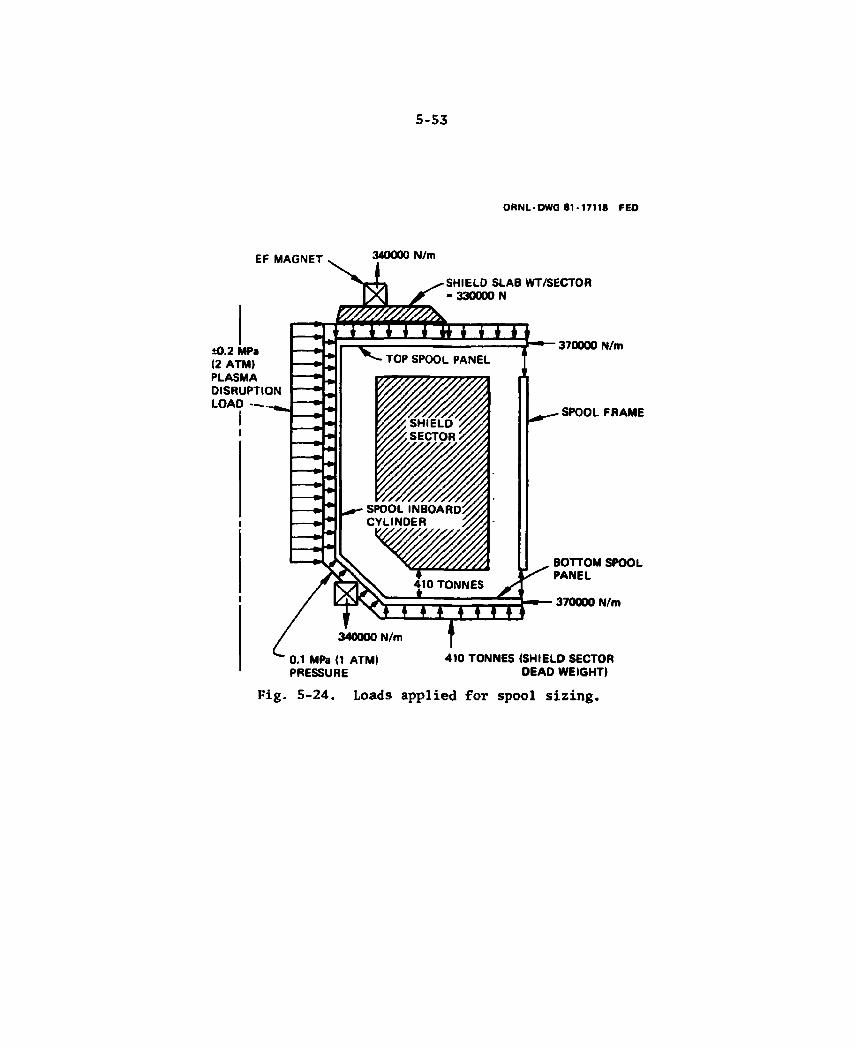
5-53
ORNL-DWG 81-17118 FED
EF MAGNET 340000 N/m
SHIELD SLAB WT/SECTOR - 330000 N
±0.2 MPa (2 ATM) PLASMA DISRUPTION LOAD
I I
370000 N/m
SPOOL FRAME
340000 N/m J
BOTTOM SPOOL PANEL
370000 N/m
0.1 MPa (1 ATM! PRESSURE
410 TONNES (SHIELD SECTOR DEAD WEIGHT)
Fig. 5-24, Loads applied for spool sizing.

5-54
The material thicknesses determined for the inboard cylinder were also used for the top panel. These panels are subjected to bending from the atmospheric pressure load and the top shield slab dead weight. Radial I beams [shown in Fig. 5-5(a)] were sized to take the bending Standard AISC M8x34.3 steel beams at a spacing of 43.5 cm were deter-mined to be adequate to take the maximum bending loads. These radial members beam the load to the inboard cylinder and an outboard panel edge ring. The outboard edge ring beams the load to the radial spool frames. This edge ring is also shown in Fig. 5-5(a). The bottom spool panel was considered to be attached to the external torus support platform. This panel transfers the sector dead weight directly through to the support platform. To accomplish this with minimum effect on the toroidal resistance, a support plate and internal I beams were provided.
Spool structure finite element analysis
The structural spool was modeled to determine internal load dis-tributions and deflected shapes. This was accomplished using the NASTRAN (NASA Structural Analysis) finite element code. Because of cyclic symmetry, only a 36° toroidal section was modeled, as shown in Fig. 5-25. The model consisted of approximately 100 plate bending elements and 100 beam bending elements. Top panel radial stiffeners were modeled with beam bending elements.
The loads accounted for include: atmospheric pressure, top shield dead weight, and poloidal field magnet loads (top and bottom of spool inboard cylinder), Fig. 5-24. Two door designs were considered. In the first case the outer door was considered capable of taking in-plane compression loads. In the second case atmospheric pressure loads were beamed by the outer ring to the support posts. In both cases, atmos-pheric pressure loads normal to the door were appropriately applied to the spool structure.
An example of the resulting internal loads is shown in Fig. 5-26, where the bending moment distributions are shown in the top panel
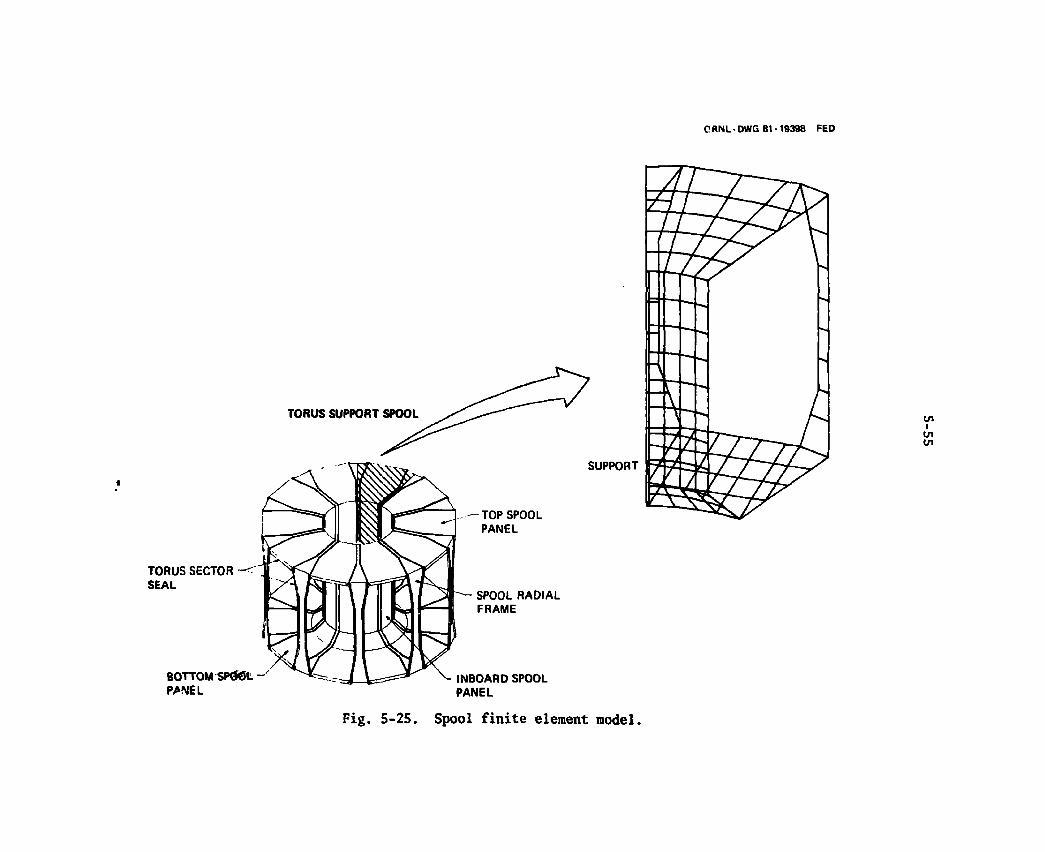
CANL DWG 81-19398 FED
TORUS SUPPORT SPOOL
TORUS SECTOR SEAL
BOTTOM SP061- -PANEL
TOP SPOOL PANEL
SPOOL RADIAL FRAME
INBOARD SPOOL PANEL
SUPPORT
in i in Ui
Fig. 5-25. Spool finite element model.
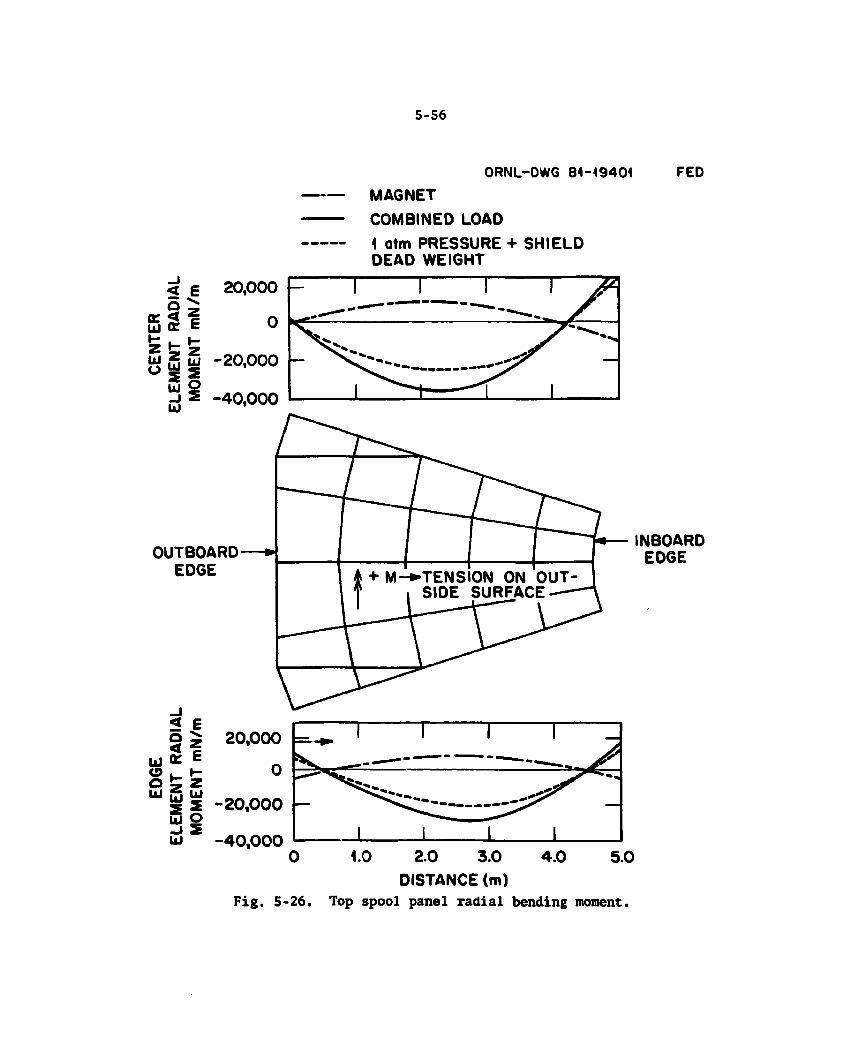
5-56
ORNL-DWG 8 4 - 1 9 4 0 1
MAGNET
COMBINED LOAD
FED
1 atm PRESSURE -l- SHIELD DEAD WEIGHT
< E 5 z
K % i UJ (£ c
U J Z £ -20,000 -w s 2
Ju O H S - 4 0 , 0 0 0 UJ
OUTBOARD EDGE
< E < i
UJ K E
a . »-o b z UJ 5 u
UJ o
ul - 4 0 , 0 0 0
INBOARD EDGE
2.0 3 .0 DISTANCE (m)
Fig. 5-26. Top spool panel radial bending moment.
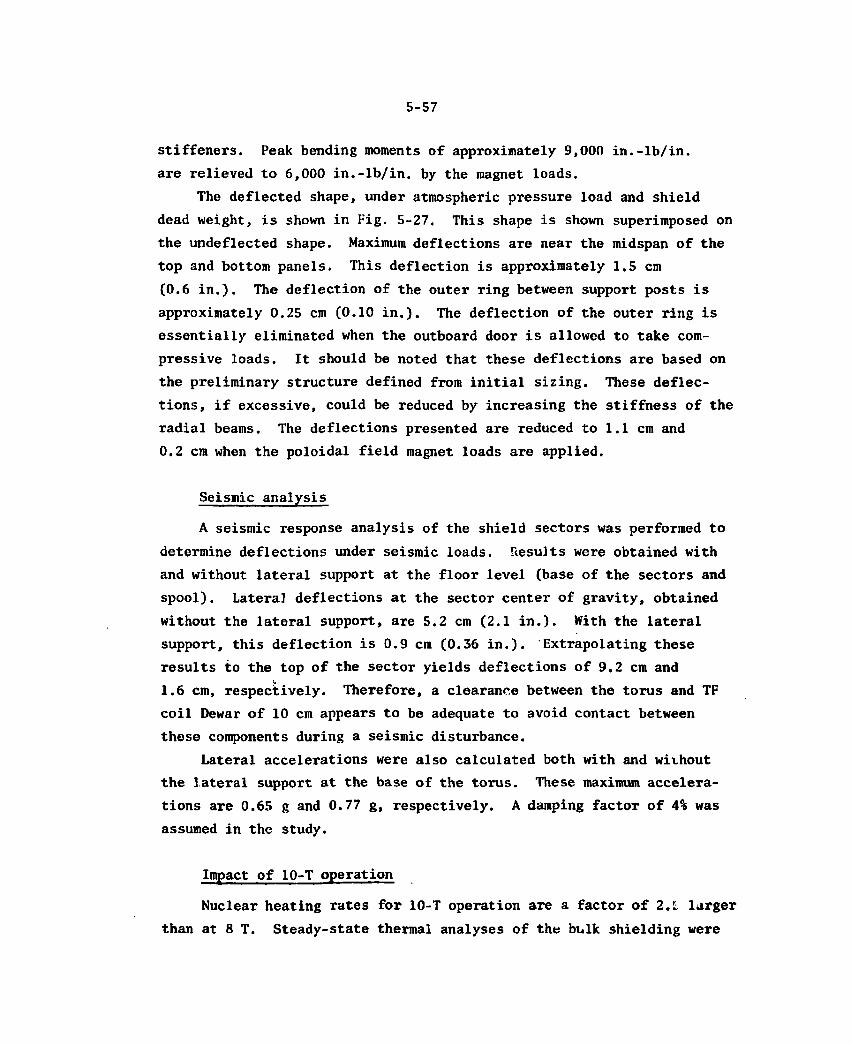
5-57
stiffeners. Peak bending moments of approximately 9,000 in.-lb/in. are relieved to 6,000 in.-lb/in. by the magnet loads.
The deflected shape, under atmospheric pressure load and shield dead weight, is shown in Fig. 5-27. This shape is shown superimposed on the undeflected shape. Maximum deflections are near the midspan of the top and bottom panels. This deflection is approximately 1.5 cm (0.6 in.). The deflection of the outer ring between support posts is approximately 0.25 cm (0.10 in.). The deflection of the outer ring is essentially eliminated when the outboard door is allowed to take com-pressive loads. It should be noted that these deflections are based on the preliminary structure defined from initial sizing. These deflec-tions, if excessive, could be reduced by increasing the stiffness of the radial beams. The deflections presented are reduced to 1.1 cm and 0.2 cm when the poloidal field magnet loads are applied.
Seismic analysis
A seismic response analysis of the shield sectors was performed to determine deflections under seismic loads. Results were obtained with and without lateral support at the floor level (base of the sectors and spool). Lateral deflections at the sector center of gravity, obtained without the lateral support, are 5.2 cm (2.1 in.). With the lateral support, this deflection is 0.9 cm (0.36 in.). Extrapolating these results to the top of the sector yields deflections of 9.2 cm and 1.6 cm, respectively. Therefore, a clearance between the torus and TF coil Dewar of 10 cm appears to be adequate to avoid contact between these components during a seismic disturbance.
Lateral accelerations were also calculated both with and without the lateral support at the base of the torus. These maximum accelera-tions are 0.65 g and 0.77 g, respectively. A damping factor of 4% was assumed in the study.
Impact of 10-T operation
Nuclear heating rates for 10-T operation are a factor of 2.1 larger than at 8 T. Steady-state thermal analyses of the bulk shielding were
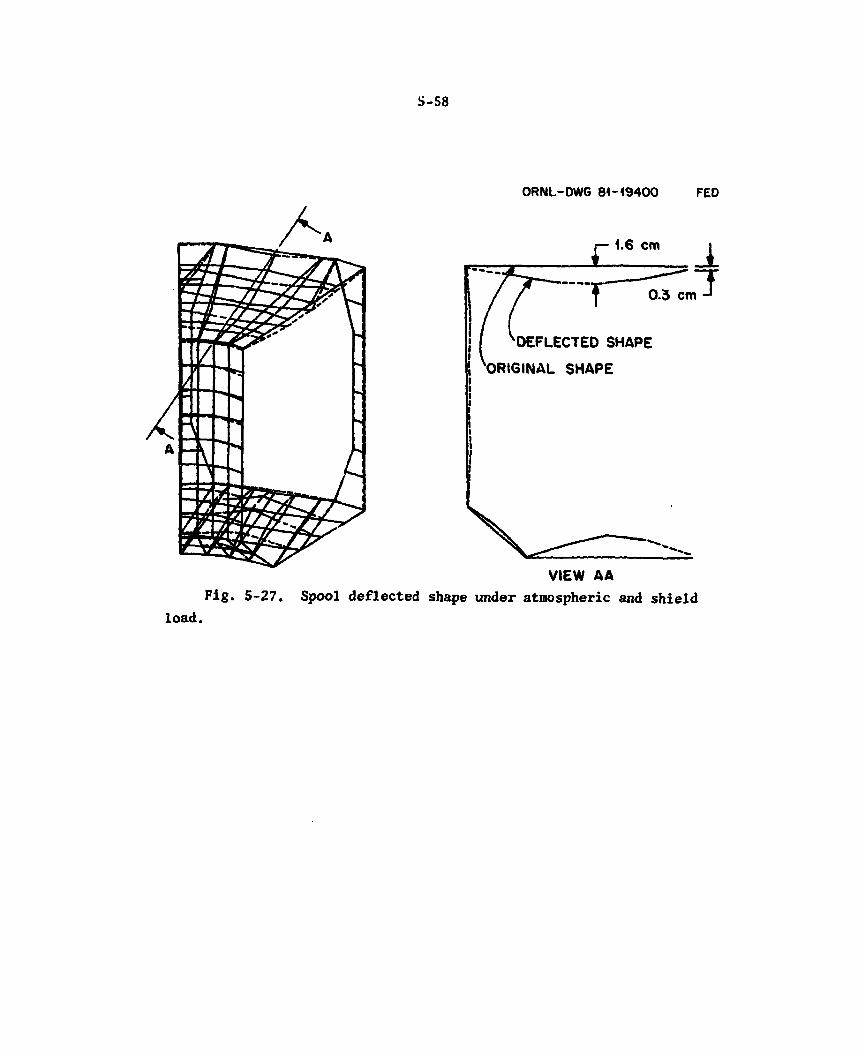
5-58
ORNL-DWG 84-49400
£ 1.6 cm
FED
J l
'DEFLECTED SHAPE
'ORIGINAL SHAPE
VIEW AA Fig. 5-27. Spool deflected shape under atmospheric and shield
load.
5-59
performed for these heating rates. Results are summarized in Table 5-9.
These steady-state results indicate that the water flow rate must be increased above the flow rate at 8 T in order to operate within acceptable temperature and pressure limits. However, since these are steady-state results, they represent the temperatures and pressures needed after a series of "closely" spaced burns or a single burn of "long" duration. If the bums were "short" enough and the dwell time between burns "long" enough, then the 8-T coolant flow system would provide adequate cooling at 10 T. Further studies of the transient response of the bulk shielding, coolant flow system, and heat exchange equipment are required to determine the b u m duration and dwell times which would allow the thermal inertia and heat removal capacity of the 8-T designed coolant system to provide adequate cooling at 10 T.
If these burn durations and dwell times are found to be too restrictive, then the capacity of the coolant flow system may have to be increased by a factor as great as 2.5.
If the coolant capacity is increased but the coolant passage spacings in the bulk shielding are not redesigned for 10 T, then the peak stainless steel shield temperature will be 430°C, which is determined to be unacceptably high. Hence, the shield coolant passages may also have to be redesigned, which may cause the shield thickness to increase.
5.2.4 Torus Design Options
The major design options considered for the torus were as follows:
e Spool structure materials e Shield materials • Shield sector structural concept e Shield design for minimizing refrigeration system costs e Alternative concepts for providing spool electrical properties e Alternative vacuum seals e Alternative electrical contact concepts
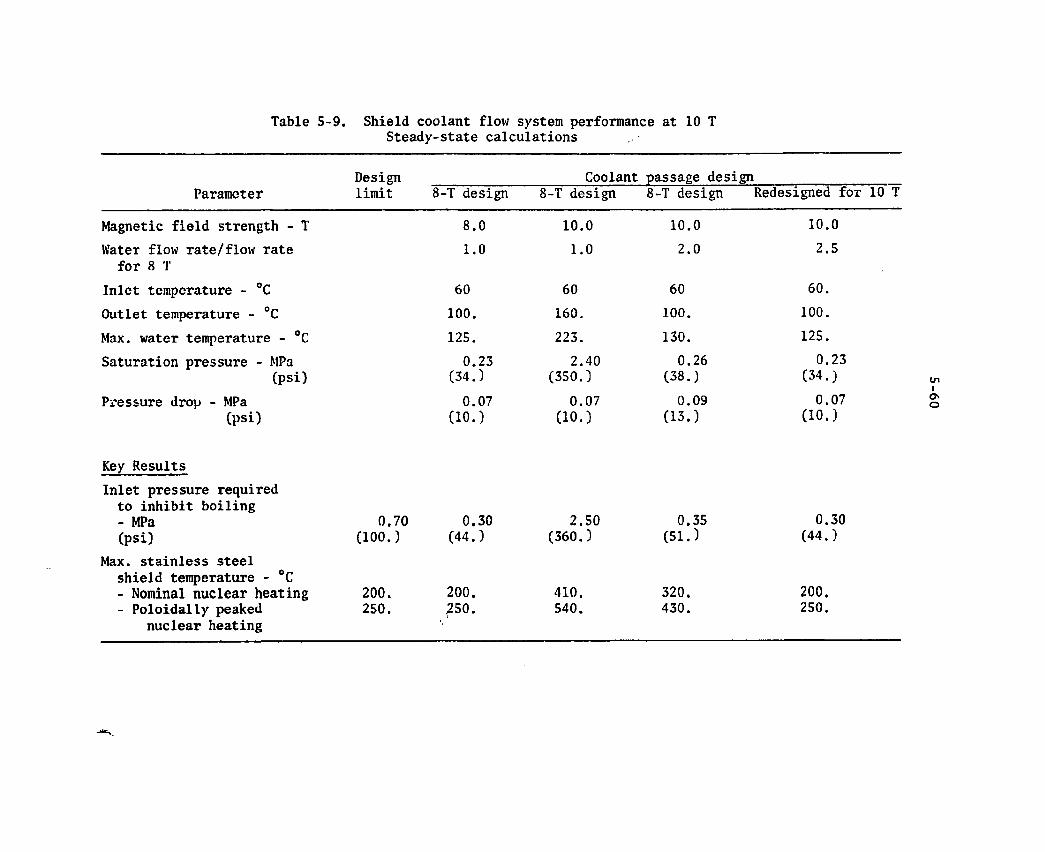
Table 5-9. Shield coolant flow system performance at 10 T Steady-state calculations
Parameter Design limit 8-T design 8-T design
Coolant passage design ssign 8-T design Redesigned for 10 T
Magnetic field strength - T Water flow rate/flow rate
for 8 T Inlet temperature - °C Outlet temperature - °C Max. water temperature - °C Saturation pressure - MPa
(psi) Pressure drop - MPa
(psi)
8.0 1.0
60
100. 125. 0.23
(34.) 0.07
( 1 0 . )
10.0 1 . 0
60
160.
223. 2.40
(350.) 0.07
( 1 0 . )
10 .0
2 . 0
60
100.
130. 0 .26
(38.) 0.09
(13.)
10 .0
2.5
60. 100.
125. 0.23
(34.) 0.07
(10.)
Key Results Inlet pressure required to inhibit boiling - MPa 0.70 0.30 2.50 (psi) (100.) (44.) (360.)
Max. stainless steel shield temperature - °C - Nominal nuclear heating 200. 200. 410. - Poloidally peaked 250. 250. 540.
nuclear heating
0.35 (51.)
320. 430.
0.30 (44.)
200. 250.

5-61
Spool structure material selection
The choice of spool structure material was based on the need for high electrical resistance. Since a panel structure uses the least amount of material for a required stiffness, the candidate designs are thin-skinned sandwich structures. In Fig. 5-28, three material/panel designs are shown with their pertinent properties. Inconel was chosen because it requires the least material thickness and has the highest resistivity. A reexamination of some of the candidate alloys is probably warranted, based on resistivity data not available earlier.
Shielding material selection
Since shielding configuration has a direct effect on machine size and cost, effort must be made toward its optimization. A satisfactory design is achieved by alternating layers of steel and water and the selection of a proper steel alloy. The chemical composition and physical properties of six candidate alloy steels are given in Table 5-10. Four of the candidates are stainless steel alloys (nitronic 33, 204 L, 304 L, and 316 L), and two are manganese alloy steels (Fe 1422 and Ncneut 1420). The alloys are commercially avail-able, with the exception of Noneut 1420, which is a hypothetical alloy. The chromium, nickel, and manganese contents are the primary consid-erations. Nickel content affects the production of secondary gamma rays and controls the biological dose rate on the outside of the outboard shield. Manganese is substituted for nickel in the case of Fe 1422 to reduce the production of secondary gamma rays and to preserve the ductility. Chromium content affects the corrosion properties. Low chromium alloys (such as FE 1422) are susceptible to corrosion in the presence of free oxygen in the cooling water and, therefore, represent a source of contaminated "crud" in heat exchange and coolant lines.
Shielding analyses (Section 5.5) have shown that the alloy steel with the lowest nickel content should be the best choice for the bulk shield material. However, other requirements must also be considered (i.e.,. corrosion, ductility, availability, etc.). Several materials
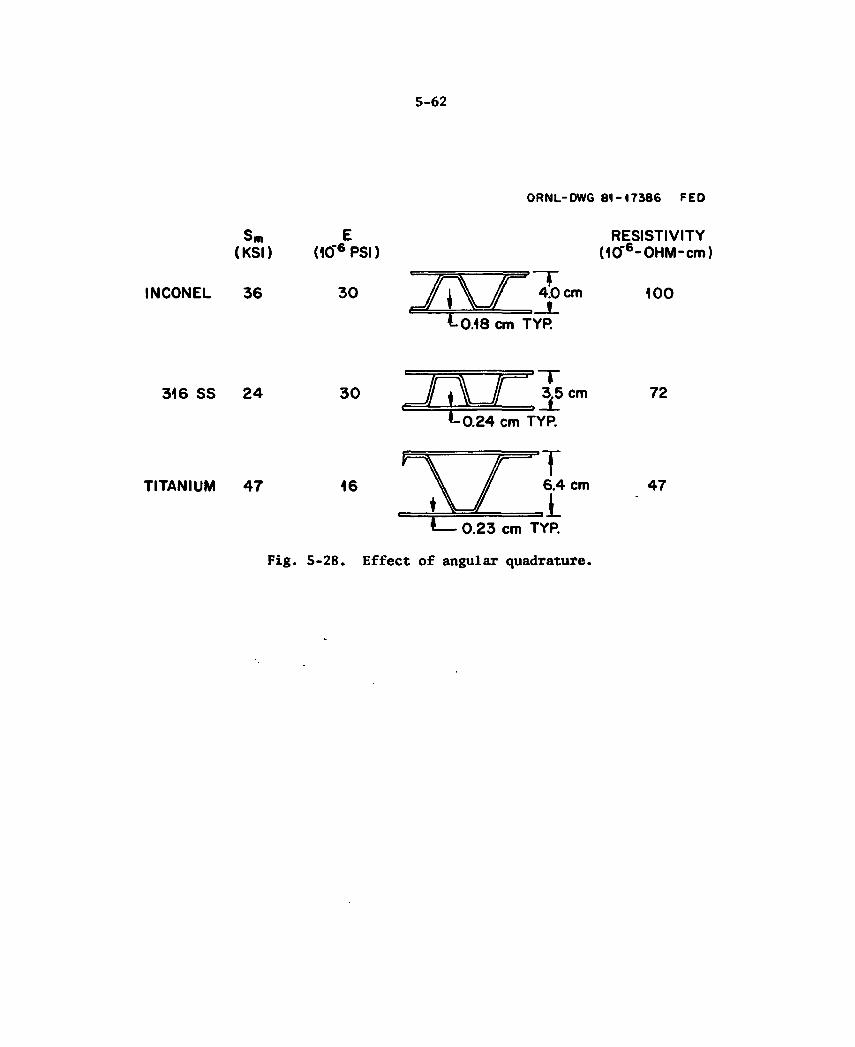
5-62
ORNL-DWG 81-17386 FED
sm
(KSI)
INCONEL 36
E do"6 PSI)
3 0 2EZ3 <-0.18 cm TYP.
cm
RESISTIVITY (10"6-0HM-cm)
100
316 SS 2 4 3 0 JFTXJr ?5cm 4-0.24 cm TYP.
72
TITANIUM 4 7 16
0.23 cm TYP.
47
Fig. 5-28. Effect of angular quadrature.
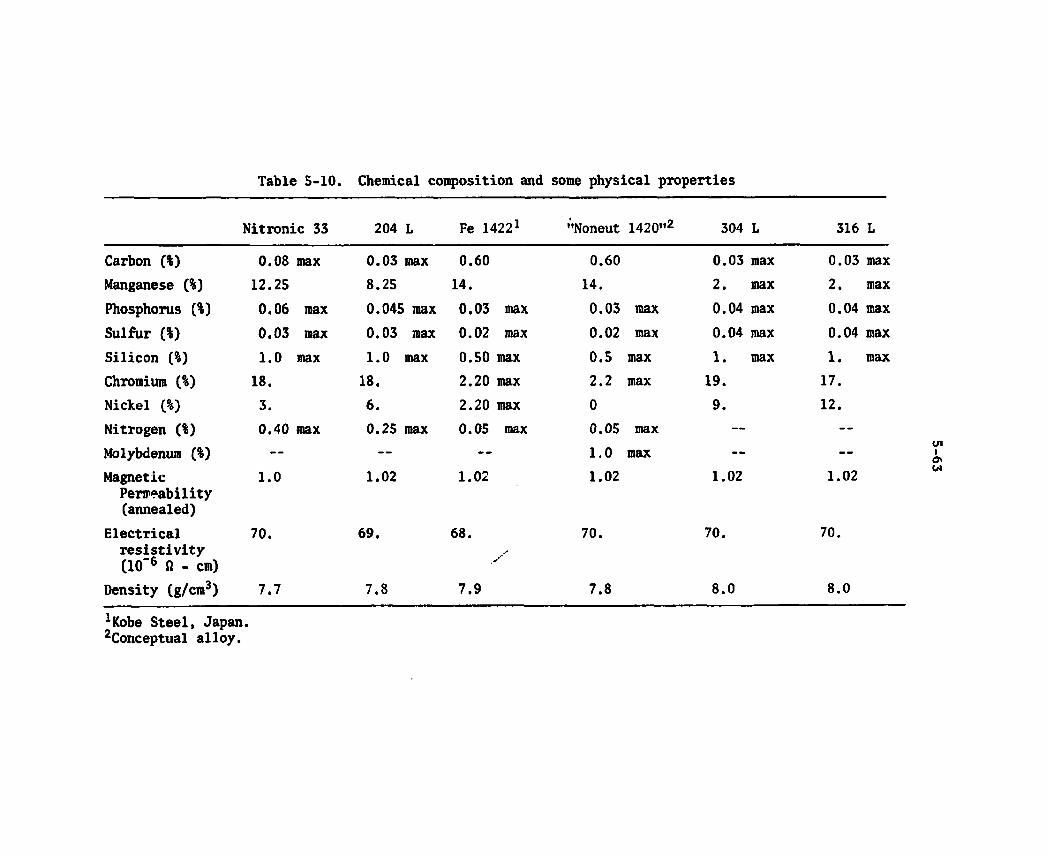
Table 5-10. Chemical composition and some physical properties
Nitronic 33 204 L Fe 14221 "Noneut 1420"2 304 L 316 L
Carbon (%) 0.08 max 0.03 max 0.60 0.60 0.03 max 0.03 max Manganese (%) 12.25 8.25 14. 14. 2. max 2. max Phosphorus (%) 0.06 max 0.045 max 0.03 max 0.03 max 0.04 max 0.04 max Sulfur (%) 0.03 max 0.03 max 0.02 max 0.02 max 0.04 max 0.04 max Silicon (%) 1.0 max 1.0 max 0.50 max 0.5 max 1. max 1. max Chromium (%) 18. 18. 2.20 max 2.2 max 19. 17. Nickel (%) 3. 6. 2.20 max 0 9. 12. Nitrogen (%) 0.40 max 0.25 max 0.05 max 0.05 max — —
Molybdenum (%) — — — 1.0 max - - —
Magnetic Permeability (annealed)
1.0 1.02 1.02 1.02 1.02 1.02
Electrical resistivity (10~6 ft - cm)
70. 69. 68. 70. 70. 70.
Density (g/cm3) 7.7 7.8 7.9 7.8 8.0 8.0
^obe Steel, Japan. Conceptual alloy.

5-64
(Nitronic 33 and Fe 1422) have acceptable shielding performances (Section 5.5). Due to the requirement of water for cooling and shield-ing, corrosion becomes a major consideration. Therefore, Nitronic 33 was selected as the baseline material.
Shield sector design options
Two coolant passage design concepts were considered for the shield sector: (1) pressurized sectors and (2) pressurized tubes. The two concepts are shown schematically in Fig. 5-29. Concept (1) minimizes the thermal resistance between the shield and coolant but results in pressurization of the shield structure to the 0.7-MPa (100-psi) coolant pressure and necessitates the use of a noncorrosive shield material. Concept (2) eliminates shield pressurization (assuming no tube leaks) and greatly reduces the corrosion resistance requirement for the shield material. However, the resistance to heat flow from the shield to coolant is significantly larger for Concept (2).
Coolant passage spacing requirements for both concepts with maximum stainless steel temperatures of 200 and 300°C are shown in Table 5-11. For pressurized tubes, it was assumed that the heat is transferred from the shield to the tubes by radiation and conduction across a 0.076-cm (0.030-in.) thick air gap. The 0.076-cm-thick gap is consistent with acceptable machining tolerances and should be conservative, since some physical contact will probably occur.
Two and one-half percent by volume of water was allowed in the shielding analyses. Therefore, water volumes in excess of 2.5% will result in increased shield thicknesses. The amounts of water required for cooling the 60-cm-thick section of the outboard shield were cal-culated for a range of maximum stainless steel shield temperatures. Results are displayed in Fig. 5-30. With a maximum allowable shield temperature of 200°C, 3.4% water by volume is required for Concept (1) (pressurized sectors), whereas 16.2% water by volume is required for Concept (2) (pressurized tubes). Because of the increase in shield thickness required for the Concept (2) design, Concept (1) was chosen for the reference shield design.
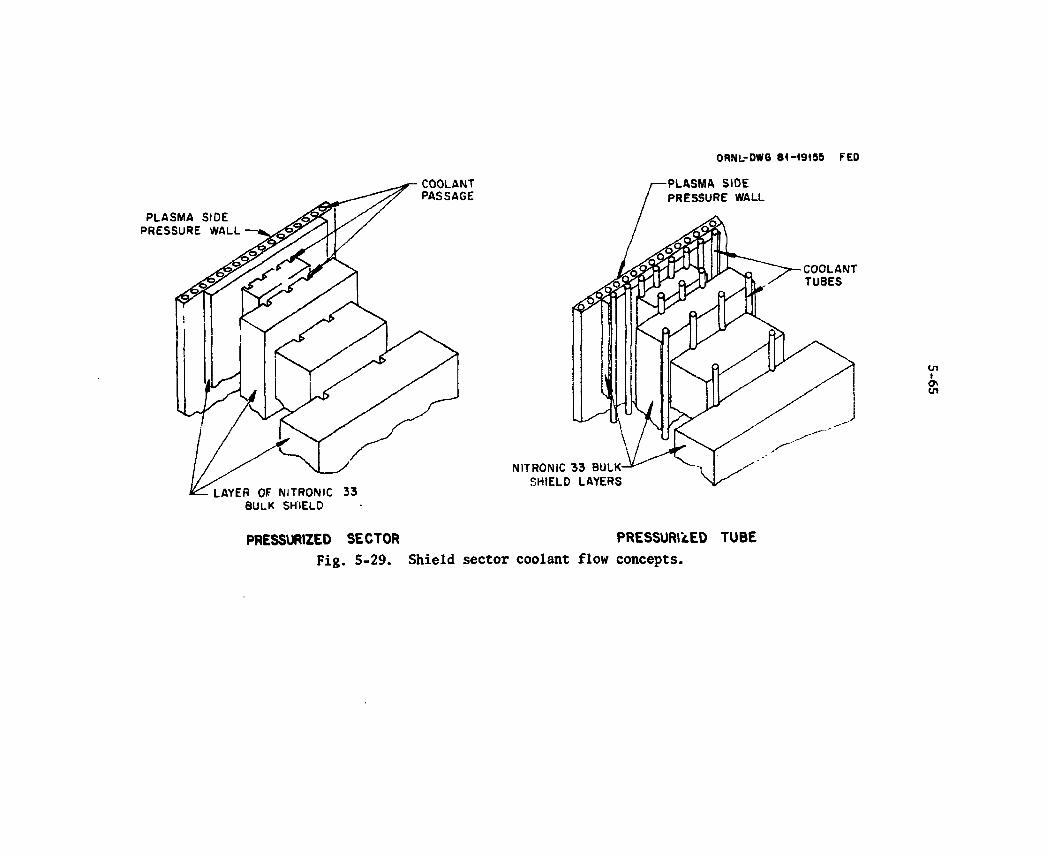
ORNL-DWG 81-19156 FED
PRESSURIZED SECTOR PRESSURISED TUBE Fig. 5-29. Shield sector coolant flow concepts.
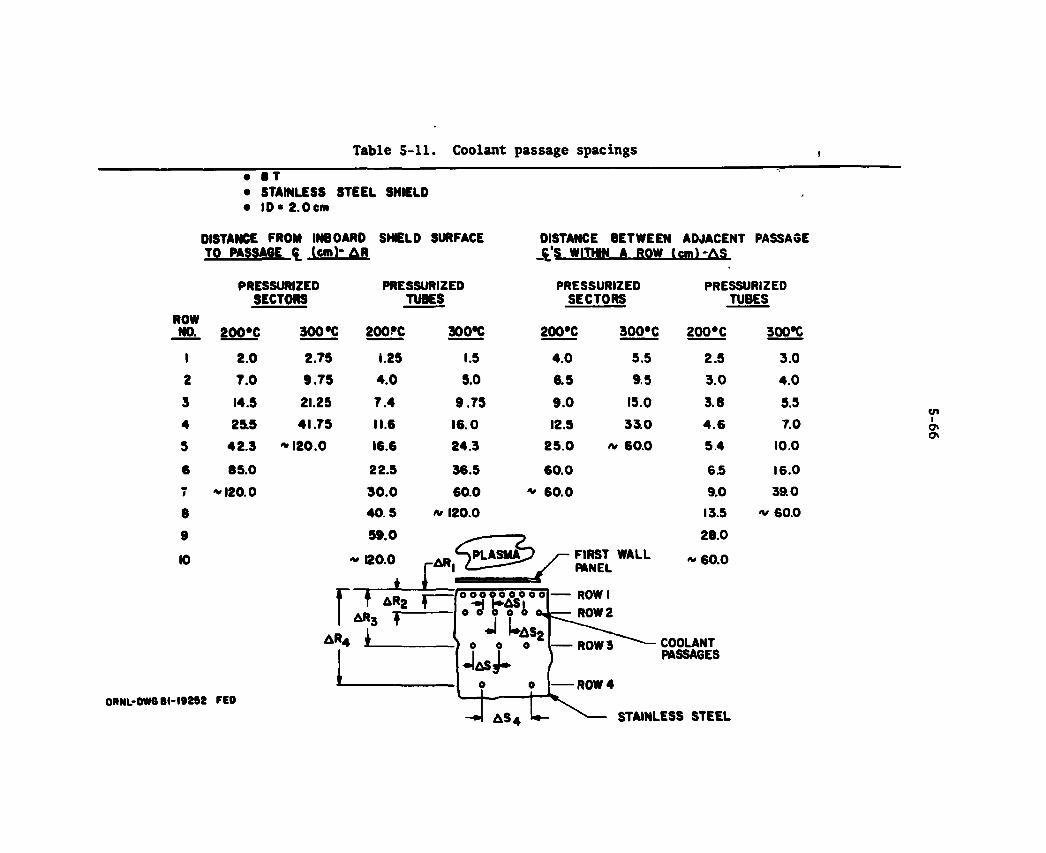
Table S-ll. Coolant passage spacings i • 8 T • STAINLESS STEEL SHIELD • ID » 2 .0cm
DISTANCE FROM INBOARD SHIELD SURFACE TO PASSAGE C (cm)- AR
DISTANCE BETWEEN ADJACENT PASSAGE fr'S WITHIN A ROW (cm) - A S
ROW
PRESSURIZED SECTORS
PRESSURIZED TUBES
PRESSURIZED SECTORS
PRESSURIZED TUBES
0RNL-0WG 81-19252 FED
O OO OOO Oo o >~c! 0 0 i
J L ROW 3 COOLANT
PASSAGES
ROW 4
STAINLESS STEEL
NO. 200*C 300*C 200*C 300*C 200*C 3 0 0 * C 200*C 300*C
1 2 .0 2.75 1.25 1.5 4 .0 5.5 2.5 3.0
2 7 . 0 9 . 7 5 4 . 0 5.0 6.5 9.5 3 .0 4 .0
3 14.5 21.25 7 .4 9 . 7 5 9 . 0 15.0 3.8 5.5
4 25.5 41.75 11.6 16.0 12.5 3 3 0 4 . 6 7.0
S 42 .3 * 120.0 16.6 24.3 2 5 . 0 <v 60.0 5.4 10.0
6 85 .0 22.5 36.5 6 0 . 0 6 5 16.0 m « * 120.0 3 0 . 0 60.0 v 6 0 . 0 9.0 3 9 0
8 4 0 . 5 * 120.0 13.5 */ 60.0
9 59 .0 ? > 28.0
10 ~ 120.0 ^ P L A S M ^ 0 y - FIRST y RANEL
WALL *» 60 .0
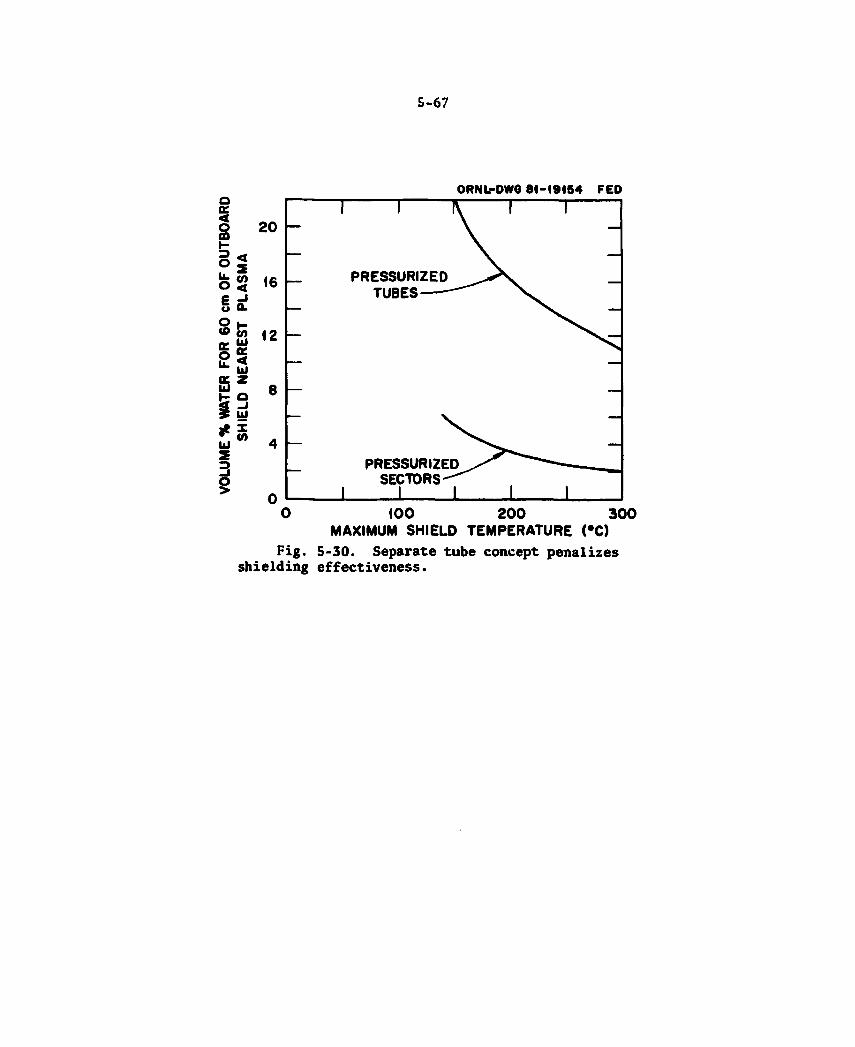
5-67
ORNL-DWQ 81-19154 FED
PRESSURIZED TUBES
PRESSURIZED SECTORS
J I 100 200 300
MAXIMUM SHIELD TEMPERATURE (*C) 5-30. Separate tube concept penalizes Fig.
shielding effectiveness.

5-68
Two design options were considered for the pressurized shield sector: (1) slab reinforced pressure wall and (2) internally stiffened pressure wall. The slab reinforced pressure wall is shown in Fig. 5-8 and discussed in Section 5.2.2. The alternate design, shown in Fig. 5-31, consists of a thin-skinned pressure wall (approximately 1 cm) box with internal stiffeners. The stiffeners are electrically insulated from each other, as well as from the pressure wall and bulk shielding.
The slab reinforced pressure wall was selected as the baseline over the internally stiffened pressure wall because of the relative simpli-city of routing the coolant passages and providing the required mater-ial distribution.
Incorporation of boron in the shield design for minimizing refrigeration cost
Boron was considered as a shield material option. Its presence enhances the capture of thermal neutrons and reduces the nuclear heating in the inner leg of the TF coil windings. There results a reduction in the refrigeration costs for the TF coils. This reduction was estimated to be on the order of $850,000.
Three concepts of using boron in the bulk shielding were considered:
• Borated water • Layers of boron carbide (B^C) • Stainless steel modified by adding boron
The two options available for addition of boron to water are: (1) normal boric acid solution and (2) boric acid solution using enriched boron. Option (1) requires a concentration of 2 atom % of boron as boric acid in the coolant water. To maintain the boron in solution, the coolant temperature would have to be maintained above 75°C. Since the coolant operating temperature is 60°C inlet and 100°C outlet, this approach is not practical. Option (2) requires a concentration r>f 0.4 atom % enriched boron (80% B 1 0, 20 B 1 1) as boric
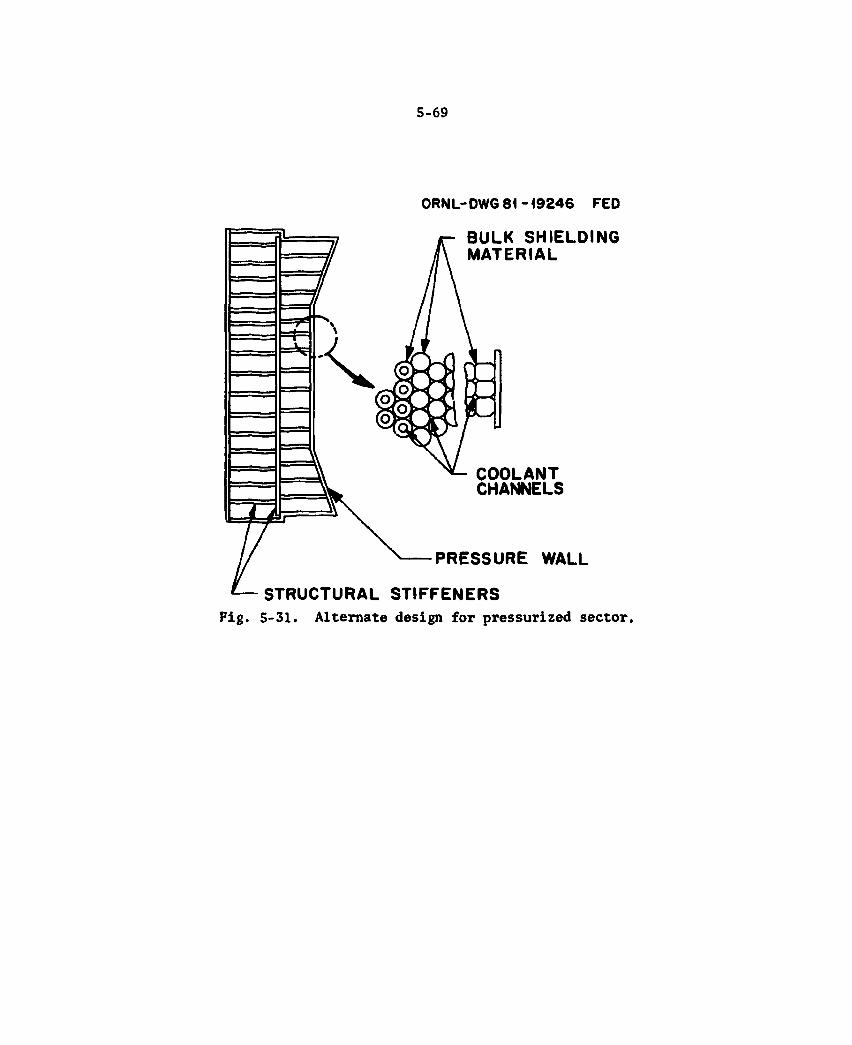
5-69
ORNL-DWG 81 - 49246 FED
BULK SHIELDING M A T E R I A L
COOLANT CHANNELS
PRESSURE WALL
STRUCTURAL S T I F F E N E R S Fig. 5-31. Alternate design for pressurized sector.

5-70
acid in the coolant water. The water borated with enriched boron does not require special heating to keep it in solution. The cost of the enriched boron, however, is high, $9,000/kg. The cost of adding the boron in this way was determined to be on the order of 15 times the cost savings in refrigeration.
To achieve TF coil refrigeration reduction, 30 cm of boron carbide (Bi»C) would be needed. These layers of Bi»C would replace the outer 20 cm of water in the inboard shield. The addition of B^C increases the machine major radius by 10 cm, which results in a, correspondingly higher machine cost. Coupling the increased device cost with the cost of the installed Bi»C layer resulted in total costs 12 times the saving in refrigeration.
Welding material thickness greater than about 0.7 cm causes excessive diffusion of boron into the weld region, with resultant brittleness. Since the structural box frame is greater than 2.5 cm and requires welding in the fabrication, the addition of boron to the Nitronic 33 was considered only for the bulk shield internal plates, which require no welding. The concentration of natural boron required to give the required neutron capture is 1% by weight. The boron-modified stainless steel raw material cost factor is estimated to be about 3. Further, it appears that the addition of boron will signif-icantly increase the manufacturing cost of the bulk shield. Manufactur-ing cost factors are estimated to be on the order of 1.2. The total cost of adding boron to the steel, therefore, is estimated to be 2.2 times the savings in refrigeration.
Of the three ways of adding boron to the shield, the technique of alloying boron in the steel has the least cost impact. Since no cost benefit resulted, however, the baseline shield does not include boron.
Dielectric break
The baseline is a high-resistance, thin-skinned sandwich spool structure. This structure must have an electrical resistance at least four times the resistance of the surface nearest the plasma, including
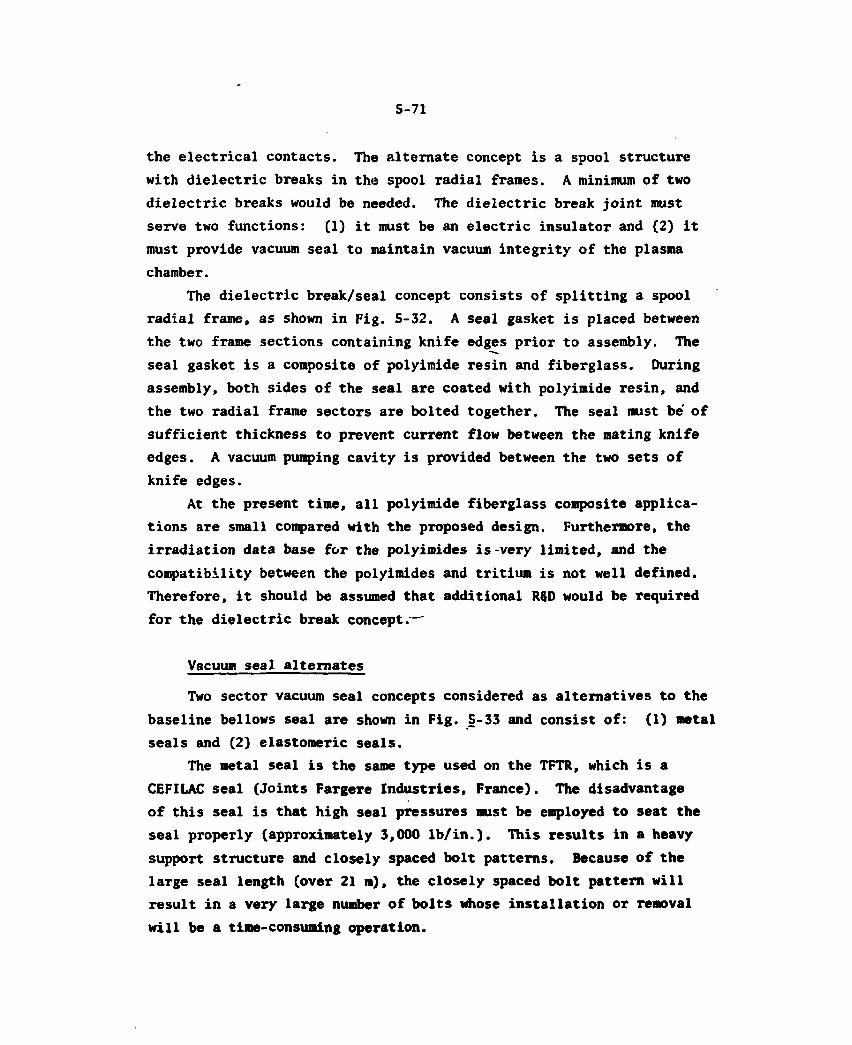
5-71
the electrical contacts. The alternate concept is a spool structure with dielectric breaks in the spool radial frames. A minimum of two dielectric breaks would be needed. The dielectric break joint must serve two functions: (1) it must be an electric insulator and (2) it must provide vacuum seal to maintain vacuum integrity of the plasma chamber.
The dielectric break/seal concept consists of splitting a spool radial frame, as shown in Fig. 5-32. A seal gasket is placed between the two frame sections containing knife edges prior to assembly. The seal gasket is a composite of polyimide resin and fiberglass. During assembly, both sides of the seal are coated with polyimide resin, and the two radial frame sectors are bolted together. The seal must be of sufficient thickness to prevent current flow between the mating knife edges. A vacuum pumping cavity is provided between the two sets of knife edges.
At the present time, all polyimide fiberglass composite applica-tions are small compared with the proposed design. Furthermore, the irradiation data base for the polyimides is-very limited, and the compatibility between the polyimides and tritium is not well defined. Therefore, it should be assumed that additional R§D would be required for the dielectric break concept."
Vacuum seal alternates
Two sector vacuum seal concepts considered as alternatives to the baseline bellows seal are shown in Fig. 5-33 and consist of: (1) metal seals and (2) elastomeric seals.
The metal seal is the same type used on the TFTR, which is a CEFILAC seal (Joints Fargere Industries, France). The disadvantage of this seal is that high seal pressures must be employed to seat the seal properly (approximately 3,000 lb/in.). This results in a heavy support structure and closely spaced bolt patterns. Because of the large seal length (over 21 m), the closely spaced bolt pattern will result in a very large number of bolts whose installation or removal will be a time-consuming operation.
5-72
ORNL- DWG 81-19245 FED
VACUUM PUMPING HEADER
SPOOL RADIAL FRAME
KNIFE EDGE
ELECTRICAL INSULATION
SPOOL RADIAL FRAME
POLYIMIDE SEAL
KNIFE EDGE
POLYIMIDE FIBERGLASS GASKET SEAL
POLYIMIDE FIBERGLASS GASKET SEAL
KNIFE EDGE Fig. 5-32. Dielectric break and seal concept.
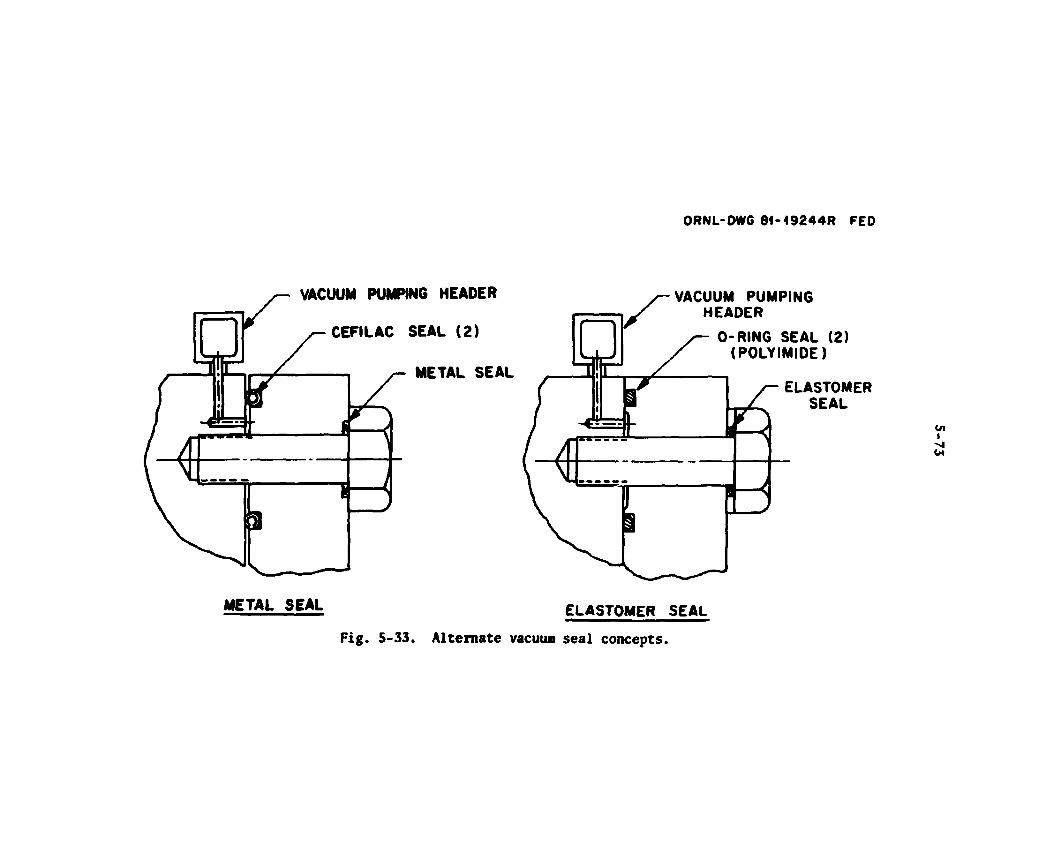
ORNL-DWG 8 1 - 1 9 2 4 4 R FED
Fig. 5-33. Alternate vacuus seal concepts.

5-74
The elastomer seal concept is a typical dual 0-ring application. The sealing force for this seal (approximately 100 lb/in.) is much lower than required for the metal seal, thus permitting a correspond-ingly lighter structure. A large number of bolts is required, however, with a long removal/installation time. In addition, the capability of meeting the bakeout (approximately 250°C) and tritium compatibility requirements is marginal.
Electrical contact options
A low resistance electrical path is required in the toroidal direction on the inner surface shield. Two options are (1) continuous contacts and (2) arcing. The baseline contact concept employs a con-tinuously pressurized bellows to produce the contact and required pressure. There are other approaches for achieving continuous contact such as crushable tubes, flapper contacts operated by electromagnetic forces, mechanical locking devices that can be engaged from the exterior of the torus, etc. The problem with most of the concepts is in pro-viding sufficient contact pressure to prevent welding of the pals.
An alternative approach is to provide a sacrificial surface (such as carbon, copper, etc.) for the arcing. These contacts would be located along the internal periphery of the sector modules. The sac-rificial contacts must provide the area of least electrical potential. The contacts can be located in discrete points, or there can be a continuous ribbon. The continuous ribbon contact concept is least sensitive to radial and vertical misalignment. A typical cross section of an arcing contact is shown in Fig. 5-34. This approach deserves additional research, particularly in answering the question, "How can one develop confidence that the arcing will occur only in the desired areas?"
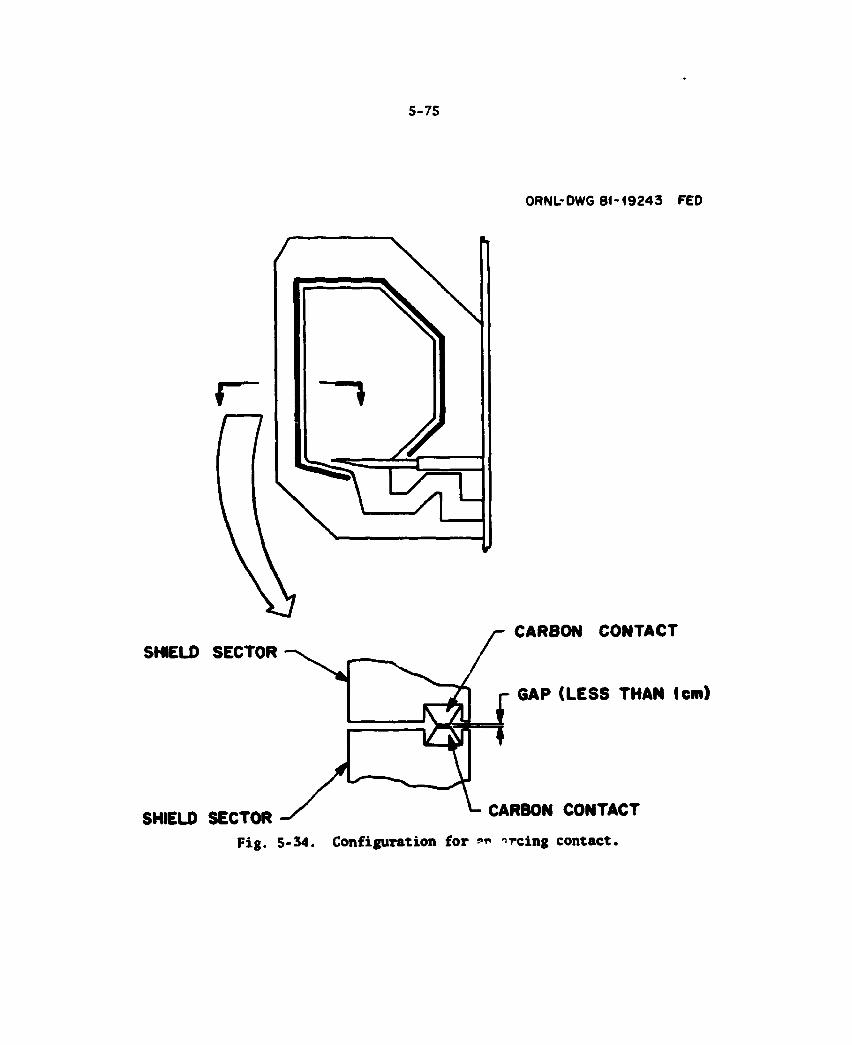
5 - 7 5
ORNL-DWG 8 1 - 1 7 3 5 7 R FED

S-76
5.2.5 Future Work — Torus
The nature of the recommended design emphases during the next period is largely influenced by those features in' which there is not yet a high degree of confidence. These include:
• Sector-to-sector electrical contact design • Vacuum leak detection e Spool wall structural design consistent with the use of
dielectric breaks e Dielectric break design • Sector-to-spool structural attachment • Coolant flow concept for shield • Sector replacement procedure' - nd support equipment definition e Port size and location for in-vessel maintenance • Design of ring shields to limit the neutron streaming from the
gap between the spool and the TF coil vacuum vessel • Design of filler shield to limit neutron streaming internal to
the spool rims
5.3 FIRST WALL SYSTEM
The FED first wall system includes all components which directly face the plasma. These are the inboard and top disruption armor, charge exchange neutral armor, outboard coolant panels, and the mechanical pump limiter. The locations of these components are shown in Fig. 5-35. Because of the special nature and purposes of the mechanical pump limiter, this component is addressed separately in Section 5.4.
5.3.1 First Wall Operating Conditions
Plasma edge conditions and disruption thermal environments have been presented in Section 5.1. Worst-case (Cases C and D) heat loads of 67 MW were used in designing the baseline disruption armor and outboard stainless steel panels.
Design conditions during normal operation are shown in Table 5-12 for the inboard armor, outboard stainless steel panels, and charge
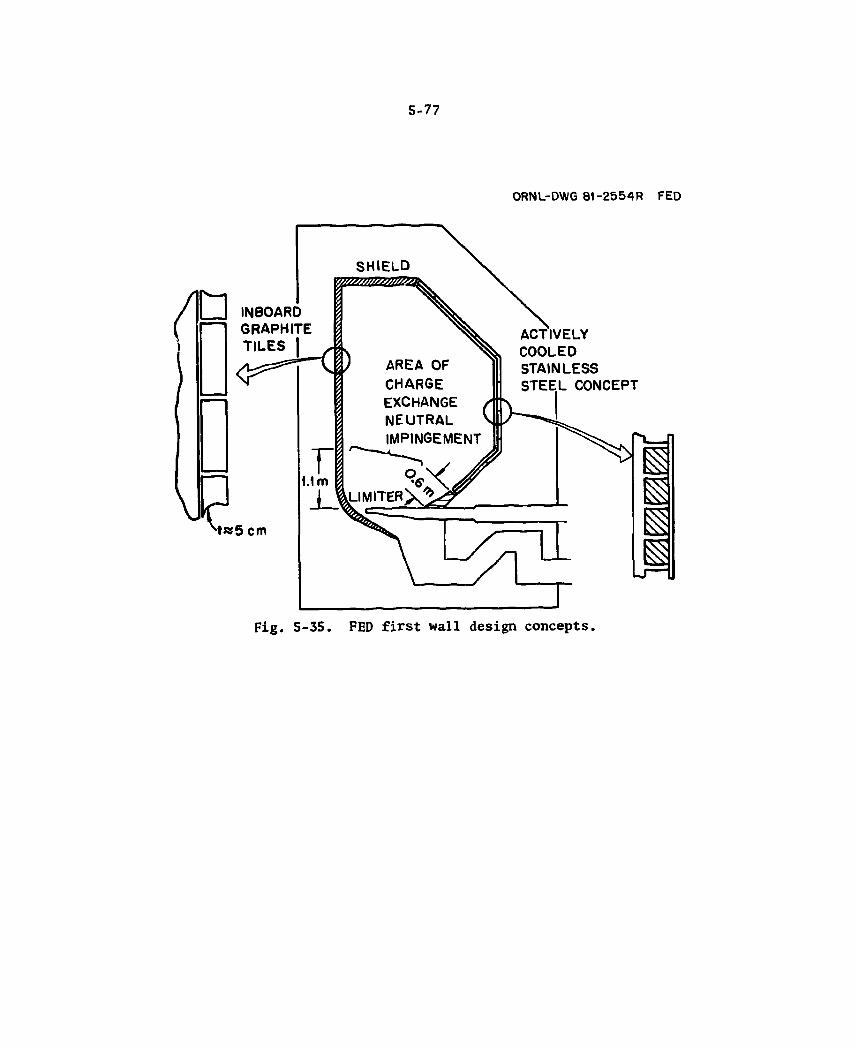
5-77
ORNL-DWG 81-2554R FED
Fig. 5-35. FED first wall design concepts.
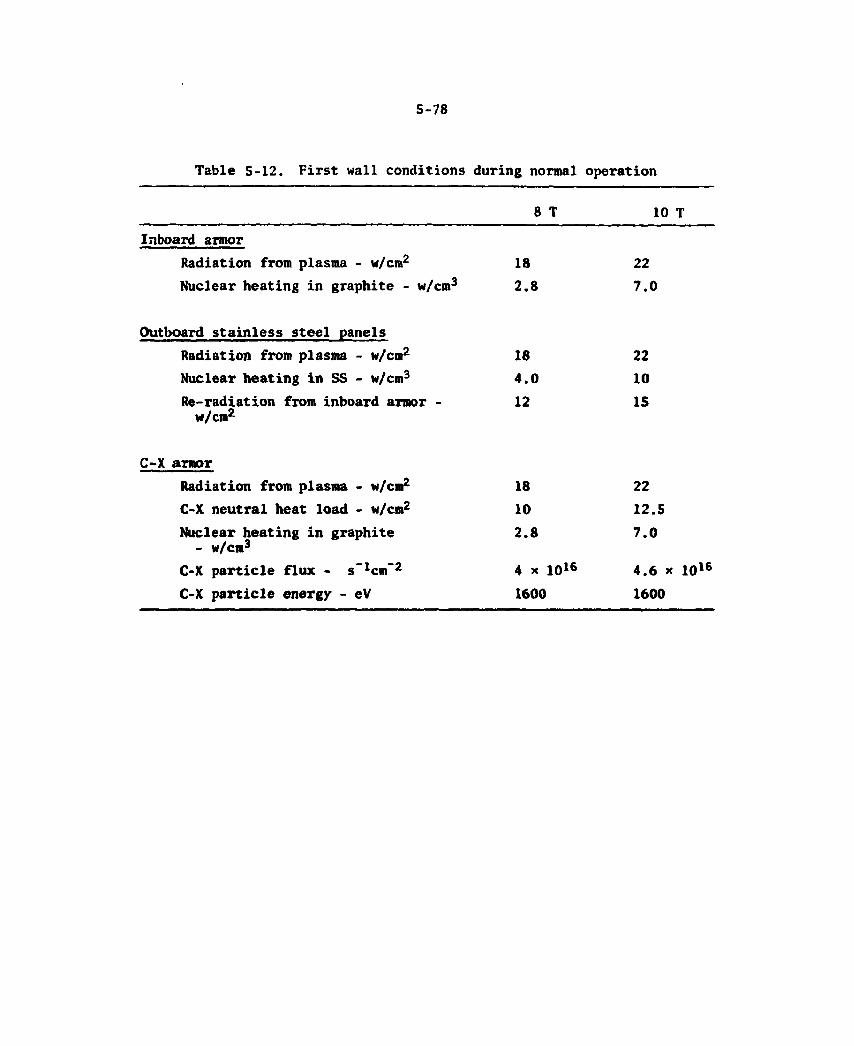
5 - 7 8
Table 5-12. First wall conditions during normal operation
8 T 10 T
Inboard armor Radiation from plasma - w/cm 2
Nuclear heating in graphite - w/cm 3
18 2.8
22 7.0
Outboard stainless steel panels
Radiation from plasma - w/cm 2
Nuclear heating in SS - w/cm 3
Re-radiation from inboard armor -w/cm 2
18 4.0 12
22 10 IS
C-X armor
Radiation from plasma - w/cm 2
C-X neutral heat load - w/cm 2
Nuclear heating in graphite - w/cm 3
C-X particle flux - s - I c m " 2
C-X particle energy - eV
18 10 2.8
4 x io 1 6
1600
22 12.5 7.0
4.6 x 10 1 6
1600

5 - 7 9
exchange neutral armor. These heat loads (and particle flux and particle energy in the case of the charge exchange armor) are shown for both the 8-T and 10-T cases.
During startup, the plasma is essentially circular and rests against the outboard water cooled panels. During this period of opera-tion, the surface heat flux varies with time and location on the out-board wall. The peak surface heat flux (q ) for a circular plasma Tiiax with a toroidal limiter which is poloidally flat is given by:3
Qt = Total particle transport heat load R = Major radius distance to the limiter surface
= 6.5 m for outboard panels XQ = Heat flux e-fold distance
= 2.0 cm at the outboard midplane of the device a = Minor radius of the plasma .
The particle transport heat load (QT) and minor radius of the plasma (a) vary with time during startup. The particle transport heat load was assumed to be equal to the plasma input power. The minor radius during startup was specified to be 0.2 m when the plasma current (1^) is 0.05 MA and, subsequently, assumed to vary directly with
-1/2 I ' . The plasma input power and plasma current are shown in Figs. 2-3 and 2-4 as a function of time during startup. Maximum surface heat fluxes (4max) during startup were calculated with these input parameters and are shown in Fig. 5-36.
Seismic loading on the overall torus sector was addressed in Section 5.2. Additional consideration of seismic loads on the first wall components has not been addressed in these studies. Loads in the
Q
where
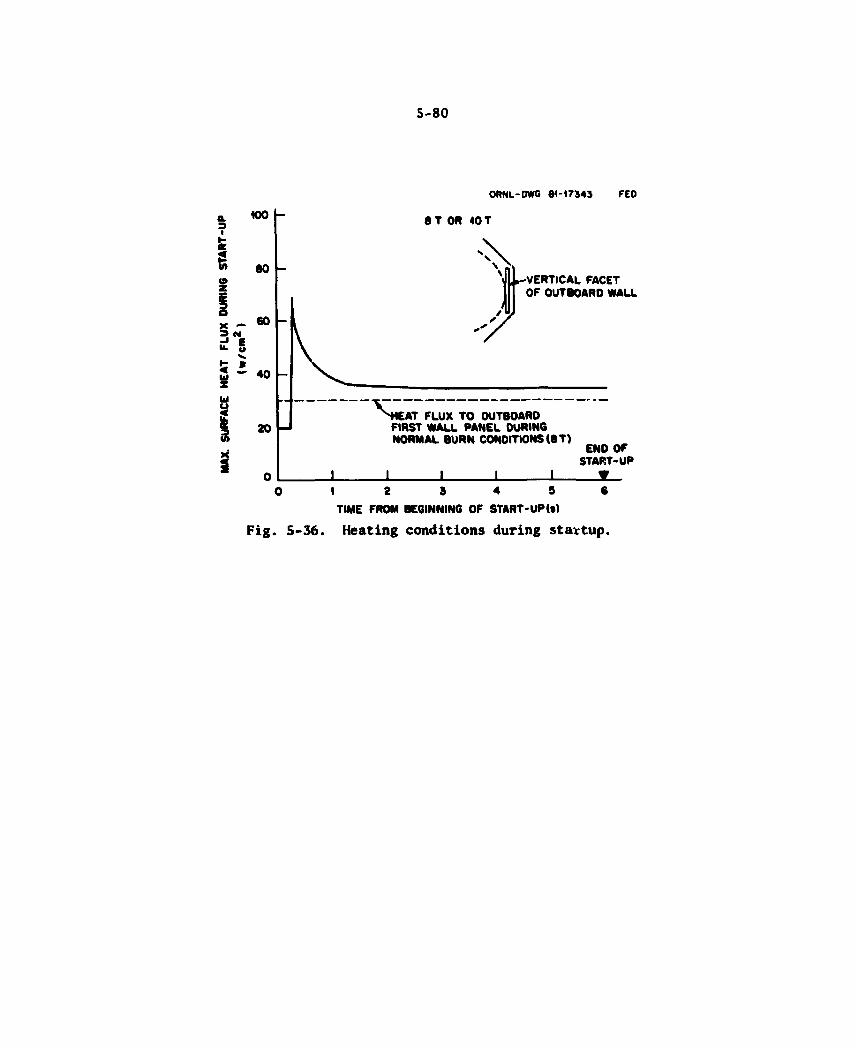
5-80
ORNL-DWG 84-17343 FED 100
80
60
S - 4 0
20
V
I
8 T OR 40 T
t -VERTICAL FACET OF OUTBOARD WALL
^ H E A T FLUX TO OUTBOARD FIRST WALL PANEL DURING NORMAL BURN CONDITIONS <8 T)
_L I _L
END OF START-UP
« _ 0 4 2 3 4 9 6
TIME FROM BEGINNING OF START-UPU)
Fig. 5-36. Heating conditions during startup.

5-81
1.0-g level should not have a significant effect on first wall compon-ents. However, the integrity of these components could be significantly affected by strains imposed by movement of the shield sectors under the influence of seismic loads. An integrated analysis of the overall system, including seismic loads, will be required to properly assess these effects.
Mechanical loads are also imposed during plasma disruptions. Calculation of the electrical currents and associated electromagnetic loads indicates a maximum 0.1-MPa (15-psi) dynamic out-of-plane load on the first wall panels.
5.3.2 First Wall Baseline Description
Inboard and top armor
The baseline design for the inboard and top wall armor consists of passively cooled graphite tiles which are attached to the torus chamber wall with graphite bolts, as shown in Fig. 5-37. Each tile is square, 15 cm on a side, and 5 cm thick. Approximately 5300 tiles are required for the total inboard and top regions of the device. The tiles are coated with titanium carbide (TiC) to limit chemical erosion in those areas of the surface which are not expected to be subject to physical erosion. The graphite bolt attachment technique features in-situ replacement of individual tiles and offers good potential for control-ling the thread temperature.
Although bare stainless steel may be adequate for normal operation on the first wall, uncertainties associated with the surface melt layer during disruptions and the possibility of runaway electrons constrained the design to include graphite tiles in certain areas. Graphite satisfies the requirement for low Z material inside the torus chamber, and a relatively good data base exists with regard to graphite stress and thermal shock resistance. Several graphites are considered to be candidates for the FED armor. These include H4S1, Poco AXF-5Q, ATJ, and GRAPHNOL. Limited data exist on the radiation damage resistance of
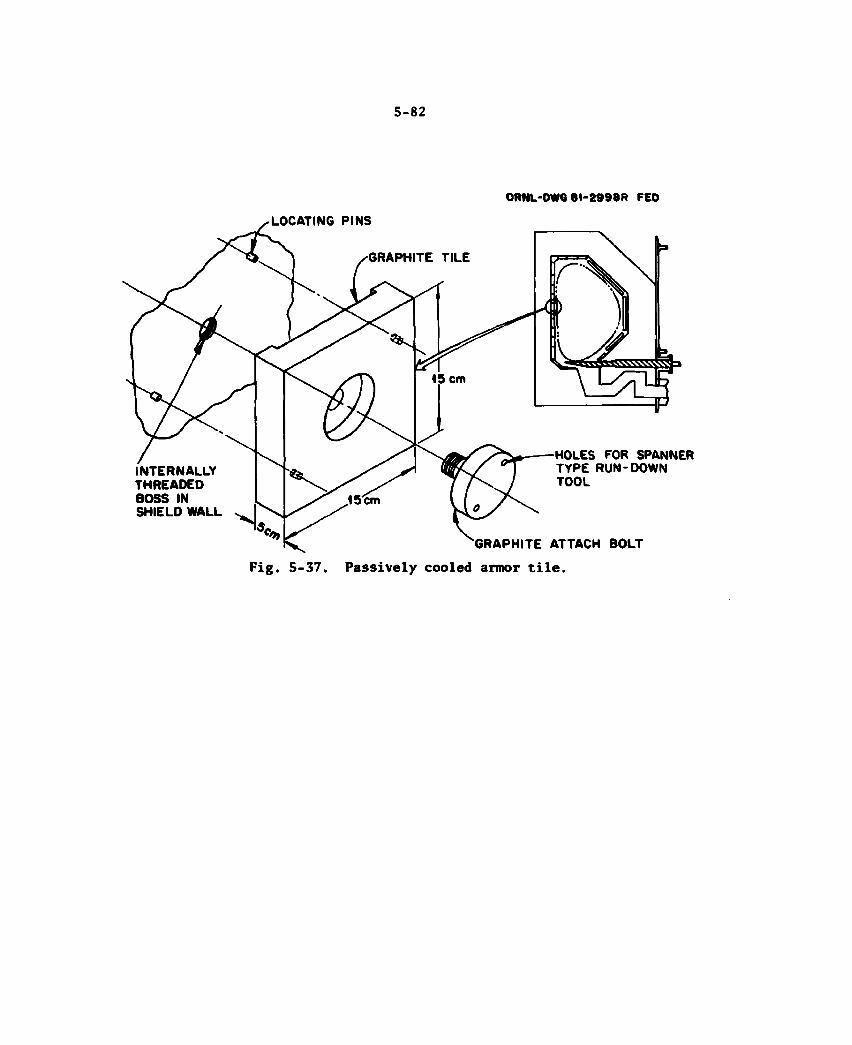
5-82
ORNL-DWG 81-2554R FED
Fig. 5-37. Passively cooled armor tile.
5-83
graphites; however, tests in the Hi-flux Isotope Reactor (HFIR) at ORNL should provide additional data in the future.
Charge exchange (C-X) neutral protection
The area of charge exchange neutral impingement is shown in Fig. 5-35. The two areas affected are on the lower 45° facet 0.6 m above the limiter surface and on the inboard wall 1.1 m above the limiter. Approximately 1000 tiles are required for the C-X impingement area. The baseline design and attachment technique for the C-X armor is the same as for the inboard and top armor.
Outboard wall
The outboard first wall panels occupy the vertical and 45° outboard shield facets. These panels are water cooled type-316 stainless steel panels, as shown in Fig. 5-38. There are six panels in each sector. Each panel is approximately 2 m on a side and 7.0 cm thick. The front and back surfaces are 0.8 cm thick. The vertical facet of the first wall will be utilized as a start-up limiter. This will require that the panels be curved toroidally. The panels on the upper and lower 45" facets are curved (conically) so that no mismatch occurs between the panel edges. The panels are designed so that they are installed from the side of the sector. This requires removal of the sector in order to replace a panel. However, since the panels should last the life of the device, in-situ replacement of panels is considered to be unnecessary. Tapered plates, spaced approximately 1.0 m apart, engage fittings attached to the shield to provide structural attachments. This support spacing results in maximum bending stresses of approximately 50 MPa (7 ksi) under the out-of-plane disruption electromagnetic load of 0.1 MPa. For analysis purposes, the dynamic load was assumed to be static, and the ends of the panel were assumed to be siaply supported. The tapered plates also provide electrical contact between the panel and shield structure. The coolant passages are a multipass design with
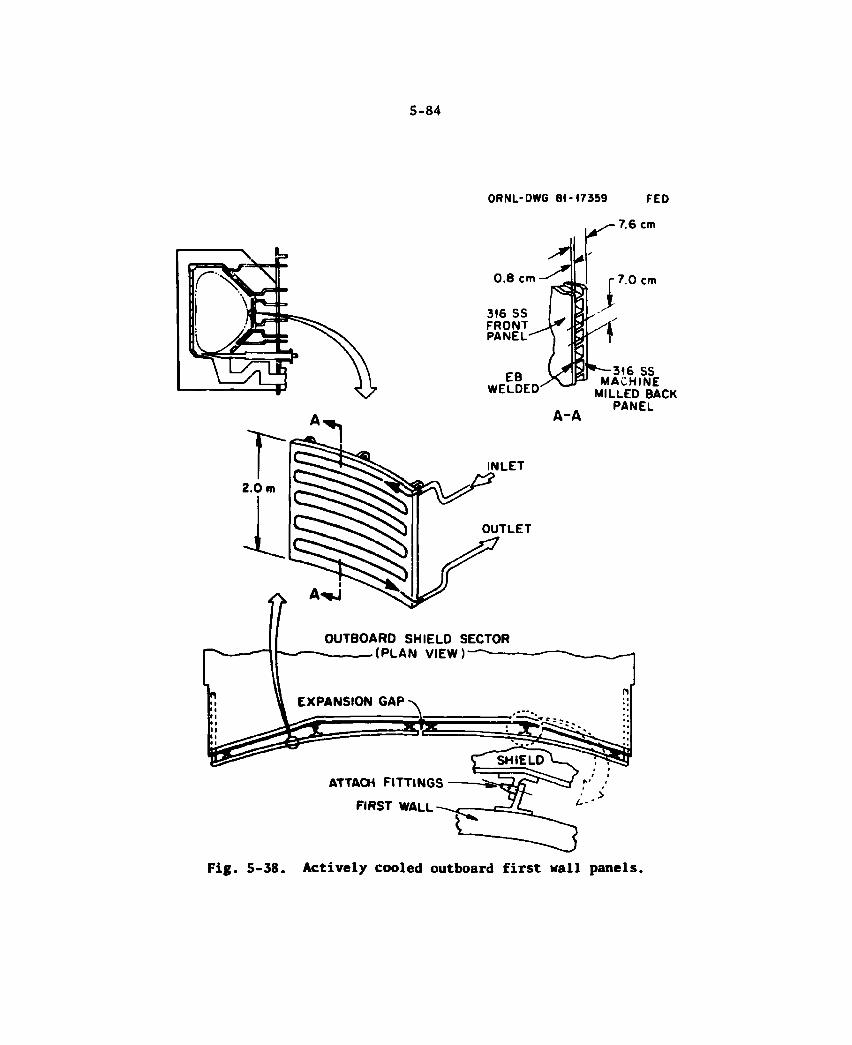
5-84
A-*,
ORNL-DWG 81-17359 FED
7.6 cm
0.8 cm
316 SS FRONT PANEL
EB WELDED
INLET
OUTLET
7.0 cm
A-A
' 316 SS MACHINE
MILLED BACK PANEL
OUTBOARD SHIELD SECTOR (PLAN VIEW!
Actively cooled outboard first wall panels.
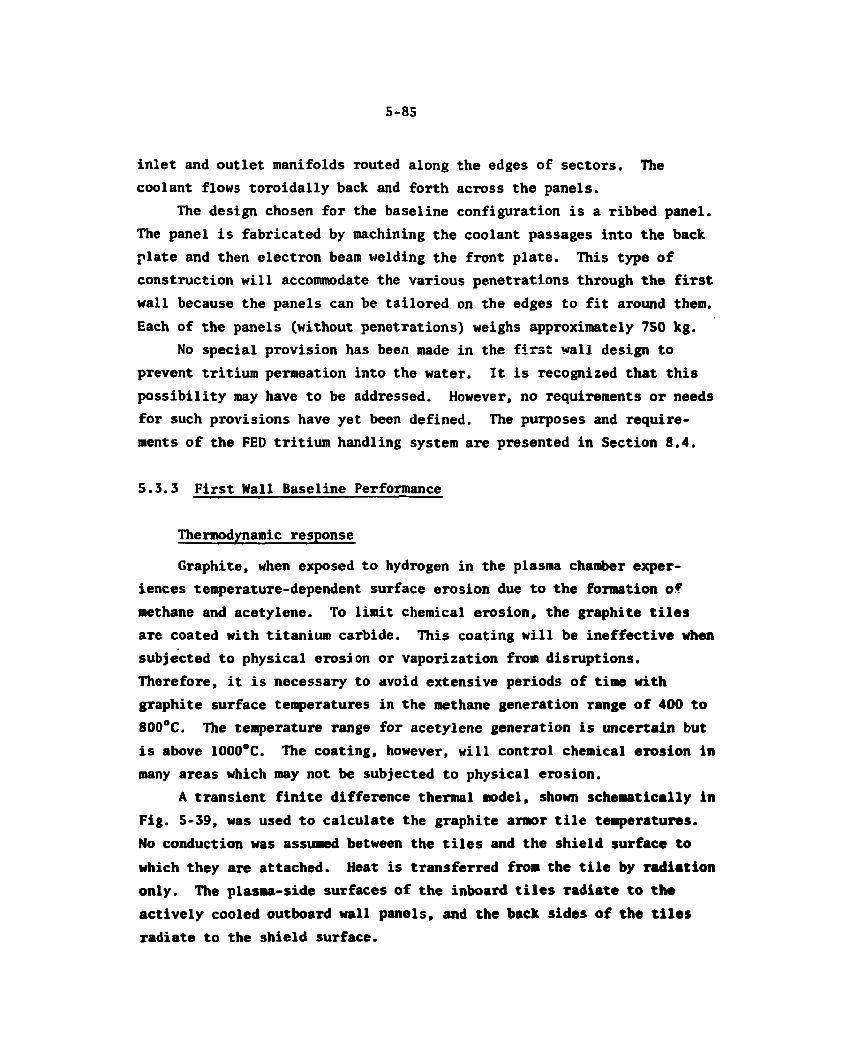
5-85
inlet and outlet manifolds routed along the edges of sectors. The coolant flows toroidally back and forth across the panels.
The design chosen for the baseline configuration is a ribbed panel. The panel is fabricated by machining the coolant passages into the back plate and then electron beam welding the front plate. This type of construction will accommodate the various penetrations through the fiTSt wall because the panels can be tailored on the edges to fit around them. Each of the panels (without penetrations) weighs approximately 750 kg.
No special provision has been made in the first wall design to prevent tritium permeation into the water. It is recognized that this possibility may have to be addressed. However, no requirements or needs for such provisions have yet been defined. The purposes and require-ments of the FED tritium handling system are presented in Section 8.4.
5.3.3 First Wall Baseline Performance
Thermodynamic response
Graphite, when exposed to hydrogen in the plasma chamber exper-iences temperature-dependent surface erosion due to the formation of methane and acetylene. To limit chemical erosion, the graphite tiles are coated with titanium carbide. This coating will be ineffective when subjected to physical erosion or vaporization from disruptions. Therefore, it is necessary to avoid extensive periods of time with graphite surface temperatures in the methane generation range of 400 to 800°C. The temperature range for acetylene generation is uncertain but is above 1000°C. The coating, however, will control chemical erosion in many areas which may not be subjected to physical erosion.
A transient finite difference thermal model, shown schematically in Fig. 5-39, was used to calculate the graphite armor tile temperatures. No conduction was assumed between the tiles and the shield surface to which they are attached. Heat is transferred from the tile by radiation only. The plasma-side surfaces of the inboard tiles radiate to the actively cooled outboard wall panels, and the back sides of the tiles radiate to the shield surface.
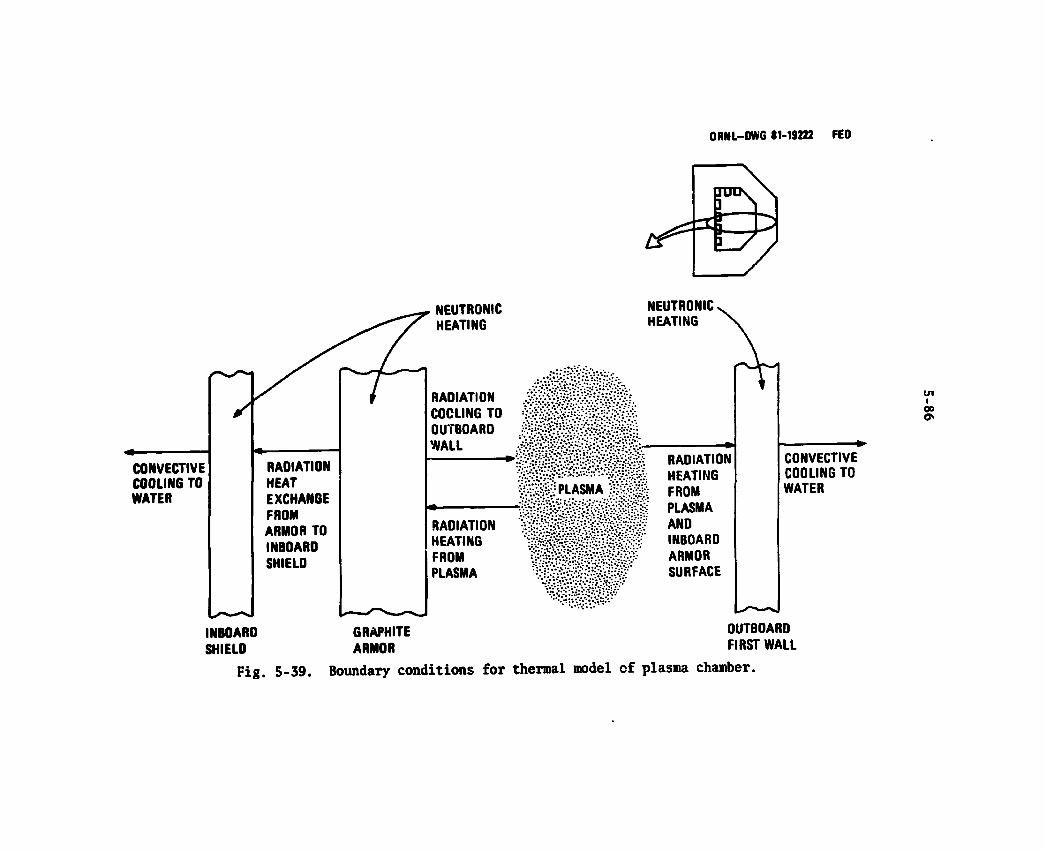
ORNL-DWG 81-19222 FED
P D D v X ^HrI
CONVECTIVE COOLING TO WATER
RADIATION HEAT EXCHANGE FROM ARMOR TO INBOARD SHIELD
NEUTRONIC HEATING
RADIATION COOLING TO OUTBOARD WALL
RADIATION HEATING FROM PLASMA
INBOARD SHIELD
GRAPHITE ARMOR
NEUTRONIC HEATING
. d S l t e , .
zmmmm:
mmmm mzmmzm? • ^ g p
RADIATION HEATING FROM PLASMA AND INBOARD ARMOR SURFACE
CONVECTIVE COOLING TO WATER
OUTBOARD FIRST WALL
Fig. 5-39. Boundary conditions for thermal model of plasma chamber.
5-87
Maximum tile surface temperatures during normal operation are shown as a function of tile thickness in Fig. 5-40 (plasma edge conditions are those of Case C or D, described in Section 5.1). For the baseline tile thickness of 5 cm, the inboard and top surfaces operate with maximum temperatures less than 1200°C. Tiles at the top of the chamber operate slightly hotter (about 40°C) than those on the inboard surface because of the lower view factor to the outboard wall. Charge exchange armor temperatures are discussed later in this section.
The transient temperature response of the graphite tile surface is shown in Fig. 5-41. The tile operates with surface temperatures above the methane generation zone (400-800°C) after four consecutive burns. This represents approximately 400 seconds of operation between 400 and 800°C at the start of a series of consecutive burns. If longer dwell times were to occur between b u m s , then the percentage of total operat-ing time spent in the methane generation range would probably increase. The temperature distributions through the graphite tiles at three times during a b u m cycle are shown in Fig. 5-42. These temperatures repre-sent the cyclic steady-state temperatures and occur after about eight consecutive b u m s .
The effects of heat loads corresponding to a range of plasma edge conditions on maximum armor tile temperatures are shown in Fig. 5-43. For the lower first wall heating conditions of Case A or B (see Table 5-2), the maximum temperature is still above 800°C.
The maximum temperature of the charge exchange armor, as a function of tile thickness, is shown in Fig. 5-40. For the baseline thickness of 5 cm, the maximum graphite temperature of the inboard armor is 1300°C, while the outboard tiles operate at 1500°C. The tile thickness can be reduced if it is judged necessary to maintain the graphite temperature below 1200°C.
The design temperature limit established for the stainless steel outboard panels is 300°C. This temperature limit is based on staying within thermal stress and thermal fatigue limits, as well as staying in temperature ranges where the impact of radiation damage is minimized. The wall thicknesses that limit the wall temperature to 300°C are shown
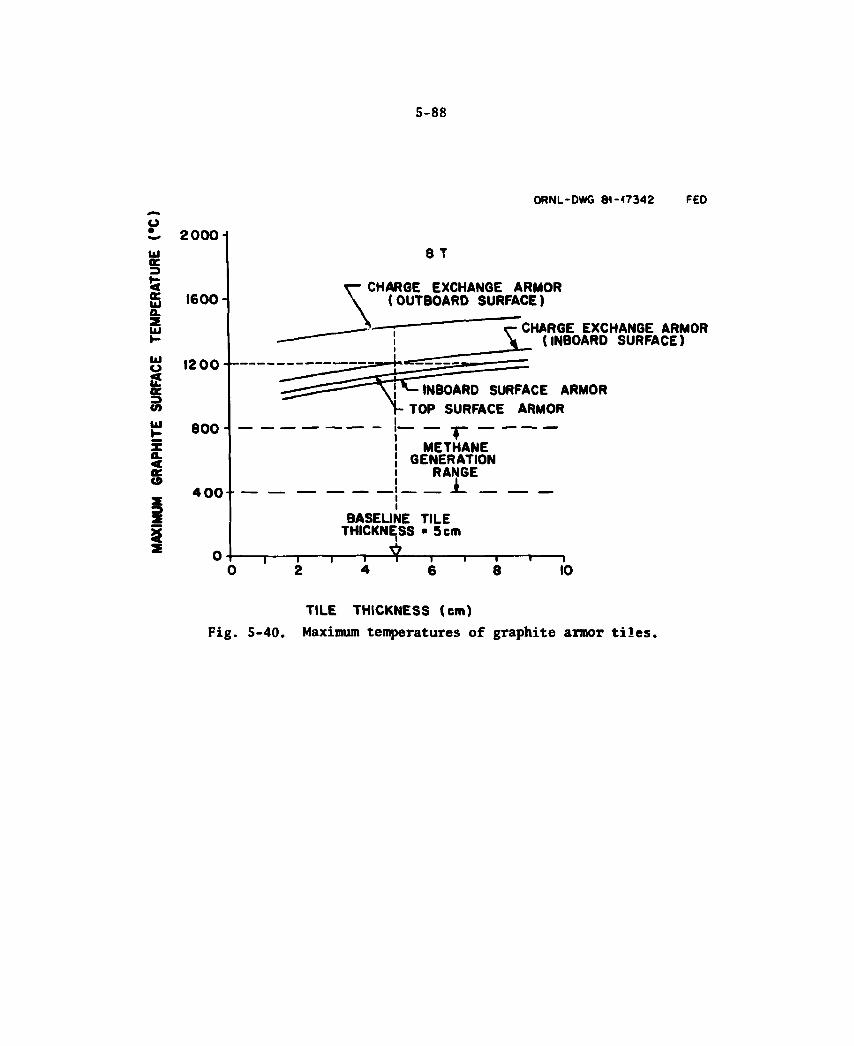
5-88
ORNL-DWG 81-17357R FED
TILE THICKNESS (em) Fig. 5-40. Maximum temperatures of graphite armor tiles.
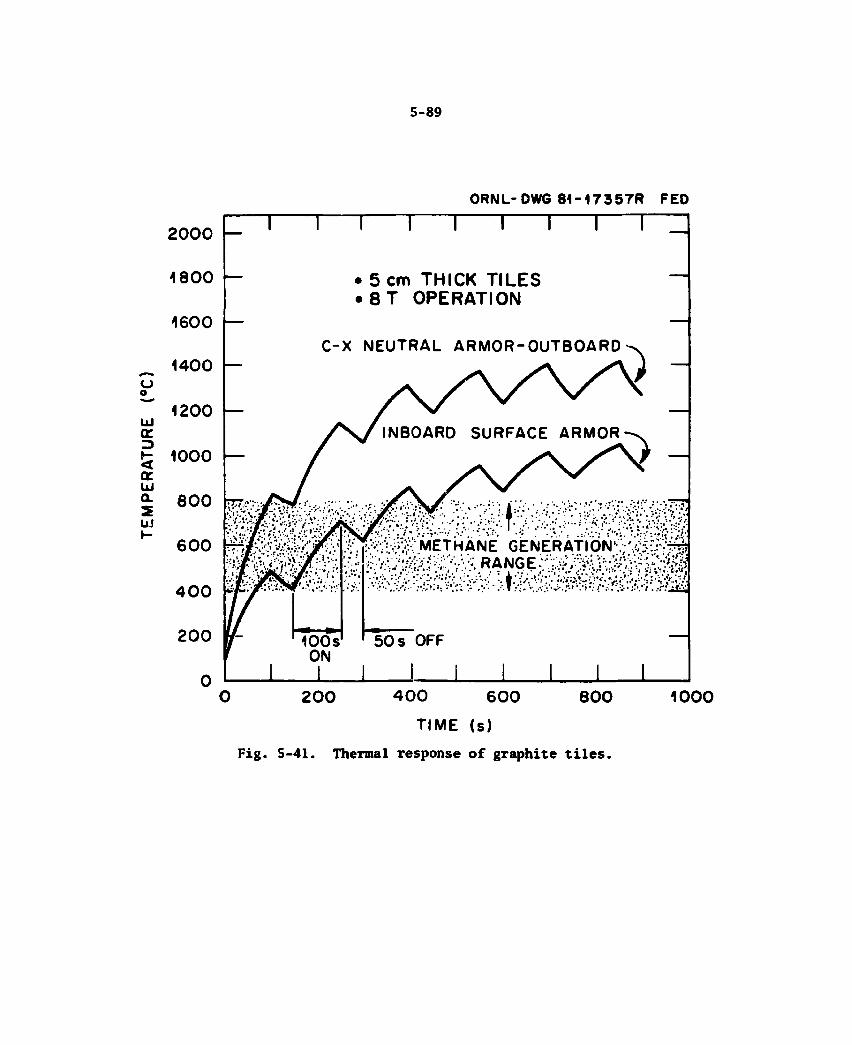
5 - 8 9
ORNL-DWG 8 1 - 1 7 3 5 7 R FED
2 0 0 4 0 0 6 0 0
T I M E (s)
Fig. 5-41. Thermal response of graphite tiles.
1000
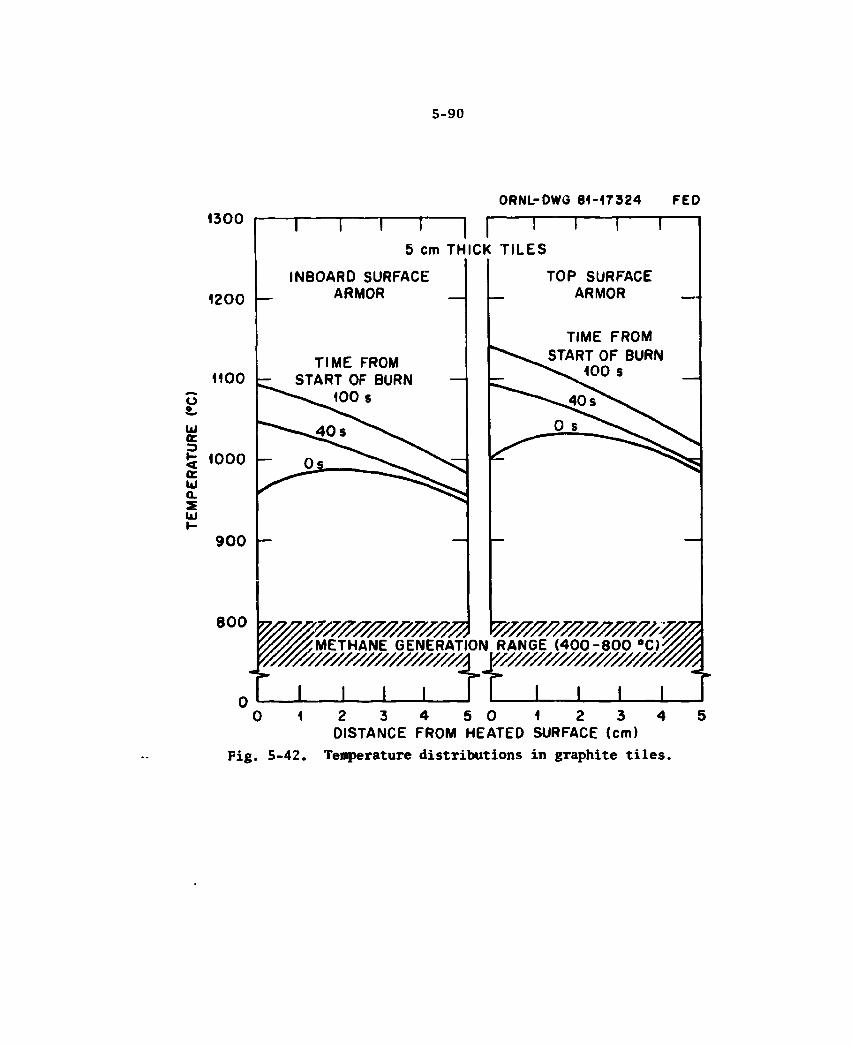
5 - 9 0
ORNL-DWG 81 -17357R FED 1300
5 cm THICK TILES
1200 INBOARD SURFACE
ARMOR
TIME FROM
UJ
9 0 0
800
TOP SURFACE ARMOR
TIME FROM START OF BURN
100 s
Fig. 5-42.
2 3 4 5 0 1 2 3 4 DISTANCE FROM HEATED SURFACE (cm)
Temperature distributions in graphite tiles.
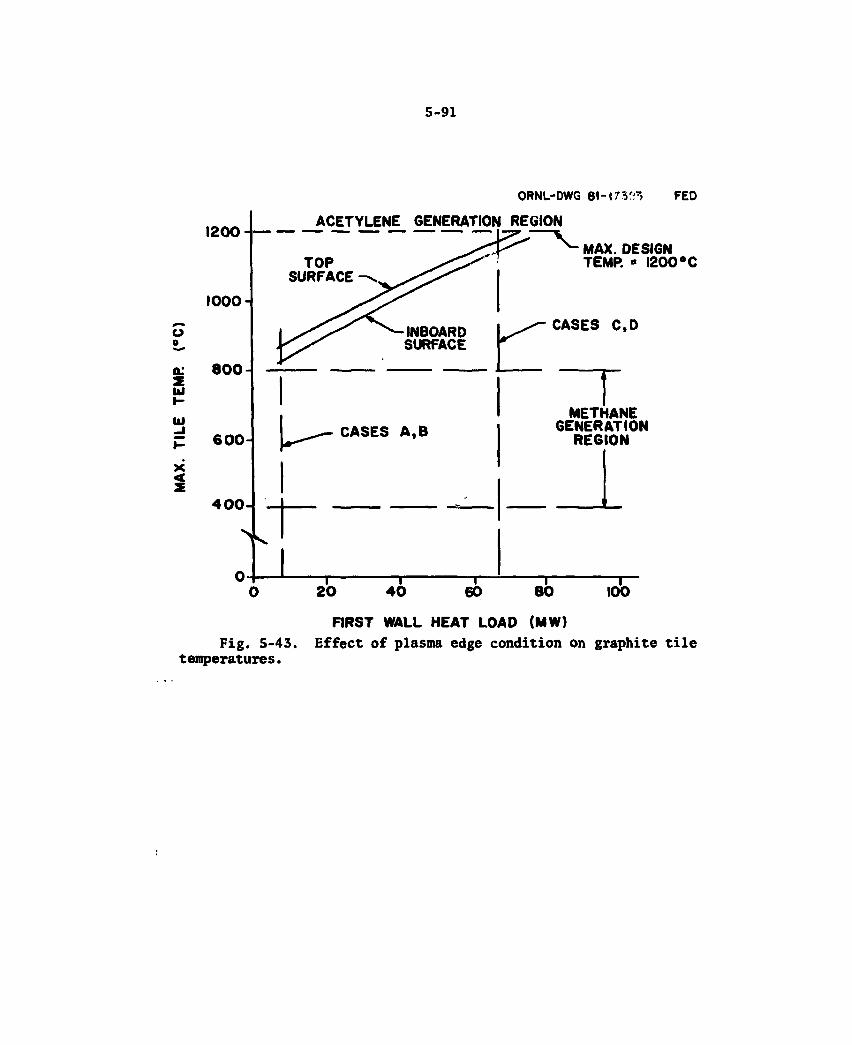
5-91
ORNL-DWG 8 1 - F E D
FIRST WALL HEAT LOAD (MW) Fig. 5-43. Effect of plasma edge condition on graphite tile
temperatures.
5 - 9 2
in Fig. 5-44 for a range of surface heat fluxes. The wall design edge conditions (Case C or D) both have a surface flux of 31 W/cm 2; there-fore, a wall thickness of 0.8 cm was chosen for the panels. If the lower surface heat flux of edge Cases A and B were experienced during operation, then the peak stainless steel temperature would be 170°C. Coolant flow conditions for the first wall panels are presented in Table 5-13.
i Table 5-13. First wall coolant flow parameters
Coolant inlet temperature - °C 60 Coolant outlet temperature - °C 100 Coolant inlet pressure - MPa 0.7 (100 psi) Coolant outlet pressure - MPa 0.5 (75 psi) Flow velocity - m/s 2.8 Pumping power - MW 0.1
The temperature response of the stainless steel panel at the location on the vertical facet where the maximum heating during startup occurs is shown in Fig. 5-45 for a complete burn cycle. The temperature response of the panel at a location not affected by startup is also shown for comparison. The panel remains at or below its 300*C design limit during startup, as well as during the remainder of the burn cycle.
Structural response
Thermal stresses in the outboard panels have been calculated as functions of surface heating rates and wall'thicknesses. These studies consistently show that the highest stresses occur at the surface of the panel facing the plasma. These stresses are compressive and are ori-ented in the longitudinal panel direction (parallel to the coolant flow direction). Calculations have assumed that these panels are free to expand but are constrained against out-of-plane bending. Because these stresses are compressive and because irradiation creep will result in
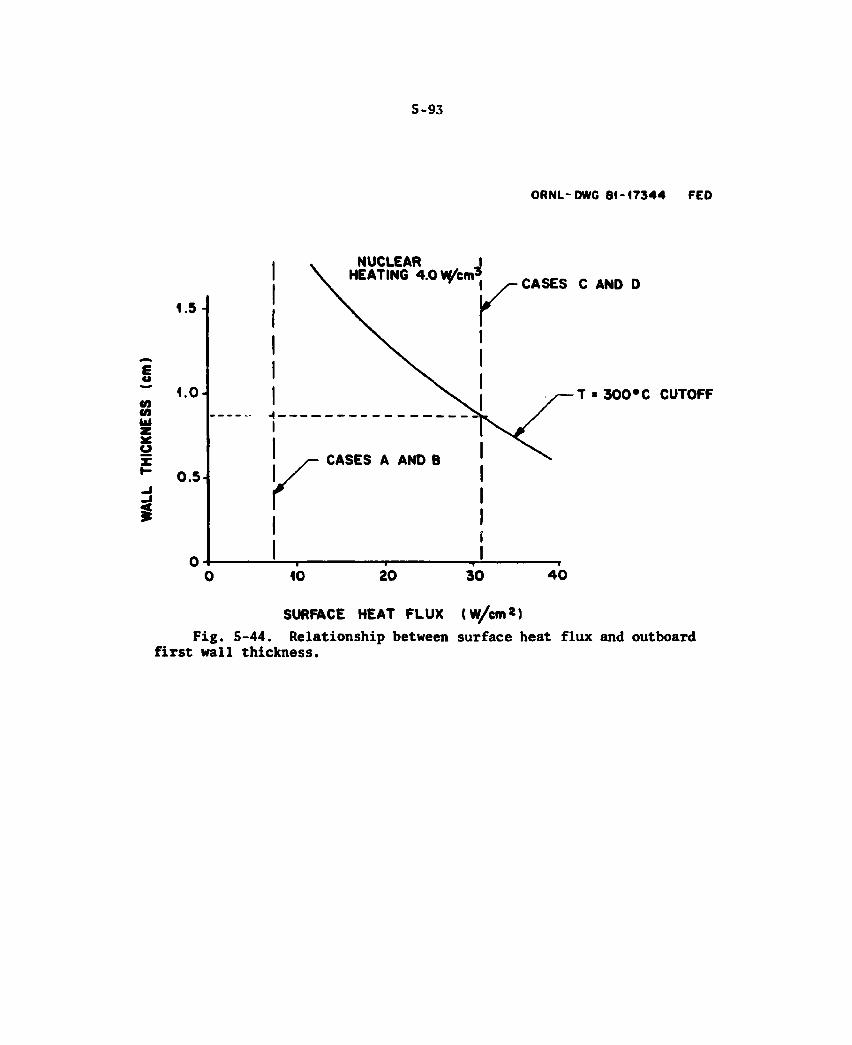
5-93
ORNL-DWG 81-17325 FED
E CJ CO CO
3C u
NUCLEAR HEATING 4.0 V^cm-| / - C A S E S C A N D D
T • 3 0 0 * C CUTOFF
SURFACE H E A T F L U X (W/cm«) Fig. 5-44. Relationship between surface heat flux and outboard
first wall thickness.
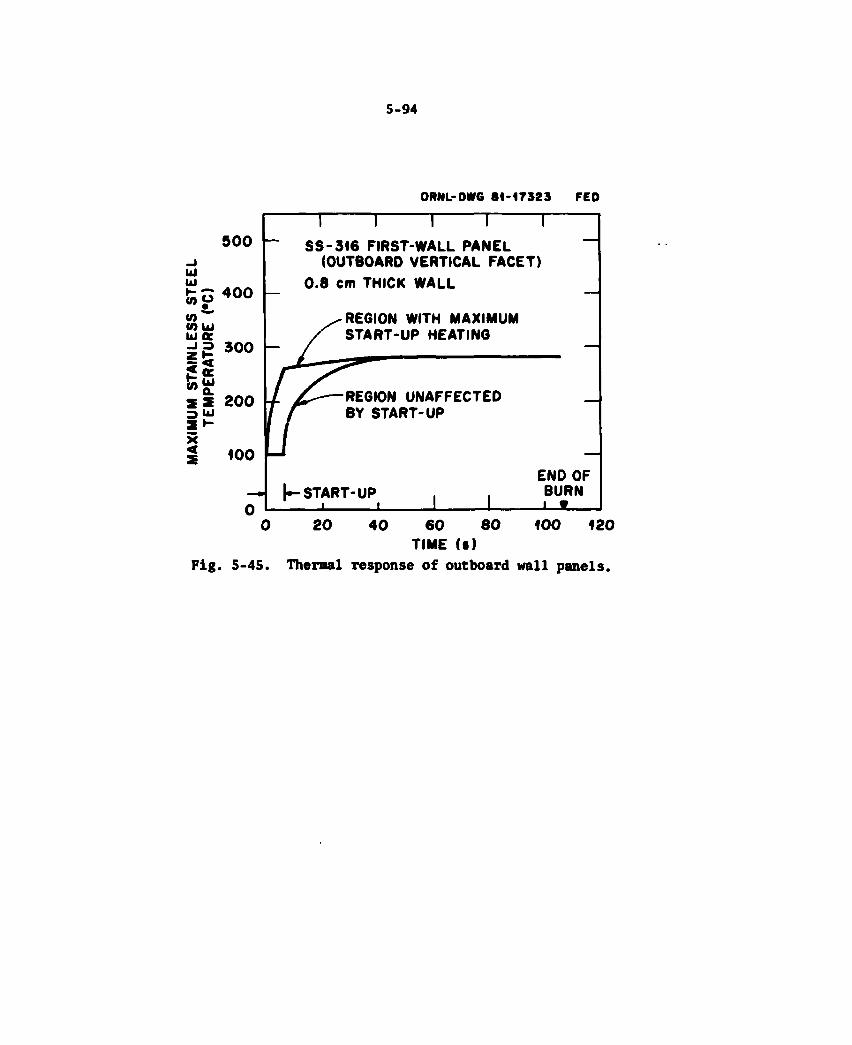
5-94
5 0 0 T
ORNL-DWG 81-17323 FED
T SS-316 FIRST-WALL PANEL
(OUTBOARD VERTICAL FACET) 0 .8 cm THICK WALL
REGION WITH MAXIMUM START-UP HEATING
REGION UNAFFECTED BY START-UP
|—START-UP I L 1
END OF BURN • •
60 80 TIME ( t )
100 120
Fig. 5-45. Thermal response of outboard wall panels.

5 - 9 5
tine-dependent reduction in the peak stresses during the burn, the stresses through the first wall thickness have been applied in fatigue life calculations. Since temperature distributions through the first ... wall are approximately linear, these stresses <tre given by aATE/2, where a = coefficient of thermal expansion, AT = the temperature difference" between the first wall surface and the coolant surface, and E is the modulus of elasticity.
This gives the maximum tensile stresses in the wall, located at the surface next to the coolant. FOT the plasma-side surface temperature of 300°C and a coolant-side surface temperature of 130°C, the thermal stress is approximately 320 MPa (46 ksi). This is within the 350-MPa (50-ksi) limit which has been used as a general guideline for maximum elastically calculated thermal stresses throughout the studies.
For purposes of fatigue analysis, ASME code guidelines, modified to account for radiation effects, have been applied. The design fatigue curve includes a factor of 2 on stress or 20 on cycles applied to a "best fit" curve through smooth specimen test data. The calculated stress ranges are divided by 2.0 to provide the values of "alternating stress intensity" for determination of fatigue life from the fatigue design curve. For an alternating stress intensity of 150 MPa (23 ksi), corresponding to the thermal stress previously mentioned, the allowable number of cycles is 10 7.
Requirements for attachment of first wall tiles and water cooled panels are based on replacement requirements, thermal expansions, and plasma disruption electromagnetic loads. The design also has to meet the requirement of having an electrical conducting path through the supports at the ends of the panels so that currents can flow toroidally. For the outboard wall water cooled panels, electromagnetic loads have been calculated (Section 6.4) to be approximately 0.1 MPa (14.5 psi). For a 1.0-m panel support spacing, panel bending stresses under electromagnetic loads can be kept to 50 MPa (7 ksi). These results should be conservative because the disruption load is a dynamic load but was treated as a static load in the analysis. Actual response of the structure should, therefore, result in lower stresses than those

5-96
calculated. Even the calculated values of 50 MPa, however, should be acceptable. The attachment approach is shown conceptually in Fig. 5-38. Each first wall panel includes a multipass tube system extending from the edge to the middle of the sector. These panels have pin connections that allow for free in-plane thermal expansions. A gap of approximately 1.0 cm is required at the sector midplane for thermal expansion (each panel expands approximately 0.4 cm). Out-of-plane deflections normal to the surface of the panel are constrained by the pin/lug attachments.
Electromagnetic loads on the graphite tiles are only 0.04 MPa (6 psi). Resulting stresses are well below 7 MPa (1 ksi) in the graphite bolt. Thus, no problems are anticipated in developing appro-priate attachment concepts from the standpoint of thermomechanical considerations.
Erosion Tesponse/life characteristics
Intense heat fluxes on first wall components of FED during plasma disruptions will cause surface melting and/or vaporization. Since this erosion mechanism can be a significant factor in limiting the life of these components, methods for accurately predicting the amount of material removed from the surface during a plasma disruption are required. The predicted thickness of material melted and/or vaporized can vary by several orders of magnitude, depending on the heating conditions and sophistication of the analysis method used.
Simple (closed-form) analysis methods were considered for predict-ing the vaporization depth but were not used because these simple methods were shown 4 to be subject to errors of several orders of mag-nitude for the heat fluxes and deposition times expected for FED plasma disruptions. Other difficulties in using the simple methods were the inability to (1) predict melt layer thickness and (2) consider time-dependent heat fluxes.
The method used for plasma disruption thermal analysis of FED first wall components consists of a slightly modified version of the MDAC/St. Louis transient finite difference heat transfer code called HEATRAN. The HEATRAN code can be used to model heat transfer in complex
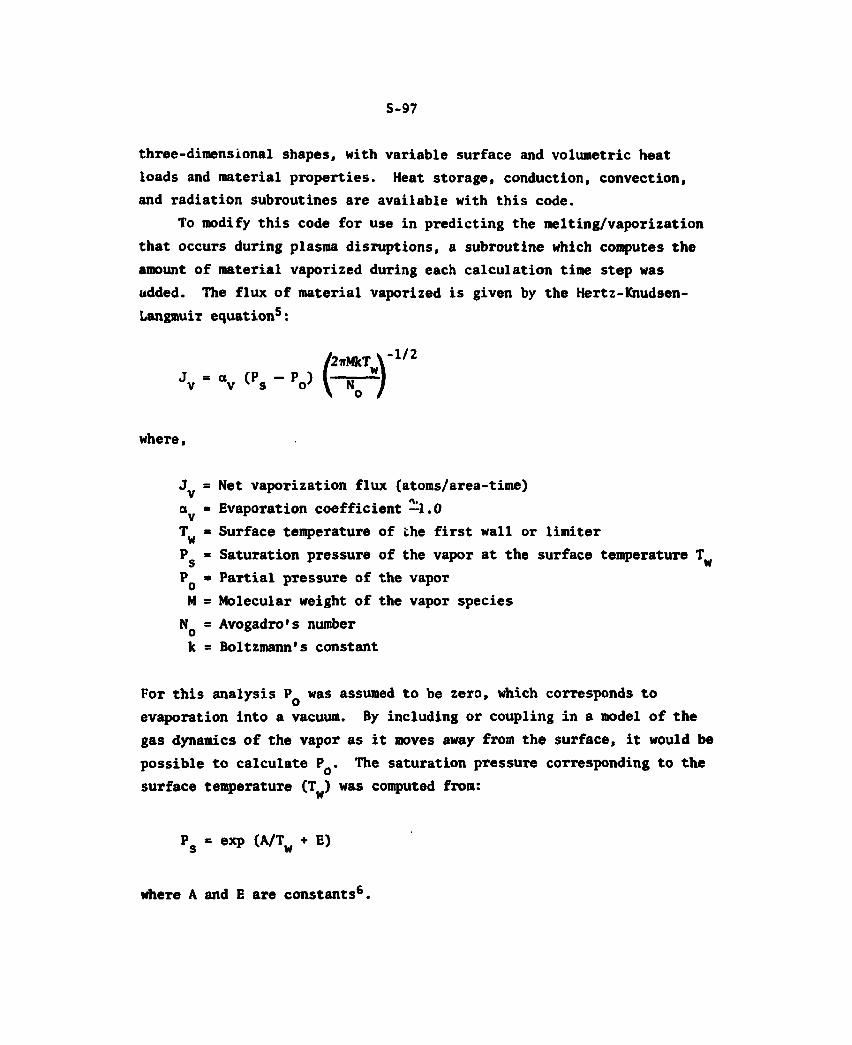
5 - 9 7
three-dimensional shapes, with variable surface and volumetric heat loads and material properties. Heat storage, conduction, convection, and radiation subroutines are available with this code.
To modify this code for use in predicting the melting/vaporization that occurs during plasma disruptions, a subroutine which computes the amount of material vaporized during each calculation time step was added. The flux of material vaporized is given by the Hertz-Knudsen-Langmuir equation 5:
J v = Net vaporization flux (atoms/area-time) (*v = Evaporation coefficient —1.0 T^ = Surface temperature of the first wall or limiter P g = Saturation pressure of the vapor at the surface temperature T w
P Q a Partial pressure of the vapor M = Molecular weight of the vapor species
N q = Avogadro's number k = Boltzmann's constant
For this analysis P 0 was assumed to be zero, which corresponds to evaporation into a vacuum. By including or coupling in a model of the gas dynamics of the vapor as it moves away from the surface, it would be possible to calculate P Q. The saturation pressure corresponding to the surface temperature (T^) was computed from:
P s = exp (A/Tw + E)
where A and E are constants 6.
where
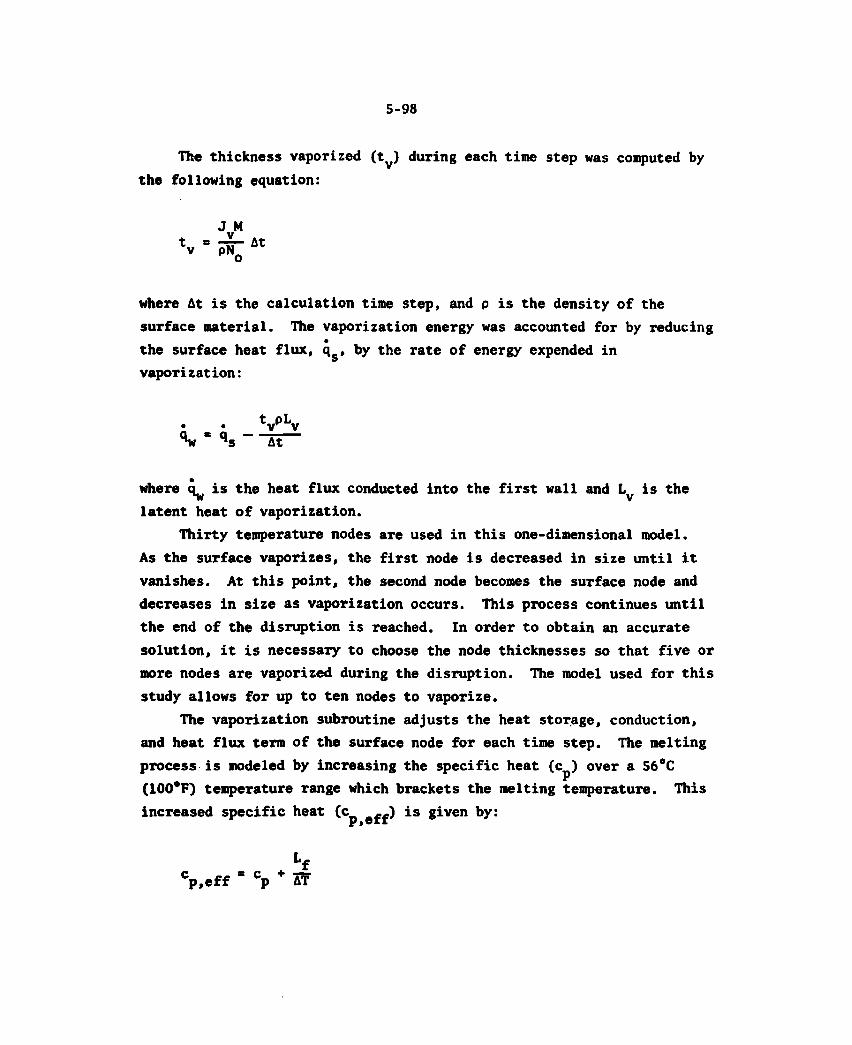
5 - 9 8
The thickness vaporized (t v) during each time step was computed by the following equation:
J M
where At is the calculation time step, and p is the density of the surface material. The vaporization energy was accounted for by reducing the surface heat flux, q , by the rate of energy expended in vaporization:
t pL • _ • _ vK v % * % At
where q^ is the heat flux conducted into the first wall and L v is the latent heat of vaporization.
Thirty temperature nodes are used in this one-dimensional model. As the surface vaporizes, the first node is decreased in size until it vanishes. At this point, the second node becomes the surface node and decreases in size as vaporization occurs. This process continues until the end of the disruption is reached. In order to obtain an accurate solution, it is necessary to choose the node thicknesses so that five or more nodes are vaporized during the disruption. The model used for this study allows for up to ten nodes to vaporize.
The vaporization subroutine adjusts the heat storage, conduction, and heat flux term of the surface node for each time step. The melting process is modeled by increasing the specific heat (c^) over a 56°C (100°F) temperature range which brackets the melting temperature. This increased specific heat (c^ eff) is given by:
+ L f
cp,eff - c p AT

5-99
where L^ is the latent heat of fusion, and AT is the temperature range bracketing the melting temperature (56°C). Linear interpolation of the temperature between the two nodes which bracket the melting temperature is used to determine the point at which the melt/solid interface is located for each time step.
Several features which are available for performing melting/ vaporization predictions with the modified HEATRAN code are:
1. Variable material properties and heat fluxes
2. Modeling of complex three-dimensional shapes 3. Inclusion of phase-change energy
Results obtained with this code have been shown 4 to exhibit good agreement with results obtained using the code developed for INTOR studies. 7
Erosion caused by sublimation of the graphite tiles during plasma disruptions was determined for the physics parameters defined in Table 5-4. Disruption erosion rates for the inboard armor tiles vary considerably over the range of conditions that has been established as FED parameters. Shown in Fig. 5-46 is the variation in erosion (per disruption) of graphite as a function of the plasma thermal energy deposited during current quench (only one of the seven independent parameters shown in Table 5-4). This shows that the sensitivity for only one variable is a factor of 20 in using the maximum value over the minimum value. Table 5-14 shows the sensitivity of the inboard armor tile disruption erosion to the uncertainty in each parameter. Subli-mation calculated for the full ten-year FED life for four combina-tions of disruption parameters is shown in Fig. 5-47. The "worst" case erosion of 10.3 cm represents the result obtained using all parameter values which maximize sublimation. Sublimation for the "best" case parameters (parameters which minimize erosion) is negligible. The erosion calculated for nominal parameter values is 0.1 cm. The design case erosion was chosen as the erosion at nominal parameter values plus the root-sum-square of the maximum variation of erosion due to changing each parametier. The equation used for calculating the design case erosion is:
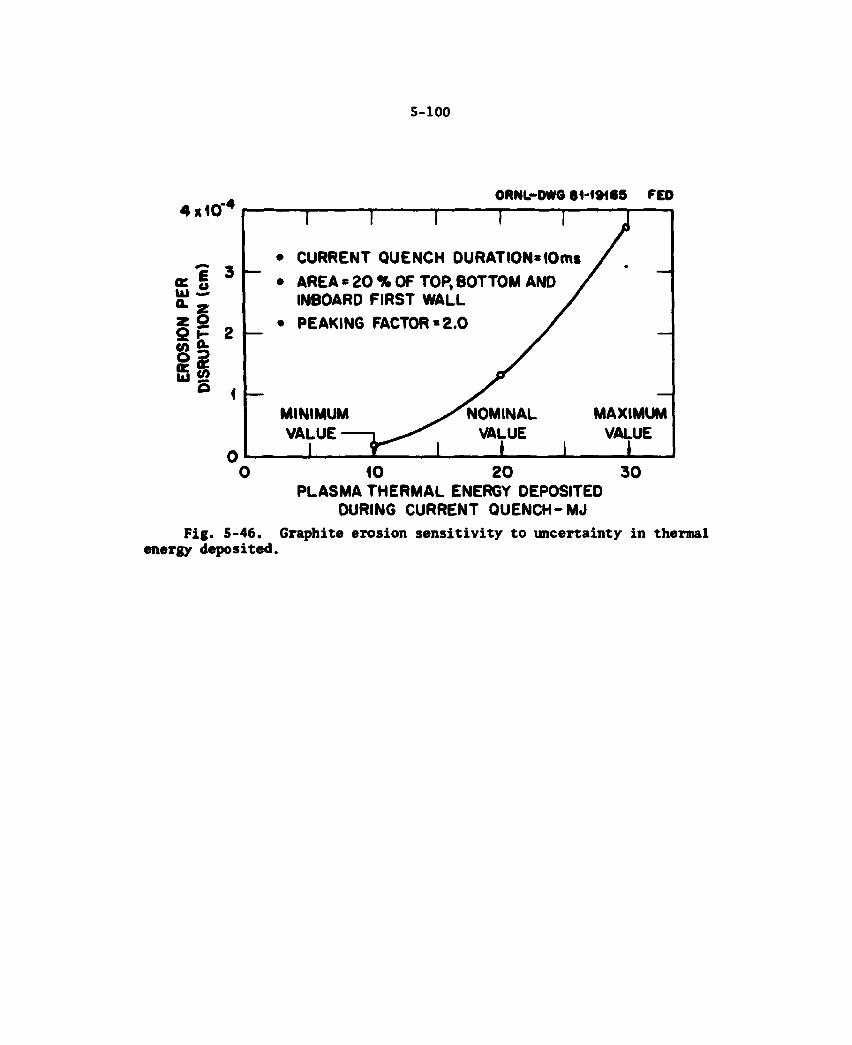
5-100
4 * 1 0 " 4 ORNL-DWG 81-17325 FED
* g UJ £>
z 2 9 H </> Sb S i Q CO
5
• CURRENT QUENCH DURATION* 10ms
• AREA * 2 0 % OF TOP, BOTTOM AND INBOARD FIRST WALL
• PEAKING FACTOR s 2 . 0
MINIMUM VALUE -
1 VALUE
MAXIMUM VALUE
I 10 20
PLASMA THERMAL ENERGY DEPOSITED DURING CURRENT QUENCH-MJ
3 0
Fig. 5-46. Graphite erosion sensitivity to uncertainty in thermal energy deposited.
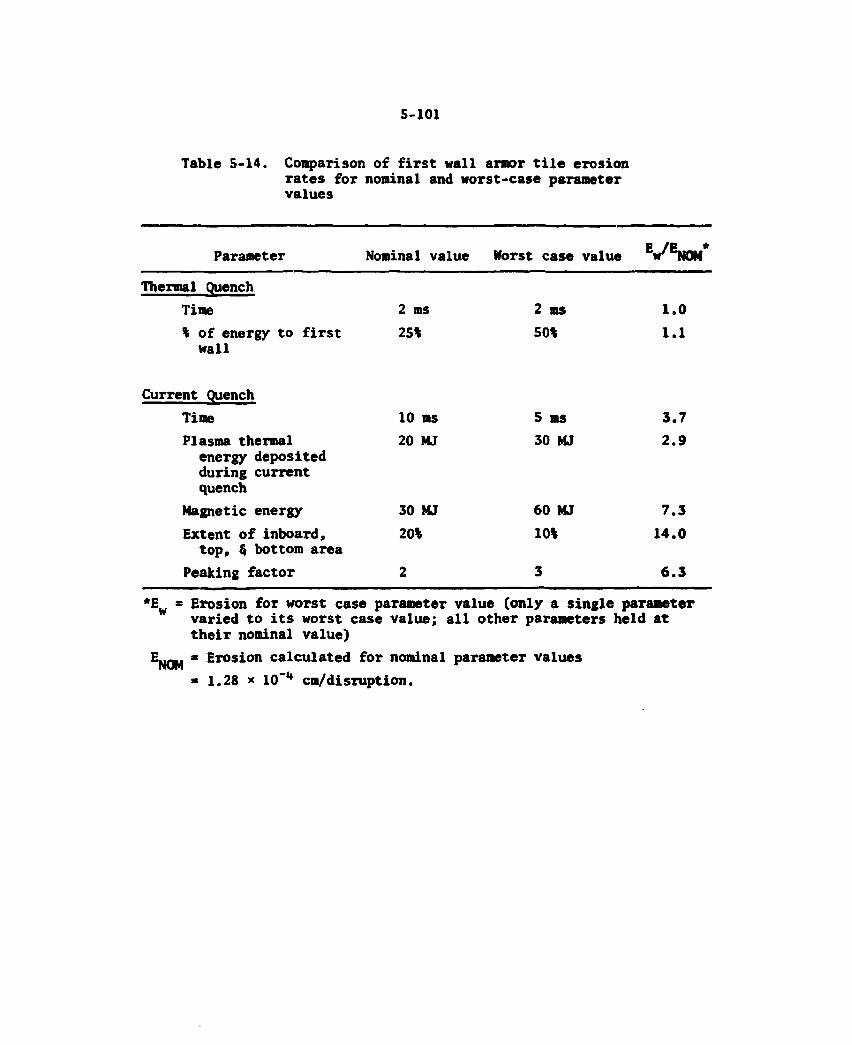
5-101
Table 5-14. Comparison of first wall armor tile erosion rates for nominal and worst-case parameter values
Parameter Nominal value Worst case value v w
Thermal quench Time 2 ms 2 ms 1.0 % of energy to first 25* 50% 1.1
wall
Current quench Time 10 ms 5 ms 3.7 Plasma thermal 20 MJ 30 MJ 2.9
energy deposited during current quench
Magnetic energy 30 MJ 60 MJ 7.3 Extent of inboard, 20% 10% 14.0
top, § bottom area Peaking factor 2 3 6.3
*E W = Erosion for worst case parameter value (only a single parameter varied to its worst case value; all other parameters held at their nominal value)
E n q m » Erosion calculated for nominal parameter values
= 1.28 * 10"u cm/disruption.
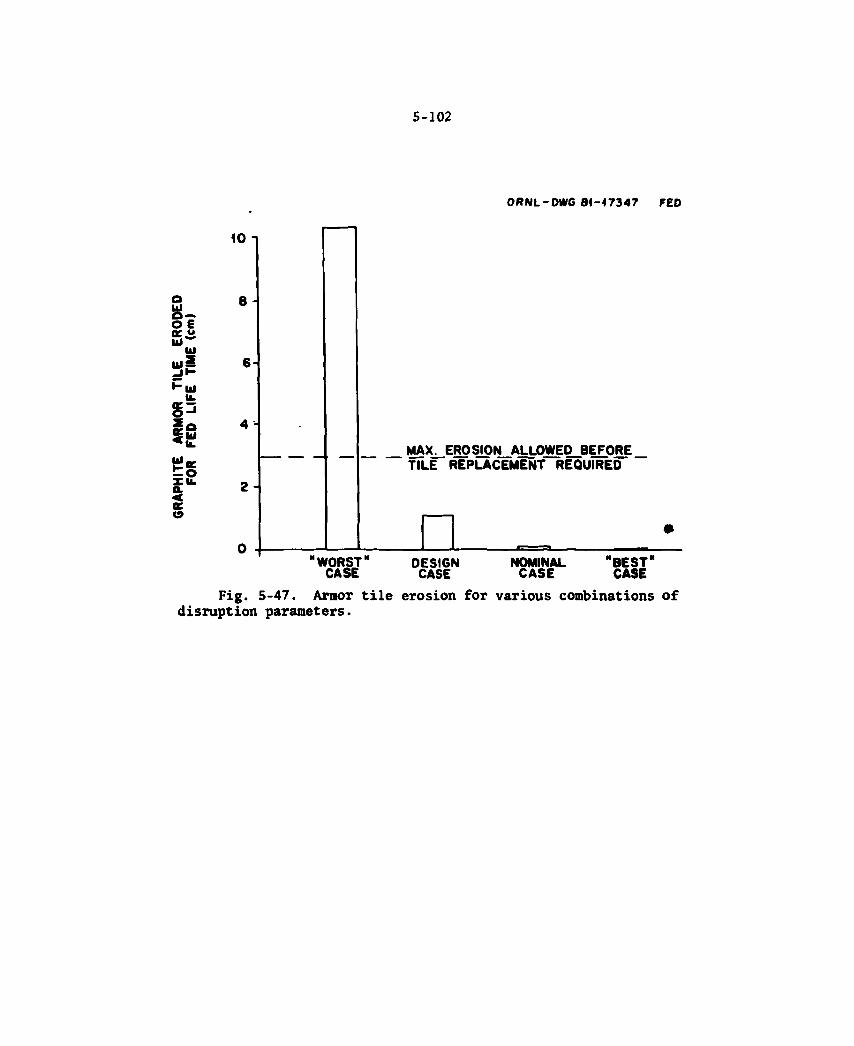
5-102
ORNL-DWG 81-<7347 FED
10 1
8
6-
4 -
2 -
MAX _ERO SJ0N_ALL0WED_BEF0RE TILE REPLACEMENT REQUIRED
'WORST" CASE
DESIGN CASE
NOMINAL CASE
*BEST" CASE
Fig. 5-47. Armor tile erosion for various combinations of disruption parameters.
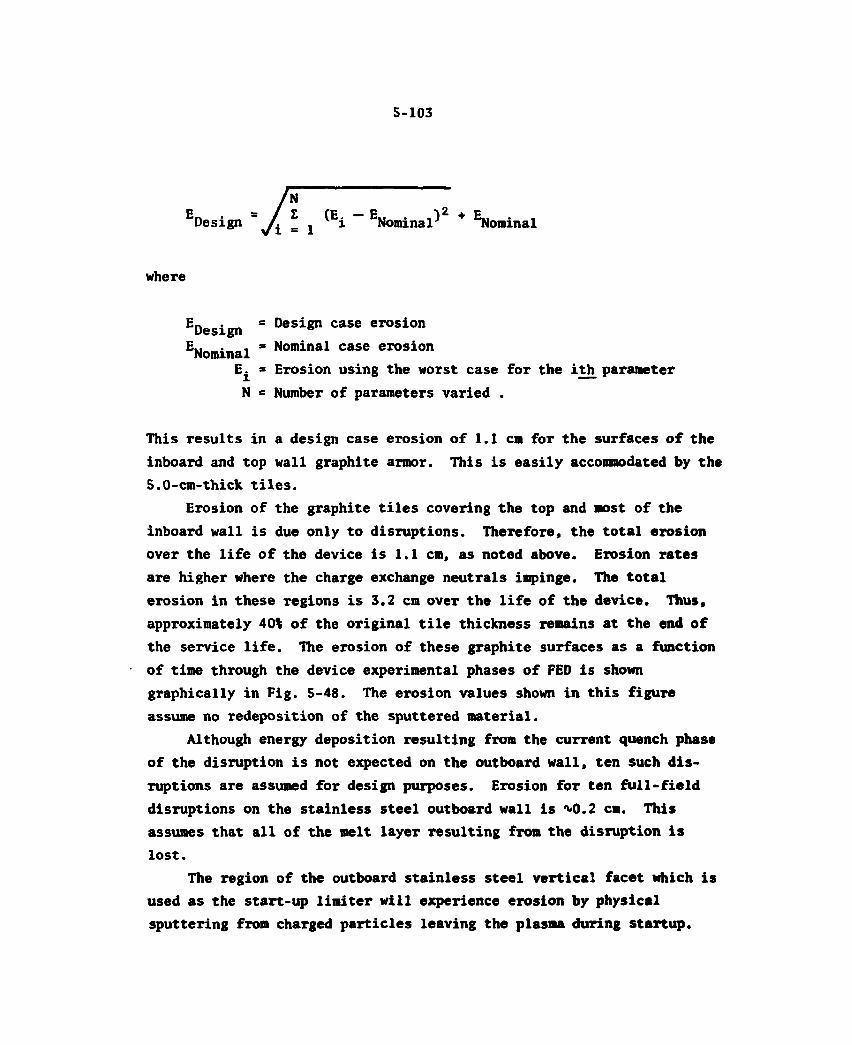
5-103
^Design = / f . ( Ei ^ o m i n a p 2 + N o m i n a l
where
^Design s Design c » s e erosion
^Nominal = Nominal case erosion E^ = Erosion using the worst case for the ith parameter N = Number of parameters varied .
This results in a design case erosion of 1.1 cm for the surfaces o f the inboard and top wall graphite armor. This is easily accomodated by the 5.0-cm-thick tiles.
Erosion of the graphite tiles covering the top and most of the inboard wall is due only to disruptions. Therefore, the total erosion over the life of the device is 1.1 cm, as noted above. Erosion rates are higher where the charge exchange neutrals impinge. The total erosion in these regions is 3.2 cm oveT the life of the device. Thus, approximately 40% of the original tile thickness remains at the end of the service life. The erosion of these graphite surfaces as a function of time through the device experimental phases of FED is shown graphically in Fig. 5-48. The erosion values shown in this figure assume no redeposition of the sputtered material.
Although energy deposition resulting from the current quench phase of the disruption is not expected on the outboard wall, ten such dis-ruptions are assumed for design purposes. Erosion for ten full-field disruptions on the stainless steel outboard wall is M).2 cm. This assumes that all of the melt layer resulting from the disruption is lost.
The region of the outboard stainless steel vertical facet which is used as the start-up limiter will experience erosion by physical sputtering from charged particles leaving the plasma during startup.
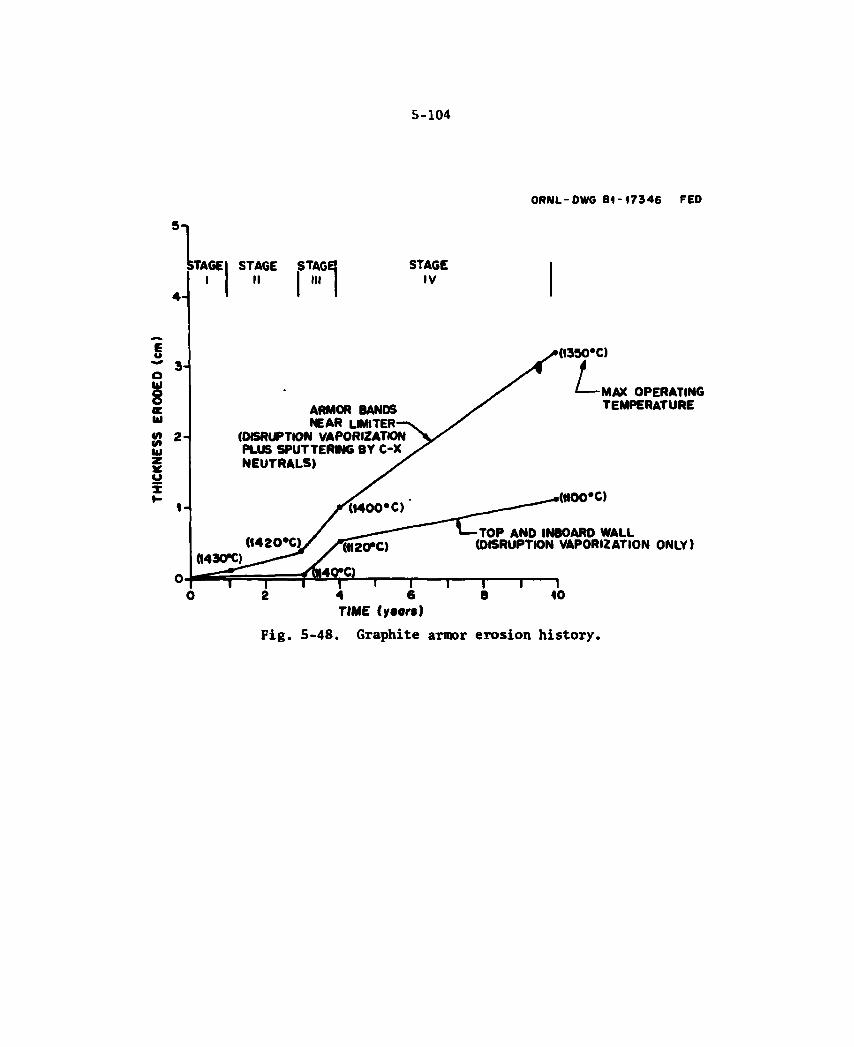
5-104
1 TAGEI STAGE STAGE!
4 -III
I STAGE
IV
ORNL-DWG 84-17346 FED
(1350'C)
a UJ 8 K hi in in UJ X O
2-
ARMOR BANDS NEAR UMITER-
(DISRUPTION VAPORIZATION PLUS SPUTTERMG BY C-X NEUTRALS)
MAX OPERATING TEMPERATURE
« 0 0 " C )
TOP AND INBOARD WALL (DISRUPTION VAPORIZATION ONLY)
F i g . 5 - 4 8 . G r a p h i t e armor e r o s i o n h i s t o r y .

5-105
The thickness eroded by charged particles will be 0.14 cm for the full ten-year FED life. This erosion added to the erosion by ten disruptions assumed for design purposes results in a total erosion of 0.34 cm. Therefore, the 0.8-cm-thick stainless steel first wall is expected to last the full life of the device, with an end-of-life thickness of 0.46 cm in the start-up limiter region of the vertical facet and 0.6 cm in regions not affected by startup.
Effect of 10-T operation
The effects of 10-T operation were evaluated. Results of thermal analyses of the outboard surface panels and the inboard and top surface armor tiles are summarized in Fig. 5-49, together with steady-state conditions at 8 T.
A burn of greater than 100 seconds can be tolerated by all com-ponents. The steady-state stainless steel panel temperature is 330°C for 10-T operation, which is 50°C higher than the value at 8 T. This will increase cyclic thermal stresses and, therefore, decrease the fatigue life of the panels. However, only a limited number of 10-T cycles is anticipated, and effects of radiation creep should help limit maximum thermal stresses to acceptable levels.
The graphite armor tiles on the inboard wall will remain below 1300°C for a 100-second burn at 10 T. Therefore, assuming that acetylene formation is not significant at graphite surface temperatures below about 1300°C, the burn time at 10 T will not be limited by first wall components.
5.3.4 First Wall Design Options
Alternative armor attachment
Two alternate armor tile attachment concepts were considered, as shown in Fig. 5-50. One alternative concept is a variation of the baseline design. External metal studs attached to the wall would be used in conjunction with a graphite nut for attaching tiles. The stud
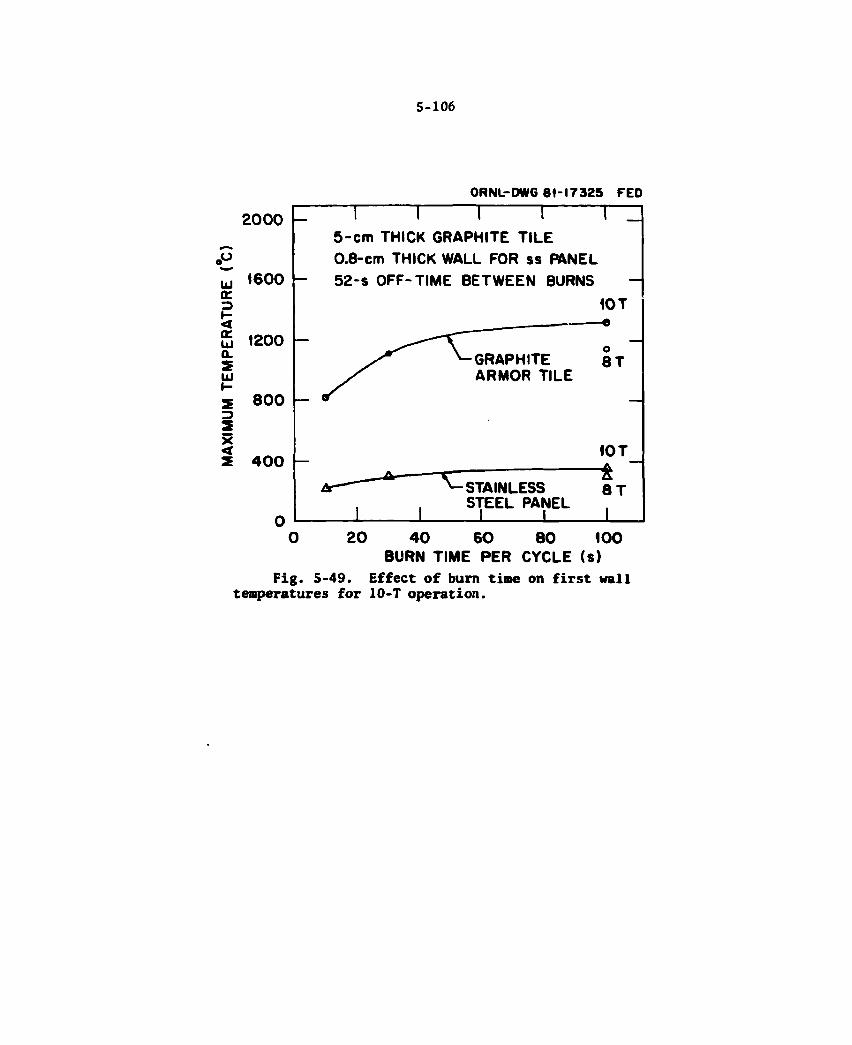
5-106
ORNL-DWG 81-17325 FED
2000 -O UJ 0C »-< a. UJ o. s UJ l-
X <
1600
1200
800
4 0 0
1 1 1 m 5 - c m THICK GRAPHITE TILE 0.8-cm THICK WALL FOR ss PANEL 52-s OFF-TIME BETWEEN BURNS
10 T
GRAPHITE ARMOR TILE
o 8 T
x : STAINLESS STEEL PANEL
10 T
8 T
0 2 0 4 0 6 0 8 0 100 BURN TIME PER CYCLE (s)
Fig. 5-49. Effect of burn time on first wall temperatures for 10-T operation.
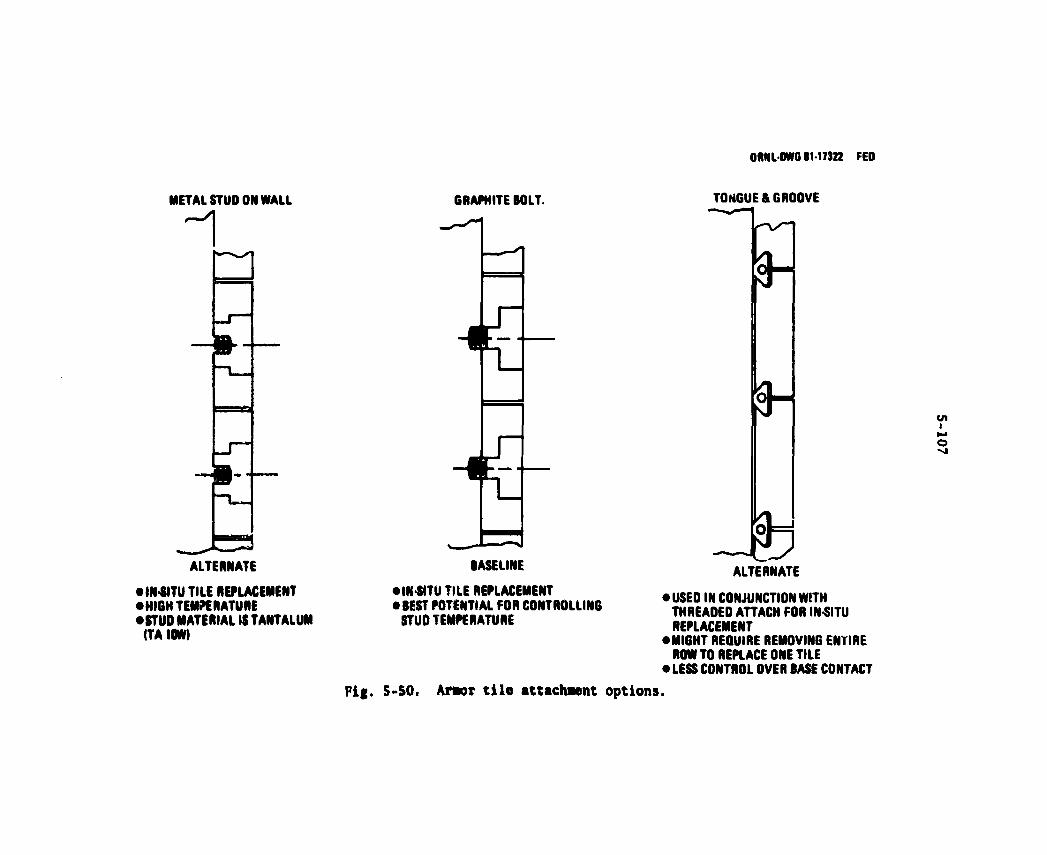
ORNLOMrO 81-17322 FED
GRAPHITE BOLT. TONGUE & GROOVE
BASELINE D •IN-SITU TILE REPLACEMENT • BEST POTENTIAL FOR CONTROLLING
STUO TEMPERATURE
ALTERNATE
• USED IN CONJUNCTION WITH THREAOED ATTACH FOR IN-SITU REPLACEMENT
•MIGHT REQUIRE REMOVING ENTIRE ROW TO REPLACE ONE TILE
• LESS CONTROL OVER BASE CONTACT S-SO. Armor t i l e attachment options.

5-108
material is tantalum (Ta 10W). One advantage of this design is that the coolant flow passage design in the shield may be simpler. However, this would not be true if cooling the stud became a requirement.
The other alternative concept shows a tongue-and-groove tile arrangement. The tiles would be grooved on each edge and would slide on external rails which arc cooled, as shown in Fig. 5-51. This design could be used in conjunction with some bolted-in-place tiles. Edge rows of bolted tiles would be required to permit in-situ tile replacement. An advantage of this concept is that if a large quantity of tiles had to be replaced, refurbishment time might be reduced. However, for isolated tile replacement, an entire row of tiles might have to be removed to replace one tile. Also, less control exists over contact pressure between tile and shield.
The baseline attachment approach was selected in order to allow for replacement of individual tiles. However, each alternative approach offers some advantages. Final selection of the design approach will depend upon the disruption scenario, which dictates frequency of replacement and the capabilities of remote handling equipment.
Alternative outboard wall panel concepts
The baseline ribbed panel design and two alternative design con-cepts considered for the outboard first wall arc shown in Fig. 5-S2. The first alternative is to use circular tube banks. One advantage of tubes is that thermal stresses can be relieved by deflection if tubes are allowed to expand freely. This may be difficult to achieve because frequent supports are required to carry the out-of-plane electromag-netic loads. If significant erosion occurs, the circular tube would have an additional advantage in being able to carry coolant pressures (hocp tension) more easily than the flat plates (bending), thus making rupture less likely. Disadvantages are that the manifolding is complex, and gap control between tubes is necessary; two nested tube banks may be required.
Another panel configuration considered was the embossed panel, or panel coil design. These panels arc fabricated by diffusion bonding a
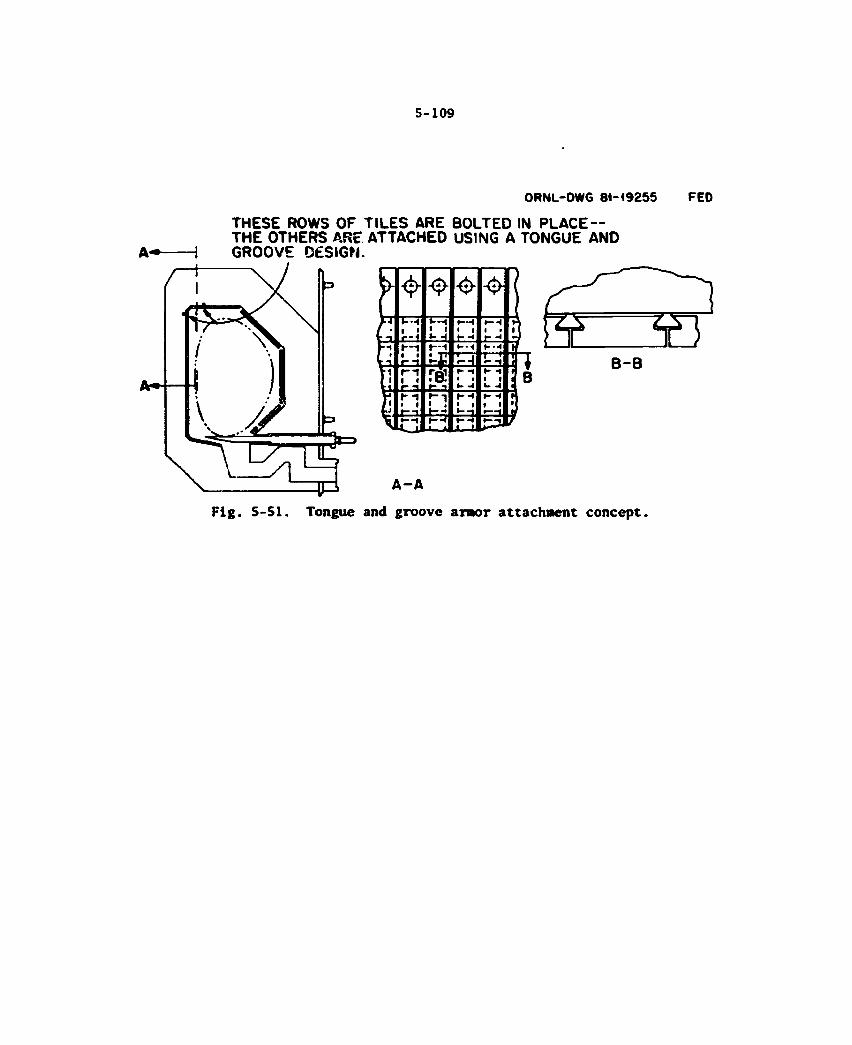
5-109
ORNL-DWG 81-19255 FED
THESE ROWS OF TILES ARE BOLTED IN PLACE— THE OTHERS ARE ATTACHED USING A TONGUE AND
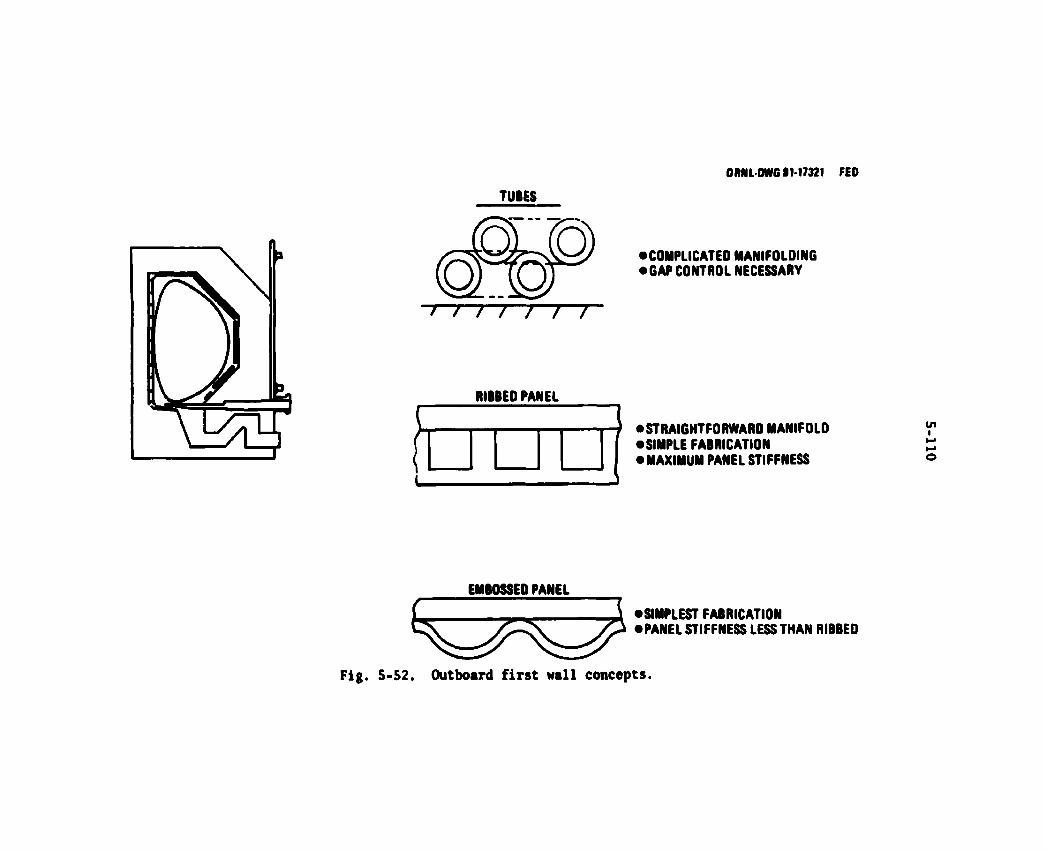
ORNLOMffi IM7321 FED TUBES
/ / / / / / /
RIBBEO PANEL
• COMPLICATED MANIFOLDING • GAP CONTROL NECESSARY
• STRAIGHTFORWARD MANIFOLO • SIMPLE FABRICATION • MAXIMUM PANEL STIFFNESS
in •
EMBOSSEO PANEL
•SIMPLEST FABRICATION • PANEL STIFFNESS LESS THAN RIBBED
Fig. 5-52. Outboard f i r s t wal l concepts.

5-111
flat plate that faces the plasma to a corrugated panel which forms the coolant passages. This concept features simpler fabrication than the ribbed panel design. However, panel stiffness is reduced, requiring more frequent support.
The primary reason foT selecting a smooth surface design, such as the ribbed panel, was to provide a continuous surface for the plasma to deposit heat during startup. In addition, manifolding the panels is significantly eased with the ribbed panel configuration.
Start-up limiter design options
The baseline design is to use the vertical facet of the bare stainless steel outboard wall as the start-up limiter. The temperature response of the bare stainless steel wall during startup was previously presented in Fig. 5-45. Other approaches were also considered. Design features of the baseline and two alternatives are compared in Table 5-15.
One alternative (Option 1) would be to bolt graphite tiles on the outboard shield surface in a fashion similar to the inboard wall design. The transient thermal response of the graphite tiles and the shield surface is shown in Fig. 5-53. The tile surface operates near or above 1600°C for the entire b u m cycle. The advantages of graphite are that it would be relatively insensitive to plasma parameter variations, it would provide runaway electron protection, and it would facilitate in-situ maintenance. A disadvantage is that the graphite operates at a temperature that may yield excessive chemical erosion (1650*C). Also, the design is more complex than the baseline.
A second alternative (Option 2) would be to use separate limiter modules, as shown in Fig. 5-54. Ten modules, one per sector equally spaced, are required. The limiter face would consist of graphite tiles attached to an actively cooled copper substrate. During startup, these limiters are translated further into the plasma chamber than the first wall and after the six-second startup are retracted so that limiter surfaces are flush with the first wall. Pneumatic actuators linked by a feedback control system are employed to achieve the proper radial
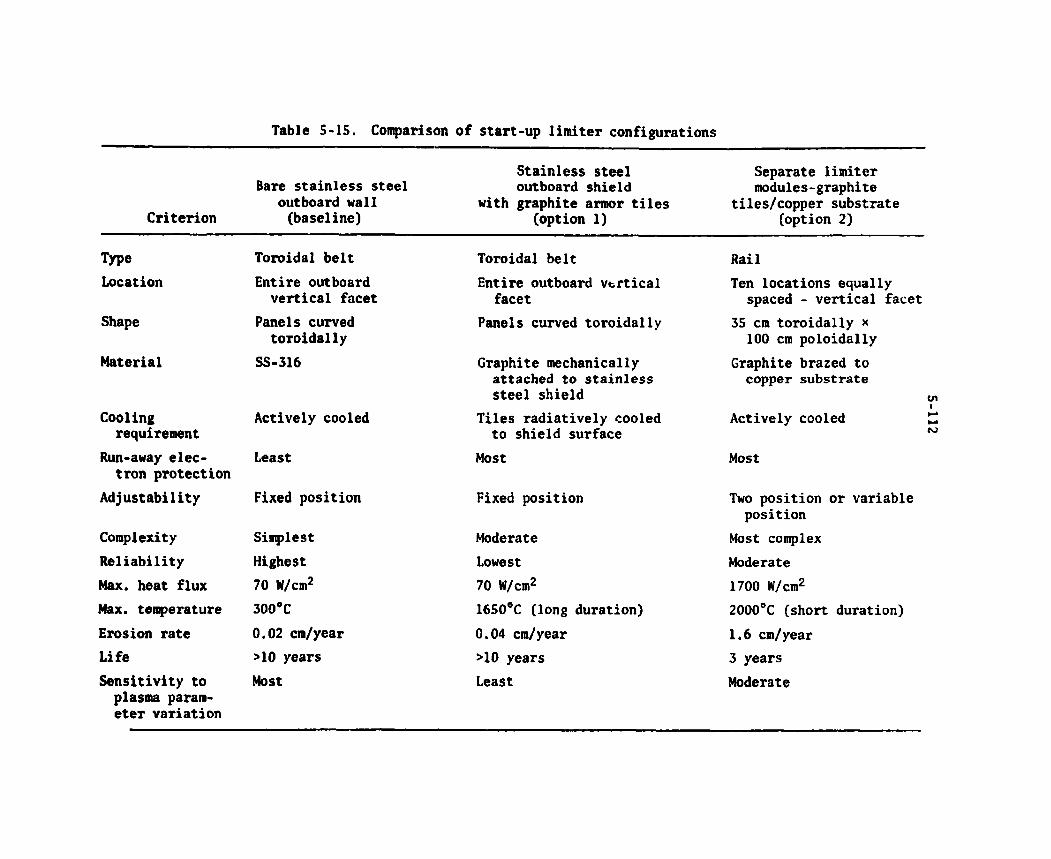
Table 5-15. Comparison of start-up limiter configurations
Criterion
Bare stainless steel outboard wall (baseline)
Stainless steel outboard shield
with graphite armor tiles (option 1)
Separate limiter modules-graphite
tiles/copper substrate (option 2)
Type Location
Shape
Material
Cooling requirement
Run-away elec-tron protection
Adjustability
Complexity Reliability Max. heat flux Max. temperature Erosion rate Life Sensitivity to plasma param-eter variation
Toroidal belt Entire outboard vertical facet
Panels curved toroidally
SS-316
Actively cooled
Least
Fixed position
Simplest Highest 70 W/cm2
300°C 0.02 cm/year >10 years Most
Toroidal belt Entire outboard vertical
facet Panels curved toroidally
Graphite mechanically attached to stainless steel shield
Tiles radiatively cooled to shield surface
Most
Fixed position
Moderate Lowest 70 W/cm2
1650°C (long duration) 0.04 cm/year >10 years Least
Rail Ten locations equally
spaced - vertical facet 35 cm toroidally * 100 cm poloidally
Graphite brazed to copper substrate
Actively cooled
Most
Two position or variable position
Most complex Moderate 1700 W/cm2
2000°C (short duration) 1.6 cm/year 3 years Moderate
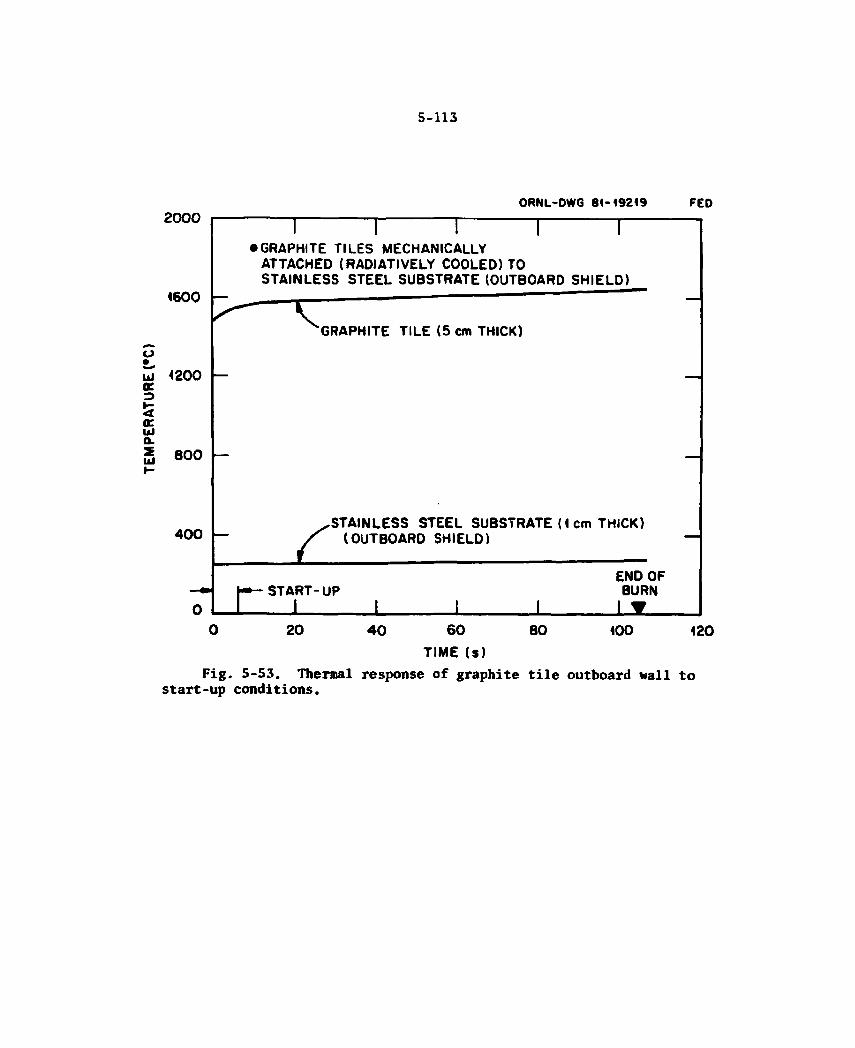
5-113
2 0 0 0
1600
1200
600
400
ORNL-DWG 81-19219 FED
T • GRAPHITE TILES MECHANICALLY
ATTACHED (RADIATIVELY COOLED) TO STAINLESS STEEL SUBSTRATE (OUTBOARD SHIELD)
GRAPHITE TILE (5 cm THICK)
STAINLESS STEEL SUBSTRATE (1 cm THICK) (OUTBOARD SHIELD)
END OF h*— START-UP BURN J I I I I I •
0 20 40 60 80 100 120 TIME (s)
Fig. 5-53. Thermal response of graphite tile outboard wall to start-up conditions.
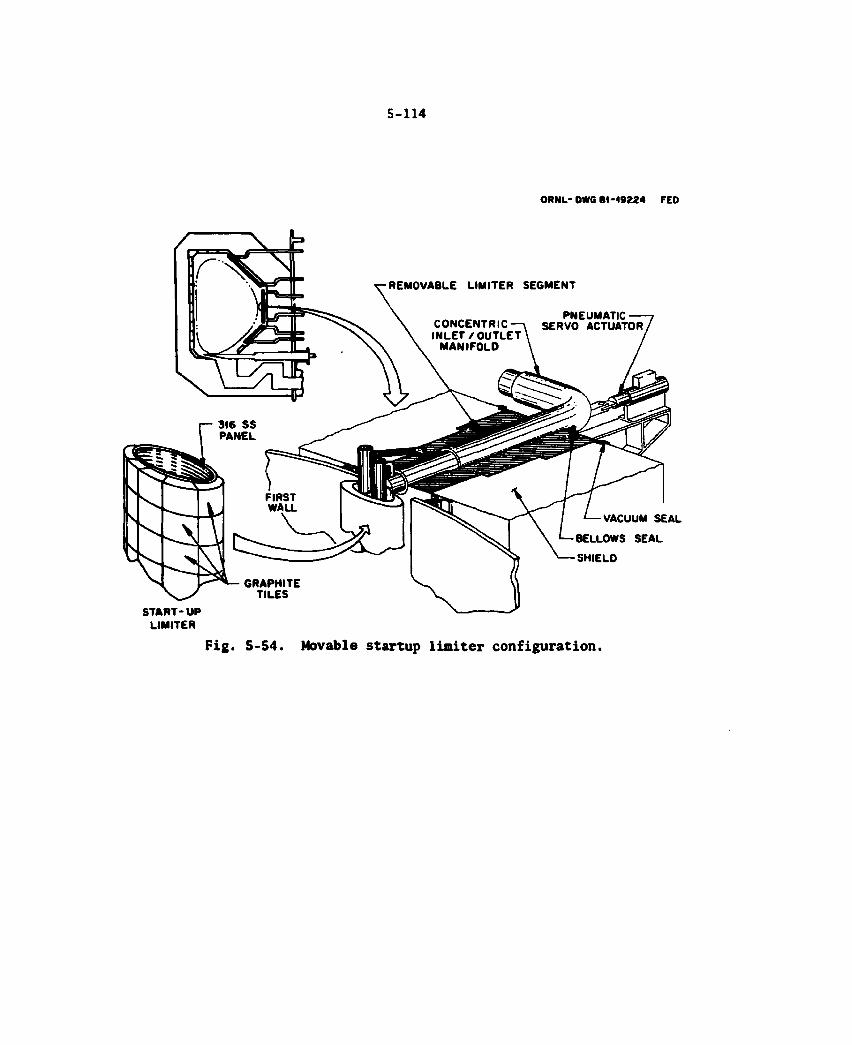
5-114
ORNL- DWG 84-49224 FED
REMOVABLE LIMITER SEGMENT
VACUUM SEAL
BELLOWS SEAL
SHIELD
START-UP LIMITER
Fig. S-54. Movable startup limiter configuration.
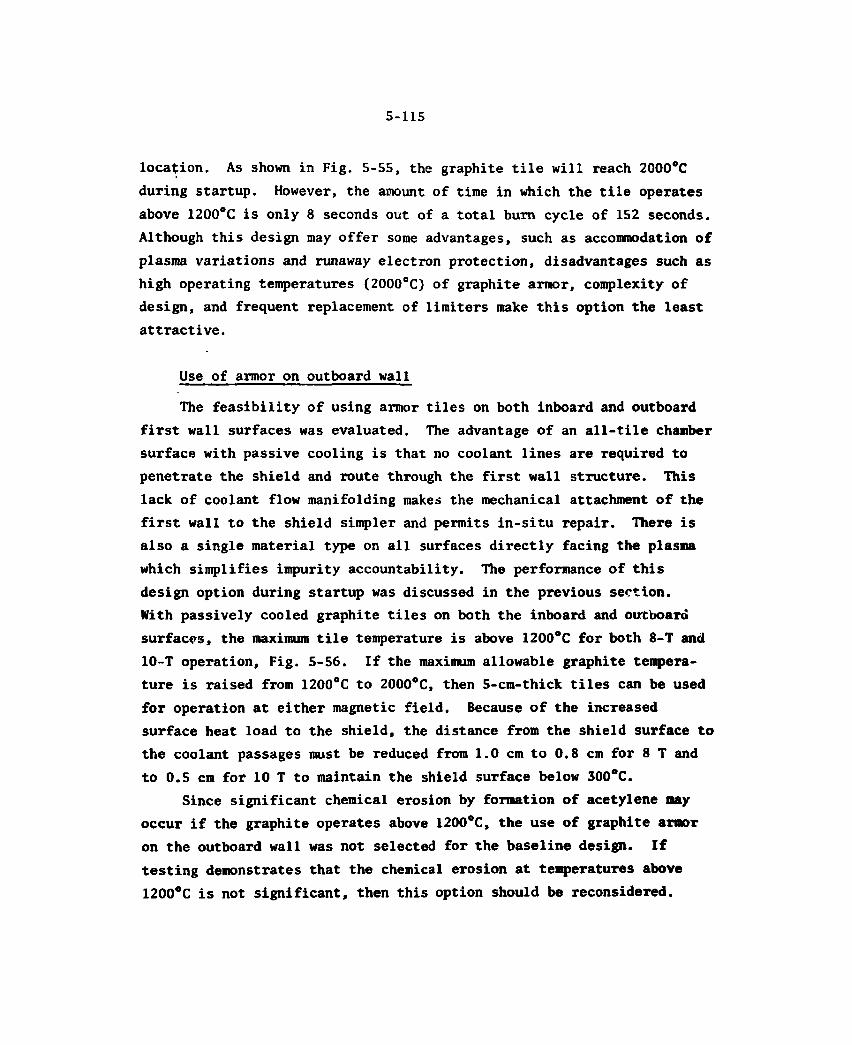
5-115
location. As shown in Fig. 5-55, the graphite tile will reach 2000°C during startup. However, the amount of time in which the tile operates above 1200°C is only 8 seconds out of a total burn cycle of 152 seconds. Although this design may offer some advantages, such as accommodation of plasma variations and runaway electron protection, disadvantages such as high operating temperatures (2000°C) of graphite armor, complexity of design, and frequent replacement of limiters make this option the least attractive.
Use of armor on outboard wall
The feasibility of using armor tiles on both inboard and outboard first wall surfaces was evaluated. The advantage of an all-tile chamber surface with passive cooling is that no coolant lines are required to penetrate the shield and route through the first wall structure. This lack of coolant flow manifolding makes the mechanical attachment of the first wall to the shield simpler and permits in-situ repair. There is also a single material type on all surfaces directly facing the plasma which simplifies impurity accountability. The performance of this design option during startup was discussed in the previous section. With passively cooled graphite tiles on both the inboard and outboard surfaces, the maximum tile temperature is above 1200°C for both 8-T and 10-T operation, Fig. 5-56. If the maximum allowable graphite tempera-ture is raised from 1200°C to 2000°C, then 5-cm-thick tiles can be used for operation at either magnetic field. Because of the increased surface heat load to the shield, the distance from the shield surface to the coolant passages must be reduced from 1.0 cm to 0.8 cm for 8 T and to 0.5 cm for 10 T to maintain the shield surface below 300°C.
Since significant chemical erosion by formation of acetylene may occur if the graphite operates above 1200°C, the use of graphite armor on the outboard wall was not selected for the baseline design. If testing demonstrates that the chemical erosion at temperatures above 1200°C is not significant, then this option should be reconsidered.
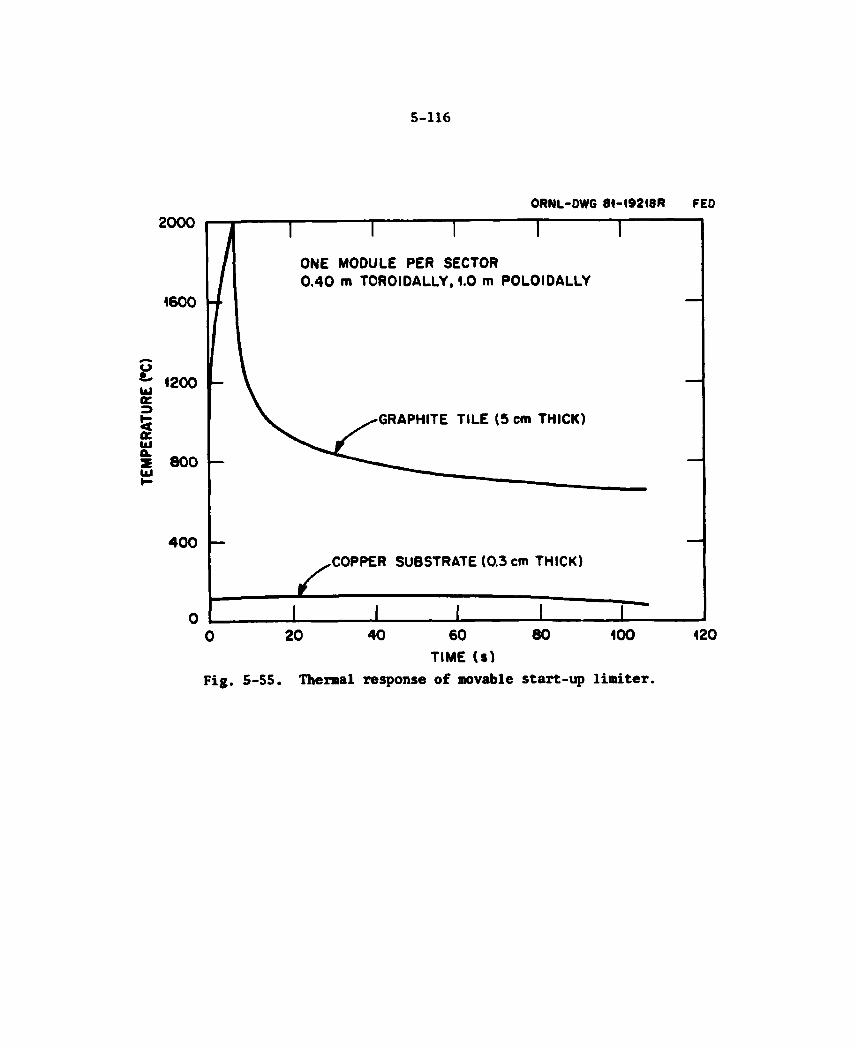
5-116
ORNL-DWG 81-19218R FED
TIME (S) Fig. 5-55. Thermal response of movable start-up limiter.
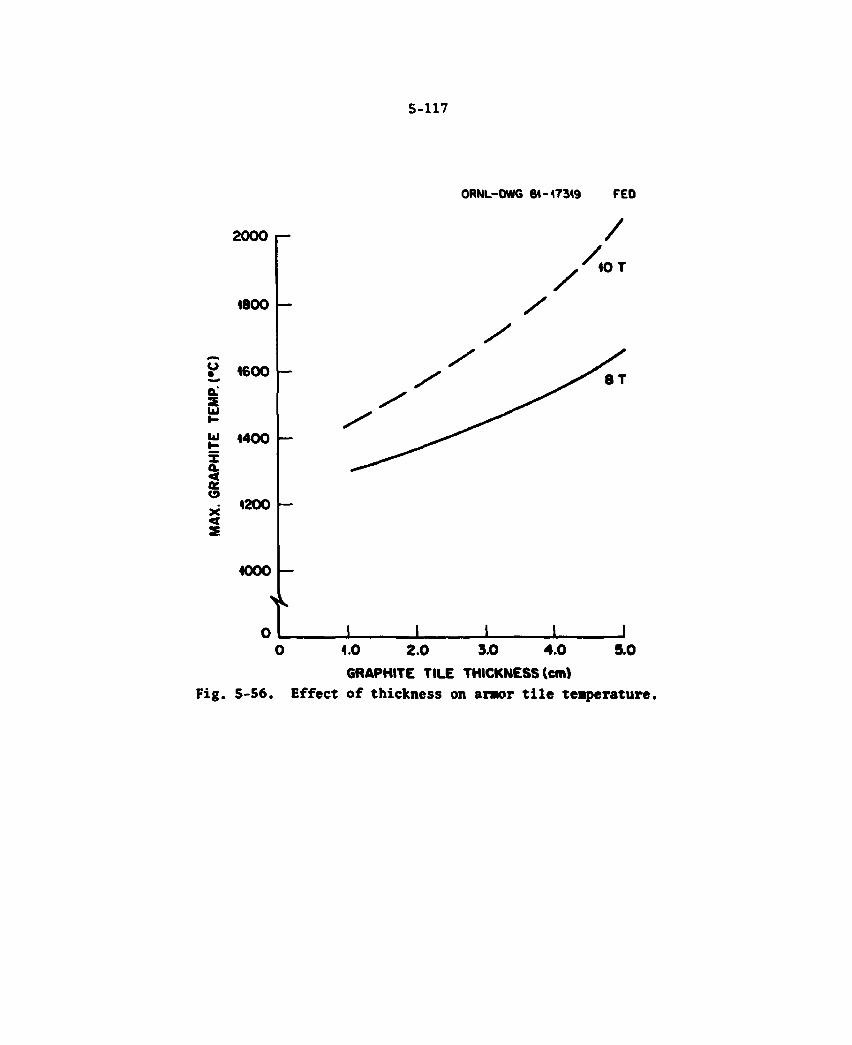
5-117
2000
1800
£ 1600 a: s UJ
w 4400
a. < ac ( 9 X < 3E
1200
1000
ORNL-DWG 84-47349 FED
/
1 _L 5.0
Fig. 5-56.
1.0 2.0 3.0 4.0 GRAPHITE TILE THICKNESS (em)
Effect of thickness on armor t i l e temperature.

5-118
Bare stainless steel inboard wall
An option for the FED inboard wall design is to use bare stainless steel panels or only the bare stainless steel shield surface in place of the graphite armor tiles. However, there are indications that a stainless steel inboard wall structure will have a limited life because of the erosion caused by melting and vaporization during disruptions. The range of plasma disruption parameters shown in Table 5-4 was used to perform sensitivity studies for the thickness of stainless steel melted and vaporized during the FED ten-year life. Results are summarized in Fig. 5-57 for four cases. The nominal case represents the erosion calculated using nominal disruption parameter values. The "best" case represents the thickness eroded for parameter values that minimize erosion. The "worst" case represents erosion for parameters that maximize erosion. The design case erosion was chosen as the erosion at nominal parameter values plus the root-sum-square of the maximum increase in erosion due to changing each parameter.
The stainless steel inboard wall structure will last the entire FED life for only the "best" case condition. Using the nominal values and assuming that only 4% of the melt layer is removed, the stainless steel structure will require replacement before the end of the FED life. For the design case erosion, the thickness of stainless steel vaporized (even assuming none of the material melted is removed) will limit the life of the sector to about two years. Since replacement of either the stainless steel inboard wall structure or the entire sector would be required, this approach was judged as unacceptable, and graphite armor tiles were chosen as the baseline design.
5.3.5 Future Work - First Wall
Future work for first wall water cooled panels and armor components includes many challenges. Specific analyses which should be performed include more detailed structural analyses of first wall water cooled concepts (e.g., finite element analyses). Additionally, effects of dynamic loads from seismic events and plasma disruptions should be
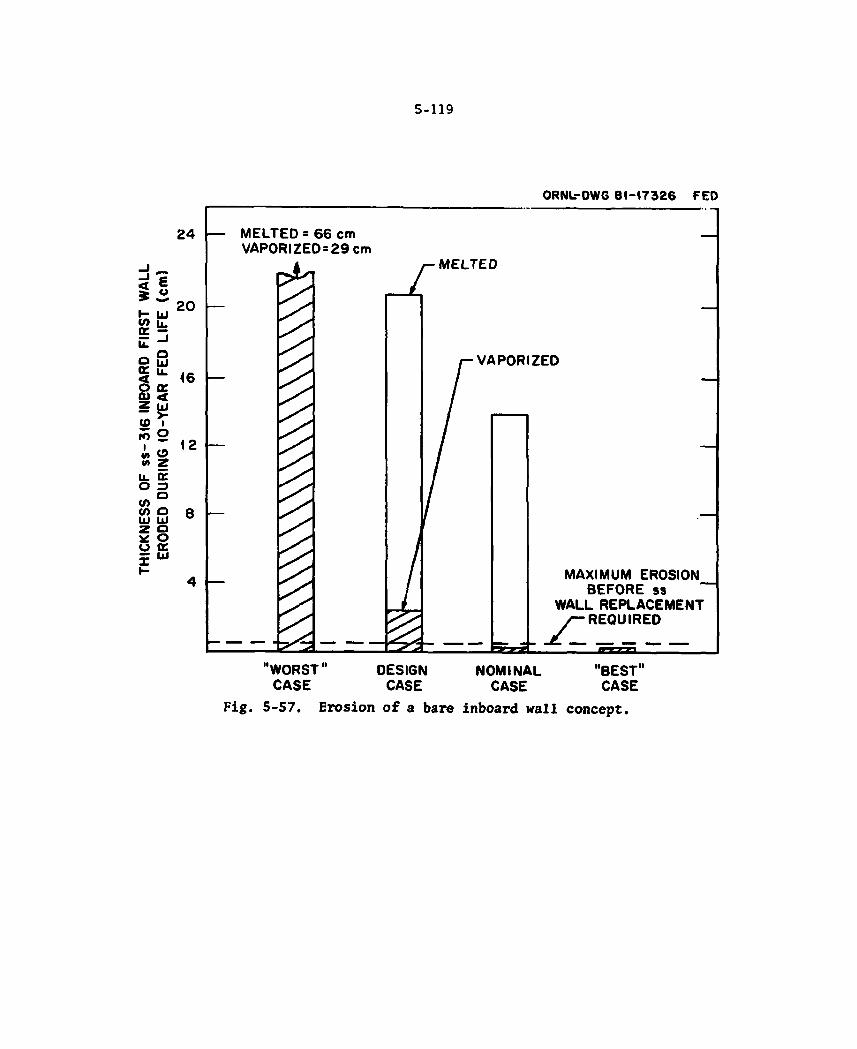
5-119
ORNL-DWG 81-17326 FED
24
20
16
12
8
MELTED - 66 cm VAPORIZED = 29 cm
r MELTED
VAPORIZED
MAXIMUM EROSION BEFORE ss
WALL REPLACEMENT REQUIRED ^ / — R E Q U I R E D
"WORST" CASE
DESIGN CASE
NOMINAL CASE
"BEST" CASE
Fig. 5-57. Erosion of a bare inboard wall concept.

5-120
further evaluated. Outboard panel attachment concepts deserve addi-tional work. This is particularly true with regard to the large electrical current flows during a disruption. Efforts should be directed toward defining time-dependent material properties as a function of operating conditions defined for the device. This could then be integrated into the structural analyses to provide a better basis for cyclic fatigue analysis and allowable stresses.
In addition to specific analyses, the whole question of erosion and redeposition of material on first wall components remains an ir.iportant issue. Definition of the environments should be pursued from a physics standpoint. Additionally, further definition of chemical erosion phenomena and melt layer response during disruption are critical issues which need to be pursued.
5.4 MECHANICAL PUMP LIMITER
The current FED baseline design includes a mechanical pump limiter. The purpose of the limiter is to establish the plasma edge and provide a mechanism to remove helium ash and hydrogen particles from the plasma. Because of high particle fluxes during normal operation and intense heating during plasma disruptions, the limiter surface may experience relatively large erosion rates. Calculations indicate that the limiter life is very sensitive to plasma edge conditions.
The baseline configuration incorporates a full toroidal belt pump limiter at the bottom of the vacuum chamber, as shown in Fig. 5-58. It is part of an interacting system of first wall components and bears the brunt of the plasma environment. The bottom location was selected for the following reasons:
1. The limiter blade is separate from the vacuum duct and is, there-fore, relatively easy to replace during maintenance.
2. The geometry results in a minimum effect on outboard wall area and outboard shield volume.
3. The plasma radial location is easier to adjust relative to limiter leading edge.
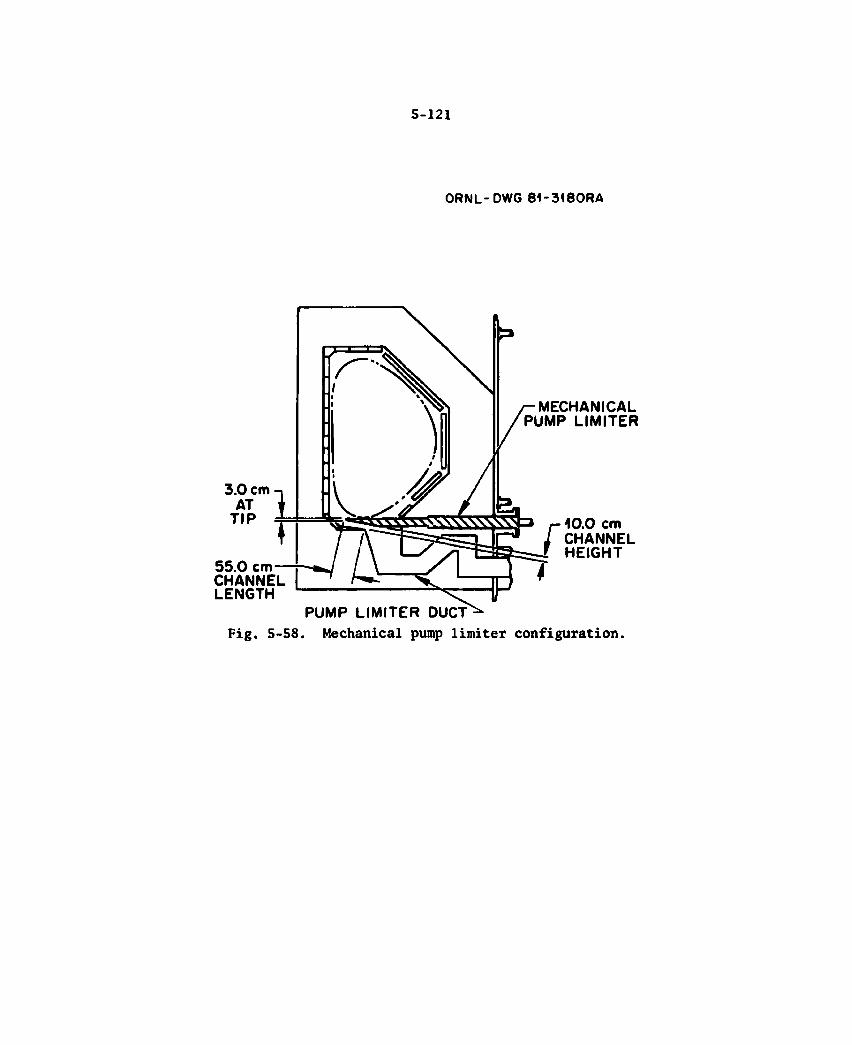
5-121
ORNL-DWG 8 1 - 3 1 8 0 R A
55.0 cm CHANNEL LENGTH
MECHANICAL PUMP LIMITER
10.0 cm CHANNEL HEIGHT
PUMP LIMITER DUCT Fig. 5-58. Mechanical pump limiter configuration.
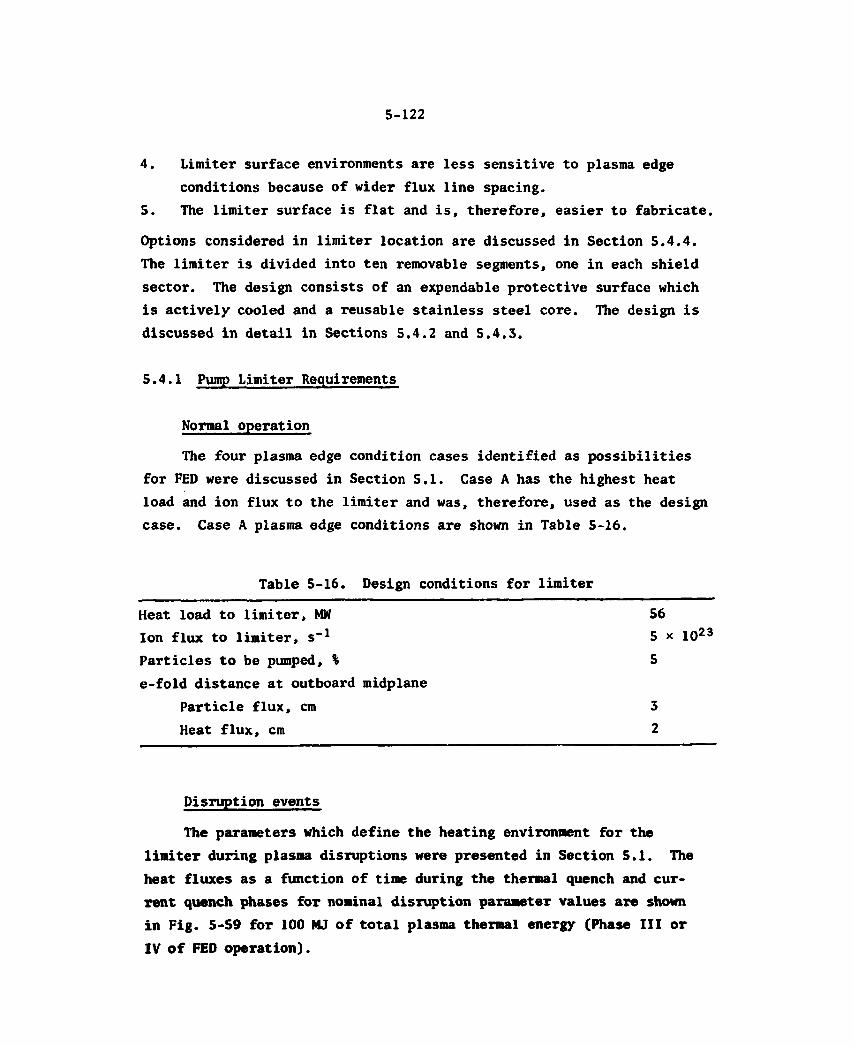
5-122
4. Limiter surface environments are less sensitive to plasma edge conditions because of wider flux line spacing.
5. The limiter surface is flat and is, therefore, easier to fabricate.
Options considered in limiter location are discussed in Section 5.4.4. The limiter is divided into ten removable segments, one in each shield sector. The design consists of an expendable protective surface which is actively cooled and a reusable stainless steel core. The design is discussed in detail in Sections 5.4.2 and 5.4.3.
5.4.1 Pump Limiter Requirements
Normal operation
The four plasma edge condition cases identified as possibilities for FED were discussed in Section 5.1. Case A has the highest heat load and ion flux to the limiter and was, therefore, used as the design case. Case A plasma edge conditions are shown in Table 5-16.
Table 5-16. Design conditions for limiter
Heat load to limiter, MW 56 Ion flux to limiter, s"1 5 x 10²³
Particles to be pumped, % 5 e-fold distance at outboard midplane
Particle flux, cm 3 Heat flux, cm 2
Disruption events
The parameters which define the heating environment for the limiter during plasma disruptions were presented in Section 5.1. The heat fluxes as a function of time during the thermal quench and cur-rent quench phases for nominal disruption parameter values are shown in Fig. 5-59 for 100 MJ of total plasma thermal energy (Phase III or IV of FED operation).
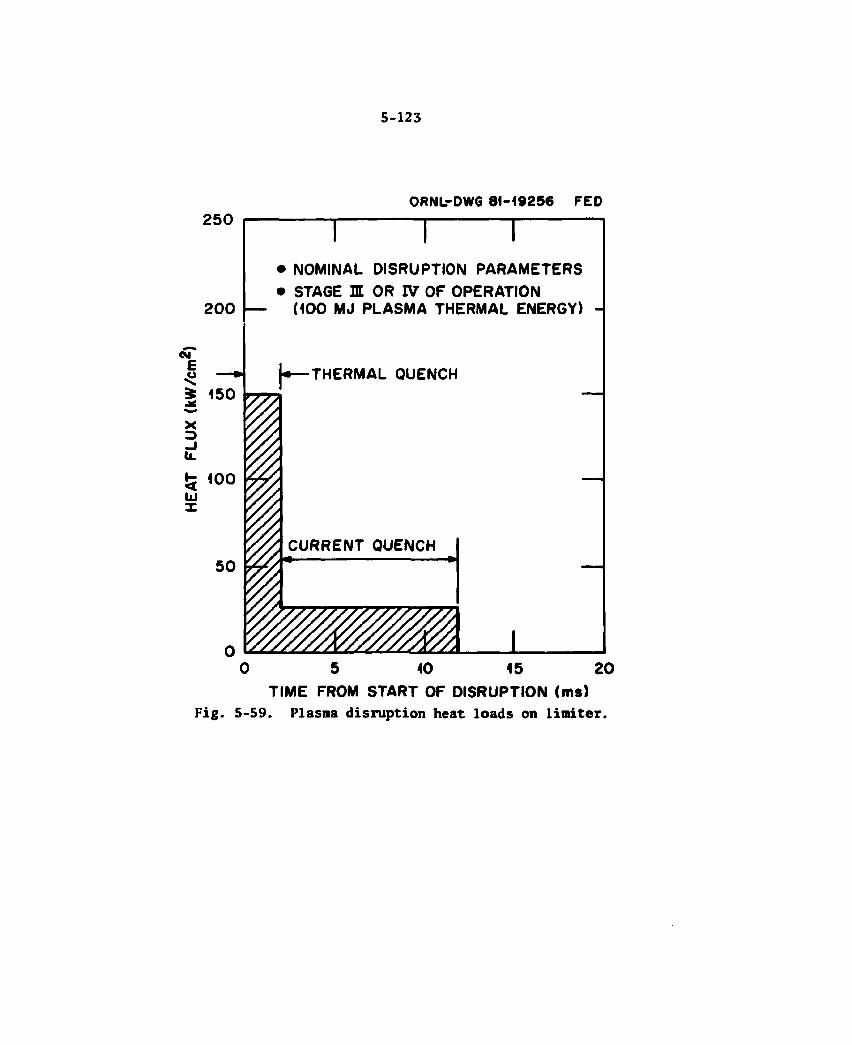
5-123
2 5 0
200 —
CM E o £ 150
x 3
< UJ X
100
5 0
ORNL-DWG 81-19256 FEO
NOMINAL DISRUPTION PARAMETERS STAGE I t OR IV OF OPERATION (100 MJ PLASMA THERMAL ENERGY)
•THERMAL QUENCH
CURRENT QUENCH
Fig.
0 5 10 15 2 0 TIME FROM START OF DISRUPTION (ms)
5-59. Plasma disruption heat loads on limiteT.

5-124
Guidelines
Because design analyses indicate that the limiter life may be short, ease of accessibility and maintainability were key considerations in evaluating limiter designs. The design should permit removal and replacement of the limiter without removing the sectors.
Another guideline for the limiter design was the need to provide toroidal electrical continuity to avoid arcing between adjacent limiter modules and to reduce electromagnetic loads during disruptions. A con-ceptual approach to providing electrical contact between the adjacent limiter modules is presented in Section 5.4.2.
5.4.2 Pump Limiter Baseline Description
The limiter is divided into ten removable segments, one in each shield sector. The line of tangency between the plasma and the top surface of the limiter is 36 cm from the limiter tip. Mechanical seals are used at interfaces, i.e., limiter-to-shield and coolant manifold connections, to facilitate limiter replacement.
Limiter configuration
The configuration of a limiter segment is shown in Fig. 5-60. Each segment is approximately 4.0 m in length (radially), 3.6 m in width (toroidally), and 0.4 m high. The two major components of the limiter are: (1) an expendable protective surface which consists of graphite tiles attached to an actively cooled copper substrate and (2) an actively cooled stainless steel core which is reusable.
Graphite tiles brazed to a copper substrate were selected as the baseline system for the expendable protective surface after several different material combinations had been evaluated (Section 5.4.4). Graphite and copper were selected because of the low atomic number (low Z) and good resistance to thermal shock of graphite, the high thermal conductivity of copper, and the potential for reliable brazing of graphite to copper.

5-125
As shown in Fig. 5-60, the major part of the assembly is reusable. The stainless steel core weighs approximately 25,000 kg, and the expendable surface weighs approximately 660 kg.
The coolant manifold system is shown in Fig. 5-61. It includes a 15-cm dia. inlet line, which is a header for nine smaller 5.5-cm dia. inlets. These inlets distribute cooling water into the integral coolant passages of the expendable protective surface, which provides cooling across the lower surface, around the limiter tip, and across the upper surface. The outlet manifolding is similar to the inlet. The maximum operating pressure of the system is 1 MPa (150 psi).
The nine inlet and outlet lines contain replaceable weld couplings between the expendable and reusable portions which are cut and replaced with new couplings when installing a new protective surface. These disconnects are located approximately 40 cm inside the shield such that they are protected from neutron bombardment. The replace-able couplings are required to accommodate tolerances between compon-ents and eliminate individual cutting and fitting of lines when installing a new protective surface.
The limiter design features integral structural attachments between the expendable protective surface and the reusable core structure, as shown in Fig. 5-62. A "captive rail" concept is used on the upper surface, and locator pins which engage slotted holes are used on the lower surface. These attachments are required to react the out-of-plane electromagnetic load caused by disruptions. Bolts restrain the expendable portion in the radial direction.
Expendable protective surface The fabrication techniques for the expendable protective surface
are indicated in Fig. 5-63. Both the upper and lower surfaces of the metal substrate are water cooled panels. The panels are fabricated by machining the coolant passages into the inner skin of the panel, which is then electron beam welded to machined copper fittings at the blade tip. Webs are welded between the panels at the edges to complete the substrate assembly. For the design coolant pressure of 1 MPa
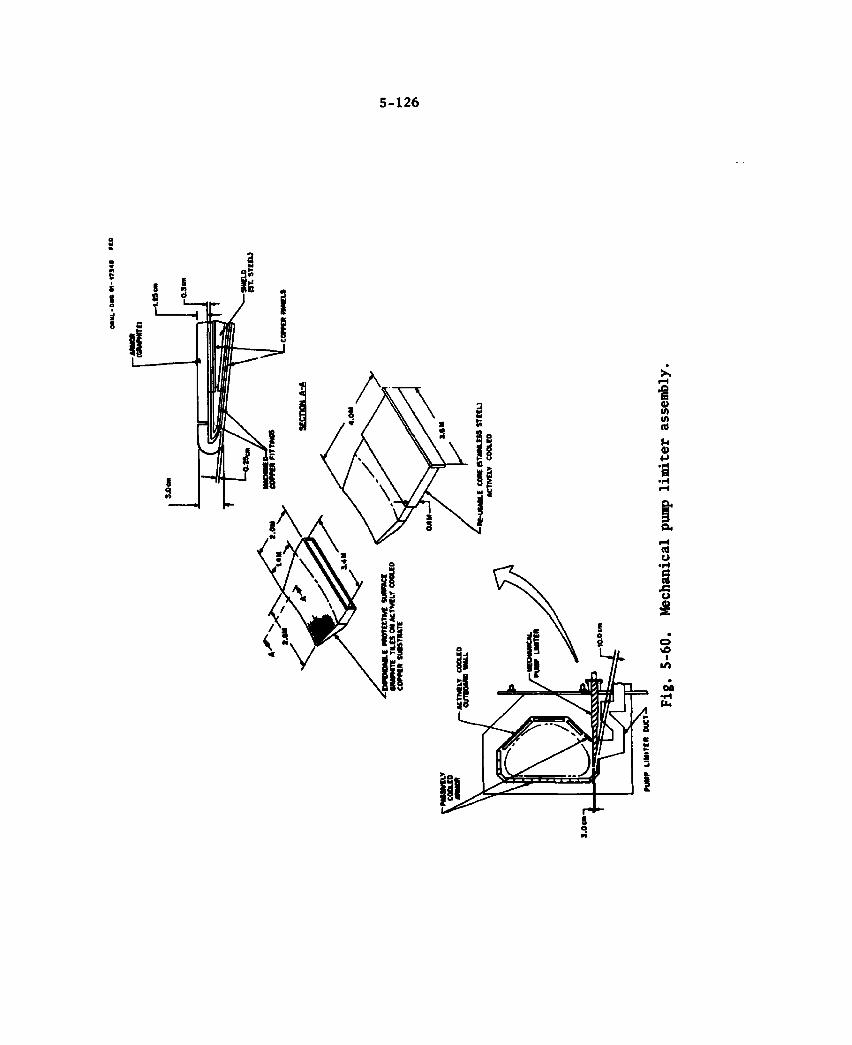
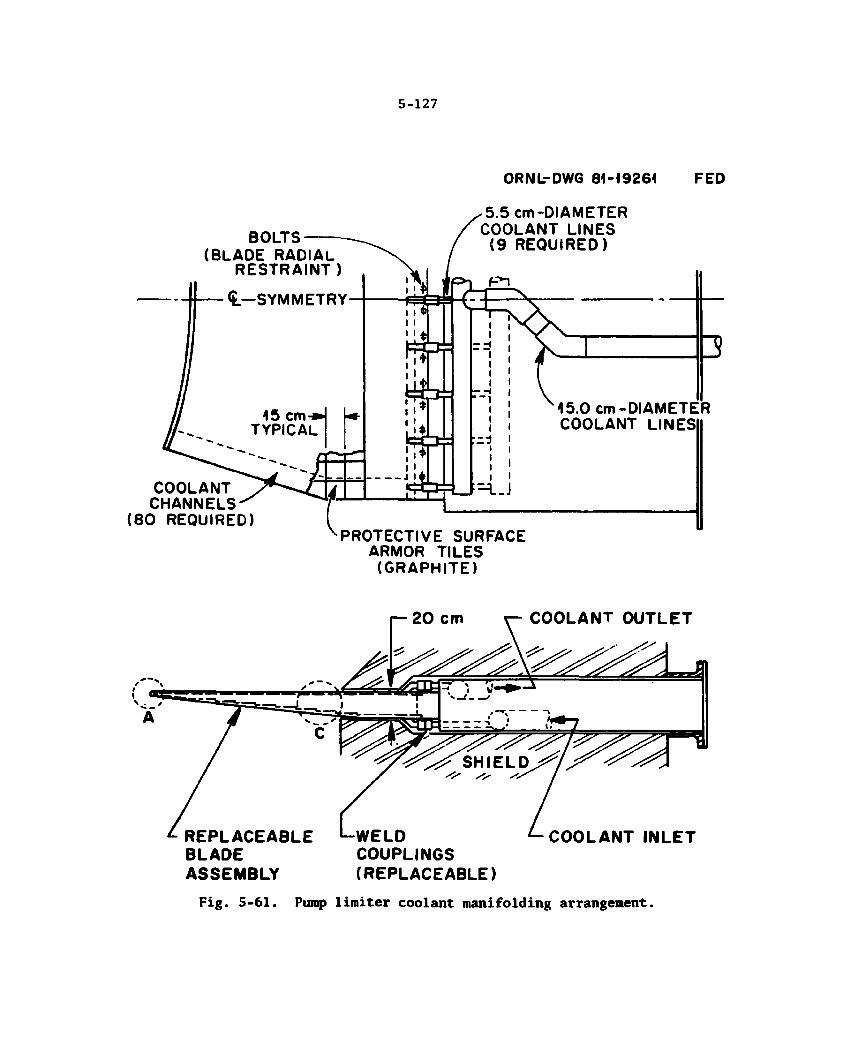
5-127
ORNL-DWG 81-19264 FED
BOLTS (BLADE RADIAL
R E S T R A I N T )
5 .5 cm-DIAMETER COOLANT LINES
( 9 REQUIRED)
COOLANT CHANNELS
( 8 0 REQUIRED) PROTECTIVE SURFACE
ARMOR TILES ( G R A P H I T E )
i— 2 0 cm C O O L A N T O U T L E T
R E P L A C E A B L E B L A D E A S S E M B L Y
W E L D COUPLINGS ( R E P L A C E A B L E )
C O O L A N T I N L E T
Fig. 5-61. Pump limiter coolant manifolding arrangement.
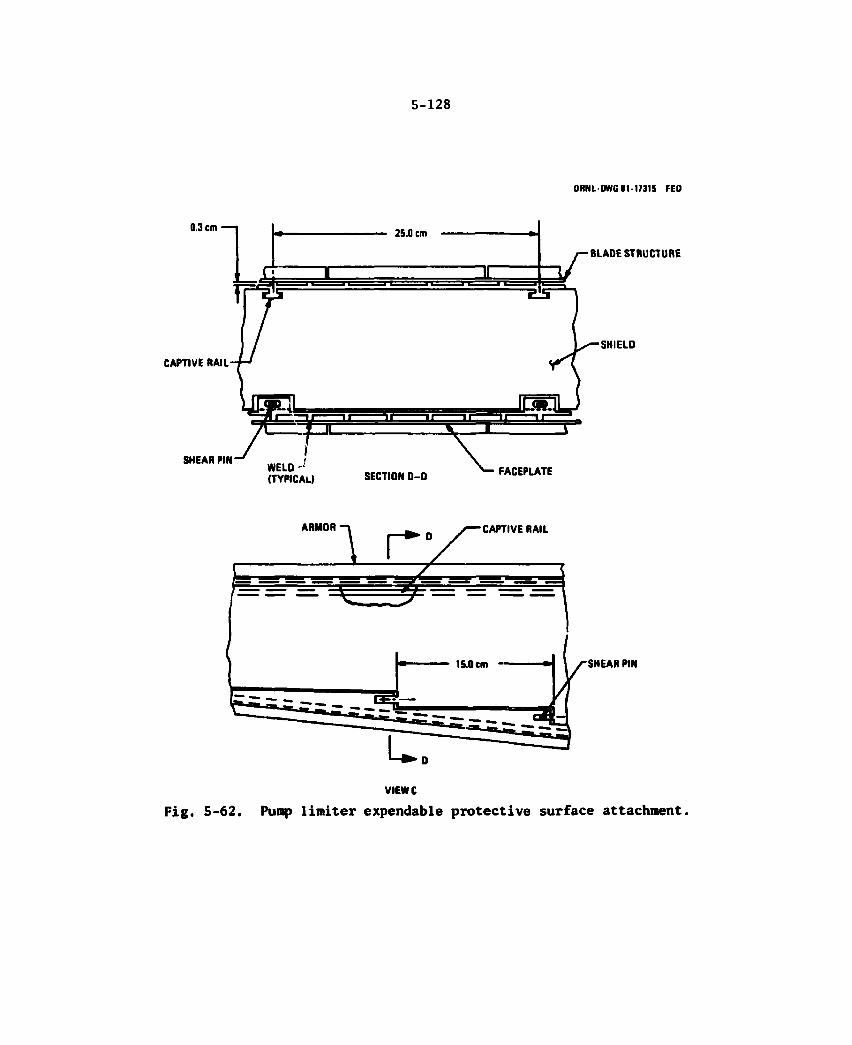
5-128
ORNL-DWG 81-17315 FED
VIEWC
Fig. 5-62. Pump limiter expendable protective surface attachment.
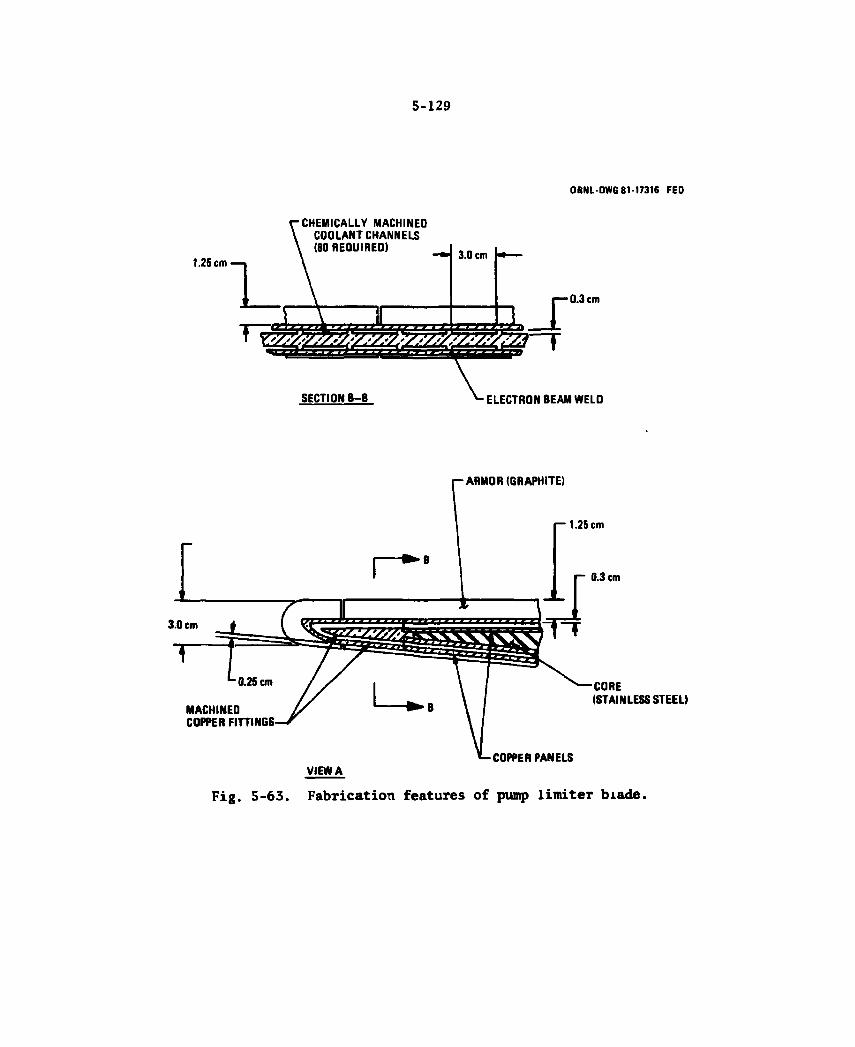
5-129
ORNL-DWG 81-17316 FED
Fig. 5-63. Fabrication features of pump limiter biade.

5-130
(150 psi), a rib spacing of 3 cm results in a bending stress of 50 MPa (7 ksi) in the 0.3-cm-thick copper plate. Optimization of the design for combined pressure and thermal stresses and establishment of firm design criteria for these components remains to be accomplished.
The graphite surface armor tiles are brazed to the copper substrate upper and lower surfaces. The technique for brazing is described in Fig. 5-64.
Reusable core
The reusable core structure provides support for the expendable protective surface and facilitates the structural attachment between the limiter and the shield. Construction details of the core will be similar to the shield, as shown in Section 5.2. The material is Nitronic 33, and the core is water cooled. The core structure carries the out-of-plane disruption loads to the shield sector where the loads are reacted. Maximum bending stresses in the 20-cm-deep steel core are approximately 70 MPa (10 ksi) for the presently defined 30-psi dynamic load, treated as a static load.
Electrical contacts
Electrical contact between adjacent limiter segments is required to achieve a toroidal current path around the entire limiter. This is accomplished by metal bellows with Ag/Mo bus plates located between the adjacent limiter segments, as shown in Fig. 5-65. During machine operation, the bellows are hydraulically pressurized using the water coolant. The preferred bellows design is a welded configuration made up of disc elements. This allows the bellows to be shorter in length than a formed convoluted bellows. The bellows material is stainless steel. The bellows contain an internal copper conductor to carry the current load. The contact area and bellows dimensions required will be a function of the current carried and the mechanical operating requirements. Nhen removal of the limiter is required, a vacuum system is used to retract the bellows.
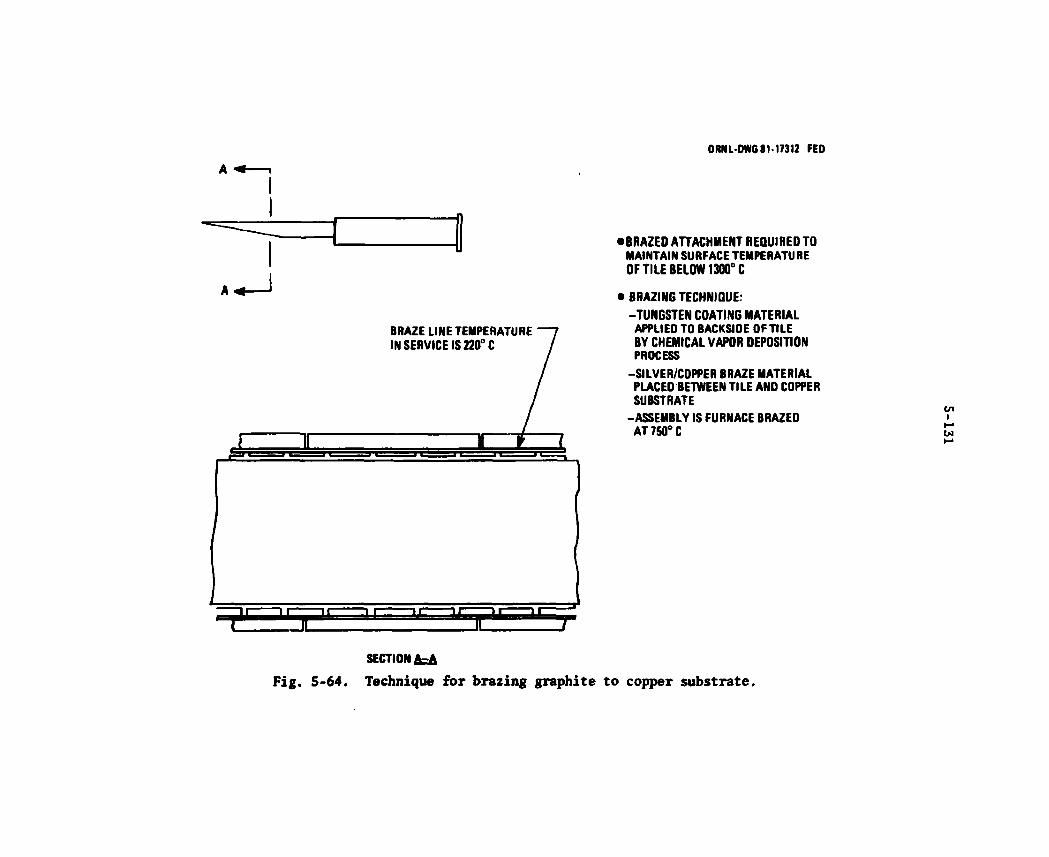
ORNL OWG 81-17312 FED
BRAZE LINE TEMPERATURE IN SERVICE IS 220° C
• BRAZED ATTACHMENT REQUIRED TO MAINTAIN SURFACE TEMPERATURE OF TILE BELOW 1300° C
• BRAZING TECHNIQUE:
-TUNGSTEN COATING MATERIAL APPLIED TO BACKSIDE OF TILE BY CHEMICAL VAPOR DEPOSITION PROCESS -SILVER/COPPER BRAZE MATERIAL PLACED BETWEEN TILE AND COPPER SUBSTRATE -ASSEMBLY IS FURNACE BRAZED AT 750° C
tn H-CM
i i i r JL
1 " T
SECTION A=A Fig. 5-64. Technique for brazing graphite to copper substrate.
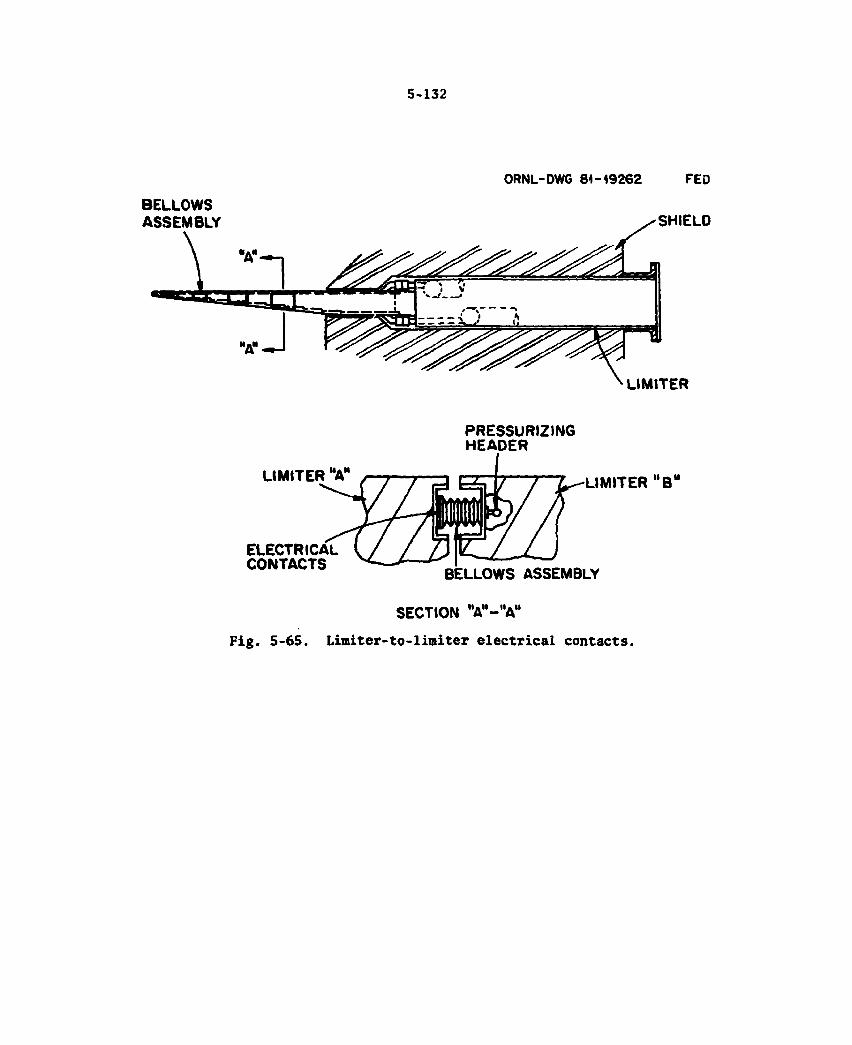
5-132
BELLOWS ASSEMBLY
ORNL-DWG 81-19262 FED
SHIELD
LIMITER
LIMITER "A"
ELECTRICAL CONTACTS
PRESSURIZING HEADER
LIMITER "B"
BELLOWS ASSEMBLY
SECTION "A"—"A"
Fig. 5-65. Limiter-to-limiter electrical contacts.

5-133
5.4.3 Pump Limiter Baseline Performance
The heat flux distributions along the limiter surface were required to evaluate the performance of the limiter coolant flow system and to define material thickness limits based on maximum temperature and/or thermal stress limits. In addition, particle flux and energy distri-butions were required to determine the sputtering erosion of the limiter surface.
The particle flux, heat flux, and particle energy striking the limiter were assumed to decrease exponentially with distance into the scrape-off region and were calculated u~ing the following equations:3
• Q T - X / X Heat flux: q = . ' e Q sin 0 o Q
^ T - X / X Particle flux: r = 1 e ' p sin 0 o p
Energy of particles Q™ X ,, striking limiter: T = — — y c * s i n 0
2YNt AQ
where
Xq = heat flux e-fold distance Ap = particle flux e-fold distance X^ = particle energy e-fold distance x = minor radius distance from the limiter surface to the plasma
edge 6 = angle of incidence between the limiter and a poloidal flux
line
R a major radius distance to the limiter surface
Qj, = total particle transport heat load
5-134
Nj = total particle flux at edge of plasma
Y = heat transmission coefficient of the plasma sheath at limiter
As given in Table 5-16, the e-fold distances at the outboard mid-plane of the device were specified as 2.0 cm for Aq, 3.0 cm for A^, and 6.0 cm for A .. These e-fold distances were assumed to vary poloidally in direct proportion to the spacing of magnetic field lines. Using the field line geometry (Fig. 2-74), the e-fold distances at locations along the limiter surface were found to be a factor of 2 to 4.5 times greater than those at the midplane.
Calculated heat flux, particle flux, and particle energy distribu-tions for the baseline pump limiter configuration are shown in Fig. 5-66. The maximum heat flux is 240 N/cm2. The maximum particle flux is 2.0 x 10¹⁸/s — cm2. The energies of the particles striking the liaiter vary from 520 eV at the plasma tangency point to 220 eV at the leading edge. The leading edge has been located such that 6% of the total particle flux at the plasma edge passes through a 10-cm-deep slot below the limiter.
Thermal response
A two-dimensional finite difference thermal model of the limiter was used to determine the transient temperature distribution throughout the limiter. The model includes two-dimensional conduction within the lisiter, convection cooling to the water, and radiation from the limiter surfaces to the outboard stainless steel panels, inboard armor tiles, and shield surface under the limiter. Surface heating caused by charged particle impingement (shown in Fig. 5-66), charge-exchange neutral particle impingement (10 W/cm2 § 8 T) and radiation fror the plasma (2 If/cm2 e 8 T) were included in the model. Neutronic heating of 2.8 If/cm3 « 8 T for the graphite tiles and 4.0 W/ce3 § 8 T for the copper structure was also applied.
Based on an upper temperature limit of 1200°C for the graphite surface, the maximum tile thickness was determined to be 1.25 cm. Maximum temperatures for the limiter with 1.25-cm-thick graphite tiles
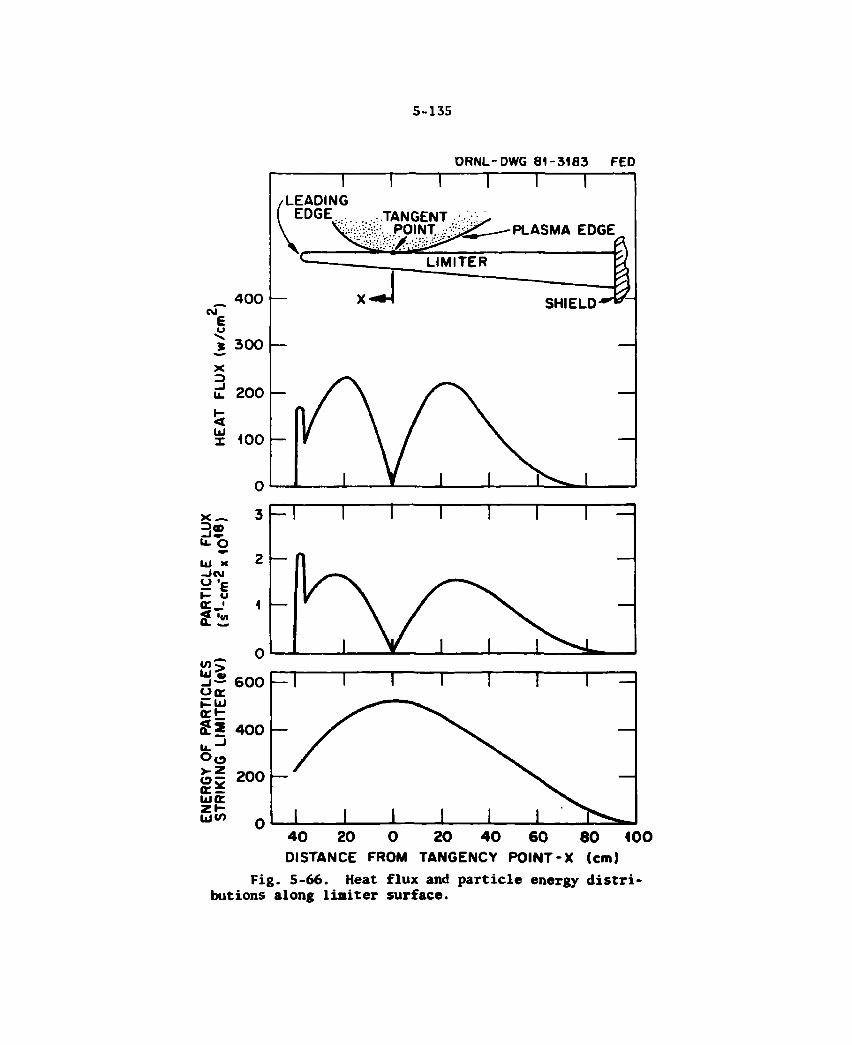
5-135
ORNL-DWG 81-3183 FED
'LEADING EDGE TANGENT
POINT PLASMA EDGE
„ 400 C\J E
<_>
j 300
SHIELD'
4 0 20 DISTANCE
20 4 0 6 0 8 0 400 TANGENCY POINT-X (cm)
Fig. 5-66. Heat flux and particle energy distri-butions along limiter surface.
5-136
are shown in Fig. 5-67. The copper substrate aaxlnua temperature is maintained below 210°C. Maximum teaperatures of the graphite surface exposed to the plasma range from 200 to 1200"C.
Since graphite reacts with hydrogen to form methane in the temperature range between 400 and 800°C, some regions of the graphite tile will experience chemical erosion. The region operating in this range will change because of the temperature decrease as erosion occurs (due to the decreased conduction thickness fron heated surface to coolant) and also because of the transient variations during each burn. Both of these variations are shown in Fig. S-6S for three points on the limiter surface. Point A (plasma tangency point) operates below the methane generation range at all times. Point C (point of maximum heat flux on the flat surface) operates in the methane generation range only duriiig the heat-up and cool-down periods within a burn cycle. The temperature at Point B (between tangency point and point of maximum heat flux) is in or near the methane generation range for most of the operating life of the limiter.
Thermal-hydraulic analyses of the limiter water coolant system were performed. The characteristics of this coolant system are shown in Table 5-17. The maximum temperature at the coolant-structure inter-face is 165°C and occurs at the downstream end of the leading edge. The saturation pressure for water at 165°C is 0.70 MPa (102 psi). The frictional pressure drop from the inlet of the limiter to the down-stream end of the leading edge is 0.11 MPa (15 psi). [The frictional pressure drop through the remainder of the limiter flow system is 0.17 MPa (25 psi), which results in a total pressure drop in the limiter coolant flow system of 0.28 MPa (40 psi).] To inhibit subcooled boiling at the leading edge, the inlet pressure must be greater than 0.70 + 0.11 = 0.81 MPa (117 psi). The inlet pressure was selected as 1.03 MPa (150 psi), which leaves a 0.22-MPa (33 psi) margin above the pressure required to inhibit boiling. This pressure margin corresponds to an allowance for a 10°C increase in the coolant-structure interface temperature without the occurrence of subcooled boiling.
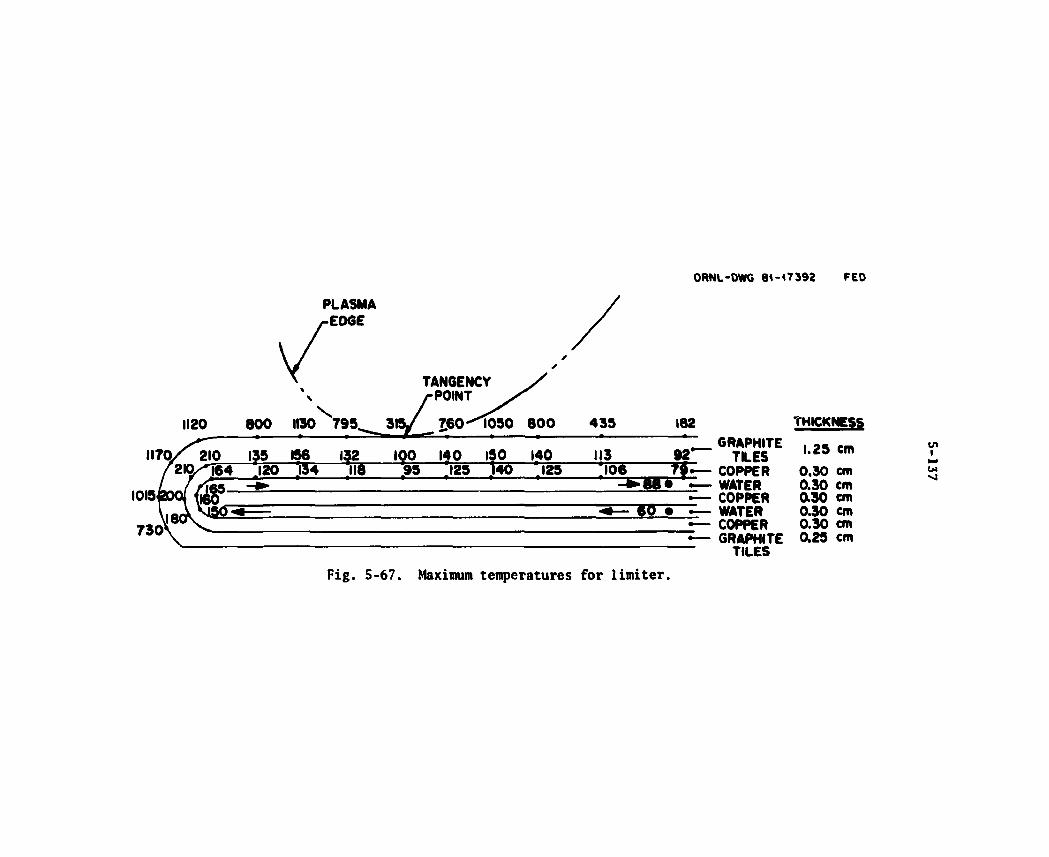
ORNU-DWG 8<-<7392 FEO
PLASMA EDGE
1120 800 1 1 3 0 ^ 7 9 5 . / 3 I Y _ IJ
TANGENCY POINT
760—1090 800 4 35 182
156 120 134
l?2 IpO 118 .95
~ GRAPHITE 140 ISO 140 113 9 2 T L E S 1125 U O J 2 5 .106 COPPER
- » . B B « — • WATER R ~ COPPER
W T - WATER R— COPPER
THICKNESS 1.25 cm
0.30 cm 0.30 cm 0.30 cm 0.30 cm 0.30 cm
GRAPHITE 0 .25 cm TILES
Fig. 5-67. Maximum temperatures for limiter.
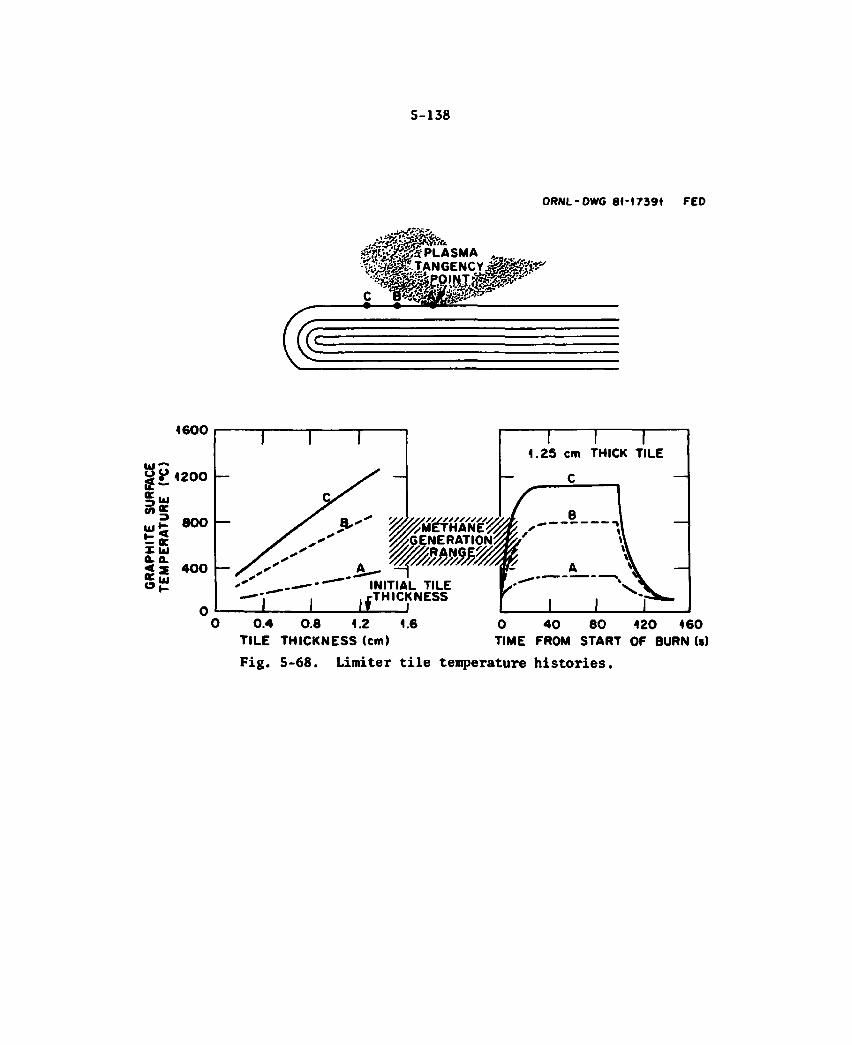
5-138
ORNL-DWG 8M7391 FED
1600 i — r
IK 1* X Ul a. a. K QJ e> !r
4 2 0 0
800
4 0 0
1 INITIAL TILE
, RTHICKNESS
0.4 0.8 1.2 1.6 0 4 0 8 0 120 160 TILE THICKNESS (cm) TIME FROM START OF BURN (s)
Fig. 5-68. Limiter tile temperature histories.
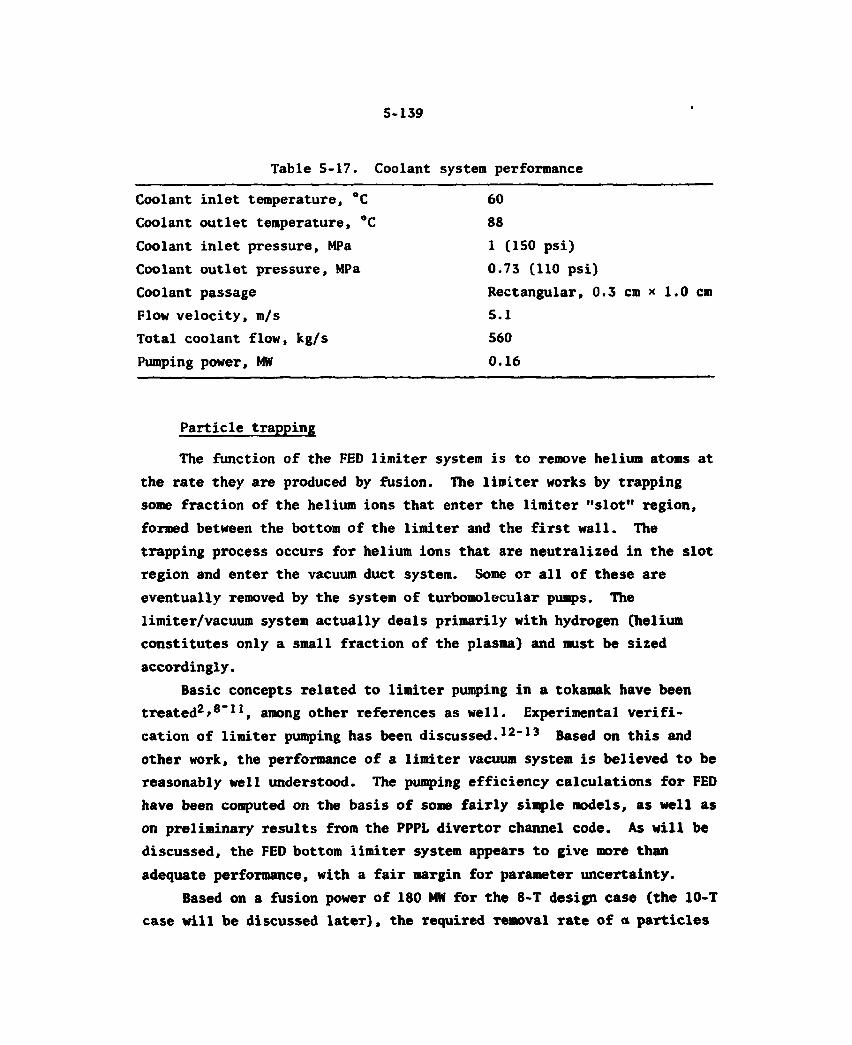
5-139
Table 5-17. Coolant system performance
Coolant inlet temperature, °C Coolant outlet temperature, °C Coolant inlet pressure, MPa Coolant outlet pressure, MPa Coolant passage Flow velocity, m/s Total coolant flow, kg/s Pumping power, MW
60 88
1 (150 psi) 0.73 (110 psi) Rectangular, 0.3 cm * 1.0 cm 5.1 560 0.16
Particle trapping
The function of the FED limiter system is to remove helium atoms at the rate they are produced by fusion. The limiter works by trapping some fraction of the helium ions that enter the limiter "slot" region, formed between the bottom of the limiter and the first wall. The trapping process occurs for helium ions that are neutralized in the slot region and enter the vacuum duct system. Some or all of these are eventually removed by the system of turbomolecular pumps. The limiter/vacuum system actually deals primarily with hydrogen (helium constitutes only a small fraction of the plasma) and must be sized accordingly.
Basic concepts related to limiter pumping in a tokamak have been treated2*8"11, among other references as well. Experimental verifi-cation of limiter pumping has been discussed.12-13 Based on this and other work, the performance of a limiter vacuum system is believed to be reasonably well understood. The pumping efficiency calculations for FED have been computed on the basis of some fairly simple models, as well as on preliminary results from the PPPL divertor channel code. As will be discussed, the FED bottom limiter system appears to give more than adequate performance, with a fair margin for parameter uncertainty.
Based on a fusion power of 180 MW for the 8-T design case (the 10-T case will be discussed later), the required Temoval rate of a particles
5-140
is I = 6.4 x 10¹⁹ s The reference DT particle outflow at the edge o T^yrAL
of the plasma ( J ^ ) = 5 x 10²³ s _ 1, nearly all of which is assumed to impinge on the limiter. Based on the limiter geometry, the particle e-folding distance of 12 cm, and on the assumption of obtaining a proper flux contour equilibrium, 6% of the plasma outflow (fgjot) will enter the limiter slot region. The ratio of helium to hydrogen in the plasma outflow will depend on the relative transport processes in the plasma region, as well as on the removal efficiency of the limiter itself and is uncertain at this time. However, if the helium concentra-tion of the plasma outflow (f$a) is as little as 1% of the total, then the rate at which helium enters the limiter slot is:
J s l 0 t = 0 f . , J ™ T A L = 3.0 x 10²⁰ s"1 ot a slot DT
Comparing this rate to the required removal rate then gives an estimate of the minimum required removal efficiency of the limiter:
MIN la n e = — = — - = 0.21 a j s* o t
a
Therefore, a helium removal efficiency of only about 20% would be sufficient to maintain a long burn pulse. This requirement would be even less for higher concentrations of helium in the plasma out-flux but would increase if the total plasma outflux were lower, which in fact would be desirable from the standpoint of erosion. As will be dis-cussed, the pumping efficiency for both helium and hydrogen is probably much closer to 100%, thereby providing a fair margin for uncertainty in the FED reference parameters. At this pumping efficiency, the helium concentration in the plasma would adjust itself to yield a value of J s l o t = I . a a
For the bottom limiter to work effectively, the plasma flux lines past the limiter leading edge must remain nested and concentric so that
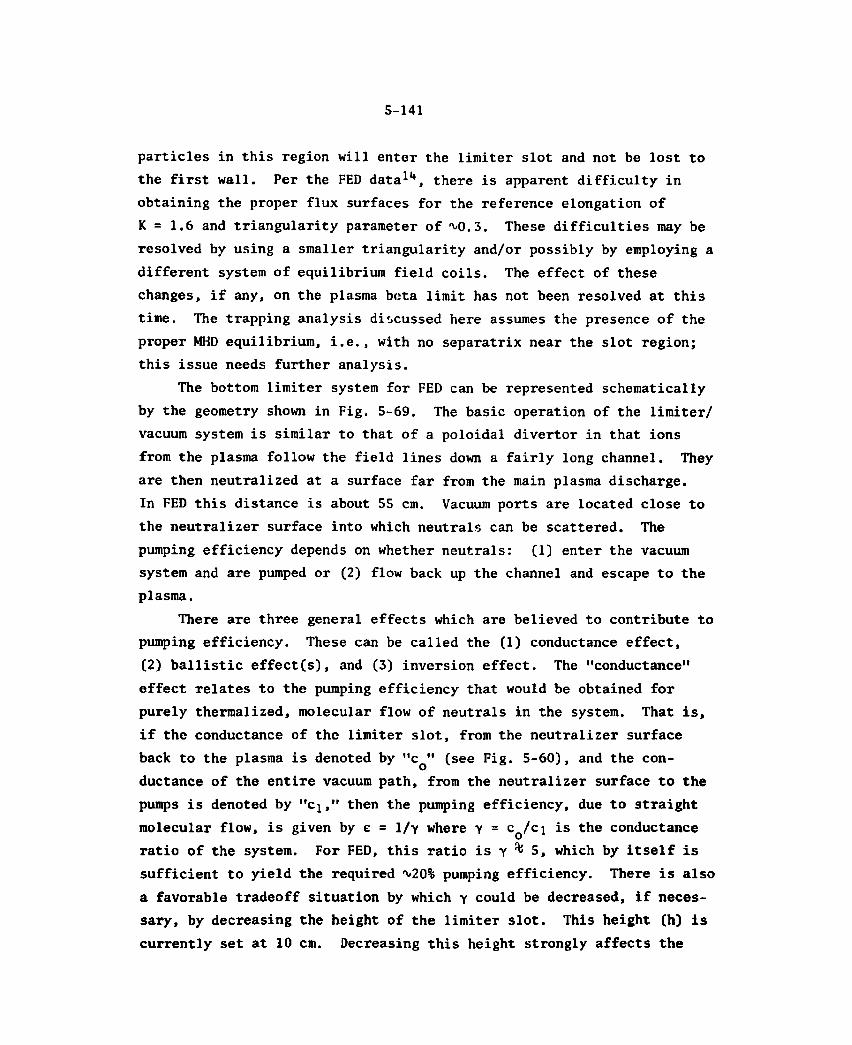
5-141
particles in this region will enter the limiter slot and not be lost to the first wall. Per the FED data1**, there is apparent difficulty in obtaining the proper flux surfaces for the reference elongation of K = 1.6 and triangularity parameter of M).3. These difficulties may be resolved by using a smaller triangularity and/or possibly by employing a different system of equilibrium field coils. The effect of these changes, if any, on the plasma beta limit has not been resolved at this time. The trapping analysis discussed here assumes the presence of the proper MHD equilibrium, i.e., with no separatrix near the slot region; this issue needs further analysis.
The bottom limiter system for FED can be represented schematically by the geometry shown in Fig. 5-69. The basic operation of the limiter/ vacuum system is similar to that of a poloidal divertor in that ions from the plasma follow the field lines down a fairly long channel. They are then neutralized at a surface far from the main plasma discharge. In FED this distance is about 55 cm. Vacuum ports are located close to the neutralizer surface into which neutrals can be scattered. The pumping efficiency depends on whether neutrals: (1) enter the vacuum system and are pumped or (2) flow back up the channel and escape to the plasma.
There are three general effects which are believed to contribute to pumping efficiency. These can be called the (1) conductance effect, (2) ballistic effect(s), and (3) inversion effect. The "conductance" effect relates to the pumping efficiency that would be obtained for purely thermalized, molecular flow of neutrals in the system. That is, if the conductance of the limiter slot, from the neutralizer surface back to the plasma is denoted by "co" (see Fig. 5-60), and the con-ductance of the entire vacuum path, from the neutralizer surface to the pumps is denoted by "ci," then the pumping efficiency, due to straight molecular flow, is given by e = 1/Y where y = cQ/ci is the conductance ratio of the system. For FED, this ratio is Y 5, which by itself is sufficient to yield the required ^20% pumping efficiency. There is also a favorable tradeoff situation by which Y could be decreased, if neces-sary, by decreasing the height of the limiter slot. This height (h) is currently set at 10 cm. Decreasing this height strongly affects the
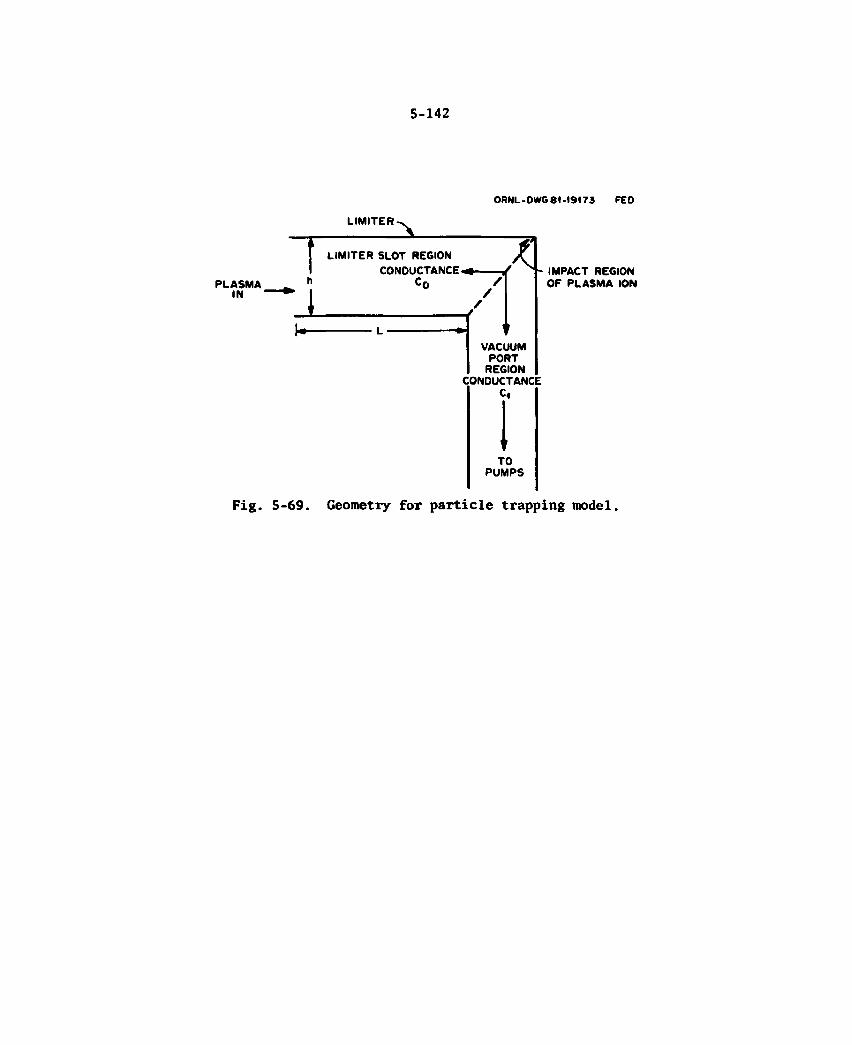
5-142
ORNL-DWG 81 -19173 FED
LIMITER
PLASMA IN
LIMITER SLOT REGION CONDUCTANCE
C0 / IMPACT REGION OF PLASMA ION
VACUUM PORT
REGION CONDUCTANCE
C,
TO PUMPS
Fig. 5-69. Geometry for particle trapping model.
5-143
slot conductance, the scaling being approximately Cq « h2 but has only a second-order effect in decreasing the fraction of particles entering the slot. This fraction scales as:
If, for example, h is decreased from 10 cm to 7 cm, the value of 1/y would approximately double, while the slot fraction would decrease by only 20%.
The "ballistic" effect refers to the fact that energetic ions having elastic collisions with the bottom surface of the limiter will retain some fraction of their energy, and their scattering angles will tend to be related to the incidence angle. Ballistic effects can help pumping efficiency in two ways: (1) neutralized particles will be preferentially scattered into the vacuum duct region and (2) elastically scattered particles contribute to a higher conductance ci.
In the existing FED limiter design, ions entering the slot region will impinge on the bottom neutralizer plate, at almost normal inci-dence. Even for a cosine distribution of reflected angles, the neutrals would have a strong tendency to enter the vacuum duct, and ballistic effects would increase this tendency even further. It has also been suggested15 that properly shaped baffles could be added to take further advantage of ballistic effects, as per the results of Hacrotor experiments13.
Finally, the "inversion" effect refers to the interaction of neutrals in the limiter slot with the incoming plasma. Such neutrals have a strong tendency to be ionized and returned (inverted) to the neutralizer plate. Neutrals are ionized by electron impact ionization. They tend to return to the plate because of momentum transfer with the incoming plasma and because of the presheath electric field.
A simple model16 treating the neutrals in the slot region by a diffusion equation and the plasma as a zero-D fluid was developed to

5-144
define the general range of the FED limiter trapping and to provide initial guidance for vacuum system definition. The pumping efficiency predicted by this model is:
_ 1 E;i 1 + Y(1 + L/X.)e"L/Xj '
where e^ is the pumping efficiency for species j, y is the conductance ratio, L is the slot length, and X^ is the mean free path in terms of linear slot length for a neutral to be ionized. The mean free path is given by:
D X = ° j N <CTV>. ' J e j
In this formula D is the neutral diffusion coefficient, N is the o e electron density, and <CTV>. is the rate coefficient for electron impact ionization of neutral species j. The diffusion coefficient is given by D = 1/A c , where A is the cross-sectional area of the limiter slot, o o The electron density is given by:
Vj_ (sin •)•.* = • < 1 0 t ) f e ,
where Vj is the flow velocity for electrons entering the slot region, 8 is the angle at which particles hit the limiter (prior to the sheath region), and f is the ratio of electrons to ions in the plasma. The © velocity, Vi, is given by:
where the square-root term is the speed of sound and the constant C s
denotes flow at some fraction of the speed of sound.

5-145
The following parameters have been used for this model in analyzing the bottom limiter pumping efficiency:
L = 0.53 m f = 1.08 e c 0 = 250 m3/s Y s 5.9 A s 3.27 m2
.slot DT = 3.0 x 10²² s"1
.slot a = 3.0 x io20 s"1
Cs = 0.5 6 = 20 deg
Te — 30 eV N e = 1.7 x lo18 m~3
<ov> a = 1.5 x io_llt m3/s < O V >DT = 2.0 x io_1<l m"3
Based on these parameters, the following results were obtained:
Mean free path:
Pumping efficiency:
D-T molecules to be pumped: Helium atoms to be pumped:
Thus, the mean free path for both helium and hydTOgen is much smaller than the slot length L = 55 cm. This suggests that all neutrals attempting to escape to the plasma will be ionized fairly quickly and returned to the original impact point. Also, the number of D-T mole-cules to be pumped, per second, is equal to one-half of the entering D-T ion rate, and the helium atoms to be pumped equal the entering rate.
Using this model, trapping efficiencies for the 10-T option for FED were assessed. The parameters used (where different) for this case are:
X - 4.1 cm
eDT = 1
1.5 x 10²² s"1
6.4 x 10¹⁹ s"1 .

5-146
4.8 x 10²² s"1
1.6 x 10²⁰ s"1
2.7 x 10¹⁸ m"3 .
Tn'i- assessment results in the following parameters: = 3.2 cm, A^, = 2.8 cm, e ^ = 1, eQ = 1. Thus, 10-T operation will not change the trapping efficiency, on the basis of this first-order model.
Preliminary analyses were performed for the FED bottom limiter by M'. Petravic, M. Ulrickson, and D. Post using the Princeton divertor channel code17. This code uses a Monte Carlo neutral treatment combined with a two-dimensional plasma fluid model. The code incorporates detailed collision processes such as charge exchange, electron impact ionization, and disassociation for both atomic and molecular hydrogen. The limiter slot was modeled by a rectangular channel with ions flowing along straight magnetic field lines to impinge on a surface parallel to the slot opening. This was done for convenience in the initial modeling and is more conservative than the actual situation, since in the model neutralized ions emerging at normal incidence return in the direction of the plasma rather than being scattered into the vacuum duct. Even for this conservative case, the PPPL code results indicate pumping effi-ciencies on the order of 70%. Several features of the code results are shown in Fig. 5-70 through 5-72. Figure 5-70 shows the model geometry used; Fig. 5-71 shows the neutral pressure profile, and Fig. 5-72 shows the electron density in the limiter slot.
Structural response
Structural loads on the limiter include internal coolant pressure and plasma disruption electromagnetic forces. Additionally, thermal stresses occur during operation and as a result of fabrication processes such as brazing. The coolant pressure of 1.0 MPa (150 psi) can be handled by appropriate internal rib spacing. For the FED baseline limiter structural thickness of 0.30 cm (near the leading edge), a rib spacing of 0.8 cm results in a bending stress of 35 MPa (5 ksi).
slot DT fslot a
5-147
ORNL-DWG 81-19406 FED
6 0 cm
—I—i—I—I
~ t
—i—i-
1
4 - 4 - 4 - 4 - 4 -
—I—
— i
_ L —j—a—I —I—| t
—-I—!—i-
I I
-I—I-I I
h-1-4-}—h-i
f - T -
-i—L—*—l
4 -I t"1 -j H
r-1
- l - U
i
j-4-t-f-
I I
I I I
—r-t--
i i i i i i i i i
JL_J._i_LJ 15 cm
TO PUMP
2 0 cm
Fig. 5-70. Computational mesh for divertor channel code model.
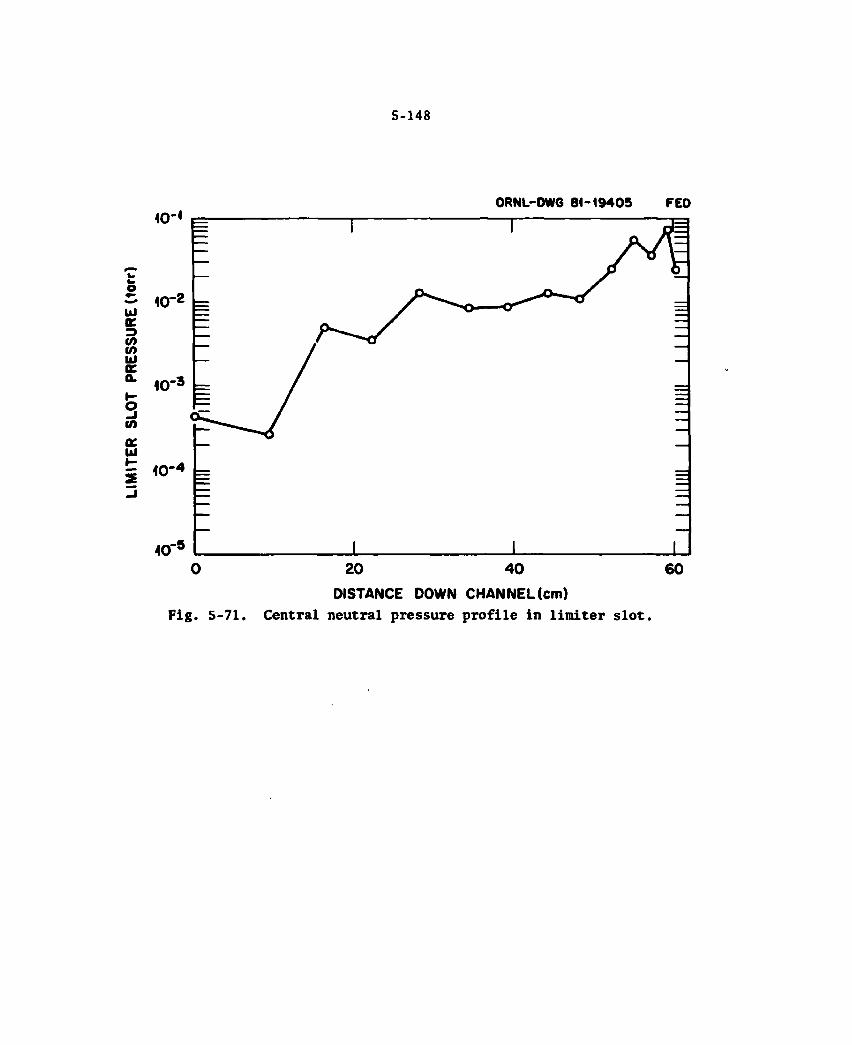
5-148
ORNL-DWG 81-19405 FED
DISTANCE DOWN CHANNEL (cm) Fig. 5-71. Central neutral pressure profile in limiter slot.
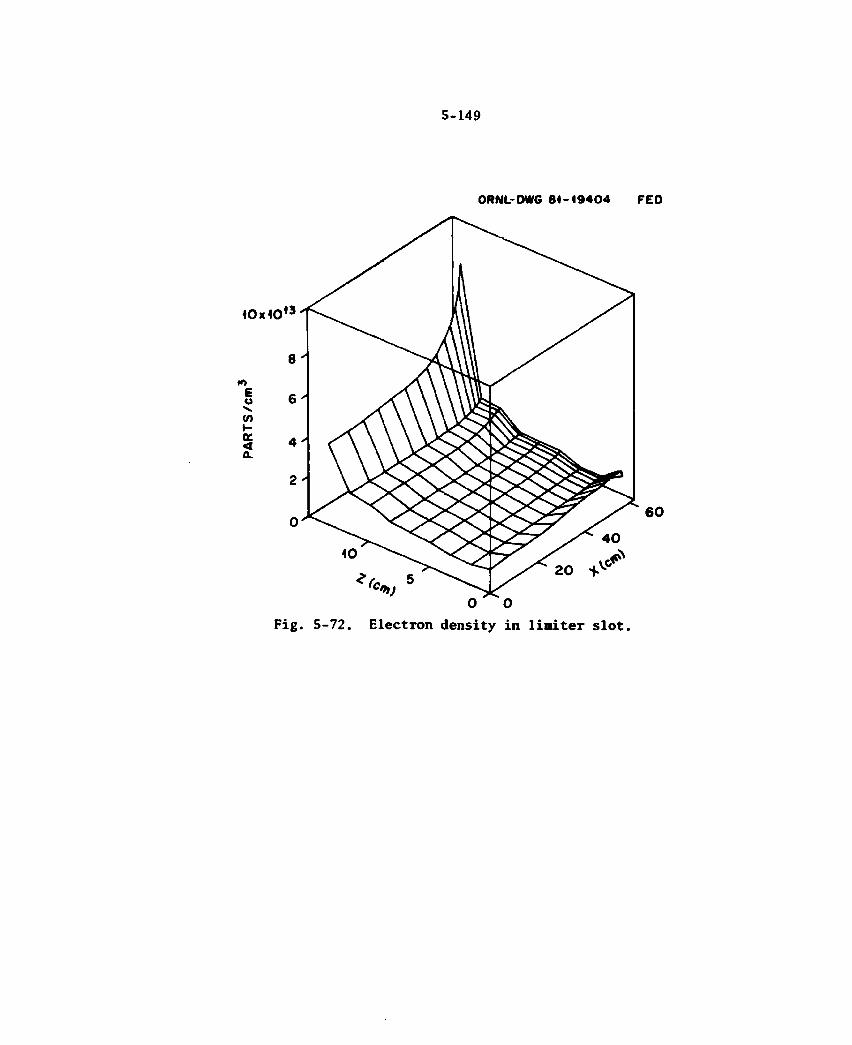
5-149
ORNL-DWG 84-19404 FED
0 0 Fig. 5-72. Electron density in limiter slot.

5-150
Electromagnetic loads from plasma disruption are approximately 0.2 MPa (30 psi) normal to the limiter surface. This load requires increasing limiter depths and structural thicknesses with increasing distance from the leading edge.
The baseline design concept utilizes brazing of the graphite tiles to the metal substrate to gain required thermal performance of the tiles under the high limiter heat loads. Brazing of graphite to metal sub-strates and subsequent capability for reliable performance under the loading conditions remains a development task. Several materials were reviewed as candidate substrates. These are discussed later in Section 5.4.4. Of those reviewed, an annealed copper, which would yield during cooldown from braze and yield, if required, under subsequent thermal cycling, appears to provide the best capability. Properties of both coppers and graphites vary significantly. For purposes of evalu-ation, it was assumed that the copper substrate would yield at about 50 MPa (7 ksi) during cooldown from braze at 800°C.
Because the graphite tiles are approximately twice as thick as the total copper thickness, the compressive stresses developed in the graphite are approximately 25 MPa (3500 psi). The plastic tensile strain in the copper is approximately 0.58%. Subsequent thermal cycling produces compressive stresses in the graphite of approximately 45 MPa (6500 psi) and plastic strains of 0.16%. These results are preliminary and are based on unirradiated properties. Because of reduced thermal conductivity for irradiated graphites, the stresses can become tensile at the braze surface. The performance of the copper, graphite, and braze under fatigue loadings and with time-dependent properties remains to be demonstrated.
Erosion response/life characteristics
Several types of graphite tile erosion mechanisms will combine to shorten the life of the limiter. These erosion mechanisms are physical sputtering from charged particles leaving the plasma and from charge exchange (C-X) neutral particles, chemical sputtering induced by the
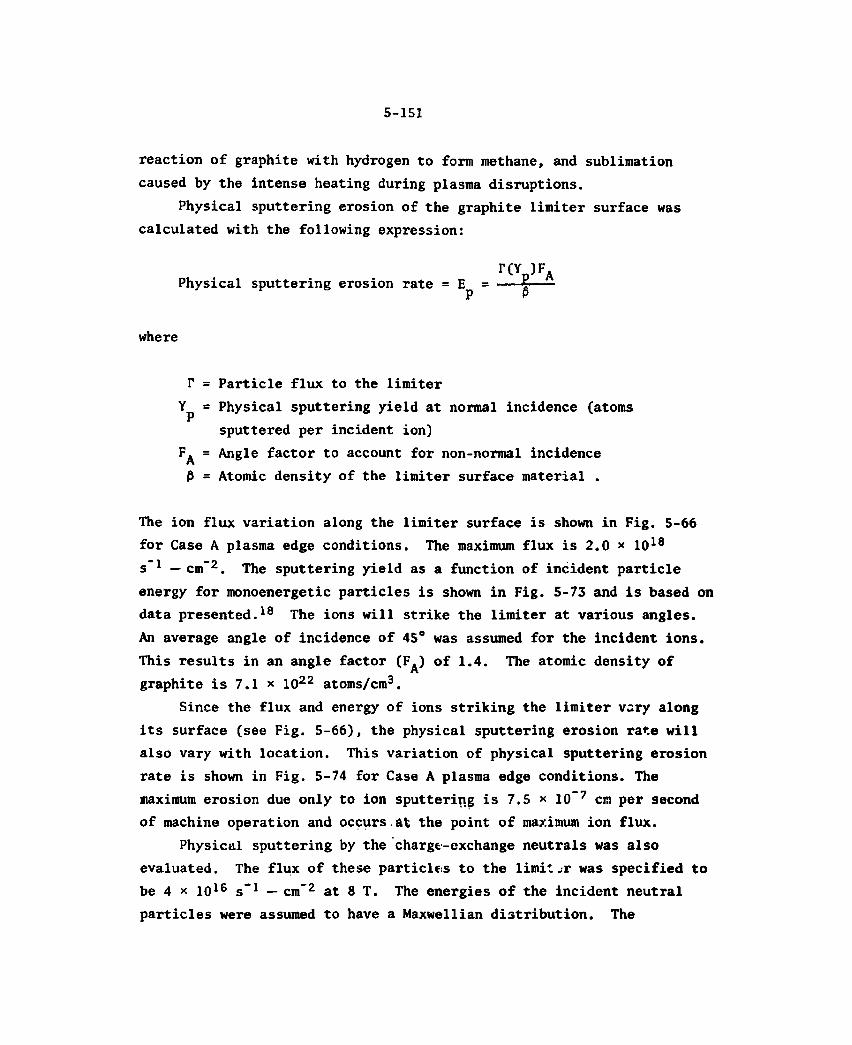
5-151
reaction of graphite with hydrogen to form methane, and sublimation caused by the intense heating during plasma disruptions.
Physical sputtering erosion of the graphite limiter surface was calculated with the following expression:
r ( V F A Physical sputtering erosion rate = E = *
where
r = Particle flux to the limiter Yp = Physical sputtering yield at normal incidence (atoms
sputtered per incident ion) F^ = Angle factor to account for non-normal incidence 0 = Atomic density of the limiter surface material .
The ion flux variation along the limiter surface is shown in Fig. 5-66 for Case A plasma edge conditions. The maximum flux is 2.0 * 1018
s"1 — cm"2. The sputtering yield as a function of incident particle energy for monoenergetic particles is shown in Fig. 5-73 and is based on data presented.18 The ions will strike the limiter at various angles. An average angle of incidence of 45° was assumed for the incident ions. This results in an angle factor (FA) of 1.4. The atomic density of graphite is 7.1 x io22 atoms/cm3.
Since the flux and energy of ions striking the limiter vary along its surface (see Fig. 5-66), the physical sputtering erosion rate will also vary with location. This variation of physical sputtering erosion rate is shown in Fig. 5-74 for Case A plasma edge conditions. The maximum erosion due only to ion sputtering is 7.5 * 10 7 cm per second of machine operation and occurs.at the point of maximum ion flux.
Physical sputtering by the charge-exchange neutrals was also evaluated. The flux of these particles to the limit„r was specified to be 4 x 10¹⁶ s"1 — cm"2 at 8 T. The energies of the incident neutral particles were assumed to have a Maxwellian distribution. The
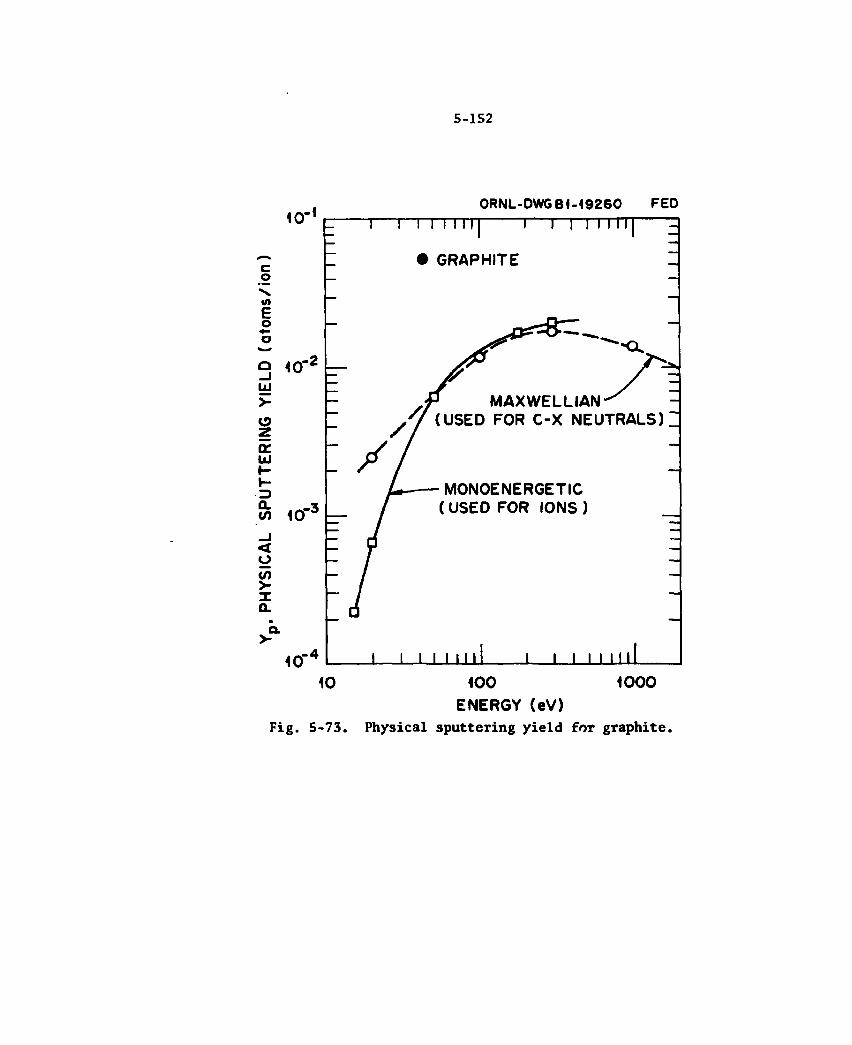
5-152
ORNL-DWG 8 4-19260 FED I I I I I I l| 1 1 | I I I I l|
• GRAPHITE
- M A X W E L L I A N , v (USED FOR C - X N E U T R A L S ) _
MONOENERGETIC ( USED FOR IONS )
I I I I I I I J I l l I I 111 10 1000 100
ENERGY (eV) Fig. 5-73. Physical sputtering yield for graphite.
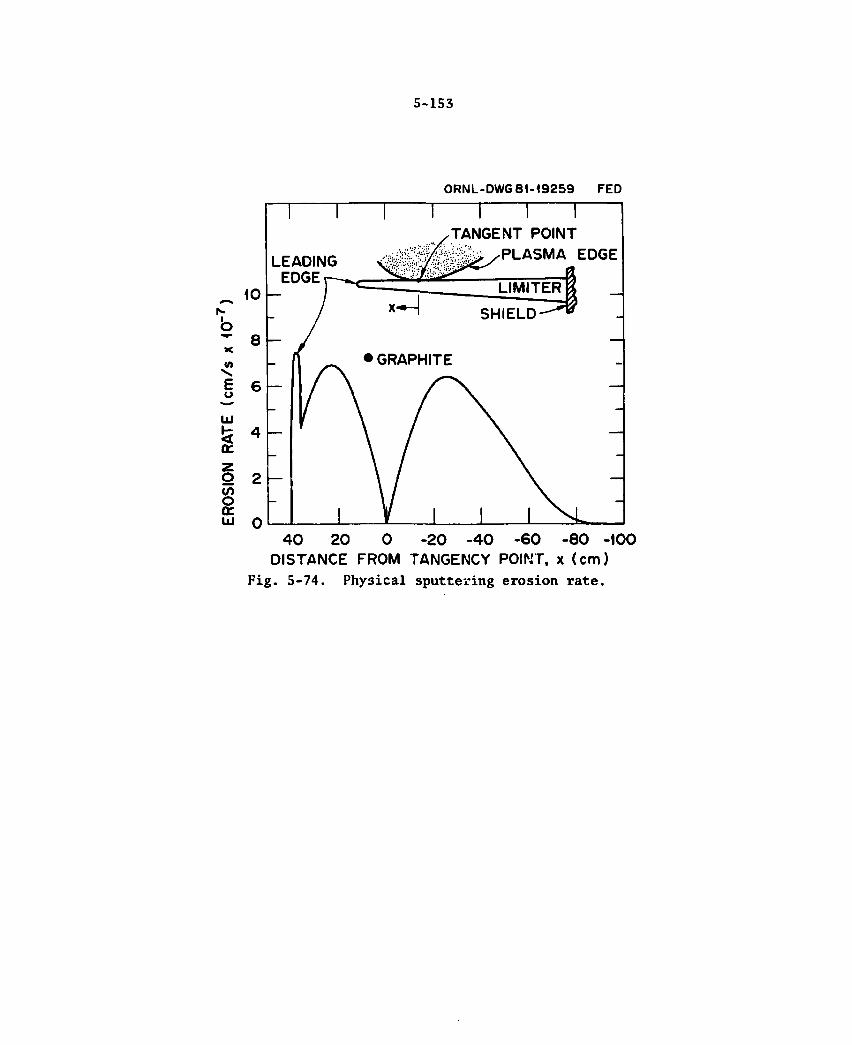
5-153
ORNL-DWG 81-19259 FED
LEADING EDGE'
TANGENT POINT PLASMA EDGE
10 h-
8 \—
6 h
LIMITER
SHIELD
z O 2 tn o a.
• GRAPHITE
4 0 2 0 0 - 2 0 - 4 0 - 6 0 - 8 0 -100 DISTANCE FROM TANGENCY POINT, x ( c m )
Fig. 5-74. Physical sputtering erosion rate.
5-154
sputtering yield curve, based on data18, is shown in Fig. 5-73. The angle of incidence of the charge-exchange neutrals was assumed to be uniformly distributed from 0 to 90°. This results in an angle factor of 2.4.18 Using these input parameters, the physical sputtering erosion of the limiter surface caused by C-X neutrals was calculated to be 1.4 x 10~8 cm per second of machine operation.
Chemical erosion by formation of hydrocarbons can be a significant erosion mechanism for graphite when exposed to hydrogen. Methane formation has been shown to be a significant erosion mechanism when the surface temperature is between about 400°C and 800°C. Erosion by formation of acetylene may be significant at temperatures above 1200°C, but further research is required to quantify this erosion.
Since the attack of thermal hydrogen results in sputtering yields, which are about 5 orders of magnitude lower th-"i for energetic hydro-gen,19 only chemical erosion by energetic hydrogen (in this case the ions leaving the plasma and C-X neutrals) was considered. Chemical sputtering erosion rates by energetic hydrogen ions and neutrals can be determined using the following equation:
TY Chemical erosion rate = — P
where Yc is the chemical sputtering yield coefficient. This coefficient depends on both particle energy and surface temperature. Even if these parameters are well known, there is a large degree of uncertainty in the sputtering yield. As discussed in the "Thermodynamic Response" section, the surface temperature varies with time during the bum, with tile thickness (thickness decreases as erosion occurs), and with location on the limiter surface. In addition to this complex variation, there is a large uncertainty in the temperatures caused by uncertainties in (1) the plasma edge conditions (Cases A, B, C, and D), (2) the scrape-off e-fold distances, and (3) the material properties after irradiation.
Because of these complexities and uncertainties, a detailed evaluation of the chemical erosion wa:. not performed. However,
5-155
chemical erosion for the graphite surface was estimated by examining the temperature history of the limiter surface as it erodes at the point of maximum particle flux on the flat surface. Chemical sputtering yield
variation of chemical sputtering yield with surface temperature is shown in Fig. 5-75. Although the sputtering yield varies with particle energy, it is relatively constant in the range of interest for this study (approximately 200 to 500 eV for the C-X neutrals). The chemical erosion that occurs during the life of the 1.25-cm-thick tile at this point was found to be approximately equal to the physical sputtering erosion. Therefore, for the evaluation of limiter life, chemical erosion was assumed to be equal to the physical sputtering erosion.
Sensitivity studies were performed for the limiter erosion during plasma disruptions for the parameters defined in Tables 5-3 and 5-4. The technique described in Section 5.3.3 was used to calculate the thickness of graphite sublimed. The thicknesses of material vaporized during a disruption in each of the form stages of operation are shown in Table 5-18 for four combinations of disruption parameters. The "worst" case erosion represents the result obtained using all parameter values which maximize sublimation. "Best" case erosion represents the sub-limation with all parameter values which minimize erosion. The nominal case is the erosion calculated for nominal parameter values. The design case erosion was chosen as the erosion at nominal parameter values plus the root-sum-square of the maximum variation of sublima-tion due to changing each parameter. The equation used for calculat-ing the design :ase erosion is:
data20 for particle energies of 630 eV were used for this estimate. The
E, Design
where
Design E Nominal
= design case erosion
= nominal case erosion
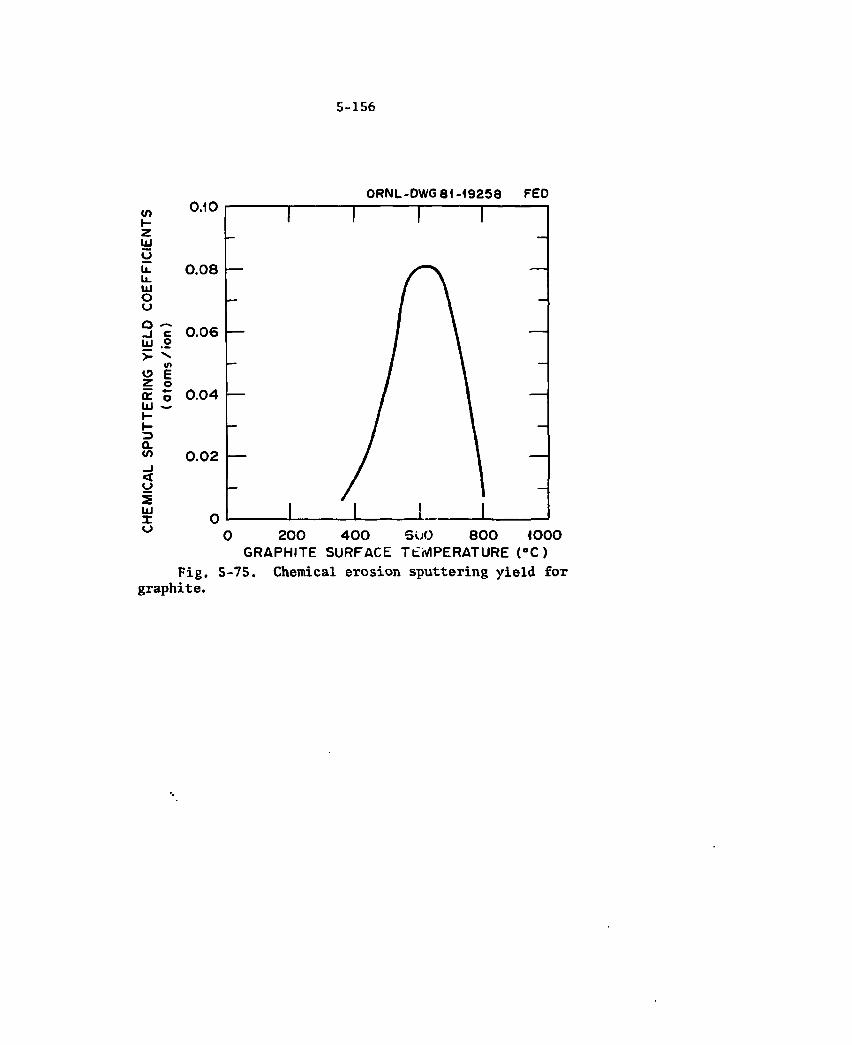
5-156
0.10
0.08 \—
0.06 h-
0.04 —
0.02 —
ORNL-DWG 81 -19258 FED
w 0 200 400 SOO 800 <000 GRAPHITE SURFACE TtWIPERATURE (°C )
Fig. 5-75. Chemical erosion sputtering yield foT graphite.
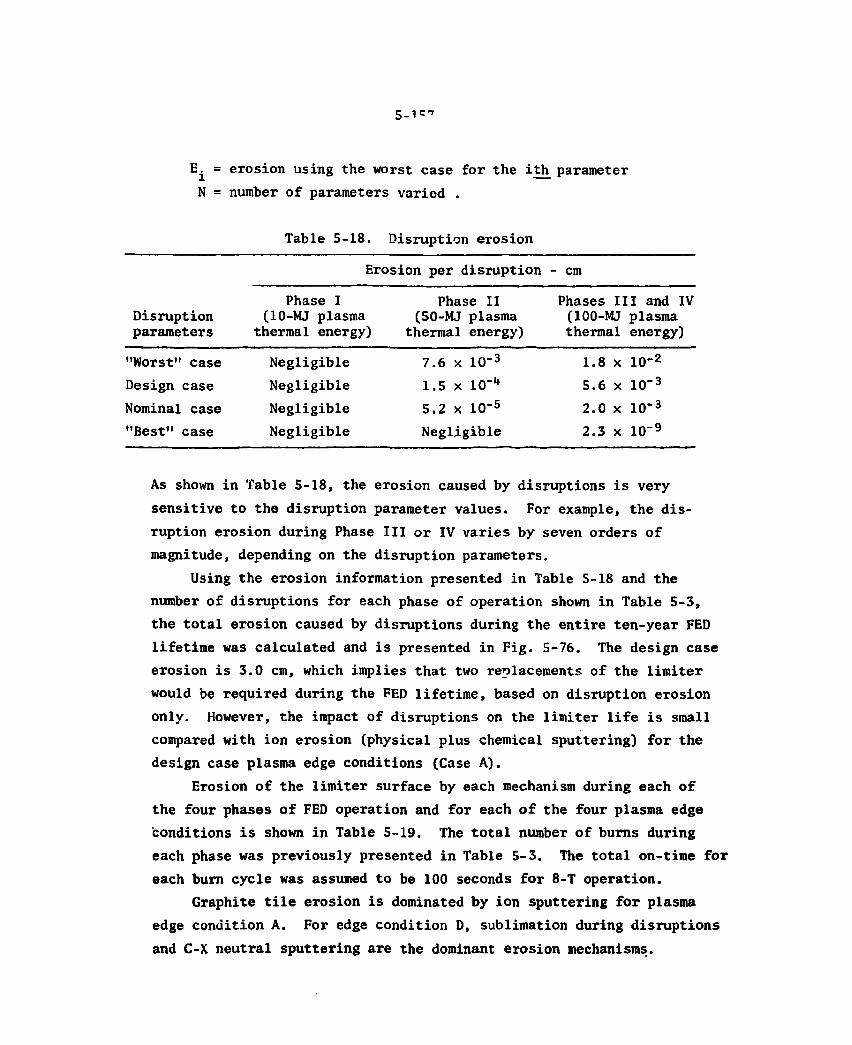
5 - 1 ^
E^ = erosion using the worst case for the ith parameter N = number of parameters varied .
Table 5-18. Disruption erosion
Erosion per disruption - cm
Phase I Phase II Phases III and IV Disruption (10-MJ plasma (50-MJ plasma (100-MJ plasma parameters thermal energy) thermal energy) thermal energy)
"Worst" case Negligible 7.6 x 10⁻³ 1.8 X 10⁻² Design case Negligible 1.5 x lO'" 5.6 X 10"3
Nominal case Negligible 5.2 x 10"5 2.0 X 10"3
"Best" case Negligible Negligible 2.3 X 10"9
As shown in Table 5-18, the erosion caused by disruptions is very sensitive to the disruption parameter values. For example, the dis-ruption erosion during Phase III or IV varies by seven orders of magnitude, depending on the disruption parameters.
Using the erosion information presented in Table 5-18 and the number of disruptions for each phase of operation shown in Table 5-3, the total erosion caused by disruptions during the entire ten-year FED lifetime was calculated and is presented in Fig. 5-76. The design case erosion is 3.0 cm, which implies that two replacements of the limiter would be required during the FED lifetime, based on disruption erosion only. However, the impact of disruptions on the limiter life is small compared with ion erosion (physical plus chemical sputtering) for the design case plasma edge conditions (Case A).
Erosion of the limiter surface by each mechanism during each of the four phases of FED operation and for each of the four plasma edge conditions is shown in Table 5-19. The total number of burns during each phase was previously presented in Table 5-3. The total on-time for each burn cycle was assumed to be 100 seconds for 8-T operation.
Graphite tile erosion is dominated by ion sputtering for plasma edge condition A. For edge condition D, sublimation during disruptions and C-X neutral sputtering are the dominant erosion mechanisms.
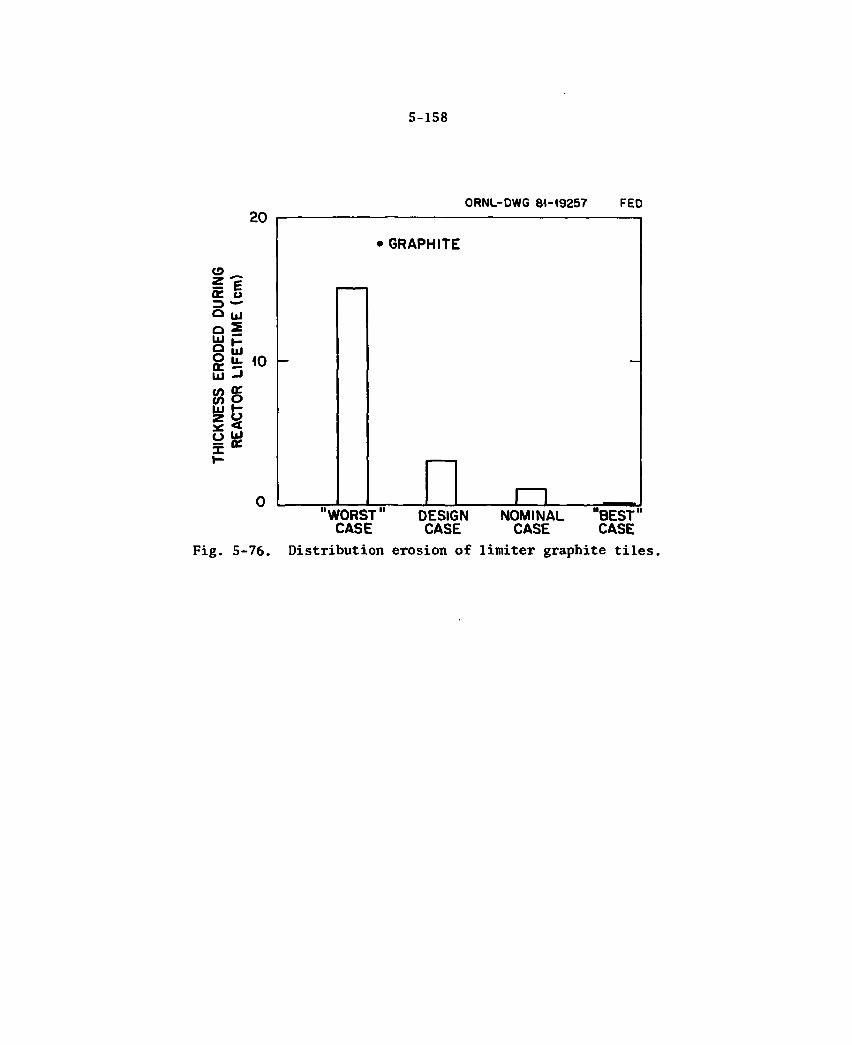
5-158
20
o _ s e CC u O ul Q S UJ p O uj g ^ 10 Ul J CO £ CO o LU H-z y ^ < o UJ
0RNL-0WG 81-19257 FED
"WORST" CASE
DESIGN CASE
NOMINAL CASE
"BEST" CASE
Fig. 5-76. Distribution erosion of limiter graphite tiles.
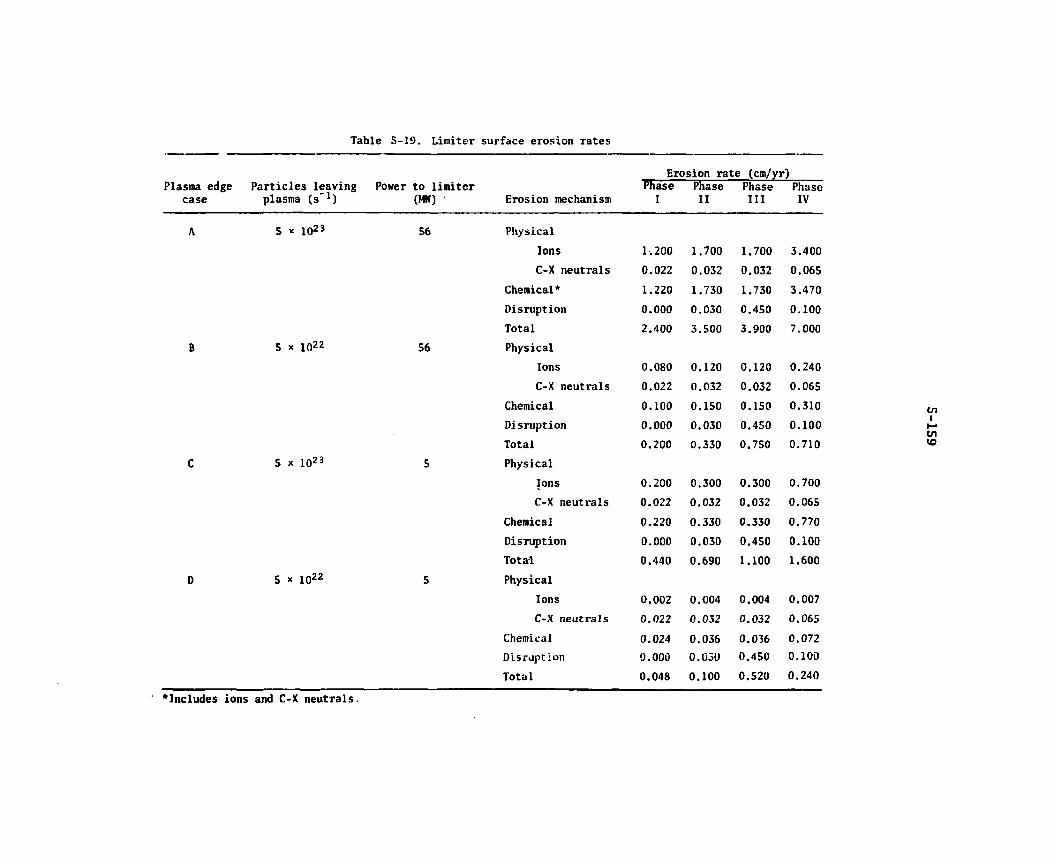
Table 5-19. Limiter surface erosion rates
Erosion rate (cm/yr) Plasma edge
case Particles leaving plasma (s"1)
Power to limiter (MW) • Erosion mechanism
Phase I
Phase II
Phase III
Phase IV
A 5 * 1023 56 Physical Ions 1.200 1.700 1.700 3.400 C-X neutrals 0.022 0.032 0.032 0.065
Chemical* 1.220 1.730 1.730 3.470 Disruption 0.000 0.030 0.450 0.100 Total 2.400 3.500 3.900 7.000
B 5 * 1022 56 Physical Ions 0.080 0.120 0.120 0.240 C-X neutrals 0.022 0.032 0.032 0.065
Chemical 0.100 0.150 0.150 0.310 Disruption 0.000 0.030 0.450 0.100 Total 0.200 0.330 0.750 0.710
C 5 x io23 5 Physical Ions 0.200 0.300 0.300 0.700 C-X neutrals 0.022 0.032 0.032 0.065
Chemical 0.220 0.330 0.330 0.770 Disruption 0.000 0.030 0.450 0.100 Total 0.440 0.690 1.100 1.600
D 5 x io22 5 Physical Ions 0.002 0.004 0.004 0.007 C-X neutrals 0.022 0.032 0.032 0.065
Chemical 0.024 0.036 0.036 0.072 Disruption 0.000 0.030 0.450 0.100 Total 0.048 0.100 0.520 0.240
'Includes ions and C-X neutrals.
5-160
Graphite tile erosion rates and service lifetimes for the four plasma edge conditions during the final phase of the FED operation are presented in Fig. 5-77. The tile thickness available for erosion was assumed to be 1.0 cm out of a total tile thickness of 1.25 cm. The erosion rates vary from 7.1 cm/yr down to 0.24 cm/yr, which results in limiter lifetimes that vary from approximately two months to four years, respectively. These results demonstrate that limiter performance is extremely sensitive to plasma edge conditions.
Redeposition on the limiter surface
As discussed in the previous section, sputtering of the carbon coating is expected to be the major life-limiting factor in the FED limiter design. However, redeposition of carbon on the limiter could have a significant impact on limiter life. This subject was studied for the FED bottom limiter design using a code based on models for physical sputtering and redeposition of the limiter coating.
FED baseline parameters for particle energy and temperature in the scrape-off region were coupled with the field line geometry near the limiter to determine the particle flux and subsequent sputtering yields all along the limiter surface. Because these calculations were per-formed independently from those presented in the previous section on erosion, the sputtering rates are slightly different. Sputtering yields as a function of incident particle energy were calculated using the sputtering model of Smith21 for both D-T and carbon self-sputtering.
The rate of erosion in the absence of any redeposition is shown in Fig. 5-78 Curve (a). For this calculation, an impurity-free, 50-50, D-T plasma was assumed, and a sheath potential on the limiter surface of e<(> = 3 kT was used. Near the limiter edge erosion rates are calculated to be in excess of 0.018 nun per hour of operation. Near the tangent point, x = 0, where the plasma particle trajectories nearly parallel to the limiter surface the rate of erosion is much smaller (0.0012 mm/h of operation). Elsewhere on the limiter, erosion rates vary up to 0.01 mm/h, as shown.
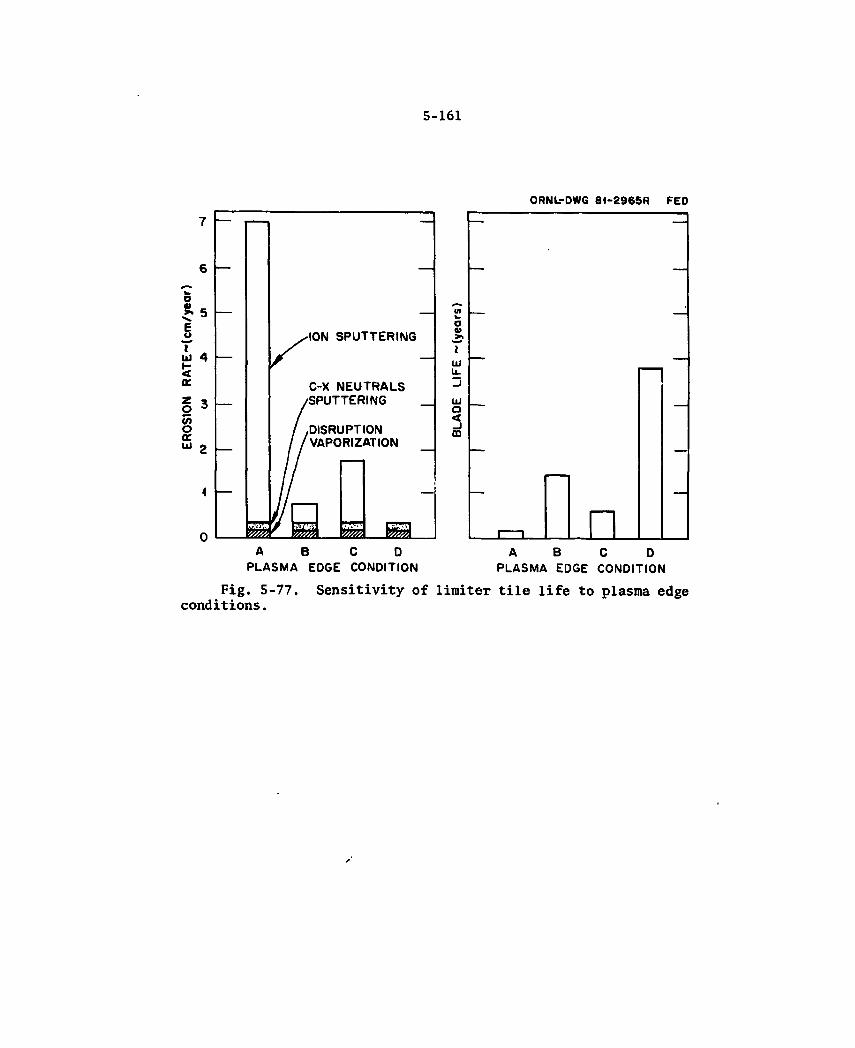
5-161
ORNL-DWG 81-2965R FED
7 —
6 —
o O) _ £ 5 E o
4 — < ac z o (A O ac UJ 2 —
4 —
'ION SPUTTERING
C-X NEUTRALS SPUTTERING
DISRUPTION VAPORIZATION
A B C 0 PLASMA EDGE CONDITION
A B C D PLASMA EDGE CONDITION
Fig. 5-77. conditions.
Sensitivity of limiter tile life to plasma edge
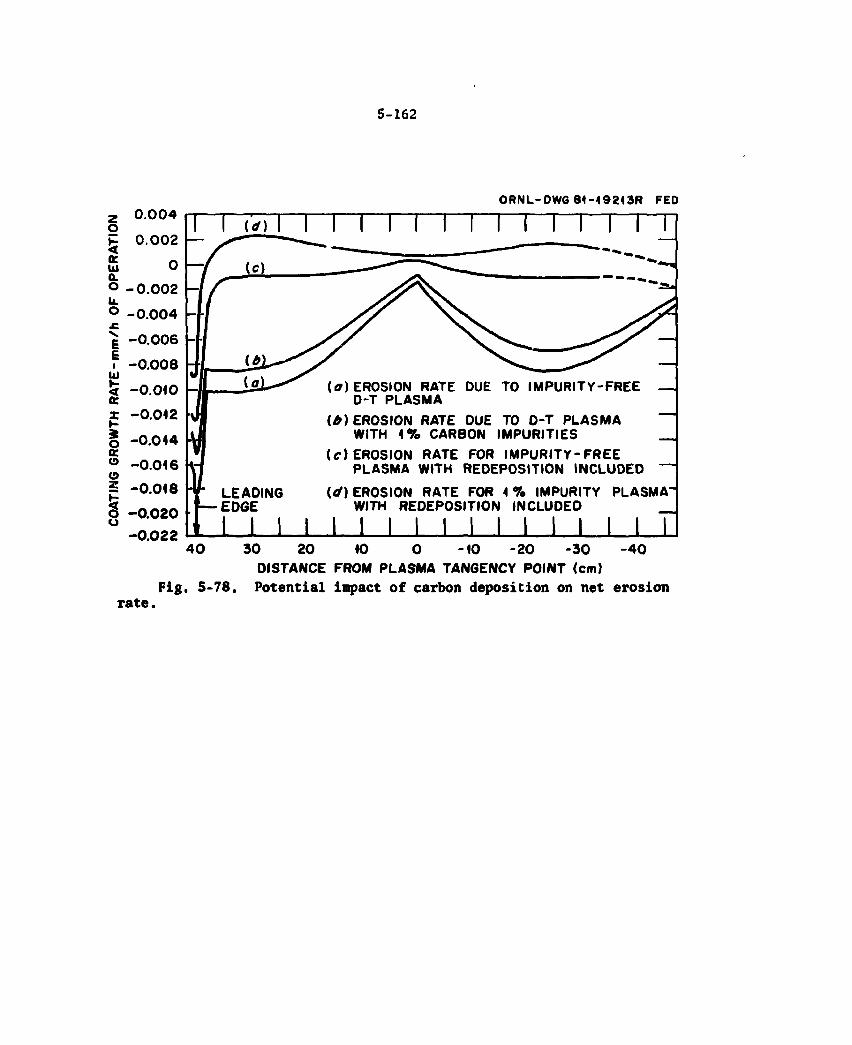
5-162
z 0.004 o »- 0.002 < (t U1 0 a o -0.002 u. o -0.004 •C V. E -0.006 E i -0.008 Ul
-0.010 a: z K -0.012
o -0.014 a: o -0.016 o z -0.018 i o -0.020
-0.022
ORNL-DWG 81-19213R FED
I ( '</) ! I I I I I I I I I I I I I I
(fl-) EROSION RATE DUE TO IMPURITY-FREE D-T PLASMA
(t) EROSION RATE DUE TO 0-T PLASMA WITH 1 % CARBON IMPURITIES
(?) EROSION RATE FOR IMPURITY-FREE PLASMA WITH REDEPOSITION INCLUDED
( d ) EROSION RATE FOR 1 7o IMPURITY PLASMA" WITH REDEPOSITION INCLUDED
LEADING EDGE I I I I l I I I I l I l I I l I l
rate.
40 30 20 10 0 -10 -20 -30 -40 DISTANCE FROM PLASMA TANGENCY POINT (cm)
Fig. 5-78. Potential impact of carbon deposition on net erosion

5-163
When the plasma composition is adjusted to include a 1% carbon impurity concentration, the erosion rate of the limiter coating is reduced, as shown in Curve (b). This occurs because the self-sputtering shields for carbon are less than unity. This means that the sticking of bulk plasma impurity carbon atoms on the surface more than compensates for the additional sputtering which they cause.
For the redeposition calculation, the angular distribution of sputtered carbon atoms is modeled using a cosine functional form. These atoms are ejected from the surface in a neutral charge state. They are quickly ionized, however, through collisions with the electron component of the scTape-off region plasma.
Based on a sputtered neutral energy of 1 eV and using rate coef-ficients reported by Bell et al.22 for electron impact ionization of carbon, the mean free path of sputtered neutral carbon atoms is found to be about 3 cm near the tip of the limiter and less than 0.5 cm near the tangent point.
Sputtered carbon atoms traveling through the scrape-off zone and into the bulk plasma before undergoing an ionizing collision are unavailable for redeposition, as are those which migrate onto other surfaces within the vacuum vessel. Those undergoing ionizing collisions in the scrape-off zone become tied to the field lines in that region.
Once ionized, these carbon atoms have roughly one-fifth the momen-tum of the D-T particles in the scrape-off zone. In the model, we assume that momentum transfer through coulomb collisions with the scrape-off region plasma and the attraction due to any presheath electric field causes the sputtered carbon to move back toward the limiter surface along the field line to which it is tied.
As mentioned earlier, the sheath potential at any point along the limiter is assumed to be three times the plasma temperature at that location. Returning singly charged C+ ions are accelerated across this potential before striking the limiter surface. These returning part-icles initiate a cascade of additional self-sputtering of the limiter coating and significantly enhance the overall sputtering rate of the limiter surface. An iterative calculation is carried out to obtain a convergent result of this effect.
5-164
We find that most of the sputtered material is redeposited on the limiter. The results of the redeposition calculation for an impurity-free plasma are shown in Fig. 5-78, Curve (c}. Some sputtered material is lost to the bulk plasma or is deposited elsewhere inside the vacuum vessel. As a result, a net erosion is predicted over most of the limiter surface. Near the tangent point a slight material buildup is predicted. This reflects the reduced rate of sputtering on that portion of the limiter and the nonuniformity of the redeposition process. Note that the erosion rate calculated here is significantly below that obtained when redeposition is not included. Curve (d) shows the results of the redeposition calculation when the impurity content of the plasma is held fixed at 1%. Except near the limiter tip, a net growth of the carbon coating is predicted.
Since graphite tiles are used on the inboard and top surfaces of the first wall, additional carbon redeposition on the limiter will take place. Charge-exchange neutrals will sputter carbon atoms from the first wall. Neutral carbon atoms from the wall will enter the scrape-off region where they will undergo electron impact ionization. Once ionized, some of these atoms will be guided by the field lines to the limiter surface. Modeling of this process shows that the neutTal carbons do not penetrate very far into the scrape-off zone before ionization takes place. Consequently, these atoms are deposited on the ends of the limiver.
Thus, charge-exchange neutral sputtering of the first wall tends to reduce the net erosion rate at the limiter edge. Preliminary results indicate that surface erosion near the limiter tip may be reduced by as much as 0.004 mm/h below those values shown in Fig. 5-78, CuTve (a). This process will be given closer attention in subsequent studies.
For the redeposition calculation carried out with a 1% plasma impurity content, Curve (d), limiter coating growth rates as high as 0.002 nm/h of operation are predicted for the central portions of the limiter. The FED limiter design has not been optimized with respect to these calculations. Clearly, if the plasma impurity content could be maintained at a value of about 1/2%, a net erosion/redeposition rate
5-165
near zero could be achieved over much of the limiter surface. Other mechanisms for control of the coating thickness may become apparent as more detailed studies are carried out. Note also that chemical sput-tering has not been considered in the present sputtering/redeposition model but was included in the previous section on limiter erosion.
It is concluded that redeposition of sputtered material may sig-nificantly prolong limiter life.
Impact of 10-T operation
The surface heat load to the mechanical pump limiter for clean plasma edge conditions (Case A of Table 5-2) is increased from 56 MW for 8-T operation to 70 MW for 10-T operation. Nuclear heating is increased by a factor of 2.5 for 10-T operation. This increased heating causes the maximum temperature of the 1.25-cm-thick graphite tile to reach 1530°C, compared with 1180°C at 8 T. The copper substrate maximum temperature is 265°C at 10 T, compared with 210°C at 8 T.
The performance of the limiter coolant flow system at 10 T was evaluated for a range of water flow rates and inlet pressures. To inhibit subcooled boiling, the pressure must be maintained above the saturation pressure corresponding to the coolant-structure interface temperature at all locations. The inlet pressure is, therefore, required to be greater than or equal to the saturation pressure at a particular location, plus the pressure drop from the inlet to that particular location. The two limiter locations that were found to be most critical from a boiling viewpoint are the leading edge and the point of maximum heat flux on the flat surface of the limiter blade outboard of the plasma tangency point.
The effect of flow rate on saturation pressure and pressure drop at these two locations is shown in Figs. 5-79 and 5-80. As the flow rate increases, the convection heat transfer in the coolant passages is enhanced. This leads to a lower coolant-structure interface tempera-ture, which corresponds to a lower saturation pressure. However, the pressure drop increases as the flow rate is increased. The sum of the
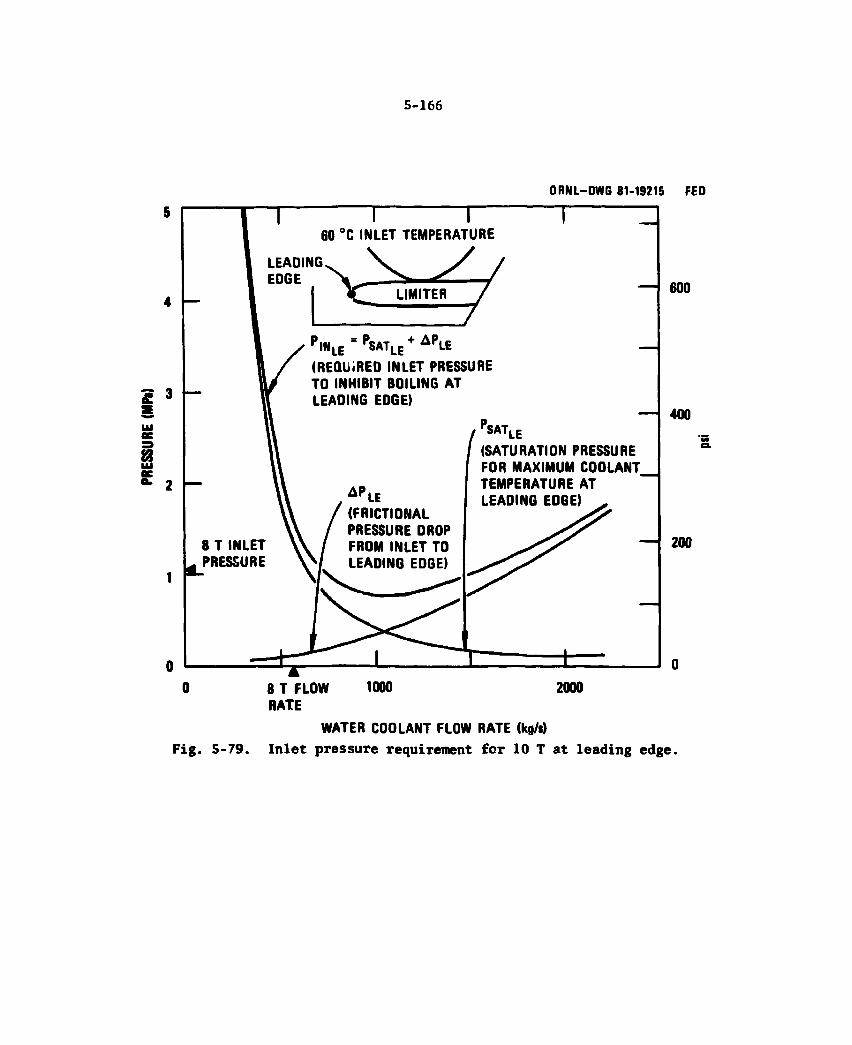
5-166
ORNL-DWG 81-19215 FED
4 —
? 3 —
8
2 —
— 600
400
— 200
1000 2000
Fig. 5-79.
T 8 T FLOW RATE
WATER COOLANT FLOW RATE (kg/s) Inlet pressure requirement for 10 T at leading edge.
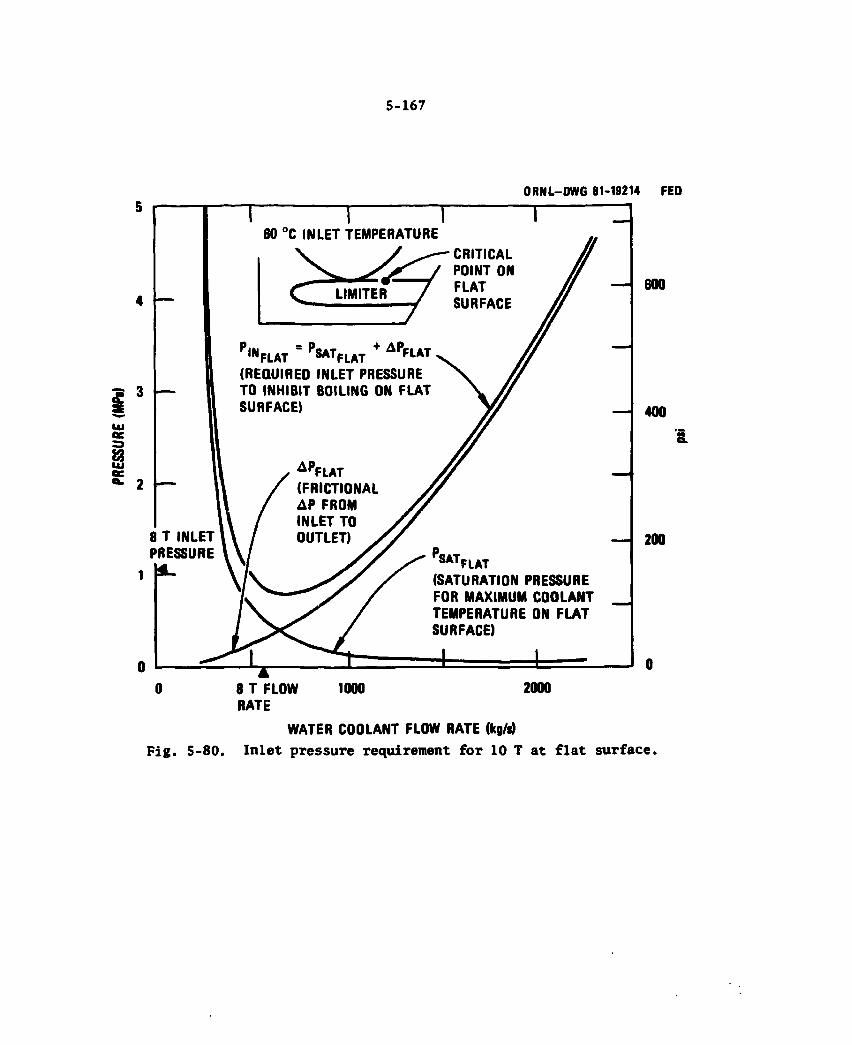
5-167
ORNL-DWG 81-19214 FED
— 6QO
— 400
—- 200
Fig. 5-80. WATER COOLANT FLOW RATE (kg/g)
Inlet pressure requirement for 10 T at flat surface.
5-168
two pressures, which is indicated in Figs. 5-79 and 5-80 as the required inlet pressure, has a minimum value.
The inlet pressures required J inhibit boiling at the two critical locations on the limiter are plotted together in Fig. 5-81. The inlet pressure required to inhibit boiling at all locations is indicated. If the flow rate for 8-T operation (560 kg/s) is used for 10-T operation, then the inlet pressure must be increased to above 1.7 MPa (250 psi). If the 8-T inlet pressure of 1.0 MPa (150 psi) is maintained at 10 T, then the flow rate must be increased to about 800 kg/s. The minimum inlet pressure is about 0.90 MPa (130 psi) and corresponds to a flow rate of 900 kg/s. To provide some margin (approximately 0.1 MPa or 20 psi) in the required inlet pressure, a limiter coolant system water flow rate of 900 kg/s and inlet pressure of 1.0 MPa (150 psi) is recommended for 10-T operation. These conditions do not impact the basic limiter blade design.
The charged particle flux to the limiter at 10 T is a factor of 1.6 times that for 8 T. Since the erosion of the limiter surface is dominated by the physical and chemical sputtering due to charged particles, the erosion rate at 10 T will be increased by about 1.6 times that for 8-T operation. This results in a limiter life, in terms of device operating (or bum) time, that is reduced by a factor of 1.6 from the life at 8 T. However, a reduced duty factor at 10 T would partially compensate for the increased erosion rate (compared to 8 T) and increase the life, in terms of calendar time.
5.4.4 Pump Limiter Design Options
Limiter location
Two pump limiter locations considered for FED are shown in Fig. 5-82. The primary advantages of the baseline bottom location relative to the 45° location are: 1. Decoupling of limiter structure and vacuum duct 2. Smaller size module required for removal and replacement
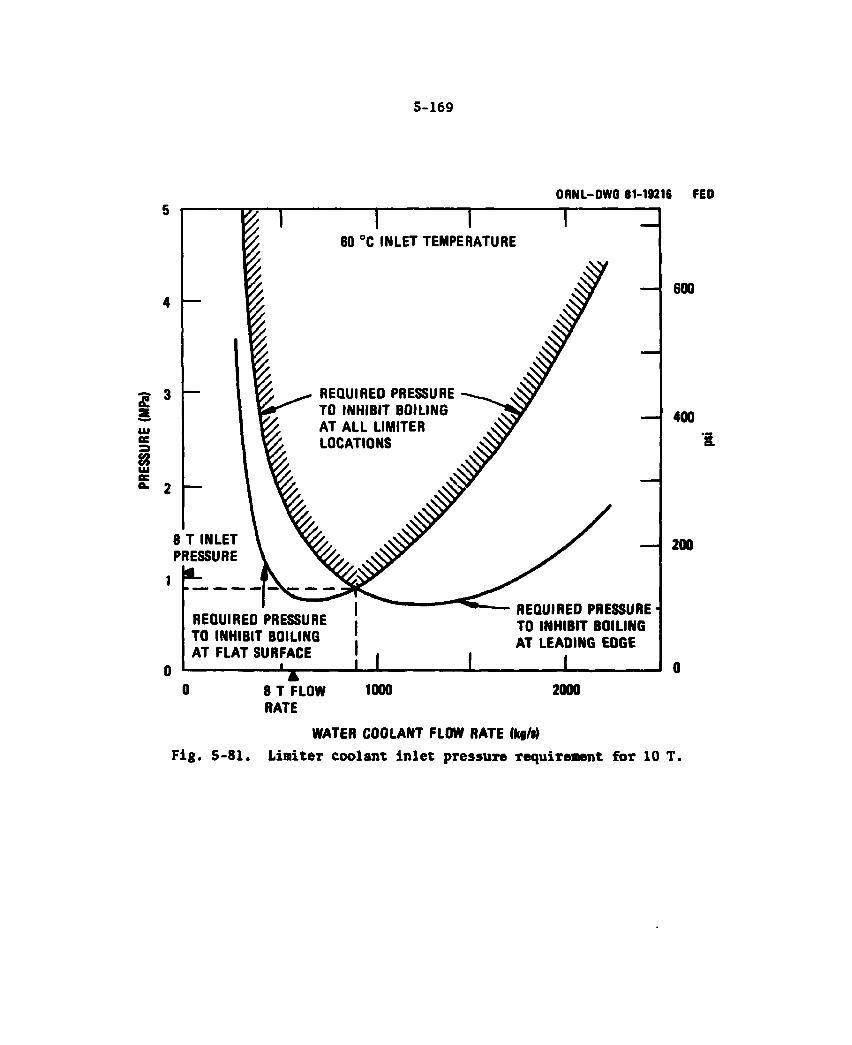
5-169
ORNL-OWG 81-19216 FEO
4 I—
£ 3
— I 600
— J 400 a
2 I—
8 T INLET PRESSURE
1
— I 200
WATER COOLANT FLOW RATE (kg/i) Fig. 5-81. Limiter coolant inlet pressure requirement for 10 T.
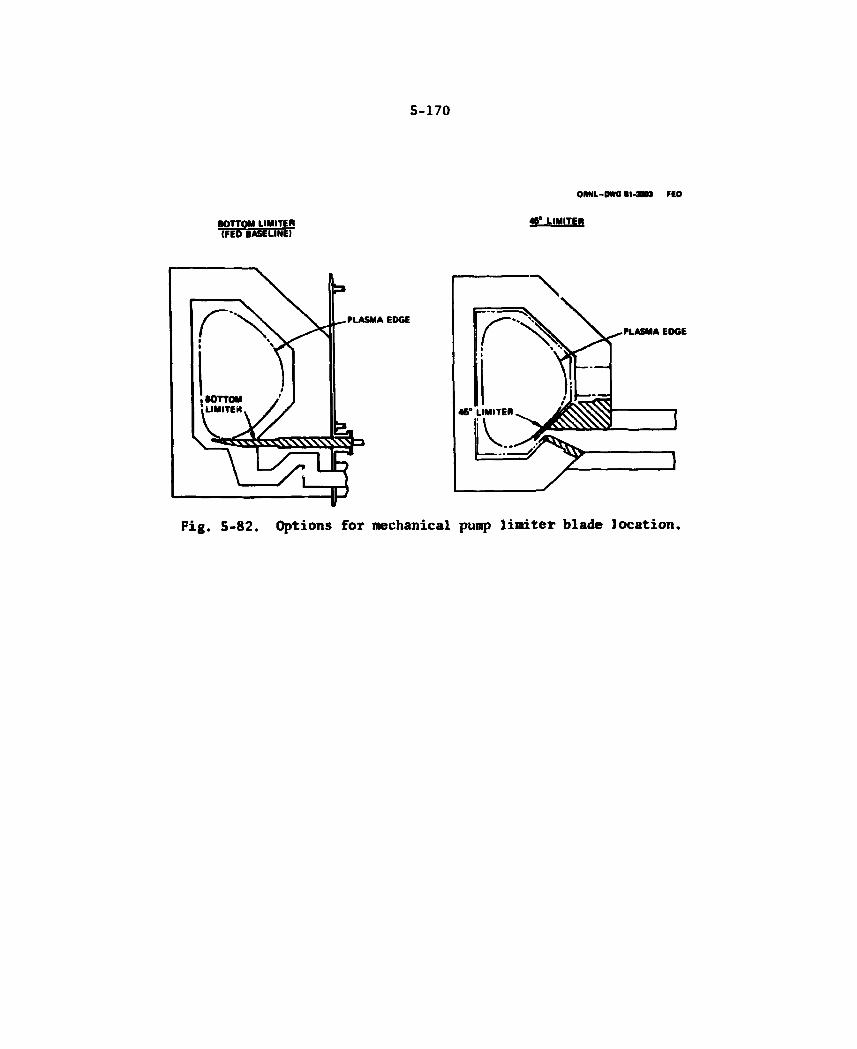
5-170
BOTTOM LIMITEIj (FED BASELINE)
ORNL-DWO11-3003 HO
LIMITEW

5-171
3. Better control of the position of the leading edge with respect to the plasma edge by changing the horizontal location of the plasma major radius
4. Less sensitive to plasma edge conditions 5. Easier fabrication due to flat face (no poloidal or toroidal
curvature) The disadvantage of the bottom location is that the plasma edge charac-teristics are less well defined near the bottom.
The heat and particle fluxes were calculated for both locations with a range of particle flux and heat flux e-fold distances. Results are presented in Pig. 5-83. The maximum flux on both the flat surface of the limiter and the limiter leading edge are shown in the figure. For the baseline e-fold distances (X/X baseline - 1.0), fluxes are slightly lower on the flat surface but slightly higher at the leading edge for the 45° location. Although at both locations the fluxes at the leading edge increase rapidly for e-fold distances less than the base-line values, the 45° location is significantly more sensitive. Because of the maintenance advantages and smaller sensitivity to plasma edge conditions, the bottom location was selected as the baseline.
Number of limiters
During the development of the limiter concept, consideration was given to locating toroidal belt limiters at both bottom and top loca-tions, as shown in Fig. 5-84. Analysis was performed to determine if substantially increased limiter life could be achieved. Results indicated that an even distribution of the heat load on the top and bottom was not feasible because of uncertainties in controlling the plasma vertical location. Although some increase in limiter life could be realized, incorporating limiters at both locations presents problems from an overall configuration and maintenance standpoint. Installing a limiter at the top reduces the already limited amount of outboard area available for test modules, diagnostics, etc. Also, to maintain the ease of replacement of the limiter (vacuum duct separate from limiter blade), a second vacuum pumping system would have to be located at the
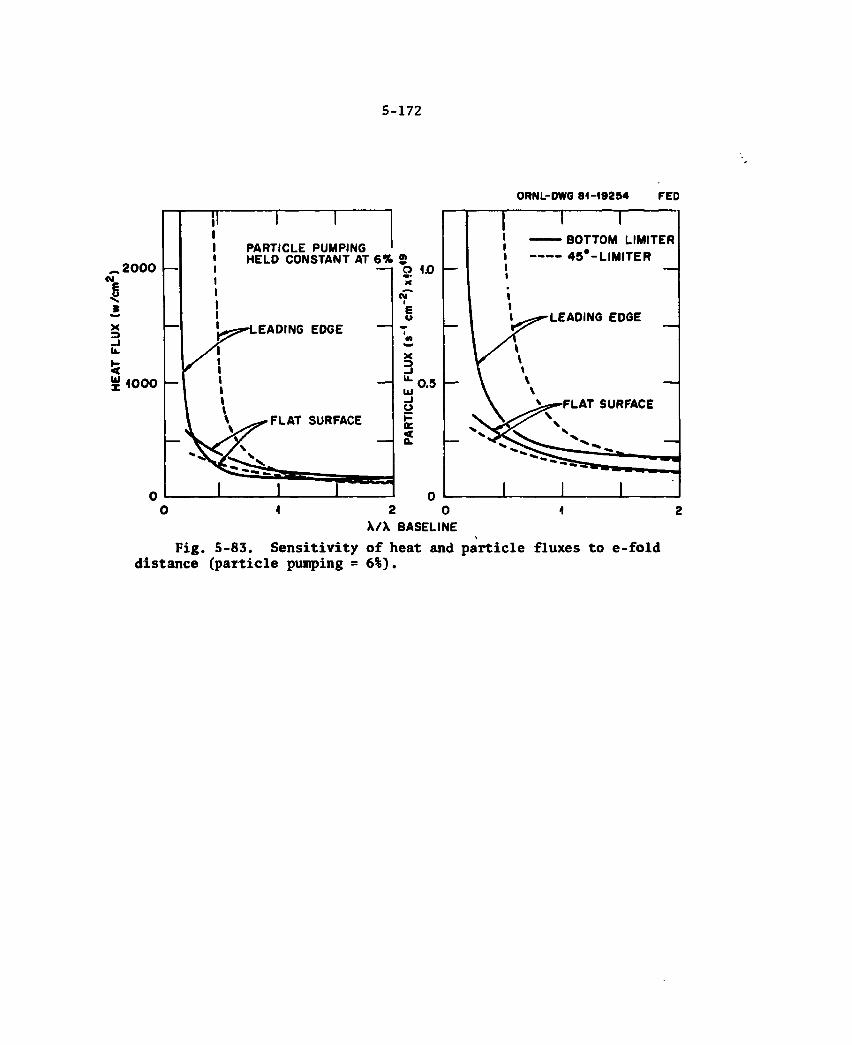
5-172
ORNL-DWG 81-19254 FED
X/X BASELINE 1
Fig. 5-83. Sensitivity of heat and particle fluxes to e-fold distance (particle pumping = 6%).
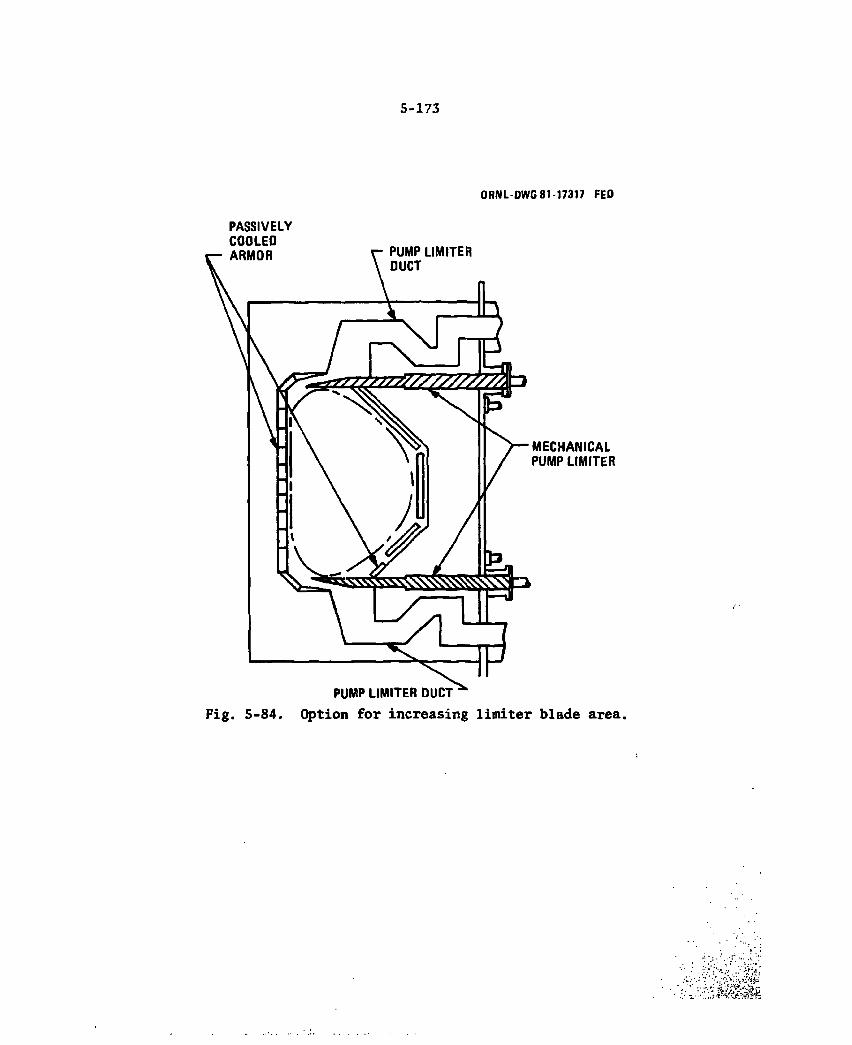
5-173
ORNL-DWG 81-17317 FED
PASSIVELY COOLEO
5-174
top of the device. Therefore, because the disadvantages outweigh the advantages of slightly increased limiter life, the single bottom loca-tion was selected.
Deflector plates
Deflector plates located in the entrance to the pump limiter channel were considered as a design option. The configuration of these plates is shown in Fig. 5-85. The channels are shaped to fol-low the field lines. The purpose of providing these plates is to enhance particle trapping. Particles entering the channel would impinge on the plates, become neutralized, and deflect into the vacuum duct. Relative to the baseline design, particles striking the deflector plates would be less likely to return to the plasma because of the released channel area.
Although these plates would improve particle trapping during the burn, they will significantly diminish the ability to pump down between bums. Because adequate trapping is expected without the plates, the deflector plates are not included in the baseline design.
Material selection and attachment techniques
Options considered for the limiter protective surface design are shown in Table 5-20. The key issue that was identified for each of the options is also presented in the table. This list is not exhaustive but covers the more interesting possibilities.
Graphite was selected as the limiter surface material. Other tile materials considered were silicon carbide, titanium carbide, and beryllium. Erosion rates and thermal shock parameters for each of these materials are presented in Table 5-21. Erosion mechanisms are: (1) physical sputtering, (2) chemical sputtering, and (3) vaporization and/or melting during plasma disruptions. Physical sputtering yield coefficients were obtained.18 Chemical erosion data are subject to considerable uncertainty. Data20 were used to evaluate the chemical erosion of graphite. Chemical erosion rates for titanium carbide and silicon carbide were assumed to be 10% of the rates for graphite.
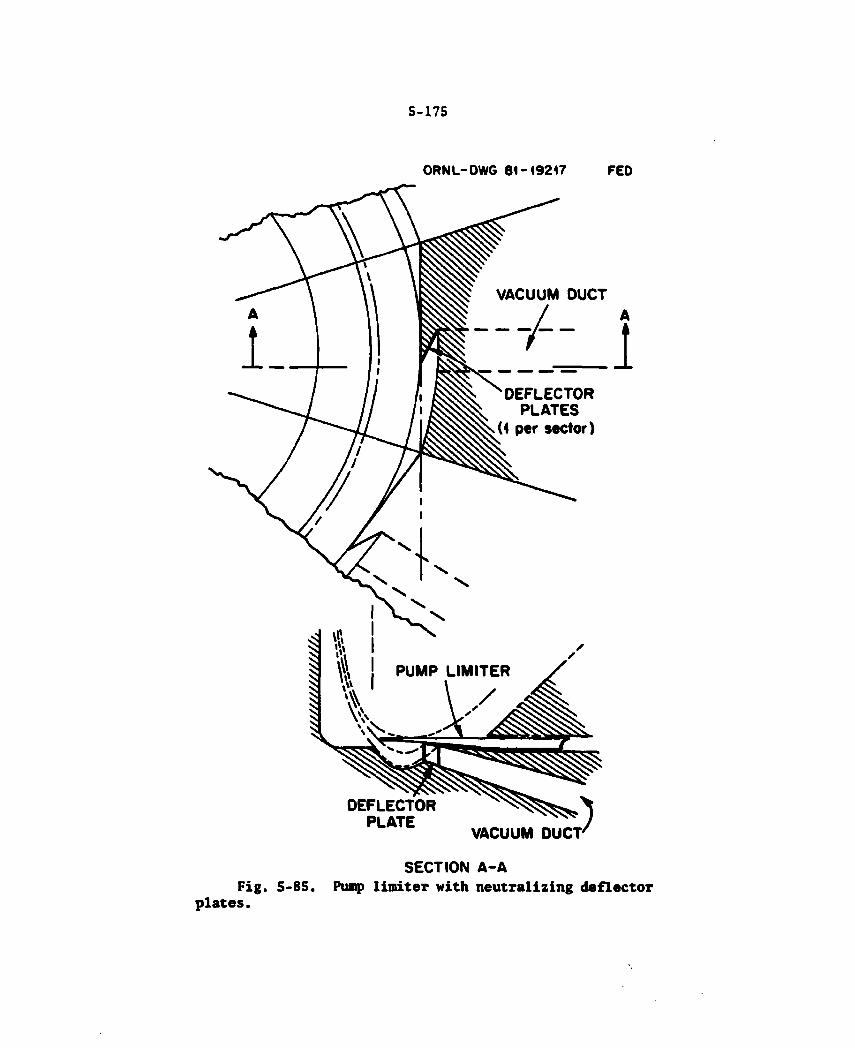
S-175
ORNL-DWG 81-19217 FED
DEFLECTOR PLATE
VACUUM DUCT'
SECTION A-A Fig. 5-85. Pump limiter with neutralizing deflectoT
plates.
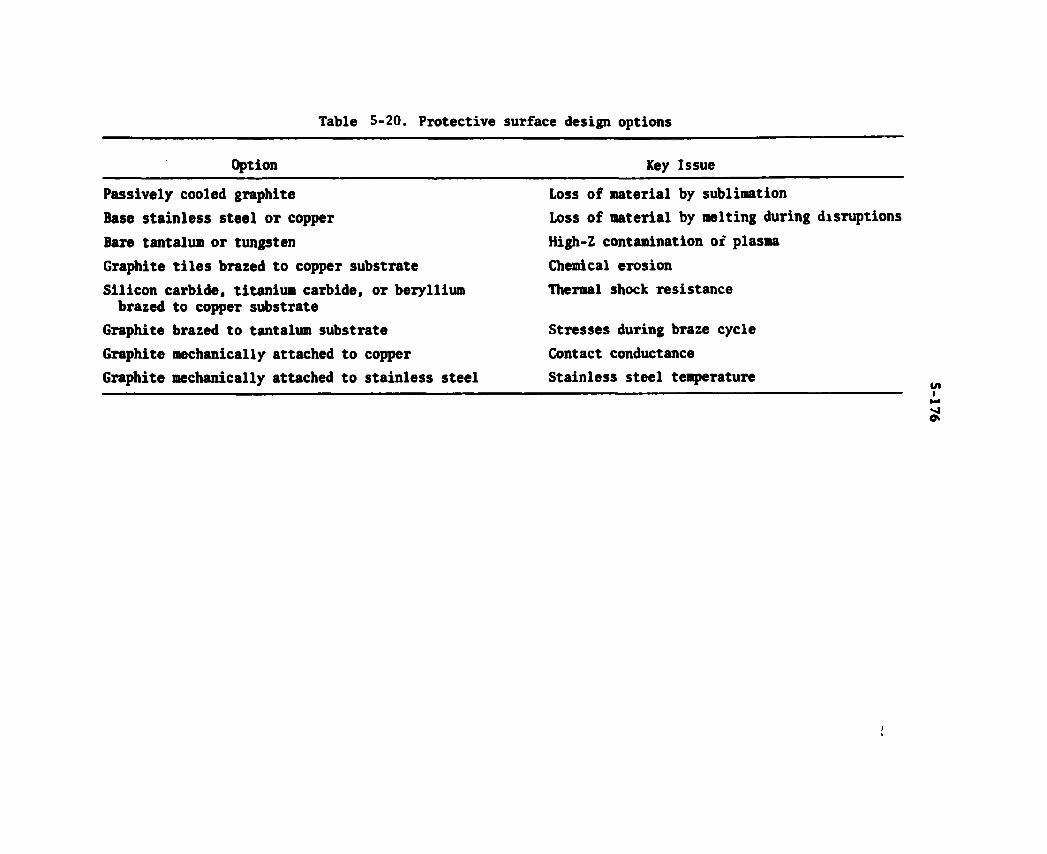
Table 5-20. Protective surface design options
Option
Passively cooled graphite Base stainless steel or copper Bare tantalum or tungsten Graphite tiles brazed to copper substrate Silicon carbide, titanium carbide, or beryllium brazed to copper substrate
Graphite brazed to tantalum substrate Graphite mechanically attached to copper Graphite mechanically attached to stainless steel
Key Issue
Loss of material by sublimation Loss of material by melting during disruptions High-Z contamination ox plasma Chemical erosion Thermal shock resistance
Stresses during braze cycle Contact conductance Stainless steel temperature
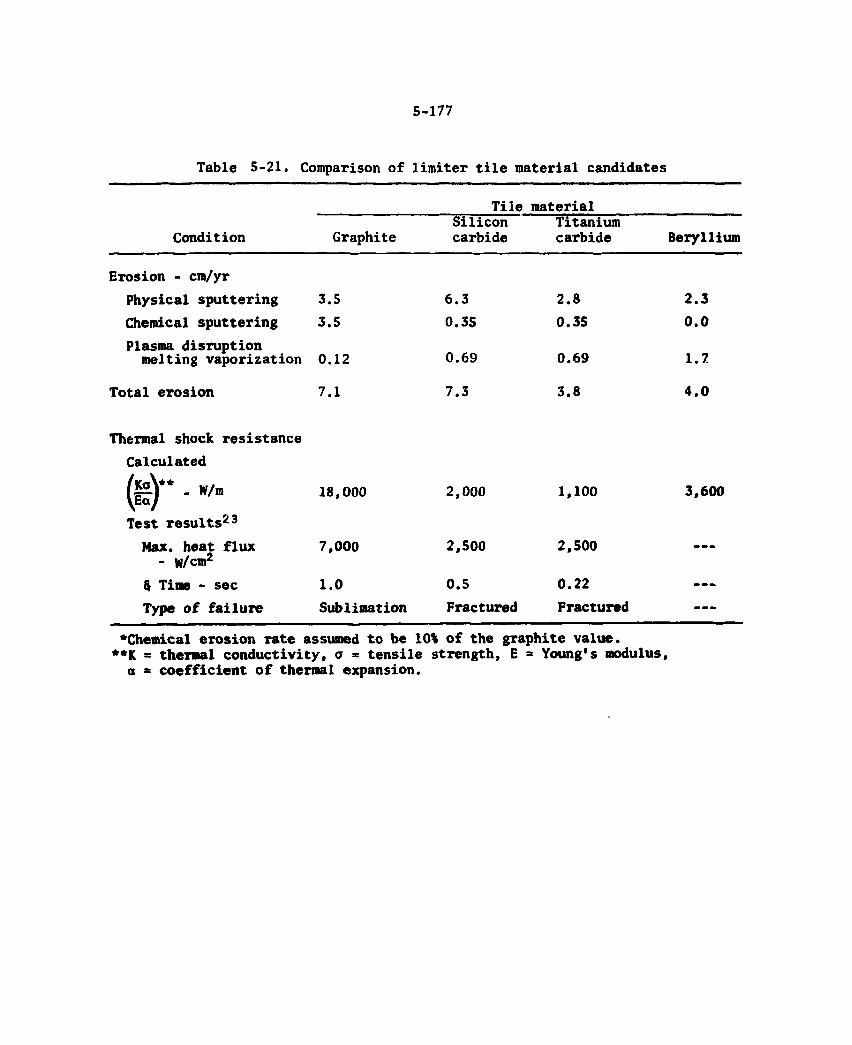
5-177
Table 5-21. Comparison of limiter tile material candidates
Tile material
Condition Graphite Silicon carbide
Titanium carbide Beryllium
Erosion - cm/yr Physical sputtering 3.5 Chemical sputtering 3.5 Plasma disruption melting vaporization 0.12
Total erosion 7.1
6.3 0.3S
0.69
7.3
2.8 0.35
0.69
3.8
2.3 0.0
1.7
4.0
Thermal shock resistance Calculated
i** - W/m
Test results23
Max. heat flux - w/cm2
5 Time - sec Type of failure
18,000
7,000
1.0 Sublimation
2,000
2,500
0.5 Fractured
1,100
2,500
0.22 Fractured
3,600
•Chemical erosion rate assumed to be 10% of the graphite value. **K = thermal conductivity, o * tensile strength, E - Young's modulus,
a = coefficient of thermal expansion.
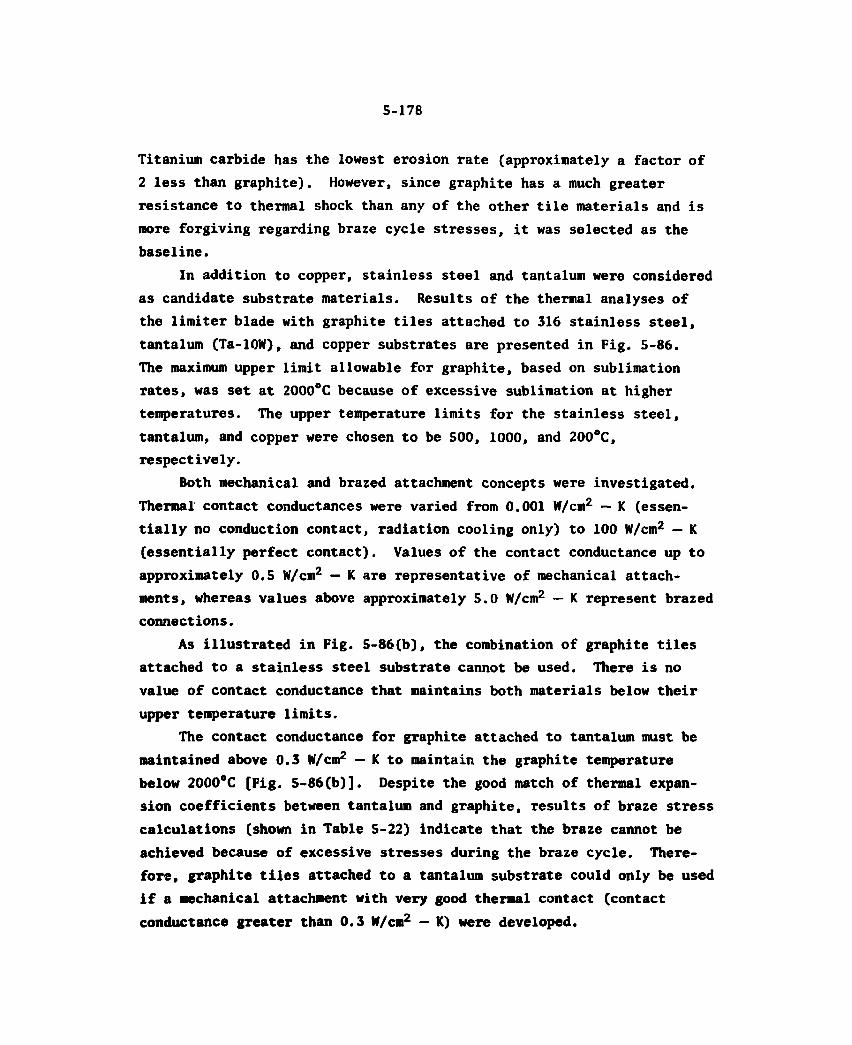
5-178
Titanium carbide has the lowest erosion rate (approximately a factor of 2 less than graphite). However, since graphite has a much greater resistance to thermal shock than any of the other tile materials and is more forgiving regarding braze cycle stresses, it was selected as the baseline.
In addition to copper, stainless steel and tantalum were considered as candidate substrate materials. Results of the thermal analyses of the limiter blade with graphite tiles attached to 316 stainless steel, tantalum (Ta-lOW), and copper substrates are presented in Fig. 5-86. The maximum upper limit allowable for graphite, based on sublimation rates, was set at 2000°C because of excessive sublimation at higher temperatures. The upper temperature limits for the stainless steel, tantalum, and copper were chosen to be 500, 1000, and 200°C, respectively.
Both mechanical and brazed attachment concepts were investigated. Thermal contact conductances were varied from 0.001 W/cm2 — K (essen-tially no conduction contact, radiation cooling only) to 100 W/cm2 — K (essentially perfect contact). Values of the contact conductance up to approximately 0.5 W/cm2 — K are representative of mechanical attach-ments, whereas values above approximately 5.0 W/cm2 — K represent brazed connections.
As illustrated in Fig. S-86(b), the combination of graphite tiles attached to a stainless steel substrate cannot be used. There is no value of contact conductance that maintains both materials below their upper temperature limits.
The contact conductance for graphite attached to tantalum must be maintained above 0. 3 W/cm2 - K to maintain the graphite temperature below 2000°C [Fig. 5-86(b)]. Despite the good match of thermal expan-sion coefficients between tantalum and graphite, Tesults of braze stress calculations (shown in Table 5-22) indicate that the braze cannot be achieved because of excessive stresses during the braze cycle. There-fore, graphite tiles attached to a tantalum substrate could only be used if a mechanical attachment with very good thermal contact (contact conductance greater than 0.3 W/cm2 - K) were developed.
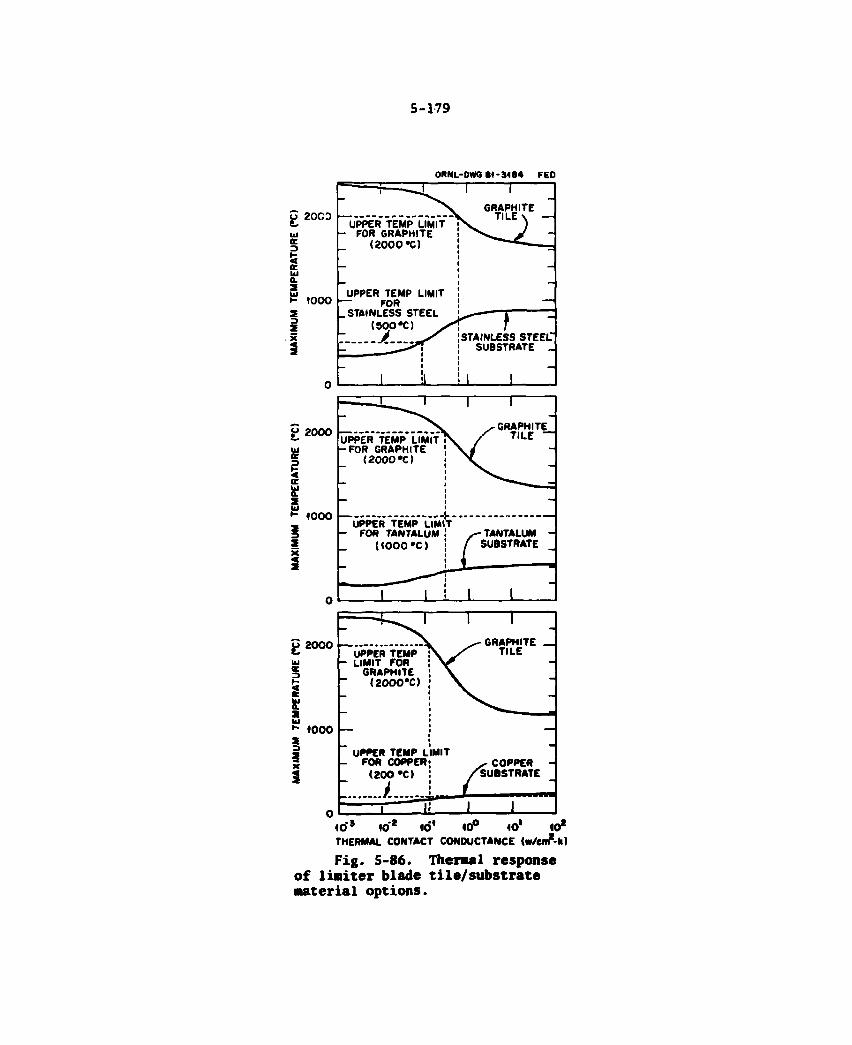
5-179
ORNL-DWG 81-3184 FED
2000
< ac a. 3
1000
s . x
_ — i — ^ J 1 1 GRAPHITE
^ TILE \ — UPPER TEMP LIMIT
^ TILE \ — - FOR GRAPHITE J -
(2000 *C) =
UPPER TEMP LIMIT -
— FOR i^"" T -
(300 *C) > f STAINLESS STEEL"
— K W V I 1 SUBSTRATE -
1 it 1 1
2000 UJ te
< tr Ui a 1000 I—
2 3 X «* s
J 1
UPPER* TEMP U M ^ X -FOR GRAPHITE J x
{2000*0 j i — i i t i
1 I
, GRAPHITE X TILE ~
UPPER TEMP LIMIT - FOR TANTALUM ! y TANTALUM -
(«000*C) J 1 — 1
f SUBSTRATE
^ ^ ^ ^ ^ 1
1 1 : 1 1
2000
oe 2
1000 3 3 s 3
UPPER TEMP LIMIT FOR
GRAPHITE (2OOO'C)
• GRAPHITE TILE
UPPER TEMP LIMIT FOR COPPER; ^ COPPER
(200 -C) I /SUBSTRATE
_L 1 40 fS 1 0 ' 10" id® 10' 10* THERMAL CONTACT CONDUCTANCE (w/enr?-h)
Fig. 5-86. Thermal response of liniter blade tile/substrate material options.
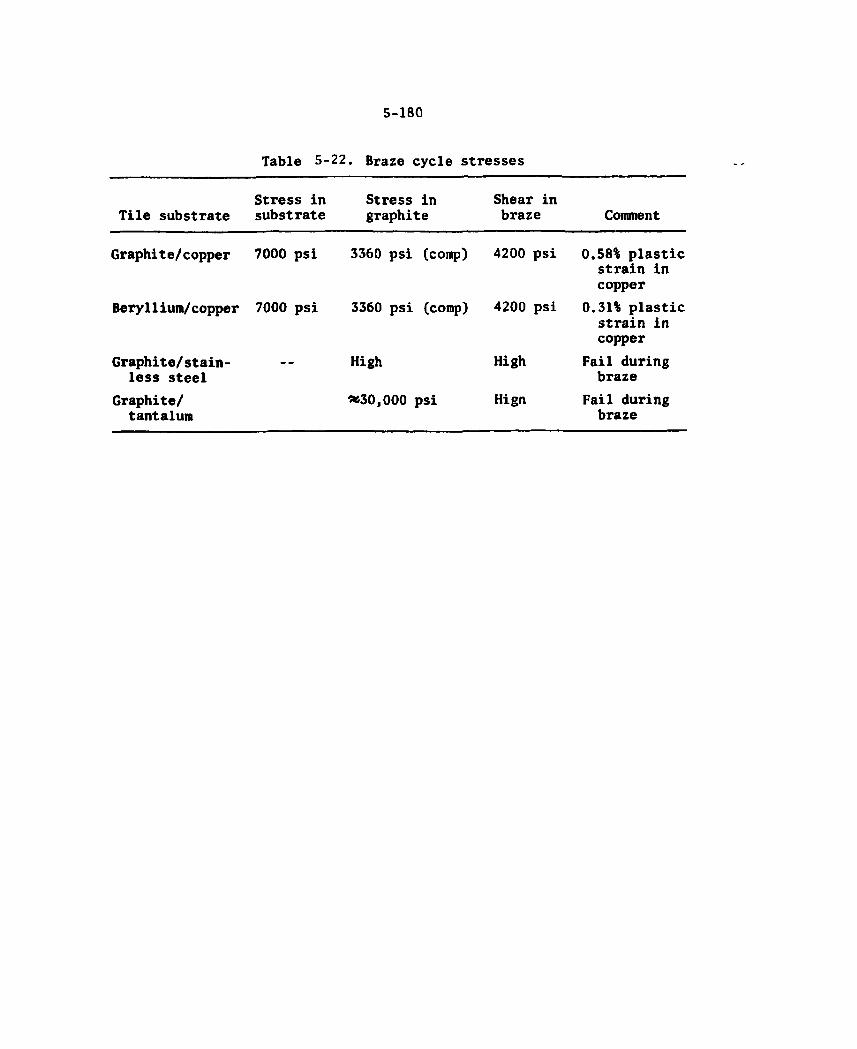
5-180
Table 5-22. Braze cycle stresses
Tile substrate Stress in substrate
Stress in graphite
Shear in braze Comment
Graphi t e/copper 7000 psi 3360 psi (comp) 4200 psi 0.58% plastic strain in copper
Beryl1ium/copper 7000 psi 3360 psi (comp) 4200 psi 0.31% plastic strain in copper
Graphite/stain-less steel
— High High Fail during braze
Graphite/ tantalum
*30,000 psi Hign Fail during braze
5-181
Results for graphite attached to a copper substrate are shown in Fig. 5-86(c). The copper temperature is near or below its 200°C upper limit for all values of the contact conductance. However, to maintain the graphite temperature below 2000°C, the contact conductance must be above 0.2 W/cm2 — K. Since it would be difficult to achieve and main-tain this relatively high value of the contact conductance with a mechanical attachment, brazing and diffusion bonding techniques are feasible options. Brazing consists of joining materials by the appli-cation of heat, causing the flow of a thin layer of braze material into the space between pieces. Intimate contact is produced by the dissolu-tion of a small amount of base metal in the molten braze material without fusion of the base metal.
Several different brazing techniques were investigated. One required melting a thin layer of braze material such as Ti/Cu/Ag on the face of graphite tile. The assembly is then furnace brazed at 840°C. Another method used a graded alpha attachment technique. This technique required the use of several layers of material between the graphite and metal substrate. The layers graded in expansivity from a high expan-sivity layer (a = 17 x 10 b per dSTgree centigrade) on the copper side to a lower expansivity layer (a = 8 * 10 ' per degree centigrade) on the ceramic side. The expansion coefficients of the intermediate layers are graded between these limits.
The use of a compliant layer between the graphite and the copper substrate was investigated. This layer would elastically absorb the stresses generated during thermal cycling by the mismatch in coeffi-cients of expansion of the graphite and the copper. This compliant layer could be a fiber metal pad approximately 0.060 in. thick. The pad is composed of randomly arrayed fibers which are sintered together to produce a fiber network of continuous porosity. Properties of the pad are controlled by density. The density is chosen to achieve a balance between compliance, high thermal contact conductance, and strength. The pad is brazed between the graphite tile and the copper substrate. During thermal cycling the pad allows for the two materials to expand and contract essentially independent of each other, and the shear
5-182
stresses at the braze joint become minimal, reducing the chance of failure in the braze joint. One problem area that would require development is the tendency for the pads to be good thermal insulators rather than good conductors. Compliant pads have, to date, been primarily used in applications such as MHD electrodes and jet engines where high conductance properties are not required. It may be feasible, however, to develop a pad which would provide good conductance and still retain the compliant properties. Additional data can be found.21*
A method similar to furnace brazing is diffusion bonding. A thin layer of Ti/Cu/Ag braze material is melted on the graphite tile at 840*C. The graphite tiles are stacked on the copper substrate using a thin layer of silver braze material, and the assembly is diffusion bonded in a vacuum at 750°C with applied compressive force. The assembly is slowly cooled, and an increasing compressive force is applied to cause creep deformation of copper and silver to compensate for the difference in expansion coefficients of the two materials.25
5.4.5 Future Work — Pump Limiter
Several limiter design issues need more detailed study and analysis in order to be resolved.
1. The armor tile-to-substrate attachment technique will require a research and development effort to determine the best design.
2. Plasma edge uncertainties need to be reduced because of impact on limiter life.
3. A better data base of the effects of chemical and physical erosion on different materials is needed.
4. Refurbishment and maintainability-related issues such as installa-tion/removal techniques (including handling and remote maintenance equipment), alignment of adjacent limiter segments, vacuum seal requirements, and structural attachment of the limiteT to the shield sector.
5. Experimental verification of pumped limiter performance. 6. Design of the electrical contacts to assure satisfactory electrical
current distribution during a disruption.
5-183
5.5 FED NUCLEAR ANALYSIS
An important aspect of the Fusion Engineering Device (FED) concep-tual design is the shielding design and associated nuclear analysis. The capital cost of bulk, duct, and component shielding for such a machine may constitute 10 to 20% of facility direct cost, and the design of the shielding greatly influences plant operation, safety, and main-tenance. Therefore, particularly in the initial design stages, major emphasis should be placed on nuclear analysis and shield design. Some of the major neutronics concerns are called out in Fig. 5-87.
As in the case of the Engineering Test Facility (ETF), the pro-genitor of FED, important shielding criteria include radiation damage to the inboard magnet insulation, resistivity changes in the copper stabilizer, nuclear heating in the magnet, and outboard activation levels, the latter determining accessibility after shutdown.
Earlier ETF design studies had established stainless steel and borated water as the preferred bulk shield materials. FED, with its lower wall loading and availability, enjoys somewhat relaxed shield requirements. For low availability, the inboard shield thickness is set by the nuclear heating limit in the inboard TF coils. The outboard shield thickness is dictated by the limits on personnel exposure during maintenance operations. With a lead layer of 5 cm and unborated water, a shutdown dose rate of 2.5 mrem/hr 24 hours after shutdown is achieved for the 8-T operation.
Inboard and outboard shield performance is summarized in Table 5-23. All nuclear analyses were performed for the 8-T case; the values shown for 10 T assume no change in the bulk shield design.
Major FED penetrations include TF and pumped limiter ducts. Neutron and gamma streaming during operation, with possible heating and damage to outboard components, and activation, gamma radiation after shutdown constitute the major problems of concern.
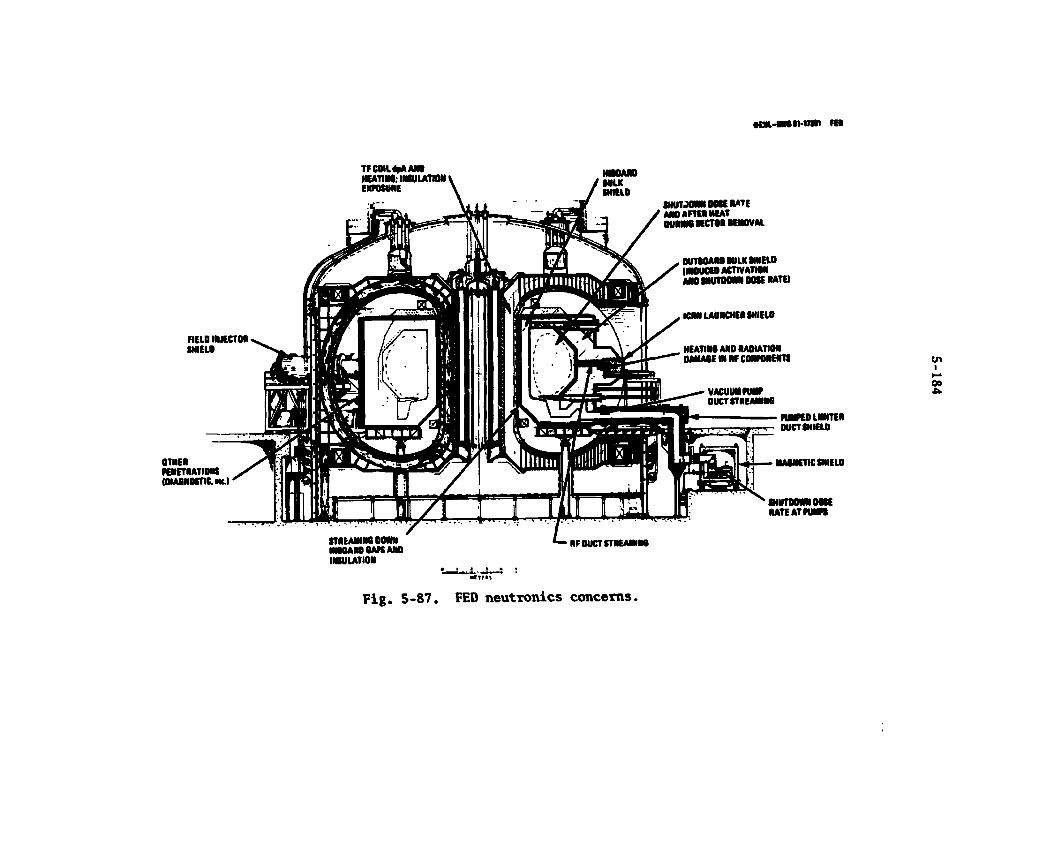
Kst-aMiMnn na
TFCOILfcAANO HCAT1M; INSULATION EXPOSURE
FIELD INJECTOR IHIELO
OTHER PENETRATIONS (DIAGNOSTIC. Mc.)
>TII LAW N6 DOWN MROARO GAPS AND INSULATION
RF OUCT STREAMING
SHOT JOHN DOSE RATE AHO AFTER HEAT DUR1M SECTOR REMOVAL
OUTROARORULK SHIELD IWOUCfO ACTIVATION ADO SHUTDOWN OOSE RATE]
•CRN LAUNCHER SHIELD
HEATINfi AND RAOIATION DAMA6E IN RF CONPONENTS tn
OO •e* PIMPED LMNTER OUCT SHIELD
MA8NET1C SHIELO
SHUTOOMNOOSE RATE AT PUMPS
Fig. 5-87. FED neutronics concerns.
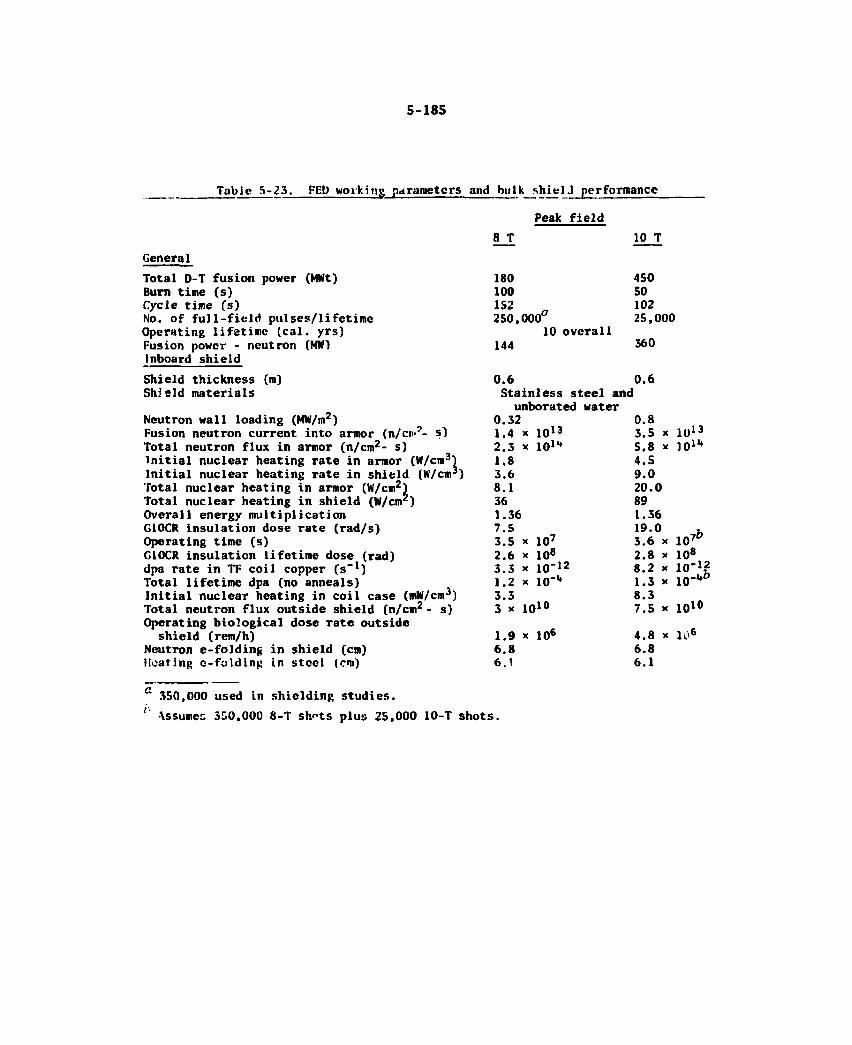
5-185
Table 5-23. FED working parameters and bulkshielJ performance
Peak field
General Total D-T fusion power (MWt) Burn time (s) Cycle time fs) No. of full-field pulses/lifetime Operating lifetime leal, yrs) Fusion power - neutron (MW) Inboard shield Shield thickness (m) Shield materials
Neutron wall loading (MW/m2) Fusion neutron current into armor (n/cn*7- s) Total neutron flux in armor (n/cm2- s) initial nuclear heating rate in armor (W/cm3) Initial nuclear heating rate in shield (W/cm3) Total nuclear heating in armor (W/cm2) Total nuclear heating in shield (W/cm2) Overall energy multiplication G10CR insulation dose rate (rad/s) Operating time (s) G10CR insulation lifetime dose (rad) dpa rate in TF coil copper (s-1) Total lifetime dpa (no anneals) Initial nuclear heating in coil case (mW/cm3) Total neutron flux outside shield (n/cm2 - s) Operating biological dose rate outside shield (rem/h)
Neutron e-folding in shield (cm) Heating e-folding in steel (cm)
8 T
180 100 152 250,000
10 overall 144
10 T
450 50 102
25,000 360
10'3 101-
0.6 Stainless steel and unborated water
0.32 1.4 2.3 1.8 3.6 8.1 36 1.36 7.5 3.5 2.6 3.3 1.2 3.3 3 x
0.6
x 107
x 108
x 1 0 " 1 2
x lO""
10l°
1.9 x 6.8 6.1
106
0.8 3.5 5.8 4.5 9.0 20.0 89 1.36 19.0 3.6 x 10 2.8 8 .2 1.3 8.3 7.5
1013 lO*-
7 b 108 10-1? 10 Mb
x 10 10
4.8 x 10⁶ 6 .8 6 .1
350,000 used in shielding studies. Assumes 350,000 8-T sh"ts plus 25,000 10-T shots.
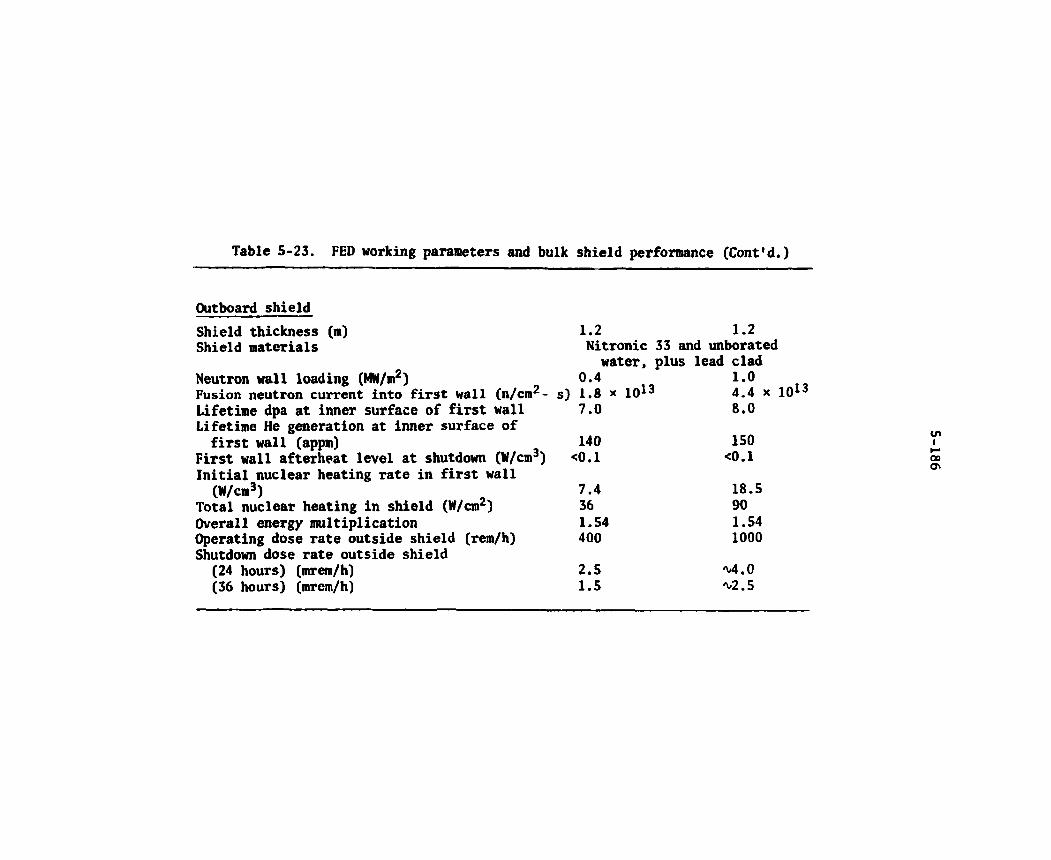
Table 5-23. FED working parameters and bulk shield performance (Cont'd.)
Outboard shield Shield thickness (m) Shield materials
Neutron wall loading (MN/m2) Fusion neutron current into first wall (n/cm2-Lifetime dpa at inner surface of first wall Lifetime He generation at inner surface of first wall (appm)
First wall afterheat level at shutdown (W/cm3) Initial nuclear heating rate in first wall
(W/cm3) Total nuclear heating in shield (W/cmz) Overall energy multiplication Operating dose rate outside shield (rem/h) Shutdown dose rate outside shield
(24 hours) (mrem/h) (36 hours) (mrem/h)
1.2 1.2 Nitronic 33 and unborated water, plus lead clad
0.4 1.0 1.8 * 1013 4.4 7.0 8.0
140 150 <0.1 <0.1
7.4 18.5 36 90 1.54 1.54 400 1000
2.5 M . O 1.5 ^2.5
5-187
5.5.1 Shield Design Criteria
An important initial step in any shield design is the establishment of radiation criteria, i.e., the material and biological dose and dose rate limits. Many radiation criteria for fission power reactors have been standardized and documented in various regulatory codes, guides, and handbooks. The fusion industry must exercise considerable flexibil-ity in the choice of radiation criteria until more design, construction, and operating experience is acquired.
In the case of the FED, now in the preconceptual design phase, the setting of radiation criteria is a cooperative effort involving the several participating organizations.
A summary of FED shield design criteria, together with a list of conversion factors, is presented in Table 5-24.
Material dose criteria
The important radiation effects are insulation damage, TF coil resistivity increase, and nuclear heating. A continuing survey of expert opinion and experimental results on radiation effects shows some rather wide ranges for the key design criteria.
The importance attached to the question of electrical insulation radiation damage was demonstrated by the convening of a meeting by R. J. Dowling at DOE Headquarters in Germantown on December 2 and 3, 1980, on "Electrical Insulators for Fusion Magnets." The meeting included 26 presentations covering every aspect of fusion magnet insula-tion, particularly irradiation problems.
In the ETF design26 a dose limit of 109 rads was selected for G10CR insulation. Many magnet designers, however, would prefer a lower limit or to switch to a more advanced insulator such as Kapton, Epon, or some other polyimide. Nygren has concluded that "G-10 is suspect beyond a 2 x 10⁸ rads but may be useful to 109 rads".27 Therefore, until more definitive information becomes available on fast-neutron radiation effects on G10 at cryogenic temperatures, the FED criterion will be maintained at 109 rads, but an attempt should be made to keep well below this level in actual inboard bulk shield design.
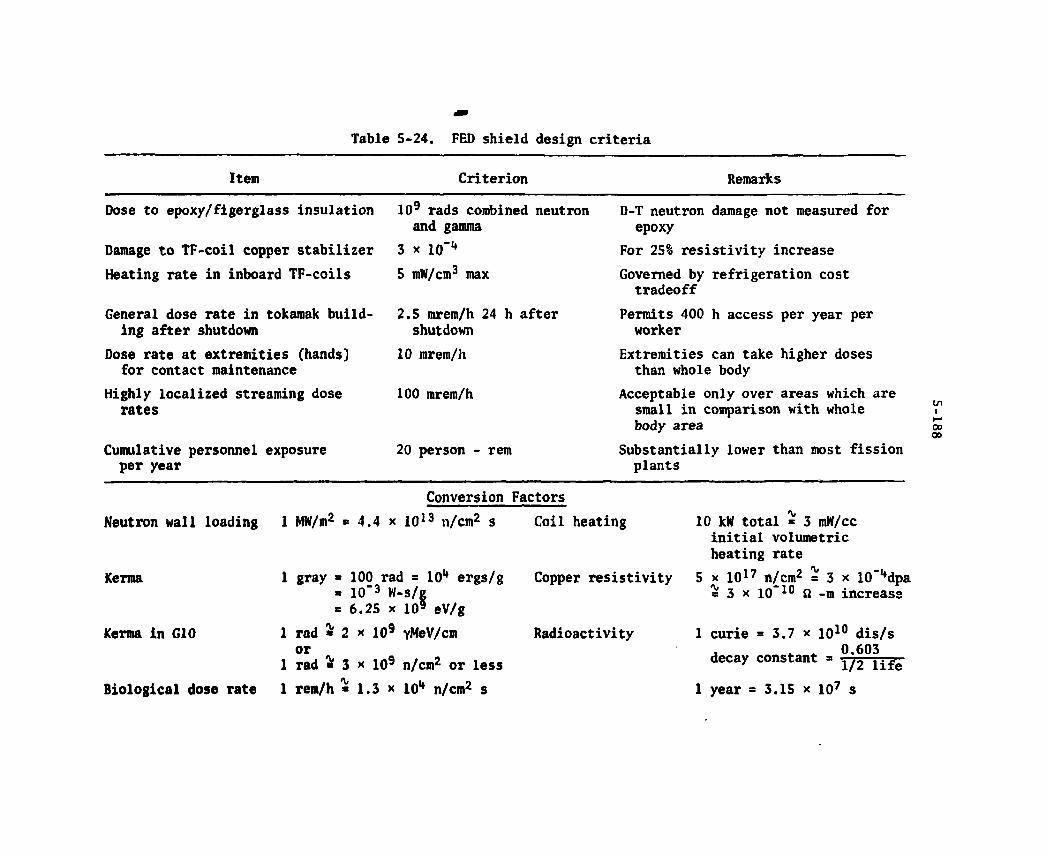
Table 5-24. FED shield design criteria
Item Criterion Remarks
Dose to epoxy/figerglass insulation 109 rads combined neutron D-T neutron damage not measured for and gamma epoxy
Damage to TF-coil copper stabilizer 3 x lo-- For 25% resistivity increase Heating rate in inboard TF-coils 5 mW/cm3 max Governed by refrigeration cost
tradeoff General dose rate in tokamak build- 2.5 mrem/h 24 h after Permits 400 h access per year per ing after shutdown shutdown worker
Dose rate at extremities (hands) 10 mrem/h Extremities can take higher doses for contact maintenance than whole body
Highly localized streaming dose 100 mrem/h Acceptable only over areas which are rates small in comparison with whole
body area Cumulative personnel exposure 20 person - rem Substantially lower than most fission per year plants
Conversion Factors Neutron wall loading 1 MW/m2 = 4.4 x 10¹³ n/cm2 s Coil heating
Kertna
Kerma in G10
Biological dose rate
1 gray » 100 rad • 101* ergs/g » 10"3 W-s/e = 6.25 x 10⁹ eV/g
1 rad - 2 x 10⁹ vMeV/cm or
1 rad ^ J x 109 n/cm2 or less 1 rem/h » 1.3 * io1* n/cm2 s
Copper resistivity
Radioactivity
10 kW total = 3 mW/cc initial volumetric heating rate
5 x 10¹⁷ n/cm2 = 3 x 10"\lpa = 3 x 10~10 ft -m increase
1 curie = 3.7 X IO10 dis/s * * 0.603 decay constant = l i f e
1 year = 3.15 X IO7 s
5-189
The radiation induced resistivity increase in the TF-coil copper stabilizer should probably be limited to 25% of that of the preirradi-ated matrix (including magnetoresistivity).28 Other recommendations in the literature range from 10% increase to doubling the resistance. Periodic annealing is usually prescribed to restore conductivity, but two to three months may be required to cool down the magnet from room temperature down to 4 K. The initial resistivity of the copper stabil-izer is about 10~9 8 — m. A 25% increase amounts to 2.5 x 10"10 fi — m, corresponding to a neutron fluence of about 5 x 10¹⁷ n/cm2 or 2.5 * lO"4 dpa (based on 5 * 10~22 dpa per unit fluence).
Radiation effects on the superconductor invariably occur later than those in the copper stabilizer, and hence no radiation criterion is needed for the superconductor.
In many tokamak studies nuclear heating in the inboard TF coils has been limited to around 5 milliwatts/cm3, peak. Frequently, control of nuclear heating in the coils follows automatically from control of radiation exposure, particularly in designs with high load factors. For instance, in the case of STARFIRE,29 the radiation-induced resis-tivity increase in the stabilizer is 2.2 * 10~10 0 — m, and the maximum dose to the electrical insulator is 1.2 x 10⁹ rads, both quantities being very close to FED design criteria. However, the maximum heating rate in the helium tank is only 0.03 mW/cm3, far below most nuclear heating design criteria.
In the case of an experimental or testing device such as FED, the load factor and operating life will be much less than for a comercial plant. Hence, the ratio between instantaneous exposure rate and inte-grated exposure will be much higher for FED. It was found earlier that when FED had a load factor of only 2%, for any coil heating rates up to 20 aM/cm3 the insulation exposure remained well below 109 rads.
The nuclear heating criterion for the inboard coils is primarily determined by economic considerations. Plasma performance improves, and capital cost for the entire machine drops as the inboard shield thick-ness is reduced. However, the capital and power costs for coil refrig-eration increase because of the larger nuclear heating rr-rc- .

5-190
Ten kW total nuclear heating in the coils is considered to be a realistic criterion. This total heat load corresponds to a maximum volumetric heating rate in the inboard coil case of approximately 3 mW/cm3. However, an increase in nuclear heating to 5 mW/cm3, or 15 kW for the entire coil assembly, would increase total coil heating from all sources by less than 10%. Therefore, the 5 mW/cm3 criterion used in ETF studies26 has been retained for FED.
Biological dose criteria
A design goal of the FED is to allow hands-on maintenance external to the bulk shield. For relatively unlimited access to the tokamak building after shutdown, personnel dose and dose rate criteria can be modeled after: (1) NRC/DOE guidelines, (2) nuclear fission plant practice, and (3) parameters already established for other fusion devices such as TFTR.
NRC guidelines are delineated principally in 10CFR20 and Regulatory Guide 8.8. The latter is directed mainly at light-water power reactors and specifies that occupational exposures be "as low as reasonably achievable" (ALARA). The Code of Federal Regulations 10CFR20 specifies 1.25 rem/quarter for radiation workers, but it is in the process of being revised to incorporate ALARA principles.
DOE radiation guidelines are given in Chapter XI of the Department of Energy Environmental Safety and Health Manual, where it is stated that radiation worker exposure in controlled areas must not exceed 5 rem/year. However, this limit is subject to the provisions of ALARA guidelines, which specify that "on-site personnel exposure levels less than one-fifth of the permissible dose equivalent limits prescribed in this chapter should be used as a design objective."
Current f iss ion plant design practice is also to l i m i t worker exposure to o n e - f i f t h o f 10CFR20 regulations, namely, 1 rem/yeaT or approxiaately 0.5 mreq/hour for continuous 40-hour work weeks. Usually, continuous access to radiat ion areas i s not required, in which cases higher general dose rates are permissible. Co l lec t ive ly , LMR plants are
5-191
experiencing about 500 person-rem per unit-year accumulative occupa-tional exposure, which NRC considers excessive.
With respect to other fusion plant designs, the TFTR on-site radiation design objective is <1 rem/year. in a controlled area, which is in accord with DOE guidelines.
Consideration of the foregoing and a review of ETF biological radiation criteria led to a selection of personnel exposure criteria for FED, including a shutdown dose rate of 2.5 mrem/h.
5.5.2 Methods and Data
For bulk shield scoping, optimization, and preconceptual design purposes, one-dimensional discrete-ordinates methods were deemed ade-quate for neutron and gamma flux and response calculations. The cal-culations previously performed for the ETF study were used as a basis for selecting the analytical methods for FED. Most of the ETF bulk shield calculations were performed using the ANISN 1-D discrete ordinates code30 in slab geometry, with a 25-neutron, 21-gamma cross section set derived from DLC-41 at Oak Ridge.31 The energy structure of this set is shown in Table 5-25. The relatively fine structure used for the first ten broad neutron groups assures that the weighting functions used above 5 MeV would have little impact on the cross section accuracy, but results from comparative analyses indicate that the groups are too coarse in the lower energy ranges of both neutrons and gammas.
Another 1-D discrete ordinates code is the Los Alamos ONEDANT code.32 This code has several advantages over ANISN in the areas of input/output format, ease of changing mixtures for parametric studies, and acceptance of user response functions. It was, therefore, used for most of the FED bulk shield studies. The associated cross section set is the standard Los Alamos 42-energy-group structure containing 30 neutron and 12 gamma-ray energy groups.33 This energy group structure is presented in Table 5-26. It also suffers from a too-broad gamma-ray grouping below 1 MeV but has a better coverage of epithermal neutrons than the DLC-41 25/21 grouping.
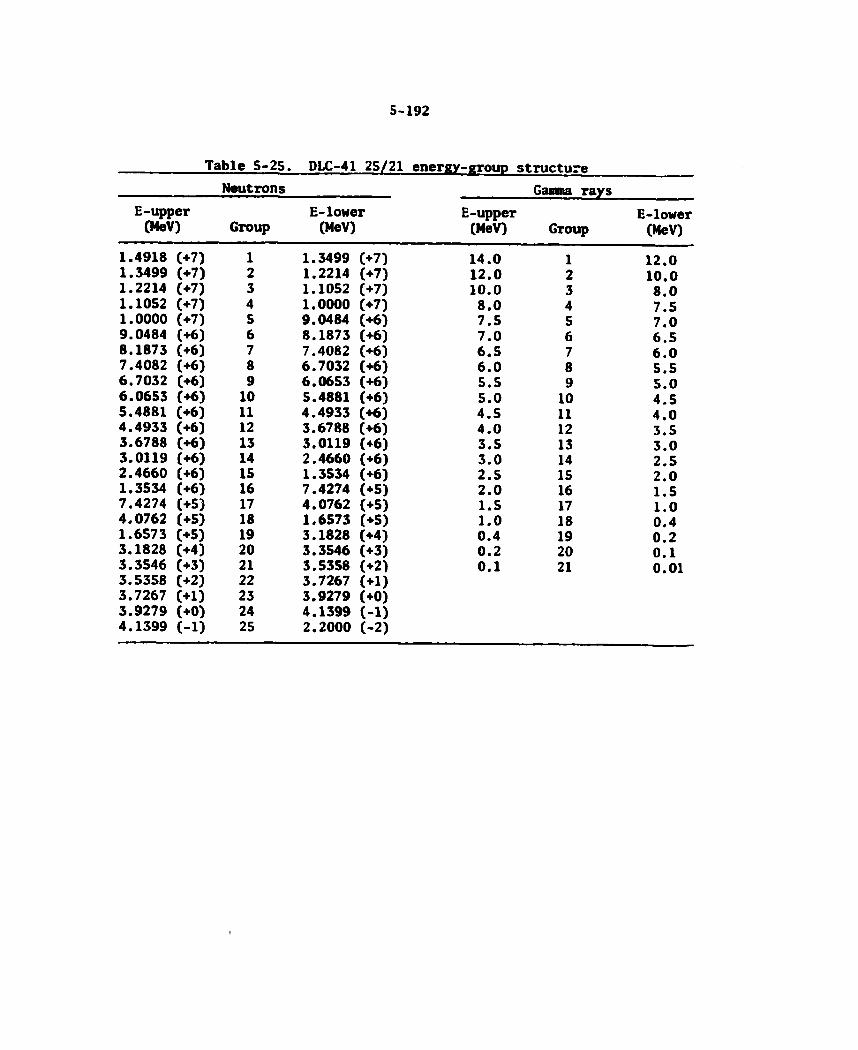
5-192
Table 5-25. PLC-41 25/21 energy-group structure Neutrons Gamna rays
E-upper E-lower E-upper E-lower (MeV) Group (MeV) (MeV) Group (MeV)
1.4918 +7) 1 1.3499 +7) 14.0 1 12.0 1.3499 •7) 2 1.2214 •7) 12.0 2 10.0 1.2214 +7) 3 1.1052 +7) 10.0 3 8.0 1.1052 •7) 4 1.0000 •7) 8.0 4 7.5 1.0000 •7) S 9.0484 •6) 7.5 5 7.0 9.0484 +6) 6 8.1873 •6) 7.0 6 6.5 8.1873 +6) 7 7.4082 +6) 6.5 7 6.0 7.4082 •6) 8 6.7032 +6) 6.0 8 5.5 6.7032 •6) 9 6.0653 +6) 5.5 9 5.0 6.0653 •6) 10 5.4881 +6) 5.0 10 4.5 5.4881 •6) 11 4.4933 +6) 4.5 11 4.0 4.4933 •6) 12 3.6788 +6) 4.0 12 3.5 3.6788 +6) 13 3.0119 •6) 3.5 13 3.0 3.0119 •6) 14 2.4660 •6) 3.0 14 2.5 2.4660 +6) 15 1.3534 •6) 2.5 15 2.0 1.3534 •6) 16 7.4274 •5) 2.0 16 1.5 7.4274 +5) 17 4.0762 +5) 1.5 17 1.0 4.0762 +5) 18 1.6573 •5) 1.0 18 0.4 1.6573 •5) 19 3.1828 +4) 0.4 19 0.2 3.1828 +4) 20 3.3546 •3) 0.2 20 0.1 3.3546 •3) 21 3.5358 •2) 0.1 21 0.01 3.5358 +2) 22 3.7267 •1) 3.7267 +1) 23 3.9279 •0) 3.9279 +0) 24 4.1399 -1) 4.1399 -1) 25 2.2000 -2)
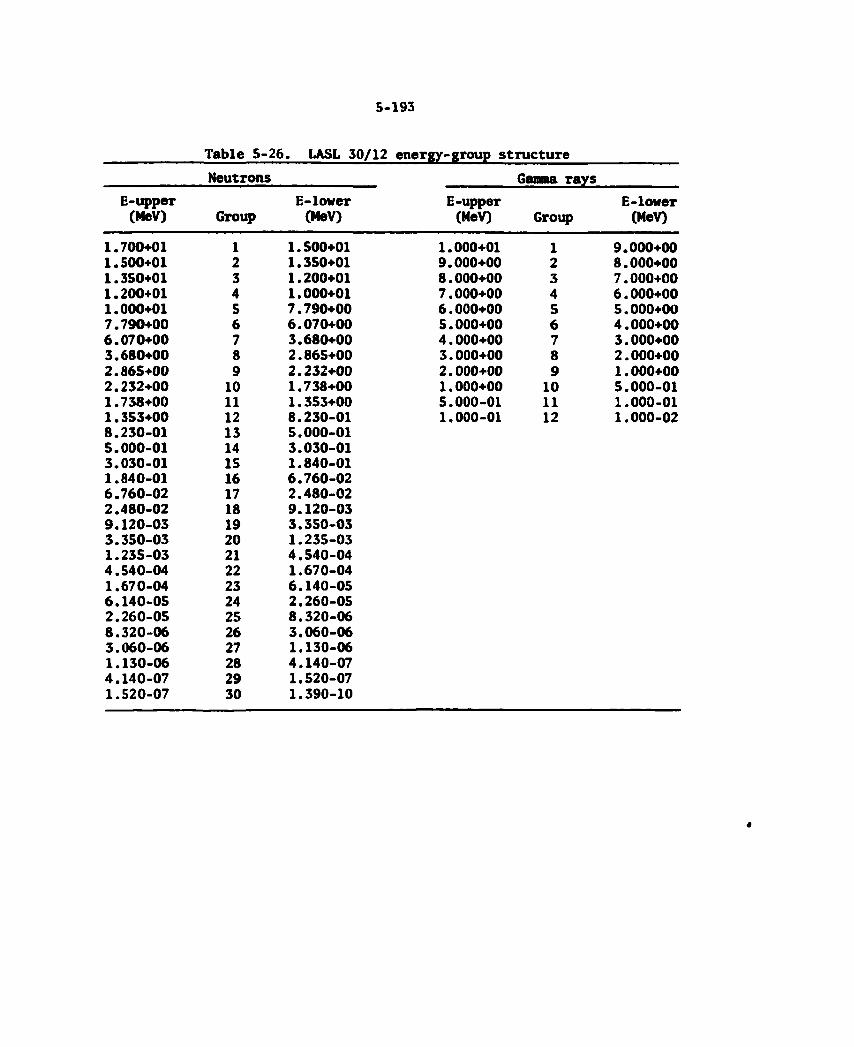
5-193
Table 5-26. LASL 30/12 energy-group structure Neutrons Ganma rays
E-upper E-lower E-upper E-lower (MeV) Group (MeV) (MeV) Group (MeV)
1.700401 1 1.500401 1.000401 1 9.000400 1.5004-01 2 1.350401 9.000400 2 8.000400 1.350+01 3 1.200401 8.000400 3 7.000400 1.200+01 4 1.000401 7.000400 4 6.000400 1.000401 5 7.790400 6.000400 5 5.000400 7.790400 6 6.070400 5.000400 6 4.000400 6.070400 7 3.680400 4.000400 7 3.000400 3.680400 8 2.865400 3.000400 8 2.000400 2.865400 9 2.232400 2.000400 9 1.000400 2.232400 10 1.738400 1.000400 10 5.000-01 1.738400 11 1.353400 5.000-01 11 1.000-01 1.353400 12 8.230-01 1.000-01 12 1.000-02 8.230-01 13 5.000-01 5.000-01 14 3.030-01 3.030-01 15 1.840-01 1.840-01 16 6.760-02 6.760-02 17 2.480-02 2.480-02 18 9.120-03 9.120-03 19 3.350-03 3.350-03 20 1.235-03 1.235-03 21 4.540-04 4.540-04 22 1.670-04 1.670-04 23 6.140-05 6.140-0S 24 2.260-05 2.260-05 25 8.320-06 8.320-06 26 3.060-06 3.060-06 27 1.130-06 1.130-06 28 4.140-07 4.140-07 29 1.520-07 1.520-07 30 1.390-10
5-194
With respect to response function data, the ANISN/DLC-41 combina-tion is usually augmented with kerma and reaction cross sections from the ORNL DLC-60 (MACKLIB-IV) library. The ONEDANT code, on the other hand, utilizes user-supplied reaction cross sections; kerma cross sections are already included in the LASL set.
Activation cross sections for individual isotopes are often dif-ficult to obtain. For example, the 63Cu cross sections are not all available separately in MACK IV, nor are some of the individual Ni reactions. Therefore, activation cross sections were prepared specif-ically for input to the ONEDANT code, using BNL-325 and other standard references. These are listed in Table 5-27.
Methods and data used by LASL and ORNL in their duct streaming calculations are cited separately.
A few shutdown gamma calculations were performed using the PATH point kernel code.3** This approach has the advantage of 3-D geometry and more accurate treatment of low-energy gamma-rays using the buildup-factor method.
5.5.3 Bulk Shield Design
Nuclear design of a tokamak bulk shield is a much more complex problem than the analogous design of a fission-reactor shield. The competing requirements on the inboard shield minimum thickness versus adequate protection of inboard components versus low cost is challenging enough, without the additional complexities of gaps, penetrations, and inhomogeneities. The outboard shield, on the other hand, is more likely to be designed to limit the shutdown dose rate; this portion of the bulk shield is penetrated by large ducts (NBI, vacuum, TF, and/or divertor), and the bulk and duct shielding must be integrated.
Abdou has considered the influence of inboard shield design on the torus and TF coil dimensions.35 The results of his studies show that large economic benefits accrue in minimizing the thickness of the inboard shield. On the other hand, tradeoff studies performed by Woods36 and others indicate that incorporation of exotic materials such
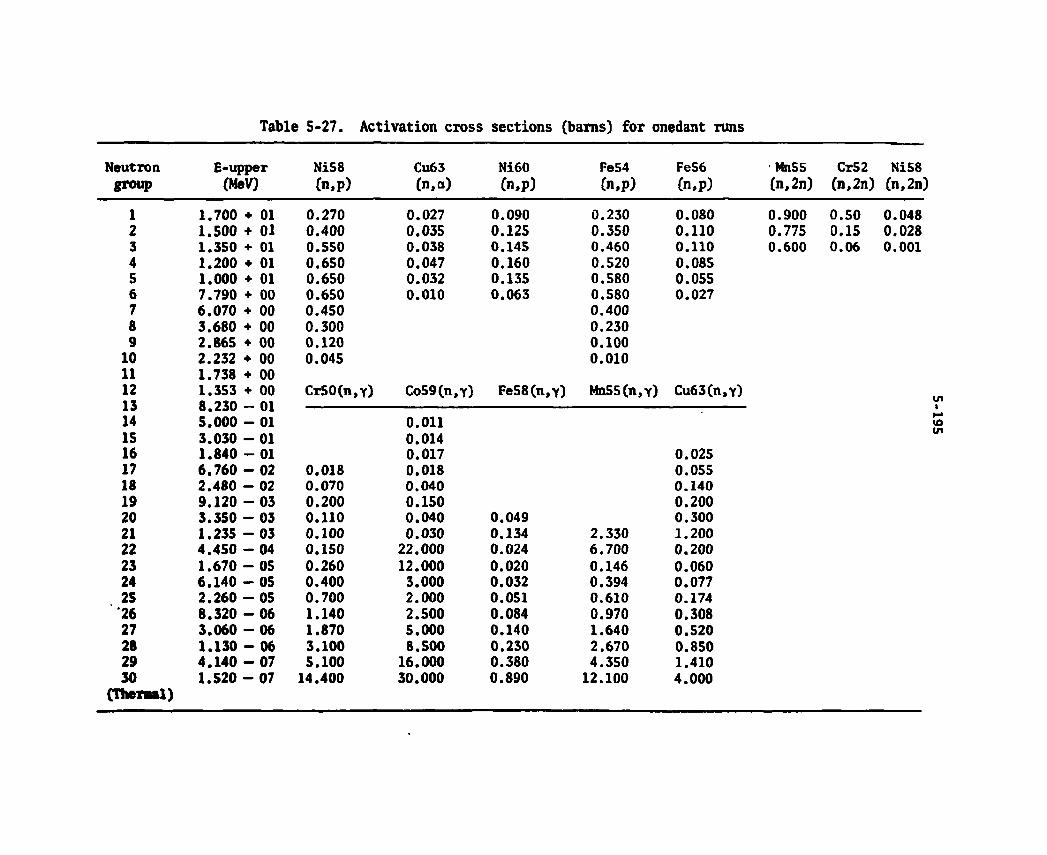
Table 5 -27 . Act ivat ion cross sections (barns) for onedant runs
NeutTon E-upper Ni58 Cu63 Ni60 Fe54 Fe56 group (MeV) ( n , p ) (n,cr) ( n , p ) ( n , p ) Cn,p)
1 1 . 7 0 0 + 01 0 . 2 7 0 0 . 0 2 7 0 . 0 9 0 0.230 0 . 0 8 0 2 1 . 5 0 0 + 01 0 . 4 0 0 0 . 0 3 5 0 . 1 2 5 0 . 3 5 0 0 . 1 1 0 3 1 . 3 5 0 + 01 0 . 5 5 0 0 . 0 3 8 0 . 1 4 5 0.460 0 . 1 1 0 4 1 . 2 0 0 • 01 0 . 6 5 0 0 . 0 4 7 0 . 1 6 0 0 . 5 2 0 0 . 0 8 5 5 1 . 0 0 0 + 01 0 . 6 5 0 0.032 0 . 1 3 5 0 . 5 8 0 0.055 6 7 . 7 9 0 + 00 0.650 0.010 0.063 0 . 5 8 0 0 . 0 2 7 7 6.070 + 00 0.450 0.400 8 3 . 6 8 0 + 00 0.300 0 . 2 3 0 9 2 . 8 6 5 + 00 0.120 0.100 10 2.232 + 00 0.045 0.010 11 1.738 + 00 12 1.353 + 00 Cr50(n,Y) Co59(n,y) Fe58(n,Y) Mn55(n,Y) Cu63(n,Y) 13 8.230 - 01 13 8.230 - 01 14 5.000 - 01 0 . 0 1 1 15 3.030 - 01 0.014 16 1.840 - 01 0.017 0 . 0 2 5 17 6.760 - 02 0.018 0.018 0.055 18 2.480 - 02 0.070 0.040 0.140 19 9.120 - 03 0.200 0.150 0.200 20 3.350 - 03 0.110 0.040 0.049 0.300 21 1.235 - 03 0.100 0.030 0.134 2 . 3 3 0 1 . 2 0 0 22 4.450 - 04 0.150 22.000 0 . 0 2 4 6 . 7 0 0 0.200 23 1.670 - 05 0.260 12.000 0.020 0.146 0.060 24 6.140 - 05 0.400 3.000 0.032 0.394 0.077 25 2.260 - 05 0.700 2.000 0.051 0 . 6 1 0 0.174 '26 8.320 - 06 1.140 2.500 0.084 0.970 0.308 27 3.060 - 06 1.870 5.000 0.140 1.640 0.520 28 1.130 - 06 3.100 8.500 0.230 2.670 0.850 29 4.140 - 07 5.100 16.000 0.380 4.350 1.410 30 1.520 - 07 14.400 30.000 0.890 12.100 4.000
Mn55 Cr52 Ni58 (n f2n) (n,2n) (n,2n)
0.900 0.775 0.600
0.50 0.15 0.06
0.048 0.028 0.001

5-196
as tungsten may not be cost-effective. Hence, an early decision in the ETP/FED preconceptual design stage was to retain the stainless steel and water combination of shielding materials proposed in the Westinghouse/ ORNL TNS concept.37 These materials are relatively inexpensive, well understood in both physical and nuclear properties, readily fabricable, and domestically available, and the water can also serve as the coolant.
It was known from analyses performed by Gilai38 and others that enhanced shield performance can be obtained by a judicious preferential distribution of materials, as opposed to a homogeneous mixture of stainless steel and water. A major caveat governs this approach—the intent should be to minimize the shield thickness for the most important single radiation criterion, whether it be exposure of TF coil organic insulation, displacements in copper, heating rate in the coil case, or shutdown radiation level outside the shield. In optimizing for a single criterion, it is tacitly assumed that considerable design margins exist in the other criteria.
Experience with ETF bulk shield design39'1+0 showed that optimizing the shield for minimum total neutron leakage leads to approximate minima in dpa in copper, rads to G-10, and shutdown dose rate. Therefore, the approach taken in the FED bulk shield preconceptual design was to develop a simple configuration of shield layers which could then be applied to both inboard and outboard bulk shields.
Shield optimization study
Some initial survey calculations were made to evaluate the effects of assumptions such as geometry using the ONEDANT code, followed by actual optimization calculations.
A comparison was made between slab, cylindrical, and spherical geometries. A cross section of the poloidal cylindrical geometry case is shown in Fig. 5-88. The shield layer compositions and thicknesses assumed represent a simplification of the ETF outboard shield configura-tion.39 The cylindrical poloidal geometry produced the greatest flux outside the shield, so for conservatism, this geometry was chosen for subsequent calculations.
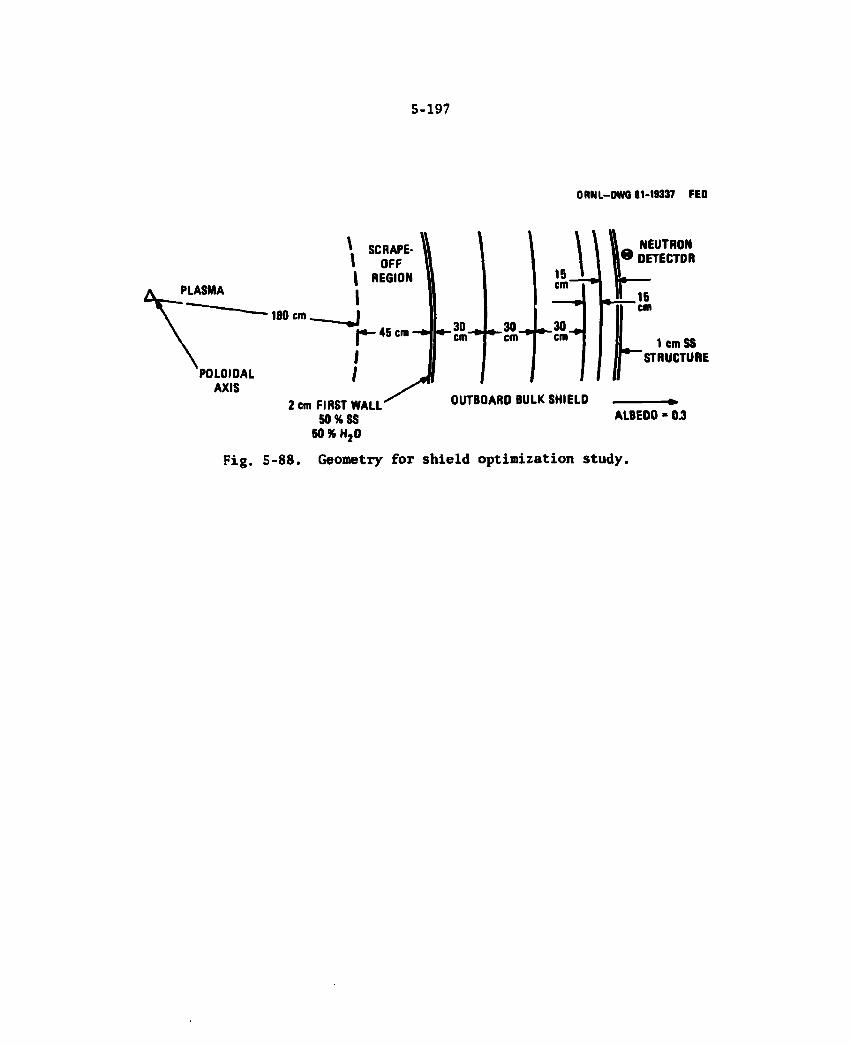
5-197
ORNL-DWG 81-19337 FED
Fig. 5-88. Geometry for shield optimization study.
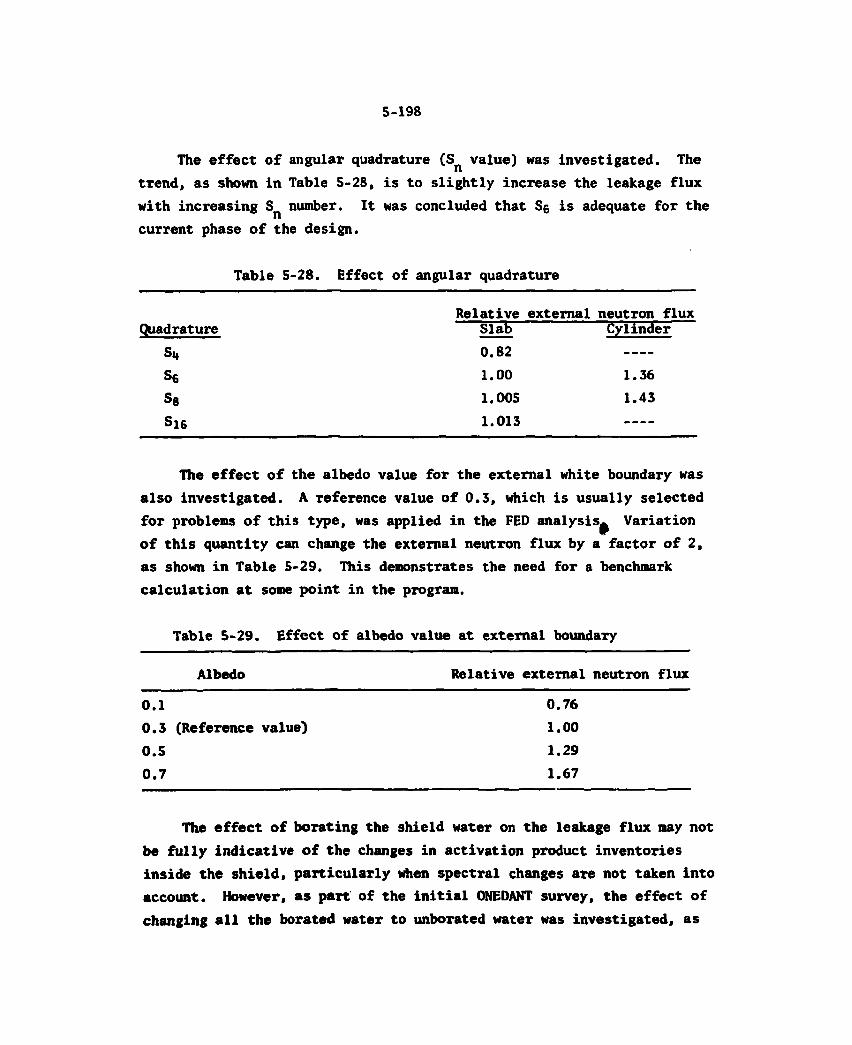
5-198
The effect of angular quadrature (Sn value) was investigated. The trend, as shown in Table 5-28, is to slightly increase the leakage flux with increasing number. It was concluded that S6 is adequate for the current phase of the design.
Table 5-28. Effect of angular quadrature
Relative external neutron flux Quadrature Slab Cylinder
S„ 0.82 s6 1.00 1.36 S8 1.005 1.43 Si6 1.013
The effect of the albedo value for the external white boundary was also investigated. A reference value of 0.3, which is usually selected for problems of this type, was applied in the FED analysis^ Variation of this quantity can change the external neutron flux by a factor of 2, as shown in Table 5-29. This demonstrates the need for a benchmark calculation at some point in the program.
Table 5-29. Effect of albedo value at external boundary
Albedo Relative external neutron flux
0.1 0.76 0.3 (Reference value) 1.00 0.5 1.29 0.7 1.67
The effect of borating the shield water on the leakage flux may not be fully indicative of the changes in activation product inventories inside the shield, particularly when spectral changes are not taken into account. However, as part of the initial ONEDANT survey, the effect of changing all the borated water to unborated water was investigated, as
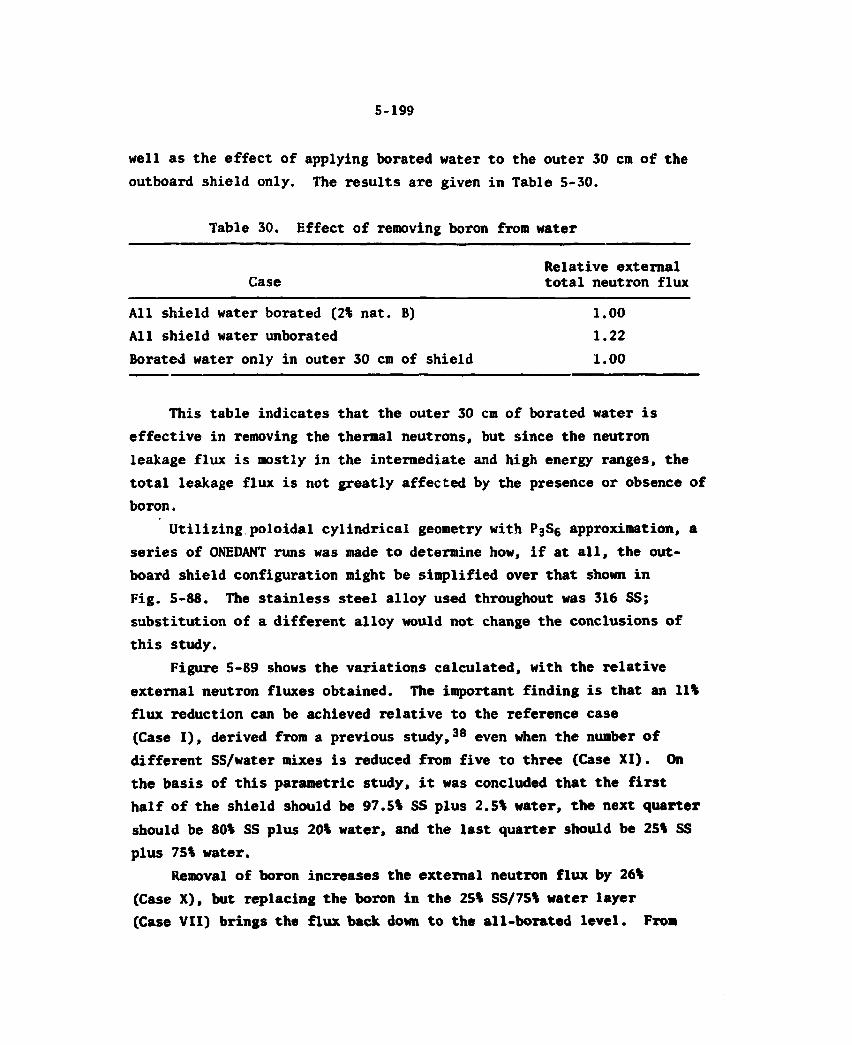
5-199
well as the effect of applying borated water to the outer 30 cm of the outboard shield only. The results are given in Table 5-30.
Table 30. Effect of removing boron from water
Relative external Case total neutron flux
All shield water borated (2% nat. B) 1.00 All shield water unborated 1.22 Borated water only in outer 30 cm of shield 1.00
This table indicates that the outer 30 cm of borated water is effective in removing the thermal neutrons, but since the neutron leakage flux is mostly in the intermediate and high energy ranges, the total leakage flux is not greatly affected by the presence or obsence of boron.
Utilizing poloidal cylindrical geometry with PgSg approximation, a series of ONEDANT runs was made to determine how, if at all, the out-board shield configuration might be simplified over that shown in Fig. 5-88. The stainless steel alloy used throughout was 316 SS; substitution of a different alloy would not change the conclusions of this study.
Figure 5-89 shows the variations calculated, with the relative external neutron fluxes obtained. The important finding is that an 11% flux reduction can be achieved relative to the reference case (Case I), derived from a previous study,38 even when the number of different SS/water mixes is reduced from five to three (Case XI). On the basis of this parametric study, it was concluded that the first half of the shield should be 97.5% SS plus 2.5% water, the next quarter should be 80% SS plus 20% water, and the last quarter should be 25% SS plus 75% water.
Removal of boron increases the external neutron flux by 26% (Case X), but replacing the boron in the 25% SS/75% water layer (Case VII) brings the flux back down to the all-borated level. From
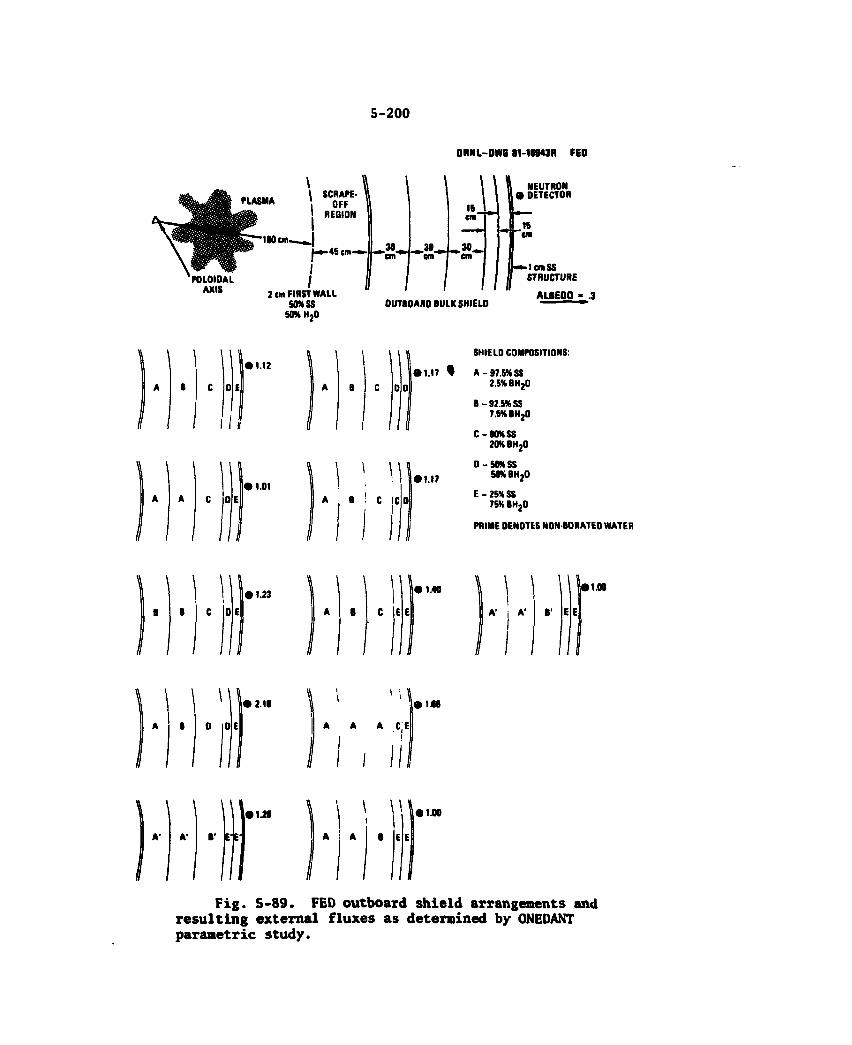
5-200
ORNL-DWG S1-16943R FEO
PLASMA
\
110 an.
\ SCRAPE-OFF
REGION
-•-45 cm-»-
POLOIDAL AXIS 2 cm FIRST WALL
50* SS SOKH2O
15 cm — « -
30 _ _ 30 em cm cm
NEUTRON • DETECTOR
OUTBOARD BULK SHIELD
cmSS STRUCTURE
ALBEOO - .3
• 1.12
II
• 1.01
SHIELD COMPOSITIONS:
• 1.17 T A - 97.5KSS 2.S«BH20
B - 92.5% SS 7.5KBH.0
» \ B : C
• 1.17
C-SOKSS 20KBH20
D - 5 0 K S S SOSBHJO
E - 25% SS 7SKBH20
PRIME DENOTES NON-BORATEO WATER
• 1.23 11.40
A'
>1M
\
0 0 • 2.10
B' l«1.2f
E' El
• IBB A A A C!E
I I
\ 1 ^ A A B
11.00
Fig. 5-89. FED outboard shield arrangements and resulting external fluxes as determined by ONEDANT parametric study.
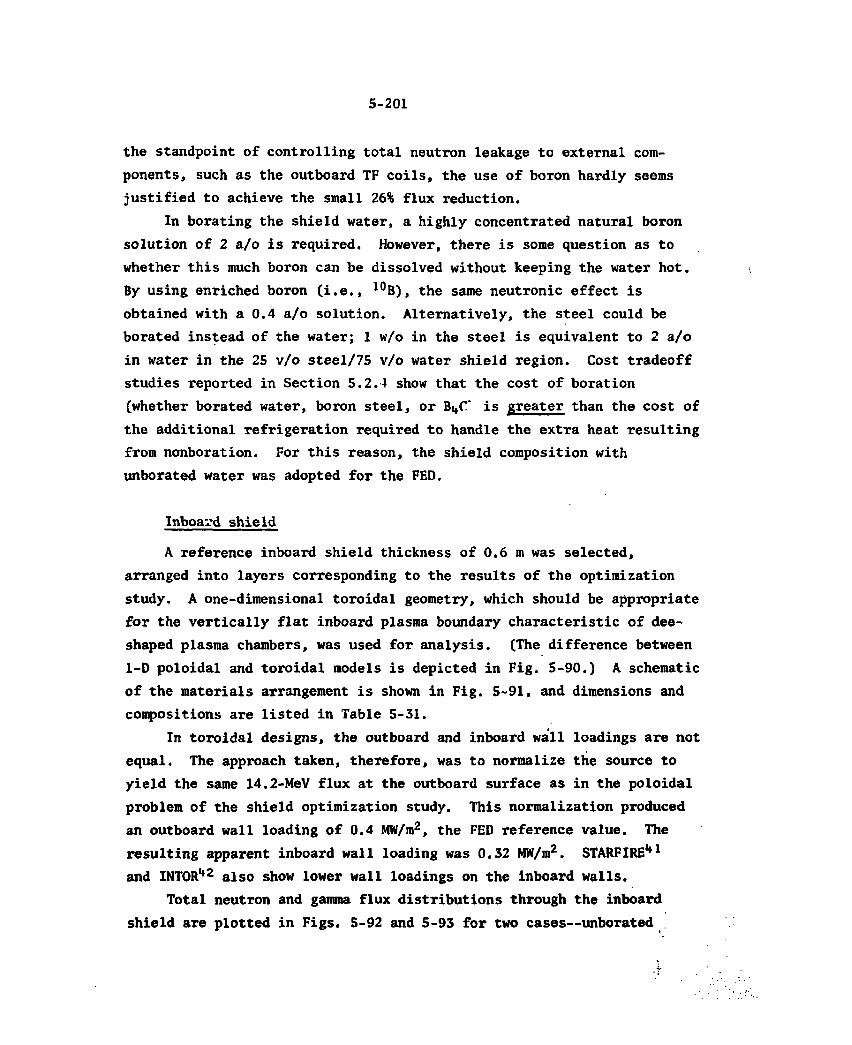
5-201
the standpoint of controlling total neutron leakage to external com-ponents, such as the outboard TF coils, the use of boron hardly seems justified to achieve the small 26% flux reduction.
In borating the shield water, a highly concentrated natural boron solution of 2 a/o is required. However, there is some question as to whether this much boron can be dissolved without keeping the water hot. By using enriched boron (i.e., 10B), the same neutronic effect is obtained with a 0.4 a/o solution. Alternatively, the steel could be borated instead of the water; 1 w/o in the steel is equivalent to 2 a/o in water in the 25 v/o steel/75 v/o water shield region. Cost tradeoff studies reported in Section 5.2.4 show that the cost of boration (whether borated water, boron steel, or B^C is greater than the cost of the additional refrigeration required to handle the extra heat resulting from nonboration. For this reason, the shield composition with unborated water was adopted for the FED.
Inboard shield
A reference inboard shield thickness of 0.6 m was selected, arranged into layers corresponding to the results of the optimization study. A one-dimensional toroidal geometry, which should be appropriate for the vertically flat inboard plasma boundary characteristic of dee-shaped plasma chambers, was used for analysis. (The difference between 1-D poloidal and toroidal models is depicted in Fig. 5-90.) A schematic of the materials arrangement is shown in Fig. 5-91, and dimensions and compositions are listed in Table 5-31.
i In toroidal designs, the outboard and inboard wall loadings are not
equal. The approach taken, therefore, was to normalize the source to yield the same 14.2-MeV flux at the outboard surface as in the poloidal problem of the shield optimization study. This normalization produced an outboard wall loading of 0.4 MW/m2, the FED reference value. The resulting apparent inboard wall loading was 0.32 MW/m2. STARFIRE1*1
and INTOR1*2 also show lower wall loadings on the inboard walls. Total neutron and gamma flux distributions through the inboard
shield are plotted in Figs. 5-92 and 5-93 for two cases—unborated .
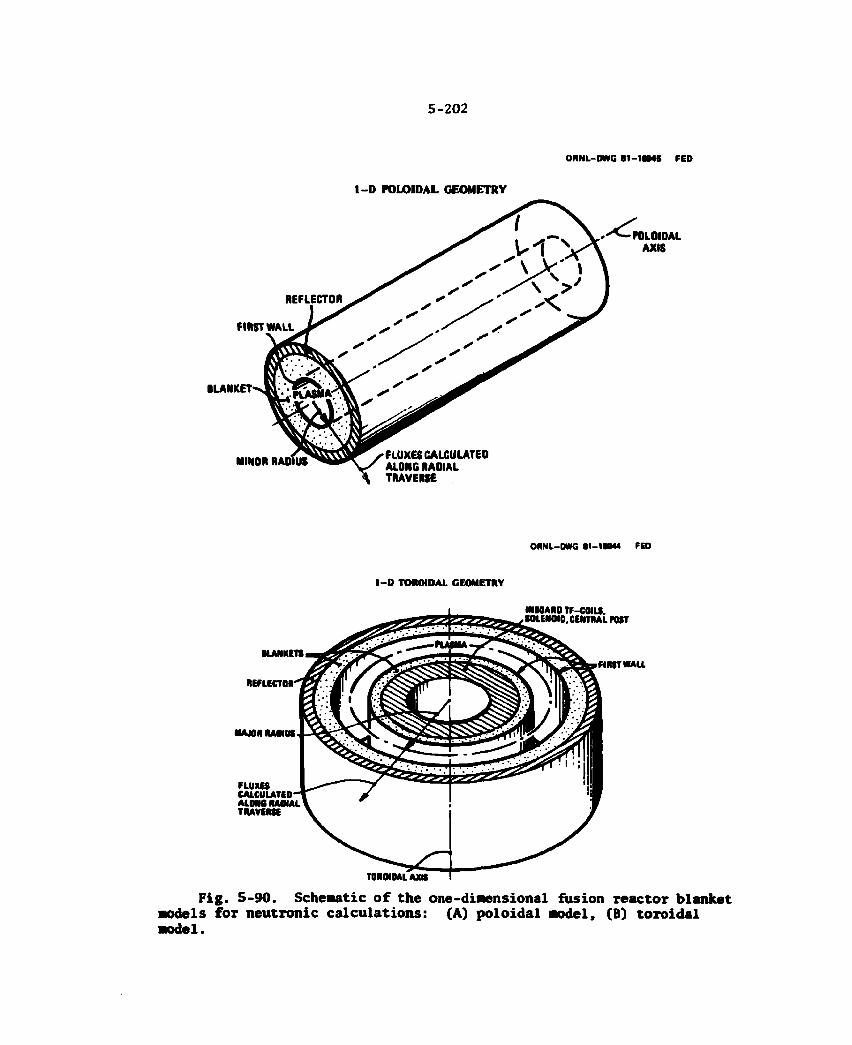
5-202
ORNL-DWG S1-1M46 FED
1 - D POLOIDAL GEOMETRY
REFLECTOR
FIRST WALL
BLANKET
MINOR
POLOIDAL AXIS
' FLUXES CALCULATED ALONG RADIAL
V TRAVERSE
ORNL-DWG il—IRB44 FED
l - D TOMNOAL GEOMETRY
INROARO TF-COILC. CMTRALPOIT
FIRST WALL
MAJOR UHIR
FLUXES CALCULATED
TRAVERSE
TOROIDAL AXIS
Fig. 5-90. Schematic of the one-dimensional fusion reactor blanket models for neutronic calculations: (A) poloidal model, (B) toroidal model.
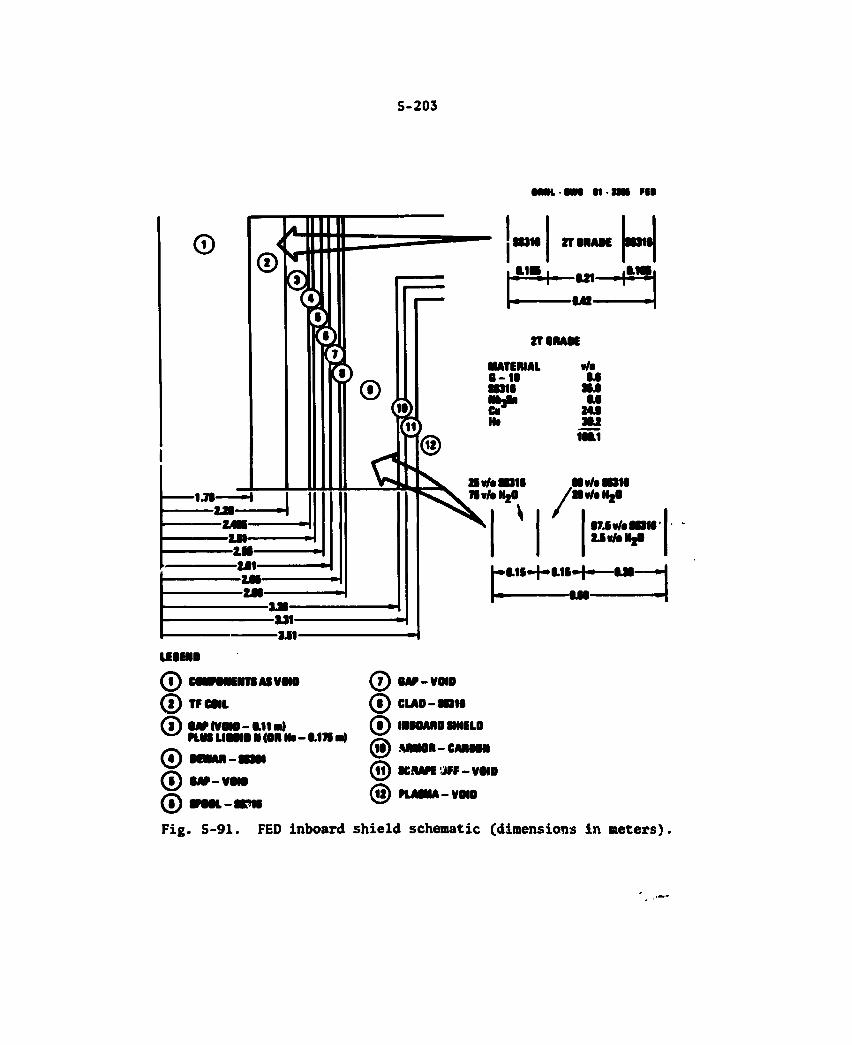
5-203
© ® riiiii tamn . _ • • i
t
-1.7S-
-tlt— - i m — —111-— L N -
XT SHADE
tea
H a.11
®
\ till
-Ml— -131-—1J1-
- M l -
2T8RAOC MATERIAL 8 - 1 1 m w Cm H>
^ f f ® V « ) \ »*/«MIW
O v nwbHgO
M *J U 244 J U 1N.1
Mv/cWtt 'iSv/aHgO
/ STJv/aSaM XJvMMjO
c u s - t - m - f - — u i 3 LEBEHD (T) CfMPMENTO AS VMO (?) TFOML (7) CAf (VMD-S.Ha) w M M U«MOH(DRIto-8.171a) © © ©
( 7 ) SAP-VOID 0 CLAD-Mill (•) MSDAHO SHIELD (is) MMOR-CARSM («) K U K JFF - VSID @ PLANA-VOIO
Fig. 5-91. FED inboard shield schematic (dimensions in meters)
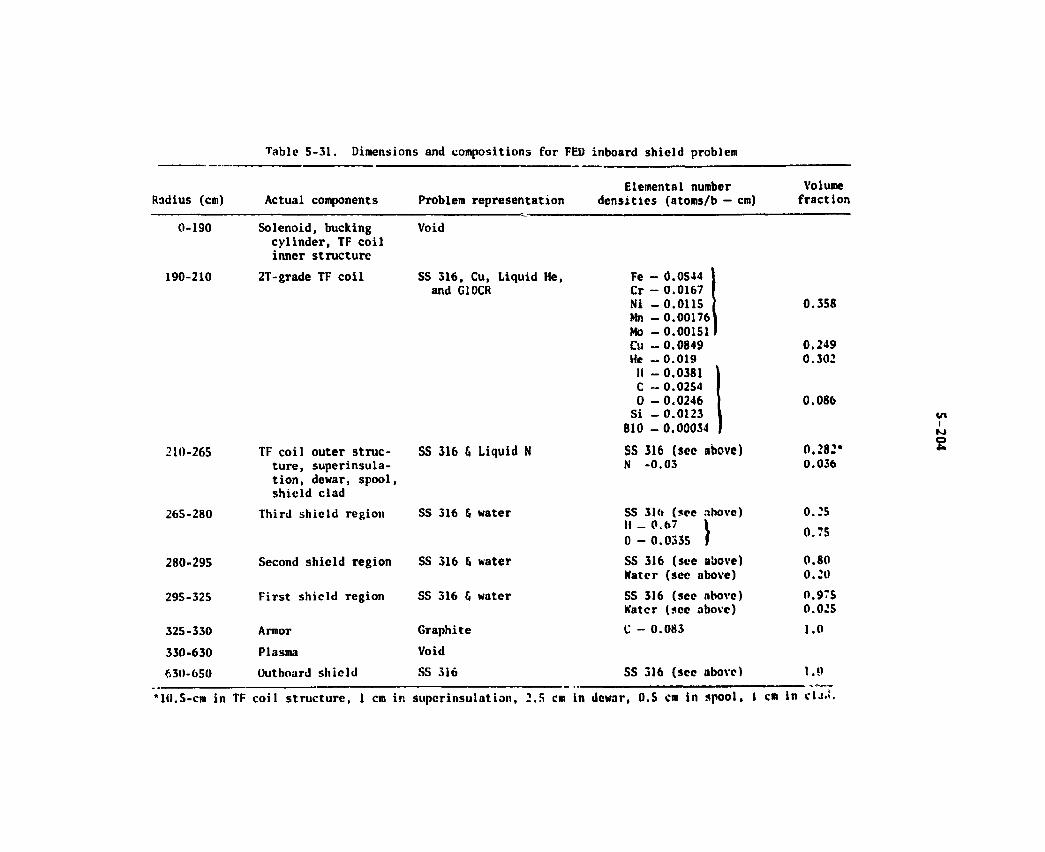
Tabic 5-31. Dimensions and compositions for FED inboard shield problem
Radius (cm) Actual components Problem representation Elemental number Volume
densities (atoms/b - cm) fraction
0-190
190-210
210-265
265-280
280-295
295-325
325-330 330-630 630-650
Solenoid, bucking cylinder, TF coil inner structure
2T-grade TF coil
TF coil outer struc-ture, superinsula-tion, dewar, spool, shield clad
Third shield region
Second shield region
First shield region
Armor Plasma Outboard shield
Void
SS 316, Cu, Liquid He, and G10CR
SS 316 6 Liquid N
SS 316 6 water
SS 316 6 water
SS 316 & water
Graphite Void SS 316
Fe Cr Ni
- 0.0S44 - 0.0167 - 0.011S
Mn - 0.00176 Mo - 0.001S1 Cu - 0.0849
- 0.019 - 0.0381 - 0.02S4 - 0.0246 - 0.0123 - 0.00034
He If C O Si B10 SS 316 (see above) N -0.03
SS 31<» (see above) II _ 0.67 i 0 - 0.0335 » SS 316 (sve above) Water (see above) SS 316 (see above) Kater (see above) C - 0.083
SS 316 (see above)
0.358
0.249 0.302
0.086
0.28:* 0,036
o.:s 0.75
0.80 o.:o 0.975 0.025 1.0
1.0
*10.5-cm in TF coil structure, 1 cm in supcrinsulation, 2.5 cm in dowar, 0.5 cm in spool, I cm in
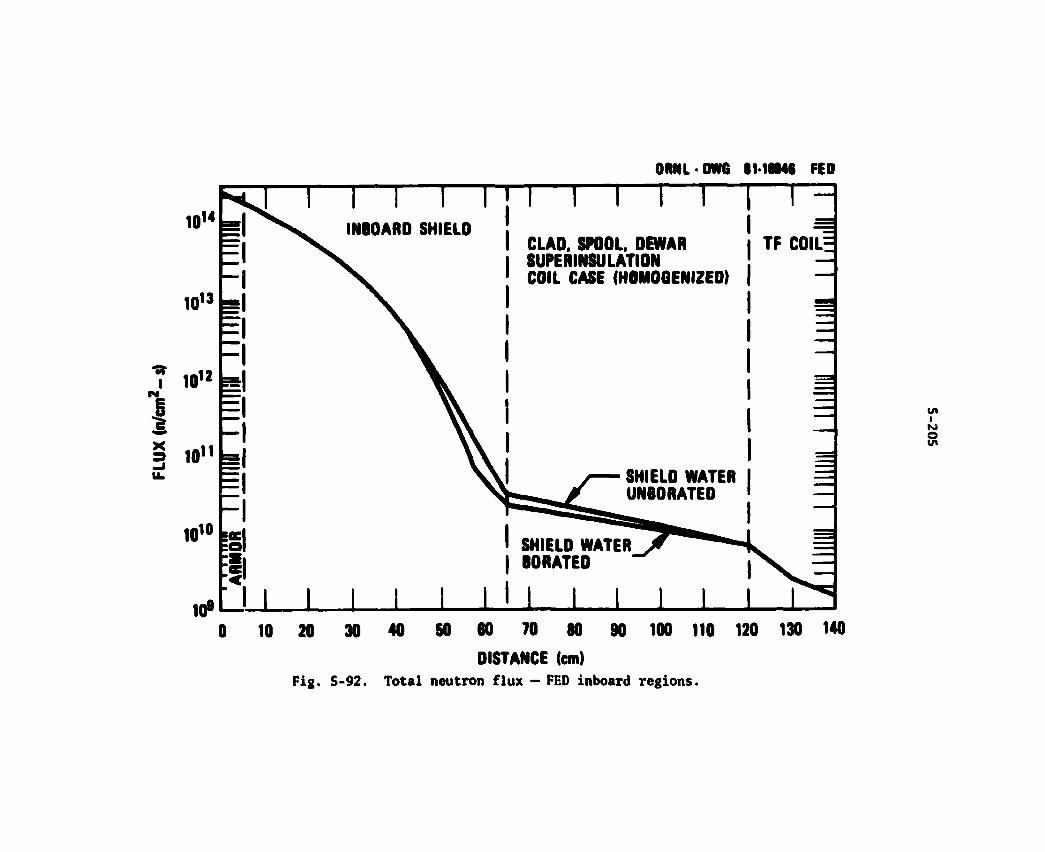
ORNL • DWG I M 6 M 8 FED
I I I I CLAD. SPOOL. DEWAR SUPERINSULATION COIL CASE (HOMOGENIZED)
I I
INBOARD SHIELD
l _ l l _ J L
SHIELO WATER UNBORATED
SHIELD WATER BORATEO
J 1 1 1 1
TF COIL-
10 20 30 40 SO 60 70 80 90 100 110 120 130 140
DISTANCE (cm) Fig. 5-92. Total neutron flux — FED inboard regions.
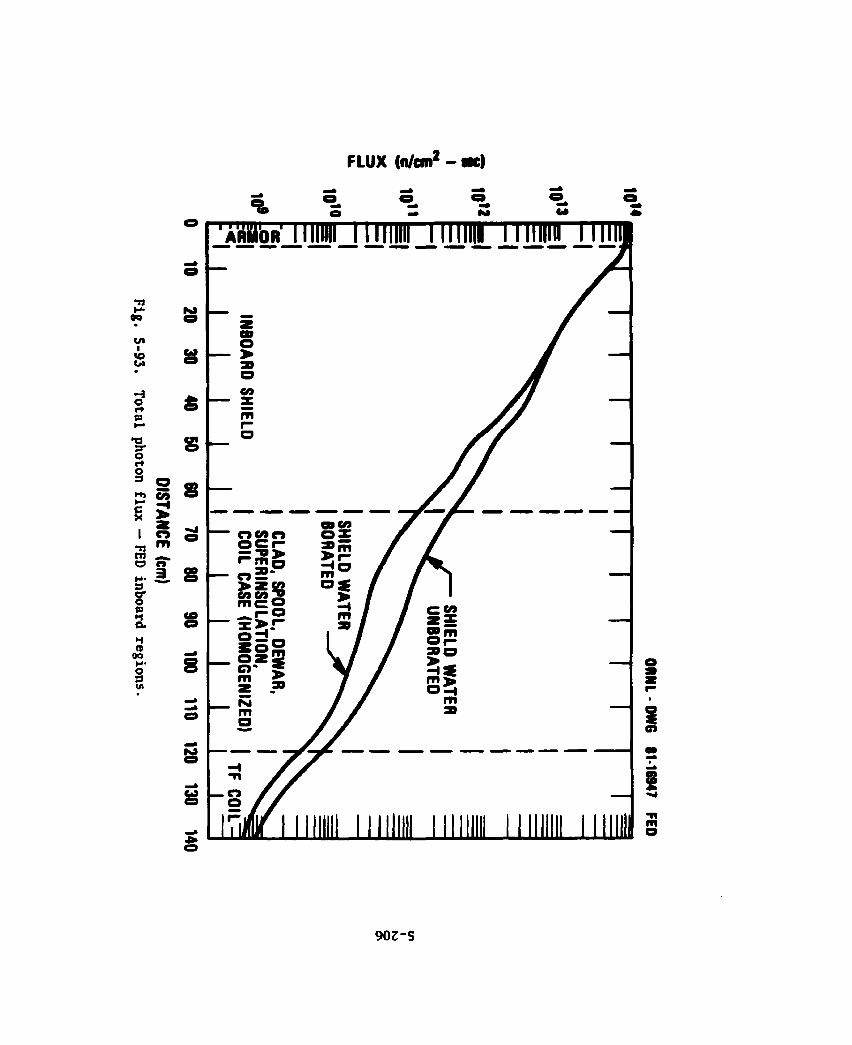
FLUX (n/an2 - ac)
90Z-S

5-207
water and borated water (2 atom % natural boron). Note that the TF coil case, superinsulation, cryostat, spool, and clad are homogenized together as one region.
Nuclear heating by region is given in Table 5-32 for the unborated and borated cases.
Neutron and gamma heating rates as a function of distance are plotted in Figs. 5-94 and 5-95 for the unborated and borated cases, respectively. Borating the shield water reduces the heating in the coil and coil case by a factor of 3.
Figure 5-96 shows the dpa rate and integrated dpa in the copper stabilizer, versus depth. An integrated dpa of 3 x 10'1* is equivalent to a 25% resistivity increase; hence, the dpa levels shown in the figure are entirely acceptable.
The G10CR Tadiation exposure is presented in Fig. 5-97 for the unborated case. Again, the integrated lifetime exposure of 2.6 x 10® Tads is well within the specified criterion (109 rads) for G10CR.
Induced activation was not calculated in the inboaTd shield study. However, results for the outboard shield can be scaled, based on neutron flux levels outside the outboard shield during operation of 4 * 106
n/cm2 — s. With no lead cladding, this flux level resulted in a 24-h shutdown dose rate of 100 mrem/h. As shown in Fig. 5-92, the operating neutron flux level at the spool piece inboard of the inboard shield is about 2 * 1010 n/cm2 — s. Hence, the 24-h shutdown dose rate at the spool piece would be around 500 rem/h.
Outboard shield
For the FED outboard shield, poloidal geometry was adopted as the best 1-D approximation, i.e., the torus is stretched into an infinite cylinder. This cylindrical approximation is shown in Fig. 5-98. The plasma radius is taken as 1.78 m and the first wall inner radius as 2.25 m, based on a best fit to the flat-sided interior cross section of the dee.
The detailed first-wall geometry used for this calculation is shown in Fig. 5-99. For purposes of a 1-D transport calculation, the
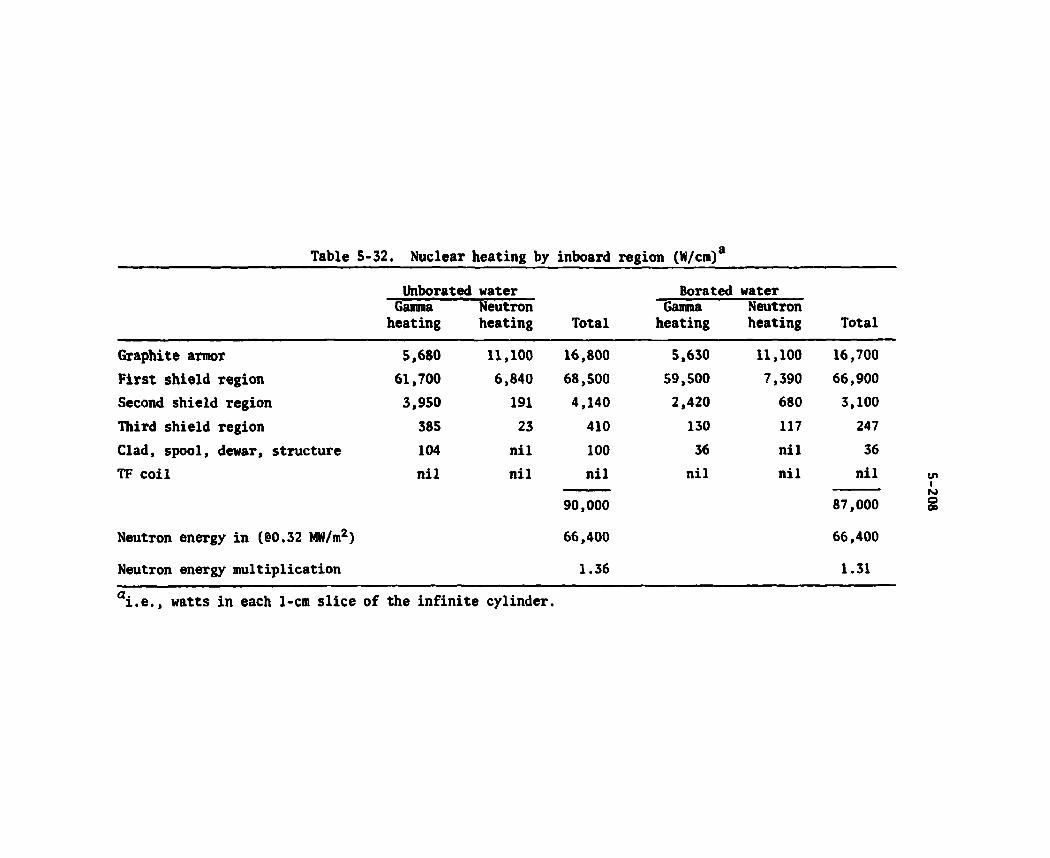
Table 5-32. Nuclear heating by inboard region (W/cm)a
Unborated water Borated water Gamma
heating Neutron heating Total
Gamma heating
Neutron heating Total
Graphite armor 5,680 11,100 16,800 5,630 11,100 16,700 First shield region 61,700 6,840 68,500 59,500 7,390 66,900 Second shield region 3,950 191 4,140 2,420 680 3,100 Third shield region 385 23 410 130 117 247 Clad, spool, dewar, structure 104 nil 100 36 nil 36 TF coil nil nil nil nil nil nil
90,000 87,000
Neutron energy in (60.32 MW/m2) 66,400 66,400
Neutron energy multiplication 1.36 1.31 ai.e., watts in each 1-cm slice of the infinite cylinder.
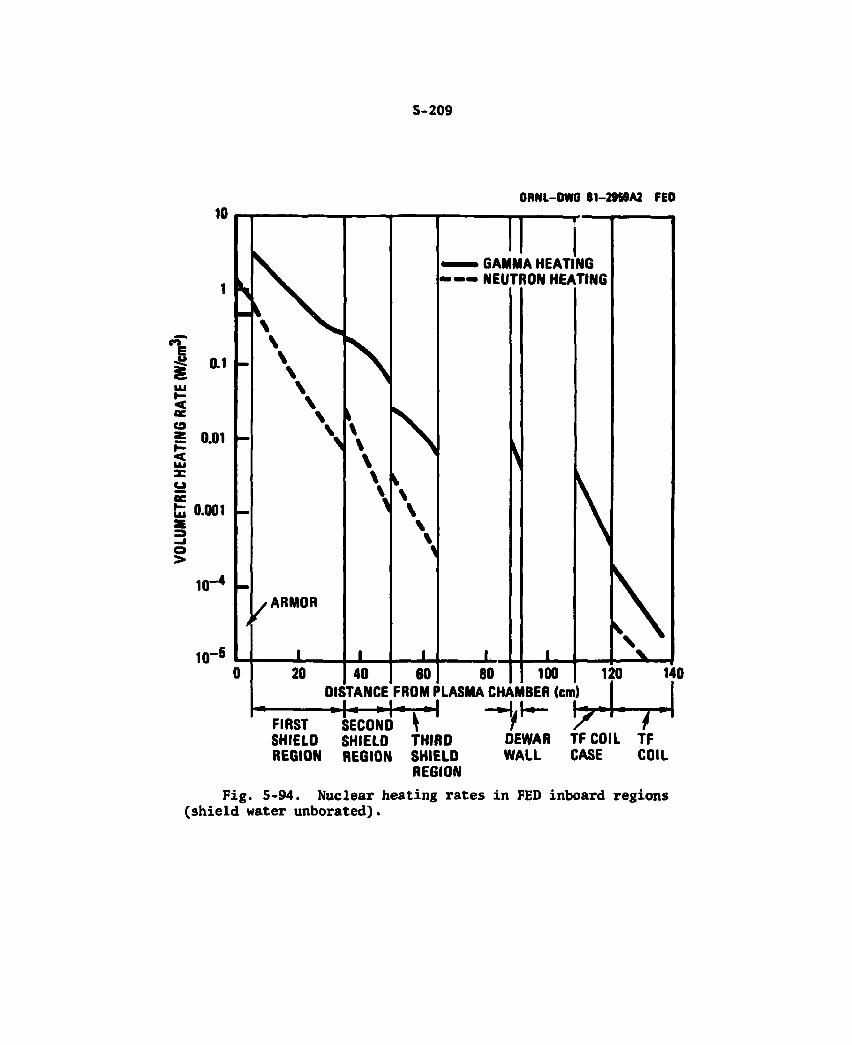
5-209
ORNL-DWG 81-2959A2 FEO
REGION REGION SHIELD WALL CASE COIL REGION
Fig. 5-94. Nuclear heating rates in FED inboard regions (shield water unborated).
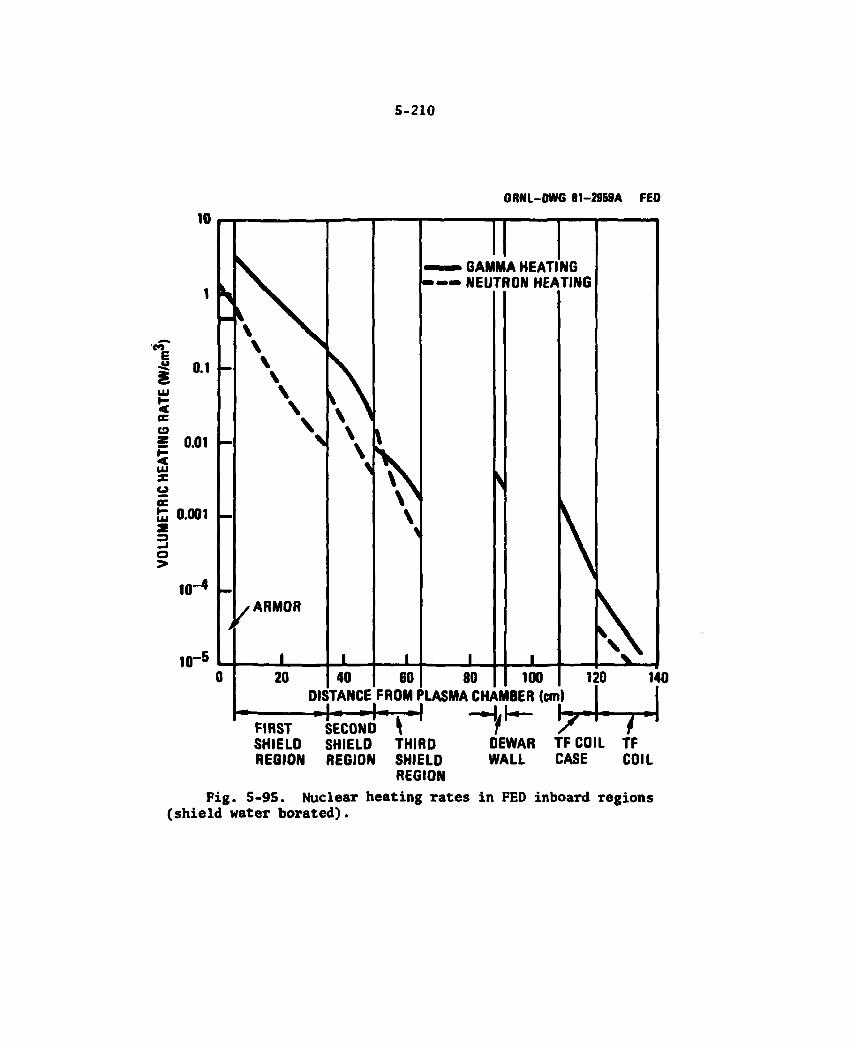
5-210
ORNL-DWG 81-2959A FED
REGION REGION SHIELD WALL CASE COIL REGION
Fig. 5-95. Nuclear heating rates in FED inboard regions (shield water borated).
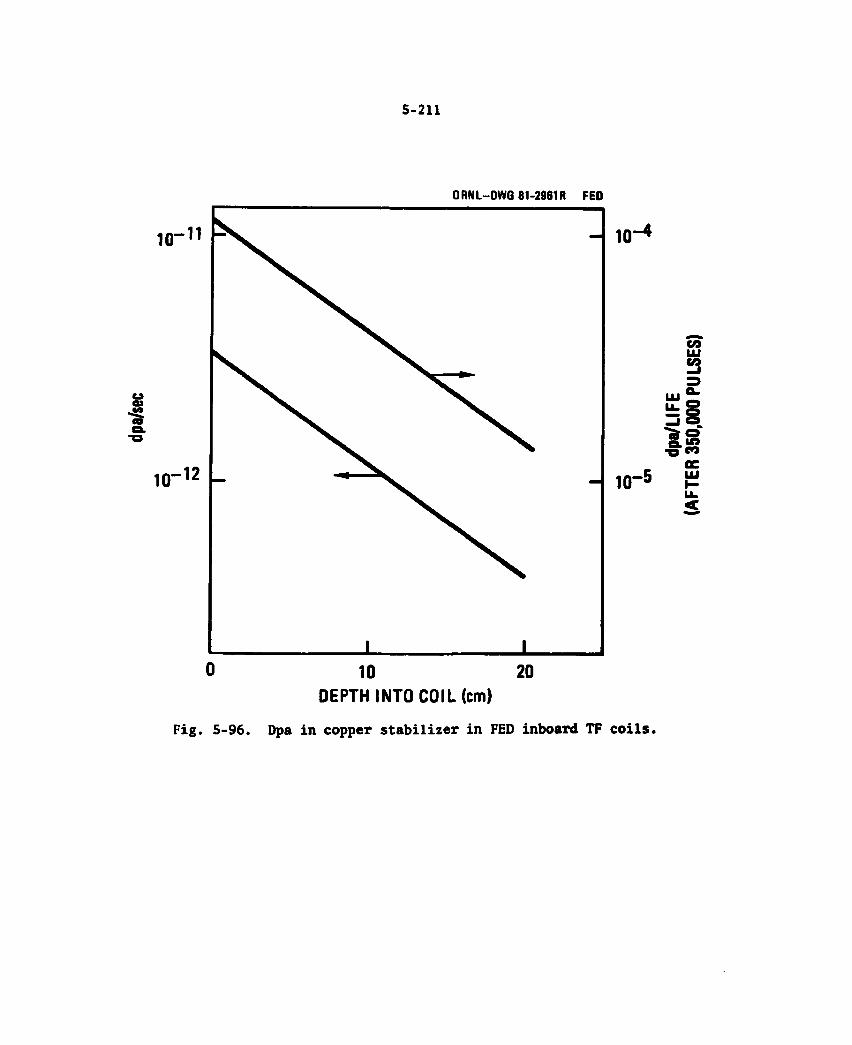
5-211
ORNL-OWG 81-2961R FED
DEPTH INTO COIL (cm)
Fig. 5-96. Dpa in copper stabilizer in FED inboard TF coils.
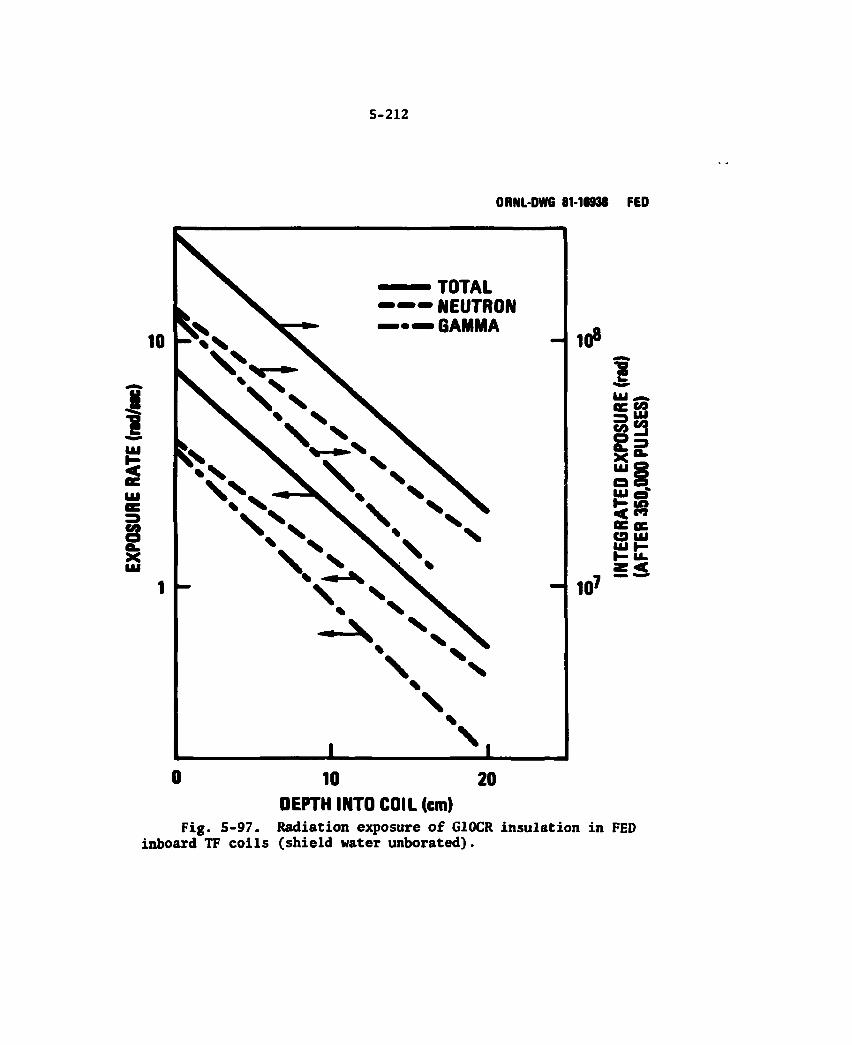
5-212
ORNL-DWG 81-18938 FED
\
- h o »
-g U l A fie CO a ui
i i x i
< « oc K C9 U l
- h o *
0 10 20 DEPTH INTO COIL (cm)
Fig. 5-97. Radiation exposure of G10CR insulation in FED inboard TF coils (shield water unborated).
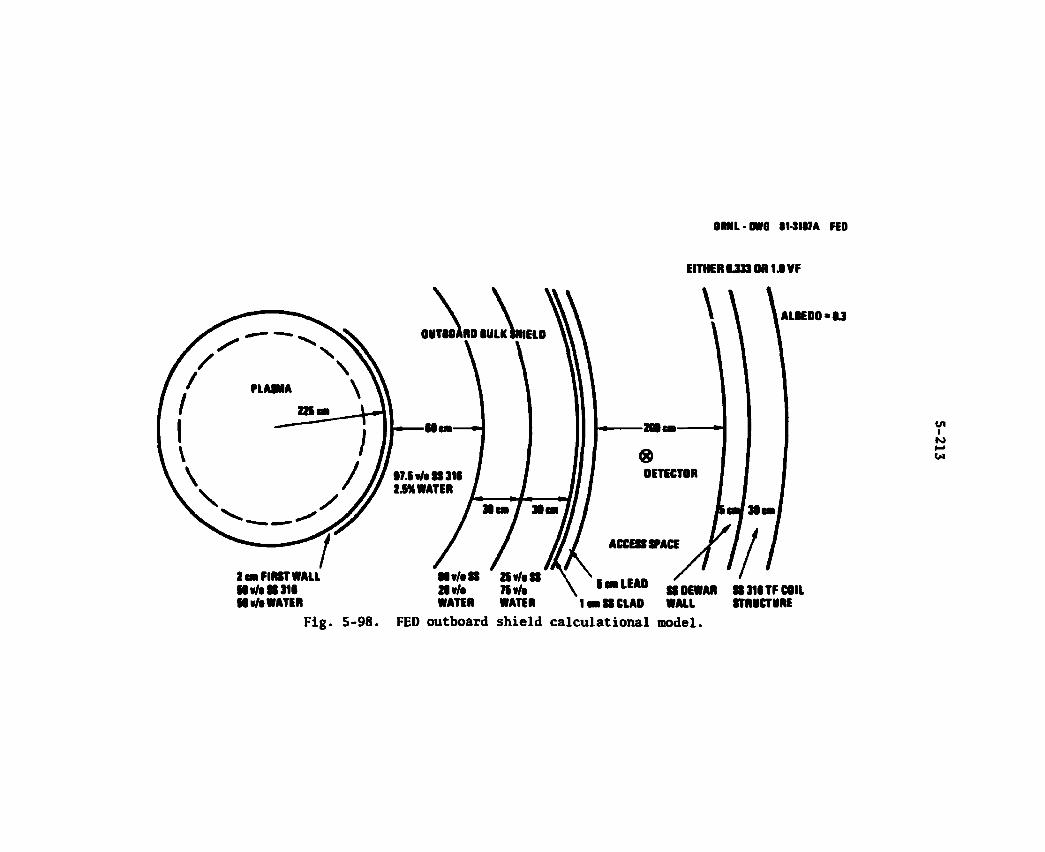
OML-DWG II-31I7A FED
EITHER U33 OR 1JVF
Fig. 5-98. FED outboard shield calculational model.
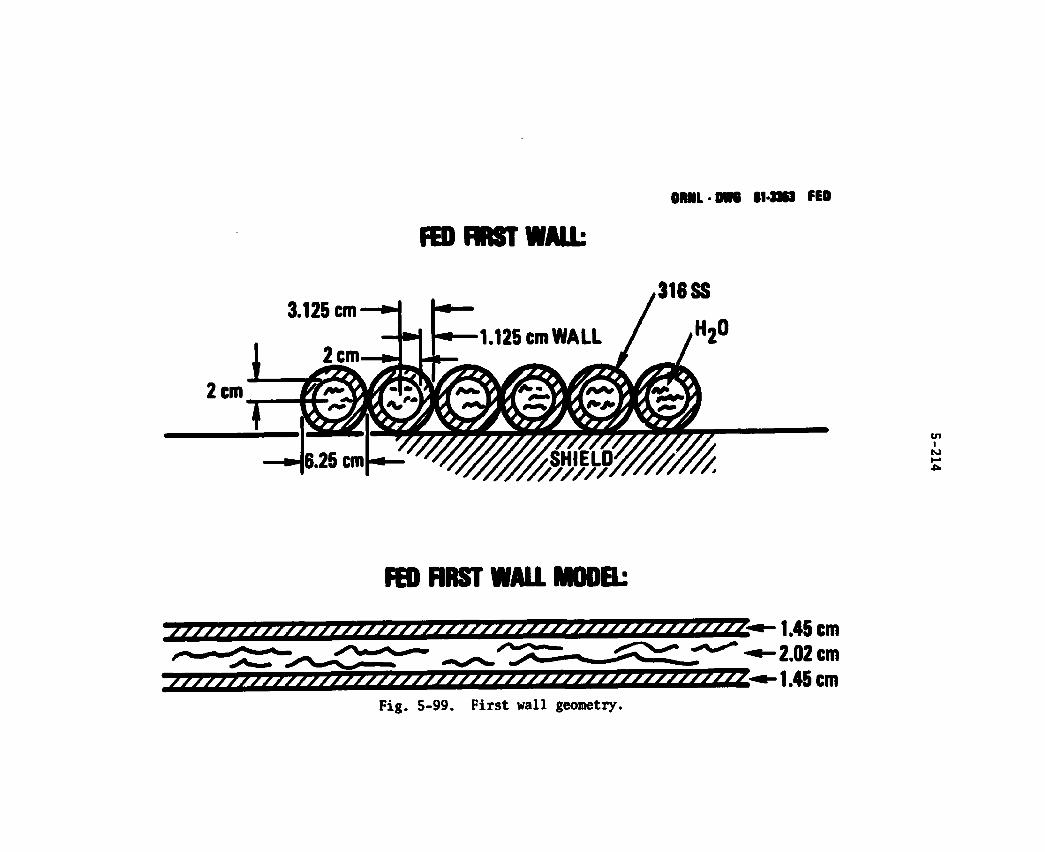
ORNL-DVB 11-3X3 FED
FED FIRST WALL
3.125 cm 316 SS
FED FIRST WALL MODEL
1.45 cm 2.02 cm 1.45 cm
Fig. 5-99. First wall geometry.
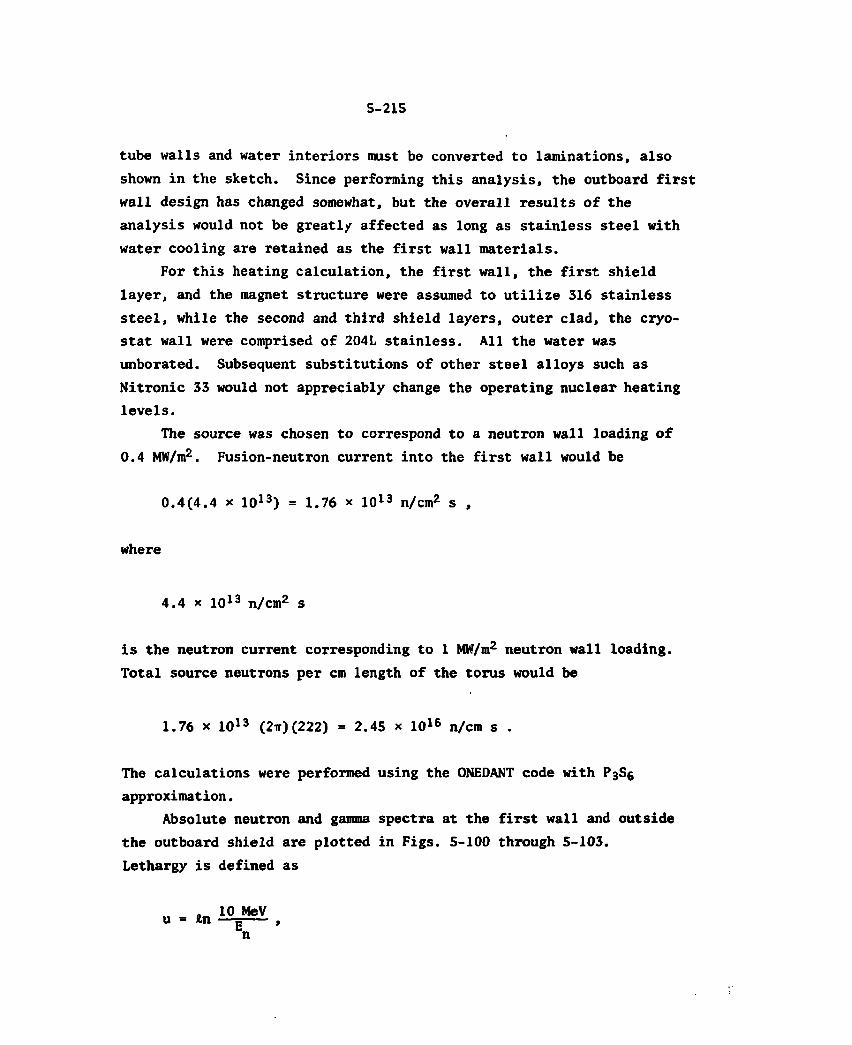
5-215
tube walls and water interiors must be converted to laminations, also shown in the sketch. Since performing this analysis, the outboard first wall design has changed somewhat, but the overall results of the analysis would not be greatly affected as long as stainless steel with water cooling are retained as the first wall materials.
For this heating calculation, the first wall, the first shield layer, and the magnet structure were assumed to utilize 316 stainless steel, while the second and third shield layers, outer clad, the cryo-stat wall were comprised of 204L stainless. All the water was unborated. Subsequent substitutions of other steel alloys such as Nitronic 33 would not appreciably change the operating nuclear heating levels.
The source was chosen to correspond to a neutron wall loading of 0.4 MW/m2. Fusion-neutron current into the first wall would be
0.4(4.4 x 10¹³) = 1.76 x lo13 n/cm2 s ,
where
4 . 4 x i o 1 3 n/cm2 s
is the neutron current corresponding to 1 MW/m2 neutron wall loading. Total source neutrons per cm length of the torus would be
1.76 x 10¹³ (2ir) (222) = 2.45 x 10¹⁶ n/cm s .
The calculations were performed using the ONEDANT code with P3S6 approximation.
Absolute neutron and gamma spectra at the first wall and outside the outboard shield are plotted in Figs. 5-100 through 5-103. Lethargy is defined as
n
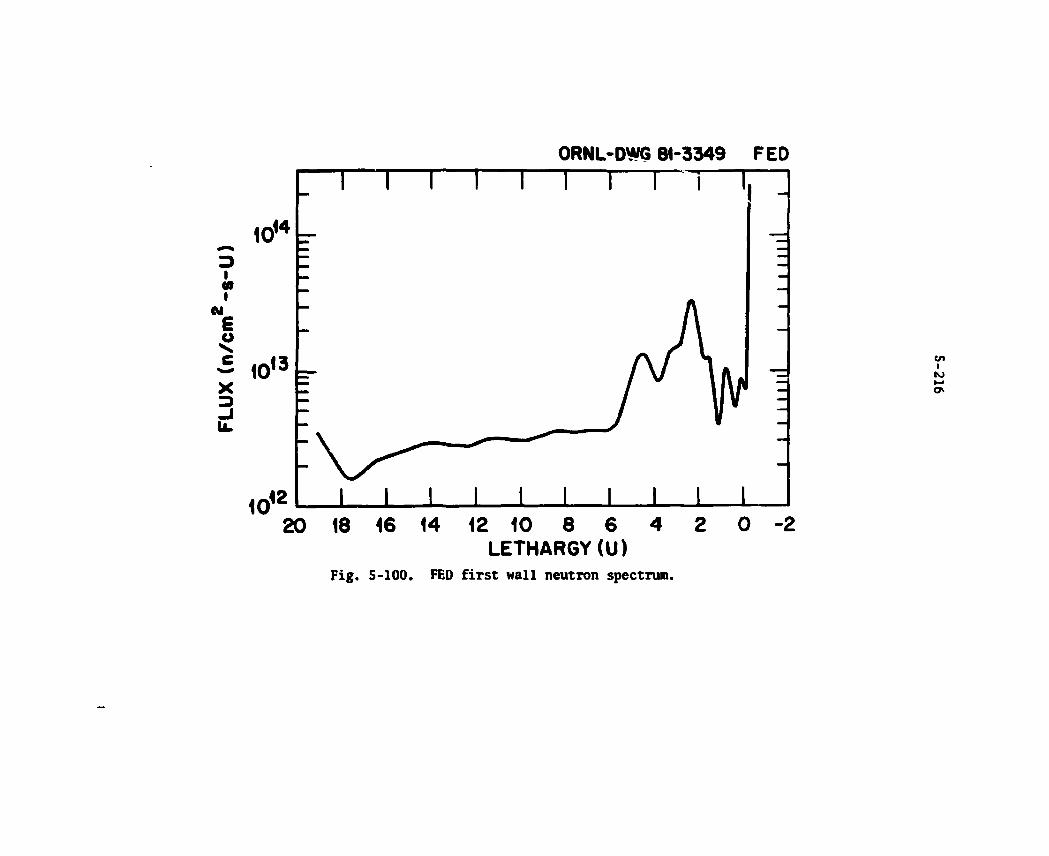
ORNL-DWG 81-3349 FED
LETHARGY(U) Fig. 5-100. FED first wall neutron spectrum.
F L U X ( P H 0 T 0 N S / c m 2 - s - M « V )
Z. IZ-S
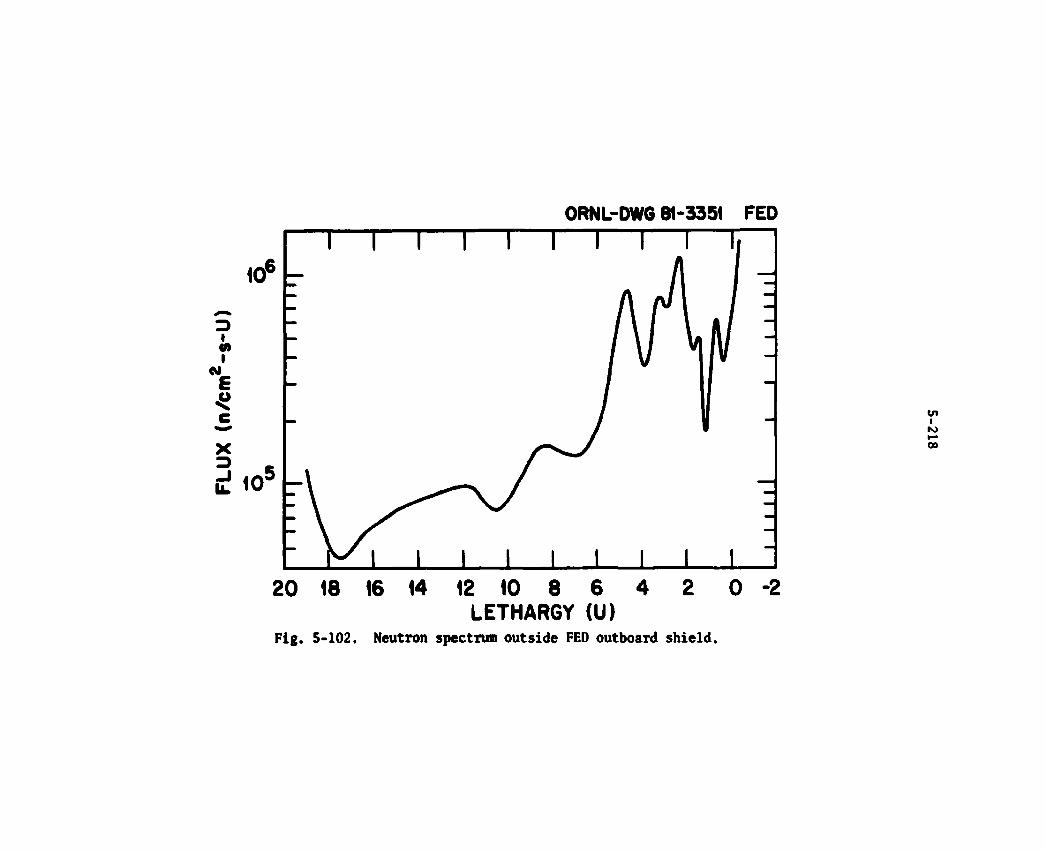
ORNL-DWG 81-3951 FED
20 18 16 14 12 10 8 6 4 2 0 -2 LETHARGY (U)
Fig. 5-102. Neutron spectrum outside FED outboard shield.
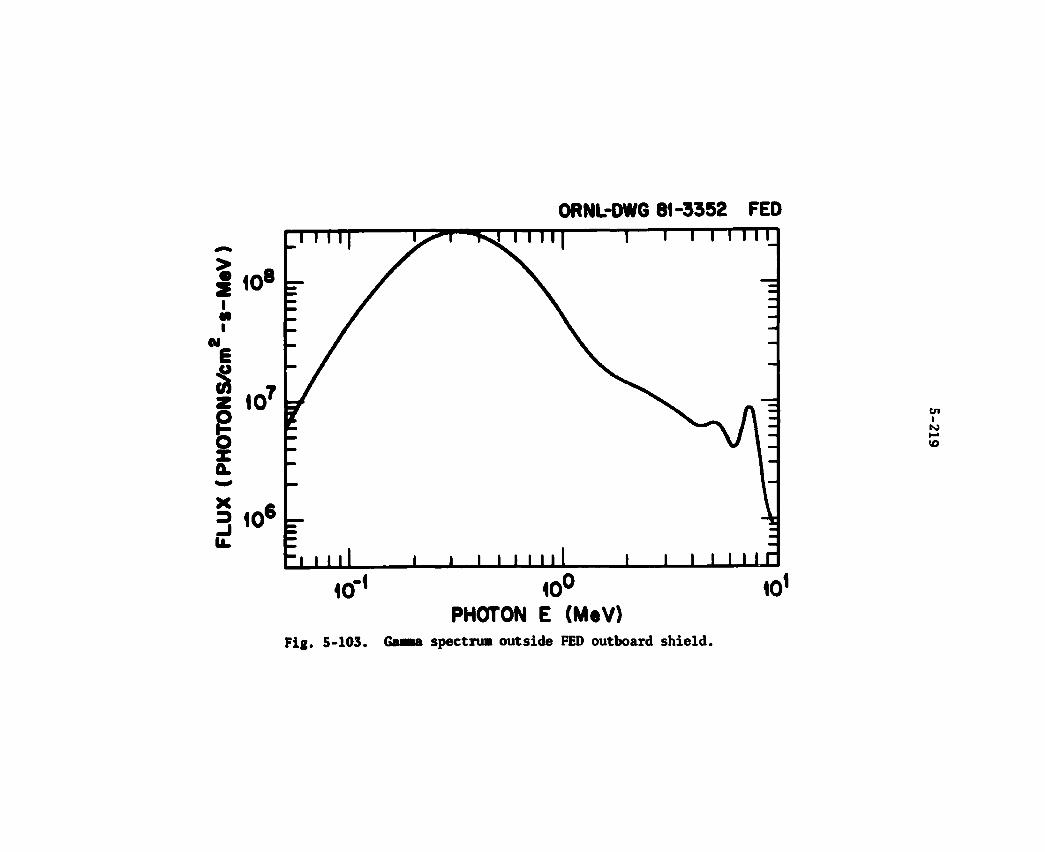
ORNL-DWG 81-3352 FED
PHOTON E (MeV) Fig. 5-103. Gaaaa spectrum outside FED outboard shield.
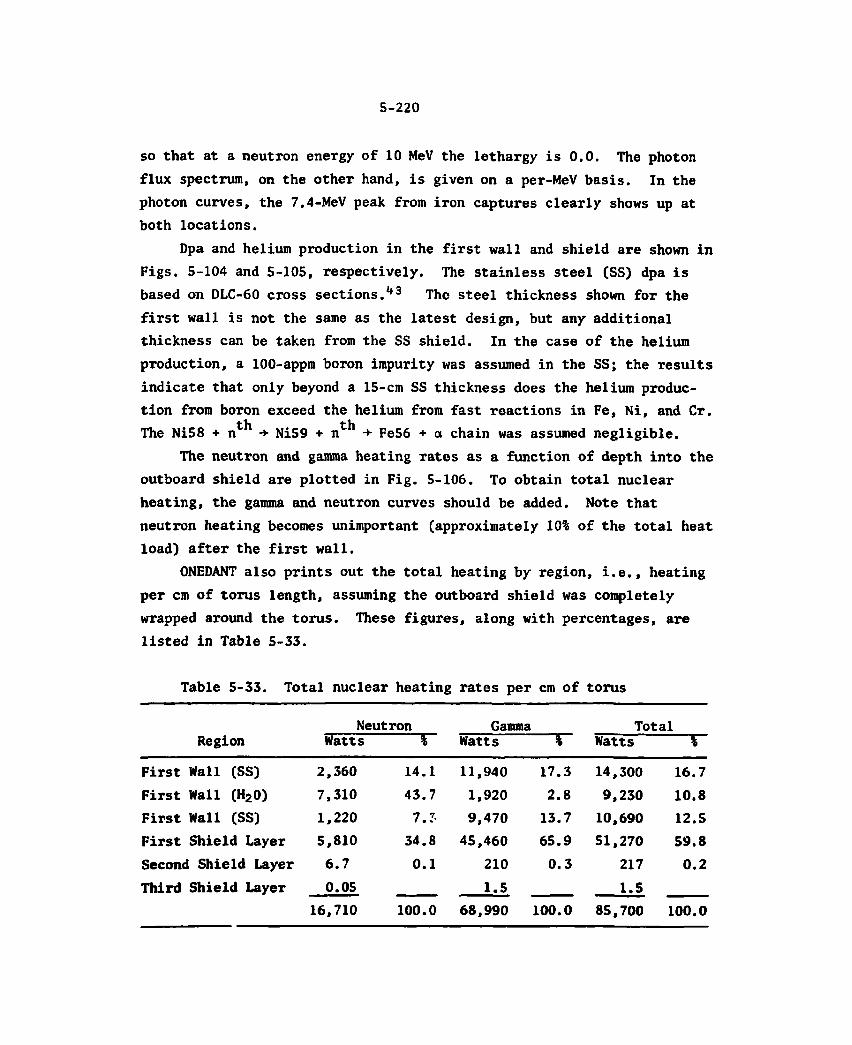
5-220
so that at a neutron energy of 10 MeV the lethargy is 0.0. The photon flux spectrum, on the other hand, is given on a per-MeV basis. In the photon curves, the 7.4-MeV peak from iron captures clearly shows up at both locations.
Dpa and helium production in the first wall and shield are shown in Figs. 5-104 and 5-105, respectively. The stainless steel (SS) dpa is based on DLC-60 cross sections.1*3 The steel thickness shown for the first wall is not the same as the latest design, but any additional thickness can be taken from the SS shield. In the case of the helium production, a 100-appm boron impurity was assumed in the SS; the results indicate that only beyond a 15-cm SS thickness does the helium produc-tion from boron exceed the helium from fast reactions in Fe, Ni, and Cr. The Ni58 + ntl1 + Ni59 + n**1 Fe56 + o chain was assumed negligible.
The neutron and gamma heating rates as a function of depth into the outboard shield are plotted in Fig. 5-106. To obtain total nuclear heating, the gamma and neutron curves should be added. Note that neutron heating becomes unimportant (approximately 10% of the total heat load) after the first wall.
0NEDANT also prints out the total heating by region, i.e., heating per cm of torus length, assuming the outboard shield was completely wrapped around the torus. These figures, along with percentages, are listed in Table 5-33.
Table 5-33. Total nuclear heating rates per cm of torus
Neutron Gamma Total Region Watts Watts V Watts £
First Wall (SS) 2,360 14. 1 11,940 17. 3 14,300 16.7 First Wall (H20) 7,310 43. 7 1,920 2. 8 9,230 10.8 First Wall (SS) 1,220 7. 7, 9,470 13. 7 10,690 12.5 First Shield Layer 5,810 34. 8 45,460 65. 9 51,270 59.8 Second Shield Layer 6.7 0 . 1 210 0 . 3 217 0.2 Third Shield Layer 0.05 1.5 1.5
16,710 100. 0 68,990 100. 0 85,700 100.0
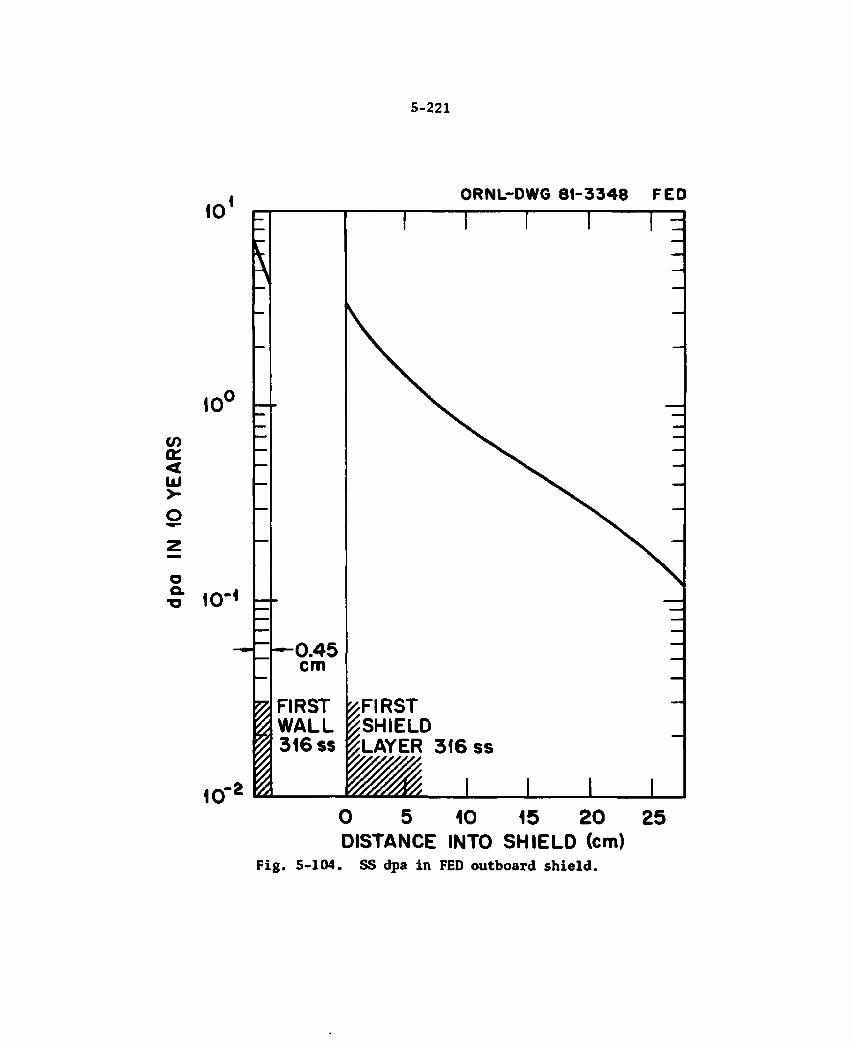
5-221
1 0
10
CO a: < Ui >
o a. "O
N
1 0 r 2
ORNL-DWG 81-3348 FED
T
r—0.45 cm
FIRST WALL 316 ss
?FIRST ^SHIELD ^LAYER 316 ss
1 1
0 5 10 15 20 DISTANCE INTO SHIELD (cm)
Fig. 5-104. SS dpa in FED outboard shield.
25
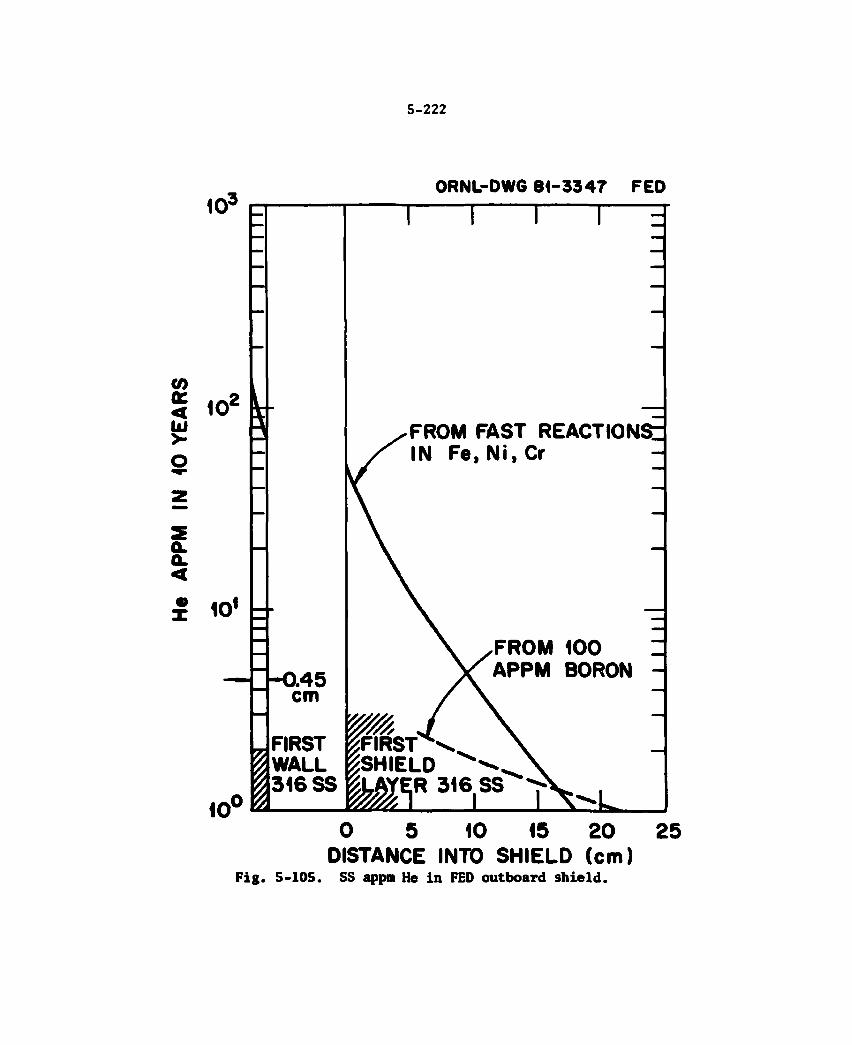
5-222
103 p ORNL-DWG 81-3347 FED
10' U
1 0 1 LL
h0.45 cm
FIRST WALL 316 SS
FROM FAST REACTION^ IN Fe, Ni, Cr
1 0
FROM 100 APPM BORON
fcFIRST gSHIELD
*W-,R 316 SS
0 5 10 15 20 DISTANCE INTO SHIELD (cm)
Pig. 5-105. SS appm He in FED outboard shield.
25
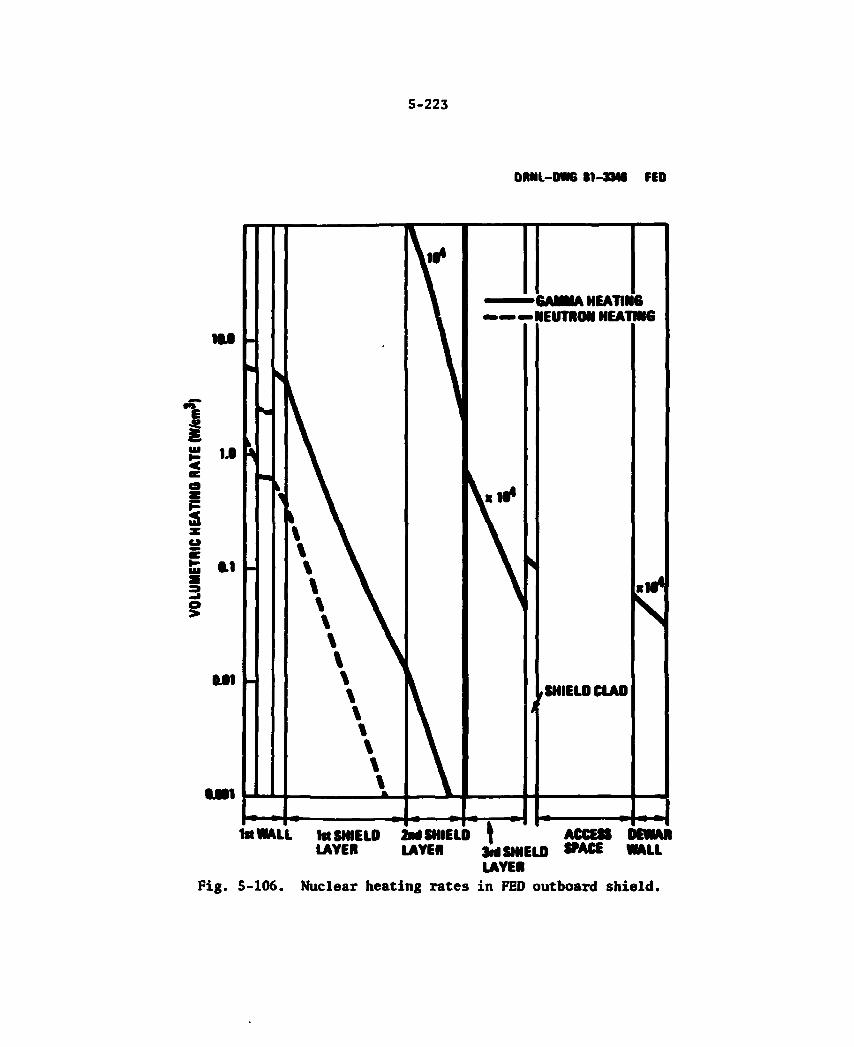
5-223
ORNL-DWG 11-SMS FEO
110
1.0
11
M l
M i l
Fig. 5-106. Nuclear heating rates in FED outboard shield.
fe
i
•
k \ \ \ % \ % \ \ \ \ \ \ \ \ \ \ \ \ \ \ % \ \ %
\ ViN*
\
—
*
/
iAMMA HEATII IEUTRON HEAT
, SHIELD CLAD
B
IMG
\
1st WAL L taSIMELO ; iriSHlELI ACCESS 1 E W M LAYER LAYER M SHIELD *ACE WALL
LAYER
5-224
Since the neutron power into the torus is 40 W/cm2 * 2ir 222 = 55,800 W/cm, overall energy multiplication is 85,700/55,800 = 1.54. Note that only 20% of the total energy deposition is neutron, the remainder being from inelastic scattering and capture gammas.
It is interesting to note that the outboard energy multiplication is 1.54, whereas inboard multiplication is only 1.36 (Table 5-32). It appears that much more energy is deposited in the SS/water first wall than in the graphite armor, which is not completely counterbalanced by the relative heating rates in the shield.
For comparison, heating rates in the inboard region were also calculated using the ANISN code with DLC-41 and MACK IV cross sections. Neutron and gamma heating rates in the first wall were found to be 0.091 and 0.147 MW/m2, respectively, whose total (0.238 MW/m2) is in good agreement with the ONEDANT results (9.245 MW/m2). ANISN energy multiplication is 1.46, and 75% of the heating is from gammas.
Both an ETF study39 and a STARFIRE study*1** reflected that replac-ing high nickel alloys such as SS 316 with low nickel alloys such as FE 1422 or SS 201 in the outboard bulk shield and TF coils greatly reduced the shutdown dose rate due to Co58 and Co60. In the case of STARFIRE, there was also the incentive to minimize the consumption of strategic materials such as chromium. Therefore, a neutronics study was undertaken to survey a group of candidate materials, including low-nickel steel alloys, for possible use in the outboard shield.
A list of the alloys selected for this study, along with densities and compositions, is provided in Table 5-34. Stainless steel 316L and 304L are high nickel alloys usually considered for the torus and TF coil structures. Nitronic 33 has a much lower nickel content and is being used in the TFTR coil structure. Stainless steel 204L was substituted for stainless steel 201 when it was found that no manufacturer currently supplies the latter. The low nickel, low chromium alloy FE i422 was the choice for STARFIRE, as discussed."Noneut 1420" is a hypothetical alloy based on FE 1422 technology but with nickel content reduced to zero and some molybdenum added for ductility.
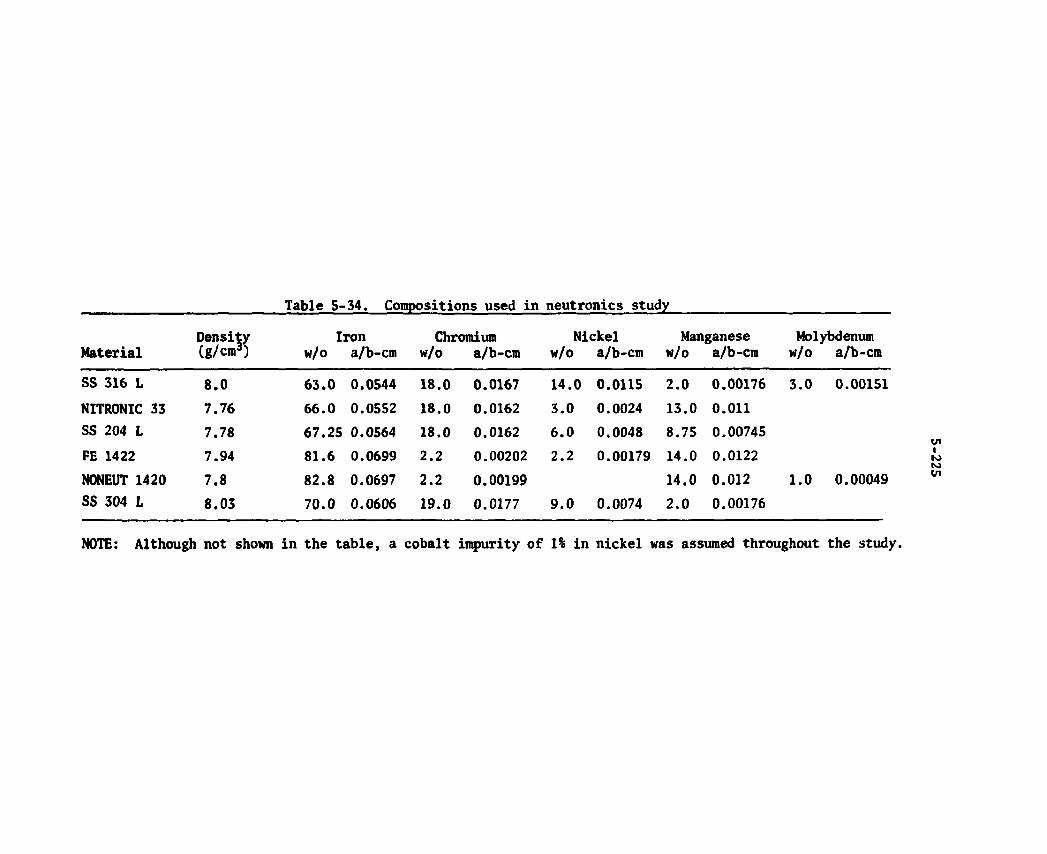
Table 5-34. Compositions used in neutronics study
Material Density (g/cm3)
Iron w/o a/b-cm
Chromium w/o a/b-cm
Nickel w/o a/b-cm
Manganese w/o a/b-cm
Molybdenum w/o a/b-cm
SS 316 L 8.0 63.0 0.0544 18.0 0.0167 14.0 0.0115 2.0 0.00176 3.0 0.00151 NITRONIC 33 7.76 66.0 0.0552 18.0 0.0162 3.0 0.0024 13.0 0.011 SS 204 L 7.78 67.25 0.0564 18.0 0.0162 6.0 0.0048 8.75 0.00745 FE 1422 7.94 81.6 0.0699 2.2 0.00202 2.2 0.00179 14.0 0.0122 NONEUT 1420 7.8 82.8 0.0697 2.2 0.00199 14.0 0.012 1.0 0.00049 SS 304 L 8.03 70.0 0.0606 19.0 0.0177 9.0 0.0074 2.0 0.00176
NOTE: Although not shown in the table, a cobalt impurity of 1% in nickel was assumed throughout the study.

5-226
Only the key activation reactions were included in the calcula-tions. Previous experience in ETF analysis and the results obtained by others for ORMAK1*5 and STARFIRE had identified the important contribu-tors to shutdown dose rate. The list of the important reactions is shown in Table 5-35.
Activation cross sections were hand-input to ONEDANT, utilizing the values shown in Table 5-27. The ONEDANT code was programmed to convert the calculated reaction rates to curies of saturated activity at zero decay, and to sum multiple contributions to a given activation product (such as Co60). A large amount of data was generated, consisting of activities by region and activities by interval for each of the steel alloys with or without boron in the water.
Figure 5-107 (for a SS 316/water shield) shows two typical dis-tributions: Co58 (produced mainly by fast neutrons) and Co60 (produced by thermal or epithermal neutrons). The latter nuclide inventory is plotted for both borated shield water and nonborated shield water. Results show that the inside regions of the shield contain such high levels of activity that the external shutdown dose rate may be dom-inated by those sources, rather than those near the outside of the shield. Results also show that boration of the shield water reduced the Co60 activity in the last shield layer by a factor of ^5.
The best discussion on correcting saturated, undecayed activities to realistic operating conditions is given.If6 Basically, a short-lived activity "remembers" only the most recent operating history of the device, whereas long-lived activities reflect the entire operating history. Assumed FED operating conditions for this study are listed in Table 5-36.
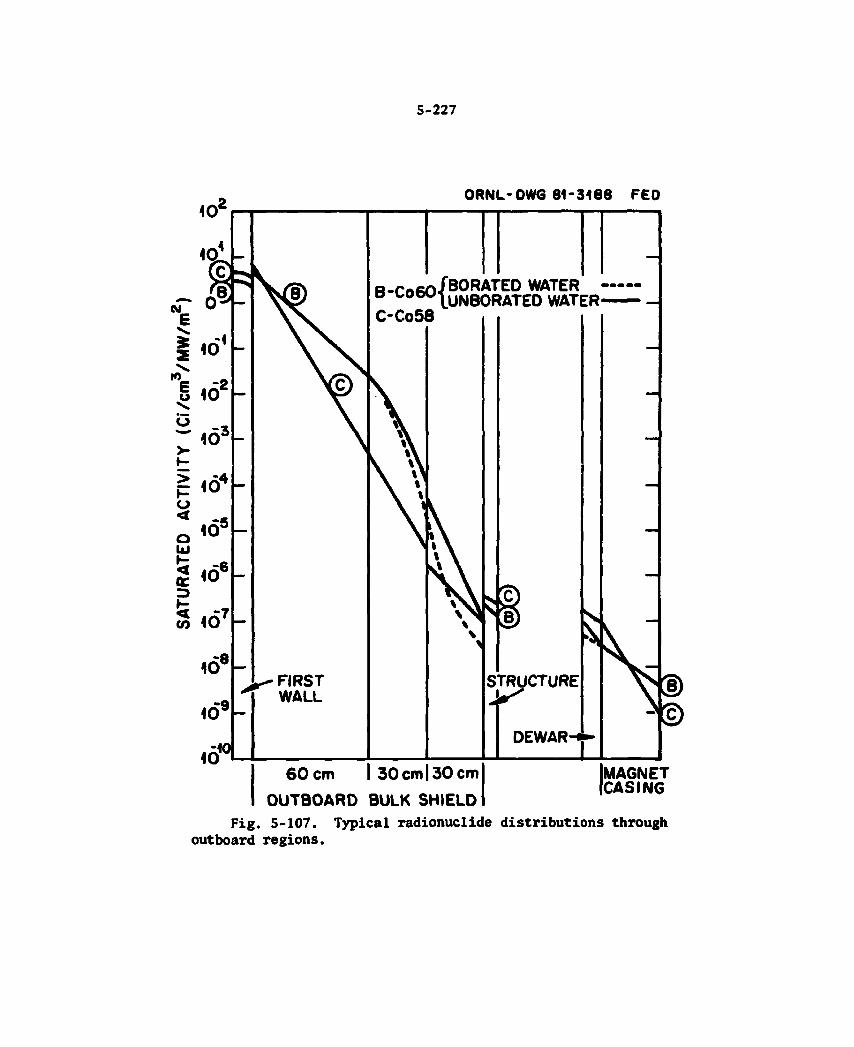
5-227
Fig. 5-107. Typical radionuclide distributions through outboard regions.
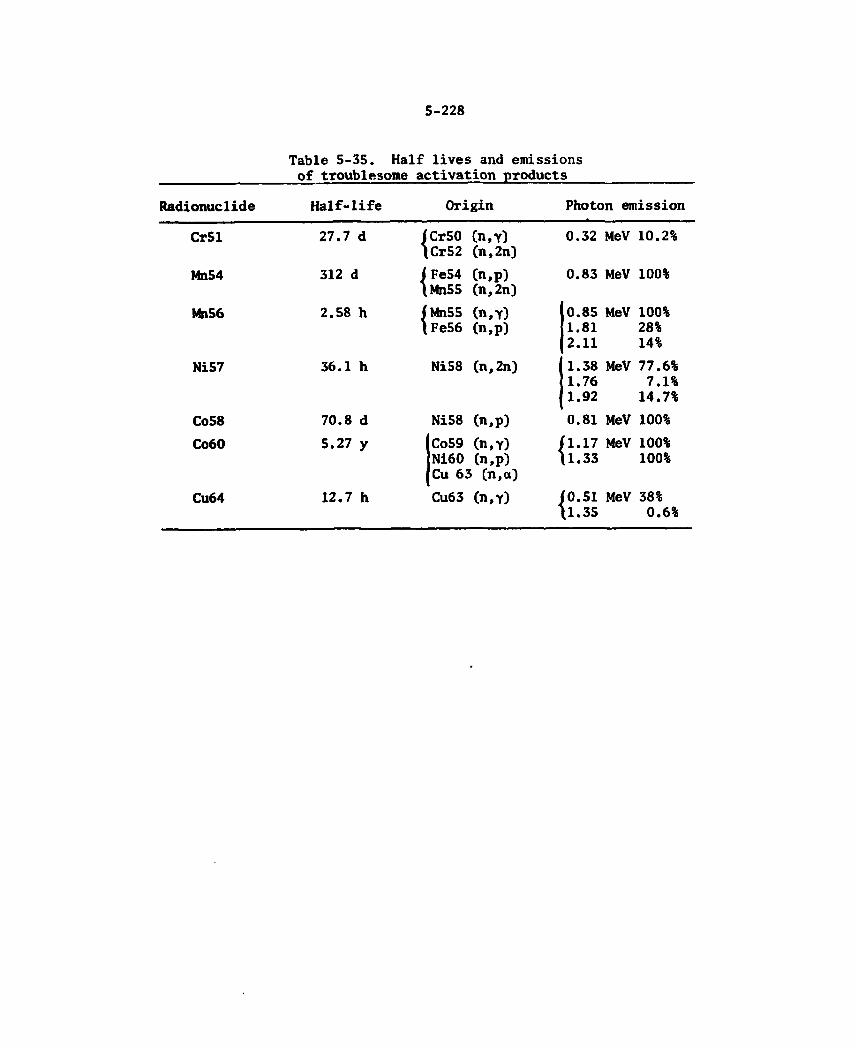
5-228
Table 5-35. Half lives and emissions of troublesome activation products
Radionuclide Half-life Origin Photon emission
Cr51 27.7 d j Cr50 (n,y) Cr52 (n,2n)
0.32 MeV 10.2%
Mn54 312 d | Fe54 (n,p) Mn55 (n,2n)
0.83 MeV 100%
Mn56 2.58 h | Mn55 (n,Y) Fe56 (n,p)
0.85 1.81 2.11
MeV 100% 28% 14%
Ni57 36.1 h Ni58 (n,2n) 1.38 1.76 1.92
MeV 77.6% 7.1% 14.7%
Co58 70.8 d Ni58 (n,p) 0.81 MeV 100% C06O 5.27 y Co59 (n,y)
Ni60 (n,p) Cu 63 Cn,a)
'1.17 (1.33
MeV 100% 100%
Cu64 12.7 h Cu63 (n,Y) (0.51 [1.35
MeV 38% 0.6%
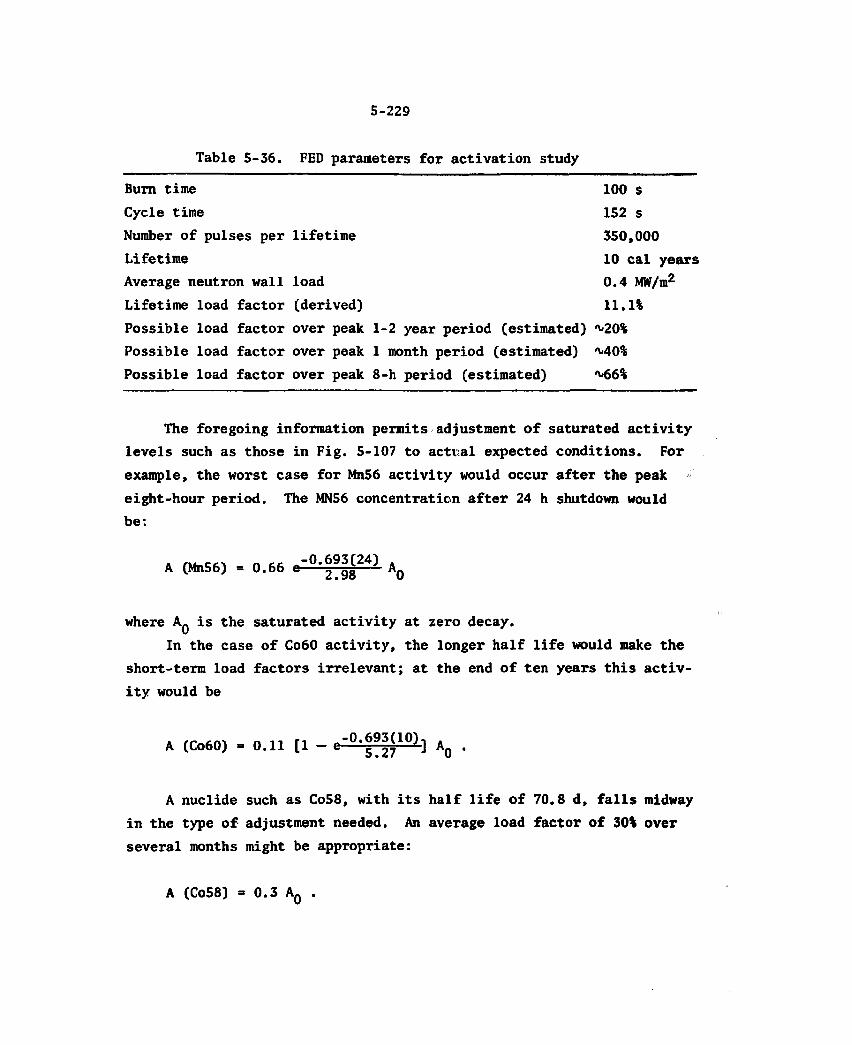
5-229
Table 5-36. FED parameters for activation study
Bum time 100 s Cycle time 152 s Number of pulses per lifetime 350,000 Lifetime 10 cal years Average neutron wall load 0.4 MW/m2
Lifetime load factor (derived) 11.1% Possible load factor over peak 1-2 year period (estimated) ^20% Possible load factor over peak 1 month period (estimated) M 0 % Possible load factor over peak 8-h period (estimated) M>6%
The foregoing information permits adjustment of saturated activity levels such as those in Fig. 5-107 to actual expected conditions. For example, the worst case for Mn56 activity would occur after the peak eight-hour period. The MN56 concentration after 24 h shutdown would be:
A (Mn56) = 0.66 c ' 0 , ^ 2 4 ) AQ
where AQ is the saturated activity at zero decay. In the case of Co60 activity, the longer half life would make the
short-term load factors irrelevant; at the end of ten years this activ-ity would be
A (Co60) = 0.11 [1 - , - 0 - y W ] AQ .
A nuclide such as Co58, with its half life of 70.8 d, falls midway in the type of adjustment needed. An average load factor of 30% over several months might be appropriate:
A (Co58) = 0.3 AQ
5-230
By the sane reasoning, Mn54 would logically be calculated using a load factor of 20%.
The General Atomic PATH code was used instead of ANISN or ONEDANT for the calculation of FED shutdown dose rates for the following reasons:
1. PATH will handle a 3-D geometry, whereas ANISN and ONEDANT are 1-D codes.
2. The gamma energy structure currently being used with ANISN and ONEDANT is too coarse below 1 MeV to accurately represent low energy gamma buildup.
As part of the previous ETF nuclear analysis, a comparison had been made between ANISN and PATH calculations for Co58 activity in the out-board shield. The DLC-41 photon energy group structure has groups for 0 . 4 - 1.0 MeV, 0.2 - 0.4 MeV, 0.1 - 0.2 MeV, and 0.01 - 0.1 MeV. The Co58 source was entered into the 0.4 — 1.0 MeV group. The ANISN result was a.shutdown dose rate of 30 mrem/h outside the bulk shield. A PATH calculation for the same geometry and source distribution yielded two to three times the ANISN value, an indication that (1) ANISN was tinder-estimating the buildup of scattered radiation and (2) the source photon energy was set at 0.7 MeV instead of the more correct 0.8 MeV, thus overestimating the attenuation.
The geometry used for the FED PATH calculations is sketched in Fig. 5-108. The outboard shield layers were approximated by large circular slabs, while the outboard TF coil was represented by a two-layer prism. The source strength in each layer was assigned an exponential distribution in order to fit the source curves such as Fig. 5-107.
The dose rates from the various regions for the reference 1.2-m SS 316 case, with and without boration of the outer two shield layers, are tabulated in Table 5-37. The shutdown dose rates increase by a factor of 7 when boron is removed from the shield water, because of increased Co60 activity. Even reducing the cobalt impurity in nickel
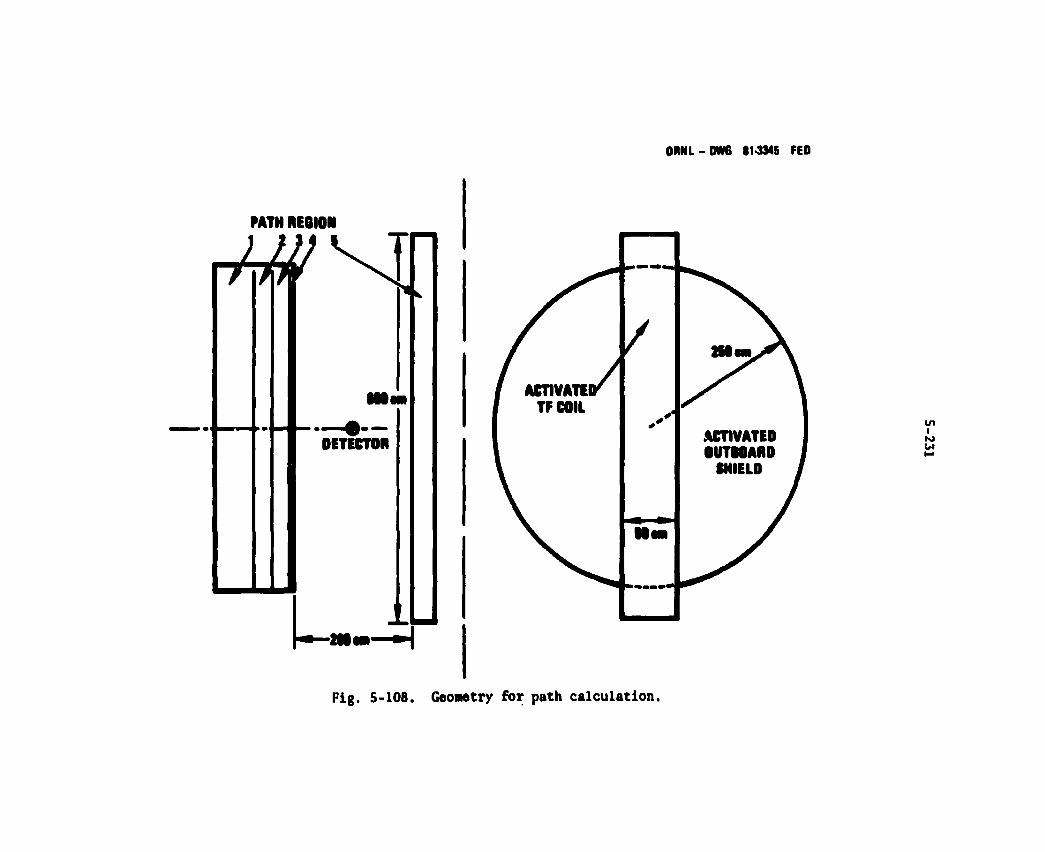
ORNL-OWG 11-3345 FED
PATH REGION
DETECTOR I fo w
Pig. 5-108. Geonetry for path calculation.
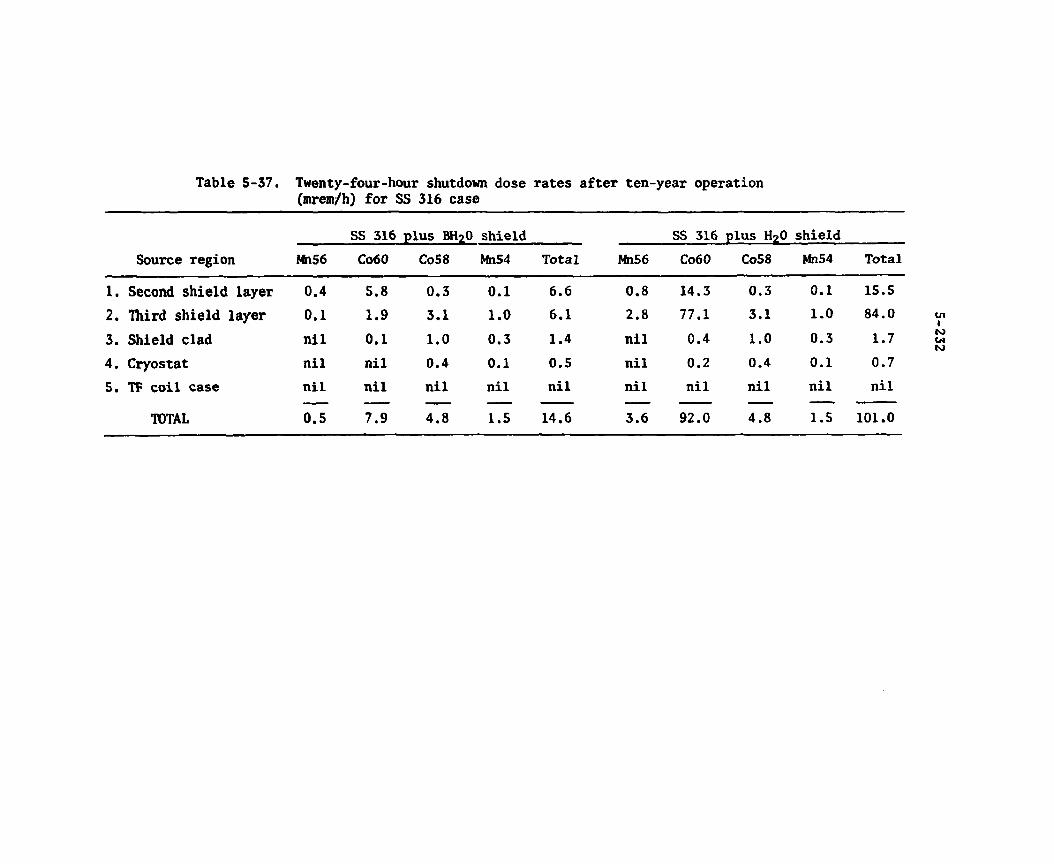
Table 5-37. Twenty-four-hour shutdown dose rates after ten-year operation (mrem/h) for SS 316 case
Source region SS 316 plus BH2O shield SS 316 plus H20 shield
Source region Mn56 Co60 Co58 Mn54 Total Mn56 Co 60 Co58 Mn54 Total
1. Second shield layer 0.4 5.8 0.3 0.1 6.6 0.8 14.3 0.3 0.1 15.5 2. Hiird shield layer 0.1 1.9 3.1 1.0 6.1 2.8 77.1 3.1 1.0 84.0 3. Shield clad nil 0.1 1.0 0.3 1.4 nil 0.4 1.0 0.3 1.7 4. Cryostat nil nil 0.4 0.1 0.5 nil 0.2 0.4 0.1 0.7 5. TF coil case nil nil nil nil nil nil nil nil nil nil
TOTAL 0.5 7.9 4.8 1.5 14.6 3.6 92.0 4.8 1.5 101.0

5-233
from 1% to 0.2% with the unborated water results in an unacceptable dose rate of 27 mrem/h.
Since an objective in considering other steel alloys is the possible elimination of the need for added boron, the shutdown dose rates shown in Table 5-38 for SS 204, SS 304, Fe 1422, Noneut, and Nitrom.c 33 are for unborated shield water. The lowest 24-hour shut-down dose rate is obtained with Noneut, a factor of 4 below the SS 316 shutdown dose rate. Moreover, at 36 hours shutdown the Noneut dose rate is down to 5 mrem/h, a factor of 20 below the SS 316 dose rate.
Even with low cobalt stainless steel, thft shutdown dose rates in all cases are marginal (compared with the goal of 2.5 mrem/h). There-fore, an analysis was made with 5 cm of lead added to the outside of the 1.2-m outboard shield. This modification reduces the differences in the shutdown dose rate between the various steel alloys to an over-all factor of 2 (1.9 mrem/h for 316 SS versus 0.9 mrem/h for Noneut), as shown in Table 5-39.
These calculations show that an alloy steel with a low nickel content should be chosen for the FED bulk shield. Considering all requirements (i.e., corrosion, ductility, availability, etc.), Nitronic 33 was selected as the baseline material. From a neutronic standpoint, Nitronic 33 with unborated water and a 5-cm lead cladding yields acceptable performance. The 1.2-mrem/h dose rate for the 1.2 m of stainless steel and water, plus 5 cm of lead, is a factor of 2 below the design criterion. A shield design with 115 cm of stainless steel and water plus 5 cm of lead cladding was adopted. This results in a shutdown dose rate of 2.5 mrem/h. Figure 5-109 shows the contribut-ing components of this shutdown dose rate as a function of decay time. A longer delay than 24 hours would be beneficial in eliminating the contribution from Mn56.
Because of the heavy steel structure surrounding the outboard TF coils, whatever copper activation is created in the stabilizer (Cu64 emits 0.51 MeV photons) is well shielded against the associated shutdown radiation. Such might not be the case with the PF coils, which are located close to the outboard shield and have less structure. It is
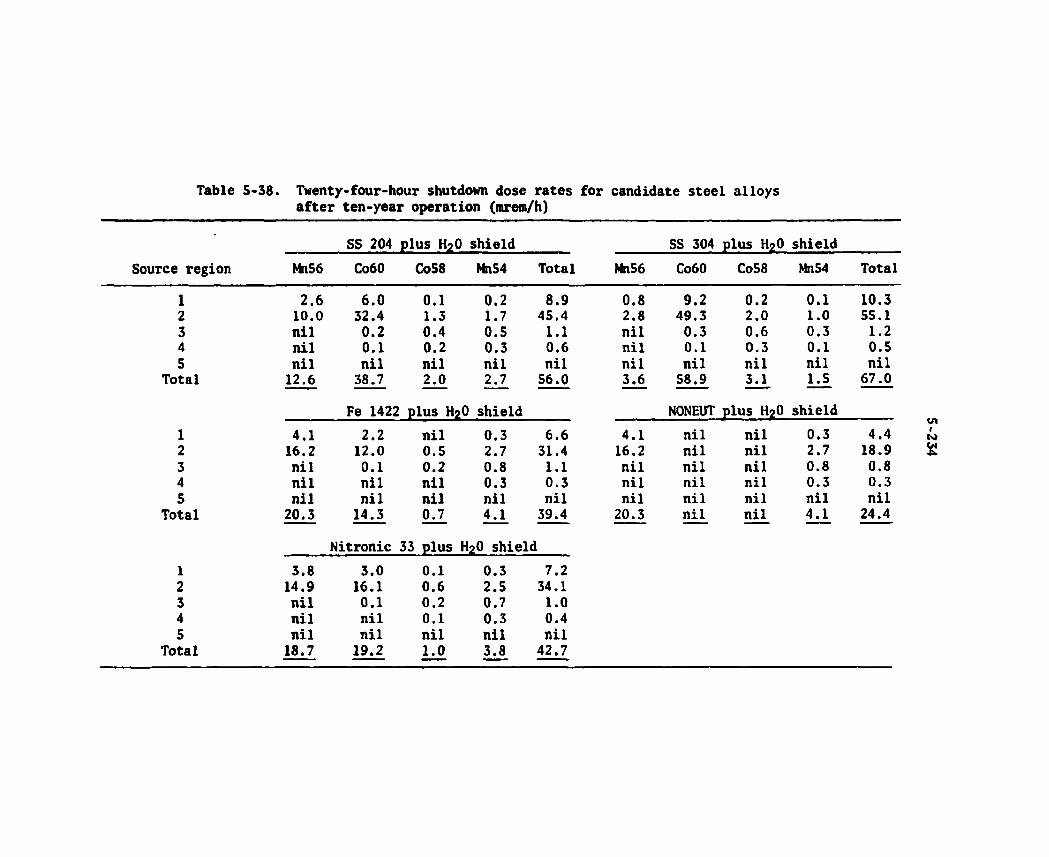
Table 5-38. Twenty-four-hour shutdown dose rates for candidate steel alloys after ten-year operation (mrero/h)
SS 204 plus H20 shield SS 304 plus Hg0 shield Source region Mn56 Co60 Co58 Mn54 Total Mn56 C06O Co58 Mn54 Total
1 2.6 6.0 0.1 0.2 8.9 0.8 9.2 0.2 0.1 10.3 2 10.0 32.4 1.3 1.7 45.4 2.8 49.3 2.0 1.0 55.1 3 nil 0.2 0.4 0.5 1.1 nil 0.3 0.6 0.3 1.2 4 nil 0.1 0.2 0.3 0.6 nil 0.1 0.3 0.1 0.5 5 nil nil nil nil nil nil nil nil nil nil
Total 12.6 38.7 2.0 2.7 56.0 3.6 58.9 3.1 1.5 67.0
Fe 1422 plus H20 shield NONEUT plus H20 shield 1 4.1 2.2 nil 0.3 6.6 4.1 nil nil 0.3 4.4 2 16.2 12.0 0.5 2.7 31.4 16.2 nil nil 2.7 18.9 3 nil 0.1 0.2 0.8 1.1 nil nil nil 0.8 0.8 4 nil nil nil 0.3 0.3 nil nil nil 0.3 0.3 5 nil nil nil nil nil nil nil nil nil nil
Total 20.3 14.3 0.7 4.1 39.4 20.3 nil nil 4.1 24.4
Nitronic 33 plus H2O shield 1 3.8 3.0 0.1 0.3 7.2 2 14.9 16.1 0.6 2.5 34.1 3 nil 0.1 0.2 0.7 1.0 4 nil nil 0.1 0.3 0.4 5 nil nil nil nil nil
Total 18.7 19.2 1.0 3.8 42.7
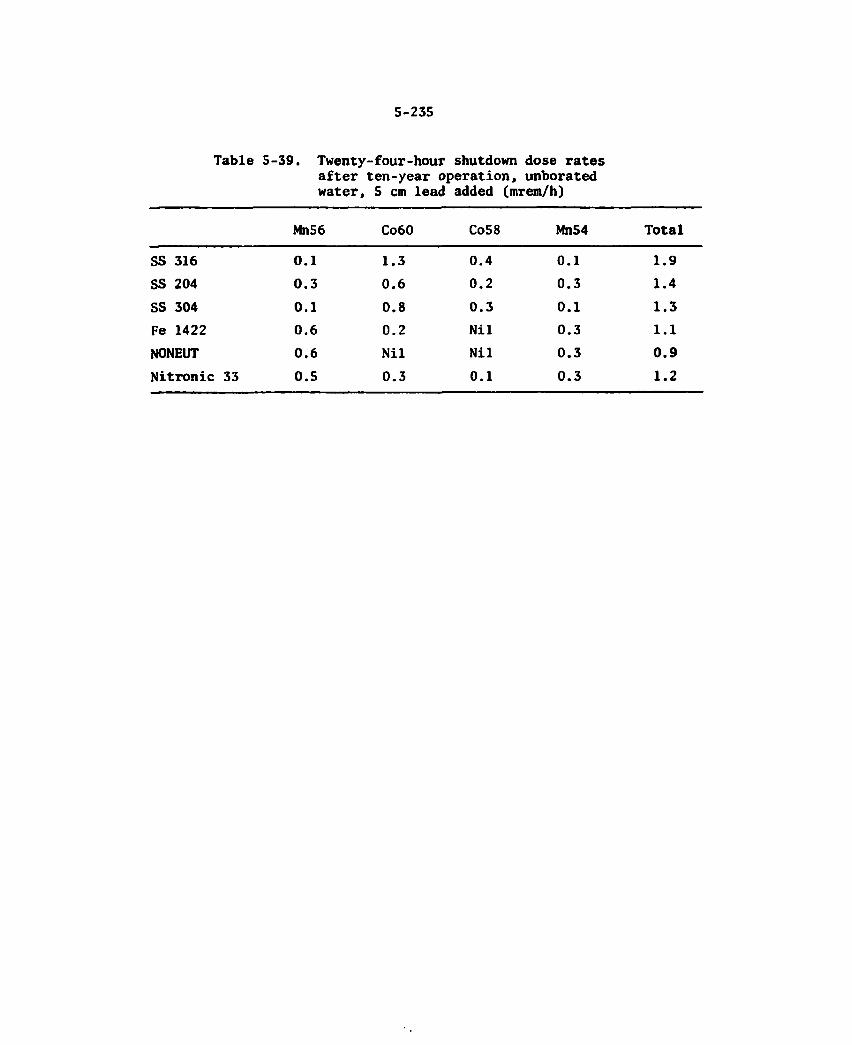
5-235
Table 5-39. Twenty-four-hour shutdown dose rates after ten-year operation, unborated water, 5 cm lead added (mrem/h)
Mn56 Co60 Co58 MnS4 Total
SS 316 0.1 1.3 0.4 0.1 1.9 SS 204 0.3 0.6 0.2 0.3 1.4 SS 304 0.1 0.8 0.3 0.1 1.3 Fe 1422 0.6 0.2 Nil 0.3 1.1 NONEUT 0.6 Nil Nil 0.3 0.9 Nitronic 33 0.5 0.3 0.1 0.3 1.2
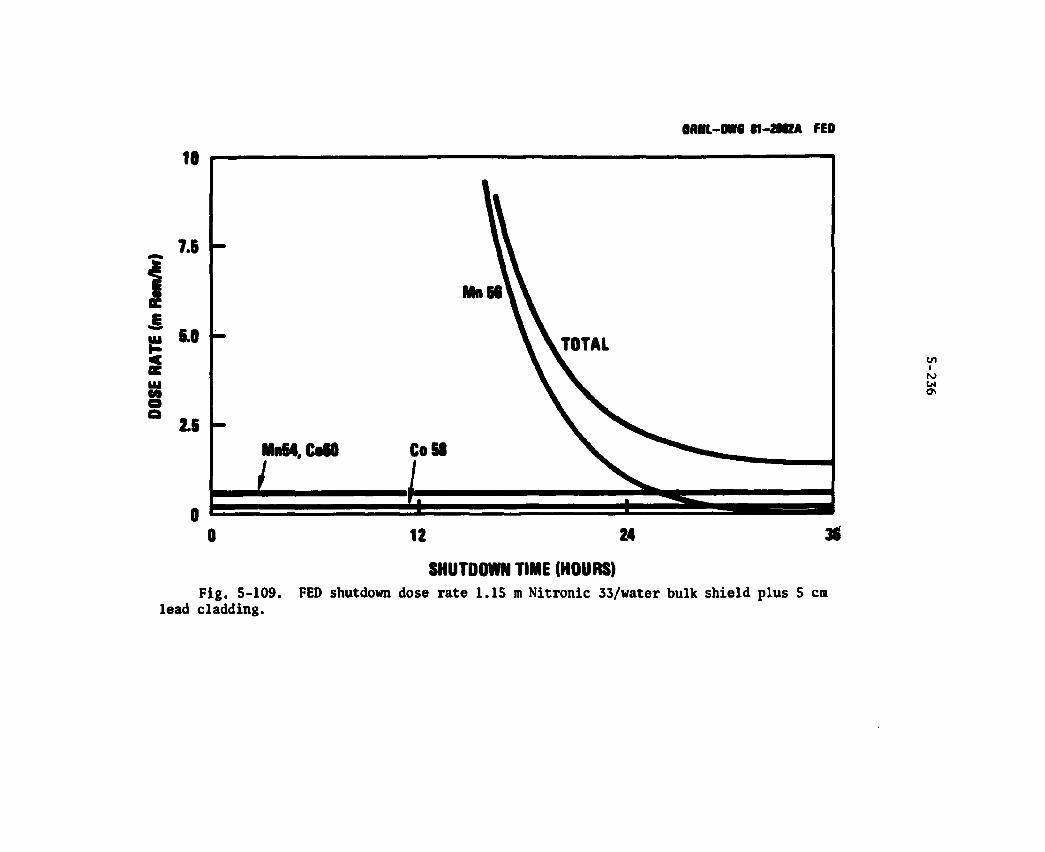
OMUL-MS M - 2 N M FED
SHUTDOWN TIME (HOURS) Fig. 5-109. FED shutdown dose rate 1.15 m Nitronic 33/water bulk shield plus 5 cm
lead cladding.

5-237
calculated that the Cu64 activity at shutdown could be ^1.0 pCi/cm3. Such an activity could add 1 or 2 mrem/h to the shutdown dose rate at 24 hours (for a detector point between the outside of the shield and the inside of the PF coil). Waiting 36 hours instead of 24 hours will reduce this dose rate by a factor of 2. It may be necessary to limit access to certain locations such as this beyond the general access criterion of 24 hours.
Gaps and inhomogeneities
The effects of gaps and inhomogeneities in the bulk shield have been recognized and accounted for in the preconceptual designs of both ETF and FED. In the studies, use has been made of semianalytic methods and parametric data from fission-reactor experience. The state-of-the-art of fusion neutronics will be enhanced after LANL completes work on a fusion gap-streaming parametric study and after a streaming compendium is developed under OFE-DfJT cognizance.1*7 In the meantime, qualitative results presented here were used as the design basis for the FED bulk shield.
A clearance of 1 to 3 cm is provided between torus sectors. A gap with no steps would provide attenuation of1*8
i ^ HL-
•o " L '
where
4 = neutron flux at gap exit
= neutron flux at gap entrance V = the gap width L = the gap length .
In the case of the inboard shield, L = 60 cm; so the attenuation would range from 0.017 to 0.05. Since the shield provides a neutron attenua-tion of 10"*, a straight-through gap is obviously unacceptable.

5-238
A step or elbow in a penetration can normally be counted on for an order-of-magnitude additional attenuation. The configuration shown in Fig. 5-110 is currently being used between the inboard sectors. Note that the overall attenuation along the gap is about 10" 3, which produces a small but acceptable radiation peak at the inboard gap opening. This peak becomes quite well diffused after passage through the spool piece, cryostat, thermal insulation, and coil case.
An open gap is not the only way radiation can stream through the bulk shield. The optimized shield arrangement calls for alternate layers of steel and water. If a straight path of solid steel exists through the shield, intermediate-energy neutrons will preferentially stream along the steel with some forward scattering but experience very little moderation. The result may be an unacceptably high neutron peak outside the shield. Hence, steps must be introduced in the shield structure to interrupt the straight paths of solid steel.
In the event of a water pathway straight through the shield, a combination of 14-MeV neutron streaming and capture gamma streaming will take place. After shutdown, activation gammas from the first wall region could actually stream through the water, producing an excessive shutdown dose rate outside the shield.
Figure 5-111 depicts two other gap problems which must be consid-ered.
The torus spool upper and lower panels intersect the outboard bulk shield both at the top and bottom. These spool panels are very low density steel web structures; the spool panel depicted at the top is some 0.2 m thick but contains the equivalent of only about 2 cm of solid steel. Hence, if additional shielding were not provided, the equivalent of an 18-cm horizontal gap would be introduced into the outboard bulk shield. Since 0.8 cm of shield precedes the gap, the neutron level in this space would be about three orders of magnitude higher than the external level. Hence, as shown in the sketch, lateral neutron stream-ing would occur in the vicinity of the outboard PF coil, resulting in a shutdown dose rate near this coil far in excess of 2.5 rem/h. In addition, as implied in Fig. 5-107, the radionuclide concentration 0.8 m
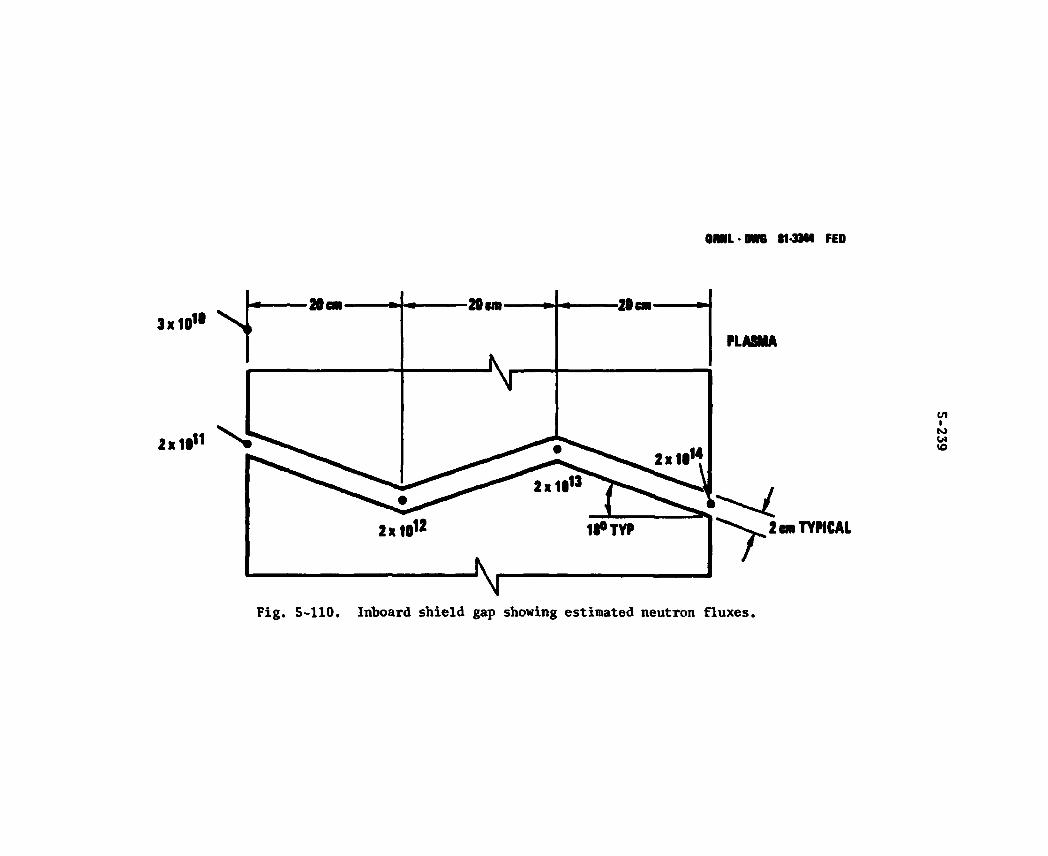
ORNL • DW6 11-3344 FED
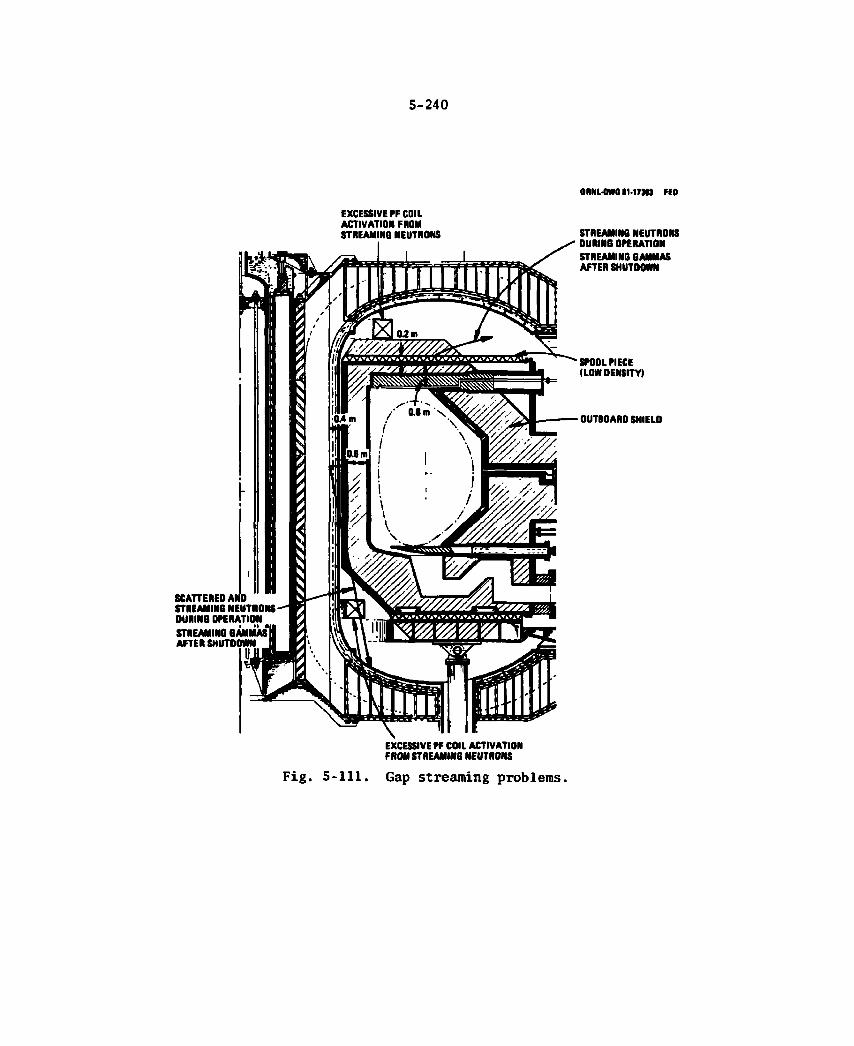
5-240
0RNL-0W611-17301 FED EXCESSIVE PF COIL ACTIVATION FROM STREAMING NEUTRONS
SCATTERED AND STREAMING NEUTRONS 0URIN6 OPERATION >
STREAMING GAMMAS* AFTER SHUTDOWN
EXCESSIVE PF COIL ACTIVATION FROM STREAMING NEUTRONS
STREAMING NEUTRONS DURING OPERATION STREAMING GAMMAS AFTER SHUTDOWN
SPOOL PIECE (LOW DENSITY)
OUTBOARD SHIELD
Fig. 5-111. Gap streaming problems.

5-241
through the 1.2-m shield would be very high, particularly for such species as C06O and Mn56. After shutdown, activation gammas from the spool piece would stream out the slot, preventing manned access to this region. The solution is to fill void spaces in the spool piece with moderating material, so as to increase its shielding effectiveness to that of SS plus water.
Relative to the panel "density" issue, the long vertical inboard gap between the inboard shield and the TF coil case, also shown in Fig. 5-111, presents a greater potential for neutron and gamma stream-ing. Its equivalent width is about 0.4 m, and the radiation levels entering the gap are higher. Furthermore, since this gap is a composite of several regions, including nitrogen-cooled superinsulation, one cannot simply "fill" the region with a moderating material. Also, the gap provided between the support spool and the cryostat for seismic movement cannot be eliminated.
The shutdown dose rate in this gap was estimated to be 500 rem/h. If, during operation, only 1% of the gap neutrons are able to reach the region below the gap (at a PF coil), it would be reasonable to expect a shutdown dose rate at the latter location of about 5 rem/h, a factor of 2000 above the criterion. One would also expect some of the gammas contributing to the gap shutdown dose rate to stream down, possibly adding another 5 rem/h at the PF coil. Shield rings or blocks must be incorporated within these inboard gaps to minimize the radiation stream-ing effects. The rings could be interleaved or flexible where necessary to allow for structural movement.
The inboard gap streaming problem is the most serious impediment to contact maintenance after shutdown and is identified as a major unresolved design issue.
5.5.4 Duct Shield Design
Before 1980, little analytical work had been done on duct shielding for fusion reactors, the only major effort in this regard being studied by Jung and Abdou.49*50 The need for further calculations was recog-nized early in the ETF program, and ORNL and LANL shield design groups
5-242
were enlisted in late 1979 to analyze NBI and vacuum duct streaming. Concurrently, ANL was initiating streaming and shielding calculations for the STARFIRE rf and vacuum ducts.
The LANL scope of work essentially consisted of utilizing the MCNP Monte Carlo and the TRIDENT-CTR discrete ordinates codes to obtain fluxes in the ETF NBl and vacuum ducts and duct shielding. ORNL was asked to calculate fluxes and heating rates in the ETF NBI cryopanels, as well as the radiation levels in the drift duct, using the DOT dis-crete ordinates code. Both laboratories completed their work in late 1980 and subsequently have uc.umented the results, both in technical reports and in technical papers.51*52
Fortunately, the scope of work was broad enough and the presenta-tion of results flexible enough to permit extension to the FED design (and to other tokamak designs with large ducts). For example, Fig. 5-112 shows a generalized two-legged duct based on the LANL ETF analysis, indicating how wall loading and shutdown dose rate for the FED conditions might vary with distance along the duct.
No new analyses of FED duct streaming and duct shielding were performed during FY 81, for several reasons: (1) many of the ETF results could be extrapolated, (2) neutral beam injection became a backup concept rather than the reference concept, and (3) the level of effort did not permit new streaming calculations. The FED duct shield designs discussed below thus generally represent extrapolations from previous work, modified by utilization of semianalytic shielding techniques.
Neutral beam injector duct
The results of an analysis of the ETF and NBI duct carried out by LANL53 and ORNL54 were used as the basis for estimating the FED NBI shielding requirements, should neutral beam injectors be used on FED. At a neutron wall loading of about 0.4 MW/m2 (8-T operation), the LANL analysis indicates that the external flux level at the far end of the FED duct shield would be about 2 x 10® n/cm2 — s. In the ORNL analysis of the ETF NBI duct,54 a duct shield 1.2 m thick was analyzed. LANL
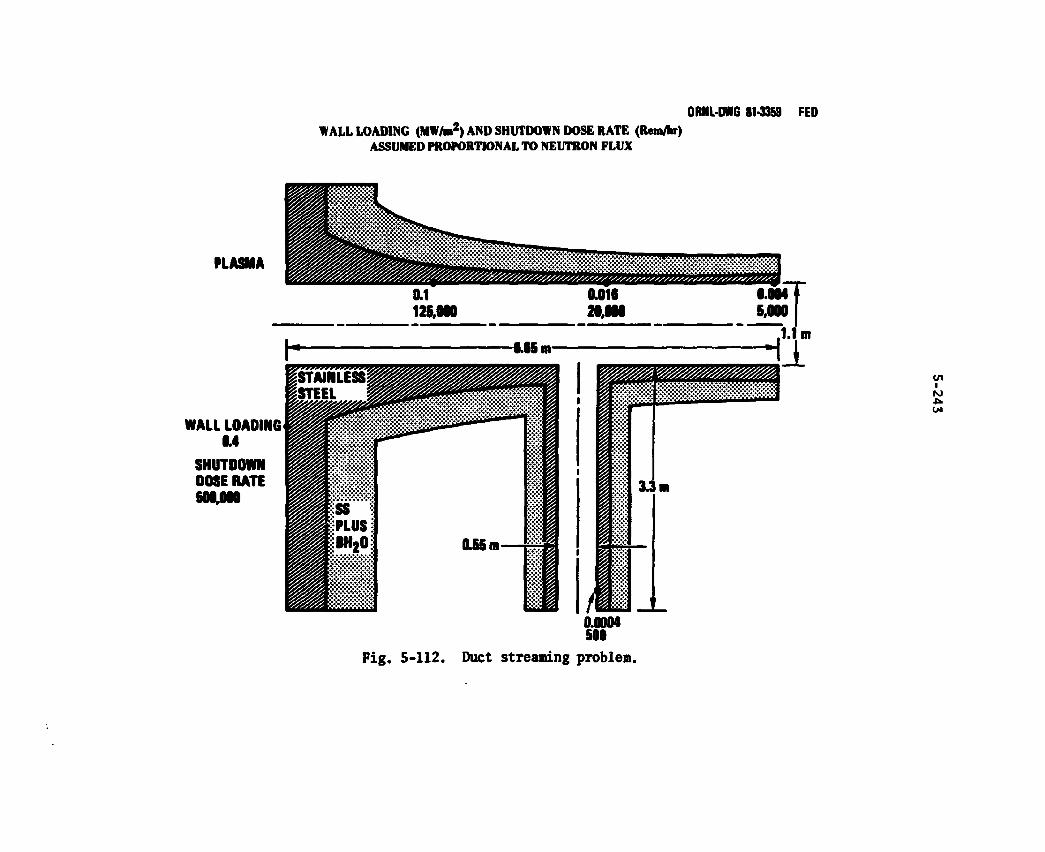
ORNL-DWG 81-2598R3 FED WALL LOADING (MW/m2) AND SHUTDOWN DOSE RATE (Rem/hr)
ASSUMED PROPORTIONAL TO NEUTRON FLUX
PLASMA
WALL LOADING 0.4
SHUTDOWN DOSE RATE 500,000
0.0004 500
F ig . 5-112. Duct streaming problem.
5-244
and ORNL results for ETF are plotted together in Fig. 5-113. The ORNL results at a distance of 1.30 m down the duct are being influenced by neutrons from the tokamak bulk shield, whereas LANL's model did not allow for this effect.
The reference design for the FED NBI duct shield is shown in Fig. 5-114. As pointed out in Section 5.5.3, an operating external neutron flux level of 10 7 n/cm 2 — s should keep activation down to sufficiently low levels to allow contact maintenance 24 hours after shutdown, if lcv-nickel steel and a lead cladding are employed. In order to limit the external flux to 10 7 n/cm 2 — s, the shield should be approximately 1 m thick at the valve end of the duct and approximately 60 cm thick at the NBI end of the duct. It will very likely be neces-sary to clad the outside of the NBI duct shield with lead, as is done with the bulk shield.
Rf launcher
The FED rf launcher concept is shown in Fig. 5-115. Some shielding is provided by a ridge waveguide, which results in an inverted U-shaped duct with a total width of 2 m and an overall height of 0.3 m. Shield-ing estimates for the FED rf launcher were made by line-of-sight tech-niques, aided by extrapolations from LANL duct streaming calculations. 5 3
It was estimated that 0.9 m of shielding at the end of the launcher would reduce the neutron flux to approximately the same level as the 1.2-m bulk shield. It would be straightforward to represent the launcher geometry in MCNP 5 5 format and obtain accurate shield thick-nesses; such an analysis is recommended in a more detailed design phase.
Vacuum duct
The FED pump limiter vacuum duct, shown in Fig. 5-116, is a complex configuration which requires the use of Monte Carlo techniques for accurate shield design. Hand calculation methods (the Simon-Clifford equation) and comparisons with the LANL vacuum duct analysis 5 3 were used to make the present estimates.
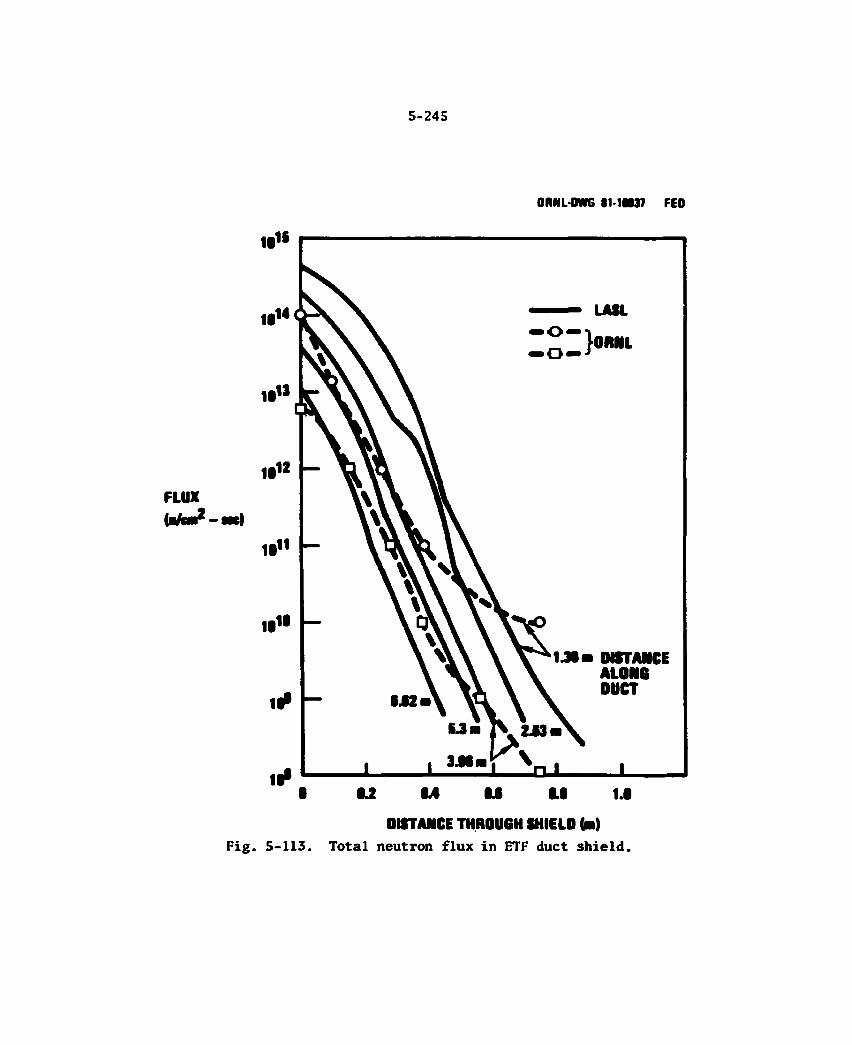
5-245
ORNL-DWG 81-18937 FED
FLUX (afoa2
DISTANCE THROUGH SHIELD (n) Fig. 5-113. Total neutron flux in ETF duct shield.
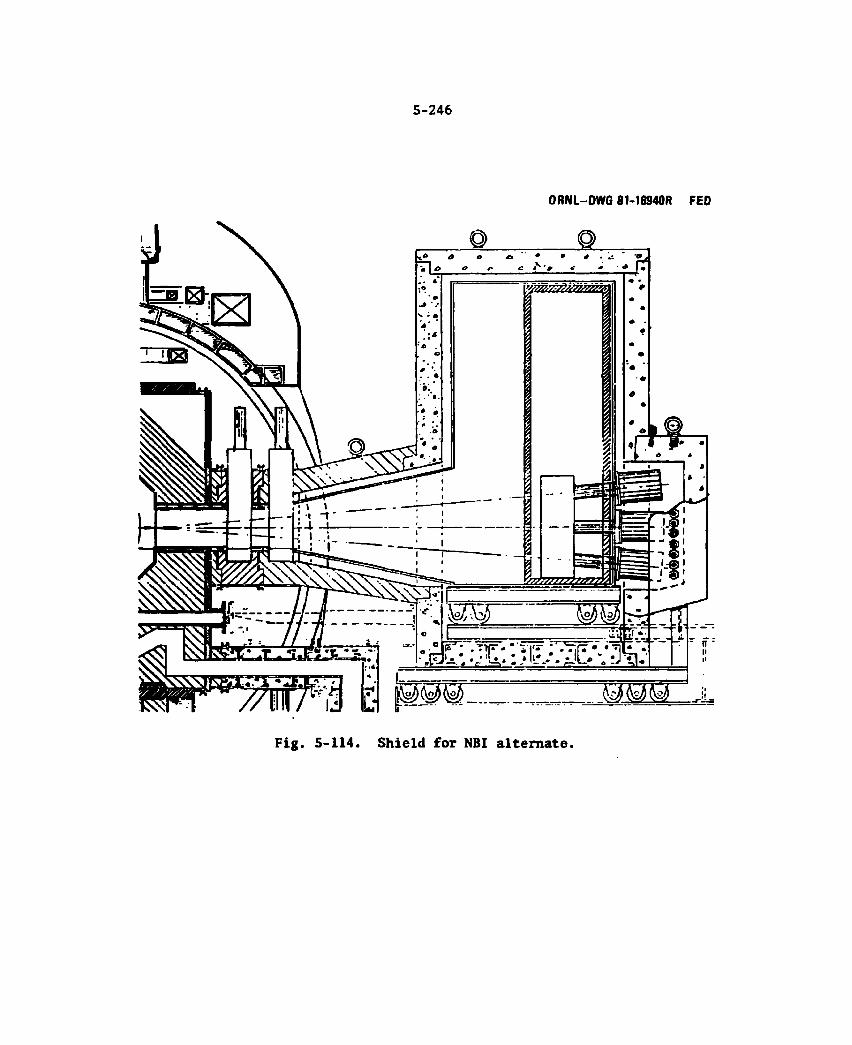
5-246
ORNL-DWG 81-16940R FED
Fig. 5-114. Shield for NBI alternate.
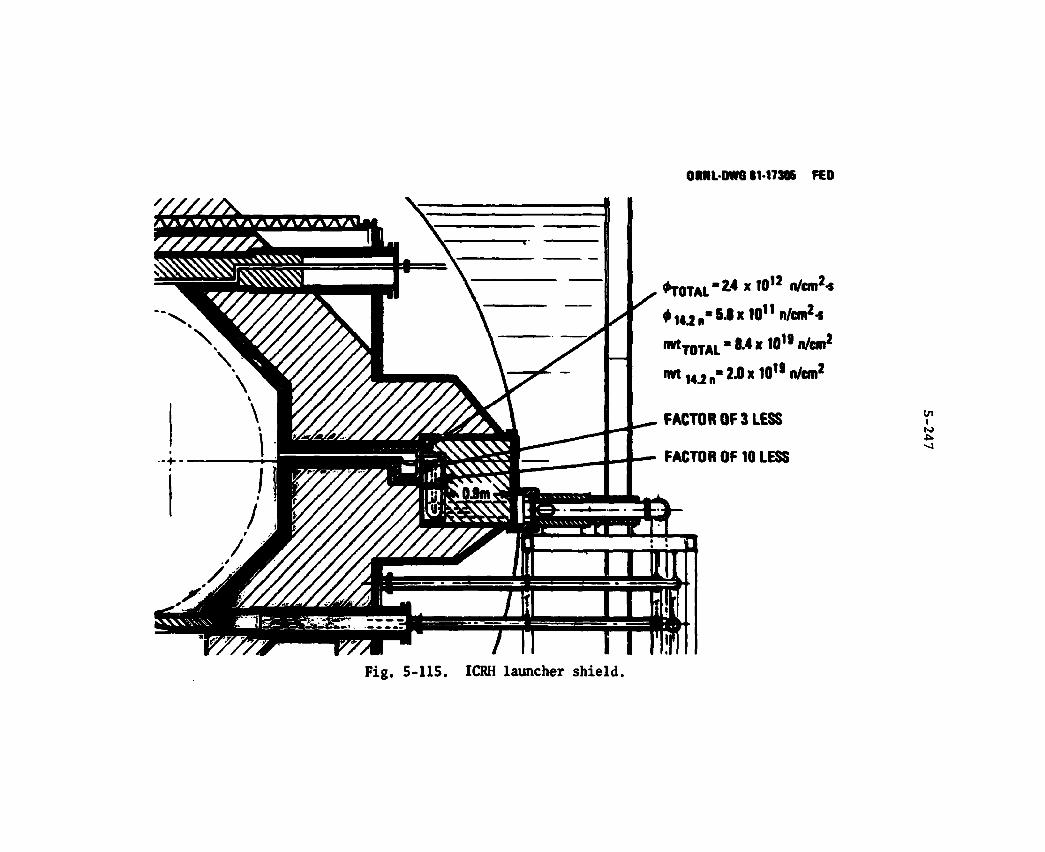
ORNLOWG11-17306 FED
* T 0 T A L " Z 4 * 1 0 , 2 " /a" 2 " 1
•l*Jn"5-8x,°11n/cm2-1
8.4*1019n/cm2 TOTAL
14.2 n' '2Jx101 9n/cm2
FACTOR OF 3 LESS
FACTOR OF 10 LESS
rr Fig. 5-115. ICRH launcher shield.
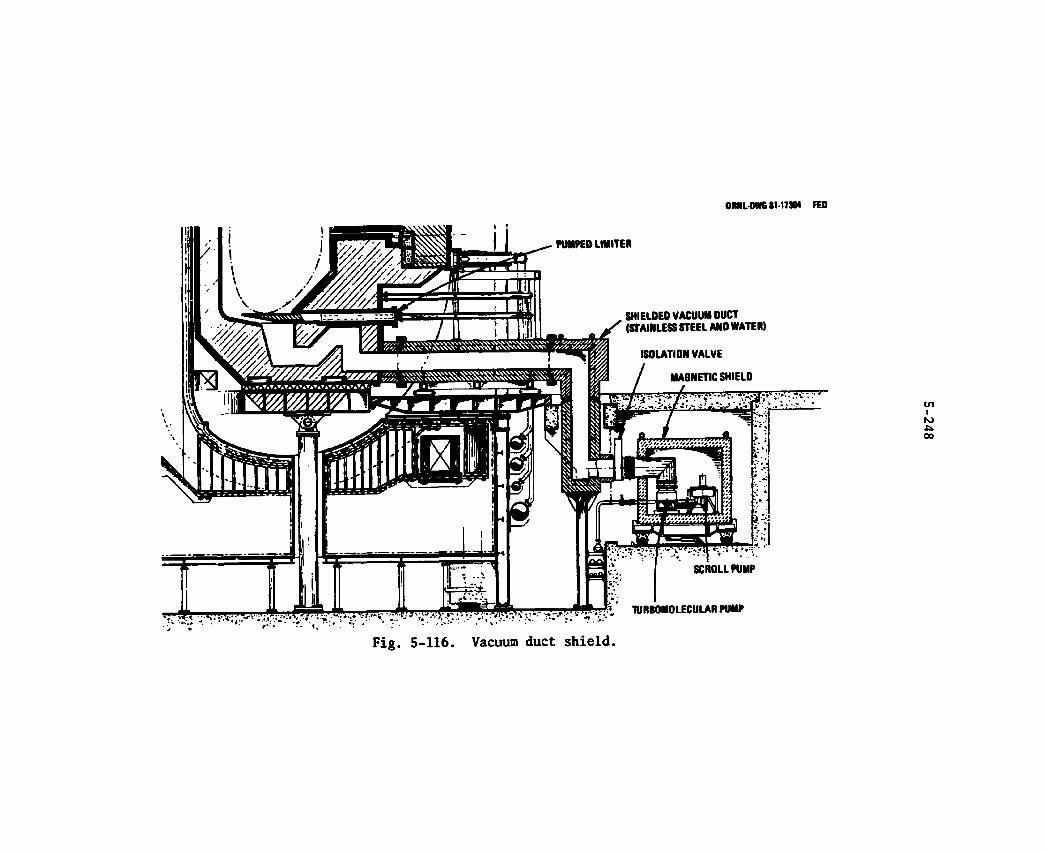
ORNL-DWG11-1730* FED
PUMPED LIMITER
SHIELDED VACUUM OUCT S (STAINLESS STEEL AND WATER)
• i TURBOMOLECULARPUMP
Fig. 5-116. Vacuum duct shield.

5-249
An important feature of the FED vacuum duct design is the incorpor-ation of two 180° returns in the duct while it is still within the bulk shield. Together, these two elbows should provide an additional atten-uation factor of 100 over that for a straight duct or slot. Also, the limiter itself provides a modest amount of neutron attenuation.
LANL's study showed that the total neutron e-folding distance in the vacuum duct shield was quite small—less than 4 cm. Hence, it is estimated that a 40-cm-thick duct shield (SS and water) is adequate for the first exterior leg. Additional thickness is needed to block streaming at the end of this leg. The second and third legs can utilize modest thicknesses of stainless steel and water, or even ordinary concrete.
Activation of the vacuum pumps should be low enough to permit contact maintenance after shutdown. Hence, no nuclear shielding is required around the pumps; however, magnetic shielding, as shown in Fig. 5-116, is a necessity.
Fueling penetrations
The shielding analysis for a small-diameter penetration is usually more challenging than that for a major duct. If the Monte Carlo method is used, the statistics for a small duct are generally worse than for a large duct, for the same number of histories. This problem was investigated4^50 using Monte Carlo calculations to compare 0.2-m diameter and 0.85-m diameter ducts. The following conclusions were made: "Better statistics are obtained for the larger duct case... Smaller duct sizes are more computer-time consuming than larper ducts. In addition, as the shield effectiveness is improved, the computational difficulties increase substantially."
The current design of the fuel injector shielding is shown in Fig. 5-117. The shield, composed of stainless steel and water equiv-alent, is 50 cm thick at the bulk shield end of the injector. Although not incorporated in the design, the shield could be tapered down to 20 cm, based on calculations using the Simon-Clifford equation lor a
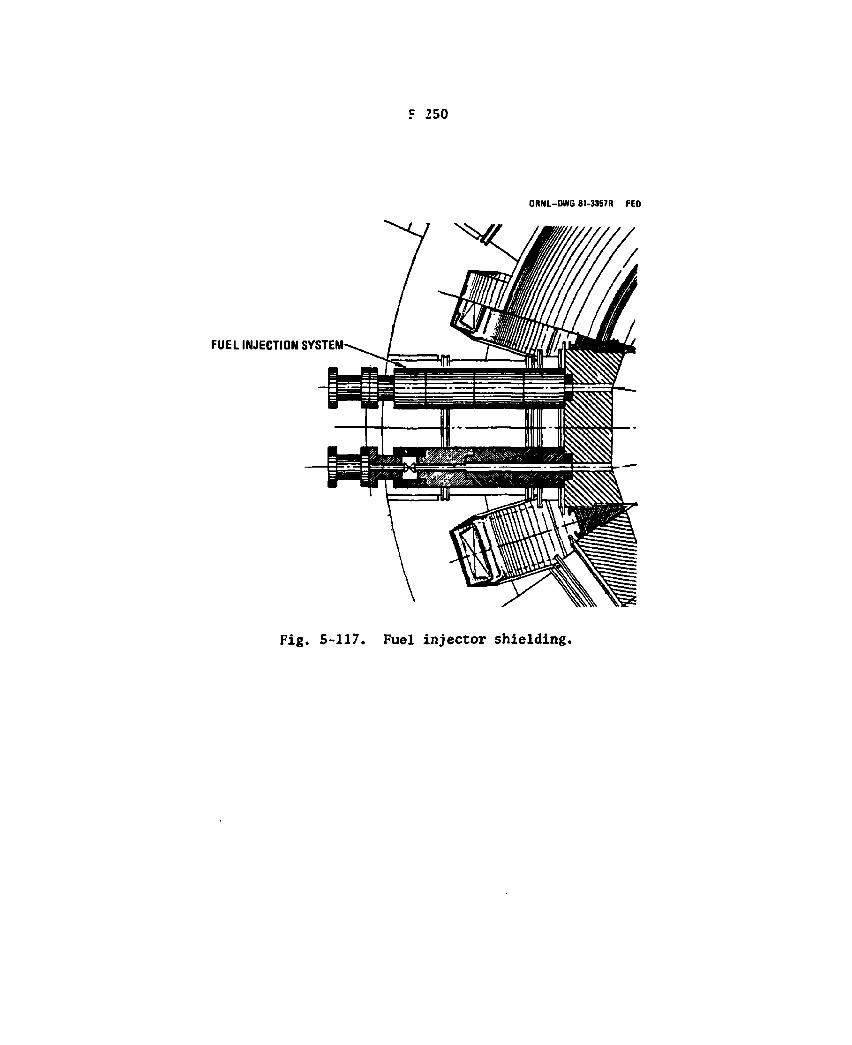
F 250
O R N L - D W G 81-3357R FED
FUEL INJECTION SYSTEM
Fig. 5-117. Fuel injector shielding.
5-251
15-cm-diameter penetration and assuming an e-folding distance of 4 or 5 cm.
5.5.5 Component Shield Design
During the ETF design effort, shielding estimates were made for the neutral beam injectors and bundle divertor. The purpose of component shielding is twofold: to limit neutron transport beyond the component, producing activation in the building; to attenuate activation gammas from the component after shutdown.
Neutron beam injector
Shielding estimates for the neutral beam injector were originally made under the assumption that a shield shutter would close off the drift duct during the burn. Under these conditions, it appeared that 0.6 m of borated concrete at the back of the NBI and 0.45 m at the top, sides, and bottom would be adequate.
Studies by ORNL on the TFTR NBI shield56 and an extrapolation to ETF conditions with no shutter shield57 generally indicate greater NBI shield thicknesses are required to achieve the 2.5-mrem/h shutdown criterion. Scaling to the 8-T FED case with a load factor of 20%, a basic shield of about 1 n of concrete is required (Fig. 5-115). (INTOR is recommending 0.5-0.75 m of concrete for their NBI shield.)58
Rf launcher
This component primarily constitutes J. duct shielding problem, discussed in Section 5.5.4. The coax window should be protected from line-of-sight radiation from the plasma, either by an intervening shield plug or by locating it after an elbow.
Diagnostic components
An OFE-sponsored diagnostic hardening study is currently being conducted at General Atomic in which radiation environments and

5-252
shielding approaches are being examined for several fusion reactor designs, including FED.
Diagnostic equipment has a wide range of radiation susceptibility and exposure requirements. Therefore, the first approach to radiation protection is a parametric one, covering a wide range of radiation limits and integrated exposures. Shielding methods for diagnostic equipment are summarized below:
1. Line-of-sight diagnostics a. Minimize exposure time (withdrawal capability) b. Minimize penetration diameter c. Maximize penetration length d. Minimize number of penetrations e. Provide shielding outboard of penetrations and receptors
2. Non-line-of-sight diagnostics a. Incorporate shield barriers or windows in penetrations, if
possible b. Incorporate elbows into the penetration c. Provide elbow and shielding outboard of penetration
The general radiation levels which FED diagnostics will encounter are shown in Fig. 5-118, and a more detailed view of the situation at typical bulk shield penetration is depicted in Fig. 5-119. The latter shows examples of patch shielding outside diagnostic penetrations through the bulk shield and the use of an offset (two 90° elbows) to reduce exposure of diagnostic windows.
5.5.6 Radioactivity Inventories and Afterheat
Inventories of selected activation products were calculated for the outboard shield in connection with the shutdown dose rate study in Section 5.5.3. Table 5-40 lists the saturated inventories in the first wall for a wall loading of 0.4 MW/m2. Also shown are levels after ten years of operation at 11% load factor.
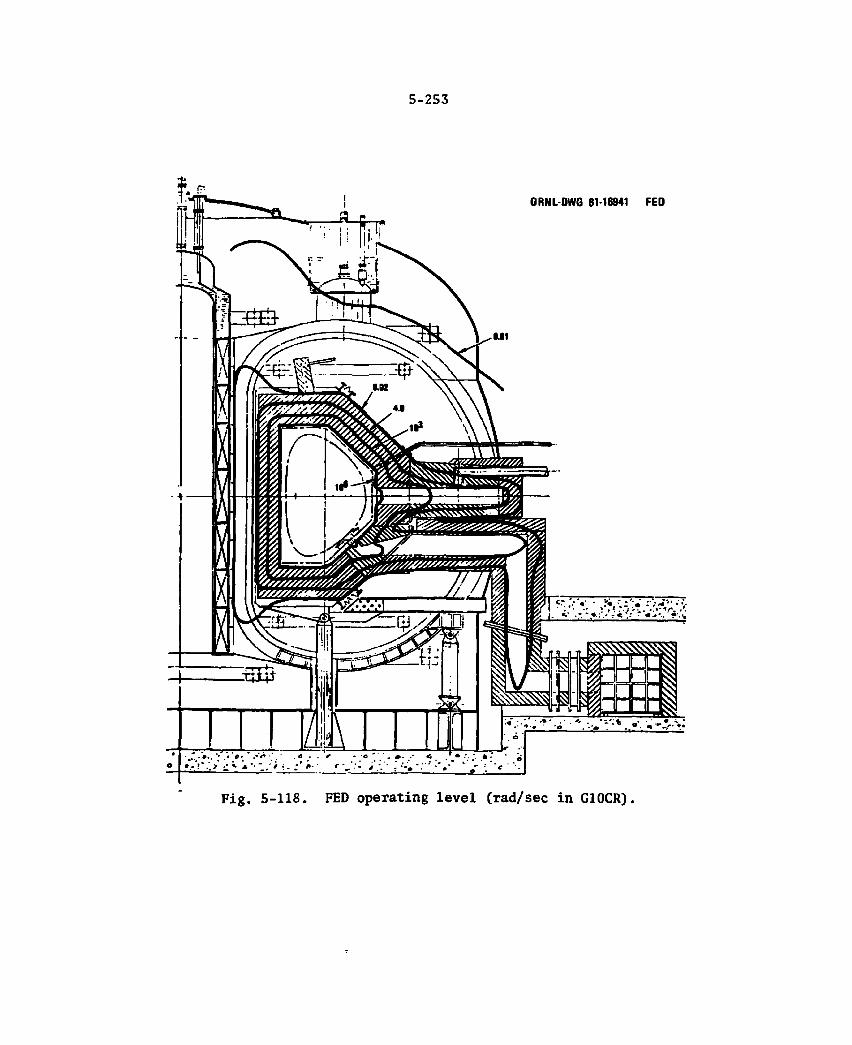
5-253
Fig. 5-118. FED operating level (rad/sec in G10CR).
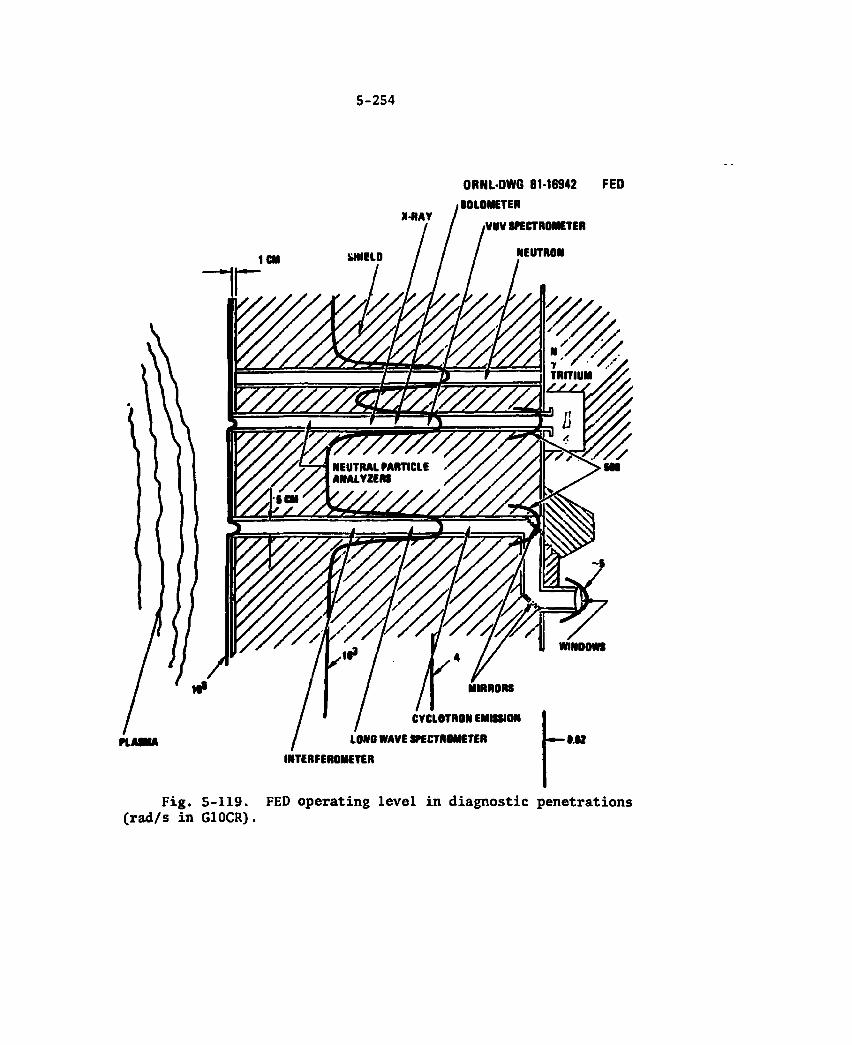
5-254
I
ORNL-DWG 81-16942 FED
BOLOMETER
VUV SPECTROMETER
PLMMA
Fig. 5-119. FED operating level in diagnostic penetrations (rad/s in G10CR).
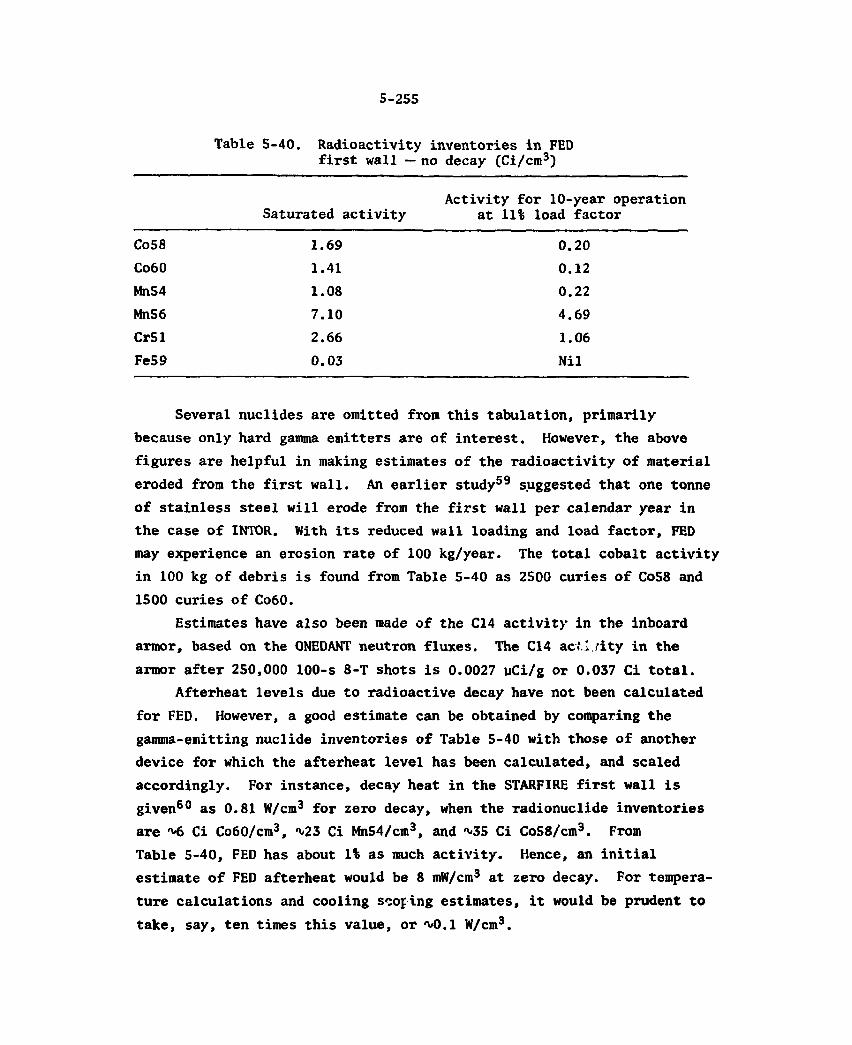
5-255
Table 5-40. Radioactivity inventories in FED first wall — no decay (Ci/cm3)
Saturated activity Activity for 10-year operation
at 11% load factor
Co58 1.69 0.20 Co60 1.41 0.12 Mn54 1.08 0.22 Mn56 7.10 4.69 Cr51 2.66 1.06 Fe59 0.03 Nil
Several nuclides are omitted from this tabulation, primarily because only hard gamma emitters are of interest. However, the above figures are helpful in making estimates of the radioactivity of material eroded from the first wall. An earlier study59 suggested that one tonne of stainless steel will erode from the first wall per calendar year in the case of INTOR. With its reduced wall loading and load factor, FED may experience an erosion rate of 100 kg/year. The total cobalt activity in 100 kg of debris is found from Table 5-40 as 2500 curies of Co58 and 1500 curies of Co60.
Estimates have also been made of the C14 activity in the inboard armor, based on the ONEDANT neutron fluxes. The C14 activity in the armor after 250,000 100-s 8-T shots is 0.0027 uCi/g or 0.037 Ci total.
Afterheat levels due to radioactive decay have not been calculated for FED. However, a good estimate can be obtained by comparing the gamma-emitting nuclide inventories of Table 5-40 with those of another device for which the afterheat level has been calculated, and scaled accordingly. For instance, decay heat in the STARFIRE first wall is given60 as 0.81 W/cm3 for zero decay, when the radionuclide inventories are Ci Co60/cm3, ^23 Ci Mn54/cm3, and ~35 Ci Co58/cm3. From Table 5-40, FED has about 1% as much activity. Hence, an initial estimate of FED afterheat would be 8 mW/cm3 at zero decay. For tempera-ture calculations and cooling sloping estimates, it would be prudent to take, say, ten times this value, or M).l W/cm3.
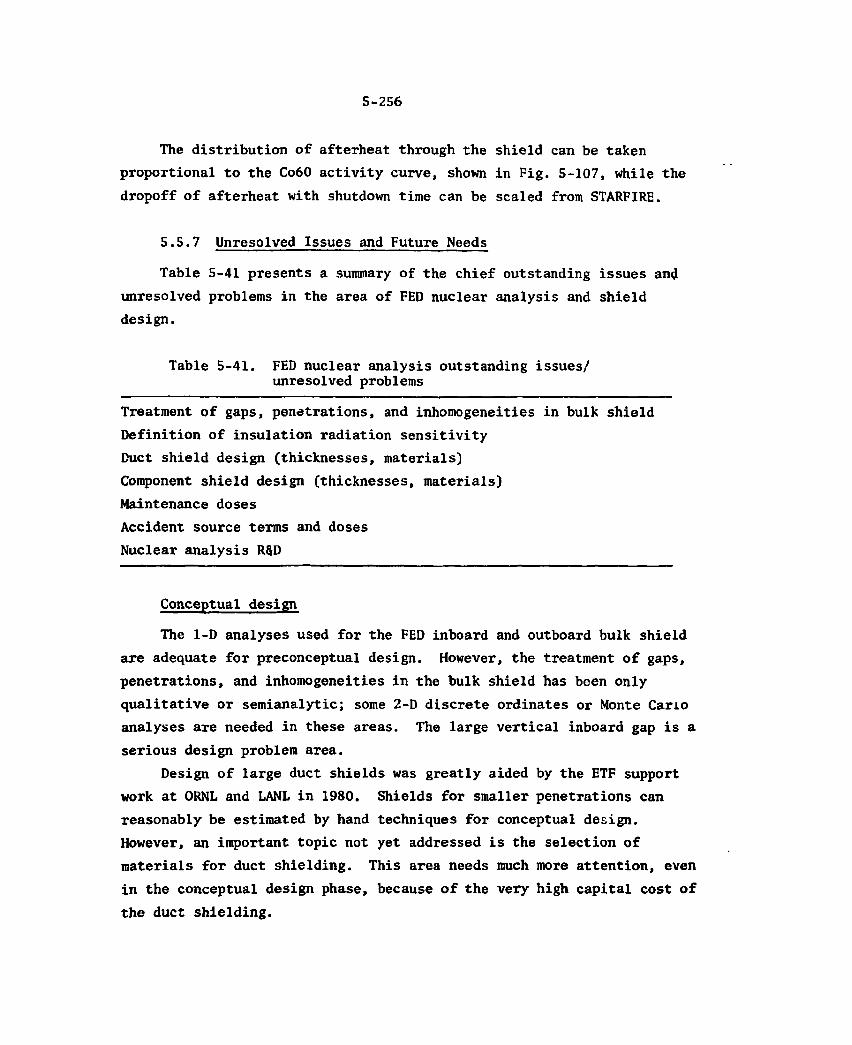
5-256
The distribution of afterheat through the shield can be taken proportional to the C06O activity curve, shown in Fig. 5-107, while the dropoff of afterheat with shutdown time can be scaled from STARFIRE.
5.5.7 Unresolved Issues and Future Needs
Table 5-41 presents a summary of the chief outstanding issues and unresolved problems in the area of FED nuclear analysis and shield design.
Table 5-41. FED nuclear analysis outstanding issues/ unresolved problems
Treatment of gaps, penetrations, and inhomogeneities in bulk shield Definition of insulation radiation sensitivity Duct shield design (thicknesses, materials) Component shield design (thicknesses, materials) Maintenance doses Accident source terms and doses Nuclear analysis R$D
Conceptual design
The 1-D analyses used for the FED inboard and outboard bulk shield are adequate for preconceptual design. However, the treatment of gaps, penetrations, and inhomogeneities in the bulk shield has been only qualitative or semianalytic; some 2-D discrete ordinates or Monte Carlo analyses are needed in these areas. The large vertical inboard gap is a serious design problem area.
Design of large duct shields was greatly aided by the ETF support work at ORNL and LANL in 1980. Shields for smaller penetrations can reasonably be estimated by hand techniques for conceptual design. However, an important topic not yet addressed is the selection of materials for duct shielding. This area needs much more attention, even in the conceptual design phase, because of the very high capital cost of the duct shielding.
5-257
Maintenance doses still need to be calculated throughout the building to provide input to facility design and operations studies.
Preliminary design
In addition to elaborating on the items mentioned above, the bulk shield do.sign should be confirmed by 2-D or 3-D transport calculations for the FED preliminary design. All gaps, penetrations, and inhomo-geneities must be analyzed and accounted for in the design; diagnostic penetrations should represent a large part of the effort.
Component shield design, only estimated or extrapolated in the conceptual phase, should be computer calculated and optimized for the preliminary design.
Finally, in cooperation with FED safety analysts, detailed radio-nuclide inventories should be calculated for all plant components, along with accurate afterheat levels and decay rates.
5-258
REFERENCES
1. AISC Steel Construction Manual, Seventh Edition (1970). 2. C. C. Baker et al., STARFIRE - A Commercial Tokamak Fusion Power
Plant Study, Argonne National Laboratory ANL/FPP-80-1 (September 1980).
3. H. C. Howe, Physios Considerations for the FED Limiter, ORNL/TM-7803, Oak Ridge National Laboratory (July 24, 1981).
4. J. R. Haines, Personal Communication, FEDC-M-81-NS-046 (3/13/81). 5. J. P. Hirth and G. M. Pound, Condensation and Vaporization,
Progress in Materials Science, Vol. 11, pp. 1-14 (1963). 6. R. E. Honig and P. A. Kramer, RCA Review, Vol. 30, p. 285 (1969). 7. W. M. Stacey, Jr. et al., USA INTOR/Bl-l, Vol. 1 (June 1981). 8. W. Bieger, "Proceedings of the International Symposium on Plasma
Wall Interactions," Julich, October 1976, Pergamon Press, Oxford (1977).
9. J. F. Schievell, Princeton Plasma Physics Laboratory, PPPL-1342 (1977).
10. J. N. Brooks, "Proceedings of the Third ANS Topical Meeting on the Technology for Controlled Nuclear Fusion," Conference 780508-2, p. 873 (1978).
11. R. W. Conn et al., "Proceedings of the IEEE Symposium on Engineer-ing Problems of Fusion Research," IEEE Publication No. 79CH1441-5-NPS (1979).
12. D. Overskei , The Efficiency of Passive Limiter Pumping of Neutral
Particles, MIT Report PFC/JA-80-13 (1980). 13. S. Talmadge and R. J. Taylor, Bull. Am. Plvye. Soc. 2S_,
(1980). 14. D. J. Strickler, Personal CoMunication, FEDC-M-81-PS-060
(6/15/81). 15. R. W. Conn, Personal Communication, UCLA. 16. J. N. Brooks, Personal Communication, ANL (4/6/81). 17. W. M. Stacey, Jr., et al., USA INTOR/Bl-l, Vol. 1 (June 1981).
t

5-259
18. J. Roth, J. Bohdansky, and W. Ottenberger, Data on Low Energy
Light Ion Sputtering, Max-Planck Institut for Plasma-Physik, Garching Bel Miinchen (September 1979).
19. B. M. Scherzer, R. Behrisch, and J. Roth, "Proceedings of the International Symposium on Plasma Wall Interactions," Julich, p. 353 (1976).
20. C. F. Barnett et al., Atomic Data for Controlled Fusion Researcht
Oak Ridge National Laboratory, ORNL-5207 (1977). 21. D. L. Smith, "Analytical Expressions: Physical Sputtering,"
Proceedings of Workshop on Sputtering Caused by Plasma Surface Interactions, CONF-790775 (July 1979).
22. K. L. Bell et al., Recommended Cross Sections and Ratee for
Electron Ionization of Light Atoms and lone, Atomic and Molecular Data for Fusion, Part I (May 22, 1981).
23. M. Ulrickson, Materials Studies Related to TFTR Limitere and Wall
Armort Journal of Nuclear Materials, Vol. 85-86, p. 231 (1979). 24. R. P. Tolokan and J. C. Nablo, High Temperature Ceramic-Metal
Attachment Using a Strain Absorbing Fiber Metal Pad, Technetics Division, Brunswick Corporation.
25. L. Sevier and G. O'Connor, Conceptual Design Study for the TFTR
Phase II Bumper Limiter, Informal Report, Princeton Plasma Physics Laboratory.
26. B. A. Engholm, Preliminary Radiation Criteria and Nuclear Analysis
for ETF, General Atomic Report GA-A16072 (September 1980). 27. R. E. Nygren, Personal Communication, FEDC-M-81-SE-026 (2/6/81). 28. J. Schultz, Personal Communication, MIT (1/2/80). 29. STARFIRE — A Comtercial Tokamak Fusion Pouer Plant Study,
ANL/FPP-80-1, Vol. 1, Table 2-15 (September 1980). 30. If. W. Engle, Jr., A User's Manual for ANISN, K-1693, Oak Ridge
Gaseous Diffusion Plant (1967). 31. Vitartin-C, 171 Neutron, 36 Gama-Ray Group Cross Section in AMPX
and CCra Interface Formats for Fusion and IMPBR Neutronice, DLC-41, RSIC Data Library Collection, Oak Ridge National Laboratory (1977).
32. R. D. O'Dell et al., User's Manual for ONEDANT, LANL report draft (October 1980).

5-260
33. H. A. Sandimeier et al., Coupled Neutron-Gamma Multigroup Cross
Sections for 29 Materials...s LA-5137 (February 1974). 34. S. S. Clark and B. A. Engholm, A Highly Flexible, General-Purpose
Garrma-ShieIding Program, General Atomic Report GA-9908 (December 10, 1969).
35. M„ A. Abdou, Nuclear Design of the Blanket/Shield System for a
Tokamak Experimental Power Reactor, Nucl. Tech 2!9 (April 7, 1976). 36. T. J. Wood, Shield Design Alternatives for the Noncircular
Experimental Power Reactor, General Atomic Report GA-A13670 (September 30, 1975).
37. R. L. Reid et al.. Oak Ridge TNS Program: System Description
Manual, ORNL/TM-6721 (May 1979). 38. D. Gilai et al., "Optimal Iron-Water Shields for Fusion Reactors,"
Proc. 5th Int. Conf. on Reactor Shielding, Knoxville, Tennessee (April 1977).
39. B. A. Engholm, "Preliminary Radiation Criteria and Nuclear Analysis for ETF," Proc. 4th ANS Topical, King of Prussia, Pennsylvania (October 1980).
40. P. H. Sager, Jr., et al., "First Wall-Shield Design Considerations for ETF," ibid.
41. STARFIRE — A Commercial Tokamak Fusion Power Plant Study, ANL/FPP-80-1, Vol. 1, pp. 10-153 (September 1980).
42. W. M. Stacey, Jr., et al., USA INTOR/81-lJ Vol. 1, Table VII-24 (June 1981).
43. T. A. Gabriel et al., Radiation-Damage Calculations: Primary
Knock-on Atom Spectra, Displacement Rates, and Gas Production
Rates, Nucl. Sci. Eng. 6^, 21-32 (1976). 44. J. Jung and M. Abdou, "Importance of Shield Design in Minimizing
Radioactive Material Inventory in Tokamaks," Proc. 4th ANS Topical, King of Prussia, Pennsylvania (October 1980).
45. T. A. Gabriel et al., Shielding Design Calculations for ORMAK-F/BX,
Oak Ridge National Laboratory, ORNL/TM-4619 (August 1974). 46. L. P. Ku, Nuclear Radiation Analysis for TFTR, Princeton Plasma
Physics Laboratory Report PPPL-1711 (September 1980).

5-261
47. R. N. Ng, Personal Communication (2/4/81). 48. W. E. Selph and H. C. Claiborne, Methods foCalculating E f f e c t s
of Duct8s Access Way8, and Holes in Radiation Shields, Oak Ridge National Laboratory, ORNL-RSIC-20, p. 6 (January 1968).
49. J. Jung and M. A. Abdou, A Ttio-Dimensional Neutronics Model for Major Penetrations in Tokamaks, Trans. ANS 30, 506 (June 1977).
50. J. Jung and M. A. Abdou, Radiation Shielding of Mag or Penetrations in Tokamak Reactors, Nucl. Techno 1. 41_, 71 (November 1978).
51. W. T. Urban, T. J. Seed, and D. J. Dudziak, Nucleonic Analysis of
the ETF Neutral-Beam-Injector Duct and Vacuum-Pumping-Duot Shields, LA-8830-MS (May 1981). Also, papers at 4th Topical Meeting on Tech. of Controlled Nucl. Fus., King of Prussia, Pennsylvania (October 1980), and Trans. ANS 38, 554 (June 1981).
52. R. A. Lillie, R. T. Santoro, R. G. Alsmiller, Jr., and J. M. Barnes, Neutron and Gamma Ray Streaming Calculations for the ETF Neutral Beam Injectors, Oak Ridge National Laboratory, ORNL/TM-7705 (February 1981), and Iso-Response Contours in the ETF Neutral
Beam Injectors, 0RNL/TM-7783 (May 1981), and Trans. ANS 38 (June 1981).
53. W. T. Urban et al., Nucleonic Analysis of the ETF Neutron Beam Injector Duct and Vacuum Pumping Duct Shields, LA-8830-MS (May 1981).
54. J. M. Barnes et al., Iso-response Contours in the ETF Neutron Beam Injectors, Oak Ridge National Laboratory, ORNL/TW-7783 (May 1981).
55. MCNP — A General Monte Carlo Code for Neutron and Photon Transport, Version 2B, LA-7396-M (April 1981).
56. R. T. Santoro et al., Shielding Calculations for the TFTR Neutral Beam Injectors, Oak Ridge National Laboratory, ORNL/TM-6949 (July 1979).
57. R. A. Lillie et al., Estimated Nuclear Effects in the Neutral Beam Injectors of a Large Fusion Reactor, Oak Ridge National Laboratory, ORNL/TM-7526.
5-262
58. M. A. Abdou, "Overview of INTOR Nuclear Systems," Review Meeting, Atlanta, Georgia (MarcL 16, 1981).
59. B. A. Engholm, Personal Communication, General Atomic (10/2/80). 60. STARF'IRE - A Comeroial Tokamak Fusion Power Plant Study, ANL/FPP-
80-1, Vol. 2, Table 12-15 (September 1980).
6. PLASMA HEATING SYSTEM
B. A. Engholra " G. E. Gorker* J. R. Haines*
D. H. Metzler*
D. Q. Hwang® J. G. Murray++ W. D. Nelson*
S. W. Schwenterly1
L. D. Stewart* W. L. Stirling**
The plasma heating system consists of ttye plasma initiation, start-up and bulk heating subsystems. The initiation phase includes the ionization or breakdown of the gas and heating beyond the point where radiation losses dominate the energy balance. Current buildup charac-terizes the startup phase, in which ohmic heating is highly effective. In the final phase, bulk heating provides the energy to reach and main-tain the burn stage.
To overcome the need for a high-voltage plasma initiation and to I reduce the volt-seconds required from the PF system, FED uses an rf system to provide initial heating. One megawatt of electron-cyclotron resonant heatiig (ECRH) is applied when the gas is puffed into the torus. The electron-cyclotron wave is launched from the high-field side of the torus using the extraordinary mode of propagation. Ionization occurs in a relatively small vertical band around the major radius, whose radial position is determined by the frequency of the rf system and the magnitude of the toroidal field. A few hundred milliseconds after the ECRH is applied, the temperature at this vertical band of plasma exceeds the temperature at which radiation loss dominates. Plasma current is started after the electron temperature reaches approxi-mately 100 eV.
To start the plasma current, the PF coils are pulsed, thereby inducing a toroidal electric field with an associated loop voltage. •Fusion Engineering Design Center/General Electric Company. ^General Atomic Company. ^Fusion Engineering Design Center/McDonnell Douglas Corporation. 'Princeton Plasma Physics Laboratory.
^Fusion Engineering Design Center/Princeton Plasma Physics Laboratory. **0ak Ridge National Laboratory. 'Exxon Nuclear Corporation.
6 - 1
5-2
This reshapes the plasma from a vertical band to a circular plasma. The radial plasma position control is t"i?n actuated to position the plasma toward the outside of the torus, maintaining an initial plasma minor radius of approximately 40 cm.
After the plasma is started, the loop voltage decreases to about 10 V, which is sufficient to raise the plasma current at the desired rate for startup. The ECRH remains energized during this period as long as it effectively assists the startup.
Also, to assist the OH system during the startup or ohmic heating phase, 5 MW of ion-cyclotron resonant heating (ICRH) is applied. Six seconds after the plasma current is started, the 50 MW ICRH (bulk heating) system is used to raise the temperature of the plasma to the b u m stage (approximately 10 keV).
The FED baseline bulk heating design is based on ICRH with neutral beam injection (NBI) as an alternate. The selection of ICRH has been motivated by the experimental successes of PLT and on the technological advantages of ICRH over NBI. The experiments have demonstrated ICRH heating efficiencies equal to that of NBI. All the components for ICRH are presently available with the exception of the radiation hardened launcher, while a radiation hardened long-pulse NBI subsystem at 150 kV requires development. Relative to NBI, ICRH is less expensive (shielding and maintenance equipment are less) and more reliable (equipment is in a benign environment), and easier to maintain (only the launcher and trans-mission line need be in the reactor building).. The proposed FED ICRH-configuration is conducive to the complete testing of current drive.
The rf design addresses the need to adapt to changes in cyclotron resonance frequency. To operate the ECRH system at toroidal fields different from the nominal FED design point, the radial position at which plasma initiation occurs would be varied. To provide for a wide range of variation in the operating toroidal field, the ECRH frequency must be changed. At least two different sets of gyrotrons would be necessary in FED to operate at toroidal fields in the range of 5-10 T. A frequency change in ICRH is required when the toroidal field is varied. This can be accomplished by switching the components and cir-cuitry. It is believed that two frequencies will be sufficient for the
5-3
ICRH system, and the selection can be made during a single pulse by switches that vary resonator parameters.
In the design description that follows the plasma initiation and startup subsystem is treated first, followed by a discussion of the two bulk heating subsystems (rf-baseline and NBI-alternate). For each sub-system, the exposition starts with a brief review of the requirements driving the design, followed by the delineation of the design, and its performance, options considered, and future effort.
6.1 PLASMA INITIATION AND STARTUP
6.1.1 Introduction
The plasma initiation and startup system is compatible with either the baseline rf bulk heating approach or the alternate approach of neu-tral beam injection. The ECRH frequency required in FED is higher than required in current experiments, and component technology development is needed. The basis for the concept presented is that present-day components operating at 28 and 60 GHz can be scaled to the 80-100 GHz operating band. See Volume V of the FY 81 documentation for further details.1
6.1.2 Requirements
Table 6-1 summarizes the heating requirements for the ionization and initial startup. Electron cyclotron resonance heating (ECRH) is specified to perform this function. In a broad sense the functional requirements are to ionize the prefill gas and then heat the plasma to about 100 eV. The pulse time to heat to 100 eV is expected to be 0.2 s. This plasma ionization and heating phase is followed by the current initiation phase. The current rise time to a current of 'VS.5 MA is about 6 s.
The startup power is specified at the plasma interface. Any losses due to transmission line components oust be made up by the rf generator. With the plasma startup at a major radius of 5.8 the associated toroidal field is 3 T for 8-T operation and the ECRH frequency is GHz. The
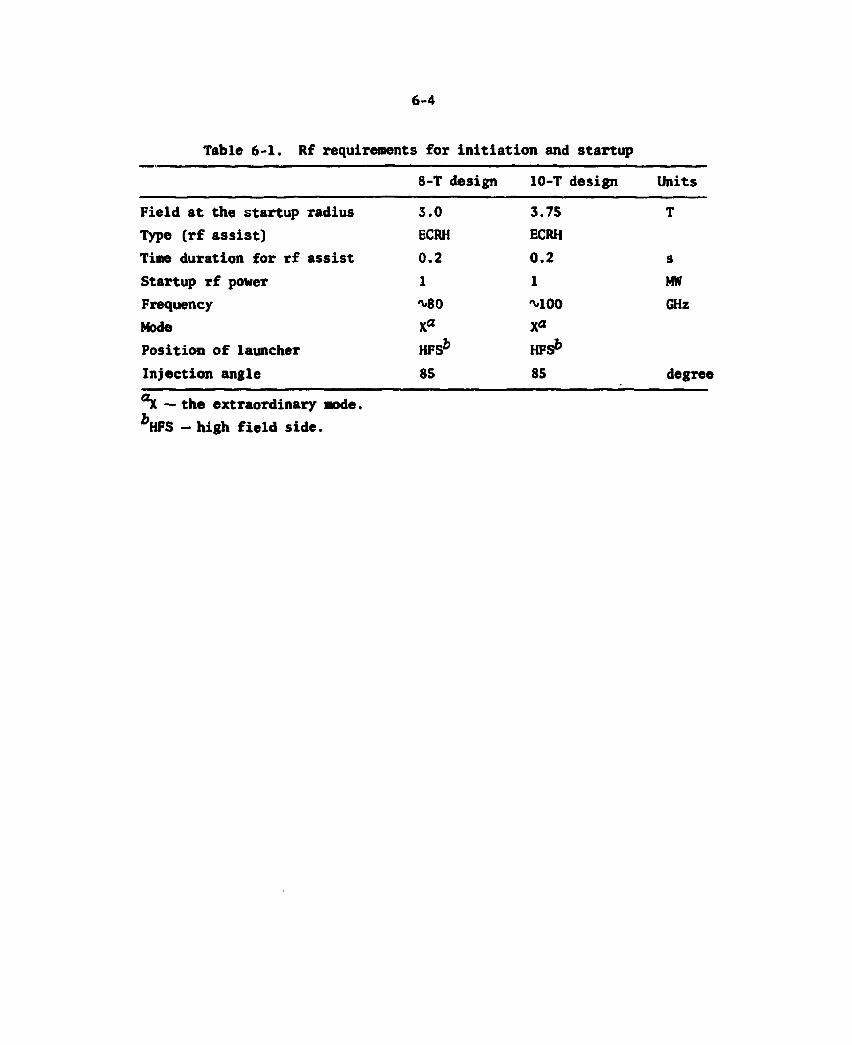
Table 6-1. Rf requirements for initiation and startup
Field at the startup radius Type (rf assist) Time duration for rf assist Startup rf power Frequency Node Position of launcher Injection angle
"ik — the extraordinary mode. *HFS - high field side.
8-T design 10-T design Units
3.0 3.75 T ECRH ECRH 0.2 0.2 s 1 1 MW ^80 M O O GHz Xa Xa
HFSfc HFS6
85 85 degree
5-5
mode to be launched is the extraordinary mode (the electric field is perpendicular to the toroidal field) launched from the high-field side (HFS). It is expected that there will be some rotation of the electric field as the wave passes through the outer portions of the plasma to the startup core which must be compensated by modifying the launching angle.
In addition to this rotation, the beam bends, changing the angle of propagation. The requirement is 85° at the plasma core (core radius is M O cm). Again compensation must be made in the launching angle to meet the requirement.
In addition to the above requirements, there are requirements of availability, hardness, minimization of space consumed at the interface with the vacuum vessel and low cost. Design concepts proposed should be compatible with technology development expectations. No specific avail-ability requirement has been established but it is expected that high availability (0.8 to 0.9) will be necessary. This requires high reli-ability components and short mean time to repair. The neutron wall
13 2 loading on the launcher assembly is 5 x 10 n/cm s.
6.1.3 Baseline Design Description
Configuration overview
From the design standpoint, the plasma initiation and startup system configuration is straightforward. Figure 6-1 shows the system configuration. A high power gyrotron oscillator supplies a mode trans-ducing launcher through an overmoded circular waveguide. Based on extrapolations of present-day gyrotrons, it will take about 8 of these equipment strings (power oscillator transmission line and launcher) to produce 1 MW at the plasma. The configuration planned has two additional equipment strings to provide for degradation of equipment and redundancy.
The configuration complexity is expanded by the need for multiple frequency operation. The required frequency varies with operating toroidal field and plasma startup position. The choice of frequency is limited by the gyrotron technology. Figure 6-2 shows tradeoffs in ECRH startup parameters for variations in operating toroidal field and startup
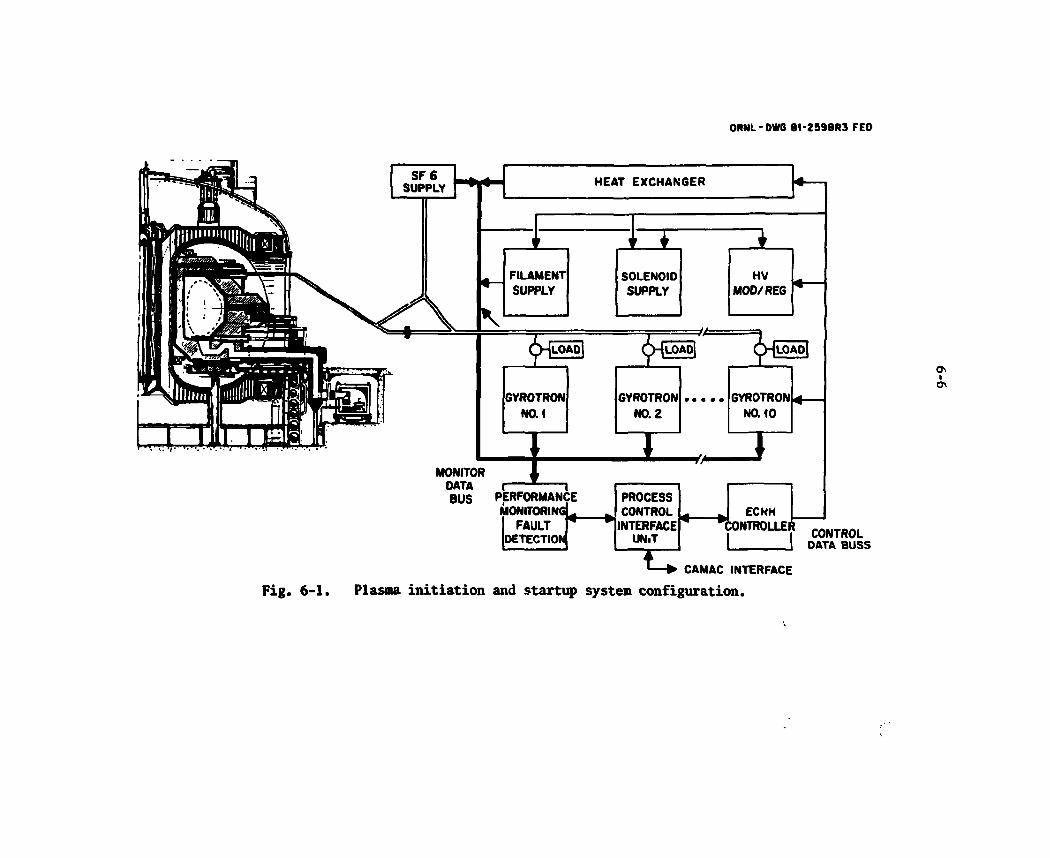
ORNL-DWG 81-2598R3 FED
SF 6 SUPPLY
SF 6 SUPPLY HEAT EXCHANGER
\
E 1
FILAMENT SOLENOID HV SUPPLY SUPPLY MOD/REG
(|)-iLOAO| (j>-flJOAo]
I
GYROTRON GYROTRON NO. 2 NO. 10
r MONITOR
DATA I 1 BUS PERFORMANCE
MONITORING1
I FAULT DETECTIOI
PROCESS CONTROL
INTERFACE UNIT
ECNH CONTROLLER CONTROL
DATA BUSS
CAMAC INTERFACE
Plasma initiation and startup system configuration.
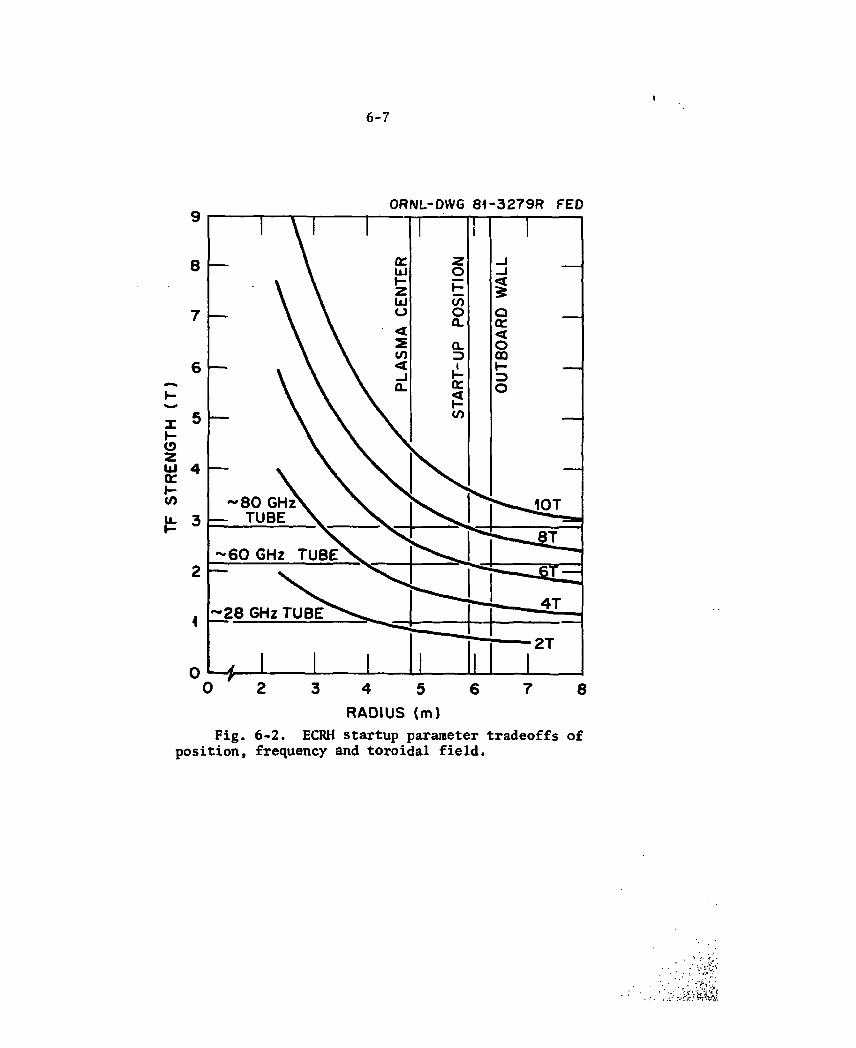
6-7
ORNL-DWQ 81-3342 FED
4 5 6 RADIUS (m)
Fig. 6-2. ECRH startup parameter tradeoffs of position, frequency and toroidal field.
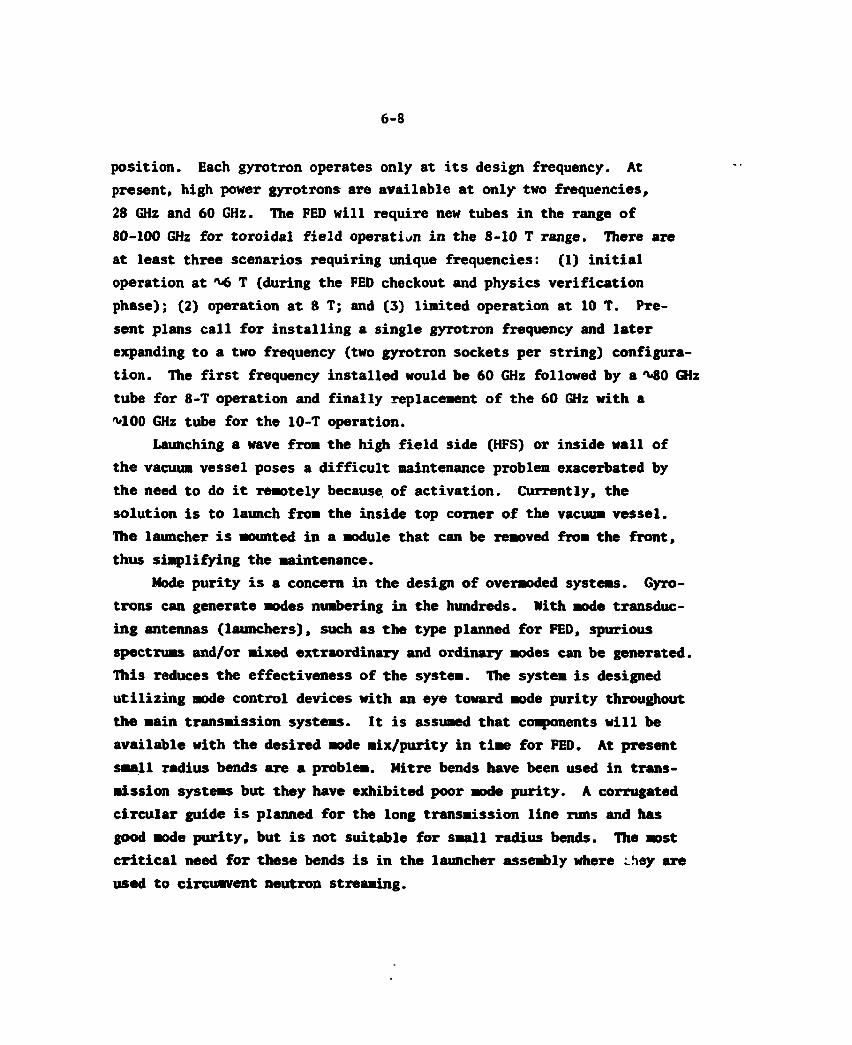
5-8
position. Each gyrotron operates only at its design frequency. At present, high power gyrotrons are available at only two frequencies, 28 GHz and 60 GHz. The FED will require new tubes in the range of 80-100 GHz for toroidal field operation in the 8-10 T range. There are at least three scenarios requiring unique frequencies: (1) initial operation at T (during the FED checkout and physics verification phase); (2) operation at 8 T; and (3) limited operation at 10 T. Pre-sent plans call for installing a single gyrotron frequency and later expanding to a two frequency (two gyrotron sockets per string) configura-tion. The first frequency installed would be 60 GHz followed by a 80 GHz tube for 8-T operation and finally replacement of the 60 GHz with a ^100 GHz tube for the 10-T operation.
Launching a wave from the high field side (HFS) or inside wall of the vacuum vessel poses a difficult maintenance problem exacerbated by the need to do it remotely because, of activation. Currently, the solution is to launch from the inside top corner of the vacuum vessel. The launcher is mounted in a module that can be removed from the front, thus simplifying the maintenance.
Mode purity is a concern in the design of overmoded systems. Gyro-trons can generate modes numbering in the hundreds. Nith mode transduc-ing antennas (launchers), such as the type planned for FED, spurious spectrins and/or mixed extraordinary and ordinary modes can be generated. This reduces the effectiveness of the system. The system is designed utilizing mode control devices with an eye toward mode purity throughout the main transmission systems. It is assumed that components will be available with the desired mode mix/purity in time for FED. At present small radius bends are a problem. Mitre bends have been used in trans-mission systems but they have exhibited poor mode purity. A corrugated circular guide is planned for the long transmission line runs and has gpod mode purity, but is not suitable for small radius bends. The most critical need for these bends is in the launcher assembly where :hey are used to circumvent neutron streaming.

5-9
Tri t ium containment requires that the transmission system have a few windows to prevent escape of the gas from the reactor building. These windows also assure the vacuum in tegr i ty of the torus. The f i r s t of these windows is placed beyond the f i r s t small radius bend where the neutron f lux i s expected to be >10:1 down from that incident on the f i r s t wal l . The window material is assumed to be beryll ium oxide (BeO)
The plasma i n i t i a t i o n and startup system layout minimizes the equipment within the reactor building. The ECRH r f generators are positioned i n a hands-on area just outside the reactor bui lding. Each power osc i l l a tor has a gun anode modulator. High voltage power supplies are in remote areas away from the reactor building.
Configuration description
Figure 6 -3 shows the ECRH launcher concept. For purposes of im-proving remote maintenance, the launcher assembly i s mounted in modules which are a t the lowest replaceable leve l . Replacaent of elements such as windows and ref lectors would be done in the hot c e l l .
The stepped ref lector at the end of the c i rcular waveguide i s a mode transducing antenna operating in the T E ^ mode.2 By adjusting the re f lec tor step to one-half wavelength, the TE*| mode radiat ion pattern is transformed from a conical shape to a l inear ly polarized pencil beam. This enables the launcher to meet the requirements of launching an extraordinary (X) mode at a prescribed angle. The e l e c t r i c f i e l d i s in the plane of the step which i s perpendicular to the toroidal f i e l d . This e l e c t r i c f i e l d (X-mode) rotates as i t passes through the edges of the plasma to the hot core. Hence the f i e l d i s launched at an angle removed from the X-mode value by the polar izat ion rotat ion (see Fig. 6 - 4 ) . The angle o f propagation is 85* with respect to the plasma. Each launcher i s directed toward the plasma in the neighboring sector.
Returning to Fig. 6-3,, the window i s seen to be positioned just back from the re f lec tor . I n th is position the neutron f lux is reduced by an order o f magnitude and the impurity deposition i s also reduced. This window has not been developed for the 80-100 GHz band. Transmissi-v i t y , hardness, thermal stress, and mode pur i ty are some of the issues.

5-10
ECRH LAUNCHER INTERFACE STRESSES NUCLEAR HARDNESS A EASE OF MAINTENANCE
OflNL-OWG 81-3148
ECRH LAUNCHER
STEPPED REFLECTOR
Fig. 6-3. ECRH launcher interface stresses nuclear hardness and ease of maintenance.
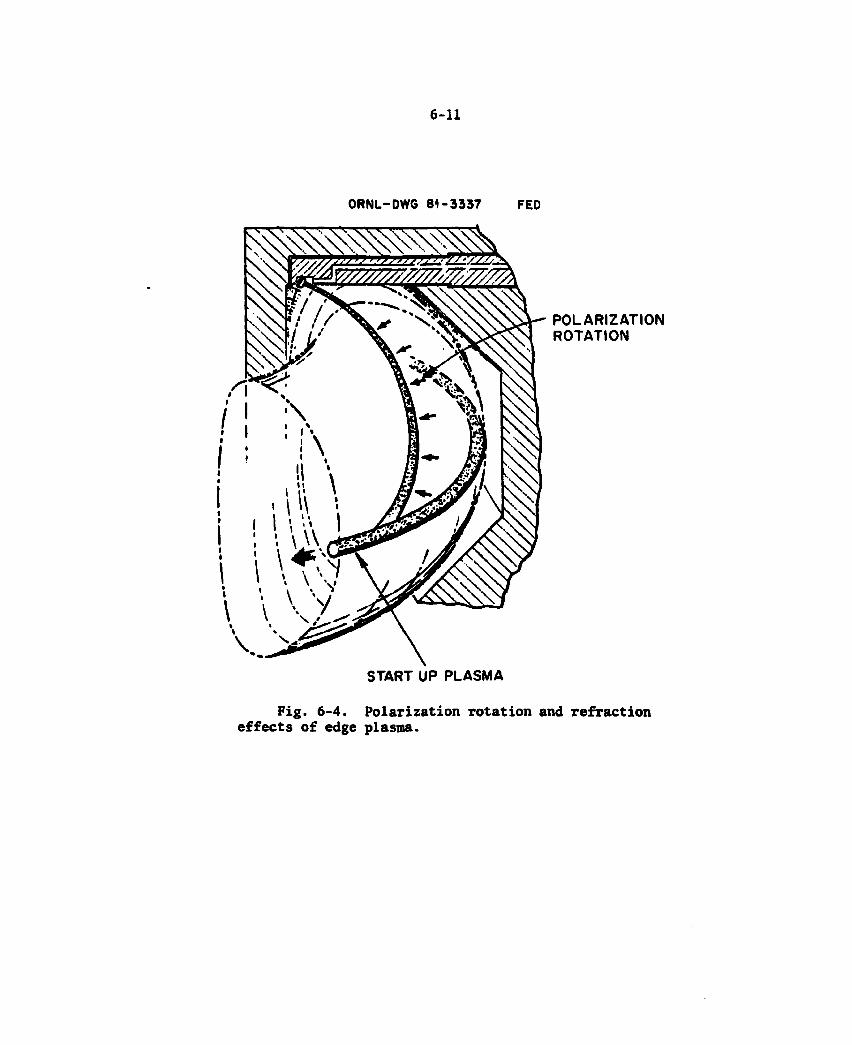
6-11
ORNL-DWQ 8 1 - 3 3 4 2 FED
POLARIZATION ROTATION
START UP PLASMA
Fig. 6-4. Polarization rotation and refraction effects of edge plasma.

5-12
It will probably be constructed of BeO (AljOj and a r e o t^ e r candidates) and must be cooled. The mitre bends developed in the past have served a dual function, that is directional coupler as well as a small radius bend technique. The main disadvantage is that mode control has been a problem. Some configurations have combatted this problem by inserting mode filters following such bends. For purposes of conceptual design it is assumed that the mode control problem associated with the small radius bends will be addressed during development.
The short sections of transmission line are planned to be 2.S-in. smooth circular guide operating with the TE°j mode. Beyond the shield of the launcher assembly, this waveguide exits through a weld flange.
Figure 6-5 shows the detail of the. transmission system. There are 3 separate sulfur hexafluoride (SF6) systems to pressurize; the launcher, the reactor building transmission line, and the rf generator transmission line. This provides triple protection against tritium leaks through the transmission line into the rf generator vault area. The reactor building wall is the facility tritium barrier. In the event of an accident where tritium is in the reactor building and the trans-mission line is severed, there is no leakage to the vault area.
After the second window (going toward the generator) there is a directional coupler which samples the forward and reverse power of the launcher. A mode converter effects compatibility between the launcher mode TEjj and that of the transmission line HE^. A length (MO m) of corrugated guide running down to a floor penetration completes the system in the reactor hall. This system (launcher assembly and trans-mission system) is duplicated 10 times (one per segment).
The injection port for the second SF6 system and the majority of the transmission line is in the basement of the reactor building. A third cooled window is positioned in (or at) the reactor building wall. Inside the vault, a switch selects which gyrotron output supplies the line and which is terminated in the water load.
Each gyrotron output has the same component line between oscillator and switch. From the tube output there i» an arc detector, directional coupler, mode filter, mode converter, SF6 injection port and a length
•) of corrugated transmission line. These monitoring devices supply
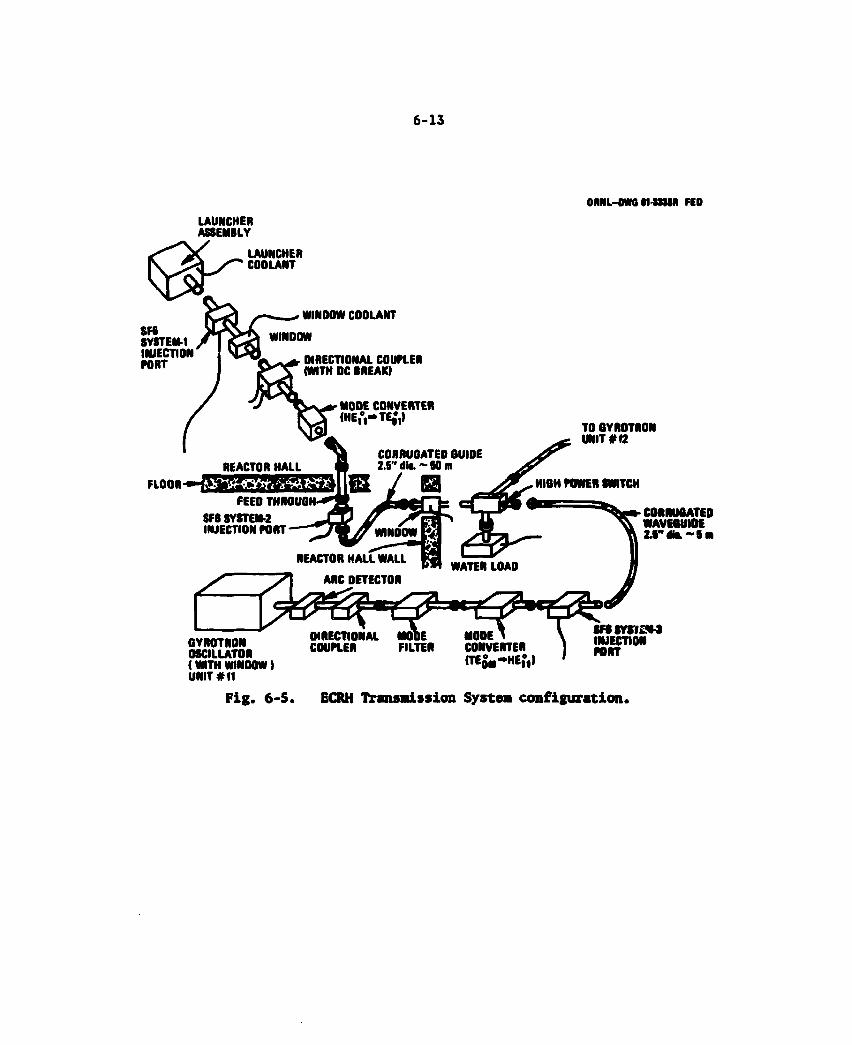
5-13
OML-DMfO ll-DIM FED LAUNCHER ASSEMBLY
LAUNCHER COOLANT
SF6 SYSTEM-1 INJECTION PORT
WINDOW COOLANT
WINDOW
DIRECTIONAL COUPLER (WITH DC BREAK)
MODE CONVERTER (HEfi-TEoV
REACTOR HALL
FEED THROUGH' SFS SYSTEM-2 INJECTION PORT
CORRUGATED GUIDE 2.S" dia. ~ SO m
TO GYROTRON UNIT # (2
HIGH POWER SWITCH
REACTOR HALL WALL
ARC DETECTOR
CORRUGATED WAVEGUIOE Z T M - l a
WATER LOAD
GYROTRON OSCILLATOR <WITH WINDOW) UNIT # ft
CONVERTER (TE5h~HE,V
M I W E M INJECTION PORT
Fig. 6 - 5 . ECRH Transmission System configurat ion.
5-14
information to the I&C system on the occurrence of arcs and on the forward and reverse power levels at the tube. A mode filter is used to reject spurious modes from the gyrotron. The predominant mode (probably TEQ3 or TEQ4) is then converted to the H E ^ for propagation in the corrugated guide. This portion of the transmission system has its own SF6 supply.
The gyrotron oscillator is shown schematically in Fig. 6-6. Its supply needs are listed in Table 6-2. Transformer oil (dielectric fluid) surrounds the gun and socket. This provides cooling for the gun and aids in the voltage standoff. High purity water cooling is used for the body and collector areas. A set of 3 superconducting magnets is used. Each tube has its own gun anode modulator (this provides indivi-dual oscillator keying). There is a crowbar and anode modulator assembly for each pair of gyr>trons (this allows one crowbar modulator to be down without shutting down the system). The transformer rectifier units are remoted to outside the building. The lower half of the tube is surrounded by a soft x-ray shield. There is some chance that the stray magnetic fields from the tokamak or its supply lines exceed the maximum level of 10 G in the vicinity of the tube. If this is the case a magnetic shield will have to be installed. (Note: At 20 m from the machine center line, the estimated stray fields are still a few hundred gauss.)
The regulated high voltage power supplies are the polyphase (12 pulse) with voltage control accomplished via thyristors in the primary. See Fig. 6-7. There are 2 such supplies planned. Each are capable of 70 A, which is sufficient to supply 8 tubes or enough power to sustain full operation. The regulation and ripple requirements on the supply await the tube development and the determination of frequency pushing factors. Voltage regulation will be done using the thyristors in the primary. This feedback loop does not have sufficient bandwidth to reduce ripple; however, this could be accomplished in the modulator without sacrificing significant efficiency loss (^5%). A ripple filter will also be employed.
Instrumentation and control processing is accomplished using microprocessor chips and a distributed architecture. Table 6-3 is a representative listing of the IgC data. The control architecture uses
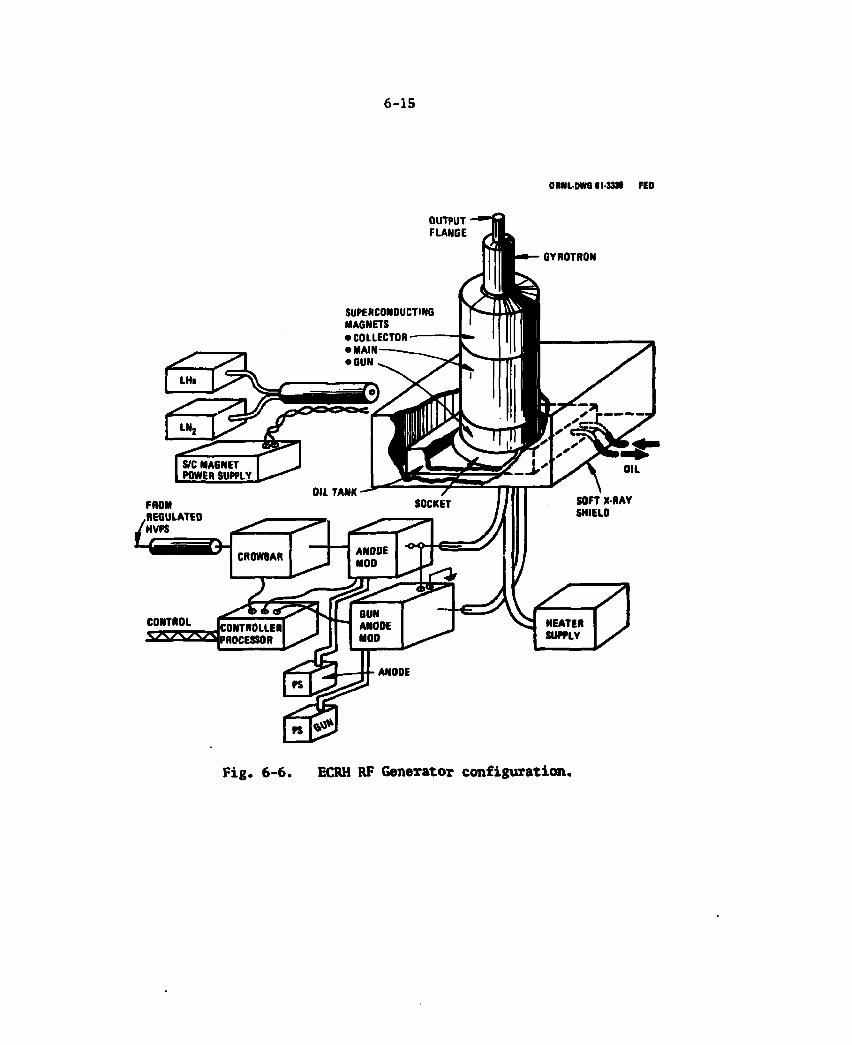
6-15
ORNL-DWQ 81-3342 FED
OUTPUT FLANGE
Fig. 6-6. ECRH RF Generator configuration.
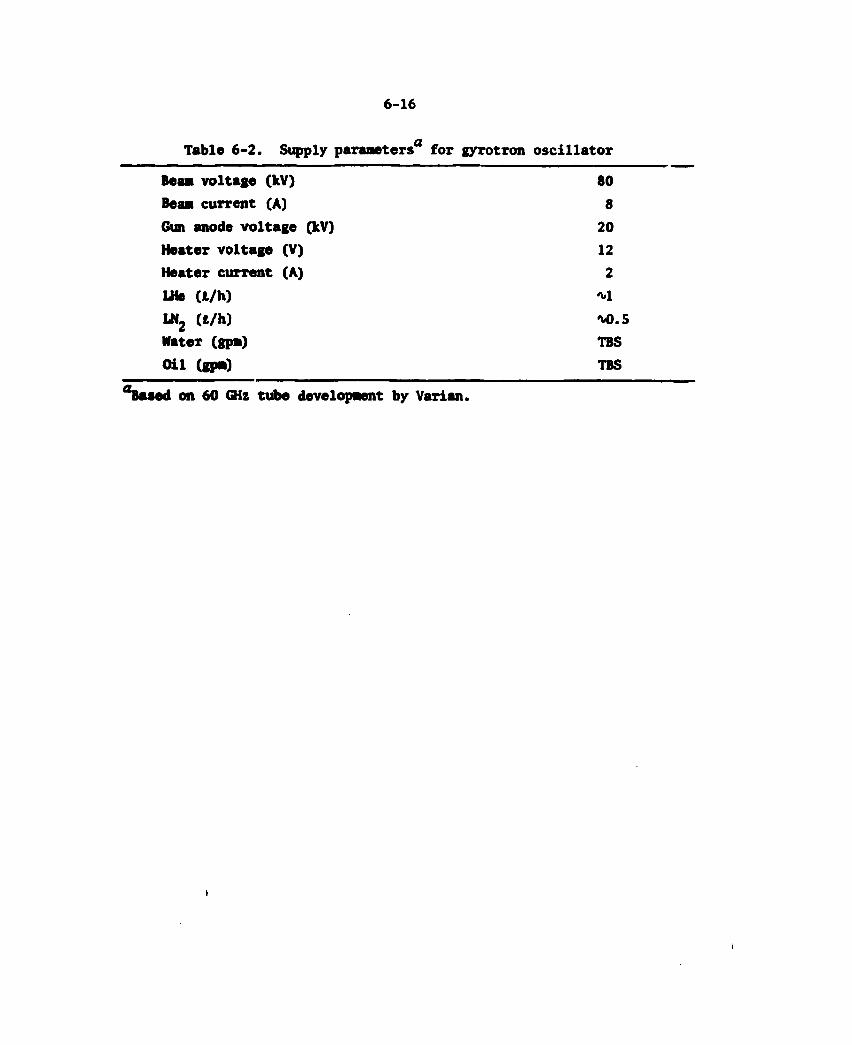
5-16
Table 6-2. Supply parameters'2 for gyrotron osci l lator
Beam voltage (kV) 80 Beam current (A) 8 Gun anode voltage (kV) 20 Heater voltage (V) 12 Heater current (A) 2 LHe ( t /h ) M.
LN2 ( t /h ) M>.5 Water (gpm) TBS Oi l (gpm) TBS
aBased on 60 GHz tube development by Varian.
t
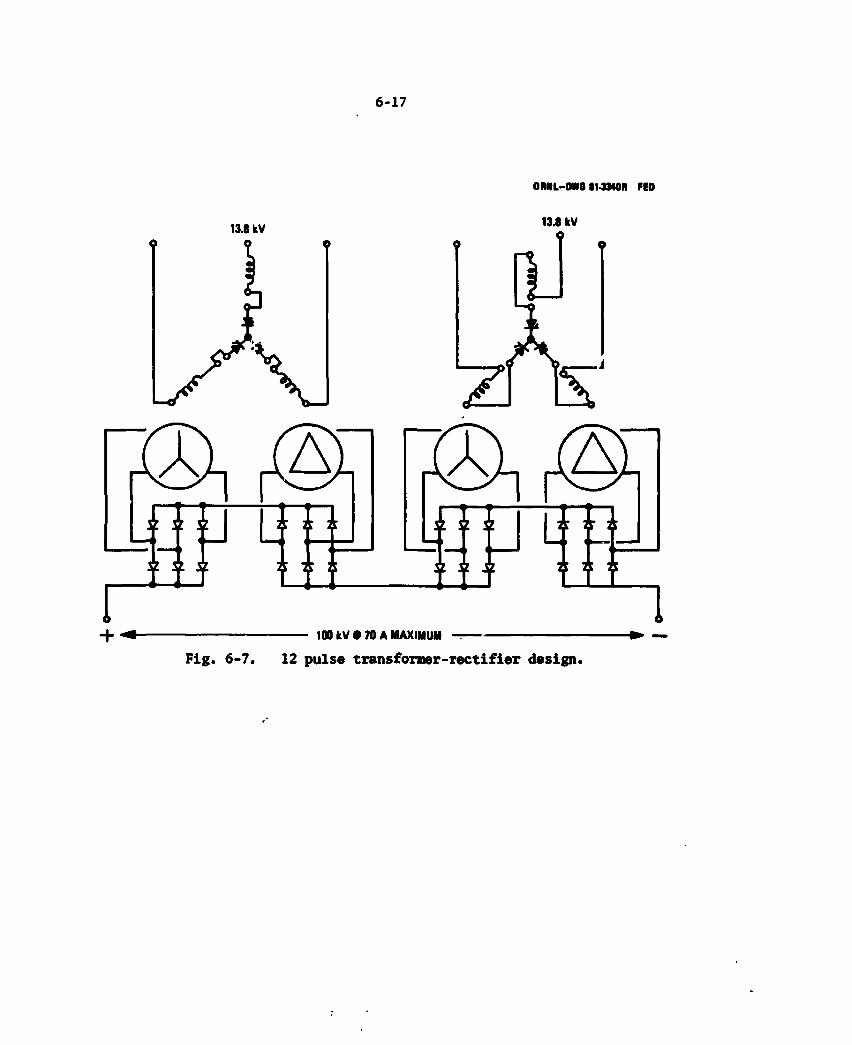
5-17
OMIL-OWGI1-3340R FED
13.8 kV
100 kV • 70 A MAXIMUM Fig. 6 -7 . 12 pulse t ransformer - rec t i f ie r design.
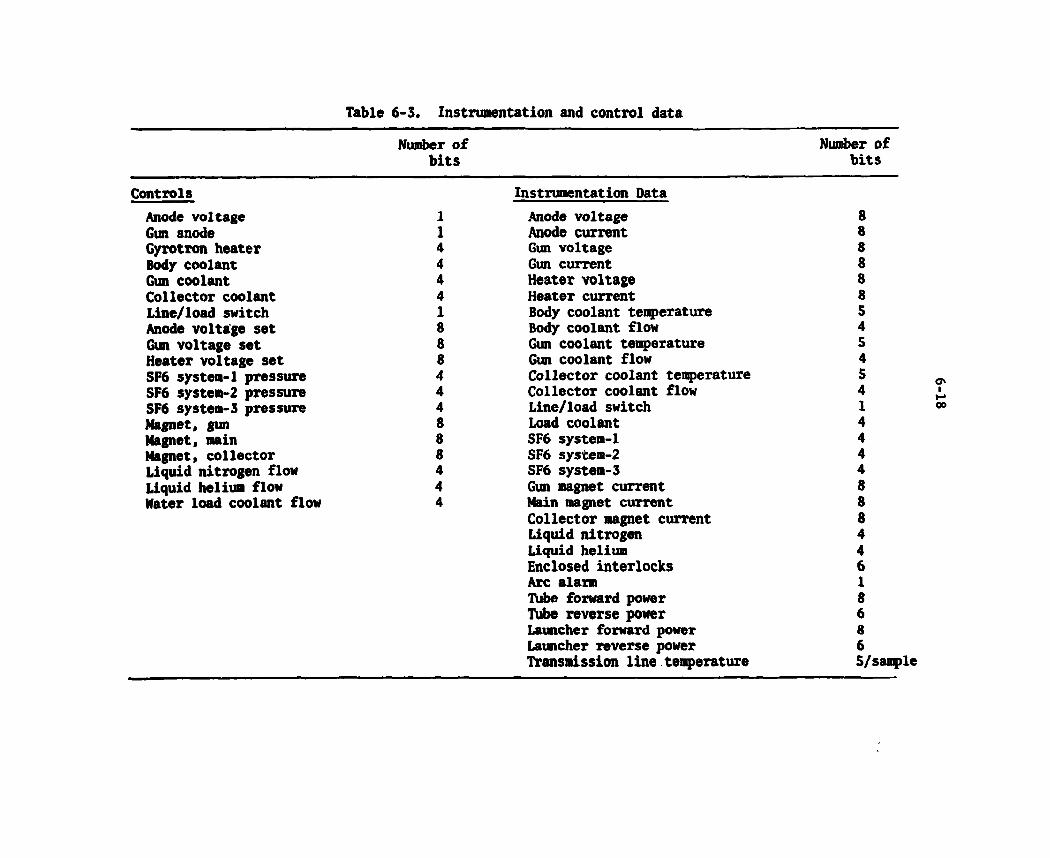
Table 6-3. Instrumentation and control data
Number of bits
Number of bits
Controls Instrumentation Data Anode voltage 1 Anode voltage 8 Gun anode 1 Anode current 8 Gyrotron heater 4 Gun voltage 8 Body coolant 4 Gun current 8 Gun coolant 4 Heater voltage 8 Collector coolant 4 Heater current 8 Line/load switch 1 Body coolant temperature S Anode voltage set 8 Body coolant flow 4 Gun voltage set 8 Gun coolant temperature 5 Heater voltage set 8 Gun coolant flow 4 SF6 system-1 pressure 4 Collector coolant tenperature S SF6 systera-2 pressure 4 Collector coolant flow 4 SF6 system-3 pressure 4 Line/load switch 1 Magnet, gun 8 Load coolant 4 Magnet, main 8 SF6 system-1 4 Magnet, collector 8 SF6 system-2 4 Liquid nitrogen flow 4 SF6 system-3 4 Liquid helium flow 4 Gun magnet current 8 Water load coolant flow 4 Main magnet current 8
Collector magnet current 8 Liquid nitrogen 4 Liquid helium 4 Enclosed interlocks 6 Arc alarm 1 Tube forward power 8 Tube reverse power 6 Launcher forward power 8 Launcher reverse power 6 Transmission line.tenperature 5/samp

5-19
a hierarchical structure. Macroconmands such as preionization power of 1.0 MW on at a specific clock count are received from the tokamak I§C center. The required microcommands are dependent on the status or state of the equipment (i.e., off, standby, operate, test etc.). For exaaiple, assuming the equipment is in the standby state, where coolants, filaments, magnetics, etc., are on, the sequence of: high power switch to "line", anode on at -T s followed by gun anode on at 0 s (the specified time) would be automatically programmed by microprocessors.
Transmission to and from high voltage deck(s) is done via fiber optics (light pipe) as a safety precaution and to avoid ground loop noise in the sensitive control and data channels. Analog signals are converted to digital. Safety loops such as arc detector to crowbar/ modulator are hardwired.
6.1.4 Baseline Design Performance
Power levels and efficiencies
Figure 6-8 summarizes the power level at the input and output of each major block in the ECRH string. The prime power line power level is 4.3 MW with the rf outpuc power at 0.12 MW per tube or an overall maximum of 1.2 MW for the 10 tubes. This corresponds to an efficiency of 28%. Because many of the components (including the gyrotron) have not been developed, these values represent typical performance. The reference point taken is the expected gyrotron power output. Assuming the 200 kW figure, the output is 0.116 MW or M>.12 MW. A 220 kW output power and 40-50% efficiency has been achieved on the lower frequency (28 and 60 GHz) gyrotrons. The transmission line and launcher loss estimates are somewhat speculative, but represent current development status.
Loss budget
The transmission system defined above is summarized in Fig.6-9 and shows estimates of the losses in dB's for each component. These losses are assumed to be the aggregate of effects due to ohmic, mismatch, and
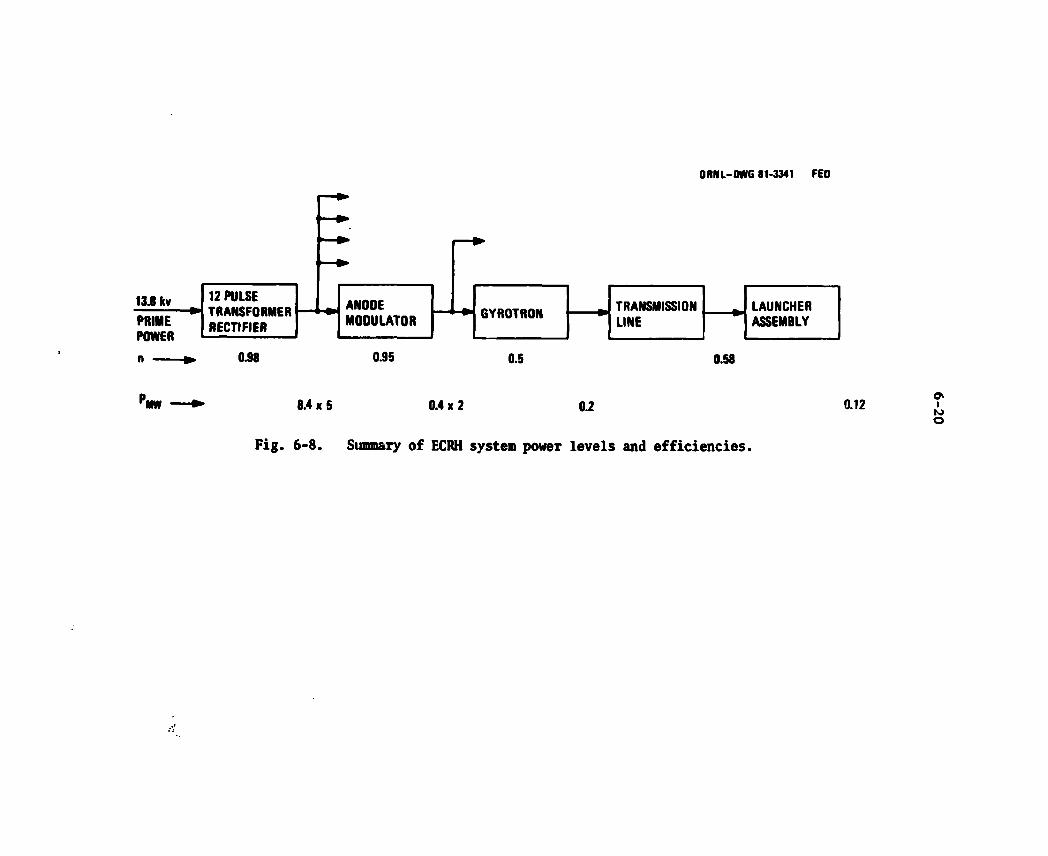
ORNL-OWG 81-3341 FED
n fr. 0.98 0.95 0.S 0.58
? m 8.4x 5 0.4x 2 0.2
Fig. 6-8. Summary of ECRH system power levels and efficiencies.
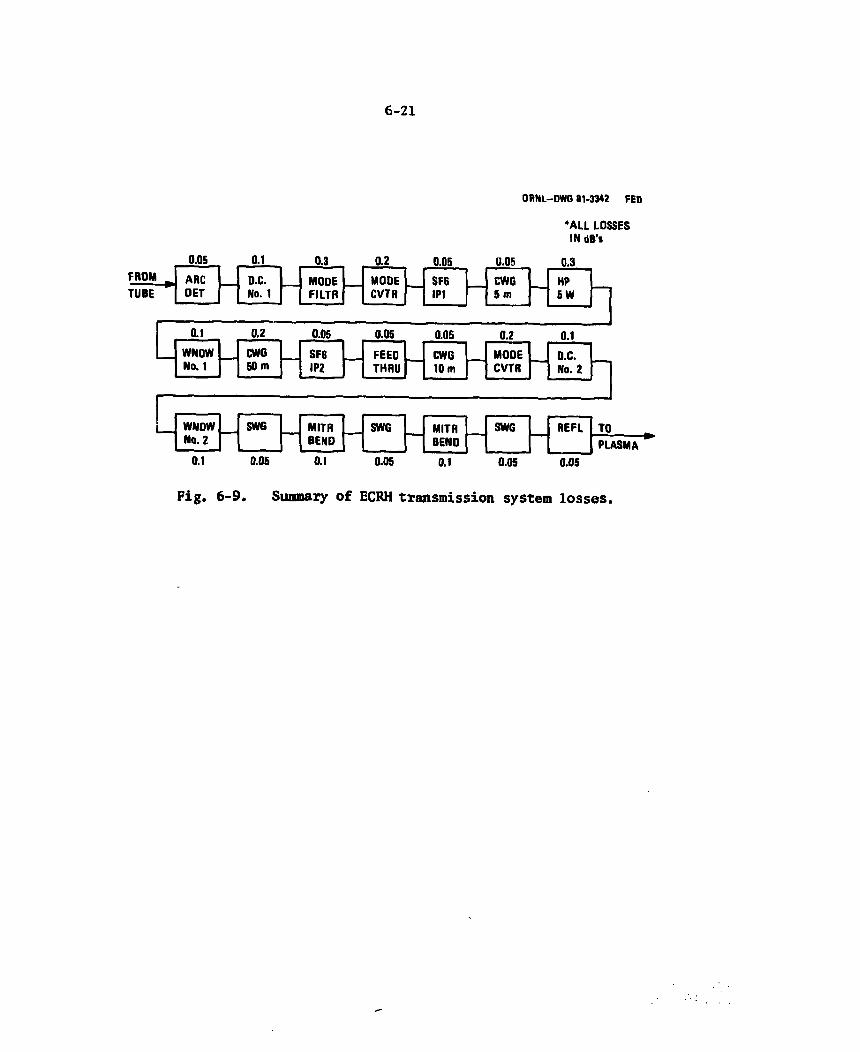
6-21
ORNL-DWQ 81-3342 FED
"ALL LOSSES IN dB's
0.1 0.05 0.1 0.05 0.1 0.05 0.05
Fig. 6-9. Summary of ECRH transmission system losses.
5-22
mode dispersion. These components have not yet been developed. Some similar components have been developed at 28 GHz, however, the mode mixes, impact of tolerance, etc., make performance extrapolation diffi-cult. Hopefully, the variation in the overall loss estimate will be small. The loss estimates for the launcher window do not allow for the effects of carbon deposition. The deposition rate is under study by others. (See Section 5.4.3.)
Launcher power density
The average power density is the power, 120 kW, divided by the area 2 2 of the launcher, 31.7 cm , or 3.78 kW/cra . This is a conservative figure.
Power supply performance
The regulation needs of the gyrotron are not known at this time. Based on 28 GHz experience, regulation would be in the 0.5% category.
Cooling
The gyrotron cooling has been identified by category (i.e., gun, body, collector) but not quantitatively since the tube has not been developed. Based on 28 GHz experience and the 60 GHz tube specification, the water coolant system would supply 200-300 gpm for cw or near cw operation. The pressure drop is expected to be about 120 to 160 psi. The gun coolant (oil) flow rate would be 0.3 gpm. These are per tube estimates.
The transmission systems dump about 80-100 kW over 21 components with the worst case heat load being 5-10 kW. For long pulse operation some components may require cooling, but this depends on the detailed design. The water load flow rate is 40-80 gpm with a pressure drop of 2-5 psi.
5-23
6.1.5 Options Considered
RF chosen over high voltage ohmic startup
The objective of rf assist is to lower the startup power losses, the volts per turn in the PF coils, and the volt-soconds required from the ohmic heating (OH) coil. The advantages of reduced volt-second requirements are: (1) a smaller OH coil, (2) lower voltage stress on the PF coils, and (3) the vacuum vessel impedance can be made smaller which eases the impact of plasma disruptions. The choice of rf vs OH system startup is also one of capital cost. A large OH coil can impact the size of the machine by requiring larger radial build. An rf startup is more complex than an OH startup; however, there are several material and design problems associated with a high impedance torus employing bellows or insulated breaks in the vacuum vessel of FED.
ECRH preferred for initiation
Ideally, ionization and startup assist would be done with the same equipment as that for the bulk heating function. This would simplify the system. Thus far, however, the ECRH technology has not developed to where it is economically wise to use it for bulk heating. ICRH and LHRH experiments have not been done to demonstrate their localized heating qualities. Some experiments with ICRH were run on PRETEXT but the results could not be scaled to the FED size machine and startup scenario. Startup assist experiments have been run on ISX-B, MTII, and JIPPT-II, demonstrating savings of volt-seconds. The modest ECRH power levels required for FED are within the technology development for the near ten.
Launcher design options
Several launcher design options were considered including: (1) v a r i a -tions in the antenna from changing the operating mode and its reflector; (2) transmitting ordinary mode from the outside and reflecting X mode from a polarized reflector on the inside; (3) a phased array or grill
5-24
launcher; and (4 ) conversion to a rectangular guide driving a horn. These options were considered but discarded in favor of the baseline. Each option is discussed briefly below.
Changing the operat ing node o f the present conf igura t ion i s the
aost a t t r a c t i v e opt ion o f those mentioned. For example, the T E j j
i s a p o s s i b i l i t y . This requires a more complex r e f l e c t o r design.
Lawrence Livermore Laboratory has s t a r t e d some development work on t h i s
and has b u i l t a r e f l e c t o r . I t i s t o be tes ted i n the near f u t u r e . The
basel ine approach has been used on ISX-B, D i l i , and elsewhere. One
disadvantage o f these stepped r e f l e c t o r approaches i s the launcher could
be designed t o operate a t the 8 and 10 T f i e l d l eve ls but would requi re
a change out f o r lower f i e l d s ( fo r example 4 or 5 T ) . The T E ^ mode
could be used w i t h a f l a t r e f l e c t o r , t h i s would have good bandwidth
( i . e . , no change out requi red) from the r e f l e c t o r s tandpoint , but generat-
ing the TE^j mode i s a problem and would have bandwidth l i m i t a t i o n s .
Transmi t t ing ordinary mode from the outside wa l l to a p o l a r i z i n g
r e f l e c t o r on the inboard w a l l that r ad ia tes ext raord inary mode back t o
the plasma was inves t iga ted by PPPL. The main concerns w i t h t h i s approach
are the v i a b i l i t y o f the r e f l e c t o r on the ins ide w a l l during a d is rupt ion
and the transparency o f the plasma t o the ordinary mode. I t i s possible
t o make the r e f l e c t o r out o f graphi te m a t e r i a l s i m i l a r t o the armor on
the back w a l l . This component would have t o be developed and tes ted f o r
r a d i a t i o n hardness. The transparency o f the plasma i s dependent on the
r e f r a c t i o n index . K i th the index o f r e f r a c t i o n less than u n i t y , the
beam disperses. Modeling o f very low densi ty and h igh densi ty regimes
has been done but not a t intermediate d e n s i t i e s . The i o n i z a t i o n and
i n i t i a t i o n i s requ i red t o operate up t o about 100 eV i n temperature and
d e n s i t i e s o f * 1 0 1 3 cm ' 3 . There i s e s s e n t i a l l y no experimental e v i -
dence t o conf i rm t h i s approach, and, t h e r e f o r e , i t was discarded.
A phased a r r a y o r g r i l l approach i s r e l a t i v e l y complex compared to
the bmseline launcher. Although i t would create the a b i l i t y t o s t e e r
the beam e l e c t r o n i c a l l y , thi.3 advantage i s not considered s u f f i c i e n t
j u s t i f i c a t i o n f o r the added complexity.

5-25
Finally, conversion to a rectangular guide was rejected because of its size. At the 80 to 100 GHz frequency band the power handling capability would be poor and multiple guides would be required.
Transmission line options
Three approaches were considered: (1) corrugated waveguide; (2) smooth waveguide; and (3) optical. The corrugated guide was chosen because of its low loss and mode purity. According to Clarricoats et al.,3 the loss in corrugated guide using the H E ^ mode is lowest. Experiments on large radius bends indicate the mode purity is good. Smooth waveguide using mitre bends has a tendency to create trapped •odes. The optical approach was investigated last year during the ETF preconceptual design effort. A sketch of this is shown in Fig. 6-10. Its disadvantages are complexity and size.
RF generator options
It would be preferable to have higher power per tube so that the number of penetrations could be reduced. There are two options: (1) higher power gyrotrons and (2) coherent high power amplifiers. The problem in both cases is the technology. A one-megawatt gyrotron develop-ment is scheduled for the late 1980's. This may be timely for an upgrade depending on the development schedule compatibility with the FED. The power density capability of the launcher may require that the 1 MM power level be divided to drive two launchers. The amplifer approach is preferred if the bandwidth of the tube were appreciable, say >10%. Then the configuration could utilize a variable frequency oscillator driving a broadband amplifier. The technology development program indicates this broadband tube would not be available in the FED time frame.
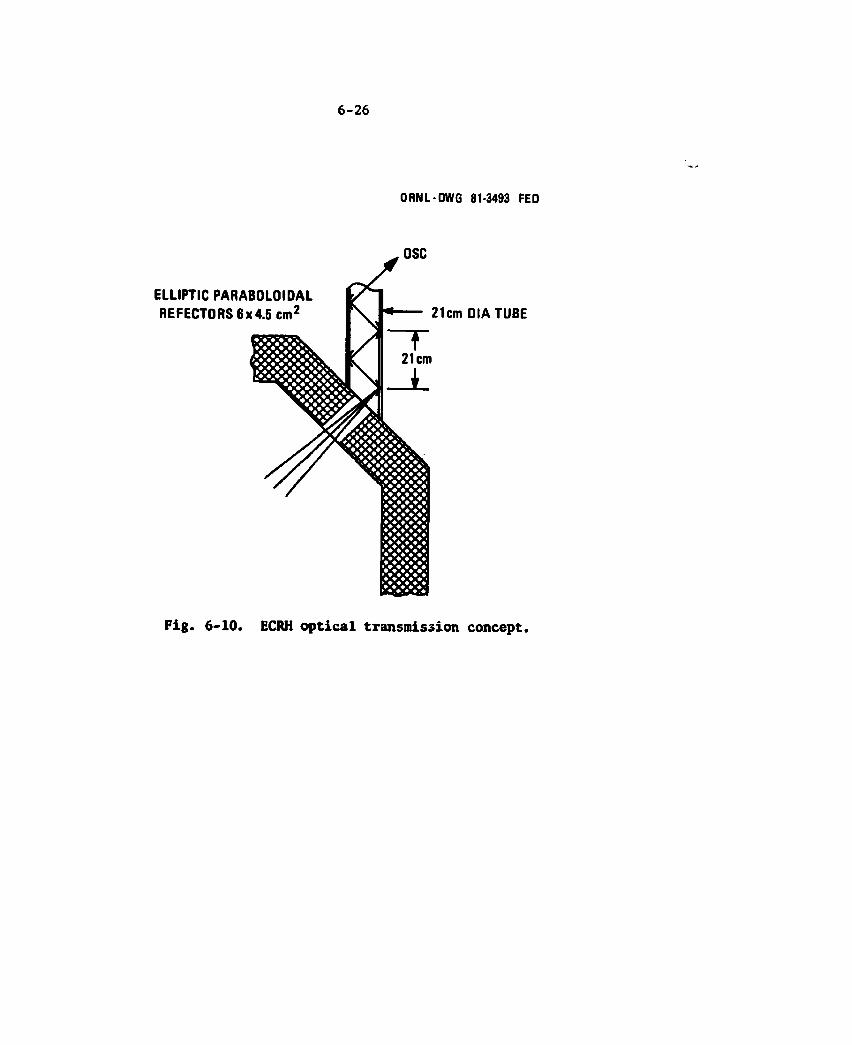
6-26
ORNL-OWG 81-3493 FED
Fig. 6-10. ECRH optical transmission concept.
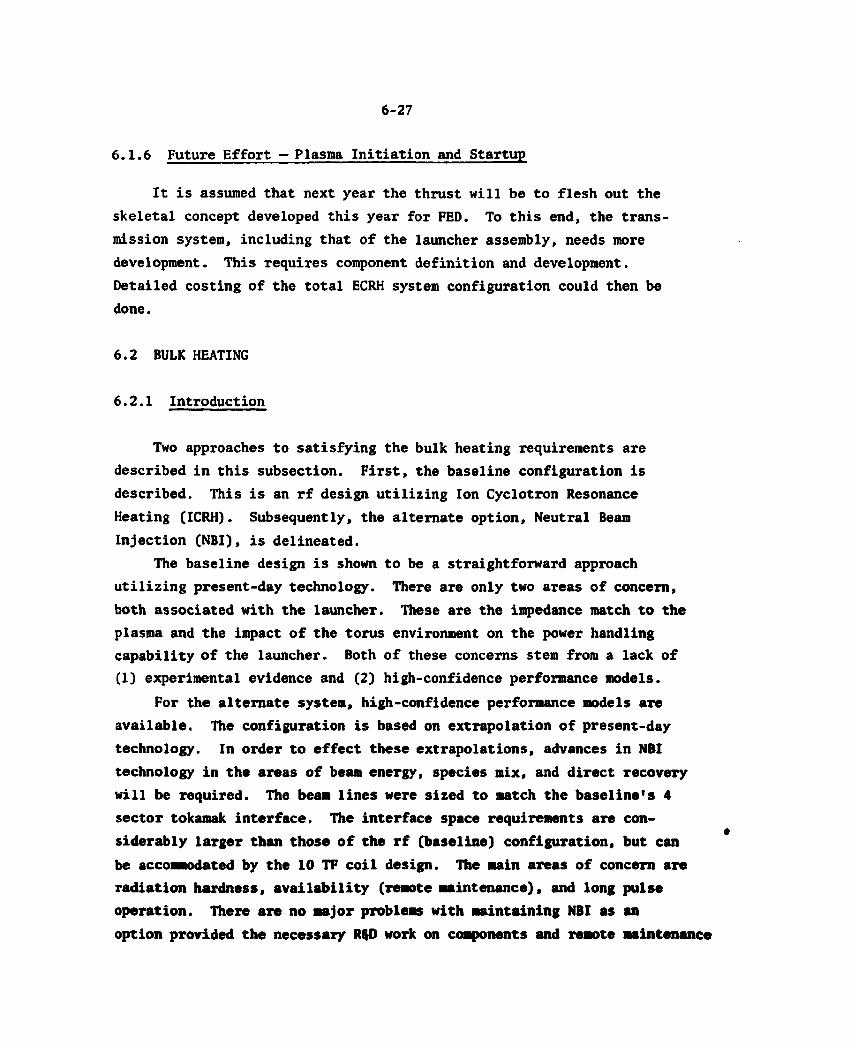
5-27
6.1.6 Future Effort — Plasma Initiation and Startup
It is assumed that next year the thrust will be to flesh out the skeletal concept developed this year for FED. To this end, the trans-mission system, including that of the launcher assembly, needs more development. This requires component definition and development. Detailed costing of the total ECRH system configuration could then be done.
6.2 BULK HEATING
6.2.1 Introduction
Two approaches to satisfying the bulk heating requirements are described in this subsection. First, the baseline configuration is described. This is an rf design utilizing Ion Cyclotron Resonance Heating (ICRH). Subsequently, the alternate option, Neutral Beam Injection (NBI), is delineated.
The baseline design is shown to be a straightforward approach utilizing present-day technology. There are only two areas of concern, both associated with the launcher. These are the impedance match to the plasma and the impact of the torus environment on the power handling capability of the launcher. Both of these concerns stem from a lack of (1) experimental evidence and (2) high-confidence performance models.
For the alternate system, high-confidence performance models are available. The configuration is based on extrapolation of present-day technology. In order to effect these extrapolations, advances in NBI technology in the areas of beam energy, species mix, and direct recovery will be required. The beam lines were sized to match the baseline's 4 sector tokamak interface. The interface space requirements are con-siderably larger than those of the rf (baseline) configuration, but can be accommodated by the 10 TF coil design. The main areas of concern are radiation hardness, availability (remote maintenance), and long pulse operation. There are no major problems with maintaining NBI as an option provided the necessary RftD work on components and remote maintenance

5-28
techniques is accomplished in a timely manner. See Volume V, "Techno-logy RQD Requirements for FED Construction," 1 for more details on both the NBI and rf development needs.
6.2.2 RF (Baseline) Requirements
Bulk heating parameters/requirements
Table 6-4 summarizes the rf bulk heating parameters/requirements for FED. Based on physics and technology considerations, ICRH was chosen to perform the bulk heating and the power drive functions. Two columns of parameters are shown; one for 8-T operation and the other for 10-T operation. The choice of species to be heated is dependent on the plasma condition. Majority heating (D+/2nd) can be used for bulk heating or burn. It is the baseline requirement. For the bulk heating when T £ 5 keV, He minority heating appears to be more efficient. Minority heating would be a desirable feature. The pulse time and power level for the bulk heating phase are the same for both 8-T and 10-T operation. For 10-T operation the plasma is expected to ignite (i.e., Q ®) and no drive power is required. The frequencies specified are for resonant heating at the center of the chamber.
Guidelines
Multiple frequency operation is desirable for operation at reduced toroidal field levels which will be employed during initial checkout. Also, the system should be compatible with H as well as D-D and D-T plasma operation. The launcher environment is not benign. At the
-4 start, fill gas to a pressure of M O torr is in the chamber (and therefore the launcher). This could degrade the power handling capa-bility of the launcher. During the burn, the neutron flux at the chamber wall is ^ O 1 4 n/cm2-s. This must be attenuated to <106 n/cm2-s in the 2 2 reactor room and 10 n/cm -s in the lower level of the reactor building. The decay radiation must be <2.5 mrem/h — 24 h after shutdown. This requires a radiation hardened launcher with shielding around it and the
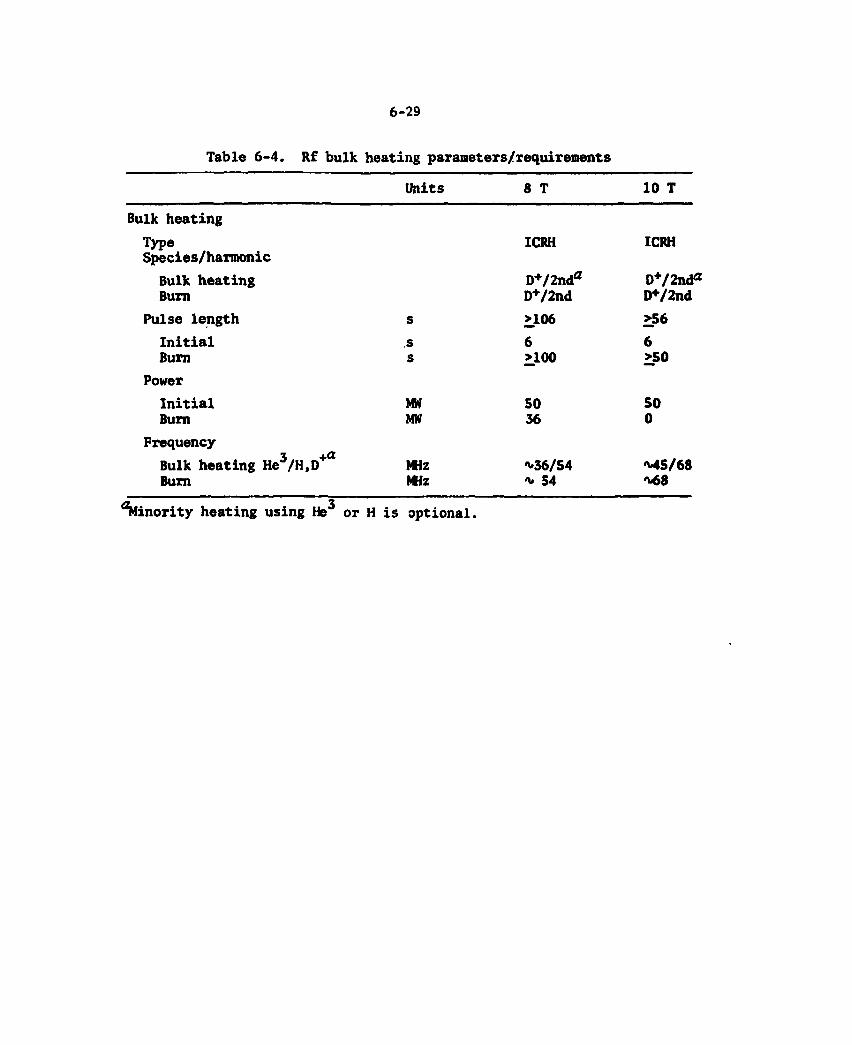
5-29
Table 6-4. Rf bulk heating parameters/requirements
Units 8 T 10 T
Bulk heating Type Species/harmonic
Bulk heating Burn
Pulse length Initial Burn
Power Initial Burn
Frequency Bulk heating He3/H,D Burn
s s
MW MW
mz mz
ICRH
D+/2nda D+/2nd >106
6 >100
50 36
*36/54 * 54
ICRH
D V ^ d ® D+/2nd >56 6 >50
50 0
M5/68 *68
Minority heating using He3 or H is optional.
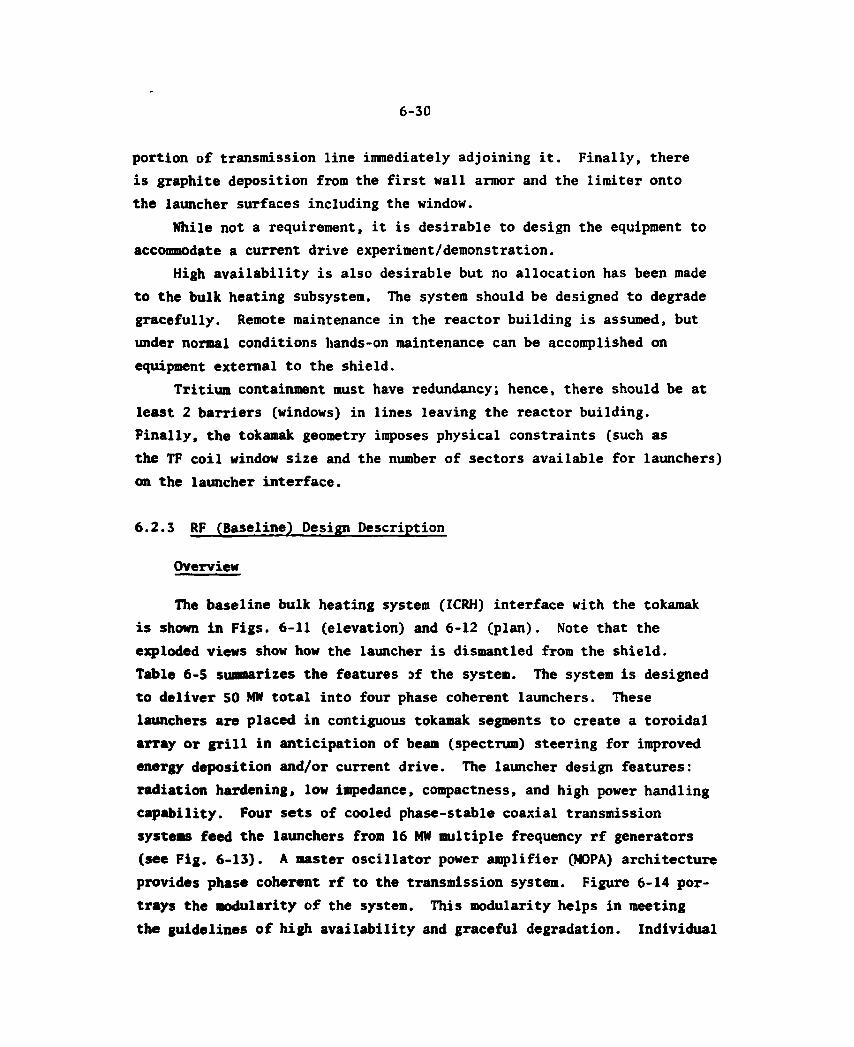
5-30
portion of transmission line immediately adjoining it. Finally, there is graphite deposition from the first wall armor and the limiter onto the launcher surfaces including the window.
While not a requirement, it is desirable to design the equipment to accommodate a current drive experiment/demonstration.
High availability is also desirable but no allocation has been made to the bulk heating subsystem. The system should be designed to degrade gracefully. Remote maintenance in the reactor building is assumed, but under normal conditions hands-on maintenance can be accomplished on equipment external to the shield.
Tritium containment must have redundancy; hence, there should be at least 2 barriers (windows) in lines leaving the reactor building. Finally, the tokamak geometry imposes physical constraints (such as the TF coil window size and the number of sectors available for launchers) on the launcher interface.
6.2.3 RF (Baseline) Design Description
Overview
The baseline bulk heating system (ICRH) interface with the tokamak is shown in Figs. 6-11 (elevation) and 6-12 (plan). Note that the exploded views show how the launcher is dismantled from the shield. Table 6-5 summarizes the features af the system. The system is designed to deliver 50 MW total into four phase coherent launchers. These launchers are placed in contiguous tokamak segments to create a toroidal arTay or grill in anticipation of beam (spectrum) steering for improved energy deposition and/or current drive. The launcher design features: radiation hardening, low impedance, compactness, and high power handling capability. Four sets of cooled phase-stable coaxial transmission systems feed the launchers from 16 MW multiple frequency rf generators (see Fig. 6-13). A master oscillator power amplifier (MOPA) architecture provides phase coherent rf to the transmission system. Figure 6-14 por-trays the modularity of the system. This modularity helps in meeting the guidelines of high availability and graceful degradation. Individual
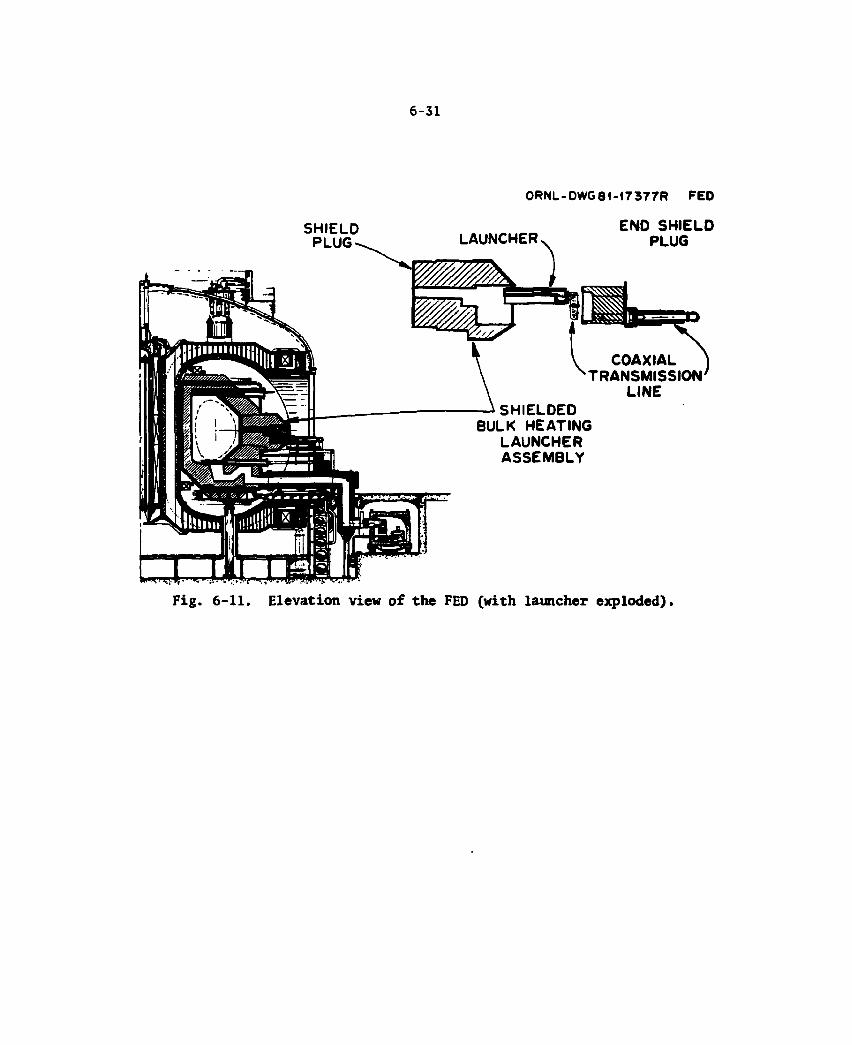
6-31
ORNL-DWG 81-17 377R FED
SHIELD PLUG LAUNCHER
ENO SHIELD PLUG
COAXIAL TRANSMISSION'
LINE SHIELOEO
BULK HEATING LAUNCHER ASSEMBLY
Fig. 6-11. Elevation view of the FED (with launcher exploded),
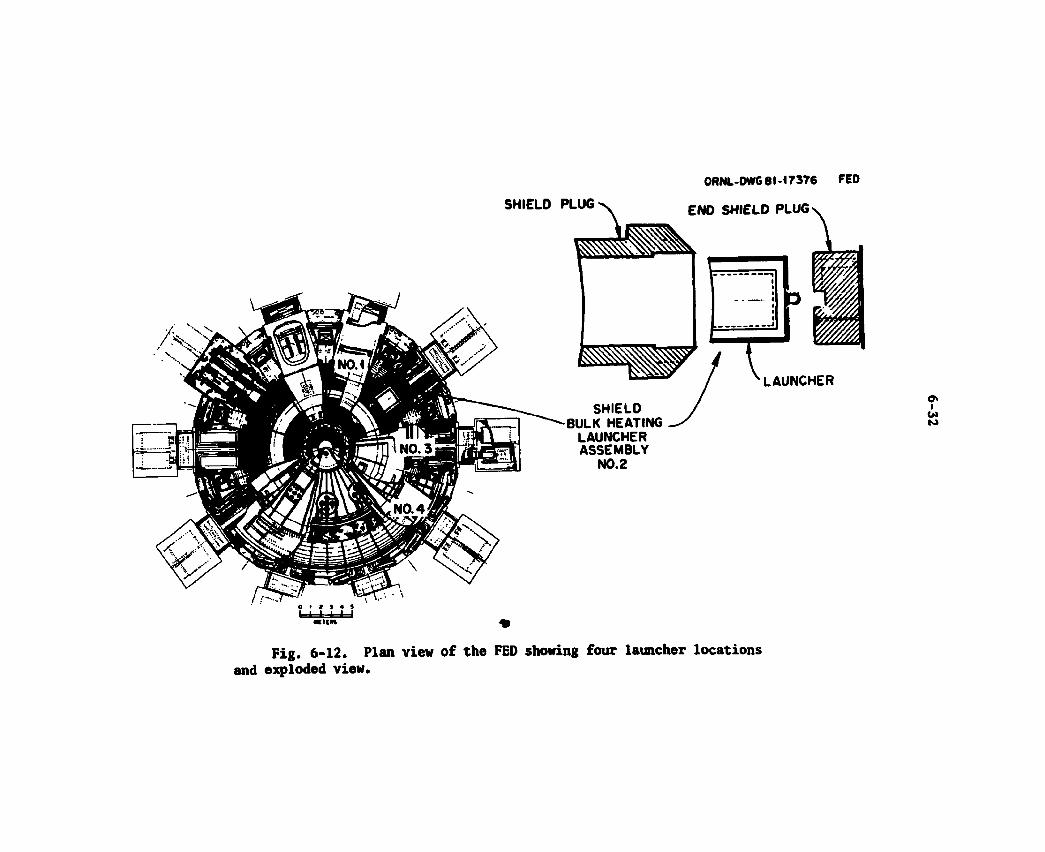
ORNL-DWG 61-17376 FED
Fig. 6-12. Plan view of the FED showing four launcher locations and exploded view.
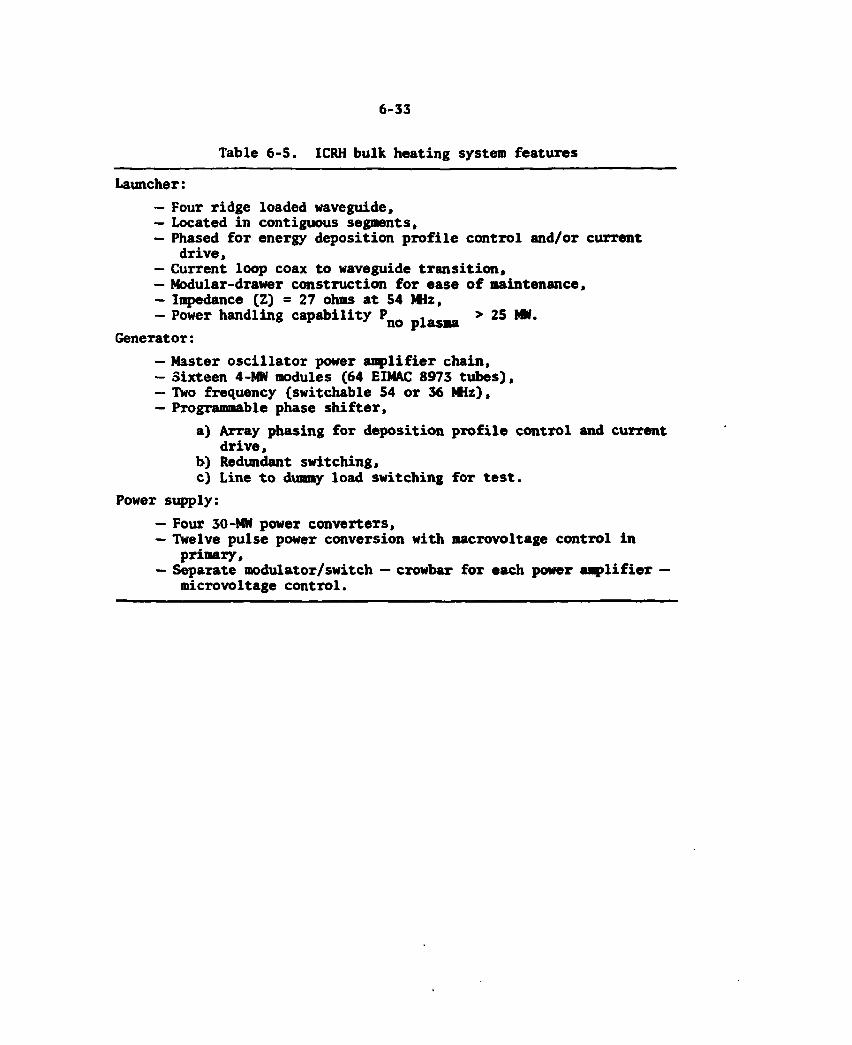
6-33
Table 6-5. ICRH bulk heating system features
Launcher: — Four ridge loaded waveguide, — Located in contiguous segments, — Phased for energy deposition profile control and/or current
drive, — Current loop coax to waveguide transition, — Modular-drawer construction for ease of maintenance, — Impedance (Z) - 27 ohms at 54 Miz, — Power handling capability P n o p l a s B a * 25 MW.
Generator: — Master oscillator power amplifier chain, — Sixteen 4-MW modules (64 EIMAC 8973 tubes), — Two frequency (switchable 54 or 36 MHz), — Programmable phase shifter,
a) Array phasing for deposition profile control and current drive,
b) Redundant switching, c) Line to dummy load switching for test.
Power supply: — Four 30-MW power converters, — Twelve pulse power conversion with macrovoltage control in
primary, — Separate modulator/switch — crowbar for each power amplifier —
microvoltage control.
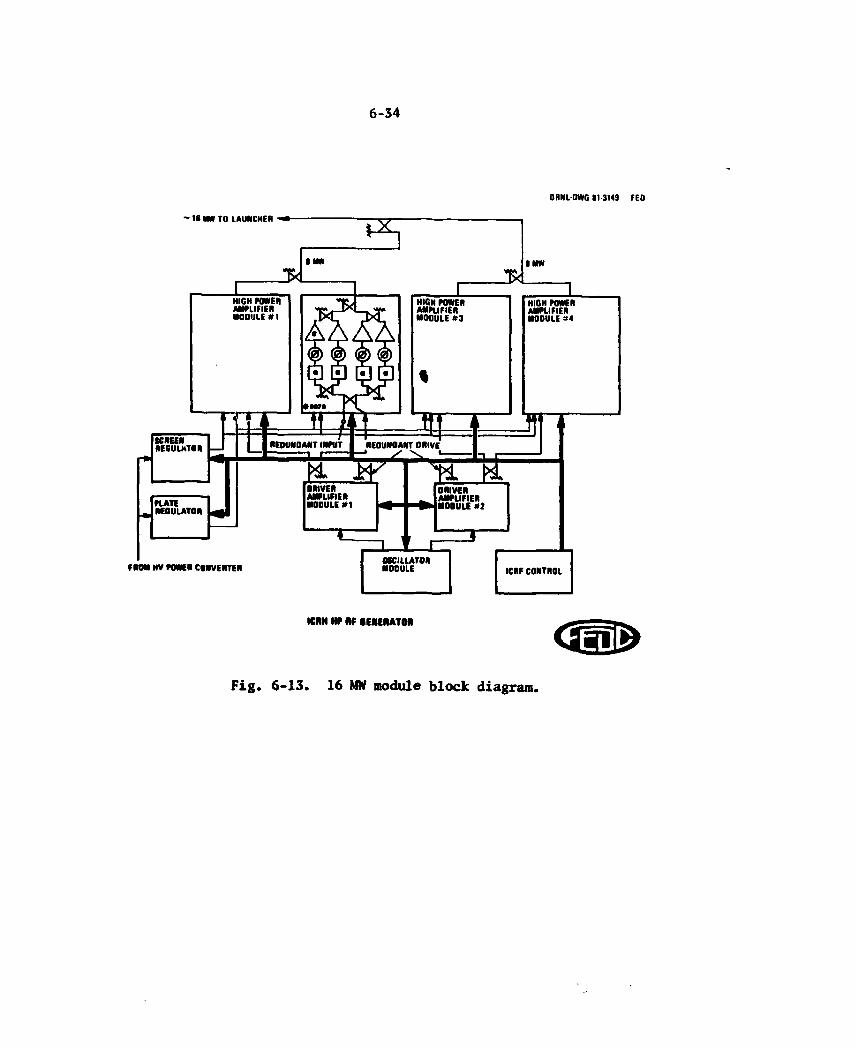
6-34
ORNL OWG 81-3149 FED
• IS M W TO LAUNCHER
FROM HV POWER CONVERTER
•CRN HP I
Fig. 6-13. 16 MW nodule block diagran.
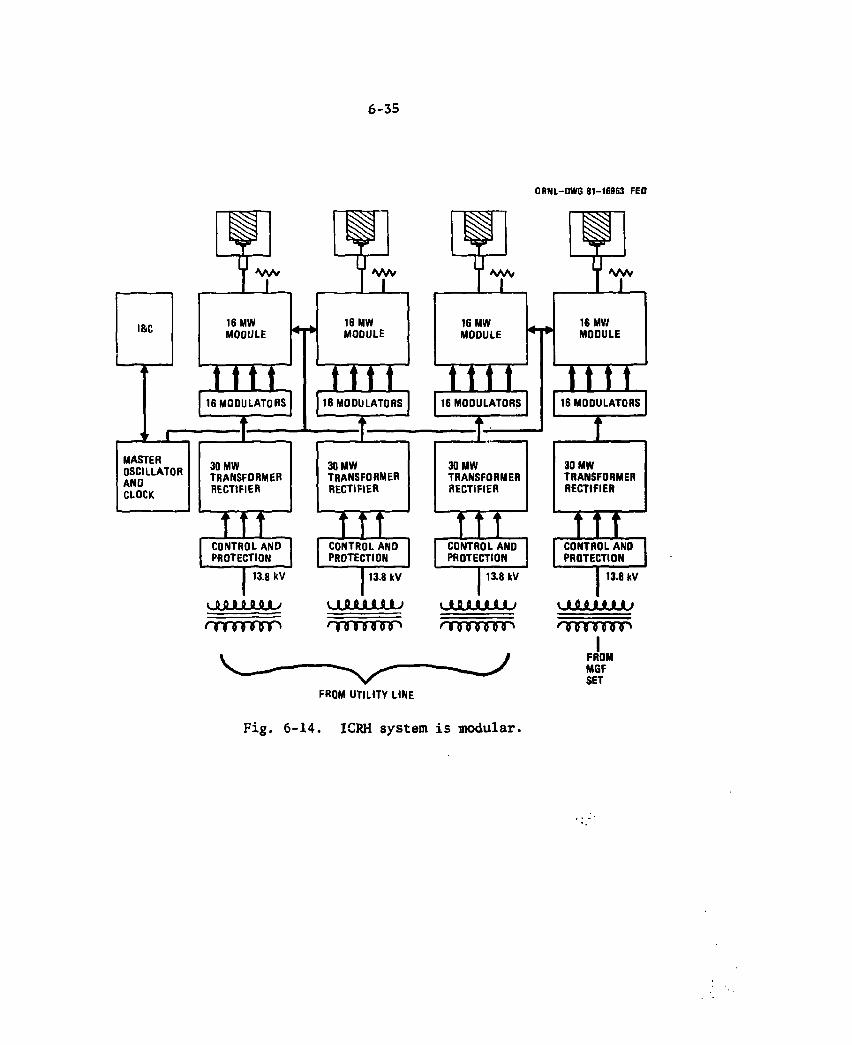
6-35
ORNL-DWG 81-16953 FED
MASTER OSCILLATOR AND CLOCK
30 MW TRANSFORMER RECTIFIER
30 MW TRANSFORMER RECTIFIER
30 MW TRANSFORMER RECTIFIER
CONTROL AND PROTECTION
CONTROL AND PROTECTION
CONTROL AND PROTECTION
13.8 kV 13.8 kV 13.8 kV
ULflJUULflJL> o r f m p
UJUAJUUU UUUULMJU
30 MW TRANSFORMER RECTIFIER
m CONTROL AND PROTECTION
| 13.8 kV
uuuuuuuu ^grrrnrp
I FROM MGF SET
FROM UTILITY LINE
Fig. 6 -14. ICRH s y s t e m i s m o d u l a r .

6-36
control is provided for each 1 MW module. Three power supplies are driven from the line and provide the 36 MW for the burn power. A fourth module is driven from the MGF set for additional power during the bulk heating phase.
Each of these components in the main chain will be discussed in detail in the text that follows. The order of exposition follows the signal path from the launcher back to the oscillator. Subsequently, the instrumentation and control equipment, and ancillary equipment will be reviewed.
Launcher
Three views of the baseline ICRH launcher are shown in Fig. 6-15. This is a ridge-loaded waveguide with a current loop feed. A tailored matching section is built in. The size of the ridge (both height and width) have been adjusted to provide nuclear shielding for the coax window located at the back of the launcher. The ridge is filled with nuclear shielding. The height of the waveguide is adjusted for the best combination of power handling, impedance match and cutoff wavelength. Through a combination of bends in the 9-3/8-in. coaxial transmission line and nuclear shielding material, the high energy neutron flux is reduced to a safe level for the reactor building. The transmission lines coolant is returned through the launchers matching section and out the ridge. A sandwich construction of two thin stainless steel membranes encloses a 1-cm serpentine cooling coil and makes up the body of the launcher. The launcher and shield plug are removed as a module (see Figs. 6-11 and 6-12).
ICRH transmission system
One channel representative of the baseline is shown in its entirety (launcher to HPA tube) in Figs. 6-16 and 6-17. A 9-3/8-in. coaxial line is the basic component. Presently it is planned to have the center conductor cooled with water with the line pressurized with SF6 or the line pressurized with high velocity Freon to enhance the average power
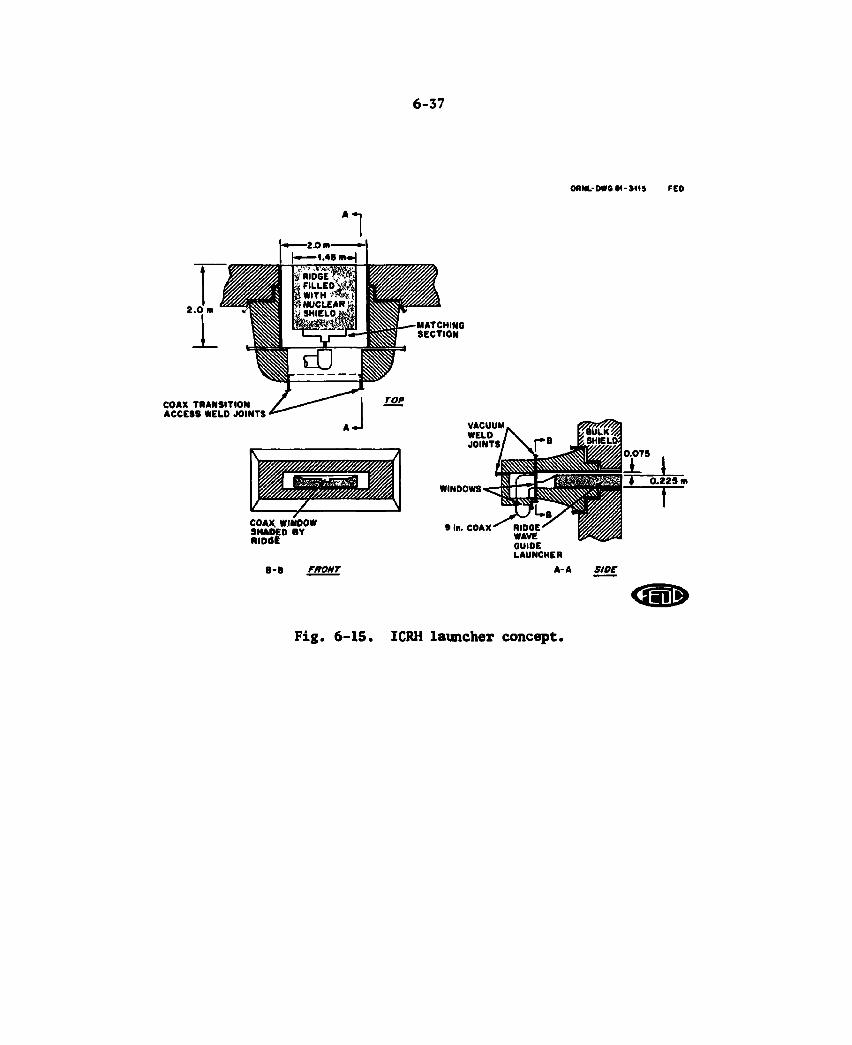
6 - 3 7
OftNL-DWGW-SMi FED
2
MATCHING SECTION
COAX TRANSITION ACCESS WELD JOINTS
COAX WINDOW S HA DEO SY RIOdt
B-B FRONT
WINDOWS
• In. COAX
A-A SIDE
Fig. 6-15. ICRH launcher concept.
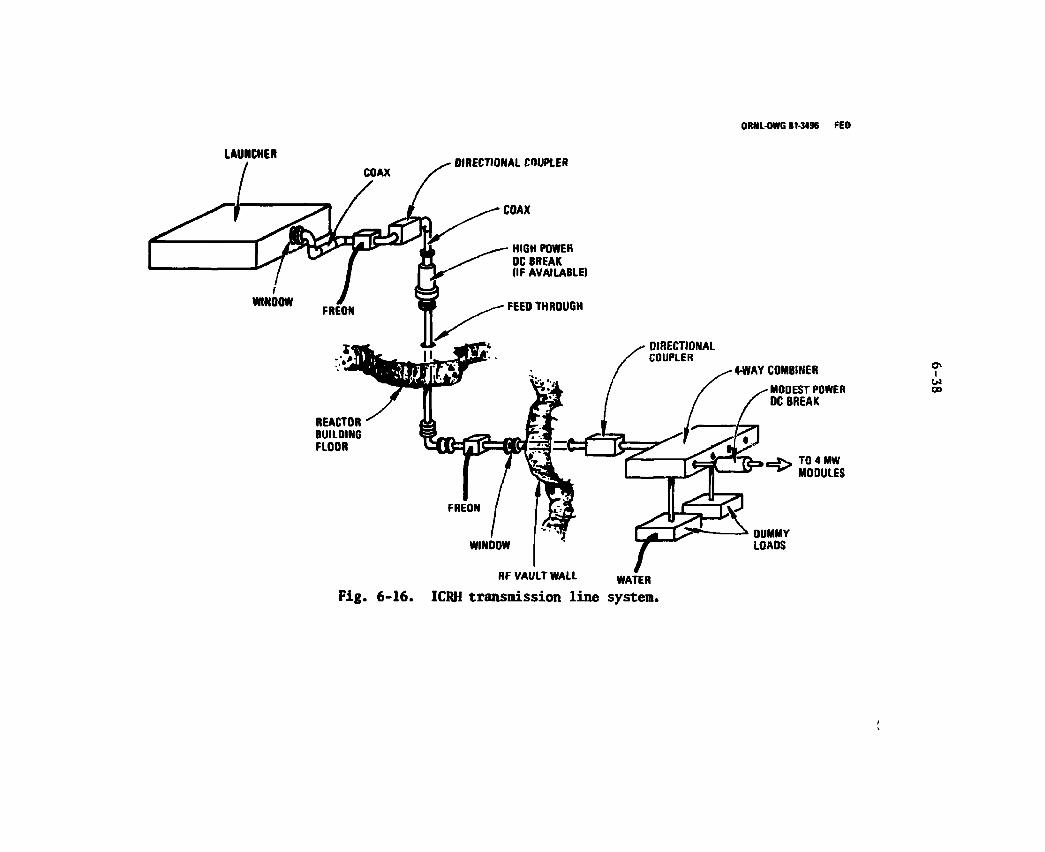
ORNL-OWG 81-3496 FEO
LAUNCHER DIRECTIONAL COUPLER
COAX
HIGH POWER DC BREAK (IF AVAILABLE)
FEED THROUGH
REACTOR BUILDING FLOOR
4-WAY COMBINER
MODEST POWER DC BREAK
J S TO 4 MW ^ ^ MODULES
DUMMY LOADS
RF VAULT WALL WATER
Fig. 6-16. ICRH transmission line system.
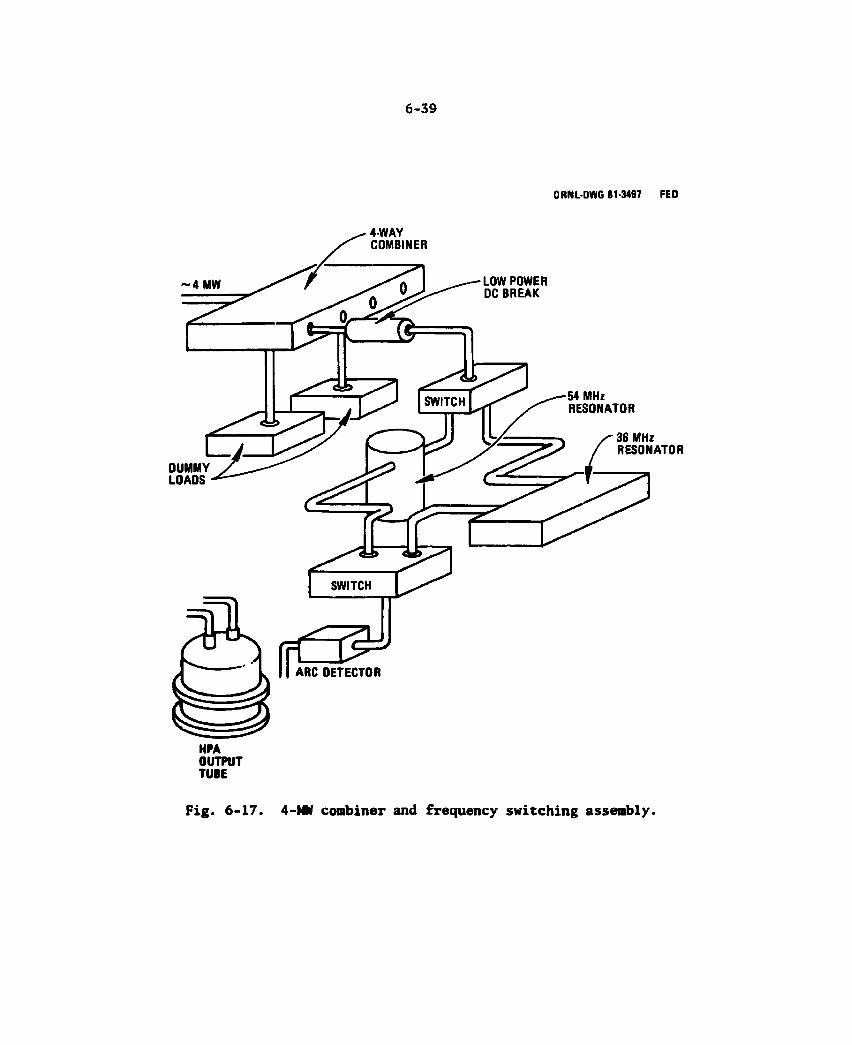
6-39
ORNL-DWG 81-3497 FED
OUTPUT TUBE
Fig. 6-17. 4-MW combiner and frequency switching assembly.

6-40
handling capability ^30:1. There are two sets of coolant systems, one inside the reactor building and another outside. This assures tritium containment. Directional couplers are positioned to provide monitoring and performance monitoring signal injection points. Depend-ing upon the success of component development programs, the dc break will be placed at one or more stations. The critical factor here is the power handling and bandwidth capability of this device.
One candidate approach to frequency switching is shown in Fig. 6-17. Pneumatically activated switches select either a ferrite resonator (for low frequency) or tuneable cavity (for higher frequency). The bandwidth of the transmission system will probably be limited by the dc break. This may precipitate the need to institute the dc break into the resonator design.
Dummy loads are provided for test and checkout. The power is directed into these loads by properly phasing the power signals at the input to the hybrid of the 4-way combiner. At the last stage of combin-ing, these dummy load ports can also be used as redundant output ports.
RF generator
It was assumed that the maximum power level tube available for FED was in the 1 to 1.5 MW range. To obtain 50 MW, 64 tubes (supplying 1 MW each) are combined — 4 sets of 16 tubes each driving a launcher. Figure 6-18 shows the detail of each 1 MW amplifier within the 4 MW module. The power from each pair is combined in a hybrid with proper phasing. The phase of each tube's output is controlled with low level digital phase shifters at the input. Digitally controlled drive attenuators are used to balance outputs for efficient combining. These are programmed by the controller from the bulk heating I&C local processor as shown. The appropriate samplers (directional couplers) used to check for needed phase and amplitude corrections are planned.
As stated earlier, the design has a graceful degradation feature. If one HPA is down, the power level to the launcher is reduced to
2 (15/16) of the normal value. Power level can be adjusted in similar steps by switching off the appropriate number of tubes.
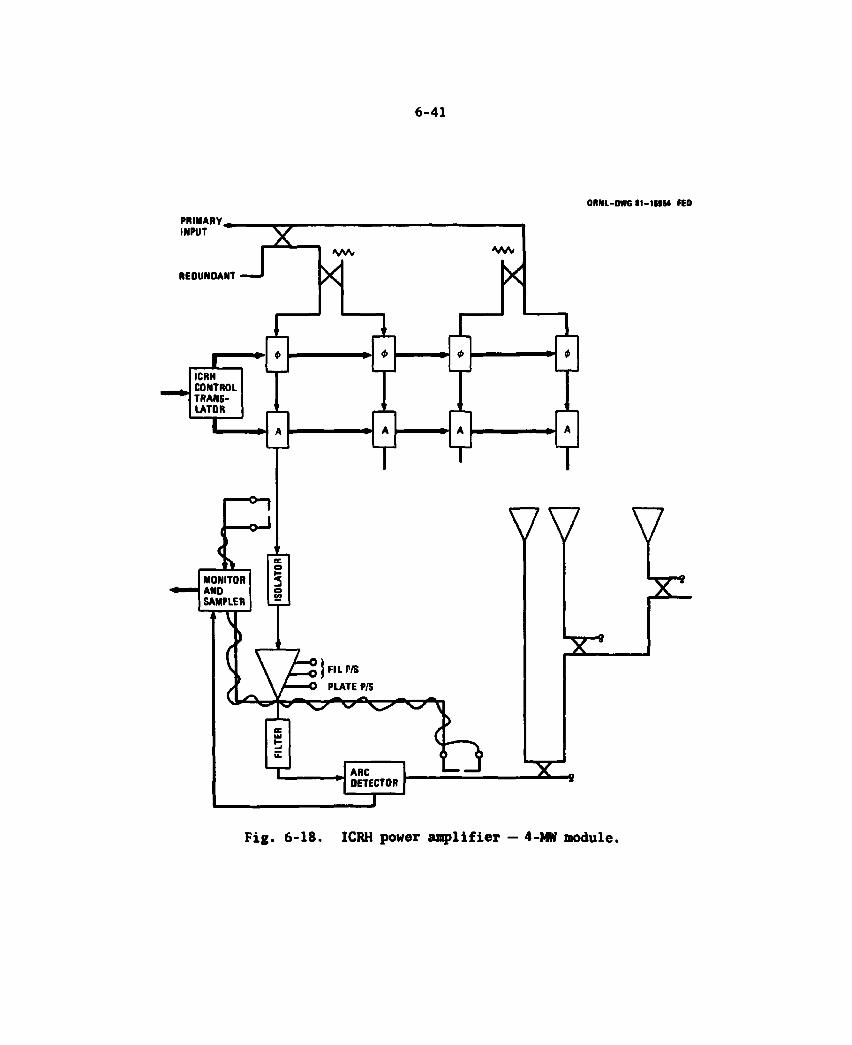
6-41
ORNl-OWG I 1 - 1 M M ttO
Fig. 6-18. ICRH power amplifier — 4-MW module.
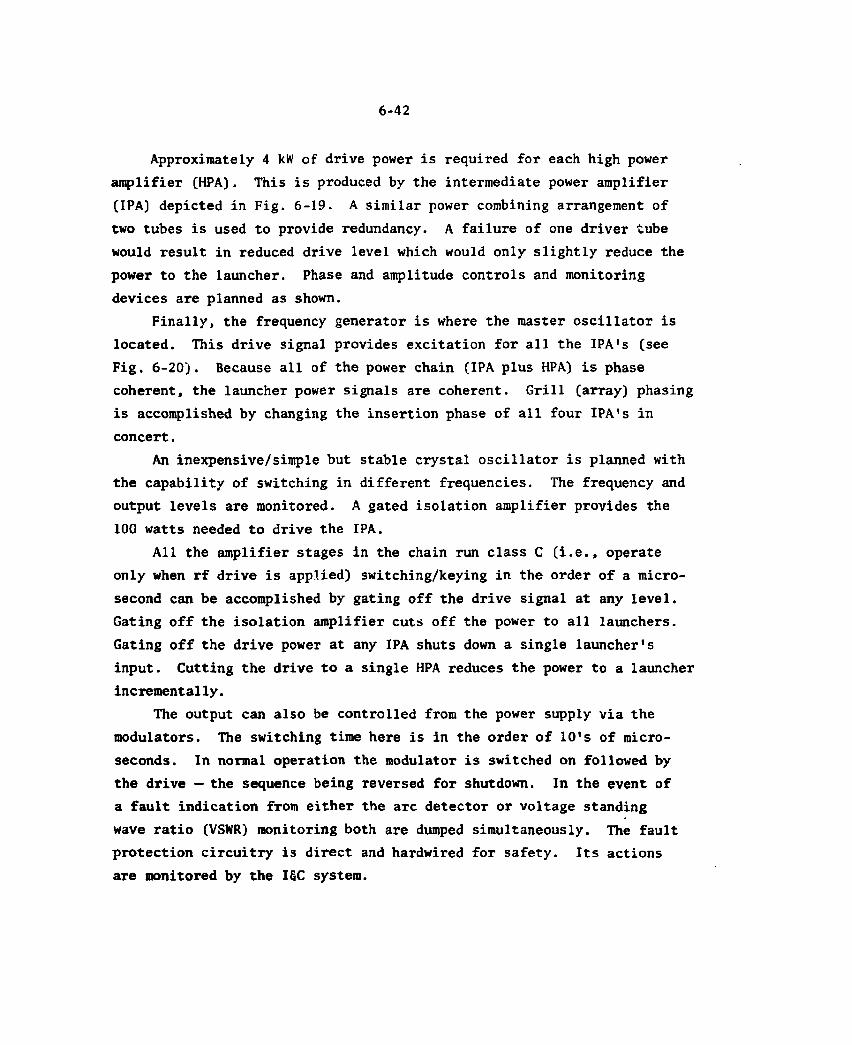
6-42
Approximately 4 kW of drive power is required for each high power amplifier (HPA). This is produced by the intermediate power amplifier (IPA) depicted in Fig. 6-19. A similar power combining arrangement of two tubes is used to provide redundancy. A failure of one driver tube would result in reduced drive level which would only slightly reduce the power to the launcher. Phase and amplitude controls and monitoring devices are planned as shown.
Finally, the frequency generator is where the master oscillator is located. This drive signal provides excitation for all the IPA's (see Fig. 6-20). Because all of the power chain (IPA plus HPA) is phase coherent, the launcher power signals are coherent. Grill (array) phasing is accomplished by changing the insertion phase of all four IPA's in concert.
An inexpensive/simple but stable crystal oscillator is planned with the capability of switching in different frequencies. The frequency and output levels are monitored. A gated isolation amplifier provides the 100 watts needed to drive the IPA.
All the amplifier stages in the chain run class C (i.e., operate only when rf drive is applied) switching/keying in the order of a micro-second can be accomplished by gating off the drive signal at any level. Gating off the isolation amplifier cuts off the power to all launchers. Gating off the drive power at any IPA shuts down a single launcher's input. Cutting the drive to a single HPA reduces the power to a launcher incrementally.
The output can also be controlled from the power supply via the modulators. The switching time here is in the order of 10's of micro-seconds. In normal operation the modulator is switched on followed by the drive — the sequence being reversed for shutdown. In the event of a fault indication from either the arc detector or voltage standing wave ratio (VSNR) monitoring both are dumped simultaneously. The fault protection circuitry is direct and hardwired for safety. Its actions are monitored by the IGC system.
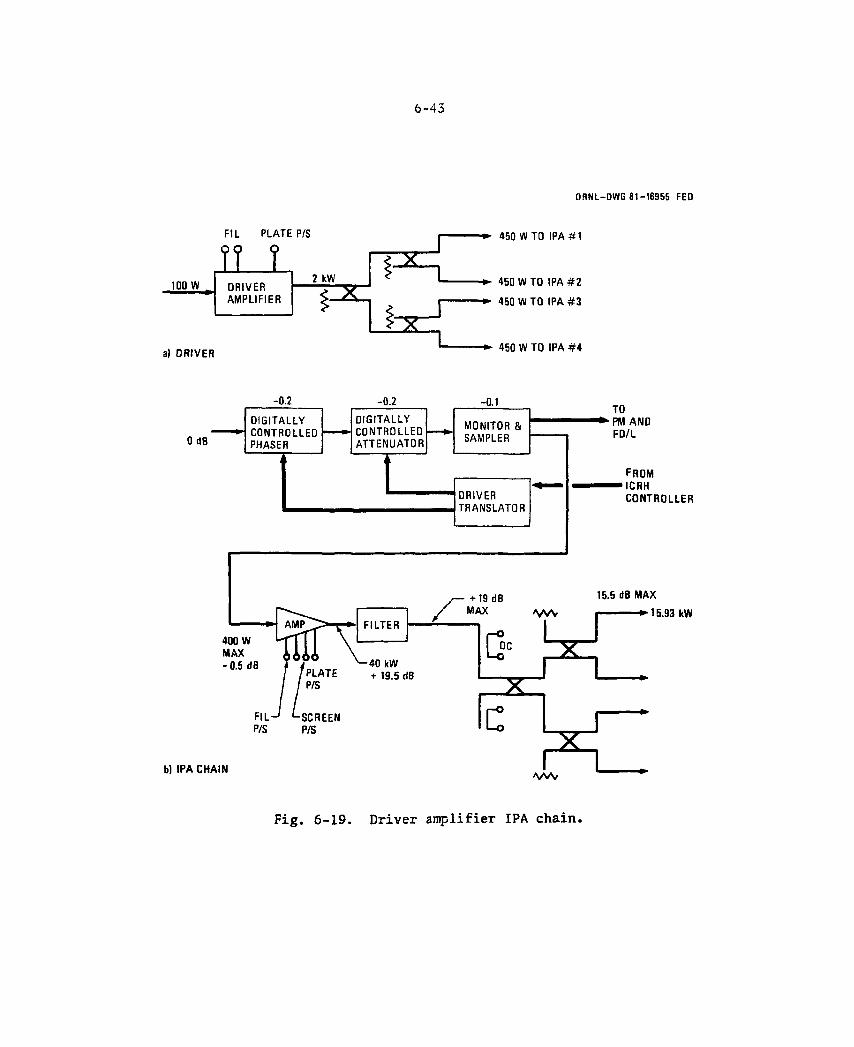
6-43
O R N L - D W G 8 1 - 1 6 9 5 5 F E D
1 0 0 w
FIL PLATE P/S
ILL • RIVER A M P L I F I E R
a ) DR IVER
2 kW
2 :
x
4 5 0 W T O IPA # 1
4 5 0 W T O IPA # 2
4 5 0 W TO IPA # 3
4 5 0 W T O IPA # 4
Fig. 6-19. Driver amplifier IPA chain.
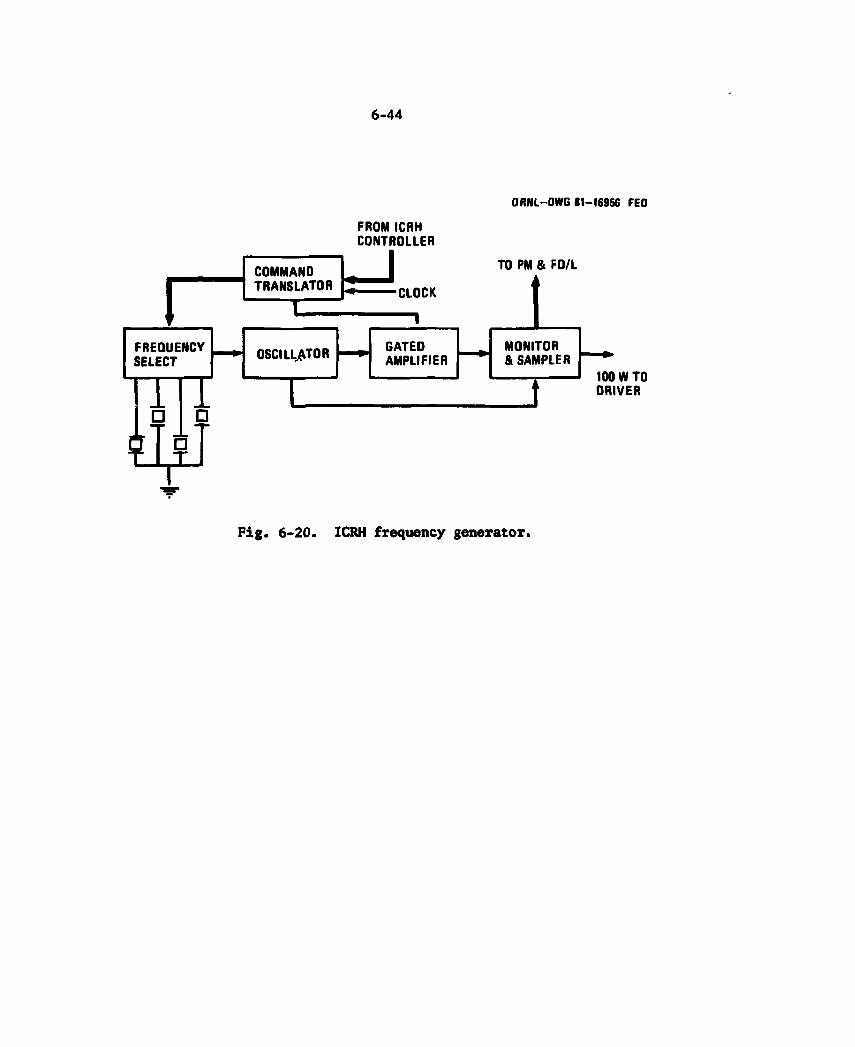
6-44
f FREQUENCY SELECT
COMMAND TRANSLATOR
I
OSCILLATOR
FROM ICRH CONTROLLER
•CLOCK
1
ORNL-DWG 81-16956 FEO
TO PM & FD/L
1 GATED AMPLIFIER
MONITOR & SAMPLER
GATED AMPLIFIER
MONITOR & SAMPLER
100 WTO DRIVER
Fig. 6-20. ICRH frequency generator.

6-4S
Power supplies
A diagram of the proposed 12 pulse transformer rectifier converter for the ECRH is shown in Fig. 6-7. The transformer rectifier for ICRH is the same basic type but delivers a maximum of 30 kV dc at 1500 A. (Note: A typical operation is 22 kV at 1050 A.) The 13.8 kV-3 phase line drives each converter (see Fig. 6-21). Appropriate circuit breakers, vacuum breaks, and lightening protection is planned. Thyristors in the "star" configuration with the wye primary effects macrovoltage control to set the plate voltage to the nominal value of 21 kVdc. Microvoltage control (5%) used to trim individual supply voltages to compensate for tube anomalies is done by the modulator. (An added benefit of this regulator is ripple reduction). A crowbar circuit is provided with each modulator for protection. There is one modulator/crowbar per HPA — a total of 64.
Instrumentation and control
The interface of the instrumentation and control (I&C) was shown in Fig. 6-13. Figure 6-22 summarizes the sampling and control points. Contained within the I&C block shown in this figure are three major units: (1) the process control interface unit (PCIU); (2) the perform-ance monitor and fault detection and location (PMSFDfiL) unit; and (3) the ICRH controller. The planned architecture is distributed (hardware intensive). Macrocommands from the tokamak main I$C data processor are broken down into a sequence of microcommands. Summary level status data is sent to the tokamak I§C. These interfacing functions are accomplished with the PCIU portrayed in Fig. 6-23. The tokamak interface will be CAMAC.
The PM&FD&L unit architecture is detailed in Fig. 6-24. Because the on time of the Plasma Heating System is long and the data sanpling rate required is high, the monitor system uses a "sample subset, integrate data and compare" approach. Both the data sample and equipment status fields are made available to the PCIU. It is desirable to convert to digital format as soon as possible. Therefore A/D converters will be
6-46
ORNl-DWG 81-16957 FED
MGF MGF MGF MGF 1 UTILITY
Fig. 6-21. One phase of the 3-phase 13.8 KV prime power.
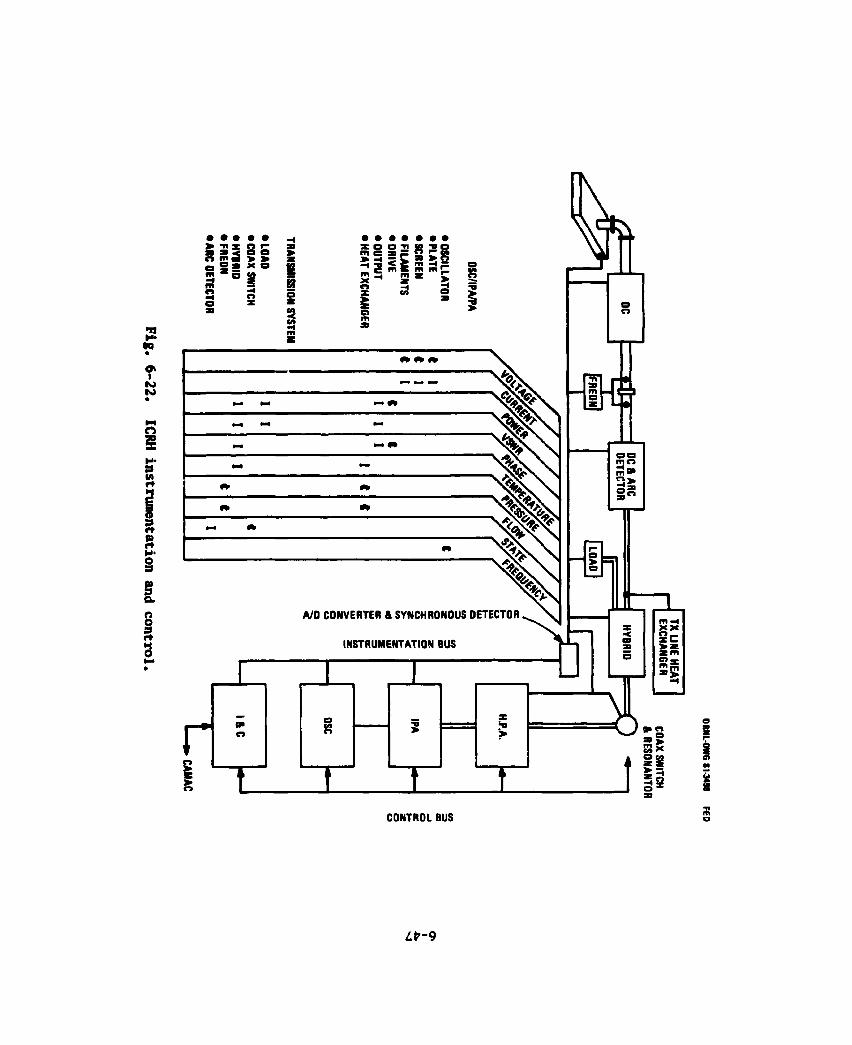
• • • • • > ti* o r a a 3 o o n nfi > > o g a * e 3 ° * m ™ n H H O
• •
U H< OQ O* I N> K>
fe
in •< in
x e e s 0 2 e n = » r 2 C K
£ e £
3 in
9 M* §
S a o o 9
A/D CONVERTER & SYNCHRONOUS DETECTOR
INSTRUMENTATION BUS
r > r» I
o X n o > >
E s 0 m 1 8
CONTROL BUS
9
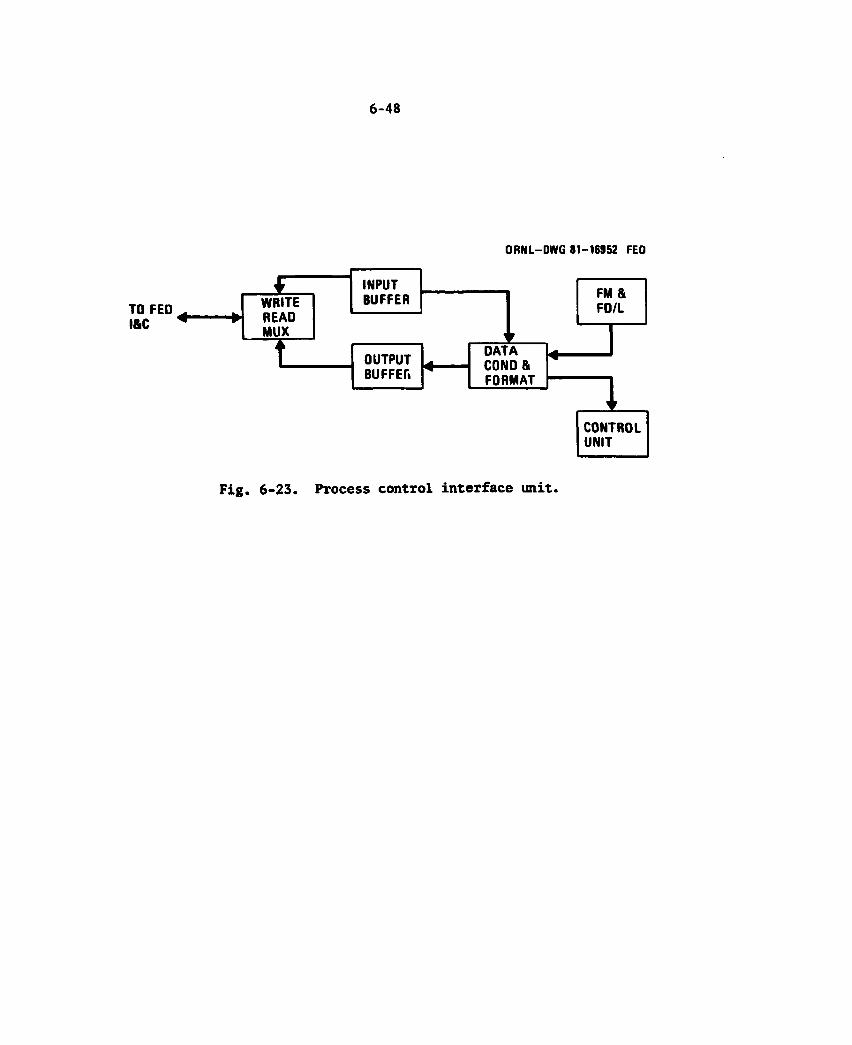
6-48
ORNL-DWG 81-16952 FEO
Fig. 6-23. Process control interface unit.
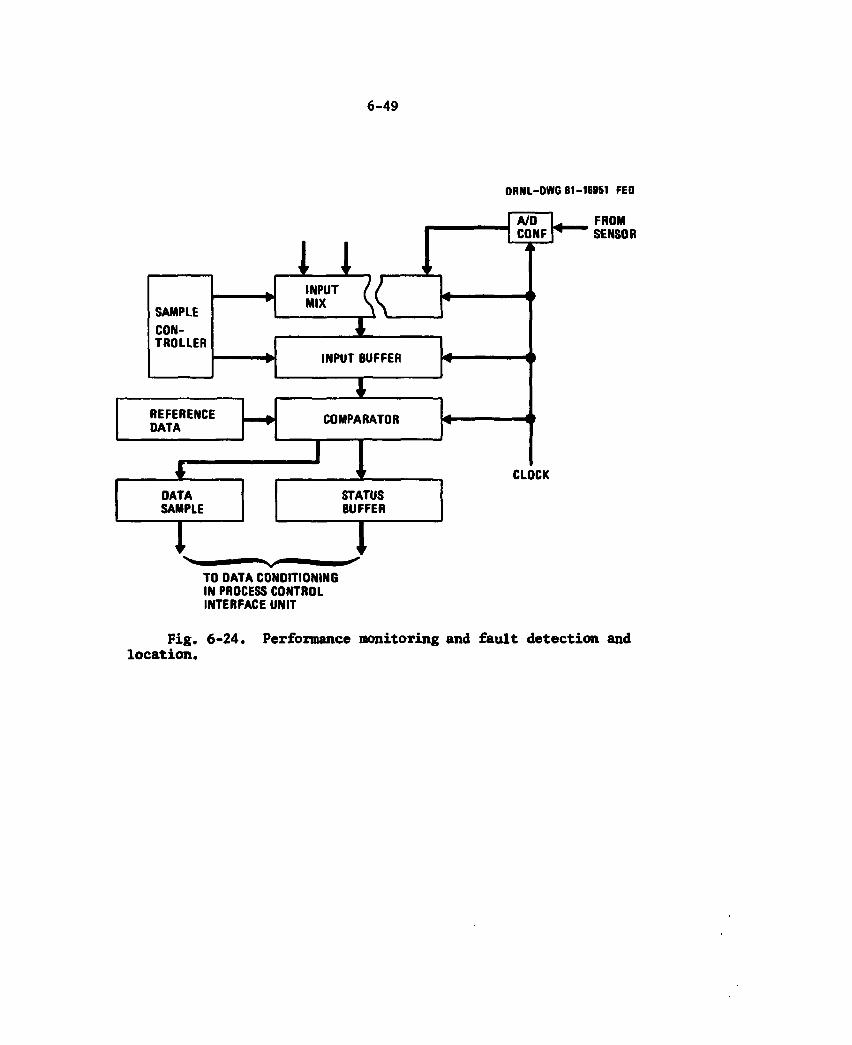
6-49
ORNL-DWG 81-16951 FED
SAMPLE CON-TROLLER
REFERENCE DATA
LA INPUT MIX K 3
INPUT BUFFER
I COMPARATOR
A/D CONF
FROM SENSOR
DATA SAMPLE
STATUS BUFFER
CLOCK
TO DATA CONDITIONING IN PROCESS CONTROL INTERFACE UNIT
Fig. 6-24. Performance monitoring and fault detection and location.
6-50
placed in close proximity to the sensor (thermocouple, rf level, detector, etc.). Transmission of data from high voltage deck is done through fiber optics.
The ICRH controller architectur? is characterized by the sketch in Fig. 6-25. A hierarchical command structure is used. For each command, a microschedule sequence is commanded that operates the controls. Table 6-6 gives an example of the startup procedure.
Note the monitor diagnostic sequence block (Fig. 6-25). For the ICRH system with its phase coherent amplifiers and transmission systems, monitor signals must be routed to particular points and insertion phase (and amplitude) measured for appropriate correction. This is a complex sequence and will have many subsequences.
Ancillary
The most significant portion of the ancillary equipment is the cooling system. Two systems are considered for the transmission line (i.e., Freon or SF6 and water). Water, oil, and chilled air are needed for the HPA. The IPA and dummy loads also require cooling but they have not been investigated. Figure 6-26 shows the water and air cooling system for the HPA. Details for the Freon cooling system configuration considered for the transmission line have not been worked out but there would be a chiller required to reduce the Freon inlet temperature. The transmission line cooling load might be shared between this chiller and the water cooling loop. If both Freon and center conductor water cooling are used, the Freon and water coolant operating parameters must he made compatible (i.e., temperature and heat transfer).
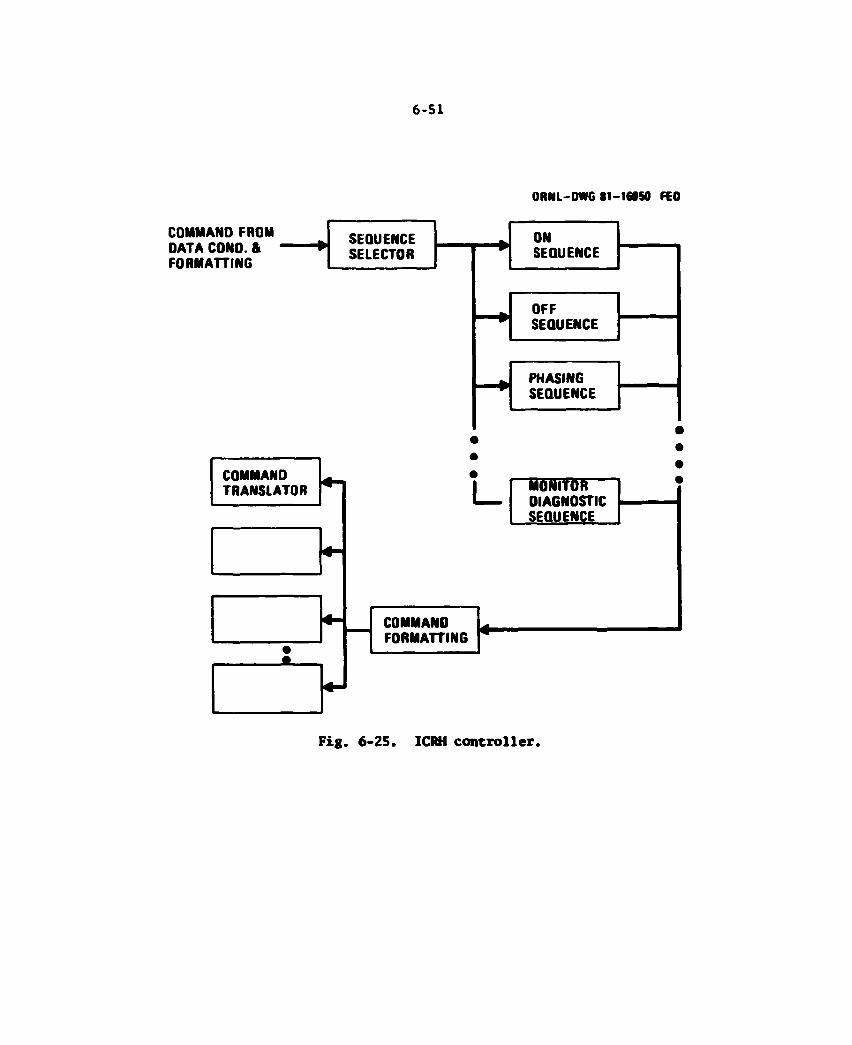
6-51
ORNL-DWG 81-1050 FEO
F ig . 6 - 2 5 . ICRH c o n t r o l l e r .
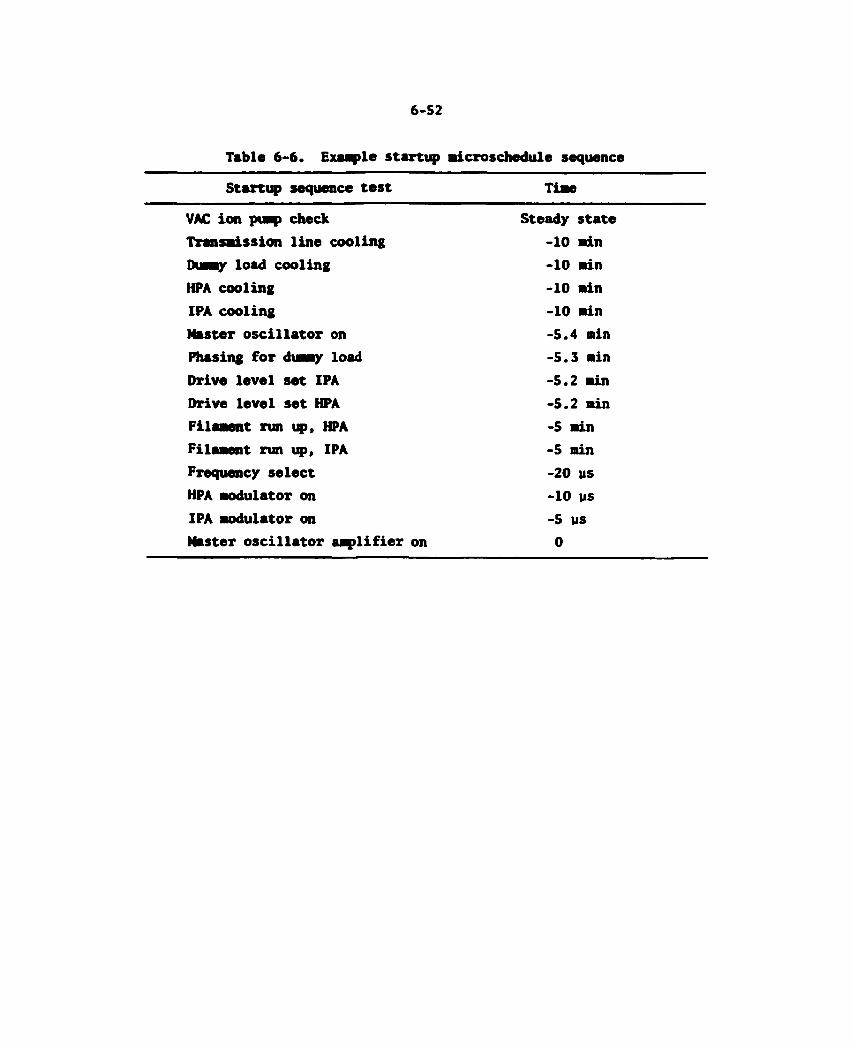
6-52
Table 6 - 6 . Example s ta r tup microschedule sequence
Start 14) sequence test Time
VAC ion pump check Steady state Transmission l ine cooling -10 min Dumqr load cooling -10 min HPA cooling -10 min IPA cooling -10 min Master osc i l la tor on -5 .4 min Phasing for dumqr load - 5 . 3 min Drive level set IPA -5 .2 min Drive level set HPA -5 .2 min Filament run HPA -5 min Filament run up, IPA -5 min Frequency select -20 us HPA modulator on -10 lis IPA modulator on -5 us Master osc i l la tor amplif ier on 0
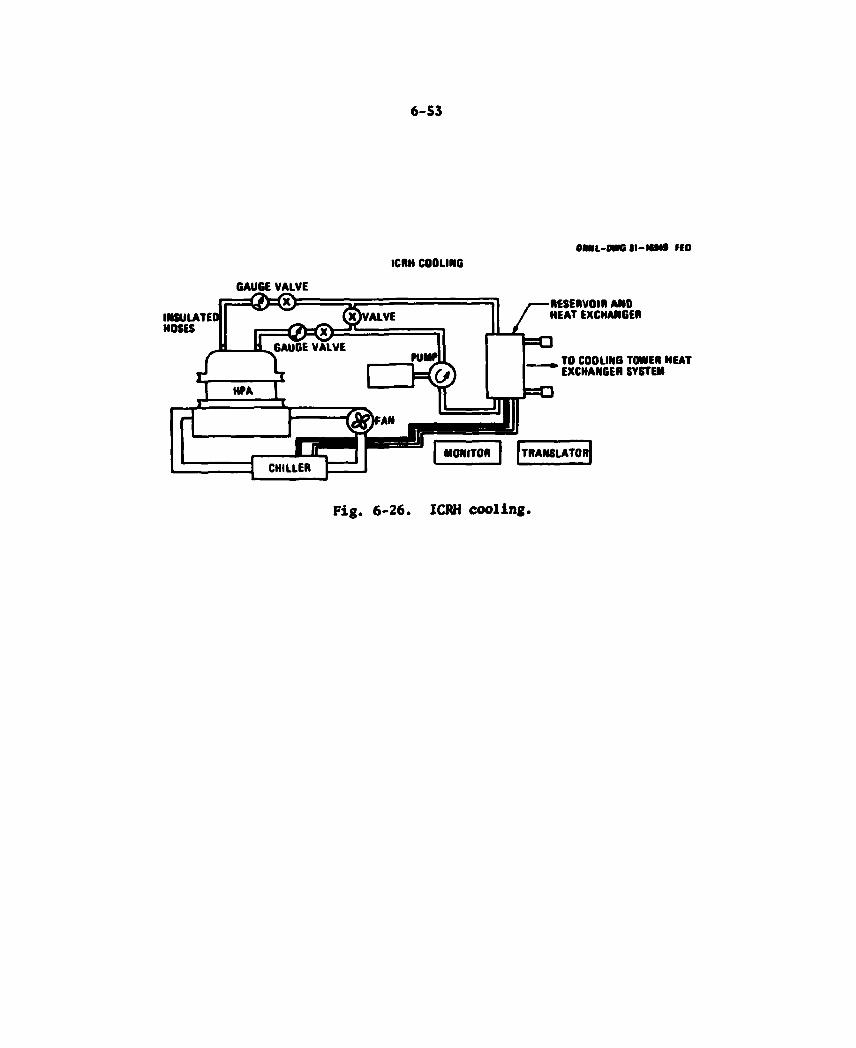
6 -53
ICRH COOLING
INSULATED HOSES
GAUGE VALVE
OMl-OHNS II-MM9 HO
RESERVOIR AND HEAT EXCHANGER
TO COOLING TOWER HEAT EXCHANGER SYSTEM
F i g . 6 - 2 6 . ICRH coo l ing .
6-54
6.2.4 RF (Baseline) Design Performance
Power levels and efficiencies
Figure 6-27 summarizes the power levels and efficiencies of the system. It assumes a 50-MW power level into a matched load. The trans-mission line losses are delineated in the next subsection entitled, "Loss budget." Plate efficiency is specified by the manufacturer for typical operating conditions. The IPA efficiency estimate does not include an allowance for amplitude/drive control attenuation (i.e., operating the IPA at high power and attenuating it to get to the proper drive level). This can be circumvented by proper design. Using the modulator as a switch and for microvoltage control makes the high modulator efficiency possible. About 1% of the tube output power is consumed by the screen grid. Finally, the transformer rectifier efficiency is an achievable performance for current designs.
Loss budget
Table 6-7 gives the loss allocation for the transmission system described above. Where not delineated, these losses include all effects (i.e., ohmic, phase and amplifier and VSWR).
Power handling
A 9-3/6-in. line is rated 6-MW peak and 0.4 MW at 100 MHz average at one atmosphere ury air. Using SF6 at 3 to 4 atmospheres the peak rating is increased 4 or 5 to 1. To increase the average power handling the line must be cooled. Two approaches have been considered: (1) flowing Freon between the center and on the conductors and (2) flowing water in the center conductor. Assuming a 300-ft coax run and a line loss of 0.05 dB/100 ft, yields a total loss of 0.15 dB. The associated power loss is 5.43 x 10^ W. For a 40°C temperature rise, the mass flow rate M of water required to remove this power loss is
(
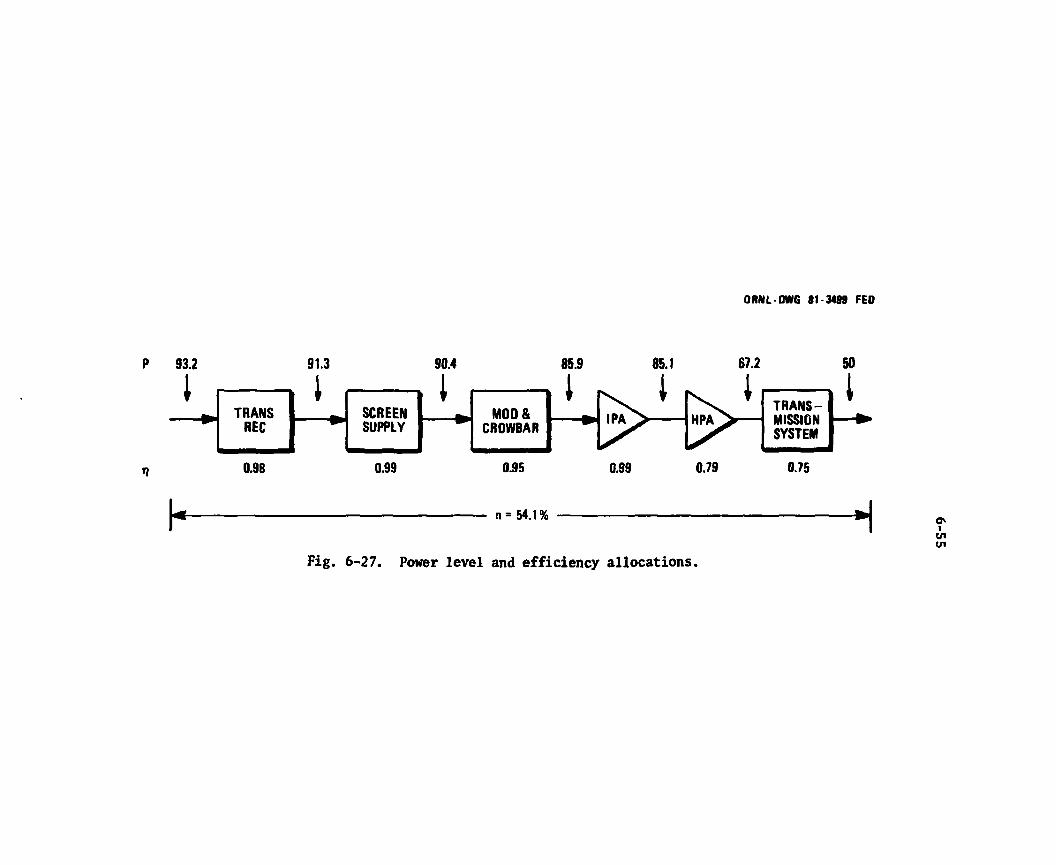
ORNL-OWG 81-3499 FED
85.1
I 67.2
I 50
J P ^ H P ^ >
0.98 0.99 0.95
n = 54.1%
0.99 0.79 0.75
H Fig. 6-27. Power level and efficiency allocations.
on i U1 i n
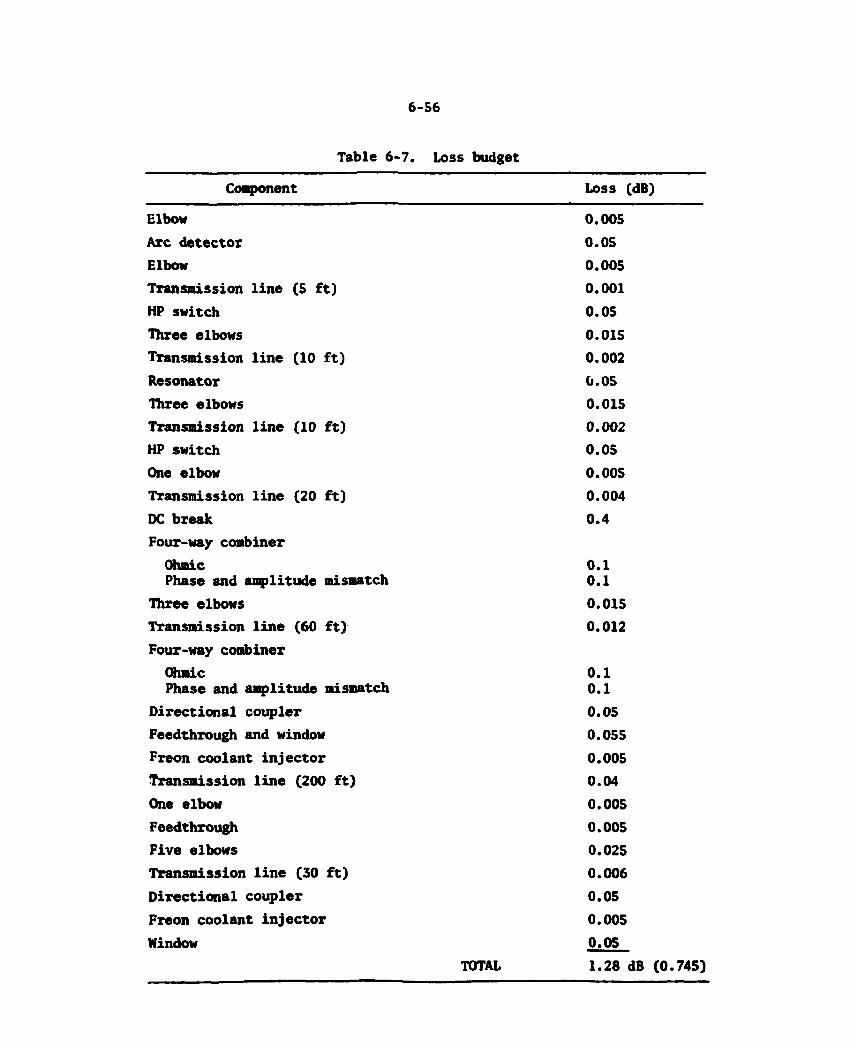
6 - 5 6
Table 6-7. Loss budget
Component Loss (dB)
Elbow 0.005 Arc detectox 0.05 Elbow 0.005 Transmission l ine (5 f t ) 0.001 HP switch 0.05 Three elbows 0.015 Transmission l ine (10 f t ) 0.002 Resonator 0.05 Three elbows 0.015 Transmission l ine (10 f t ) 0.002 HP switch 0.05 One elbow 0.005 Transmission l ine (20 f t ) 0.004 DC break 0.4 Four-way combiner
Ohmic Phase and amplitude mismatch
0 .1 0 .1
Three elbows 0.015 Transmission l ine (60 f t ) 0.012 Four-way combiner
Ohmic Phase and amplitude mismatch
0 .1 0 .1
Directional coupler 0.05 Feedthrough and window 0.055 Freon coolant in jector 0.005 Transmission l ine (200 f t ) 0.04 One elbow 0.005 Feedthrough 0.005 Five elbows 0.025 Transmission l ine (30 f t ) 0.006 Direct ional coupler 0.05 Freon coolant in jector 0.005 Window 0.05
TOTAL 1.28 dB (0.745)
6 - 5 7
P(W) = 5.43 X 1 0 ,5 = 4.2 x At 4.2 x 40 =3.23 kg/s »
P " S x 0.4536 = 27.2 kg/cu. ft cu • rx
• 3.23 kg/s " 27.2 kg/cu.ft
x 6 0 s s ? j c u f t / m i n
^ 50 gal/min.
The pressure drop through a 2-in. cooling tube is about 1/2 atmosphere, a safe design.
The Freon system parameters are summarized in Table 6-8. The low inlet temperature is required to maintain the Freon below the boiling temperature for the approximate 3 atmosphere pressure level. The mass flow rate is given by
P
where Q is the heat loss in watts (0.5 x 10⁶), C is specific heat in 3
joules/kg — K° (10 ), and At is inlet to outlet temperature differential — 5°. The velocity is given by
V = = 2.4 m/s PA
3 2 - 2 where p is the density in kg/m (1300), A is the area in m (3.2 x io ). The pressure drop, AP, is given by
- 2
2
AP - • 10 x + ^inlet-outletj ^ T = 9' 2 > s i
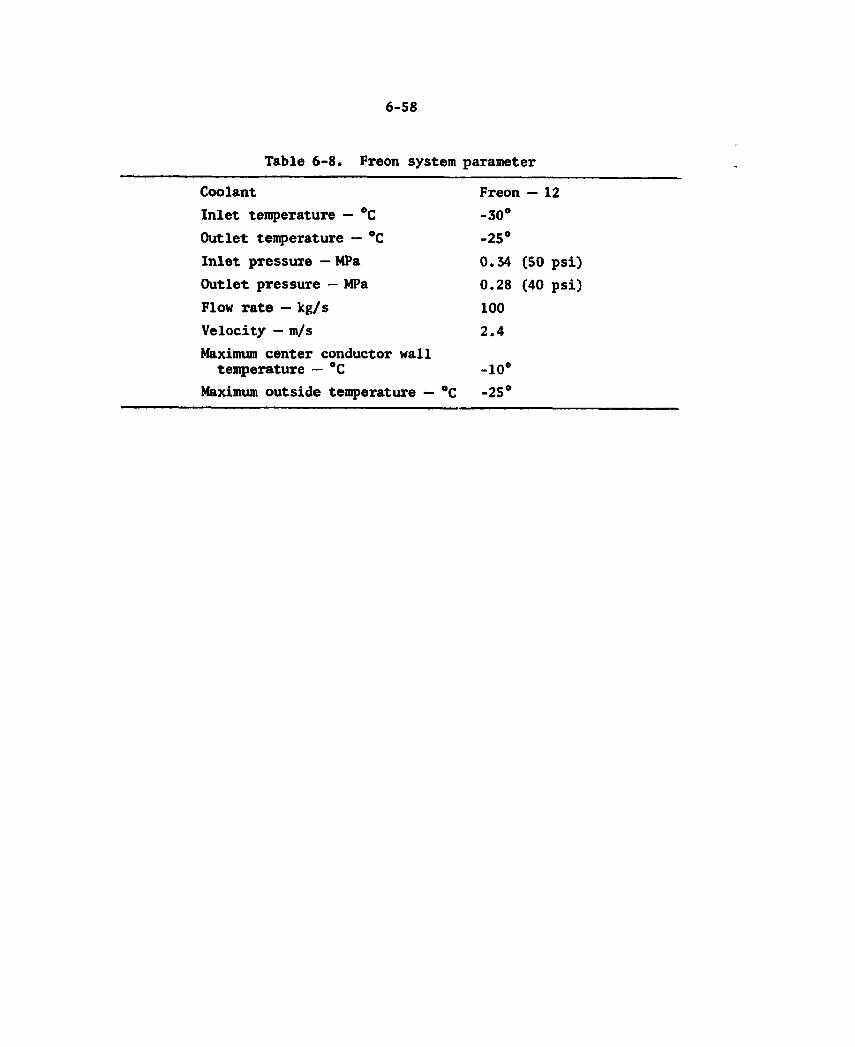
6 - 5 8
Table 6-8. Freon system parameter
Coolant Freon — 12 Inlet temperature — °C -30° Outlet temperature — °C -25° Inlet pressure — MPa 0.34 (50 psi) Outlet pressure — MPa 0.28 (40 psi) Flow rate — kg/s 100 Velocity — m/s 2.4 Maximum center conductor wall
temperature — °C -10° Maximum outside temperature — °C -25°
6-59
where f is the friction coefficient, 0.015, for R > 3 * 105; ©
Kelbow resistance coefficient for the elbow 30 x ft = 0.45; is effective diameter in meters (0.25); and
Kinlet-outlet resistance coefficient for the inlet and outlet = 1.5.
L is the length in meters (100); Kelbow resistance coeffic D is effective diameter in meters (0.25); and
^inlet-outlet 1S The inlet pressure is
Pinlet " PSAT « T + AP = 5 0 Psi
where Pg^j @ j is a tabulated quantity;
T = T. + At..., + At. . ^ + 5° margin l film inlet-outlet 6
= S^r— + t, = 51°C film hiAi bulk
T. = -30°C l
At = t V inlet-outlet 3 14'
If the two cooling approaches (water and Freon) were combined, the heat loss Q would be shared by the two systems. The Freon tempera-ture could therefore be made higher at the same pressure. However, the temperature and hence, the pressure, would have to increase to be compatible with the water coolant (i.e., above freezing).
Launcher power density 3 4 2 The average power density of the launcher is 13 * 10 kW/(0.6 x 10 cm )
2 or 2.2 kW/cm . Because most of the power is in the gap area between the ridge and the top of the guide, the peak power density is estimated to
t 3 2 be 13 x io divided by gap * ridge width or 1.11 x 10 cm which makes 2 the peak power density 11.7 kW/cm .
6-60
Power supply and modulator performance
Based on the assumption of 4 transformer rectifiers (1 per 16-MW module, or launcher) and 64 modulators the sizing is as follows. From the power level calculation, the total dc power is about 90 MW or 22.5 MW per power supply. Adding some safety margin, 30 MW input power per transformer is a reasonable sizing. The plate supply voltage is 21 kV so the current from each supply is 1.5 kA. The regulation should be about 5%. Each modulator has to handle ^65 A with a maximum voltage drop of ^2 kV. The macrovoltage control is done with thyristors in the primary.
Cooling
Each EIMAC tetrode takes a minimum of 150 gpm to cool the anode at 270 kW dissipation. The manufacturer gives the approximate jacket pressure drop as ^22 psi. For 64 tubes then the main supply capacity is a minimum of 9600 gpm. There are additional cooling requirements for the filaments and screen but these are small, <10 gpm per tube at a total of 640 gpm more. Inlet and outlet temperatures are 50°C and 70°C at less than 100 psi pressure. This must be high purity water (resistivity > 106 ohms-cm). Added to this cooling load, is that of the transmission system, 50 gpm times 4 systems or 200 gpm.
The base area of the tube requires 50 cfm at 50°C air cooling. This can be accomplished with the cabinet fan.
Nuclear shielding
Figure 6-28 shows a possible launcher shield configuration. The material choice is the same as the bulk shield (SS and ^0). Thicknesses range from 40 cm to 90 cm. Recently, the launcher design has been modi-fied to achieve a more compact configuration as shown in Fig. 6-29. Note that the ridge portion of the launcher "shades" the window from direct neutron streaming. As indicated in Fig. 6-29, the flux at the window is 160/1 lower than at the wall. Assuming ceramic material and a
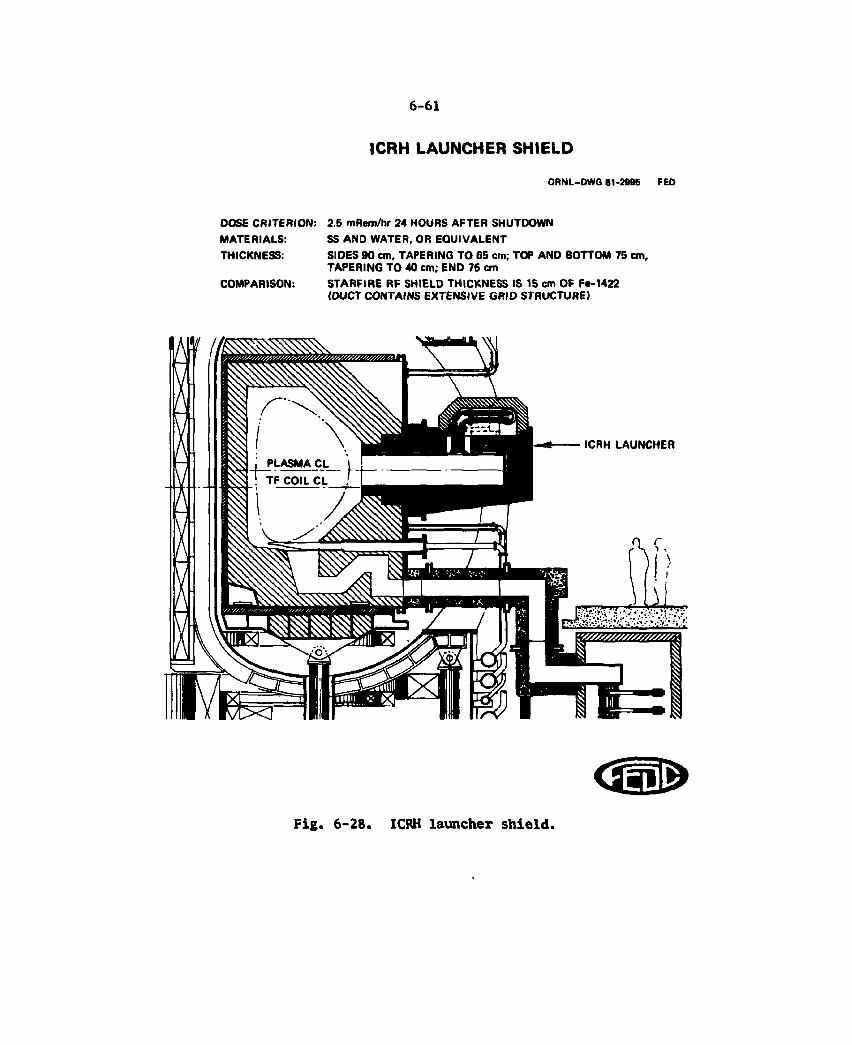
6-61
ICRH LAUNCHER SHIELD
ORNL-DWG 81-29BB FED
DOSE CRITERION: 2.5 mRem/hr 24 HOURS AFTER SHUTDOWN MATERIALS: SS AND WATER, OR EQUIVALENT THICKNESS: SIDES 90 cm. TAPERING TO 65 cm; TOP AND BOTTOM 75 cm,
TAPERING TO 40 cm; END 75 cm COMPARISON: STARFIRE RF SHIELD THICKNESS IS IS cm OF Fe-1422
(DUCT CONTAINS EXTENSIVE GRID STRUCTURE)
ICRH LAUNCHER
Fig. 6-28. ICRH launcher shield.
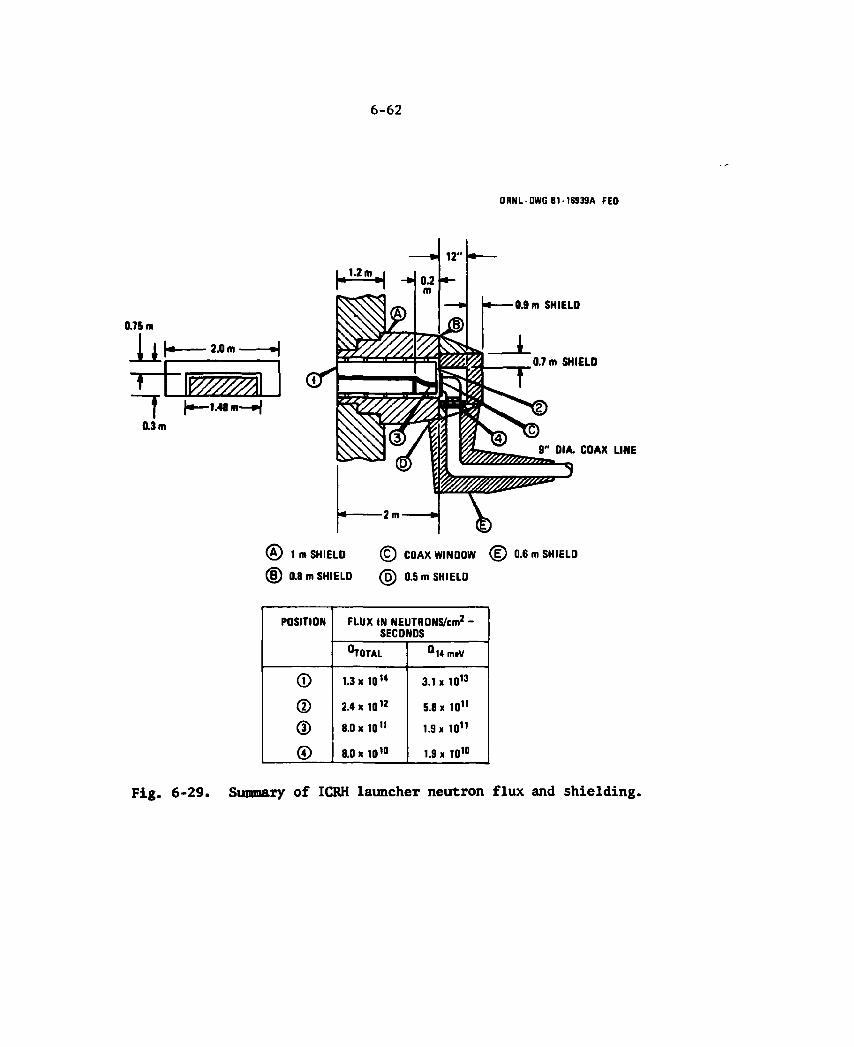
6-62
ORNL-DWG 81 • 16939A FED
(§) 0.8 m SHIELO (5) 0.5 m SHIELD
POSITION FLUX IN NEUTRONS/cm2 -SECONDS
POSITION
° T 0 T A L °14 nnV
0 1.3* 10'* 3.1 * 10"
® 2.4* 1012 5.8 x 10" CD 8.0* 10" 1.9* 1011
© 8.0* 1010 1.9 * 10'°
Fig. 6-29. Summary of ICRH launcher neutron flux and shielding.
6-63
damage threshold of 10 rads, the window should last ^3 * 10 shots at 9 2
8 T (assumes 1 rad equals 3 x 10 n/cm — see Table 5-24). The shield thickness requirements are still significant (^70 to 90 cm). The inte-grated shield design is shown in Figs. 6-11 and 6-12. The shielding thickness around the transmission line was determined as follows. First, ^ out * t*ie flux transported through a narrow passage was estimated by
<j> = 4>. (R/Z)2 rout in 1
where
R is the radius of the passage, Z is the length of the passage, and <J> n is the input flux. Second, each right angle bend was assumed to reduce the flux 10:1. Finally, it was assumed that the flux in the
6 2 reactor hall should be less than 10 n/cm -s and ir. the cable tray area 2 2 below the reactor floor less than 10 n/cm -s.
Multipactor breakdown
In the vicinity of the launcher's back panel, at the coax trans-mission line interface, the magnetic field is ^8 kG in the theta direc-tion, 'v-O.S kG in the Z direction and ^2 kG in the radial direction. These values neglect the time varying OH field and are strong functions of radius, height (Z) and toroidal angle (6). The multipactor breakdown is a function of the magnetic field (magnitude and direction), electric field (magnitude and direction), frequency, interconductor spacing, con-ductor material (secondary emission factor) and pressure in the trans-mission line. At full power, each 9-in. coax line will have an electric field of about 4 kV/cm. At 100 MHz this is well above the multipactor region assuming low pressure and no magnetic field. As noted above the field is strong near the launcher. It is also likely that the SF6 gas in the transmission line will be under high pressure (50 to 100 psi) and temperature to satisfy cooling requirements. With so many variables it is clear that this investigation should be carried out in detail, once more of the configuration parameters are firm. A computer code should
6-64
be developed and some testing done before definitive statements can be made about multipactor breakdown.
Launcher matching
Based on extrapolation (from low to high density) of some impedance match data from PPPL,* the plasma impedance, Z , versus density, n , p e (for the baseline launcher W/H ratio) is approximated by
Z = 161 n~ 0 , 9 1 ohms (W/H = 6.7), P ®
which yields an impedance match requirement of about 20 ft at a density of 13 -3
10 cm . The baseline launcher has a Zm impedance of M 9 ft. At 54 MHz the launcher has an impedance of ^27 ft for which the reflection coefficient is M).2. Early in the bulk heating cycle the match will be better according to the above equation but rapidly deteriorates at 13 higher densities (5 * 10 ) where the impedance is predicted to be ^5 ft. This estimate is very crude and preliminary. Refinement awaits a better model and/or test data at which time the selection of launcher parameters should be reviewed.
6.2.5 Options and Trades
RF chosen over NBI
While most of the heating experience on tokamaks has been with NBI, it is recognized that NBI availability could be a problem in FED. This projected difficulty stems fTom the fact that a large fraction of the NBI components interface directly with the tokamak. Failure rates could be high due to radiation damage of components, and remote maintenance times are generally long compared to hands-on repair times. By comparison, the rf system has a simple interface with only passive components exposed to the radiation. On the other hand the experimental data base is much more extensive with NBI heating than with rf heating. However,
6-65
recent experiments on the PLT and TFR using ICRH for bulk heating indicate that the heating efficiency of 1CRH is comparable to that of
13 NBI — at least at modest temperature and density (<2.5 keV and ^2 * 10 units). Further, the rf technology is readily available except for reactor relevant launchers and some very high power components. On the basis of the above considerations it was decided that ICRH would be the baseline for FED and NBI the alternate.
ICRH preferred
Both LHRH and ECRH were considered for bulk heating. The technology is not currently available to configure a practical ECRH design for bulk heating. Lower hybrid resonant heating lacks experimental evidence, but the technology is available. From an engineering standpoint, LHRH is preferred because the launcher can be more compact, but proof of the heating performance at modest densities and temperatures is necessary.
Launchers
Two general classes of launchers were considered for FED, loops and waveguides. Loops were taken as a backup option even though all the experience to date was with such designs. The rationale for this is that loops generally are placed near the plasma (in the scrapeoff region) to effect a good match. This position makes the loop act as a limiter and its viability even using graphite and special materials is questionable. Waveguide launchers are mounted flush to the wall, and the scrapeoff region helps the launcher impedance match. Another issue is the relatively low power handling capability of loops; present devices are designed for M MW maximum. A single waveguide should be capable of handling 10's of MW. Moreover, the interface area consumed by a loop array handling 50 MW may be no less than that required for the four waveguide launchers. A loop configuration operating at 50 MW has not been developed and tested on a machine the size of FED; so there is no direct experience advantage for loops. The impedance match for loops is in the order of a few ohms while that of a loaded waveguide is in the ten's of otuu. Hie

6-66
plasma impedance data presently available indicates impedances in the 5-20 ohms range depending on the density profile and its magnitude. Earlier plasma impedance estimates indicated an impedance of t<300 ohms. The models used in both cases are in the early stages of development. Both launcher approaches should be investigated and developed in a tech-nology program, but for the baseline design waveguide is the choice.
There has been discussion/consideration of four types of waveguide launchers, they are simple/standard, ridge-loaded, reentrant, and dielectric-loaded waveguides. Dielectric loading was discarded because of the materials problem of the dielectric in the radiation environment. The reentrant approach5 offers more compactness than the ridge-loaded waveguide for a specified cutoff wavelength. Its impedance is slightly lower. However, the block shape of the ridge offers more nuclear shielding than the "T" section of the reentrant type. Comparing the ridge-loaded approach to that of a simple waveguide, shows that the simple waveguide offers a poorer impedance match, requires wider TF coil windows, but offers higher power handling capability.
Two variations of the preferred ridge-loaded guide were investigated; they were the single ridge and the double ridge. A computer code was developed and the performance of the two compared. The double-ridge approach offered no particular advantage in compensation for its added construction complexity.
Figure 6-30 summarizes a ridge approach that operates at either 54 or 36 MHz with only a 25% change in impedance. This launcher design assumed that the coax to waveguide transition was a broadwall probe and its power handling and bandwidth capability would be acceptable. With this probe approach large electric fields exist between the probe and the ridge and the power handling is limited. Further, the probe is positioned exactly one-half wavelength from the end of the launcher, and, hence, the transition is only truely matched at this one wavelength. This limits the bandwidth capability. The selected design uses a current loop formed by strapping the coax center conductor (which enters at the back of the launcher) to the back of the ridge. The strap is tapered to effect an impedance match and the holdoff voltage is set by
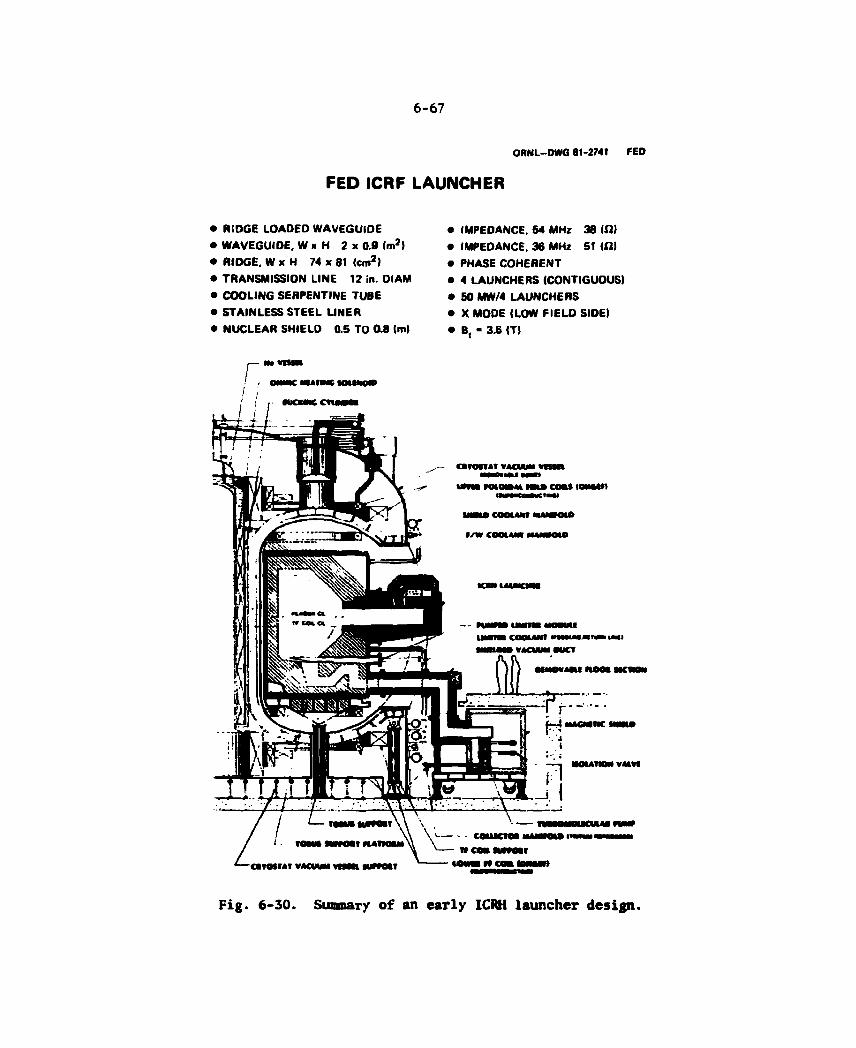
6-67
ORNL—DWG 81-2741 FED
FED ICRF LAUNCHER
• RIDGE LOADED WAVEGUIDE • WAVEGUIDE. W K H 2 * 0.9 (m2! • RIDGE. W x H 74 x 81 (cm2) • TRANSMISSION LINE 12 in. DIAM • COOLING SERPENTINE TUBE • STAINLESS STEEL LINER • NUCLEAR SHIELD 0.5 TO 0.8 (m)
• IMPEDANCE, 54 MHz 38 (ft) • IMPEDANCE, 36 MHz 51 (ftl • PHASE COHERENT • 4 LAUNCHERS (CONTIGUOUS) • 50 MW/4 LAUNCHERS • X MODE (LOW FIELD SIDE) • B, - 3.6 (T)
Fig. 6-30. Summary of an early ICRH launcher design.
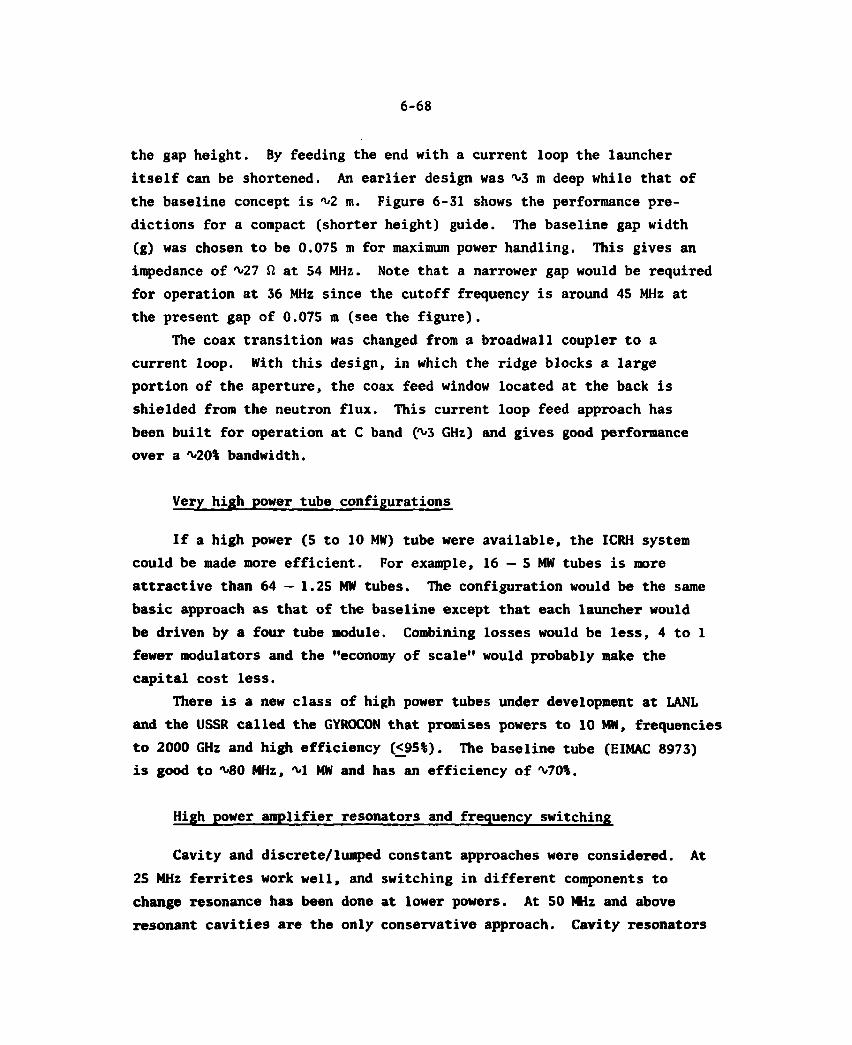
6-68
the gap height. By feeding the end with a current loop the launcher itself can be shortened. An earlier design was ^3 m deep while that of the baseline concept is m. Figure 6-31 shows the performance pre-dictions for a compact (shorter height) guide. The baseline gap width (g) was chosen to be 0.075 m for maximum power handling. This gives an impedance of 27 ft at 54 MHz. Note that a narrower gap would be required for operation at 36 MHz since the cutoff frequency is around 45 MHz at the present gap of 0.075 m (see the figure).
The coax transition was changed from a broadwall coupler to a current loop. Kith this design, in which the ridge blocks a large portion of the aperture, the coax feed window located at the back is shielded from the neutron flux. This current loop feed approach has been built for operation at C band (^3 GHz) and gives good performance over a 20% bandwidth.
Very high power tube configurations
If a high power (5 to 10 MW) tube were available, the ICRH system could be made more efficient. For example, 16 — 5 MW tubes is more attractive than 64 — 1.25 MW tubes. The configuration would be the same basic approach as that of the baseline except that each launcher would be driven by a four tube module. Combining losses would be less, 4 to 1 fewer modulators and the "economy of scale" would probably make the capital cost less.
There is a new class of high power tubes under development at LANL and the USSR called the GYROCON that promises powers to 10 MW, frequencies to 2000 GHz and high efficiency (£95%). The baseline tube (EIMAC 8973) is good to ^80 MHz, M MW and has an efficiency of ^70%.
High power amplifier resonators and frequency switching
Cavity and discrete/lumped constant approaches were considered. At 25 MHz ferrites work well, and switching in different components to change resonance has been done at lower powers. At 50 MHz and above resonant cavities are the only conservative approach. Cavity resonators
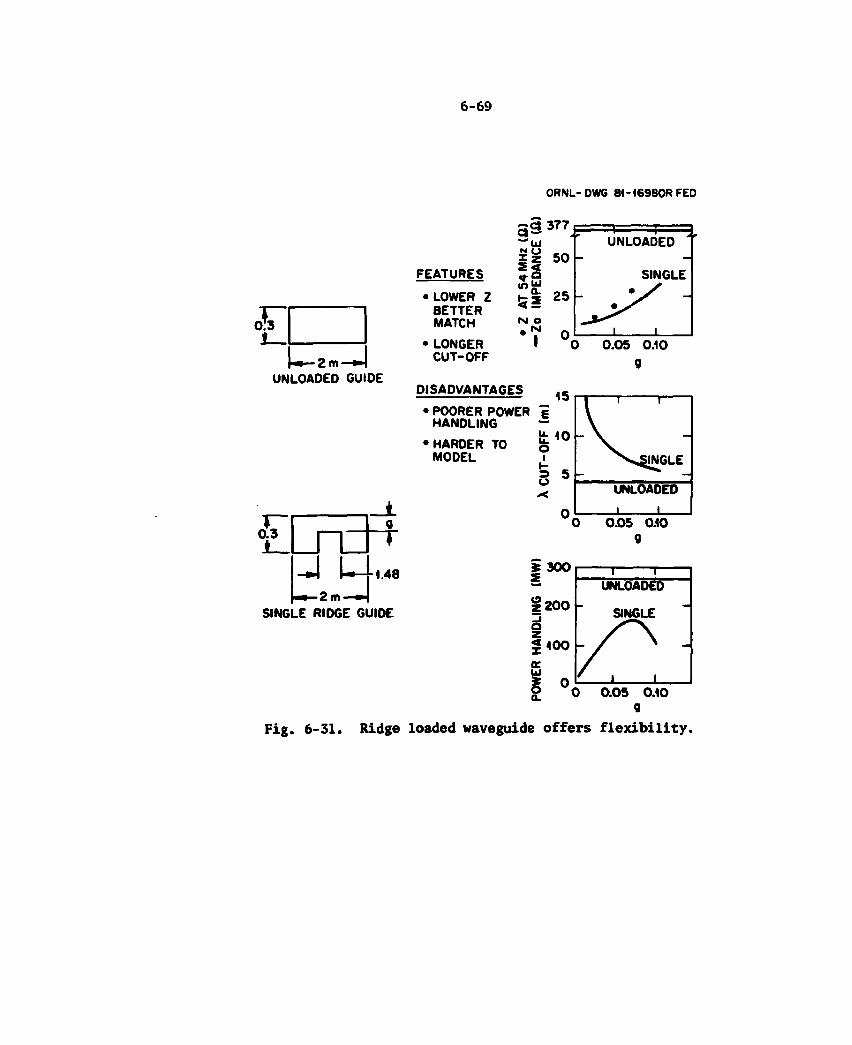
6-69
1 _
— 2 m — UNLOADED GUIDE
JT ±_ J u, i—2m —
SINGLE RIDGE GUIDE
FEATURES
• LOWER Z BETTER MATCH
• LONGER CUT-OFF
DISADVANTAGES
• POORER POWER i HANDLING —
HARDER TO MODEL
9 T
.48
Z 200 A < 400 c u £ 0
UNLOADED
SINGLE
0.05 0.10 g
Fig. 6-31. Ridge loaded waveguide offers flexibility.
6-70
have been used below 50 MHz but their size becomes prohibitive especially if more than one frequency is needed. At one megawatt and below, changing cavity dimensions is a practical approach to tuning. Considering these points, the baseline design uses ferrite lumped constant resonators for 36 MHz and a tuneable cavity for 54 MHz.
For a two frequency system a rectangular cavity could be designed in which two different modes would give different resonance frequencies. This approach was discarded because of its development status. Figure 6-32 shows another approach which has the capability of changing frequency in a few microseconds. However, this approach requires additional (3) levels of combining to provide the resonator selection. It is therefore less efficient and more expensive. For the baseline, the frequency switching time is longer (hundreds of milliseconds) but acceptable. The switching in of different resonators was the approach taken because of its efficiency and low cost.
One other approach considered was a wideband distributed amplifier. This offers much flexibility in frequency changing but very low efficiency (M5%). This would translate to a high life cycle because the rf heating systems prime power and cooling requirements would increase threefold. Based on present requirements, this technique did not appear economically justifiable.
6.2.6 Future Work
F-"om the design standpoint, the major effort should be in the launcher design. The power handling of the guide and transmission line need further investigation. In parallel, there should be a technology development effort for very high average power (5-20 MW) components. Multipactor breakdown for the FED environment (i.e., E-field, B-fields, frequency, etc.) should be thoroughly investigated. Launcher matching data is needed for the FED plasma conditions. A parametric analysis of neutron flux loading on the launcher window vs ridge size should be performed. Configurations for current drive will be needed when the requirements are understood.
6-71
ORNL-DWG 81-16979 FED
N O . t b o W J ^ (b)
> > > >
S4MHz 36 MHz
L d 54 MHz
36 MHz
(c)
2 = 7
X
- O 54 @ 4 MW
- O 36 9 4 MW
Fig. 6-32. Dual frequency high-power amplifier combining features switching time in 10 us. (a) module combinrr, (b) launcher, (c) intramodule combiner/selector.
6-72
A detailed cost and performance model should be developed. This should be done at the major component level (i.e., amplifier combiner, modulator/crowbar, etc.).
Finally, if experimental data from PLT on LHRH heating is favorable, the choice of rf type should be revisited.
6.2.7 NBI Alternate
The alternate approach for the bulk heating function is neutral beam injection (NBI). This approach has the advantages of significant experimental evidence and high-confidence performance prediction models. However, much of the required technology has not been developed at the performance levels needed for the FED. Technology development is needed to achieve the FED requirements of pulse length, beam energy, species mix, and direct recovery. In addition to these technology developments, the issues of radiation hardness and availability (remote maintenance) are also of concern.
The beam lines are sized to match the rf-baseline 4 sector inter-face. The NBI interface space requirements are considerably larger than those of the rf baseline configuration, but can be accommodated by the 10 TF coil design. There are no major problems with maintaining NBI as a viable option provided the necessary R&D work on components and remote maintenance techniques is accomplished in a timely manner. See Volume V of the FY 81 documentation entitled, "Technology R§D Requirements for FED Construction." 1
One of the objectives of the FED plasma heating effort was to maintain the viability of NBI option. It is noted that in the parallel INTOR Conceptual Design Phase I NBI was the baseline approach. In November of 1980, the 1MB formed a NBI Committee to provide strategic planning input and NB development program interface for FEDC.6
Beyond these programmatic developments there were technical issues. The FED was specified to be a driven machine (Q 5) and the long-pulse concerns expressed in INTOR were magnified for FED. Further, consideration was given to a current drive function. Here the key tech-nology issue is that of higher beam energy (MOO keV) requirements.
6-73
6.2.8 NBI Requirements
There were two sets of requirements that were used in the study of the NBI system. The first set was generated for use in the TMB NBI task team study. These are listed in Table 6-9. Subsequent to this study, it was decided to limit the requirements to beam energies capable of performing only the bulk heating and power drive functions. These requirements are summarized in Table 6-10. It will be noted that the main differences between the two tables are the functional requirements, injection angle, and elimination of the current drive performance require-ments .
During bulk heating the temperature and density are raised from 1 9 f 1 i 9
M. keV and * 10 cm to the operating values of ^10 keV and ^10 cm" . Power drive refers to maintenance of the operating point by continuous injection of neutral particles.
Under performance, "energy" refers to the full energy component of the injected power. The power is the total of all energy species (i.e., full, half, and third) injected into the plasma. The injection angle of the beam is the angle formed by the beam with a radial line referenced to the plasma edge or the magnetic axis. On FED, the reference is the plasma edge. The species mix is specied at the accelerator stack output prior to neutralization. Because up to 50 MW is required for bulk heating but only 36 MW is needed for power drive (8-T operation), the pulse times for each function are called out separately. This requirement suggests that the system allows for shutdown of some sources during the burn.
In addition to these parameters and requirements there are constraints and guidelines, the more important of which aTe listed in Table 6-11. Under the interface constraints, the number of available sectors for bulk heating is limited to 4 (including redundancy) — this is compatible with the rf baseline. The required thickness of shielding impacts the area consumed by the interface of the drift duct with the vacuum vessel and also the reactor hall floor print. Maximum power density of less
2 than 2 or 3 kW/cm is a design guideline. Geometry and structural require-ments limit the available window size and hence the maximum injection
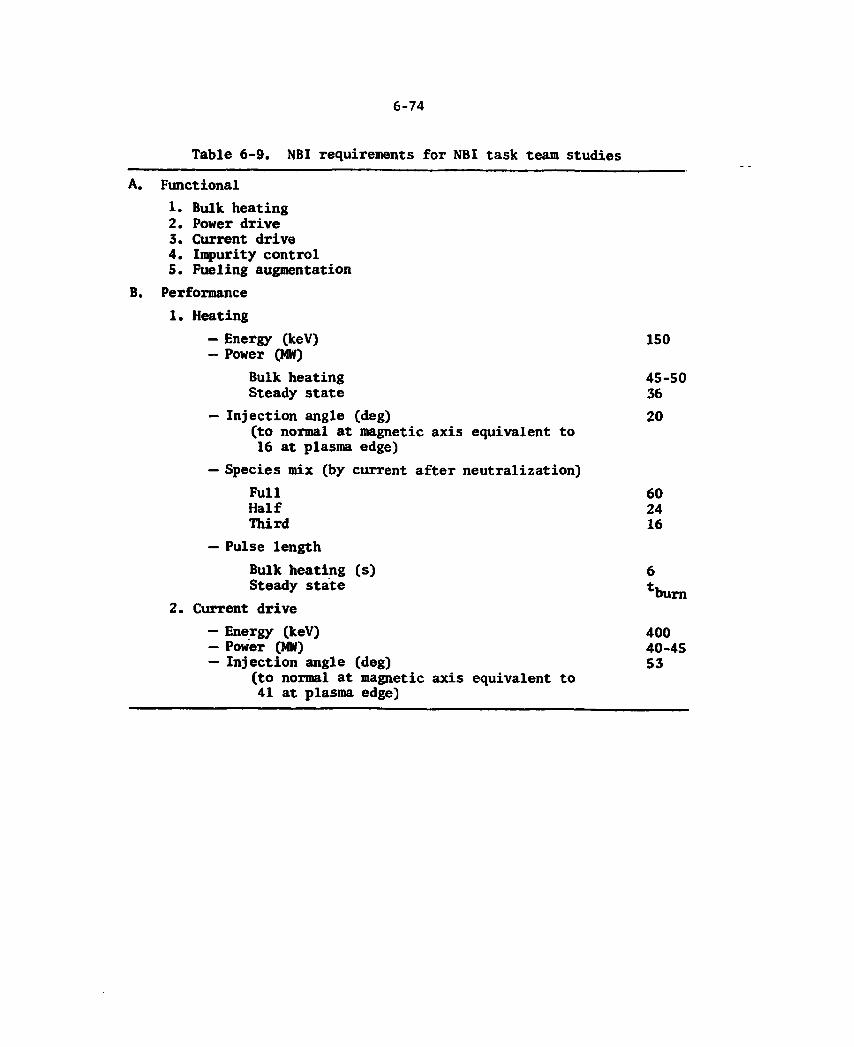
6-74
Table 6-9. NBI requirements for NBI task team studies
A. Functional 1. Bulk heating 2. Power drive 3. Current drive 4. Impurity control 5. Fueling augmentation
B. Performance 1. Heating
— Energy (keV) 150 — Power (MW)
Bulk heating 45-50 Steady state 36
— Injection angle (deg) 20 (to normal at magnetic axis equivalent to 16 at plasma edge)
— Species mix (by current after neutralization) Full 60 Half 24 Third 16
— Pulse length Bulk heating (s) 6 Steady state tburn
2. Current drive — Energy (keV) 400 — Power (MW) 40-45 — Injection angle (deg) 53
(to normal at magnetic axis equivalent to 41 at plasma edge)
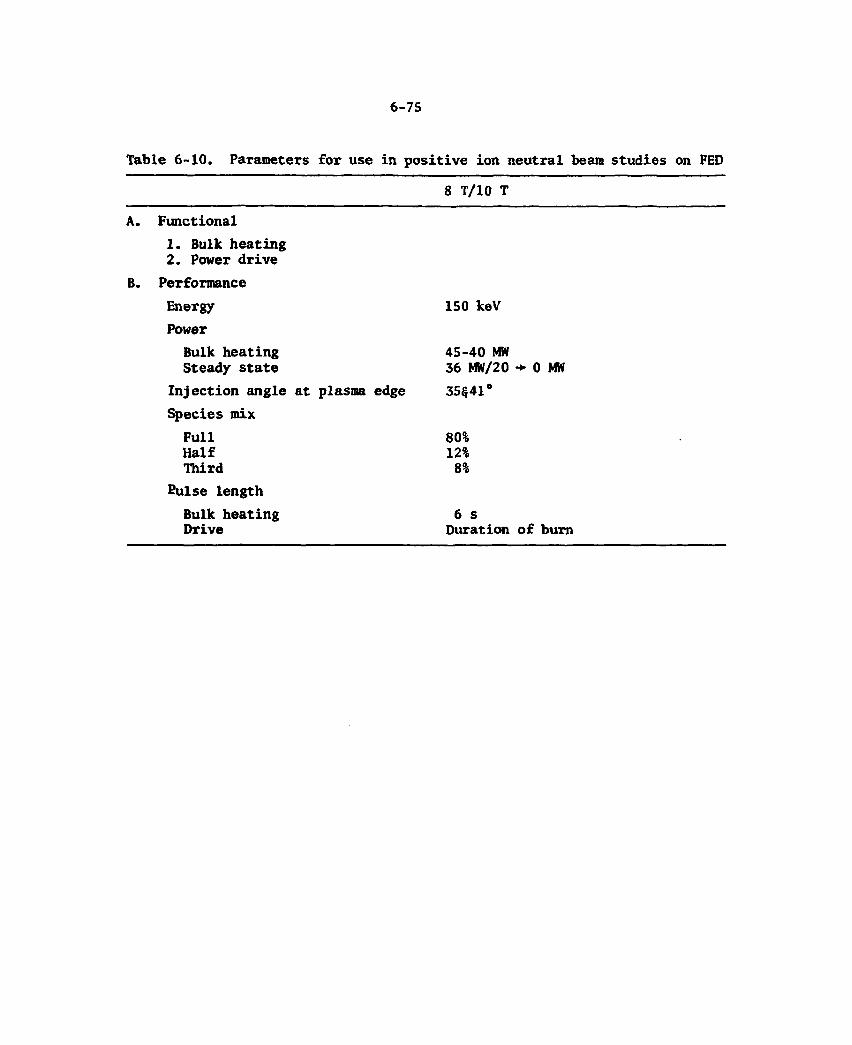
6-75
Table 6-10. Parameters for use in positive ion neutral beam studies on FED
8 T/10 T
A. Functional 1. Bulk heating 2. Power drive
B. Performance Energy 150 keV Power
Bulk heating 45-40 MW Steady state 36 MW/20 •*• 0 MW
Injection angle at plasma edge 35<J41° Species mix
Full Half Third
Eulse length Bulk heating 6 s Drive Duration of b u m
80% 12%
8%
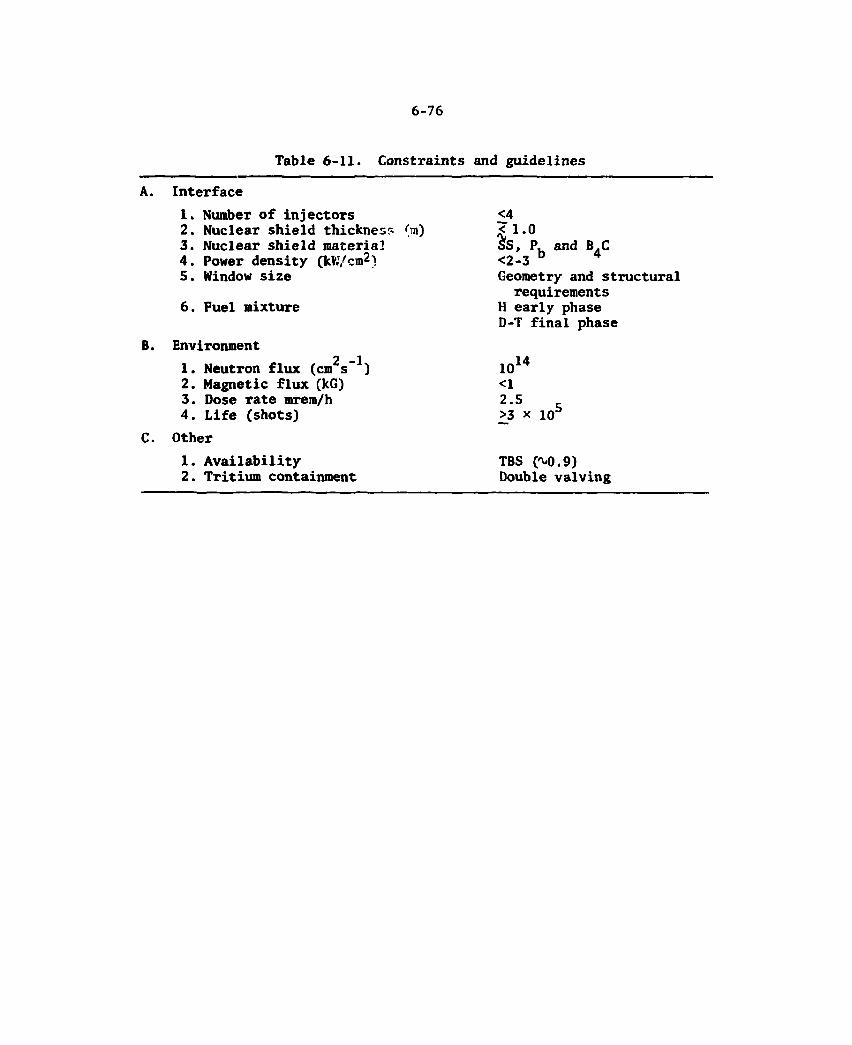
6-76
Table 6-11. Constraints and guidelines
A. Interface 1. Number of injectors 2. Nuclear shield thickness On) 3. Nuclear shield material 4. Power density (kK/cm2) 5. Window size
6. Fuel mixture
<4 £ 1.0 SS, P. and B.C <2-3 b 4
Geometry and structural requirements
H early phase D-T final phase
B. Environment 2 -1
1. Neutron flux (cm s ) 2. Magnetic flux (kG) 3. Dose rate mrem/h 4. Life (shots)
1014
<1 2.5 >3 x lob
C. Other 1. Availability 2. Tritium containment
TBS (M).9) Double valving
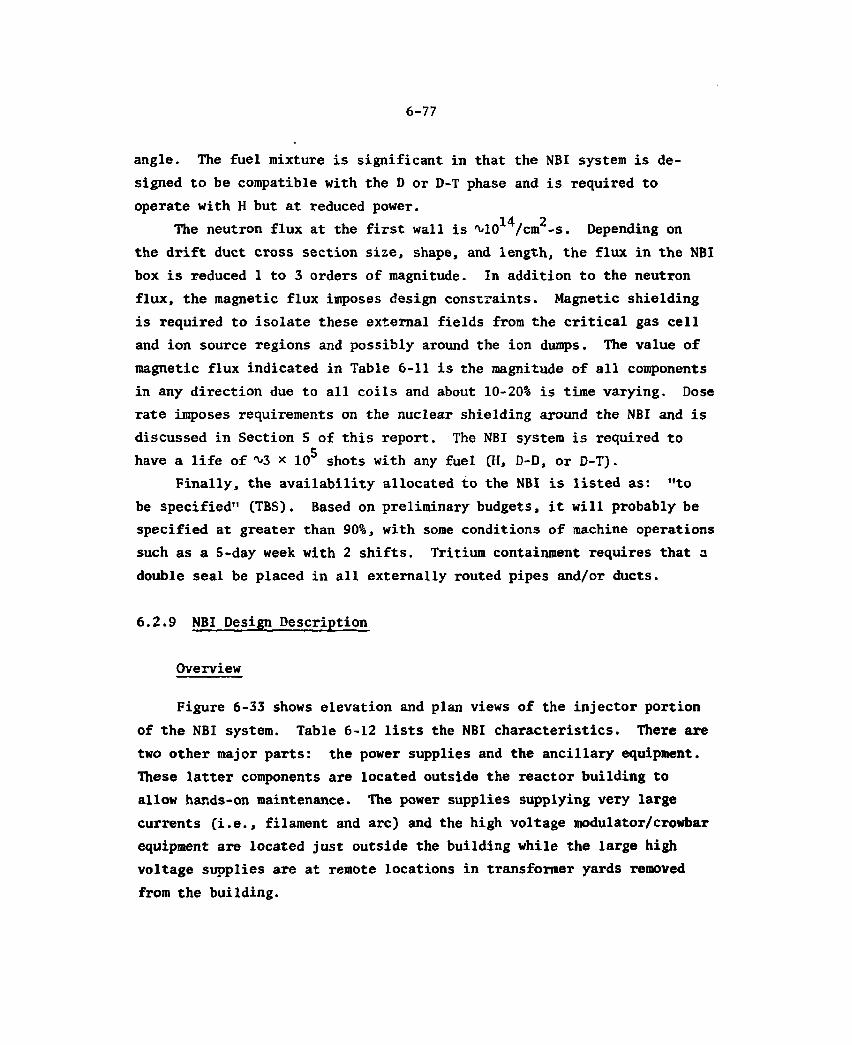
6-77
angle. The fuel mixture is significant in that the NBI system is de-signed to be compatible with the D or D-T phase and is required to operate with H but at reduced power.
14 2 The neutron flux at the first wall is 10 /cm -s. Depending on
the drift duct cross section size, shape, and length, the flux in the NBI box is reduced 1 to 3 orders of magnitude. In addition to the neutron flux, the magnetic flux imposes design constraints. Magnetic shielding is required to isolate these external fields from the critical gas cell and ion source regions and possibly around the ion dumps. The value of magnetic flux indicated in Table 6-11 is the magnitude of all components in any direction due to all coils and about 10-20% is time varying. Dose rate imposes requirements on the nuclear shielding around the NBI and is discussed in Section 5 of this report. The NBI system is required to have a life of 3 x io5 shots with any fuel CH, D-D, or D-T).
Finally, the availability allocated to the NBI is listed as: "to be specified" (TBS). Based on preliminary budgets, it will probably be specified at greater than 90%, with some conditions of machine operations such as a 5-day week with 2 shifts. Tritium containment requires that a double seal be placed in all externally routed pipes and/or ducts.
6.2.9 NBI Design Description
Overview
Figure 6-33 shows elevation and plan views of the injector portion of the NBI system. Table 6-12 lists the NBI characteristics. There are two other major parts: the power supplies and the ancillary equipment. These latter components are located outside the reactor building to allow hands-on maintenance. The power supplies supplying very large currents (i.e., filament and arc) and the high voltage modulator/crowbar equipment are located just outside the building while the large high voltage supplies are at remote locations in transformer yards removed from the building.
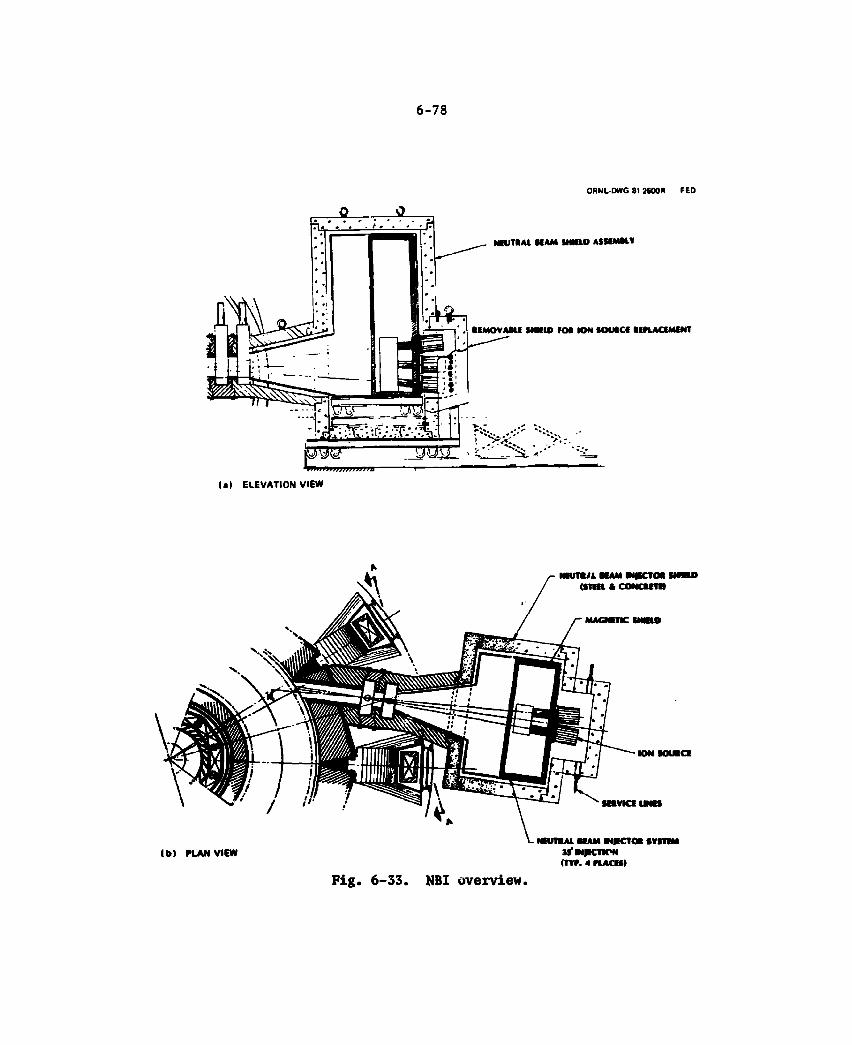
6-78
ORNL-DWG 81 2600R FED
NHJTt/1 NAM MIKTM <*THl * COMCUT1)
MAGMTK (MHO
MVICiUMS
NHItBAL MAM MffCTOt SVITiM tf M|KTtPN (TTP. 4 n A C H )
F i g . 6 - 3 3 . NBI overv iew.
6-79
Table 6-12. NBI characteristics
Source design A. Number ( to meet 50 MM) B. Size, H x W (cm2) C. Current (amp) D. Per injector E. Configuration F. Divergence (deg) G. Energy (keV) H. Pulse length (s)
Interface design A. Number of NBI
(1) operation (2) redundant
B. Drift duct (1) height (m) (2) w.ldth (m) (3) length (cm) (4) valves
C. Power density average (kW/cm"2) D. Injection
(1) angle (deg) (2) power per NBI (MW) (3) beam cross over
E. Efficiency (overall NBI) (1) full energy (2) all energies
Cryopumps A. Gas type B. Area
(1) drift region (m2) (2) gas cell region (m2)
C. Configuration
D. Refrigeration load (kW) E. Regeneration periodicity
Ion deposition A. Type
B. Capability Species mix
A. Ion fraction B. Power fraction
18 11 x 22 60 6 2 stacks of 3 <1.5 ISO 106
3 1
1.2 1.0 330 2 vacuum 1.4
35 and 41 16.7 Drift duct center
26 41
H or H isotopes
50 25 Differential LHe shielded by
LN_ chevrons 2 * Every 12 hours of operation
Direct recovery on full energy >0.6 efficiency
0.8, 0.12, 0.08 0.64, 0.20, 0.16
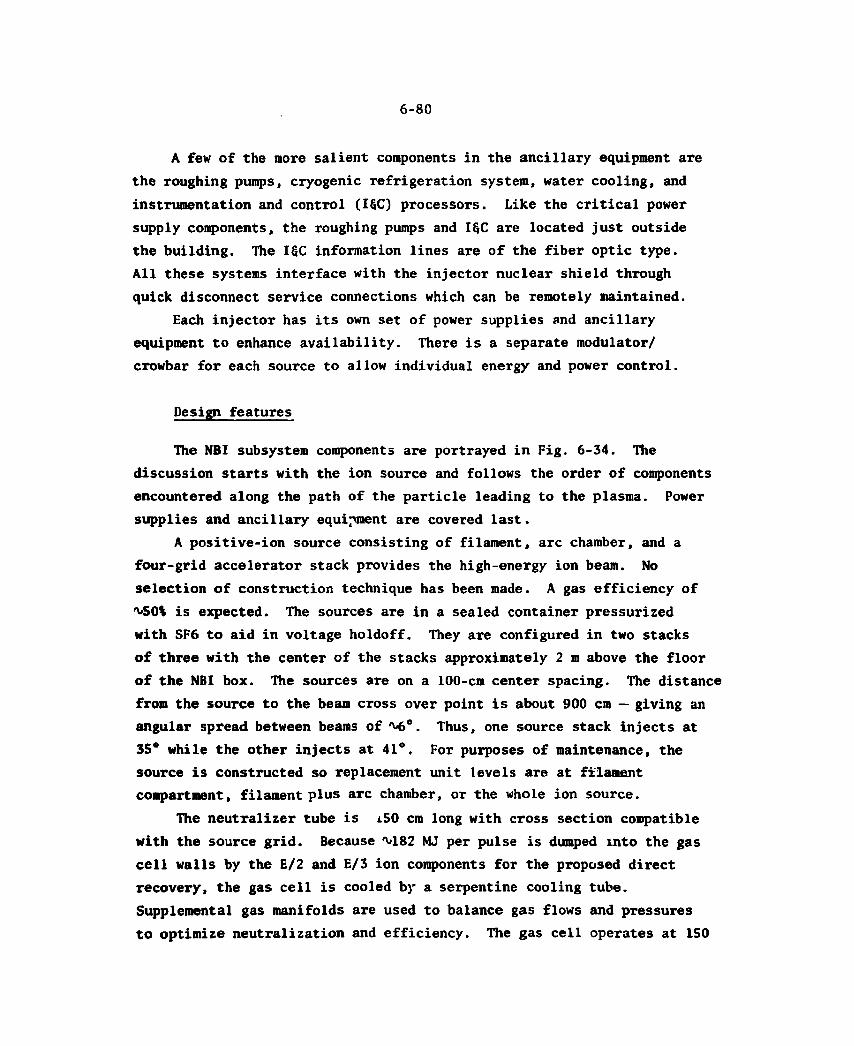
6-80
A few of the more salient components in the ancillary equipment are the roughing pumps, cryogenic refrigeration system, water cooling, and instrumentation and control (ISC) processors. Like the critical power supply components, the roughing pumps and I§C are located just outside the building. The ISC information lines are of the fiber optic type. All these systems interface with the injector nuclear shield through quick disconnect service connections which can be remotely maintained.
Each injector has its own set of power supplies and ancillary equipment to enhance availability. There is a separate modulator/ crowbar for each source to allow individual energy and power control.
Design features
The NBI subsystem components are portrayed in Fig. 6-34. The discussion starts with the ion source and follows the order of components encountered along the path of the particle leading to the plasma. Power supplies and ancillary equipment are covered last.
A positive-ion source consisting of filament, arc chamber, and a four-grid accelerator stack provides the high-energy ion beam. No selection of construction technique has been made. A gas efficiency of ^50% is expected. The sources are in a sealed container pressurized with SF6 to aid in voltage holdoff. They are configured in two stacks of three with the center of the stacks approximately 2 m above the floor of the NBI box. The sources are on a 100-cm center spacing. The distance from the source to the beam cross over point is about 900 cm — giving an angular spread between beams of 'v-6°. Thus, one source stack injects at 35° while the other injects at 41°. For purposes of maintenance, the source is constructed so replacement unit levels are at filament compartment, filament plus arc chamber, or the whole ion source.
The neutralizer tube is i50 cm long with cross section compatible with the source grid. Because M 8 2 MJ per pulse is dumped into the gas cell walls by the E/2 and E/3 ion components for the proposed direct recovery, the gas cell is cooled by a serpentine cooling tube. Supplemental gas manifolds are used to balance gas flows and pressures to optimize neutralization and efficiency. The gas cell operates at 150
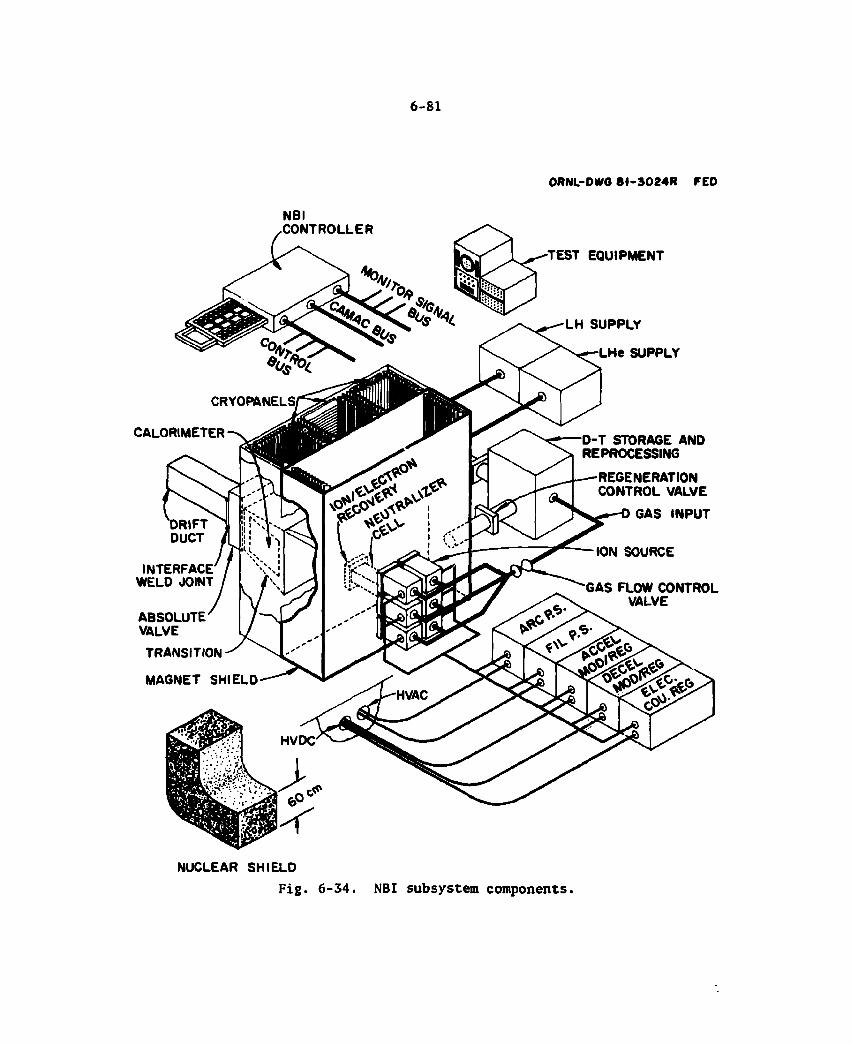
6-81
ORNL-0WO 8I-3024R FED
NBI ,CONTROLLER
TEST EQUIPMENT
^ ^ ^ L H SUPPLY
^ ^ " N ^ - L H e SUPPLY
CALORIMETER D-T STORAGE AND REPROCESSING
REGENERATION CONTROL VALVE
GAS INPUT
INTERFACE WELD JOINT
ABSOLUTE VALVE
TRANSITION
MAGNET SHIELD
GAS FLOW CONTROL VALVE
NUCLEAR SHIELD
Fig. 6-34. NBI subsystem components.
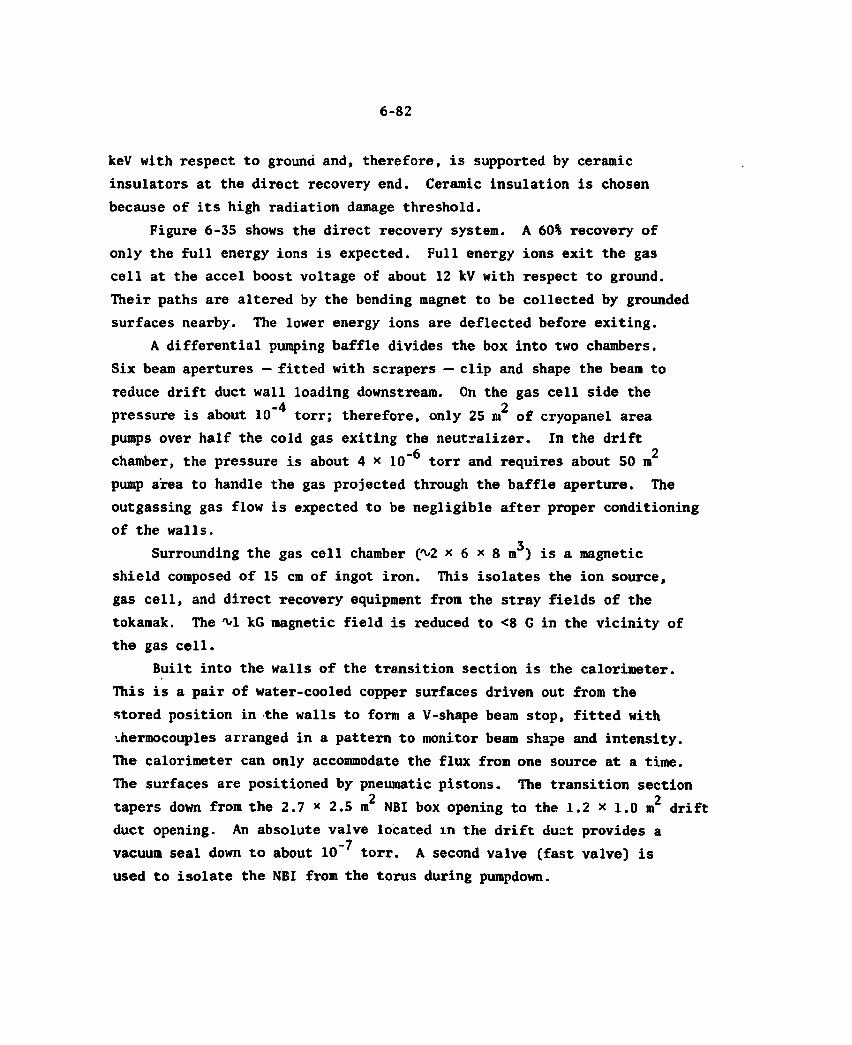
6-82
keV with respect to ground and, therefore, is supported by ceramic insulators at the direct recovery end. Ceramic insulation is chosen because of its high radiation damage threshold.
Figure 6-35 shows the direct recovery system. A 60% recovery of only the full energy ions is expected. Full energy ions exit the gas cell at the accel boost voltage of about 12 kV with respect to ground. Their paths are altered by the bending magnet to be collected by grounded surfaces nearby. The lower energy ions are deflected before exiting.
A differential pumping baffle divides the box into two chambers. Six beam apertures — fitted with scrapers — clip and shape the beam to reduce drift duct wall loading downstream. On the gas cell side the
-4 2 pressure is about 10 torr; therefore, only 25 m of cryopanel area pumps over half the cold gas exiting the neutralizer. In the drift
-6 2 chamber, the pressure is about 4 x 10" torr and requires about 50 m pump area to handle the gas projected through the baffle aperture. The outgassing gas flow is expected to be negligible after proper conditioning of the walls.
3 Surrounding the gas cell chamber f^2 * 6 x 8 m ) is a magnetic
shield composed of 15 cm of ingot iron. This isolates the ion source, gas cell, and direct recovery equipment from the stray fields of the tokamak. The M kG magnetic field is reduced to <8 G in the vicinity of the gas cell.
Built into the walls of the transition section is the calorimeter. This is a pair of water-cooled copper surfaces driven out from the stored position in the walls to form a V-shape beam stop, fitted with <.hermocouples arranged in a pattern to monitor beam shape and intensity. The calorimeter can only accommodate the flux from one source at a time. The surfaces are positioned by pneumatic pistons. The transition section
2 2 tapers down from the 2.7 x 2.5 m NBI box opening to the 1.2 x 1.0 m drift duct opening. An absolute valve located in the drift duct provides a vacuum seal down to about 10~^ torr. A second valve (fast valve) is used to isolate the NBI from the torus during pumpdown.
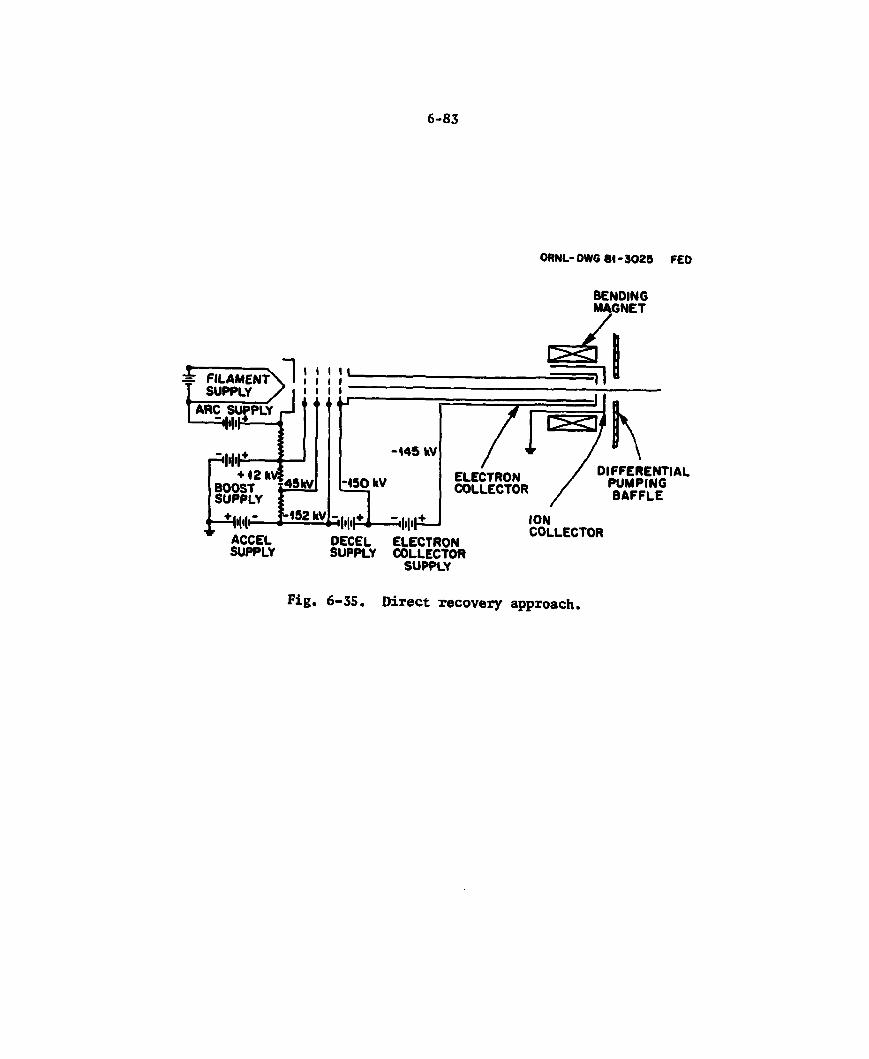
6-83
ORNL- OWG 81 -3025 FEO
BENDING MAGNET
± FILAMENT SUPPLY
ARC SUPPLY
DIFFERENTIAL PUMPING BAFFLE
ACCEL SUPPLY
DECEL SUPPLY
ELECTRON COLLECTOR
SUPPLY
ION COLLECTOR
Fig. 6-35. Direct recovery approach.
6-84
A nuclear shield composed of stainless steel, lead, boron carbide, and water surrounds the drift duct and transition sections. The NBI box is housed inside an igloo of similar composition or borated concrete. The shield thickness is 60 to 100 cm and weight is V550 tons. It is fitced with access panels on the back to allow removal of the ion source replaceable units when the beam line is in place. It is planned that the NBI be removable while leaving the nuclear shield in place.
When the six beams pass through the drift duct exit the power density is as seen in Fig. 6-36. The energy deposition pattern at the center of the plasma (assuming penetration) is about 40 cm between beam centers and each beam is about 65 cm across at the 1.5° divergence con-tour.
The performance, status, and control configuration are monitored by numerous (^200) sensors. This data is transduced into digital format and transmitted over fiber optic lines to receivers at the NBI Controller. This instrumentation data is compiled and formatted for status reports to the main computer control equipment. Microprocessors provide the computing facility for this formatting as well as the control function. Interfaces with the main control use macrocommands. All microscheduling is done in the NBI Controller.
Figure 6-34 shows the mechanical pumps of the ancillary equipment. The roughing pumps take the NBI box pressure down to about 10 torr in 60 minutes and in a like period the turbomolecular (TM) pumps down to 10 ^ torr at which point the cryopumps take over. During regeneration the cryopanels are elevated in temperature and the hydrogen isotopes pumped to D-T storage and reprocessing. The TM pumps operate continuously to sweep out any He backstreaming.
Because there is no neutron shutter, the cryopanels are continuously heated by the neutrons which increase the refrigeration load (by about two orders of magnitude) to 2 kW per beam line. Each liquid helium (LHe) line supplying a beam line is required to be 8 cm in diameter. The LHe line is placed concentrically inside the liquid nitrogen (L^) line.
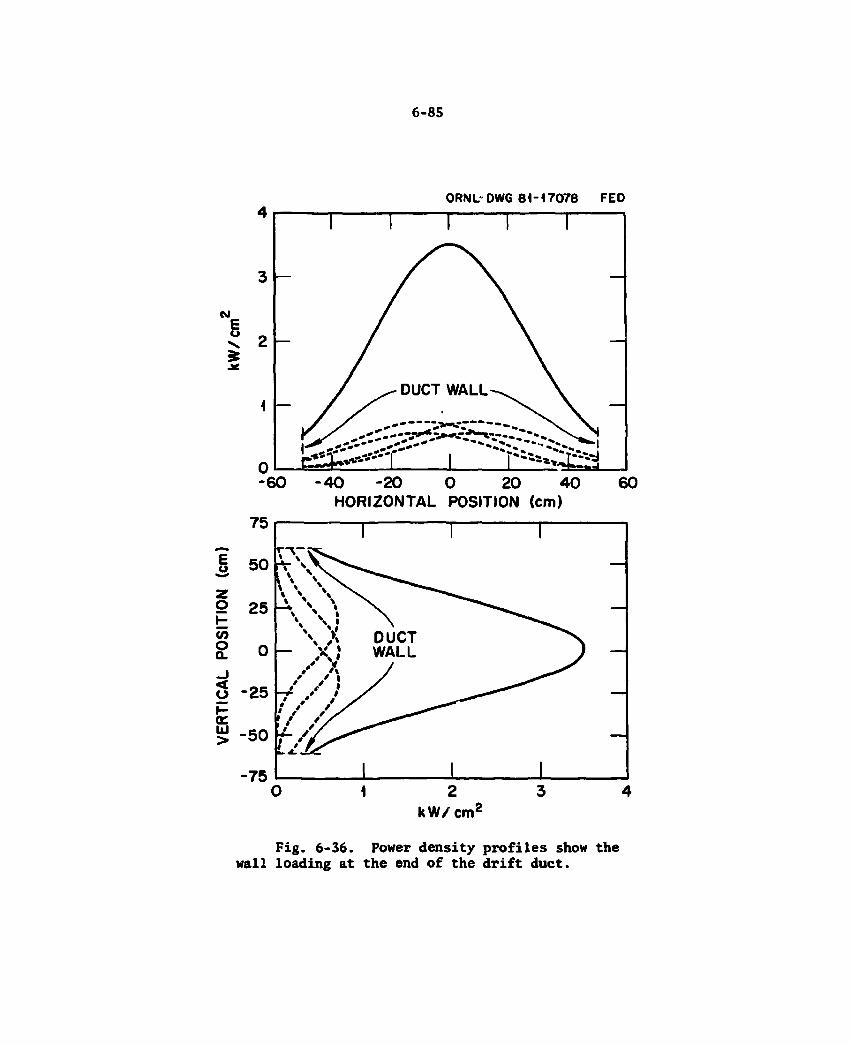
6-85
ORNL" DWG 81-17078 FED
i -60 - 40 -20 O 20 40
HORIZONTAL POSITION (cm) 60
Fig. 6-36. Power density profiles show the wall loading at the end of the drift duct.
6-86
The cooling system is a two stage arrangement. At the injector components, the pulsed thermal load is pumped with high pressure/velocity to a heat exchanger which drives the second loop having a remotely located cooling tower for heat exchange to the air.
Finally the modulator/crowbar equipment of the power supply is laid out to minimize the stored energy seen by the ion source in the event of an arc in the source and a subsequent crowbar action. Voltage drop across the modulator is minimized to maximize efficiency.
6.2.10 NBI Performance
Analysis tools
A code developed by Drs. J. Kamperschroer, GA and L. Stewart, Exxon Nuclear (at PPPL) was used extensively for performance analysis. This code models the NBI subsystems and calculates the performance for the total subsystem. There is a built-in loop that allows the determination of the source size which meets the specified input conditions. Table 6-13 shows an example of the 2 input files giving typical NBI parameters used for the analyses. Table 6-14 shows typical output data resulting from the code.
A neutron streaming analysis was also performed. This analysis was based on a set of scaling relationships that give estimates of neutron flux levels in the NBI box. The analysis employed a neutron streaming
i model developed for the TFTR using a 2-D code. For injector configura-tions similar to that of the TFTR, the scaling equations are expected to give reasonable estimates. These equations were used to estimate neutron heat loads on the cryopanels and radiation-limited life of components. The data base required for this analysis is the geometry (plasma and injector) and the machine wall loading.7
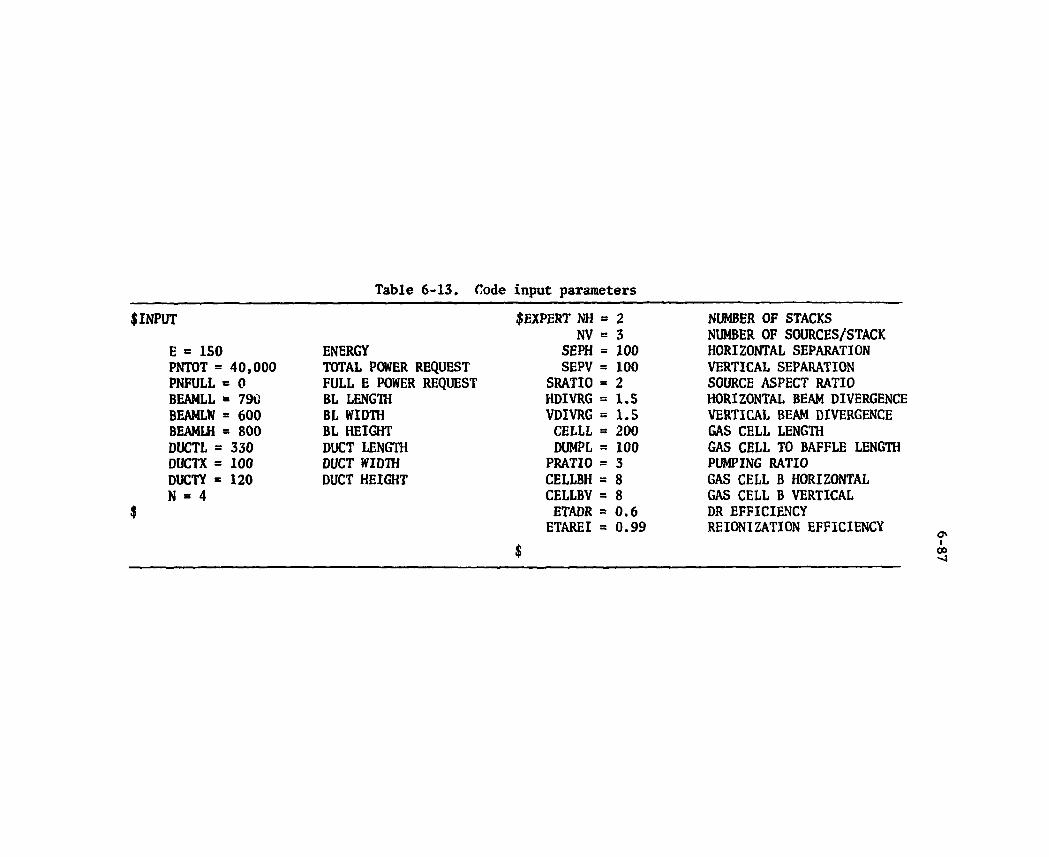
Table 6-13. Code input parameters
$INPUT $EXPERT NH - 2 NUMBER OF STACKS NV = 3 NUMBER OF SOURCES/STACK
E = ISO ENERGY SEPH = 100 HORIZONTAL SEPARATION PNTOT = 40,000 TOTAL POWER REQUEST SEPV = 100 VERTICAL SEPARATION PNFULL = 0 FULL E POWER REQUEST SRATIO = 2 SOURCE ASPECT RATIO BEAMLL = 790 BL LENGTH HDIVRG = 1.5 HORIZONTAL BEAM DIVERGENCE BEAMLW = 600 BL WIDTH VDIVRG = 1.5 VERTICAL BEAM DIVERGENCE BEAMLH = 800 BL HEIGHT CELLL s 200 GAS CELL LENGTH DUCTL = 330 DUCT LENGTH DUMPL = 100 GAS CELL TO BAFFLE LENGTH DUCTX = 100 DUCT WIDTH PRATIO = 3 PUMPING RATIO DUCTY =120 DUCT HEIGHT CELLBH = 8 GAS CELL B HORIZONTAL N = 4 CELLBV = 8 GAS CELL B VERTICAL
$ ETADR = 0.6 DR EFFICIENCY ETAREI s 0.99 REIONIZATION EFFICIENCY
$
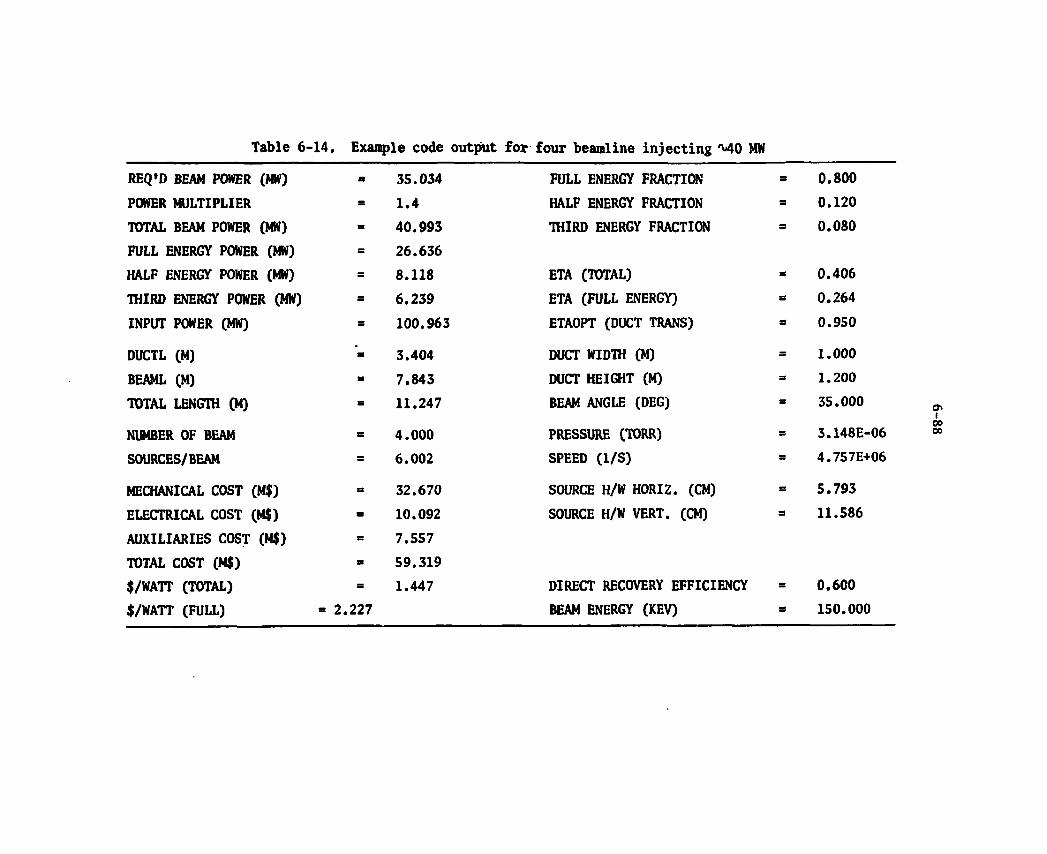
Table 6-14. Example code output for four beamline injecting M O MW
REQ'D BEAM POWER (MW) 35.034 FULL ENERGY FRACTION s 0.800 POWER MULTIPLIER 1.4 HALF ENERGY FRACTION s 0.120 TOTAL BEAM POWER (MW) 40.993 THIRD ENERGY FRACTION = 0.080 FULL ENERGY POWER (MW) 26.636 HALF ENERGY POWER (MW) 8.118 ETA (TOTAL) s 0.406 THIRD ENERGY POWER (MW) 6.239 ETA (FULL ENERGY) = 0.264 INPUT POWER (MW) 100.963 ETAOPT (DUCT TRANS) • 0.950
DUCTL (M) 3.404 DUCT WIDTH (M) = 1.000 BEAML (M) 7.843 DUCT HEIGHT (M) s 1.200 TOTAL LENGTH (M) 11.247 BEAM ANGLE (DEG) = 35.000
NUMBER OF BEAM 4.000 PRESSURE (TORR) = 3.148E-06 SOURCES/BEAM 6.002 SPEED (1/S) s 4.757E+06
MECHANICAL COST (M$) 32.670 SOURCE H/W H0RI2. (CM) s 5.793 ELECTRICAL COST (M$) 10.092 SOURCE H/W VERT. (CM) s 11.586 AUXILIARIES COST (M$) 7.557 TOTAL COST (M$) 59.319 $/WATT (TOTAL) 1.447 DIRECT RECOVERY EFFICIENCY = 0.600 $/WATT (FULL) = 2.227 BEAM ENERGY (KEV) = 150.000
6-89
Performance issues
Table 6-15 lists the salient issues identified for the NBI. The first item arose from a concern about the viability of an NBI operating on a driven machine. Radiation damage was assessed using the scaling equations from Reference 3 appropriately modified for the FED design, g Assuming a 10 rad limit for organic insulation material, the radiation
4 5 damage life was M . 2 * 10 one-hundred second shots. Since over 10 shots are planned, it is clear that organic insulators must be adequately shielded or replaced by materials (inorganic) having damage thresholds approaching 1011 rads.
The dose rate was examined using initially 30-cm-thick concrete on the sides of the beam box and 61 cm on the back. Instead of the required
4 2 mrem/h, the dose rate was estimated to be M..4 * 10 mrem/h. This condition was corrected by increasing the shield thickness by factors of 2 and more.
Thermal stress in the grids, back plate of the source and regions where ions or electrons are deposited must be actively cooled. Assuming 1% of the beam power is deposited on each grid, the four grids must dissipate M).36 MW for 106 s or ^38 MJ per pulse. For the direct recovery approach proposed, the unneutralized half and third energy components dump 85 MJ into each of the gas cells at the wall. The direct recovery ion dump for the full energy component must handle ^34 MJ per pulse. With direct recovery, 60% of the full energy ion power is dumped and thermalized at the collector. (Note: These ions are at the boost voltage when they strike the collector and therefore their energy is only 10% of the accel energy. Hence the energy dumped is only ^10% of what it would be without direct recovery.) The other fraction (40%) of the full energy component goes into the gas cell wall. This dumps >230 MJ into each gas cell. The direct recovery approach reduces the thermal stress problem by at least an order of magnitude on the full energy collector but the gas cell heating is increased significantly. Improvement in the ion species mix and the direct recovery efficiency would relieve this gas cell loading. Presently, the mix is required to be 0.80, 0.12, 0.08 with a goal of 0.90, 0.05, 0.05 and the direct
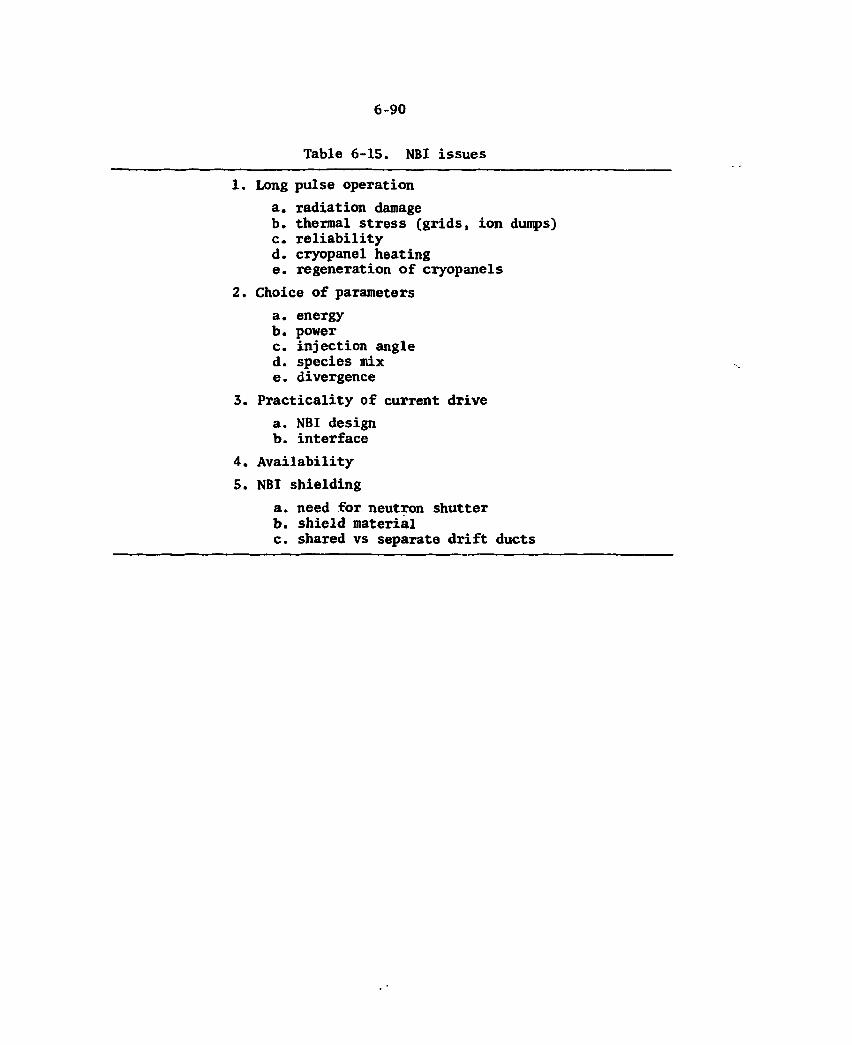
6-90
Table 6-15. NBI issues
1. Long pulse operation a. radiation damage b. thermal stress (grids, ion dumps) c. reliability d. cryopanel heating e. regeneration of cryopanels
2. Choice of parameters a. energy b. power c. injection angle d. species mix e. divergence
3. Practicality of current drive a. NBI design b. interface
4. Availability 5. NBI shielding
a. need for neutron shutter b. shield material c. shared vs separate drift ducts
6-91
recovery efficiency requirement is 60% with a goal of about 90%. Taking the goal values, the gas cell would get 105 MJ (compared to 315) and the collector 58 MJ (compared to 34). These are sizeable energy levels but still reduced, in either case, from the 572 MJ dumped without direct recovery. Further, direct recovery circumvents the ion dump design problem where ro.x 0.5 m x 1.75 m dumps would have to handle upwards to 6
2 kW/cm for periods of 106 s.
Reliability concerns centered around the filament or cathode of the source. Short pulse (<0.5 s) systems in the past (at lower duty factors than the FED) have activated the filament for slightly longeT than the pulse. Extrapolating this experience, suggests that these filaments might have to be replaced as often as once a month for bulk heating pulses of 6 s. For the driven machine, where the pulse length is 100 s longer and the duty factor at 70% the reliability is expected to be ler,s. A long-life indirectly heated cathode is probably feasible but no performance estimates were made.
Cryopanel heating occurs over the b u m time of the machine plus at some reduced level during the later portions of the bulk heating cycle. Based on the scaling estimates, the average nuclear heat load is M . 3 x 10 w/cc. Assuming a 3-mm-thick stainless steel surface the -3 2 load would be 1.3 x 10 w/cm . For the proposed configuration, the
2 5 2 cryopanel surface is 75 m or 7.5 x 10 cm which yields a heat load of 2
9.75 x 10 watts. Averaging over the duty factor of the machine, the average nuclear cryogenic load per beam line is 0.975 kW x 102/152 0.650 kW. An additional 0.350 kW is added for all other thermal loads. For sizing the cryogenic refrigeration need, a maximum load of 2 kW/beam line was used. The refrigeration cost, $R, was estimated to be
$ R = 0.0132 x 10⁶ [P(kW)500]0,7 = 4.6 M$
Assuming 0.05 $/kWh for power and that, it takes 600 watts of power/watt of refrigeration the operating cost, $„__, is opsr
0.05 x 4 kW x 600 W ,,ft 4 "oper = kWh~ - w 1 2 0 * / h
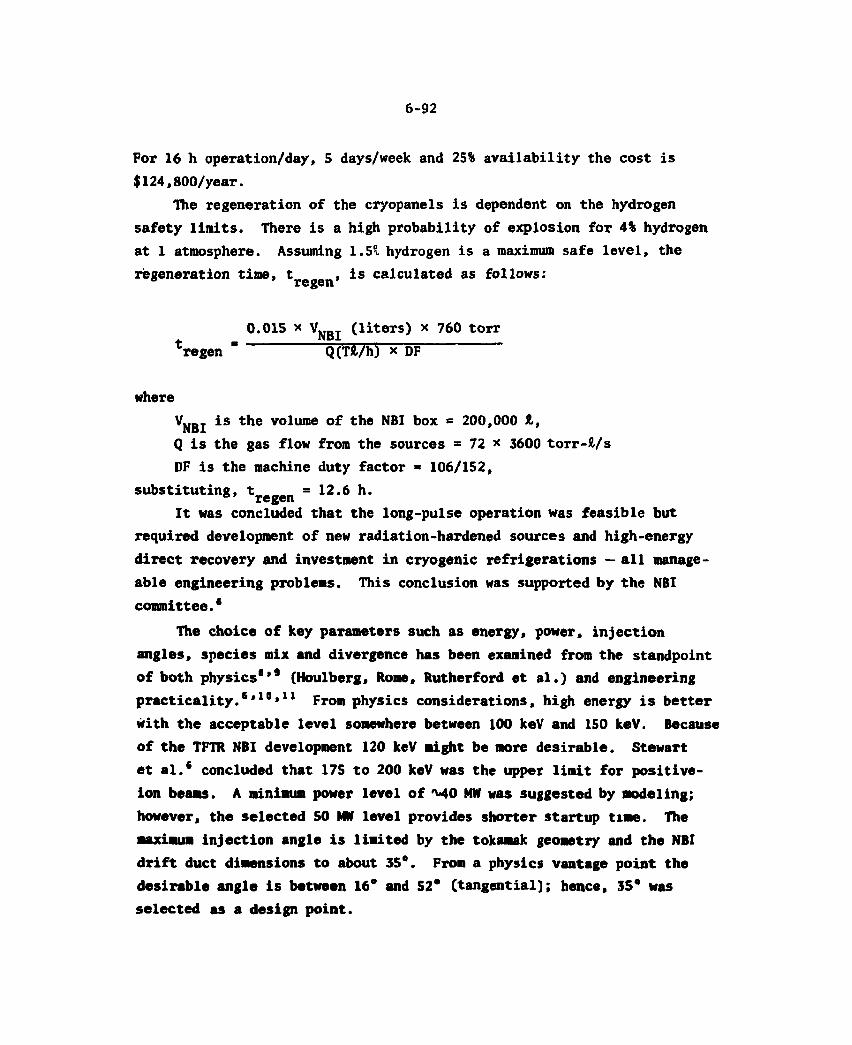
6-92
For 16 h operation/day, 5 days/week and 25% availability the cost is $124,800/year.
The regeneration of the cryopanels is dependent on the hydrogen safety limits. There is a high probability of explosion for 4% hydrogen at 1 atmosphere. Assuming 1.5° hydrogen is a maximum safe level, the regeneration time, t , is calculated as follows: regen
0.015 x V N W (liters) x 760 torr tregen = Q(W/h) x OF
where
VNBI i S t h e v o l u m e o f t h e N B I b o x s 2 0 0 > 0 0 0
Q is the gas flow from the sources = 72 x 3600 torr-£/s DF is the machine duty factor = 106/152,
subst i tut ing, t „ = 12.6 h. regen I t was concluded that the long-pulse operation was feasible but
required development o f new radiation-hardened sources and high-energy d i rect recovery and investment i n cryogenic re f r igerat ions — a l l manage-able engineering problems. This conclusion was supported by the NBI committee.6
The choice of key parameters such as energy, power, i n j ec t ion angles, species mix and divergence has been examined from the standpoint of both physics 8 ' 9 (Houlberg, Rome, Rutherford et a l . ) and engineering p r a c t i c a l i t y . 6 * 1 0 * 1 1 From physics considerations, high energy i s bet ter with the acceptable leve l somewhere between 100 keV and 150 keV. Because of the TFTR NBI development 120 keV might be more desirable. Stewart et a l . 6 concluded that 175 to 200 keV was the upper l i m i t for posi t ive-ion beams. A minimum power level o f M O MW was suggested by modeling; however, the selected 50 MW level provides shorter startup time. The maximum in jec t ion angle i s l imited by the tokamak geometry and the NBI d r i f t duct dimensions to about 35*. From a physics vantage point the desirable angle i s between 16° and S2° ( tangent ia l ) ; hence, 35° was selected as a design po int .

6-93
Species mix was chosen based on current technology development experience. It has been shown10 that improved species mix: (1) makes direct recovery more effective and (2) improves full energy component efficiency. Higher full energy mix provides a superior energy deposi-tion profile because the penetration is better and edge heating is reduced.9
Divergence was specified at 1.5° (half width, 1/e) based on the following two assumptions: (1) 1° optics are achievable in laboratory environment and (2) some field degradation (<0.5°) can be expected in an environment not conducive to maintenance. The obvious advantages of achieving a 1° beam are lower wall loading or some wall loading with a smaller drift duct (see Pig. 6-37).
Current drive was considered in the early part of this year's effort by the FEDC and the NBI beam committee. A High Energy Neutral Beam Workshop was held to examine the state-of-the-art of formation and acceleration using negative-ion based concepts. The conclusions of all these groups were as follows. First, positive-ion beam technology does not support the required energy levels of M O O keV. Second, negative-ion based beams of the required size will likely not be available for application until at least the mid 1990's. It appeared possible to inject at a tangential angle if the optics were good enough to allow a drift duct width of <0.5 m (see Fig. 6-38). Finally, there is a shine-through problem associated with high-energy beams such as those proposed for current drive. Therefore, either two sets of beams would be required (one for heating and one for current drive) or an energy modulation approach would be needed.
Availability is an issue tied to the mission requirements and the cost of: (1) redundancy, (2) high reliability components, and (3) mainten-ance support equipment. No unique availability allocations have been made this time. The design concept proposed addresses availability by planning for a redundant bean line and separate power supplies, and by identi-fying critical components.
Nuclear shielding issues are: (1) choice and thickness of materials for the NBI box, (2) need for neutron shutter in the drift duct, and (3) shared vs separate drift ducts. Concrete, borated stainless-steel and
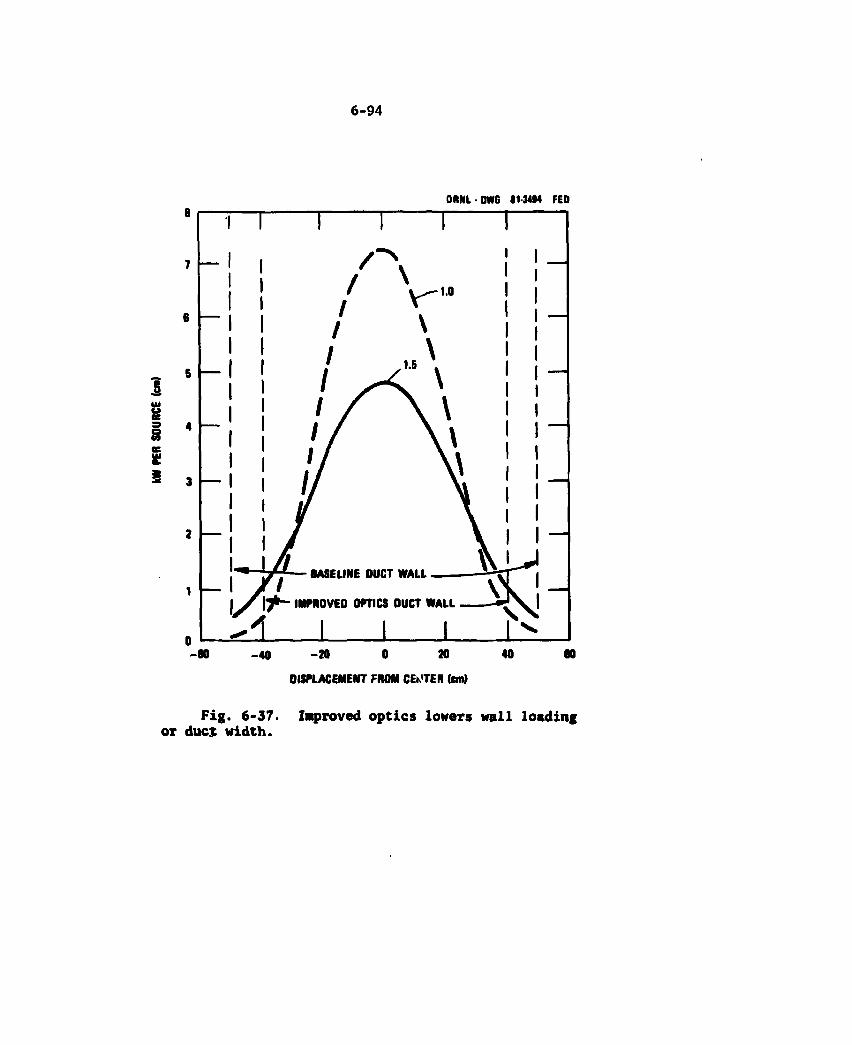
6-94
ORNl-OWG 81-3494 FED
-40 -20 0 20 DISPLACEMENT FROM CENTER (cm)
Fig. 6-37. Improved optics lowers wall loading OT duc$ width.
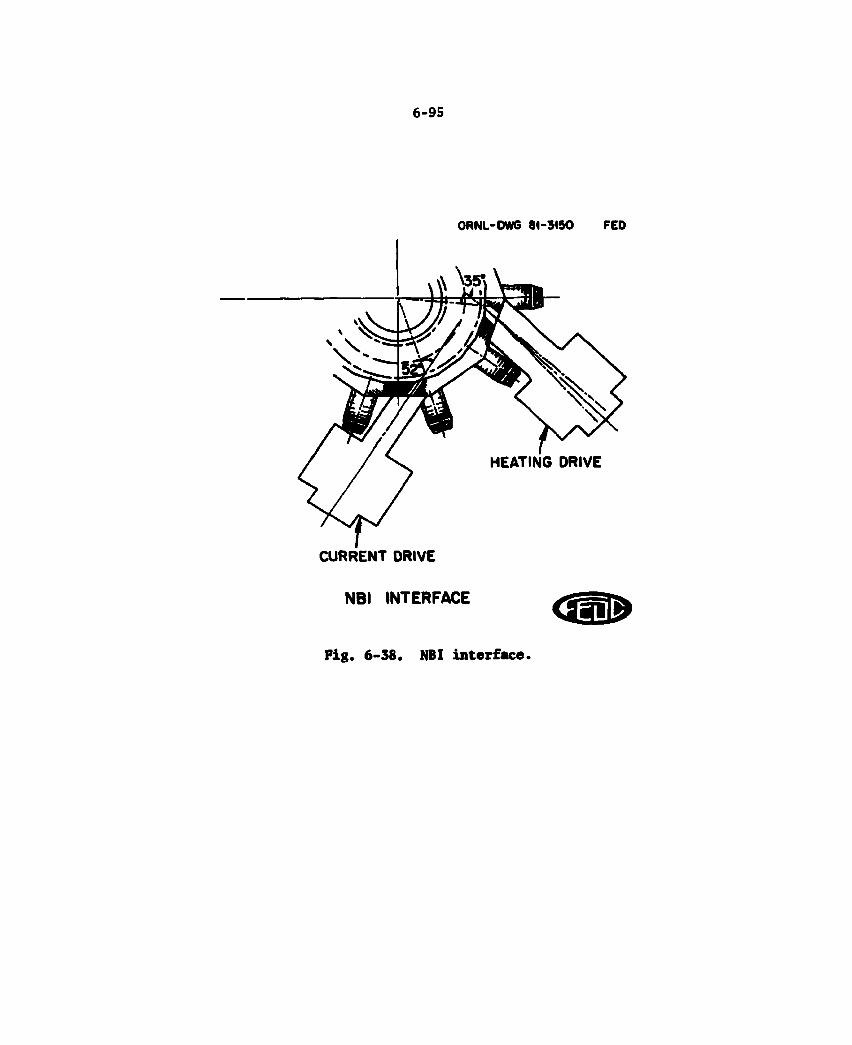
6-95
ORNL-DWG 81-3450 FED
HEATING DRIVE
CURRENT DRIVE
NBI INTERFACE
F i g . 6 - 3 8 . NBI i n t e r f a c e .

6-96
water, a composite of stainless steel and lead, and boron carbide were among the candidate materials. Concrete is preferred for its simplicity. Based on scaling the results in 0RNL/1M-7526,7 all the walls should be at least 2-ft-thick (see Fig. 6-39). The need for a neutron shutter on a driven machine is minimal. At 10-T operation ignition is expected and the desirability of a shutter increases. On INTOR, the suggestion was made that the neutron flux seen by the source could be reduced by pro-viding a separate drift duct for each source. This was evaluated and found to be effective (6.4:1 reduction) and the total flux entering the box was 0.95 of that of the shared approach. The disadvantages were that the penetration area of the beam line would increase 5 or 6:1, the source separation would have to be double (possibly increasing the NBI box size), and the valving in the drift duct would be complex. The choice made was to retain the more conventional shared drift-duct approach.
6.2.11 Options and Trades
Positive vs negative-ion based beams
For the present FED program schedule and the basic function of bulk heating, positive-ion beams were a clear choice. Positive-ion beams are practical at the energy level specified and can be developed in time for FED. Negative-ion beams are suited to a demonstration add-on after ;the mid 1990's. The NBI Beam Committee has developed a skeletal development plan which is reported on in Ref. 6.
Source size
Table 6-16 shows 4 cases of different source size. These cases were run on the NBI code. The objective of this study was to tradeoff the number of sources vs the source size. At one extreme, a few very large sources with high stored energy are risky to develop, and are unfavorable from a reliability standpoint. At the other extreme, a large number of small sources tends to increase the drift duct wall loading or interface area (larger penetration of the torus) and increase the cost.
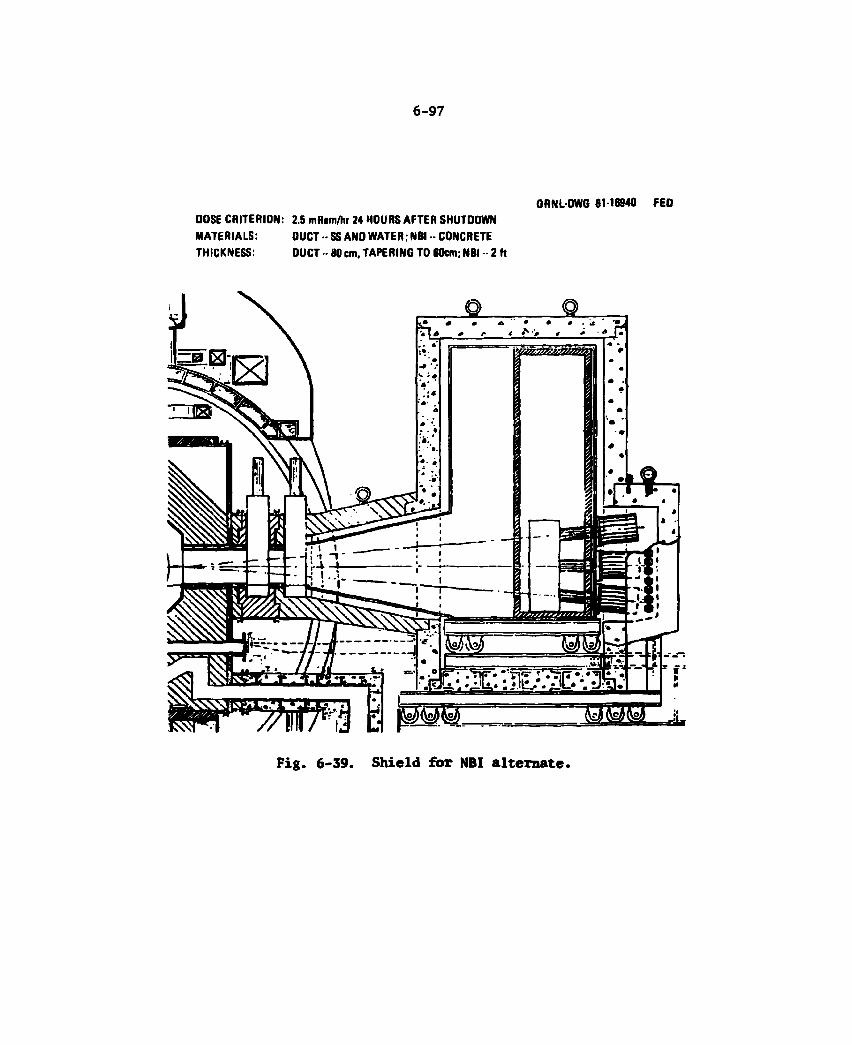
6-97
ORNL-DWG 84-19408 FED DOSE CRITERION: 2.5 mRam/hr 24 HOURS AFTER SHUTDOWN MATERIALS: OUCT •• SS AND WATER; NBI -- CONCRETE THICKNESS: DUCT -- 80 cm, TAPERING TO 60cm; NBI - 2 ft
Fig. 6-39. Shield for NBI alternate.
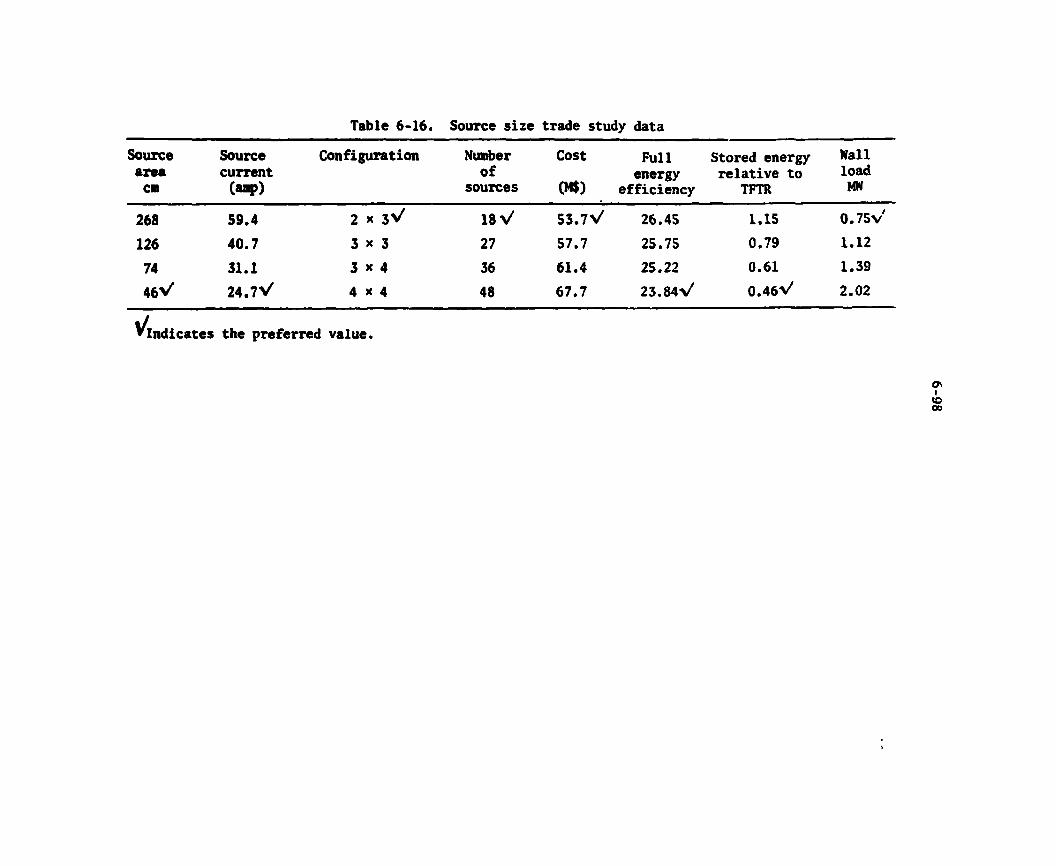
Table 6-16. Source size trade study data
Source area
en
Source current
(aap)
Configuration Number of
sources
Cost
(H$)
Full energy
efficiency
Stored energy relative to
TFTR
Wall load MW
268 59.4 2 x 3 V 18 V 53 .7V 26.4S 1.15 0 .75V
126 40.7 3 * 3 27 57.7 25.75 0.79 1.12
74 31.1 3 x 4 36 61.4 25.22 0.61 1.39 46V 24.7 V 4 x 4 48 67.7 23.84V 0 .46V 2.02
Indicates the preferred value.

6-99
Capital cost and efficiency impact total system life cycle cost (LCC). Poor beam line efficiency manifests itself in higher operating cost and greater capital expenses for cooling and power storage equipment. Stored energy within the source (defined as W = 1/2 CE where C is the distributed capacity of the accelerator stack and its supply lines and E is the appropriate acceleration voltage for the acceleration stack) and source current limits are feasibility issues which can only be answered by development programs. Wall loading is an engineering issue which is exacerbated by the relatively long (^90:1 longer than TFTR) pulse on-time.
Based on this table, the larger source (59 amp) is preferred with respect to number of sources, cost, efficiency and wall loading; while the smaller source is a better choice from a current and stored energy standpoint. Considering present experience on TFTR with a current of 65 A at 120 keV and a stored energy of <5 J, the chosen source size operating at about 55-60 A should be a tractable problem even at the higher acceleration voltage (i.e., 150 keV for FED vs 120 keV for TFTR).
Another aspect of the source size is its physical dimension. The 2 59 A source has a cross sectional area of 268 cm . Assuming a commonly
used aspect ratio of ^1:2 (height to width) this source would be about 2
11 "22 cm . These dimensions effect the minimum permissable spacing between the sources and therefore the included angle of the beam bundle passing through the drift duct section. In the analysis the spacing is set to 100 cm because clearance between the sources is required for mounting brackets, magnetic shielding, voltage holdoff, etc. For a source this size, the spacing is not unreasonable. However, the scrape-off loss and wall loading decreases for a given drift duct cross section with the reduced source spacing.
The conclusion is to make the source size as large as possible and still hold to reasonable current and stored* energy. It is not clear at this point what the stored energy limit is because some investigators have found a 5 J limit while others have found none. It is not possible to calculate the stored energy accurately without knowing the source and surrounding geometry. Based on current experience, design of the selected source size should be achievable.

6-100
Interface design
The main factors influencing the interface design are the number of beamline penetrations, the area needed for each shielded drift duct around the penetration, the injection angles and the efficiency. The 10-TF coil configuration offers a significant challenge because the windows between coil legs are quite constricted.
It is desirable to make the penetration as large as possible to maintain efficiency and lower average power density through the duct. Figure 6-40 shows the impact on beam line efficiency of making the duct narrower. This shows the chosen 1 meter width to be just beyond the knee of the curve. These results are optimistic, however, because the code assumes a Gaussian beam shape which has lower skirt levels than are expected to be realized. The scrapeoff loss would therefore be higher. (Note: These results are for 150 keV beam energy with the 6-source baseline configuration.)
Assuming that the nuclear shield thickness is required to be 0.8-m thick at the vacuum vessel, the interface was configured to allow the maximum injection angle. Figure 6-41 shows this interface. The limiting cross section is shown to Section AA. Because the fit is so tight it would appear to be appropriate to do a tradeoff of injection angle and plasma heating efficiency in the future. A better interface might be more power and a smaller angle. Also, when the nuclear shielding analysis is more detailed, the tradeoff of drift duct width and shield thickness should be revisited.
The average power density associated with this drift duct cross 2 2 section is 1.4 kW/cm . To date power densities to 4 kW/cm have been
planned at much shorter pulse lengths. For the 6-s bulk heating time the transient surface temperature is proportional to the square root of the pulse length. Because this pulse length is 1 longer than TFTR the temperature would be ^2:1 higher. For the 8-T operation, FED's pulse length is 90 times current experience, the temperature is expected to rise to a steady state condition. Since this temperature is directly proportional to power density, the allowable power density should be 2-3 times lower than present experience to help reduce the wall temperature
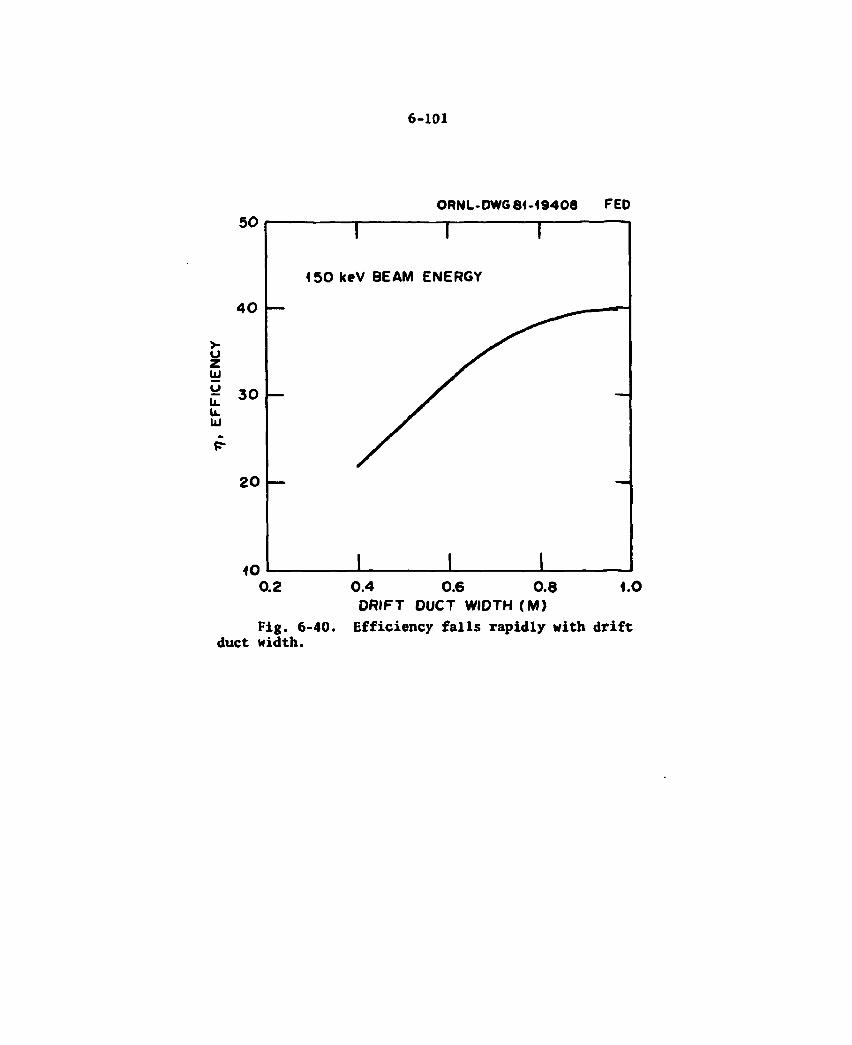
6-101
ORNL-DWG 84-19408 FED
DRIFT DUCT WIDTH (M> Fig. 6-40. Efficiency falls rapidly with drift
duct width.
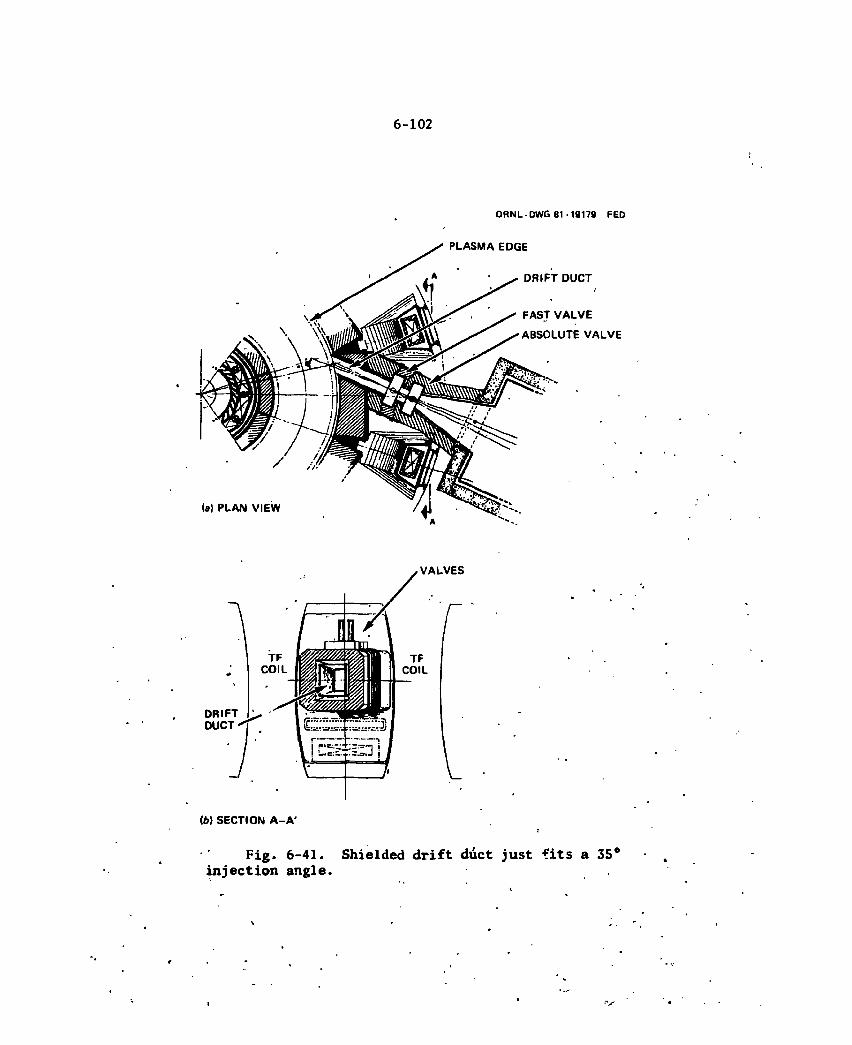
6-102
ORNL-DWG 81-19179 FED
PLASMA EDGE
DRIFT DUCT
FAST V A L V E
ABSOLUTE V A L V E
(a) PLAN VIEW
DRIFT DUCT
VALVES
1
(6) SECTION A-A '
Fig. 6-41. Shielded drift diet just fits a 35* injection angle.

6-103
2 and/or required cooling. Hence, the 1.4 kW/cm average power density is supported.
The number of penetrations or NB injectors is proposed to be 3 (plus 1 extra held in reserve) to meet the operation power of 50 MW. The trade here is to have fewer injectors with more power (re., more sources per beam line), assuming the source size has already been selected. If the drift duct opening is maximized (as above), then varying the number of penetrations is tantamount to varying the power density. A 2-beam line approach would have 33% higher power density. More sources per beam line means lower efficiency since the added sources increase the included angle of the beam bundle going through the drift duct. Not only,does this increase the scrapeoff loss but it also increases the duct wall loading. In going from 6 sources per beam line to 9, the wall 'leading increased 50%. Again this is undesirable from a surface temperature standpoint.
The powier density distributions in the drift duct at the vacuum vessel first wall are shown in Fig. 6-36 above for the six-source baseline configuration. A duct wa1! power density of 343 W/cm is estimated at thi point. Taking into account the grazing angle of the beams, the normal
" 2 (to the wall) component is about 43 W/cm . The wall temperature goes to about 300°-400°C with the planned cooling. A 50% increase would raise the temperature to ^600°C. This is undesirable. There are some alterna-tives. It may be possible to reduce wall loading by optics with smaller divergence (see Fig. 6-37) and/or lower sidelobes. The wall loading calculations are based on 1.5° maximum. The choice of divergence (1° design, 1.5° operational but degraded) was made based on the desire to reduce the required ion source maintenance. The use of scrappers could reduce the wall loading by effecting lower sidelobes but may lower the beam line efficiency. The configuration calls for the use of beam scrappers but their impact on wall loading and efficiency has not been evaluated. Taking this and possible improved optics into account might move the maximum number of sources to 8 or 9. The current design may be a little conservative. At this level of design detail this con-servatism is justifiable.

6-104
Ion deposition
This trade study was discussed under "Performance issues" (long pulse). Direct recovery is preferred over the conventional ion dump approach. One hedge or concern to the selectior is that, thus far the direct recovery device has only been demonstrated on low energy (<100 keV) beams. There are no known feasibility issues with going to higher energies, but a program to demonstrate this is warranted.
Monatomic ion fraction
The impact of higher full energy ion fractions was touched on above. In raising the mix from the baseline value of 80/12/8 to 90/5/5 the fraction of neutral power into the plasma goes from 0.64 to 0.81 (see Reference 4). The capital cost decreases slightly, ^5%. The problem is that presently developed sources are only achieving around 7S to 80% full energy component. Some preliminary source development work using a dual arc chamber with magnetic barrier shows encouraging results, however, the state-of-the-art performance was chosen for the FED base-line.
Cryopumping
Simple cryocondensation pumps were selected over compound cryo-absorption pumps. The small amount of He backstreaming into the NB injector can be handled by the TM pumps, hence there was no need for the less efficient compound pumps. Differential punf was chosen because it reduces the pump area 3 or 4 to 1.10
6.2.12 Future Effort - Neutral Beam Injection Heating
Neutral beam injection heating is a feasible, practical alternative to rf heating on FED. There are no significant problems with keeping this option open.
Aside from a continuum of iterations of the NBI heating design to respond to changes in requirements, the most important remaining effort

6-105
i s addressing the a v a i l a b i l i t y quest ions. Th is e n t a i l s c a r r y i n g out a
d e t a i l e d design t o a po in t a t which maintenance act ions could be de-
l i n e a t e d step by s tep , components could be l i s t e d w i t h f a i l u r e r a t e s
est imated and sca led , and remote maintenance equipment requirements
could be i d e n t i f i e d . Cost est imates would be improved i f t h i s d e t a i l e d
design were a v a i l a b l e .
Some technology developments should be pursued, s p e c i f i c a l l y d i r e c t
recovery f o r p o s i t i v e - i o n beams and general component development f o r
high-energy beams. Obviously , t h e r e i s much t o do on the h igh energy
beam l i n e design f o r cur rent d r i v e , but the technology must be developed
f i r s t .

6-106
REFERENCES
1. Fusion Engineering Device, Vol. V, Technology RfiD Requirements for FED Construction, DOE/TIC—11600 (to be published).
2. "A Mode Transducing Antenna," Robert D. Wengenroth, IEEE Transactions on Microwave Theory and Techniques, Vol. MTT-26, No. S, May 1978.
3. Attenuation in Corrugated Circular Waveguides by Prof. P. J. B. Clarricoats et al., Proc. IEEE Vol. 122, No. 11, November 1973.
4. Private correspondence for Dr. D. Q. Hwang, "Waveguide Coupling Calculations with Flat Edge Density."
5. F. W. Perkins, "An ICRF Waveguide," PPPL-346, Princeton University, March !981.
6. "FED/INTOR Beam Committee Report on Beams for FED," April 1981, Dr. L. D. Stewart, Exxon Nuclear, Chairman.
7. "Estimated Nuclear Effects in the Neutral Beam Injectors of a Large Tokamak," R. A. Lillie et al., 0RNL/1M-7526.
8. Fusion Engineering Design Center Staff (C. A. Flanagan, D. Steiner, G. E. Smith, eds.), "Initial Trade and Design Studies for the Fusion Engineering Device," ORNL/TM-7777, Section 4.3.3, Oak Ridge National Laboratory (June 1981).
9. Fusion Engineering Device, Vol. IV, Physics R&D Requirements for the Fusion Engineering Device, DOE/TIC--11600 (to be published).
10. "US INT0R Conceptual Design," Vol. 17 Chapter VI, Section 1.0, Neutral Beam Injection, Fusion Engineering Design Center.
11. Fusion Engineering Device, Vol. VI, Complementary Development Plan for Engineering Feasibility, DOE/TIC--11600 (to be published).
7. ELECTRICAL SYSTEMS
J. G. Murray* M. Anderson**
G. E. Gorker5
J. F. Baur+ G. Bronner* S. Ghose++
D. H. Metzler5 W. Stodiek* J. C. Wesley* W. D. Nelson5 R. J. Thome6 S. Whitley** M. Pelovitz* S. L. Thomson** J. B. Wilgentt
Y-K. M. Peng11 L. R. Turner55 W. R. Wing" S. S. Shen" H. F. Vogel&S K. M. Young*
The electrical system as defined in this documentation consists of
• Power Handling and Conversion • Energy Storage • Electromagnetic Analyses • Diagnostics, Instrumentation, Data Acquisition, and Control
The power handling and conversion includes the 60 Hz utility company ac power, the associated facility substations, and the ac to dc converters. To obtain a minimum cost design, it was decided to place as much of the pulsed load on the utility system as was feasible. It is understood that some load leveling may be required, and the facility should be near the source of large power distribution, to minimize the adverse effects of the voltage variations. Two power lines are required. One for supplying the standard building and facility loads which are normally considered steady loads. These include such loads as lighting, heating, office equipment, and computers which normally function on utility systems. The second system will be a heavy duty line which has
'Fusion Engineering Design Center/Princeton Plasma Physics Laboratory. **Tennessee Valley Authority. ^General Atomic Company. 'Princeton Plasma Physics Laboratory.
'•'jFusion Engineering Design Center/Bechtel Corporation. ^Fusion Engineering Design Center/General Electric Company. "Fusion Engineering Design Center/Oak Ridge National Laboratory. "Oak Ridge National Laboratory. ^Massachusetts Institute of Technology. TTBechtel Corporation. §§Argonne National Laboratory. $&Los Alamos National Laboratory.
7-1

6-2
a d i r e c t connection t o a u t i l i t y system t h a t can accept l a rge vo l tage
f l u c t u a t i o n s . These f l u c t u a t i o n s w i l l be due t o the 200-300 MVA load
changes, which occur every t ime FED i s pulsed.
The conversion equipment i s t h a t needed t o convert ac power from
the u t i l i t y system or the spec ia l energy storage systems to dc w i th
v r r i o u s current wave shapes. The converters must operate over the range
o f 6 0 - 9 0 Hz when suppl ied from the energy storage system. The design i s
based on phase c o n t r o l l e d r e c t i f i e r s which w i l l be used as b u i l d i n g
block modules. They w i l l be standard u n i t s w i t h s p e c i f i c vo l tage and
current r a t i n g s . To provide the requi red c o i l or system load vo l tages
and cur rents these standardized modules w i l l be connected i n var ious
s e r i e s and p a r a l l e l arrangements. I n v e r t e r c a p a b i l i t y w i l l be provided
t o o b t a i n f a s t discharge o f c o i l s , f l e x i b i l i t y o f c o n t r o l , and to recover
the c o i l energy.
The energy storage system w i l l be motor generator u n i t s s i m i l a r t o
those u t i l i z e d by PPPL and GA. Two t o four u n i t s w i l l be r e q u i r e d t o
prov ide f o r t h e pulsed s t a r t u p and shutdown o f FED. The power f o r the
burn phase o f the opera t ion w i l l be provided d i r e c t l y from the u t i l i t y
system.
The e lectromagnet ics ana lys is includes the e f f e c t s o f eddy currents
and induced vo l tages i n the FED s t ructures as the r e s u l t o f the t r a n s i e n t s
o f s t a r t u p , shutdown, d i s r u p t i o n , and c o n t r o l . The FED requ i res a
massive to rus s t r u c t u r e t o wi thstand the fo rces , h e a t , and r a d i a t i o n .
The t o r u s design and e lectromagnet ic f ea tu res must be v a s t l y d i f f e r e n t
from e x i s t i n g devices and those being constructed. The base design has
i n t e r n a l e l e c t r i c a l connectors between torus sector modules. These
connectors have a c o n d u c t i v i t y high enough t o r e s u l t i n vo l tage drops
less than those necessary t o susta in any arcs which develop dur ing a
d i s r u p t i o n . The d i s r u p t i o n may produce ion ized p a r t i c l e s which are
forced i n t o the torus s t r u c t u r e and may i n i t i a t e a f low o f current
between s t r u c t u r e gaps. I f the e l e c t r i c a l conduction o f the connectors
i s h i g h enough, e l e c t r o n s w i l l not be emi t ted from the s t ruc tures and
e r r o s i o n w i l l not occur . Excessive arc damage could r e s u l t i f these
connectors were not u t i l i z e d . This good conducting s h e l l a lso assures

7-3
that the disruption induced voltages in the external coils will not exceed those required for normal operation. The internal connectors are provided around the torus sector minor radius with spacing between connectors of one meter or less. This produces a conducting shell which damps and controls plasma fluctuations faster than a few hundred milli-seconds .
Studies have been performed to determine the magnitude of the predominant eddy current circuits and to size the startup system as well as the control power system. This self-consistent electromagnetic design was based on maintaining toroidal eddy currents at values that keep forces low; and to maintain voltages between adjacent structures to values less than required to sustain arc currents. The startup and control fields must be capable of penetrating this conducting shell as well as the shells on the outer surface of the torus (the spool and the sector outer surfaces). The PF coil startup power is eased in the FED design by the ECRH system. This design requires a loop voltage of less than 25 V for the plasma startup.
The diagnostics instrumentation, data acquisition, and control systems include all of the equipment for operation, feedback, and super-visory control.
Control and performance verification for all phases of FED operation is provided by the diagnostics, information, and control systems. Instru-mentation for facility control and instruments needed to evaluate interaction between the FED subsystems and the plasma are being identified as the subsystems are designed. The information and control system provides the hardware and software to perform all programmable processes for FED. Important parts of this system are the facility control, the diagnostic data system, subsystem monitoring and control monitoring, and the archival system.
The instrumentation and control system features of FED will use the latest technology of existing devices and will incorporate the latest, advances in industry; but their salient features will be based on those used on present systems. The feedback control will be more complicated because of the FED plasma elliptical shape and because of the need for density and burn control. Utilizing the torus penetrations for diagnostics

7-4
will be more difficult on FED because of radiation and tritium confine-ment considerations. The environment provides a complication on the number of plasma diagnostic devices that will be available especially during the tritium phase of operation. The specific design of the instru-ments which will be used will be determined in a manner that takes full advantage of the development progress in the various laboratories. It is noted that the environment of radiation and high magnetic fields will impose additional development requirements, even in instruments which are now considered standard hardware. The sensors for plasma position, shape, and burn feedback as well as those for measuring or controlling critical temperature or cooling system within the torus will be specified and developed as those systems become better defined.
7.1 POWER HANDLING AND CONVERSION
The power handling and conversion system consists of the ac power system and the power supplies and protection system for the TF and PF coils. The ac power system provides 60 Hz electrical power at the de-sired voltages to the FED and to its supporting facilities. It includes facility substations, feeders, transformers, and circuit breakers. The power conversion system consists of rectifier inverter power supplies for converting ac to dc and vice versa. Coil protection includes instrumentation and control, dump resistors, and dc circuit breakers.
7.1.1 AC Power Systems
The ac power system provides all 60 Hz electrical power for operating FED and its supporting facilities. Very large pulsed power supply loads that exist during startup and shutdown are supplied by energy storage units. Loads that exist throughout the burn phase are supplied directly from the utility line.
Two utility power lines are proposed; one to supply pulsed power with large voltage fluctuations and one to provide power for facility service loads and essential loads which have voltage regulation normally provided by utilities. In addition, standby diesel generators and
7-5
uninterruptible power supplies are proposed for essential protection systems and for operating safety related equipment.
Requirements
The ac power system must provide the 60-Hz pulsed and steady-state power for the FED electrical loads and the facility support loads identi-fied in Tables 7-1 and 7-2, respectively. This system also provides the backup power for essential loads and the power for noninterruptible loads. Fault protection is provided by coordinated circuit breakers in each feeder line.
Referring to Table 7-1 and Reference 1, 36 of the 50 MW of ion cyclotron radio frequency (ICRF) power is needed during the entire b u m phase when operating in the 8-T driven mode. All 50 MW of ICRF power is needed for only six seconds of the startup phase when operating in the 10-T ignited mode. Therefore, three of the four ICRF power supplies can take power directly from the utility line when operating in the 8-T mode, but all four ICRF power supplies will take their power from the MGF storage units when operating in the 10-T mode.
During startup and shutdown, the large peak power (^1800 MW) needed for the poloidal fields is supplied by the MGF units, but during the bum phase the 56 MW required by poloidal fields is taken direct from the utility line. With this provision, the maximum pulsed power for the MGF units is about 25 MW as indicated in Table 7-1.
Cryogenic (CRYO) compressor power and heat transfer system (HTS) pump power may be a steady-state load or possibly increased during the dwell part of the operating cycle to compensate some for the power trough in the cycle. Cryogenic and HTS electrical loads given in Table 7-1 are the steady, uniform electrical load requirements.
Table 7-2 is an estimate of facility power loads. Tritium removal and cleanup are essential under all abnormal conditions and represents the major load that must be transferable to the diesel generators. Only one of the tritium removal units is needed to do the job, but for reliability, either one must be available on demand. Loads without
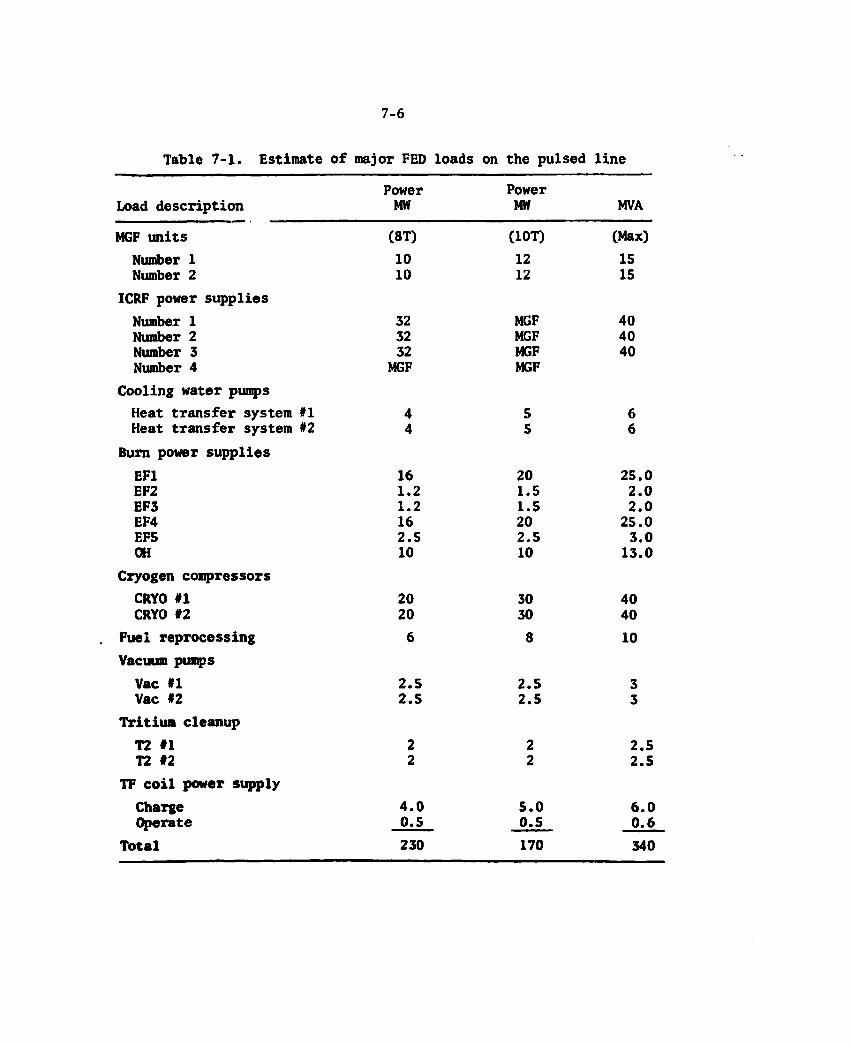
7-6
Table 7-1. Estimate of major FED loads on the pulsed line
Power Power Load description MW MW MVA
MGF units (8T) C10T) (Max) Number 1 10 12 15 Number 2 10 12 15
ICRF power supplies Number 1 32 MGF 40 Number 2 32 MGF 40 Number 3 32 MGF 40 Number 4 MGF MGF
Cooling water pumps Heat transfer system #1 4 5 6 Heat transfer system #2 4 5 6
Burn power supplies EF1 16 20 25.0 EF2 1.2 1.5 2.0 EF3 1.2 1.5 2.0 EF4 16 20 25.0 EF5 2.5 2.5 3.0 OH 10 10 13.0
Cryogen compressors CRYO #1 20 30 40 CRYO #2 20 30 40
Fuel reprocessing 6 8 10 Vacuum pumps
Vac #1 2.5 2.5 3 Vac #2 2.5 2.5 3
Tritium cleanup T2 #1 2 2 2.5 T2 #2 2 2 2.5
TF coil power supply Charge 4.0 5.0 6.0 Operate 0.5 0.5 0.6
Total 230 170 340
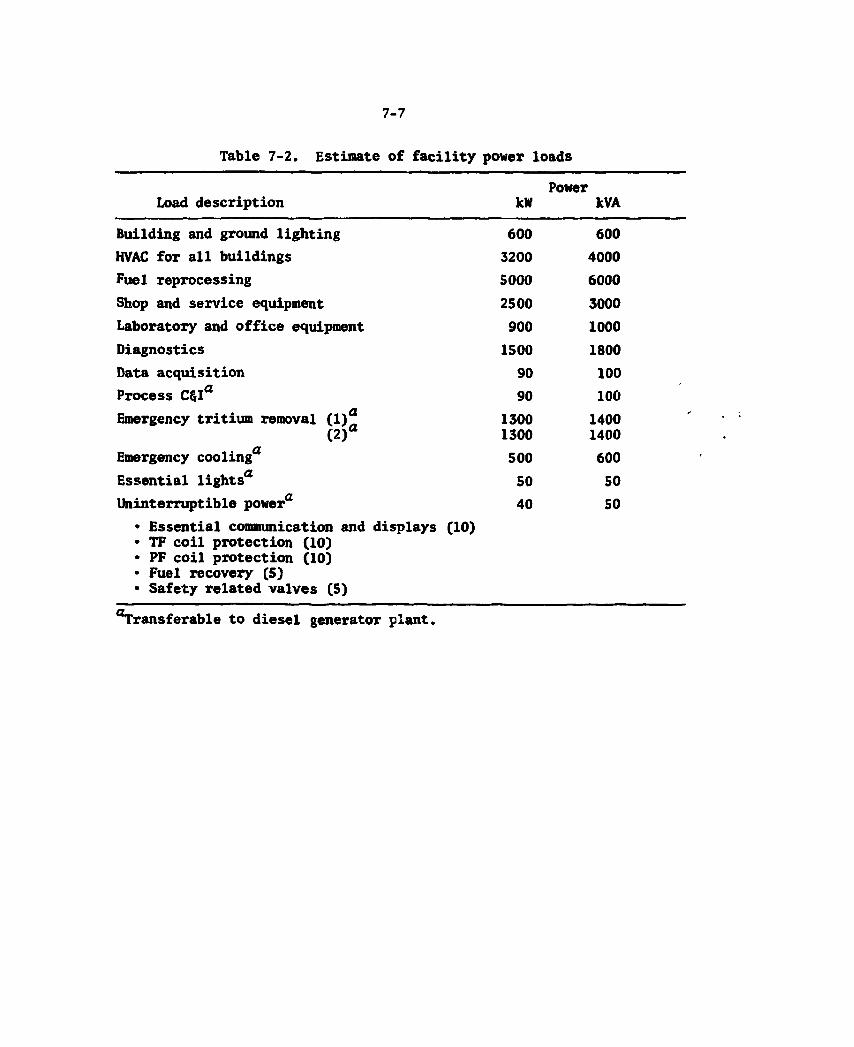
7-7
Table 7-2. Estimate of facility power loads
Power Load description kW kVA
Building and ground lighting 600 600 HVAC for all buildings 3200 4000 Fuel reprocessing 5000 6000 Shop and service equipment 2500 3000 Laboratory and office equipment 900 1000 Diagnostics 1500 1800 Data acquisition 90 100 Process C$Ia 90 100 Emergency tritium removal (1)^ 1300 1400
(2) 1300 1400 Emergency coolinga 500 600 Essential lights'2 50 50 Uninterruptible powera 40 50
• Essential communication and displays (10) • TF coil protection (10) • PF coil protection (10) • Fuel recovery (5) • Safety related valves (5)
"Transferable to diesel generator plant.

7-8
asterisks will normally be operated on facility power, but these normal loads are not transferable to the diesel generators. Superconducting coil protection systems and environmental safety related equipment will be provided with uninterruptible power.
Table 7-3 gives the utility line and backup power requirements data. The pulsed heavy duty line has poor voltage regulation. A 500-kV line is preferred but the 161 kV substation cost is about 5 M$ less than a 500 kV substation. Power transfer between the heavy duty line and the light duty line shall be as indicated in Table 7-3 when a power failure disables one of the two utility lines or main power transformers. If the utility system fails, the diesel generator units shall start auto-matically and pick up the essential transferable loads.
Baseline design description
The pulsed line substation proposed for FED uses three single phase transformers, each having two 13.8 kV secondary windings as shown in Fig. 7-1. A spare transformer, is provided at the substation to restore full power service rapidly if a transformer failure occurs. To reduce the cost there is no bank circuit breaker in either 13.8 kV circuit. For this purpose, differential current measurements between the primary and secondary of the transformers are used to trip the two 500 kV circuit breakers. Service disconnect switches are provided to isolate the high voltage and 13.8 kV circuits for maintenance and backup power operations.
Figure 7-2 is a one-line diagram of the 13.8 kV pulsed distribution substation showing the major loads. Two 13.8 kV transformer secondary windings were selected in lieu of one 13.8 kV winding to reduce the short circuit current and cost of the distribution circuit breakers. The ICRF power supplies can be connected with circuit breakers to take power from the utility line or from the motor-generator-flywheel (MGF) storage units. Each 13.8 kV circuit provides utility power to the motors, cyclo-converters, and exciters of one MGF unit.
TWo double winding transformers, connected to circuit breakers 10 and 11 of Fig. 7-2, provide power to EF1 and EF4 power supplies, cooling water pumps, EF2 and EF3 b u m power supplies and vacuum pumps. The
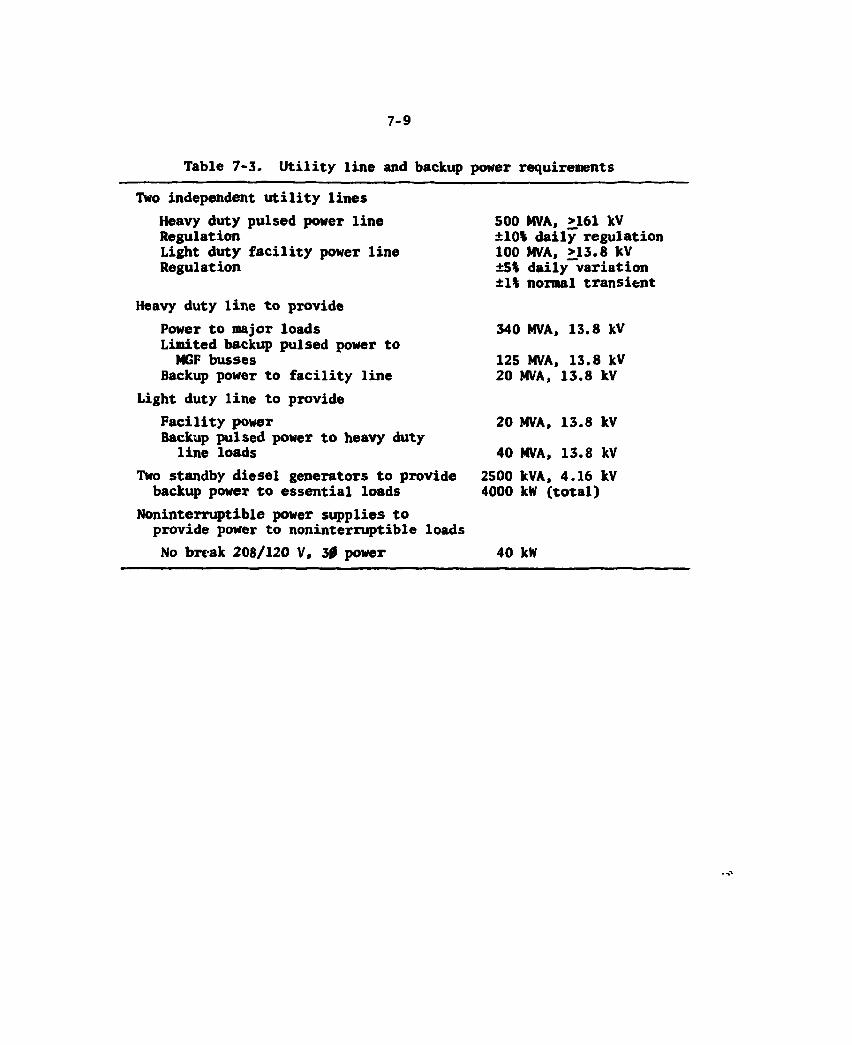
7-9
Table 7-3. Utility line and backup power requirements
Two independent utility lines Heavy duty pulsed power line Regulation Light duty facility power line Regulation
Heavy duty line to provide Power to major loads Limited backup pulsed power to MGF busses
Backup power to facility line Light duty line to provide
Facility power Backup pulsed power to heavy duty
line loads Two standby diesel generators to provide
backup power to essential loads Noninterruptible power supplies to
provide power to noninterruptible loads No break 208/120 V, 30 power
500 MVA, >161 kV ±10% daily regulation 100 MVA, >13.8 kV ±5% daily variation ±1% normal transient
340 MVA, 13.8 kV
125 MVA, 13.8 kV 20 MVA, 13.8 kV
20 MVA, 13.8 kV
40 MVA, 13.8 kV 2500 kVA, 4.16 kV 4000 kW (total)
40 kW
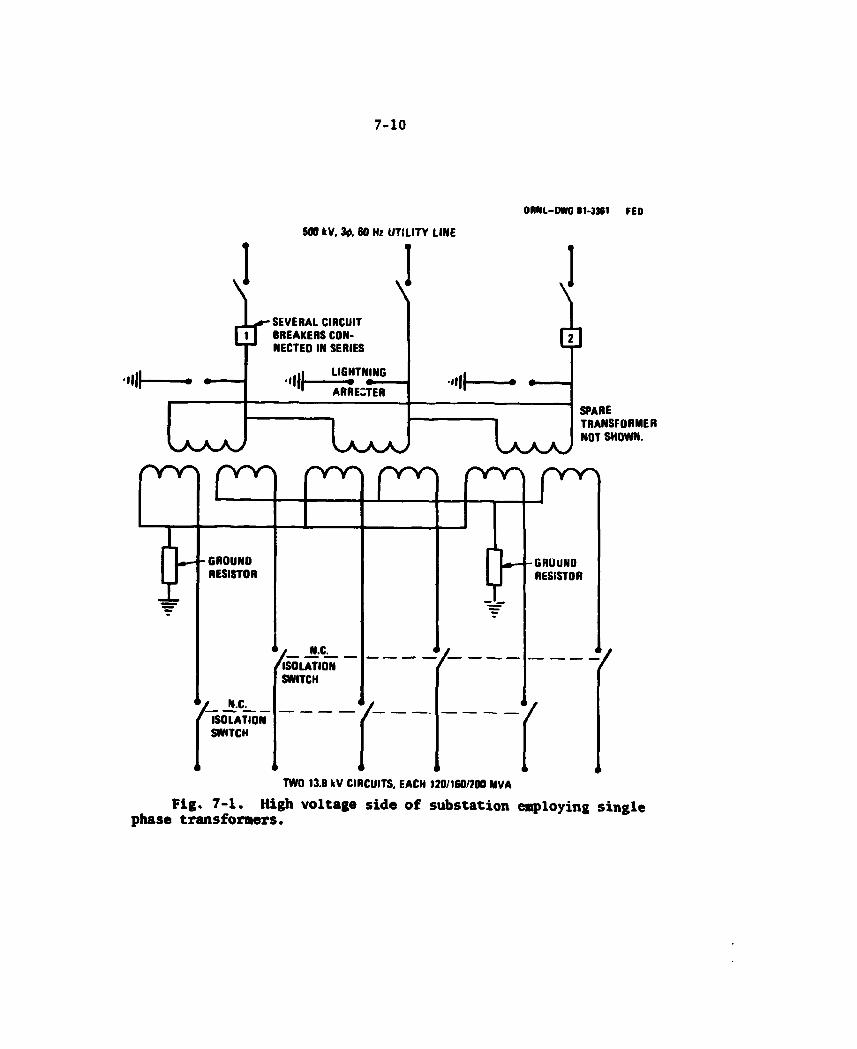
7-10
OHNL-OWG 81-3J81 FED
I SOO kV, 30, SO Hz UTILITV LINE
\ -SEVERAL CIRCUIT
| 1 | BREAKERS CON-NECTED IN SERIES
LIGHTNING
ARRECTER
L a _ a _ a >
I "Ih
SPARE TRANSFORMER NOT SHOWN.
r m
I L - - GROUNO [ J RESISTOR
nr>r\
7-N.C.
ISOLATION SWITCH
i N.C^ ISOLATION SWITCH
n n n
7-
7 -
I GROUND [ J RESISTOR
TWO 13.8 kV CIRCUITS. EACH 120/160/200 MVA
Fig. 7-1. High voltage side of substation employing single phase transformers.
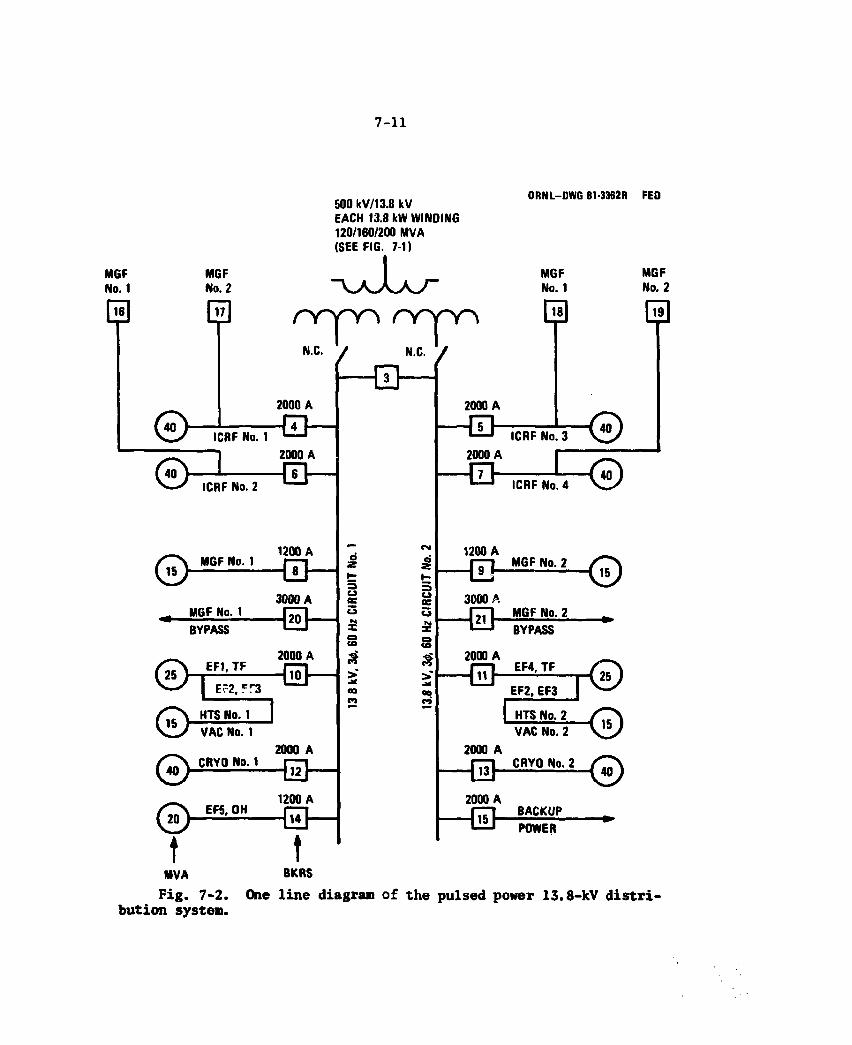
7-11
MGF No. 1
MGF No. 2
a
0
500 kV/13.8 kV EACH 13.8 kW WINDING 120/160/200 MVA (SEE FIG. 7-1)
r v y v ^ i r v y v ^
N.C. • N.C. •
— C D —
ORNL-DWG 81-3376R FED
MGF No. 1
n g
ICRF No
0
0
ICRF No. 2
MGF No. 1
2000 A
t - H H 2000 A
- S —
1200 A
- 0 —
MGF No. 1
0 0 " 0.
0 -t MVA
BYPASS
EF1.TF
3000 A
- E H
E~2, cr3
2000 A - 0
HTS No. 1 VAC No. 1
CRYO No. 1 2000 A
-fl2]
EF5, OH 1200 A
• Q — t BKRS
u oe
to
>*
CM
e
u as u fM X s £ > oo ri
2000 A
— [ 7 1 -
2000 A
- 0 -
ICRF No H 0
1200 A
ICRF No. 4
MGF No. 2
3000 A
— n o -MGF No. 2
2000 A
— G D -
BYPASS
EF4, TF
EF2, EF3
HTS No. 2
2000 A
0
h - G D -
VAC No. 2
CRYO No. 2
2000 A
— G O " BACKUP POWER
MGF No. 2
ra
0 0
Fig. 7-2. One line diagram of the pulsed power 13.8-kV distri-bution system.

7-12
cryogen compressor motors are provided with power via circuit breakers 12 and 13. EF5 and OH burn power supplies receive their power through circuit breaker 14. Circuit breaker 15 is a tie breaker that connects the backup power transfer bus between pulsed power system and the facility power system in Fig. 7-3.
The normal facility loads, identified in Table 7-2, may be connected to either utility system as shown in Fig. 7-3. The transferable loeds can also be connected to the diesel generators if utility power failed. The facility power system normally provides about 20 MVA but can provide an additional 40 MVA to the pulsed load system if the heavy duty line fails. If the facility power fails, the pulsed power system provides 20 MVA to the facility loads.
Other options
Another more reliable, but less cost effective ac power system was considered. It used a 500-kV source with three, 30 transformers to provide pulsed power. Any two of these transformers could carry the entire facility load. This alternate power system has a greater reliability and provides for future expansion, but it was not selected because of the increased cost.
Conclusions
Commercial ac power systems can supply all the FED electrical loads directly from the line except the very-large short-duration loads that occur during the startup and shutdown of each cycle. MGF buffer storage units are provided for the short duration loads.
7.1.2 TF Coil Power Conversion
The toroidal field (TF) coils are charged slowly and operate at steady state for long periods of time. When maintenance is required, the coils are also discharged slowly. However, during a quench, the coils must be discharged rapidly to limit the temperature rise. Low voltage power supplies are used to charge the coils slowly; dump resistors and circuit breakers are used to discharge the coils both slowly and rapidly.
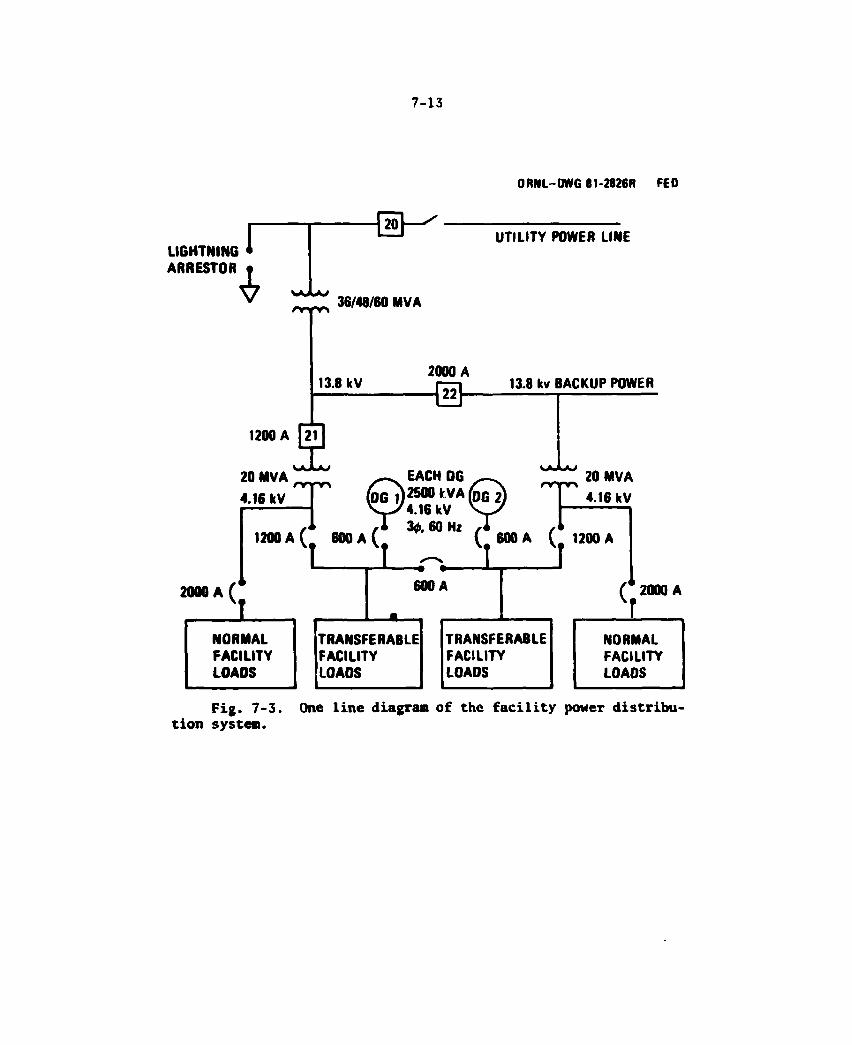
7-13
O R N L - O W G 81-3363R2 FED
LIGHTNING ARRESTOR I
UTILITY POWER LINE
36/48/60 MVA
13.8 kV 2000 A
-QD- 13.8 kv BACKUP POWER
1200 A F ] saJU; 20 MVA " " EACH OG 20 MVA ' ^ / \ nr Ti
4.16 kV W 4 . 1 6 kV V L / 4.16 kV
/l ,1 60 Hz ,1 f > 1200 A ( # 600 A ( # 600 A ( 1200 A
2000 A ( 600 A
•
TRANSFERABLE TRANSFERABLE FACILITY FACILITY LOAOS LOADS
(2000 A
Fig. 7-3. One line diagram of the facility power distribu-tion system.
7-14
Requirements
Toroidal field coil power conversion requirements data are given in Table 7-4. The TF coils must carry nearly equal currents during charge, steady state regulation, and discharge to prevent high unbalanced forces on the coils. For this reason the TF coils aTe connected in series and charged to full current with two power supplies in four hours. The TF coils use forced flow conductors, requiring a coil discharge time constant of about 40 s to prevent the maxima coil temperature from exceeding 200 K during a quench. For a 10-T field, the stored energy is 23.5 GJ which is dissipated in the dump resistors during a rapid discharge. A filtered threshold voltage of approximately 0.2 V has tentatively been selected as a trip level for discharging the TF coils. Coil protection is discussed further under Sect. 7.1.4.
Baseline design description
Table 7-5 contains the design data for the TF coil power conversion and protection system proposed in Fig. 7-4. Two 65-V power supplies charge the TF coils from 0 to 25 kA in four hours. About 460 watts of power are dissipated in the shunt dump resistors (2 Rd) when charging the coils, which is negligible compared to the fast discharge peak power of 62.5 MM.
Referring to Fig. 7-4, a slow discharge (one hour time constant) can be initiated by connecting the resistors (2R) across a power supply with switches S-l or S-6 and opening the corresponding circuit breakers. If both switches S-l and S-6 are used, the discharge time constant is 30 minutes. A fast discharge is initiated by opening all the switches across the circuit breakers that carry the continuous 25 kA and then opening the circuit breakers. During a fast discharge, half the power is dissipated in the dump resistors across the coil and the other half in the dump resistors across the circuit breakers. Transient suppressors limit the transient voltage across the power supplies during a plasma disruption.
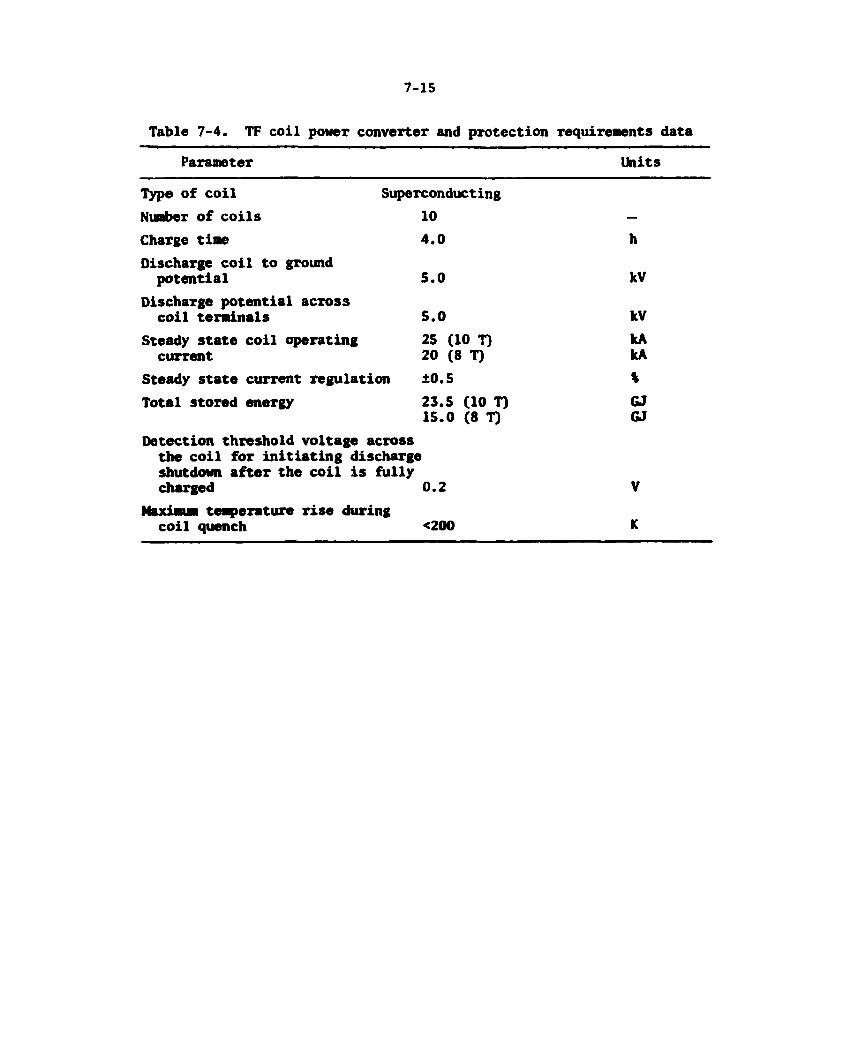
7-15
Table 7 - 4 . TF c o i l power converter and p r o t e c t i o n requirements data
Parameter Un i ts
Type o f c o i l Superconducting
Number o f c o i l s 10 —
Charge t ime 4 . 0 h
Discharge c o i l t o ground p o t e n t i a l 5 . 0 kV
Discharge p o t e n t i a l across c o i l t e r m i n a l s 5 . 0 kV
Steady s t a t e c o i l opera t ing cur rent
25 (10 T) 20 (8 T)
kA kA
Steady s t a t e cur rent r e g u l a t i o n 10 .5 % T o t a l s tored energy 2 3 . 5 (10 T)
15 .0 (8 T) GJ GJ
Detec t ion th resho ld v o l t a g e across the c o i l f o r i n i t i a t i n g discharge shutdown a f t e r the c o i l i s f u l l y charged 0 . 2 V
Maximum t e ^ t e r a t u r e r i s e dur ing c o i l quench <200 K
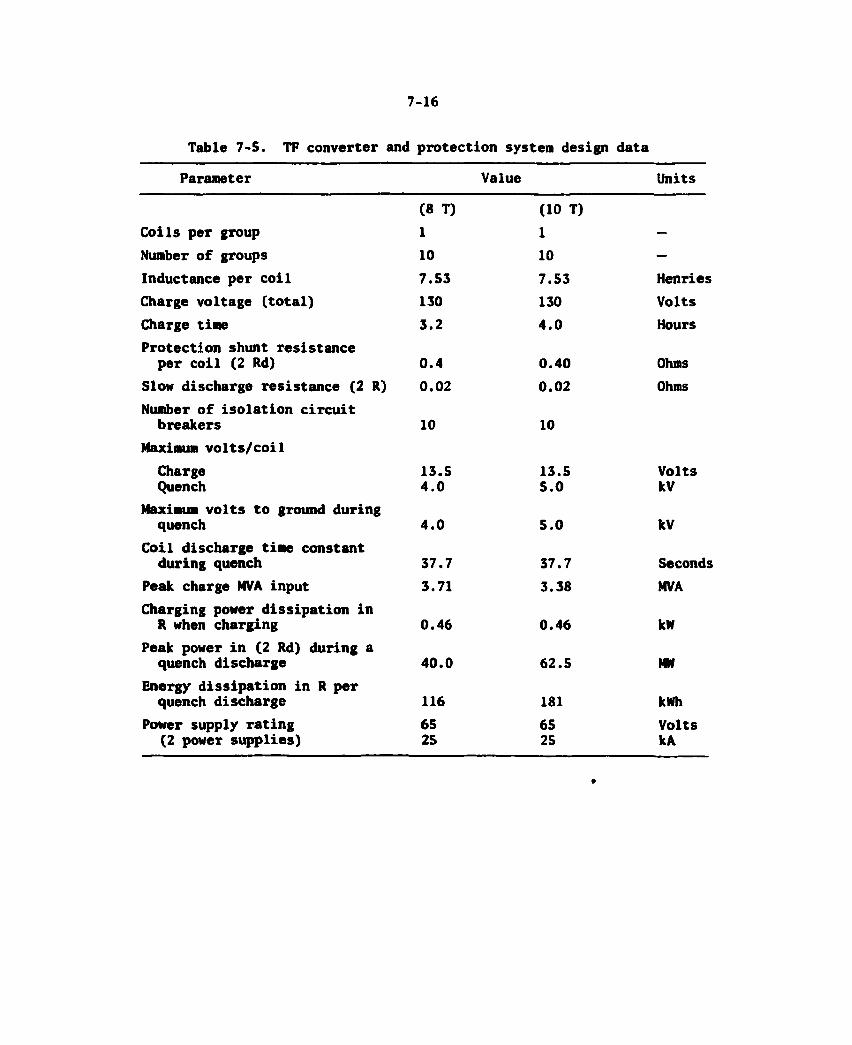
7-16
Table 7-5. TP converter and protection system design data
Parameter Value Units
(8 T) (10 T) Coils per group 1 1 —
Number of groups 10 10 —
Inductance per coil 7.53 7.53 Henries Charge voltage (total) 130 130 Volts Charge time 3.2 4.0 Hours Protection shunt resistance per coil (2 Rd) 0.4 0.40 Ohms
Slow discharge resistance (2 R) 0.02 0.02 Ohms Number of isolation circuit
breakers 10 10 Maximum volts/coil
Charge Quench
13.5 4.0
13.5 5.0
Volts kV
Maximum volts to ground during quench 4.0 5.0 kV
Coil discharge time constant during quench 37.7 37.7 Seconds
Peak charge MVA input 3.71 3.38 MVA Charging power dissipation in
R when charging 0.46 0.46 kW Peak power in (2 Rd) during a
quench discharge 40.0 62.5 Ml Energy dissipation in R per
quench discharge 116 181 kWh Power supply rating
(2 power supplies) 65 25
65 25
Volts kA
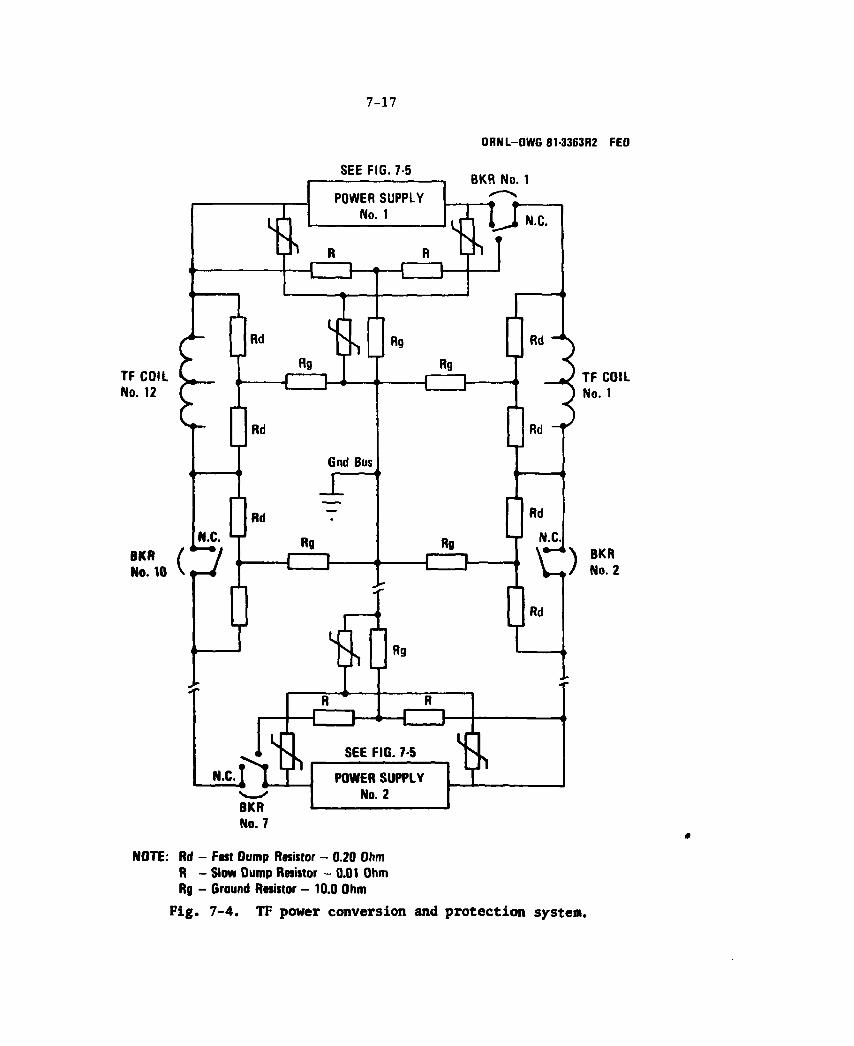
7-17
ORNL-OWG 81-3363R2 FED
SEE FIG. 7-5 BKR No. 1
TF COIL No. 12
BKR No
R t ~ J >. 10 i
TF COIL No. 1
BKR No. 2
NOTE: Rd - Fast Dump Resistor - 0.20 Ohm R - Slow Dump Resistor - 0.01 Ohm Rg - Ground Resistor - 10.0 Ohm
Fig. 7-4. TF power conversion and protection system.

7-18
The details of the low voltage power supplies are shown in Fig. 7-5. Four 6-pulse rectifier modules are connected in parallel to provide the operating current of 25 kA. During the charge period, the 120 V circuit breakers are open and the 480 V circuit breakers are closed providing a maximum voltage of 65 VDC at the power supply output. Once the TF coil current of 25 kA is established, the required voltage to sustain and regulate the current is about 10 V (just enough to provide the voltage drop across the 25 kA bus and the coil leads). Therefore, when the current approaches the desired operating value, the 480 V circuit breakers are opened and the 120 V circuit breakers are closed. The primary controller then controls the voltage to the rectifiers to hold the TF coil current at the desired value. The low voltage controller operates efficiently near its design point for long periods of time.
Performance
The baseline power conversion system provides a fixed four hour charge rate which can be stopped at any time by opening the 480 V circuit breakers to the low voltage power supply. It is also possible to charge at a 16 hour rate by connecting the low voltage power supplies to the variable voltage primary controller which also permits a taper charge to the desired current level. One low voltage primary controller also provides for efficient operation when regulating the current after the desired current is established. If only one of the two power supplies were used to charge the coils, the maximum charge rate is 8 hours. One power supply can maintain the 10 volts needed during steady state regu-lation. The power supplies, therefore, provide redundancy, flexibility, and efficient performance.
The power supplies are generally not used to discharge the coils. They are turned off and disconnected with circuit breakers; the discharge rate is controlled by dump resistor values. There are three possible discharge rates provided by the dump resistors. A slow discharge rate with a one hour discharge time is achieved by turning off the power supplies and opening one of the power supply circuit breakers. A 30-minute discharge time is available by opening both power supply breakers,
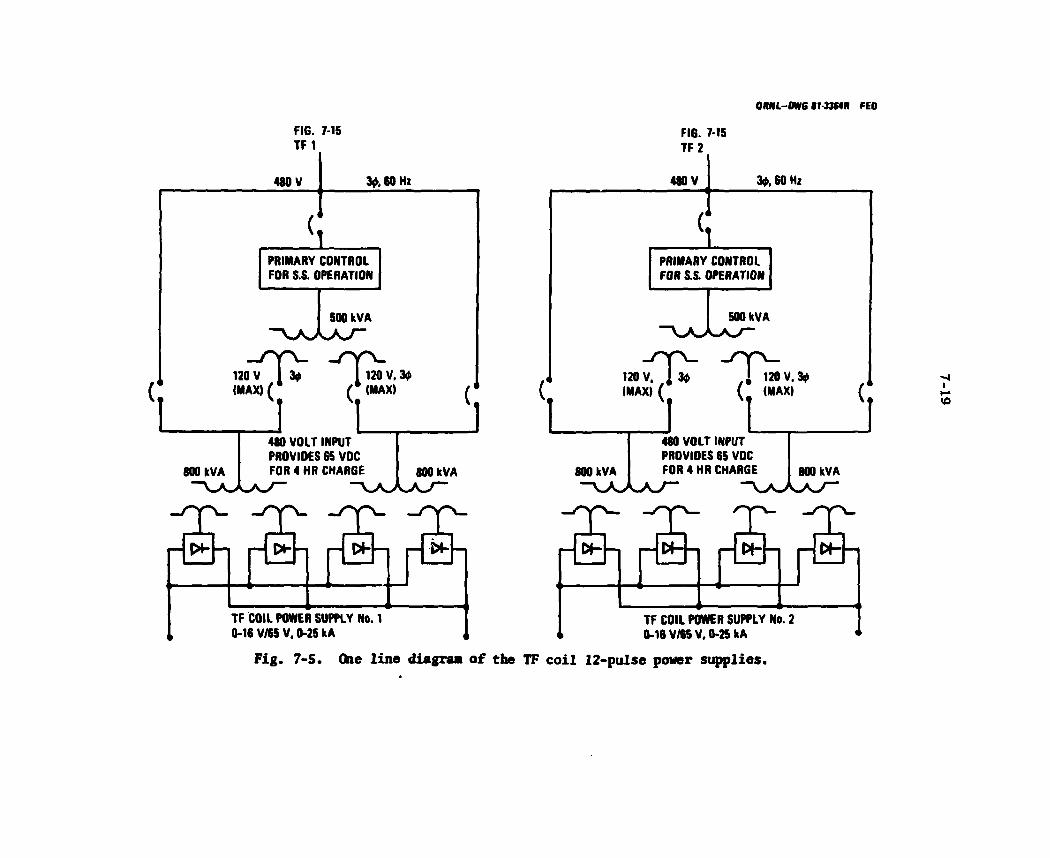
ORNL-DWG I1-3364R FEO
FIG. 7-15 TF 1
480 V 3$, 60 Hi
PRIMARY CONTROL FOR S.S. OPERATION
120 V I 30 I 120 V. 3<t> (MAX) ( ( (MAX) J L
800 kVA
480 VOLT INPUT PROVIDES 65 VDC FOR 4 HR CHARGE 800 kVA
FIG. 7-15 TF 2
480 V 3$, 60 Hz
PRIMARY CONTROL FOR S.S. OPERATION
] 1 _ O p v _ j n p L .
120 V. ] 30 1 120 V, 30 (MAX) ( (. (MAX) J L
800 kVA
480 VOLT INPUT PROVIDES 65 VOC FOR 4 HR CHARGE 800 kVA
" " d ^ " " T ^ ^ C C ™ r— PH—I — l>—I I - W - - I r~ ' W —
TF COIL POWER SUPPLY No. 1 0-16 V/65 V. 0-25 kA
r- W — W — r- W — W —
TF COIL POWER SUPPLY No. 2 0-16 V/6S V. 0-25 kA
Fig. 7-5. Que line diagram of the TF coil 12-pulse power supplies.

7-20
and a 37-s rapid discharge is available by opening all 10 circuit breakers. A very slow controlled discharge is also possible by turning off one power supply and opening its circuit breaker while operating the other power supply at reduced voltage.
Other options
Inverters were considered for discharging the coils. Relatively inexpensive low voltage inverters could be used to return the stored energy of the coils to the power line during a slow discharge. However, it would require expensive high voltage inverters to discharge the coils within a minute, and furthermore, the utility line could not absorb the 23.5 GJ within one minute. Inverters are not 100% reliable and would require backup dump resistors anyway. Therefore, the dump resistor discharge system was selected. Failure of a single circuit breaker to open does not prevent a fast discharge nor exceed the voltage ratings of the coils.
Counter pulse circuit breakers for interrupting 25 kA at 5 kV are a relatively new device. A shunt switch is also needed to carry the 25 kA coil current continuously. The switch must be interlocked with the circuit breaker control so that it opens first in the interrupt sequence. If rapid discharges occur infrequently, as they must for high availability, replaceable fuse links and resistors may be used in lieu of circuit breakers and shunt switches.
Conclusions
The TF coil power supplies can be constructed with commercially available power modules at relatively low cost compared to the TF coil protection system. Future work should be devoted to coil protection to assure that a reliable protection system can be provided at a reasonable cost without reducing the machine availability. A system of three inde-pendent protection channels, each having a separate uninterruptible power supply, shown in Fig. 7-6, has the potential of meeting these objectives as discussed further under Sect. 7.1.4 below.
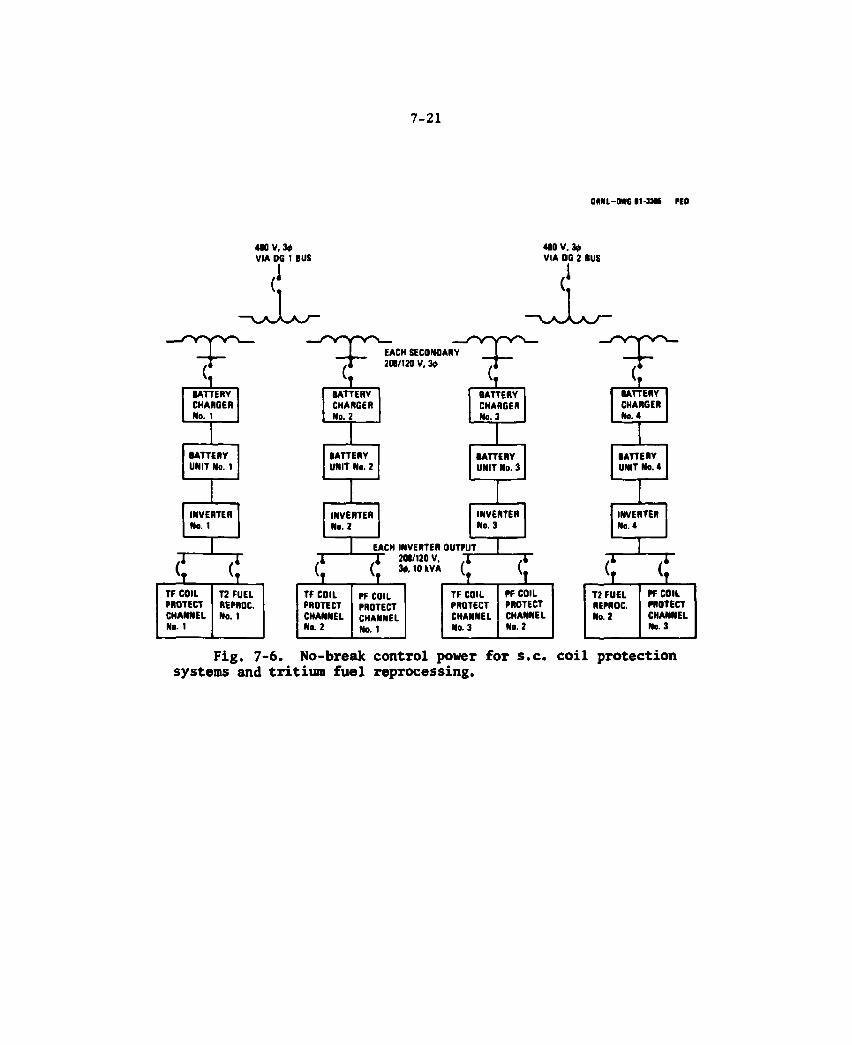
7-21
0 NHL-OMfG 11-UH FEO
MOV, 3* VIA DG 1 BUS
,1
TF COIL T2 FUEL PROTECT REPROC. CHANNEL No. 1 No. 1
EACH SECONOARY 208/120 V, 3<t>
BATTERY CHARGER No. 3
BATTERY UNIT No. 3
INVERTER No. 3
TF COIL PF COIL PROTECT PROTECT CHANNEL CHANNEL No. 2 No. 1
EACH INVERTER OUTPUT X 201/120 V, X " ( 34.10 kVA (
uo v. s*
VIA OG 2 BUS
( i
TF COIL PF COIL PROTECT PROTECT CHANNEL CHANNEL No. 3 No. 2
BATTERY CHANGER No. 4
BATTERY UNIT No. 4
INVERTER No. 4
T2 FUEL PF COIL REPROC. PROTECT No. 2 CHANNEL
No. 3
Fig. 7-6. No-break control power for s.c. coil protection systems and tritium fuel reprocessing.

7-22
The design, construction, and building space allocation for the circuit interrupters and the dump resistors need to be addressed. Preliminary equipment specifications need to be prepared which can be used as the basis for more refined cost estimating. The design, construction, and routing of the 25 kA busses, and the control and instrumentation cables between the reactor cell and the electrical building require careful attention. Electrical penetrations through the reactor cell building walls must be gas tight to meet environmental requirements. This work should be coordinated with architect-engineers who design the buildings and their support facilities.
7.1.3 PP Coil Power Conversion
The PF coil power converters receive ac power from the MGF units or the utility line and convert it to pulsed dc power needed for the PF coils during the startup, burn, and shutdown phases of a normal operating cycle. Reversible power converters are required so that they can return part of the stored energy in the PF coils to the MGF units when the coils are in the discharge part of their cycle and thereby jrcovide a rapid, controlled shutdown needed for terminating each cycle. The power converters take power from the stored energy of the MGF units during the startup phase, take power from thfe utility line during the b u m phase, and return power to the MGF units during the shutdown phase. In addition, the PF system provides for coil protection if a quench occurs and the PF converters fail to operate.
Requirements
Poloidal field coils require pulsed dc voltages to generate a prescribed set of current waveforms. The characteristics and location of the coils that generate the poloidal fields determine the power conversion requirements. Figure 7-7, extracted from Ref. 2, shows the identification and location of the poloidal field coils. Control coils CF1 through CF4 and equilibrium field coils EF1 and EF4 are water-cooled copper coils. All other coils are superconducting. The high voltage
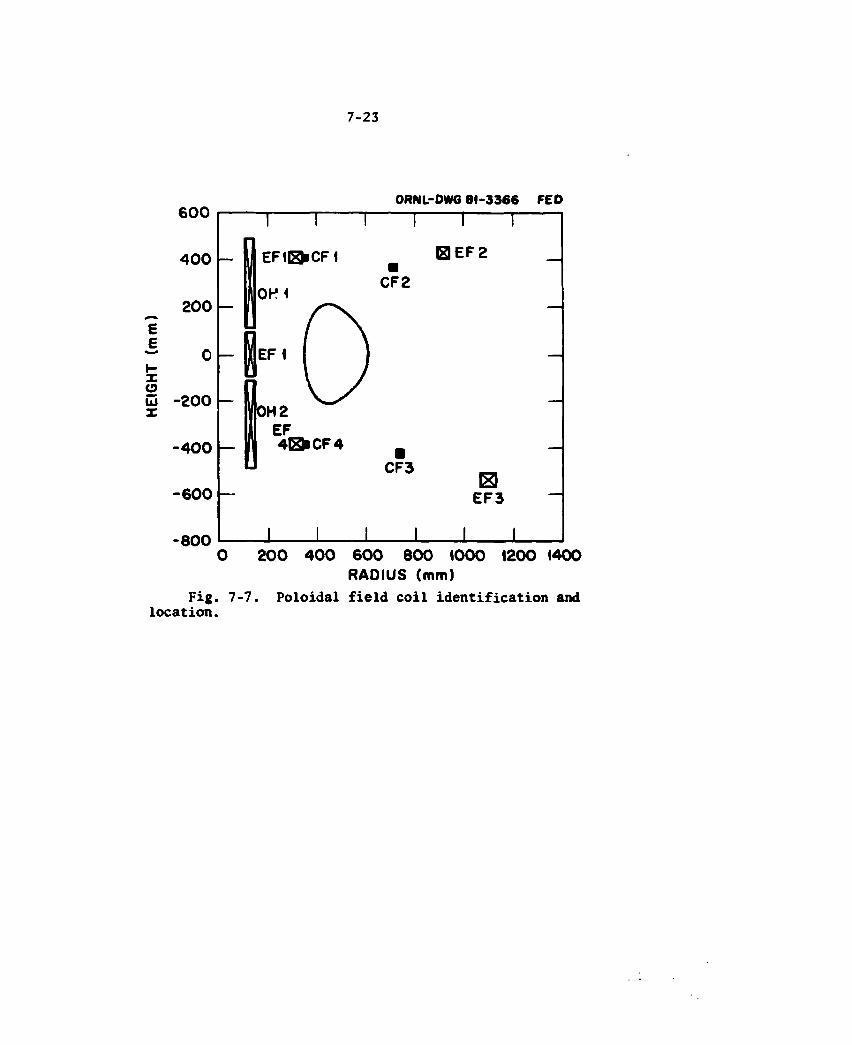
7-23
6 0 0
4 0 0
_ 200 E E - 0 I-x o D -200 z
- 4 0 0
- 6 0 0
-800 0 2 0 0 4 0 0 6 0 0 8 0 0 1 0 0 0 1200 1400
RADIUS (mm) Fig. 7-7. Poloidal field coil identification and
location.
ORNL-DWG 81-3366 FED I I I I I I
E F I I ^ C F I • B E F 2 —
C F 2 OH 1 r\ —
-—
-
L vy OH 2
—
EF 4 g * C F 4 • —
CF3 El
CF3 El
I I I I
E F 3
I I
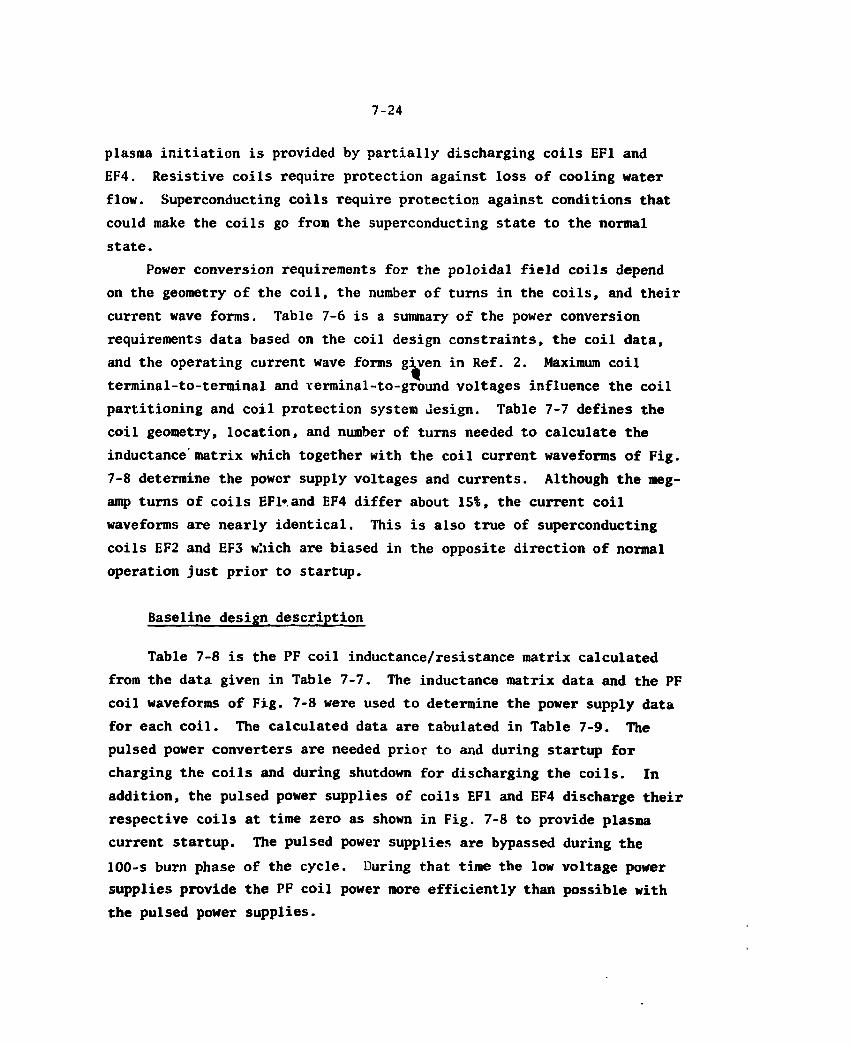
7-24
plasma initiation is provided by partially discharging coils EF1 and EF4. Resistive coils require protection against loss of cooling water flow. Superconducting coils require protection against conditions that could make the coils go from the superconducting state to the normal state.
Power conversion requirements for the poloidal field coils depend on the geometry of the coil, the number of turns in the coils, and their current wave forms. Table 7-6 is a summary of the power conversion requirements data based on the coil design constraints, the coil data, and the operating current wave forms g^ren in Ref. 2. Maximum coil terminal-to-terminal and verminal-to-ground voltages influence the coil partitioning and coil protection system Jesign. Table 7-7 defines the coil geometry, location, and number of turns needed to calculate the inductance'matrix which together with the coil current waveforms of Fig. 7-8 determine the power supply voltages and currents. Although the meg-amp turns of coils EFl*.and EF4 differ about 15%, the current coil waveforms are nearly identical. This is also true of superconducting coils EF2 and EF3 which are biased in the opposite direction of normal operation just prior to startup.
Baseline design description
Table 7-8 is the PF coil inductance/resistance matrix calculated from the data given in Table 7-7. The inductance matrix data and the PF coil waveforms of Fig. 7-8 were used to determine the power supply data for each coil. The calculated data are tabulated in Table 7-9. The pulsed power converters are needed prior to and during startup for charging the coils and during shutdown for discharging the coils. In addition, the pulsed power supplies of coils EF1 and EF4 discharge their respective coils at time zero as shown in Fig. 7-8 to provide plasma current startup. The pulsed power supplies are bypassed during the 100-s burn phase of the cycle. During that time the low voltage power supplies provide the PF coil power more efficiently than possible with the pulsed power supplies.
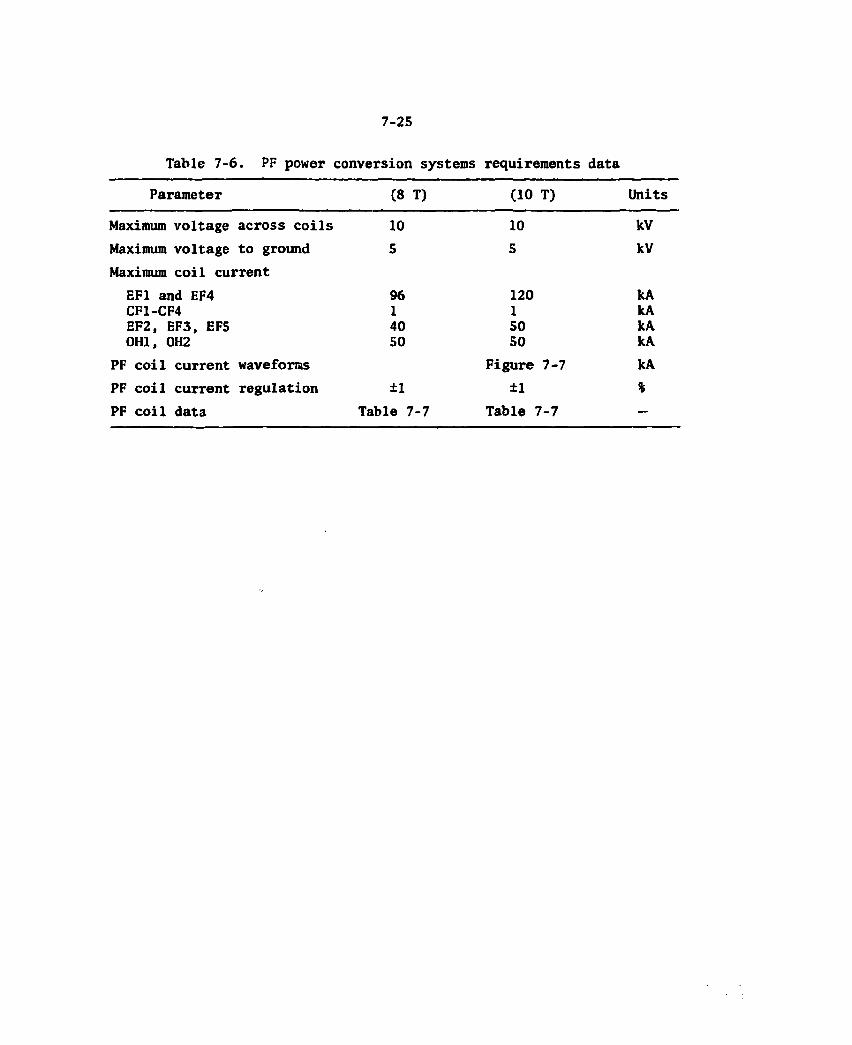
7-25
Table 7-6. PF power conversion systems requirements data
Parameter (8 T) CIO T) Units
Maximum voltage across coils 10 10 kV Maximum voltage to ground 5 5 kV Maximum coil current
EF1 and EF4 96 120 kA CF1-CF4 1 1 kA EF2, EF3, EF5 40 50 kA 0H1, 0H2 50 50 kA
PF coil current waveforms Figure 7-7 kA PF coil current regulation ±1 ±1 % PF coil data Table 7-7 Table 7-7 —
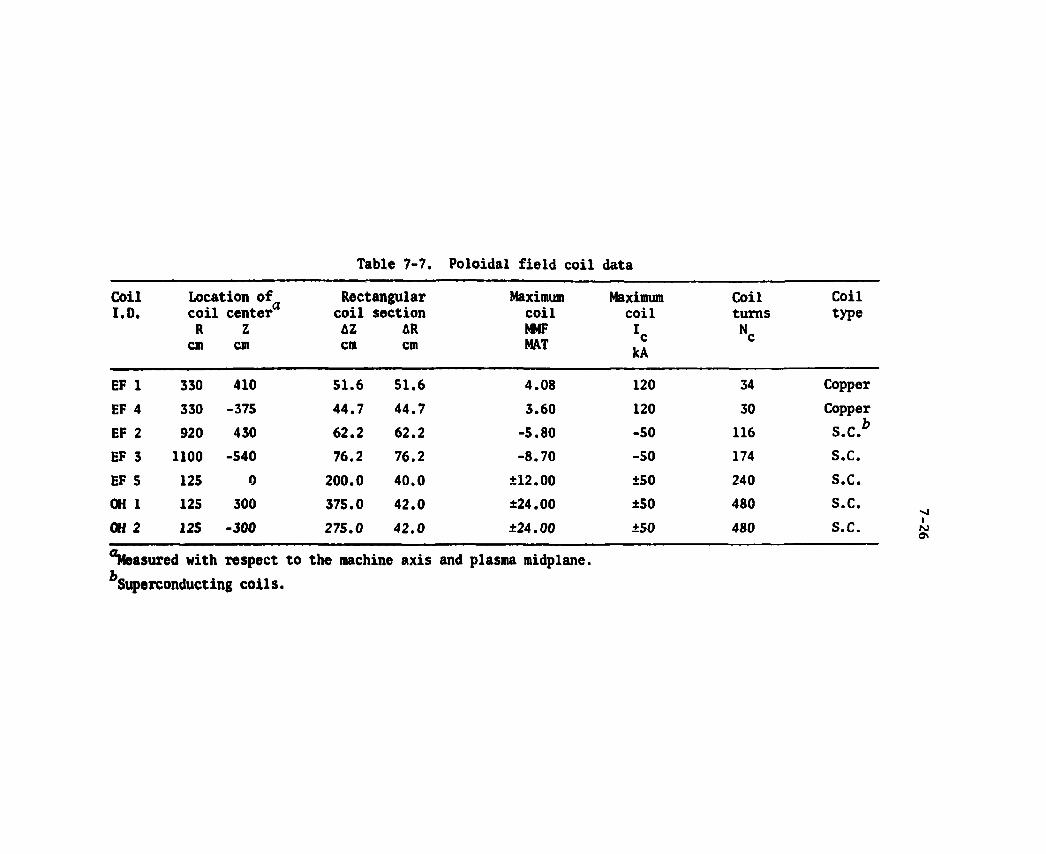
Table 7-7. Poloidal field coil data
Coil I.D.
Location of coil center R Z
cm cm
Rectangular coil section AZ AR cm cm
Maximum coil M F MAT
Maximum coil
kA
Coil turns Nc
Coil type
EF 1 330 410 51.6 51.6 4.08 120 34 Copper EF 4 330 -375 44.7 44.7 3.60 120 30 Copper
*
EF 2 920 430 62.2 62.2 -5.80 -50 116 S.C.b
EF 3 1100 -540 76.2 76.2 -8.70 -50 174 s . c . EF 5 125 0 200.0 40.0 ±12.00 ±50 240 s . c . OH 1 125 300 375.0 42.0 ±24.00 ±50 480 s . c . OH 2 125 -300 275.0 42.0 ±24.00 ±50 480 s . c .
''Measured with respect to the machine axis and plasma midplane. ^Superconducting coils.
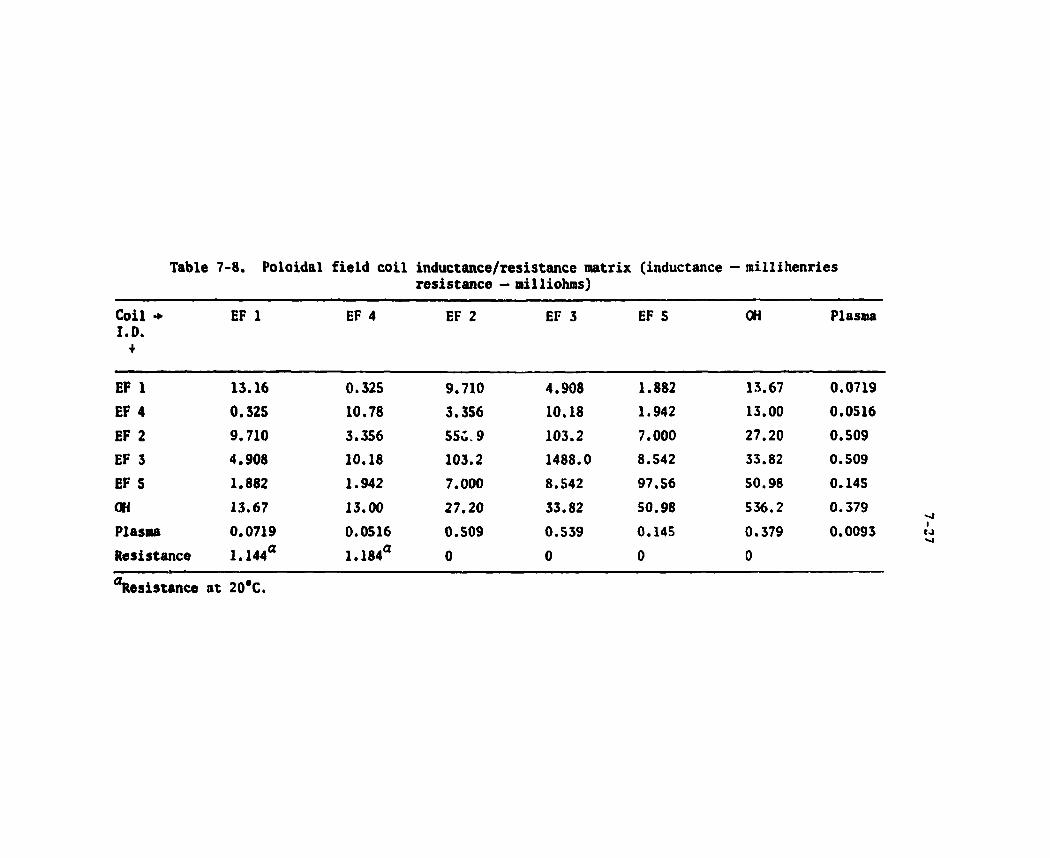
Table 7-8. Poloidal field coil inductance/resistance matrix (inductance - millihenries resistance — milliohms)
Coil * I.D. +
EF 1 EF 4 EF 2 EF 3 EF 5 OH Plasma
EF 1 13.16 0.32S 9.710 4.908 1.882 13.67 0.0719 EF 4 0.325 10.78 3.356 10.18 1.942 13.00 0.0516 EF 2 9.710 3.356 550. 9 103.2 7.000 27.20 0.509 EF 3 4.908 10.18 103.2 1488.0 8.542 33.82 0.509 EF 5 1.882 1.942 7.000 8.542 97.56 50.98 0.145 OH 13.67 13.00 27.20 33.82 50.98 536.2 0.379 Plasma 0.0719 0.0516 0.509 0.539 0.145 0.379 0.0093 Resistance 1.144a 1.184® 0 0 0 0
"Resistance at 20°C.
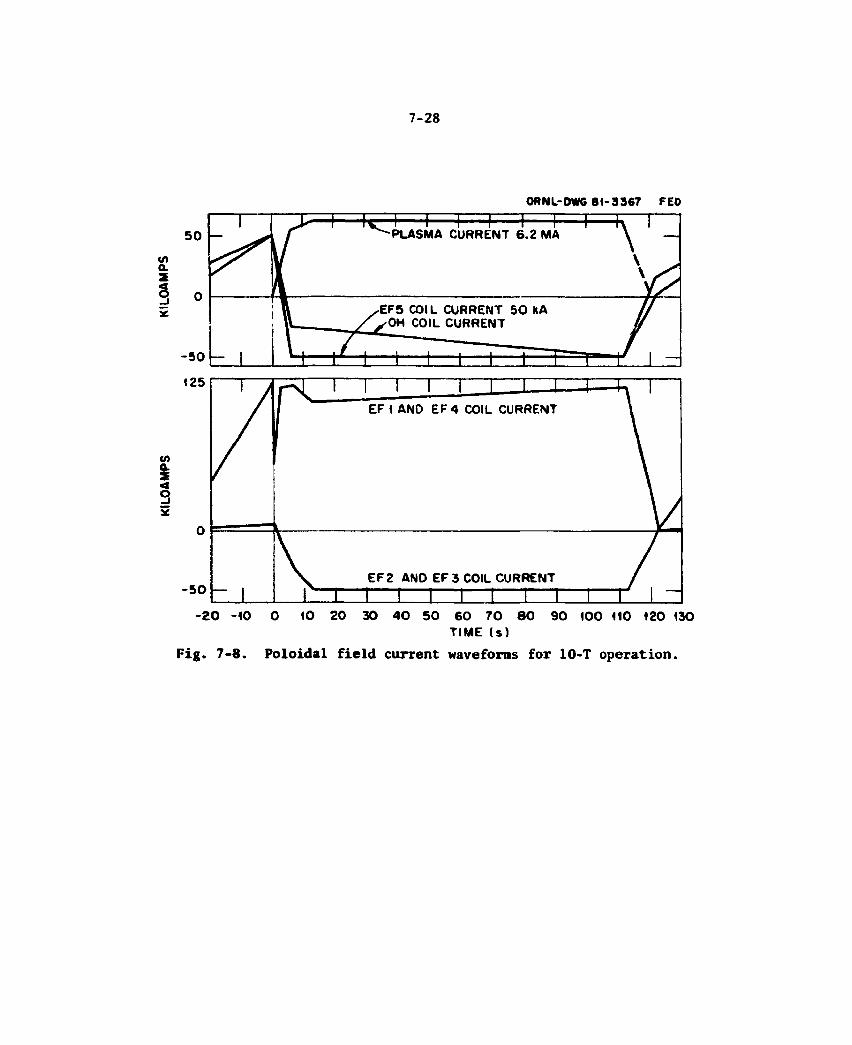
7-28
ORNL-DWG 81-3 367 FEO
ui a. S S
to a S < Q
- 2 0 -10 0 10 20 30 4 0 5 0 6 0 7 0 8 0 9 0 100 110 120 130 TIME (s )
Fig. 7-8. Poloidal field current waveforms for 10-T operation.

Table 7-9. Polo&dal field power conversion and protection system data
Coi l Coi l Max vo l ts Rated Max Peak Peak Pulsed power Steady state I . D . sections per c o i l coil DI/DT voltage power supply capacity power supply
section current capacity kV kA kA/s kV MW kV/kA/MW V/kA/MK
EF 1 (B l ip ) 1 5 120 165 2.40 288 2.5/120/300 200/120/20.0 EF 4 (B l ip ) 1 5 120 167 2.02 243 2.5/120/300 200/120/20.0 EF 2 1 5 50 -6.5 3.99 200 5/50/250 50/50/1.5 EF 3 2 5 50 -6.1 9.55 478 10/50/500 50 /50 /1 .5
EF 5 1 5 50 - 18 .8 2.63 132 5/50/150 100/50/2.5
OH 2 5 50 -12 .5 6 .90 345 10/50/500 300/50/10
7-30
From Table 7-9 it may be noted that coil voltages do not exceed 5 kV if they are provided with a grounded center top (equivalent to 2 coil sections). Each power supply must provide very large currents which are generated by operating 10 power supply modules in parallel.
The basic modules proposed to synthesize the PF coil power converters are given in Figs. 7-9 through 7-13 designated as Type A, B, C, D, and E power modules, respectively. These modules are based on recent developments in large thyristors which will soon be available.
Type A modules of Fig. 7-9 are two-quadrant converters in which current can flow in one direction only. They can supply a rated output of 5 kV, 5 kA. A burn phase low voltage six-pulse diode bridge is connected between the high voltage rectifier inverter units. Type B power conversion modules (Fig. 7-10) are four quadrant rectifier-inverter modules with low voltage operation in one direction only. Type B modules provide for bidirectional power flow having a rating of ±5 kV, ±5 kA.
Type C and D modules contain additional six-pulse rectifier inverter units placed in series to increase the voltage rating of the power supplies. Type C modules (Fig. 7-11) provide two quadrant operation with current flow in one direction only. The high voltage bridges can be bypassed for operation on the low voltage section only. Type D power modules (Fig. 7-12) provide four quadrant operation with bidirectional power flow. Low voltage burn phase operation is restricted to one direction only.
The water-cooled copper coil-s require very high current (120 kA) at relatively low voltage (200 V) during most of the cycle. Six-pulse bridges of a double-winding transformer are connected in parallel to form a Type E module. This module has a 2.5 kV inverter connected in series as shown in Fig. 7-13 to provide the Tapid discharge needed during startup.
Figure 7-14 is a one-line diagram showing the common primary power controllers of the low voltage burn phase power units for the supercon-ducting coils. One SCR primary power controller provides controlled voltage to the ten low voltage rectifier units of each burn phase power supply. Considerably more power is needed for water-cooled coils re-quiring larger primary controllers as shown in Fig. 7-15.
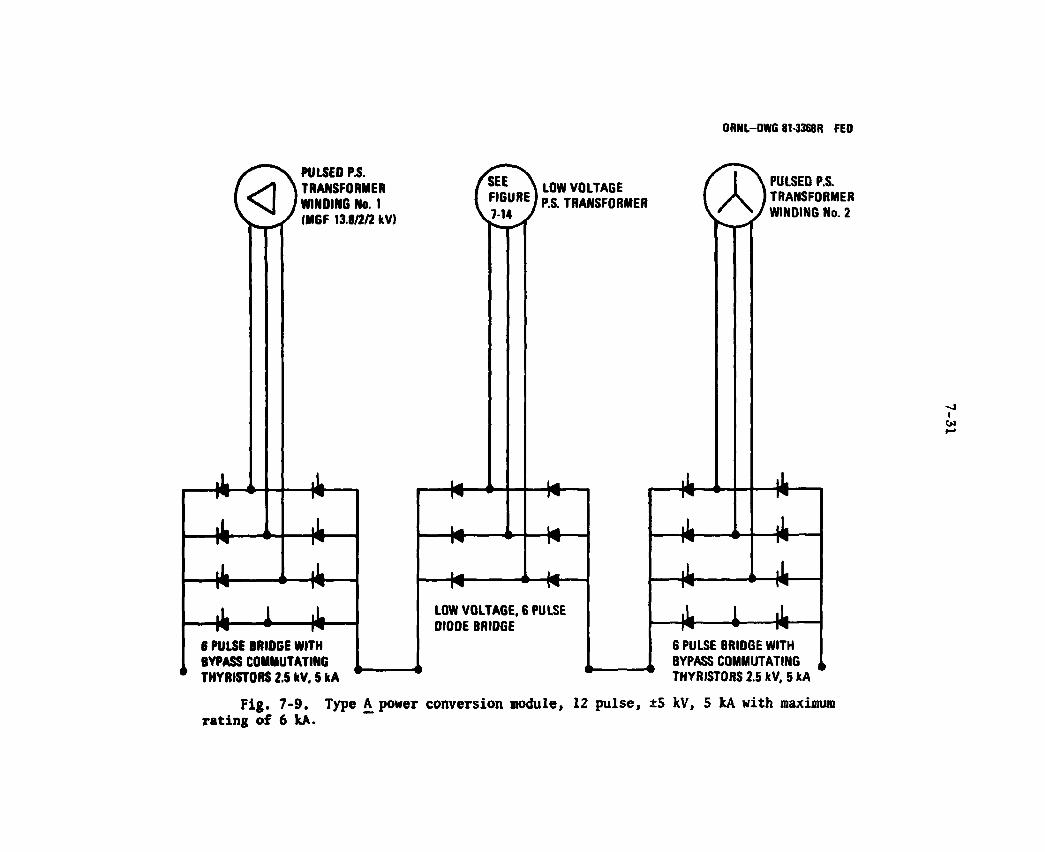
ORNL-DWG 81-3368R FEO
Fig. 7 - 9 . Type A power conversion module, 12 pulse, ±5 kV, 5 kA wi th maximum r a t i n g of 6 kA.
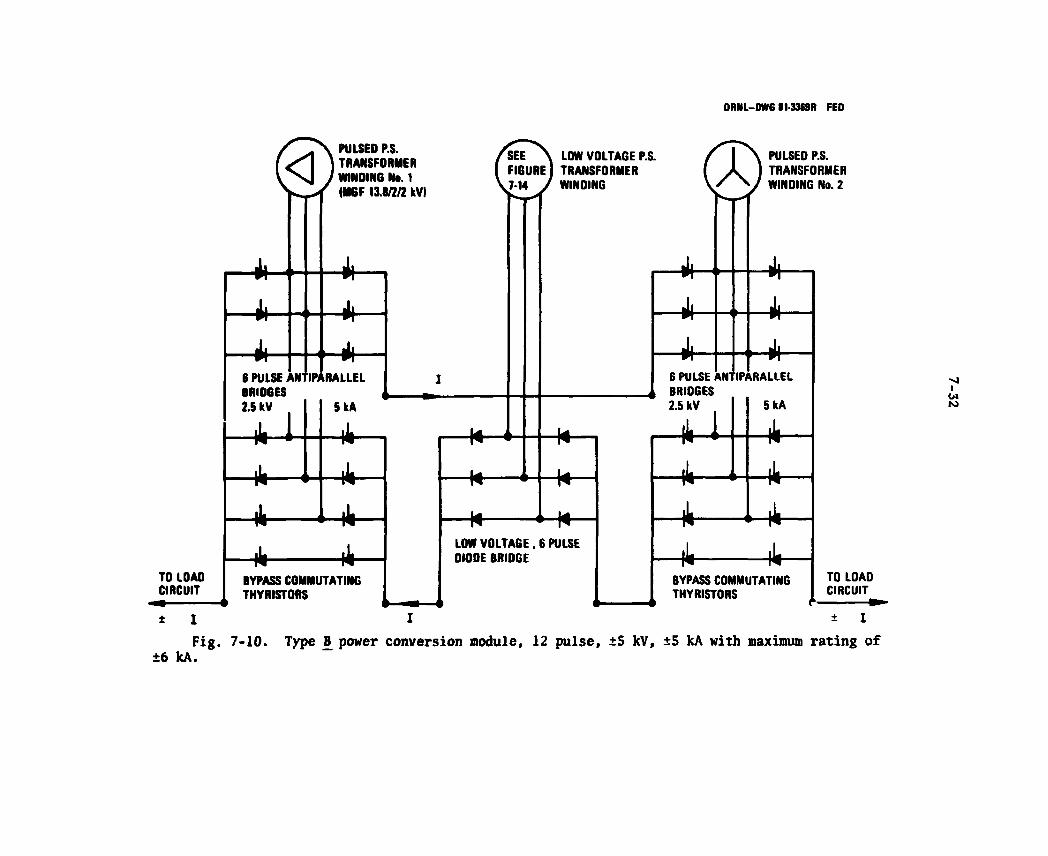
ORNL-DWG I1-3364R FEO
Fig. 7-10. Type JJ power conversion module, 12 pulse, ±5 kV, ±5 kA with maximum rating of ±6 kA.
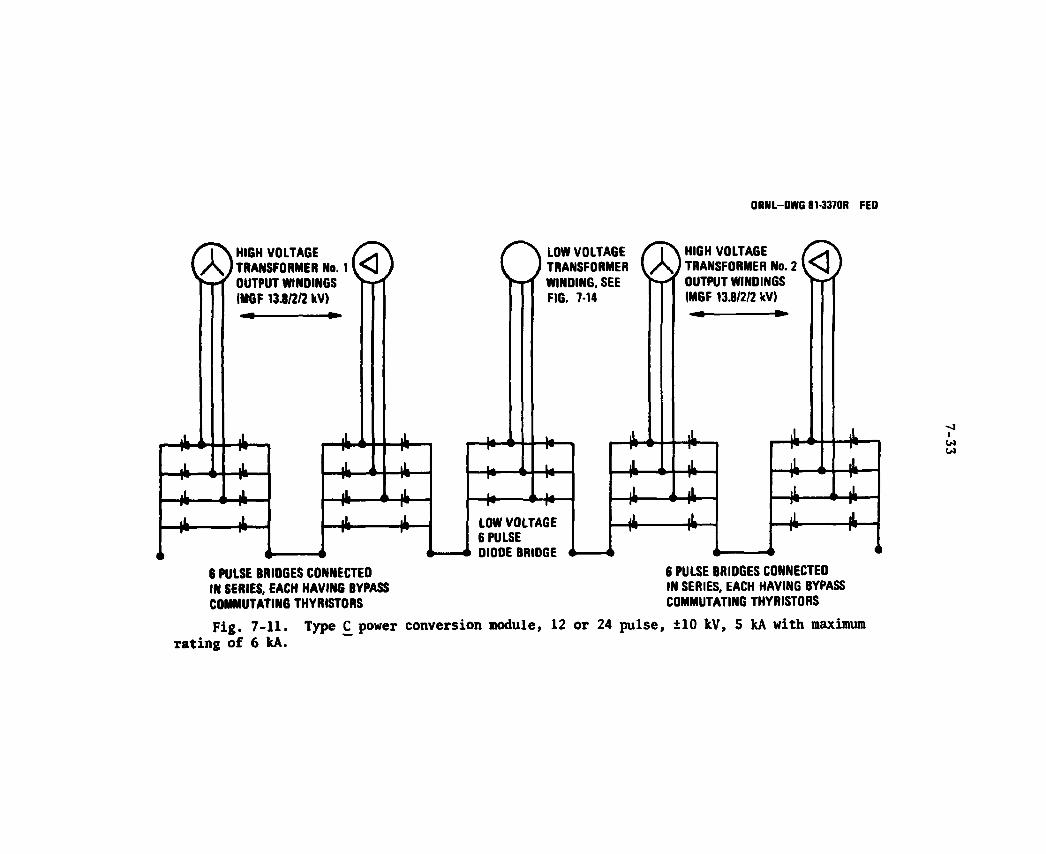
ORNL-DWG 81-3370R FED
®HIGH VOLTAGE / C T \ TRANSFORMER No. 1 V V j ) OUTPUT WINDINGS V ^ T (MGF 13.8/2/2 kV)
•4
•f-
o LOW VOLTAGE TRANSFORMER WINDING. SEE FIG. 7-14
LOW VOLTAGE 6 PULSE DIODE BRIDGE
®HIGH VOLTAGE TRANSFORMER No. 2 J OUTPUT WINDINGS V J / (MGF 13.8/2/2 kV)
•4 4
Hi t
6 PULSE BRIDGES CONNECTED IN SERIES. EACH HAVING BYPASS COMMUTATING THYRISTORS
6 PULSE BRIDGES CONNECTED IN SERIES. EACH HAVIN6 BYPASS COMMUTATING THYRISTORS
Fig. 7-11. Type C power conversion module, 12 or 24 pulse, ±10 kV, 5 kA with maximum rating of 6 kA.
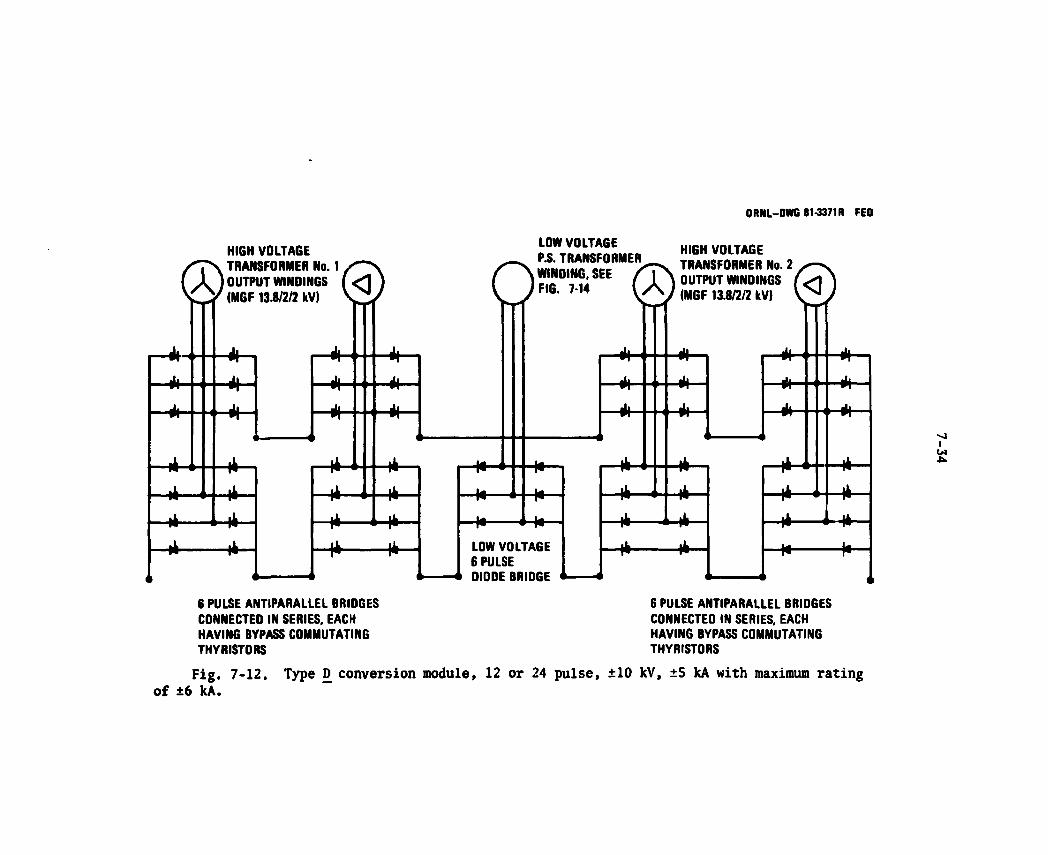
ORNL-DWG 81-3371R FEO
HIGH VOLTAGE
©TRANSFORMER No. 1 OUTPUT WINDINGS (MGF 13.8/2/2 kV) @
6 PULSE ANTIPARALLEL BRIDGES CONNECTED IN SERIES, EACH HAVING BYPASS COMMUTATING THYRISTORS
LOW VOLTAGE
OP.S. TRANSFORMER WINDING, SEE FIG. 7-14
LOW VOLTAGE 6 PULSE DIODE BRIDGE
•R
® HIGH VOLTAGE TRANSFORMER No. 2 OUTPUT WINDINGS (MGF 13.8/2/2 kV) ©
6 PULSE ANTIPARALLEL BRIDGES CONNECTED IN SERIES. EACH HAVING BYPASS COMMUTATING THYRISTORS
Fig. 7-12. Type D conversion module, 12 or 24 pulse, ±10 kV, ±5 kA with maximum rating of ±6 kA.
W
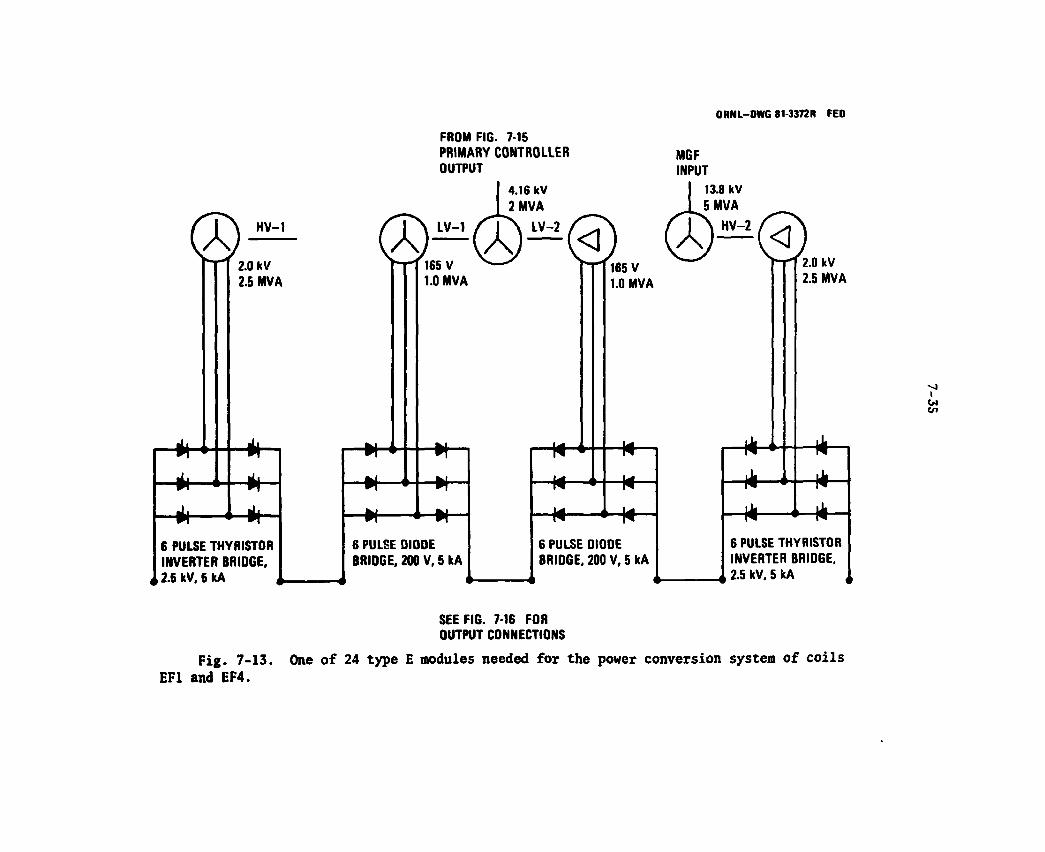
ORNL-DWG 81-3368R FEO
FROM FIG. 7-15 PRIMARY CONTROLLER OUTPUT
4.16 kV
MGF INPUT
<2> HV-1
2.0 kV 2.5 MVA
6 PULSE THYRISTOR INVERTER BRIDGE,
4,2.5 kV, 5 kA
13.8 kV
1 2 MVA 1 5 MVA
165 V 1.0 MVA
6 PULSE DIODE BRIDGE, 200 V, 5 kA
H4-
165 V 1.0 MVA
-n-
H4-6 PULSE DIODE BRIOGE, 200 V, 5 kA
2.0 kV 2.5 MVA
*
6 PULSE THYRISTOR INVERTER BRIOGE, 2.5 kV. 5 kA
SEE FIG. 7-16 FOR OUTPUT CONNECTIONS
Fig. 7-13. One of 24 type E modules needed for the power conversion system of coils EF1 and EF4.
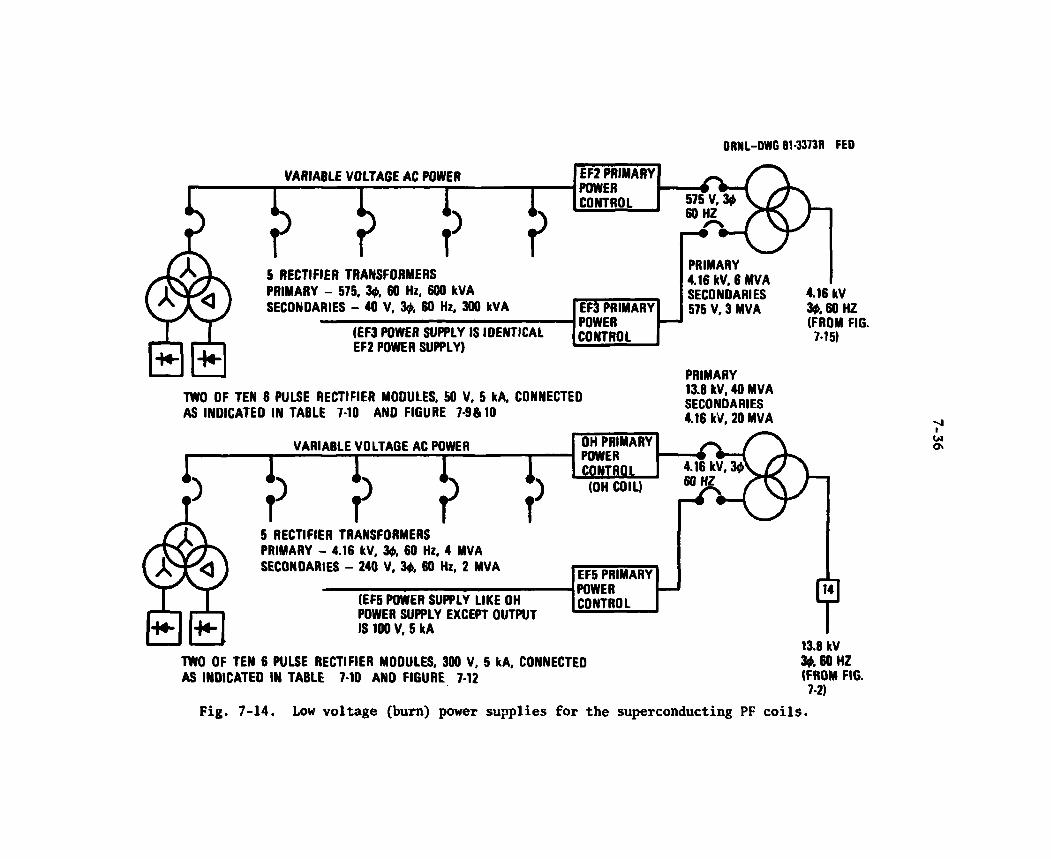
ORNL-DWG 81-3373R FEO
VARIABLE VOLTAGE AC POWER
FT r r 5 RECTIFIER TRANSFORMERS PRIMARY - 575, 30, 60 Hz, 600 kVA SECONDARIES - 40 V, 30, 60 Hz, 300 kVA
(EF3 POWER SUPPLY IS IDENTICAL EF2 POWER SUPPLY)
EF3 PRIMARY POWER CONTROL
TWO OF TEN 6 PULSE RECTIFIER MODULES, 50 V, 5 kA. CONNECTED AS INDICATED IN TABLE 7-10 AND FIGURE 7-9&10
VARIABLE VOLTAGE AC POWER n r r > ) OH PRIMARY POWER CONTROL
(OH COIL)
5 RECTIFIER TRANSFORMERS PRIMARY - 4.16 kV, 30, 60 Hz, 4 MVA SECONDARIES - 240 V, 30, 60 Hz, 2 MVA
(EF5 POWER SUPPLY LIKE OH POWER SUPPLY EXCEPT OUTPUT IS 100 V, 5 kA
EF5 PRIMARY POWER CONTROL
PRIMARY 4.16 kV, 6 MVA SECONDARIES 575 V, 3 MVA
PRIMARY 13.8 kV, 40 MVA SECONDARIES 4.16 kV, 20 MVA
TWO OF TEN 6 PULSE RECTIFIER MODULES, 300 V, 5 kA, CONNECTED AS INDICATED IN TABLE 7-10 AND FIGURE 7-12
4.16 kV 30,60 HZ (FROM FIG.
7-15)
13.8 kV 30, 60 HZ (FROM FIG. 7-2)
Fig. 7-14. Low voltage (burn) power supplies for the superconducting PF coils.
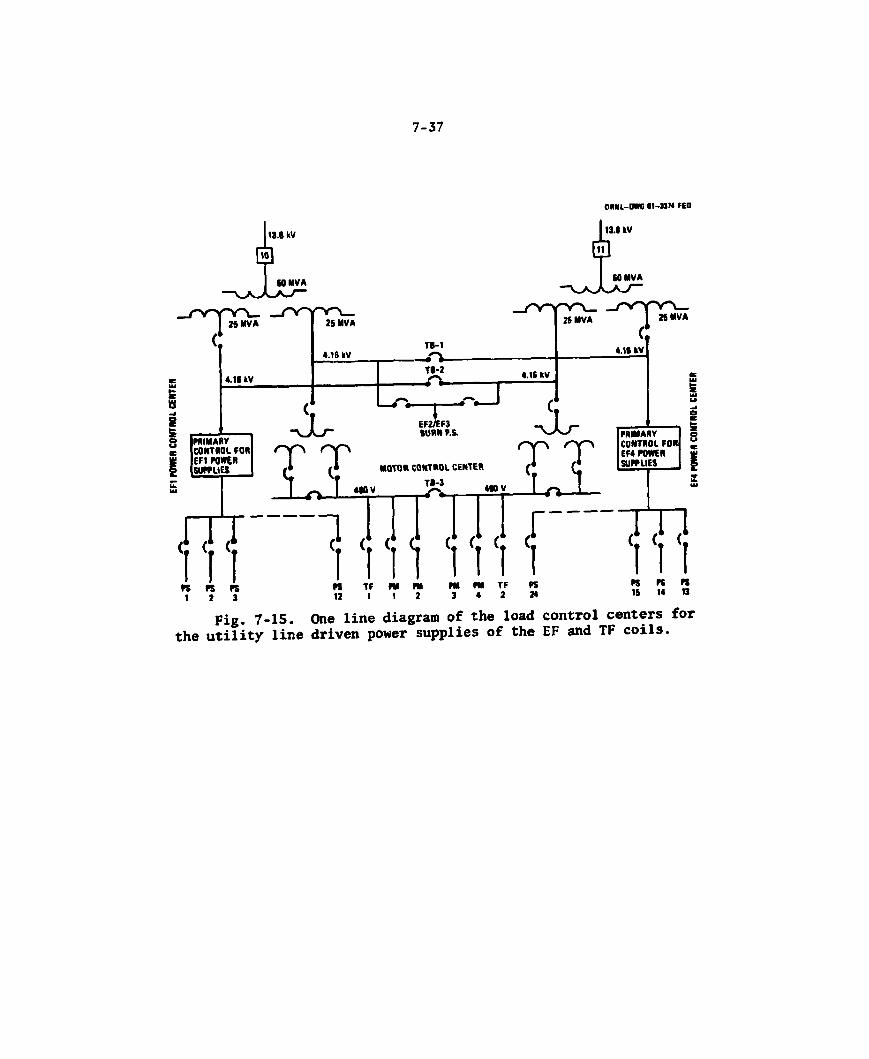
7-37
OMU-DWG I1-11M FED
13.1 kV
PRIMARY CONTROL FOR EF1 POWER SUPPLIES
< [ 7 7 Vf I f$ K fS 1 2 3
PRIMARY CONTROL FOR EF4 POWER SUPPLIES
" " 7 7 7 III PS PS PS IS 14 13
Fig. 7-15. One line diagram of the load control centers for the utility line driven power supplies of the EF and TF coils.
n i l ' I ' m PS »
TF PM I 1 TF PS
4 2 2*

7-38
Figure 7-16 is a one-line diagram of the power conversion system for the water-cooled coils EF1 and EF4. The two coils are connected in series with a common return to carry the difference current. Large heavy-wall 12 in. coppeT pipe is proposed to carry the coolant water to the coils and provide the electrical bus for 120 kA.. Only one of the twelve power modules for each coil is shown in Fig. 7-16. Each thyristor or rectifier block is a six-pulse bridge but the transformer windings are designed to provide 12-pulse operation when the bridges are connected in parallel. The pipes are electrically isolated from the coolant pumps and heat exchangers by the flow meter sections to prevent snorting out the power supplies. Heat exchangers are large enough so that either coolant system can remove the entire heat load. Pump motors derive their power from the motor control center of Fig. 7-15. Loss of water flow initiates a controlled shutdown of the power supplies.
Figure 7-17 is a generic one-line diagram representing one of the superconducting coil power converters and the coil protection backup. Only two of the ten power modules are shown. Table 7-10 indicates the number of a given type power module that needs to be connected in parallel to provide the power conversion for each coil. Coils are center tapped and grounded to reduce the coil terminal to ground voltage without having to provide more than two electrical bus runs. Circuit breakers and their bypass dump resistors provide backup coil protection if the inverters fail to operate. Coil protection is discussed under Section 7.1.4 below.
Referring to Table 7-10, it may be noted that 10 Type-D2 modules having a 300 V low voltage section must be connected in parallel to meet the OH coil power supply requirements. Likewise 10 Type-B2 modules connected in parallel will provide the bidirectional power needed for the EF5 coil. Some power supplies require two different modules to provide the needed power. For example, 8 Type-A power modules and 2 Type-B power modules, connected in parallel, provide the bidirectional current for coil EF2. The 2 Type-B modules provide the needed reverse power bias prior to startup.
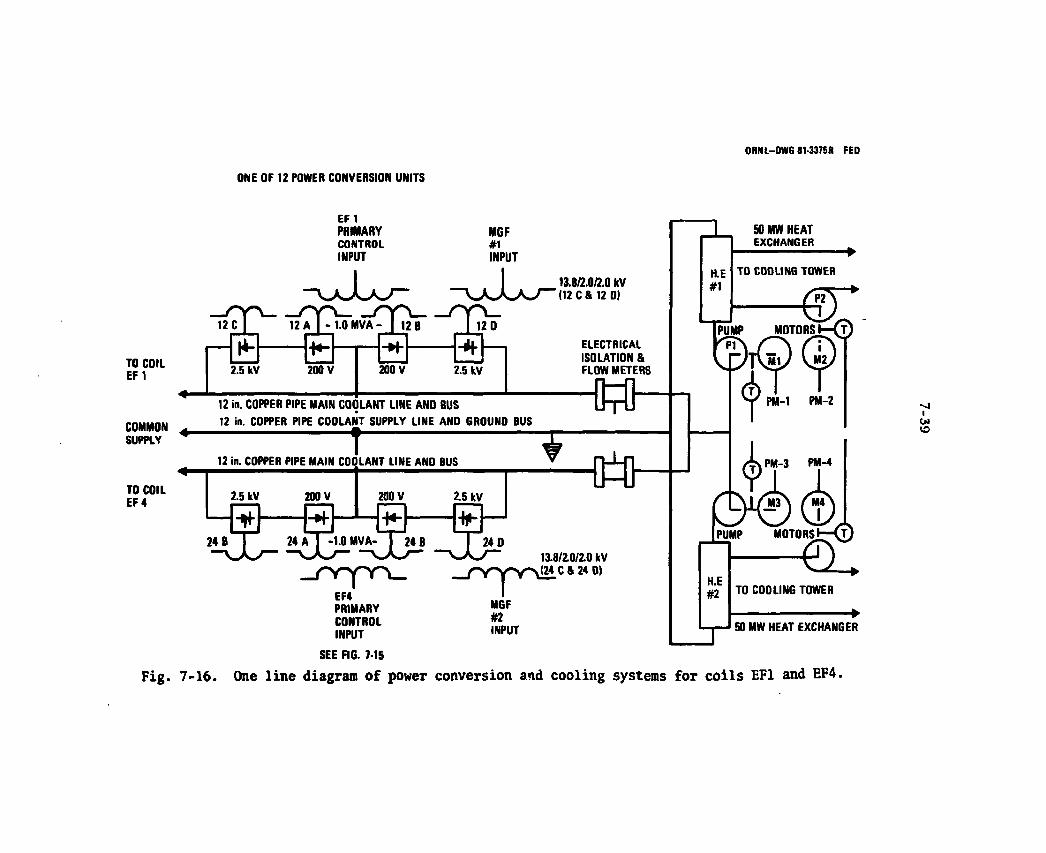
ORNL-DWG 81-3368R FEO ONE OF 12 POWER CONVERSION UNITS
TO COIL EF 1
COMMON SUPPLY
TO COIL EF4
EF 1 PRIMARY CONTROL INPUT
13.8/2.0/2.0 kV (12 C & 12 0)
ELECTRICAL ISOLATION & FLOW METERS
12 in. COPPER PIPE MAIN COOLANT LINE AND BUS 12 in. COPPER PIPE COOLANT SUPPLY LINE AND GROUND BUS
T 12 in. COPPER PIPE MAIN COOLANT LINE AND BUS
13.8/20/2.0 kV (24 C & 24 0)
EF4 PRIMARY CONTROL INPUT
SEE FIG. 7-15
SO MW HEAT EXCHANGER
SO MW HEAT EXCHANGER
--J i W <o
Fig. 7-16. One line diagram of power conversion and cooling systems for coils EF1 and EF4.
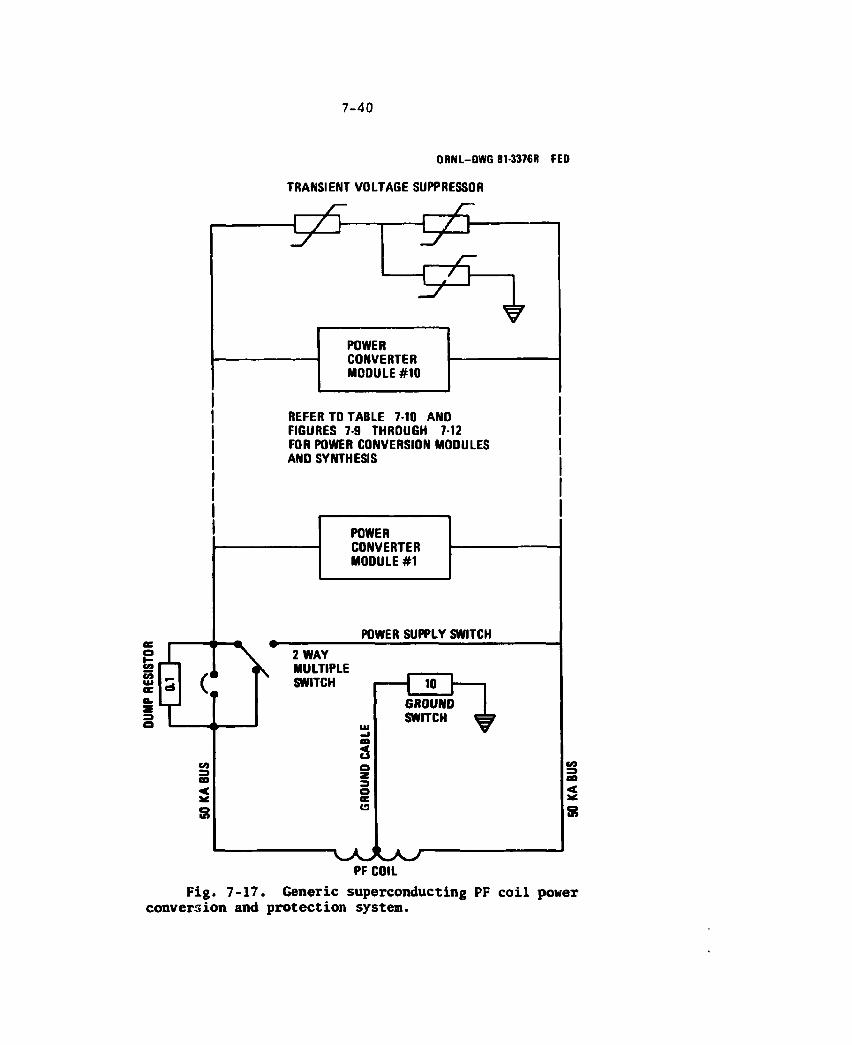
7-40
ORNL-DWG 81-3376R FED
TRANSIENT VOLTAGE SUPPRESSOR
Fig. 7-17. Generic superconducting PF coil power conversion and protection system.
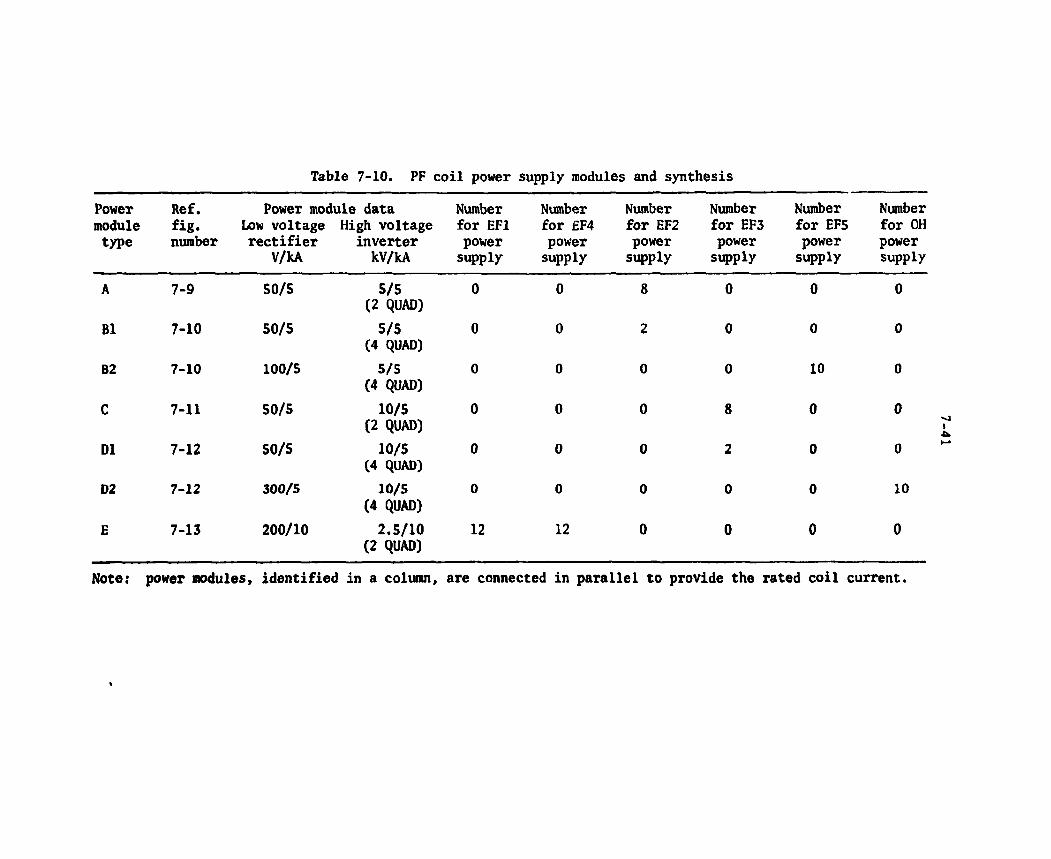
Table 7-10. PF coil power supply modules and synthesis
Power module type
Ref. fig. number
Power module data Low voltage High voltage rectifier inverter
V/kA kV/kA
Number for EFl power supply
Number for £F4 power supply
Number for EF2 power supply
Number for EF3 power supply
Number for EF5 power supply
Number for OH power supply
A 7-9 50/5 5/5 (2 QUAD)
0 0 8 0 0 0
B1 7-10 50/5 5/5 (4 QUAD)
0 0 2 0 0 0
B2 7-10 100/5 5/5 (4 QUAD)
0 0 0 0 10 0
C 7-11 50/5 10/5 (2 QUAD)
0 0 0 8 0 0
D1 7-12 50/5 10/5 (4 QUAD)
0 0 0 2 0 0
D2 7-12 300/5 10/5 (4 QUAD)
0 0 0 0 0 10
E 7-13 200/10 2.5/10 (2 QUAD)
12 12 0 0 0 0
Note: power modules, identified in a column, are connected in parallel to provide the rated coil current.
7-42
Performance
The function of the PF power conversion equipment is to provide the coil current waveforms shown in Fig. 7-8. Power modules consist of large thyristor bridges. The thyristor firing angles must be controlled to provide the voltages needed for generating the current waveforms. Figure 7-18 is a diagram of the PF power conversion control system.
Referring to Fig. 7-18, a computer command signal provides the timing needed to execute the various phases of the cycle. The digital controller for each coil is a stored program computer which contains the current waveforms and the firing angles needed to create different phases of the current waveforms. Local trim control feedback provides refinement where the measured current from a power module is made to •ore closely track the desired value stored in the computer ROM. Coil currents from each pulsed power module are thereby made nearly equal at all times.
During the startup, the burn power supplies are operating at their •axiaua voltage. As the coil currents approach steady state rated value, the pulsed power supply voltages are reduced. When pulsed power is no longer needed, these power supplies are phased off and bypassed. The only current control during the burn phase is accomplished with the primary controller of the bum power supplies.
There are no controls for equalizing the current among the b u m power supply modules other than by taps on their rectifier transformers. Kith the use of these taps it should be possible to nearly equalize the currents during checkout of the system so that the common primary con-troller provides satisfactory performance during the bum phase.
During the shutdown phase, the bum power supplies of the super-conducting coils are turned off. The pulsed power inverters are con-trolled to return power to the MGF units to generate the shutdown current waveforms. The digital controllers provide the firing angles needed for this purpose. If refined current control is desired during shutdown, current feedback may be used for trim correction.
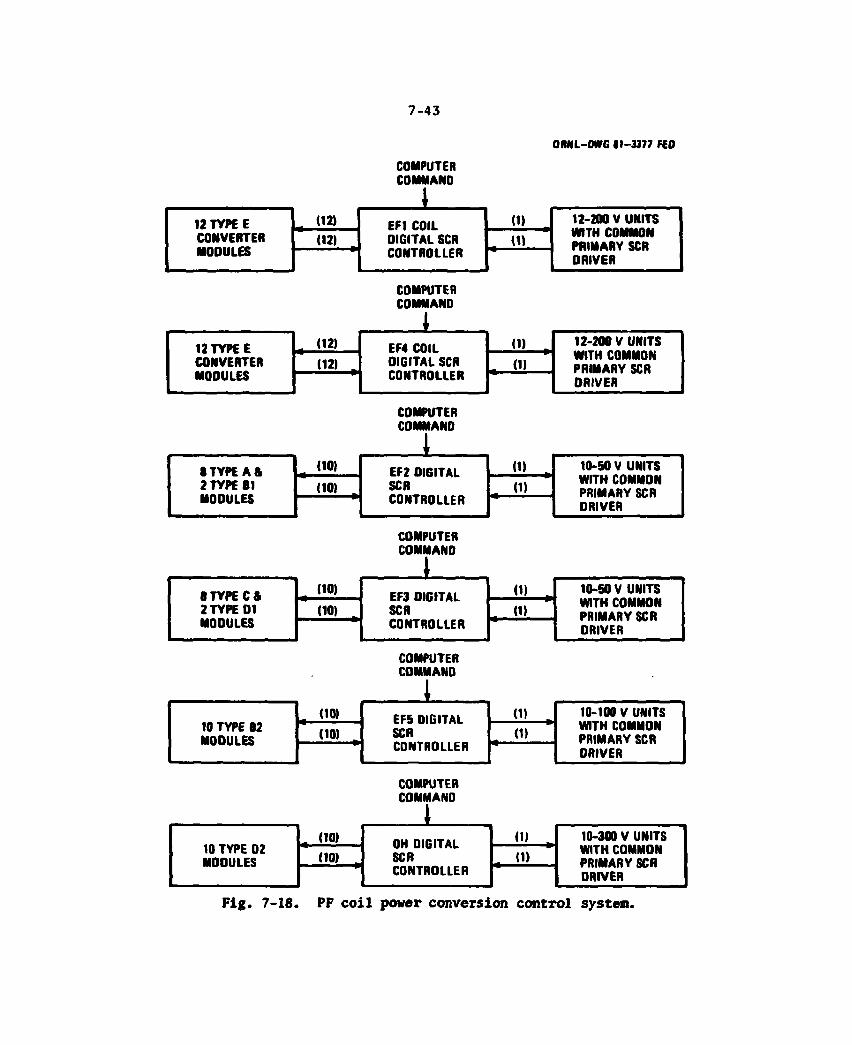
7-43
ORNL-OWG 11-3377 FED
COMPUTER COMMANO
12 TYPE E a 02 ) EF1 COIL (1) 12-200 V UNITS
CONVERTER (12) DIGITAL SCR • W WITH COMMON PRIMARY SCR MODULES CONTROLLER ORIVER
COMPUTER COMMANO
12 TYPE E g (12) EF4 COIL (1) t 12-200 V UNITS
CONVERTER (12) B OIGITAL SCR . (1» WITH COMMON PRIMARY SCR
MODULES CONTROLLER DRIVER
COMPUTER COMMAND
• TYPE A & (10) EF2 DIGITAL SCR CONTROLLER
(1) u 10-50 V UNITS
2 TYPE 81 MOOULES
(10) B
EF2 DIGITAL SCR CONTROLLER • n )
WITH COMMON PRIMARY SCR 2 TYPE 81
MOOULES
EF2 DIGITAL SCR CONTROLLER ORIVER
COMPUTER COMMAND
8 TYPE C 8 2 TYPE D1
(10) EF3 DIGITAL SCR
(1) % 10-50 V UNITS 8 TYPE C 8 2 TYPE D1 (10) a
EF3 DIGITAL SCR . (1>
WITH COMMON PRIMARY SCR DRIVER MOOULES CONTROLLER
WITH COMMON PRIMARY SCR DRIVER
COMPUTER COMMAND
10 TYPE 82 m (10) EF5 DIGITAL
SCR
(1) B 10-100 V UNITS 10 TYPE 82 (10) (
EF5 DIGITAL SCR (1)
WITH COMMON MODULES (10) (
EF5 DIGITAL SCR (1) PRIMARY SCR MODULES CONTROLLER DRIVER
COMPUTER COMMANO
10 TYPE 02 t (10) OH DIGITAL
SCR
(1) ^ 10-300 V UNITS 10 TYPE 02
(10) B
OH DIGITAL SCR . 0) WITH COMMON
MOOULES (10) B
OH DIGITAL SCR . 0) PRIMARY SCR
DRIVER MOOULES
CONTROLLER PRIMARY SCR DRIVER
Fig. 7-18. PF coil power conversion control system.

7-44
Four coils, CF1, CF2, CF3 and CF4 provide plasma position control. The peak power for these coils is about 10 MW but the average power is less than 1 MW. There are about 100 turns in each coil with a voltage limit of 100 volts/turn. Therefore, the 10 kV power supply of Fig. 7-19 meets the requirements. The grounded center taps of the power supply limits the coil terminal-to-ground voltage to S kV.
Other options
Another alternate was considered to eliminate the burn power supplies and the bypass switching around the pulsed power supplies. This alternate, during the burn phase, operates one of the 6-pulse bridges as a power supply and the other bridge as an inverter. The difference in the circulating power is that required by the coil circuit. With this arrangement, the 6-pulse bridges can be operated efficiently but full load losses appear in the transformer windings and in the thyristors. The pulsed power supplies must be designed for continuous duty, not just for operating during startup and shutdown only. A frequency converter is needed to convert utility line power to variable frequency power needed at the MGF bus during the burn phase unless the MGF storage capacity is increased 3 or 4 GJ. This alternate, therefore, substitutes a frequency converter for the burn power supplies, increases the power handling requirements of the pulsed power supplies, but eliminates the bypass around the pulsed power supplies.
Conclusions
The power supplies for resistive EF1 and EF4 coils require very high currents at low voltage (120 kA, 150 volts). These power supplies must be connected in series with 2.5 kV, 120 kA inverters to discharge the coils quickly to initiate the plasma. Many power modules, each having transformers, must be connected in parallel. The 12 in. copper water pipe must be insulated for 2.5 kV pulsed operation.
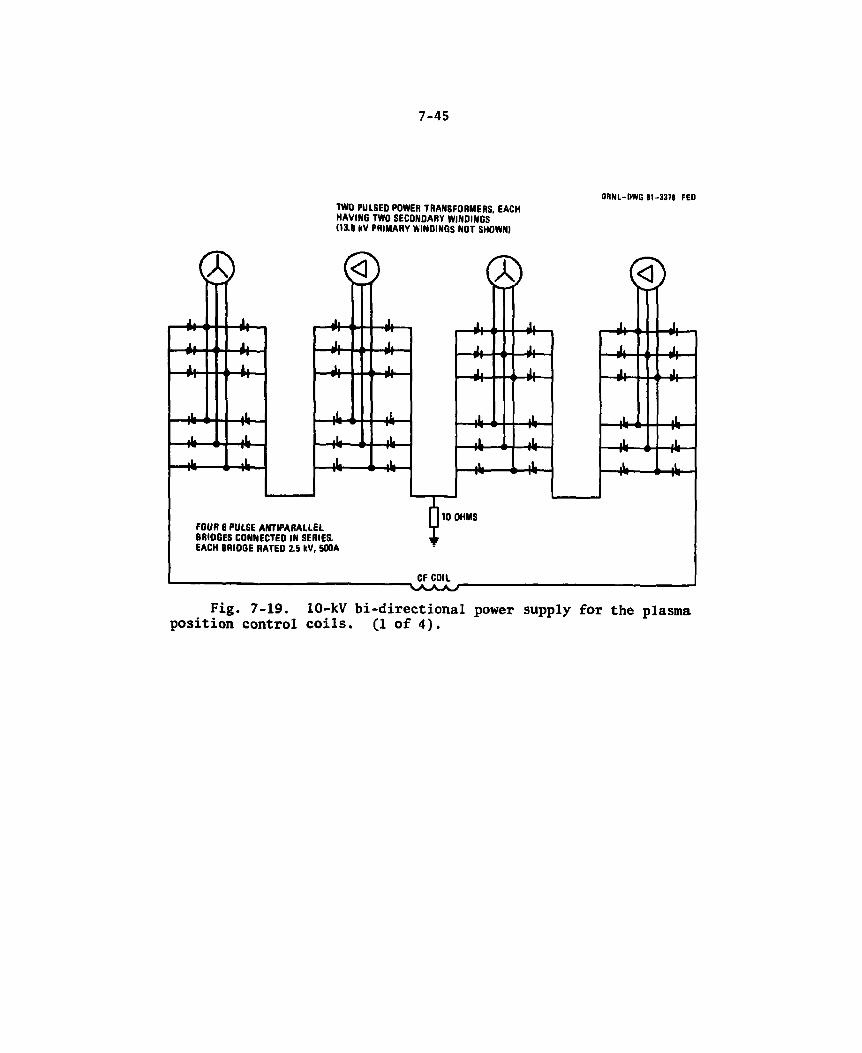
7-45
© ii i J,
Ji 1,
J. 1 t l
.L iL
.L lb
— *
TWO PULSED POWER TRANSFORMERS, EACH HAVING TWO SECONDARY WINDINGS (13.8 kV PRIMARY WINOINGS NOT SHOWN)
ORNL-DWG 81-3379 FEO
© Jl 1 J ,
A Ji
Jl 11 4i
lb lb . L lb
— —
FOUR 6 PULSE ANTIPARALLEL BRIOGES CONNECTED IN SERIES. EACH BRIOGE RATED 2.5 kV, 500A
©
^ tO OHMS
J . , Ji
J. Ji
Jl ii Jl
.L iL
lb n lb
ib lb
CF COIL •\AA_AJ"
© Jl 1 Jl Jl Jl J. l> Jl
lb i .L
.L lb
— A —
Fig. 7-19. 10-kV bi-directional power supply for the plasma position control coils. (1 of 4).
7-46
The power supplies for the superconducting coils consist of 5 or 10 kV power modules connected in parallel to provide 50 kA. Large thyristors are available which should reduce the space requirement and cost of these power supplies. Even so, these power supplies will require a substantial investment and require a separate building to accommodate the power supplies.
In the future we need to determine whether power supply voltage and current ripple will adversely affect the operation of the quench detectors. The choice of 120 kA coils for EF1 and EF4 should be evaluated to determine if a more conventional 50 kA coil would not be more advantageous. Also the alternate approach to providing burn phase power needs to be investi-gated further to compare relative costs and reliability of both alternates.
Preliminary equipment specifications need to be prepared which can be used as the basis for more refined cost estimating. The problem of routing high voltage 50 kA and 120 kA bussing between the electrical buildings and the reactor cell needs to be addressed in greater depth. Electrical penetrations through the reactor cell must be gas tight to meet environmental requirements.
The work described above needs to be coordinated with architect engineers who plan and design the buildings and their support facilities.
7.1.4 Superconducting Coil Protection
The superconducting toroidal field (TF) coils are charged slowly and then operate in the steady state charged condition for long periods of time (weeks). In contrast, the superconducting poloidal field (PF) coils operate in a repetitive pulsed mode with a period of 152 s. When fully charged for 10-T operation the stored energy of the TF coils is 23.5 GJ compared to 3.7 GJ for the fully charged PF coils. The magnetic fields of the TF coils and PF coils are orthogonal which minimizes the interactive magnetic coupling between the two types of coils. Although there are significant differences between these coils, the protection system requirements are similar in many respects. The discussion which follows is applicable to both types of coils except where otherwise noteU.

7-47
The main function of the coil protection system is to prevent injury to personnel and to minimize damage to the coils and other toka-mak components when a fault occurs. Among the serious faults are those that force a superconducting coil to go from the superconducting state to the normal state within a few seconds. The transition from the superconducting state to the normal state may occur in part of the coil or propagate throughout the coil; the latter is frequently referred to as a coil quench. Under normal operating conditions and many abnormal operating conditions, such as a plasma disruption, the coils will not quench.
Any fault that gives rise to large unequal currents in the TF coils can produce large unbalanced forces and moments that may damage the supporting structures. Other cascading events could follow such as broken bus bars, cryogenic ruptures, and a break in the containment boundary. Furthermore, if currents are not maintained nearly equal during a quench discharge, the energy is distributed unequally among the coils; more energy is dissipated in the coil circuit that has the greater time constant. Therefore, the TF coil protection system will be designed to prevent large unequal currents during normal and abnormal operation that may result from electrical and mechanical faults.
Coil protection measures
A coil that quenches may give rise to helium boiling and larger pressure increase unless some energy can be dissipated externally to the coil. To prevent the possibility of an explosion, pressure relief valves and rupture diaphragms must be provided. Other protective measures include slow and rapid coil discharges which dissipate energy in external dump resistors. A rapid discharge is needed to dissipate most of the energy externally after a quench is under way. A slow discharge is adequate if a failure occurs which could eventually lead to a quench. A slow discharge is mandatory if a shorted coil or coil section occurs.
The energy dump systems of the TF and PF coils were described in Sections 7.1.2 and 7.1.3, respectively. Protection systems for both types of coils have provisions for slow and rapid discharge. Both TF
7-48
coils and PF coils have center taps to reduce the voltage to ground and to provide differential instrumentation measurements for detecting a coil short, coil ground, and coil quench. Instrumentation must be provided to detect all credible faults and take the appropriate pro-tection measure.
Requirements
The TF coil protection system will have sufficient instrumentation to detect and characterize faults which could impair operation or damage the coils. It will be able to perform the following functions with high reliability:
1. Alert the operator with alarms when abnormal conditions exist. (A)
2. Stop pulsing the PF coils (SV) and discharge the TF coils slowly (T = 1 hour) when an abnormal condition exists that could impair the magnet system.
3. Stop the slow discharge when the abnormal condition ceases to exist.
4. Stop pulsing PF coils immediately and discharge all TF coils rapidly (T < 40 s) if a fault exists which could quickly lead to a coil quench. (FD)
5. Open valves or blow out rupture discs if the helium pressure in the coil exceeds the design pressure limit.
The PF coil protection system will have also sufficient instrumenta-tion to detect and characterize faults which could impair operation and protection, or damage the coils. It will be able to perform the following functions with high reliability:
1. Alert the operator with alarms when abnormal conditions exist.
2. Discharge coils immediately with a normal inverter discharge when an abnormal condition exists that could lead to a coil quench. (ND)
3. Discharge the PF coils slowly with inverter discharge if a shorted coil is detected. (SD)

7-49
4. Discharge coils with the backup energy dump if the inverter fails to operate. (BD)
5. Open valves or blow out rupture discs if the helium pressure exceeds a pressure limit to be determined.
Baseline design description
To achieve high reliability and to minimize inadvertent shutdowns, three channel coil protection systems are used which have 2 out of 3 polling logic. TF and PF coil protection systems are composed of seven major parts:
1. Sensors and signal condition instrumentation.
2. Channel buffers that provide signal isolation and transmission to the monitor computers.
3. Monitor computers that process the signals, characterize the fault, and determine the appropriate protection measure.
4. Coil discharge controllers that implement the 2 out of 3 monitor computing polling and execute the protection measure.
5. Protection system diagnostic computer that monitors the protection system and informs the operator of component failures or impending failures.
6. Independent power supplies for each channel as shown in Fig. 7-6.
7. Circuit breakers and dump resistors.
Figure 7-20 shows a typical three channel sensor and signal condi-tioning group which provides quench detection and hot coil lead detection. The coil instrumentation taps are also connected to ground detection and coil short detection bridges not shown in the figure. The micro-processors provide analog-to-digital conversion and make comparison between the many bridges to locate any quench that may be impending. These computers also service the ground fault and coil short detection bridge circuits.
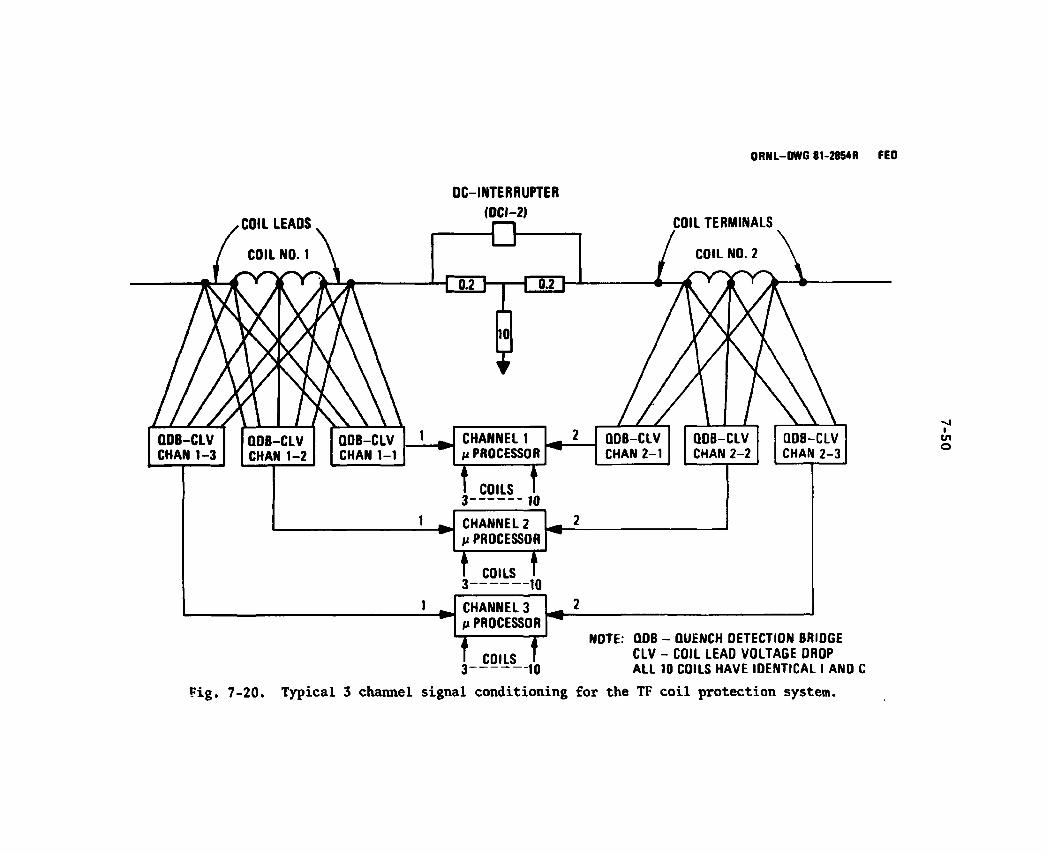
ORNL-DWG 81-3373R FEO
COIL LEADS
COIL NO. 1
DC-INTERRUPTER
(DCI-2)
O
n n — i — r m I 10
CHANNEL 1 ft PROCESSOR
I COILS 3 10
CHANNEL 2 (i PROCESSOR
I COILS 3 1Q
CHANNEL 3 HPROCESSOR
I COILS I 3 10
COIL TERMINALS
NOTE: QDB - QUENCH DETECTION BRIDGE CLV - COIL LEAD VOLTAGE DROP ALL 10 COILS HAVE IDENTICAL I AND C
i Ul o
Fig. 7-20. Typical 3 channel signal conditioning for the TF coil protection system.
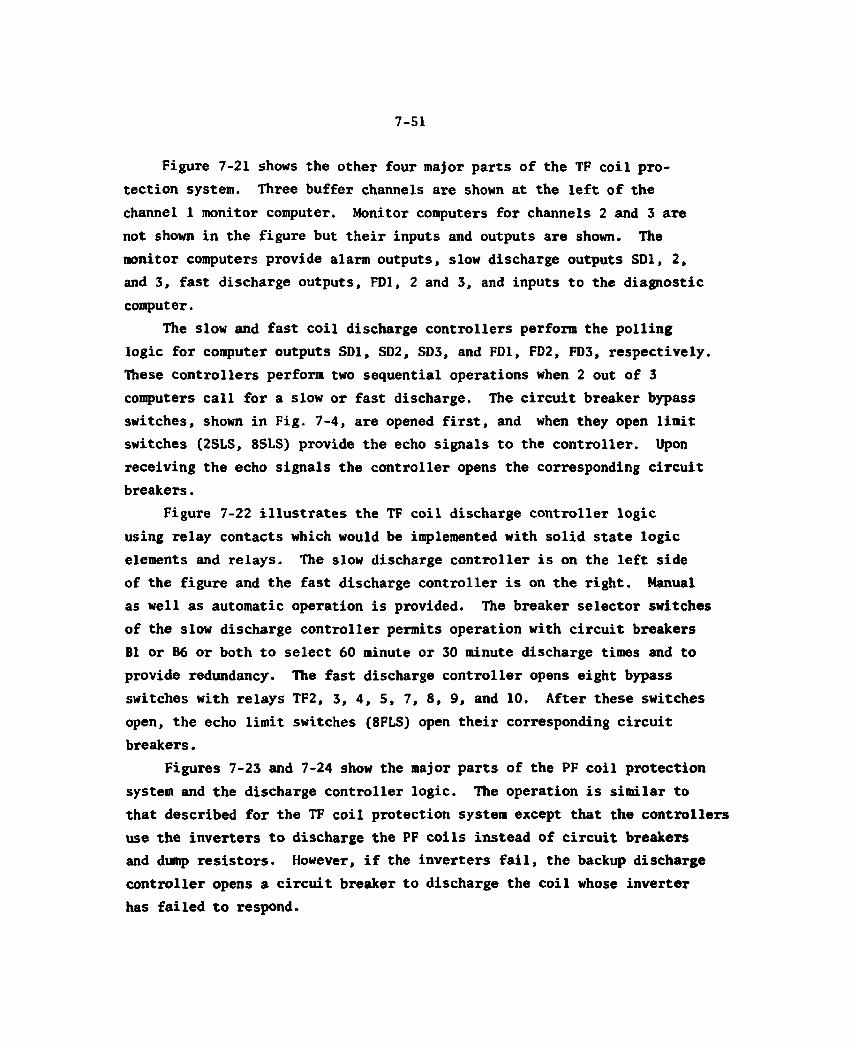
7-51
Figure 7-21 shows the other four major parts of the TF coil pro-tection system. Three buffer channels are shown at the left of the channel 1 monitor computer. Monitor computers for channels 2 and 3 are not shown in the figure but their inputs and outputs are shown. The monitor computers provide alarm outputs, slow discharge outputs SD1, 2, and 3, fast discharge outputs, FD1, 2 and 3, and inputs to the diagnostic computer.
The slow and fast coil discharge controllers perform the polling logic for computer outputs SD1, SD2, SD3, and FD1, FD2, FD3, respectively. These controllers perform two sequential operations when 2 out of 3 computers call for a slow or fast discharge. The circuit breaker bypass switches, shown in Fig. 7-4, are opened first, and when they open limit switches (2SLS, 8SLS) provide the echo signals to the controller. Upon receiving the echo signals the controller opens the corresponding circuit breakers.
Figure 7-22 illustrates the TF coil discharge controller logic using relay contacts which would be implemented with solid state logic elements and relays. The slow discharge controller is on the left side of the figure and the fast discharge controller is on the right. Manual as well as automatic operation is provided. The breaker selector switches of the slow discharge controller permits operation with circuit breakers B1 or B6 or both to select 60 minute or 30 minute discharge times and to provide redundancy. The fast discharge controller opens eight bypass switches with relays TF2, 3, 4, 5, 7, 8, 9, and 10. After these switches open, the echo limit switches (8FLS) open their corresponding circuit breakers.
Figures 7-23 and 7-24 show the major parts of the PF coil protection system and the discharge controller logic. The operation is similar to that described for the TF coil protection system except that the controllers use the inverters to discharge the PF coils instead of circuit breakers and dump resistors. However, if the inverters fail, the backup discharge controller opens a circuit breaker to discharge the coil whose inverter has failed to respond.
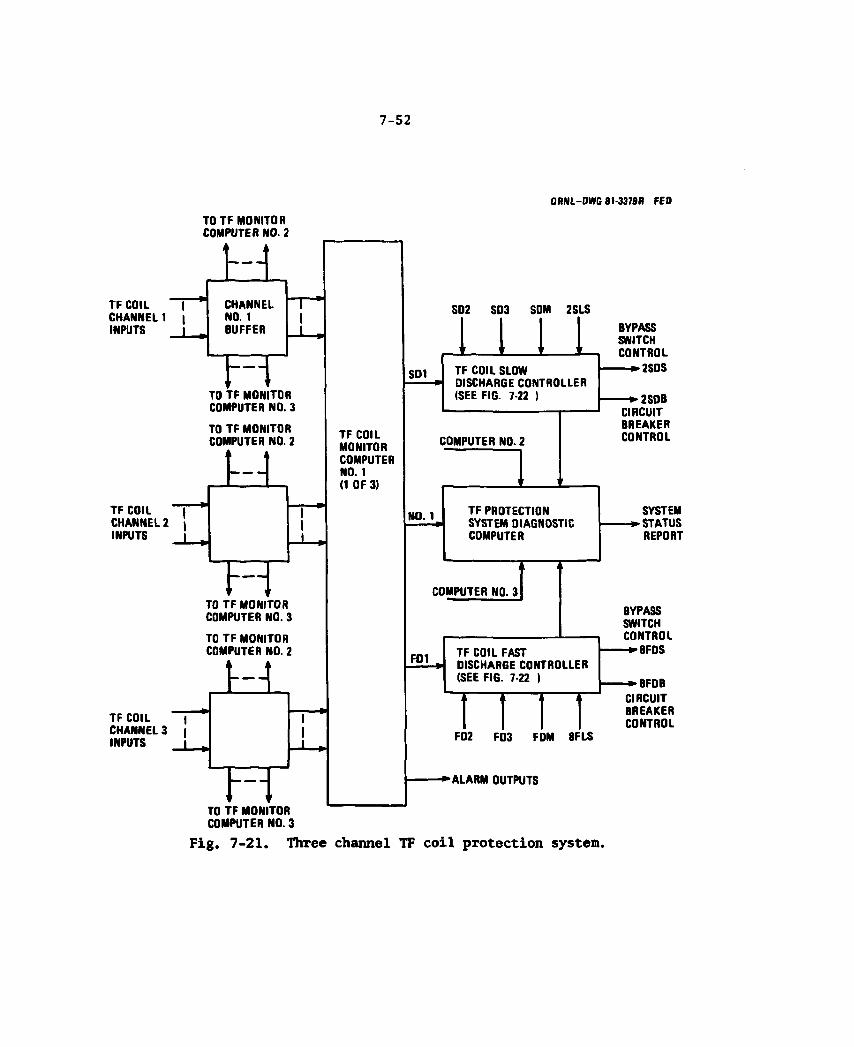
7-52
ORNL-DWG 8I-3379R FEO
TO TF MONITOR COMPUTER NO. 2
COMPUTER NO. 3 Fig. 7-21. Three channel TF coil protection system.
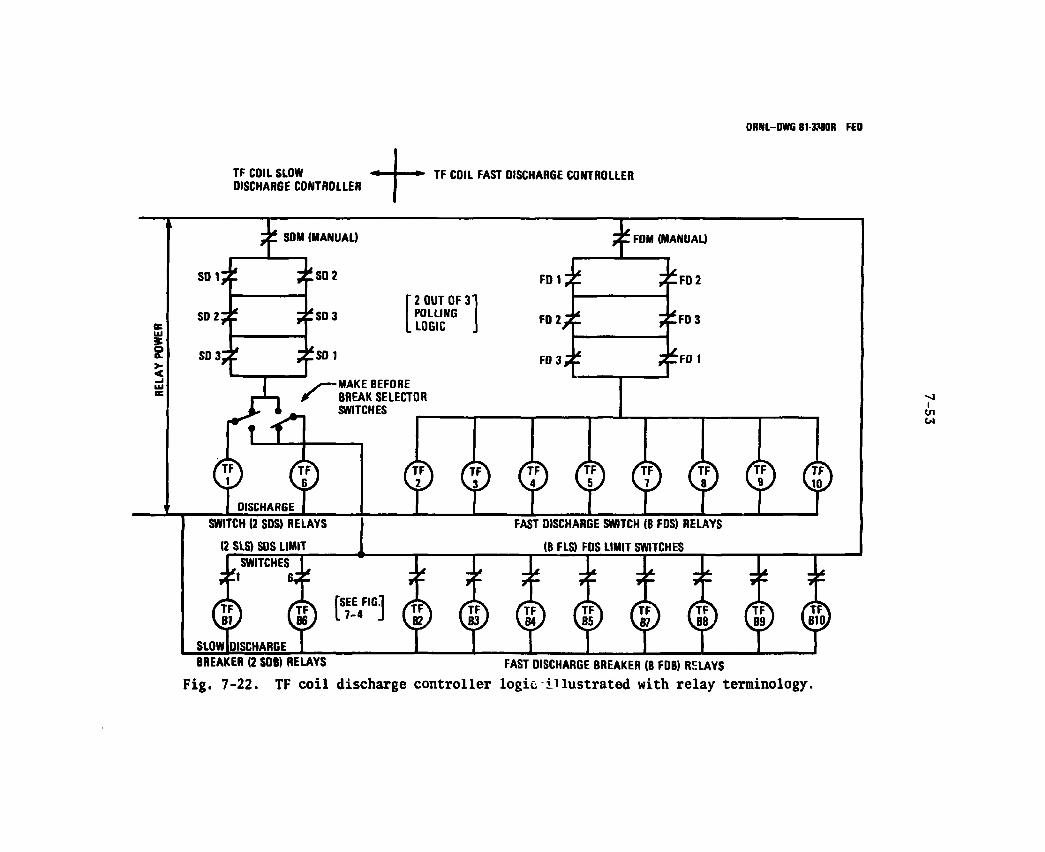
ORNL-DWG 81-3780R FED
TF COIL SLOW DISCHARGE CONTROLLER
TF COIL FAST DISCHARGE CONTROLLER
£ S >-<
SDM (MANUAL)
[ 2 OUT OF 3' POLLING
L LOGIC
F D 1 Z
F D 2 Y i
F0 3,
MAKE BEFORE BREAK SELECTOR SWITCHES
I FDM (MANUAL)
FD 2
Y F FD 3
Z T FD I
c p ^ c p c p < p c p c p < p SWITCH (2 SDS) RELAYS
(2 SLS) SDS LIMIT
FAST DISCHARGE SWITCH (8 FDS) RELAYS
(8 FLS) FDS LIMIT SWITCHES SWITCHES
!l
(S) ^ "I ^ (S) ( p ^ ( p ^ ( p SLQWIDISCHARGE I I I I I I I L
rTF> l B I Q J
BREAKER (2 SOB) RELAYS FAST DISCHARGE BREAKER (8 FDB) RELAYS
Fig. 7-22. TF coil discharge controller logic illustrated with relay terminology.
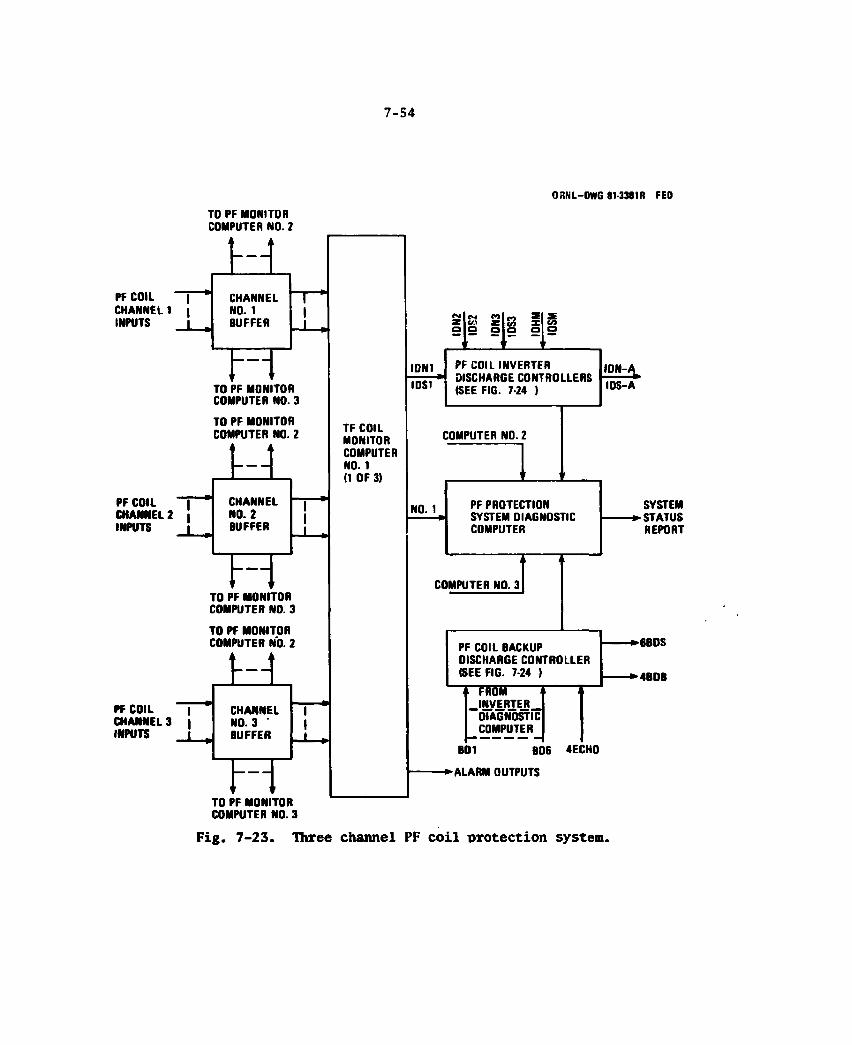
7-54
ORNL-OWG 81-3381R FED
TO PF MONITOR COMPUTER NO. 2
COMPUTER NO. 3
Fig. 7-23. Three channel PF coil protection system.
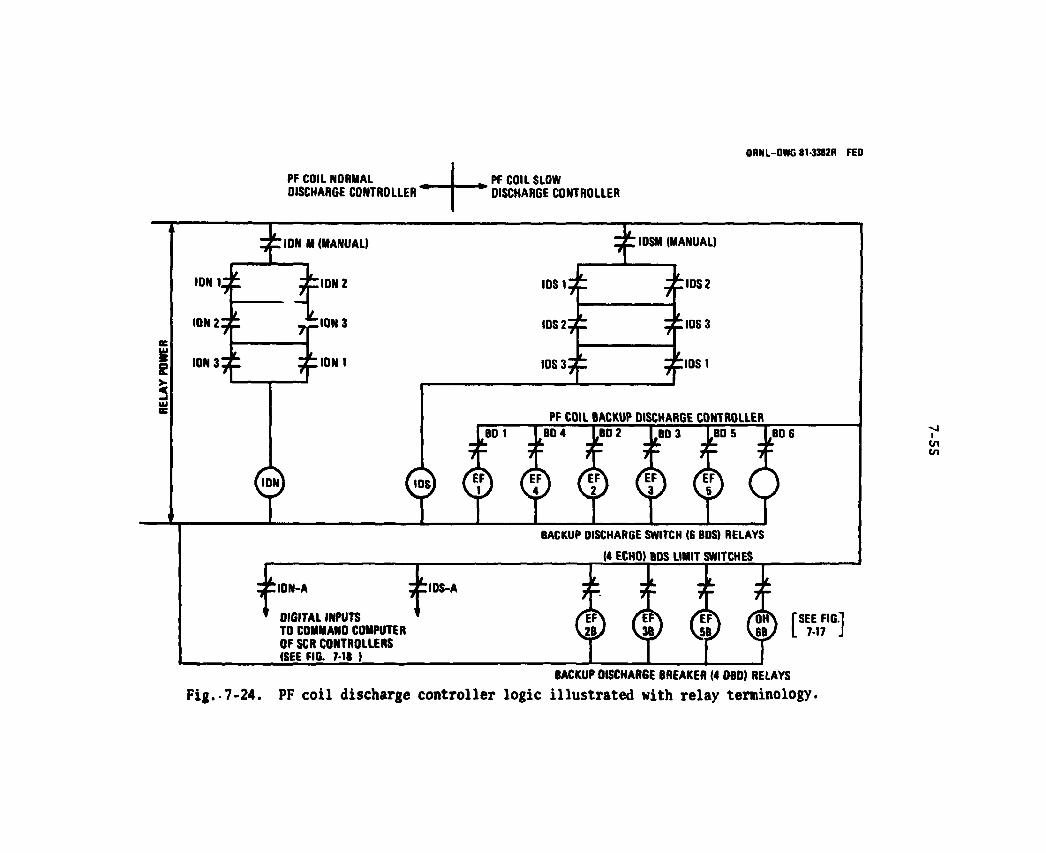
ORNL-DWG 81-3373R FEO
PF COIL NORMAL DISCHARGE CONTROLLER'
PF COIL SLOW DISCHARGE CONTROLLER
$ e >-2
ION M (MANUAL)
IDN 2
ION 3
ION I
IDS I :
IDS 2:
IDS 3:
;IDSM (MANUAL)
:iDS2
:ios3
:10s 1
PF COIL BACKUP DISCHARGE CONTROLLER BO 1 BD 4 1BD 2 BO 3 BD S BO 6 • t JL • fc «L «fc
CD <y ( y CD ( j )
BACKUP DISCHARGE SWITCH (6 BDS) RELAYS
(4 ECHO) BDS LIMIT SWITCHES
:IDN-A
DIGITAL INPUTS TO COMMANO COMPUTER OF SCR CONTROLLERS (SEE FIG. 7 -U )
:IDS-A
( I H Z E F \ / E F \ / O H \ FSEE FIG." \2y U a / v V \§y L 717 .
BACKUP DISCHARGE BREAKER (4 OBD) RELAYS F i g . - 7 - 2 4 . PF c o i l discharge c o n t r o l l e r log ic i l l u s t r a t e d w i th r e l a y terminology.
7-56
The three channel logic proposed for the TF and PF coil protection system is given in Tables 7-11 and 7-12 for one threshold level and two threshold logic, respectively. The protection identification (ID) logic numbers refers to the number of channels (first digit) and the number of states per channel (second digit). Only 8 logic combinations exist for three channel, one threshold level logic, whereas 27 logic combinations exist for three channel two level logic.
The parameters given in Table 7-13 are cross referenced to the ID numbers (32 or 33) excep*- for parameters which have only alarm states. The latter are identified only as alarm high (A/H) or alarm low (A/L). Some coil protection parameters, identified in Table 7-13, have only one threshold level (2 states) while the others in this table have two threshold levels (3 states).
The First column of Table 7-13 applies to the TF coils which used forced flow cooling. Two categories of protection are provided, slow discharge (SD) and fast discharge (FD). Some parameters are not applicable (NA) to forr.?.d flow cooling; they apply only to the PF coils which are cooled with pool boiling given in the second column. In the second column a normal discharge (ND) is performed in 10 seconds and a slow discharge is performed in about 5 minutes. If the inverters fail to respond, a backup discharge controller opens a circuit breaker to transfer the energy to a dump resistor.
Fault diagrams and analysis
Logic diagrams, Figs. 7-25 through 7-31 were used to identify the protection parameters given in Tables 7-13 and 7-14. These diagrams cover four general classes of failures; cryogen system, coil shorts, ground faults, and open circuit failures which are most, but not all of the types of failures that can occur. General types of failures are identified near the top of each diagram. Heavy lines show the subsequent influence of faults on process variables. Light lines lead to alarms and protective action that could be initiated before a quench occurs. If no protective action occurs, these faults generally lead to a quench as shown on the diagrams.
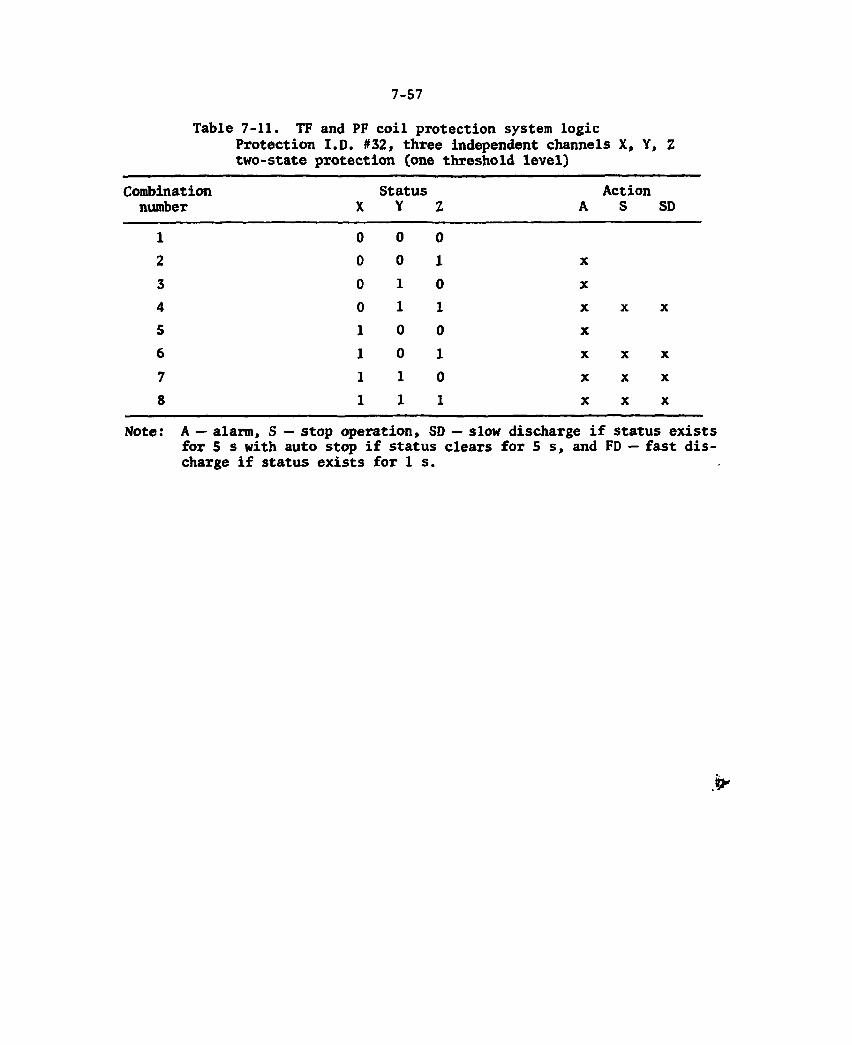
7-57
Table 7-11. TF and PF coil protection system logic Protection I.D. #32, three independent channels X, Y, Z two-state protection (one threshold level)
Combination number X
Status Y z A
Action S SD
1 0 0 0
2 0 0 1 X
3 0 1 0 X
4 0 1 1 X X X
5 1 0 0 X
6 1 0 1 X X X
7 1 1 0 X X X
8 1 1 1 X X X
Note: A — alarm, S — stop operation, SD — slow discharge if status exists for 5 s with auto stop if status clears for 5 s , and FD — fast dis-charge if status exists for I s .
>
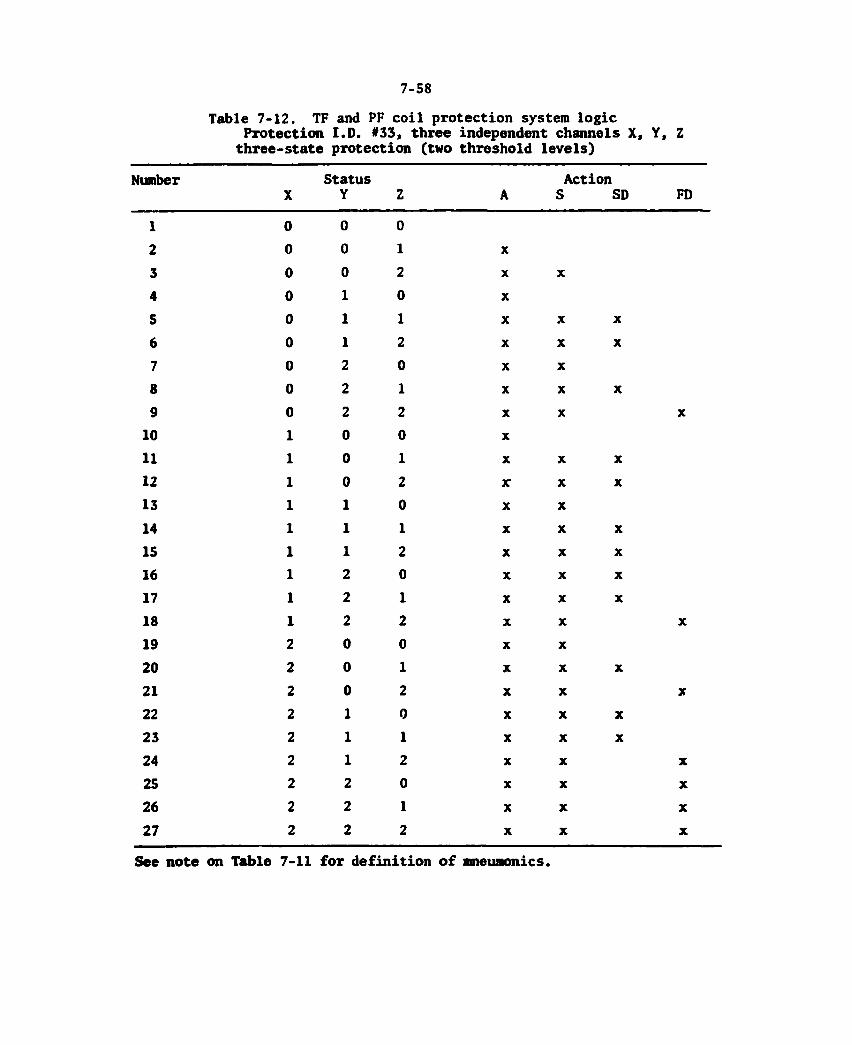
7-58
Table 7-12. TF and PF coil protection system logic Protection I.D. #33, three independent channels X, Y, Z
three-state protection (two threshold levels)
Number X
Status Y Z A
Action S SD FD
1 0 0 0 2 0 0 1 X
3 0 0 2 X X
4 0 1 0 X
5 0 1 1 X X X
6 0 1 2 X X X
7 0 2 0 X X
8 0 2 1 X X X
9 0 2 2 X X X
10 1 0 0 X
11 1 0 1 X X X
12 1 0 2 X X X
13 1 1 0 X X
14 1 1 1 X X X
15 1 1 2 X X X
16 1 2 0 X X X
17 1 2 1 X X X
18 1 2 2 X X X
19 2 0 0 X X
20 2 0 1 X X X
21 2 0 2 X X X
22 2 1 0 X X X
23 2 1 1 X X X
24 2 1 2 X X X
25 2 2 0 X X X
26 2 2 1 X X X
27 2 2 2 X X X
See note on Table 7-11 for definition of mneumonics.
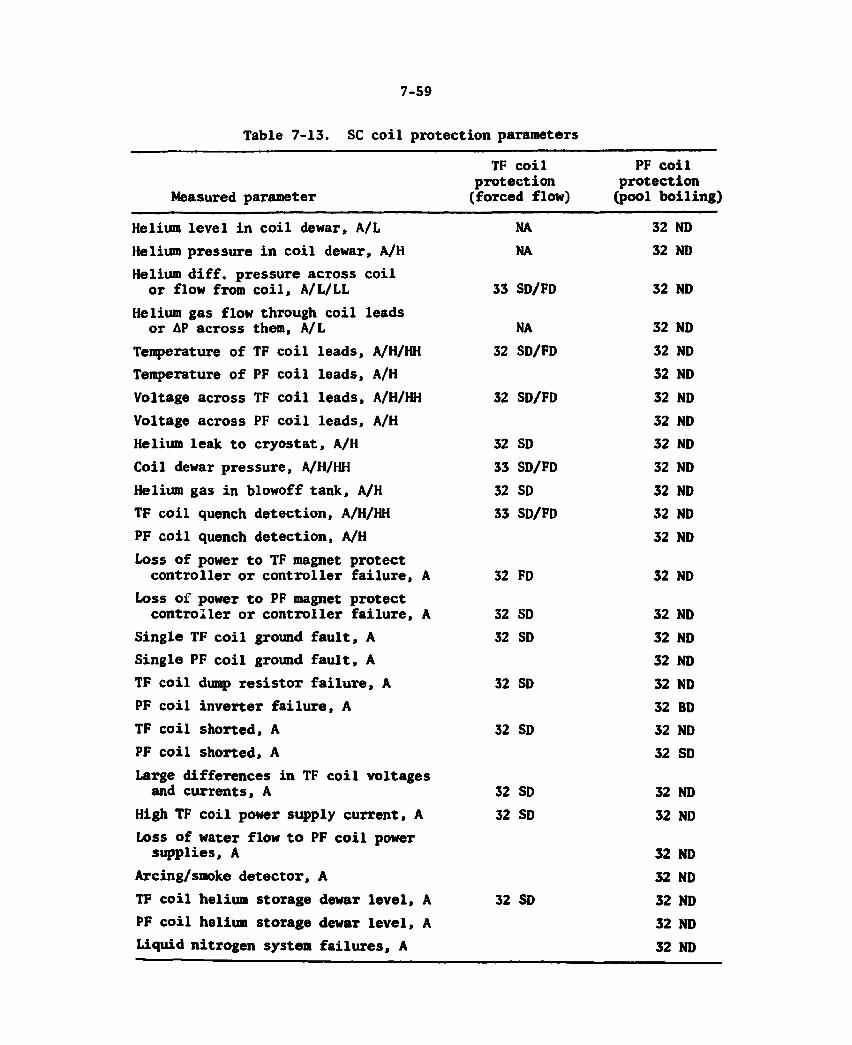
7-59
Table 7-13. SC coil protection parameters
TF coil PF coil protection protection
Measured parameter (forced flow) (pool boiling)
Helium level in coil dewar, A/L NA 32 ND Helium pressure in coil dewar, A/H NA 32 ND Helium diff. pressure across coil
or flow from coil, A/L/LL 33 SD/FD 32 ND Helium gas flow through coil leads
or AP across them, A/L NA 32 ND Temperature of TF coil leads, A/H/HH 32 SD/FD 32 ND Temperature of PF coil leads, A/H 32 ND Voltage across TF coil leads, A/H/HH 32 SD/FD 32 ND Voltage across PF coil leads, A/H 32 ND Helium leak to cryostat, A/H 32 SD 32 ND Coil dewar pressure, A/H/HH 33 SD/FD 32 ND Helium gas in blowoff tank, A/H 32 SD 32 ND TF coil quench detection, A/H/HH 33 SD/FD 32 ND PF coil quench detection, A/H 32 ND loss of power to TF magnet protect controller or controller failure, A 32 FD 32 ND
Loss of power to PF magnet protect controller or controller failure, A 32 SD 32 ND
Single TF coil ground fault, A 32 SD 32 ND Single PF coil ground fault, A 32 ND TF coil dump resistor failure, A 32 SD 32 ND PF coil inverter failure, A 32 BD TF coil shorted, A 32 SD 32 ND PF coil shorted, A 32 SD Large differences in TF coil voltages and currents, A 32 SD 32 ND
High TF coil power supply current, A 32 SD 32 ND Loss of water flow to PF coil power supplies, A 32 ND
Arcing/smoke detector, A 32 ND TF coil helium storage dewar level, A 32 SD 32 ND PF coil helium storage dewar level, A 32 ND Liquid nitrogen system failures, A 32 ND
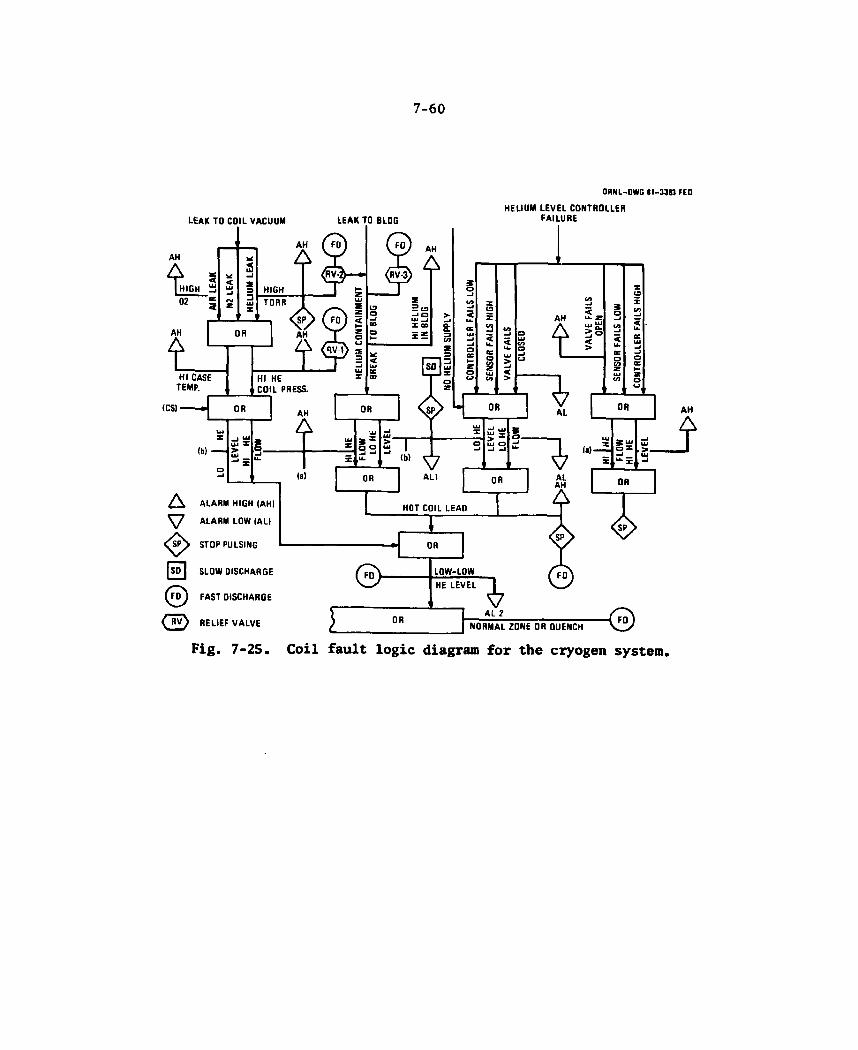
7-60
ORNL-DWG 81—3383 FED
LEAK TO COIL VACUUM
HEL IUM L E V E L CONTROLLER FA ILURE
A A L A R M HIGH (AH)
V A L A R M LOW (AL)
STOP PULSING
SLOW DISCHARGE
© FAST DISCHARGE
<E> RELIEF V A L V E
Fig. 7-25. Coil fault logic diagram for the cryogen system.
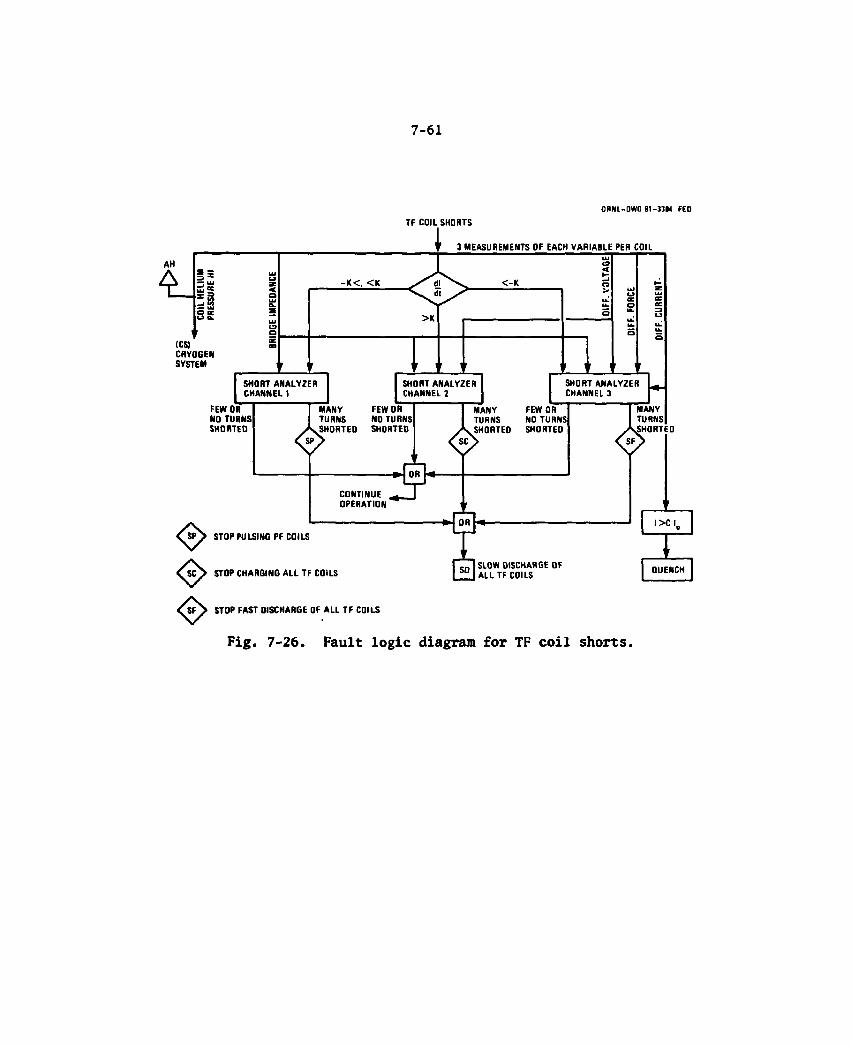
7-61
OfML-DWG 81—3384 FED TF COIL SHORTS
1 ' 3 MEASUREMENTS OF EACH VARIABLE PER COIL
AH
is O B u S
ICS) CRY0GEN SYSTEM
- K < , < K dl di
<-K
>K
SHORT ANALYZER CHANNEL 1
FEW OR NO TURNS SHORTED
SHORT ANALYZER CHANNEL 2
[ M A N Y FEW OR TURNS NO TURNS
.SHORTED SHORTED
SHORT ANALYZER CHANNEL 3
MANY FEW OR TURNS NO TURNS
.SHORTED SHORTEO
CONTINUE OPERATION
• y
S P > STOP PULSING PF COILS
S C > STOP CHARGING ALL TF COILS SO SLOW DISCHARGE OF ALL TF COILS
I > C l o
QUENCH
SF > STOP FAST DISCHARGE OF ALL TF COILS
Fig. 7-26. Fault logic diagram for TF coil shorts.
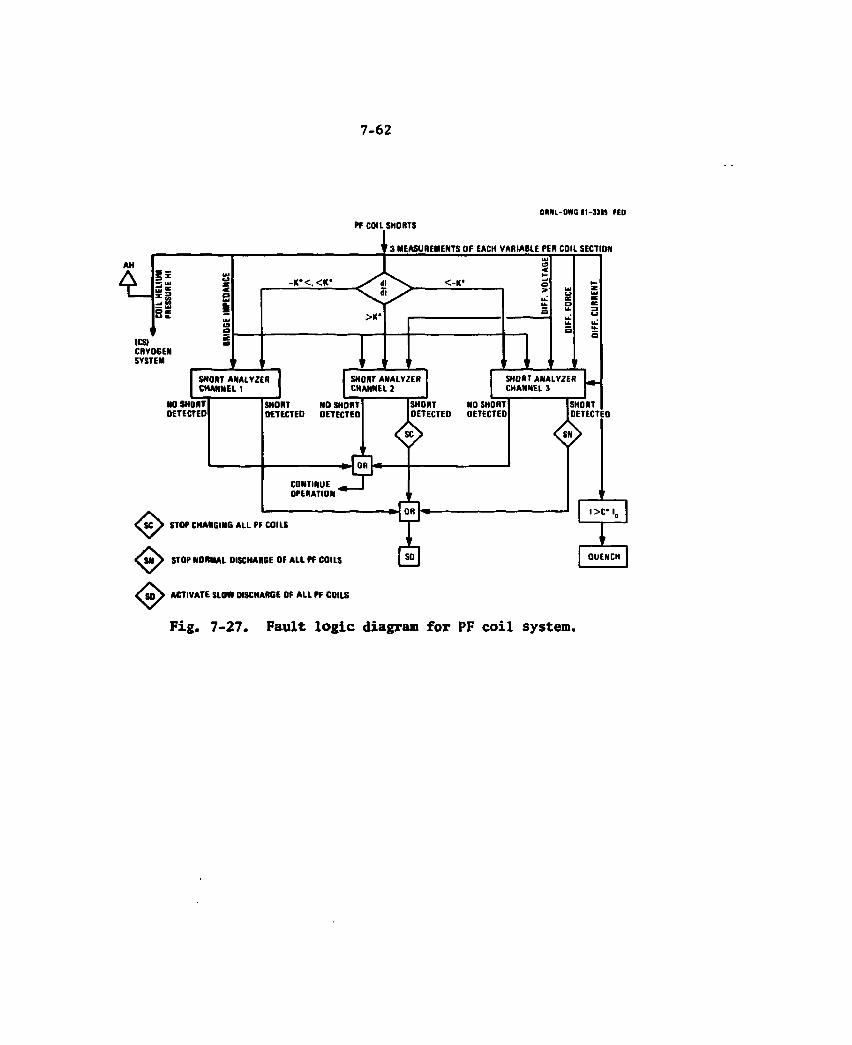
7-62
ORNl-OWG 81-33BS FED PF COIL SHORTS
Fig. 7-27. Fault logic diagram for PF coil system.
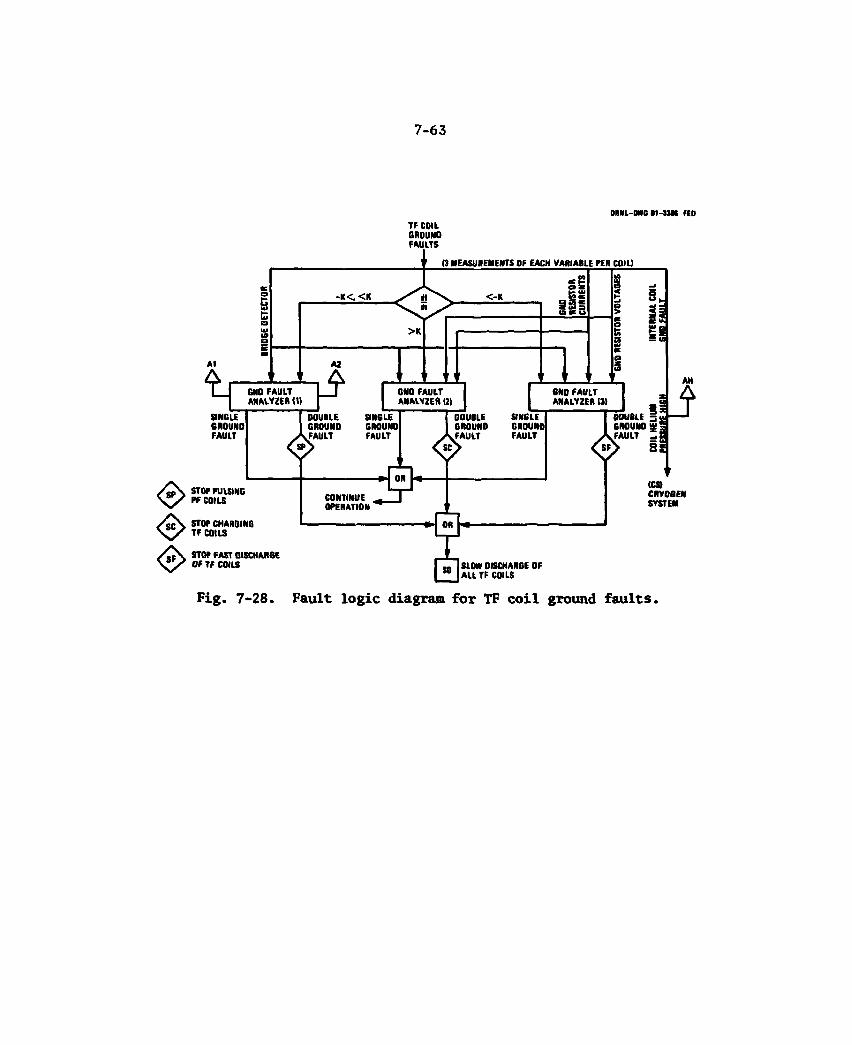
7-63
OIML-MO M-11M KD TF COIL GROUND FAULTS
Fig. 7-28. Fault logic diagram for TF coil ground faults.
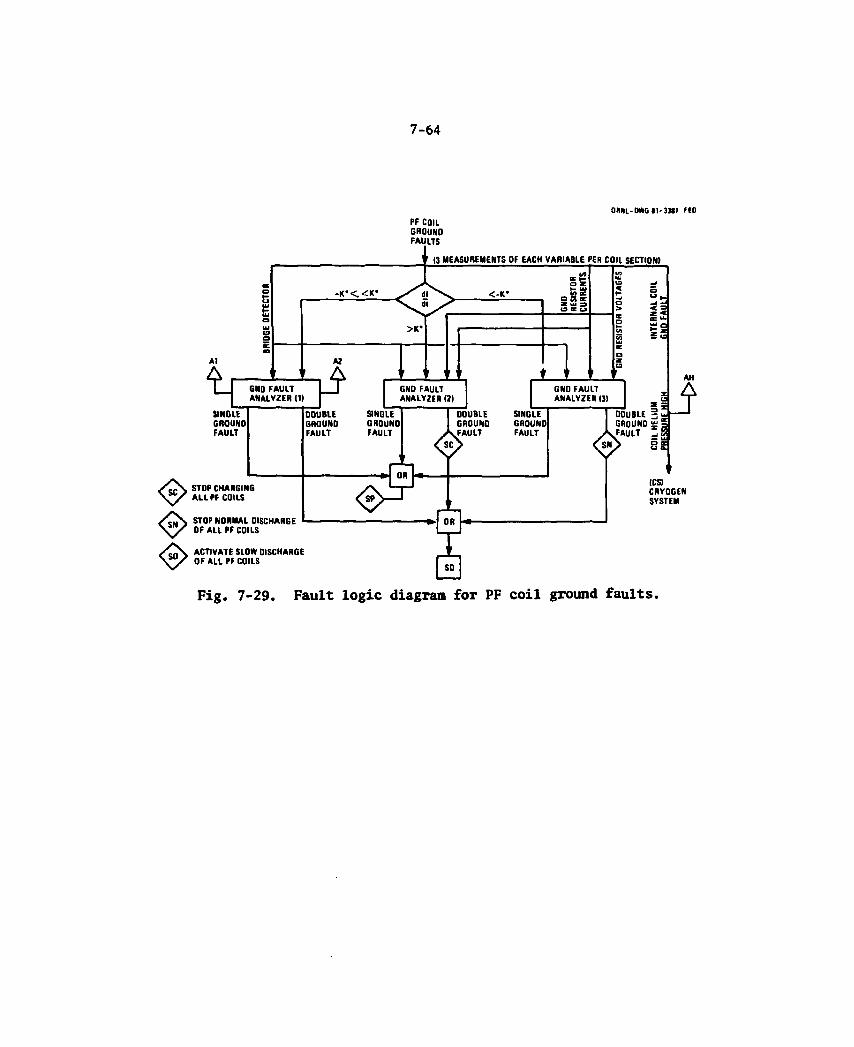
7-64
ORNL-OMG ll-]3ir FED PF COIL GROUNO FAULTS
Fig. 7-29. Fault logic diagram for PF coil ground faults.
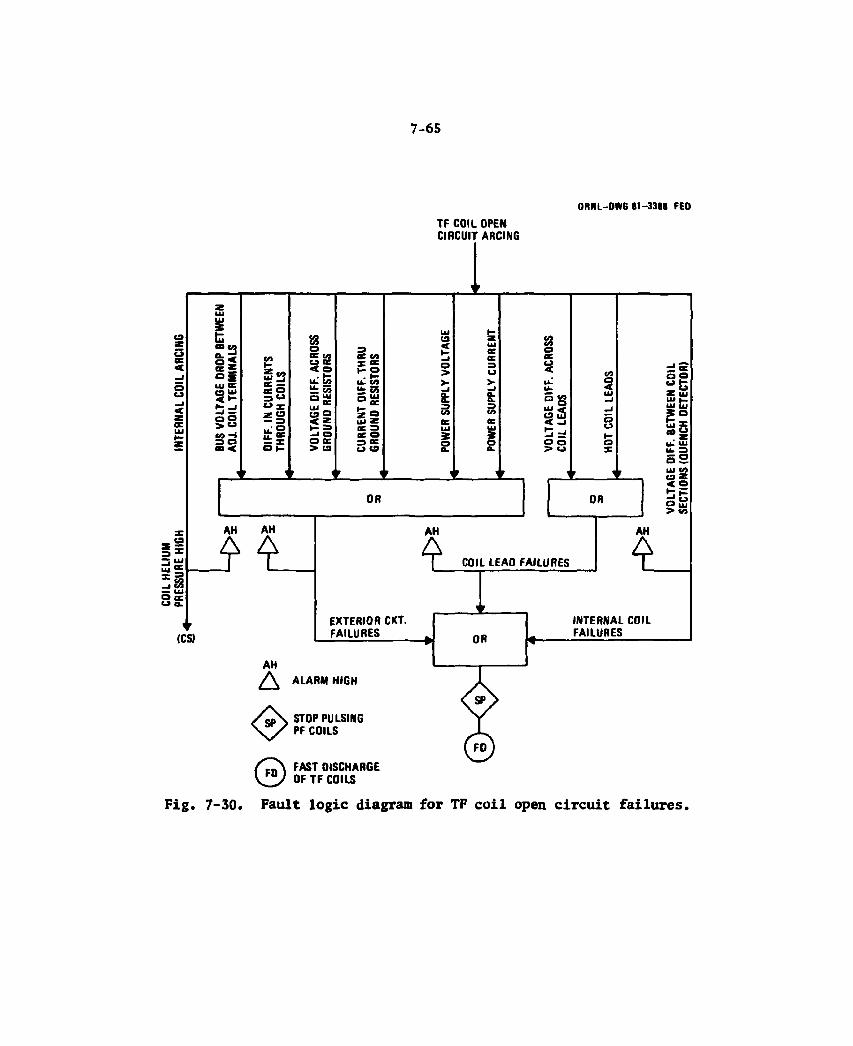
7-65
ORNL-DWG 8 I - 3 3 M FED
TF COIL OPEN CIRCUIT ARCING
Fig. 7-30. Fault logic diagram for TF coil open circuit failures.
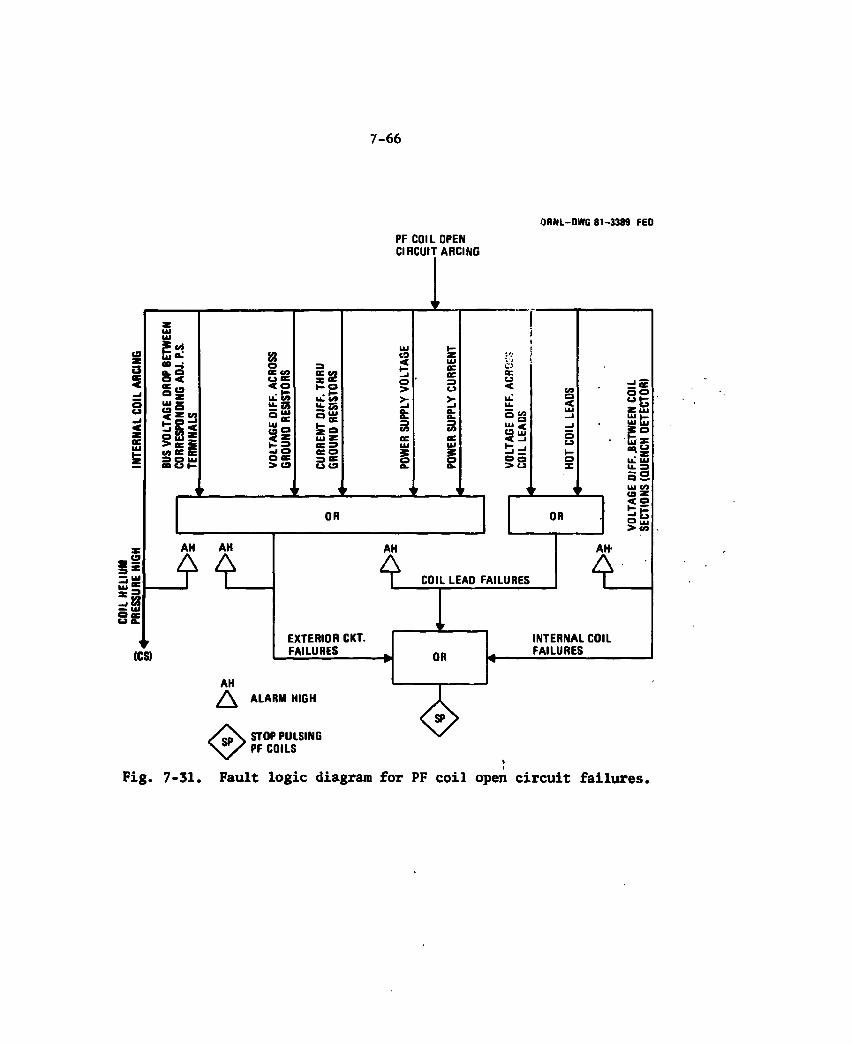
7-66
O R N L - D W G 8 1 - 3 3 9 9 FED
PF COIL OPEN CIRCUIT ARCING
Pig. 7-31. Fault logic diagram for PF coil open circuit failures.
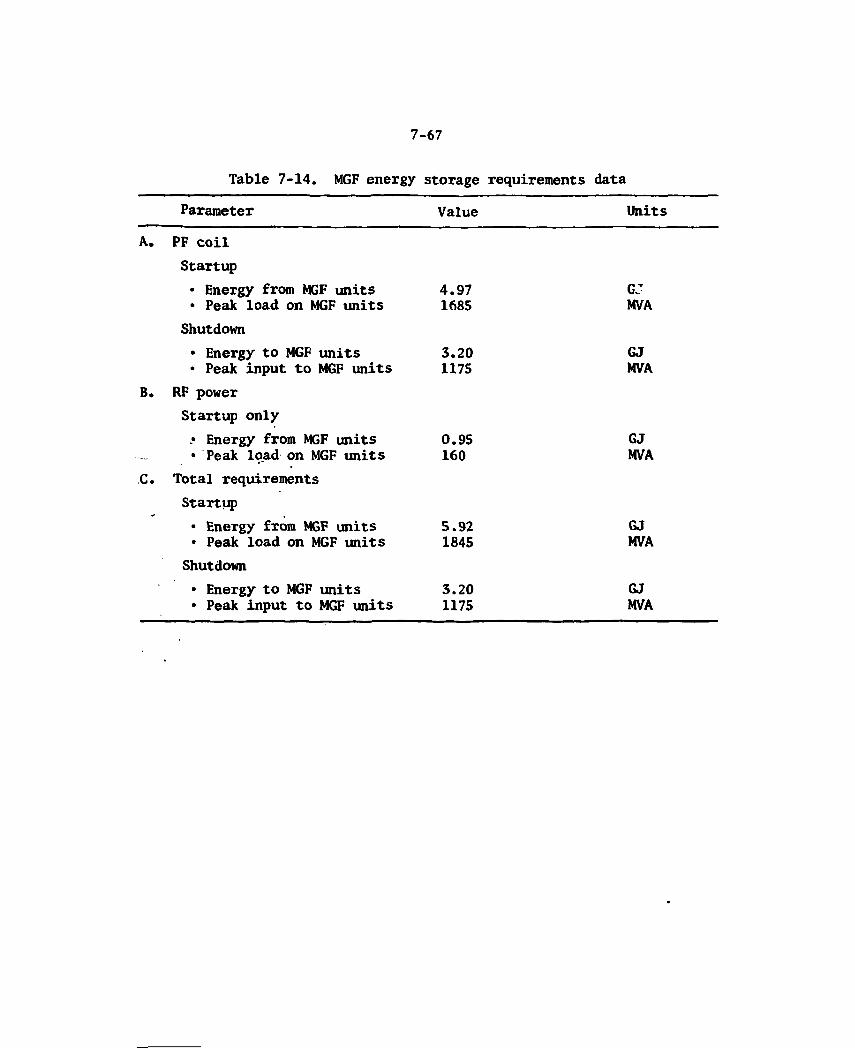
7-67
Table 7-14. MGF energy storage requirements data Parameter Value Units
A. PF coil Startup • Energy from MGF units 4.97 GJ • Peak load on MGF units 1685 MVA
Shutdown • Energy to MGF units 3.20 GJ • Peak input to MGF units 1175 MVA
B. RF power Startup only • Energy from MGF units 0.95 GJ • Peak load on MGF units 160 MVA
C. Total requirements Startup • Energy from MGF units 5.92 GJ • Peak load on MGF units 1845 MVA
Shutdown • Energy to MGF units 3.20 GJ • Peak input to MGF units 1175 MVA

7-68
Low frequency bridges (£400 Hz) will be used to detect coil shorts and ground faults. Microcomputer analyzers will characterize the failures and initiate the proper protective measure. The electrical fault diagrams connect with the cryogen system diagram with the label cs^
A component failure analysis of the TF coil protection arrangements given in Figs. 7-32 and 7-33 was performed. The following failures were investigated.
1. Fast discharge with shorted coil.
2. Slower discharge with shorted coil.
3. Fast discharge with open dump resistor.
4. Fast discharge with a shorted dump resistor.
5. Fast discharge when one circuit breaker fails to open.
6. Fast discharge with an open ground resistor.
7. Fast discharge with short between coil terminal and ground.
8. Fast discharge with one circuit breaker opening one second before the others.
This component failure analysis shows that the TF coil protection of Fig. 7-32 is more fault tolerant than the one in Fig. 7-33. Grounding resistors between 1 and 10 ohms inclusive were found to be satisfactory for the faults considered. A shorted coil turn is tolerable but a shorted coil section can be a serious problem and generally require a slower discharge for adequate protection. Dump resistors must not fail to open; they should be monitored during operation to assure that they are available when needed.
Conclusions
F&jlt analysis shows that the better active fault protection system for the TF coils is the system shown in Fig. 7-4 with dump resistors shunting both the TF coils and the circuit breakers that connect the coils in series. Three channel coil protection logic with 2 out of 3 polling provides high reliability and minimum downtime due to inadvertent
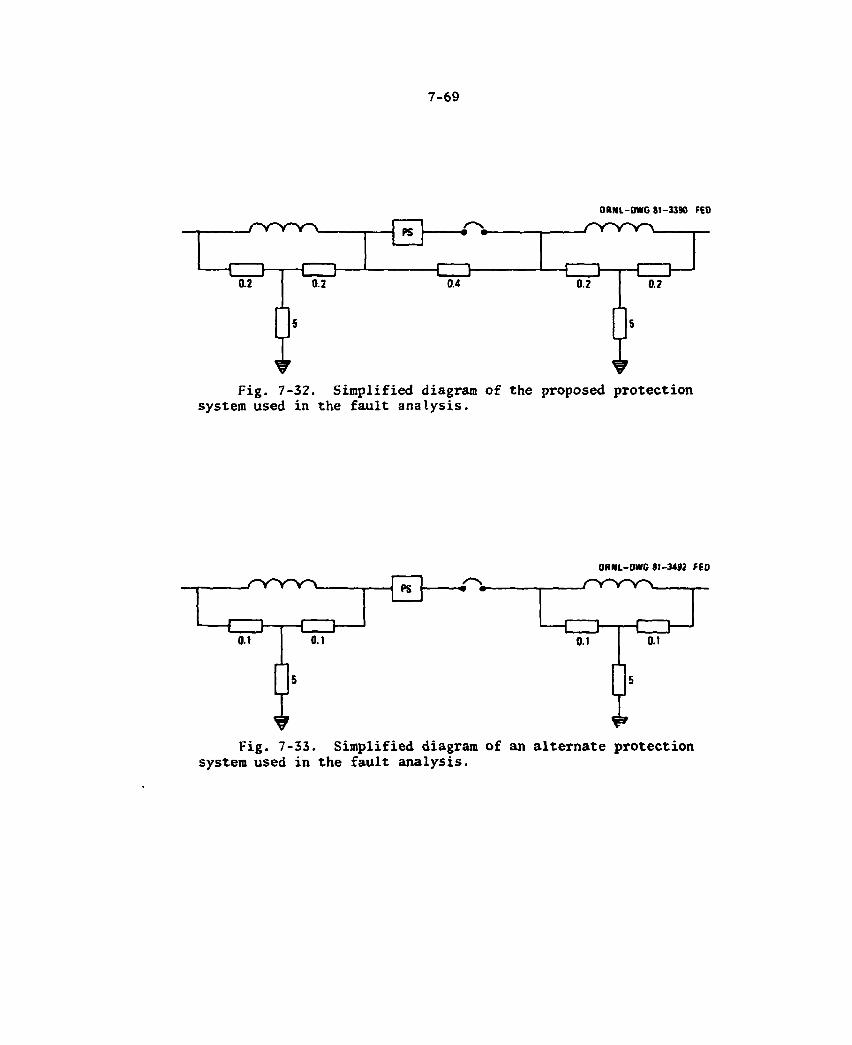
7-69
ORNL-DWG 81-3425 FEO
0.2
PS
0.2 0.4 0.2 0.2
Fig. 7-32. Simplified diagram of the proposed protection system used in the fault analysis.
OHNL-OWG 81-3492 FED
Fig. 7-33. Simplified diagram of an alternate protection system used in the fault analysis.

7-70
coil discharges. The protection system must be able to characterize faults so that rapid discharges are limited when shorted coils or coil sections exist.
Quench detection bridges are readily adapted to 10 identical TF coils with center taps to provide 2 out of 3 polling logic. This is not true for the PF coils where all the coils are different. More PF coil taps may be needed to detect normal zones that grow symmetrically about the coil center tap. Also, the high pulsed voltages of the PF coils during startup and shutdown of each cycle may make quench detectors of the PF coils useless except during the burn phase. In that case the quench detector signals of the PF coils need to be inhibited except during the burn phase of the cycle.
Much guidance for improving the FED coil protection system and resolving some of the problems was obtained from the FED Superconducting Coil Protection Workshop3 and previously published papers. Some of the analysis and studies suggested during the workshop was performed and additional effort remains to be done. In particular the capability for limited operation at 10 T feature of the FED design requires fault analysis to determine whether the proposed protection system is adequate for all credible faults and to determine its reliability.
7.2 ELECTRICAL ENERGY STORAGE SYSTEM
The ac energy storage system reduces the peak power demand on the utility line. It receives power from the utility line during the dwell and long burn phase of the cycle, and from the inductive loads of the PF converters during the discharge phase and stores this energy for the pulse loads uf the subsequent cycle. Motor Generator Flywheel (MGF) units are proposed for isolating the major pulsed loads from the utility line and supplying the required energy storage. The MGF units provide variable frequency, 13.8 kV pulsed power and isolat.. the converter harmonics from the utility line.
7-71
7.2.1 Requirements
The short duration, large pulsed loads of the PF coil power con-verters cannot be connected direct to the utility line; they must be connected to a buffer energy storage system. The peak pulsed power of the PF converters and their energy storage requirements during startup are given in Table 7-14. During startup the PF coils require about 5 GJ, but during shutdown 3.2 GJ of the stored energy in the coils is returned to the MGF units. The MGF units must also be able to supply 130 MW to the rf auxiliaries for 6 s when operating in the 10-T mode. Adding the rf power and energy requirement to the PF converter load gives the total requirements identified in Table 7-14. From this table it may be noted that the peak load during startup is about 1850 MVA and the stored energy needed is nearly 6 GJ. The table is based on supplying all the electrical load from the utility line during the burn phase. The MGF motors provide mechanical power to the generator and flywheel during the entire 152-s cycle.
7.2.2 Baseline Design Description
At least two vertical MGF units are proposed for isolating the short duration large pulsed loads from the utility line and for providing the energy storage and peak loads required. Some design data for the motor, generator and flywheel is given in Table 7-15. Drive motor and generator size are based on a 12-s startup time, a 100-s burn time, a 10-s shutdown time and a 30-s dwell time. Two MGF units, each having an energy storage of 3.2 GJ and a peak load rating of 1000 MVA meet the requirements. Two 15,000 HP wound rotor induction motors make up the energy loss of 2.7 GJ per cycle with about 3000 HP reserved for uncer-tainties associated with the requirements.
Figure 7-34 is a one-line diagram of the proposed energy storage system and the variable frequency power distribution system. Circuit breakers 8, 9, 20, and 21 are part of the ac power system of Fig. 7-2. The MGF bypass permits testing equipment on the MGF bus without starting the MGF units during maintenance and service operations. Switches S-l
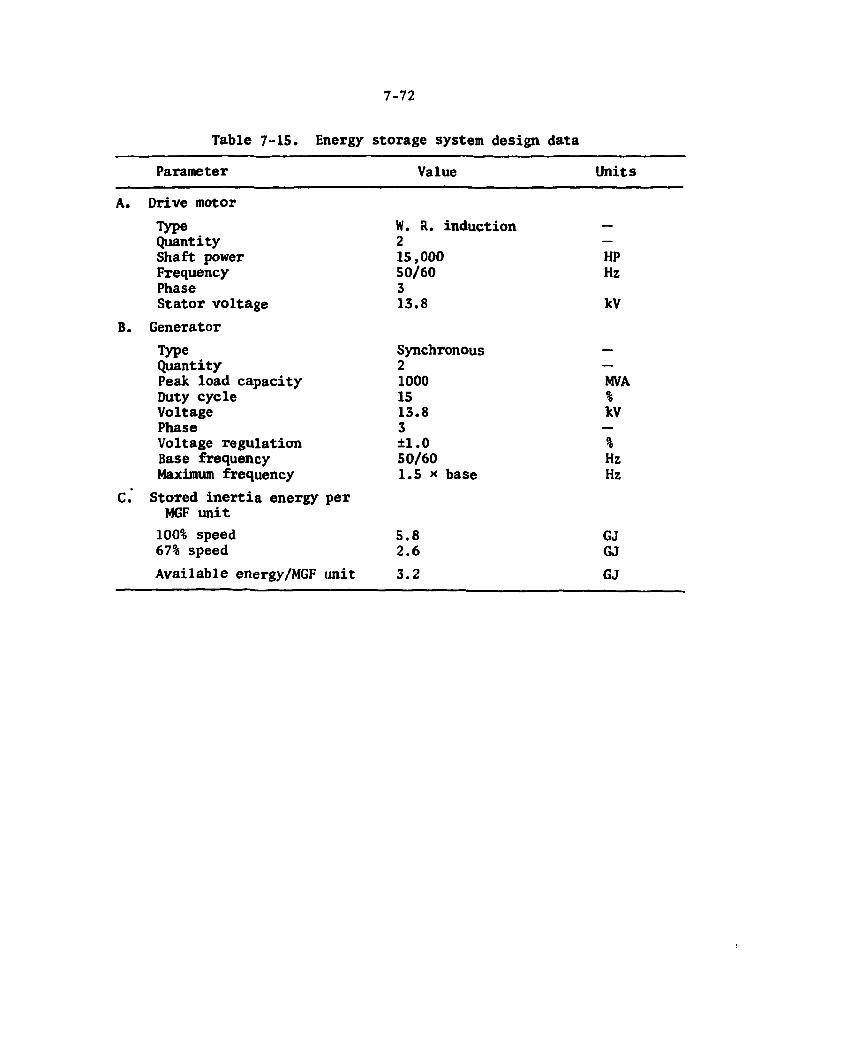
7-72
Table 7-15. Energy storage system design data
Parameter Value Units
A. Drive motor Type W. R. induction —
Quantity 2 —
Shaft power 15,000 HP Frequency 50/60 Hz Phase 3 Stator voltage 13.8 kV
B. Generator Type Synchronous —
Quantity 2 —
Peak load capacity 1000 MVA Duty cycle 15 % Voltage 13.8 kV Phase 3 —
Voltage regulation ±1.0 % Base frequency 50/60 Hz Maximum frequency 1.5 x base Hz
C." Stored inertia energy per MGF unit
100% speed 5.8 GJ 67% speed 2.6 GJ Available energy/MGF unit 3.2 GJ
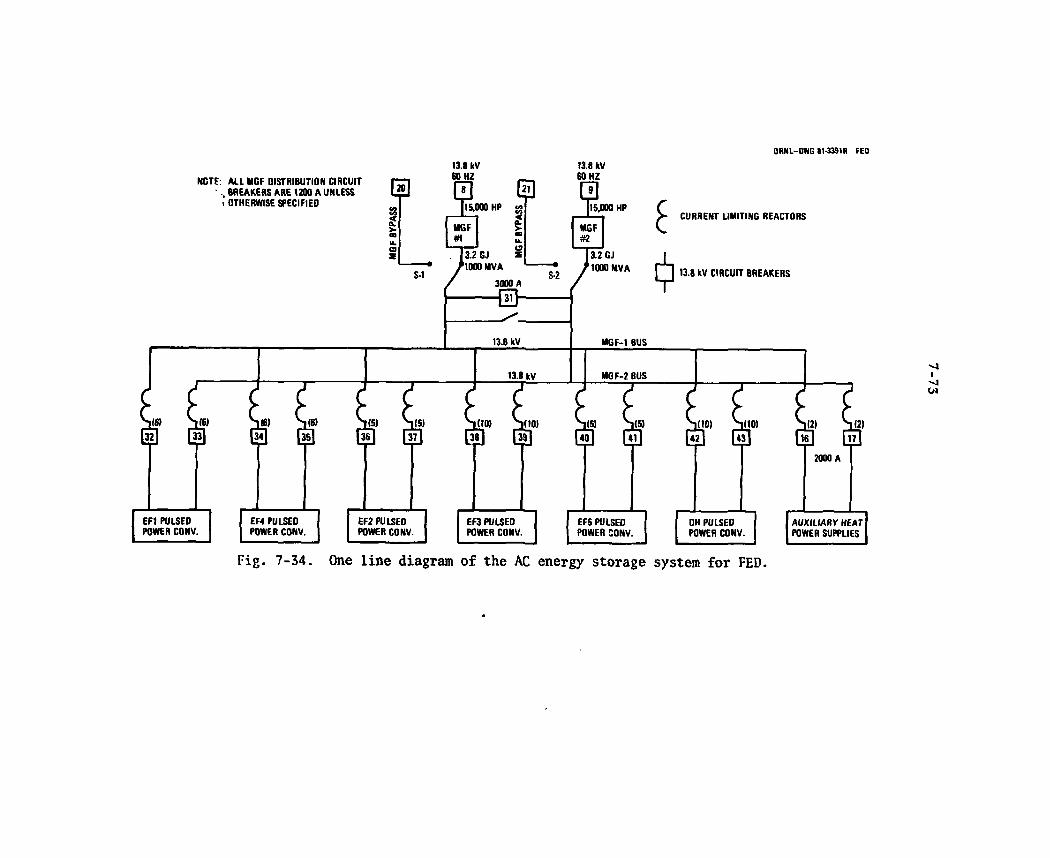
ORNL-DWG I1-33S1R FED
13.8 k V 13.8 k V
Fig. 7-34. One line diagram of the AC energy storage system for FED.
7-74
and S-2 could be bus links since they are used only infrequently when the machine is down for major servicing. Current limiting reactors are used to reduce the short circuit current and the size of the circuit breakers. Each PF coil power converter is composed of a number of modules defined in 7.1.3 above and each of these require circuit breakers. The number in parentheses is the number of current limiting reactors and circuit breakers associated with each power supply. There are a total of 88 MGF distribution circuit breakers.
7.2.3 Performance
The MGF units have very large inertias so that the stored energy at top speed is 5.8 GJ for each unit. Starting an MGF unit from zero speed will require about 15 minutes. Liquid rheostats, although inefficient, can be used to bring the wound rotor motor up to base speed (67% of top speed). To provide better control during normal operation and to con-trol the power system voltage regulation, a cycloconverter may be used to feed power to the rotor of the motor. During operation the slip frequency determines the motor torque and may be used to control the motor load. This type of control has proven to be satisfactory for MGF units about half the size of the ones proposed for FED and it should prove satisfactory for larger units.
The MGF unit has a relative high energy storage density and has proven its capability of storing large quantities of energy. The MGF unit is an effective buffer between the pulsed load and the utility line greatly reducing the voltage fluctuations and harmonics that would exist if the PF coil converters were connected directly to the line. These storage units have proven to be safe, reliable and economical and easy to control. Voltage can be regulated within ±1% with conventional exciter controls.

7-75
7.2.4 Other Options
Other types of energy storage systems that were considered are superconducting coils, homopolar generators, compressed air turbine driven generators with compressed air storage, hydroturbine driven generators with a water pump and reservoir. These systems have not been employed in large energy storage systems built thus far for tokamaks and are either economically unattractive or require further development.
7.2.5 Conclusions
The proposed ac energy storage system can be designed and constructed with commercially available MGF units which have proven to be safe, reliable, and easily controlled. Future work should include an evaluation of the number of MGF units needed to provide satisfactory reliability. Preliminary specifications for the MGF units also need to be prepared which can be used as the basis for improving the cost estimating.
Building space allocation, installation and maintenance equipment, and the support facilities also need to be addressed. There are 88 current limiting reactors, circuit breakers, and feeder lines which must be routed through underground service tunnels to the electrical power supply buildings. This work needs to be coordinated with architect-engineers who plan and design the buildings and their support facilities.
7.3 ELECTROMAGNETIC ANALYSIS
The electromagnetics analysis is the calculation of the structure and coil currents, voltages, and forces which are induced by transients. The transients are produced by:
(a) Startup and Shutdown, (b) Disruption, and (c) Plasma Position Control
The disruption is the dominant transient affecting the design features of FED. However, the three functions must be considered in a self-consistent fashion since the design features to satisfy one affects the
7-76
others; hence, the full system must be designed to provide a resultant structure which is satisfactory for all three transients.
7.3.1 Requirements
The electromagnetic requirements associated with startup are the same for both the 8-T and 10-T operating modes. ECRH is used to heat a small vertical resonan.t band inside of the torus chamber. When this band is heated to approximately 100 eV an external field is pulsed to provide 25 V around the plasma loop for approximately 200 ms. This initial high voltage provides the L(dl/dt) and the IR drop need to increase the plasma current from zero to a value of approximately 25 kA. After the initiation of the plasma, the loop voltage is decreased to approximately 10 V which is required to develop the plasma over the first 6 s of startup.
The disruption characteristics used for electromagnetics analyses are given oelow for the thermal quench and the current quench stage of the FED disruption design.
FED DESIGN 8 T 10 T Disruption
Thermal quench Plasma loop voltage (V) 1000 1200 Time (ms) 5 5 Plasma magnetic flux change (Wb) 5 6
Current quench Time for current decay (ms) 10 10
A plasma disruption induces voltages and high currents in the FED circuits and structures which react with the toroidal fields and the poloidal fields to produce forces and torques. Arcing is only a minor problem on present machines, but it will be a major problem on FED if the design is not completed in a fashion to eliminate the arcs. Because of the presence of ionized gas, gaps between structures could arc over and produce arc erosion. The depth or thickness of the torus in FED is
7-77
very large in comparison to present experimental devices resulting in increased potential for arcing damage. The FED eddy currents will result in voltages in excess of those required to maintain an arc if the eddy currents on the sector walls are designed to flow radially to the outer walls of the sectors.
7.3.2 Baseline Design and Performance
The baseline electromagnetic design for the FED structure provides connecting links between each sector at the edges of the sectors near the plasma. The connecting links are arranged so that they occur with not more than 1.0 m separation around the circumference of the sectors. They are capable of conducting the full 4.6 million amperes Which will be induced in the first walls and the inside torus sector walls.
The first wall coolant panels are electrically connected to the sector torus walls at both ends. This allows the 1.4 million amperes in the coolant panels to flow around the structure with as small a radial component as practical. Where the currents in the first wall coolant panels flow through the supports to the sector walls there are J x B , forces. By keeping this connection length small, the forces on the connector can be kept small, and the voltage drop between the first wall panels are maintained below those that would sustain arcs.
The limiter segment copper sleeves are also connected internally to provide a toroidal eddy current path around the machine which will conduct 1.5 million amperes. The limiter segment has a coppcr water coolant substructure to remove the heat energy from the carbon blocks on the surface. This copper sleeve results in an unsyiiunetrical eddy current distribution, which pulls the plasma toward the limiter during a disruption current decay phase, and require spccial phasing and gain control in the position feedback control system.
To provide the high plasma loop voltage during plasma initiation, the two inner equilibrium field coils, EF1 and EF4, which are precharged, are discharged at a rate sufficient to provide slightly more than 25 V/turn. The induced voltage flux in the Qenter of the torus is impeded by the eddy currents in the torus. Thus the structure eddy currents result in
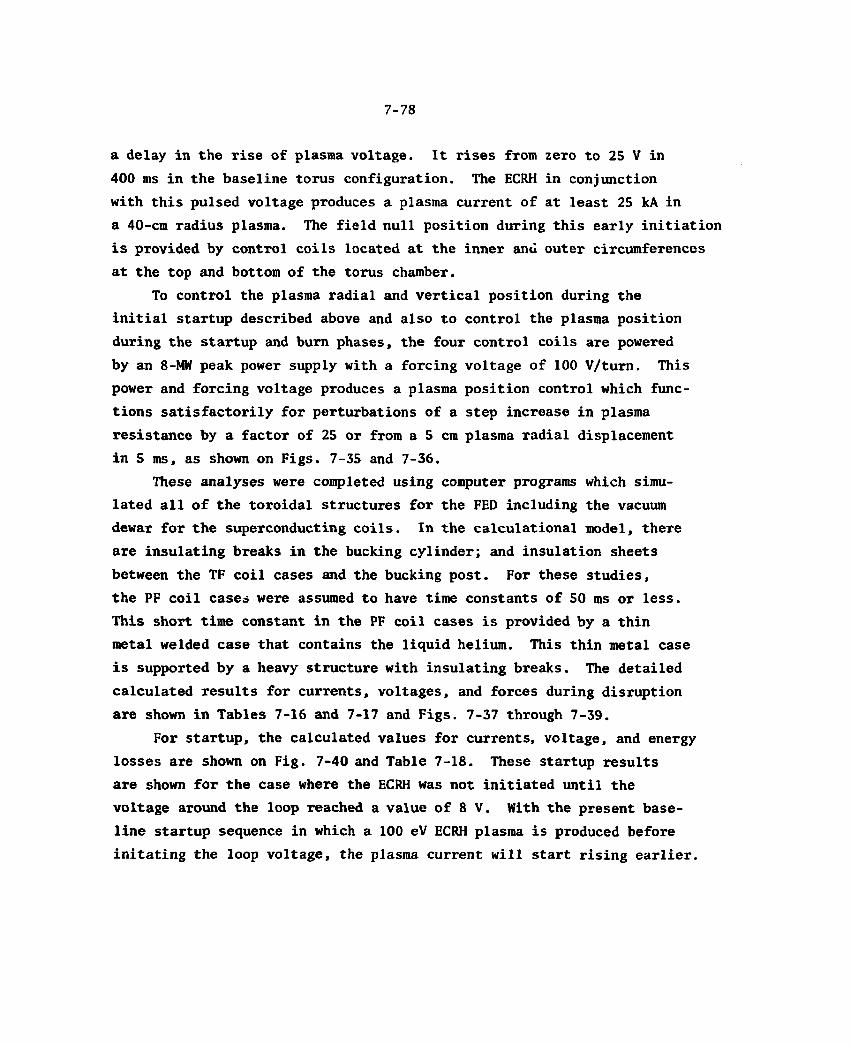
7-78
a delay in the rise of plasma voltage. It rises from zero to 25 V in 400 ms in the baseline torus configuration. The ECRH in conjunction with this pulsed voltage produces a plasma current of at least 25 kA in a 40-cm radius plasma. The field null position during this early initiation is provided by control coils located at the inner anu outer circumferences at the top and bottom of the torus chamber.
To control the plasma radial and vertical position during the initial startup described above and also to control the plasma position during the startup and burn phases, the four control coils are powered by an 8-MW peak power supply with a forcing voltage of 100 V/turn. This power and forcing voltage produces a plasma position control which func-tions satisfactorily for perturbations of a step increase in plasma resistance by a factor of 25 or from a 5 cm plasma radial displacement in 5 ms, as shown on Figs. 7-35 and 7-36.
These analyses were completed using computer programs which simu-lated all of the toroidal structures for the FED including the vacuum dewar for the superconducting coils. In the calculational model, there are insulating breaks in the bucking cylinder; and insulation sheets between the TF coil cases and the bucking post. For these studies, the PF coil cases were assumed to have time constants of 50 ms or less. This short time constant in the PF coil cases is provided by a thin metal welded case that contains the liquid helium. This thin metal case is supported by a heavy structure with insulating breaks. The detailed calculated results for currents, voltages, and forces during disruption are shown in Tables 7-16 and 7-17 and Figs. 7-37 through 7-39.
For startup, the calculated values for currents, voltage, and energy losses are shown on Fig. 7-40 and Table 7-18. These startup results are shown for the case where the ECRH was not initiated until the voltage around the loop reached a value of 8 V. With the present base-line startup sequence in which a 100 eV ECRH plasma is produced before initating the loop voltage, the plasma current will start rising earlier.
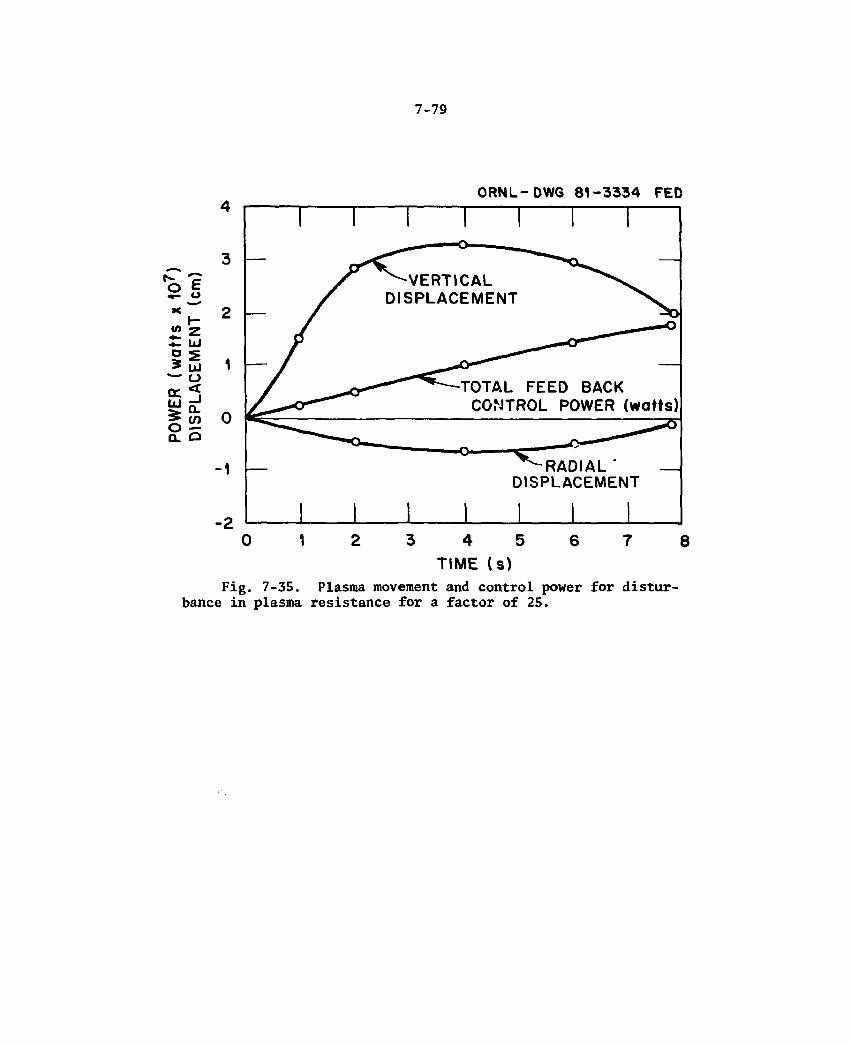
7-79
ORNL-DWG 8 1 - 3 3 3 3 FED
- 1
- 2
Fig. 7-35. Plasma movement and control power for distur-bance in plasma resistance for a factor of 25.
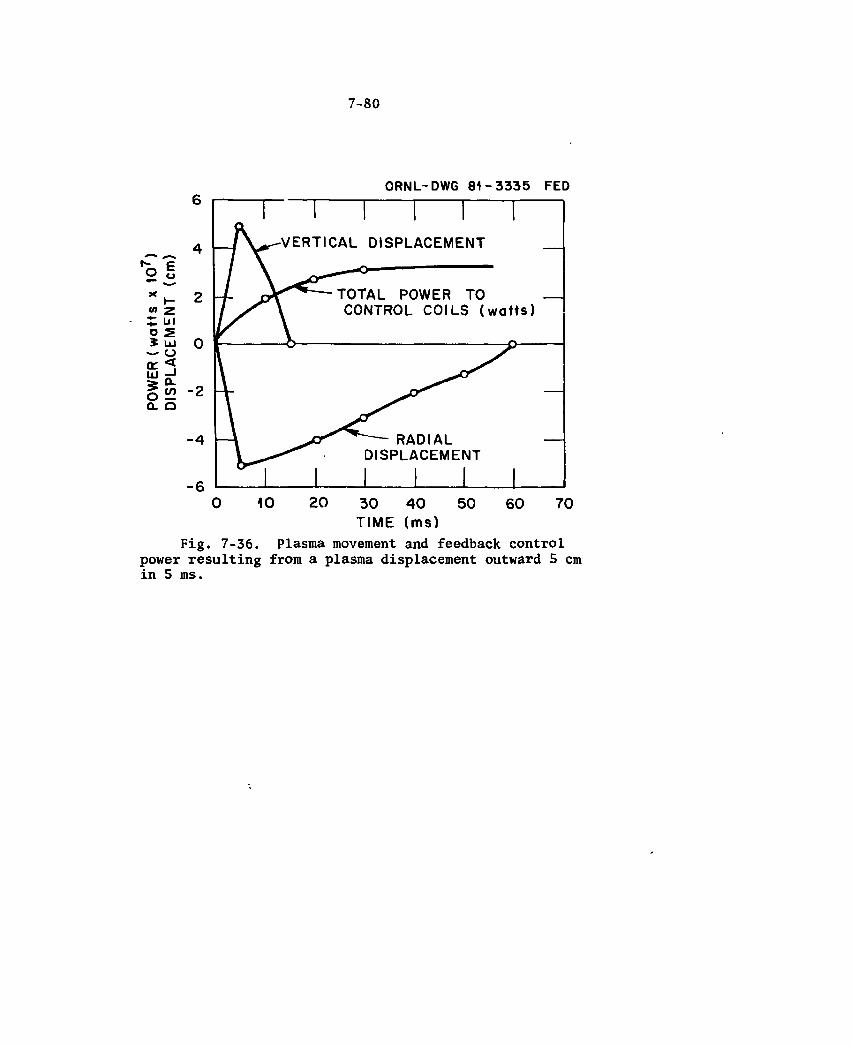
7-80
ORNL-DWG 8 1 - 3 3 3 3 FED
VERTICAL DISPLACEMENT
TOTAL POWER TO CONTROL COILS ( w a t t s )
30 4 0 TIME (ms)
Fig. 7-36. Plasma movement and feedback control power resulting from a plasma displacement outward 5 cm in 5 ms.
7-81
Table 7-16. Maximum currents in structures
Surface Maximum total
MA Time ms
Local peak A/cm2
Limiter 1.37 155 1100 First wall 1.23 10 120 Armor P. 21 10 110 Inside torus 3.03 13 1300 Outside torus 0.51 50 250 Spool 0.25 50 50 Dewar 0.59 75 300 Through contacts 4.68 10 1600
Table 7-17. Induced voltages during disruption
Peak voltage Coil kV Volts/turn
OH 10.0 8 EF1 4.0 39 EF2 4.0 39 EF3 3.3 32 EF4 1.7 18
Table 7-18. Energy expenditure during first 55 ms of startup
Plasma 111 kJ Spool (inconel) 388 kJ Inner wall 575 kJ TF cryostat 2.01 MJ Rest of passive elements 4.15 MJ
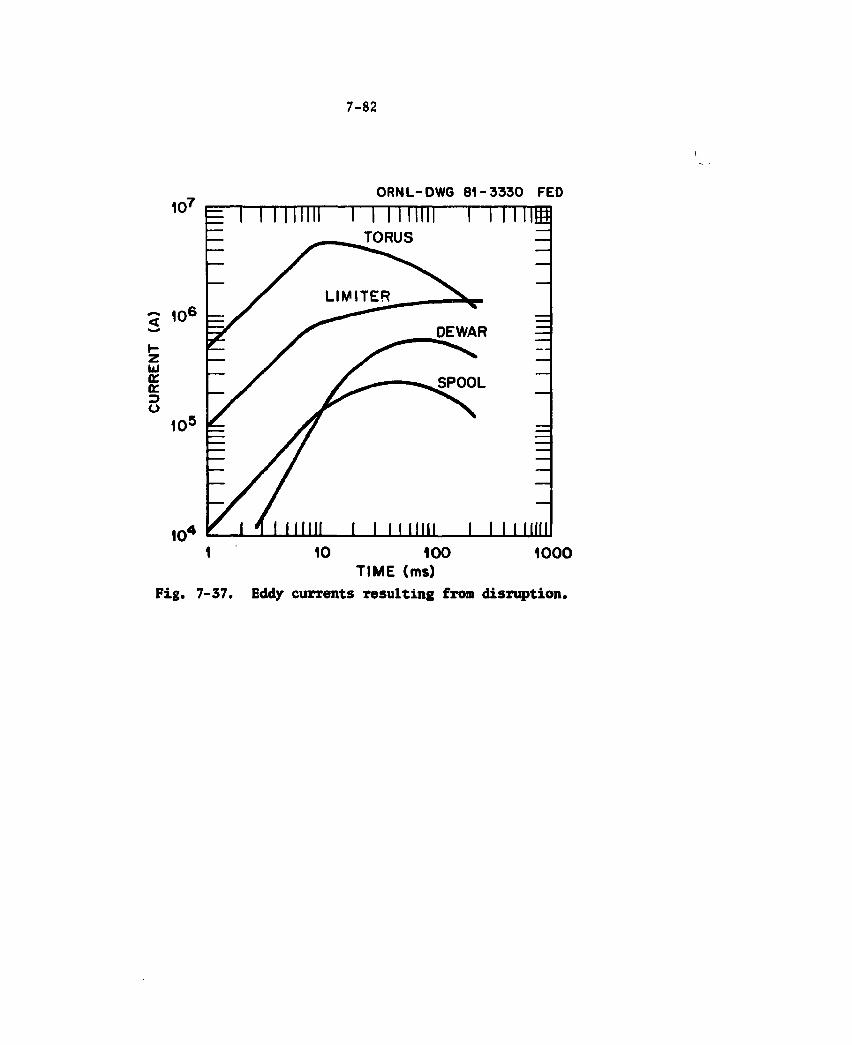
7-82
10* ORNL-DWG 8 1 - 3 3 3 0 FED
5 106
UJ a. a: 3 O
10"
10 1
TORUS TTTfH
111 1000 10 100
TIME (ms) F i g . 7 -37 . Eddy currents r e s u l t i n g from d i s r u p t i o n .
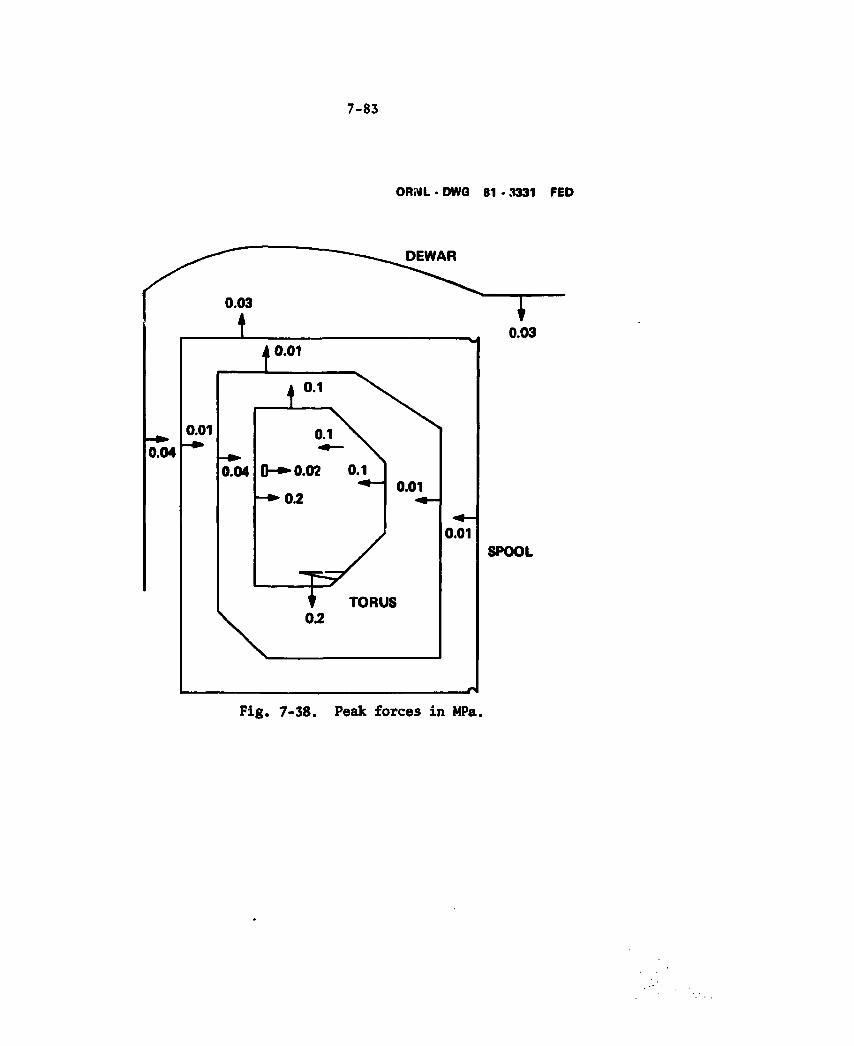
7-83
ORNL - DWG SI • 3331 FED
Fig. 7-38. Peak forces in MPa.
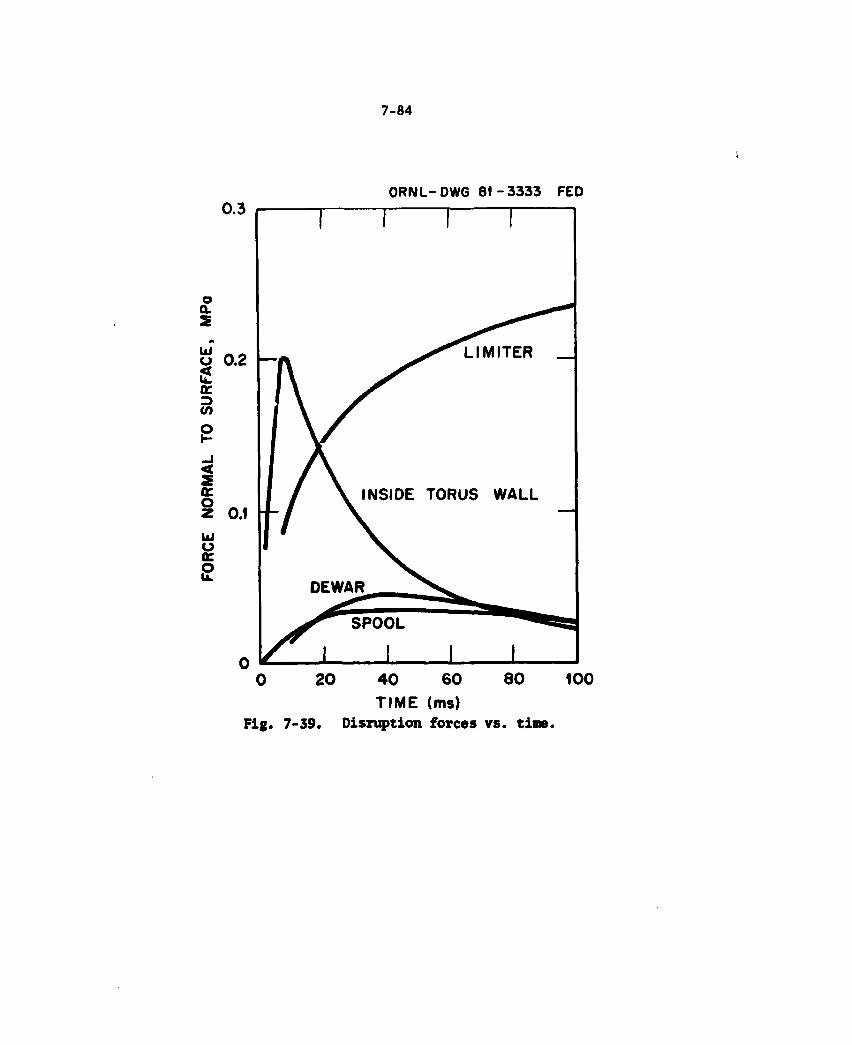
7-84
ORNL-DWG 8 1 - 3 3 3 3 FED
o Q.
UJ O if ac
o: o
o o: s
Fig. 7-39.
40 60 T I M E (ms)
Disruption forces vs. t ine .
100
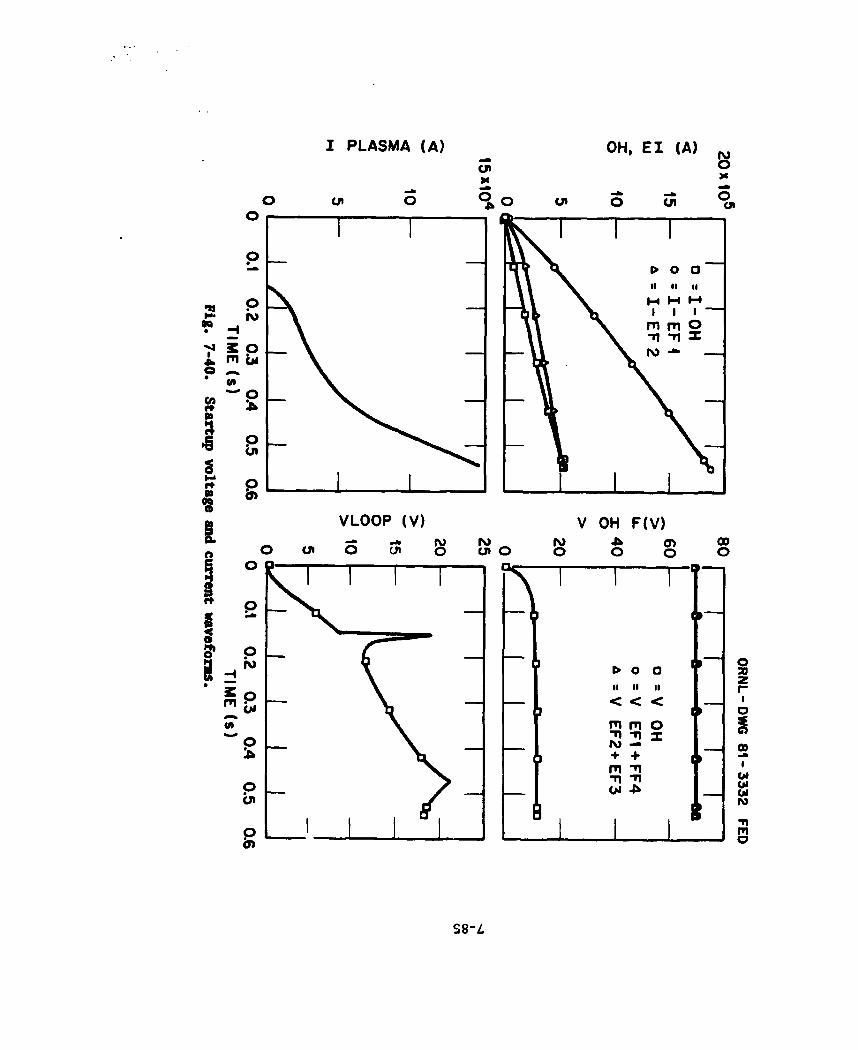
I PLASMA (A) OH, E I (A)
VLOOP (V)
m o o !
V OH F(V) ro o O 0) O
00 O
u
o • II M II < < < m m o •n T1 I l\) —* + + m -n -n w
O as
i o £ 0 s 1 Ol W OI ro •n m o
S8-Z
7-86
This electromagnetic baseline design evolved from the design and review of many options for ETF and INIOR as well as for FED. It was initially planned that the sectors would have 1-cm-thick shell walls. To withstand the hydraulic coolant water pressure, the walls near the plasma had to be increased to 4 cm with a row of 1 cm coolant holes in the wall to cool the surface. To provide reasonable control, it is necessary that the toroidal resistance of the torus outside shell be less than the innershell. With the original 1-cm-thick wall, the spool did not have low enough resistance and an insulating break was considered. Since the torus inside wall had to increase in thickness, the resistance decreased by a factor of about four and the requirement for an insulating break in the spool was eliminated. The insulating break would be used only if the spool losses of 490 MJ could be reduced and the savings would justify the reduction of vacuum reliability, the increased radial dimension of FED, and the cost of developing and manufacturing the insulating breaks.
Consideration was given to use of the superconducting OH coils and for special copper coils inside of the bore of OH coils to produce the 25 volts for initiation. These options were abandoned because of the long rise time, the large I R losses in the structure, and the high induced voltages in the superconducting poloidal coils. Consideration was also given to providing the
startup with special "blip coils" made of copper conductors located at the outer edge of the torus. This re-quired 1.2 million ampere turn (MAT) coils adjacent to EF1 and EF4 coils. Combining the startup feature using the EF1 and EF4 coils for plasma initiation eliminated the need for a second set of large coils. Position control is presently provided with separate coils; however, the control coils may be combined later with the EF1 and EF2 coils. The use of
separate control coils results in a lower voltage stress on the EF1 and EF4 coils and allows for a more versatile control system; this may prove necessary to provide the vertical position control for the FED with its elongated plasma and the copper sleeve pump limiter.
7-87
Consideration was given to placing the startup and control coils inside of the vacuum chamber. This option was not pursued because of the complications of removing the sectors to complete inspection or to provide minor maintenance work on the coils, and the reduced reliability of the vacuum systems and the insulation on the coils.
Alternatives to connecting links on the inner torus walls are: insulating the walls to prevent arcing, or providing spark gap type surfaces and allow the arcing to occur. It is not considered to be practical to provide an insulation to preclude an arc from developing between sectors during disruption. One could try to employ special carbon surfaces, and assume the arcs would remain in a diffused state or that the arcing would not develop on paths not parallel with the TF fields (arcing would not go around or between carbon blocks). A practical approach along these lines was not developed.
Allowing the arcs to occur in predetermined areas and providing a surface which would survive the required arc erosion is termed the spark gap method. The erosion rate for tungsten gaps on the torus was deter-mined to be approximately 10 grams per sector per major disruption. An additional problem /ith spark gaps around the torus occurs because the gaps will not always conduct. The currents will then travel back along the sector towards the outer wall and will result in higher J * B^ forces or torques. Calculations indicate that these forces would exceed 2 x 10⁶ lbs on the sectors and on the limiter segments. This would be a major factor in a limiter support design.
Developing the segment and limiter blade electrical connectors is the major problem associated with the present design. The power losses on startup are high but the system can easily handle current disruption voltages, heat produced by currents, forces and arcs.
The plasma thermal energy dissipation during the disruption is now considered to be independent of the electromagnetics, but as our knowledge of disruption behavior increases, it is likely that a good conducting wall, as in the baseline design, will result in a decrease in the thermal energy damage to the wall during the current quench phase of disruption. A good conducting wall near the plasma can be used to provide position
7-88
control for disturbances which are fast compared to the vessel time constant. Thus, the internal connectors between the sectors provide a desirable control feature. Electromagnetically this good conducting shell is equivalent to a 40-MW power system for a plasma disturbance with a time constant of 5 ms. If the sectors were not interconnected near the plasma, then the control would have to be larger by more than a factor of two to provide an equivalent control capability.
7.3.3 Future Tasks
The electromagnetic analysis is in the initial stages and will require much more work. A preliminary list of future tasks is given below.
1. Disruption analysis should be performed to calculate disruption parameters (such as thermal quench time, current decay time, current rise, and plasma position) on present operating machines. By comparing computed results with measured results, a solid engineering base, or reference, may be obtained for predicting the electromagnetics effects due to disruption on future devices such as FED.
2. Plasma position control is in the early definition stages on present machines, feedback control is generally developed by a test pro-cedure after the machine has been placed in service, and this approach will not be satisfactory in the future. With a reactor type device like FED, the shielding and test blankets are major eddy current conductors which impede the control fields from reaching the plasma. With plasmas that have high betas and greater elongation, the vertical position control becomes more demanding.
The various changes or fluctuations in poloidal field circuits, plasma inductance and resistance, and other features which would cause fluctuations need to be specified and then the electromagnetic analysis made to determine the control power and stabilization features needed.

7-89
Even if the thermal quench phase of disruption cannot be eliminated, it may be possible to provide a control which would prevent the current quench phase. This would reduce energy dissipated during the disruption by a factor of two.
In providing an optimum electromagnetic design, the shielding or cases on the PF coils should be designed such that the induced voltages for disruption and for startup are approximately the same.
During startup and shutdown as well as during a disruption, the heating due to the eddy currents in the superconducting structures must not cause a quench of the superconductor and the refrigeration system must be sized to remove the heat in the required pulse time. Providing the proper shielding or insulating breaks in the structure can result in a minimum cost of the structure, refrigeration system, coolant water, and power for operations. It may be determined that active electrical control shielding should be provided to keep the eddy currents out of the areas which are cooled to superconducting temperatures. Studies are needed to further understand these inter-active effects.
The design of the sector and pump limiter electrical connections needs to be developed in a way to minimize the number of contacts. The design should provide contacts which are easily installed and have a reliable operating life, and which do not weld to the structure durin? a disruption.
Analysis needs to be performed on the controllability of the field null position and the sensitivity of the plasma movement to the control fields. During the initial stages of startup, it is necessary that a null field be provided at the position where the ECRH has produced a band of 100 eV plasma. During the first few ms while the current rises to 25 kA, the null and the plasma, which transposes from a vertical band to a 40-cm-circular plasma must be positioned such that the null and the center of the plasma remain at the desired position.
7-90
Associated with this analysis one would obtain details on the use of 'voltseconds including how many voltseconds are needed during this initiation and from what coils they are supplied. The analysis would also provide information as to the voltseconds remaining in the system and available for the 12 s startup and burn period.
7. -The control system design needs more in-depth study. In a feedback - control system, the final design will require the gain and damping
circuits to be optimized. To do this will require a very detailed simulation of the structure and sensors. In addition, the sensitivity of the feedback control system to the design of the major components such as the unsymmetrical torus configuration, the copper pump l'imiter sleeve, and the thickness of the outer shell of the torus should be determined.
8. The present concept shows that the vertical position of the plasma can be controlled with less power and faster response than the radial position. Improvement could be obtained in the radial posi-• tion control by using the EF coils in conjunction with the control coils, especially to control large perturbations. The control sensitivity needed to control both the vertical and radial position should be determined; the use of the PF coils in conjunc-tion with the control coils to perform the control functions should be investigated.
7.4 DIAGNOSTICS, INFORMATION, AND CONTROL SYSTEMS
7.4.1. Introduction
Overview
The area of diagnostics, information, and control system generally covers the functions, processes, and equipment shown in Fig. 7-41. The term plasma diagnostics is defined to include all instruments that provide data related to properties or parameters of the plasma. It includes instruments that measure the behavior of the plasma when tokamak
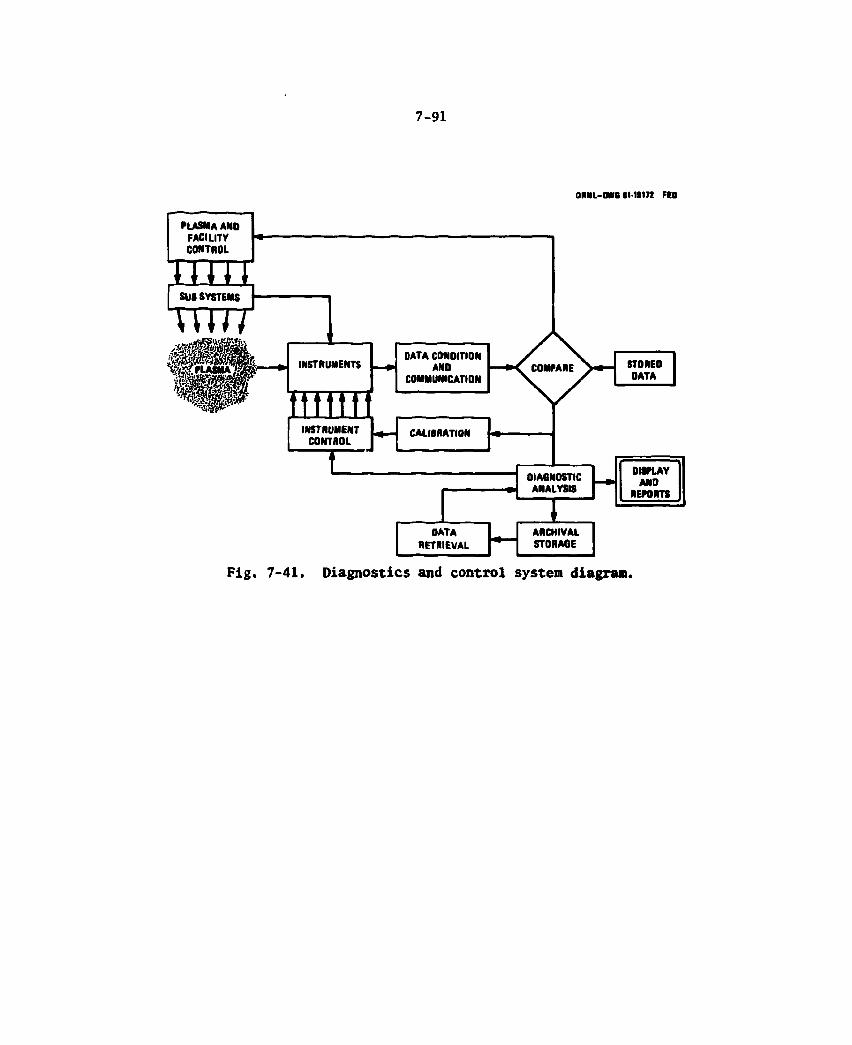
7-91
O M I L - O W B I I H 1 7 I FEO
Pig. 7-41. Diagnostics and control system diagram.
7-92
subsystems such as rf launchers, limiters or fuelers interact with the plasma. It also includes those instruments that provide the information required for feedback control of the plasma parameters such as plasma current position, density, neutron yield or temperature.
Sections 7.4.2 through 7.4.7 of this report discuss aspects of, diagnostics. Topics are: requirements, signal levels and environment, control diagnostics, analysis diagnostics and some selected instrument layouts. The remainder of Fig. 7-41 represents various elements of the Information and Control System which is addressed in Sections 7.4.10 to 7.4.13.
The upper half of Fig. 7-41 is related to facility and plasma control. The lower half of the figure is related to the diagnostic data system including instrument controls.
Diagnostics overview
Substantial advancement has occurred in all phases of diagnostic development in the last few years. During the last two years, JET has completed numerous design studies for individual diagnostics and has chosen a diagnostic set for their machine. JT-60 has defined a diagnostic set for their machine. Recently, MFTF-B has outlined a complete diagnostic set for their machine. New diagnostic instruments are regularly suggested and tested on EBT, PDX, Dili, Alcator, ISX and other existing machines. Laboratories that do not have their own tokamak facilities often test their diagnostics on these machines. The TFTR plasma diagnostics are evolving at a rapid pace. Their identification and definition has given way to design and implementation. These diagnostics will provide the most significant data base for the FED.
In spite of the steady progress in the state-of-the-art for plasma diagnostics, there remain several areas requiring development. The first is related to the instruments available for the D-T burn phase and the second is feedback control of the burning plasma. Present-day machines have operated with hydrogen and some with deuterium but none with significant amounts of tritium. Proven instruments are available to be adapted to FED for the hydrogen phase, but there are few proven
7-93
instruments available for the high temperature D-D phases or the D-T phases of operation. Some work has been instituted to develop detectors that will function in the FED D-T environment, the preliminary results of which will be available later this year. Until TFTR, and other facilities operate in the D-T mode, we will have a limited number of proven D-T instruments available. D-T instruments that can be remotely controlled and calibrated need development.
Second there is a substantial interest in the area of feedback control of the plasma for machines such as FED. However, insufficient information is available to accurately select the instruments to be used in the feedback process. Also, considerable work needs to be done on actuator effect on plasma parameters, identification of instruments to measure plasma parameters, modeling and simulation before a control system can be defined.
Section 7.4.2 of this report describes diagnostic requirements for FED. The requirements are related to the functional needs of FED. This section is followed by a section on signal levels and environment which discusses some plasma signal levels available to plasma diagnostic instruments and some of the background radiation and interference in which the instruments must function. Section 7.4.4 then describes some physical aspects related to the overall instrument set. This is followed by an identification of instruments used for plasma control and then the instruments used for performance verification, optimization and diagnosis Some selected instrument layouts are discussed and shown in Section 7.4.7 The last two sections on diagnostics briefly describe options to the baseline and future work.
7.4.2 Diagnostic Requirements
FED is scheduled to be the first large tokamak with a D-T ignited, long-pulse plasma. This places an increased pressure on the diagnostic instruments to deliver information that will improve the controlled thermonuclear technology. It will be important to be able to accurately measure the burning plasma parameters since there is a great deal to learn about scaling the FED to future ignited plasma designs. There is
7-94
also a grea t dea l t o l e a r n about the i n t e r a c t i o n between the subsystems
such as the r f hea t ing system or f u e l e r s and the plasma parameters.
This i n t e r a c t i o n must be w e l l enough understood t o c o n f i d e n t l y spec i fy
f u t u r e cont ro l systems. F i n a l l y , u n c e r t a i n t y o f the s e v e r i t y , frequency
and character o f d i s r u p t i o n s , ar 1 u n c e r t a i n t y i n the methods o f impur i ty
and ash removal have a large impact on FED design. The measurements
t h a t remove these u n c e r t a i n t i e s must be made i f the next machine i s t o
be opt imized from a c o s t - r i s k balance po in t o f v iew. FED w i l l undoubtedly
serve as a t e s t bed t o determine which d iagnost ic instruments are
requ i red i n a r e a c t o r .
With the a n t i c i p a t e d h igh cost o f FED i t i s important t o have a d iag-
n o s t i c set t h a t w i l l be appropr ia te f o r moni tor ing and c o n t r o l l i n g the
performance o f the machine. I t would be unfor tunate i f the machine d i d not
meet the performance due t o a lack o f d iagnost ic c a p a b i l i t y i n an area
where i t could have been prov ided. As a l l preceding f u s i o n - o r i e n t e d
machines have been, FED w i l l be a unique, o n e - o f - a - k i n d dev ice . Because
o f i t s importance i n the e v o l u t i o n o f fus ion power product ion t h i s
machine must be p a r t i c u l a r l y w e l l understood. The data obta ined from
the plasma d iagnost ic instruments must be complete enough t o r e l a t e t h i s
machine t o previous machines and to e x i s t i n g theory . Furthermore, i t
must t e l l us enough t o e x p l a i n the performance o f FED and then provide
the in fo rmat ion t o a c c u r a t e l y design and p r e d i c t the performance o f
machines t h a t f o l l o w . I n genera l the plasma diagnost ics f o r FED should
provide in format ion f o r the needs shown i n Table 7 - 1 9 .
FED w i l l have severa l d i f f e r e n t phases o f operat ion as shown i n
Table 7 - 2 0 . During subsystem checkout plasma d iagnost ics w i l l not be
used t o any great e x t e n t . There are severa l except ions, the f i r s t being
magnetic sensors which w i l l be used wh i le the magnetic system i s being
set up and a l i g n e d . A second i s the r e s i d u a l gas analyzers which w i l l
be used when the vacuum system i s checked o u t . The o v e r a l l in format ion
and c o n t r o l system w i l l be one o f t h e f i r s t systems checked out and w i l l
be a v a i l a b l e f o r a i d i n g the o t h e r subsystems dur ing the checkout proce-
dure.
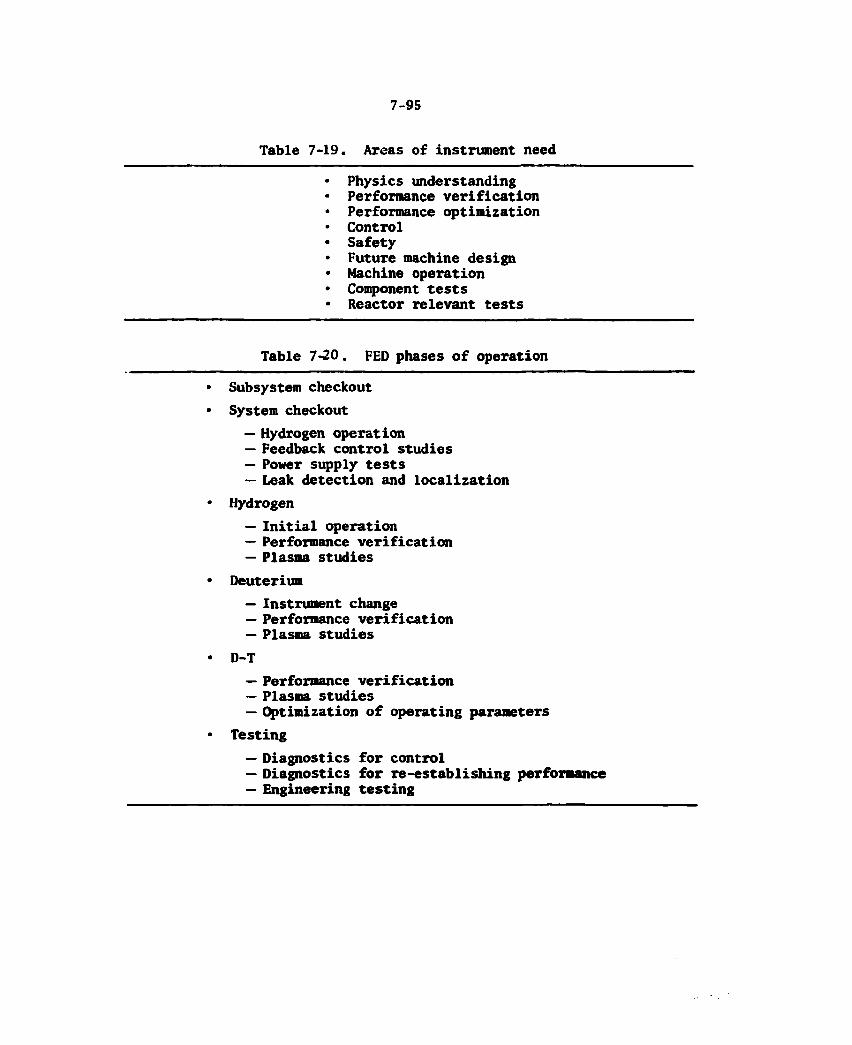
7-95
Table 7-19. Areas of instrument need
• Physics understanding • Performance verification • Performance optimization • Control • Safety • Future machine design • Machine operation • Component tests • Reactor relevant tests
Table 7-20. FED phases of operation
• Subsystem checkout • System checkout
— Hydrogen operation — Feedback control studies — Power supply tests — Leak detection and localization
• Hydrogen — Initial operation — Performance verification — Plasma studies
• Deuterium — Instrument change — Performance verification — Plasma studies
• D-T — Performance verification — Plasma studies — Optimization of operating parameters
• Testing — Diagnostics for control — Diagnostics for re-establishing performance — Engineering testing

7-96
Extensive use of plasma diagnostics begins with the overall systems checkout. This will include vacuum establishment and power supply tests followed by hydrogen ionization, buildup of I to its maximum value of 6.S MA, and finally feedback control studies that will allow progressing to the next phase.
Plasma studies will involve the integrated operation of all of the systems on FED. While the tokamak is using hydrogen, an extensive set of plasma diagnostics can be used. Some of the instruments that will provide significant information during this phase will not function in the D-T phase. Small amounts of deuterium can be used in this phase until the fusion products become a problem to the special detectors, seals and windows which have been used in the machine for the hydrogen phase.
When FED has been checked out sufficiently with hydrogen and small concentrations of deuterium, then instruments to be used for D-T should be installed. From the time the machine is operated in a D-D phase it will become activated. Approximately 2 * 1019 neutrons per shot will be generated during full power D-D shots. The plasma diagnostic equipment installed at this time should remain available until the machine is no longer utilized. During operating phases, where reactor testing or materials testing is being performed, most of the instruments can be de-activated, unless they are required for feedback control. However, if a problem occurs with the machine that results in a significant change in the performance, then the plasma instruments should be activated and used for diagnostic purposes.
7 . 4 . 3 Signal Levels and Environment
As discussed i n the previous section there are several d i f f e r e n t phases o f operation for FED. For each of these phases there w i l l be s ign i f icant dif ferences in senior signal levels associated with the various plasma parameters. Table 7-21 shows some expected source levels for analysis and background environmental conditions for the plasma diagnostic instruments when the plasma is operating at a "normal" leve l with hydrogen, D-D or DT in e i ther the 8 T or 10 T mode.
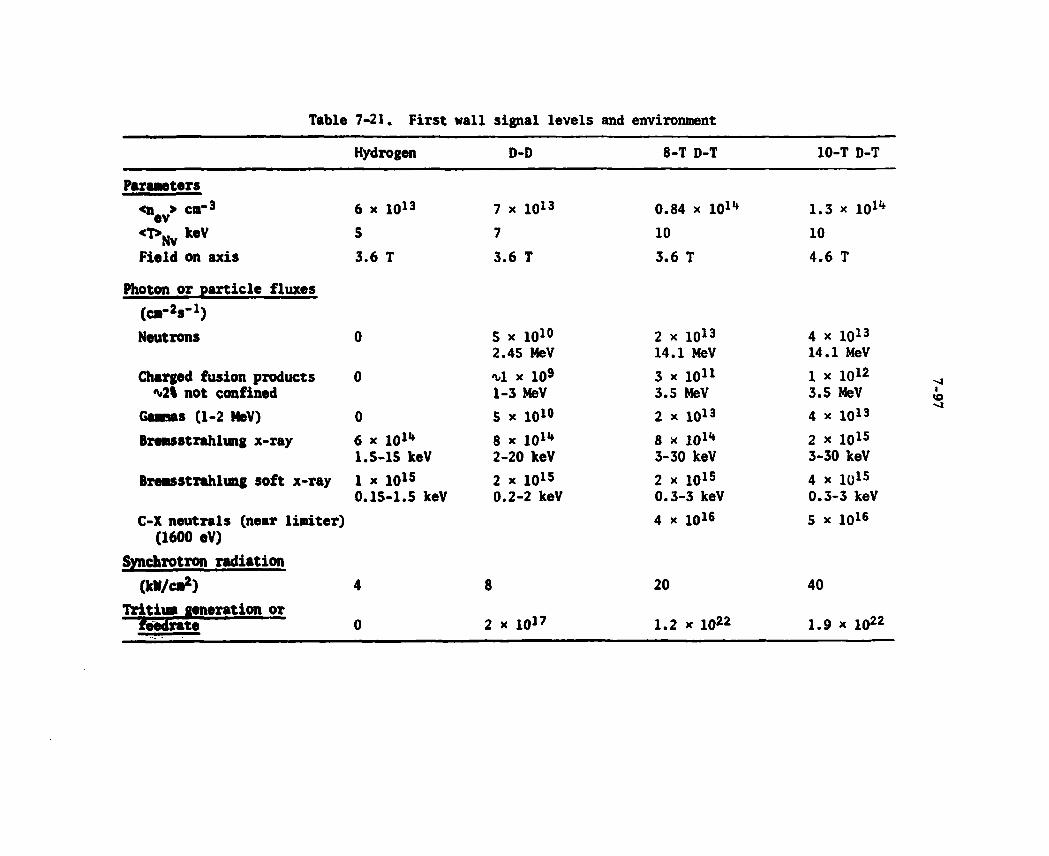
Table 7-21. First wall signal levels and environment
Hydrogen D-D 8-T D-T 10-T D-T
Parameters
<n > cm-3 ev
<T>Nv keV
Field on axis
Photon or par t ic le fluxes
( c m - V 1 )
Neutrons
Charged fusion products not confined
(tanas (1-2 MeV)
Bremsstrahlung x-ray
Bremsstrahlung soft x-ray
C-X neutrals (near l imi ter ) (1600 eV)
Synchrotron radiation (kW/cn2)
T r i t i w i generation or f eedrate
6 x 10¹³
5 3.6 T
6 x l o l * 1.5-15 keV 1 x 10¹⁵
0.15-1.5 keV
7 x 10¹³
7 3.6 T
5 x 10¹⁰
2.45 MeV x 10*
1-3 MeV 5 x 10¹⁰
8 x 101%
2-20 keV 2 x 10¹⁵
0.2-2 keV
2 x 10¹⁷
0.84 x 1011* 10
3.6 T
2 x 10¹³
14.1 MeV 3 x 10¹¹
3.5 MeV 2 x 10¹³
8 x io11* 3-30 keV 2 x 10¹⁵
0.3-3 keV 4 x 10¹⁶
20
1.2 x 10"
1.3 x 10^ 10
4.6 T
4 x 10¹³
14.1 MeV 1 x 10¹²
3.5 MeV 4 x 10" 2 x loiS 3-30 keV 4 x 10¹⁵
0.3-3 keV 5 x 10¹⁶
40
1.9 x 10²²

7-98
Table 7-21 shows that even the D-D plasma represents a severe environment as neutrons, gamma radiation from the shield, and tritium production from D-D fusion reactions all become overly abundant from the perspective of diagnostics operation. Neutron and gamma fluxes increase by more than two orders of magnitude for the D-T phase. Tritium pro-duction in the D-D phase due to fusion reactions is negligible in com-parison with tritium fueling in the D-T phase. About 0.1 mg of tritium is produced for each full power D-D shot of 100 s duration. Never-theless, even in the D-D phase, tritium production is more than suffi-cient to affect the use of secondary electron emission detectors typi-cally used in conventional residual gas analyzers, charge-exchange (C-X) neutral analyzers, vacuum ultra-violet (VUV) spectrometers as well as other diagnostics that require direct vacuum connection to the torus.
The synchrotron radiation is substantial and represents a high power microwave environment comparable to that which exists in present day microwave heated devices such as EBT-S. The power fluxes given in Table 7-21 include the effects of a reflecting wall with a reflectivity of 0.96. Since 96% of this power is reflected and subsequently reabsorbed by the plasma, the synchrotron wall losses account for only 4% of this flux. The maximum in the synchrotron spectrum occurs near a wavelength of 0.S mm. Synchrotron radiation is more suitably expressed as a power flux than a photon/particle flux; it is given a separate line on the table.
The first wall environment includes strong magnetic fields in the range of 5 T due to the toroidal field coils. This is a steady, non-pulsive field. The field at the outer vertical shield surface is about 3.5 T, while at the top surface of the shield the field is in the 4-8 T range. The pulsed OH, EF, and control field provide an extra problem for the diagnostic detectors located near the shield. These fields begin to decrease rapidly outward from the TF coil. At a distance of 2 meters outside the TF coil, the field is of the order of 0.5 T.
During normal operation the first wall temperature will be 200-300°C. The diagnostic instruments components which are installed near the first wall should be designed to operate from about 20 to 350°C. The tempera-ture reduces in the shield and the outer shield surface but still repre-sents a significant design consideration.
7-99
The plasma diagnostics must actually deal with a range of conditions for each of the phases shown in Table 7-20. Consider an operation sequence using D-T. From startup to shutdown we have pressure going
-7 -5 -4 from 10 Torr at prefill co 10 at beginning of burn to 10 at end of burn. The average electron temperature ranges from 0 to 10 keV, the
13 3 1 4 *y average density from 10 cm" to 1,3 x 10 4 cm , and the neutron production 20
from 0 to l.S ><10 n/s. For complete characterization of the plasma, diagnostic instrumentation must cover these ranges and more since most of the above numbers are averaged over the plasma volume.
7.4.4 Baseline Diagnostics — Physical Aspects
Certain of the tokamak sectors are dominated by major subsystems as shown in Fig. 7-42. Of the ten sectors, four have rf (ICRH auxiliary heating) launchers, one has a fueler and two have been designated as test sectors. Three sectors will be dominated by plasma diagnostics. It is expected that there will be some diagnostic instrumentation in all sectors, but keeping good design practice rules (such as maintainability) in mind, the instruments will be concentrated in three sectors. The surface area available for diagnostics is much larger than for previous machines. If comparison is made between TFTR and FED, between 3 and 4 sectors on FED would be required to provide a plasma viewing surface area similar to that provided on TFTR. For FED, the sector width is 4 m
2 at the equator. The flat section near the equator has about 8 m area. Instrument lines are planned to be routed within the TF coil bore at the top and sides of the machine since the superconducting TF coils have a large bore. The normal problems of fitting in the instruments with the interference of pipes, wires, and other systems are sure to appear even with the relatively large area available. A larger problem will be the difficulty of "seeing" the plasma through the thick neutron shield, in the presence of streaming neutrons, tritium, gamma rays, the magnetic field and the radiation shielding required around the diagnostic access holes. These problems will be addressed in the detail design phase for FED.
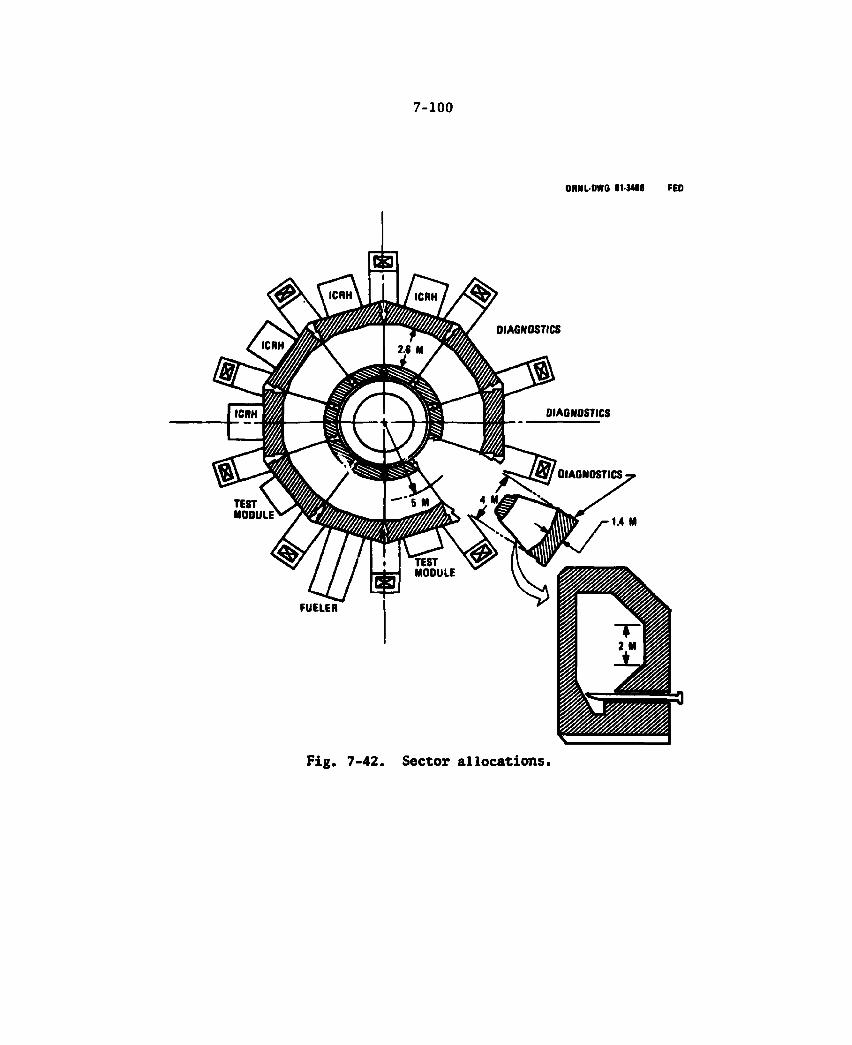
7-100
F i g . 7 - 4 2 . Sec tor a l l o c a t i o n s .

7-101
Figure 7-43 shows a drawing of the present FED tokamak cross section. This f igure indicates some of the mechanical aspects asso-ciated with implementation of the plasma diagnostics on FED. For hor i -zontal plane access to the plasma, a penetration must be made through the outer shield and then the inner wall of the torus. A diagnostic detector placed just outside the shield in th is area w i l l be in a mag-net ic f i e l d of about 3 Tesla. At the equator, the magnetic f i e l d due to the TF and PF magnetic systems is 1000 gauss at a radius of 12 meters. The f i e l d drops to 400 gauss at 20 meters. For certain detectors th is would s t i l l represent a problem and magnetic shielding would be required. The magnetic f i e l d above the torus dies very slowly. F i f teen meters above the cpnter of the plasma, the f i e l d is s t i l l 1600 gauss.
For ver t ica l access to the plasma from the top we must penetrate the shield, a res is t ive spool structure, the segment vacuum boundary and the armor t i l e . I f the diagnostic requires a path through the plasma and through the bottom of the torus as we l l , then we must pass through the l im i te r blade, the vacuum duct, more shielding, more resist ive structure and f i n a l l y through the f loor support structure. I f a long collimator i s necessary or i f the diagnostic detector must be in a low magnetic f i e l d then e i ther the upper or lower vacuum chamber related to the cryogenic system would have to be penetrated as well as the bridge-l i ke structure that holds the TF and PF co i l system in place. The clearance from the top or bottom of the torus_sbield to the TF co i l i s 1 n o r less. At the equator i t i s approximately 3.S m from a point out-side the torus shield to the outer edge of the TF c o i l .
There are basically thTee kinds of penetrations required for FED plasma diagnostic instruments. These are shown in Fig. 7-44. The f i r s t hole penetrates the shield but may be sealed at e i ther or both ends. This hole can be used for neutron measurements assuming end plug thick-nesses of 0.5 cm or less. Approximately 70% of the 14 HeV neutrons would pass through these plugs. The detector placed at the outside of the shield would have to be surrounded by shielding to help reduce the quantity and spectrum of streaming neutrons. Detectors in th is location have to be designed to operate in a high magnetic f i e l d (3-5 T) and high temperature (up to 300°C).
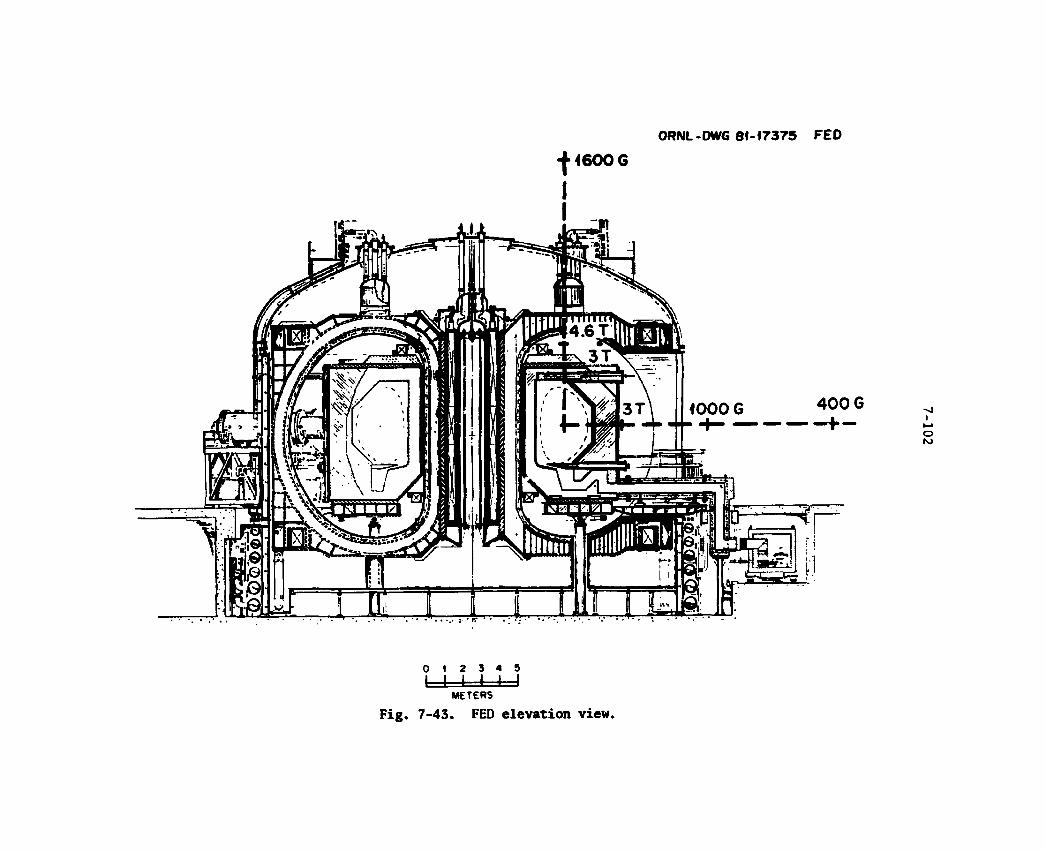
ORNL-DWG 81-17375 FED
4600 6 I
0 1 2 3 4 5
1 I I I I I METERS
Fig. 7-43. FED elevation view.
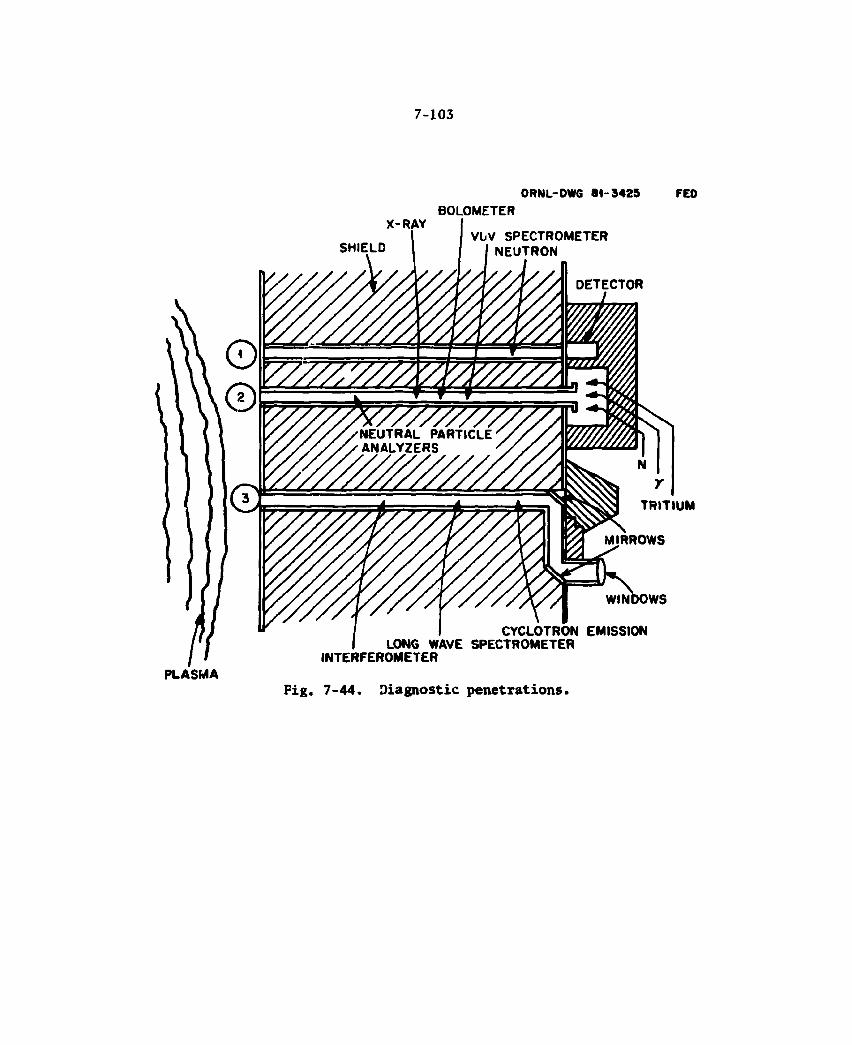
7-103
ORNL-DWG 81-3425 FEO BOLOMETER
X-RAY VUV SPECTROMETER
NEUTRON
DETECTOR
WINDOWS
CYCLOTRON EMISSION LONG WAVE SPECTROMETER
INTERFEROMETER
F i g . 7 - 4 4 . D i a g n o s t i c p e n e t r a t i o n s .
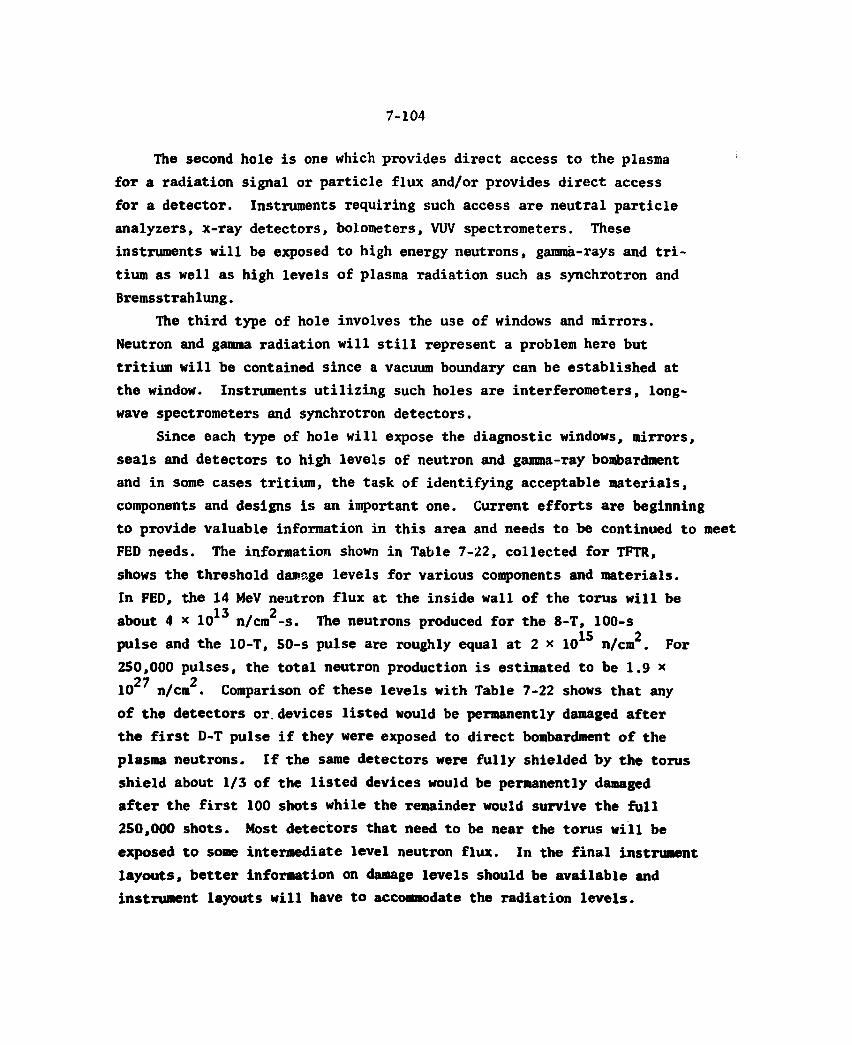
7-104
The second hole is one which provides direct access to the plasma for a radiation signal or particle flux and/or provides direct access for a detector. Instruments requiring such access are neutral particle analyzers, x-ray detectors, bolometers, VUV spectrometers. These instruments will be exposed to high energy neutrons, gamma-rays and tri-tium as well as high levels of plasma radiation such as synchrotron and Bremsstrahlung.
The third type of hole involves the use of windows and mirrors. Neutron and gamma radiation will still represent a problem here but tritium will be contained since a vacuum boundary can be established at the window. Instruments utilizing such holes are interferometers, long-wave spectrometers and synchrotron detectors.
Since each type of hole will expose the diagnostic windows, mirrors, seals and detectors to high levels of neutron and gamma-ray bombardment and in some cases tritium, the task of identifying acceptable materials, components and designs is an important one. Current efforts are beginning to provide valuable information in this area and needs to be continued to meet FED needs. The information shown in Table 7-22, collected for TFTR, shows the threshold damage levels for various components and materials. In FED, the 14 MeV neutron flux at the inside wall of the torus will be
13 2 about 4 x 10 n/cm -s. The neutrons produced for the 8-T, 100-s 15 2 pulse and the 10-T, 50-s pulse are roughly equal at 2 * 10 n/cm . For
250,000 pulses, the total neutron production is estimated to be 1.9 * 27 2
10 n/cm . Comparison of these levels with Table 7-22 shows that any of the detectors or. devices listed would be permanently damaged after the first D-T pulse if they were exposed to direct bombardment of the plasma neutrons. If the same detectors were fully shielded by the torus shield about 1/3 of the listed devices would be permanently damaged after the first 100 shots while the remainder would survive the full 250,000 shots. Most detectors that need to be near the torus will be exposed to some intermediate level neutron flux. In the final instrument layouts, better information on damage levels should be available and instrument layouts will have to accommodate the radiation levels.
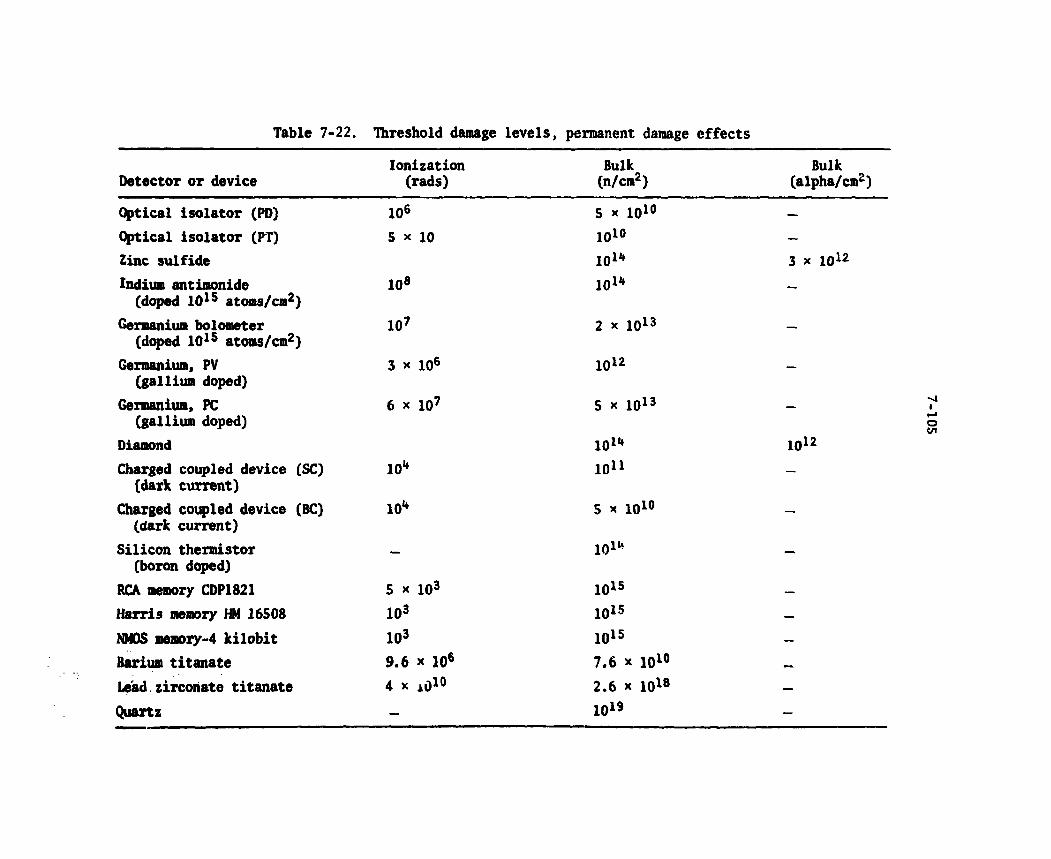
Table 7-22. Threshold damage levels, permanent damage effects
Detector or device Ionization
(rads) Bulk
(n/cm2) Bulk
(alpha/cm2)
Optical isolator (PD) 106 5 x 10¹⁰ —
Optical isolator (PT) 5 x 10 1 0 " —
Zinc sulfide 10*- 3 x 10¹²
Indium antimonide (doped 10*5 atoms/cm2)
10® 10*- —
Germanium bolometer (doped 10*5 atoms/cm2)
10? 2 x 10¹³ —
Germanium, PV (gallium doped)
3 x 10⁶ 10*2 —
Germanium, PC (gallium doped)
6 x 10⁷ 5 x 10¹³ —
Diamond 10*- 10*2
Charged coupled device (SC) (dark current)
10- 10** —
Charged coupled device (BC) (dark current)
10- 5 x 10¹⁰ —
Silicon thermistor (boron doped)
— 10*- —
RCA memory CDP1821 5 x 10³ 10*5 —
Harris memory HM 16508 103 10*5 —
NMOS memory-4 k i lob i t 103 10*5 —
Barium t i tanate 9.6 * 10* 7.6 x 10*0 _
Lead.zircoriate t i tanate 4 x A010 2.6 x 10¹⁸ —
Quartz — 10*9 —
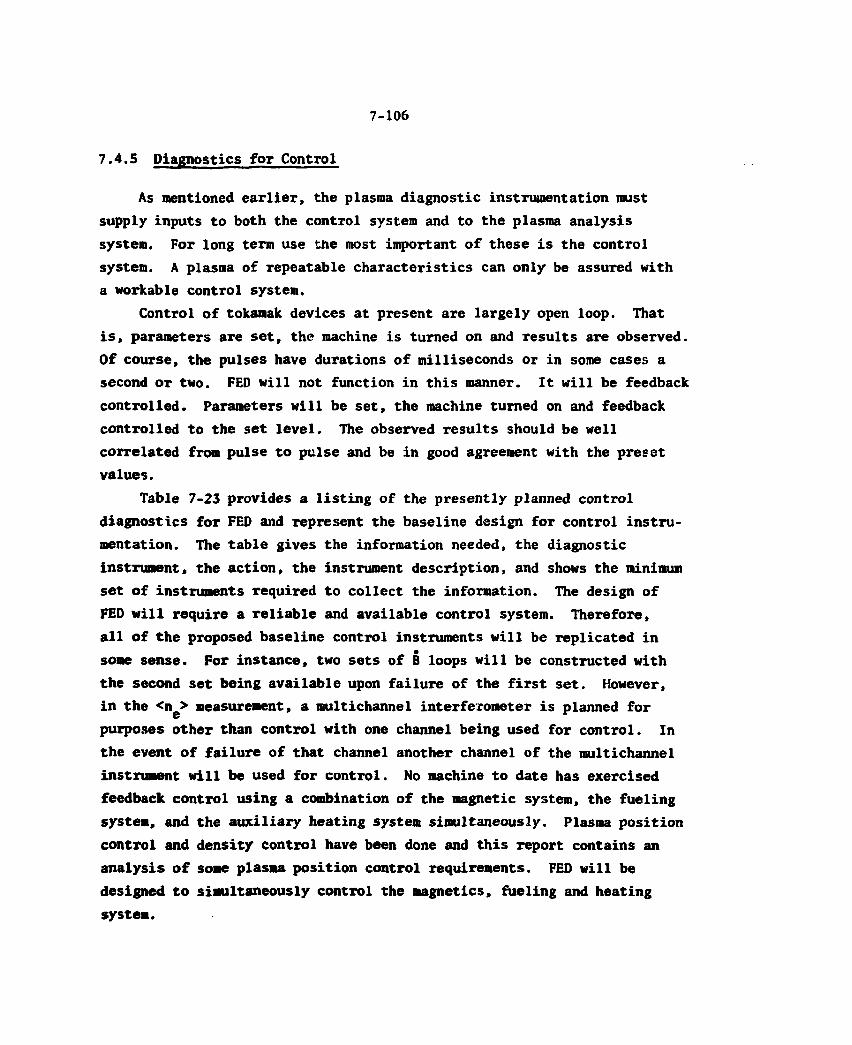
7-106
7.4.5 Diagnostics for Control
As mentioned earlier, the plasma diagnostic instrumentation must supply inputs to both the control system and to the plasma analysis system. For long term use the most important of these is the control system. A plasma of repeatable characteristics can only be assured with a workable control system.
Control of tokamak devices at present are largely open loop. That is, parameters are set, the machine is turned on and results are observed. Of course, the pulses have durations of milliseconds or in some cases a second or two. FED will not function in this manner. It will be feedback controlled. Parameters will be set, the machine turned on and feedback controlled to the set level. The observed results should be well correlated from pulse to pulse and be in good agreement with the preset values.
Table 7-23 provides a listing of the presently planned control diagnostics for FED and represent the baseline design for control instru-mentation. The table gives the information needed, the diagnostic instrument, the action, the instrument description, and shows the minimum set of instruments required to collect the information. The design of FED will require a reliable and available control system. Therefore, all of the proposed baseline control instruments will be replicated in some sense. For instance, two sets of B loops will be constructed with the second set being available upon failure of the first set. However, in the <n > measurement, a multichannel interferometer is planned for purposes other than control with one channel being used for control. In the event of failure of that channel another channel of the multichannel instrument will be used for control. No machine to date has exercised feedback control using a combination of the magnetic system, the fueling system, and the auxiliary heating system simultaneously. Plasma position control and density control have been done and this report contains an analysis of some plasma position control requirements. FED will be designed to simultaneously control the magnetics, fueling and heating system.
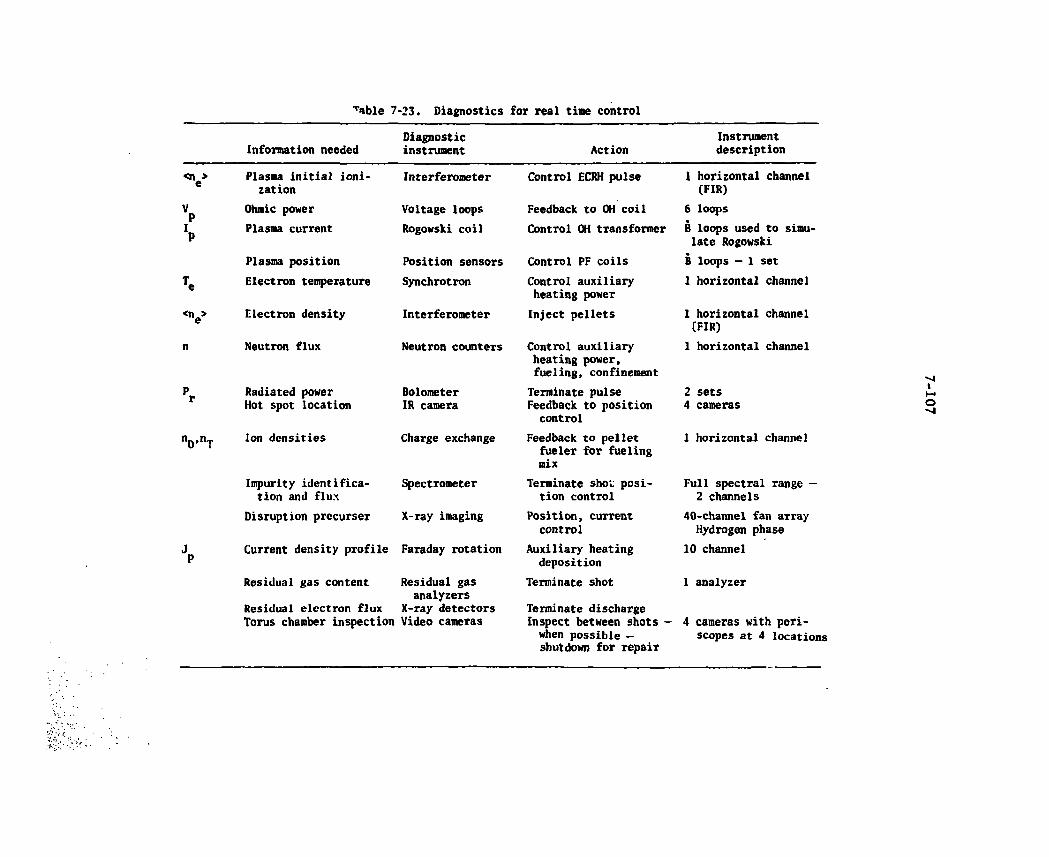
Tible 7-23. Diagnostics for real tine control
Information needed Diagnostic instrument Action
Instrument description
• v
< v
nD'nT
Plasma initial ioni-zation
Ohmic power Plasma current
Plasma position Electron temperature
Electron density
Neutron flux
Radiated power Hot spot location
Ion densities
Impurity identifica-tion and flux
Disruption precurser
Interferometer
Voltage loops Rogowski coil
Position sensors Synchrotron
Interferometer
Neutron counters
Bolometer IR camera
Charge exchange
Spectrometer
X-ray imaging
Current density profile Faraday rotation
Residual gas content Residual gas analyzers
Residual electron flux X-ray detectors TOTUS chamber inspection Video cameras
Control ECRH pulse
Feedback to OH coil Control OH transformer
Control PF coils Control auxiliary heating power Inject pellets
Control auxiliary heating power, fueling, confinement Terminate pulse Feedback to position control
Feedback to pellet fueler for fueling mix
Terminate shot: posi-tion control
Position, current control
Auxiliary heating deposition
Terminate shot Terminate discharge Inspect between shots -when possible — shutdown for repair
1 horizontal channel (FIR)
6 loops B loops used to simu-late Rogowski B loops — 1 set 1 horizontal channel
1 horizontal channel (FIR) 1 horizontal channel
2 sets 4 cameras
1 horizontal channel
Full spectral range -2 channels
40-channel fan array Hydrogen phase
10 channel
1 analyzer
4 cameras with peri-scopes at 4 locations

7-108
7.4.6 Diagnostics for Performance Verification and Optimization
The major fraction of diagnostics is presently used by physicists to measure their progress in understanding and improving the plasma performance as they vary input parameters. The same diagnostics give information for understanding unexpected deficiencies in performance. Thus, capability is required for these diagnostics for all phases of operation of the tokamak in addition to those operating within the control system. Table 7-24 lists the diagnostics for analyzing and optimizing performance. Over the next few years this list will change as progress is made on other fusion devices. Some of the diagnostics listed are still somewhat speculative and may be eliminated at a later date. New diagnostic instruments are on the drawing board and will be proven before needed for FED. Some of the instruments listed have detectors that will not presently function well in the FED environment. The Department of Energy has contracted for a study to identify the critical components in the instruments applicable to FED and have a plan to develop solutions to the identified problem areas.
Some attempt has been made at assessing the number of information channels needed and the level of duplication of measurement of the same parameter. These are provided in Table 7-24. No relative priority has been set for the instruments; this will be done at a later date. Each diagnostic is listed under its principal use, but often information on other parameters is obtained and is so indicated. Most of the instruments in Table 7-24 will be required for the hydrogen, D-D and D-T phases of operations. Some, such as the x-ray measurements and some spectroscopy measurements will be difficult in D-T because of the detector sensitivity to background radiation. There is need for development of diagnostics that will function in D-T environments.
Many diagnostics are in development have not been included in this list. Their need is dependent on a much more critical evaluation of the FED program and on the indications of the most significant data requirements from TFTR experiments. There is, necessarily, a very wide dynamic range of densities and temperatures which affects the usefulness of different measurement techniques. For example, an argument can be
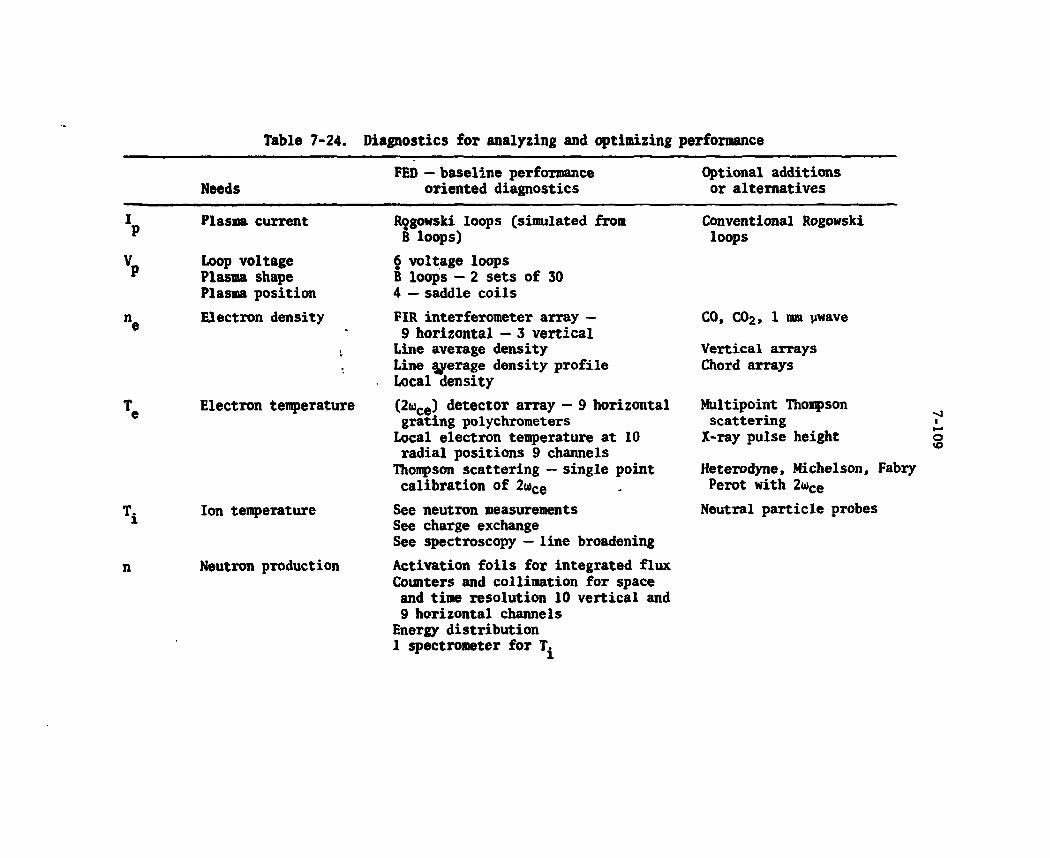
Table 7-24. Diagnostics for analyzing and optimizing performance
Needs FED — baseline performance
oriented diagnostics Optional additions
or alternatives
n
T i
n
Plasma current
Loop voltage Plasma shape Plasma position
Electron density
Electron temperature
Ion temperature
Neutron production
Rogowski loops (simulated from B loops)
6 voltage loops B loops - 2 sets of 30 4 — saddle coils
FIR interferometer array — 9 horizontal — 3 vert ical
Line average density Line ^yerage density prof i le Local density
(2u>ce) detector array — 9 horizontal grating polychrometers
Local electron temperature at 10 radial positions 9 channels
Thompson scattering — single point calibration of 2wce
See neutron measurements See charge exchange See spectroscopy — l ine broadening Activation fo i l s for integrated f lux Counters and collimation for space and time resolution 10 vert ical and 9 horizontal channels
Energy distribution 1 spectrometer for T^
Conventional Rogowski loops
CO, CO2, 1 mm ywave
Vert ical arrays Chord arrays
Multipoint Thompson scattering
X-ray pulse height
Heterodyne, Michelson, Fabry Perot with 2wce
Neutral part ic le probes

Table 7 -24 . Continued
Needs FED — basel ine performance or iented diagnostics
Optional addi t ions or a l t e r n a t i v e s
Impuri ty content
Radiated power
0
V n T
Plasaa Magnetic pressure r a t i o
Deuteriua and t r i t i u a density and energy
Runaway electrons
Nave a c t i v i t y
SpectxoMters f o r i a p u r i t y i d e n t i -f i c a t i o n and impuri ty l eve ls -S f u l l spectrua hor i zon ta l channels a t 2 locat ions
- Space and t i n e resolved measure-aents over a wide spectra l range
— T j f r o * Doppler broadening
Bolometers — 2 20 channel arrays measure p a r t i c l e plus rad ia ted power l eve ls — space resolved, time resolved
4 - IR cameras
2 - diaaagnetic loops t o t a l energy content o f plasma
Charge exchange wi th hor izonta l seed beaa — 5 v e r t i c a l , S hor i zonta l ( t angent ia l )
Hard x - ray detector
B loops (see plasaa shape) MID a c t i v i t y Soft x - ray ar ray — 2 arrays o f 40
detectors — 1 h o r i z o n t a l , 1 v e r t i c a l Location and shape o f surfaces MID node st ructure
, , v isable Breasstrahlung In 3 or 4 channels
1 ma pwave sca t te r ing
Table 7-24. Continued
Needs FED — baseline performance oriented diagnostics
Optional additions or alternatives
Plasma boundary and wall
Probes and exposure of sample surfaces at 2 locations Infrared camera — see radiated power
Background gas Residual gas analyzer
JP Current density distribution
Charged product Measurement
Faraday rotation — FIR
3 detectors — near vertical array — for D — H| Y-spectrometer — 1 channel outside torus
Beam probe
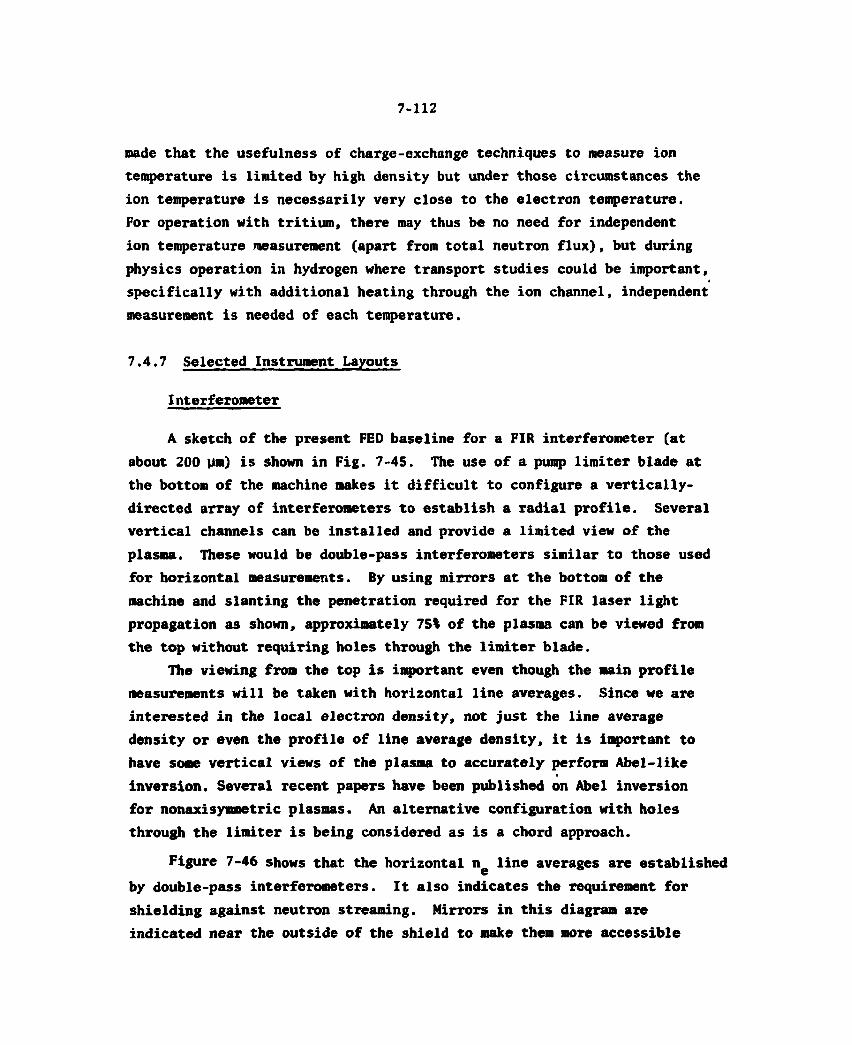
7 - 1 1 2
made that the usefulness of charge-exchange techniques to measure ion temperature is limited by high density but under those circumstances the ion temperature is necessarily very close to the electron temperature. For operation with tritium, there may thus be no need for independent ion temperature measurement (apart from total neutron flux), but during physics operation in hydrogen where transport studies could be important, specifically with additional heating through the ion channel, independent measurement is needed of each temperature.
7.4.7 Selected Instrument Layouts
Interferometer
A sketch of the present FED baseline for a FIR interferometer (at about 200 pm) is shown in Fig. 7-45. The use of a pump limiter blade at the bottom of the machine makes it difficult to configure a vertically-directed array of interferometers to establish a radial profile. Several vertical channels can be installed and provide a limited view of the plasma. These would be double-pass interferometers similar to those used for horizontal measurements. By using mirrors at the bottom of the machine and slanting the penetration required for the FIR laser light propagation as shown, approximately 75% of the plasma can be viewed from the top without requiring holes through the limiter blade.
The viewing from the top is important even though the main profile measurements will be taken with horizontal line averages. Since we are interested in the local electron density, not just the line average density or even the profile of line average density, it is important to have some vertical views of the plasma to accurately perform Abel-like inversion. Several recent papers have been published on Abel inversion for nonaxisymmetric plasmas. An alternative configuration with holes through the limiter is being considered as is a chord approach.
Figure 7-46 shows that the horizontal n e line averages are established by double-pass interferometers. It also indicates the requirement for shielding against neutron streaming. Mirrors in this diagram are indicated near the outside of the shield to make them more accessible
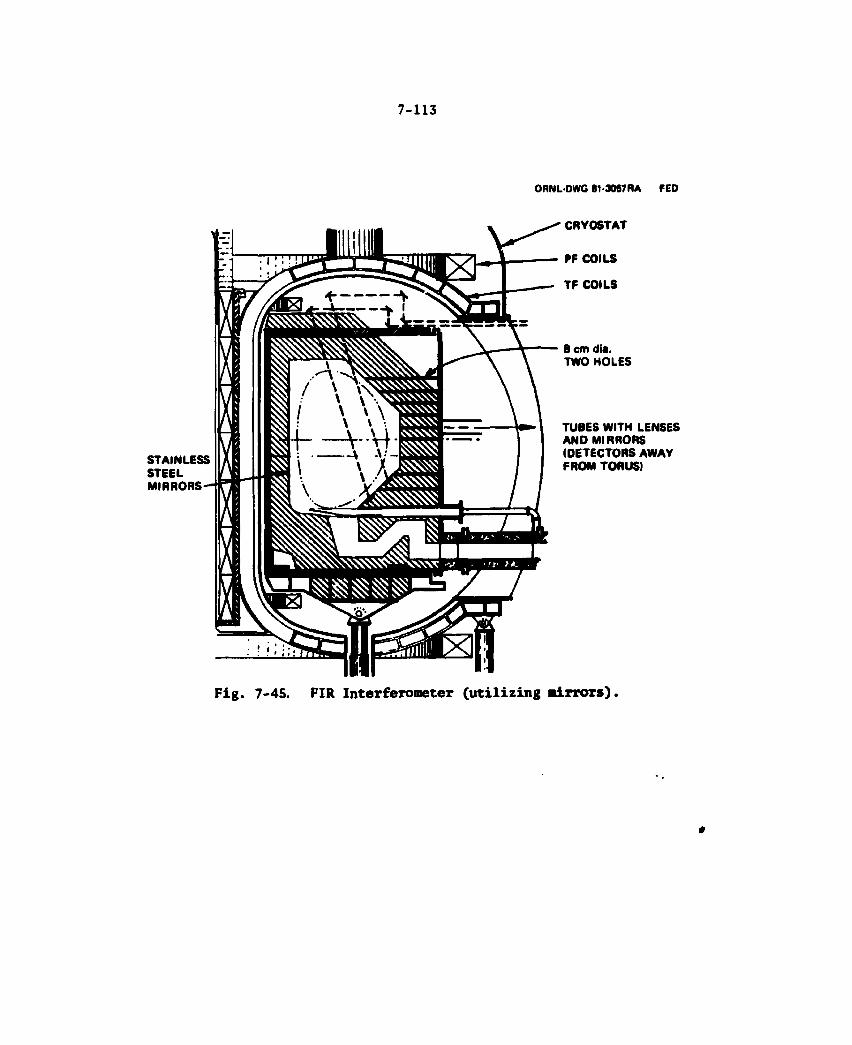
7 - 1 1 3
ORNL OWG 81-3067RA FED
STAINLESS STEEL MIRRORS
CRYOSTAT
8 cm dia. TWO HOLES
TUBES WITH LENSES AND MIRRORS (DETECTORS AWAY FROM TORUS)
Fig. 7-45. FIR Interferometer (utilizing mirrors).
#
7 - 1 1 4
ORNL-DWG 81-3426 FED
Fig. 7 -46. Horizontal — double path interferometer.
7 - 1 1 5
for replacement or alignment. For early machine phases when neutron streaming is not a problem, four mirrors and the shielding could be removed. A vacuum boundary must also be established within the tubes. This would be done at the outside of the main shield with a lens and gasket system.
As can be seen by the layout, several difficulties exist and will need to be resolved before interferometry can be installed on FED in the D-T phase. The three main difficulties are associated with mirrors, shielding, and vibration associated with the long optical paths. The mirrors must survive the plasma environment or be capable of being replaced by remote means. Provision for remote maintenance manipulators with access to the inside of the torus are included in the FED baseline description. It is expected that routine access to internal torus components will be available about twice a year. If mirrors and other components can be made to last as long as other torus components, then they can be replaced at these intervals. The mirrors can be relatively simple screw-in plates that are prealigned. The alignment can be checked when the mirrors are being replaced. It may be possible to use the torus armor plated wall itself as a mirror. The inner wall is to be graphite, which for FIR frequencies, has a reflection coefficient of about 90%. Surface erosion of the plate could be tolerated if the result-ing surface roughness does not represent a tilt and cause the beam to be misaligned.
Neutron measurement
A good set of neutron plasma diagnostic instruments is required since a fundamental purpose of FED, and the machines to follow, is to produce fusion neutrons. The three techniques to be used are foil activation, neutron profile (collimation) and spectrometry. A hole configuration for neutron profile measurements is shown in Fig. 7-47. The holes are about 3.6 cm diameter or 10 cm2 area. Both horizontal and vertical profiles can be obtained and are recommended. Local neutron production rates can be determined through Abel inversion. If the deuterium and tritium densities can be measured then local ion tempera-tures can be calculated.
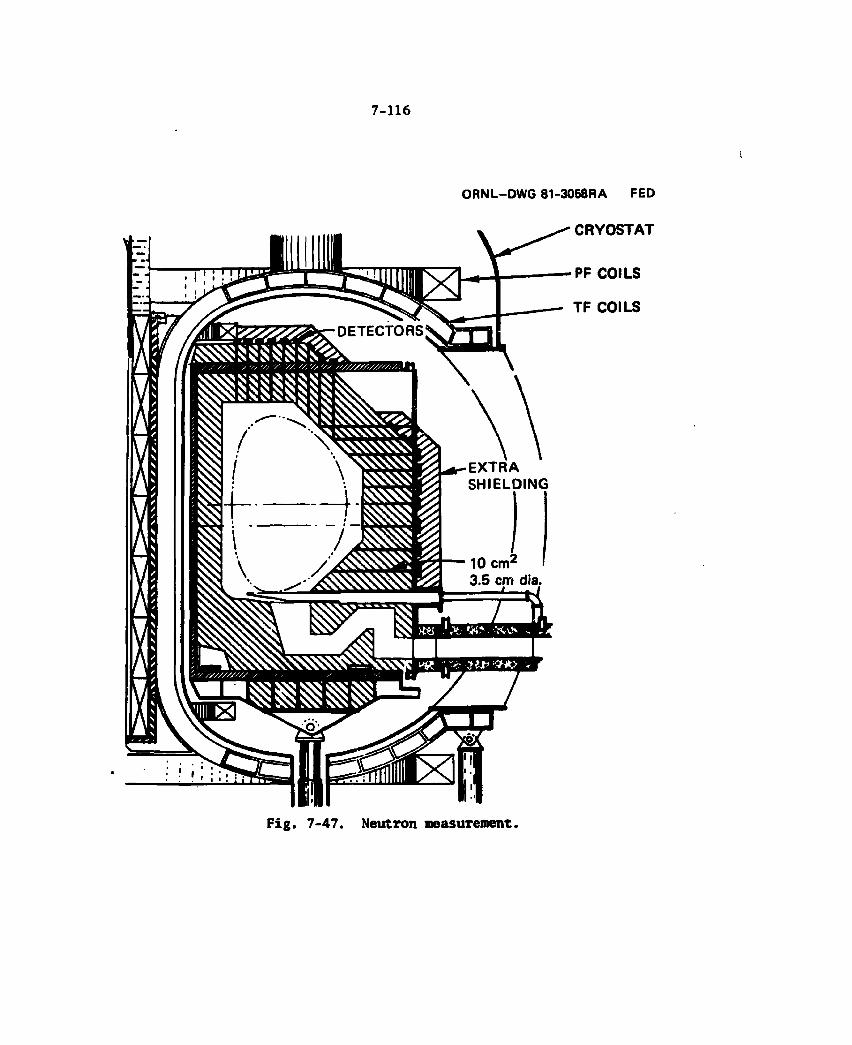
7 - 1 1 6
O R N L - D W G 8 1 - 3 0 5 8 R A FED
-DETECTORS'
X V, % v> •// /'/////A////////.
EXTRA SHIELDING
CRYOSTAT
PF COILS
TF COILS
Fig. 7-47. Neutron measurement.

7 - 1 1 7
The fact that the vertical collimations include a view of the limiter blade does not represent a serious problem for the neutron yield counters. The temperature in this area is very low compared to the central or main plasma temperature. Neutron production is roughly 4 proportional to T., for the colder edge plasma.
In FED the greatest interest will be in the virgin neutrons at 14 and 2.4 NeV. For this reason the holes used for neutron viewing can actually be sealed at both ends. A plate at each end of the hole with a thickness of 0.5 cm would still allow 70% of the neutrons to pass through without reaction with the plate. Approximately 30% of the neutrons would be influenced and have altered energy and spectrum distribution. Of course the seals can be made thinner for the small holes planned with a resultant decrease in intercepted neutrons. In FED the neutron flux is 5 * lo10 n/cm2-s for D-D, (2.45 MeV neutrons) and 4 * 1013 n/cm2-s for D-T (14.1 MeV neutrons), providing a high count level even for a hole size as small as 3 cm.
While the shielding represents a serious consideration for most of the diagnostic packages, in the case of the neutron diagnostic the shield-ing is an asset. The shield is used as a multiple collimator. It is close to the plasma, it shields adjacent collimation tubes from one another, and it will be designed to thermalize and absorb scattered neutrons.
The activation foils can also be placed at the ends of the colli-mators and may be used extensively during the early phases of D-D and D-T operation. After the neutron profile yield counters are well cali-brated, foil use will decrease in importance. However, some will remain for safety and for calibration purposes.
Neutron spectroscopy will also be used as it is developed and again the profile holes can be used to provide the virgin neutrons needed. The horizontal holes would be best for this purpose if the neutron spectrometer is to be similar to the one - oposed for TFTR or JET.
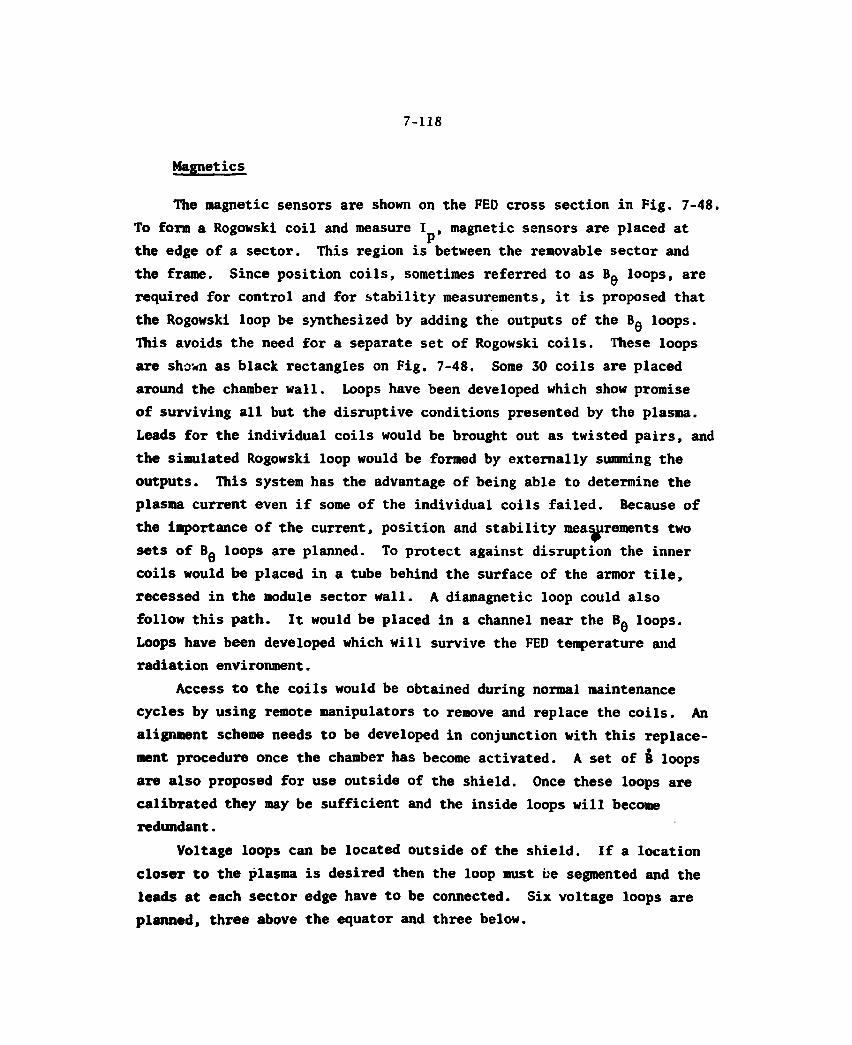
7-118
Magnetics
The magnetic sensors are shown on the FED cross section in Fig. 7-48. To form a Rogowski coil and measure 1^, magnetic sensors are placed at the edge of a sector. This region is between the removable sector and the frame. Since position coils, sometimes referred to as Bp loops, are required for control and for stability measurements, it is proposed that the Rogowski loop be synthesized by adding the outputs of the Bg loops. This avoids the need for a separate set of Rogowski coils. These loops are sho'«n as black rectangles on Fig. 7-48. Some 30 coils are placed around the chamber wall. Loops have been developed which show promise of surviving all but the disruptive conditions presented by the plasma. Leads for the individual coils would be brought out as twisted pairs, and the simulated Rogowski loop would be formed by externally summing the outputs. This system has the advantage of being able to determine the plasma current even if some of the individual coils failed. Because of the importance of the current, position and stability measurements two sets of Bg loops are planned. To protect against disruption the inner coils would be placed in a tube behind the surface of the armor tile, recessed in the module sector wall. A diamagnetic loop could also follow this path. It would be placed in a channel near the Bg loops. Loops have been developed which will survive the FED temperature and radiation environment.
Access to the coils would be obtained during normal maintenance cycles by using remote manipulators to remove and replace the coils. An alignment scheme needs to be developed in conjunction with this replace-ment procedure once the chamber has become activated. A set of B loops are also proposed for use outside of the shield. Once these loops are calibrated they may be sufficient and the inside loops will become redundant.
Voltage loops can be located outside of the shield. If a location closer to the plasma is desired then the loop must be segmented and the leads at each sector edge have to be connected. Six voltage loops are planned, three above the equator and three below.
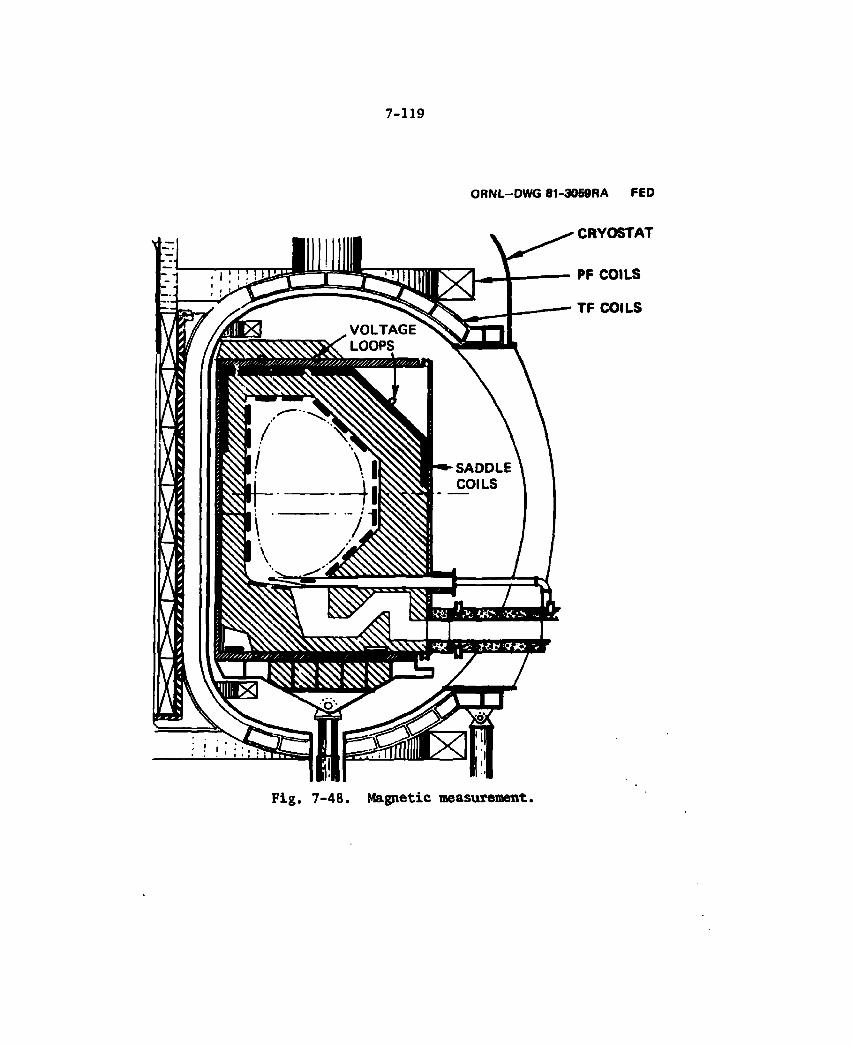
7 - 1 1 9
ORNL—DWG 81-3059RA FED
CRYOSTAT
Fig. 7-48. Magnetic measurement.
7-120
Synchrotron measurements
The use of plasma synchrotron radiation has been chosen as the prime diagnostic for measurement of T as a function of time and space on FED. Nine views of the plasma on horizontal paths will be provided.
A separate torus penetration layout for this instrument has not been provided because it would be similar to that used for the horizontal channels in the interferometer (Fig. 7-45). The FED baseline design includes plans for the various diagnostic views of the plasma to be highly spatially correlated. That is the horizontal access holes for <N >, T and neutrons will have the^same Z coordinates. The spectro-
6 G
scopic views, although fewer in number, will also be located in this manner. The Thompson scattering r, Z coordinates will correspond with the appropriate synchrotron r, Z coordinates. The holes in the shield for the diagnostics are about 7.5 cm in diameter and will use mirrors for focussing. Right angle bends will be used to reduce neutron stream-ing. The detectors can be placed at a long distance from the torus, outside the TF coils, and away from large magnetic fields and away from shield radiation. The 2u>ce x-mode measurement (in the vicinity of 260 GHz for the 10-T design) will be used for the FED baseline design. At 260 GHz and below, carbon deposits on mirrors will have a negligible effect on the reflective properties. About 5% loss will occur at the mirror surface. On the other hand, lenses or mirrors for this diagnostic will have to be remote enough from the plasma to avoid carbon deposits. This can be accommodated and thus represents no special problem. The detector used will be of the grating polychrometer variety and will provide continuous T measurements at 10 locations along the radius of
©
the machine. While present polychrometers utilize liquid helium cooled detectors, it is expected that Bismuth bolometer detectors might be available when FED is implemented and would represent a significant reduction in cost. The nominal operating average density <n > for FED <i 3 ® v is 1.3 x lO'Vcm for the 10-T design. Cutoff frequency for 2u x-mode
14 3 c e is 4 * 10 /cm so that this diagnostic provides significant range for measurement of n . The plasma will remain optically thick down t o n ^
11 e 10 and T ~ 500 eV and below. Thus, T can be reported for all but
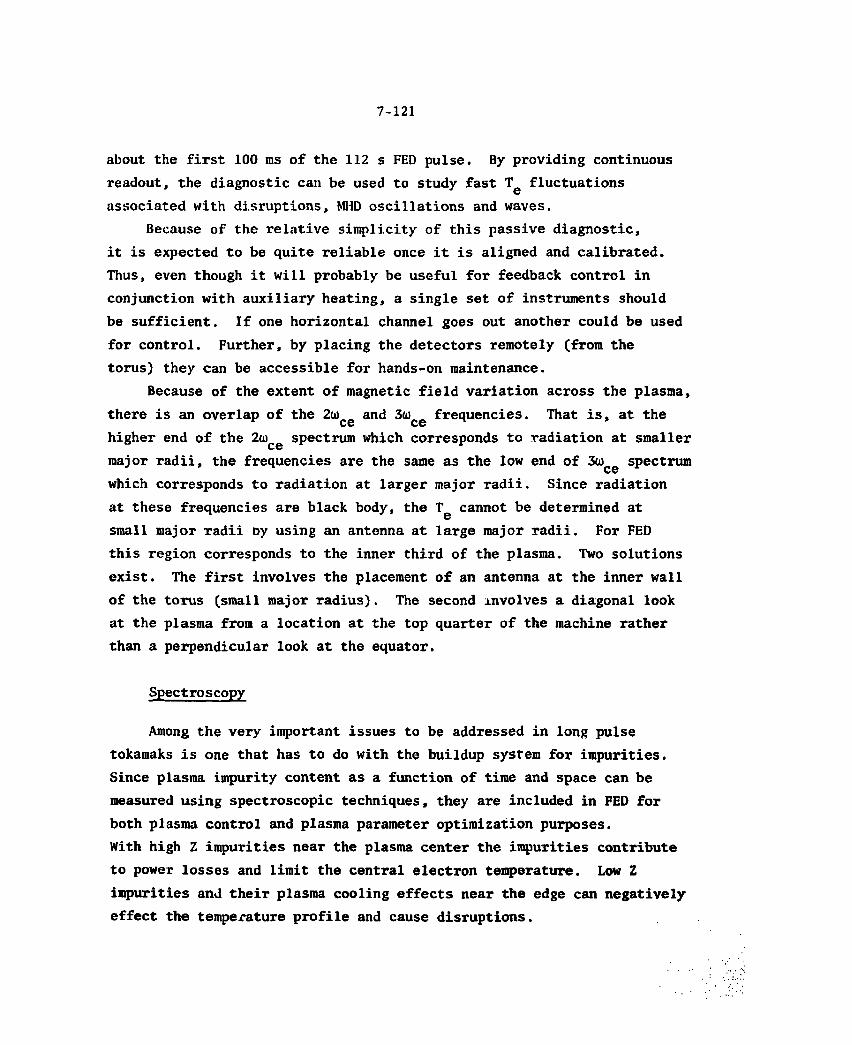
7-121
about the first 100 ms of the 112 s FED pulse. By providing continuous readout, the diagnostic can be used to study fast T fluctuations associated with disruptions, MUD oscillations and waves.
Because of the relative simplicity of this passive diagnostic, it is expected to be quite reliable once it is aligned and calibrated. Thus, even though it will probably be useful for feedback control in conjunction with auxiliary heating, a single set of instruments should be sufficient. If one horizontal channel goes out another could be used for control. Further, by placing the detectors remotely (from the torus) they can be accessible for hands-on maintenance.
Because of the extent of magnetic field variation across the plasma, there is an overlap of the 2a) and 3a) frequencies. That is, at the c© c© higher end of the 2tiJce spectrum which corresponds to radiation at smaller major radii, the frequencies are the same as the low end of 3<*) spectrum C©
which corresponds to radiation at larger major radii. Since radiation at these frequencies are black body, the Tg cannot be determined at small major radii oy using an antenna at large major radii. For FED this region corresponds to the inner third of the plasma. Two solutions exist. The first involves the placement of an antenna at the inner wall of the torus (small major radius). The second involves a diagonal look at the plasma from a location at the top quarter of the machine rather than a perpendicular look at the equator.
Among the very important issues to be addressed in long pulse tokamaks is one that has to do with the buildup system for impurities. Since plasma impurity content as a function of time and space can be measured using spectroscopic techniques, they are included in FED for both plasma control and plasma parameter optimization purposes. With high Z impurities near the plasma center the impurities contribute to power losses and limit the central electron temperature. Low Z impurities and their plasma cooling effects near the edge can negatively effect the temperature profile and cause disruptions.

7 - 1 2 2
For hot FED plasmas, impurity lines will be emitted mainly in the vacuum ultraviolet and soft x-ray regions of the specturm. Therefore, direct path views of the plasma will be provided. With the use of a limiter for edge control there will be carbon at the edge because of the plasma interaction with the graphite coated limiter. Views of the plasma will be provided for the longer wavelengths also. As shown in Fig. 7-49 and Fig. 7-50, the baseline FED design utilizes three views
© © of the plasma for the spectroscopic instruments from 10 A to 10,000 A.
o o
In the range of 10 A to 2000 A, no windows can be used and over most of the range grazing incidence mirrors must be used. For the longer wavelengths, normal incidence mirrors and lenses can be used. For the FED baseline, two sets of three torus penetrations are planned for o o spectroscopy in the 10 A to 1100 A range and two sets of three torus • e penetrations are planned for the 1100 A to 10,000 A range. The pene-trations have been planned to provide a view at the plasma equator, a view grazing the limiter blade and an edge view near the top of the plasma. These positions will also be viewed with interferometers for <n >, 2ur_ for T(r) and columated neutron yield, e ue e
Because of the need to have good shielding in the D-T phase, the spectroscopy has been limited to columnated views of the plasma. No spatial scans have been provided. During the hydrogen phase, these could be provided by fan shaped holes in the torus wall. During the D-T phase, the x-ray and VUV mirrors and detectors will be exposed to tritiua since no windows can be used. For the longer wavelength instruments any windows or mirrors must be protected from carbon deposits since the limiter blade and about half of the torus wall is covered with graphite and since carbon is a good absorber at these frequencies. The torus penetrations are small, being about 1 cm for the short wavelengths and 1-2 cm for the long wavelengths so the mirrors would not have to be recessed from the plasma.
No views of the plasma in the vertical direction are planned for the baseline system but they could be accommodated. Long wavelength spectroscopy would have the fewest problems. For the short wavelengths, the dewar or cryostat would have to be penetrated and the detector would
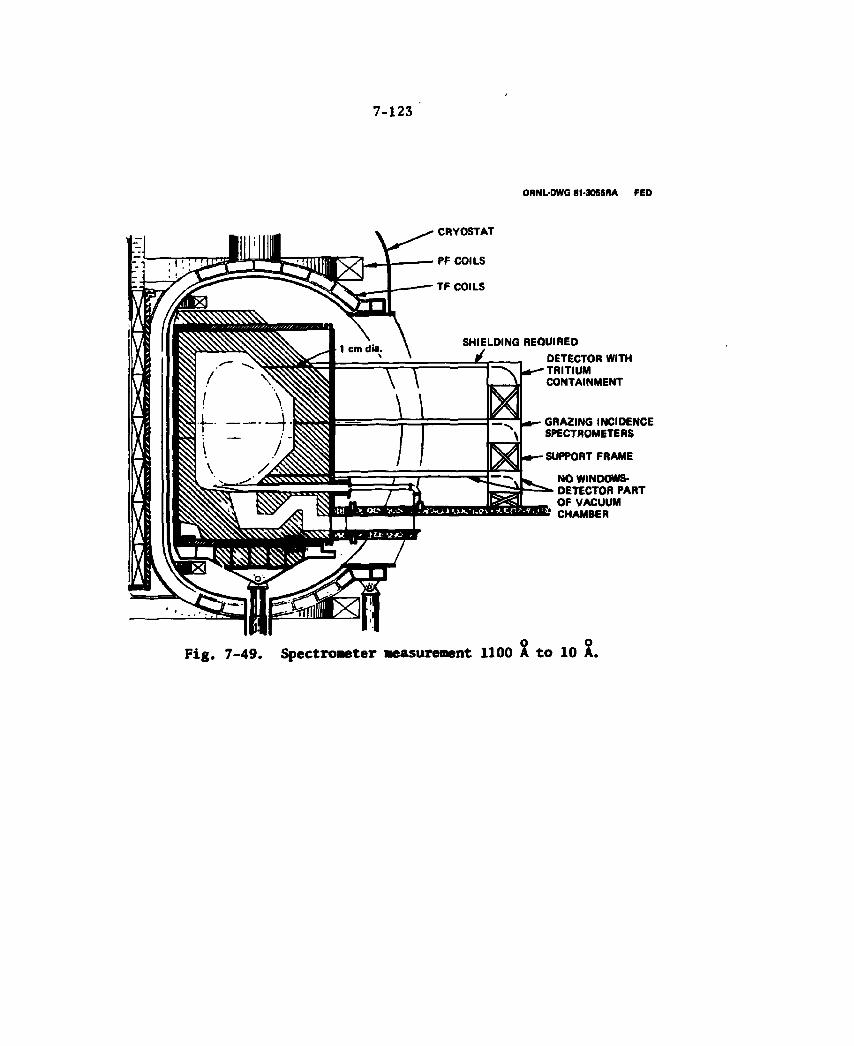
7 - 1 2 3
ORNL-OWG 81-3056RA FED
SHIELDING REQUIRED DETECTOR WITH TRITIUM CONTAINMENT
GRAZING INCIDENCE SPECTROMETERS
SUPPORT FRAME
NO WINDOWS-DETECTOR PART OF VACUUM CHAMBER
O O Fig. 7-49. Spectrometer measurement 1100 A to 10 A.
7 - 1 2 4
ORNL-0WG H-aOSWIA FED
WINDOWS FOR TRITIUM CONFINEMENT
.DETECTORS REMOTE FROM HIGH MAGNETIC FIELD
- TWO DETECTORS FOR SPECTRAL RANGE
7 - 5 0 . o o
Spectrometer measurement 10,000 A to 1100 A.
7 - 1 2 5
have to be Mounted several meters above the upper cryostat cover to be in a reasonable magnetic field.
7.4.8 Options to the Baseline
A myriad of options are possible as substitutes for the various instriaents chosen for real time control and for performance verification and optimization. In the area of electron density alone, the measurements could be made using microwaves, CO laser, C02 laser, or the baseline FIR laser. Techniques using particle beams, Thompson scattering and passive approaches such as Bremsstrahlung radiation in the green wavelengths could be applied. The measurements could be made using horizontal, vertical, chord or fan shaped array scans.
Each of the options has its own set of virtues and difficulties. FIR was chosen for the baseline. This selection was made on the basis of factors such as number of phase fringes in the measurement for the densities and chamber size used for FEO. Additional factors include refraction of the probing beam, vibration effects and ability to function in the environment. Component availability was also a factor in the selection. Mirrors, windows and sources should be available in the FIR region when FED is implemented.
For the baseline, an emphasis was placed on horizontal measurements to avoid penetrating the limiter blades. However, this approach requires mirrors inside the torus. Further consideration is being given to measurements using chords and vertical views through the plasma.
Many of the other instruments chosen for the baseline have similar alternatives and rationale for selection. Over the next few years the baseline list will change as in^/rmation is obtained from the fusion program experience. New instruments are on the drawing board and if they are proven in time they will become candidates for the FED. For the instruments to be legitimate candidates, emphasis needs to be placed on remote maintenance, calibration, availability, tritium containment. Instruments that are new or represent better ways to extract plasma parameters but do not function in a DT environment cannot be seriously considered for FED.

7 - 1 2 6
7.4.9 Future Work - Diagnostics s
Future tasks in the diagnostic area are associated both with depth and breadth of the work to date. A continuing evaluation of new and proposed diagnostics is required to assure that FED will be implemented in the most cost effective manner. These new diagnostic candidates need to be compared with the baseline diagnostics and added if they have more overall promise. FED should be built using only the diagnostics necessary to satisfy the mission of FED. This requires a continual prioritization of candidate diagnostics.
Much additional effort is required to generate physical layouts of individual diagnostics and to obtain an integrated layout for the overall diagnostic set. These layouts need to include candidate solutions to the problems brought about by D-T operation. While some community effort is now addressing various aspects of the design of the diagnostic instruments to survive the radiation environment, no known effort exists in the area of remote control, maintenance or calibration of diagnostic instruments.
Finally, the instruments used for plasma wall interaction measure-ments, subsystem control and general facility control need definition and description.
7.4.10 Information and Control System — Introduction
FED is a complex facility from an information and control point of view. The information system will provide physicists with the data acquisition and processing capability (1) for controlling and monitoring some thirty different diagnostics (to verify their performance), (2) for handling the output of an estimated 5000 transient digitizer channels, and (3) for interfacing with a large transient digitizer memory and some 70 microprocessors. The information and control system (INFACS) will also monitor and control some 20 facility subsystems related to major device systems such as the magnet, torus, electrical safety, remote maintenance control, display and archival systems. It is expected that for the facility subsystems, INFACS will interface with 3000 control

7 - 1 2 7
points and monitor 10,000 gauges, valves, temperature and pressures, positions and views. The system will have to accept inputs from 150 transient digitizers and interface with about 80 microprocessors. Three control rooms associated with the INFACS will be used. One for computer control, one for overall FED facility control, and one for diagnostics.
In the following sections, the function requirements of the INFACS are indicated (Sect. 7.4.11) and a first level baseline design description is presented (Sect. 7.4.12). A brief discussion of future work is included in the last section (7.4.13).
7.4.11 INFACS Requirements
INFACS is required to provide the hardware and software to perform all programmable processes for FED. These include control, monitoring, data acquisition and processing, analysis, display and archiving. The system will also provide performance monitoring of the FED hardware, aid configuration and test planning, and provide remote handling control and display. INFACS is required to provide a control center, local and remote controls, timing and communications. A safety system with hard-wired interlocks is also required.
Because FED is expected to be a national facility, it will be required to provide from storage, or on a buffered real time basis, the raw data relating to the machine operating parameters and the data collected from the operating diagnostic instruments. Laboratories, remote from the facility, could process this data and influence the future operating parameters as well as the facility operators.
The availability of the INFACS system is required to be high because of its relationship to all other FED systems. A 98% availability is specified.
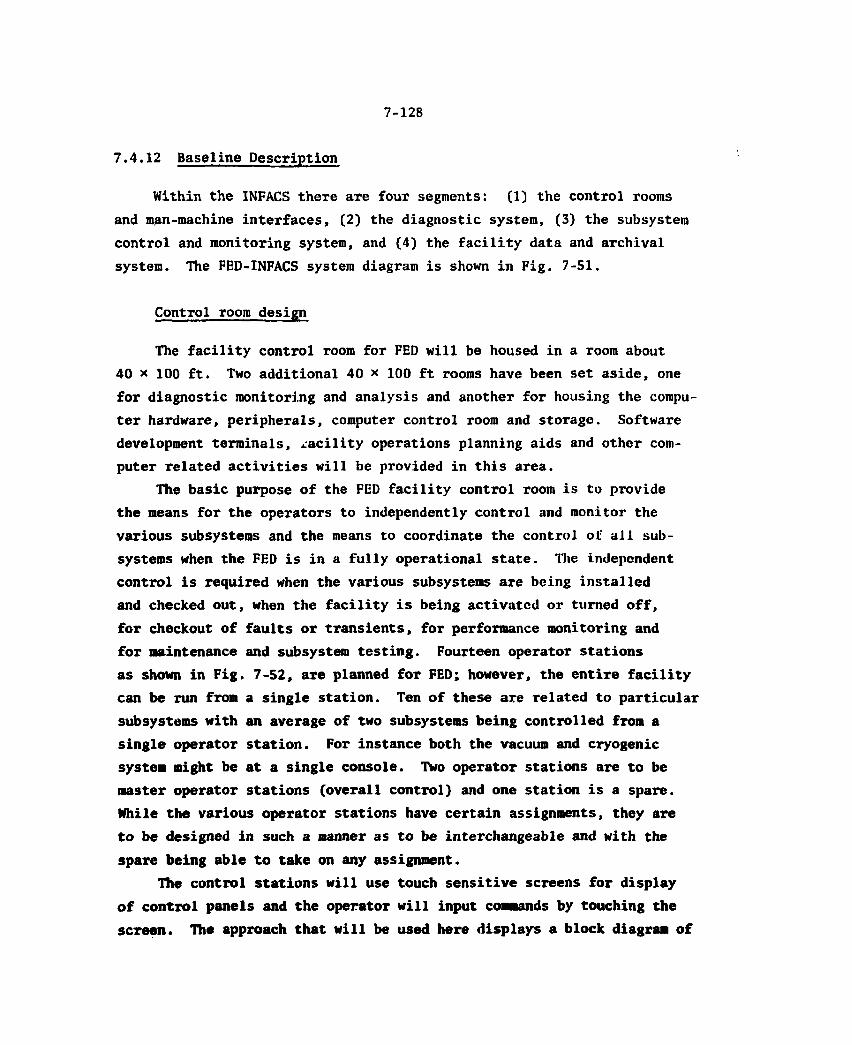
7-128
7.4.12 Baseline Description
Within the INFACS there are four segments: (1) the control rooms and man-machine interfaces, (2) the diagnostic system, (3) the subsystem control and monitoring system, and (4) the facility data and archival system. The FED-INFACS system diagram is shown in Fig. 7-51.
Control room design
The facility control room for FED will be housed in a room about 40 * 100 ft. Two additional 40 x 100 ft rooms have been set aside, one for diagnostic monitoring and analysis and another for housing the compu-ter hardware, peripherals, computer control room and storage. Software development terminals, facility operations planning aids and other com-puter related activities will be provided in this area.
The basic purpose of the FED facility control room is to provide the means for the operators to independently control and monitor the various subsystems and the means to coordinate the control oi: all sub-systems when the FED is in a fully operational state. The independent control is required when the various subsystems are being installed and checked out, when the facility is being activated or turned off, for checkout of faults or transients, for performance monitoring and for maintenance and subsystem testing. Fourteen operator stations as shown in Fig. 7-52, are planned for FED; however, the entire facility can be run from a single station. Ten of these are related to particular subsystems with an average of two subsystems being controlled from a single operator station. For instance both the vacuum and cryogenic system might be at a single console. Two operator stations are to be master operator stations (overall control) and one station is a spare. While the various operator stations have certain assignments, they are to be designed in such a manner as to be interchangeable and with the spare being able to take on any assignment.
The control stations will use touch sensitive screens for display of control panels and the operator will input commands by touching the screen. The approach that will be used here displays a block diagram of
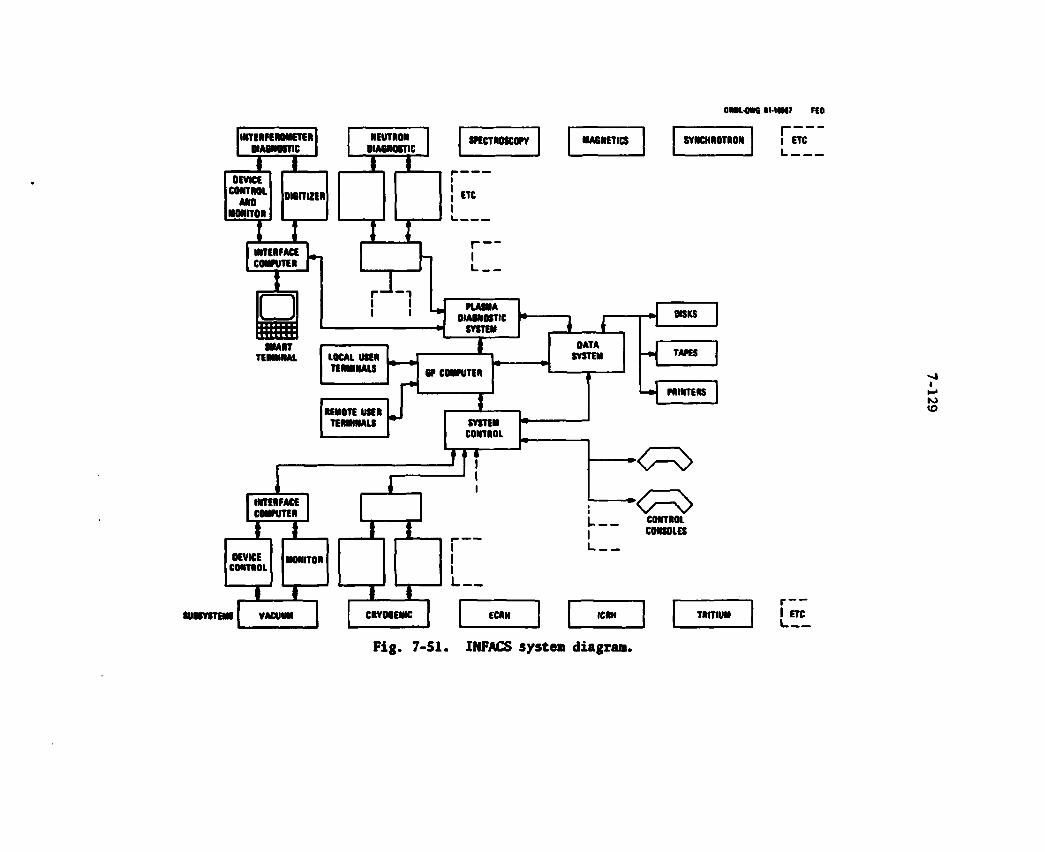
OML-OWG IMMI7 INTERFEROMETER
DJAMMTIC
m = OEVKE
CONTROL oieniziR
NEUTRON DIAMOITjC
X I
SPECTROSCOPY
ETC
INTERFACE COUNTER
I • WWtTT TTTTTTT
I I
I I I
DIA8N0STIC SYSTEM
MART TERMINAL LOCAL USER
TERMINALS
REMOTE USER TERMINALS
f
BP COMPUTER
SYSTEM CONTROL
INTERFACE COMPUTER
OEVWE
SUBSYSTEMS
MONITOR
T i
VACUUM CRYOGENIC
MAGNETICS SYNCHROTRON
DATA SYSTEM
OISKS
TAPES
PRINTERS
I I
CONTROL CONSOLES
ECRN ICRN TRITIUM
Fig. 7-51. INFACS system diagram.
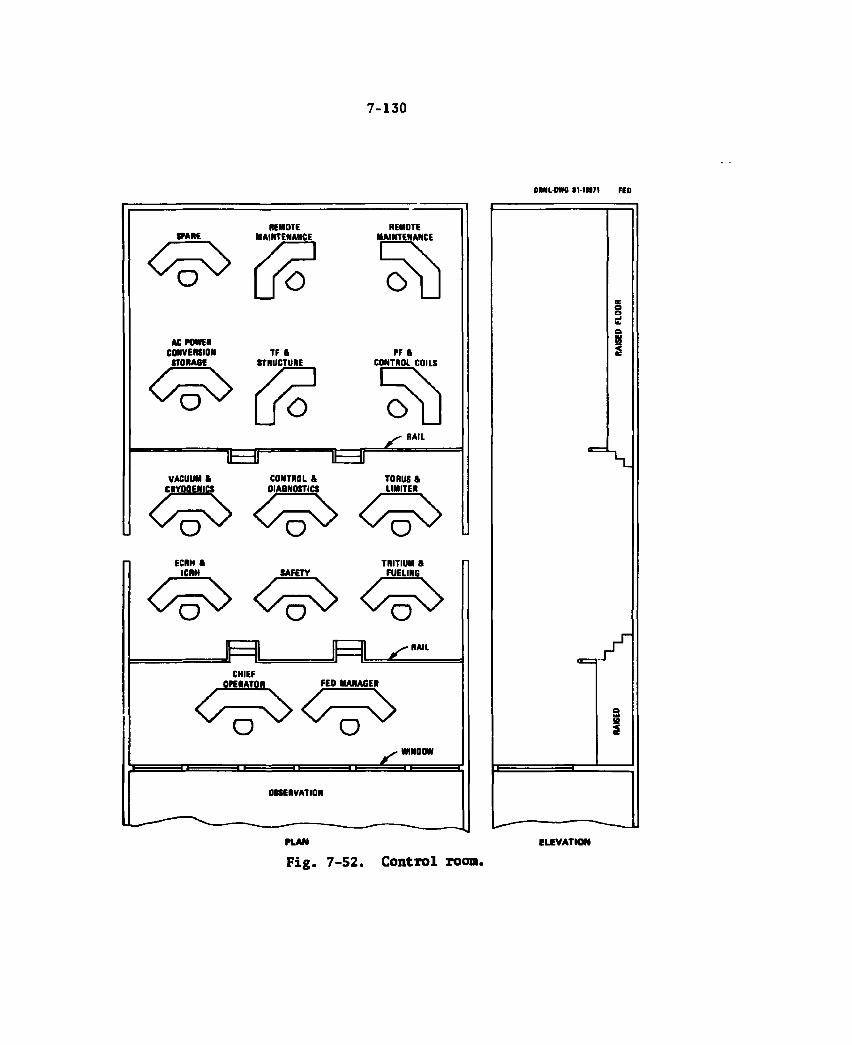
7 - 1 3 0
REMOTE REMOTE W E MAINTENANCE MAINTENANCE
AC POWER CONVERSION TF » PF & STORAGE STRUCTURE CONTROL CPUS
y RAIL
o
e i H T VACUUM a CONTROL & TORUS &
CRYOGENICS DIAGNOSTICS LIMITER
Q V V Q V V Q
ECRH « TRITIUM S ICRH SAFETY FUELING
< / ^ v >
B B ^ RAIL
CHIEF OPERATOR FED MANAGER
jC
o v v o WINDOW
OBSERVATION
PLAN
F ig . 7 -52 . Control room.
OMLOWG IMM7I FEO
ELEVATION
7 - 1 3 1
a subsystem in which the control points are activated by touching. A typical control display is shown in Fig. 7-52 for the FED vacuum system. This control display is a typical overview display. For this case, eleven pumping systems are represented. One overall scroll pump and one turbomolecular pump system for each of the ten vacuum ducts out of the torus vessel. By touching one of the pumping systems, a more detailed view of that pumping system is called up for display. Figure 7-53 shows such a display which includes valves, gauges and pumps. The operator can access a gauge reading, a temperature measurement, a valve or a pump by touching the screen representation of that component. Touching a meter or some other sensor would cause the display to show the reading on the gauge or sensor. This is shown in Fig. 7-54 where the symbol for
_3 the gauge is double circled and a reading of 0.3 x 10 Torr is indicated. If a valve is touched, the component becomes double circled and action areas of the screen are outlined as shown. Open and close are outlined according to the position of the valve, with the double outline indicating the present status. A similar process is provided for the pump. The station operator can call any preprogrammed control panel to his screen for action. To alleviate the necessity of flipping from one level of control to another repetitively, two control screens per station are provided. Background information and subsystem performance data will be displayed on screens at and above eye level. Two-to-six screens could be used depending on the amount of information to be displayed. To allow maximum flexibility in control station assignments, the FED baseline uses three displays as shown in Fig. 7-55 for all stations.
Plasma diagnostics data system
The plasma diagnostic data system will acquire data from the diag-nostic instruments, convert the analog signals to digital form, locally preprocess the data and prepare it for communication lines, transmit data, record raw data, manipulate the data according to prescribed analysis algorithms, display and Tecord the resulting information. In addition this system controls the diagnostic instrument and monitors its performance. It provides a quick-look analysis to allow changes in the various system parameters such as ICRH power and density within one pulse interval (152 s).
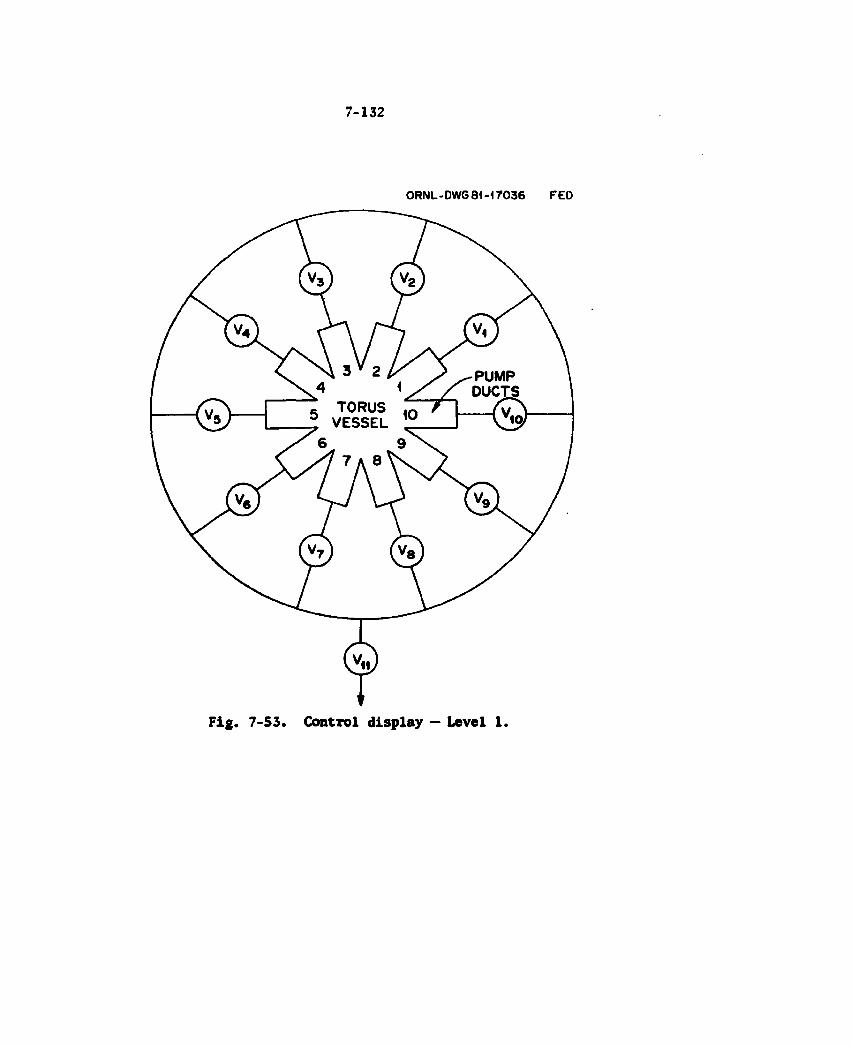
7 - 1 3 2
ORNL-DWG 81-17036 FED
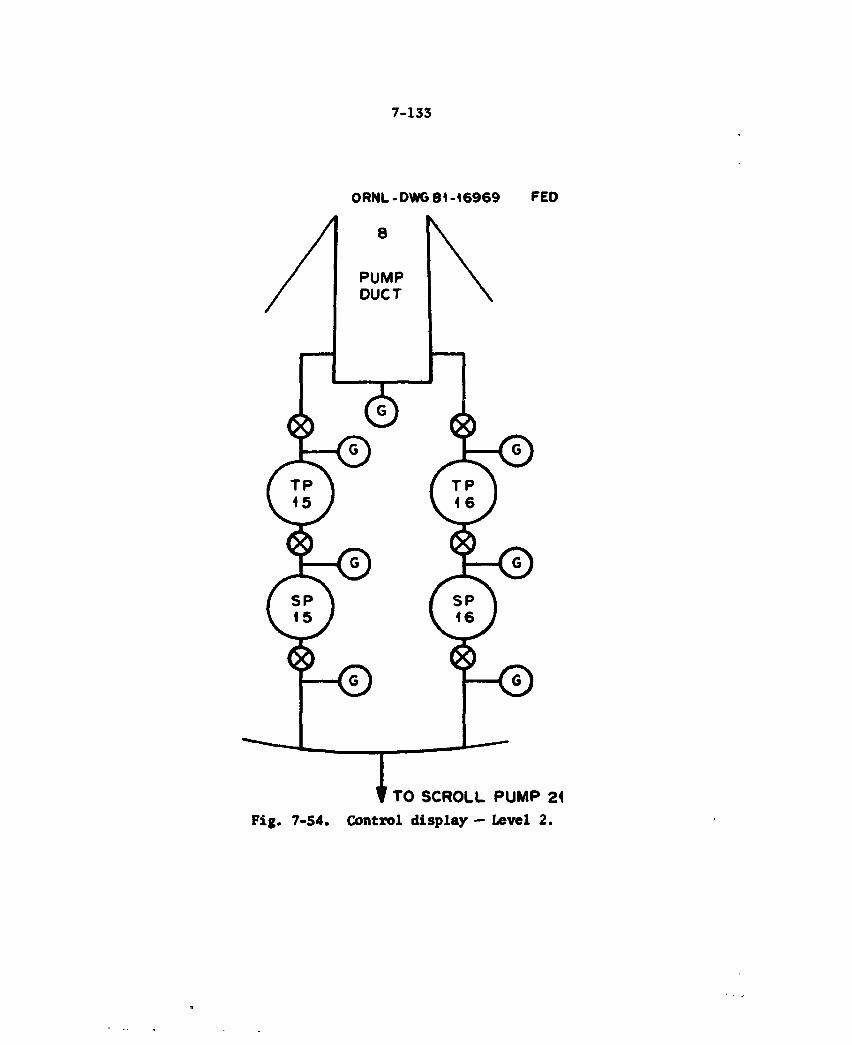
7 - 1 3 3
ORNL-DWG 81-16969 FED
8
PUMP DUCT
c h J
SP 15
SP 16
<D T TO SCROLL PUMP 21
F ig . 7 -54 . Control d isp lay — Level 2 .
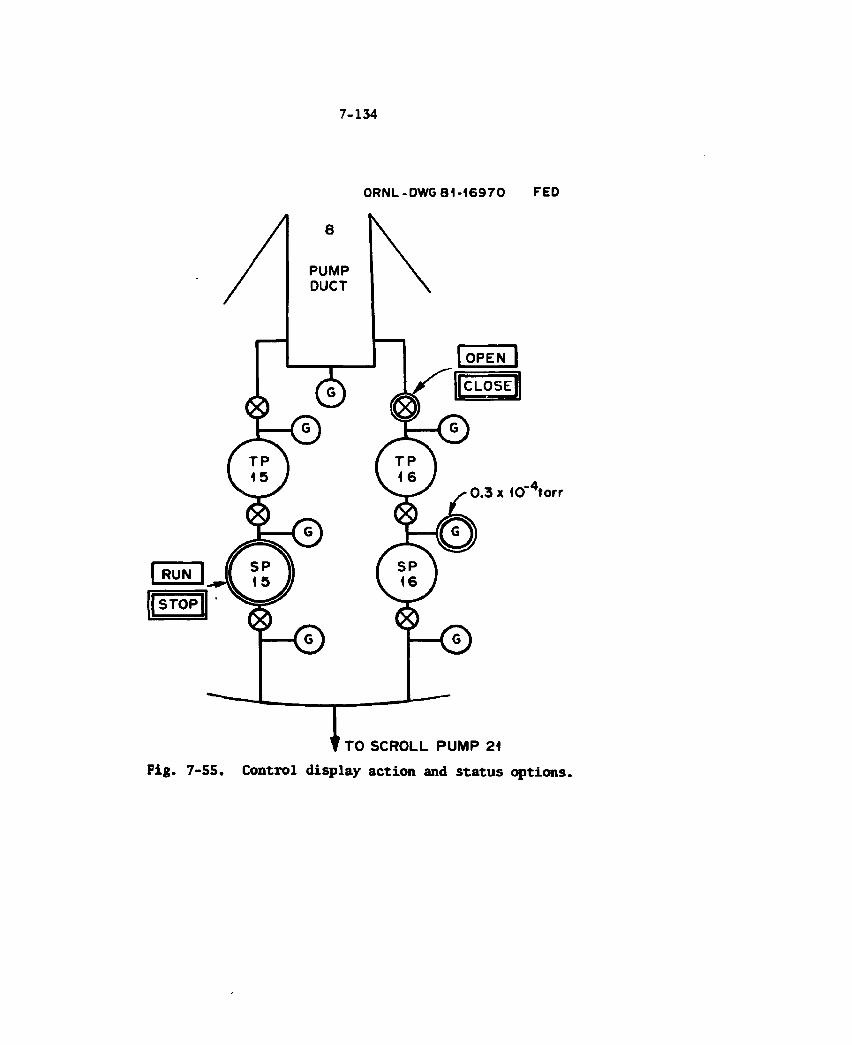
7 - 1 3 4
ORNL-DWG 8 1 - 1 6 9 7 0 FED
8
PUMP DUCT
I OPEN
0.3 x 10"4torr
P © T -© • TO SCROLL PUMP 21
Fig. 7-55. Control display action and status options.

7 - 1 3 S
There are 20 different plasma diagnostic instruments to be used simultaneously on FED during the first 4 or 5 years of operation. When vertical and horizontal arrays and replication of instruments to improve availability are considered, over thirty instruments will be on line at one time. To handle these instruments and the resulting data, thirty analysis stations are proposed for the FED baseline. These stations will access machine sensor data, inachine operating parameters and diag-nostic data. Each analysis station will have one display terminal and access to the INFACS host computer. Through the host computer system, hardcopy, colorgraphic and television displays will be available. Word processing will also be available for information dissemination purposes. Since some diagnostics will generate large amounts of data in a short time bulk transfer of data will be provided. A console similar to that shown in Fig. 7-56 will be provided if necessary for controlling and monitoring the diagnostic and displaying information.
Physicists will have access to the raw diagnostic data for off-line analysis from both local and remote terminals. The computer system must be capable of providing this data.
Subsystem control and monitoring
This system provides a control for all of the subsystems including selected plasma diagnostics. These are diagnostics which are used in feedback processes for controlling the plasma operation. There are 14 plasma diagnostics used for this purpose. Other subsystems to be moni-tored and controlled include the TF coils, PF coils, safety, vacuum, cryogenic, facility cooling, ac power, power conversion, energy storage, torus components, test modules, ECRH, ICRH, tritium and fueling. Each of these subsystems require a high degree of autonomous control during subsystem checkout, maintenance and calibration. However, during a pulse, manual control commands can orginate only from central control except for safety commands. Exceptions to this rule would involve commands that help maintain operation of the subsystem without affecting its performance.
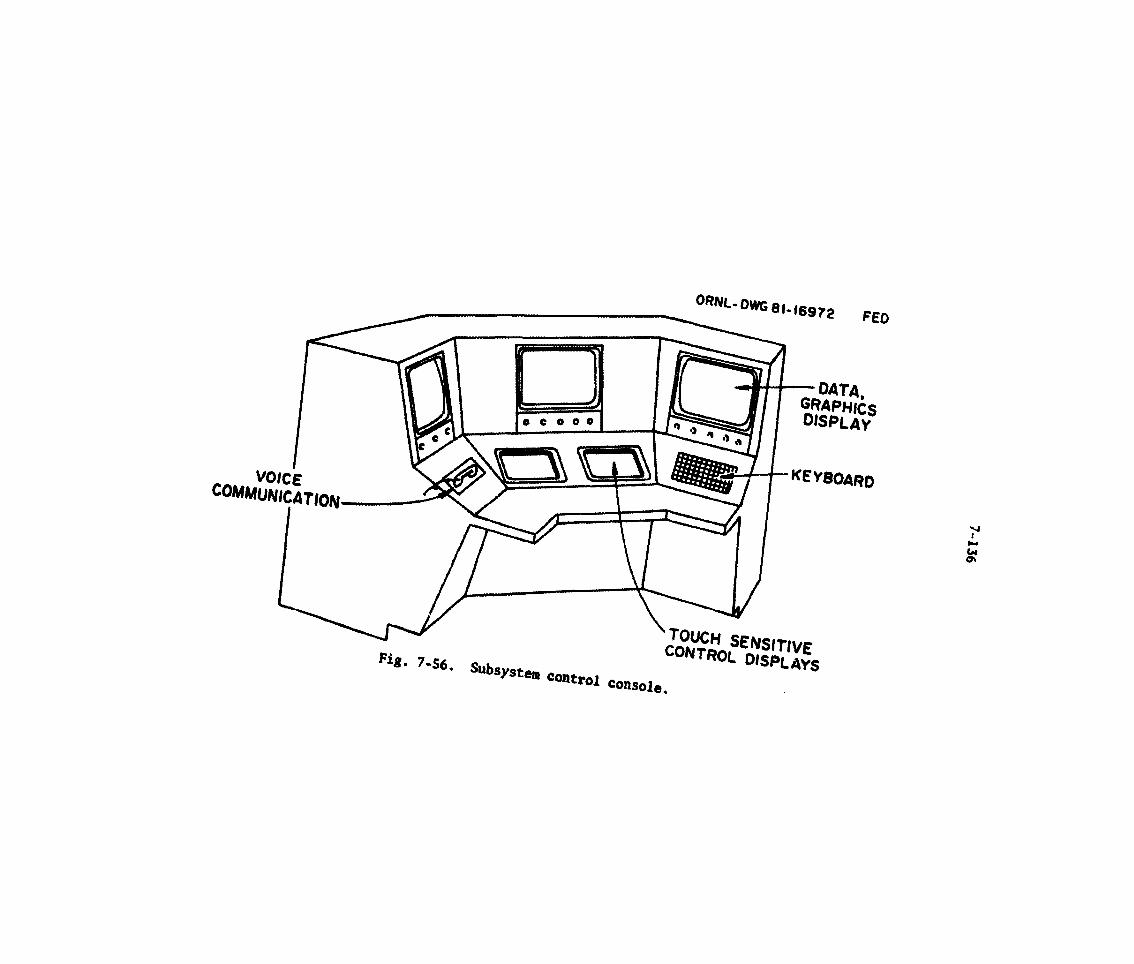
° " * < - D * G 8 M 6 9 7 2
VOICE
COMMUNICATION
FED
DATA, graphics D i s p l a y
KEYBOARD
^ ^system C o n t r o l c ° n t r o l console.
VI I (M <7l

7-137
The operational safety of FED involves a high degree of subsystem self-protection. Certain conditions will cause shutdown of the subsystems. Shutdown safety command signals should ordinarily originate from central control but in many cases the subsystem should be able to self-protect even if the central control signal does not arrive. The best safety actions involve coordinating and sequencing all subsystem actions; therefore, central control is of the utmost importance for the majority of safety actions.
During subsystem checkout or during maintenance periods, a subsystem controller will be able to control all aspects of his subsystem from the control room. However, interface with a central control is still required to ensure that actions taken by the subsystem controller have no adverse impact on other subsystems or maintenance personnel. Electronic and physical interlocks will be used for this purpose.
Each of the subsystems will be interfaced with a device controller and subsystem status and performance monitoring system. These in turn will be interfaced with a computer. The computer used will most often be a microprocessor. Control signals emanating from either the subsystem control console or the system control console will be routed through the system control process to the interface computer and subsequently to the device controller. Data related to the status and performance of the subsystem will be collected by the subsystem monitor, transmitted to the interface computer and sent to the system control process and then to the control consoles or to the facility data system for storage.
To the degree possible, the 20 subsystems should have common interfaces with the remainder of the INFACS. Further, the individual subsystems should perform some real-time fast feedback control. Feedback control which involves sensors and actuators that are within a given subsystem should be performed within that subsystem control area. Subsystem status would still be available to the central control. Some feedback control involves plasma control diagnostics and multiple subsystems. In these cases the fast feedback would be performed at the most reliable level in the system. Block transfer of data and use of array processors may become necessary in these cases.
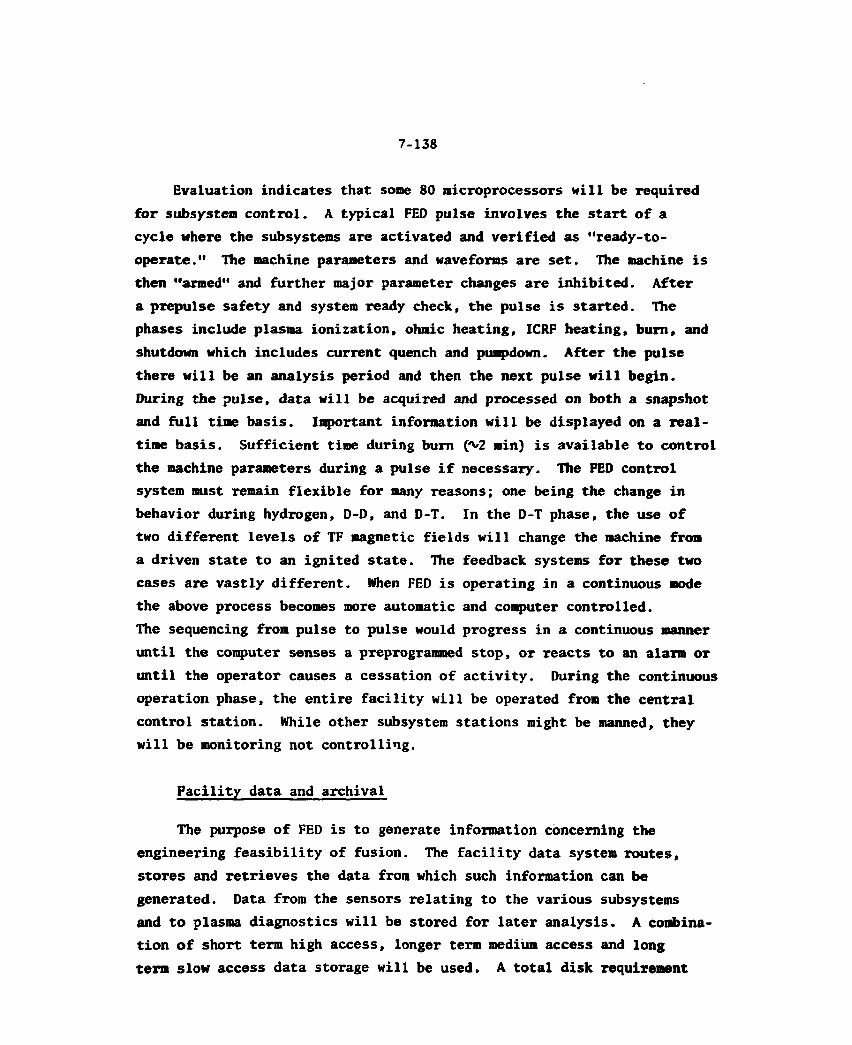
7 - 1 3 8
Evaluation indicates that some 80 microprocessors will be required for subsystem control. A typical FED pulse involves the start of a cycle where the subsystems are activated and verified as "ready-to-operate." The machine parameters and waveforms are set. The machine is then "armed" and further major parameter changes are inhibited. After a prepulse safety and system ready check, the pulse is started. The phases include plasma ionization, ohmic heating, ICRF heating, bum, and shutdown which includes current quench and puapdown. After the pulse there will be an analysis period and then the next pulse will begin. During the pulse, data will be acquired and processed on both a snapshot and full time basis. Important information will be displayed on a real-time basis. Sufficient time during burn (^2 min) is available to control the machine parameters during a pulse if necessary. The FED control system must remain flexible for many reasons; one being the change in behavior during hydrogen, D-D, and D-T. In the D-T phase, the use of two different levels of TF magnetic fields will change the machine from a driven state to an ignited state. The feedback systems for these two cases are vastly different. Nhen FED is operating in a continuous mode the above process becomes more automatic and computer controlled. The sequencing from pulse to pulse would progress in a continuous manner until the computer senses a preprogrammed stop, or reacts to an alarm or until the operator causes a cessation of activity. During the continuous operation phase, the entire facility will be operated from the central control station. While other subsystem stations might be manned, they will be monitoring not controlling.
Facility data and archival
The purpose of FED is to generate information concerning the engineering feasibility of fusion. The facility data system routes, stores and retrieves the data from which such information can be generated. Data from the sensors relating to the various subsystems and to plasma diagnostics will be stored for later analysis. A combina-tion of short term high access, longer term medium access and long term slow access data storage will be used. A total disk requirement

7 - 1 3 9
of 130 M BYTES per pulse has been estimated which includes pulse data, facilities data, keyword for searching, keyword description, comments concerning the pulse and other data needed to extract useful information from the pulse.
During the early days of operation, the FED will be operated on a single pulse basis and there will be time to store the data obtained. Later when the machine is operating on a repetitive pulse basis, the total cycle time available is about three minutes. From the time the last plasma data is collected to the beginning of the next pulse is about one minute. There is a large amount of processing, formatting and storage to be achieved in between one and three minutes.
7.4.13 Future Work — Control and Data Systems
The main areas needing effort relate to feedback control of the plasma parameters and to facility control. In plasma control, the need exists for a system dynamics characterization for the various components of the feedback loop. Work is being done in plasma position control but work needs to be initiated in density control and temperature con-trol. Hie use of sensors, control algorithms and actuators in feedback control systems need to be addressed.
In the facility control area, more detail is needed. Presently identified requirements are still functional in nature and need to be quantified. Subsystem control and monitoring have been addressed but much more information is needed to configure and size INFACS. Some of the added information will come as a natural consequence of additional design detail in the various subsystems for FED, but an organized sur-vey of the subsystems is required to obtain the needed information.
In addressing the facility data and archival system, it is recog-nized that the amount of data that will be generated is very large. Commercial data base management schemes may not be able to handle this quantity of data at reasonable cost. If later analysis proves this to be true, either the quantity of data will have to be reduced or it must be partially processed before storage. With the large amounts of data being generated, the number of pulses held on disk may be reduced
7 - 1 4 0
and tape storage increased. In later phases of machine operation, plasma diagnostics data should decrease and requirements for new storage reduce. More work needs to be done to establish more accurately the data storage requirements before the data system architecture is established and the INFACS design is finalized.
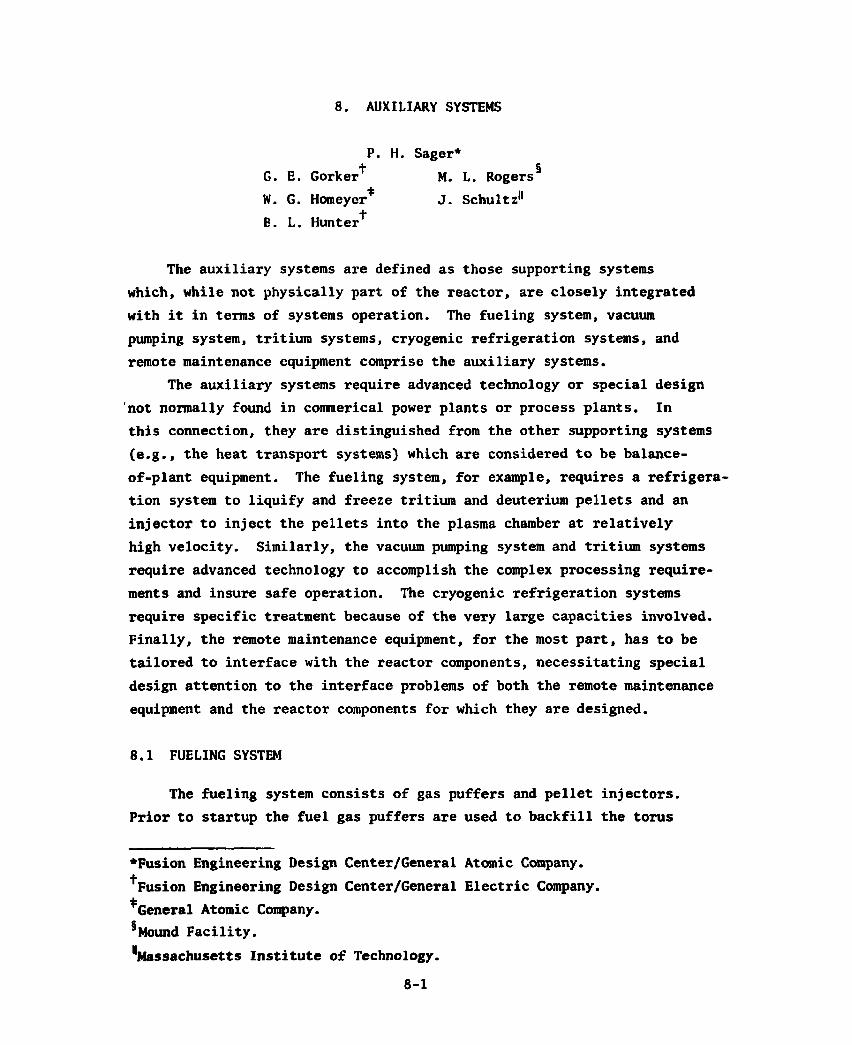
8. AUXILIARY SYSTEMS
P. H. Sager* + i G. E. Gorker M. L. Rogers
W. G. Homeyer* J. Schultz" + B. L. Hunter
The auxiliary systems are defined as those supporting systems which, while not physically part of the reactor, are closely integrated with it in terms of systems operation. The fueling system, vacuum pumping system, tritium systems, cryogenic refrigeration systems, and remote maintenance equipment comprise the auxiliary systems.
The auxiliary systems require advanced technology or special design not normally found in commerical power plants or process plants. In this connection, they are distinguished from the other supporting systems (e.g., the heat transport systems) which are considered to be balance-of-plant equipment. The fueling system, for example, requires a refrigera-tion system to liquify and freeze tritium and deuterium pellets and an injector to inject the pellets into the plasma chamber at relatively high velocity. Similarly, the vacuum pumping system and tritium systems require advanced technology to accomplish the complex processing require-ments and insure safe operation. The cryogenic refrigeration systems require specific treatment because of the very large capacities involved. Finally, the remote maintenance equipment, for the most part, has to be tailored to interface with the reactor components, necessitating special design attention to the interface problems of both the remote maintenance equipment and the reactor components for which they are designed.
8.1 FUELING SYSTEM
The fueling system consists of gas puffers and pellet injectors. Prior to startup the fuel gas puffers are used to backfill the torus
•Fusion Engineering Design Center/General Atomic Company. ^Fusion Engineering Design Center/General Electric Company. ^General Atomic Company. ^Mound Facility. "Massachusetts Institute of Technology.
8 - 1

7-2
with deuterium to the desired pressure. Gas puffing continues until a plasma of about 1 keV is established. Frozen deuterium and tritium pellets are then injected to control the plasma density. For the low tritium bumup fraction (<1%) given in Appendix A, a 4-mm diameter fuel pellet is selected.
8.1.1 Fueling System Requirements
The fuel system requirements described below are based on the FED parameters provided in Appendix A of this document. The basis for the fuel system requirements is the data given in Table 8-1 for a pellet injection velocity of 2000 m/s. Pellet injectors currently under develop-ment have the potential of attaining this velocity if the pellets do not fracture and disintegrate before they leave the injector.
The pellet injector:design requirements data given in Table 8-2 are based on the injection of 4-mm pellets for both the 8- and 10-T operating modes.
8.1.2 Fueling System Baseline Description
To reduce the number of penetrations through the radiation shield, dual channel pellet injectors are specified. These injectors have both deuterium and tritium pellet formers so that both kinds of pellets can be injected concurrently from one injector. The pellet injectors have moving members and, therefore, will require maintenance. Spare injectors may be provided to minimize downtime when a fuel injector needs to be removed for repair. The pellet injectors must be capable of operating in a high magnetic field or alternatively must be located further from the torus. The greater the distance from the torus, the greater the diameter of the shield penetration required to accommodate the increased pellet dispersion.
Gas puffers as well as pellet injectors are needed to meet fueling requirements during startup, bum, and shutdown phases of the operating cycle. Gas puffer design requirements data are given in Table 8-3. For control flexibility, each gas puffer will have a selector valve
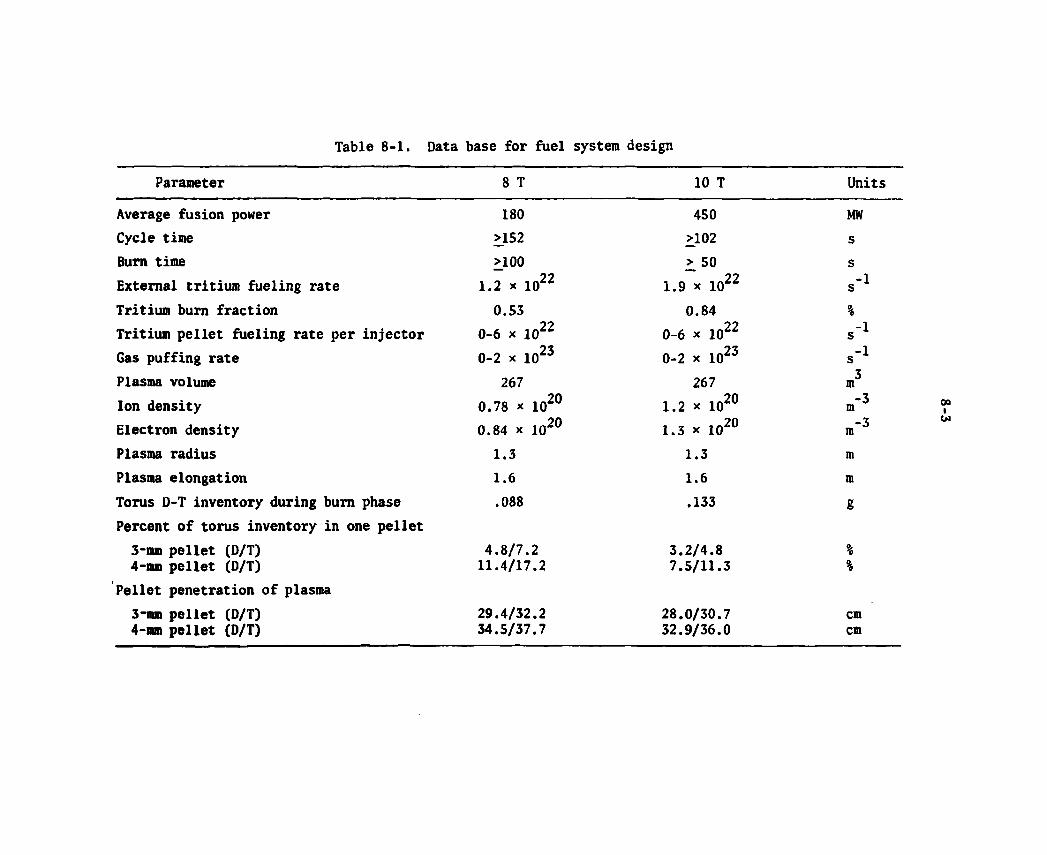
Table 8-1. Data base for fuel system design
Parameter 8 T 10 T Units
Average fusion power 180 450 MW Cycle time >152 >102 s Burn time >100 > 50 s External tritium fueling rate 1.2 x 10²² 22 1.9 x 10^ s"1
Tritium burn fraction 0.53 0.84 % Tritium pellet fueling rate per injector 0-6 x 10²² 22 0-6 x 10" s"1
Gas puffing rate 0-2 x 10²³ 23 0-2 x 10*" s-1
Plasma volume 267 267 3 m Ion density 20 0.78 x lo-4" 20 1.2 x 1 0 m -3 m Electron density 20 0.84 x 20 1.3 x 10zu -3 m Plasma radius 1.3 1.3 m Plasma elongation 1.6 1.6 m Torus D-T inventory during burn phase .088 .133 g Percent of torus inventory in one pellet 3-mm pellet (D/T) 4.8/7.2 3.2/4.8 % 4-mm pellet (D/T) 11.4/17.2 7.5/11.3 %
Pellet penetration of plasma 3-mm pellet (D/T) 29.4/32.2 28.0/30.7 cm 4-mm pellet (D/T) 34.5/37.7 32.9/36.0 cm
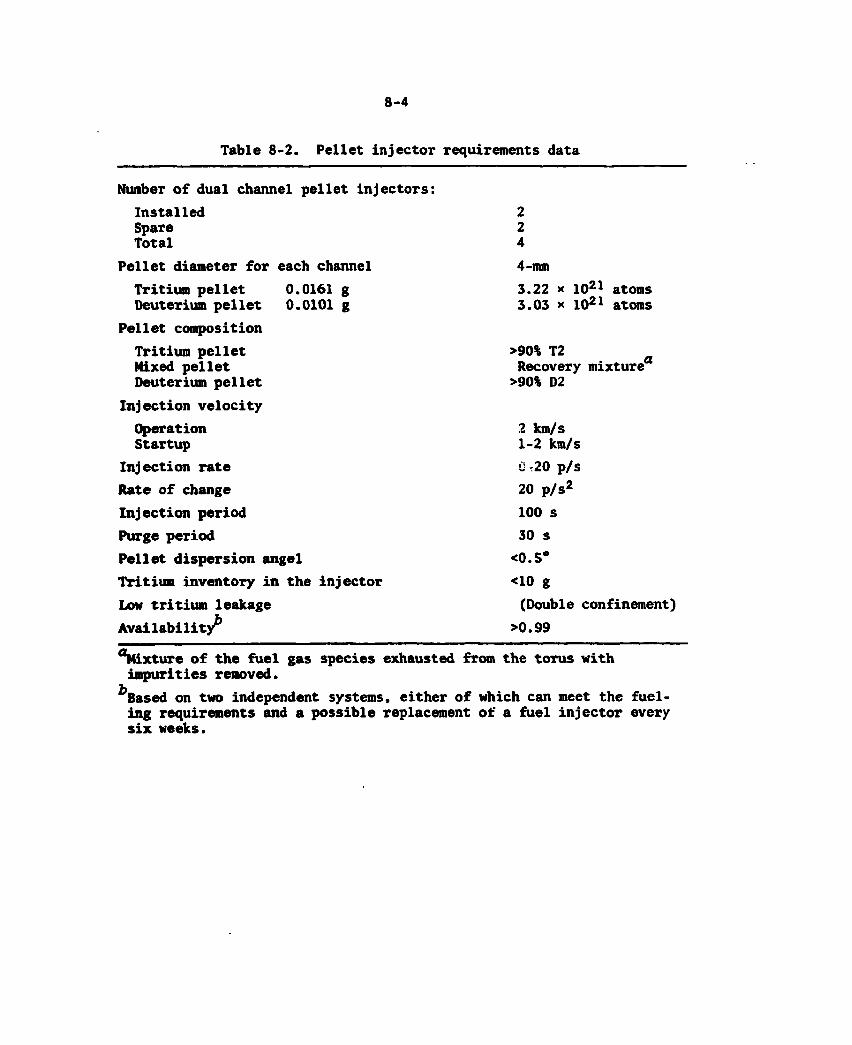
8 - 4
Table 8-2. Pellet injector requirements data
Number of dual channel pellet injectors: Installed Spare Total
Pellet diameter for each channel Tritium pellet 0.0161 g Deuterium pellet 0.0101 g
Pellet composition Tritium pellet Mixed pellet Deuterium pellet
Injection velocity Operation Startup
Injection rate Rate of change Injection period Purge period Pellet dispersion angel Tritium inventory in the injector Low tritium leakage Availability^
2 2 4 4-mm 3.22 x 10²¹ atoms 3.03 x 10²¹ atoms
>90% T2 Recovery mixture
>90% D2
2 km/s 1-2 km/s 0 ,20 p/s 20 p/s2
100 s 30 s
<0.5° <10 g (Double confinement)
>0.99
^Mixture of the fuel gas species exhausted from the torus with impurities removed.
^Based on two independent systems, either of which can meet the fuel-ing requirements and a possible replacement of a fuel injector every six weeks.
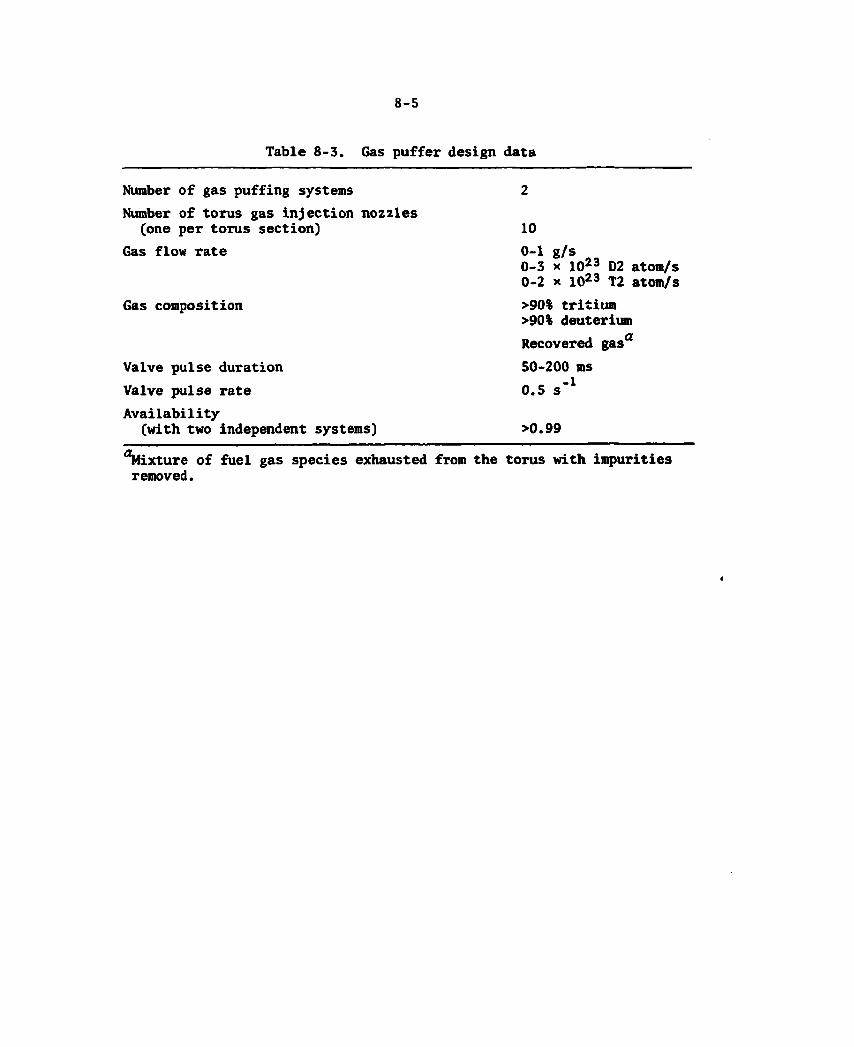
8-5
Table 8-3. Gas puffer design data
Number of gas puffing systems 2 Number of torus gas injection nozzles
(one per torus section) 10 Gas flow rate
0-3 x 10²³ D2 atom/s 0-2 x 10²³ T2 atom/s
Gas composition >90% tritium >90% deuterium Recovered gasa
Valve pulse duration 50-200 ms Valve pulse rate 0.5 s - 1
Availability (with two independent systems) >0.99
^Mixture of fuel gas species exhausted from the torus with impurities removed.

8-6
which can be used for pulsed gas control or removing the puffer port from service.
Both gas puffers and pellet injectors will have automatic and manual control modes. Programmable computers, using active feedback control, will be provided for controlling the fueling rate and the deuterium-tritium ratio when puffing fuel gas or injecting frozen pellets.
Fuel gas puffing system
Figure 8-1 is a diagram of the fuel gas flow control system proposed for FED. (The nomenclature used in Figs. 8-1 and 8-2 is defined in Table 8-4.) Both continuous and pulsed flow control of the selected gas are provided. The fuel gas is selected by the manually controlled remote valves (RM). The selected gas can be predominantly deuterium, predominantly tritium, or a mixed gas species from the fuel recovery process system. Downstream pressure controllers (P^) regulate the pressure of the selected gas to the control valve. Either one or both of two gas puffing control systems can be selected. If used separately, one flow control valve supplies all 10 gas puffing ports. Under these conditions, the manifold divider valve is- open. If both flow control valves are used, the divider valve is closed so that each control valve supplies five of the alternate ports. All or part of the available gas puffing ports can be selected for operation. Both normal and automatic control modes are provided. This system offers redundancy to improve reliability, and considerable flexi-bility in selecting and controlling fuel gas flow to the torus fusion chamber. The fuel gas tanks that contain tritium are shared with the fuel recovery system. They also service the pellet injector system described below. The specie composition of each tank will be determined by monitor-ing the tritium beta emission.
Fuel pellet injector system
There are two pellet fuel injectors located on the same torus sector. Each injector can inject 4-mm diameter deuterium and tritium pellets con-currently. A mixed specie fuel may be substituted for the deuterium or
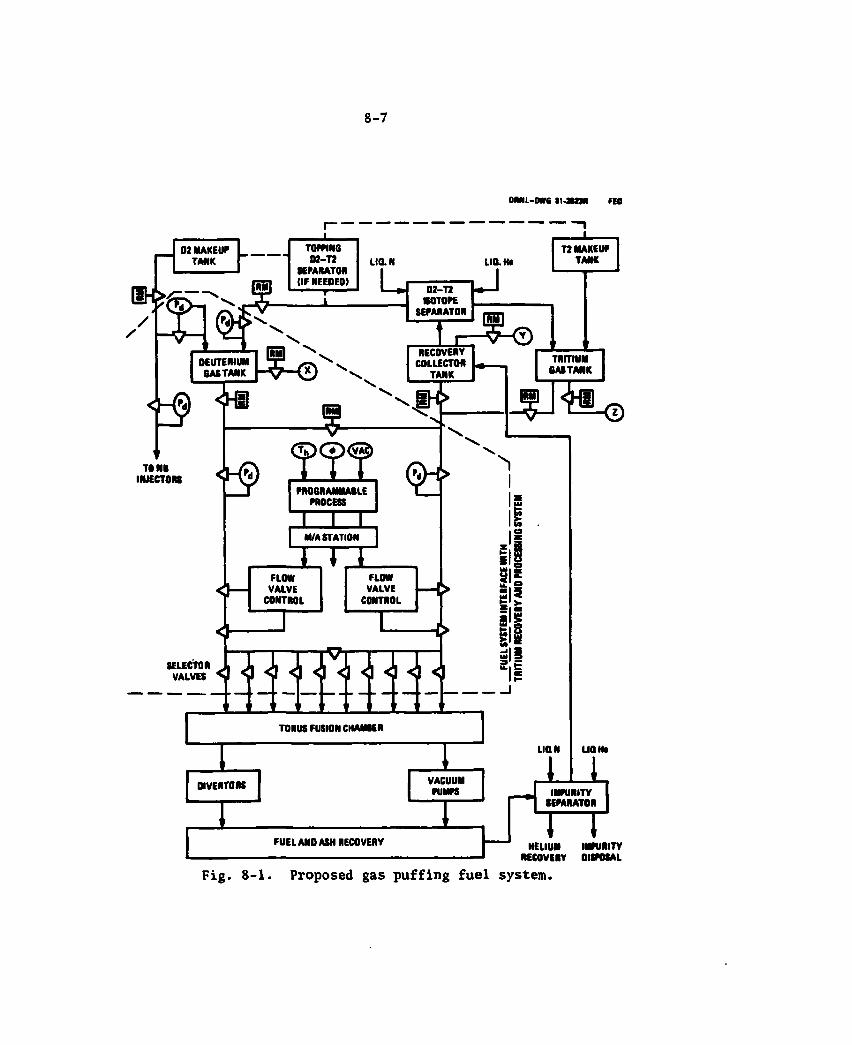
8-7
ORNL-MG 11-aafl FEO
02 MAKEUP TANK
JL TOPPING 02-T2
SEPARATOR
T2 MAKEUP TANK
VW I MIR
TOMB INJECTORS
SELECTOR VALVES
FLOW FLOW VALVE VALVE
CONTROL CONTROL
s u< K *
TORUS FUSION CHAMBER
OIVERTORS VACUUM PUMPS
LION LIQH*
i _ _ L
FUEL ANO ASH RECOVERY
IMPURITY SEPARATOR
T~T HELIUM IMPURITY
RECOVERY DISPOSAL Fig. 8-1. Proposed gas puffing fuel system.
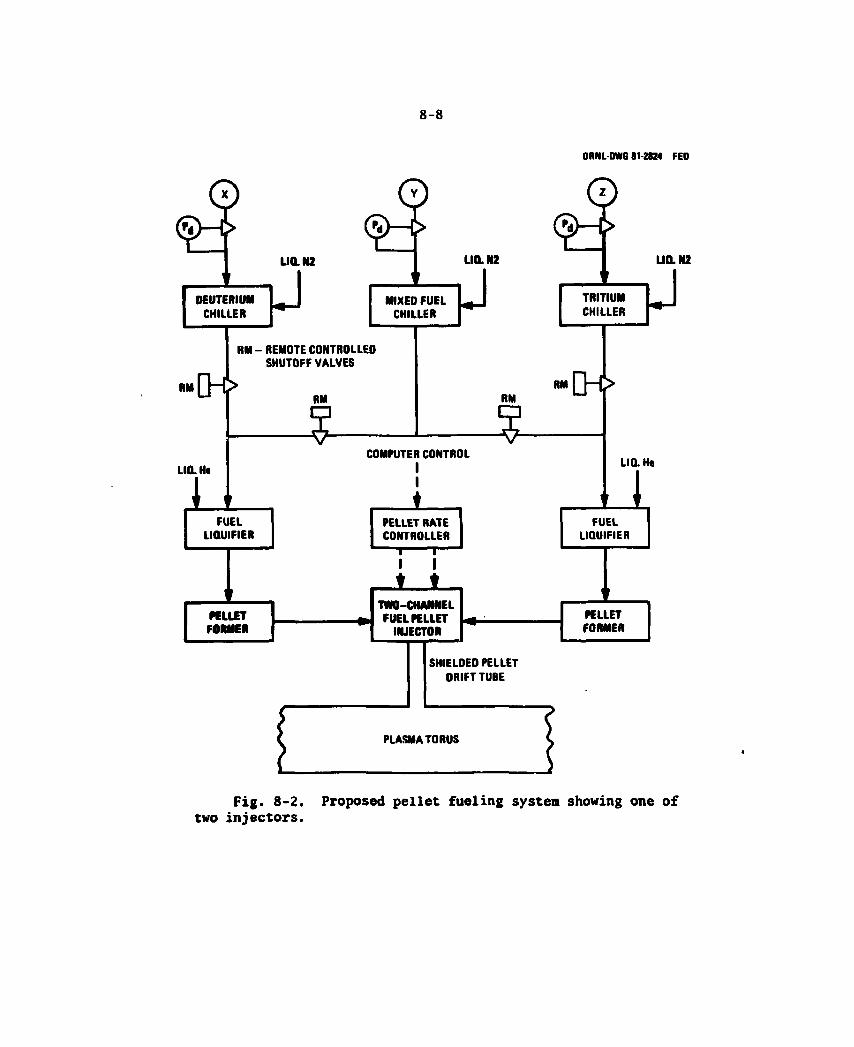
8-8
ORNL-OWG 81-2824 FED
Fig. 8-2. two injectors.
Proposed pellet fueling system showing one of
8-9
Table 8-4. Nomenclature used in Figs. 8-1 and 8-2
D2 Deuterium gas LIQ He Liquid helium LIQ N Liquid nitrogen Ne Plasma electron density Pd Downstream pressure control
RC Pellet rate controller RM Remote manual controlled valve T2 Tritium gas T2/D2 Tritium to deuterium ratio Tb Plasma boundary temperature Te Plasma electron temperature VAC Vacuum • Neutron flux
8 - 1 0
tritium as shown in Fig. 8-2. Downstream pressure regulators (P^) control the flow of gas to the nitrogen cooled chiller tanks located external to the pellet injector. Remotely controlled selector valves determine the fuel gas admitted to the liquefiers. The liquefiers are located inside the insulated fuel injectors. The liquid fuel to the pellet former flows by gravity feed rather than by forced flow. The pellets are then admitted to the dual feed pellet injector at a rate controlled by a process computer. The programmable computer uses electron density, and neutron measurements to calculate the pellet injection rate of both channels. Either fuel injector can provide for satisfactory operation, but the pellet rate could be doubled if both injectors were operating concurrently.
Both pneumatic and centrifugal pellet injcctors are being developed and could be used for injecting pellets from two feed lines concurrently. Figures 8-3 and 8-4 show each type of injector and its interface with the torus sector. The centrifugal injector is rotating many times faster than the feed rate; therefore, two or more species can be injected with the same slinger. A pneumatic injector is being developed with four barrels which could be fed with two extruders to accomplish two-channel injections.
Future development and testing will make it possible to select the type of injector. At this time, however, it appears desirable to design the shielded drift tube and associated isolation valve to accommodate either injector. Centrifugal injectors are larger than the pneumatic guns driven with compressed deuterium gas but they are better able to provide higher pellet rates and can also provide for more diagnostic instrumentation. The pneumatic guns have the advantage of a substantially lower pellet dispersion angle. Double wall containment will be needed to minimize leakage to the reactor room.
8.1.3 Fueling System Control and Performance
Development models of both the pneumatic and centrifugal injectors have been built for injecting 2-mm diameter pellets with injection velocities of 1000 m/s. Some preliminary testing has been done with low density and low temperature plasmas. More testing is under way. These
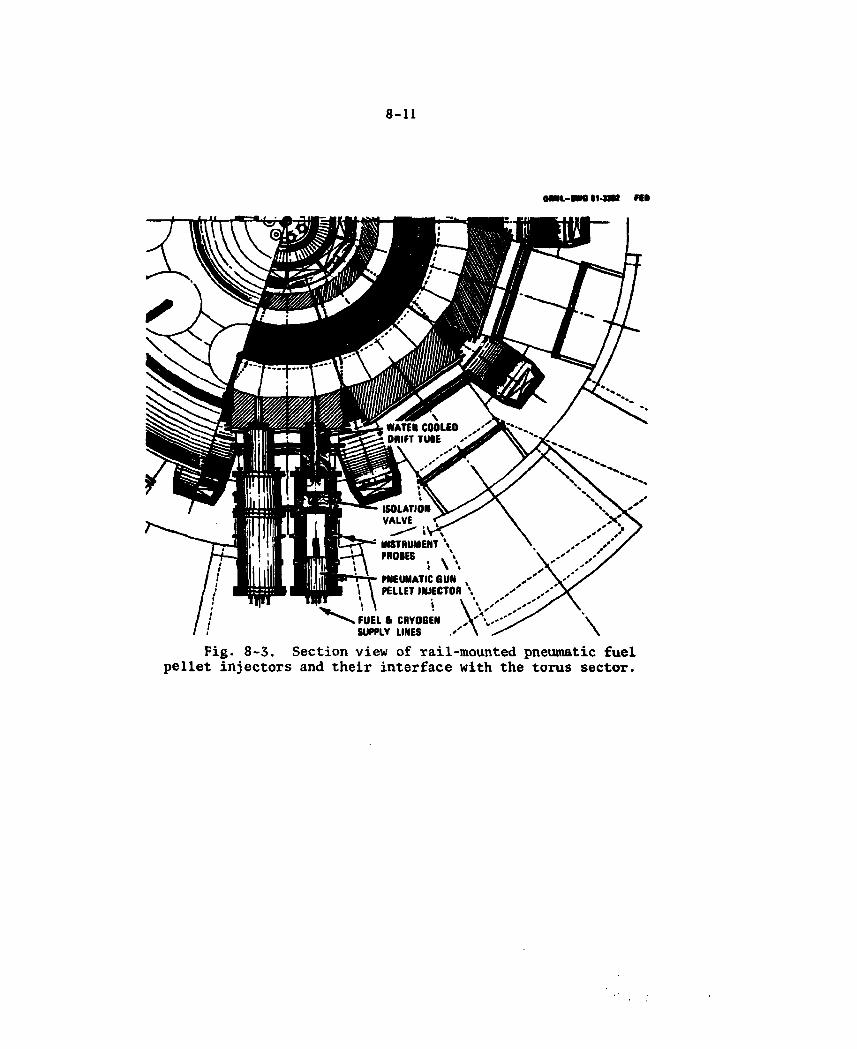
8 - 1 1
oML-NRE I I « H n o
Fig. 8-3. Section view of rail-mounted pneumatic fuel pellet injectors and their interface with the torus sector.
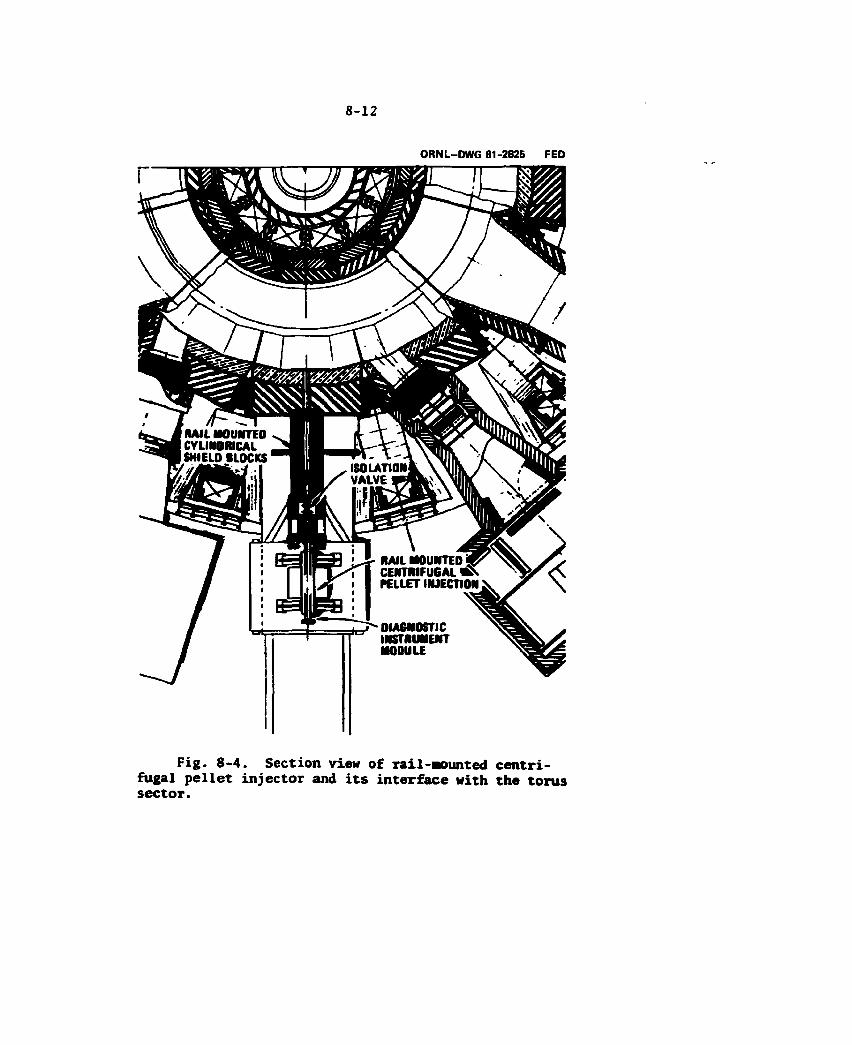
8-12
ORNL—DWG 81-2825 FED
Fig. 8-4. Section view of Tail-mounted centri-fugal pellet injector and its interface with the torus sector.
8 - 1 3
injectors are not designed to inject tritium pellets and they cannot be tested with fusion grade plasmas. There is no way of extrapolating current experimental data to determine the potential performance and reliability of these injectors.
Pellet injectors are currently used to control plasma density only. Control flexibility is needed. Ideally, it is desirable to be able to control pellet rate, pellet velocity and the ratio of tritium to deuterium injection. With centrifugal injectors it may be possible to control the pellet diameter so that smaller pellets can be injected during startup for 8-T operation (as compared to 10-T operation) in the burn phase.
8.1.4 Conclusions — Fueling System
Both pneumatic and centrifugal types of fuel injectors which have the potential of meeting FED fueling requirements are under development. Two-mm hydrogen and deuterium pellet injectors are also being developed by DOE to meet near-term objectives which do not include tritium handling problems.
There is considerable environmental safety concern about the large tritium inventory that may exist in the fuel injectors if batch processing liquefiers and extruders are used. The amount of tritium inventory is inversely proportional to the tritium burnup fraction, which is very low for FED (0.5 to 0.8%). In the future, pellet injectors should be developed to reduce the inventory with continuous process liquefiers and extruders. More detailed work is also needed in the conceptual design of double enclosed pellet injectors which assure that a single leak can be detected and the inventory returned for reprocessing before any significant leak to the reactor cell occurs.
8.2 VACUUM PUMPING SYSTEM
The vacuum pumping system for FED is designed to pump down the torus vacuum vessel initially and between burns and to remove the gas load from the pump limiter during the burn period. Ten vacuum ducts are used. To the end of each duct is connected a pair of large turbomolecular pumps,
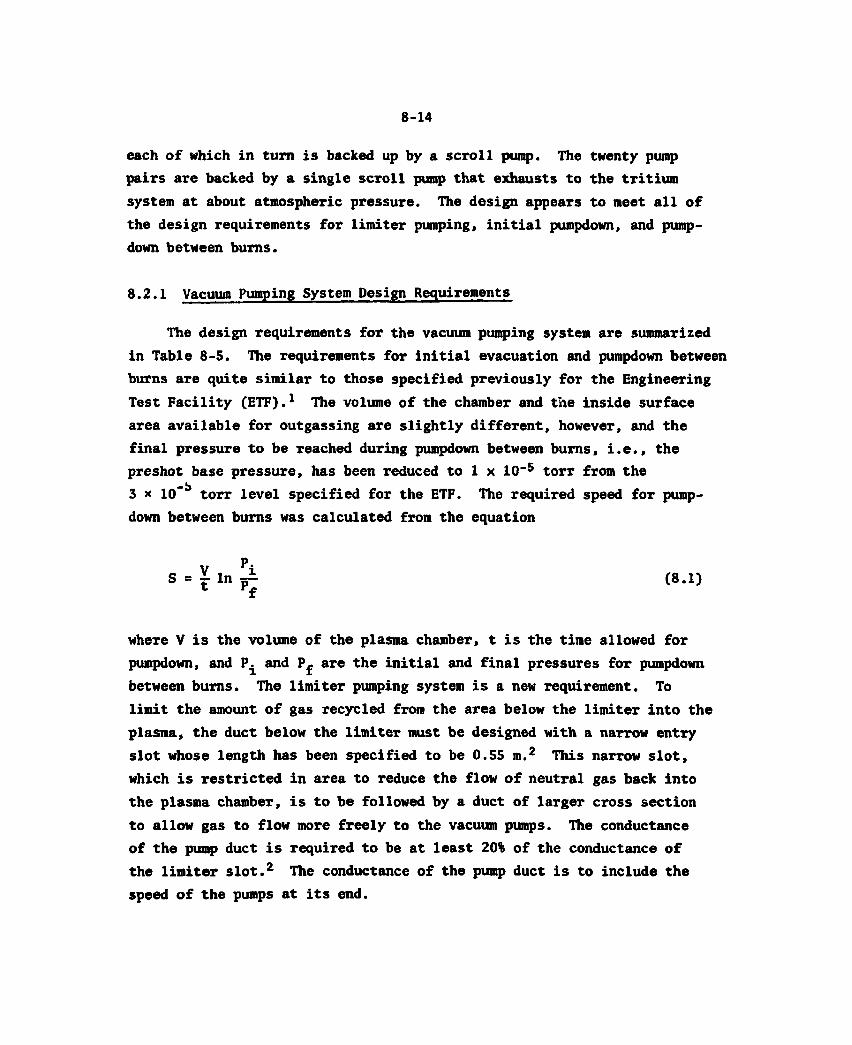
8 - 1 4
each of which in turn is backed up by a scroll pump. The twenty pump pairs are backed by a single scroll pump that exhausts to the tritium system at about atmospheric pressure. The design appears to meet all of the design requirements for limiter pumping, initial pumpdown, and pump-down between bums.
8.2.1 Vacuum Pumping System Design Requirements
The design requirements for the vacuum pumping system are summarized in Table 8-5. The requirements for initial evacuation and pumpdown between burns are quite similar to those specified previously for the Engineering Test Facility (ETF).1 The volume of the chamber and the inside surface area available for outgassing are slightly different, however, and the final pressure to be reached during pumpdown between bums, i.e., the preshot base pressure, has been reduced to 1 x 10~5 torr from the 3 x lo~b torr level specified for the ETF. The required speed for pump-down between bums was calculated from the equation
where V is the volume of the plasma chamber, t is the time allowed for pumpdown, and P^ and P^ are the initial and final pressures for pumpdown between bums. The limiter pumping system is a new requirement. To limit the amount of gas recycled from the area below the limiter into the plasma, the duct below the limiter must be designed with a narrow entry slot whose length has been specified to be 0.55 m.2 This narrow slot, which is restricted in area to reduce the flow of neutral gas back into the plasma chamber, is to be followed by a duct of larger cross section to allow gas to flow more freely to the vacuum pumps. The conductance of the pump duct is required to be at least 20% of the conductance of the limiter slot.2 The conductance of the pump duct is to include the speed of the pumps at its end.
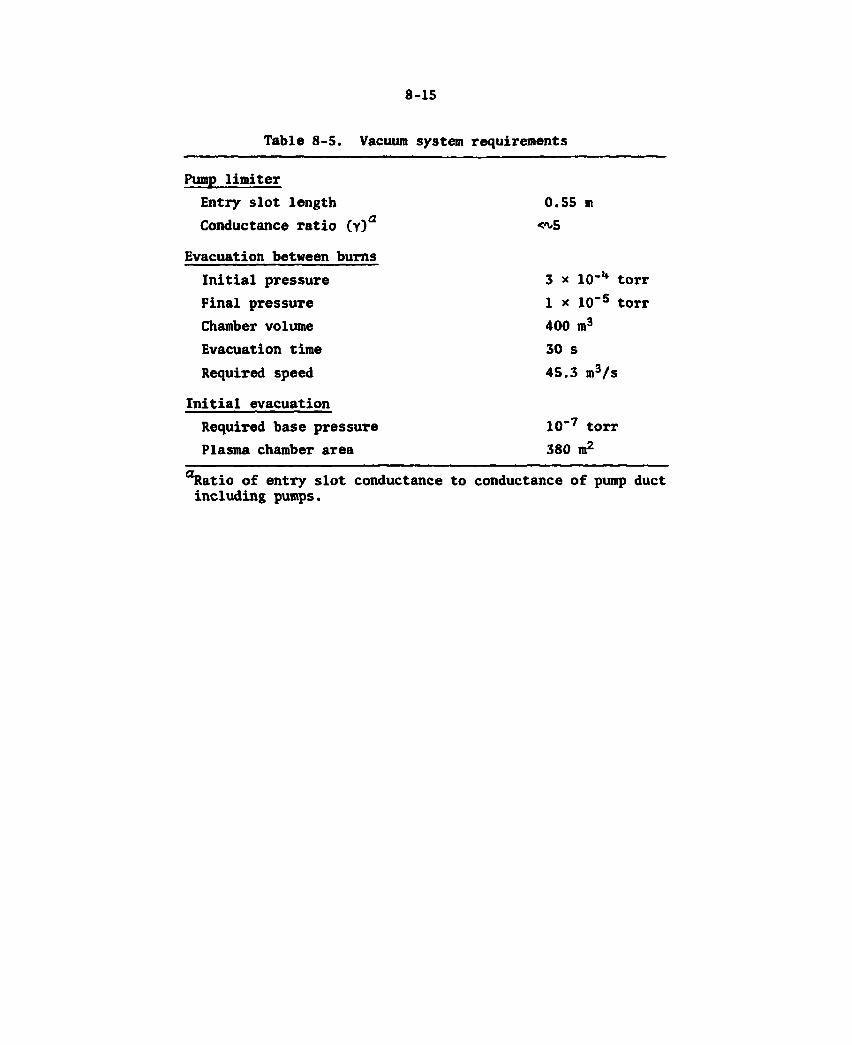
8 - 1 5
Table 8-5. Vacuum system requirements
Pump limiter Entry slot length Conductance ratio (y)<2
Evacuation between burns Initial pressure Final pressure Chamber volume Evacuation time Required speed
Initial evacuation Required base pressure Plasma chamber area
0.55 m co.5
3 * 10"1* torr 1 x 10"5 torr 400 m3
30 s 45.3 m3/s
10 - 7 torr 380 m2
aRatio of entry slot conductance to conductance of pump duct including pumps.

8 - 1 6
8.2.2 Vacuum Pumping System Baseline Design Description
The vacuum pumping system consists of ten identical vacuum ducts, one in each of the ten torus sectors, as shown in Fig. 8-5. A side elevation section of a typical duct is shown in Fig. 8-6 and in plan view in Fig. 8-7. The ten ducts merge into one below the limiter, diverging to pass between TF coils on their way to the vacuum pumps. At the end of each duct is a pair of turbomolecular pumps, each backed by a scroll pump.
The exhaust from all of the first stage scroll pumps is combined and passed to a second stage scroll pump that compresses the gases to approxi-mately atmospheric pressure. The major design parameters of the vacuum pumping system are summarized in Table 8-6.
The high vacuum turbomolecular pumps are required to have a speed 3 of 5 m /s for helium and hydrogen isotopes. They will have to be designed for tritium service; all seals will have to be metallic and provisions will have to be made for remote oil change, maintenance, repair and replacement.
The inlet flange to each turbomolecular pump has an inside diameter of 500 mm and is attached to a gate or pendulum valve. Either a gate or pendulum valve would have to be built specially to accommodate the 500 mm inside diameter, but this is viewed as well within present capabilities by manufacturers of vacuum components. A backup to this approach, with a slightly higher flow resistance, is a plate valve which is available as a catalogue item.3 The valve would be connected by a pipe section to the large rectangular duct from the pump limiter.
As shown in Figs. 8-6 and 8-7, the duct array consists of a short entry slot of 10-cm height and 2.3-m width, followed by a long duct of 50-cm height and 2-m width, which has several bends to reduce nuclear radiation streaming.
Scroll pumps were selected to back the turbomolecular pumps and for rough pumping of the plasma chamber. These are sealed pumps that have no bearing lubricant in contact with the tritium stream. Two stages
-4 -3 of scroll pumps are required to reach the pressure of 10 to 10 torr needed for effective pumping by the turbomolecular pumps to pressures
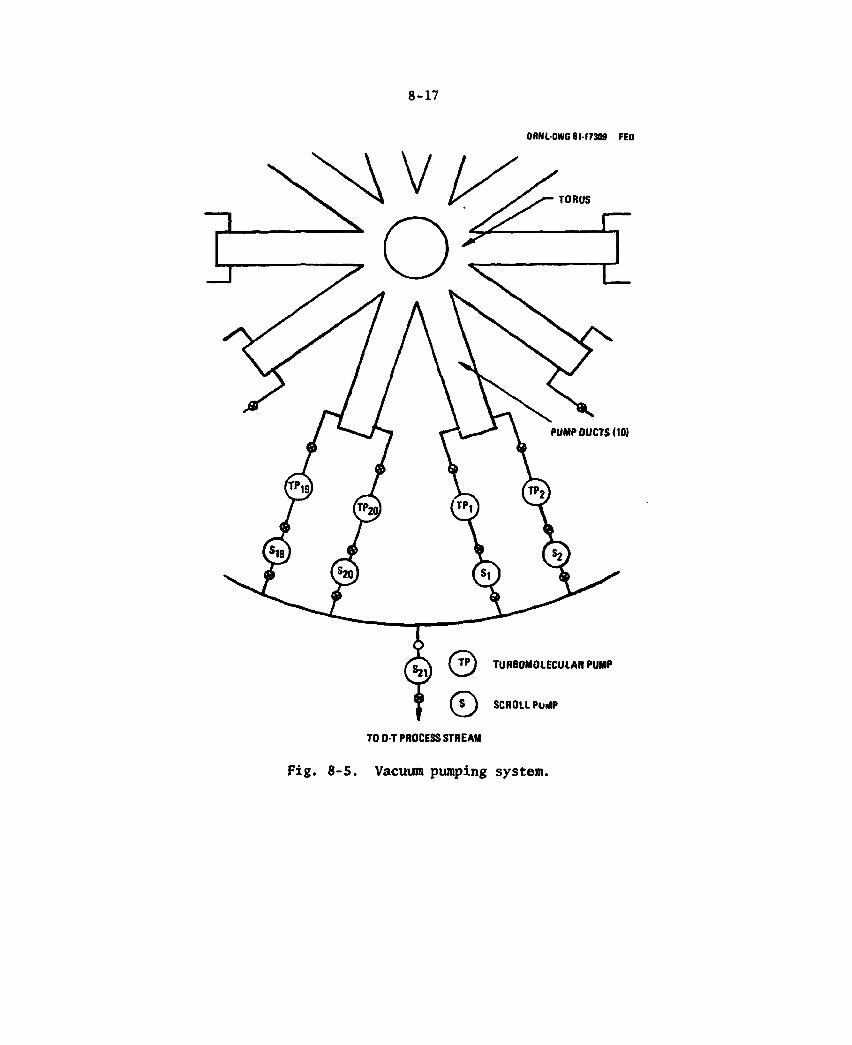
8 - 1 7
ORNLOWG 81-17309 FED
PUMP OUCTS (10)
^ © © TO D T PROCESS STREAM
Fig. 8-5. Vacuum pumping system
TURBOMOLECULAR PUMP
SCROLL PurfP
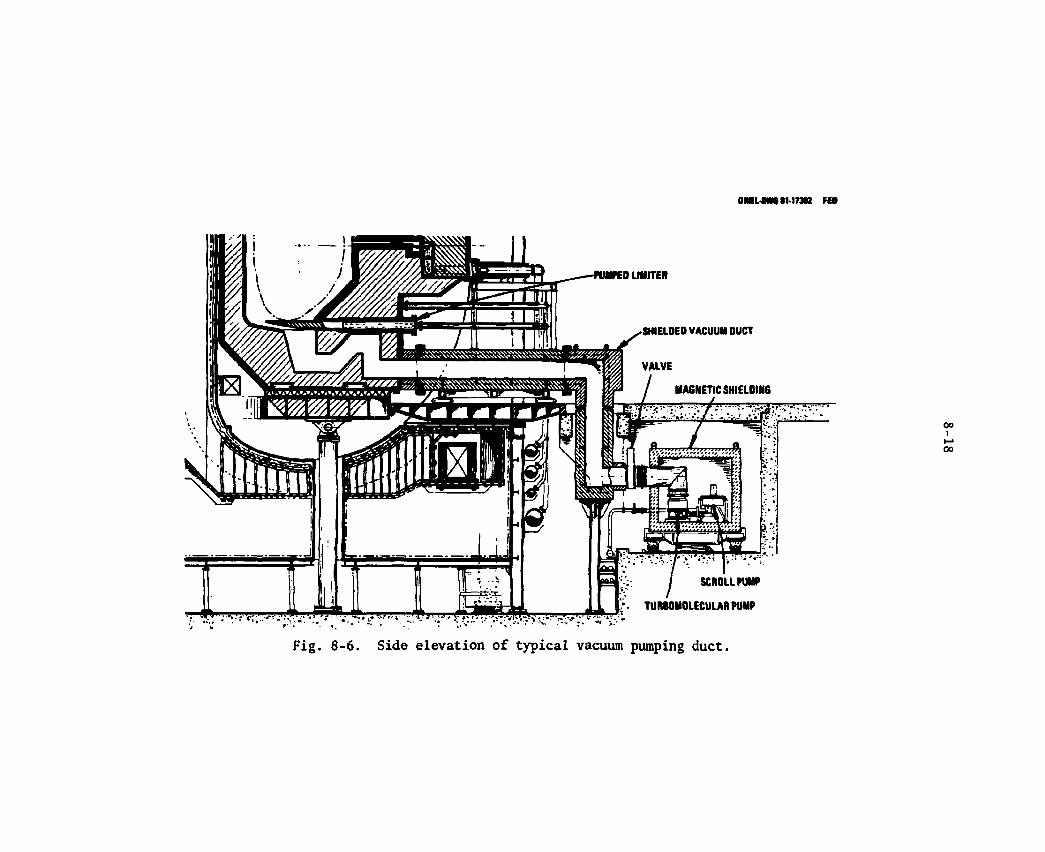
OMUNf f i 11-173*2 FED
Fig. 8-6. Side elevation of typical vacuum pumping duct.
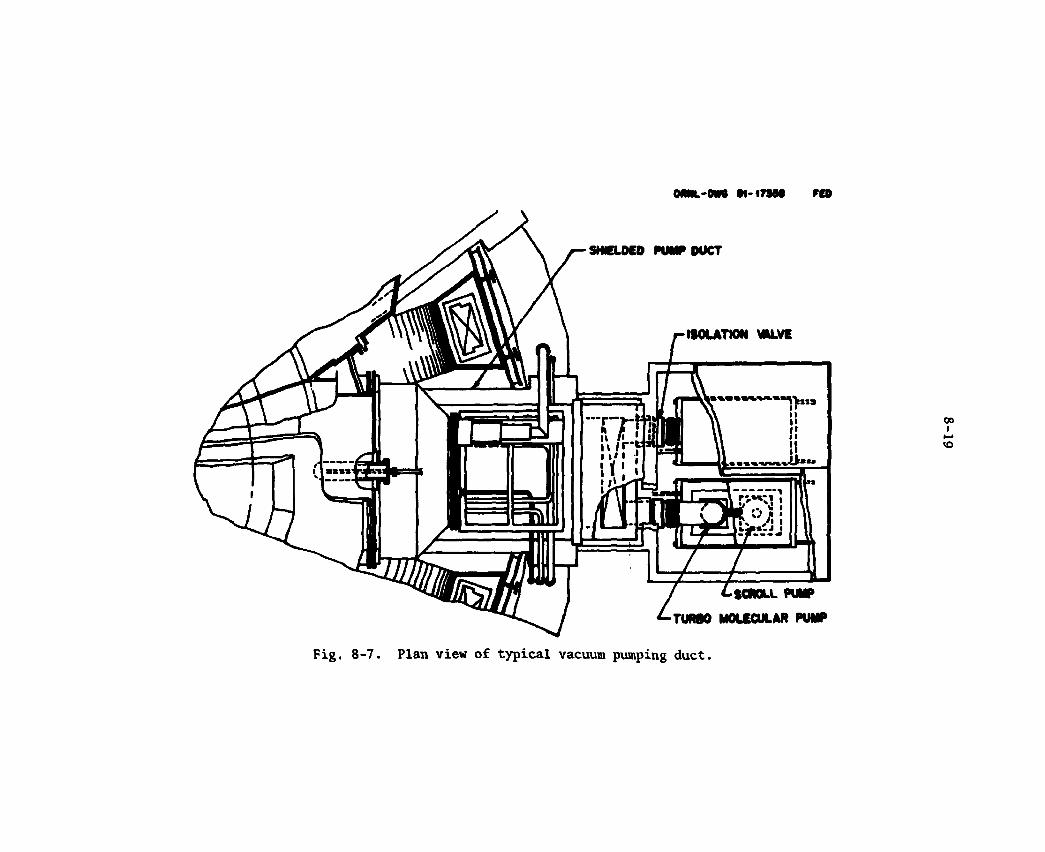
OMN.-OM M-I79M PCD
PUMP DUCT
SCROLL PUMP
TURBO MOLECULAR PUMP
vacuum pumping duct.
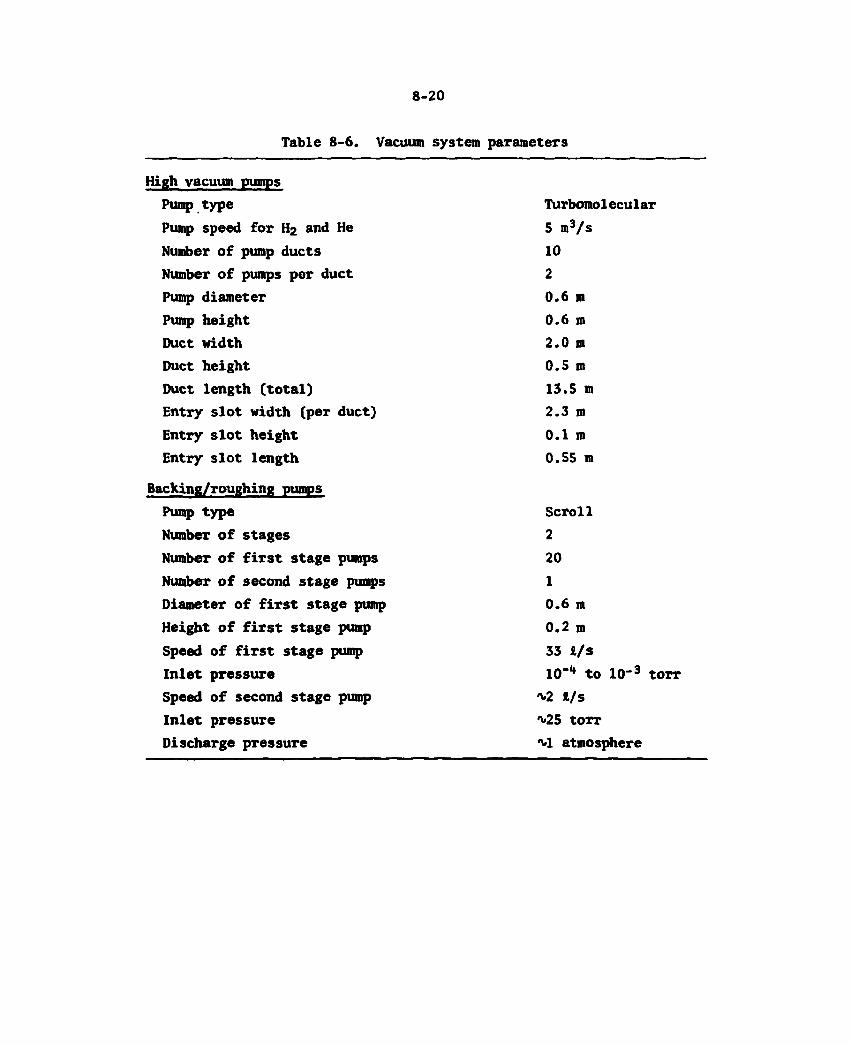
8 - 2 0
Table 8-6. Vacuum system parameters
High vacuum pumps Pump type Pump speed for H2 and He Number of pump ducts Number of pumps per duct Pump diameter Pump height Duct width Duct height Duct length (total) Entry slot width (per duct) Entry slot height Entry slot length
Backing/roughing pumps Pump type Number of stages Number of first stage pumps Number of second stage pumps Diameter of first stage pump Height of first stage pump Speed of first stage pump Inlet pressure Speed of second stage pump Inlet pressure Discharge pressure
Turbomolecular 5 m3/s 10 2
0.6 m 0.6 m 2.0 m 0.S m 13.5 m 2.3 m 0.1 m 0.55 m
Scroll 2 20 1 0.6 m 0.2 m 33 fc/s 10-1* to 10"3 torr
£/s ^25 torr
atmosphere

8-21
-7 below 10 torr. A first stage scroll pump backs each turbomolecular pump, exhausting at a pressure of about 25 torr. The exhaust from all 20 first stage pumps is combined and ducted to a single small second stage scroll pump that exhausts at about atmospheric pressure. Valves are included in the system to allow any pump to be removed without letting the vacuum system up to air. A small gate valve of 100 mm inside diameter is provided between the turbomolecular pump and the first stage scroll pump, with a 63 mm inside diameter valve provided at the outlet of each first stage scroll pump.
The turbomolecular pumps require magnetic shielding to reduce the magnetic field in the pump to 30-60 Gauss. A shielding cubicle is there-fore provided around the pump array at the end of each of the 10 vacuum ducts as shown in Fig. 8-6. This cubicle is made of plates of ingot iron 0.25-m thick that absorb the primarily poloidal field at the pump which ranges from 1 to 2 kGauss. The magnetic shielding encloses a space which measures 2.9-m long, 2.4-m wide and 2.8-m high. These dimensions appear to be more than adequate for housing the two turbomolecular and two scroll pumps.
8.2.3 Vacuum Pumping System Performance
The major performance parameters of the vacuum pumping system are 3 given in Table 8-7. The conductances, in m /s, of the entry slot and the ducts were calculated from the formula
F = 36.38 aA/f7M (8.2)
where a and A are the transmission probability and cross sectional area (m ), respectively, of the duct, and T and M are the temperature (K) and molecular weight (assumed to be 5 for a D-T mixture), respectively, of the gas. For the entry slot, the transmission probability was taken from Ref. 4, where it is tabulated as a function of the length-to-width ratio of the slot.
For the vacuum duct, which has many segments, the transmission probability was calculated from those of each of the n segments by the relationship
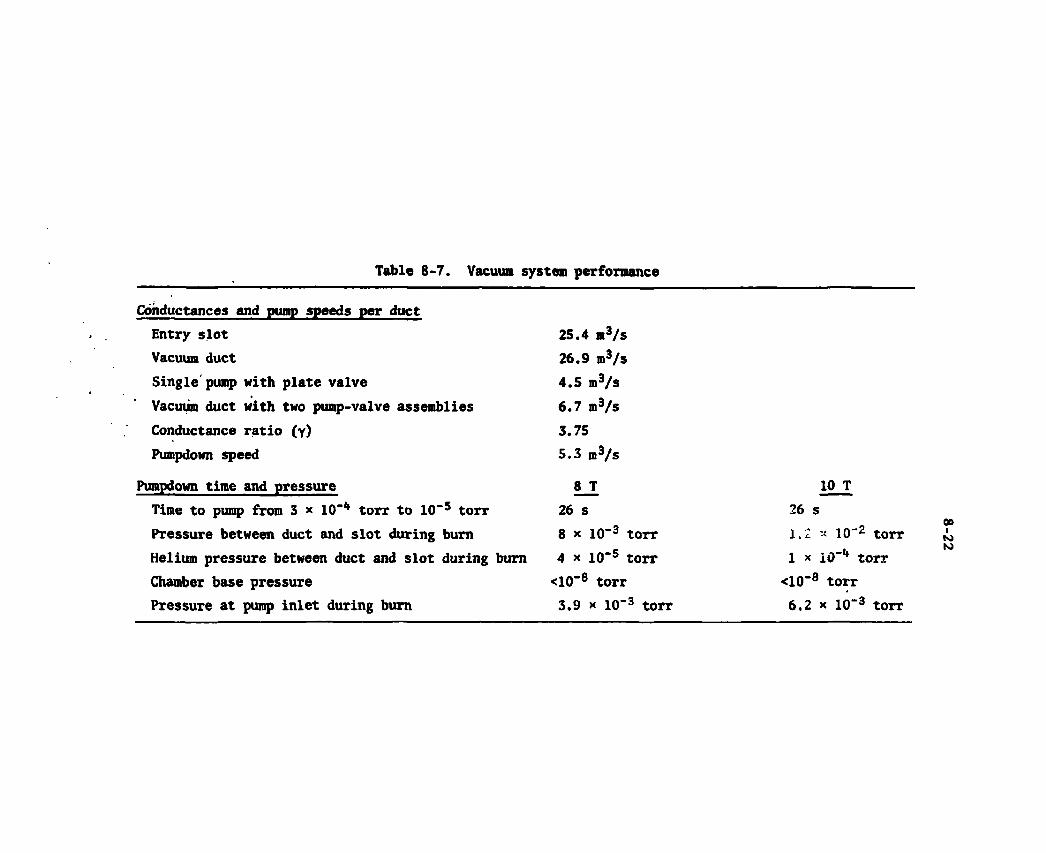
Table 8-7. Vacuum system performance
Conductances and pump speeds per duct Entry slot 25.4 m3/s Vacuum duct 26.9 m3/s Single pump with plate valve 4.5 m3/s Vacuum duct with two pump-valve assemblies 6.7 m3/s Conductance ratio (y) 3.75 Pumpdown speed 5.3 m3/s
Pumpdown time and pressure 8 T 10 T Time to pump from 3 * 10-lf torr to 10~5 torr 26 s 26 s Pressure between duct and slot during burn 8 x 10"3 torr 1=2 10"2 torr Helium pressure between duct and slot during bum 4 * 10~5 torr 1 * iO-4 torr Chamber base pressure <10"8 torr <10"8 torr Pressure at pump inlet during bum 3.9 x 10⁻³ torr 6.2 x io-3 torr
8 - 2 3
a a;1 - n • 1 (8.3)
The transmission probability for any segment, e.g., the ith segment, was calculated with the equation
where a, b and I are the width, height and length of the duct, K is a function of the ratio of b to a, tabulated in Ref. 5 and K" is a correc-tion factor which is a function of the ratio of the length to equivalent radius of the duct section:
The correction factor was calculated from Clausing's factor, K', as tabulated in Ref. 6, by the equation
where 4 and r are the length and radius of a tube of circular cross section. The correction factor K" varies from slightly less than 0.9 to 1.0, so that its inclusion provides a more conservative as well as a more accurate estimate of the transmission probability of the rectangular
The larger cross sectional area of the long duct very nearly compensates for its greater length, so that the slot and duct have approximately equal conductance for molecular flow of deuterium-tritium mixtures. The turbomolecular pumps have a pump speed much smaller than the conductance of the duct, and lower than the combined conductance of the duct, valves and pumps to 6.7 m'/s. The conductance of the valve and connection to the large rectangular duct was assumed to be 20 m'/s,
(8.4)
K" - f (4/aE7fl ) (8.5)
(8.6)
duct
8-24
which is equal to that of a plate valve with 500 nun inside diameter. Conductance of components were combined by adding those of components in parallel and taking the reciprocal of the sum of the reciprocals for components in series. The combined conductance of each duct with two valves and pumps is 0.27 of the conductance of the entry slot, well above the specified limit of 0.2.
The overall pump speed for each vacuum duct, including the conductance of the entry slot and the pump duct and the speed of the individual 3 pumps, is 5.3 m /s, indicating that the total speed of the 10-duct
3 system is 53 m /s. This allows the torus to be pumped down in 26 s between burns if there is no outgassing of the chamber walls. In the case of pumpdown between burns, it is not clear whether there will be any outgassing of the walls, or whether the walls will have been cleaned sufficiently during the burn that they v;i:I act as a sorption pump, increasing the rate of pumpdown.
The pressure6 at the junction between the entry slot and the vacuum duct, where the plasma scraped off below the limiter is neutralized, was
22 - 1 calculated from the molecular flux of 1.25 x 10 s and the combined conductance of ten ducts, each with two pump-valve assemblies. The cal-_3 culated pressure of 8 x 10 torr is approximately the same as that given
_2 in Ref. 6 (10 torr). The partial pressure of helium was calculated 19 -1 similarly using the helium generation rate of 6.4 * 10 s .
Since the requirement for a preshot base pressure is not firmly established, calculations were made with Eq. 8-1 to determine the variation of pumpdown time with preshot pressure. As shown in Fig. 8-8, the pumpdown time will be increased to only 60 s if the preshot base _7 pressure is reduced to 10 torr.
The base pressure for the plasma chamber was calculated to be less - 8
than 10 torT on the basis of a conservative estimate of the outgassing of the walls of the plasma chamber. The gas source was assumed to be stainless steel with a surface area equal to 10 times the surface area of the chamber given in Table 8-5. The outgassing rate for stainless
-7 -1 -2 steel was assumed to 10 mbar I s m .
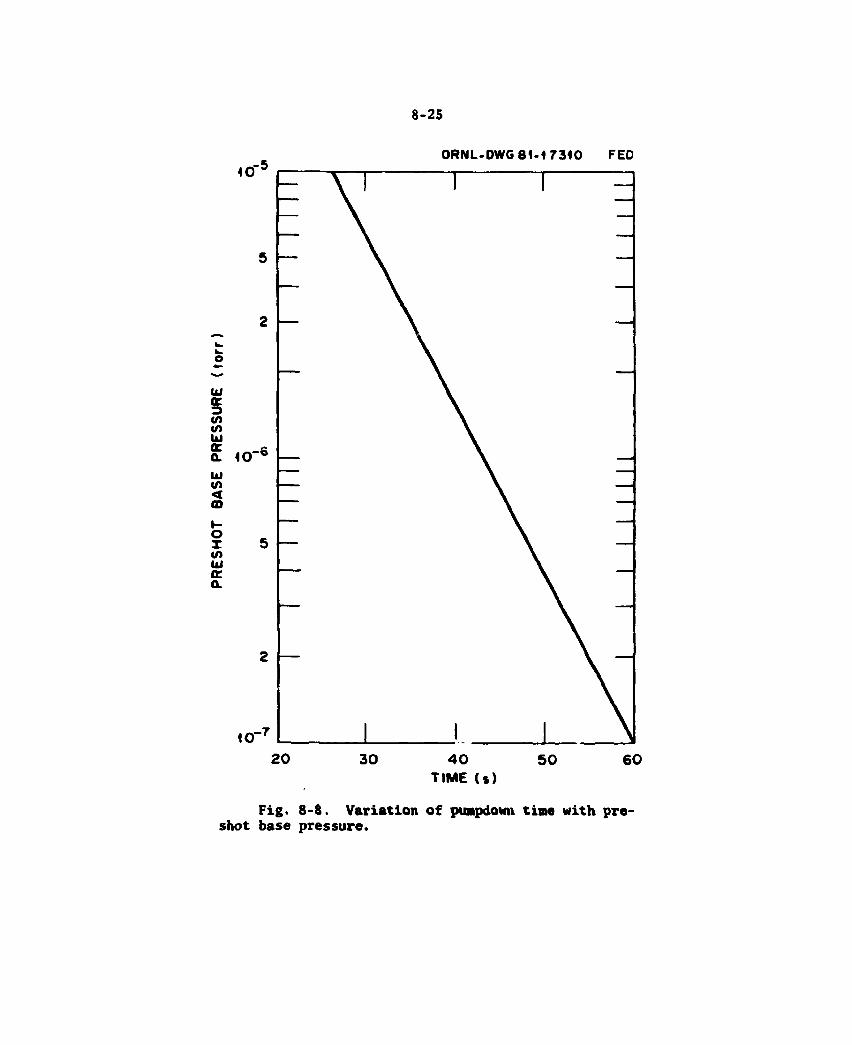
8-25
ORNL-DWG 8 1 - 1 7 3 1 0 FED
T IME ( s )
F i g . 8 - 8 . V a r i a t i o n o f puapdown t ime w i t h p re -shot base pressure.

8-26
Operation at 10 T does not affect the pumpdown time of the chamber since the pre- and post-shot pressures are the same as for 8-T operation. The particle flux to be pumped and the helium generation rate are both increased, however, which causes pressures below the pump limiter to increase.
The pumping requirements during burn are somewhat more demanding than can be met by turbomolecular pumps currently on the market. In particular, the pump speeds of available turbomolecular pumps are sub-
-3 -2 stantially degraded in the 10 to 10 torr range, which is the FED operating condition during burn. Therefore, it will be necessary to either modify an existing pump (such as the Balzers TPH 5000) to maintain its capacity during burn, or to develop a larger capacity pump which operates efficiently in this higher pressure range.
8.2.4 Vacuum Pumping System Design Options and Basis for Selection
The principal selections made in the design of the pumping system were the selection of the pumps to be used for high vacuum and for fore-pumping and roughing of the pAasma chamber. These choices are constrained by the presence of tritium in the vacuum system and the requirement for a relatively high pump speed.
High vacuum pump
Turbomolecular pumps and compound cryopumps were the main alternatives considered for the' high vacuum stage. A mercury diffusion pump was not considered seriously because of concern with mercury contamination of the plasma chamber.
Compound cryopumps, which remove most gases by cryocondensation and contain a sorption stage to remo"<> helium, can easily be made with high enough pump speed for the FED and are readily scalable to larger sizes. This type of pump was selected for the ETF,1 and three pumps of this type, each with a different cryosorbent, are being tested in the Tritium Systems Test Assembly (TSTA).7 While some development would be required for cryopumps, their feasibility has been well demonstrated. An important
8 - 2 7
drawback of xhe cryopuraps is the tritium inventory that accumulates within them between regenerations. This characteristic raises safety concerns and may require that containment structures be provided to protect against a release of tritium. Also, the compound cryopumps would have to be regenerated frequently to limit the tritium inventory present. This would lead to frequent cycling of vacuum valves, which in turn would increase valve wear.
Turbomolecular pumps are presently limited to lower pump speeds than cryopumps. The largest pump that is commercially available has
3 3 a speed of 5 m /s for air and 6.2 m for hydrogen and helium. This is an adequate size for the FED; however, manufacturers of turbomolecular pumps see no difficulty in producing pumps of higher speed, such as 20 m /s.8 The size of commercially available turbomolecular pumps seems to be limited by the lack of a market for larger pumps.
Turbomolecular pumps were selected for the Tokamak Fusion Test Reactor (TFTR),9 with modifications made in a commercial pump design to allow it to be used with tritium. One concern associated with the use of turbomolecular pumps is contamination of the pump's bearing lubri-cation oil with tritium. Such contamination can be eliminated by using a fluorocarbon oil, as long as the oil does not lead to any fluoride corrosion of the pumps. It also appears feasible to use a mineral oil and replace the oil fairly frequently as it becomes contaminated with tritium. This is the procedure that will be used in the TFTR.9
Turbomolecular pumps were selected over compound cryopumps primarily to reduce the tritium inventory available for potential release into the torus vessel or reactor building in the event of an accident. The more relaxed pumping requirements for the FED limiter as compared with the ETF divertors make turbomolecular pumps a feasible choice for this application.
Backing/roughing pumps
Turbomolecular pumps are usually backed by a rotary vane 'jump or a Roots pump backed by a rotary vane pump. Use of either of these pumps in FED, however, would be expected to lead to tritium contamination of
8 - 2 8
bearing lubricants, due to the relatively high tritium pressures in the second and third stage pumps. One method of avoiding the problem has been tested for the TSTA.7 This approach entailed: (a) a Roots pump specially equipped with ferrofluidic seals to isolate the bearings, and (b) use of a metal bellows pumps, which is a completely sealed unit, to back the Roots pump. An alternative to this that has also been tested for TSTA is a scroll pump backed by a metal bellows pump. The scroll pump, which employs a wobble rather than a rotary drive, is also a sealed unit with no bearing lubricant exposed to tritium. The experience with the ferrofluidic bearing at TSTA has been unsatisfactory, but the performance of the scroll pump has been excellent.10 As a result, scroll pumps were selected as backing pumps. The scroll pump was selected over the metal bellows pump for the final stage of recompression to atmospheric pressure because the metal bellows pumps are quite limited in capacity, so that several would have been needed.
8.2.5 Future Work — Vacuum Pumping System
Further effort is needed in the design and performance evaluation of scroll pumps for the FED application. The two approaches to be consider-ed are: (a) a scaleup of the scroll gas transfer pump of Arthur D. Little and (b) the identification of modifications, if any, needed in the
x 600 m /h bellows-scroll pump of Normetex*, which is about the required size. It will also be necessary to identify all modifications to the i 'omolecular pump that are necessary to qualify it for tritium service
:o facilitate its remote maintenance, repair, and replacement. Outgassing of the plasma chamber, including the first wall, armor,
and joints between torus sectors, also requires more detailed study. This is needed to determine bakeout requirements and provide an estimate of the _7 time required to pump the chamber down to 10 torr initially and after each exposure to air.
* Societe Normetex, S.A., 13 Rue de la Brasserie, Pont Audemer, France.
8 - 2 9
8.3 TRITIUM SYSTEMS
The FED tritium systems have three primary purposes. The first is to provide new and/or recycled tritium and deuterium fuel for the reactor. The second purpose is to provide state-of-the-art tritium handling to limit worker radiation exposure and to minimize tritium losses to the environment. The final major objective is to provide an integrated system test of the tritium handling technology necessary to support the fusion reactor program. Every effort is being made to incorporate available information from the Tritium Systems Test Assembly (TSTA) at Los Alamos National Laboratory, the Tokamak Fusion Test Reactor (TFTR) tritium systems, and the tritium handling information generated within the Department of Energy (DOE) for the past 20 years.
8.3.1 Tritium System Design Requirements
Table 8-8 lists key tritium parameters for 8-T and 10-T operation. The most important design requirement for the FED tritium system is the throughput of the primary fuel cycle, which is identified in Table 8-8 as "Particle Flux Pumped." For 8-T operation, the indicated particle flux pumped leads to a steady-state D-T flux of 0.306 standard temperature and pressure (STP) liters sec" for consecutive pulses of 100-s b u m time and 152-s cycle time. In the case of 10-T operation, the steady-state flux would be 0.365 STP liters sec-1 for consecutive pulses of 50-s burn time and 102-s cycle time.
The amount of tritium consumed is a function of the burn fraction and the reactor throughput. Tritium consumption of 1.4 kg/year for 8-T operation and 2.6 kg/year for 10-T operation have been calculated ass'uning 20% reactor availability.
The composition of the reactor exhaust is expected to be 48.5% T2, 48.5% D2, 0.5% 02> 0.5% N2, 1% CD4 or CT4, and 1% He. Other possible compounds include T20, D20, ND^, NT^, and their hydrogen isotopic mixes. Deuterium and tritium should be returned to the reactor 99+% isotopically pure with the balance being the other species (i.e., 99% T/1% D, 99% D/1% T). The tritium system will have a tritium inventory of 825 g for continuous 8-T operation or 1470 g for continous 10-T operation. These levels are driven by the need to mai- tain a 30-day b u m inventory.
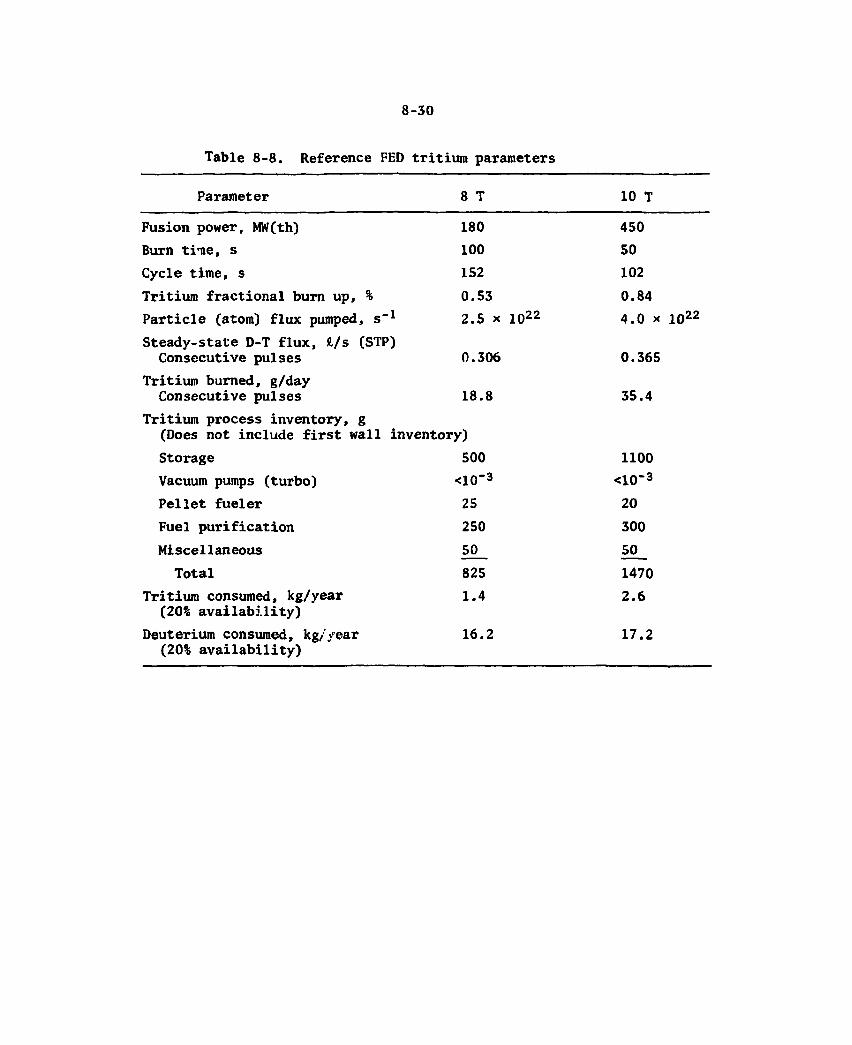
8 - 3 0
Table 8-8. Reference FED tritium parameters
Parameter 8 T 10 T
Fusion power, MW(th) 180 450 Burn tine, s 100 50 Cycle time, s 152 102 Tritium fractional burn up, % 0.53 0.84 Particle (atom) flux pumped, s"1 2.5 x io22 4.0 x io22
Steady-state D-T flux, «,/s (STP) Consecutive pulses 0.306 0.365
Tritium burned, g/day Consecutive pulses 18.8 35.4
Tritium process inventory, g (Does not include first wall inventory) Storage 500 1100 Vacuum pumps (turbo) <10~3 <10~3
Pellet fueler 25 20 Fuel purification 250 300 Miscellaneous 50 50
Total 825 1470 Tritium consumed, kg/year 1.4 2.6
(20% availability) Deuterium consumed, kg//ear 16.2 17.2
(20% availability)
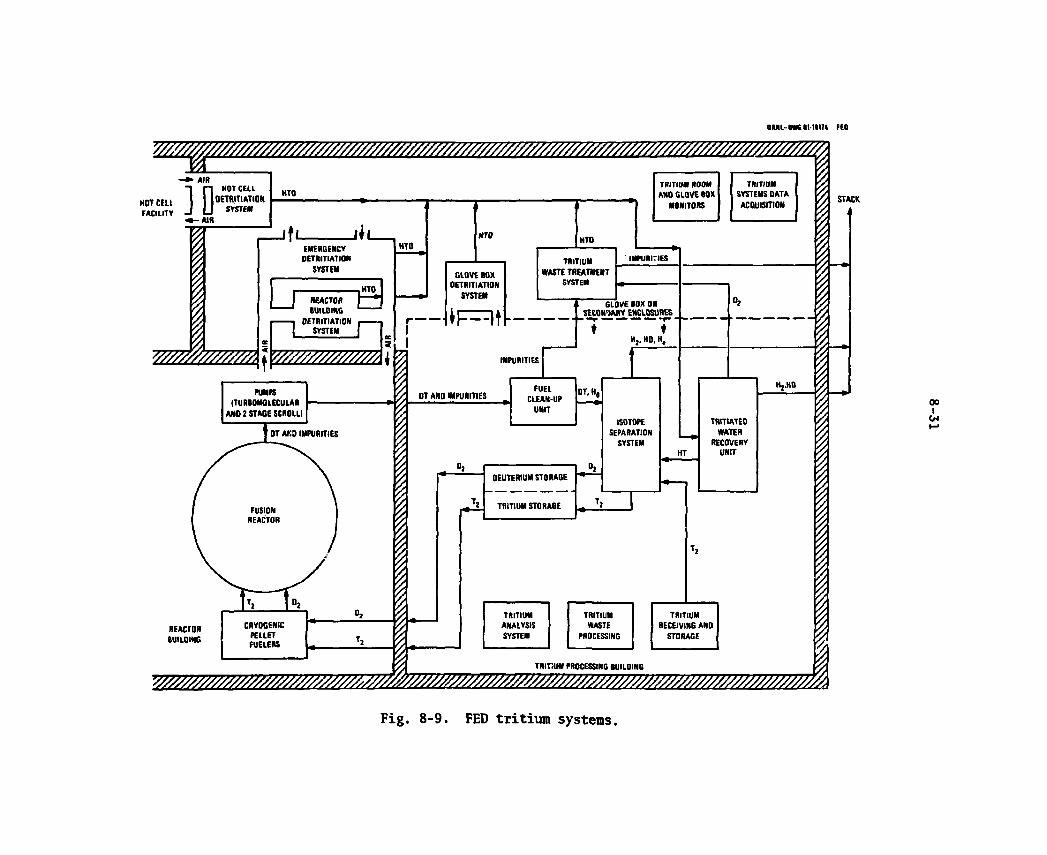
OML-MGIIUtM FED
HOT C M FACILITY
AIR
10 HOT CEIL
OETMTIATION SYSTEM
-AIR
HTO
r fi EMERGENCY OETRITIATION
SYSTEM
REACTOR • niinmr 11 • •
REACTOR WILDING
OETRITIATION SYSTEM
V / / / / / / / / / / / / / / / A
HTO
TRITIUM ROOM TRITIUM AND GLOVE (OX SYSTEMS DATA
MONITORS ACQUISITION
HTO
GLOVE BOX OETRITIATION
SYSTEM
HTO
TRITIUM WASTE TREATMENT
SYSTEM
' IMPURITIES
GLOVE SOX OR SICON ENCLKURES •
HJ. HO, H,
IMPURITIES
PUMPS (TURBOMOLECULAR
AND 2 STAGE SCROLLI
DT AND IMPURITIES FUEL
CLEAN-UP UNIT
OT.H,
DEUTERIUM STORAGE
TRITIUM STORAGE
ISOTOPE SEPARATION
SYSTEM HT
TRITIATED WATER
RECOVERY UNIT
TRITIUM ANALYSIS SYSTEM
TRITIUM WASTE
PROCESSING
H2.HO
TRITIUM RECEIVING AND
STORAGE
TRIT:UM PROCESSING BUILOING
STACK
Fig. 8-9. FED tritium systems.

8 - 3 2
Release of tritium to the environment, both operating and accidental will be minimized ?nd will in no case exceed the legal limit. Tritium
3 levels in all buildings will be maintained below 500 yCi/m , except during an accidental release. The release of tritium from the plant from all sources will be <20 Ci/day averaged over routine operation, maintenance and in-plant accidental releases.
8.3.2 Tritium System Design Description
Figure 8-9 illustrates the FED fuel cycle and tritium system. The system is designed to process a steady-state flux of 0.306 STP liters
which corresponds to continuous operation with 8-T pulses. The system can also be made to handle a limited number of consecutive 10-T pulses (50-100) by utilizing surge storage located in the Fuel Clean-up Unit. Consecutive 10-T pulses can also be handled if an additional 20 s downtime between pulses is incorporated (i.e., 50-s burn time, 122-s cycle time). Addition of more surge tank storage, as part of a system upgrade, would allow up to one week of consecutive 10-T pulses with a 102-s cycle time.
The tritium systems can be logically subdivided into four categories: Primary Fuel Cycle, Secondary Systems, Building Detritiation Systems, and Tritium Systems. Data Acquisition. Each of these elements will be described in the following subsections.
Primary fuel cycle
The primary tritium fuel cycle takes the reactor exhaust from the vacuum pumping system and routes it to the Fuel Clean-up Unit (FCU). The FCU removes all impurities except helium to below 1 ppm total so that it becomes suitable feed for the Isotope Separation System (ISS), shown in Fig. 8-10. The ISS separates the deuterium and tritium isotopically by cryogenic distillation. A third stream from the ISS containing protium, some deuterium and helium is released to the stack if it contains a sufficiently low amount of tritium. If not, it is routed to the Tritiated Water Recovery Unit for further tritium stripping. The deuterium and
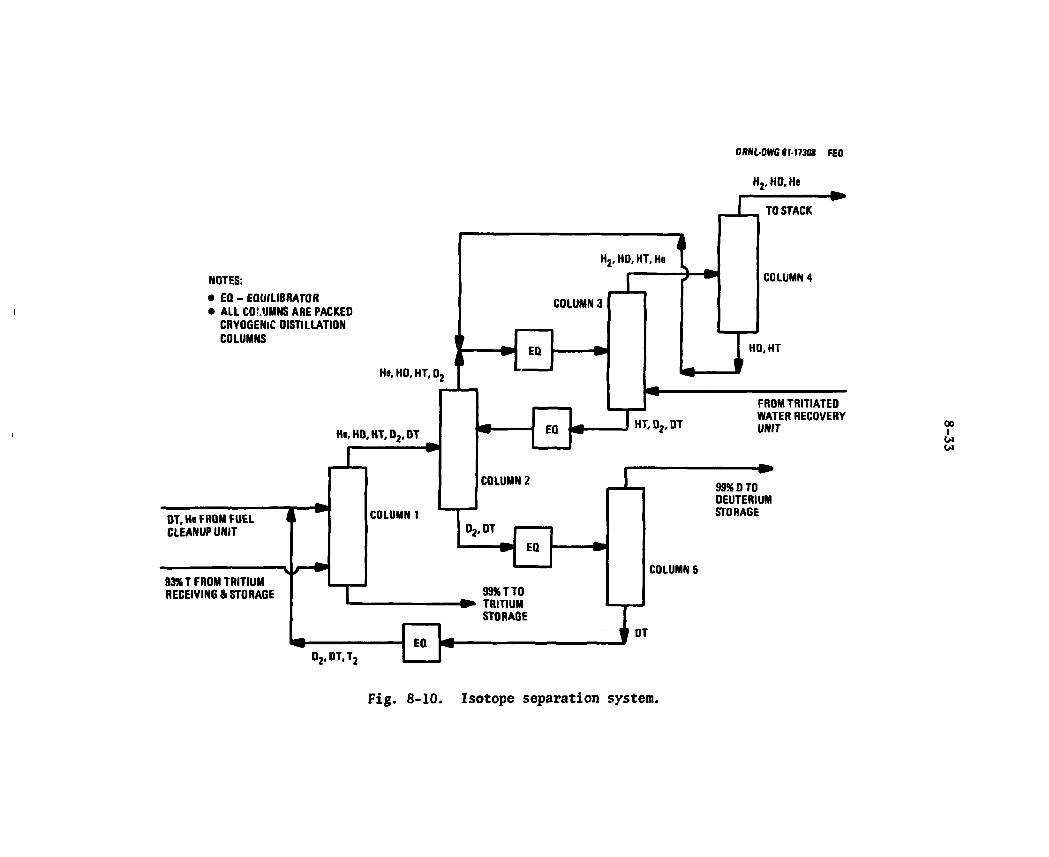
ORNL-OWG <1-17308 FEO
NOTES:
• EQ - EQUILIBRATOR • ALL CO! MMNS ARE PACKED
CRYOGENIC DISTILLATION COLUMNS
He, HO, HT, 02
He, HO, HT, 0 2 , DT
OT, He FROM FUEL CLEANUP UNIT
93% T FROM TRITIUM RECEIVING & STORAGE
COLUMN 1
H2, HD, HT, He T
COLUMN 3
EQ
H2,HD,He
J TO STACK
COLUMN 4
^ HD, HT
HT, D2, DT
FROM TRITIATED WATER RECOVERY UNIT
COLUMN 2
D2,DT
EQ
99% T TO TRITIUM STORAGE
99% D TO DEUTERIUM STORAGE
COLUMN 5
EQ , * O2,OT,T2
EQ OT
Fig. 8-10. Isotope separation system.

8-34
tritium that is 99% isotopically pure and 99.99% elementally pure is stored as a metal hydride before being recycled to the cryogenic pellet fuelers and subsequently to the reactor. New tritium to replace that burned up in the reactor is brought into the Tritium Processing Building in approved shipping containers and unloaded in the Tritium Receiving and Storage system. This system also supplies limited storage for the new tritium awaiting processing in the ISS. It is doubtful that this new tritium could be used directly in the reactor without isotopic purifica-tion. Also considered part of the primary fuel cycle is the Tritium Analysis System (TAS). The TAS will have the ability to analyze all important tritium streams both isotopically and elementally to support both process control and accountability. This system will include a mix of on-line dedicated instruments and centrally located shared instruments.
Secondary systems
The FED will incorporate secondary and teriary tritium containment to minimize worker exposure and limit environmental tritium releases. The Secondary Systems and the Building Clean-up Systems are used to fulfill these goals as well as to minimize the tritium fuel loss from the primary fuel loop. All primary fuel cycle components will incorporate secondary containment with higher risk components utilizing tertiary containment.
The Tritium Waste Treatment (TWT) system takes the impurity load from the Fuel Cleanup Unit and removes the last traces of tritium before releasing the impurities to the stack. This system uses hydrogen oxidation/water adsorption to effectively remove the tritium. It is similar to systems planned for TSTA and TFTR.
The Glovebox Detritiation System (GDS) is similar to the TWT but its primary function is to detritiate glovebox and secondary enclosure atmospheres, whether in a recycle mode or in a purge mode. Both the Tritium Waste Treatment System and the Glovebox Detritiation System will produce tritiated water as a byproduct but the TWT water will have a much higher tritium concentration. The GDS will also be used to ventilate temporary maintenance enclosures within the Tritium Processing Building

8-35
to further reduce tritium effluents. Because the TWT and GDS are similar they will provide a redundant capability.
As mentioned previously both the TWT and GDS will produce tritiated water in quantitites unacceptable for release. In addition, large quantities of tritiated water will be produced by the Building Detritiation Systems discussed in the following section. A third possible source of tritiated water is the reactor first wall coolant loop. All of this tritiated water will be processed in the Tritiated Water Recovery System (TWR). This system, shown in Fig. 8-11, will utilize the Combined Electrolysis Catalytic Exchange technology being developed at Mound Facility and also cryogenic distillation to recover all the tritium and return it to the primary fuel cycle.
The final secondary system-is the Tritium Waste Processing System (TWP). This system will provide the capability to package all tritiated wastes in containers suitable for disposal at commercial sites.
Building detritiation systems
The Building Detritiation Systems provide primary tritium containment in the Hot Cell Facility, secondary containment in the Reactor Building, and tertiary containment in the Tritium Processing Building. In addition, an added emergency capacity is available for the Reactor Building.
The Hot Cell Detritiation System (HCD) is used to continuously remove tritium that is outgassing from items in the hot cell. An example might be a torus segment that could contain up to 30 g of tritium imbedded in the first wall. This system was sized to handle a continuous tritium release of 100 Ci/day while maintaining the hot cell atmosphere at
3 500 yCi/m , and at a pressure negative to the outside.
The Reactor Building Detritiation System (RBD) illustrated in Fig. 8-12 is similar to the HCD. Its primary purpose, however, is to provide secondary containment for the reactor itself. The RBD also pro-vides for component offgassing during maintenance of the torus. This system was sized to handle a continuous tritium release of 100 Ci/day 3 while maintaining the reactor building atmosphere at 500 yCi/m and at a pressure negative to the outside.
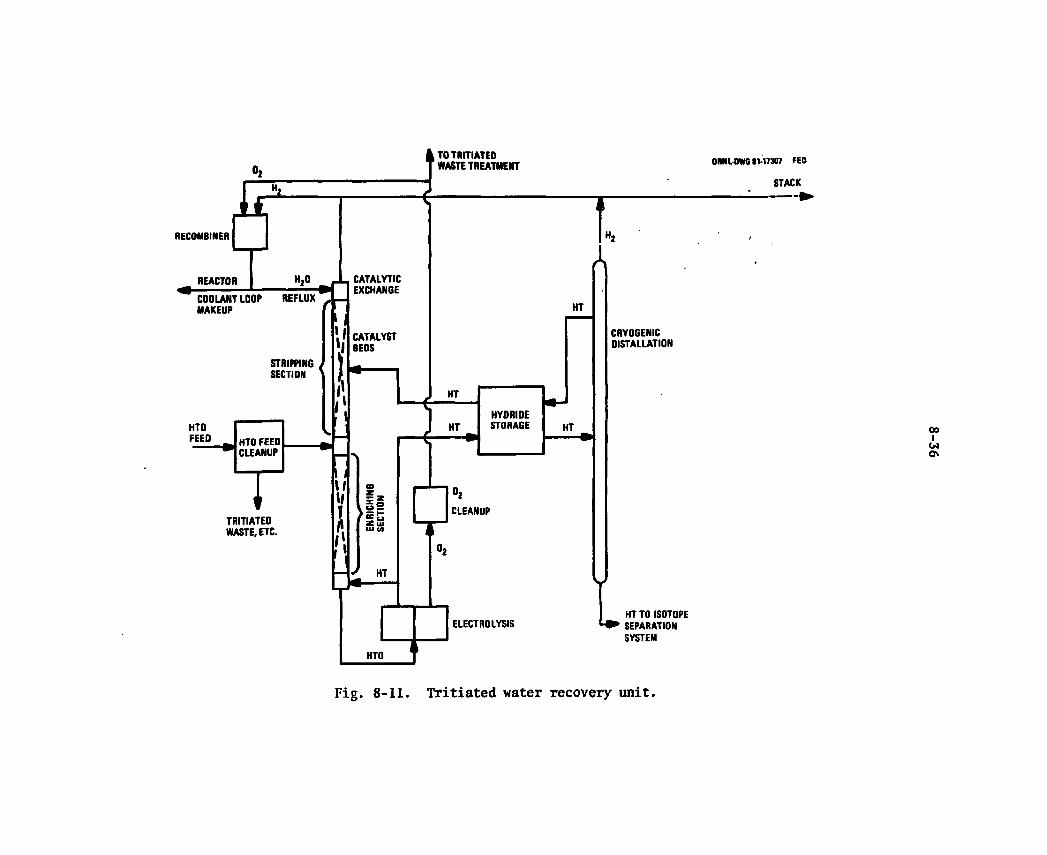
oo w o
Fig. 8-11. Tritiated water recovery unit.
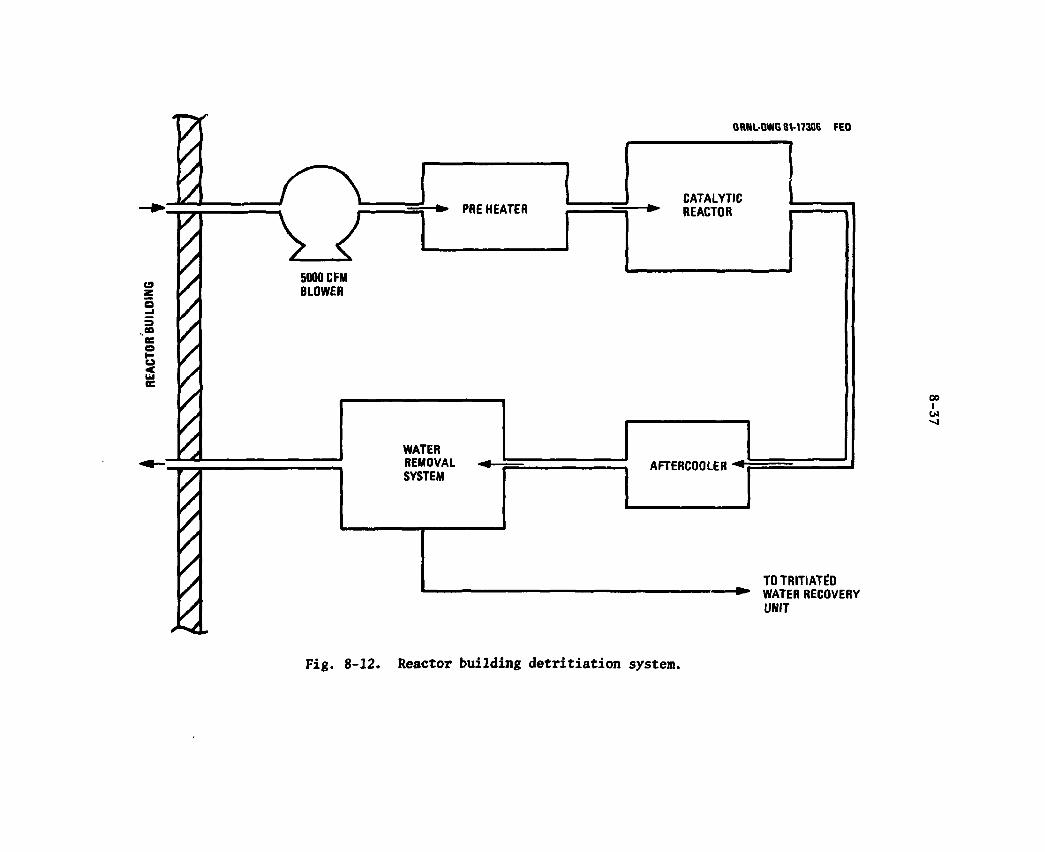
E f
1
T T / * / / / S
ORHI-OWG8V173Q6 FED
2 / / /
5000 CFM BLOWER
CATALYTIC CATALYTIC — » PRE HEATER KtAClUK KtAClUK
WATER REMOVAL SYSTEM
AFTERCOOLER
00 1 w
TOTRITIATED * WATER RECOVERY
UNIT
Fig. 8-12. Reactor building detritiation system.
8-38
The third building detritiation system is the Emergency Detritiation \ System (EDS). This system is similar to the HDC and RBD with twice the capacity of either. It seems likely that four nearly identical systems would be procured at approximately 5000 CFM each. The EDS would operate only if a large release of tritium were to occur in the reactor building or in the tritium processing building. The system capacity could also be split in the unlikely event of simultaneous releases. For a single release of 25 g (pellet fueler inventory) in the reactor building, result-
3 ing in an initial tritium concentration of 2.2 Ci/m , the EDS along with
3 the RBD could reduce the tritium concentration to 5 uCi/m in about 60 hours. For a more likely release of 1 g in the reactor building, with an 3 initial tritium concentration of 0.09 Ci/m , 45 hours would be necessary
3 to reduce the level to 5 yCi/m .
Also considered part of this subdivision are the Tritium Room and Glovebox Monitors. Room or ventilation monitors will be used to trigger the EDS. More monitors are expected to be of the ion chamber type with centrally located display and recording capability. Areas to be monitored include the hot cell facility, the reactor building, the tritium process-ing building, all gloveboxes, and adjoining "cold" areas. All stack and other release points will be monitored by real time ion chamber monitors as well as integrating "bubble" type monitors.
Tritium system data acquisition
The purpose of this system is to accurately measure performance parameters and provide control of components, subassemblies, and the tritium systems as a whole; to assure adequate safeguarding and account-ability for the large tritium inventory; and to provide alarms for "out-of-limit" processes and conditions. This system must also interface with the larger FED central computing facility but at the same time be capable of acting independently of further supervisory control.
8.3.3 Tritium System Design Options
The FED tritium systems use technology that has been developed within the DOE foT the past 20 years. Many of the system components were chosen based on this experience and upon demonstrated performance.
8-39
The FED Primary Fuel Cycle is modeled on the work now in progress at the Tritium Systems Test Assembly (TSTA) at Los Alamos. It is the charter of the TSTA to demonstrate an integrated fusion fuel-handling system. The Fuel Clean-up Unit (FCU) currently being constructed for TSTA will use two alternate methods for removing impurities from the plasma exhaust. The method deemed superior by TSTA will be recommended for use in FED. Cryogenic distillation is generally accepted as the only proven technology for separating large quantities of isotopically mixed hydrogen. Thermal diffusion and, to some extent, palladium chromatography have been used to separate hydrogen isotopes, but only in much smaller quantities than those expected for FED. Metal hydride storage has been chosen for large quantities of tritium and deuterium contaminated with tritium. This method is planned for TSTA and TFTR and is generally preferred by DOE tritium-handling sites.
There are several methods currently in use or being investigated for the removal of tritium from water. The Combined Electrolysis Catalytic Exchange process, now the front end of the Tritiated Water Recovery Unit, appears to be the best choice for FED. This, however, may change vrnen tritiated water sources and quantities are better defined.
The basic process for the Tritium Waste Treatment System, Glovebox Detritiation System, and the three building detritiation systems is the same. This process oxidizes the tritium to water and then collects the water. There is no other proven technology to accomplish the removal of dilute tritium from air or air-contaminated gases. The basic process can, however, be optimized by choice of oxidizing catalyst and choice of water removal technique.
8.3.4 Future Work — Tritium Systems
There are several tritium issues that remain to be resolved. One of the most important of these is permeation of tritium through the first wall into the coolant. This has a potentially large effect on the size of the Tritiated Water Recovery Unit and could impact the cost of this system significantly. Conversion of HT to Hit) during a release is "
8-40
another major issue to be resolved. This could impact the sizing of the building detritiation systems and could potentially add to the cost of the buildings. A better understanding of the torus exhaust impurity content will encourage a more complete design for the Fuel Clean-up Unit and will better define the concentration of tritium in the water produced in the Tritium Waste Treatment system. The physical dimensions of the tritium systems must be more closely estimated to permit further development of a floor plan for the Tritium Processing Building and determination of the associated cost.
A preliminary safety analysis for the tritium system should be carried out to uncover any safety related issues that should be addressed in the conceptual design. For systems as complex as these, an orderly analysis is needed. Also, maintenance procedures should be reviewed, as they become available, to insure that they will not cause undue occupa-tional exposure or environmental release.
8.4 REFRIGERATION SYSTEM
8.4.1 Major Design Considerations
Function su—ary
The refrigeration system for the Fusion Engineering Device must be designed to produce and transfer cryogens at a sufficient rate to sustain normal operation of the reactor. The only cryogenic requirements for the baseline design of FED are those for the magnetic systems.
A second function which the refrigeration system must be capable of providing, is the cooldown of the cold mass of the device in a reasonable amount of time.
Requirements su—ary
The cryogenic load for the magnetic systems is complex, consisting of losses removed by (a) circulating superfluid and supercritical helium through the toroidal field windings, (b) circulating supercritical helium at different temperatures through the inside of the toroidal
8-41
field coil cases and the intercoil structures, and (c) pool-boiling of atmospheric pressure helium in the poloidal field coils and cases. A summary of the loads is presented in Table 8-9. The refrigerator design is determined by the loads for the 10-T mode of operation, since these loads are larger than those for the 8-T scenario for all systems. Since the coolant has significantly different inlet and outlet thermodynamic states for each of the cryogenic loads, the only common basis for compari-son of the loads is the rate of entropy generation,11 which is shown in the table. The single largest refrigerator load is that generated in the winding of the TF coils, but the winding losses, case losses, and intercoil structure losses of the toroidal field system are all significant. The entropy generation of the FED system load is several times higher than that of any existing or planned cryogenic refrigeration facility in the world, being 2.8 times larger than that projected for the ISABELLE intersecting storage ring accelerator at Brookhaven,12 which is currently the largest planned refrigeration system.
The refrigerator design presented here includes the requirement of removing 18 W from the hottest channel of the toroidal field coil. This requirement was imposed to include a factor of three margin on the 6 W average channel heat load to account for peaking in the hot channel. This led to the necessity for the use of superfluid helium at the coil inlets. This option has several interesting features as explained below. However, since the use of superfluid helium in forced-flow conductors is unprecedented, a more refined estimate of the heat loads and redesign of the channels was initiated in order to demonstrate the feasibility of cooling entirely with supercritical helium. The average channel heat load was reduced to 4.2 N and the hot channel heat load was calculated to be 6.5 W. Using the 6.5 W as the basis for establishing coolant flow conditions, instead of the 18 N previously used, resulted in an inlet temperature of 2.2 K instead of the 1.8 K previously calculated. Thus, although the baseline refrigeration system is based on the earlier specifications and features superfluid helium TF coil inlet conditions, the more refined calculation demonstrates that the use of superfluid helium nay be avoidable.
Paradox ica l ly , although the o v e r a l l heat load has been reduced i n
the more r e f i n e d c a l c u l a t i o n s , r e f r i g e r a t i o n requirements a re not
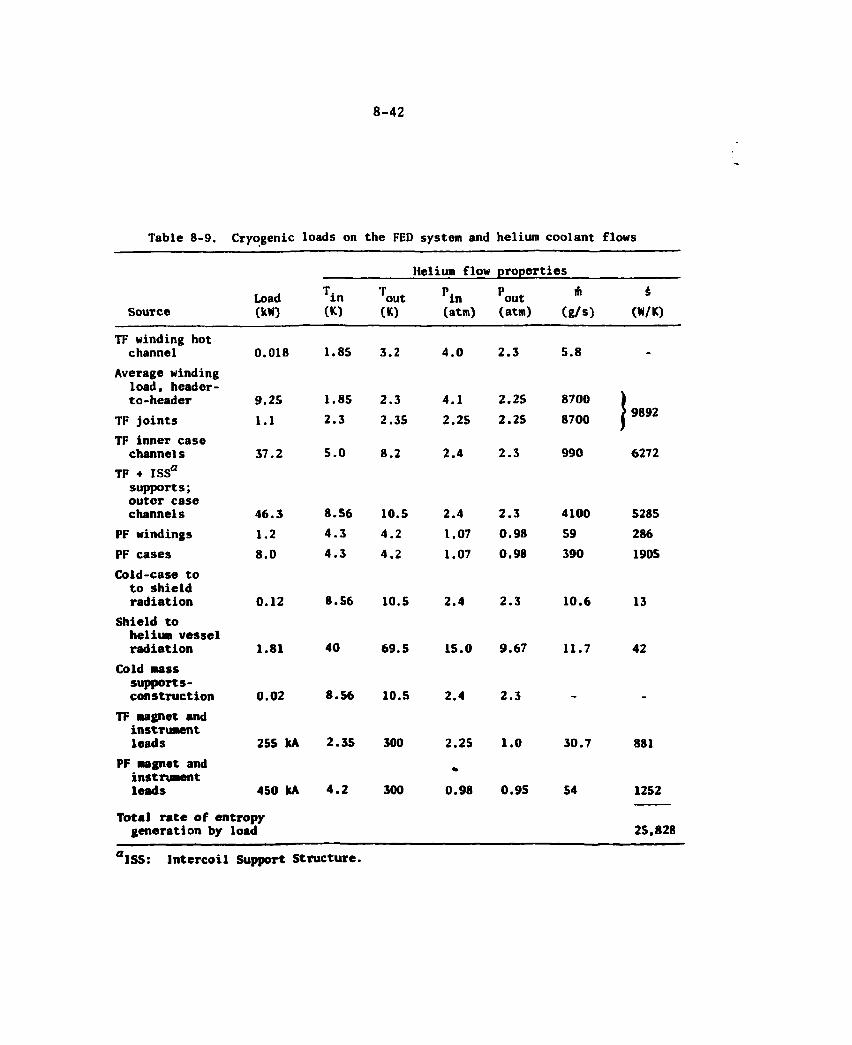
8-42
Table 8-9. Cryogenic loads on the FED system and helium coolant flows
Helium flow properties
Load Tin Tout Pin Pout m 5
Source (kW) (K) (K) (atm) (atm) (g/s) (W/K)
TF winding hot channel 0.018 1.85 3.2 4.0 2.3 5.8
Average winding load, header-to-header 9.25 1.85 2.3 4.1 2.25 8700 I
TF joints 1.1 2.3 2.35 2.25 2.25 8700 J 9 8 9 2
TF inner case channels 37.2 5.0 8.2 2.4 2.3 990 6272 TF • ISSa
supports; outer case channels 46.3 8.56 10.5 2.4 2.3 4100 5285
PF windings 1.2 4.3 4.2 1.07 0.98 59 286 PF cases 8.0 4.3 4.2 1.07 0.98 390 1905 COld-case to
to shield radiation 0.12 8.56 10.5 2.4 2.3 10.6 13
Shield to helium vessel radiation 1.81 40 69.5 15.0 9.67 11.7 42
Cold Mass supports-construction 0.02 8.56 10.5 2.4 2.3
TF magnet and instrument leads 255 kA 2.35 300 2.25 1.0 30.7 881
PF magnet and „ instrument leads 450 kA 4.2 300 0.98 0.95 54 1252
Total rate of entropy generation by load 2S.828
°1SS: Intercoil Support Structure.
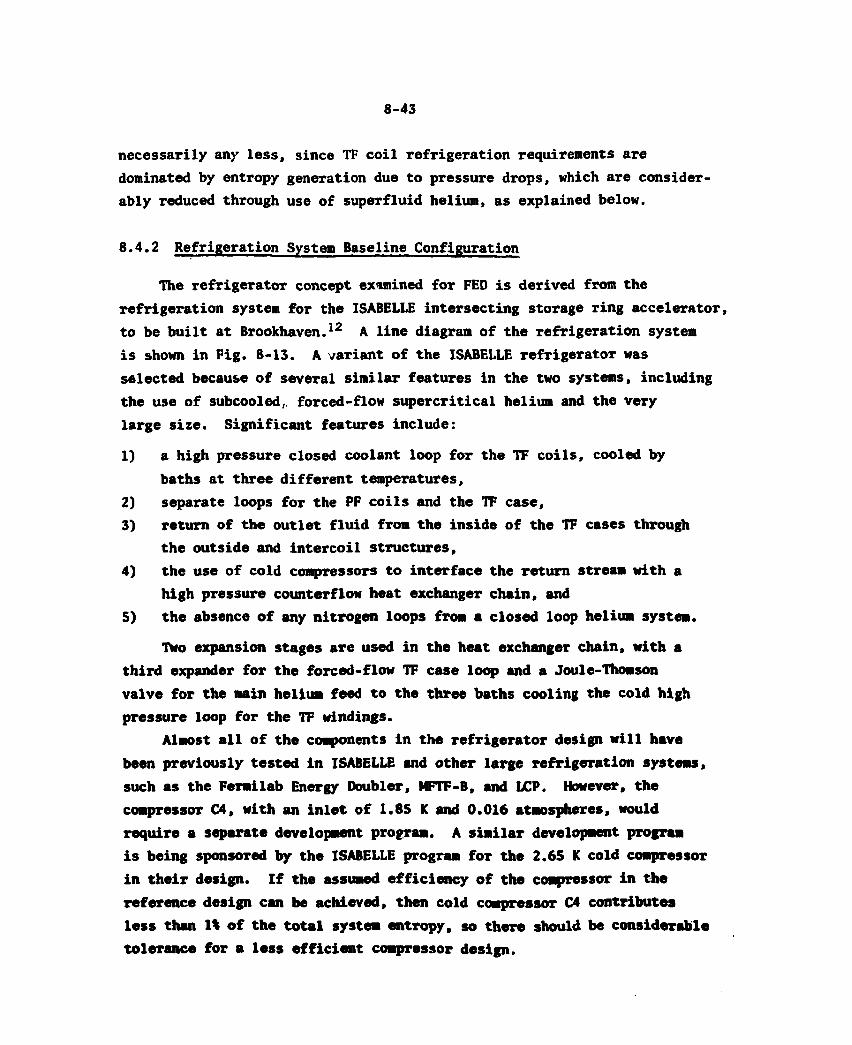
8-43
necessarily any less, since TF coil refrigeration requirements are dominated by entropy generation due to pressure drops, which are consider-ably reduced through use of superfluid helium, as explained below.
8.4.2 Refrigeration System Baseline Configuration
The refrigerator concept examined for FED is derived from the refrigeration system for the ISABELLE intersecting storage ring accelerator, to be built at Brookhaven.12 A line diagram of the refrigeration system is shown in Fig. 8-13. A variant of the ISABELLE refrigerator was selected because of several similar features in the two systems, including the use of subcooled, forced-flow supercritical helium and the very large size. Significant features include:
1) a high pressure closed coolant loop for the TF coils, cooled by baths at three different temperatures,
2) separate loops for the PF coils and the TF case, 3) return of the outlet fluid from the inside of the TF cases through
the outside and intercoil structures, 4) the use of cold compressors to interface the return stream with a
high pressure counterflow heat exchanger chain, and 5) the absence of any nitrogen loops from a closed loop helium system.
Two expansion stages are used in the heat exchanger chain, with a third expander for the forced-flow TF case loop and a Joule-Thomson valve for the main heliua feed to the three baths cooling the cold high pressure loop for the TF windings.
Almost all of the components in the refrigerator design will have been previously tested in ISABELLE and other large refrigeration systems, such as the Fermi lab Energy Doubler, MFTF-B, and LCP. However, the compressor C4, with an inlet of 1.85 K and 0.016 atmospheres, would require a separate development program. A similar development program is being sponsored by the ISABELLE program for the 2.65 K cold compressor in their design. If the assumed efficiency of the compressor in the reference design can be achieved, then cold compressor C4 contributes less than 1% of the total system entropy, so there should be considerable tolerance for a less efficient compressor design.
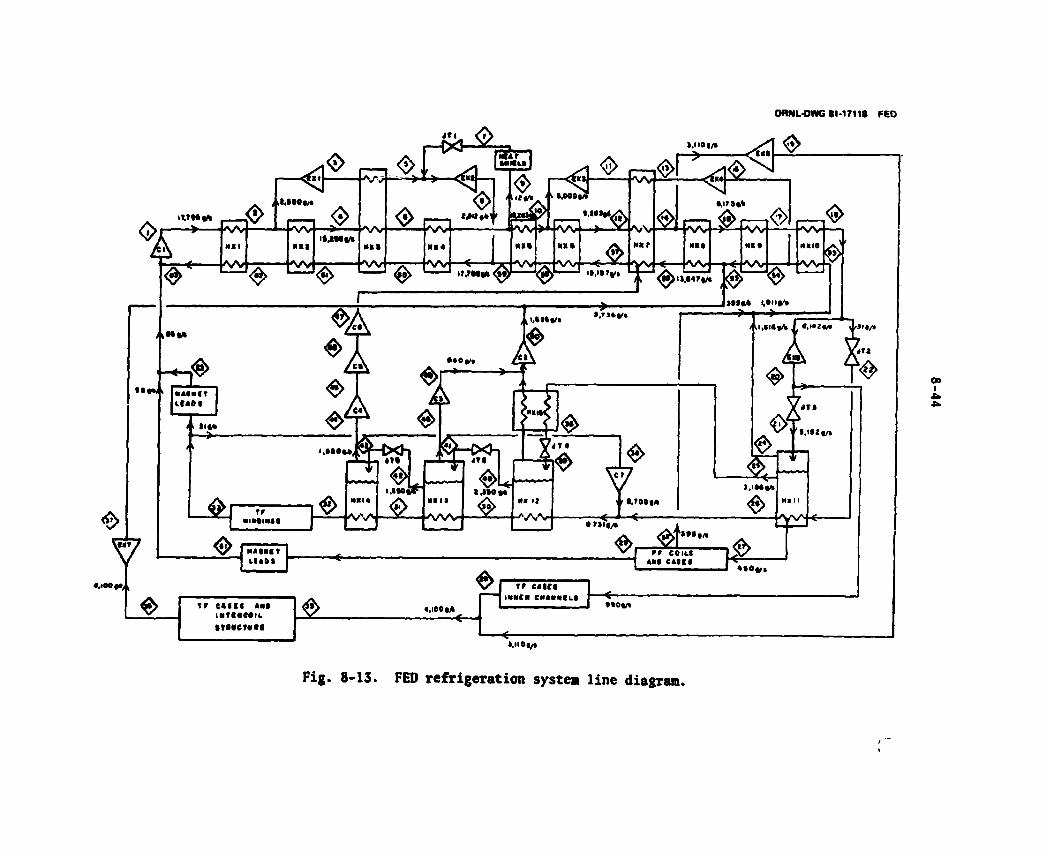
ORNL-OWG 81-17118 FED
<3>,
1VH1A Vi/
t AIMw
•It. <?>
^ ' ' > <g|—
/ W — <3> iMMtA ' W ' W
rvijH vam
/wUi. aa, > ""I "" A
TR e«IT« M I iafC«C*ii •tavcrtiai
4,100 (A
rr cftica ••Ofl/l
Fig. 8-13. FED refrigeration system line diagram.
8-45
8.4.3 Refrigeration System Alternate Concepts
The refrigerator design presented here is the first cut at a self-consistent design and does not represent any attempt to optimize or to justify selection of a topology from among different alternatives. Work is in progress on a refrigeration systems analysis and sizing code, for which most of the component models have been completed. Given the complexity of the refrigerator specification, quantitative comparison between alternative approaches requires the use of automated numerical design aids. As will be discussed in Section 8.4.4, a study of the entropy generation table reveals two obvious improvements which can be incorporated into the reference refrigerator topology. Certain design considerations, however, did lead to the reference topology. These are discussed below.
The major component tTade-offs in the design include the use of cold compressors vs. the use of larger heat exchangers and transfer lines and the use of wet expanders vs. the use of Joule-Thomson valves. A topological consideration was whether to use a high pressure, warm circulator system for the forced-flow coolant, as is done for LCP, or a cold circulator with cooling by low pressure baths. Cold compressors were chosen over oversize helium transfer components because of the extremely large sizes of heat exchanger return paths and cryogenic transfer lines required at 0.016 atmosphere. If the compressors work with an isentropic efficiency of 70%, which is the design goal of the ISABELLE cold compressors, much less space and material (and presumably less cost) will be required for the refrigeration system. Bejan13 studied a similar cycle and concluded that cold compressors would be preferred over warm recirculators if the isentropic compressor efficiency was greater than 41%, which supports the selected approach.
Wet expanders, as proposed for a helium liquefaction cycle by Minta1- and as used in the Fermi lab Energy Doubler satellite refrigerators15
might increase the efficiency of the bath generation by Joule-Thomson valve JT3, which requires an entropy addition of 1.78 kW/K (approximately 1.4% of the total system entropy generation). While it might be desirable to test out wet expanders to gain more knowledge of their long t e n
8-46
reliability, their potential use in the FED design does not appear to make a sufficient difference to warrant supplementing the work at Fermi.
From the fundamental considerations of environmental, safety and magnet shielding requirement, it is undesirable to have large, low pressure transfer lines penetrating the nuclear island. This problem is avoided in the reference design through use of a closed high pressure loop, with all low pressure 1.85 K streams in a separate building. This would be much more of a problem if a pool boiling superfluid helium approach were used. Here, low pressure pool boiling would require pene-trations on the order of 1-m diameter.
8.4.4 Refrigeration System Design Analysis
Forced flow parameters — TF coils
The use of a forced-flow conductor with a maximum outlet temperature of about 3.0 K has the one major limitation that, at the lower pressure limit of about 2.25 atmospheres for supercritical fluid behavior, the specific enthalpy of helium is only 6.3 J/g. This contrasts with a specific enthalpy of 30 J/g for helium vapor at 4.2 K or 31.3 J/g at 2.3 atmospheres and 5.5 K, such as has been proposed for high performance forced-flow magnets using Nb^Sn. Thus a much higher mass flow is required for the same amount of cooling capacity. Furthermore, since the Joule-Thomson coefficient is unfavorable in this regime, raising the fluid temperature as pressure drops, there is an absolute limit on the amount of heat that can be removed through a given channel for a given desired outlet state. In the reference design, by using an inlet in the superfluid regime (i.e., 1.85 K and 4.0 atmospheres), a conservative design is possible from the standpoint of steady-state heat removal. The inlet enthalpy is 3.7 J/g, while the outlet enthalpy at 3.2 K and 2.3 atmospheres is 6.8 J/g. Therefore, 3.1 J/g can be removed with a pressure drop of 1.7 atmospheres. If the average pressure drop per unit length, integrated over a hydraulic channel, is half that at the outlet, we calculate that a mass flow of 5.8 g/s could be achieved. This allows the removal of 18 W
2 per channel, or 8.5 W/cm . Since the average loss per turn is 2.0 W and
8-47
there are three turns per hydraulic channel, this allows a peaking factor of 3 for the hottest channel.
Evaluation of normal operation
A table of temperatures and pressures at all of the labeled interface points in Fig. 8-13 is given in Table 8-10. A table of the entropy generated by each component in the refrigeration system is given in Table 8-11.
The principal tool used in evaluating the refrigerator design is the component entropy inventory table, Table 8-11. The total work done on the helium by the room temperature compressor system equals the product of the entropy generated by the Test of the components and the temperature of the working fluid in the room temperature compressor. Put another way, in a system such as this one with no nitrogen, the room temperature compressor is the only component that decreases the entropy of the helium passing through it, and in a closed system this decrease must equal all the entropy increases of the other components. Entropy generation is the only measure that can put the refrigeration requirements (e.g., of heat loads at different or distributed temperatures; plus heat loads due to vaporization, liquefaction, and isenthalpic pressure drops) on a common basis.
The total entropy generation of all the components in the system is 119 kW/K. This is 4.7 times the entropy generated in the load. By comparison, the ISABELLE system required 4.0 times the entropy generated in the load. The difference reflects the fact that the FED design is in an eaTly stage of development, while the ISABELLE design is final. There may also be a second-order unfavorable dependence on the lowest temperature in the system, which is 1.8 K for FED and 2.65 K for ISABELLE. Of the 119 kW/K. generated in the FED system, 41.1 kW/K is generated by the heat exchangers, 20.-2 kW/K by the expanders, 16.7 kW/K by the Joule-Thomson vaives, and 12.5 kW/K by the cold compressors. These numbers imply that a reasonable balance has been achieved between cooling by heat exchange and cooling by expansion, and that the cold compressors are only increasing the system refrigeration requirements to the second order.
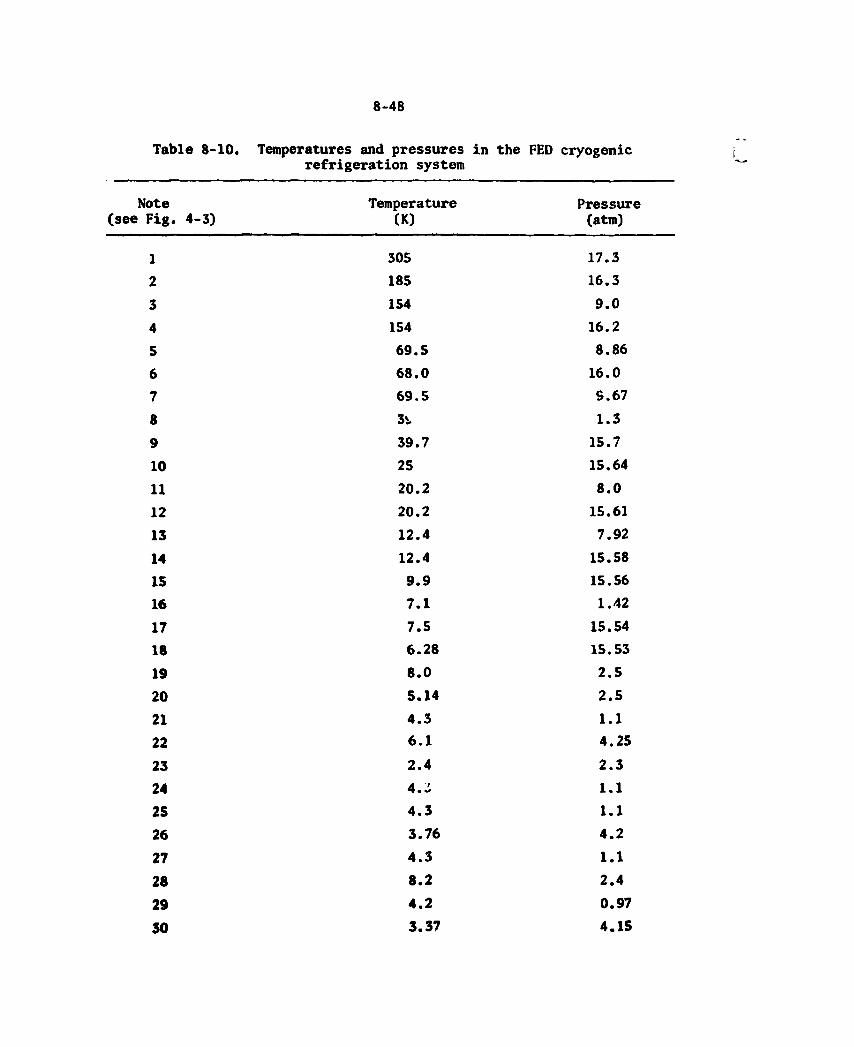
8-48
Table 8-10. Temperatures and pressures in the FED cryogenic refrigeration system
Note Temperature Pressure (see Fig. 4-3) (K) (atm)
1 305 17.3 2 185 16.3 3 154 9.0 4 154 16.2 5 69.5 8.86 6 68.0 16.0 7 69.5 S.67 8 31 1.3 9 39.7 15.7 10 25 15.64 11 20.2 8.0 12 20.2 15.61 13 12.4 7.92 14 12.4 15.58 15 9.9 15.56 16 7.1 1.42 17 7.5 15.54 18 6.28 15.53 19 8.0 2.5 20 5.14 2.5 21 4.3 1.1 22 6.1 4.25 23 2.4 2.3 24 4.i 1.1 25 4.3 1.1 26 3.76 4.2 27 4.3 1.1 28 8.2 2.4 29 4.2 0.97 50 3.37 4.15
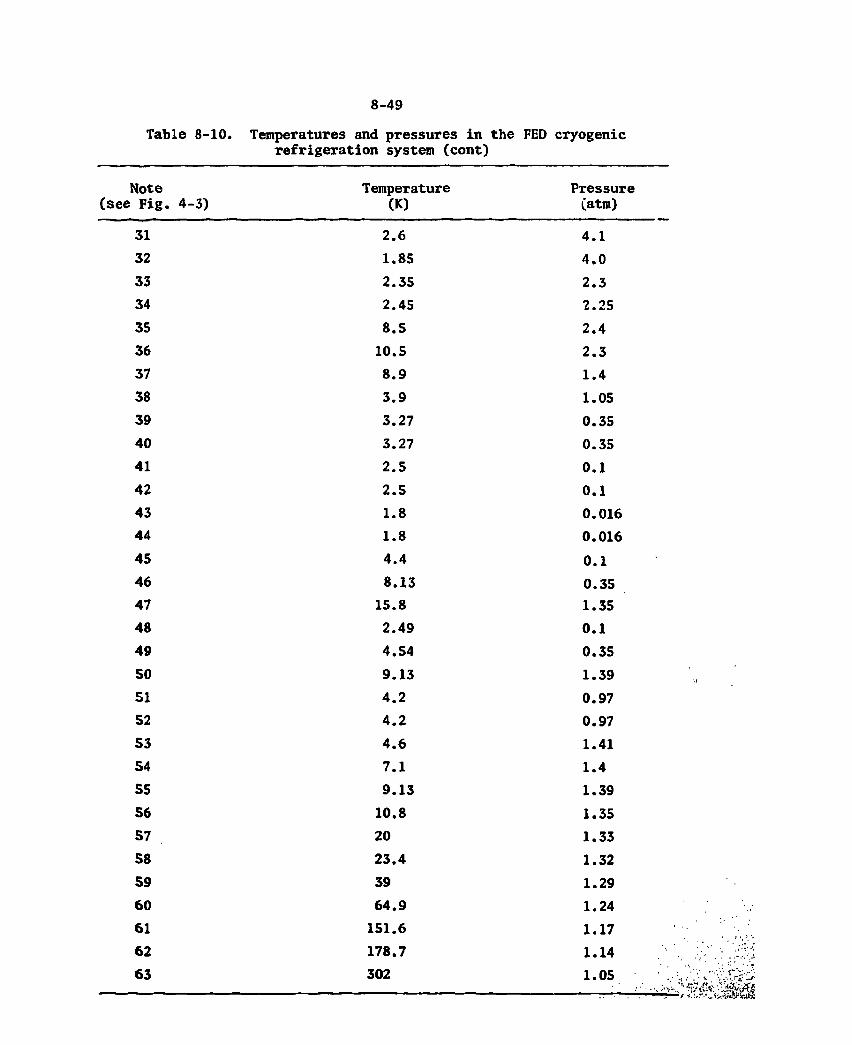
8-49
Table 8-10. Temperatures and pressures in the FED cryogenic refrigeration system (cont)
Note Temperature Pressure (see Fig. 4-3) (K) (atm)
31 2.6 4.1 32 1.85 4.0 33 2.35 2.3 34 2.45 2.25 35 8.5 2.4 36 10.5 2.3 37 8.9 1.4 38 3.9 1.05 39 3.27 0.35 40 3.27 0.35 41 2.5 0.1 42 2.5 0.1 43 1.8 0.016 44 1.8 0.016 45 4.4 0.1 46 8.13 0.35 47 15.8 1.35 48 2.49 0.1 49 4.54 0.35 50 9.13 1.39 51 4.2 0.97 52 4.2 0.97 53 4.6 1.41 54 7.1 1.4 55 9.13 1.39 S6 10.8 1.35 57 20 1.33 58 23.4 1.32 59 39 1.29 60 64.9 1.24 61 151.6 1.17 62 178.7 1.14 63 302 1.05
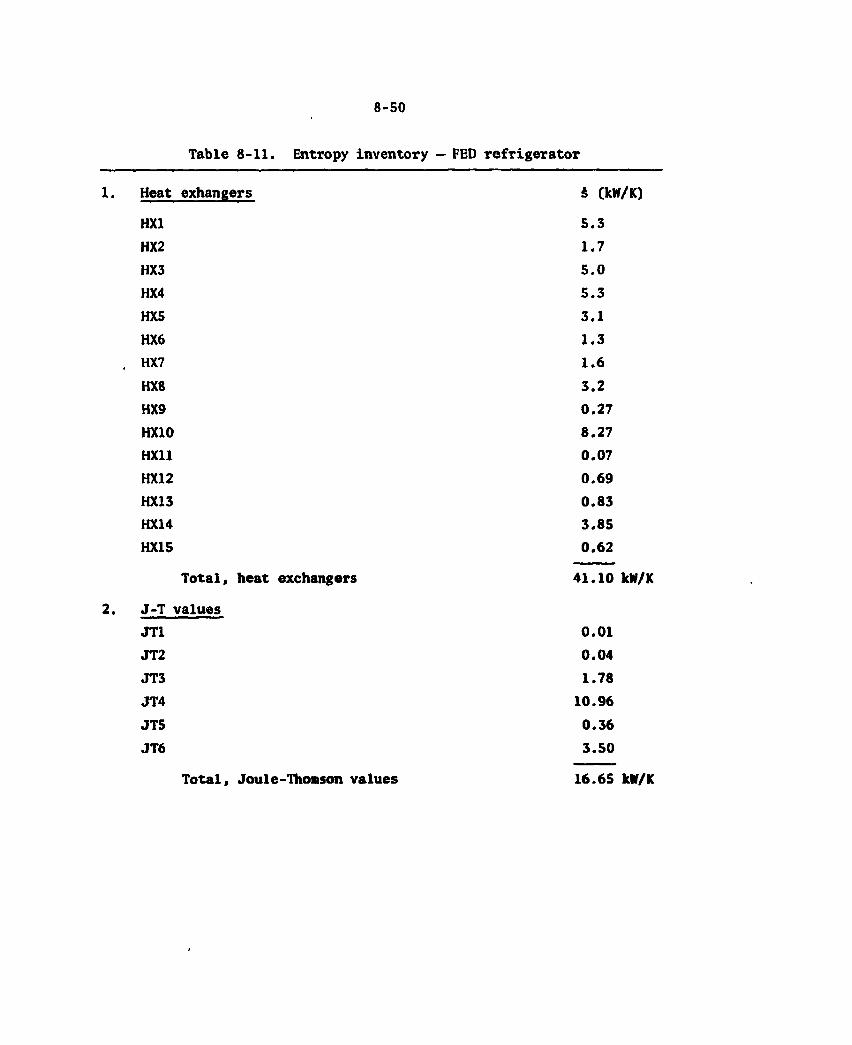
8-50
Table 8-11. Entropy inventory — FED refrigerator
Heat exhangers & (kW/K)
HX1 5.3 HX2 1.7 HX3 5.0 HX4 5.3 HX5 3.1 HX6 1.3 HX7 1.6 HX8 3.2 HX9 0.27 HX10 8.27 HX11 0.07 HX12 0.69 HX13 0.83 HX14 3.85 HX15 0.62
Total, heat exchangers 41.10 kW/
J-T values JT1 0.01 JT2 0.04 JT3 1.78 JT4 10.96 JT5 0.36 JT6 3.50
Totals Joule-Thomson values 16.65 klf/K
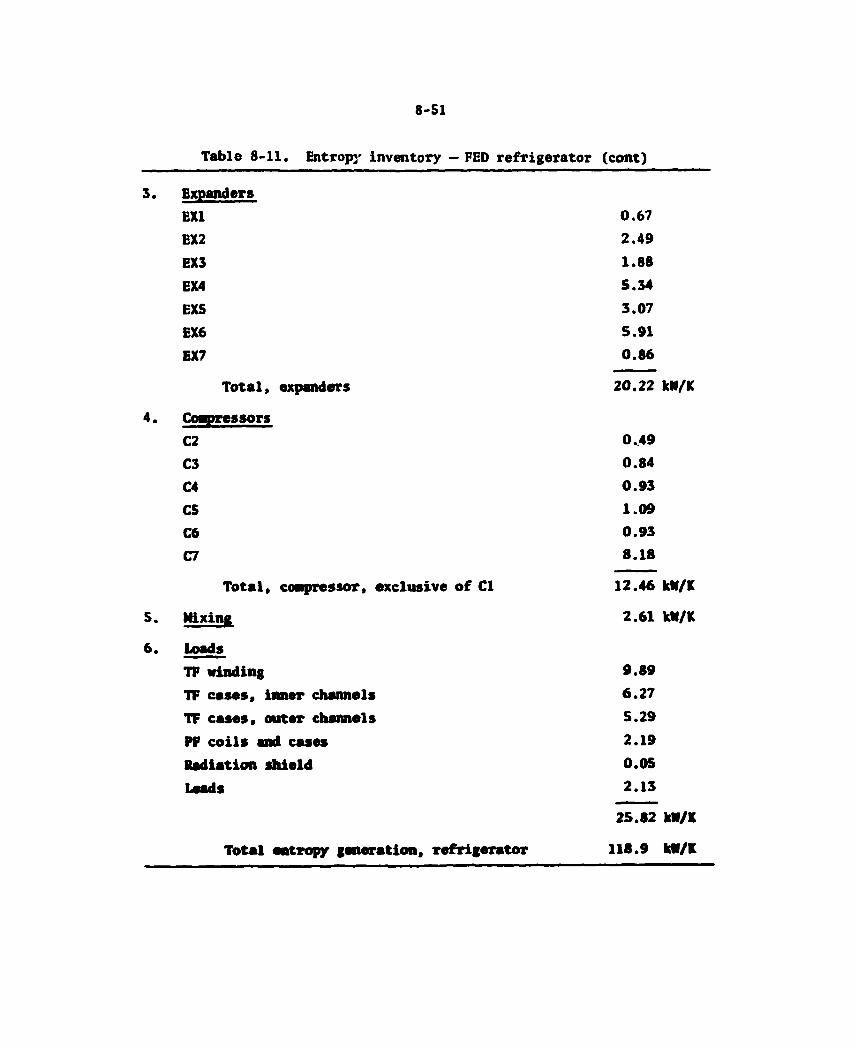
8-51
Table 8-11. Entropy inventory — FED refrigerator (cont)
3 . Expanders
EX1 0 .67
EX2 2 . 4 9
EX3 1 .88
EX4 S.34
EXS 3 .07
EX6 S .91
EX7 0 . 8 6
T o t a l , expanders 20 .22 kW/K
4 . Compressors
C2 0 . 4 9
C3 0 .84
C4 0 . 9 3
C5 1 .09
C6 0 . 9 3
C7 « . 1 8
T o t a l , compressor, exclusive o f C I 12 .46 klf/K
5 . Mixing 2 . 6 1 kW/K
6 . Loads
TF winding 9 . 8 9
TF cases, inner channels 6 . 2 7
TF cases, outer channels 5 . 2 9
PF c o i l s and cases 2 .19
Radia t ion s h i e l d 0 .05
Leads 2 .13
25 .82 M / K
T o t a l entropy generat ion, r e f r i g e r a t o r 118.9 M / K
8-52
As noted in Sect. 8.4.3, a detailed look at the entropy generation of the individual components does reveal two errors in temperature and mass flow selection. In the inner cold forced-flow loop, the entropy generated by Joule-Thomson valve, JT5, feeding heat exchanger HX13, is only 0.36 kW/K and the entropy generated in HX13 is only 0.83 kW/K. By contrast, the entropy generated in JT4, feeding KX12, is 10.9 kW/K and the entropy generated in HX14 (the 1.8 K heat exchanger) is 3.85 kW/K. The implication is that HX13 is not contributing enough to the three stage cooldown and that it should cool the high pressure stTeam to a lower temperature than 2.5 K. Similarly, at the end of the high temperature heat exchanger chain, HX10 generates an entropy of 8.27 kW/K, while the heat exchanger preceding it, HX9, generates only 0.27 kW/K. The cause of this disparity is the mass flow imbalance in the two legs of HX10. This suggests that entropy generation could be reduced by passing the inlet to expander EX4 through heat exchanger HX9, allowing the exhaust of EX4 to be returned through the cold side inlet of HX10. These two fixes might reduce the ratio of refrigerator entropy generation to lo&d entropy generation to between 4.0 and 4.5.
Cooldown
Cooldown should not be a dominant factor for sizing FED refrigerator components as it was in the TORE SUPRA study.16 That study attempted to take advantage of a proposed very low annual integrated duty cycle (0.02%) by Tunning the load from a liquid helium storage dcwar. The method was estimated to save about 25% over a refrigerator rated for steady-state removal of the heat generated over a single cycle.16 This approach was not reevaluated for the current design, since the increase by nearly a factor of 10 to a 17% duty factor, coupled with the selection of forced-flow cooling, made it highly unlikely that any significant economies could be achieved by reduction of refrigerator power in exchange for extra helium storage. Using a larger refrigerator, instead of greater storage capacity would also permit considerably more flexibility in allow-ing experiments over more extended periods. In the present design, the main compressor performs work on the helium at a rate of 63 MM, which
8-53
is 4.5 times the main compressor power of the ISABELLE refrigerator, while the cold mass is only two-thirds that of the ISABELLE magnet system. The operating plan of ISABELLE is to achieve cooldown in only 360 hours, while the reference scenario for FED allows four weeks for cooldown. The current design will almost certainly be limited by the thermal time constants of the mass being cooled or by thermal stress considerations in the large cold structural components, rather than by any lack of capacity in the refrigeration system. The TORE SUPRA calcula-tions 1 6 showed that the helium flow of 4,000 l/h would be adequate for cooldown from 100 to 20 K in two weeks and that only 1,000 l/h would be needed for final cooldown and fill in one week.
8.4.5 Future Work - Refrigeration System
Future work in the cryogenic refrigeration system design should include: (a) mounting a coordinated effort with magnet structural designers and nuclear shielding designers to reduce the cryogenic load; (b) completing a refrigerator analysis code to permit more rapid evaluation of different topologies; and (c) investigating refrigerator concepts that might simplify overall machine design. One such concept mentioned above is a more detailed design of the flow in each channel to minimize the entropy generation due to pressure drops, which is the dominant refrigeration requirement of the TF windings. Another new concept to be investigated is the possibility of suspending superinsulation from the vacuum dewar wall, with no actively cooled thermal radiation shield. This would greatly simplify the internal plumbing of the cryostat, while increasing total radiation losses (which are a trivial fraction of the total load) by less than an order of magnitude. A similar task which recognizes the dominance of pulsed ac and nuclear radiation loads would be to reexamine an early design decision to use internal cold structure for the support of out-of-plane forces. A motivation for cold structure is to avoid excessive heat leaks through structural support members. In the reference design, ac losses in the cold supports are over 2,000 times greater than thermal conduction losses through structural support members. The use of stacked G-10 pads recommended for gravitational

8-54
load support is a possible candidate to provide the interface with a warm support structure.
The low viscosity of helium in the superfluid regime allows the possibility that the refrigeration load in the TF coil using a superfluid inlet may actually be lower than if a higher temperature inlet fluid were used. The largest term in the entropy generated by the assumed drop from 4.0 atmospheres to 2.3 atmospheres is that due to the Joule-Thomson effect (i.e., isenthalpic throttling). If the entire externally imposed heat load were removed through boiling at 2.0 K, the entropy generation would be 4,625 W/K. The calculation that the entropy generation of the TF system in the reference design is 9,892 W/K assumes that the pressure drop from the inlet to the outlet header is that of the worst case channel. In fact, however, the cooler channels will remain super-fluid longer and will have a lower pressure drop. Independent circuits will be necessary to prevent the superfluid channels from shunting flow from the supercritical channels at the outlet header. However, during normal 8-T operating conditions, neutron and gamma heating (the second largest terms) are reduced by a factor of 2.5. Under these conditions, all channels should remain superfluid. Entropy generation rates for these channels should be far lower than those experienced in a channel moving 5.6 g/s of supercritical helium at 3.0 K through the TF winding with no external heat generation at all. If the concept of forced-flow heat removal with a superfluid inlet is retained, an attempt should be made to investigate whether the desirable feature of low pressure drop for high mass flow can be included in the design for most of the channels for all modes of operation. If this can be accomplished, it would reduce the room temperature power requirements for the TF winding refrigera-tion by at least the factor of two calculated above.
8-55
8.5 REMOTE MAINTENANCE EQUIPMENT
8.5.1 General Requirements
Remote maintenance procedures are required for the FED whenever* it is necessary to remove or gain access to components comprising or located inside the reactor radiation shield system. This includes removal of shield sectors and ancillary equipment shielding and access to components penetrating the shield envelope. In addition, the capability to maintain equipment outside the shield envelope by remote means has to be provided in order to be able to accomplish at least some of the more straightforward operations during radiation cooldown, and if necessary, to also carry out whatever operations are required while part of the shielding system is removed.
TWo classes of remote maintenance equipment are required: general purpose and special purpose. Special purpose equipment is required for handling and transporting components, for inspecting areas of concern, for detecting faults, for cutting and welding nonstandard joints, and for making in-situ repairs. General purpose devices, such as manipulators and cranes, are required for operations involving tools and for handling components once they have been removed from the reactor. In addition, the general purpose equipment has to have sufficient flexibility to carry out unplanned maintenance operations.
8.5.2 Items of Remote Maintenance Equipment
The major items of remote maintenance equipment included in the baseline design are listed in Table 8-12.
General purpose — manipulators
Many maintenance activities can be accomplished using general purpose manipulators. All the manipulator systems would be designed to accommodate either a power manipulator or a man-equivalent servomanipulator interchangeably.
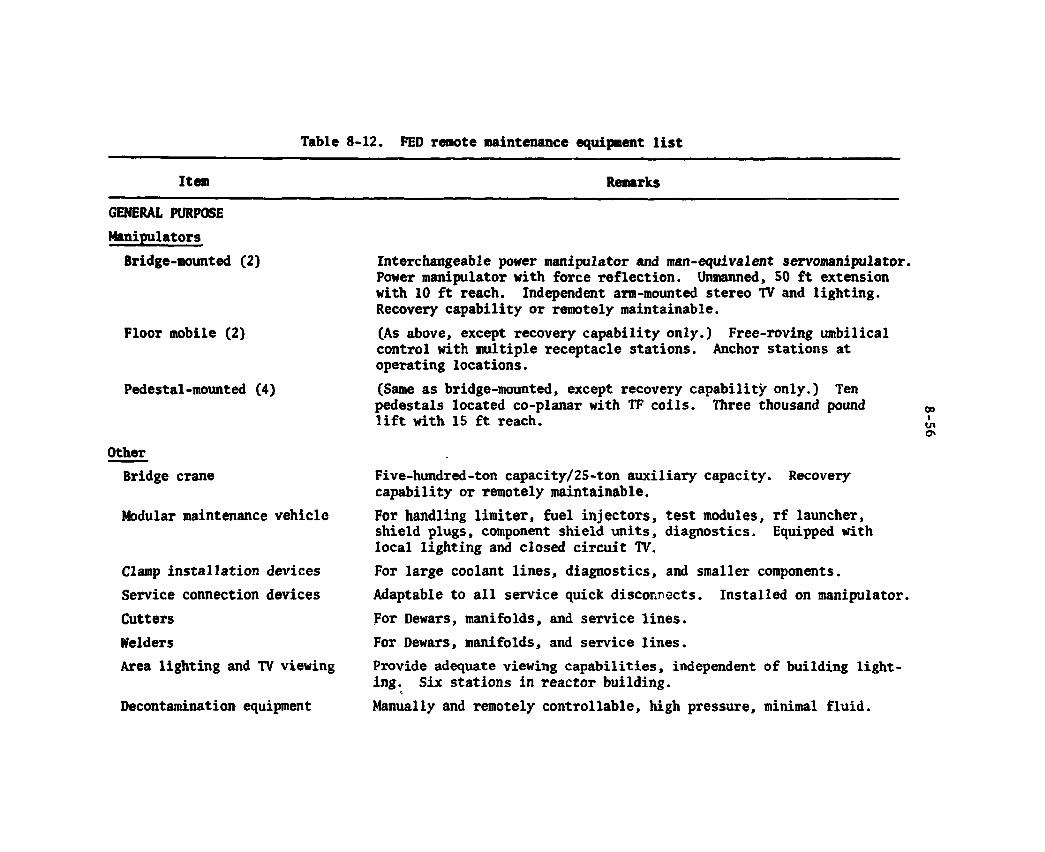
Table 8-12. FED remote maintenance equipment list
Item Remarks
GENERAL PURPOSE Manipulators
Bridge-mounted (2)
Floor mobile (2)
Pedestal-mounted (4)
Other Bridge crane
Modular maintenance vehicle
Clamp installation devices Service connection devices Cutters Welders
Area lighting and TV viewing
Decontamination equipment
Interchangeable power manipulator and man-equivalent servomanipulator. Power manipulator with force reflection. Unmanned, 50 ft extension with 10 ft reach. Independent arm-mounted stereo TV and lighting. Recovery capability or remotely maintainable. (As above, except recovery capability only.) Free-roving umbilical control with multiple receptacle stations. Anchor stations at operating locations. (Same as bridge-mounted, except recovery capability only.) Ten pedestals located co-planar with TF coils. Three thousand pound lift with 15 ft reach.
Five-hundred-ton capacity/25-ton auxiliary capacity. Recovery capability or remotely maintainable. For handling limiter, fuel injectors, test modules, rf launcher, shield plugs, component shield units, diagnostics. Equipped with local lighting and closed circuit TV. For large coolant lines, diagnostics, and smaller components. Adaptable to all service quick disconnects. Installed on manipulator. For Dewars, manifolds, and service lines. For Dewars, manifolds, and service lines. Provide adequate viewing capabilities, independent of building light-ing. Six stations in reactor building. Manually and remotely controllable, high pressure, minimal fluid.
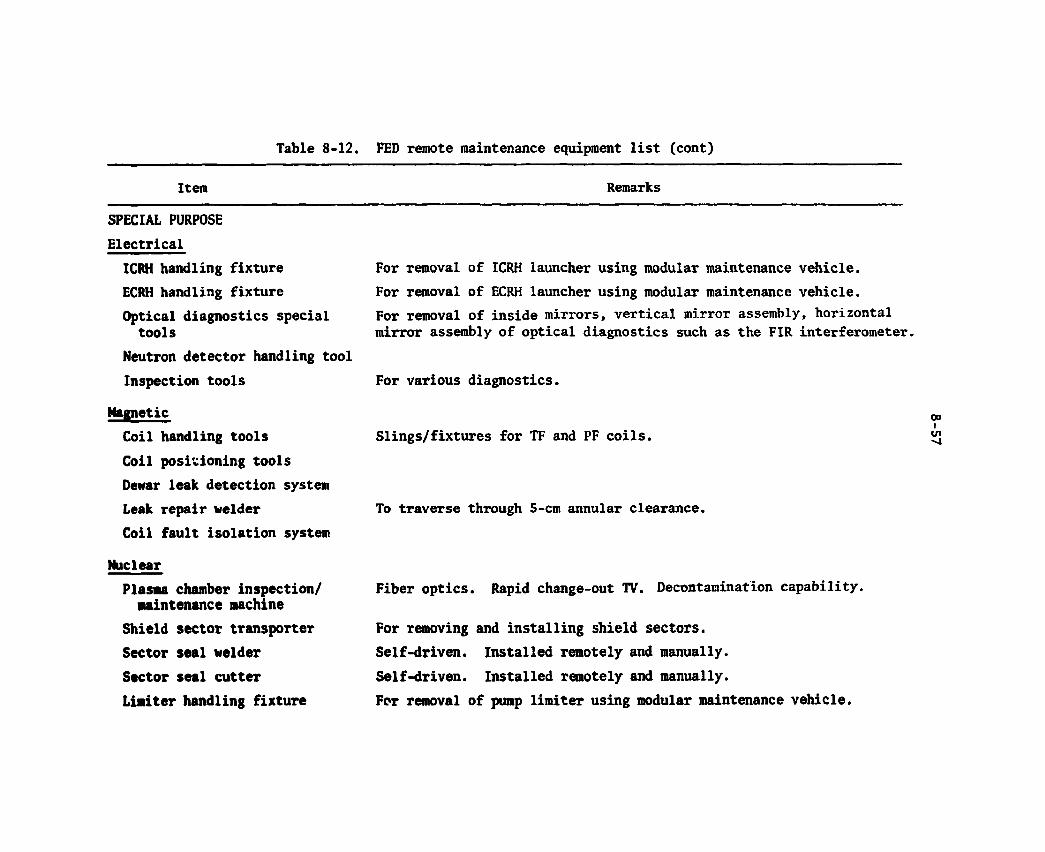
Table 8-12. FED remote maintenance equipment list (cont)
Item Remarks
SPECIAL PURPOSE Electrical ICRH handling fixture ECRH handling fixture Optical diagnostics special tools
Neutron detector handling tool Inspection tools
Magnetic Coil handling tools Coil positioning tools Dewar leak detection system Leak repair welder Coil fault isolation system
Nuclear Plasma chamber inspection/ maintenance machine
Shield sector transporter Sector seal welder Sector seal cutter Limiter handling fixture
For removal of ICRH launcher using modular maintenance vehicle. For removal of ECRH launcher using modular maintenance vehicle. For removal of inside mirrors, vertical mirror assembly, horizontal mirror assembly of optical diagnostics such as the FIR interferometer.
For various diagnostics.
Slings/fixtures for TF and PF coils.
To traverse through 5-cm annular clearance.
Fiber optics. Rapid change-out TV. Decontamination capability.
For removing and installing shield sectors. Self-driven. Installed remotely and manually. Self-driven. Installed remotely and manually. For removal of pump limiter using modular maintenance vehicle.
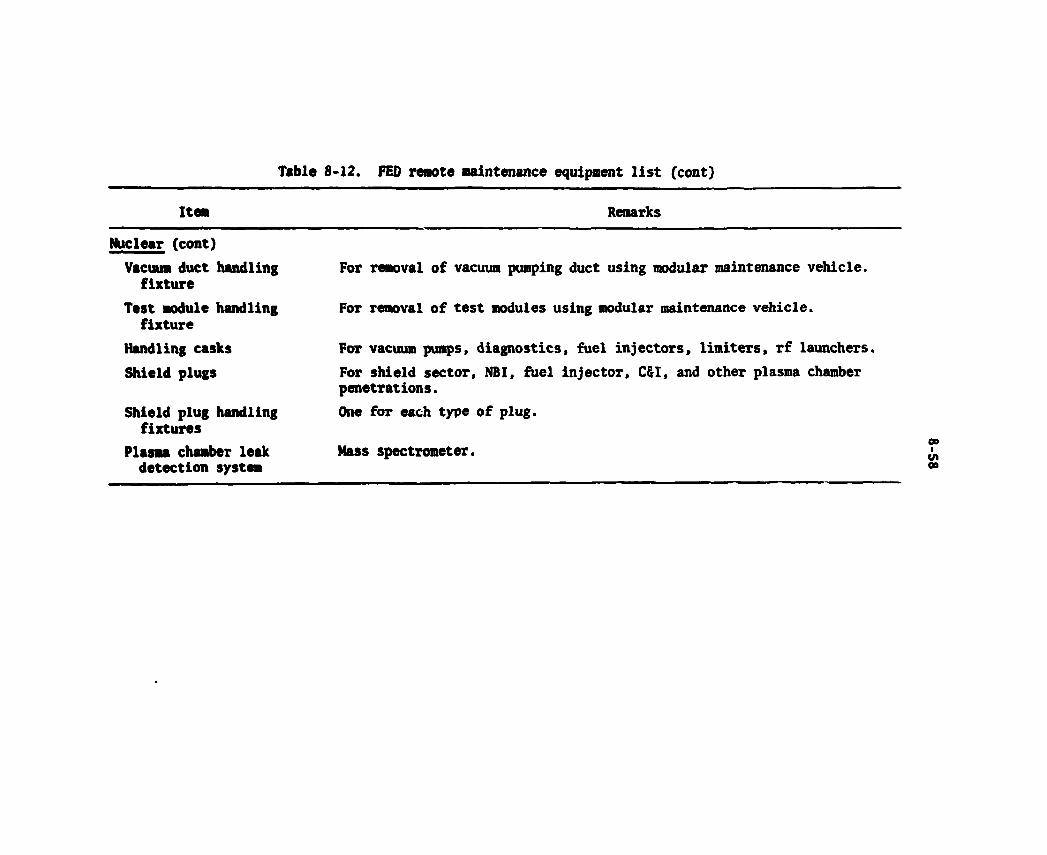
Table 8-12. FED remote maintenance equipment list (cent)
Item Remarks
Nuclear (cont)
Vacuum duct handling f i x t u r e
Test module handling f i x t u r e
Handling casks
Shield plugs
Shield plug handling f i x tures
Plasma chamber leak detect ion system
For removal of vacuum pumping duct using modular maintenance vehicle.
For removal of test modules using modular maintenance vehicle.
For vacuum pumps, diagnostics, fuel injectors, limiters, rf launchers. For shield sector, NBI, fuel injector, C$1, and other plasma chamber penetrations. One for each type of plug.
Mass spectrometer,

8-59
The power manipulator requires 400-600 lb of lift. It lacks the dexterity of the man-equivalent servomanipulator but can be used to complement its operations for a range of tasks.
The man-equivalent servomanipul?.cor is the device which most closely duplicates the activities of a mechanic. It requires a lifting capability of 50-75 lb.
End-effector devices which can be used in conjunction with the manipulator systems include, but will not be limited to, the following:
e shield block handler (shadow shielding), e bolt torquer, out-runner, impact wrench, e welder, e cutter, e radiation monitor, e leak detector, and e viewers.
The general purpose manipulator systems required to accommodate the basic maintenance needs of the FED are as follows:
1. An overhead bridge-mounted telescoping tube system having a 50-ft extension and a 10-ft reach. Two of these systems are provided.
2. A floor mobile manipulator system (Fig. 8-14) to provide access to the base of the reactor which cannot be reached by the bridge-mounted system or the fixed-base manipulators. In addition, this manipulator system could be used to augment the capability of the fixed-base system. Two floor mobile systems are provided for operations in two locations simultaneously.
3. A pedestal-mounted four-degree-of-freedom articulated device having a 3000-lb capacity, along with a 15-ft reach. Four of these are provided so that operations can be carried out concurrently by two pairs at different reactor stations. They are mounted behind the TF coils, with access to each sector through the TF coil/cryostat window.
Additional features which are incorporated in these manipulator systems include obstacle avoidance, viewing systems with positioning control.
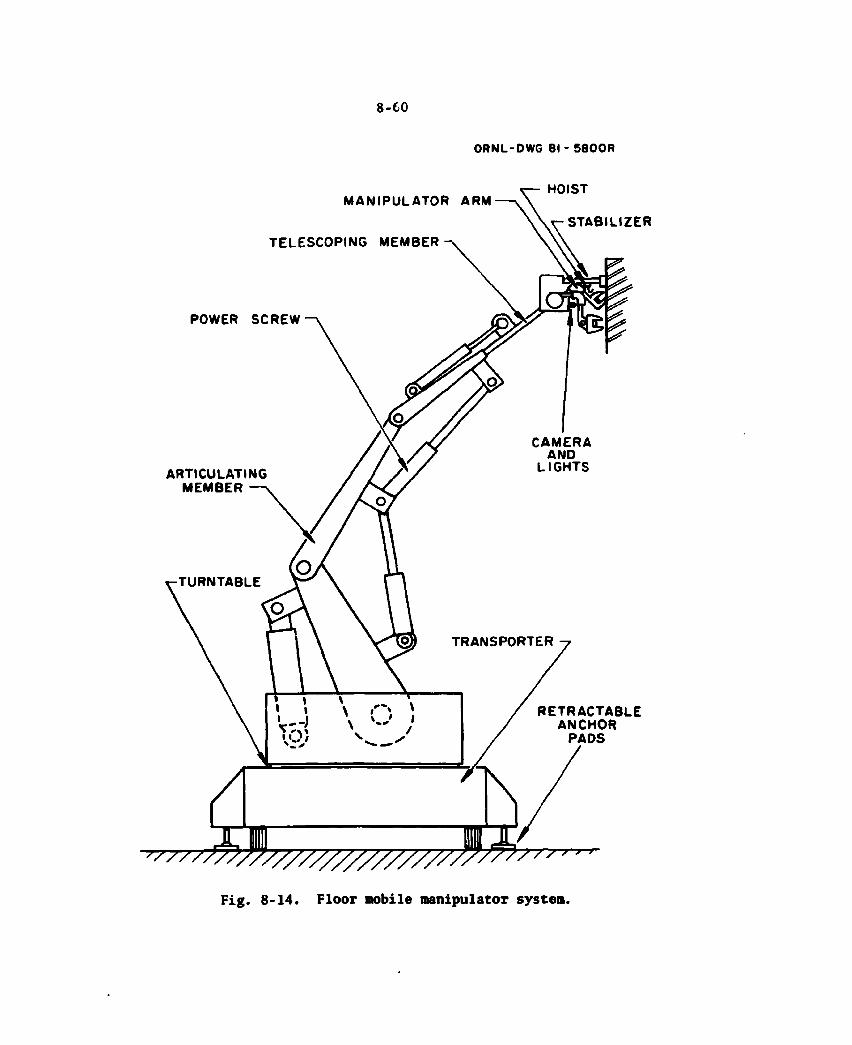
8-CO
ORNL-DWG 64 - SSOOR
MANIPULATOR ARM
TELESCOPING MEMBER
POWER SCREW
ARTICULATING MEMBER
HOIST
STABILIZER
CAMERA AND
LIGHTS
RETRACTABLE ANCHOR
PADS
W / / / / / / / / / / / / A F i g . 8 - 1 4 . F l o o r mobi le m a n i p u l a t o r system.

8-61
and supervisory control. The supervisory control includes teach-playback and tool change capabilities. Radiation hardening will be provided, since the manipulator systems will be exposed to high-level sources upon removal of the shield sectors, test modules, and ancillary equipment requiring large penetrations.
General purpose — other
In addition to manipulators, a wide range of general purpose equipment is provided. A bridge crane with a 500-ton hoist capacity is installed to move heavy reactor components, such as a shield sector. This crane either should be capable of being removed after being disabled, or it should be designed for being remotely maintained.
A modular maintenance vehicle is provided for handling a variety of components in the intermediate weight range. Among the components for which this handling machine is designed are the limiter, fuel injectors, test modules, rf launcher, shield plugs, component shield units, and diagnostics. This machine is a free-roving machine in order to interface with components installed in unanticipated locations. It is equipped with local lighting and closed circuit television (CCTV) systems to provide adequate control of operations.
Diagnostics, large coolant lines, and many smaller components will be installed using clamps. Clamp installation devices are supplied to remove and replace these clamps remotely when the operations have to be performed while the reactor building is inaccessible. These devices are adaptable to a manipulator articulated arm and are capable of push, pull, and rotational motions.
A range of different size quick disconnects will be used for all electrical, instrumentation, cryogenic, hydraulic, and coolant service lines. For most requirements, these are designed to be disconnected manually. For some situations (e.g., activities before 24 h after shutdown), however, it may be necessary to make or break connections remotely. Service connection devices are provided for this purpose. Like the clamp installation devices, they are designed for installation on a power manipulator articulated arm and are capable of push, pull, and

8-62
rotational motions. The manipulator lighting and CCTV system can be used to monitor the operations locally.
Automatic cutters and welders will be provided to cut and reweld the superconducting coil Dewars, manifolds, and service lines where sections not fitted with clamps or quick disconnects have to be removed. Normally, these tools can be set up manually, but they will be designed for installation using a manipulator for those situations where the reactor building is inaccessible. These tools are self-driven so that once installed the operations can proceed on an automated basis. Local lighting and CCTV for monitoring the operations remotely are provided by the manipulator systems.
Area lighting and CCTV coverage are provided at strategic points in the reactor building. Approximately six fixed stations are located in the main bay of the reactor building. In addition, the lighting and CCTV system installed on the bridge crane can be used for mobile area coverage in places not adequately covered by the fixed stations.
Decontamination equipment which can be remotely controlled, as well as manually operated, is provided to remove contamination in areas exposed to tritium and radioactive debris. A dry vacuum is used for loose debris. High pressure Freon 113 and/or water spray with a vacuum pickup will be used where adhered material is encountered. Fcr many operations, a manipulator with appropriate end effectors can be used to handle the decontamination equipment.
Special purpose — electrical
The electrical components are defined to include neutral beam injector, fuel injector, ICRH, ECRH, and control and instrumentation.
Wherever practicable, general purpose equipment will be used to maintain the electrical system components because of the range of uncertainties in component failure mode. Special purpose remote equipment is planned only when justified by machine availability needs or when required to allow work to be done in the contact or semi-remote mode. Electrical components will be maintained in-situ whenever possible.
8-63
A handling fixture is provided for removal and replacement of the ICRH assembly. It is assumed that either the modular mairrenance vehicle (described above) or the bridge crane can be used handling this component. In either case, the operation will have to be performed remotely, since it involves compromise of the torus shielding system.
Special handling and inspection tools are provided for the various diagnostics.
Special purpose — magnetic
Handling tools and positioning tools are needed for both the TF coils and PF coils. In general, these slings and fixtures will be the same as those designed for the original construction. For normal mainte-nance operations, it is expected that the PF coils can be removed using contact procedures. Consistent with the requirement to be able to perform maintenance operations if the reactor building becomes inaccessible, however, all the coils should be designed to be installed and removed using totally remote operations.
A Dewar leak detection system, which may havs to be partially integrated with the Dewar design, is used to isolate the location of leaks so that they can be repaired. This system will most likely involve the local application of a tracer gas which can then be detected by a mass spectrometer at a Dewar pump-out location.
Once located, a welder can be used to overlay the suspect area. In the case where a leak is located in the annulus between the torus support spool and the central cylinder section of the Dewar, the welder will have to be designed to fit in a 10-cm clearance. Lighting and a miniature TV camera will also be designed to fit i:i this confined space.
A coil fault isolation system will be developed to determine the location of an electrical fault. This system will be built into the coil system in such a way as to permit location of the fault by remote control.

8-64
Special purpose — nuclear
The principal pieces of special purpose remote maintenance equipment used for the FED nuclear systems are the plasma chamber inspection/mainte-nance machine, shield sector transporter, sector seal welder and cutter, component handling fixtures and casks, shield plugs, and plasma chamber leak detection system.
The plasma chamber inspection/maintenance system must be able to enter the vessel through an open port and access all interior surfaces within a 90° sector of the vessel. The unit must have the capability of performing precise operations, as well as handling relatively high loads.
TWo dexterous force feedback systems capable of positioning, aligning, and handling small items with a high degree of flexibility and precision are provided. Handling of heavy items can be accomplished with either power manipulators or a simple jib hoist; however, the power manipulator provides more versatility.
A large transporter will be used to install and retract the shield sectors from under the Dewar canopy. The shield sector handling presents a particularly difficult challenge, since the shield sector weighs upward of 400 tons and may have high breakaway loads. The requirements for final positioning are also demanding, requiring precise multi-degree-of-freedom adjustment capability.
Welding and cutting devices will be developed for the sector seal. Seal welding will be accomplished utilizing a standard mechanical TIG welder head mounted on a carriage which aligns, clamps, and tracks the welded surfaces. A guide rail system will be incorporated into the design as a reference frame for the system. A roll sheaT, punch sheaT, or chipper will be used for the cutter. This device mounts on the same track system as the welder.
The modular maintenance vehicle (described above) will be available to handle intermediate size components, including the limiters, test modules, and shield plugs. Handling fixtures will be provided for adapting these components to the modular maintenance vehicle.
8-65
Handling casks will be supplied for various components such as the vacuum pumps, diagnostics, fuel injectors, limiters, and rf launchers. The handling casks will limit contamination of the reactor building by tritium and radioactive debris. Shield plugs are also required to permit closure of the plasma chamber after removal of a component.
A plasma chamber le&k detection system will be developed to isolate the location of any leaks in welded joints or mechanically sealed closures. This system will incorporate a means of applying a gas source locally and use of a mass spectrometer to detect when the gas has penetrated into the plasma chamber.
8.5.3 Remote Maintenance System Options
If a neutral beam system is used for bulk heating, a transporter will be provided to remove it from the installation at the reactor and re-install it. This transporter will be designed to employ either traction drive or cable drive. A hydraulic ram and/or jack screws are provided for breakaway and for final positioning of the NBI.
A number of special tools for handling the components of the NBI would also be provided. Among the components of concern are the acceler-ator stack, source, cryopanels, direct recovery assembly, and gas cell.
«
8.5.4 Future Work — Remote Maintenance Equipment
Some conceptual design has been carried out on specific items of remote maintenance equipment.17 Substantial additional work is required to better define the characteristics of the remote maintenance equipment and establish a reliable cost estimate.
The basic design concept and scale of the shield sector handling machine, for example, has not yet been developed. This machine, as indicated above, must be capable of removing the very large and heavy shield sectors with an as yet unspecified breakaway load. It must be capable of accurately installing the section in all three linear coordi-nates to an accuracy in the millimeter range and adjusting its pitch and azimuth within a fraction of a degree. The handling machine also must

8-66
accommodate the high center-of-gravity of the shield section, implying a handling machine structure extending well up on the sector vertically, with sufficient stiffness and reacting moment arms to handle very high dynamic loads.
The modular maintenance vehicle will be studied further to develop the basic concept and define its operational requirements. This machine will have to interface with a variety of components with the use of tools and fixtures. The possibility of using a limited number of interface arrangements trill be examined in an effort to limit the maintenance vehicle handling points. The motive system and control scheme will also be defined, as will the loads and positioning requirements.
The plasma chamber inspection/maintenance machine will require a substantial effort to arrive at a definition of its basic concept and its operational characteristics. The present concept involves access through the bulk shield at a discrete (i.e., four) number of locations. It is not yet clear whether a cantilevered arrangement or a support system internal to the plasma chamber is appropriate. These options need to be examined. Also, the functions of the machine have to be better defined to insure that the design of the components of the torus is consistent with the capabilities of the machine.
The manipulator systems will have to be better defined. In particular, the reach and load capabilities of the bridge mounted, floor mobile, and pedestal mounted manipulator systems will have to be established. The force reflection characteristics of the power manipulators will also have to be established, as will control characteristics.
Studies also have to be carried out for the coil fault isolation system and the plasma chamber leak detection system. The interfaces between these systems and the reactor systems are critical in terms of defining the features in both areas.
Feasibility and conceptual definition will also have to be developed for the wide range of other elements of the remote maintenance system, including the cutters, welders, installation and connection devices, fixtures and tools, decontamination equipment, and lighting and viewing systems.
9. FACILITIES DESCRIPTION
T. E. Shannon M. L. Rogers*
R. J. Barrett* + C. E. Smith5
S. L. Thomson"
The essential purpose of the plant facilities is to support the operation and maintenance of FED. These facilities provide housing and a controlled environment for the FED equipment. The necessary facilities are summarized in Table 9-8 while a suggested site arrangement is shown in Fig. 9-2.
Most of the preconceptual design effort has focused on the tokamak building and hot cell facility while a less detailed effort has been given to definition of the remaining facilities. These efforts have resulted in an estimate of the approximate size and an identification of the general characteristics of most of the facilities. The functions of the reactOT building have been identified and the question of pressure vessel building design has been addressed. All of the current descriptions are highly machine design dependent and thus are subject to change as the FED design evolves.
9.1 REACTOR BUILDING AND HOT CELL FACILITY
9.1.1 Reactor Building
Requirements
A basic function of the reactor building is to protect the device and supporting equipment from natural elements. Rain, snow, dust, and
•Fusion Engineering Design Center/Burns and Roe, Inc. +Fusion Engineering Design Center/Oak Ridge National Laboratory. *Mound Facility. ^Fusion Engineering Design Center/Grumman Aerospace Corporation. 'Fusion Engineering Design Center/Bechtel Group, Inc.
9-1

8-2
even sunshine could pose threats to the satisfactory operation of the device. In addition to protection from the elements, the building is required to provide a satisfactory environment for machine operation and maintenance. For example, temperature, dust, and humidity need to be controlled to assure satisfactory operation of the machine and to allow an adequate working environment for personnel. Temperature control could be very important to the operation of instrumentation and safety systems. In addition, structural alignment and support may depend on adequate temperature control. One such restriction is that the temperature of structural concrete must be kept below certain limits (usually about ISO'F) to maintain its strength.
In the current FED design, the reactor building serves as a major part of the shielding system to protect the rest of the plant and plant workers from excessive radiation during machine operation.
Most of the building functions needed to support operation will also be needed to support maintenance. Temperature and building environ-ment still need to be controlled to allow maintenance operations, even though the conditions are likely to be different from those during operation. Building functions require careful consideration of the space requirements for maintenance activities and maintenance equipment. Provisions must be made for the transport of major components from the device to the hot cell facilities. This transport may be either by overhead crane; by surface transport such as wheels, roller, tracks, or airfloat; or a combination of the two. Clearance and surface conditions must be provided to remove major components and shield sectors from the machine via the windows provided between TF coils. Access must be pro-vided between the tokamak building and hot cell facilities. The current FED maintenance approach requires some or all of,the major components to be maintained in a separate area, away from tokamak device so that the device can be operated while component maintenance is being performed.
Contact maintenance (hands-on) is also a part of the FED maintenance approach. The machine shielding is not sufficient to allow personnel entry into the tokamak area during operation. However, continuous personnel activity in the tokamak area can be initiated 24 hours after

8-3
device shutdown (36 hours for 10-T operation) when the local dose rate has decreased to 2.5 mr/hr. In addition to sufficient shielding, this capability also requires the ability to decontaminate the tokamak area and control tritium levels.
The major components are estimated to be highly radioactive after device operation with tritium. During device disassembly operations, current estimates predict the occurrence of periods when personnel entry and movements will be restricted. Shield sector removal and transport are expected to be the worst case for producing high-level radiation in the tokamak area. A number of the operational steps necessary for disassembly of the major device components are expected to require remote operations. In addition, the building must provide adequate shielding for shield sector transport to protect the rest of the plant and plant workers during shield sector transit.
The safety functions of the tokamak building are clearly among the most important building functions and are highly influential in detexmining the building characteristics. In this initial stage of FED technical definition, design considerations affecting public safety are accorded the highest priority, with considerations relating to plant worker safety and machine protection being given a somewhat lower priority.
The primary public safety issue for FED is the potential release of radioactivity and more specifically the release of tritium. Thus the main safety function of the tokamak building is to provide a part of the confinement system to prevent or mitigate the effects of an uncontrolled release of radioactive material such that on-site and off-site doses are maintained within recommended guidelines during all facility operating conditions.1 Three aspects are involved in the detailed definition and design for safety functions of the tokamak building:
e acceptable guidelines and standards, e consequences of operational and accidental tritiui releases, and e design techniques for the buildings and the required safety
equipment.

8-4
Acceptable guidelines and standards are discussed in Chapter 11, while potential consequence* of tritium releases are discussed later in this chapter.
Some parts of the tritium confinement systems will be identified as safety class systems (see Chapter 11). However, the parts of any particular system to be designated as safety class must be determined through detailed accident analysis. Even at this early juncture in FED design, however, it appears that at least some building functions fall within safety class designations. For example, the building walls will have to be supported in a manner which would prevent them from falling on sensitive components and causing a major tritium release. This requirement leads to application of safety class structural integrity guidelines to the building. Another possible example is protection from external missiles. While no definitive statement can be made at this time, it is anticipated that the tokamak building will be a significant part of the confinement system, it will have significant safety functions to perform, and therefore it will probably be a safety class system. Nevertheless, the safety class designation will be applied and tested for each function of the building to avoid possible over-design and unnecessary costs.
Baseline design
A rectangular building with small, 3-5 psi, overpressure capability has been selected as the baseline design. Two meters of concrete have been specified for the walls and roof to provide adequate shielding during operation and during major radioactive component movements within the building. The suggested reactor building arrangement is shown in Fig. 9-1. The major building features are summarized in Table 9-1. The constructability of this rectangular structure has not yet been investigated. The reactor building is specified as a confinement building with some safety class functions. Together with appropriate ventilation t systems and other design features which form the confinement system, the tokamak building will mitigate and reduce the consequences of postulated releases of radioactive material below established guidelines. A leakage
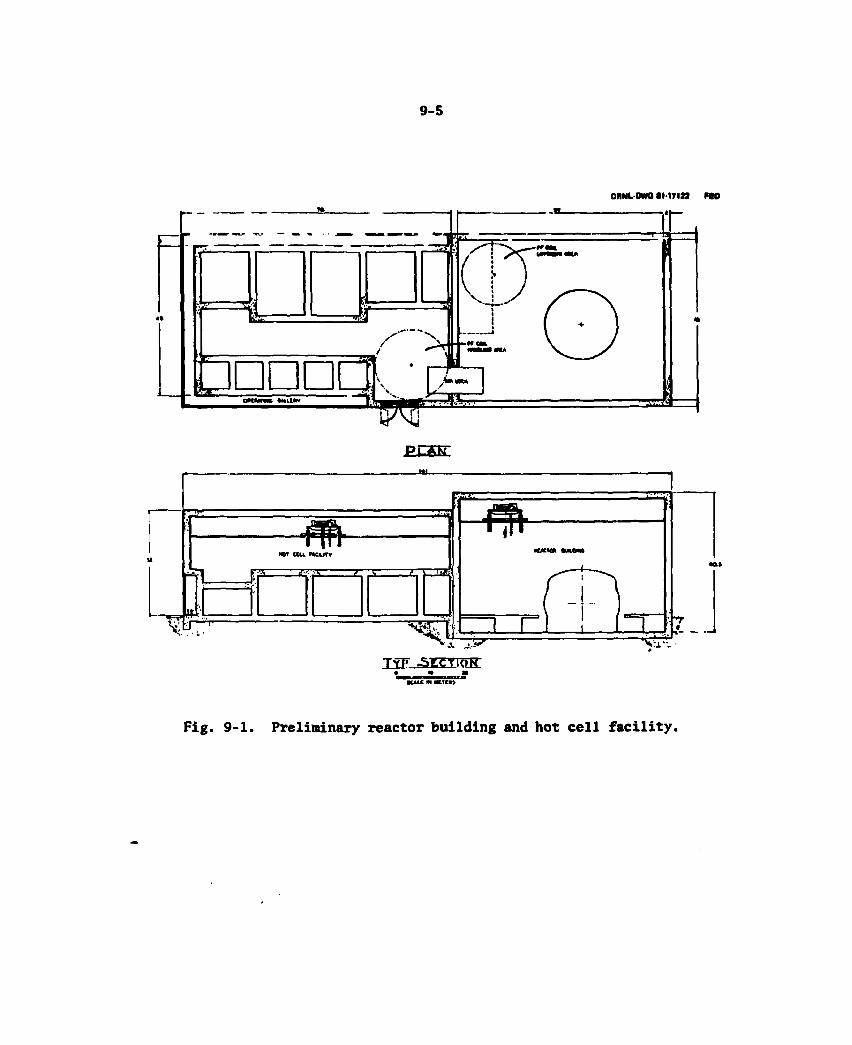
8-5
OMM.-DWG «M7ia FED
CESS:
TyF .SECTIttH • n m tCAiC Ml «tCU
Fig. 9-1. Preliminary reactor building and hot cell facility.

8-6
Table 9-1. Tokamak building characteristics Construction type • Confinement, low leakage (M volume/day)
Resistant to natural phenomena and missiles
Size - length = 63 m
width = 52 m
height = 42 m
Walls and roof constructed with two meters of concrete for shielding
rate from the building of approximately one building volume a day at the worst case conditions has been established as a measure of the confinement capability. In addition, the building will have to be able to withstand severe natural phenomena and certain wind generated and man-made missiles in order to provide its safety functions.
The size of the building is based primarily on space requirements for maintenance. These requirements include space for crane operation, component removal and transport, component laydown areas, and maintenance equipment maneuvering.
The elements which have established the overall building dimensions are summarized in Table 9-2. The width was estimated to accommodate the basic machine, to allow the vacuum pump modules to clear the vacuum duct, and to allow a right-of-way around the vacuum pump module access hatch sufficient to move the shield sectors. At least one meter clearance was allowed for all major lifts and shield sector transport.
The building length was determined by adding the size of the PF coil laydown area with one meter lifting clearances to the diameter of the dimensions used for the width calculation except that no shield sector transport right-of-way was included between the laydown area and the vacuunn pump module access hatch. The common axis was angled as much as possible without increasing the building width. The building height allows for clearance of the bucking cylinder over the top of the machine together with the estimated crane height and structural clearance.
The operating floor is positioned by the need to remove the shield sectors from the TF coil window. The resulting basement area below the
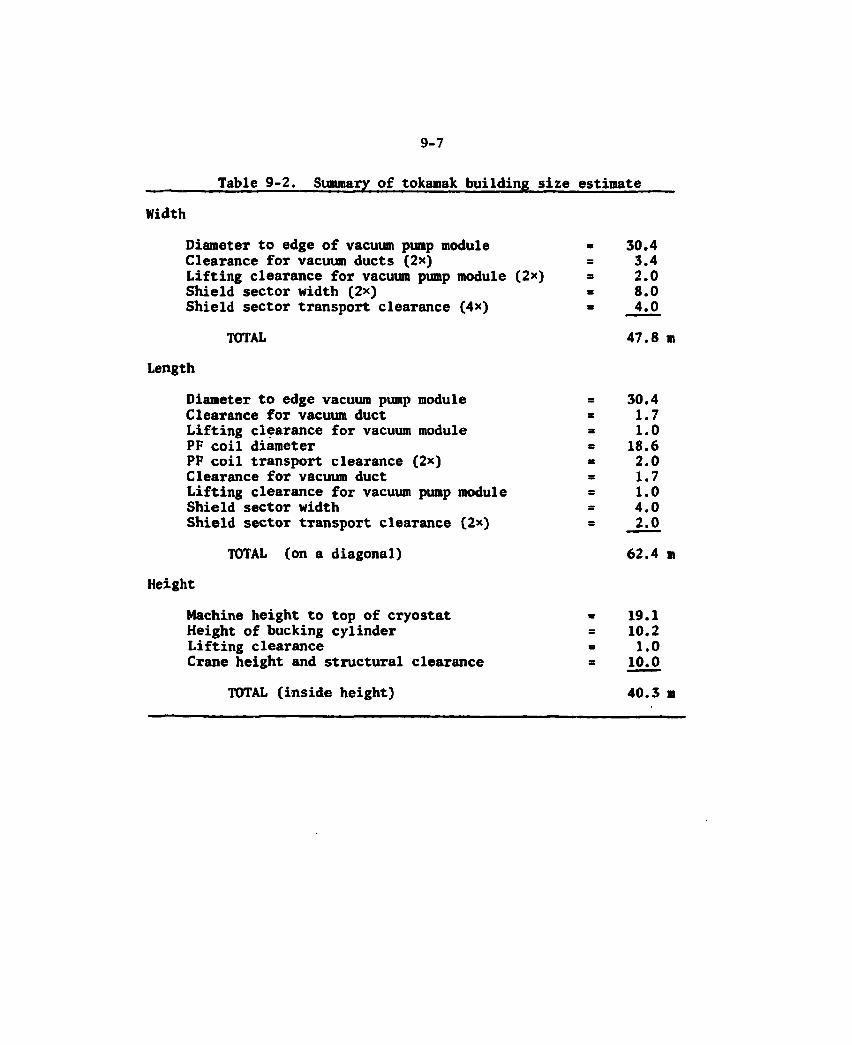
8-7
_ Table 9-2. Summary of tokamak building size estimate
Width
Diameter to edge of vacuum pump module = 30.4 Clearance for vacuum ducts (2*) = 3.4 Lifting clearance for vacuum pump module (2*) » 2.0 Shield sector width (2x) = 8.0 Shield sector transport clearance (4*) • 4.0
TOTAL 47.8 m
Length
Diameter to edge vacuum pump module = 30.4 Clearance for vacuum duct = 1.7 Lifting clearance for vacuum module = 1.0 PF coil diameter = 18.6 PF coil transport clearance (2*) = 2.0 Clearance for vacuum duct = 1.7 Lifting clearance for vacuum pump module = 1.0 Shield sector width = 4.0 Shield sector transport clearance (2*) = 2.0
TOTAL (on a diagonal) 62.4 m
Height
Machine height to top of cryostat = 19.1 Height of bucking cylinder = 10.2 Lifting clearance = 1.0 Crane height and structural clearance = 10.0
TOTAL (inside height) 40.3 m

8-8
operating floor will be required to house much of the support equipment. The vacuum pump modules will be in the basement and much of the necessary piping and cables is expected to come through the basement area to allow clear access on the operating floor for component transport, crane operation, and maintenance equipment maneuvering. One corner of the basement has been designated as the heat exchanger area where the heat exchangers for the first wall, limiter, and shield can be mounted. This allows those potentially radioactive systems to remain within the reactor building confinement boundary and eliminates the need for an additional building with confinement capabilities. This heat exchanger area was sized based on vendor design information for plate heat exchangers.
Design options
The reactor building forms an integral part of the radioactivity confinement system. Therefore, it has been necessary to consider all confinement system design options in conjunction wi(h the reactor building options to fully assess possible building options. For FED, the potential source of overpressure is the release of cryogenic fluids (liquid helium and liquid nitrogen) which would change to gas as they are heated to ambient temperature. Thu£, the issue of confinement design hinges on the need to withstand the overpressure from cryogenic releases versus the capability to process and vent cryogenic releases without developing significant overpressures for building. If overpressure design is required, a cylindrical or spherical building is implied so that hoop stress design can be used to overcome the overpressure. Flat sided buildings present difficult design complications when required to meet significant overpressure criteria (greater than about 5 psi). On the other hand, if ventilation techniques can be satisfactorily applied, a flat sided building can be used with potential savings in building costs and improved arrangement flexibility. Overpressure design is only one of several design techniques which may be applied to mitigate the conse-quences of tritium release. Some design objectives which would reduce either the probability or the consequences of tritium release are listed in Table 9-3 and discussed below.
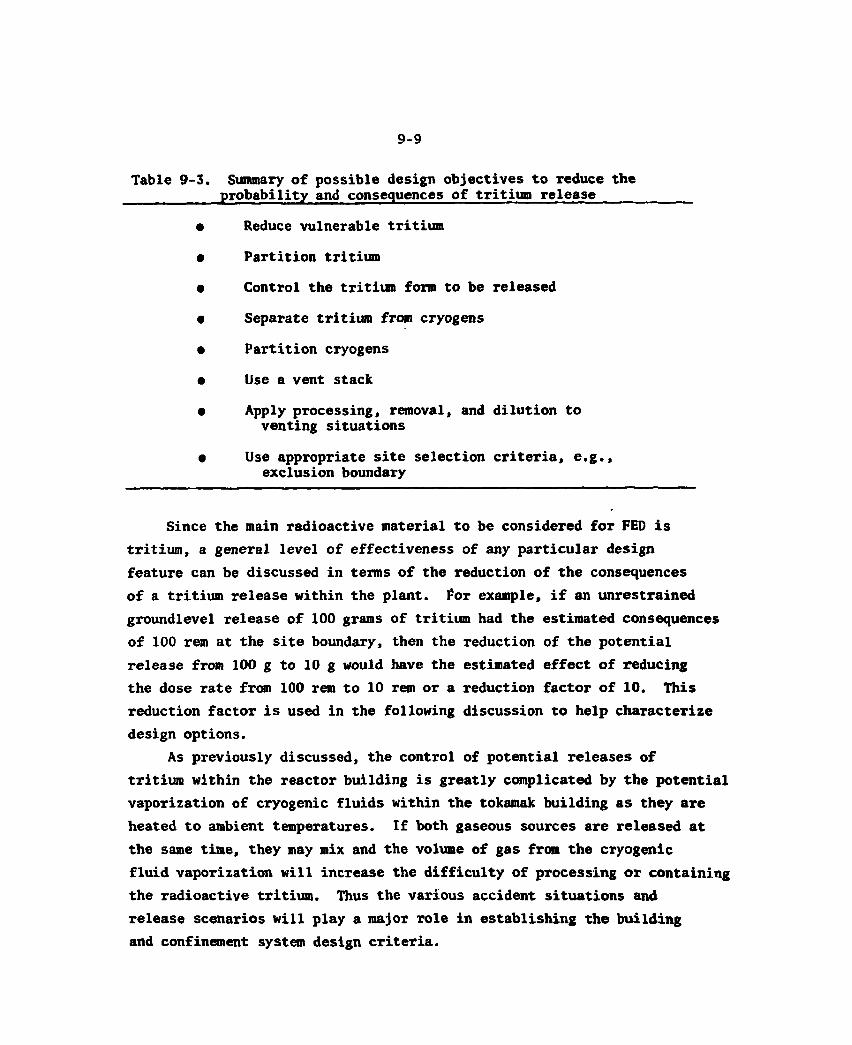
8-9
Table 9-3. Summary of possible design objectives to reduce the probability and consequences of tritium release
e Reduce vulnerable tritium
e Partition tritium
e Control the tritium form to be released
e Separate tritium from cryogens
e Partition cryogens
e Use a vent stack
e Apply processing, removal, and dilution to venting situations
e Use appropriate site selection criteria, e.g., exclusion boundary
Since the main radioactive material to be considered for FED is tritium, a general level of effectiveness of any particular design feature can be discussed in terms of the reduction of the consequences of a tritium release within the plant. For example, if an unrestrained groundlevel release of 100 grams of tritium had the estimated consequences of 100 rem at the site boundary, then the reduction of the potential release from 100 g to 10 g would have the estimated effect of reducing the dose rate from 100 rem to 10 rem or a reduction factor of 10. This reduction factor is used in the following discussion to help characterize design options.
As previously discussed, the control of potential releases of tritium within the reactor building is greatly complicated by the potential vaporization of cryogenic fluids within the tokamak building as they are heated to ambient temperatures. If both gaseous sources are released at the same time, they may mix and the volume of gas from the cryogenic fluid vaporization will increase the difficulty of processing or containing the radioactive tritium. Thus the various accident situations and release scenarios will play a major role in establishing the building and confinement system design criteria.

8-10
Pressure vessel building
One technique to reduce the consequences of radioactive release is to design the building as a pressure vessel capable of withstanding the limiting accidental release situation. The pressure vessel will then contain all the radioactivity from an unexpected release until slower acting systems can be used to reduce the building pressure and remove the radioactivity. This method has the advantage of being demonstrated and having a very high reduction factor (on the order of 1000 or greater). Reduction factors in this range^would reduce potential consequences for FED to well below the suggested guidelines. However, these advantages can be expensive. A cylindrical or spherical shape is more desirable for pressure vessels than rectangular shapes, but a cylindrical building may cost on the order of 30 to 40 percent more than a rectangular building with the same volume. In addition, a steel liner may be necessary to withstand the overpressure and could more than double the cost of a cylindrical building. Arrangement flexibility and space usage is also somewhat reduced for a cylindrical building.
Confinement building
If the consequences of possible cryogen vaporization can be reduced without a pressure vessel building, than the simpler and potentially less expensive rectangular building can be used to help control the potential release of tritium. A confinement building would prevent unrestrained groundlevel tritium release through the use of ventilation systems, and other design techniques could be used to reduce the consequences of tritium release. A rectangular building could be designed at relatively small expense to withstand some low amount of overpressure (3 to 5 psi) while maintaining a low leakage rate (on the order of one building volume peT day). Such a building could provide a reduction factor of 1.5 to 2 without any other design features depending on the maximum amount of cryogen that could potentially be released. For several types of potential releases which would not involve cryogen release or where the cryogen release is small, a confinement building of this suggested
9-11
type would contain most of the released tritium, thus yielding a high reduction factor (e.g., 100 to 1000 depending on leakage rates).
Reduce vulnerable tritium
One objective of the system design is to reduce the amount of tritium which could be released in an accident. The amount of vulnerable tritium should be made as low as possible. This might be accomplished by reducing the process inventories in the processing equipment, e.g., recycling cryovacuum pumps (if used) more often. The tritium should also be partitioned so that an accident which causes the release of tritium from one part of the system will not cause a release from other parts of the system or from other equipment. For example, isolation valves between the fueling device and the torus plasma chamber could be used to prevent tritium release from the fueling device in the event that the torus vacuum integrity is lost.
One possible design alternative that can have a significant impact on the amount of vulnerable tritium within the reactor building is the choice of the vacuum pumping system. The use of compound cryopumps to attain the desired plasma chamber vacuum will result in accumulation of as much as 300 g of tritium on the cryopanels between pump regenerations. On the other hand, the use of turbomolecular vacuum pumps would essentially add no vulnerable tritium. The other inventory of vulnerable tritium in the fueling machine has been estimated between 10 and 20 g. Thus, the use of turbomolecular pumps instead of cryopumps provides a reduction factor between 15 and 30.
Partition tritium
An important design objective is to partition the vulnerable tritium within the reactor building so that postulated accidents will not cause the release of a large fraction of tritium. This might be accomplished by using secondary confinement structures capable of withstanding and protecting the enclosed tritium from postulated accidents and capable of preventing further release if the enclosed primary containment system
9-12
should be breached. The fueling device is a likely candidate for a secondary confinement structure. Individual vacuum pumps are also possible candidates for secondary confinement. A possible feature of these suggested secondary confinement systems might be isolation valves between the equipment and the plasma chamber to reduce the release of the tritium in the equipment if plasma chamber integrity were lost. The reduction factor for these design techniques is expected to be high and could contribute significantly to the overall reduction of consequences.
Partition cryogens
Since the potential impact of cryogen evaporation is quite significant, another design object shoulc be to reduce the amount of cryogen that could possibly be released by a single accident. This might be accomplished with piping arrangements and valving so that a major cryogen leak in one part of the system does not cause the blowdown of the whole system. For example, each TF coil might be piped separately. The cryostat could be vented separately from the normal building path so that gas from cryogen leakage and evaporation inside the cryostat would not be mixed with any tritium in the building. The reduction factor for these design features could be substantial with the limit being a reduction in potential cryogen release to the level where it could be handled with no tritiimi mixing. The separation of cryogen release from tritiimi releases should be attempted for all important limiting accident scenarios.
Vent stack
The use of a vent stack is an existing technology which can significantly reduce the consequences of tritiiai release. By releasing the tritium or other radioactive effluents well above ground level better mixing and greater dispersion is achieved which results in significantly less dose at the boundary. The consequences from the stack effluent can be further reduced by processing or diluting the effluent stream before release. Releasing tritium through a vent stack with no other processing could reduce the consequences by a factor of five and possibly result in a
9-13
reduction of 100 depending on a number of vi . Just considering a factor of five reduction substantially inpro possibilities of meeting the suggested guidelines.
Processing building effluent
Processing of the vent system effluent can potentially provide great reductions in tritium release. The emergency tritium removal system may be capable of reducing the tritium concentration by a factor •-f 106. The major limitation is processing capacity. For FED the processing rate would have to be on the order of the cryogen evaporation rate to have a significant impact on the limiting events. No accident analysis has been performed to estimate the potential cryogen evaporation rates for FED, but these rates may be fairly substantial. However, it appears that processing systems can be developed which would provide significant reduction in the trititmi released for many FED cases.
Form of released tritium
One very important aspect of the potential consequences of tritium release is the form of the tritiiai. Tritium in the gaseous form, HT or Tj, has a very small biological effect because it is not taken up by the body. On the other hand, tritium in the foim of water, HTO or T20, has a large biological effect because it is readily absorbed into the body. The dose consequences are roughly estimated to be on the order of 10,000 times less for the gaseous form than for the water form. Thus, design efforts should be directed toward assuring that as high a fraction of gas as possible is maintained for any tritium release. One way to help achieve this objective is to try to avoid fir«s in conjunction with tritium release. Review of past tritium gas releases suggests, that no •ore than one percent of the releases were converted from gaseous to oxide fom. This effect by itself would result in a potential reduction factor of 100.

9-14
Site characteristics
Since site characteristics can have a najor influence on the con-sequences of radioactive releases, it follows that site selection criteria can influence the radiological consequences. Such characteristics as site exclusion boundary and population density of the surrounding areas directly affect both the dose rate at the boundary and the postulated average population dose resulting from tritium releases. For example, large distances from the plant to the site boundary can significantly reduce the consequences of tritium release.
Discussion
A number of design techniques are available to help reduce the probability and consequences of tritium release. The feasibility of designing a combination of systems to provide adequate protection from tritium release appears to be likely. Design alternatives will probably be selected based on potential cost and schedule impact. It does not appear necessary to use a pressure vessel building to meet FED safety requirements. This should allow the use of a rectangular building which is expected to be simpler to construct and capable of affording a more flexible and efficient site arrangement.
9.1.2 Hot Cell Facility
Requirements
The basic function of the hot cell facility is to support the maintenance of FED. Major components are removed from the device and taken into the hot cell facility for repair and adjustment. The require-ments of the hot cells are to provide adequate working space and a controlled environment to support the maintenance of the major FED components. The initial estimates do not include any consideration of the requirements of the test program, which need to be considered separately.
9-15
The FED is expected to have an availability on the order of 10 to 20 percent. At this level of availability, many maintenance activities may comfortably be performed in the reactor building without significantly impacting availability. Very quick repair of failed components is not expected to be as important as it might be for the higher availability goals for power reactors. Thus, general purpose as opposed to highly specialized hot cells are currently being suggested for the hot cell facility. Large cells should be provided to allow disassembly of large components while smaller cells should provide repair space for smaller components and disassembled pieces. A list of major components to be maintained in the hot ceil facility, together with their approximate dimensions is given in Table 9-4. In addition to general purpose hot cells, an anechoic chamber (without echoes) is required to test and adjust RF components, a decontamination area is desirable to allow removal of surface contamination from components to be repaired, and some storage is required for out-of-service components.
Baseline design
The basel ine design f o r the hot c e l l f a c i l i t y was determined by
reviewing the requirements and applying engineering judgement t o est imate
an appropr ia te conf igura t ion . F ive meters clearance completely around
the component was allowed f o r maintenance equipment maneuvering. Add i t iona l
c learance was included i n the la rge hot c e l l s t o a l low major components
t o be disassembled. As a r e s u l t , two large hot c e l l s and f i v e general
purpose hot c e l l s are suggested w i t h dimensions o f 19 m * 14 m and
8 a x 8 m, respec t ive ly . The other areas o f the hot c e l l f a c i l i t y are
summarized i n Table 9 - 5 and the general arrangement i s shown i n F i g .
9 - 1 w i t h the tokamak b u i l d i n g . The hot c e l l f a c i l i t y c h a r a c t e r i s t i c s
a re simmiarized i n Table 9 - 6 .
I n add i t ion t o the hot c e l l s izes and genera l arrangement, an
i n i t i a l est imate has been made o f the maintenance and handling equipment.
Th is est imate i s summarized i n Table 9 - 7 . The equipment l i s t i s based
on expected needs o f hot c e l l operations o f the Hot Experimental F a c i l i t y
and judgement o f the needs o f the FED a p p l i c a t i o n .
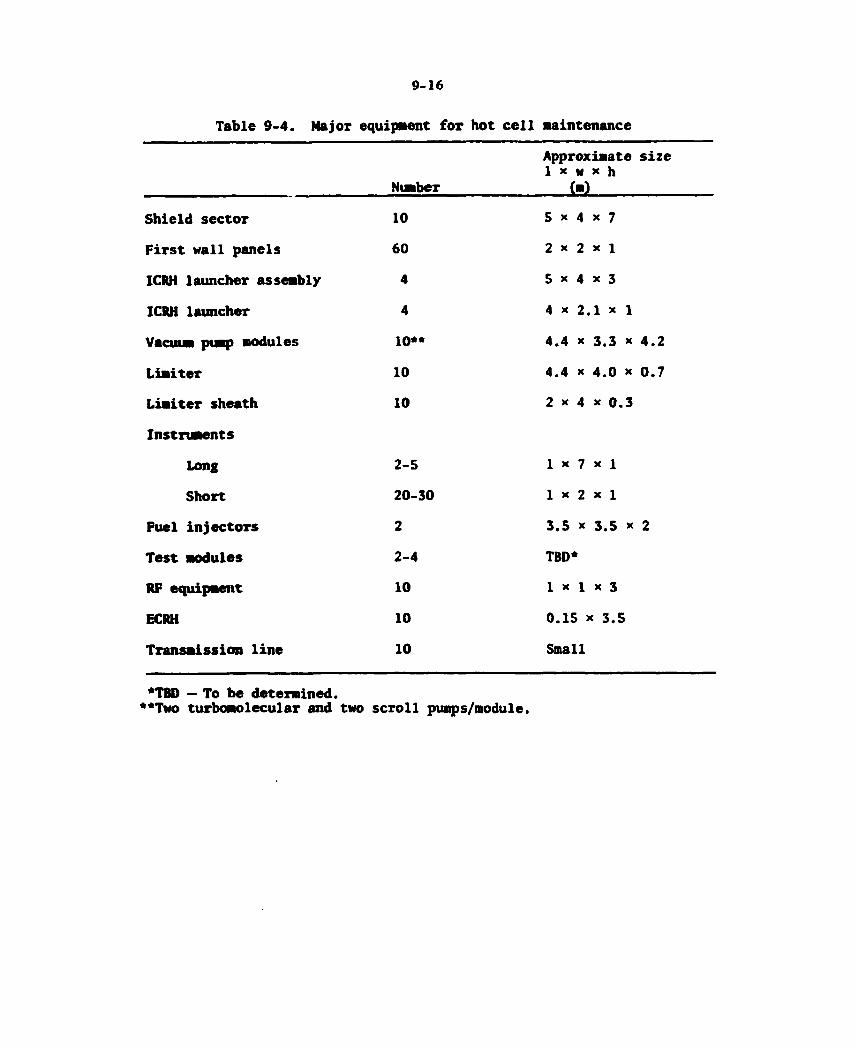
9-16
T a b l e 9 - 4 . M a j o r equipment f o r h o t c e l l m a i n t e n a n c e
Nimiber
A p p r o x i m a t e s i z e 1 * w x h
(m)
S h i e l d s e c t o r 10 5 x 4 x 7
F i r s t w a l l p a n e l s 6 0 2 x 2 x 1
ICRH l a u n c h e r assembly 4 5 x 4 x 3
ICRH l a u n c h e r 4 4 x 2 . 1 x 1
Vacuum pump modules 1 0 * * 4 . 4 x 3.3 x 4 . 2
L i m i t e r 10 4 . 4 x 4 . 0 x 0 . 7
L i m i t e r s h e a t h 10 2 x 4 x 0 . 3
I n s t r u m e n t s
Long 2 - 5 1 * 7 x 1
S h o r t 2 0 - 3 0 1 x 2 x 1
F u e l i n j e c t o r s 2 3.5 x 3.5 x 2
T e s t modules 2 - 4 TBD*
RF equ ipment 10 1 x 1 x 3
ECRH 10 0 . 1 5 x 3 . 5
T r a n s m i s s i o n l i n e 10 Small
*TBD — To be d e t e r m i n e d . • • T w o t u r b o m o l e c u l a r and two s c r o l l pumps/module.
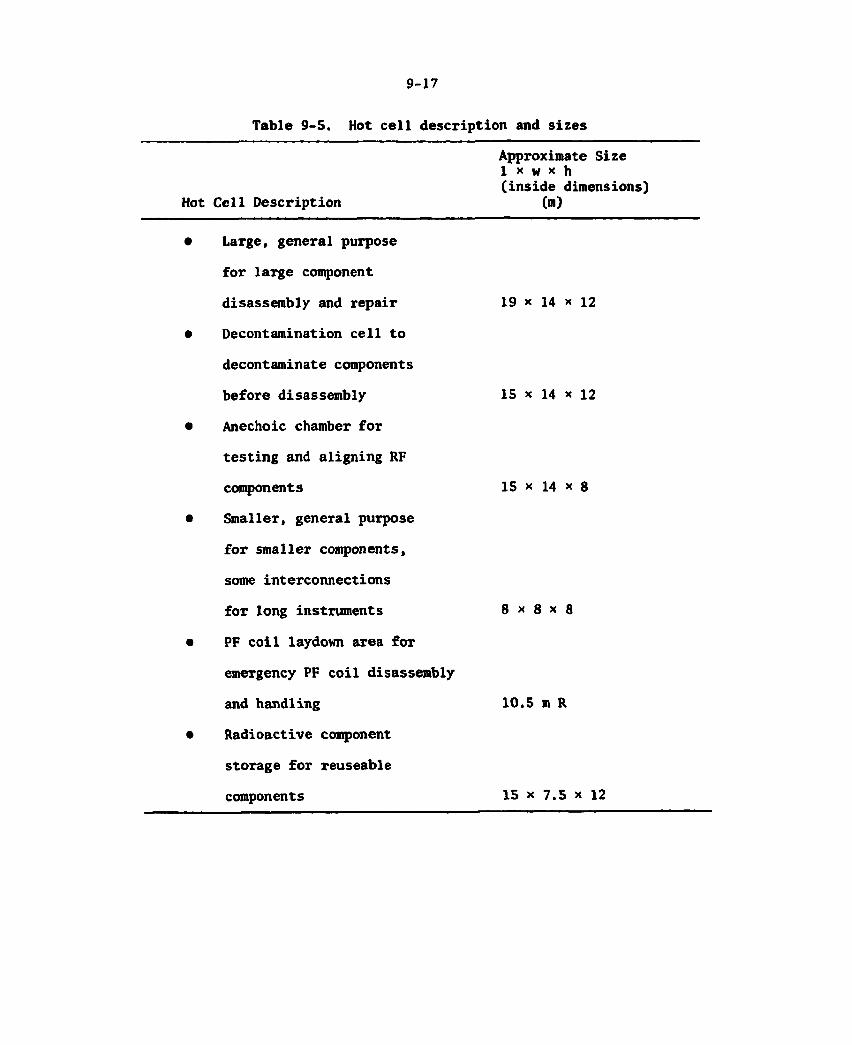
9-17
Table 9-5. Hot cell description and sizes
Hot Cell Description
Approximate Size 1 x w x h (inside dimensions)
O n )
Large, general purpose
for large component
disassembly and repair
Decontamination cell to
decontaminate components
before disassembly
Anechoic chamber for
testing and aligning RF
components
Smaller, general purpose
for smaller components,
some interconnections
for long instruments
PF coil laydovm area for
emergency PF coil disassembly
and handling
Radioactive component
storage for reuseable
components
19 x 14 x 12
15 x 14 x 12
15 x 14 x 8
8 x 8 x 8
10.5 m R
15 x 7.5 x 12

9-18
Table 9 - 6 . Hot c e l l f a c i l i t y c h a r a c t e r i s t i c s
Construct ion type • Cont ro l l ed v e n t i l a t i o n
Resistant t o n a t u r a l phenomena and miss i l es
S i z e l ength • 78 m \
w id th * 52 m
he ight « 32 m
Most i n t e r i o r , some e x t e r i o r w a l l s , and roo f constructed w i t h up t o two meters o f concrete f o r s h i e l d i n g .
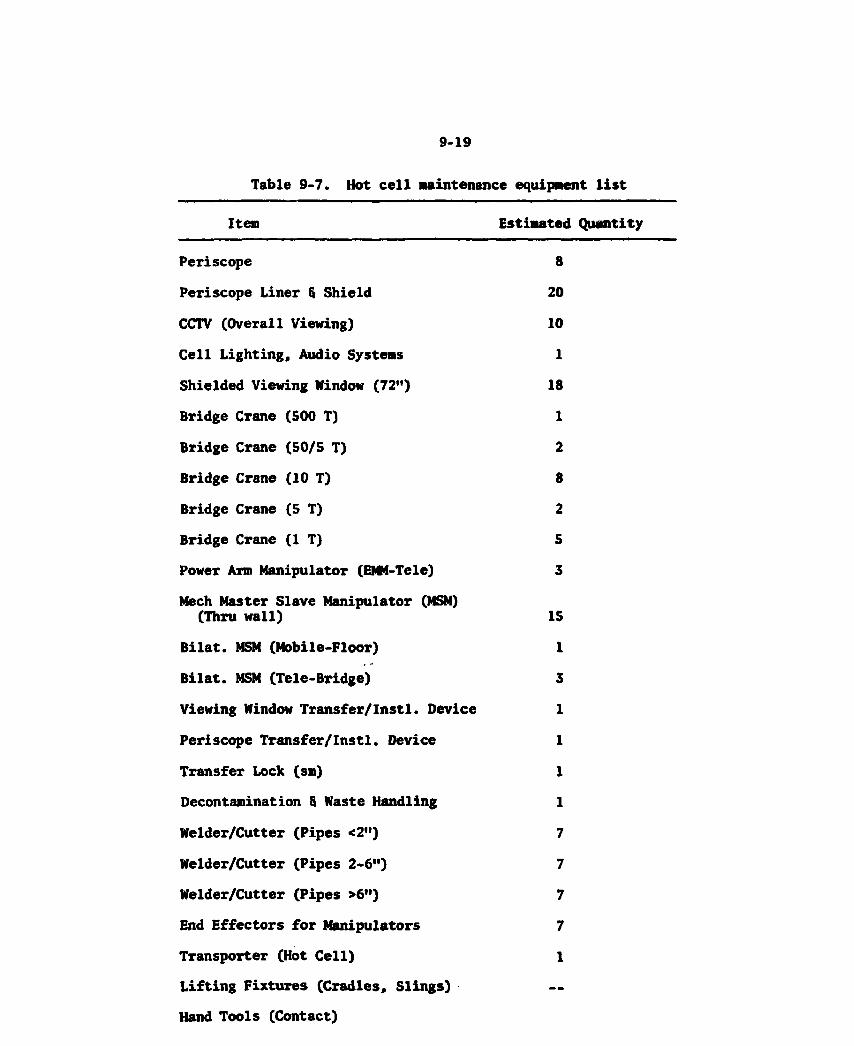
8 -19
Table 9-7. Hot cell maintenance equipment list
Item Estimated Quantity
Periscope
Periscope Liner § Shield
CCTV (Overall Viewing)
Cell Lighting, Audio Systems
Shielded Viewing Window (72")
Bridge Crane (500 T)
Bridge Crane (50/5 T)
Bridge Crane (10 T)
Bridge Crane (5 T)
Bridge Crane (IT)
Power Arm Manipulator (EMf-Tele)
Mech Master Slave Manipulator (MSM) (Thru wall)
Bilat. MSM (Mobile-Floor)
Bilat. MSM (Tele-Bridge)
Viewing Window Transfer/Inst1. Device
Periscope Transfer/Instl. Device
Transfer Lock (sm)
Decontamination § Waste Handling
Welder/Cutter (Pipes <2")
Welder/Cutter (Pipes 2-6")
Welder/Cutter (Pipes >6")
End Effectors for Manipulators
Transporter (Hot Cell)
Lifting Fixtures (Cradles, Slings)
Hand Tools (Contact)
8 20
10
1
18
1
2
8 2
S
3
15
1
3

8-20
Design options
A major design option was the possible selection of more special purpose cells. Special purpose cells would be more responsive to quick repair times needed to support high availability. Each special purpose cell could be equipped to handle and repair only one component type. While repair time could be greatly decreased with special purpose cells, the cost of building and equipping such cells would greatly increase the cost of the hot cell facility.
At the other extreme, another design option is the use of the tokamak building for maintenance so that no hot cell facility would be provided. While this would eliminate the need for one facility, it would significantly increase the size and cost of the tokamak building. Performing all the radioactive repair and maintenance in the tokamak building is also expected to greatly increase repair times due to increased restraints on working conditions and maintenance equipment which in turn would decrease plant availability.
The selected design is a compromise between the two extremes. A hot cell facility is provided with general purpose hot cells capable of maintaining the major radioactive components. Some component mainte-nance within the tokamak building is still expected. The compromise allows a reasonable chance of attaining the desired availability without greatly expanding the cost of the plant.
9.2 ADDITIONAL FACILITIES
Additional facilities have been identified as necessary to describe a complete plant with all the major services and support for FED main-tenance and operation. Varying degrees of detail have been included in the development of these facilities, but no consistent detailed design effort has been applied to any of the facilities. The additional facilities include all the major buildings and areas necessary to provide a complete plant. A summary listing of the building sizes is given in Table 9-8. Various building construction types are classified in Table 9-9. A possible site general building arrangement is shown in Fig. 9-2 which is based on the buildings in Table 9-8.
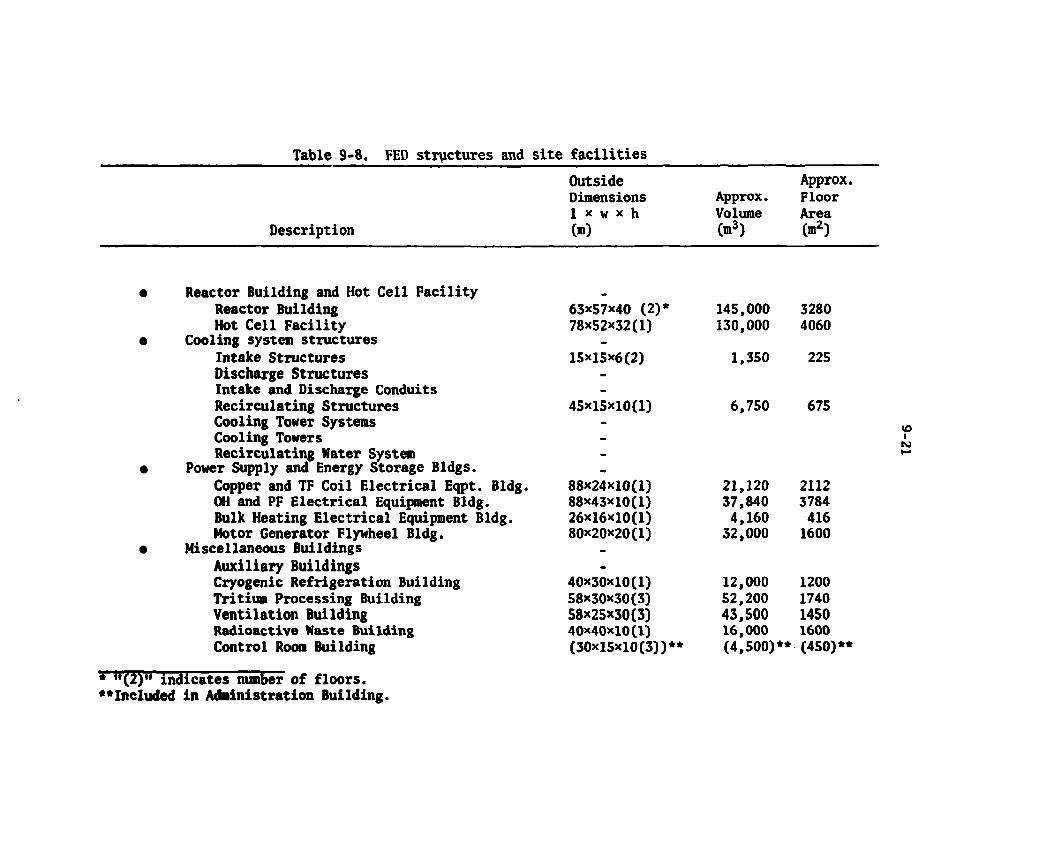
Table 9-8. FED structures and site facilities Outside Approx. Dimensions Approx. Floor 1 x w * h Volume Area
Description ( m ) C m 3 ) ( m 2 )
e Reactor Building and Hot Cell Facility Reactor Building 63x57x40 (2)* 145,000 3280 Hot Cell Facility 78x52x32(1) 130,000 4060
e Cooling system structures -
Intake Structures 15x15x6(2) 1,350 225 Discharge Structures -
Intake and Discharge Conduits -
Recirculating Structures 45x15x10(1) 6,750 675 Cooling Tower Systems -
Cooling Towers -
Recirculating Water System -
e Power Supply and Energy Storage Bldgs. -
Copper and TF Coil Electrical Eqpt. Bldg. 88x24x10(1) 21,120 2112 OH and PF Electrical Equipment Bldg. 88x43x10(1) 37,840 3784 Bulk Heating Electrical Equipment Bldg. 26x16x10(1) 4,160 416 Motor Generator Flywheel Bldg. 80x20x20(1) 32,000 1600
e Miscellaneous Buildings Auxiliary Buildings Cryogenic Refrigeration Building 40x30x10(1) 12,000 1200 Tritium Processing Building 58x30x30(3) 52,200 1740 Ventilation Building 58x25x30(3) 43,500 1450 Radioactive Waste Building 40x40x10(1) 16,000 1600 Control Room Building (30x15x10(3))** (4,500)** (450)**
* "(2)" indicates number of floors. **Included in Administration Building.
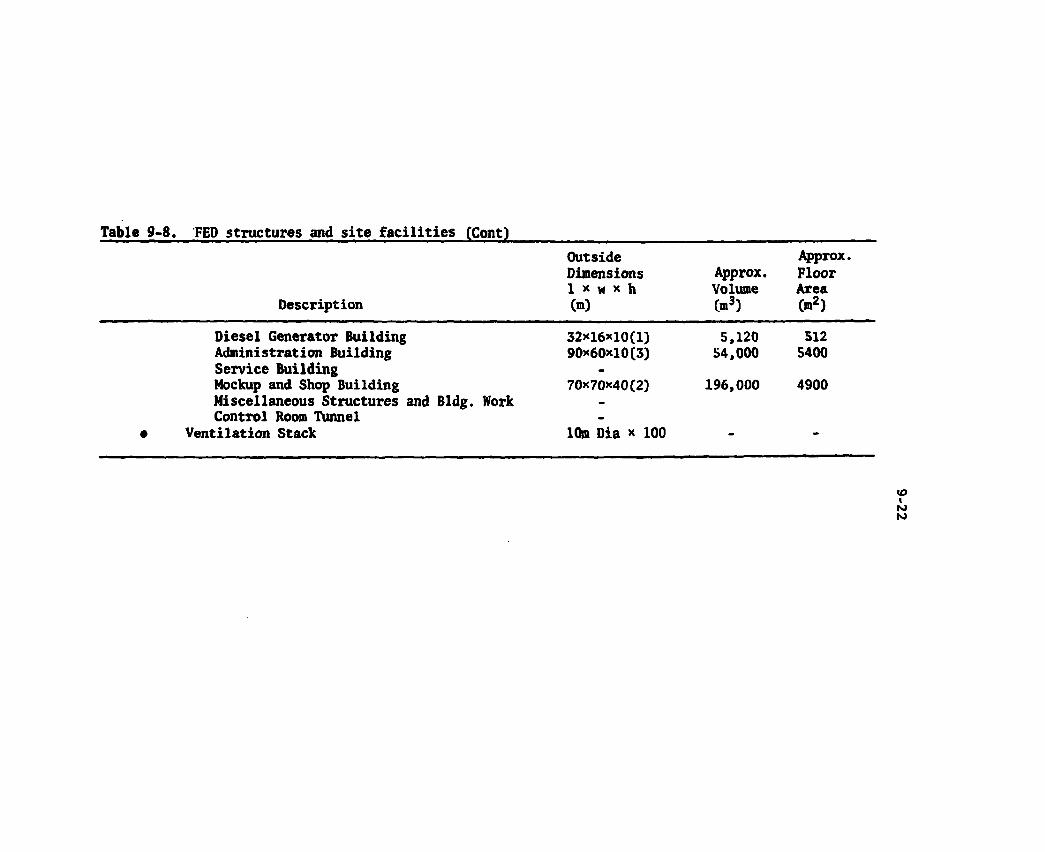
Table 9-8. FED structures and site facilities (Cont)
Description
Outside Dimensions 1 x w x h Cm)
Approx. Volume (m3)
Approx. Floor Area C ® 2 )
e
Diesel Generator Building Administration Building Service Building Mockup and Shop Building Miscellaneous Structures and Bldg. Work Control Room Tunnel
Ventilation Stack
32x16x10(1) 90x60x10(3)
70x70x40(2)
10m Dia x 100
5,120 54,000
196,000
512 5400
4900
<0 I N to
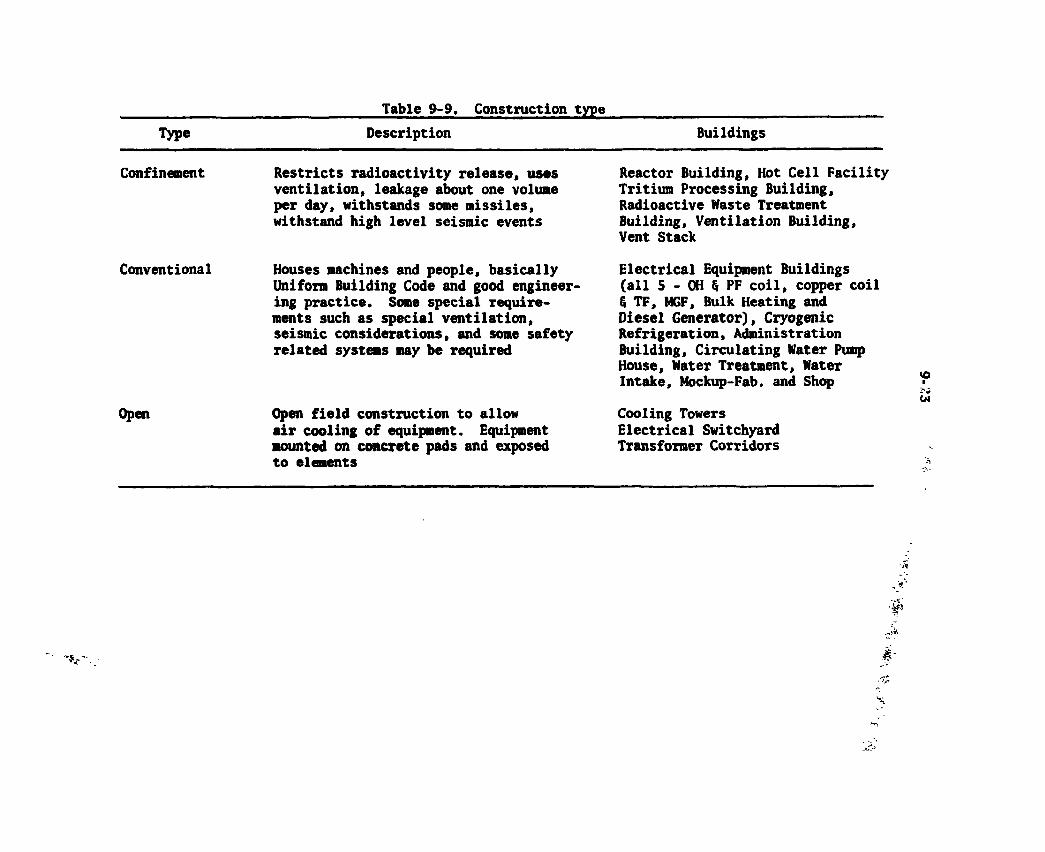
Type
Table 9-9. Construction type Description Buildings
Confinement Restricts radioactivity release, uses ventilation, leakage about one volume per day, withstands some missiles, withstand high level seismic events
Conventional Houses machines and people, basically Uniform Building Code and good engineer ing practice. Some special require-ments such as special ventilation, seismic considerations, and some safety related systems may be required
Open Open field construction to allow air cooling of equipment. Equipment mounted on concrete pads and exposed to elements
Reactor Building, Hot Cell Facility Tritium Processing Building, Radioactive Waste Treatment Building, Ventilation Building, Vent Stack
Electrical Equipment Buildings (all 5 - OH § PF coil, copper coil & TF, MGF, Bulk Heating and Diesel Generator), Cryogenic Refrigeration, Administration Building, Circulating Water Pump House, Water Treatment, Water Intake, Mockup-Fab. and Shop
Cooling Towers Electrical Switchyard Transformer Corridors
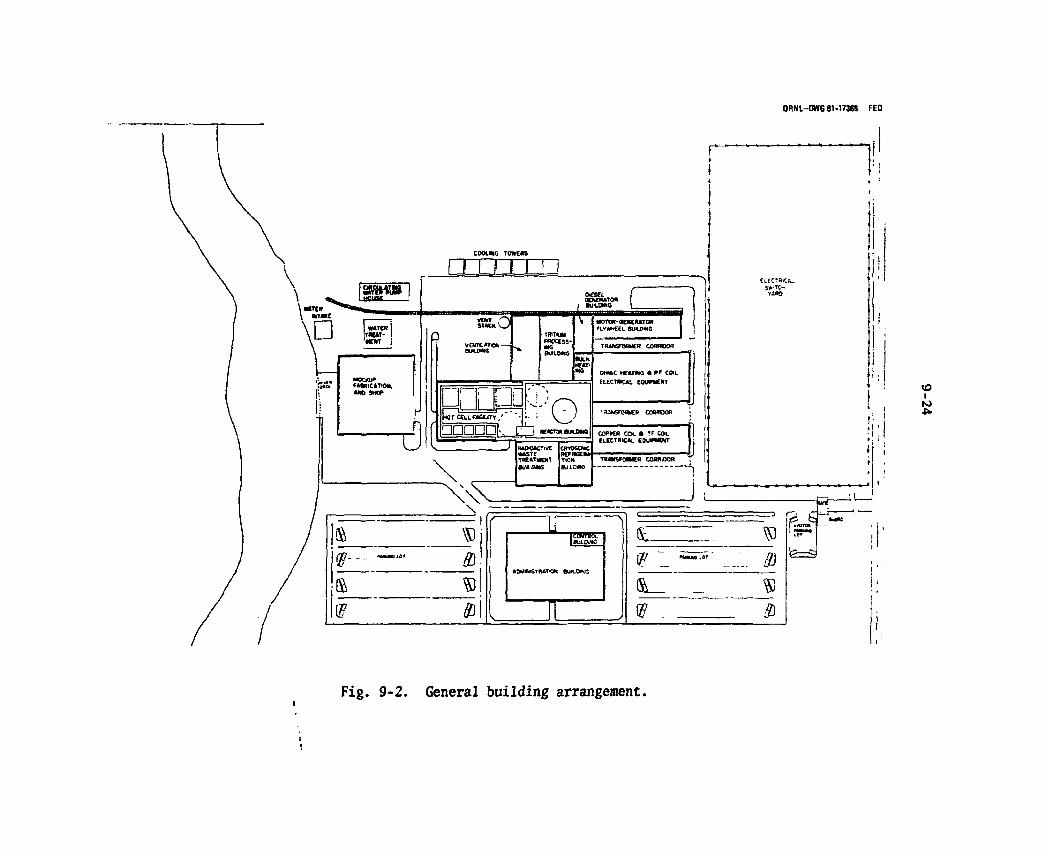
ORNL-DWG 81-17368 FED
W 0
(V, i - J
v
•»W6 iOT J
f t
fa*—CJ
U) N>
Fig. 9-2. General building arrangement.

8-25
9.2.1 Cooling System Structures
Requirements
The primary purposes of the cooling system structures are to house the recirculating water system and to provide adequate heat removal capacity for FED operation. The total peak thermal power for 8 T operation is estimated at 512 MW^. Most of this thermal energy will have to be rejected through the cooling system. The cooling system consists of the recirculating water system, pumps, pipes, valves, heat exchangers, and cooling towers to provide the required heat rejection capacity. The current design goal requires that the FED plant be designed to support 8 T operation and then to determine what limited 10 T operation can be supported with the same equipment. In some cases, the equipment may have to be changed or supplemented and in other cases, 10 T operation will imply a modified plant design. For the cooling systems, it appears that some 10 T operation will be possible using the system designed for 8 T operation. While the peak thermal power for 10 T operation is estimated at close to 814 MW^, the thermal inertia of the system can be used to keep the peak temperatures within acceptable bounds. This will probably require that the dwell time between burns be adjusted to assure that adequate initial temperature conditions are achieved before initiating the next pulse. The thexmal power to be discharged from the plant is summarized for both 8 T and 10 T cases in Table 9-10.
Baseline design
The structures required to support the cooling system are the water intake structure, discharge structure, water treatment building, conduits, recirculating water pump house and conduits, and cooling towers. Since this system has not yet been specified in any detail, the structure sizes as shown in Table 9-8 and Fig. 9-2 were developed primarily by analogy and rough scaling from other plants. Preliminary discussions with cooling tower manufacturers have led to the specification of wooden

8-26
cooling towers. Seven towers of relatively standard design appear sufficient to discharge the anticipated thermal eneTgy.
Design options
The only parts of the cooling system structure to be investigated so far are the cooling towers. Discussions with cooling tower manu-facturers suggest that a wide variety of cooling towers exist to fill a wide range of design conditions. Concrete, natural draft cooling towers are often selected for power plant designs because they exhibit low operating and maintenance cost over long lifetimes. However, the initial construction costs are higher than for other types. Mechanical draft towers usually are cheaper initially but have higher operating and maintenance costs. The building materials can be selected to optimize costs and expected cooling tower life. The FED conditions of low availability (^20%) and a ten year plant life suggests that the initial costs can be reduced at the expense of operating and maintenance costs. At 20% availability, the operating costs are not expected to be a major factor and the 10 year plant life allows selection of less expensive construction techniques and materials. Wooden cooling towers with mechanical draft appear to be the best type for these conditions. Seven or eight units of a size which is commercially available should provide adequate thermal energy dissipation for FED. The major restriction with commonly available wooden towers is that the maximum temperature may be limited to about 130°F (54°C). This restriction does not currently constitute a major limitation for the FED design.
Performance
The cooling system will remove almost all of the thermal energy from the components and equipment throughout the plant. The thermal energy in most cases will be transferred from primary coolant loops to the recirculating water system through heat exchangers. In some cases, the recirculating water may be used to cool the components directly. In other cases, air cooling might be used and then the heat removed from
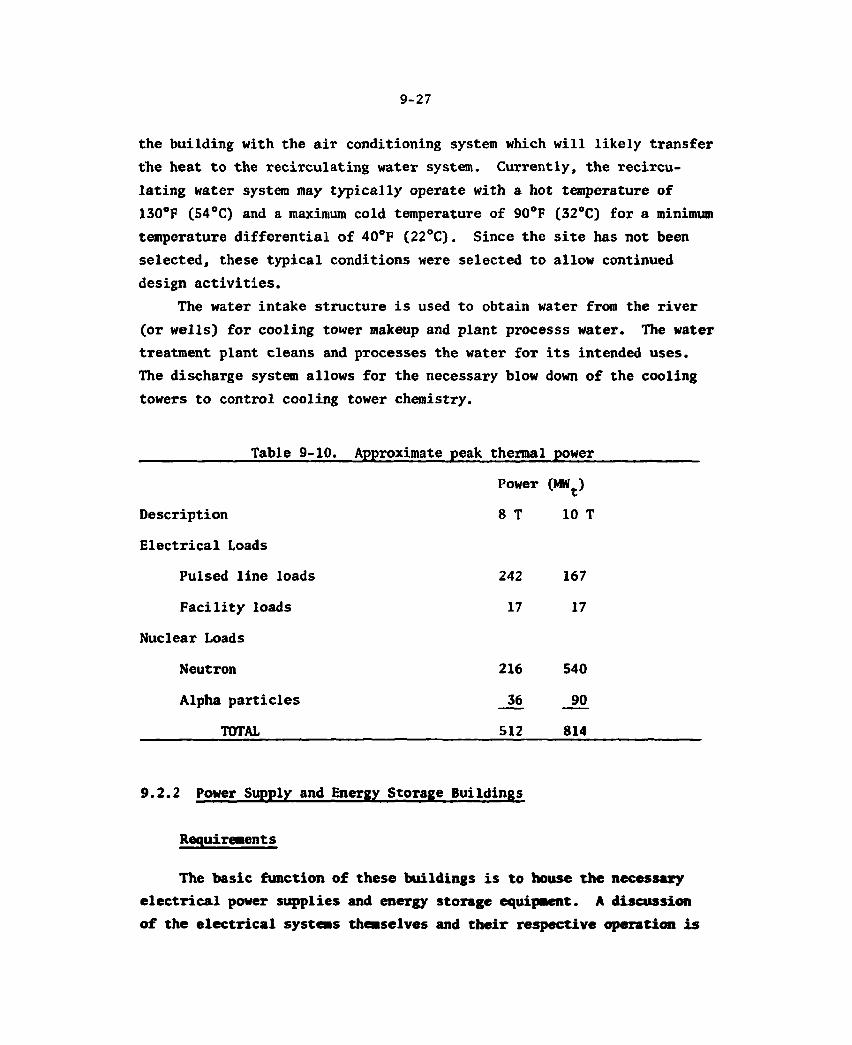
8-27
the building with the air conditioning system which will likely transfer the heat to the recirculating water system. Currently, the recircu-lating water system may typically operate with a hot temperature of 130°F (54°C) and a maximum cold temperature of 90°F (32°C) for a minimum temperature differential of 40°F (22°C). Since the site has not been selected, these typical conditions were selected to allow continued design activities.
The water intake structure is used to obtain water from the river (or wells) for cooling tower makeup and plant processs water. The water treatment plant cleans and processes the water for its intended uses. The discharge system allows for the necessary blow down of the cooling towers to control cooling tower chemistry.
Table 9-10. Approximate peak thermal power
Power CMWt)
Description 8 T 10 T
Electrical Loads
Pulsed line loads 242 167
Facility loads 17 17
Nuclear Loads
Neutron 216 540
Alpha particles 36 90
TOTAL 512 814
9 . 2 . 2 Power Supply and Energy Storage Buildings
Requirements
The basic func t ion o f these bui ld ings i s to house the necessary
e l e c t r i c a l power suppl ies and energy storage equipment. A discussion
o f the e l e c t r i c a l systems themselves and t h e i r respect ive operat ion i s

8-28
discussed in Chapter 7. Five buildings arc neccssary for this function; copper and TF coil clcctrical equipment building, GH and PF electrical equipment building, bulk heating electrical equipment building, motor-generator- flywheel building, and diesel generator building. These buildings arc necessary to protcct the equipment from the elements and to provide an adequate environment for operation and maintenance of the equipment.
Baseline design
The size of the copper and TF coil electrical equipment buildings was approximately determined from rough equipment sizes and arrangements. The OH and PF electrical equipment building was judged to be approximately twice the size of the copper and TF coil building. The bulk heating building was roughly estimated from anticipated equipment sizes. The MGF building was based on similar structures for other projects. It is sized for four MGF sets to be mounted in four pits in the floor of the building. The copper and TF coil and the OH and PF coil buildings are expccted to have substantial amounts of air cooled equipment mounted on the roof. The transformer corridors shown in Fig. 9-2 along these two buildings are a necessary part of the layout since both sets of equip-ment require a large number of transformers which can be yard mounted.
9.2.3 Miscellaneous Buildings
Requirements
The miscellaneous buildings include eight buildings necessary to support the operation of FED. The auxiliary buildings house equipment which provides necessary services to the tokamak device in the areas of cryogenic refrigeration, tritium processing, and ventilation. The radioactive waste building must provide housing for the radioactive waste treatment systems which process and package for shipment and disposal most of the radioactive wastes produced within the plant. These

8-29
include materials such as spent resins from coolant demineralization, decontamination solutions, contaminated clothing, and expendable materials. The control room building is combined with the administration building. It provides a location for control equipment and plant operators. The diesel generator building houses the diesel generators necessary for essential power in case of emergencies. The administration building is intended to provide office space, cafeteria, meeting rooms, and auditorium for the operating staff and visiting research workers. The mockup and shop building provides space for a full scale mockup of about three-tenths of the tokamak device (i.e., three segments), electrical and mechanical shops, and warehouse space.
Baseline design
None of the miscellaneous building sizes are based on detailed system designs. The basis for size estimates are experience, analogy with other plants and studies, and scaling from other plants and studies. The ventilation building is included because of the perceived need for voluminous ventilation equipment to control the air flow and provide for tritium cleanup within the tokamak building, hot cell facility, and triitum processing building. The administration building is based on an estimate of approximately 1000 people needed to conduct machine operations. The control room building was placed in the administration building to allow good access of research workers to data-taking devices. The control room building is separated from the main plant to provide greater safety for the operators.
9.2.4 Miscellaneous Structures and Building Work
Requirements
Currently only the tunnel from the control room building to the tokamak building has been identified. This tunnel is necessary to carry the signal and control circuits for control of the device. Other tunnels and structures are likely to be identified as more detailed designs are developed. The control room tunnel size has not yet been estimated.

10-8
9.2.5 Ventilation Stack
Requirements
The vent stack is required as part of the confinement system to mitigate and reduce the consequences of postulated radioactive material releases. By releasing the tritium and activated products through a tall stack, the effluents have more time to disperse in the atmosphere and thus have considerably less impact on persons living near the site boundary and the environment in general. No design information beyond the approximate dimensions shown in Table 9-8 have been developed.
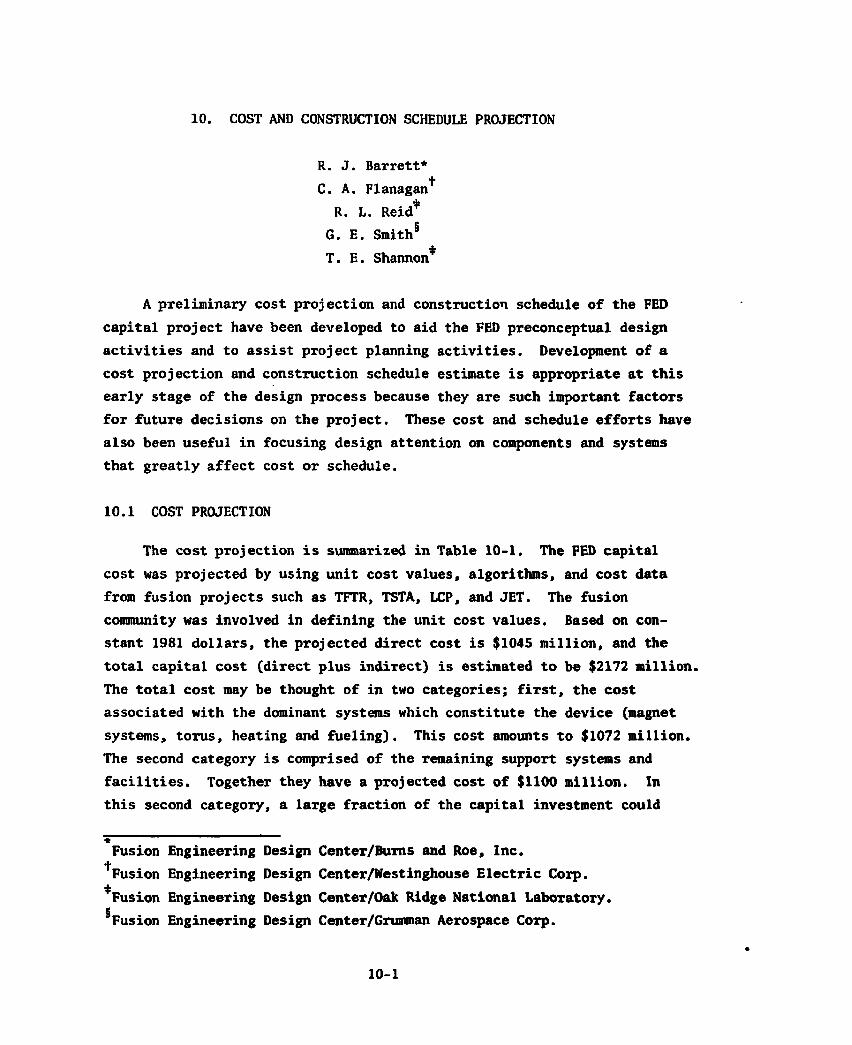
10. COST AND CONSTRUCTION SCHEDULE PROJECTION
R. J. Barrett* + C. A. Flanagan
R. L. Reid* g G. E. Smith T. E. Shannon*
A preliminary cost projection and construction schedule of the FED capital project have been developed to aid the FED preconceptual design activities and to assist project planning activities. Development of a cost projection and construction schedule estimate is appropriate at this early stage of the design process because they are such important factors for future decisions on the project. These cost and schedule efforts have also been useful in focusing design attention on components and systems that greatly affect cost or schedule.
10.1 COST PROJECTION
The cost projection is summarized in Table 10-1. The FED capital cost was projected by using unit cost values, algorithms, and cost data from fusion projects such as TFTR, TSTA, LCP, and JET. The fusion community was involved in defining the unit cost values. Based on con-stant 1981 dollars, the projected direct cost is $1045 million, and the total capital cost (direct plus indirect) is estimated to be $2172 million. The total cost may be thought of in two categories; first, the cost associated with the dominant systems which constitute the device (magnet systems, torus, heating and fueling). This cost amounts to $1072 million. The second category is comprised of the remaining support systems and facilities. Together they have a projected cost of $1100 million. In this second category, a large fraction of the capital investment could
• Fusion Engineering Design Center/Burns and Roe, Inc.
*Fusion Engineering Design Center/Westinghouse Electric Corp. *Fusion Engineering Design Center/Oak Ridge National Laboratory, s Fusion Engineering Design Center/Grumman Aerospace Corp.
10-1
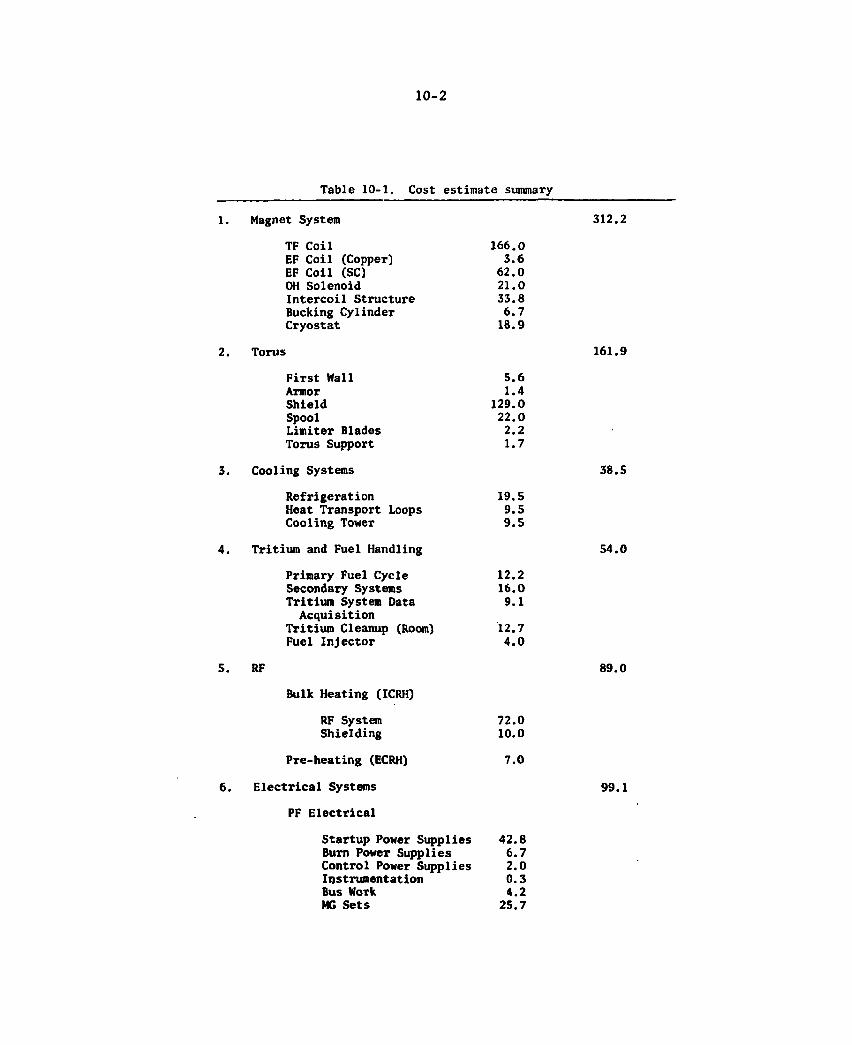
10-2
Table 10-1. Cost estimate summary
1. Magnet System 312.2
TF Coil 166.0 EF Coil (Copper) 3.6 EF Coil (SC) 62.0 OH Solenoid 21.0 Intercoil Structure 33.8 Bucking Cylinder 6.7 Cryostat 18.9
2. Torus 161.9
First Wall 5.6 Armor 1.4 Shield 129.0 Spool 22.0 Limiter Blades 2.2 Torus Support 1.7
3. Cooling Systems 38.5
Refrigeration 19.5 Heat Transport Loops 9.5 Cooling Tower 9.5
4. Tritium and Fuel Handling 54.0
Primary Fuel Cycle 12.2 Secondary Systems 16.0 Tritium System Data 9.1 Acquisition
Tritium Cleanup (Room) 12.7 Fuel Injector 4.0
5. RF 89.0
Bulk Heating (ICRH)
RF System 72.0 Shielding 10.0
Pre-heating (ECRH) 7.0
6. Electrical Systems 99.1
PF Electrical
Startup Power Supplies 42.8 Burn Power Supplies 6.7 Control Power Supplies 2.0 Instrumentation 0.3 Bus WoTk 4.2 MG Sets 25.7
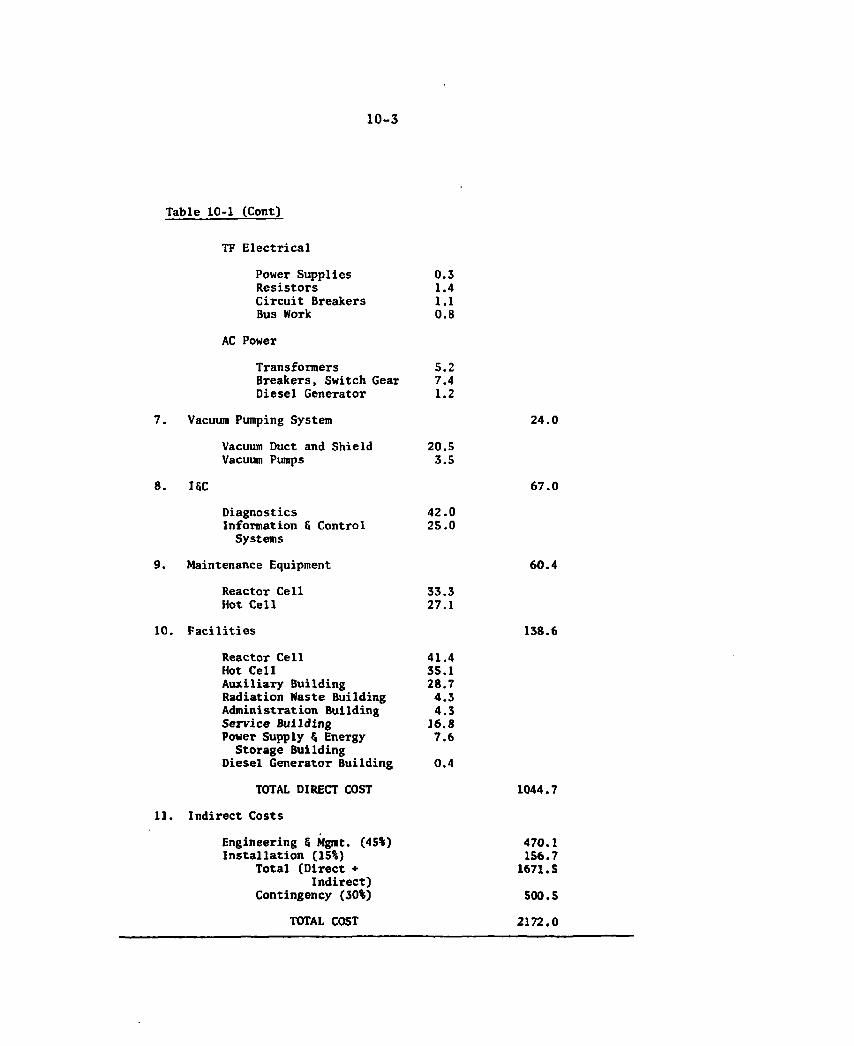
10-3
Table 10-1 (Cont)
TF Electrical
Power Supplies 0.3 Resistors 1.4 Circuit Breakers 1.1 Bus Work 0.8
AC Power
Transformers 5.2 Breakers, Switch Gear 7.4 Diesel Generator 1.2
7. Vacuum Pumping System 24.0
Vacuum Duct and Shield 20.5 Vacuum Pumps 3.5
8. ISC 67.0
Diagnostics 42.0 Information 6 Control 25.0 Systems
9. Maintenance Equipment 60.4
Reactor Cell 33.3 Hot Cell 27.1
10. Facilities 138.6
Reactor Cell 41.4 Hot Cell 35.1 Auxiliary Building 28.7 Radiation Waste Building 4.3 Administration Building 4.3 Service Building 16.8 Power Supply 5 Energy 7.6 Storage Building
Diesel Generator Building 0.4
TOTAL DIRECT COST 1044.7
11. Indirect Costs
Engineering & Mgmt. (45%) 470.1 Installation (15%) 156.7
Total (Direct + 1671.5 Indirect)
Contingency (30%) 500.5
TOTAL COST 2172.0
10-4
potentially be re-used in a subsequent FED upgrade or in the Fusion Demonstration Plant to follow FED.
The projected yearly cost and completion schedule for the con-struction project (see Section 10.2) is shown in Table 10-2. Escalation would increase the total cost relative to the constant dollar cost existing at the start of the project. The 1981 constant dollar cost projection must also be escalated to the projected start date to estimate the total impact of escalation.
The projected completion schedule shows the classic peak in the middle years of construction when most of the material and construction is required. The schedule also shows a large relative peak in the second year due to the cost of superconductor base material which must be purchased relatively early. The size of the peak stems directly from the assumption that a major portion of the superconductor material would have to be purchased shortly after contract signing.
Costing assumptions
The following assumptions were made in developing the cost projection:
e All costs are based on constant 1981 dollars. e Direct capital costs include all costs associated with
component procurement and fabrication including shipping to the construction site.
e The indirect capital costs include engineering design and project management as well as all equipment installation and assembly at the construction site.
e A 30% contingency is included in the total cost. e The estimate is only for the FED construction project and
does not include any operating or maintenance costs, spare parts, fuel, associated research and development, transmission lines or decommissioning.
Direct costs were estimated by applying unit cost values and cost algorithms that have been developed as part of the FEDC systems code.
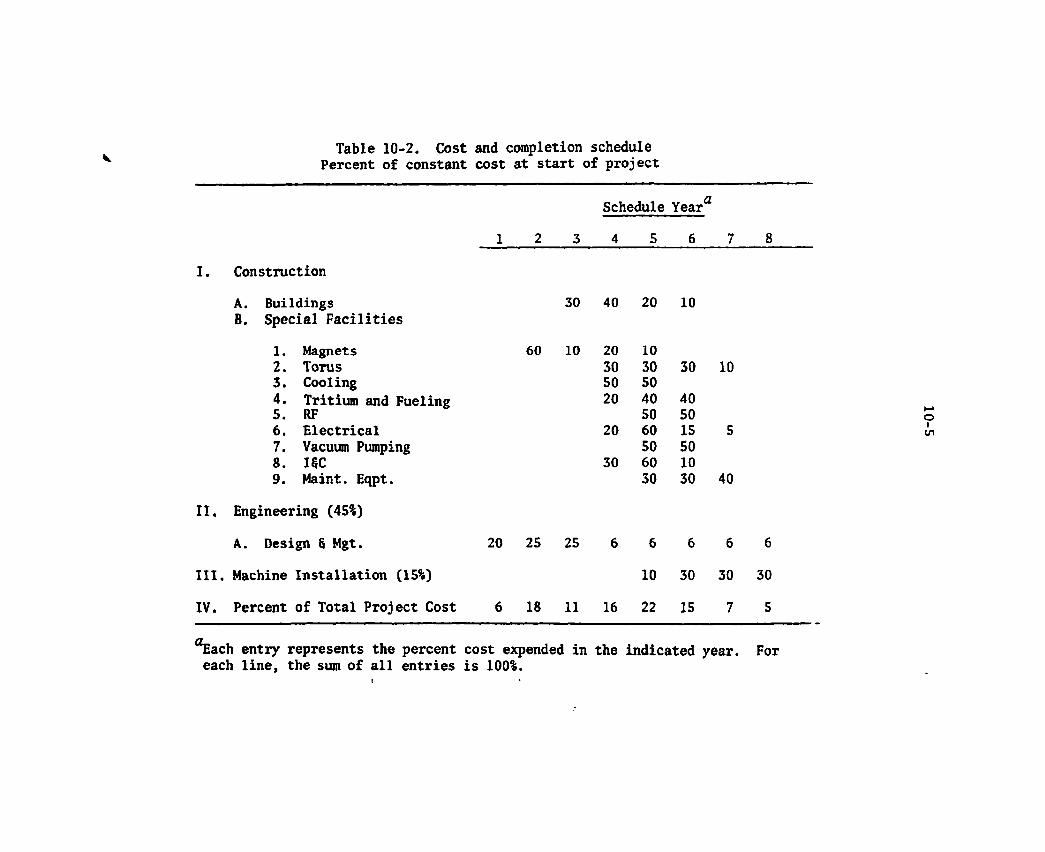
Table 10-2. Cost and completion schedule Percent of constant cost at start of project
Schedule Yeara
1 2 3 4 5 6 7 8
I. Construction
A. Buildings 30 40 20 10 B. Special Facilities
1. Magnets 60 10 20 10 2. TOTUS 30 30 30 10 3. Cooling 50 50 4. Tritium and Fueling 20 40 40 5. RF 50 50 6. Electrical 20 60 15 5 7. Vacuum Pumping 50 50 8. ISC 30 60 10 9. Maint. Eqpt. 30 30 40
II. Engineering (45%)
A. Design & Mgt. 20 25 25 6 6 6 6 6
III. Machine Installation (15%) 10 30 30 30
IV. Percent of Total Project Cost 6 18 11 16 22 15 7 5
aEach entry represents the percent cost expended in the indicated year. For each line, the sum of all entries is 100%.
10-6
The indirect costs for engineering (45%), installation and assembly (15%) are based on fixed percentages of the direct costs and represent a best judgement based on recent large DOE projects.
Integration of cost and schedule
The cost projection and construction schedule were combined to give the cost and completion schedule (Table 10-2) even though each was created on a somewhat different basis. The construction schedule was estimated as a success-oriented schedule to provide insight into FED design and planning activities. The cost projection was based on approximate unit cost projections which were not detailed enough to include the subtleties of construction differences. This success-oriented schedule has not fully integrated many of the construction realities which are likely to impact the cost projection. The expected relationship of cost versus construction schedule is shown schematically in Figure 10-1. Unfortunately, the FED design details do not support the development of a quantitative curve which would show how the costs would be increased by either increasing or decreasing the construction schedule from the point of minimum cost. Costs tend to be increased by loss of productivity and by inflation when the schedule is increased. Conversely, costs tend to be increased by the high costs of expediting construction activities as the schedule is decreased.
Cost estimate backup
In order to develop a broad basis for the FED cost projection within the framework of the current design status, a special workshop was held involving cognizant organizations in the fusion community. The workshop was held in two separate sessions a month apart. During this period, the participating organizations developed independent cost estimates of the FED systems. The workshop participants were:
i e Fusion Engineering Design Center (FEDC) e Burns § Roe, Inc. (BGR) e General Atomic (GA)
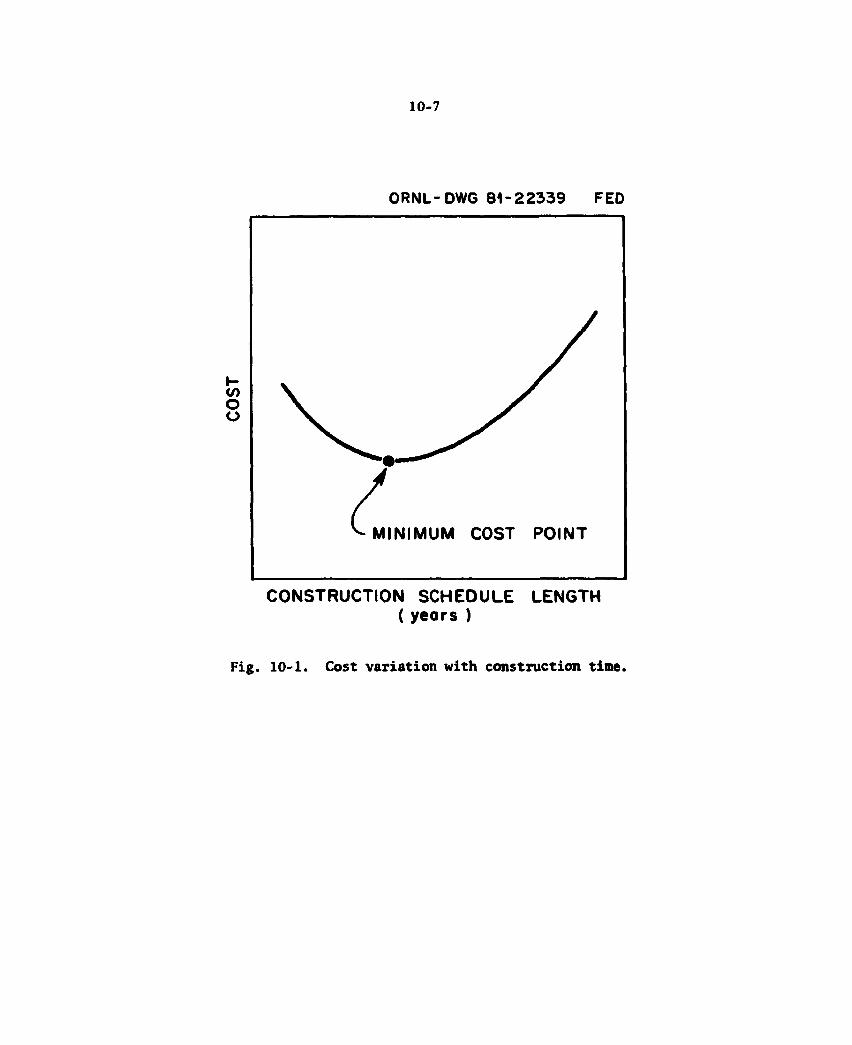
10-7
ORNL-DWG 81 -22339 FED
CONSTRUCTION SCHEOULE LENGTH ( years )
Fig. 10-1. Cost variation with construction time.
10-8
• Grumman Aerospace Corporation (GAC) • McDonnell Douglas Astronautics Company (MDAC) • Massachusetts Institute of Technology (MIT) • Large Coil Program/Oak Ridge National Laboratory (LCP/ORNL) • Princeton Plasma Physics Laboratory (PPPL) • Tennessee Valley Authority (TVA) • Nestinghouse Electric Corporation (W)
Detailed costs were developed at the same subsystem level as the FEDC estimate shown in Table 10-1. However, since at the time of the workshop the 10-T design was not yet finished, the costs are based on an earlier 8-T concept. The 10-T concept is estimated to cost ^11% more than the 8-T concept due mainly to increased costs of the magnet and electrical systems for the higher field operation.
A summary of the costs at the system level is given in Table 10-3 showing the range in values from low to high. The range between the low and high costs is $766 M to $1644 M, with an average of $1090 M.
Five of the individual system cost estimates appeared to be out of line with the others. These included the high value for the magnets and torus and the low value for the cooling, vacuum pumping, and ISC systems. With these numbers discarded, the range in cost values between the low and high values becomes $834 M to $1246 M. This leads to a modified average of $1010 M.
It is interesting to note that the magnets and torus costs, which represent almost one-half of the total cost, differed by a factor of two between the low and high estimate. This level of uncertainty is due to the fact that material and fabrication costs are not well understood for these new and complex technologies.
Costing conclusion
The FED direct cost is projected to be ^$1100 million. Indirect costs bring the total cost to approximately $2200 M. An eight-year construction project will result in additional escalation from the constant cost at the start of the project.
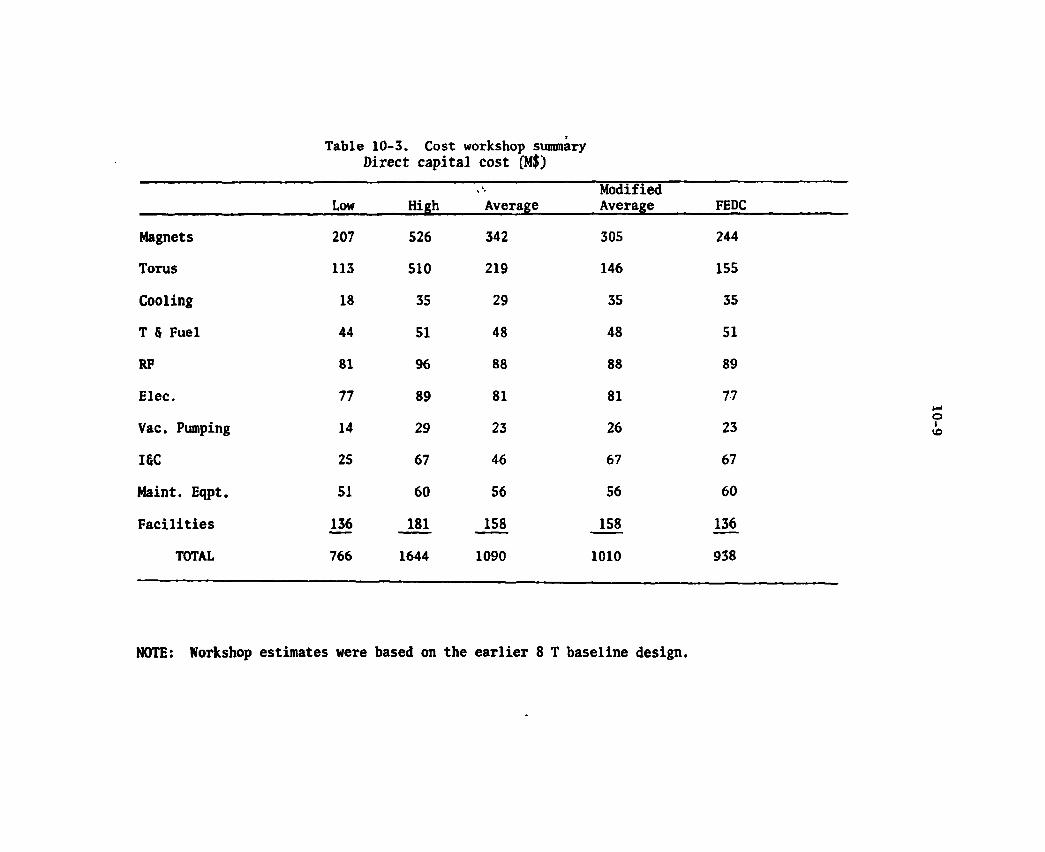
*
Table 10-3. Cost workshop summary Direct capital cost (M$)
Low High Average Modified Average FEDC
Magnets 207 526 342 305 244
Torus 113 510 219 146 155
Cooling 18 35 29 35 35
T 5 Fuel 44 51 48 48 51
RF 81 96 88 88 89
Elec. 77 89 81 81 77
Vac. Pumping 14 29 23 26 23
ISC 25 67 46 67 67
Maint. Eqpt. 51 60 56 56 60
Facilities 136 181 158 158 136
TOTAL 766 1644 1090 1010 938
NOTE: Workshop estimates were based on the earlier 8 T baseline design.

10-10
The cost workshop results provide an improved basis for the FED cost estimates. The results were encouraging in that there is reason-ably good agreement within the fusion community on the costs of the FED equipment and facilities. The results should not be interpreted to mean that the actual cost is known within the range presented. More detailed engineering design and development work is required before a project of this magnitude can be estimated with reasonable certainty.
10.2 CONSTRUCTION SCHEDULE PROJECTION
A preliminary construction schedule for FED has been developed and is summarized in Fig. 10-2. This effort was prompted by the need to identify the potential design impact of construction and to provide a basis for more detailed project planning. Both of these objectives are best satisfied by a success-oriented schedule which accentuates schedule drivers and complexities. The resulting schedule has been useful in identifying the most sensitive parts of the FED construction and installation process. It has also been useful in relating the project schedule needs to the proposed and current research and develop-ment activities. Finally, the schedule, together with the cost pro-jections and design description, serves to scope the magnitude of the FED project and to define the sequencing of project activities.
Schedule description
This schedule was developed by first estimating design, procurement, fabrication, and installation times for each major component and system. At the same time, an installation sequence was estimated. No project exists which has the same unique features and complexity as FED and this limits the amount of directly applicable experience. In addition, detailed design features, fabrication techniques, and contracting methods are not yet established for FED. Thus, the schedule and installation sequence estimates relied heavily on the judgement and experience of the Design Center and also relied on estimates made for other major construction activities both within and outside the fusion energy coomunity.
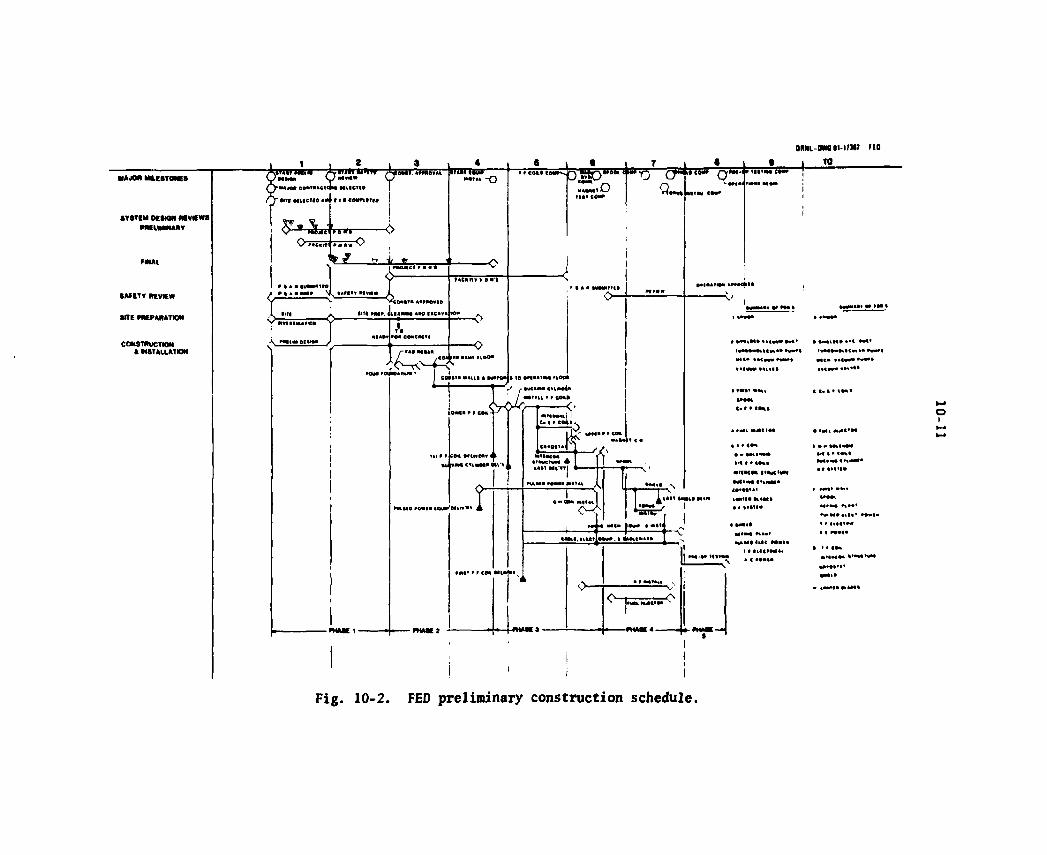
MA JO* MS.CSTONES
SYSTEM OCMN MEVCWS miMHM*
•*RTTV REVIEW
SHE NTFPARMION
CONSTRUCTION I MSTALLMHN
0 1
MtlftntHI
Fig. 10-2. FED preliminary construction schedule.

10-12
The details of the major equipment design and fabrication which must be accomplished so that installation can be achieved consistent with the overall schedule of Fig. 10-2 aTe given in Fig. 10-3. In this figure, the design and fabrication details are presented for a total of 22 major equipment items. The success of the overall schedule is dependent upon all of the indicated design and fabrication being com-pleted as scheduled. Note that the schedule for several of the major equipment systems is not shown on Fig. 10-3. These systems are judged not to be critical to the overall schedule and are included in the total listing for completeness. The schedule for these systems will be developed at a later date.
The following assumptions were made about the conditions existing at the start of the schedule:
e Beginning of preliminary design serves as the starting point for the schedule.
e A satisfactory conceptual design has been completed and approved.
e Major contractors, e.g., the project management, the construction management, the major component design organizations, and the architect and engineering firms have been selected and are ready to begin work.
e The site has been selected and the environmental impact statement has been completed and approved.
The construction schedule is conveniently viewed as comprised of five distinct phases. In the initial phase, the site is prepared, the design is started, the safety review is completed, and construction approval is received. Component design and procurement are performed in parallel to those preparatory activities so that components will be available for installation as required. This preparatory phase is expected to take about 24 months.
The second phase starts with actual construction activities on the tokamak building. During this phase, the tokamak building construction is taken to the point where device installation can begin. This tokamak building construction phase is expected to take about 21 months.
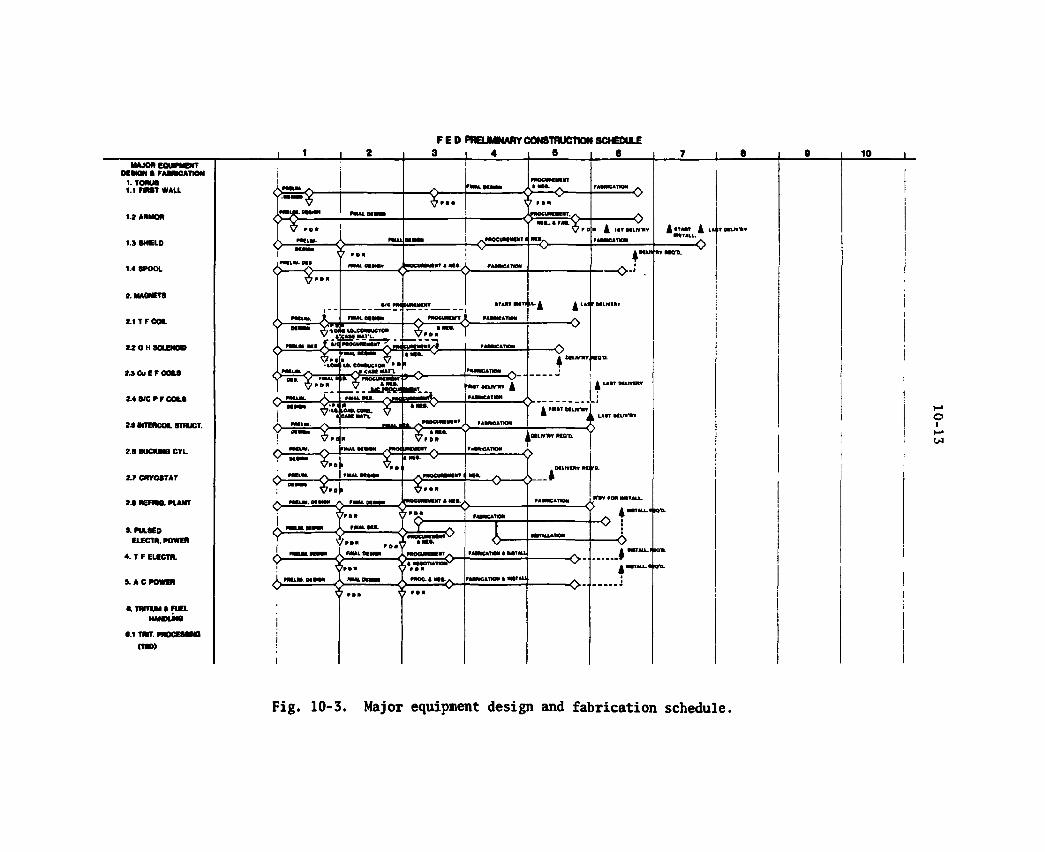
F E D PREUMMARY CONSTRUCTION SCHEDULE
Fig. 10-3. Major equipment design and fabrication schedule.
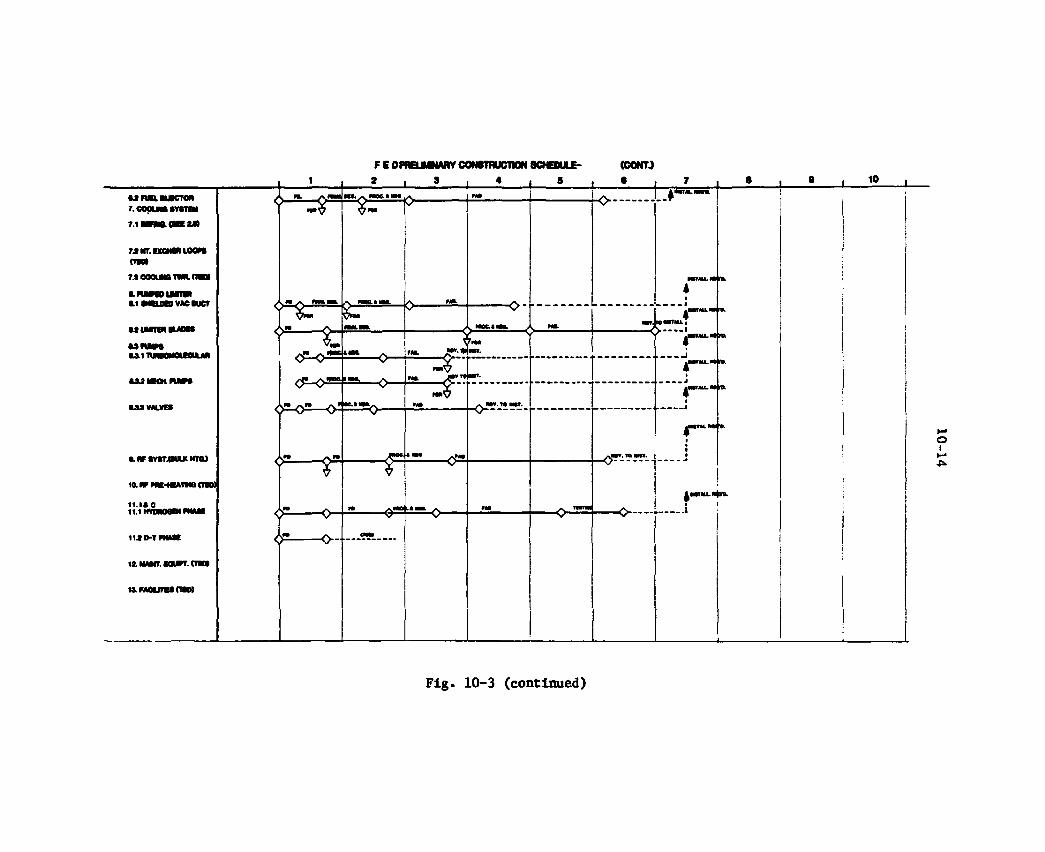
FEDfflBJMMARY CONSTRUCTION 8CHHXAE- (COHTJ
Fig. 10-3 (continued)

10-15
The third phase starts with the beginning of device installation and includes all the device installation through the completion of the magnet systems checkout. The installation logic has been worked out to give an estimate of the minimum installation time. This part begins with the installation of the lower PF coils and ends with the completion of the cryostat. The magnet system installation phase is expected to take about 23 months including a period of about 2 months for the magnet system test.
The fourth phase starts at the end of the magnet system test and goes through the end of mechanical and electrical equipment, piping, and cable installation. The torus spool structure, shield sectors, torus instruments, radio frequency (rf) heating, and fuel injectors are installed during this installation phase. The installation of the torus spool structure must start before the completion of the magnet test. The installation phase is estimated to take about 15 months.
The final phase is the preoperational testing of the completed device. All construction and installation relative to initial FED operation must be completed prior to the beginning of this phase. Nine months have been allowed for preoperational testing.
The entire schedule from the beginning of preliminary design through the end of preoperational testing is estimated to take 7 years and 8 months (92 months).
A number of assumptions were established during the course of estimating this schedule. These are summarized in Table 10-4. Similarly, a number of schedule drivers were identified as part of the estimating process and are summarized in Table 10-5. The schedule drivers in Table 10-5 represent several parallel critical paths. Thus, in order to reduce the resulting schedule any further, it would be necessary to reduce the schedule for a number of parallel activities. On the other hand, the lengthening of any of these sensitive activities will cause a corresponding increase in the overall schedule.
Note that the two major installation operations, the Cu EF coils and spool structure, are started inside the cryostat before the cryostat is completed and vacuum checked. If major vacuum leaks are detected
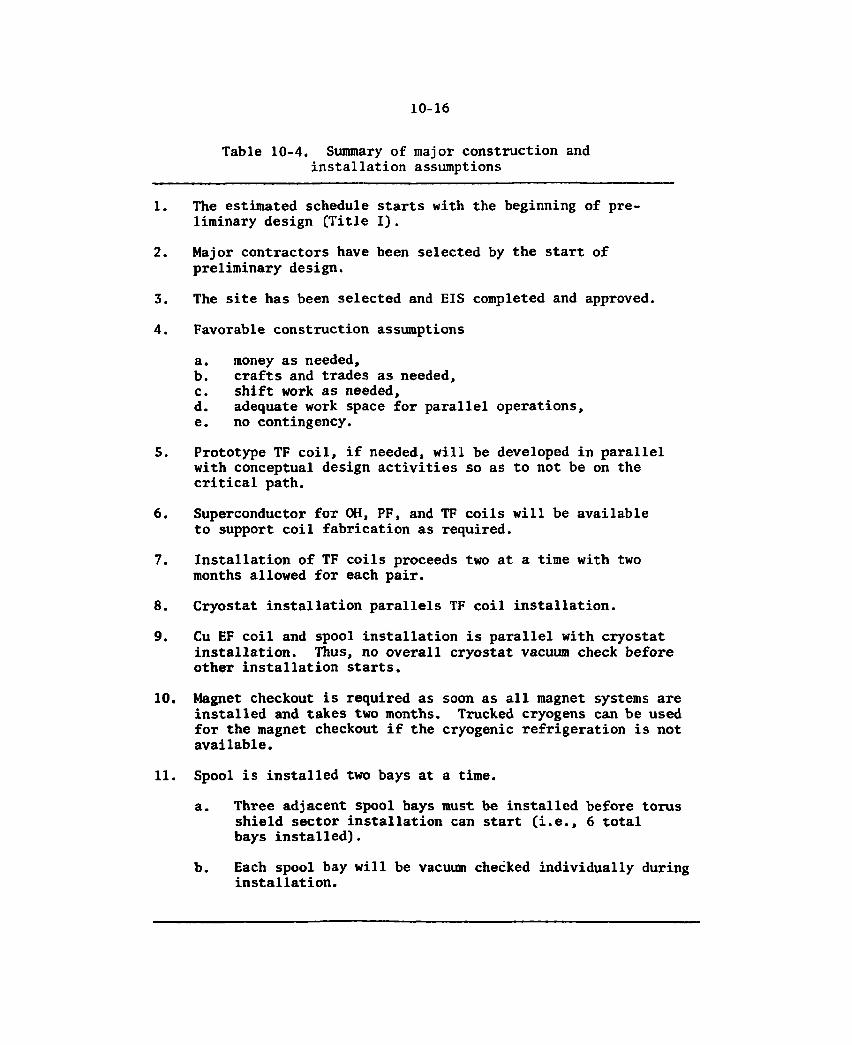
10-16
Table 10-4. Summary of major construction and installation assumptions
1. The estimated schedule starts with the beginning of pre-liminary design (Title I).
2. Major contractors have been selected by the start of preliminary design.
3. The site has been selected and EIS completed and approved.
4. Favorable construction assumptions
a. money as needed, b. crafts and trades as needed, c. shift work as needed, d. adequate work space for parallel operations, e. no contingency.
5. Prototype TF coil, if needed, will be developed in parallel with conceptual design activities so as to not be on the critical path.
6. Superconductor for OH, PF, and TF coils will be available to support coil fabrication as required.
7. Installation of TF coils proceeds two at a time with two months allowed for each pair.
8. Cryostat installation parallels TF coil installation.
9. Cu EF coil and spool installation is parallel with cryostat installation. Thus, no overall cryostat vacuum check before other installation starts.
10. Magnet checkout is required as soon as all magnet systems are installed and takes two months. Trucked cryogens can be used for the magnet checkout if the cryogenic refrigeration is not available.
11. Spool is installed two bays at a time.
a. Three adjacent spool bays must be installed before torus shield sector installation can start (i.e., 6 total bays installed).
b. Each spool bay will be vacuum checked individually during installation.

10-17
Table 10-5. Schedule drivers
• Tokamak Building Design and Initial Construction
• Site Preparation
• Device Assembly Sequence
• Lower PF Coil Delivery
• Bucking Cylinder Delivery
• FiTst TF Coil Delivery
• Intercoil Structure Last Delivery
• Pulsed Electrical Power Delivery and Installation
• Last Shield Sector Delivery
• Piping, Mechanical Equipment, and Instrumentation Installation
• Cable, Cableways, and Electrical Equipment Installation
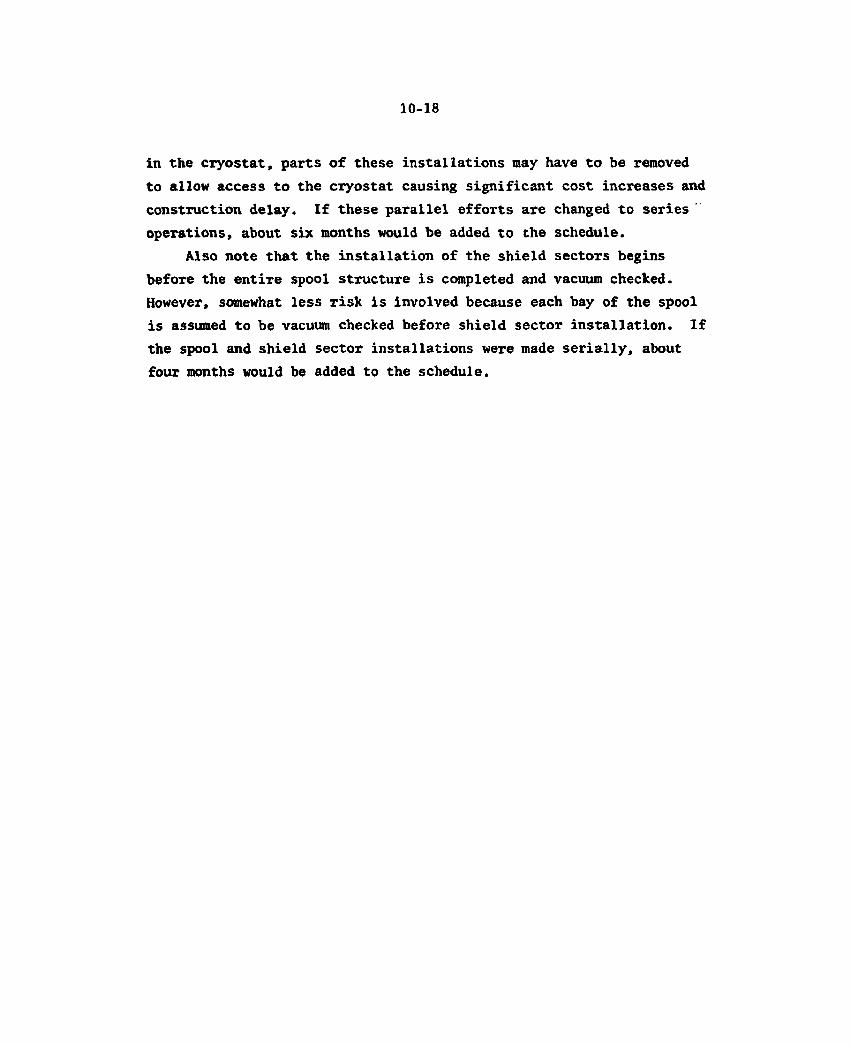
10-18
in the cryostat, parts of these installations may have to be removed to allow access to the cryostat causing significant cost increases and construction delay. If these parallel efforts are changed to series " operations, about six months would be added to the schedule.
Also note that the installation of the shield sectors begins before the entire spool structure is completed and vacuum checked. However, somewhat less risk is involved because each bay of the spool is assumed to be vacuum checked before shield sector installation. If the spool and shield sector installations were made serially, about four months would be added to the schedule.
11. SAFETY AND ENVIRONMENT
R. J. Barrett* + T. E. Shannon
i G. E. Smith
11.1 ENVIRONMENT
An environmental review of the FED project will be needed to identify potential environmental hazards imposed by FED. All elements of FED, ranging from the procurement of raw materials to facilities to the handling and disposing of radioactive wastes, should be considered. Under DOE auspices, a report is in preparation that provides an assess-ment of the technical status related to the environmental implications of the total fusion energy development program and to provide guidance for such development so that potential environmental hazards of fusion can be minimized. Environmental studies for FED should be consistent with this generic effort.
The major environmental concerns for FED are exposure to radiation and magnetic fields. Radiation exposure will have the most potential for both intra-plant and extra-plant impacts under both normal and accident conditions. Since FED will use the deuterium-tritium fuel cycle, tritium control technology and tritium cleanup technology are being developed to minimize the possibility of tritium release to the environment. The effectiveness of these technologies will be demon-strated as part of the TSTA project.
There will also be radiation exposure during maintenance, especially from activated material such as the first wall and activated corrosion products in coolant lines. Careful selection of materials and development of remote maintenance technology should reduce this potential hazard substantially.
*Fusion Engineering Design Center/Burns and Roe, Inc. Fusion Engineering Design Center/Oak Ridge National Laboratory.
*Fusion Engineering Design Center/Grumman Aerospace Corporation.
11-1
2-29
Exposure to magnetic fields is a potential concern but only to on-site personnel. At present, information about the biological effects of magnetic fields is sparse but generally suggests that significant health effects are not anticipated.
Aside from the concern about exposure to radiation and magnetic fields, the environmental impacts of FED are expected to be less than or equal to those for other large projects. Potential environmental impacts are thermal discharge, land use, and some potential for toxic chemical waste effluent. None of these impacts is expected to cause abnormal concern or delays to the FED project and all can be handled with current technology.
11.2 SAFETY
Safety analysis is an integral part of the design process for FED and will determine the final configuration and means to achieve the desired protection of the public and the plant.
11.2.1 Safety Standards and Criteria
Since FED will be a DOE project, safety standards and criteria to be established would be based upon DOE orders and procedures. For DOE projects, the DOE Order1 5480 and the former DOE Manual2 provide the basis for establishing safety criteria and give several applicable guidelines. The DOE policy is that radiation exposure to individuals and population groups be limited to "as low as reasonably achievable" (ALARA). Judgement is required for interpreting the meaning of "reasonably achievable." For DOE projects, most of the burden of interpreting the ALARA policy falls under the DOE safety analysis and review system3
as described in DOE Order 5481.1. This review system determines when the proposed design meets the intent of the ALARA policy.
Radiological guideline
It is important to establish some safety guidelines so that design activities may proceed before any safety review is undertaken. In
10-3
particular, those guidelines that may affect design and construction of the reactor building need to be identified and their applicability to the FED determined because this issue affects the basic configuration of the facilities. The issue of limiting radioactive release to the general public has a major effect on the reactor building design. The various operating conditions for which criteria need to be provided are suggested in Table 11-1. Proposed radiation exposure guidelines for use with FED are presented and are discussed below in Table 11-2.
The issue of radiation exposure criteria has been considered repeatedly by DOE (see Refs. 1, 2, 3, 4, 5, and 6). The DOE Order 5481.1, "Safety Analysis and Review Systems,"3 establishes uniform requirements for the preparation and review of safety analysis for all DOE operations. The DOE Order 5480.1, Chapter V, "Safety at Nonreactor Nuclear Facilities,"1
establishes additional requirements for an Environmental, Safety, and Health program. The intent of DOE policy is to assure that environmental protection, safety, and health matters are comprehensively addressed and that identifiable risks are reduced to acceptable low levels.
The design of DOE-owned nuclear facilities is based on a philosophy that the facility be capable of being safely shut down following postulated accidents. In addition, the nuclear facility must be designed to provide a defense-in-depth against an uncontrolled release of radioactivity to the environment.
The radiological consequence guidelines in Table 11-2 are to be interpreted as minimum guidelines to protect health and safety. In addition, DOE policy requires that radiation exposures meet ALARA policy. The dose guidelines shown in Table 11-2 are suggested based on review of appropriate DOE Orders, DOE Manual chapters, and TSTA and TFTR pre-liminary safety analysis reports. The FED exposure guidelines suggested in Table 11-2 should be considered to apply only to FED and should not be construed as being applicable to other present or future fusion test facilities, research facilities, or reactor projects. The values quoted are for whole body exposures; however, the DOE requirements for other organs (hands, arms, bone, etc.) and other time periods (quarterly) are also applicable to FED.
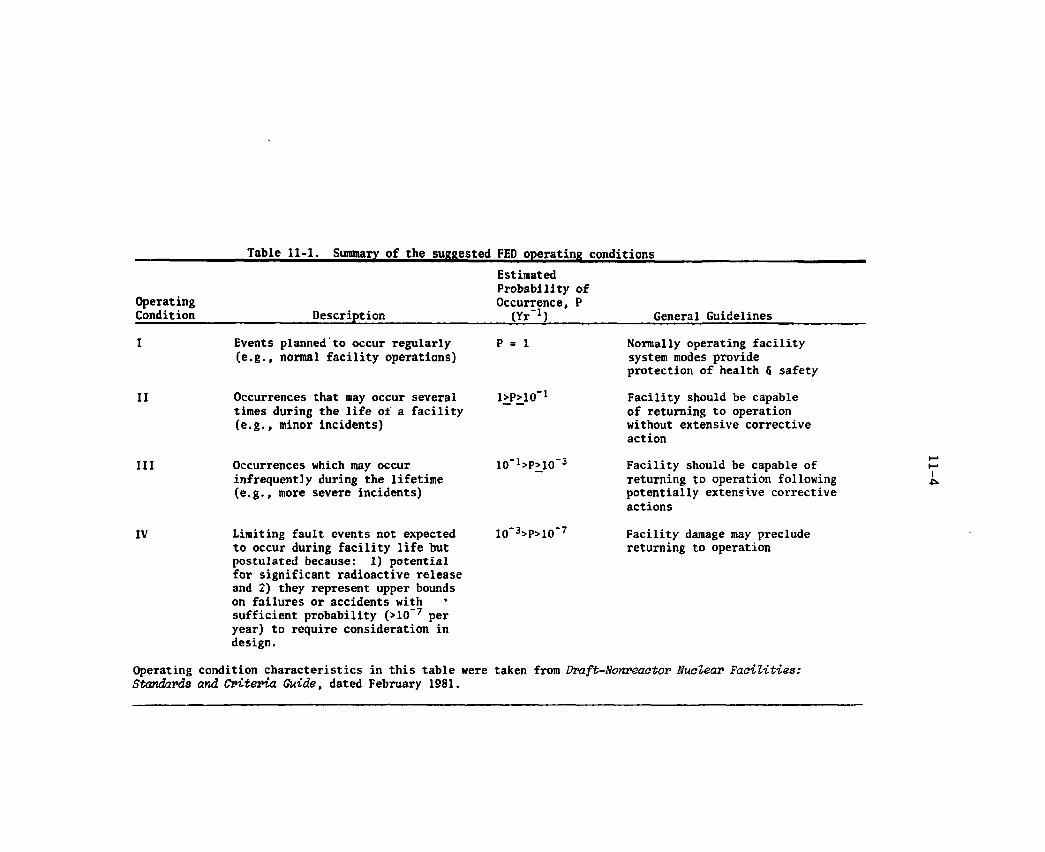
Table 11-1. Summary of the suggested FED operating conditions
Operating Condition Description
I Events planned to occur regularly (e.g., normal facility operations)
Estimated Probability of Occurrence, P (Yr"1) General Guidelines
P = 1 Normally operating facility system modes provide protection of health & safety
II Occurrences that may occur several times during the life of a facility (e.g., minor incidents)
1>P>10 -l Facility should be capable of returning to operation without extensive corrective action
III
IV
Occurrences which may occur infrequently during the lifetime (e.g., more severe incidents)
Limiting fault events not expected to occur during facility life but postulated because: 1) potential for significant radioactive release and 2) they represent upper bounds on failures or accidents with * sufficient probability (>10~7 per year) to require consideration in design.
10_1>P>10"
10~3>P>10"7
Facility should be capable of returning to operation following potentially extensive corrective actions
Facility damage may preclude returning to operation
Operating condition characteristics in this table were taken from Draft-Nonreactor Nuclear Facilities: Standards and Criteria Guide, dated February 1981.
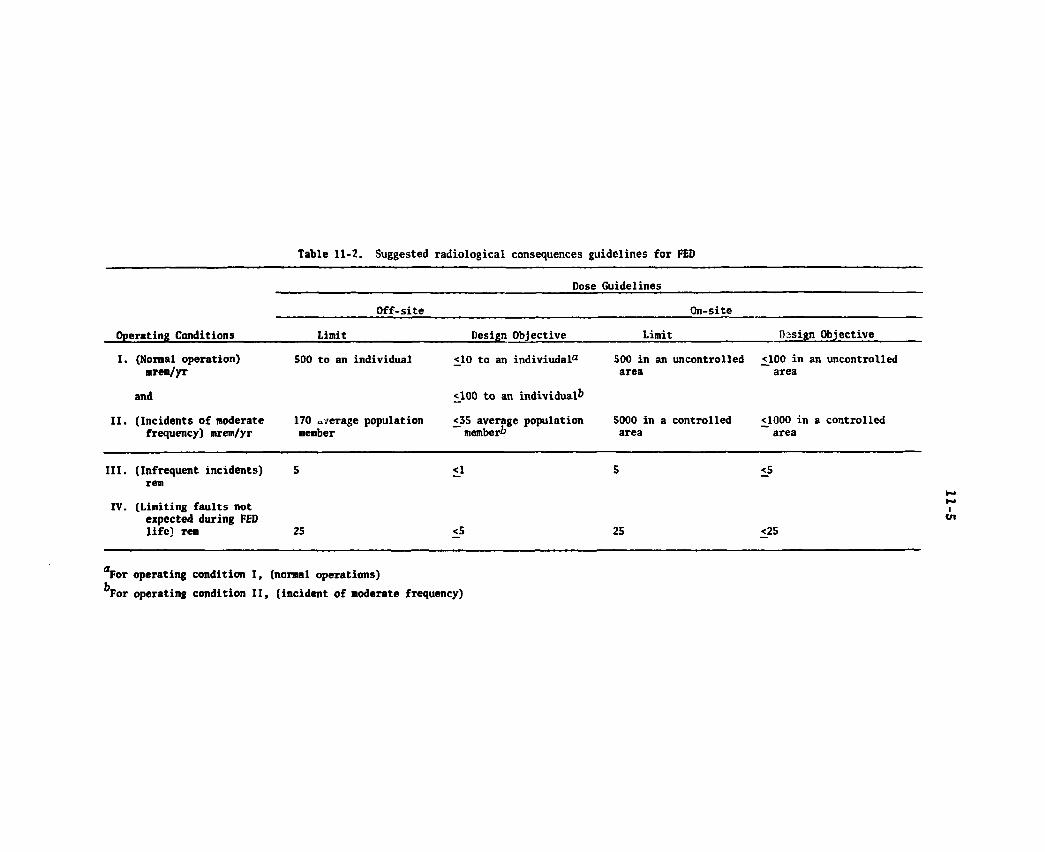
Table 11-2. Suggested radiological consequences guidelines for FED
Dose Guidelines Off-site On-site
Operating Conditions Limit Design Objective Limit Oasign Objective I. (Normal operation)
mrem/yr 500 to an individual <10 to an indiviudal® 500 in an uncontrolled
area <100 in an uncontrolled area
and <100 to an individual II. (Incidents of moderate
frequency) mrem/yr 170 average population member
£35 average population member
5000 in a controlled area
1000 in a controlled area
III. (Infrequent incidents) rem
S <1 5 <5
IV. (Limiting faults not expected during FED life) rem 25 <5 25 <25
aFor operating condition I, (nomal operations) For operating condition II, (incident of moderate frequency)
10-6
Magnetic fields
Existing criteria (letter from E. L. Alpen to Dr. K. R. Baker of DOE)7 are adopted as interim exposure guidelines for FED. These guide-lines suggest that personnel exposure be limited to magnetic fields less than 100 gauss. The earth's background magnetic field is approximately 0.5 gauss. It is judged that these guidelines will make it necessary to de-energize all the tokamak magnets before personnel enter the tokamak building. It may also be necessary to magnetically shield the control room or to locate it far enough from the tokamak building that the magnetic fields are acceptably small.
Confinement system criteria
The confinement of radioactive release normally involves the develop-ment of a confinement system that provides the desired level of protection. Reference 4 contains a discussion of confinement systems that has been reviewed and adapted to the FED situation.
Physical barriers are normally provided to prevent an uncontrolled release of radioactivity to the environment and to prevent or minimize the spread of contamination within the facility. These barriers should be provided between the environment and these areas of the FED facility containing radioactive material, or between areas in the facility that are normally expected to have levels of contamination lower than that which the barrier is designed to confine. Such physical barriers and their associated systems (e.g., ventilation, atmosphere cleanup, etc.) make up the confinement systems.
Confinement systems should prevent or mitigate the effects of an uncontrolled release of radioactive material such that on-site and off-site doses and effluent, concentrations are maintained within recommended guidelines (e.g., Table 11-2) during all facility operating conditions. Current estimates of tritium release consequences confirm that a con-finement system is necessary to maintain on-site and off-site doses and effluent concentrations within the recommended guidelines in Table 11-2 (see Section 11.2.2).
10-7
The FED design considers the use of primary, secondary, and tertiary confinement boundaries to provide a defense-in-depth against a release of radioactive material to the environment. When warranted by lesser potential hazards, portions of the facility could be designed with fewer confinement boundaries (e.g., primary and secondary confinement or, in some cases, primary confinement alone). These confinement boundaries are defined below as:
e Primary confinement. The barrier or enclosure and associated ventilation and atmosphere cleanup or off-gas treatment systems that can be exposed directly to sources of potentially high-level radioactive contamination (e . g . , hot cells, glove boxes, canyons, tanks, process piping, fume hoods, etc.).
e Secondary confinement. The barrier and associated ventilation system that encloses the primary confinement and separates potentially contaminated operating areas from normally non-contaminated areas of the facility.
e Tertiary confinement. The structure and associated ventilation system that encloses the primary and secondary confinements and includes other facility areas that are not expected to become contaminated. It is the final barrier between the outside environment and potential contamination.
Typical characteristics of these three confinement barriers, including safety classification recommendations, are summarized in Table 11-3. These do not establish the safety importance of any potential con-finement systems for FED.
Safety classification
The following definitions, based on discussion in Ref. 4, are suggested for establishing the safety importance of various parts of FED.
e Safety class applies to those components, systems, and structures that are required to prevent or mitigate the consequences of a postulated release of radioactive material that has the potential
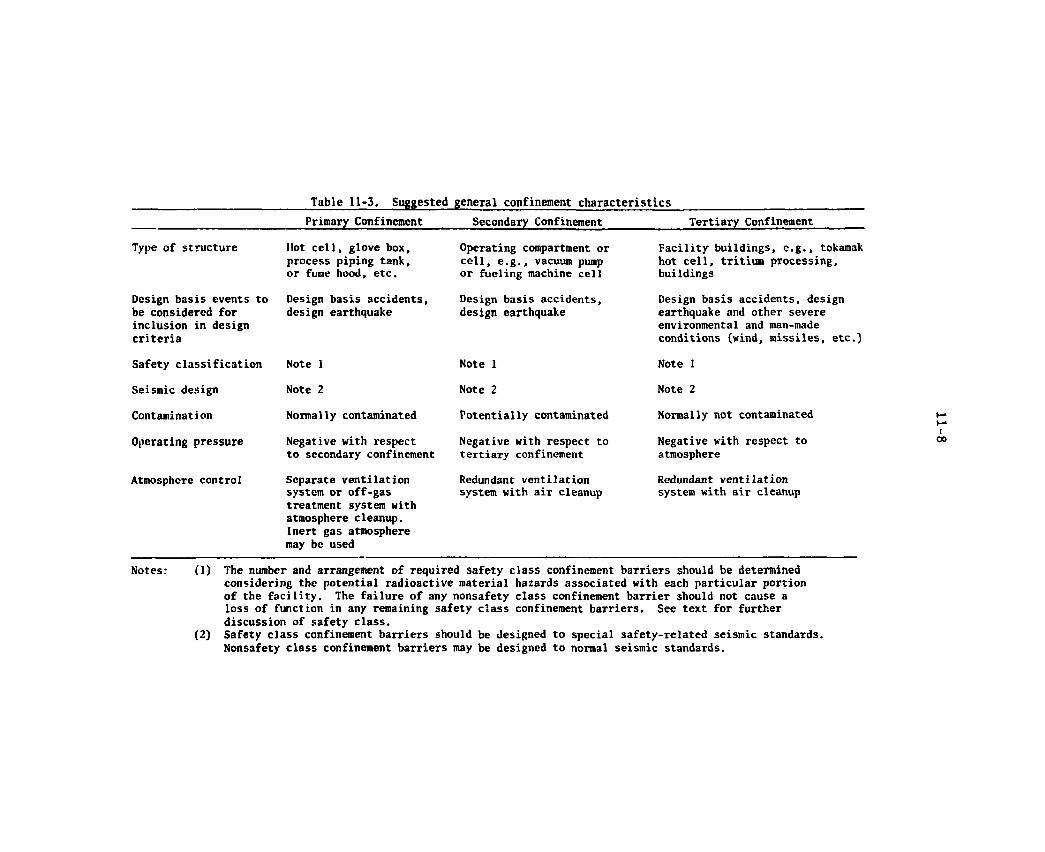
Table 11-3. Suggested general confinement characteristics Primary Confinement Secondary Confinement Tertiary Confinement
Type of structure Hot cell, glove box, process piping tank, or fume hood, etc.
Operating compartment or cell, e.g., vacuum pump or fueling machine cell
Facility buildings, e.g., tokamak hot cell, tritium processing, buildings
Design basis events to be considered for inclusion in design criteria
Design basis accidents, design earthquake
Design basis accidents, design earthquake
Design basis accidents, design earthquake and other severe environmental and man-made conditions (wind, missiles, etc.)
Safety classification Note 1 Note 1 Note 1 Seismic design Note 2 Note 2 Note 2 Contamination Normally contaminated Potentially contaminated Normally not contaminated
Operating pressure Negative with respect to secondary confinement
Negative with respect to tertiary confinement
Negative with respect to atmosphere
Atmosphere control Separate ventilation system or off-gas treatment system with atmosphere cleanup. Inert gas atmosphere may be used
Redundant ventilation system with air cleanup
Redundant ventilation system with air cleanup
Notes: (1) The number and arrangement of required safety class confinement barriers should be determined considering the potential radioactive material hazards associated with each particular portion of the facility. The failure of any nonsafety class confinement barrier should not cause a loss of function in any remaining safety class confinement barriers. See text for further discussion of safety class.
(2) Safety class confinement barriers should be designed to special safety-related seismic standards. Nonsafety class confinement barriers may be designed to normal seismic standards.
10-9
for causing off-site doses in excess of 0.5 rem to the whole body, or the equivalent of any part of the body. Nonsafety class components, systems, and structures are those which are not defined as safety class. The maximum off-site dose resulting from the failure of a nonsafety class system should not exceed 0.5 rem to the whole body, or the equivalent to any part of the body.
The determination of safety class requires accident analysis. Since these analysis are just beginning for most FED components and systems, no firm determinations of safety class are made at this time. The designation of safety class carries with it the adoption of special quality and reliability to establish a high level of assurance that safety class systems will perform their safety-related functions as designed. These special attributes include, among other characteristics, the ability to withstand severe natural phenomena. The implications of safety class designation on design of systems are considerable and will be worked out specifically for FED as needed.
Design implications
Confinement capabilities are based on the ability of ventilation systems to maintain a controlled, continuous airflow pattern from the environment into the confinement building and then from noncontaminated areas of the building to potentially contaminated areas and then to normally contaminated areas. This airflow sequence, in conjunction with other facility design and operating features, should prevent the spread of contamination within the facility during normal operations, should minimize the spread of contamination during abnormal conditions, and should ensure adequate cleanup of exhaust gas streams prior to release to the environment.
FED conditions may require some confinement barriers to be pressure containing. If a confinement barrier is not designed Co be pressure containing, the capability to maintain normal air flow paths to control the release of radioactive material should be assumed to be negated

10-10
whenever the pressure exceeds a minimum negative pressure. For periods when the confinement cannot maintain a minimum negative pressure, reduced credit will be given for cleanup systems in the normal exhaust path. The confinement ventilation should be capable of maintaining desired air flow characteristics when personnel access doors or cell hatches are open. When necessary, air locks should be incorporated to minimize the impact of facility access requirements on the ventilation system.
Safety class confinement ventilation systems should be designed with redundancy to ensure the ability to maintain airflow characteristics that provide the necessary confinement capability under all credible circumstances. If necessary for maintaining controlled, continuous confinement air flow, the ventilation system should be supplied with safety class electric power and should be operable on both on-site and off-site power sources.
Confinement air cleanup systems should be provided in the confinement ventilation exhaust system to limit the release of radioactive material to the environment and to minimize the spread of contamination within the facility. The air filtration units should be designed to remain functional throughout postulated accidents and should retain collected radioactive material after such accidents. The number of air filtration stages required for any area of the FED facility should be determined by analysis based on the quantity and type of radioactive materials to be confined. Air filtration units should be installed as close as practical to the source of contaminants to minimize contamination of ventilation system ductwork. Suitable off-gas stream pretreatment should be pro-vided upstream of the off-gas treatment system to remove or reduce the concentration of chemicals that would adversely affect the system operation.
The air filtration units should be suitably located and provided with appropriate radiation shielding to maintain occupational doses within the recommended guidelines during operations and maintenance. The air filtration system should be designed with provisions to facilitate periodic inspection and testing during equipment operation and when the equipment is shut down.

11-11
The level of radioactivity in the confinement exhaust should be continuously monitored and alarmed to detect high activity in the exhaust stream. Appropriate manual or automatic protective actions should be taken to prevent an uncontrolled release of radioactivity to the environ-ment and to minimize the spread of contamination within the facility.
11.2.2 Potential Radiological Consequences
The major potential radioactive material that could be released from the FED is tritium. The radiological aspects of released tritium are discussed in Ref. 8. Since the impact of released tritium on the general public is the basic concern, the potential concentration and dose rate at the exclusion boundary due to accidental tritium release are the parameters of most importance. These tritium concentrations and dose rates depend on a wide variety of variables, many of which are site dependent. For example, the distance to the site exclusion boundary, potential wind, atmospheric, and topographical conditions are important to the analysis as are the building and ventilation designs.
Tritium dose calculations
The dose resulting from release of tritium is a complex function of many variables. The potential environmental effects of tritium are discussed in Ref. 8. Several methods for calculating the dose from tritium release are available (e.g., McKone and Kastenherg9). However, all of the methods require information about the plant design and site which is not currently available for FED. Since no site has been selected, no reliable estimates of expected consequences of tritium release can be made for FED. An effort has been made to try to bracket the possible consequences by reviewing published tritium release dose rate calculations5*6'9 and by making some rough calculations for two different sets of possible FED configurations.
o Calculations from Ref. 9 show that for an accidental release of 10
curies of tritium in the oxide form (about 10,000 grams of tritium), the dose at a boundary 200 meters from the release point could be as high as 2200 rem.
10-12
The TSTA Preliminary Safety Analysis Report, 5 Chapter VI, also provides some estimates of expected consequences of postulated accidents. The nearest site boundary is 400 meters from the facility. For a case with very low probability of occurrence, the dose of 49 rem at the boundary is estimated for 150 g tritium released in oxide form.
The TFTR project has reported a number of dose calculation results; in Ref. 6. The distance to the boundary of the exclusion area is taken as 125 meters. The worst case reported is 2.73 rem at the boundary for a tritium release of 6200 curies (0.62 grams). The next worst case shows 0.24 rem at the boundary for tritium release of 24,000 curies (2.4 grams).
This literature review and the rough calculations suggest that FED dose rate consequences may lie somewhere between 0.10 and 4.4 rem at the site boundary for each gram of tritium in the o; ".de form released at ground level. Design features and site selection should be able to assure that potential consequences are below 1 rem at the boundary per gram released. Assuming for this discussion that consequences can be held to 1 rem/g or less, a maximum ground level release of 25 grams of tritium could be tolerated before exceeding the suggested guideline of 25 rem at the site boundary for limiting faults. The FED plant is expected to contain considerably more than 25 grams of tritium (e.g., greater than 1 kilogram). The reactor building should contain between 10 and 300 grams of tritium during operation depending on design options. Any system which is necessary to prevent the ground level release of 0.5 gram or more of tritium will be a safety class system. It appears from the total amount of tritium needed for FED operation that several safety class systems may be required. Favorable conditions could greatly reduce the need for safety class functions and special building features. Unfavorable conditions would require more safety class systems and special building functions to protect against releases of tritium. In between these two extremes is a range of possible FED conditions for which varying degrees of protection might be required. The possible uncontrolled tritium releases from FED indicate that confinement techniques will need to be applied to FED, but these should be adequate to limit the possible consequences a tritium release.
10-13
After reviewing the possible radiological consequences, two con-clusions can be reached to help guide the tokamak building design process. First, the possible uncontrolled tritium releases from FED indicate that confinement techniques will need to be applied to limit the possible consequences of an accidental tritium release. Second, in accordance with the suggested guidelines defining safety class systems, at least some systems are likely to be classified as safety class.
11.2.3 Protection Systems
The FED design requires passive and active protection systems that are fundamentally independent of the operating systems and that ensure the required protection during and following off-normal and accident conditions. The protection system design is part of the overall design of the man-machine system for FED. The design starts with a knowledge of the plant systems and the tests to be performed and should be started after completion of the preconceptual design.
The FED operation is planned to be partly automated, and some of the safety systems are incorporated into the automated system. Some of the operations are controlled in software. This introduces a need for software security measures and for a hierarchy in the computer control system such that erroneous operations can be brought to a safe conclusion. Appropriate remote control capability exists so that the necessary control can be maintained after accidents to the facility.
11.2.4 Lithium Metal Test Modules
The current FED design does not require the use of lithium, but relatively small quantities of lithium may be needed for test modules. The most recent U.S. experimental results indicate that violent reactions may be expected if lithium contacts water (or concrete, which contains water). However, if spilled on steel in an air atmosphere, several minutes elapse before the reaction becomes severe, due to reaction of lithium with the nitrogen in the air. The reactions can be stopped by

10-14
flooding with an inert gas such as argon. The FED design criteria need to be such that any spill from a test module will be contained in a steel sump or catch basin which can be flooded with inert gas. Concrete surfaces that could be contacted by the lithium should be lined with steel, and lithium piping should be double-walled to reduce chances of a leak. Whatever the blanket breeding test materials are to be, the facility will be designed to accommodate them, rather than attempting to retrofit the facility for them.
11.2.5 Natural Phenomena
Final design protection against natural phenomena will be site-specific. Since a site has not been selected, only generic considersL .ons are addressed at this time.
The priority of design will be to provide protection to the public, to the plant personnel, and to the plant. The design will ensure that the public will be protected against the wrst intense events reasonably possible for the site. The design will ensure that the plant personnel will be protected in accordance with normal accepted industrial practices (including radiation safety practices). Finally, the plant equipment will be designed to be protected based on economic and schedular con-siderations. For protection of the plant and the plant personnel, it may be desirable to specify design guiding events which on the average would not be exceeded for a given site.
All systems containing tritium will be designed to withstand the most intense events reasonably possible at the site without releasing tritium above normally expected operational leak rates. These systems include tritium handling systems and the buildings containing them, the primary cooling system, and any systems (such as TF coils) whose failure as a result of natural events might cause a tritium release.
Types of natural events and. the suggested most intense events are as follows:
10-15
Most Intense Event Seismic 0.25 g Tornado 180 mph
0.75 psi Ap
According to Ref. 10, 80 to 90 percent of all prospective sites for nuclear facilities will have most intense seismic events equal to or less than this criteria.
11-16
REFERENCES
DOE Order 5480.1, Chapter V, "Safety of Non-reactor Nuclear Facilities," dated March 1981. DOE Manual, Chapter 0524, "Standards for Radiation Protection." (Referenced version from ERDA Manual, Chapter 0524, approved March 30, 1977.) DOE Order 5481.1, "Safety Analysis and Review System," dated March 20, 1979. Draft Nonreaotor Nuclear Facilities: Standards and Criteria Guide, dated, February 1981, transmitted by letter to R. J. Barrett from W. J. Brynda, Brookhaven National Laboratory, dated March 25, 1981. Los Alamos Scientific Laboratory, Tritium System Test Assembly, Preliminary Safety Analysis Report, January 1979. Princeton Plasma Physics Laboratory, "Tokamak Fusion Test Reactor, Preliminary Safety Analysis Report." Letter from E. L. Alpen to Dr. K. R. Baker of DOE. P. S. Rohwer and W. H. Wilcox, "Radiological Aspects of Environmental Tritium," Nuclear Safety, Vol. 17, No. 2, March-April 1976. R. E. McKone and W. E. Kastenberg, "Calculation of Radiological Dose Due to Release of Tritium Oxides from Controlled Thermonuclear Reactors," Nuclear Technology, Vol. 40, September 1978, pp. 170-184. Bechtel National, Inc., "Evaluation of a Committed Fusion Site," 0RNL/SUB-7503/1, dated July 1979.
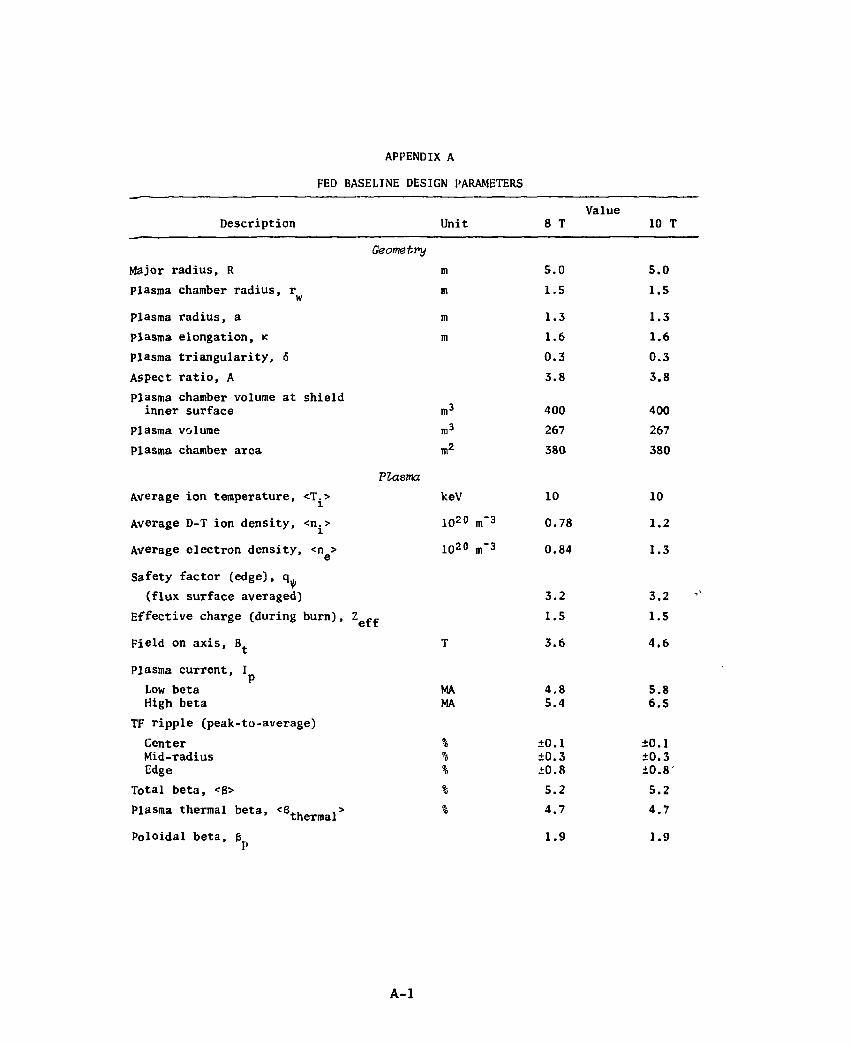
APPENDIX A FED BASELINE DESIGN PARAMETERS
Value Description Unit 8 T 10 T
Geometry
Major radius, R m 5.0 5.0 Plasma chamber radius, r^ m 1.5 1.5 Plasma radius, a m 1.3 1.3 Plasma elongation, k m 1.6 1.6 Plasma triangularity, 6 0.3 0.3 Aspect ratio, A 3.8 3.8 Plasma chamber volume at shield inner surface m3 400 400
Plasma volume m3 267 267 Plasma chamber area m2 380 380
Plasma
Average ion temperature, <T^> keV 10 10 Average D-T ion density, <ni> 102° m"3 0.78 1.2 Average electron density, <ng> 1020 m"3 0.84 1.3 Safety factor (edge), q^ (flux surface averaged) 3.2 3.2
Effective charge (during burn), Z^^ 1.5 1.5 Field on axis, Bt T 3.6 4.6
Plasma current, Ip Low beta MA 4.8 5.8 High beta MA 5.4 6.5
TF ripple (peak-to-average) Center % +0.1 ±0.1 Mid-radius % ±0.3 ±0.3 Edge % ±0.8 ±0.8'
Total beta, <B> % 5.2 5.2 Plasma thermal beta, <6thermal> °° 4 , 7 4'7
Poloidal beta, 6 1.9 1.9
A-1

A-2
FED BASELINE DESIGN PARAMETERS (cont'd)
Value Description Unit 8 T 10 T
Total D-T fusion power, P h Energy confinement time, Burn time, tburn
Cycle time, T.ycle
Pumpdown time, t
Operating mode MW(t)
Startup/shutdown time, t ss Number of full-field pulses/lifetime Lifetime
180
1.4 >100
>152 30 12/10
2.5 * 10s
450 1.8
>50 >102
30 12/10
2.5 x 10¹⁴ years 10 (for all 8T/10T
operation) Plasma thermal power balance (during burn)
Total D-T fusion power D-T fusion power (neutrons) D-T fusion power (alpha particles) Bulk heating power into plasma during burn
Fusion power amplification, Q Total thermal power deposited on plasma chamber surfaces
• Power to first wall/armor Charge exchange neutrals Radiation
• Power to limiter, charged particles
MW MW MW
MW
MV MW MW
MW Plasma disruptions
Probability per pulse (Varies with operating sequence, see later listing)
Thermal quench and voltage spike ms
180 144 36
36 5
72 16 8 8
56
1 0 - 1 - 1 0 " 3
450 360 90
0 Ignited
90 20
10 10
70
1 0 _ 1 - 1 0 " 3
Time for thermal qucnch Plasma internal energy deposition per disruption via particles via radiation
MJ 80
75 25
125 75 25
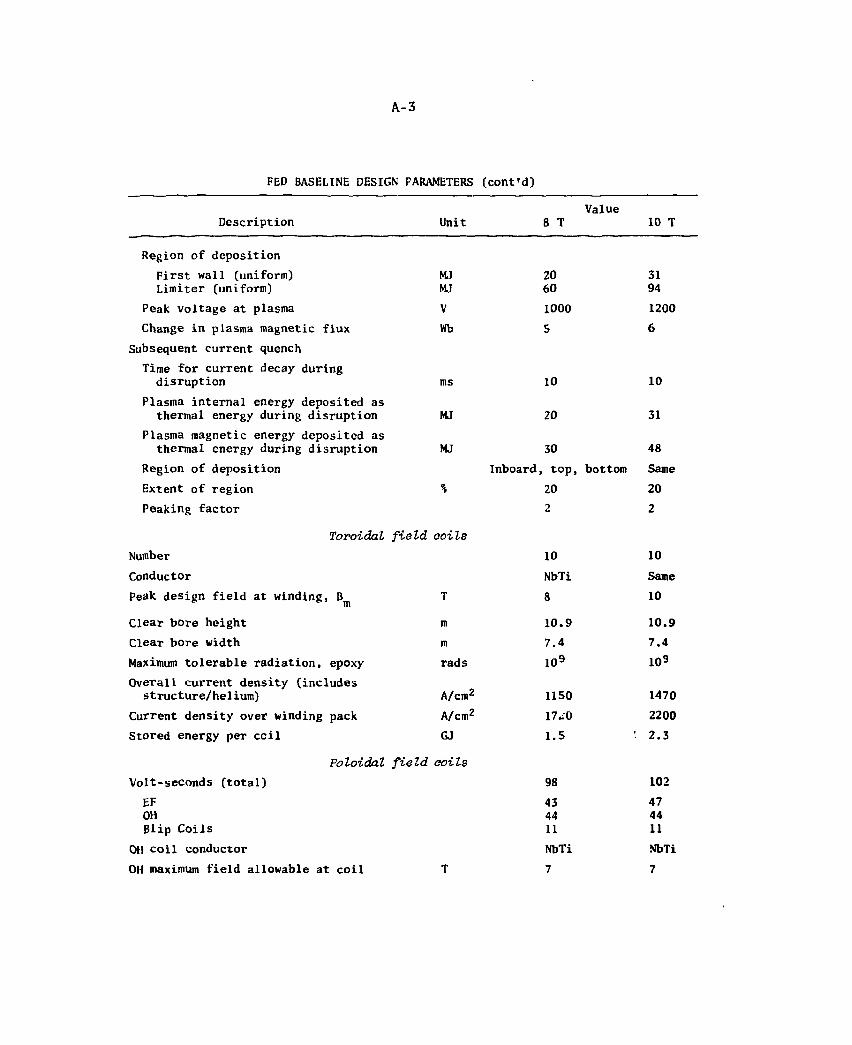
A-3
FED BASELINE DESIGN PARAMETERS (cont'd)
Value Description Unit 8 T 10 T
Region of deposition First wall (uniform) Limiter (uniform)
MJ MJ
20 60
31 94
Peak voltage at plasma V 1000 1200 Change in plasma magnetic flux Wb 5 6
Subsequent current quench Time for current decay during disruption ms 10 10
Plasma internal energy deposited as thermal energy during disruption MJ 20 31
Plasma magnetic energy deposited as thermal energy during disruption MJ 30 48
Region of deposition Inboard, top, bottom Same Extent of region % 20 20 Peaking factor 2 2
Toroidal field coils Number 10 10 Conductor NbTi Same Peak design field at winding, Bm T 8 10 Clear bore height ID 10.9 10.9 Clear bore width m 7.4 7.4 Maximum tolerable radiation, epoxy rads 10® 109 Overall current density (includes structure/helium) A/cm2 1150 1470
Current density over winding pack A/cm2 17^0 2200 Stored energy per ccil GJ 1.5 2.3
Poloidal field coils Volt-seconds (total) 98 102 EF OH Blip Coils
43 44 11
47 44 11
OH coil conductor NbTi NbTi OH maximum field allowable at coil T 7 7
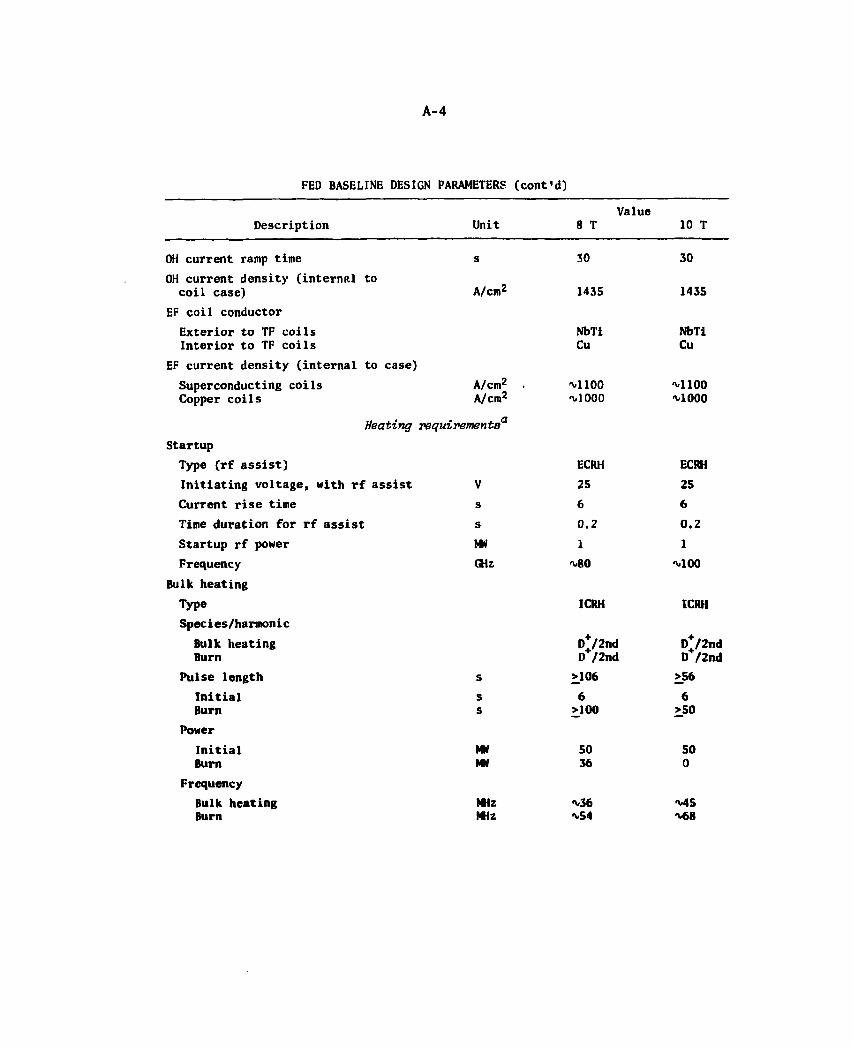
A-4
FED BASELINE DESIGN PARAMETERS (cont'd)
Value Description Unit 8 T 10 T
OH current ramp time OH current density (internal to coil case)
EF coil conductor Exterior to TF coils Interior to TF coils
EF current density (internal to case) Superconducting coils Copper coils
A/cm2
A/cm2 A/cm2
Heating requirements'1
Startup Type (rf assist) Initiating voltage, with rf assist V Current rise time s Time duration for rf assist s Startup rf power Frequency
Bulk heating Type Species/harmonic
Bulk heating Burn
Pulse length Initial Burn
Power Initial Burn
Frequency Bulk heating Burn
MW GHz
MW MW
m z mz
30
1435
NbTi Cu
-vllOO M000
ECRH 25 6 0.2 1
ICRH
D*/2nd D /2nd
>106 6
>100
50 36
^36 *S4
30
1435
NbTi Cu
^1100 •\-1000
ECRH 25 6 0.2 1
-*il00
ICRH D*/2nd D /2nd >56 6 >50
SO 0
t68
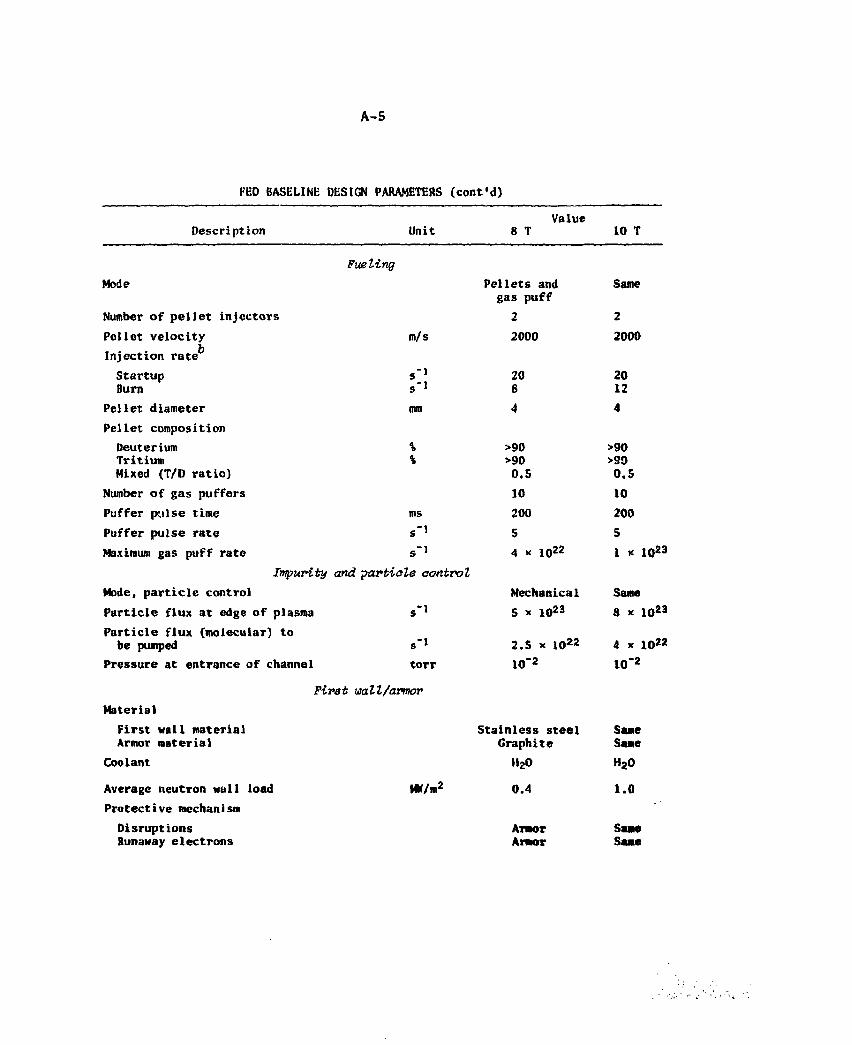
A-5
FED BASELINE DESIGN PARAMETERS (cont'd)
Description Unit Value
8 T 10 T
Fueling Mode Pellets and
gas puff Same
Number of pellet injectors 2 2 Pellet velocity m/s 2000 2000 . . . b Injection rate Startup Burn
s'1 s"»
20 8
20 12
Pellet diameter mm 4 4 Pellet composition Deuterium Tritium Mixed (T/D ratio)
% % >90 >90 O.S
>90 >90 0.5
Number of gas puffers 10 10 Puffer pulse time ms 200 200 Puffer pulse rate 5 5 Maximum gas puff rate s_1 4 x 10²² I « 1023
Impurity and particle control Mode, particle control Mechanical Same Particle flux at edge of plasma s_1 5 * 1023 8 x 10²³
Particle flux (molecular) to be pumped s'l 2.S x 1022 4 x 10²²
Pressure at entrance of channel torr 10"2 10"2
First wall/armor Material
First wall material Armor material
Stainless steel Graphite
Same Same
Coolant )l20 H 20
Average neutron wall load MK/m2 0.4 1.0 Protective mechanism Disruptions Runaway electrons
Armor Armor
Same Same
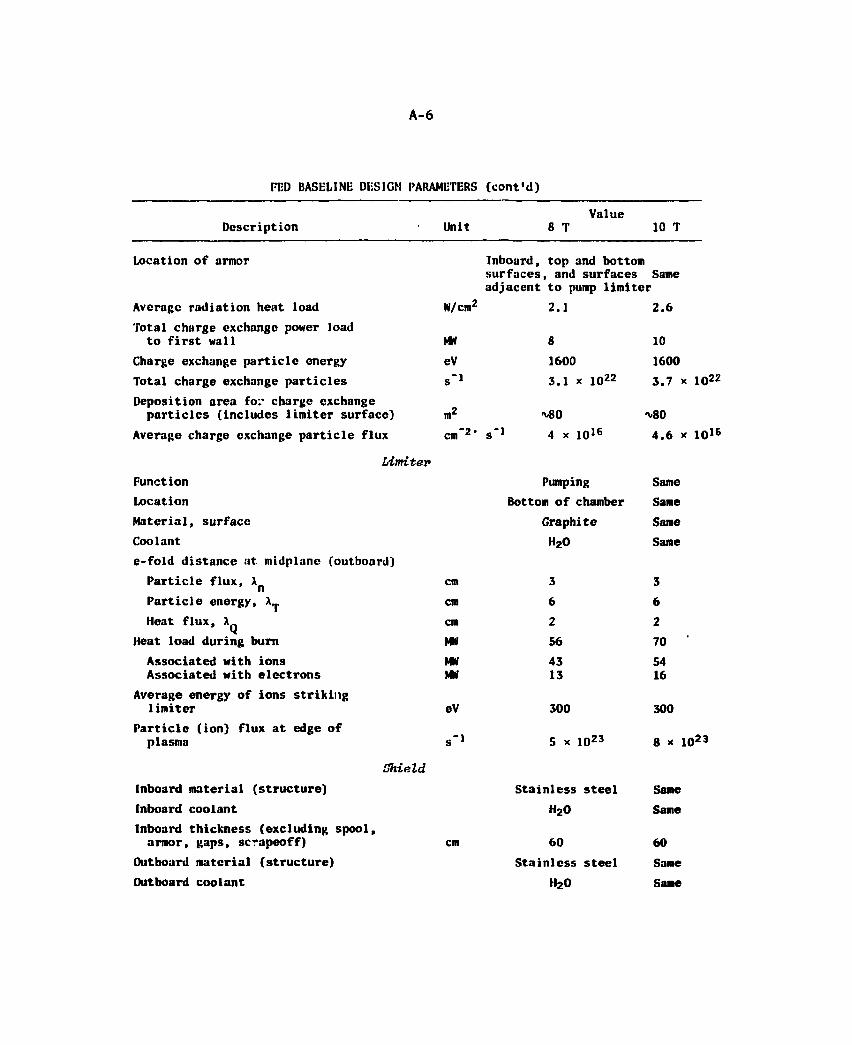
A-6
FED BASELINE DESIGN PARAMETERS (cont'd)
Description Value
Unit 8 T 10 T
Location of armor
Average radiation heat load Total charge exchange power load to first wall
Charge exchange particlc energy Total charge exchange particles Deposition area for charge exchange particles (includes limiter surface)
Average charge exchange particle flux
Idmiter Function Location Material, surface Coolant e-fold distance at midplanc (outboard) Particle flux, Particle energy, X^ Heat flux, XQ
Heat load during burn Associated with ions Associated with electrons
Average energy of ions striking limiter
Particle (ion) flux at edge of plasma
Inboard, top and bottom surfaces, and surfaces Same adjacent to pump limiter
s
nr cm"
Shield.
Inboard material (structure) Inboard coolant Inboard thickness (excluding spool, armor, gaps, scrapeoff)
Outboard material (structure) Outboard coolant
W/cm2 2.1
MW 8 eV 1600
3.1 * 1022
<v80
4 x 10¹⁶
Pumping Bottom of chamber
Graphite H20
3 6 2 56 43 13
300
5 x 10²³
Stainless steel H20
cm 60 Stainless steel
ll20
cm cm cm MM MW MW
eV
s"1
2.6
10 1600 3.7 x 10²²
-x.80 4.6 x 10¹⁶
Same Same Same Same
3 6 2 70 54 16
300
8 x 10²³
Same Same
60 Same Same
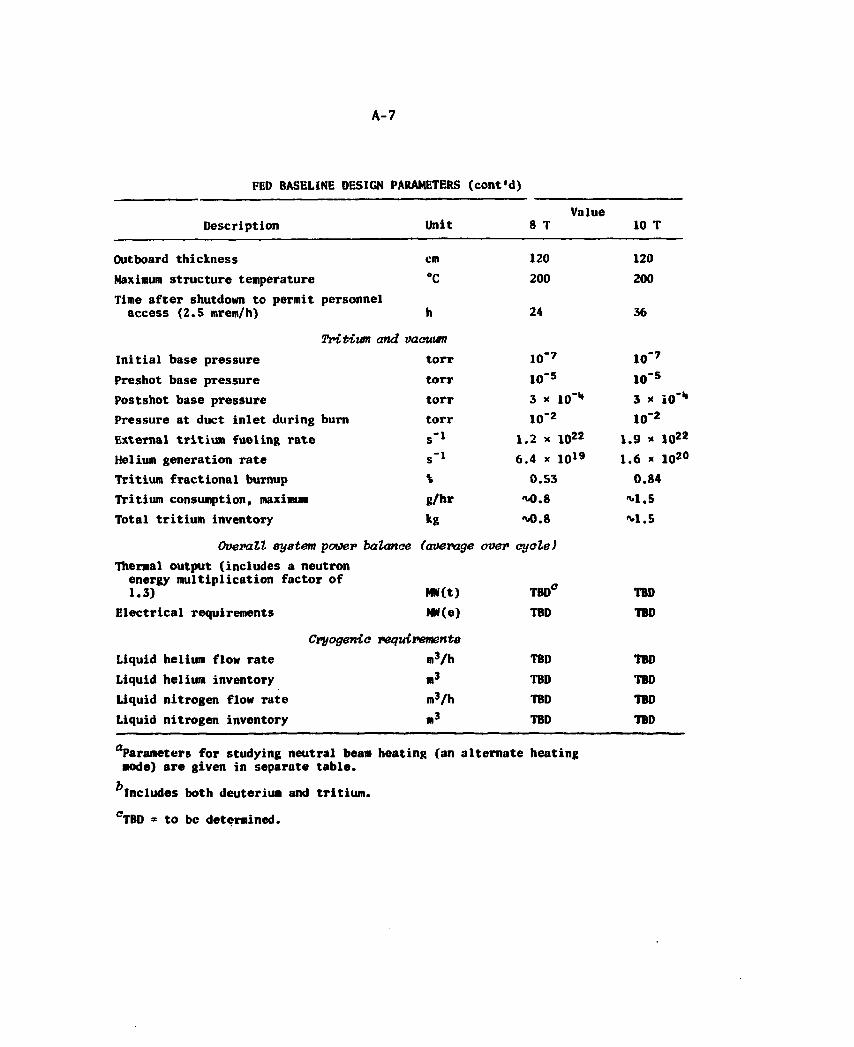
A-7
FED BASELINE DESIGN PARAMETERS (cont'd)
Description Unit Value
8 T 10 T
Outboard thickness cm 120 120 Maximum structure temperature °C 200 200 Time after shutdown to permit personnel access (2.5 mrem/h) h 24 36
Tritium and mourn Initial base pressure torr 10"7 I0"7
Preshot base pressure torr 10"5 10"s
Postshot base pressure torr 3 * I0"1* 3 x iO"1* Pressure at duct inlet during b u m torr 10"2 lO"2
External tritium fueling rate s"1 1.2 x 10²² 1.9 * 1022
Helium generation rate s"1 6.4 x 10¹⁹ 1.6 * 1020
Tritium fractional burnup * 0.53 0.84 Tritium consumption, maximum B/hr "•0.8 "•1.5 Total tritium inventory H M).8 "•1.5
Overall system power balanae (average over cyale) Thermal output (includes a neutron energy multiplication factor of 1.3) MN(t) TBDC TBD
Electrical requirements MW(e) TBD TBD
Cryogenic requirements Liquid helium flow rate m3/h TBD TBD Liquid helium inventory m3 TBD TBD Liquid nitrogen flow rate m3/h TBD TBD Liquid nitrogen inventory m3 TBD TBD
^Parameters for studying neutral beam heating (an alternate heating •ode) are given in separate table.
^Includes both deuterium and tritium. CTBD = to be determined.
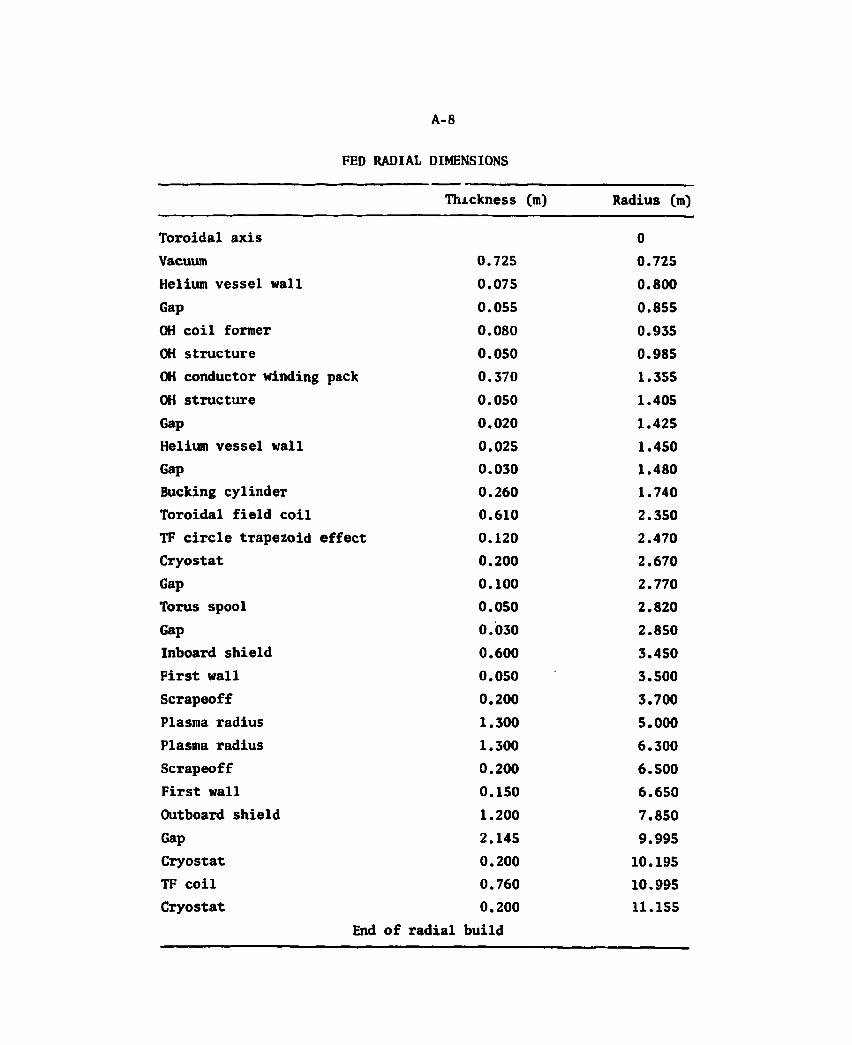
FED RADIAL DIMENSIONS
Thickness (m) Radius (m)
Toroidal axis 0 Vacuum 0.725 0.725 Helium vessel wall 0.075 0.800 Gap 0.055 0.855 OH coil former 0.080 0.935 OH structure 0.050 0.985 OH conductor winding pack 0.370 1.355 OH structure 0.050 1.405 Gap 0.020 1.425 Helium vessel wall 0.025 1.450 Gap 0.030 1.480 Bucking cylinder 0.260 1.740 Toroidal field coil 0.610 2.350 TF circle trapezoid effect 0.120 2.470 Cryostat 0.200 2.670 Gap 0.100 2.770 Torus spool 0.050 2.820 Gap 0.030 2.850 Inboard shield 0.600 3.450 First wall 0.050 3.500 Scrapeoff 0.200 3.700 Plasma radius 1.300 5.000 Plasma radius 1.300 6.300 Scrapeoff 0.200 6.500 First wall 0.150 6.650 Outboard shield 1.200 7.850 Gap 2.145 9.995 Cryostat 0.200 10.195 TF coil 0.760 10.995 Cryostat 0.200 11.155
End of radial build
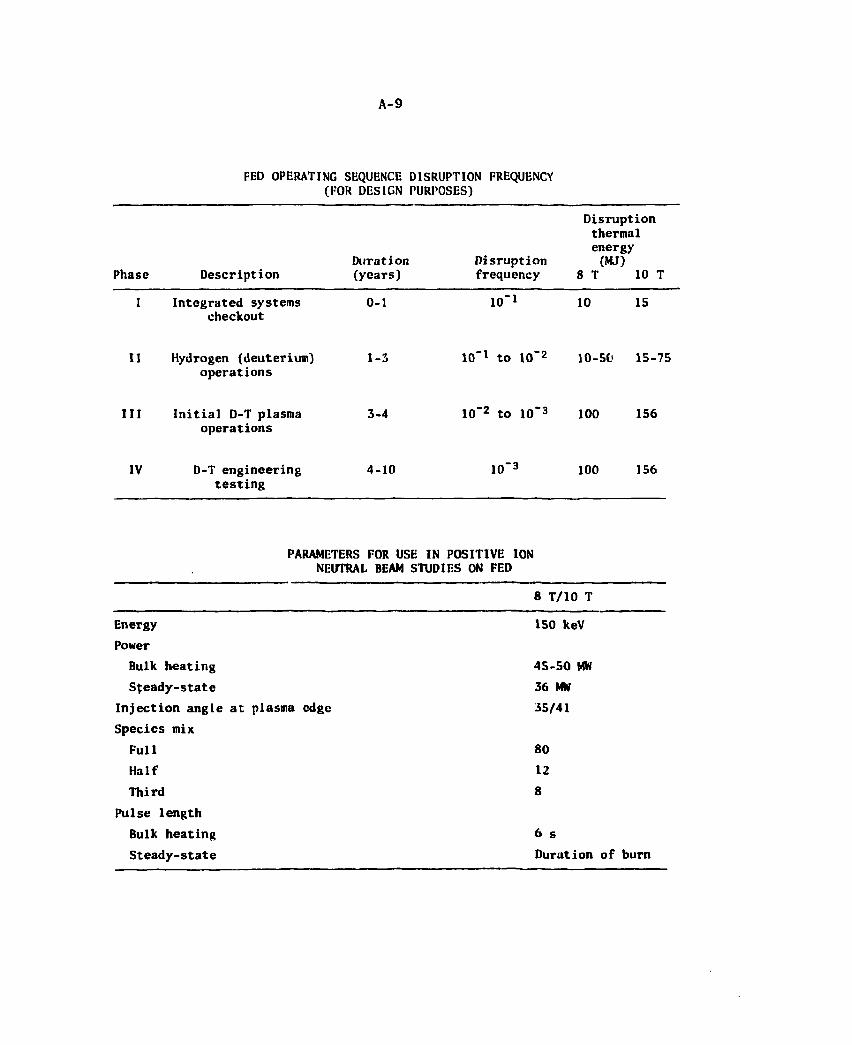
A-9
FED OPERATING SEQUENCE DISRUPTION FREQUENCY (FOR DESIGN PURPOSES)
Disruption thermal energy
Duration Disruption (MJ) Phase Description (years) frequency 8 T 10 T
I Integrated systems 0-1 10"1 10 15 checkout
II Hydrogen (deuterium) 1-3 10"1 to 10"2 10-50 15-75 operations
III Initial D-T plasma 3-4 10"2 to 10"3 100 156 operations
IV D-T engineering 4-10 10"3 100 156 testing
PARAMETERS FOR USE IN POSITIVE ION NEUTRAL BEAM STUDIES ON FED
8 T/10 T
Energy Power
Bulk heating Steady-state
Injection angle at plasma edge Species mix
Full Half Third
Pulse length Bulk heating Steady-state
150 keV
45-50 MM 36 HH 35/41
80
12
8
6 s Duration of burn
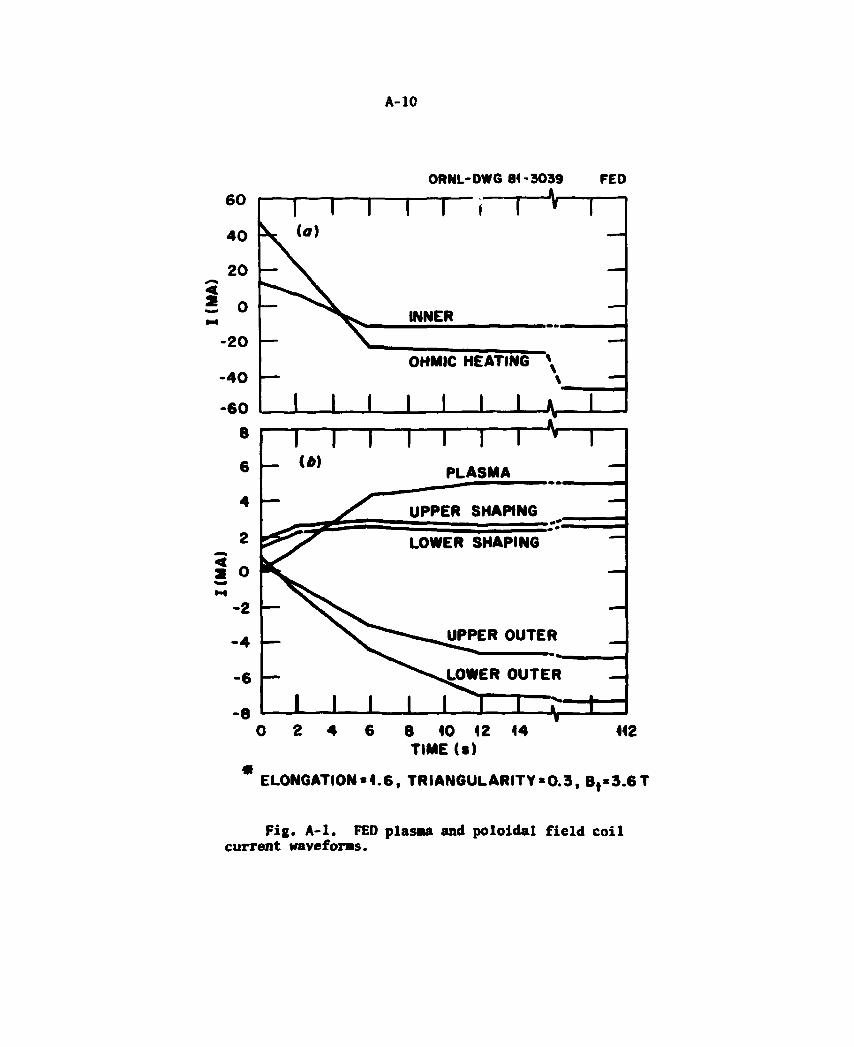
A-10
ORNL-DWG 81 -3039 FED
TIME (S)
* ELONGATION>4.6, TRIANGULARITY*0.3, B,>3.6T
F i g . A - l . FED plasaa and po lo ida l f i e l d c o i l current waveforms.
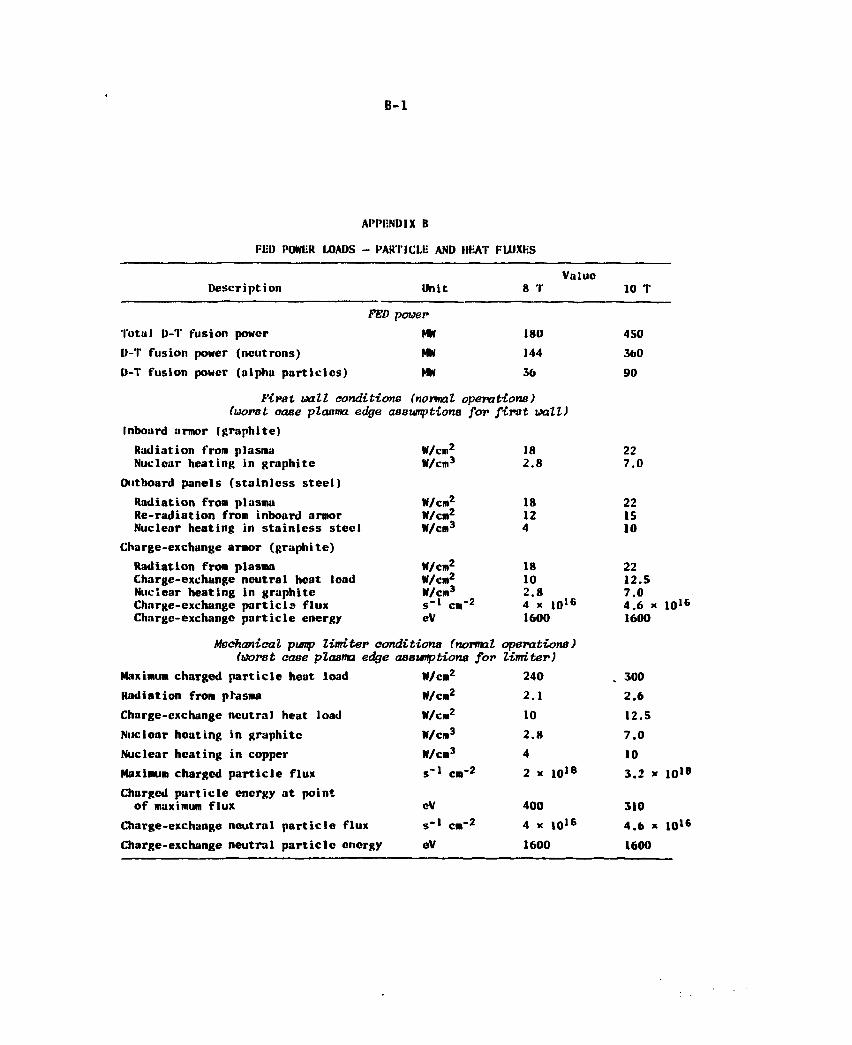
B - 1
APPENDIX B
FED POWER LOADS - PARTICLE AND HEAT FLUXES
Description Unit Value
8 T 10 T FED power
Total D-T fusion power 180 450
D-T fusion power (neutrons) MW 144 360
D-T fusion power (alpha particles) MW 36 90
First wall conditions (normal operations) (worst ease plasma edge assumptions for first wall)
Inboard armor (graphite) Radiation from plasma Nuclcar heating in graphite
W/cm2 W/cm3
18 2 . 8
22 7 . 0
Outboard panels (stainless steel) Radiation from plasma Re-radiation from inboard armor Nuclear heating in stainless steel
W/cm2 W/cm2 W/cm3
18 12 4
22 15 10
Charge-exchange araor (graphite) Radiation from plasma Charge-exchange neutral heat load Nuclear heating in graphite Charge-exchange particle flux Charge-exchangc particle energy
W/cm2 W/cm2 W/cm3 s"1 cm"2 eV
18 10 2 . 8 4 x I 0 1 6
1600
22 12.5 7 . 0 4 . 6 x 1600
1016
Mechanical pump limiter conditions (normal (worst case plasma edge assumptions for
operations) limiter)
Maximum charged particle heat load W/cm2 240 „ 300
Radiation from ptasma W/cm2 2 . 1 2.6 Charge-exchange neutral heat load W/cM2 10 1 2 . 5
Nuclear heating in graphite W/cm3 2 . 8 7 . 0
Nuclear heating in copper W/cm3 4 10
Maximum charged particle flux s-> cm'2 2 x io18 3.2 x 10>«
Charged particle energy at point of maximum flux cV 400 310
Charge-exchange neutral particle flux s"1 cm-2 4 x | 0 1 6 4.6 x 1 0 1 6
Charge-exchange neutral particle energy eV 1600 1600