ultrastructural studies of microalgae
TRANSCRIPT

Ultrastructural Studies of Microalgae
Alanoud Jaber Rawdhan
A thesis submitted for the degree of Doctor of Philosophy
(Integrated)
October, 2015
School of Agriculture, Food and Rural Development, Newcastle University
Newcastle upon Tyne, UK

ii
Abstract
Ultrastructural Studies of Microalgae
The optimization of fixation protocols was undertaken for Dunaliella salina,
Nannochloropsis oculata and Pseudostaurosira trainorii to investigate two different aspects
of microalgal biology. The first was to evaluate the effects of the infochemical 2, 4-
decadienal as a potential lipid inducer in two promising lipid-producing species, Dunaliella
salina and Nannochloropsis oculata, for biofuel production. D. salina fixed well using 1%
glutaraldehyde in 0.5 M cacodylate buffer prepared in F/2 medium followed by secondary
fixation with 1% osmium tetroxide. N. oculata fixed better with combined osmium-
glutaraldehyde prepared in sea water and sucrose. A stereological measuring technique was
used to compare lipid volume fractions in D. salina cells treated with 0, 2.5, and 50 µM and
N. oculata treated with 0, 1, 10, and 50 µM with the lipid volume fraction of naturally
senescent (stationary) cultures. There were significant increases in the volume fractions of
lipid bodies in both D. salina (0.72%) and N. oculata (3.4%) decadienal-treated cells.
However, the volume fractions of lipid bodies of the stationary phase cells were 7.1% for D.
salina and 28% for N. oculata. Therefore, decadienal would not be a suitable lipid inducer
for a cost-effective biofuel plant. Moreover, cells treated with the highest concentration of
decadienal showed signs of programmed cell death. This would affect biomass accumulation
in the biofuel plant, thus further reducing cost effectiveness.
The second investigation used the cell structure and gametogenesis of Pseudostaurosira
trainorii to evaluate the cytoplasmic support for the molecular phylogeny of diatoms
proposed by Medlin and Kaczmarska (2004) which divides diatoms into three clades that
differ in their ultrastructure, where Clade 1 contains centric diatoms, Clade 2a centric bipolar
and multipolar diatoms and Clade 2b pennate diatoms. P. trainorii is classified as araphid
diatom which has a thread-like structure reported by Sato et al. (2011) that could resemble
the flagella in centric diatoms. P. trainorii fixed better with combined osmium-
glutaraldehyde prepared in sea water and sucrose, and it was found that its Golgi apparatus
and auxospore were resemble those of Clade 2b, while the pyrenoid structure might
represent a variation of the structures described for other members of Clade 2b. In addition,
this study proved that the thread-like structures in P. trainorii were not flagella.

iii
Dedication
I dedicate this work to my father “Jaber
Rawdhan”, whose belief in me inspired me to
believe in myself.

iv
Acknowledgements
This work is the product of support from many people - my advisors, colleagues, friends,
and family.
Firstly, I would like to thank Dr. Gordon Beakes for his guidance, support, encouragement,
and advice throughout my study.
I would like to thank too Dr. Gary Caldwell, Dr. Rebecaa Taylor, and Dr. Shina Sato, for
supporting me and providing algal samples for my research.
My thanks also go to thank the electron microscopy research service staff at Newcastle
University, especially Vivian Thompson, Tracey Davey, and Kathryn White, for their
training and technical help.
I would like to thank Kuwait University for funding my Integrated PhD studies.
More personally, I would like to thank my friends: Gillian Libretto; Awar al-Hawge; Hanan
Dashti; Zainab Afseri; Wafa Hussain; Zainab Ashkanani; Amerah Ibrahim and her family;
and Howra Ben Hasan, for their support and encouragement.
Finally, I wish to thank my family for their living support – my father Jaber Rawdhan; my
mother Warda al-Shamri; my sisters Hanouf, Ohoud, Narjes, Heba, Fatma, Anaam, and
Hawraa; my brothers Ahmad and Hussain; and my lovely niece Laila Al-Shammari.

v
Table of contents
Abstract ………………………………………………………………………………. ii
Dedication ……………………………………………………………………………. iii
Acknowledgements …………………………………………………………………... iv
Table of content ………………………………………………………………………. v
List of Tables …………………………………………………………………………. viii
List of Figures ……………………………………………………………………….... x
Chapter 1. Introduction ……………………………………………………………….. 1
1.1 Introduction …………………………………………………………………… 1
1.2 Thesis organization ……………………………………………………………. 3
1.3 Project description …………………………………………………………….. 3
1.3.1 Effects of an algal infochemical (decadienal) on the ultrastructure of
Dunaliella salina and Nannochloropsis oculata ………………………...
3
1.3.2 Pseudostaurosira trainorii: ultrastructure and gametogenesis ………….. 6
1.4 Aims and objectives …………………………………………………………… 7
Chapter 2. Methods …………………………………………………………………… 22
2.1 Cultures ………………………………………………………………………... 22
2.1.1 Maintenance cultures of Dunaliella salina and Nannochloropsis oculata 22
2.1.2 Pseudostaurosira trainorii: cultures and inducing gamete formation and
mating ……………………………………………………………………
24
2.2 Light microscopy ……………………………………………………………… 28
2.3 Transmission electron microscopy fixation protocols ………………………… 28
2.3.1 Optimizing the fixation of Dunaliella salina ……………………………. 28
2.3.1.1 Protocol one: 2% glutaraldehyde 1% osmium in 0.1 M cacodylate
buffer in seawater (2% GaOs, SW) ………………………………...
28
2.3.1.2 Protocol two: 2% glutaraldehyde 1% osmium in 0.1 M cacodylate
buffer in buffered sterile F/2 medium (2% Ga/Os F/2) …………….
29
2.3.1.3 Protocol three: 1% glutaraldehyde 1% osmium in 0.1 M cacodylate
buffer in buffered sterile F/2 medium (1% Ga/Os F/2) …………….
29
2.3.2 Optimizing fixation protocols for Nannochloropsis oculata ……………. 29
2.3.2.1 Protocol four: combined glutaraldehyde-osmium with sucrose (Ga-
Os/Os suc) …………………………………………………………..
29
2.3.2.2 Protocol five: combined glutaraldehyde-osmium (Ga-Os/Os) …….. 30
2.3.3 Optimizing the fixation of Pseudostaurosira trainorii ………………….. 32
2.3.3.1 Protocol six: 1.25% glutaraldehyde 1% osmium in 0.1 M
cacodylate buffer in seawater (1.25% GaOs, 50% SW)…………….
32
2.3.3.2 Protocol seven: 2.5% glutaraldehyde 1% osmium in 0.1 M
cacodylate buffer in seawater (2% GaOs, SW) …………………….
32
2.3.3.3 Protocol eight: combined 2% glutaraldehyde - 0.5% osmium - 1%
osmium in 0.1 M cacodylate buffer in buffered sterile SW with
sucrose (2% Ga-Os/Os 50% SW) …………………………………..
32
2.4 Preparation for scanning electron microscopy ………………………………... 34
2.5 Evaluation of fixation protocols ………………………………………………. 34
2.5.1 Optimizing fixation protocols for Dunaliella salina …………………….. 35
2.5.2 Optimizing fixation protocols for Nannochloropsis oculata ……………. 41
2.5.3 Optimizing fixation protocols for Pseudostaurosira trainorii …………... 51
2.6 Conclusion …………………………………………………………………….. 56
Chapter 3. Effects of an algal infochemical (decadienal) on the ultrastructure of
Dunaliella salina and Nannochloropsis oculata …………………………
57
3.1 Introduction ………………………………………………………………….. 57

vi
3.1.1 Importance of biofuels …………………………………………………... 57
3.1.2 Advantages of algal biofuel ……………………………………………... 59
3.1.3 Algal biofuel production schemes ……………………………………….. 60
3.1.4 Lipids in microalgae ……………………………………………………... 61
2.1.5 Maximising the lipid content in algae …………………………………… 62
3.1.6 Infochemicals ……………………………………………………………. 65
3.1.7 Study aims ……………………………………………………………….. 66
3.2 Methods ……………………………………………………………………….. 68
3.2.1 Comparison of active versus stationary phase cell ultrastructure ……….. 68
3.2.1.1 Dunaliella salina CCAP19/30 …………………………………….. 68
3.2.1.2 Nannochloropsis oculata CCAP849/1……………………………... 68
3.2.2 Assessing the effects of decadienal on Dunaliella salina and
Nannochloropsis oculata cell structure ………………………………….
68
3.23.2.3 Stereological and statistical analysis ……………………………………. 72
3.2.3.1 Dunaliella salina: testing the differences between volume fractions
of log and stationary phases ………………………………...………
72
3.2.3.2 Dunaliella salina: testing the differences between volume fractions
of decadienal-treated cells ………………………...………………..
73
3.2.3.3 Nannochloropsis oculata: testing the differences between volume
fractions of log and stationary phases……………………………….
74
3.2.3.4 Nannochloropsis oculata: testing the differences between volume
fractions of decadienal-treated cells …………………………….....
75
3.3 Results ………………………………………………………………………… 77
3.3.1 Dunaliella salina ultrastructure …………………………………………. 77
3.3.1.1 Ultrastructure of actively growing 7-day-old cells ………………... 77
3.3.1.2 Ultrastructure of 14-day-old stationary phase cells ………………... 78
3.3.1.3 Ultrastructure of decadienal-treated cells ………………………….. 86
3.3.2 Nannochloropsis oculata ultrastructure …………………………………. 97
3.3.2.1 Ultrastructure of actively growing 6-day-old cells ………………... 97
3.3.2.2 Ultrastructure of 14-day-old stationary phase cells ………………... 98
3.3.2.3 Ultrastructure of decadienal-treated cells ………………………….. 107
3.4 Discussion ……………………………………………………………………... 122
3.4.1 Ultrastructural differences between actively growing and stationary cells 122
3.4.1.1 Dunaliella salina ……………………………………………..……. 122
3.4.1.1.1 General morphology …………………………………………. 122
3.4.1.1.2 Chloroplast structure and lipid reserves ……………………... 124
3.4.1.1.3 Other cell organelles …………………………………………. 126
3.4.1.2 Nannochloropsis oculata …………………………………………... 128
3.4.1.2.1 General morphology …………………………………………. 128
3.4.1.2.2 Chloroplast morphology and structure and lipid reserves …… 128
3.4.2 Effects of decadienal and culture age on lipid accumulation in
Dunaliella salina and Nannochloropsis oculata ……………………...…
129
3.4.3 Effect of decadienal on other cell organelles of Dunaliella salina and
Nannochloropsis oculata ………………………………………………...
133
Chapter 4. Gametogenesis of Pseudostaurosira trainorii ……………………………. 144
4.1 Introduction …………………………………………………………………… 144
4.1.1 Diatom classification: historical perspectives based on morphological
characteristics ……………………………………………………………
144
4.1.2 Diatom classification: molecular phylogeny and ultrastructural
characteristics …………………………………………………………...
145
4.1.2.1 Golgi apparatus ……………………………………………………. 146
4.1.2.2 Pyrenoid structure …………………………………………………. 150

vii
4.1.2.3 Sexual reproduction ………………………………………………... 150
4.1.2.3.1 Sexual reproduction in centric diatoms ……………………… 155
4.1.2.3.2 Sexual reproduction in pennate diatoms ……………………... 157
4.1.2.4 Auxospore formation and structure in relation to molecular
phylogeny …………………………………………………………..
158
4.1.3 Aims of this diatom study ……………………………………………….. 161
4.2 Methods ……………………………………………………………………….. 161
4.3 Results ………………………………………………………………………… 161
4.3.1 Vegetative cells ………………………………………………………….. 161
4.3.2 Gametogenesis …………………………………………………………... 166
4.3.2.1 Male gametogenesis and gametes …………………………………. 166
4.3.2.2 Female gametogenesis and gametes ……………………………….. 170
4.3.2.3 Fertilization and auxospore development …………………………. 174
4.4 Discussion ……………………………………………………………………... 177
4.4.1 Organelles with significance for molecular phylogeny …………………. 177
4.4.2 Sexual reproduction, gametogenesis and auxosporulation ……………… 178
4.4.3 Auxospore development ………………………………………………… 181
Chapter 5. Conclusion ………………………………………………………………… 184
Appendices ……………………………………………………………………………. 189
Appendix 1.………………………………………………………………………... 189
Appendix 2 ..………………………………………………………………………. 190
References …………………………………………………………………………….. 203

viii
List of Tables
Table Title Page
1.1 The conventional algal groups 9
1.2 The classification of eukaryotes at the highest ranks 11
1.3 The classification of the three organisms 12
1.4 Ultrastructural studies available of the genus Dunaliella 13
1.5 Studies available of the genus Nannochloropsis 16
1.6 Available studies of the genus Pseudostaurosira trainorii 17
2.1 The chemical composition of F/2 medium 23
2.2 Chemical components of the WC medium 26
2.3 Chemical components of Roshchin medium 27
2.4 Summary of preparative procedure used 31
2.5 Summary of preparative procedure used for Pseudostaurosira trainorii 33
2.6 Assessment of fixation techniques applied to Dunaliella salina 37
2.7 Assessment of fixation techniques applied to Nannochloropsis oculata 44
2.8 Assessment of fixation techniques applied to Pseudostaurosira
trainorii 52
3.1 Experimental set-up for Dunaliella salina 70
3.2 Experimental set-up for Nannochloropsis oculata 70
3.3 Results of t-tests for volume fractions of cytoplasm, mitochondria,
chloroplast, matrix, thylakoid membranes and starch in Dunaliella
salina active and stationary phase cells 81
3.4 Results of Mann-Whitney tests for volume fraction for nucleus, lipid,
vacuoles, plastoglobuli and pyrenoid in Dunaliella salina active and
stationary phase cells 81
3.5 Results of ANOVA tests on the effects of decadienal treatments on the
volume fractions of cytoplasm, thylakoid membrane, starch, and
matrix in Dunaliella salina 90
3.6 Results of Kruskal-Wallis tests for volume fractions of nucleus,
mitochondria, lipid, vacuoles, chloroplast, pyrenoid and plastoglobuli
in Dunaliella salina decadienal-treated cells 90
3.7 Results of Mann-Whitney tests for significant differences between
volume fractions of nucleus, mitochondria, lipid and vacuoles in
Dunaliella salina decadienal-treated cells 91
3.8 Results of t-tests of volume fractions of cytoplasm, cell wall,
chloroplast, matrix and thylakoid membranes and starch in
Nannochloropsis oculata active and stationary phase cells 100
3.9 Results of Mann-Whitney tests of volume fractions of nucleus, lipid,
vacuoles, plastoglobuli and mitochondria in Nannochloropsis oculata
active and stationary phase cells 100
3.10 Results of ANOVA tests on the effects of decadienal treatments on the
volume fractions of cytoplasm and matrix in Nannochloropsis oculata 110
3.11 Results of Kruskal-Wallis test of volume fractions of nucleus,
mitochondria, lipid, vacuoles, chloroplast, cell wall, plastoglobuli and
thylakoid membranes in Nannochloropsis oculata decadienal-treated
cells 110
3.12 Results of Mann-Whitney tests for significant differences between
volume fractions of lipid and cell wall in Nannochloropsis oculata
decadienal-treated cells 111

ix
3.13 Programmed cell death mechanisms, their signs and mediator with the
key reference 136
3.14 Similarities and differences between results of this present study for
Dunaliella salina programmed cell death and the results of Jimenez et
al. (2009) 143
4.1 Comparison of morphological features across the three molecular
clades 148
4.2 Summary of pyrenoid characteristics as described by Schmid (2001)
together with diagrammatic interpretations of the present writer 152

x
List of Figures
Figure Title Page
1.1 A phylogeny of the major groups of eukaryotic organisms 18
1.2 Dunaliella salina cell structure 19
1.3 Nannochloropsis oculata cell structure 20
1.4 The diatom cell structure 21
2.1 Gametogenesis induction in Pseudostaurosira trainorii 25
2.2 Dunaliella salina fixation protocol one 38
2.3 Dunaliella salina fixation protocol two 39
2.4 Dunaliella salina fixation protocol three 40
2.5 Nannochloropsis oculata cells fixed with fixation protocol one 46
2.6 Nannochloropsis oculata cells fixed with fixation protocol two 47
2.7 Nannochloropsis oculata cells fixed with fixation protocol three 48
2.8 Nannochloropsis oculata cells fixed with fixation protocol four 19
2.9 Nannochloropsis oculata cells fixed with fixation protocol five 50
2.10 Pseudostaurosira trainorii life cycle stages fixed using protocol six 53
2.11 Pseudostaurosira trainorii life cycle stages fixed using protocol seven 54
2.12 Pseudostaurosira trainorii 24 hours induced male gamete fixed using
protocol eight 55
3.1 Basic structure of triacylglycerides 67
3.2 Decadienal structure 67
3.3 Experimental set-up 71
3.4 Stereological analysis 76
3.5 Dunaliella salina cell structure under light, scanning electron microscopy and
comparison between exponential and stationary growth phases of Dunaliella
salina under lower magnification transmission electron microscopy 82
3.6 Comparison of exponential and stationary growth phases of Dunaliella salina
at higher magnification of transmission electron microscope. 83
3.7 Mean and 95% confidence intervals of volume fractions of the cell organelles
in Dunaliella salina log and stationary phase cells 84
3.8 Median and 95% confidence intervals of volume fractions of the cell
organelles in Dunaliella salina log and stationary phase cells 85
3.9 Comparisons of cell structures of two Dunaliella salina control samples 92
3.10 Dunaliella salina decadienal-treated cells 93
3.11 Detailed structural distortion of Dunaliella salina cells treated with 50 M
decadienal 94
3.12 Means and 95% confidence intervals of volume fractions of the cytoplasm
and chloroplast constituents in Dunaliella salina treated with decadienal 95
3.13 Figure 3.13: Medians and 95% confidence intervals of volume fractions of
organelles in Dunaliella salina treated with decadienal 96
3.14 Nannochloropsis oculata cell structure under light and scanning electron
microscopy and exponential growing cells under electron microscopy 101
3.15 Higher magnification of the fine structure of exponentially growing cells of
Nannochloropsis oculata 102
3.16 Nannochloropsis oculata stationary phase growing cells 103
3.17 Higher magnification of fine structure of stationary phase growing cells of
Nannochloropsis oculata 104

xi
3.18 Mean and 95% confidence interval of volume fractions of the cell organelles
and chloroplast constituents in Nannochloropsis oculata log and stationary
phase samples 105
3.19 Median and 95% confidence interval fractions of cell organelles and
chloroplast constituents in Nannochloropsis oculata log and stationary phase
samples 106
3.20 Nannochloropsis oculata controls 112
3.21 Higher magnification of Nannochloropsis oculata cell organelles of both 0
M decadienal and ethanol control cells 113
3.22 Nannochloropsis oculata cells treated with 1 decadienal 114
3.23 Higher magnification of Nannochloropsis oculata cells treated with 1
decadienal 115
3.24 Nannochloropsis oculata cells treated with 10 decadienal 116
3.25 Higher magnification of Nannochloropsis oculata cells treated with 10 M
decadienal 117
3.26 Nannochloropsis oculata cells treated with 50 M decadienal 118
3.27 Higher magnification of Nannochloropsis oculata cells treated with 50 M
decadienal 119
3.28 Mean and 95% confidence intervals of volume fraction of the cytoplasm and
matrix in Nannochloropsis oculata cells treated with deacadienal 120
3.29 Median and 95% confidence intervals of volume fraction of the cell
organelles in Nannochloropsis oculata cells treated with deacadienal 121
4.1 Golgi arrangements 149
4.2 Different types of sexual reproduction in different diatom groups as
summarised by Mann (1993) 154
4.3 Sperm formation in centric diatoms 156
4.4 The three types of auxospore 160
4.5 Light, scanning and transmission electron micrographs of Pseudostaurosira
trainorii 164
4.6 Cytological features of Pseudostaurosira trainorii 165
4.7 Male dividing cells and gametogenesis 168
4.8 Mature male gamete 169
4.9 Female dividing cells and gametogenesis 172
4.10 Egg differentiation and maturation 173
4.11 Fertilization and auxospore in the 20 minutes fertilized sample 175
4.12 Mature auxospore from 24 hours fertilized sample 176

1
Chapter 1. Introduction
1.1 Introduction
Eukaryotic organisms that are photosynthetic and have chlorophyll a with a thallus not
differentiated into roots, stem and leaves are defined as algae (Lee 1999). Algae occur
in almost all habitats and exhibit a huge morphological diversity, ranging from tiny
unicells to large kelps over 50 m long (Lee 1999). However, algae also include
cyanobacteria, which are only prokaryotic. Microalgae (or microscopic algae), which
are algae that are generally invisible to the naked eye, which are both prokaryotic and
eukaryotic (Tomaselli 2004). Microalgae include a variety of mostly unicellular
organisms with different cellular organizations, and also include colony forming
organisms that may have specialised structures that help them to adapt to their
environment.
The conventional approach to classifying algae was generally based on their colour.
New criteria were added later to classify algae, including the types of pigments, the
chemistry of their storage products, cell wall composition, the presence and structure of
flagella, patterns of nuclear division, and the relationship between the endoplasmic
reticulum envelope and the nuclear envelope and chloroplast. Then Lee (1989) reviewed
algal groups. He stressed the importance in algae classification of the additional
membranes that surround the chloroplast envelope. Using this as a basis, he proposed
that eukaryotic algae can be separated into three groups. They differ from one another
based on chloroplast evolution in accordance with endosymbiosis theory (Table 1.1).
The first eukaryotic algal group is of algae that have chloroplasts surrounded by no
extra membranes and includes Rhodophyta, and Chlorophyta. The molecular phylogeny
of Adl et al. (2012) placed these two groups together with Glaucophyta in
Archaeplastida. The Glaucophyta have endosymbiotic cyanobacteria in the cytoplasm
instead of chloroplasts (Lee 1999). The second group includes both the Dinophyta and
Euglenophyta, which have one additional membrane of endoplasmic reticulum
surrounding the plastid. In the final group, the algae have two additional membranes of
endoplasmic reticulum surrounding the chloroplast and this group includes the
Cryptophyta, Chrysophyta, Prymnesiophyta, Bacillarophyta, Xanthophyta,
2
Eustigmatophyta, Raphidophyta and Phaeophyta (Lee 1999). The scheme used for
classifying algae is summarized in Table 1.1.
The development of molecular phylogeny and the Tree of Life project resulted in
amendments to the classification of all eukaryotic organisms, which includes algae. The
latest classification has been summarised by Adl et al. (2012). The present thesis is
concerned with three algae Dunaliella salina, Nannochloropsis oculata, and
Pseudostaurosira trainorii. They belong to two major super-groups described by Adl et
al. (2012). D. salina belongs to the super-group Archaeplastida, and both N.oculata and
P. trainorii belong to the super-group SAR (Table 1.2, Figure 1.1). The super-group
Archaeplastida includes Glaucophyta, Rhodophyceae (red algae) and Chloroplastida
(green lineages, including land plants). These three groups arose from the symbiosis of
a heterotrophic eukaryotic ancestral organism with a photosynthetic cyanobacterium,
and are considered to have the primary plastids (Reyes-Prieto et al. 2007). Following
the evolution of red and green algae, the ancestors of the Chromalveolata were thought
to have evolved through the engulfment of forms of red algae by a non-photosynthetic
protist (Cavalier-Smith 1999). The Chromalveolata include the algal lineages of
cryptophytes, haptophytes, stramenopiles, and dinoflagellates and the
nonphotosynthetic ciliates and apicomplexans (Adl et al. 2005). However, more recent
research suggests that this is a polyphyletic assemblage (Adl et al. 2012). Other algal
groups evolved through the secondary symbiosis of either a green or a red alga
(Falkowski et al. 2004). The euglenids evolved by the engulfment of the green alga cell
by the ancestor of the euglenoid (Excavata), and chlorarachniophytes evolved by the
engulfment of the green alga cell by the ancestor of the chlorarachniophyte amoebae
(Rhizaria) (Falkowski et al. 2004; Reyes-Prieto et al. 2007). The red algal plastid groups
such as cryptomonads, heterokonts, haptophytes, apicomplexans and dinoflagellates
were acquired by a single secondary endosymbiosis by their common ancestor
(Archibald 2005; Archibald 2008). However, Adl et al. (2012) reported that
Stramenopiles (heterokonts, apicomplexans, diatoms, chrysophytes and brown
seaweeds), Alveolata (dinoflagellates) and Radiolaria (Foraminifera) are now thought to
share a common ancestor and have now been placed in the so-called SAR super-group.
However, the cryptomonads and haptophytes still present challenges with regard to their
phylogenetic placement in the tree of life (Adl et al. 2012).

3
1.2 Thesis organization
Algal ultrastructure is well documented and has been reviewed by Dodge (1973) and
Berner (1993). This thesis examined two different and unrelated problems, using the
common tool of transmission electron microscopy. The first problem investigated was
the effect of the infochemical decadienal on the cell structure and lipid production of
two algal species, Dunaliella salina and Nannochloropsis oculata, which are considered
to be potential biofuel stock species (a full review of the issue is presented in the
introduction to Chapter 3, section 3.1). The second problem was describing the cell
structure and gametogenesis of the diatom Pseudostaurosira trainorii. This species is
described for the first time in this thesis using transmission electron microscopy and this
is considered important because it is the first species in which a thread-like structure in
the male gametes has been reported (Sato et al. 2011).
The evolution of diatom diversity is an area that requires the study of different
biological processes in order to be fully understood. For example, it requires the study
of frustule (cell valve) morphology and ontogeny, of sexual reproduction, which
includes gamete and auxospore ontogeny, and of cell structure organization. Different
systems have been used historically to classify diatoms, but the use of molecular
phylogeny changed the situation and erased the link between cell structure and
classification again. A comprehensive, detailed description and review of the problem is
presented in Chapter 4. The following section (1.3) gives a brief description of both
problems, stating the aims of the two studies and the important cell ultrastructure
features of the organisms studied.
1.3 Project description
1.3.1 Effects of an algal infochemical (decadienal) on the ultrastructure of
Dunaliella salina and Nannochloropsis oculata
The aim of the experimentation described in Chapter 3 was first to use electron
microscopy to permit the differentiation between two types of lipid-rich structures
within the cell, namely, lipid bodies and membrane constituents, since chemical
extraction methods only provide a measure of the total lipids in the cell. Electron
microscopy was used as part of a quantitative technique using stereological
measurements of randomly-taken thin sections of cells in their exponentional and
stationary growth phases, and in a range of decadienal concentrations. This allowed an
4
estimation of the volume fraction of lipid production, which would enable assessment of
whether decadienal triggers a shift to lipid body content or just increases the overall
membrane constituents in the cell and, in particular, the extensive plastid thylakoid
system. Furthermore, the effect of decadienal on the cell structure of N. oculata and D.
salina could be evaluated in these two species of microalgae, which are already widely
cultured and many of whose characteristics are well known. Finally, the effectiveness of
decadienal as a lipid production inducer in both species could be assessed by comparing
cell structure in the absence and presence of decadienal.
D. salina is green alga (Table 1.3) that has diverse features, some of them shared with
land plants (van den Hoek et al. 1995; Graham et al. 2009). The chloroplasts are
encircled by a double membrane with thylakoids grouped in lamellae, and contain
chlorophyll a and b along with a set of accessory pigments such as carotenes and
xanthophylls. Pyrenoids, when present, are embedded within the chloroplast and are
surrounded by starch, which is the main reserve polysaccharide (Figure 1.2). While the
majority of the green algae have firm cell walls, D. salina lacks a cell wall and, instead,
has a thin glycocalyx coat (Ginzburg 1987). D. salina has two flagella which are similar
in structure to each other (isokont).
The genus Dunaliella is considered a model organism, both for studying the evolution
of higher plants and for studying the effect of stress factors, owing to its ubiquity and
ability to survive in harsh environmental conditions such as high salinity, temperature
fluctuation, nitrogen starvation, and irradiance (Ginzburg 1987; Cowan et al. 1992). It is
industrially important because it can accumulate huge amounts of β-carotene in the cells
which can be collected for commercial purposes (Borowitzka et al. 1984; Borowitzka
and Borowitzka 1990). In addition, it has potential as a feedstock for biofuel production
(Oren 2005; Gouveia and Oliveira 2009; Tafresh and Shariati 2009). Devi et al. (2012)
demonstrated that the direct transesterification of microalgae biomass showed a good
biodiesel yield, where D. salina yielded 66.6%. The total lipid content of D. salina was
21.2% (Devi et al. 2012).
Under some stress-inducing conditions, such as increased salt concentration
(halostress), D. salina shows increased lipid production (Alhasan et al. 1987). In
contrast, nitrogen limitation, which is a common way of inducing lipid production in
other microalgae species, does not induce increased lipid production in D. salina
(Griffiths and Harrison 2009). However, there has been relatively little research into

5
lipid accumulation in D. salina in response to halostress, as most of the earlier work in
this area has focused principally on -carotene production (Ben-Amotz and Avron
1983). D. salina is reported to produce 35% lipid content in non-stressed conditions
(Griffiths and Harrison 2009). The effect of several physical stress factors on lipid
production in D. salina has been studied previously (reviewed in Sharma et al. 2012).
The majority of these studies used chemical extraction and dry weight as a method to
quantify lipids (detailed in Chapter 3, section 3.1). However, only a limited number of
studies, listed in Table 1.4, have been conducted using electron microscopy. To the best
of the present writer’s knowledge, this is the first ultrastructural study that has examined
the effect of a chemical factor on D. salina cell structure.
The other organism considered was Nannochloropsis oculata. The genus
Nannochloropsis belongs to the Eustigmatales, which is classified in the Stramenopiles
that occur within the superclade SAR (Adl et al. 2012). It belongs to the class
Eustigmatophyta, which has both ecological significance and economic uses (van den
Hoek et al. 1995). It is a unicellular alga with spherical cell shape that ranges in size
from two to four micrometres and has a simple cell structure (Figure 1.3). Growing in
marine environments, it is characterized by its high content of eicosap entaenoic acid,
an omega three fatty acid [2053] (Brown et al. 1993). Consequently, it has been used
in many marine-culture hatcheries in Europe since the late 1980s to provide this
important nutrient supplement (Cheng-Wu et al. 2001). Many studies have been
conducted to optimise the mass production of Nannochloropsis cultivation in order to
produce pharmaceuticals and fish feed (Rebolloso-Fuentes et al. 2001; Richmond and
Cheng-Wu 2001; Rodolfi et al. 2003). Recently Nannochloropsis has been considered a
candidate for the production of biofuel (Chisti 2007; Rodolfi et al. 2009; Brennan and
Owende 2010). The genus Nannochloropsis is known to synthesise triacylglyceride
(TAG) lipids (Vieler et al. 2012). As with other algal species, stress conditions trigger
the accumulation of increased amounts of TAGs in Nannochloropsis spp. The stress
factors that have been studied in this respect in Nannochloropsis spp. include changing
nitrogen concentration, level of irradiation, temperature and salinity conditions.
Rodolfi et al. (2009) screened thirty microalgal species and assessed the best lipid
producers as those strains showing the best combination of biomass productivity and
lipid content. Three members of the marine genus Nannochloropsis had a lipid content
of 30% or higher and a lipid productivity ranging from 55 to 61 mg l-1 day-1. The
authors reported that Nannochloropsis species could produce 20 tons of lipid per

6
hectare in the Mediterranean climate and more than 30 tons of lipids per hectare in
sunny tropical areas. Nannochloropsis could attain 60% lipid content by weight when
subjected to nitrogen deficiency and high irradiances (Rodolfi et al. 2009; Pal et al.
2011). In addition, Devi et al. (2012) showed that Nannochloropsis sp. yielded 68.5%
lipid content by direct transesterification. The total lipid content of Nannochloropsis sp.
was 27.5% (Devi et al. 2012). Ultrastructural studies of N. oculata, however, are very
limited and are summarized in Table 1.5.
1.3.2 Pseudostaurosira trainorii: ultrastructure and gametogenesis
Diatoms are unicellular or colonial algae with a unique cell wall. This wall (frustule) is
composed of silica and has a complex architecture, as summarized in Figure 1.4.
Variation in diatom frustule structure has been widely used to classify diatoms, in
addition to features such as mode of sexual reproduction and plastid number and
structure (Round et al. 1990). Diatoms have been traditionally split into two major
taxonomic groups: the radially symmetrical centric diatoms and the bilaterally
symmetrical pennate diatoms (Figure 1.4). In centric diatoms the valve is radially
symmetric, organized around one central point, with pores and ribs radiating out from a
central ring called the “annulus”. Their overall cell shape varies from circular to short
elliptical, triangular, or polygonal (Mann and Evans 2007). In contrast, in pennate
diatoms, the valves are bilaterally symmetric and have their ribs and pores arranged on
each side of a centre line (called the sternum) which divides the valve into two equal
parts with an elongated cell shape (Lee 1999). Some pennate diatoms have a
longitudinal slot in the valve called a raphe. The raphe divides the valve of the pennate
diatom into two bilateral symmetrical halves. Valve ornamentation is caused by the
presence of pores in the silica wall, which are called are loculi or areolae and are
arranged in rows called a striae. The molecular phylogenetic study of diatoms (Medlin
and Kaczmarska 2004) has revealed a slightly different classification as it results in two
major clades at the level of subdivision. The first is Coscinodiscophytina (Clade 1)
which includes those centric diatoms that have valves with radial symmetry
(representing the class Coscinodiscophyceae), and the second is Bacillariophytina
(Clade 2). This has two subgroups (class level) that are different from those recognised
in conventional classification schemes. The first subgroup is the so-called Clade 2a and
includes the bi- or multipolar centrics and the radial Thalassiosirales (resembleing
traditional Mediophyceae); and the second is so-called Clade 2b that includes all the
traditional pennate diatoms (equivalent to the traditional Bacillariophyceae) (Medlin

7
and Kaczmarska 2004). Medlin and Kaczmarska (2004) carried out a detailed analysis
to see what ultrastructural and cytological features (e.g. the structure of the Golgi
apparatus, chloroplast, pyrenoid organisation, auxospore structure and pattern of sexual
reproduction) correlated with their molecularclades. A more detailed account of this is
given in Chapter 4, section 4.1.2. This chapter documents the relationship between
ultrastructural features and molecular phylogeny through the study of Pseudostaurosira
trainorii, which belongs to the araphid pennate diatoms that have so far only been
described by light and scanning electron microscopy (Table 1.6). Its shape is circular to
elliptical with parallel striae (30 in 10 m) and a distinct sternum along the long axis
(Sato et al. 2011) (Figure 1.4). Only centric diatoms have anteriorly uniflagellate sperm
whereas all pennate diatoms lack flagella (van den Hoek et al. 1995). Thus the presence
of thread-like structures in P. trainorii make it an interesting organism to investigate as
regards cell ultrastructure so as to determine the nature of this structure, which has been
considered might be a vestigial flagellum (Sato et al. 2011). In addition, the cell
ultrastructure determined by transmission electron microscopy of this hitherto
undescribed species can be used to investigate the significance of cell structure in the
context of the recent molecular phylogenetic concepts of the diatoms proposed by
Medlin and Kaczmarska (2004).
1.4 Aims and objectives
The aim of this thesis was to use transmission electron microscopy to address two
unrelated biological problems. The first was to assess the effects of the infochemical
decadienal on the cell structure of two important biofuel producing species, Dunaliella
salina and Nannochloropsis oculata, qualitatively and quantitatively through
stereological technique. In order to assess whether this infochemical was simply
speeding up the normal cell aging processes in the algal cells, the cytological effects of
decadienal were compared using cells from two groups. One group consisted of
exponentially growing decadienal-treated cells and the other of normal stationary phase
cells. Further, estimating the volume fraction of lipid globules in decadienal-treated
cells and normal aged cells would help to assess the usage of decdienal as a lipid
induction substance in biofuel production plan.
The second problem addressed here was to describe the cell structure and
gametogenesis of Pseudostaurosira trainorii, not hirherto described. This species had
recently been shown to have a unique pattern of gametogenesis, with motile male

8
gametes that appeared to glide along fine cytoplasmic threads, which might or might not
be related to flagella (Sato et al. 2011). Transmission electron microscopy should
resolve this issue. Finally, these cytological ultrastructural features were to be placed in
the context of the modern molecular phylogeny of diatoms, such as outlined by Medlin
and Kaczmarska (2004).

9
Table 1.1: The conventional algal groups
(Source: Berner 1993)
No membrane One membrane
Rhodophyta Chloroplyta Euglenophyta Dinophyta
Flagellum - Two anterior (whiplash) acronematic
isokont flagella; sometimes
stephanokont
One anterior
pantonematic flagellum
Transverse pantonematic
flagellum, located in groove
or a girdle and shorter
posterior acronematic
flagellum
Hairs - Fibrillar solid hairs (tripartite tubular
hairs in some primitive Chlorophyta)
Nontubular fibrillary
hairs
Nontubular fibrillary hairs
Chloroplast Two-layered chloroplast
envelope
Two-layered chloroplast envelope CER membrane not
continuous with nuclear
membrane
CER membrane not
continuous with nuclear
membrane
Thylakoid membrane 1 -7; sometimes pseudograna 3 3
Girdle lamella - - - -
Storage product location Outside chloroplast Within the chloroplast stroma, often
as a sheath around the pyrenoid
Outside chloroplast Within the chloroplast
stroma, often as a sheath
around the pyrenoid
Chromosomes Condensed at mitosis Condensed at mitosis Persistently condensed Persistently condensed;
attached to nuclear
envelope
Kinetochore + -or + + -
Nucleolus Not persistent at mitosis Not persistent at mitosis Persistent at mitosis
(endosome)
Not persistent at mitosis
Nuclear envelope
Intact + + + +
Polar gaps
Breaks down (+)
Spindle type Closed nuclear and cytoplasmic Nuclear and cytoplasmic or
intranuclear
Intranuclear and
subspindles
Cytoplasmic tunnels
Polar structure Polar rings; no true centrioles Centrioles ? ?
Cytokinesis Annular wall plus septal plug Phycoplast and phragmoplast Cleavage Cleavage
9

10
Table 1.1: The conventional algal groups (continued)
Two membranes
Cryptophyta Chrysophta Prymnesiophyta Bacillariophyta Xanthophyta Eustigmatophyta Raphidophyta Phaeophyta
Flagellum Two anterior
pantonematic flagella
Two unisokont with
long anterior pantonematic and
short posterior
acronematic flagellum
Two unisokont
acronematic flagella
One posterior
pantonemtic flagellum
Two unisokont with
long anterior pantonematic and
short posterior
acronematic flagellum
One anterior
pantonematic flagellum
Two unisokont with
long anterior pantonematic and short
acronematic flagellum
Two unisokont with
long anterior pantonematic and short
posterior acronematic
flagellum
Hairs Tripartite tubular
hairs
Tripartite tubular
hairs
Tripartite tubular
hairs
Tripartite tubular hairs Tripartite tubular hairs Tripartite tubular
hairs
Tripartite tubular hairs Tripartite tubular hairs
Chloroplast ? Outer CER membrane
continuous with
outer membrane of nuclear envelope
Outer CER membrane
continuous with
outer membrane of nuclear envelope
Outer CER membrane continuous with outer
membrane of nuclear
envelope
Outer CER membrane continuous with outer
membrane of nuclear
envelope
CER membrane not continuous with
nuclear membrane
Outer CER membrane continuous with outer
membrane of nuclear
envelope
Outer CER membrane continuous with outer
membrane of nuclear
envelope
Thylakoid
membrane
2 3 3 3 3 3 3 3
Girdle lamella - + + + + - - +
Storage product
location
Between chloroplast
envelope and CER
Outside the
chloroplast
Outside the
chloroplast
Outside the
chloroplast
Outside the
chloroplast
Outside the
chloroplast
Outside the chloroplast Outside the chloroplast
Chromosomes Persistently
condensed
Condensed at
mitosis
Condensed at
mitosis
Condensed at mitosis Condensed at mitosis Condensed at
mitosis
Condensed at mitosis Condensed at mitosis
Kinetochore + - - - - - + +
Nucleolus Persistent at mitosis Not persistent at
mitosis
Not persistent at
mitosis
Not persistent at
mitosis
Not persistent at
mitosis
Not persistent at
mitosis
Not persistent at mitosis Not persistent at
mitosis
Nuclear envelope
Intact + + + (+)
Polar gaps +
Breaks down + + + + +
Spindle type Nuclear and
cytoplasmic
Nuclear and
cytoplasmic
Nuclear and
cytoplasmic
Cytoplasmic (?) Extended intranuclear Nuclear and
cytoplasmic
Intranuclear Intranuclear
Polar structure Flagellarbasis; no true centriole
Rhizoplast No centrioles Spindle “precursor” Centrioles Flagellar bases act as centrioles
Centrioles Extranuclear centrioles
Cytokinesis Cystokinetic ring Cleavage Cleavage Furrowing Cleavage Cleavage Cleavage Cell plate
10

11
Table 1.2: The classification of eukaryotes at the highest ranks
(Source: Adl et al. 2012)
Super-groups Examples
Eukaryota
Amorphea
Amboebozoa Tubulinea
Mycetozoa
Opisthokonta Fungi
Choanomonada
Metazoa
Apusomonnada
Breviata
Excavata Metamonada
Malawimonas
Discoba
Diaphoretickes Cryptophyceae
Centrohelida
Telonemia
Haptophyta
Sar Cercozoa
Foraminifera
“Radiolaria”
Alveolata
Stramenopiles
Archaeplastida Glaucophyta
Rhodophyceae
Chloroplatida
Incertae sedis Eukaryota Incertae sedis

12
Table1.3: The classification of the three organisms
D. salina N. oculata P. trainorii
Super-group Archaeplatida Sar Sar
Higher Level Chloroplastida Stramenopiles Stramenopiles
Phylum Chlorophyta Heterokontophyta Bacillariophyta
Class Chlorophyceae Eustigmatophyta Fragilariophyceae
Order Volvocales Eustigmatales Fragilariales
Family Dunaliellaceae Monodopsidaceae Fragilariceae

13
Table 1.4: Ultrastructural studies available of the genus Dunaliella
Factor Ultrastructural effect Microscope Study
Comparison between logarithmic and
stationary phase growing cells of D.
primolecta.
Stationary phase was marked by:
- Changes in content and size of cytoplasmic vacuoles
- Accumulation of cytoplasmic lipids
- Accumulation of starch in plastid
- Formation of autophagosome-like bodies
LM and TEM Eyden (1975)
3.5% and 25% NaCl thylakoid membranes was numerous at low NaCl and
stacked or compressed at high NaCl
TEM Pfeifhofer and Belton (1975)
Comparison between D. tertiolecta cell
structure and three other species. - D. tertiolecta similar to D. salina and D.
bioculata in having two flagellar basal bodies
while D. primolecta has four basal bodies.
- The stigma in D. tertiolecta flat in shape, D.
salina elongated in shape, D. bioculata dense
plaque, and plate-like in D. primolecta
TEM Hoshaw and Maluf (1981)
Light intensity and temperature At low light intensity the thylakoids had intensive
structure and condensed membranes, while the
thylakoid was reduced under high light intensity
Lipid globules appeared in all studied variants
TEM Vladimirova (1978)
Ultrastructural comparison between D.
salina and Spermatozopsis
- TEM Melkonian and Preisig (1984)
Hypoosmotic shock Swollen cells
Expanded organelles
TEM and stereology Maeda and Thompson (1986)
Low and high CO2 concentrations Tsuzuki et al. (1986)
Review of English and non-English
literature
- - Ginzburg (1987)
13
14
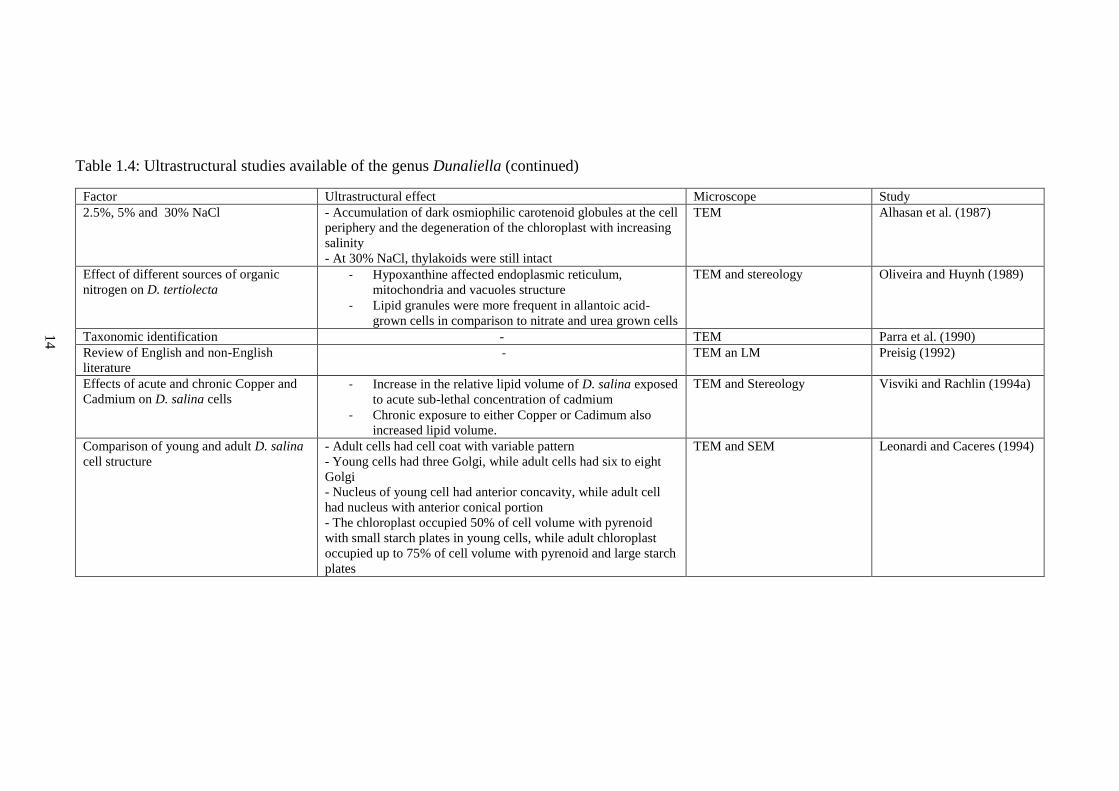
Table 1.4: Ultrastructural studies available of the genus Dunaliella (continued)
Factor Ultrastructural effect Microscope Study
2.5%, 5% and 30% NaCl - Accumulation of dark osmiophilic carotenoid globules at the cell
periphery and the degeneration of the chloroplast with increasing
salinity
- At 30% NaCl, thylakoids were still intact
TEM Alhasan et al. (1987)
Effect of different sources of organic
nitrogen on D. tertiolecta - Hypoxanthine affected endoplasmic reticulum,
mitochondria and vacuoles structure
- Lipid granules were more frequent in allantoic acid-
grown cells in comparison to nitrate and urea grown cells
TEM and stereology Oliveira and Huynh (1989)
Taxonomic identification - TEM Parra et al. (1990)
Review of English and non-English
literature - TEM an LM Preisig (1992)
Effects of acute and chronic Copper and
Cadmium on D. salina cells - Increase in the relative lipid volume of D. salina exposed
to acute sub-lethal concentration of cadmium
- Chronic exposure to either Copper or Cadimum also
increased lipid volume.
TEM and Stereology Visviki and Rachlin (1994a)
Comparison of young and adult D. salina
cell structure
- Adult cells had cell coat with variable pattern
- Young cells had three Golgi, while adult cells had six to eight
Golgi
- Nucleus of young cell had anterior concavity, while adult cell
had nucleus with anterior conical portion
- The chloroplast occupied 50% of cell volume with pyrenoid
with small starch plates in young cells, while adult chloroplast
occupied up to 75% of cell volume with pyrenoid and large starch
plates
TEM and SEM Leonardi and Caceres (1994)
14

15
Table 1.4: Ultrastructural studies available of the genus Dunaliella (continued)
Factor Ultrastructural effect Microscope Study
Salinity and irradiance - High salinity induced salt-containing vacuoles
- Changes in salinity and irradiance changed the chloroplast structure
by increasing invaginations and protuberances, lowring number of
thylakoids and starch grains
TEM Stoynova-Bakalova and
Toncheva-Panova (2003)
Darkness - Cromatin condensation
- Loss of nuclei
- Intact mitochondria
- Intact pyrenoids and starch were lost.
TEM Segovia et al. (2003)
Chronic selenium intoxication Different selenium concentrations cause:
- Increase in excretory vacuoles
- Chloroplast devoid of thylakoid
- Autolysed mitochondria
- Lysed cytoplasm
- Fusing vacuoles
TEM and stereology Reunova et al. (2007)
-UV irradiation
- Acute heat-shock
- Hyperosmotic shock
- Nutrient starvation and nitrogen limitation
- Stationary phase
- Aponecrosis-like
- Necrotic like
- Paraptotic
- Autophagic/vascular cell death
- Chromatin aggregation, nuclear fragmentation, membrane blebs,
cytoplasmic disassembling
TEM Jimenez et al. (2009)
UV-B radiation - Swelled thylakoids
- Lipid globule accumulation
- Increased starch grains
- Disintegrated mitochondrial cristae
- Cisternae of Golgi dictyosomes became loose and swollen
TEM Tian and Yu (2009)
Light-stress - Lipid globule accumulation and disappearance of most thylakoid
membranes
SEM Lamers et al. (2010)
Dodecane Distorted membranes, decomposed completely LM Kleinegris et al. (2011)
15

16
Table1.5: Studies available of the genus Nannochloropsis
Study Microscope Main findings
Antia et al. (1975) TEM Detailed description of N. oculata cell structure suggesting
its similarity to Eustigmatophyceae rather than Chlorophyta.
Maruyama et al.
(1986)
LM and TEM Identification of two marine Chlorella species as members
of Eustigmatophyceae, and evidence of ultrastructure and
biochemistry of N. oculata.
Solomon et al.
(1986)
TEM In comparison with healthy cells, nutrient stressed cells of
N. oculata contained more cytoplasmic lipid droplets. In
nitrogen-deficient cells small lipid droplets (plastoglouli)
were numerous within the chloroplast and disrupted the
orderly arrangement of thylakoid membranes.
Karlson et al.
(1996)
TEM Comparison of cell structures of the genus N. granulate with
N. oculata and N. salina
N. granulate did not have pyrenoid and lamella vesicles,
which are present in the other two species.
Rodolfi et al.
(2003)
TEM Medium recycling changed the cell structure of
Nannochloropsis sp. by producing two types of storage
bodies, accumulation bodies and pigmented bodies, which
differed in their osmiophility.
Murakami and
Hashimoto (2009)
TEM Description of unusual nuclear division of N. oculata.
Khairy (2009) TEM Exposure of N. oculata to high concentration of copper
resulted in increased numbers of vacuoles, cell swelling,
clumping.
Simionato et al.
(2013)
TEM Cell volume of the nitrogen-deficient cells were occupied by
oil bodies, intact chloroplast in N. gaditana in comparison
with control cells.

17
Table 1.6: Available studies of the genus Pseudostaurosira trainorii
Study Microscope Main findings
Williams and Round (1987) SEM Systematic study based on valve morphology separated the following genera from the Genus Fragilaria
Morales (2001) SEM Morphological study based on SEM, that aiming to identify isolated strains from Lake Connecticut waters in the USA. All
these isolates were suspected to belong to the genus Fragilaria. The author identified the Species Pseudostaurosira trainorii
Morales, sp. Nov. with the following description: “ Frustules rectangular in girdle view, usually forming chains with the aid of
spines, valve elliptical to round, valves 1.88-8.57 m long/ 1.72- 4.41 m wide, striae typically 20-25 per 10 m, spines
interrupting the striae, spines with lateral projections”. He mentioned that this species were previously reported under the
names: Fragilaria elliptica by Archibald 1983; Poulin et al. 1984 and Staurosira elliptica by Snoeijs and Balashova 1998.
Morales (2005) LM and SEM Morphological study based on SEM, that aiming to identify isolated strains from rivers in USA. Identified and described the
species Pseudostaurosira subsalina
Morales et al. (2010) LM and SEM Description of several diatom species, including Pseudostaurosira trainorii Morales as the following: “Valve elliptical to
flattened spheroids, valves 4-5 m long/ 3.5- 4.0 m wide, striae typically 16.5-19.5 per 10 m, spines are not always visible
at the valve margin but can be clearly seen on the girdle view ”
Medlin et al. (2008) Molecular Phylogeny
and SEM
The new araphid genera separated from Fragilaria fell into several clades and they deserved taxonomic ranking but not as
individual genera. The Genus Pseudostaurosira was one of these genera that occured in both sub-clades (2a and 2b) of the
send clade within the araphid diatoms. The four isolates of the genus Pseudostaurosira studied had variable valve structure.
Sato et al. (2011) SEM and LM First detailed study of the gametofensis of Pseudostaurosira trainorii proved the induction of gametogenesis by cell-free
exudates. Proved the presence of sticky threads structure in male gametes that resembled flagella in containing microtubules.
However, they lacked mastigonemes and could catch and draw female gametes.
17

18
Figure 1.1: A phylogeny of the major groups of eukaryotic organisms
(Source: Adl el al. 2012)

19
Figure 1.2: Dunaliella salina cell structure
(Source: Ginzburg 1987)

20
Figure 1.3: Nannochloropsis oculata cell structure
(Source: Antia et al. 1975)
CER: chloroplast endoplasmic reticulum; D: dictyosome; E: chloroplast envelope; GE:
chloroplast genophore; L: lipid droplet; LV: lamellate vesicle; M: mitochondrion; N:
nucleus; NL: nucleolus; P: plastoglobuli; PM: plasma membrane; V: vacuole; W: cell
wall.

21
Figure 1.4: The diatom cell structure
A) Centric diatom. B) Pennate diatom. C) Diatom cell section from the side showing
two newly formed cells within the mother cell. It consists of two parts called valves,
which have different perforation patterns and ornamentations in different genera (Cox
2011). Of the two valves, one is slightly smaller and fits into the other in a way
resembling the two parts of a Petri dish. The larger outer (upper) part is called the
epitheca, whilst the smaller inner (lower) valve is called the hypotheca. At the periphery
of each valve there are connecting bands (strips of silica) called the girdle bands.
Therefore, the diatom cells have two different surface views. The valve view sees the
diatom cell from the upper or lower surface (like looking at a Petri dish from the top or
bottom surface), while the girdle view sees the diatom cell from the side (like viewing a
Petri dish side-on). D) P. trainorii under the light microscope; scale bar 5 m. E) Inner
valve showing the bilateral symmetry of the pennate diatom of the P. trainorii scale bar
2 m. F) Cell shell of P. trainorii with its circular appearance scale bar 2 m. G) Close
view of the loculi. Scale bar 5 m.
Sources:
A-C: Kelly et al. (2005)
D-G: Sato et al. (2011)

22
Chapter 2. Methods
2.1 Cultures
2.1.1 Maintenance cultures of Dunaliella salina and Nannochloropsis oculata
Dunaliella salina (CCAP19/30) and Nannochloropsis oculata (CCAP849/1) were
purchased from the Culture Collection of Algae and Protozoa. These two strains were
maintained as suspended cultures in 10 litre Nalgene polycarbonate carboys containing
9 litres of culture. The carboys were kept in an algal growth room within the School of
Marine Science and Technology of Newcastle University. The growth room was
illuminated by a combination of warm and cold fluorescent tubes giving a range
luminance of 2200-2800 Lux with photoperiods of 16 hours light: 8 hours dark at 19 ± 2
oC. The carboys were aerated by connecting them to a pump, and the air coming from
the pump was filtered through the use of a 0.45 m HePA-vent disposable in-line filter
device, which is a glass microfibre filter with polypropylene housing (Whatman plc,
Maidstone, Kent).
The medium used to culture both species was an F/2 medium (Guillard and Ryther
1962), which was prepared using natural seawater filtered to 1 μm, UV sterilised and
autoclaved at 121°C for 25 min. The medium stock solutions consisted of NaNO3
(0.075 g l-1), NaH2PO4.2H2O (0.00565 g l-1), trace elements stock solution (1.0 ml l-1),
and vitamin mix stock solution (1.0 ml l-1). The contents of the trace element solution
are explained in Table 2.1. The medium was adjusted to pH 8.0 with 1 M NaOH or HCl.
The medium was sterilized by autoclaving for 15 minutes at 121°C and used when
cooled to room temperature.
These cultures were used to obtain samples for the evaluation of the fixation protocols
and in the experiments described in Chapter 3 (sections 3.2.1 and 3.2.2).

23
Table 2.1: The chemical composition of F/2 medium
Component Concentration
NaNO3 0.075 g l-1
NaH2PO4.2H2O 0.00565 g l-1
Trace element stock
solution (1.0 ml l-1)
Na2 EDTA 4.16 g l-1
FeCl3.6H2O 3.15 g l-1
CuSO4.5H2O 0.01 g l-1
ZnSO4.7HO 0.022 g l-1
CoCl2.6H2O 0.01 g l-1
MnCl2.4H2O 0.18 g l-1
Na2MoO4.2H2O 0.006 g l-1
Vitamin mix stock
solution (1.0 ml l-1)
Cyanocobalamin (Vitamin B12) 0.0005 g l-1
Thiamine HCl (Vitamin B1) 0.1 g l-1
Biotin 0.0005 g l-1

24
2.1.2 Pseudostaurosira trainorii: cultures and inducing gamete formation and
mating
Cultures of Pseudostaurosira trainorii were provided by Shinya Sato from the Royal
Botanic Garden, Edinburgh. They were derived from P. trainorii cells that were
collected from the bottom sands at Obuchi-numa Lake, Aomori Pref., Japan, on 25 July
2010. The methods for inducing gametogenesis were as described by Sato et al. (2011)
and are as follows. Single cells were isolated from the original field sample to obtain
clonal cultures. Eighteen clones were successfully established, of which six were male
and twelve female. Clone numbers 3 (male) and 7 (female) were used for all
ultrastructural fixations. Cultures were maintained in a 1:1 mixture of WC medium
(Table 2.2) and Roshchin medium (Table 2.3) at 15 oC under cool-white fluorescent
light on a 14 hours light: 10 hours dark photoperiod at a photon flux density of 5-20
mmol photons m–2 s–1.
Gamete induction was achieved by the release of the pheromone, as described by Sato
et al. (2011). A Petri dish with 3% solid agar was used and two holes were prepared one
centimetre apart from each other. Male and female compatible clones were placed into
the separate holes. This allowed the pheromone to diffuse into the agar and induce the
counterpart to produce gametes without mixing the compatible clones. This facilitated
the ultrastructural study of male and female clones gametogenesis because it enabled
populations of solely male or female gametes (together with their parent clone cells) to
be collected for fixation. Samples were fixed after 24 hours induction of gametogenesis
in Petri dishes (Figure 2.1). The observations of fertilization and zygote (auxospore)
development were made from two compatible clones that were mixed in a liquid
medium prepared as above and fixed 20 minutes, 3 hours and 48 hours after mixing the
female and male compatible clones.

25
Figure 2.1: Gametogenesis induction in Pseudostaurosira trainorii

26
Table 2.2: Chemical components of the WC medium
Component Amount Stock solution Final
concentration
NaNO3 1 ml l-1 85.1 g l-1 1 mM
CaCl2·2H2O 1 ml l-1 36.76 g l-1 0.25 mM
MgSO4·7H2O 1 ml l-1 36.97 g l-1 0.15 mM
NaHCO3 1 ml l-1 12.6 g l-1 0.15 mM
Na2SiO3·9H2O 1 ml l-1 28.42 g l-1 0.1 mM
K2HPO4 1 ml l-1 8.71 g l-1 0.05 mM
H3BO3 1 ml l-1 24 g l-1 0.39 mM
WC trace elements
solution (1 ml-1)
Na2EDTA·2H2O 4.36 g l-1 11.7 µM
FeCl3·6H2O 3.15 g l-1 11.7 µM
CuSO4·5H2O 1 ml l-1 2.5 g l-1 10 nM
ZnSO4·7H2O 1 ml l-1 22 g l-1 76.5 nM
CoCl2·6H2O 1 ml l-1 10 g l-1 42 nM
MnCl2·4H2O 1 ml l-1 180 g l-1 910 nM
Na2MoO4·2H2O 1 ml l-1 6.3 g l-1 26 nM
Na3VO4 1 ml l-1 18 g l-1 98 nM
Vitamin B12 (1 ml-1)
HEPES buffer pH
7.8 (Sigma H-3375) 2.4 g/200 ml dH2O
Vitamin B12
(cyanocobalamin,
Sigma V-6629)
0.027 g/200 ml dH2O
Thiamine vitamin
solution (1 ml-1)
HEPES buffer pH
7.8 (Sigma H-3375) 2.4 g/200 ml dH2O
Thiamine (Sigma
T-1270) 0.067 g/200 ml dH2O
Biotin vitamin
solution (1 ml-1)
HEPES buffer pH
7.8 (Sigma H-3375) 2.4 g/200 ml dH2O
Biotin
(Sigma B-4639) 0.005 g/200 ml dH2O

27
Table 2.3: Chemical components of Roshchin medium
Component Concentration
Seawater 16%o
KNO3 202 mg l-1
Na2HPO4.12H2O 17.9 mg l-1
FeSO4.7H2O 0.29 mg l-1
MnCl2.4H2O 0.19 mg l-1
CoCl2.6H2O 0.24 mg l-1
Na2EDTA 3 mg l-1
Na2S2O3.5H2O 1.2 mg l-1
Na2SiO3.9H2O 10 mg l-1
Vitamin B12 g l-1

28
2.2 Light microscopy
The three species D. salina, N. oculata, and P. trainorii were examined by light
microscopy under a Leica DMRB microscope (Leica Microsystems, Wetzlar,
Germany), fitted with differential interference contrast (DIC) optics. A drop of the
culture was placed on a glass slide and covered by a coverslip. Images of cells were
recorded using an Olympus 5050 (Olympus Corp, Tokyo, Japan) 5 Mp digital camera.
2.3 Transmission electron microscopy fixation protocols
Fixation was optimized by undertaking initial trials using a range of different fixation
protocols that were evaluated based on the overall quality of organelle preservation,
reduced shrinkage and best overall visual appearance. The most appropriate protocol for
each of the three algal species was then adopted for the main experimental
investigations.
2.3.1 Optimizing the fixation of Dunaliella salina
Samples of cultures of D. salina, strain (CCAP19/30) were subjected to three different
chemical fixation protocols to choose the best fixation protocol. The protocols were as
follows:
2.3.1.1 Protocol one: 2% glutaraldehyde 1% osmium in 0.1 M cacodylate buffer in
seawater (2% GaOs, SW)
D. salina cells were concentrated by centrifugation. Cells were transferred into 1.5 ml
micro-centrifuge tubes (6 tubes) and centrifuged for 15 minutes at room temperature at
8000 rpm in a Hettich Microliter bench top centrifuge. The excess media were discarded
and cells were embedded in agarose. These were fixed with 2% glutaraldehyde in a
0.1M cacodylate buffer (pH 7) prepared in sterile filtered seawater for 3 hours at room
temperature (ca 20 °C) in 5 ml snap-capped glass vials under a fume hood. The fixed
cells were rinsed three times (15 minutes each) with a fresh cacodylate buffer and then
post-fixed in 1% osmium tetroxide for 1 hour at room temperature, again under a fume
hood. The rinsing procedure with cacodylate buffer was repeated and then the
specimens were dehydrated in a graded series of acetone solutions (25%, 50%, 75% and
100%), allowing 30 minutes in each dilution. Then the samples were infiltrated in a
TAAB Premix epoxy resin kit (TAAB Laboratories Equipment Ltd, Aldermaston,
Berks), in a series of graded mixes (25%, 50%, 75%, 100% resin: acetone) and left in

29
100% resin overnight in a refrigerator. The infiltrated agarose embedded blocks were
then transferred to embedding capsules and polymerized overnight in a 60 oC oven.
Blocks were selected and trimmed into pyramids by hand with a razor blade. The
trimmed blocks were sectioned to a thickness of 80 nm using a Reichert Ultracut E
ultramicrotome (Leica Microsystems, Wetzlar, Germany) with a DiATOME (Diatome
AG, Biel, Switzerland) diamond knife. Ultrathin sections were picked up on 100-mesh
copper grids, stained with 2% aqueous uranyl acetate for 15 minutes, washed in three
separate distilled water rinses, dried with filter paper and post-stained in lead citrate for
10 minutes at 20 °C in a Leica AC20 staining machine (Leica Microsystems, Wetzlar,
Germany) prior to examination in a Philips CM100 TEM (Philips-FEI, Eindhoven,
Netherlands). Images were recorded using an AMT CCD camera (Advanced
Microscopy Techniques, Woburn, MA, USA). The optronics 1824 x 1824 pixel with
AMT40 version 5.42 image capture engine was supplied by Deben, UK.
2.3.1.2 Protocol two: 2% glutaraldehyde 1% osmium in 0.1 M cacodylate buffer in
buffered sterile F/2 medium (2% Ga/Os F/2)
This fixation protocol was the same as that described in Section 2.3.1.1 above, except
that the cells were buffered in an F/2 medium (Table 2.1) rather than seawater (2%
Ga/Os f/2).
2.3.1.3 Protocol three: 1% glutaraldehyde 1% osmium in 0.1 M cacodylate buffer
in buffered sterile F/2 medium (1% Ga/Os F/2)
This fixation was the same as that described in Section 2.3.1.1 above, except that the
primary fixation was 1% glutaraldehyde (1% GaOs F/2).
2.3.2 Optimizing fixation protocols for Nannochloropsis oculata
Samples of cultures of N. oculata (CCAP849/1) were fixed using the three different
protocols described above, together with the following additional two protocols, as
described by Karlson et al. (1996).
2.3.2.1 Protocol four: combined glutaraldehyde-osmium with sucrose (Ga-Os/Os
suc)
Cells of N. oculata were fixed using a combined osmium-glutaraldehyde fixation
protocol as developed by Karlson et al. (1996) for fixing Nannochloropsis. Cells were

30
concentrated by filtration using 0.22 m Millipore membrane filters, embedded with
agarose and mixed with a mixture of 5 ml osmium tetroxide (1% in 0.1 M cacodylate
buffer, pH 7), 2 ml sucrose (2 mol l-1 in filtered seawater), and 0.8 ml 25%
glutaraldehyde. They were post-fixed with 1% osmium tetroxide in a cacodylate buffer
for 1 hour. The samples were dehydrated as described above (section 2.3.1.1) and
embedded in a TAAB low viscosity resin kit (TLV, TAAB Laboratories Equipment
Ltd, Aldermaston, Berks).
2.3.2.2 Protocol five: combined glutaraldehyde-osmium (Ga-Os/Os)
Cells of N. oculata were fixed using a combined osmium-glutaraldehyde modified
fixation protocol from Karlson et al. (1996) as described above but without the addition
of sucrose to the fixative medium.

31
Procedure
Number Primary fixation Duration
Secondary
fixation Duration Temperature Dehydration Embedding Organism
Protocol one
(2% GaOs, SW)
2% glutaraldehyde in 0.1 M cacodylate
buffer (pH 7) prepared in sterile filtered
seawater
3 hours 1% osmium
tetroxide 1 hour Room temperature
25%, 50%, 75% and
100% Acetone
TAAB epoxy resin, impregnated with
25%, 50%, 75%, 100% resin in acetone
D. salina,
N. oculata
Protocol two
(2% Ga/Os F/2)
2% glutaraldehyde in 0.1 M cacodylate
buffer (pH 7) prepared in F/2 medium 3 hours
1% osmium
tetroxide 1 hour Room temperature
25%, 50%, 75% and
100% Acetone
TAAB epoxy resin, impregnated with
25%, 50%, 75%, 100% resin in acetone
D. salina,
N. oculata
Protocol three
(1% Ga/Os F/2)
1% glutaraldehyde in 0.5 M cacodylate
buffer (pH 7) prepared in F/2 medium 3 hours
1% osmium
tetroxide 1 hour Room temperature
25%, 50%, 75% and
100% Acetone
TAAB epoxy resin, impregnated with
25%, 50%, 75%, 100% resin in acetone
D. salina,
N. oculata
Protocol four
(2%Ga-Os/Os
suc)
osmium-glutaraldehyde:
Mixture of 5 ml osmium tetroxide (1% in
0.1 M cacodylate buffer, pH 7), 2 ml
sucrose (2 mol l-1 in filtered sea water), and
0.8 ml glutaraldehyde
3 hours 1% osmium
tetroxide 1 hour Room temperature
25%, 50%, 75% and
100% Acetone
TAAB epoxy resin, impregnated with
25%, 50%, 75%, 100% resin in acetone N. oculata
Protocol Five
(2%Ga-Os/Os)
osmium-glutaraldehyde:
Mixture of 5 ml osmium tetroxide (1% in
0.1 M cacodylate buffer, pH 7), and 0.8 ml
glutaraldehyde
3 hours 1% osmium
tetroxide 1 hour Room temperature
25%, 50%, 75% and
100% Acetone
TAAB epoxy resin, impregnated with
25%, 50%, 75%, 100% resin in acetone N. oculata
31
Table 2.4: Summary of preparative procedure used

32
2.3.3 Optimizing the fixation of Pseudostaurosira trainorii
Four samples were fixed representing different stages of the life cycle (Table 2.5). These
were: 24 hours induced male gamete; 24 hours induced female gamete; 3 hours mated
male and female gametes; and 48 hours mated male and female gametes. Three fixation
protocols were used to determine the optimum fixation conditions for P. trainorii cells
(Table 2.5).
2.3.3.1 Protocol six: 1.25% glutaraldehyde 1% osmium in 0.1 M cacodylate buffer
in seawater (1.25% GaOs, 50% SW)
P. trainorii cells were fixed with 1.25% glutaraldehyde in a 0.05 M cacodylate buffer in
50% sterile seawater (pH 7) at room temperature for 3 hours and post fixed with 1%
osmium tetroxide for 1 hour at room temperature. The samples were dehydrated and
stained as described in Protocol One of D. salina (section 2.3.1.1) and embedded with
TAAB low viscosity resin.
2.3.3.2 Protocol seven: 2.5% glutaraldehyde 1% osmium in 0.1 M cacodylate
buffer in seawater (2% GaOs, SW)
P. trainorii cells were fixed with 2.5% glutaraldehyde in a 0.1 M cacodylate buffer in
50% sterile filtered seawater (pH 7) at room temperature for 3 hours and post fixed with
1% osmium tetroxide in a 0.1 M cacodylate buffer for 1 hour at room temperature.
Subsequently, they were centrifuged, dehydrated and stained as described for D. salina
in section 2.3.1.1 and embedded with TAAB low viscosity resin.
2.3.3.3 Protocol eight: combined 2% glutaraldehyde-0.5% osmium-1% osmium in
0.1 M cacodylate buffer in buffered sterile SW with sucrose (2% Ga-Os/Os
50% SW)
Cells of P. trainorii were fixed using a combined osmium-glutaraldehyde fixation
protocol as described by Karlson et al. (1996). Seven ml of each sample were mixed
with a mixture of 5 ml osmium tetroxide (2%), 6 ml 0.2 M cacodylate buffer, 2 ml
sucrose (2 mol l-1 in filtered seawater), and 1 ml 25% glutaraldehyde for 30 minutes,
centrifuged at 1500 rpm and washed 3 times in a 0.1 M sodium cacodylate buffer in
50% sea water. They were post-fixed with 1% osmium tetroxide in a 50% cacodylate
buffer for 1 hour and washed 3 times in 0.1 M sodium cacodylate buffer in 50%

33
seawater. The samples were dehydrated and stained as described for D. salina in section
2.3.1.1 and embedded with TAAB low viscosity resin.
Table 2.5: Summary of preparative procedure used for Pseudostaurosira trainorii
Fixation protocol Sample Figure
Protocol six (1.25
% GaOs, 50% SW)
24 hours induced male gamete Figure 2.11A, B
24 hours induced female gamete Figure 2.11C, D
3 hours mated male and female gametes
(zygote) Figure 2.11E, F
48 hours mated male and female
gametes (zygote) Figure 2.11G
Protocol seven
(2% GaOs, SW)
24 hours induced male gamete Figure 2.10A-C
24 hours induced female gamete Figure 2.10D, E
3 hours mated male and female gametes
(zygote) Figure 2.10F
48 hours mated male and female
gametes (zygote) Figure 2.10G, H
Protocol eight
(2% Ga-Os/Os 50%
SW)
24 hours induced male gamete
Figure 2.9

34
2.4 Preparation for scanning electron microscopy
The samples of Dunaliella and Nanochloropsis were prepared using 2% glutaraldehyde
in a 0.1 M Sorenson’s phosphate buffer overnight. Circular coverslips (13 mm
diameter) were washed with liquid detergent to remove grease and rinsed lightly. The
cleaned coverslips were then coated in the adhesive agent poly-l-lysine (0.025%) and
left to dry for 30 minutes. One 40 mm Petri dish was used for each sample, filled with
Sorenson’s phosphate buffer. The poly-l-lysine-coated coverslips were placed under the
buffer and fixed suspensions pipetted onto the poly-l-lysine-covered coverslips and
allowed to settle for 10 minutes, to enable the cells to attach firmly to the slide surface.
Samples were dehydrated in stages of ethanol, starting with 25%, 50%, 70% for 10
minutes each, and then 100% twice for 15 minutes each. They were then placed in a
coverslip holder and placed in a Baltec critical point dryer using carbon dioxide.
Samples were viewed with a Cambridge S240 scanning electron microscope
(Cambridge Instrument Company, Cambridge, UK) which has an analogue-digital
converter. Images were captured using Orion version 6 software.
2.5 Evaluation of fixation protocols
The aim of fixation is to stabilize cellular organization so that the ultrastructure of a cell
is not changed by the following treatments of the sample preparation such as
dehydration, embedding and exposure to an electron beam (Glauert and Lewis 1998).
There is no one perfect fixation for all types of cells. Therefore, a given fixation
protocol was selected based upon the overall appearance of cell structure and the
absence of obvious artefacts such as shrinkage, excessive membrane or breakage. There
are some objective criteria for assessing fixation quality (Brand and Arnold 1986; Hayat
1989; McDonald and Morphew 1993; Glauert and Lewis 1998; Cribb et al. 2004). The
absence of any obvious preservation artefacts was the main criterion by which the
preservation protocols of the present writer were evaluated. Examples of such artefacts
include membrane breakage or proliferation, the distortion (obvious swelling or
shrinkage) and disorganization of organelles, and the presence of empty spaces in the
cytoplasm or shrinkage of plasma membrane away from the cell wall in the case of
plants (Glauert and Lewis 1998). Other criteria for assessing well-preserved cells
involve the evaluation of the preservation of individual cell organelles. For example,
organelle membranes should be intact and continuous. The nucleus of a well-preserved
cell should have an intact structure with well-preserved contents and nuclear envelope.

35
The nucleoplasm should be of uniform density and contain visible heterochromatin and
nucleolus. The cytoplasmic matrix must be finely granulated and contain no empty
spaces. The mitochondria profiles must show clear and intact outer double membrane
and cristae with a denser matrix than the cytoplasm. Finally, vacuoles must be bounded
by an unbroken single membrane.
2.5.1 Optimizing fixation protocols for Dunaliella salina
Selecting the fixation protocol for Dunaliella salina was based on the comparison of
protocols listed in the literature with the standard fixation protocol recommended by the
Electron Microscopy Unit at Newcastle University (Appendix 1). Maeda and Thompson
(1986), Einspahr et al. (1988) and Berube et al. (1999) fixed Dunaliella with 2%
glutraldehyde, which matches the standard procedure of the Electron Microscopy Unit
at Newcastle University. Oliveira and Huynh (1989) and Tian and Yu (2009) fixed
Dunaliella with 2.5% glutaraldehyde. Since Dunaliella salina lacks a cell wall this
would facilitate the diffusion of the fixative and the present writer decided to compare
two different glutaraldehyde concentrations (1% and 2%) to determine the effect of
different osmolarities on the fixation in sea water and F/2 medium used to prepare the
stock solution of the glutaraldehyde. This was compared with protocols described in the
literature in which only buffered solutions were used. Because fixative penetration into
fixed cells depends primarily on simple diffusion in aqueous solution, this would be
affected by the cell’s internal osmolality (Glauert and Lewis 1998). The second factor
that affects diffusion is the different constituents of the fixative, which have different
diffusion coefficients and thus diffuse at different rates (Glauert and Lewis 1998). It was
difficult to predict the result of fixation as the F/2 medium used had not been previously
reported in the literature. The third factor which affects the diffusion of fixative into
specimens is that the fixed parts of the cell may change the diffusion coefficients of the
different fixative constituents, and this may result in poor penetration of the fixative to
the deeper parts of the cell (Glauert and Lewis 1998).
The different fixation protocols here used all resulted in slightly different appearances
of the cells (Table 2.6). The general appearance of fixed cells and an overall evaluation
of the main organelle appearance and preservation are presented in Figures 2.2-2.4 and
Table 2.6. The results of fixation with protocol one (2% GaOs, SW) were the most
satisfactory, since no obvious fixation artefacts were detected. The whole cell and its
different subcellular components were intact and easily differentiated from one another

36
and met the criteria of well-fixed cell components as defined by Hayat (1989). The
description of each organelle and the assessment of its fixation quality are presented in
Table 2.6 and Figure 2.2. In contrast, protocol two (2% Ga/Os, F/2) resulted in many
fixation defects and artefacts, and therefore it was not considered to be satisfactory. The
fixation quality for each organelle using protocol two is presented in Table 2.6 and
Figures 2.3. The organelles that appeared adversely affected were mitochondria and
chloroplast membranes and their constituents. The mitochondrial membranes were not
clearly visible, the chloroplast thylakoid membranes were merged, and starch and
pyrenoid contents showed signs of extraction, which indicated poor penetration of the
fixatives. These observations indicated that the constituents of the F/2 medium reacted
differently with the fixative than with seawater. Nor did fixation with protocol three
(1% Ga/Os F/2) meet the criteria for well-preserved cells. The cytoplasmic matrix was
densely granulated and the protoplast showed signs of shrinkage, which, again, is an
indicator of poor penetration of the fixative into the cell, or an osmotic imbalance
between the cytoplasm and fixative solution. As a result cells lost their water and
shrank. Since protocol three had only 1% glutaraldehyde in comparison to protocol two
(2%), it is likely that the cells were in hypertonic solution, resulting in the observed
shrinkage.
It is clear that the higher glutaraldehyde fixative concentration (2% in protocols one and
two) resulted in better overall cytoplasmic preservation and less membrane breakage
than did the lower concentration (protocol three). Although most organelles appeared
quite similar in appearance, the chloroplast thylakoid membranes appeared less regular
and well-organised in the cells fixed in an F/2 medium, compared with seawater (cf
Figures 2.2 and 2.3). In general, protocol one (2% Ga/Os, SW) appeared to give the best
overall quality of fixation, with the half-strength fixative solution (1% Ga/Os) the
poorest. Consequently, the former was the protocol selected for all forthcoming
experiments on this organism.

37
Table 2.6: Assessment of fixation techniques applied to Dunaliella salina
Organelles Protocol one (2% GaOs, SW) Protocol two (2% Ga/Os, F/2) Protocol three (1% Ga/Os, F/2)
Features Figure Features Figure Features Figure
Cytoplasm Finely granulated showing no empty space 2.2A, B,
D
Densely granulated, showing empty
spaces 2.3A, D
Densely granulated showing no empty
spaces 2.4A-D
Mitochondria
Outer double membrane and cristae and intact
dense matrix in comparison with cytoplasm, not
shrunk or swollen
2.2C
Not the same in all cells: outer double
membrane was intact; cristae were lost
in some cells. However, some cells had
no intact mitochondrial shape. Matrix
was the same density as cytoplasm
2.3B- D
Shrinkage in some cell outer double
membranes and cristae were lost in
dense matrix in comparison with
cytoplasm
2.4A, D
Chloroplast
Outer double membrane intact Thylakoid
membranes, starch, and pyrenoids were intact and
showed no sign of extraction
2.2A, C,
D
Outer double membrane lost its
continuity, thylakoid membrane clear,
condensed and merged in different
parts. Starch and pyrenoid showed sign
of extraction
2.3C
Outer double membrane lost its
continuity, thylakoid membrane clear,
condensed and merged in different
parts. Starch and pyrenoid showed sign
of extraction
2.4A, B,
D
Nuclear
content Uniformly dense, visible chromatin and nucleolus 2.21A, B
Density varied, visible chromatin and
nucleolus 2.3A Uniformly dense 2.4A, B
Nuclear
envelope
Double membrane intact and essentially parallel
to each other and showed pores 2.2B Difficult to identify membrane 2.3A, D
Double membrane intact and essentially
parallel to each other but loss of
continuity
2.4A
Cell
membrane Intact 2.2B, D Loss of continuity
2.3A,
D Loss of continuity 2.4A, B
Vacuoles Bound by unbroken single membrane 2.2A, D Bound by unbroken single membrane 2.3A Loss of membrane continuity 2.4D
37

38
Figure 2.2: Dunaliella salina fixation protocol one
A) Longitudinal section. The cytoplasm matrix is finely granulated showing no empty
spaces and intact membranes. The chloroplast’s outer double membrane is unbroken
(black arrow). Thylakoid membranes, starch, and pyrenoids are intact and show no sign
of matrix extraction. Scale bar 2 m. B) High power magnification of nucleus showing
intact nucleus structure with uniform density and visible heterochromatin and nucleolus.
The intact nuclear envelope has well-preserved double membranes which are parallel to
each other and show the nuclear pores (red arrow). Scale bar 0.5 m. C) Higher
magnification of mitochondria. The mitochondria are undamaged (not shrunken or
swollen, with a well-preserved matrix). The outer double membrane of the
mitochondrion and cristae are all intact and clearly seen. The dense matrix of well-
preserved mitochondria appears denser than that of the background cytoplasm. The
chloroplast has intact double outer membrane (red arrow). Scale bar 0.5 m. D)
transverse section. Cell membrane is intact and visible (red arrows) Scale bar 0.5 m.
Chl: chloroplast; M: mitochondria; N: nucleus; Nu: nucleolus; Py: pyrenoid; S: starch;
V: vacuoles.

39
Figure 2.3: Dunaliella salina fixation protocol two
A) Longitudinal section shows the densely granulated cytoplasm matrix with empty
spaces (red stars). The thylakoid membranes can be either clearly resolved or intact
(black arrow) or condensed and merged in different parts (red arrow), and starch and
pyrenoid show sign of extraction (green arrow). The nuclear content has a variable
density and visible chromatin and nucleolus. Vacuoles are bound by unbroken single
membrane. Scale bar 0.5 m. B) High power magnification of cytoplasm with
mitochondrial and vacuoles shows the lost cristae (red arrows). Mitochondrial matrix
has the same density as background cytoplasm. Scale bar 0.5 m. C) Higher
magnification of mitochondrion showing intact double outer membrane and many
cristae (red arrow). Chloroplast’s double outer membrane is swollen in places (black
arrows). Scale bar 0.5 m. D) High power magnification of nucleus and surrounded
cytoplasm. Mitochondria are difficult to discern from background matrix. The nuclear
envelope is also hard to identify. Cell membrane has lost its continuity (blue arrow).
Scale bar 0.5 m. Chl: chloroplast; G: Golgi; L: lipid bodies; M: mitochondria; m?:
mitochondria difficult to discern; N: nucleus; Nu: nucleolus; Py: pyrenoid; S: starch; V:
vacuoles.

40
Figure 2.4: Dunaliella salina fixation protocol three
A) Longitudinal section where cytoplasm matrix is densely granulated showing no
empty spaces. Chloroplast outer double membrane lost its continuity (white arrow).
Starch and pyrenoid show signs of extraction (black arrows). Nuclear content is
uniformly dense with clear nucleolus and chromatin. Cell membrane shows some
breakage (green arrows). Scale bar 0.5 m. B) High power magnification of vacuoles
and cytoplasm. Chloroplast’s outer double membrane has lost its continuity (green
arrows), cell membrane has loss its continuity (black arrow). Scale bar 0.5 m. C)
Higher magnification of intact mitochondria with loss of some cristae membranes and
outer double membranes (red star). The mitochondrial matrix is dense in comparison
with cytoplasm. Scale bar 0.5 m. D) High power magnification of nucleus and
surrounding cytoplasm. Chloroplast outer double membrane has lost its continuity
(green arrows). Mitochondria is either shrunken (red star) or intact with loss of some
cristae membranes and outer double membranes. The double membranes of the nuclear
envelope are intact and parallel to each other but show some breakage (blue arrows).
Vacuoles show loss of membrane continuity (black arrows). Scale bar 0.5 m. Chl:
chloroplast; L: lipid bodies; M: mitochondria; m?: mitochondria difficult to discern; N:
nucleus; Nu: nucleolus; Py: pyrenoid; S: starch; V: vacuoles.
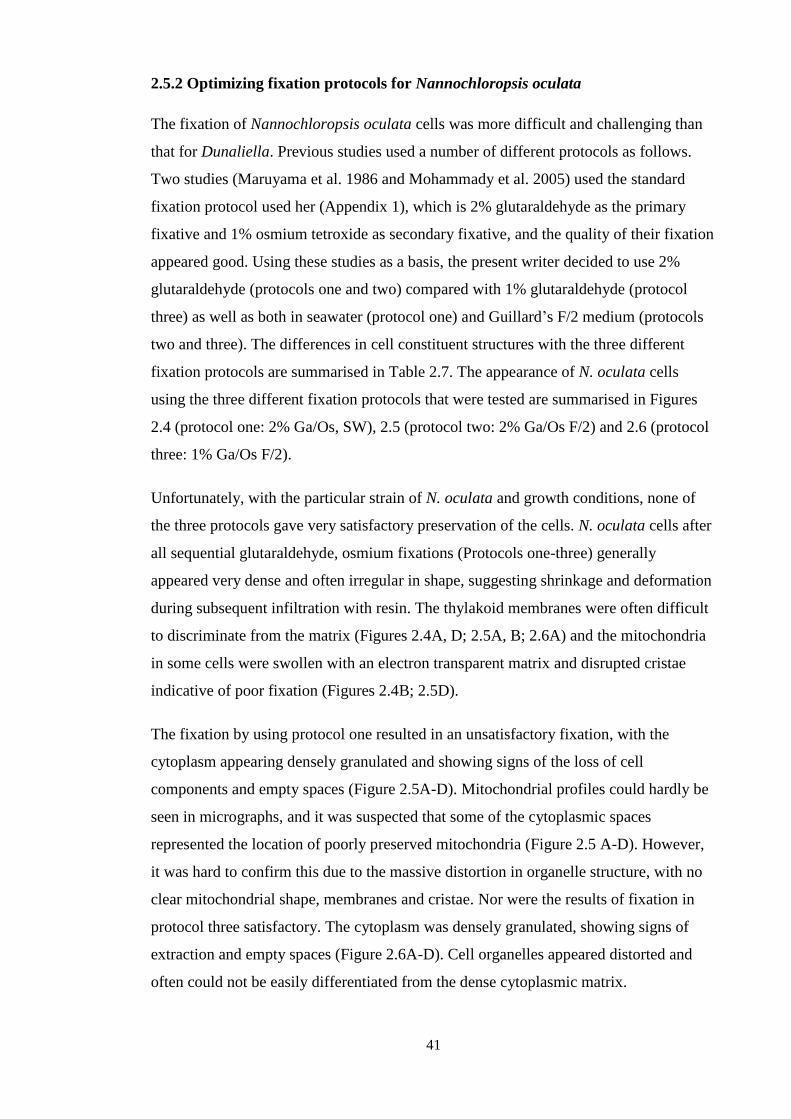
41
2.5.2 Optimizing fixation protocols for Nannochloropsis oculata
The fixation of Nannochloropsis oculata cells was more difficult and challenging than
that for Dunaliella. Previous studies used a number of different protocols as follows.
Two studies (Maruyama et al. 1986 and Mohammady et al. 2005) used the standard
fixation protocol used her (Appendix 1), which is 2% glutaraldehyde as the primary
fixative and 1% osmium tetroxide as secondary fixative, and the quality of their fixation
appeared good. Using these studies as a basis, the present writer decided to use 2%
glutaraldehyde (protocols one and two) compared with 1% glutaraldehyde (protocol
three) as well as both in seawater (protocol one) and Guillard’s F/2 medium (protocols
two and three). The differences in cell constituent structures with the three different
fixation protocols are summarised in Table 2.7. The appearance of N. oculata cells
using the three different fixation protocols that were tested are summarised in Figures
2.4 (protocol one: 2% Ga/Os, SW), 2.5 (protocol two: 2% Ga/Os F/2) and 2.6 (protocol
three: 1% Ga/Os F/2).
Unfortunately, with the particular strain of N. oculata and growth conditions, none of
the three protocols gave very satisfactory preservation of the cells. N. oculata cells after
all sequential glutaraldehyde, osmium fixations (Protocols one-three) generally
appeared very dense and often irregular in shape, suggesting shrinkage and deformation
during subsequent infiltration with resin. The thylakoid membranes were often difficult
to discriminate from the matrix (Figures 2.4A, D; 2.5A, B; 2.6A) and the mitochondria
in some cells were swollen with an electron transparent matrix and disrupted cristae
indicative of poor fixation (Figures 2.4B; 2.5D).
The fixation by using protocol one resulted in an unsatisfactory fixation, with the
cytoplasm appearing densely granulated and showing signs of the loss of cell
components and empty spaces (Figure 2.5A-D). Mitochondrial profiles could hardly be
seen in micrographs, and it was suspected that some of the cytoplasmic spaces
represented the location of poorly preserved mitochondria (Figure 2.5 A-D). However,
it was hard to confirm this due to the massive distortion in organelle structure, with no
clear mitochondrial shape, membranes and cristae. Nor were the results of fixation in
protocol three satisfactory. The cytoplasm was densely granulated, showing signs of
extraction and empty spaces (Figure 2.6A-D). Cell organelles appeared distorted and
often could not be easily differentiated from the dense cytoplasmic matrix.

42
Therefore, as a result of the poor fixation results obtained using the first fixation
protocols a new fixation protocol was tested based on that described by Karlson et al.
(1996), who used a combined glutaraldehyde-osmium tetroxide primary fixative
protocol. In addition to using a combined primary fixative, the inclusion of sucrose (2
mol l-1) was also examined, as used by Karlson et al. (1996), in the fixative mix
(protocol four), compared with seawater alone (protocol five). The cell structures of N.
oculata cells under protocols four and five are presented in Figures 2.8 (protocol four:
2% Ga-Os/Os suc SW) and 2.9 (protocol five: 2% Ga-Os/Os SW). This simultaneous
fixation resulted in a significant improvement in the fixation of the N. oculata (Figure
2.8 protocol four: 2% Ga-Os/Os suc SW, and Figure 2.8 protocol five: 2% Ga-Os/Os
SW) and, therefore, was the protocol that was adopted in all subsequent studies. The
differences in the major cell constituent structures with all the different fixation
protocols that were used for N. oculata are summarized in Table 2.7. In the combined
Ga-Os/Os fixations (protocols four and five; Figures 2.8, 2.9) the overall cell shape was
smooth and rounded and the mitochondrial matrix uniform with generally dispersed
tubular cristae (Figures 2.8A-C; 2.9B, D). The addition of sucrose to the fixative mix
seemed to reduce cell shrinkage and gave better overall preservation of mitochondria. In
general, cytoplasmic shrinkage was well controlled, although there was some slight
shrinkage in protocol five (2% Ga-Os/Os in SW; Figure 2.9D). In protocol four, in
which sucrose was also added to the filtered seawater (Table 2.7), the overall plastid
matrix appeared less dense and the bands of closely depressed thylakoids were well
preserved (Figure 2.8-D). In protocol five, the thylakoids often appeared less electron
dense overall (Figure 2.9A, D), although there was some variability in this. Protocols
four and five gave much better overall cell appearance (Figure 2.8, 2.9) and fixation
quality in comparison with the other protocols (protocols one-three, Figures 2.5-2.7,
Table 2.7). Although both protocols of the combined Os-Ga/Os fixation were
satisfactory it was her preferred to use protocol four to fix N. oculata in subsequent
fixations, since it was superior to protocol five in membrane preservation.
The reason for the combined fixative proving to be more effective for preserving N.
oculata could be due to the fact that glutaraldehyde reacts rapidly with proteins and
stabilizes the structures by cross-linking before there is any opportunity for extraction
by the buffer (Glauert and Lewis 1998). At the same time, osmium tetraoxide penetrates
the cell slowly and it reacts particularly with lipids that are not fixed by the aldehyde
(Glauert and Lewis 1998). It reacts with the olfinic double bond of unsaturated lipid

43
(Glauert and Lewis 1998). However, if osmium tetraoxide is used solely as a primary
fixative it usually leads to protein extraction due to the fact that it causes breakages in
the polypeptide chains (Glauert and Lewis 1998). Therefore, in the simultaneous
glutaraldehyde-osmium fixation, the former would fix the proteins, followed by the
rapid fixation of lipids by osmium tetraoxide.

44
Table 2.7: Assessment of fixation techniques applied to Nannochloropsis oculata
Organelles Protocol one (2% GaOs, SW) Protocol two (2% Ga/Os, F/2) Protocol three (1% Ga/Os F/2) Protocol four (Ga-Os/Os suc) Protocol five (Ga-Os/Os)
Feature Figure Feature Figure Feature Figure Feature Figure Feature Figure
Cytoplasm
Densely granulated,
showed sign of
extraction and empty
spaces
2.5A-D
Densely granulated,
showed sign of
extraction and empty
spaces
2.6A-D
Densely granulated,
showed sign of
extraction and
empty spaces
2.7A-D
Finely granulated,
showed no sign of
extraction or empty
spaces
2.8A-D
Finely granulated,
showed no sign of
extraction or empty
spaces
2.9A-D
Mitochondria No clear membrane,
swollen 2.5B, D
No clear
mitochondrial shape,
membranes and
cristae
2.6A-D Broken cristae 2.7A-D
Outer double
membrane and
cristae and intact
dense matrix in
comparison with
cytoplasm, not
shrunk nor swollen
2.8A-D
Outer double
membrane and cristae
were broken with
signs of extraction
2.9A-D
Chloroplast
Loss of continuity of
outer double
membrane, thylakoid
membrane condensed
and merged
2.5A, C
Loss of continuity of
outer double
membrane, thylakoid
membrane could be
clear, condensed and
merged in different
parts, signs of
extraction
2.6A-D
Outer double
membrane lost its
continuity.
Thylakoid
membrane could be
clear, condensed and
merged in different
parts, signs of
extraction
2.7A-D
Outer double
membrane intact.
Thylakoid
membranes were
intact and showed no
sign of extraction
2.8A-D
Loss of continuity of
outer double
membrane. Thylakoid
membranes were
intact and showed no
sign of extraction
2.9A-D
44
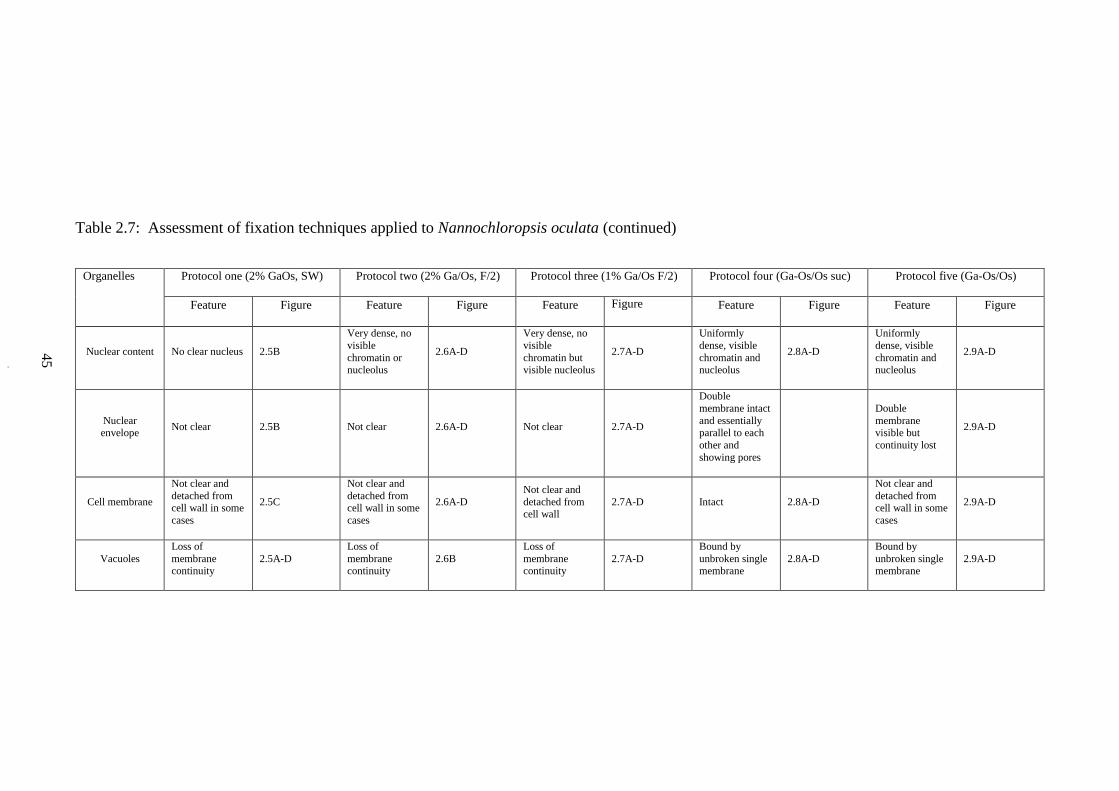
45
Table 2.7: Assessment of fixation techniques applied to Nannochloropsis oculata (continued)
Organelles Protocol one (2% GaOs, SW) Protocol two (2% Ga/Os, F/2) Protocol three (1% Ga/Os F/2) Protocol four (Ga-Os/Os suc) Protocol five (Ga-Os/Os)
Feature Figure Feature Figure Feature Figure Feature Figure Feature Figure
Nuclear content No clear nucleus 2.5B
Very dense, no
visible
chromatin or nucleolus
2.6A-D
Very dense, no
visible
chromatin but visible nucleolus
2.7A-D
Uniformly
dense, visible
chromatin and nucleolus
2.8A-D
Uniformly
dense, visible
chromatin and nucleolus
2.9A-D
Nuclear
envelope Not clear 2.5B Not clear 2.6A-D Not clear 2.7A-D
Double
membrane intact
and essentially
parallel to each
other and
showing pores
Double
membrane
visible but
continuity lost
2.9A-D
Cell membrane
Not clear and
detached from cell wall in some
cases
2.5C
Not clear and
detached from cell wall in some
cases
2.6A-D
Not clear and
detached from cell wall
2.7A-D Intact 2.8A-D
Not clear and
detached from cell wall in some
cases
2.9A-D
Vacuoles
Loss of
membrane continuity
2.5A-D
Loss of
membrane continuity
2.6B
Loss of
membrane continuity
2.7A-D
Bound by
unbroken single membrane
2.8A-D
Bound by
unbroken single membrane
2.9A-D
45

46
Figure 2.5: Nannochloropsis oculata cells fixed with fixation protocol one
A) Densely granulated cytoplasm, shows sign of extraction and empty spaces (red
stars). Chloroplast outer double membrane shows breakages (black arrow). Thylakoid
membranes are condensed and merged (white star). Vacuole membranes are not clear.
B) Mitochondrial profiles are swollen. Thylakoid membranes are condensed and
merged (white star). Poor nucleus fixation as no clear nucleus is observed and no clear
nuclear envelope. C) Densely granulated cytoplasm, shows sign of extraction and empty
spaces (red stars). Chloroplast outer double membrane shows breakages (black arrow).
Thylakoid membrane appears condensed and merged (white star). The cell membrane is
not clear and appears only when detached from cell wall (red arrow). Vacuoles
membranes show breakages. D) Mitochondrial profiles show no clear membranes (blue
arrow). Thylakoid membrane condensed and merged (white star). Scale bar 0.5 m.
Chl: chloroplast; M: mitochondria; V: vacuoles.

47
Figure 2.6: Nannochloropsis oculata cells fixed with fixation protocol two
A) Distorted chloroplast structure: outer double membrane hard to discriminate from
thylakoids; thylakoid membranes are clear or condensed and merged in different parts;
very dense nuclear contents. Signs of matrix loss on unclear mitochondrial profile (red
star). B) Chloroplast outer double membrane lost its continuity and is condensed and
merged in different parts. Nucleus profiles with no clear nuclear envelope. Vacuoles
have lost their membranes. Mitchondrial profile with distorted cristae and matrix loss
(red star). C) Clear thylakoid membranes, with some evidence of matrix loss (red stars).
Cell membrane not well-resolved and no clear nuclear profile in cells. D) Thylakoid
membranes are clear or condensed in places. Cell membrane detached from cell wall.
Scale bar 0.5 m. Chl: chloroplast; CW: cell wall; m?: mitochondria difficult to discern;
N?: nucleus difficult to discern; V: vacuoles.

48
Figure 2.7: Nannochloropsis oculata cells fixed with fixation protocol three
A) Clearly separated cell wall with closely depressed thylakoid membranes. B-D) No
clear mitochondria. The nuclear envelope is not easily resolved and there is no visible
heterochromatin, but a visible nucleolus. Chloroplast and thylakoid membranes are
mostly condensed and merged, although some are clear and intact. Scale bar 0.5 m.
Chl: chloroplast; CW: cell wall; m?: mitochondria difficult to discern; N?: nucleus
difficult to discern; V: vacuoles.

49
Figure 2.8: Nannochloropsis oculata cells fixed with fixation protocol four
A-D) Finely granulated cytoplasm with no signs of matrix loss or empty spaces. Well-
preserved mitochondrial profiles; neither shrunk nor swollen. Intact outer double
membrane of chloroplast. Thylakoid membranes are intact and show no sign of
swelling. Nucleus is well preserved with uniformly dense nuclear content and clearly
visible heterochromatin and nucleolus. Double membrane of nuclear envelope is intact
and not swollen. Cell membrane is intact and vacuoles are bound by unbroken single
membranes. Scale bar 0.5 m. Chl: chloroplast; G: Golgi; M: mitochondria; N: nucleus;
V: vacuoles.

50
Figure 2.9: Nannochloropsis oculata cells fixed with fixation protocol five
A-D) Cytoplasm is finely granulated with no signs of matrix loss or empty spaces.
Mitochondrial profiles have broken outer double membrane and there is poorly defined
cristae and matrix loss. Chloroplast has an outer double membrane which is broken in
places. Thylakoid membranes are intact and show signs of swelling. Nuclear content is
uniformly dense with visible heterochromatin and nucleolus and the nuclear envelope
membranes are hard to discern. Cell membrane is not clear and in some cases detached
from the cell wall. Vacuoles are bounded by unbroken single membranes. Scale bar 0.5
m. Chl: chloroplast; CW: cell wall; M: mitochondria; N: nucleus; V: vacuoles.

51
2.5.3 Optimizing fixation protocols for Pseudostaurosira trainorii
The fixation of Pseudostaurosira trainorii for transmission electron microscopy was
undertaken for the first time. It is recommended by Hayat (1989) to fix diatoms through
the use of a range from 1%-3% which suits different diatom species and to post-fix with
either 1% or 2% osmium tetraoxide. A concentration of 1.25% glutaraldehyce was
chosen here followed by 1% osmium in 50% sea water for protocol six and a
concentration of 2% glutaraldehyde followed by 1% osmium tetraoxide in seawater for
protocol seven. The combined glutaraldehyde-osmium fixation (protocol eight) that was
used successfully with N. oculata (section 2.5.2) was also employed as a better fixation
protocol for P. trainorii, as the combined glutaraldehyde-osmium primary fixation has
the advantage of fixing protein and lipids efficiently. Table 2.8 summarizes the
ultrastructural features of different organelles fixed with protocols six, seven, and eight.
The results of fixation with protocols seven and eight were not satisfactory as the cells
showed considerable shrinkage and malformation in structures (Table 2.8, Figures 2.10-
2.12).
The fixation by protocols six and seven resulted in poor quality. Protocol six was the
worst protocol, with complete loss and shrinkage of the cytoplasm (Figure 2.10). This
indicates that the cells were in hyposmotic solution because of the low concentration of
glutaraldehyde 1.25% and 50% of seawater. Cell components were not-distinguishable
from one another, with no clear differentiation between mitochondria, nucleus and
chloroplast. Protocol seven was better than protocol six, yet it was not perfect.
Cytoplasm shrinkage occurred and organelle details were unclear. For example, the
mitochondrial cristae were not visible (Figure 2.11). Cell organelles could not be easily
discriminated from one another and the dense cytoplasmic matrix.
The combined primary fixative (protocol eight) was the best fixative protocol for the
diatom cells (Figure 2.12). As in the case of Nannochloropsis, the nucleus was clear and
the mitochondrial matrix uniform, with generally dispersed tubular cristae (Figure
2.12A, C). Cell shrinkage was absent. The plastids were less condensed and the
thylakoids were visible (Figure 2.12A-C). Therefore, protocol eight was used to fix P.
trainorii. Detailed descriptions of the fixation protocols are presented in Table 2.8 and
Figures 2.10-2.12.

Organelles
Protocol six (1.25% Ga/Os, 50% SW) Protocol seven (2% Ga/Os, SW) Protocol eight (2%Ga-Os/Os 50% SW)
Feature Figure Feature Figure Feature Figure
Cytoplasm Densely granulated, showing signs
of extraction and shrinking 2.10
Densely granulated, showing
shrinkage 2.11
Densely granulated, showing no
empty space in vegetative cells 2.12
Mitochondria Unclear 2.10 Unclear 2.11
Outer double membrane and
cristae and intact dense matrix in
comparison with cytoplasm, not
shrunken or swollen
2.12
Chloroplast Distorted 2.10 Intact but condensed 2.11 Intact. Thylakoid membranes and
pyrenoids were intact and showed
no sign of extraction
2.12
Nuclear content Unclear 2.10 Unclear 2.11 Intact 2.12
Nuclear envelope Unclear 2.10 Unclear 2.11 Intact 2.12
Cell membrane Loss of continuity 2.10 Loss of continuity 2.11 Intact 2.12
Vacuoles Loss of membrane continuity 2.10 Bound by unbroken single
membrane 2.11 Bound by unbroken single
membrane 2.12
Cell wall Extracted 2.10 Extracted 2.11 Intact 2.12
52
Table 2.8: Assessment of fixation techniques applied to Pseudostaurosira trainorii

53
Figure 2.10: Pseudostaurosira trainorii life cycle stages fixed using protocol six
A-B) 24 hours induced male gamete. C) 24 hours induced female gamete. D-F) 3 hours
mated male and female gametes. G) 48 hours mated male and female gametes. The
common features of poor preservation are: densely granulated cytoplasm with signs of
matrix loss and shrinkage (red arrows); no visible mitochondrial profiles; chloroplast
either distorted or dense; nuclear content and the nuclear envelope membranes not
clearly visible; cell membrane not clear and if present has lost its integrity; vacuoles
have lost their membranes; cell wall extracted. Chl: chloroplast; L: lipid bodies; N:
nucleus; Py: pyrenoid; V: vacuoles.

54
Figure 2.11: Pseudostaurosira trainorii life cycle stages fixed using protocol seven
A-C) 24 hours induced male gamete. Scale bar 2 m. D-E) 24 hours induced female
gamete. Scale bar 2 m. F) 3 hours mated male and female gametes Scale bar 2 m. G-
H) 48 hours mated male and female gametes. Scale bar 2 m. The common features of
the fixation are: the cytoplasm is densely granulated with signs of extraction and
shrinkage (red arrows); mtochondrial profiles are dense with no clear cristae (m), and if
clear there are sign of extraction (m?). Chloroplasts are intact but highly compact and
condensed. Thylakoid membranes are not clearly differentiated. Nuclear content and the
nuclear envelope membranes are not clearly visible. Cell membrane unclear and if
present it has lost its continuity. Vacuoles are bounded by unbroken single membrane.
Cell wall was extracted. Chl: chloroplast; G: Golgi; L: lipid bodies; M: mitochondria;
N: nucleus; Py: pyrenoid; V: vacuoles.

55
Figure 2.12: Pseudostaurosira trainorii 24 hours induced male gamete fixed using
protocol eight
A) Male vegetative cell gird view. Scale bar 2 m. B) Male vegetative cell valve view.
Scale bar 2 m. C) Male gametes. Scale bar 2 m. The common features of cell
organelle fixation are that the cytoplasm is densely granulated with no signs of
extraction or empty spaces. Mitochondrial profiles show good fixation since the outer
double membrane and cristae are intact; matrix dense in comparison with cytoplasm;
mitochondrial profiles not shrunken or swollen. The chloroplast is intact and thylakoid
membranes and pyrenoids are intact and show no signs of extraction. Nuclear content,
nuclear envelope and plasma membrane are intact. Vacuoles are bounded by unbroken
single membrane. Cell wall is intact. Chl: chloroplast; G: Golgi; L: lipid bodies; M:
mitochondria; N: nucleus; N?: second nucleus; Py: pyrenoid; V: vacuoles.

56
2.6 Conclusion
In conclusion, although there were no standard fixation protocols that suited all algal
species and cell types, an optimal fixation protocol was selected that gave the best
overall appearance of cell organelles. In addition, the selected protocol minimized
fixation artefacts, particularly, in sensitive marker organelles such as mitochondria.
These should not be swollen but have intact membranes and a well preserved matrix.
Glutaraldehyde has been a widely used primary fixative, followed by post fixation with
osmium tetroxide as a secondary fixative, and this combination generally worked well
here with D. salina. However, combined fixation using both glutaraldehyde and
osmium as a primary fixative followed by further secondary fixation with osmium
tetraoxide gave better preservation of cells in both N. oculata and P. trainorii. This is
because the fixatives react differently with each cell constituent and other factors such
as the diffusion coefficients of the fixatives, osmolality, and time.

57
Chapter 3. Effects of an algal infochemical (Decadienal) on the
ultrastructure of Dunaliella salina and Nannochloropsis oculata
3.1 Introduction
3.1.1 Importance of biofuels
Energy consumption in the form of fossil fuels is increasing globally (Singh and Gu
2010). Petroleum is currently the main energy source for the transport and logistics
industries and will become depleted in the future, leading to unstable prices (Sorrell et
al. 2009). Furthermore, the increasing consumption of fossil fuels causes an increase in
greenhouse gas emissions, which results in global warming and climate change (Chisti
2007). Therefore, finding alternative sources of low-carbon, renewable and sustainable
energy is of great importance. One such solution is biofuels (fuels produced from a
source of organic biomass).
Biofuel production on a large scale will reduce greenhouse gas emissions because it
relies directly on photosynthesis, a process that converts CO2 into organic compounds,
and thus is attracting great interest (Gavrilescu and Chisti 2005). There are different
types of biofuels produced from different crops (such as edible as well as non-edible oil
seeds) as well as from several aquatic algae, all of which have been recognized as bio-
oil sources (Singh and Gu 2010). In addition, firewood, biogas, bio-hydrogen,
bioethanol and biodiesel are examples of biofuels. There are commercial or pilot
experimental procedures to use some of these (Gavrilescu and Chisti 2005). However,
bioethanol produced from corn starch, sugar cane or sugar beet and biodiesel produced
from oil crops such as palm and oil seed rape are the most widely produced biofuels
(Chisti 2008; Scott et al. 2010). However, their production is unsustainable (Hill et al.
2006; Stephenson et al. 2008).
There are two important problems with the use of bioethanol and biodiesel from oil
crops. One problem is that cultivating such crops to meet energy demand will compete
with food security, as it will occupy huge areas of arable land. For example, to produce
the amount of fuel needed in the UK for transport in 2008 would require more than half
the land area of the UK to grow biodiesel crops (Scott et al. 2010). Another problem is
that the production of biodiesel requires high amounts of energy. Both factors have

58
negative effects on ecosystem stability and food security (Chisti 2008; Christenson and
Sims 2011).
The successful use of microalgae in other industries marks them as potentially better
candidates for biofuel production. They can be sources of high-value products such as
polyunsaturated fatty acids, natural colourants, biopolymers, and therapeutics (Belarbi
et al. 2000; Lorenz and Cysewski 2000; Metzger and Largeau 2005; Singh et al. 2005;
Walter et al. 2005; Spolaore et al. 2006). Microalgae are used to solve various
environmental problems as they can be used in wastewater treatment plants and as bio-
remediating microorganisms (Mallick 2002; Kalin et al. 2005; Munoz and Guieysse
2006) and as biofertilizers because of their nitrogen fixing capabilities (Vaishampayan
et al. 2001). In addition, microalgae can be used as feedstock for other forms of biofuel
such as methane produced by anaerobic digestion of the algal biomass (Spolaore et al.
2006). Another way to utilize algae is to photobiologically produce biohydrogen
(Ghirardi et al. 2000; Fedorov et al. 2005). Finally, microalgal lipids could be used to
produce energy, either by simple direct combustion in boilers or in diesel engines
(Converti et al. 2009). However, Chisti (2007) has recently shown that, theoretically,
the best option to produce energy from algae is by transforming their lipids to produce
more highly refined biofuels (Sawayama et al. 1995; Dunahay et al. 1996; Gavrilescu
and Chisti 2005).
There are two main routes for the production of biofuels. In the first method, the algal
biomass is fermented by other microbes. In the second, the algal lipid is transformed
into biofuel through different chemical or thermochemical reactions, such as
transesterification, direct hydrogenation of oils, pyrolysis of whole biomass, or
gasification (Hill et al. 2006; Stephenson et al. 2008). In the transesterification reaction
the reactants are triacylglycerides (TAGs), which are lipids produced by microalgae to
store their energy, and methanol (Fukuda et al. 2001). Triacylglycerides are also called
neutral lipids and are composed of three long-chain fatty acids (FAs) attached to a
glycerol molecule (Figure 3.1). The methanol in the transesterification reaction
substitutes glycerol. The results are methyl esters (biodiesel). This method is well-
known and has been used to produce methyl esters for pharmaceutical use (Belarbi et al.
2000; Barnwal and Sharma 2005; Gerpen 2005).

59
3.1.2 Advantages of algal biofuel
The possibility of using microalgal biodiesel as an alternative to petroleum-derived
transport fuels has increased in recent years as research shows it has many advantages
that make it a preferable option. Some of the reported advantages include the ability to
grow microalgae in shallow lagoons, raceway ponds, closed ponds or photobioreactors,
which makes them available all year round. Microalgae have rapid growth since they
are able to double their biomass (during the exponential growth phase) in a short time.
The species of microalgae that are suitable for use as biofuel feedstock are abundant
with variable lipid content in the range of 20–50% dry weight of biomass (Chisti 2007;
Singh and Gu 2010). In addition, some microalgae can, under certain circumstances,
have an oil content of 80% by weight of dry biomass (Metting 1996; Spolaore et al.
2006). This increases the potential to produce the required quantities of biodiesel
demanded world-wide. In contrast, seed crops are limited by their cultivation season. In
addition, seed crops need huge land areas and produce low biodiesel quantities when
compared with microalgae. According to Chisti (2007), replacing 50% percent of
United States transport consumption by biodiesel produced from oil palm cultivation
will require 24% of United States agricultural land. In contrast, using microalgae as
feedstock would need only 1-3% of total agricultural land (Chisti 2007). Together with
the ability to cultivate microalgae on marginal lands, this makes algae the best option to
replace fossil fuels without competing with food or other crops (Chisti 2007; Singh and
Gu 2010). Furthermore, due to the high lipid content of microalgae cells (ranging from
20% to 50% of dry weight depending on species) their oil yields are much higher than
those of oil crops. Singh and Gu (2010) showed that if microalgae oil content is 70% oil
by weight this can yield 136,900 l ha-1 biodiesel, and if it drops to 30% the biodiesel
yield will be 58,000 l ha-1. However, the yield from rapeseed is only 1190 l ha-1 (Schenk
et al. 2008) and for jatropha it is 1892 l ha-1 (Chisti 2007). Therefore, microalgae could
be an oil source which might meet the global demand for transport fuels.
Microalgae can help the environment in different ways if used as biofuel. Firstly, algae
need CO2 to grow, and Chisti (2008) estimated that producing 100 tons of algal biomass
fixes roughly 183 tons of CO2. This CO2 can be provided from electricity power plants
that burn fossil fuels (Sawayama et al. 1995; Yun et al. 1997), thus reducing emissions
of a major greenhouse gas. Secondly, microalgae not only grow in the sea but also in
brackish or saline waters and contaminated water. Therefore, they will help in the
remediation of contaminated water since they utilize nutrients therefrom (Hu et al.
60
2008). For example, they can use nitrogen and phosphorus from agricultural run-off,
concentrated animal feed operations, and industrial and municipal wastewaters (Hu et
al. 2008). Thirdly, in contrast to oil crops, algae do not require herbicide or pesticide
application (Rodolfi et al. 2009). Fourthly, livestock waste resulting from agriculture
can be used to grow algae (Cantrell et al. 2008). Finally, the residual biomass resulting
from lipid extraction can be used as feed or fertilizer (Spolaore et al. 2006).
The sustainable production of biodiesel from microalgae can be carbon-neutral and save
energy. The algal biomass that remains after lipid extraction can be used in several
ways, either as a further source of energy in the biodiesel production process or to
produce products that can be sold for profit. For instance, the biomass can be fermented
to bioethanol or biomethane (Chisti 2008), thereby providing another source of energy,
or the residual biomass can be sold as high-protein animal feed or high-value microbial
products (Molina et al. 1999; Gavrilescu and Chisti 2005; Chisti 2006).
3.1.3 Algal biofuel production schemes
A practical algal biofuel production scheme consists of several steps. Many factors
affect the sustainability of the production scheme. In all cases, there is a necessity for
biomass feedstock which is cheap to produce, sustainable, available in large amounts
and preferably non-food based (Tang et al. 2011). It is started by growing the algae,
which requires a supply of nutrients, under controlled growth conditions. Many factors
have to be taken into consideration when choosing a viable production scheme. These
are: i) the choice of the best bioreactor; ii) the prevention of contamination with
invading organisms; and iii) controlling growth conditions to ensure that the algae will
produce the highest amount of lipids (Scott et al. 2010). The second stage is harvesting
and processing the algal biomass. It is important that the energy required for the
production of biodiesel must be less than that obtained in the final product (Scott et al.
2010). The energy production and energy required for the production of biofuels is
analysed by life-cycle analysis (LCA). One factor which adds considerable expense to
the process is the need to separate algae from the water before lipid extraction. There
are currently no efficient technologies available for this other than those which are very
costly indeed (Brennan and Owende 2010). Lipids can be released from the cell by
chemical extraction, but this must be done using both cost-effective and
environmentally friendly techniques. Two solutions have been suggested to solve the
issue of the prohibitive costs of biofuel production from microalgae (Scott et al. 2010).

61
One solution is to increase both the rate of growth and the concentration of cells in the
culture. This will assist in the offset of the embodied energy within materials utilised in
the ponds or photobioreactors. Additionally, this will bring down the expense involved
in downstream processing. The second solution involves subjecting algae to nutrient
starvation, which will induce them to maximise their lipid production. In this way the
amount of nutrients needed to feed the algae will be decreased. Furthermore, the amount
of residual biomass will be reduced. In turn, this will reduce the total energy needed for
production (Scott et al. 2010).
The selection of suitable algal strains is also of crucial importance. Typically, the algal
strain must be fastgrowing and at the same time produce large quantities of lipid in the
cells (Scott et al. 2010). Algal genera that have been used for biofuel production include
Chlorella, Dunaliella, Haematococcus and Botryococcus (Wolf et al. 1985). The latter
have a high hydrocarbon content (Knights et al. 1970). Dunaliella spp. have been
widely studied, cultivated and commercialized as a source of natural β-carotene (Ben-
Amotz and Avron 1983).
3.1.4 Lipids in microalgae
Two categories of lipids are produced by microalgae according to their functions inside
the cell: structural lipids (polar lipids) and storage lipids (non-polar lipids).
Polyunsaturated fatty acids (PUFAs) are normally discovered in high amounts within
structural lipids. They are also vital nutrients for aquatic animals and humans. Polar
lipids (phospholipids) and sterols are important components of cell membrane structure.
They can perform the role of a selective yet permeable barrier for both cells and
organelles. Other roles polar lipids play in the cell are to enable the membrane to be
functional, act as a medium for the provision of metabolic processes, take part in the
membrane fusion process, and have a role in cell signalling pathways, so they can play a
role in the adaptation of algae to environmental stresses (Hu et al. 2008; Sharma et al.
2012).
Lipids found in microalgae as storage reserves include neutral lipids, polar lipids, wax
esters, sterols, hydrocarbons and prenyl derivatives (Hu et al. 2008; Sharma et al. 2012).
Storage lipids are mainly in the form of triacylglycerides (TAGs) made of
predominately saturated fatty acids and some unsaturated fatty acids which can be
transesterified to produce biodiesel. Lipid production is increased under a range of
stress conditions (Chisti 2006, 2007; Greenwell et al. 2010). TAGs are stored in

62
cytosolic lipid droplets. Research efforts over the last couple of decades have changed
the perception of lipid droplets from static, energy-dense particles to dynamic organelles
found across all Kingdoms (Beller et al. 2010). All lipid droplets share common
features: a hydrophobic core typically comprising of TAGs or sterols surrounded by a
monolayer of polar glycerolipids into which lipid droplet-associated proteins are
embedded (Vieler et al. 2012). Despite these similarities, lipid droplets are versatile
organelles that vary in size, shape, and function, depending on cell type (Sheehan et al.
1998; Vieler et al. 2012).
3.1.5 Maximising the lipid content in algae
Algal productivity is defined as the overall increase in algal biomass, whereas oil
productivity is defined by Chisti (2007) as “the mass of oil produced per unit volume of
the microalgal broth per day”, and is the key factor that affects the success of an alga in
biofuel production. It is controlled by the algal genome (Sharma et al. 2012) and
depends on the algal growth rate and the oil content of the cells (Scott et al. 2010).
Different factors that affect oil productivity in an algae can be grouped as physical,
chemical and environmental. Examples include nutrients (particularly nitrogen and
phosphorous), light irradiation, pH, temperature and heavy metals. All of these factors
affect algal cells either on their own or synergistically and in each case have different
effects (Hu et al. 2008). The effect of environmental factors on Nannochloropsis lipid
production has been tested in various studies (Boussiba et al. 1987; Sukenik et al. 1989,
1993a, b; Zittelli et al. 1999). Culture age, light intensity, salinity levels and temperature
limit Nannochloropsis growth, while at the same time they cause increases in saturated
and monosaturated fatty acids (Renaud et al. 1991; Sukenik et al. 1993b; Renaud and
Parry 1994). On the other hand irradiance levels affect the balance between structural
membranes and storage lipids (Pal et al. 2011). Microalgae have the ability to adapt to
different environmental conditions because they can change their metabolic pathways to
synthesise different types of lipids (Thompson 1996; Guschina and Harwood 2006).
When microalgal cells are stressed they will typically start to synthesise neutral lipids
(storage lipids) which can constitute anything from 25-50% of their dry weight (Wang
et al. 2009) or, in some extreme cases, as high as 80% of their lipid content (Klyachko-
Gurvich 1974; Suen et al. 1987; Tonon et al. 2002). The green alga Chlorella vulgaris
changed its metabolism during nitrogen starvation to synthesise lipids containing TAGs,
while it is used to synthesis fatty acid rich lipids under normal conditions in a study by
Widjaja et al. (2009).

63
The most common factor affecting lipid production in microalgae is nutrient starvation,
which is defined as depletion of nutrients such as nitrogen or phosphorus (Hu et al.
2008; Sharma et al. 2012). Algal growth rate is reduced when subjected to nutrient
reduction. However, algal cells can continue synthesising fatty acids if enough light and
CO2 are available for photosynthesis (Thompson 1996). Since growth and nutrients are
directly related, the reduction in nutrients will generally cause a reduction in growth;
therefore, requiring no new membrane synthesis. This leads to a shift in fatty acid
metabolism to accumulate and store them as TAGs (Hu et al. 2008; Sharma et al. 2012).
It is thought that this conversion in lipid metabolism during stress conditions is a
protective mechanism, because photosynthesis does not cease in the presence of CO2
and light irradiation, which results in the formation of ATP and NADPH (Hu et al.
2008; Sharma et al. 2012). In the presence of nutrients, the cellular energy stored as
ATP and NADPH resulting from photosynthesis is used to construct new cells
(biomass), but under nutrient starvation growth is limited and no new cells are formed.
Therefore, ATP and NADPH start to accumulate and the cells will be depleted in ADP
and NADP+, which are needed for photosynthesis to continue (Hu et al. 2008; Sharma et
al. 2012). This may cause injuries to the cell (Hu et al. 2008; Sharma et al. 2012). As a
result, consuming the energy stored in ATP and NADPH by synthesising TAGs will
make ADP and NADP+ available for photosynthesis.
The effect of limitations in different nutrients has been extensively investigated (Hu et
al. 2008; Sharma et al. 2012). The most studied nutrient is nitrogen. The increase in
amount of lipid in algal cells during nitrogen starvation has been shown by several
studies (Guschina and Harwood 2006; Griffiths and Harrison 2009; Hsieh and Wu
2009; Rodolfi et al. 2009; Wang et al. 2009; Praveenkumar et al. 2012). Algal genera
have different lipid productivity responses following nutrient depletion. For instance,
the diatom Phaeodactylum tricornutum showed a 6% increase in lipid content (Alonso
et al. 2000), whereas C. vulgaris increased its lipid content by 40% (Illman et al. 2000).
The actual composition of algal lipids may also vary in different species in response to
nutrient starvation.
Converti et al. (2009) studied the effects of nitrogen reduction on the growth of
Nannochloropsis oculata and C. vulgaris. When the nitrogen concentration was reduced
by 50% compared with the standard medium concentration, the growth rate of N.
oculata decreased but its lipid content doubled. In contrast, the growth rate of C.
vulgaris was not affected and its lipid content increased threefold. Rodolfi et al. (2009)

64
carried out a large-scale study on the induction of lipid production in Nannochloropsis
and other algal species using nitrogen and phosphorous depletion. Their results
confirmed that nitrogen starvation increased lipid content and overall lipid productivity
in an outdoor algal culture (Rodolfi et al. 2009). They showed that Nannochloropsis
species could produce 20 tons of lipid per hectare in the Mediterranean climate and
more than 30 tons of lipids per hectare in sunny tropical areas. The main limitation in
using nitrogen depletion as a means to increase lipid production is the time required.
This varied from two to five days, during which biomass increase was low and lipid
productivity limited (Widjaja et al. 2009).
Other studies have investigated the effects of phosphorus, silicon and potassium
deficiencies on lipid production in different algae. The effects of phosphorus deficiency
showed contradictory results in different species. Whilst it increased lipid content (<
53%) in Scenedesmus sp. (Xin et al. 2010) and in P. tricornutum, Chaetoceros sp.,
Isochrysis galbana and Pavlova lutheri (Reitan et al. 1994), it resulted in a reduction of
lipid content in Nannochloris atomus and Tetraselmis (Reitan et al. 1994). In addition,
phosphorous deficiency affects fatty acid composition in a number of different ways. It
has been shown to increase the production of unsaturated and monosaturated fatty acids
and decrease the production of polyunsaturated fatty acids (Reitan et al. 1994).
Meanwhile it increased unsaturated fatty acids in Chlorella kessleri (El-Sheek and Rady
1995). Silicon deficiency induced lipid (mainly TAGs) production in the diatom
Cyclotella cryptica, as illustrated by Miao and Wu (2006) and in Chlorella (Griffiths
and Harrison 2009). Finally, both potassium and iron deficiency induced lipid
production in C. vulgaris (Liu et al. 2008).
The major effect of temperature changes on microalgae is in altering fatty acid
composition (Sharma et al. 2012). This is thought to be a protective mechanism, as the
trend is to increase the proportion of unsaturated fatty acids as temperature decreases in
order to maintain membrane fluidity (Sharma et al. 2012). Conversely, increasing
temperature will increase the proportion of saturated fatty acids (Sharma et al. 2012). In
Dunaliella salina, whose lipid-globules contain elevated levels of triacylglycerols
(Rabbani et al. 1998), unsaturated lipids increased by 20% when growth temperature
was decreased from 30 °C to 12 °C (Thompson 1996). Temperature elevation increased
the growth rate of Ochromonas danica and the total lipid content was increased
(Aaronson 1973). Elevated temperatures increased both the growth rate and total lipid
production in Nannochloropsis salina (Boussiba et al. 1987). In contrast, the growth

65
rate of Nannochloropsis oculata was decreased in both elevated and reduced
temperatures compared with the optimum (Converti et al. 2009). Therefore, the effects
of temperature changes are not only genus-specific but also strain-specific. Increasing
temperature cannot be considered as a practical way to improve lipid content in biofuel
production, as it would be energetically expensive to maintain high temperatures in
large-scale cultivation bioreactors (Sharma et al. 2012).
3.1.6 Infochemicals
Infochemicals are defined as secondary metabolites that serve as means of
communication between different organisms (including microalgae) in aquatic
environments (Dicke and Sabelis 1988). They convey information from the producer to
the receiver organism to induce certain behavioural or physiological responses. This
chemical communication is important for organisms that live in aquatic environments,
to enable them to adapt to continual fluctuations in environmental factors such as levels
of nutrients, light and temperature. Such communication is supported by the physical
properties of water (Falciatore et al. 2000; Pohnert et al. 2007). These infochemical
compounds belong to several different chemical groups, including dissolved gases
(Steinke et al. 2002), hydrocarbons (Yasumoto et al. 2005), peptides (Rittschof and
Cohen 2004) and proteins (Hallmann et al. 1998). Infochemicals are important factors
that play major roles in managing the ecology of aquatic environments.
One group of infochemicals is the polyunsaturated aldehydes (PUAs). These are
reported to have variable effects on invertebrates, algae, bacteria and yeast (Adolph et
al. 2004; Caldwell et al. 2005; Casotti et al. 2005; Fontana et al. 2007; Taylor et al.
2007). Their effect on calanoid copepods is to reduce egg viability, produce abnormal
morphological development in nauplii, and reduction in naupliar survival (Ban et al.
1997; Paffenhöfer 2002; Ianora et al. 2003; Taylor et al. 2007). PUAs are also toxic to
many taxa other than copepods, such as polychaetes, echinoderms, and ascidians
(Buttino et al. 1999; Caldwell et al. 2002; Simon et al. 2010).
Decadienal is one of the PUAs and has been reported to play an important role in the
algal growth cycle and the formation of blooms. For example, Vardi et al. (2006)
showed that when cells of the diatom Phaeodactylum tricornutum are exposed to 19.8
M (3 g ml-1) of decadienal, cell death results, probably as a result of it triggering
intracellular calcium transients which, in turn, leads to the generation of nitric oxide

66
(NO) by a calcium-dependent NO synthase-like activity (Vardi et al. 2006). However,
subjecting cells to sublethal doses of decadienal can induce resistance to lethal doses,
which is reflected in altered calcium signatures and the kinetics of NO production
(Vardi et al. 2006). Decadienal belongs to the ,-unsaturated aldehydes, which are
reactive compounds that can receive electrons because of the double bond found in their
aldehyde group (Hansen et al. 2004). These compounds affect the cell in various ways.
They can react with proteins and enzymes (Witz 1989), DNA (Uchida 1999) and DNA
polymerase (Wawra et al. 1986). They are reported to cause apoptosis in copepods
(Miralto et al. 1999; Poulet et al. 2003; Romano et al. 2003) and diatoms (Casotti et al.
2005). In addition, they cause necroptosis in human cancer cells (Sansone et al. 2014).
Apoptosis and necroptosis are types of programmed cell death (PCD).
Since microalgal cultivation for biofuel production resembles an open water
environment, it is important to explore the effect of infochemicals such as decadienal on
microlagal cultures, with the aim of enhancing biofuel production. Previous work by
Taylor et al. (2012) indicated that, by treating algae cultures with decadienal, the lipid
yield increased, but at the expense of reducing growth rate. Also, treatment with algae
extracts promoted autoflocculation responses in the cultures. Given that decadienal is
known to be broadly toxic to a range of cellular processes, it is important to gain an
understanding of what the chemical is doing to the algae at the cellular and sub-cellular
levels. High lipid yield per unit area is the result of both overall biomass productivity
and individual cell lipid content. Both parameters need to be optimized in a successful
biofuel production plant (Rodolfi et al. 2009). In this present study, sub-lethal
concentrations of decadienal were investigated to determine the effects on overall yield
and speed of lipid production (i.e. increased lipid yields more quickly) in
Nannochloropsis oculata and Dunaliella salina, both of which have been intensively
investigated as practical organisms for biofuel production (Hu et al. 2008; Rodolfi et al.
2009; Kilian et al. 2011).
3.1.7 Study aims
The main focus of this chapter is investigation of the effect of decadienal on the
production of lipid droplets within the algal cellular structure. Electron microscopy was
used, as it permits differentiation between the two types of lipid-rich structure, whereas
chemical extraction methods only provide a measure of the total lipids in the cell.
Stereological measurment techniques were used on randomly selected thin sections of

67
cells in their exponential growth phase and in a range of decadienal concentrations (0,
2.5, 50 µM for D. salina) and (0, 1, 10, 50 µM for N. oculata), to assess whether
decadienal triggers a shift in lipid body content or increases the overall membrane
constituents in the cell, particularly the extensive plastid thylakoid system.
Figure 3.1: Basic structure of triacylglycerides
Triacylglycerides are composed of a glycerol backbone to which 3 fatty acids are
esterified. (Source: King (2014))
Figure 3.2: Decadienal structure
(Source: Sigma-Aldrich (2015))

68
3.2 Methods
3.2.1 Comparison of active versus stationary phase cell ultrastructure
The two algal species used throughout this investigation were obtained from the Culture
Collection of Algae and Protozoa, Oban. The Dunaliella salina strain (CCAP 19/30)
and the Nannochloropsis strain (CCAP 849/1) were grown under the same conditions as
the maintenance cultures described in Chapter 2 (section 2.1.1). To compare cell
structure between active and stationary growth phases, standard growth curves were
determined using optical density measurements (at 690 nm wavelength) using a Varian
UV-VIS spectrophotometer. For each of the two species, two samples (one actively
growing in the linear phase and one in the stationary phase) were fixed as described in
Chapter 2 (section 2.3.1.1).
3.2.2.1 Dunaliella salina CCAP19/30
Two D. salina samples were fixed concurrently. Sample one was taken from a 10-day-
old culture which was in the linear growth phase and had a culture cell density of
2.5x10⁷ cells ml-1. Sample two was taken from a 14-day-old culture in stationary phase
with a culture density of 10.5x10⁷ cells ml-1. Samples were fixed using protocol one as
described in Chapter 2 (section 2.3.1).
3.2.1.2 Nannochloropsis oculata CCAP849/1
For N. oculata, the first sample was fixed from a 6-day-old culture in the linear growth
phase with a culture density of 1.95x10⁷ cells ml-1. The second sample was fixed from a
20-day-old culture that had entered stationary phase with a cell density of 8.77x10⁷ cells
ml-1. Samples were fixed using protocol four as described in Chapter 2 (Section
2.3.2.1).
3.2.2 Assessing the effects of decadienal on Dunaliella salina and Nannochloropsis
oculata cell structure
The effects of a range of trans, trans-2, 4-decadienal (Sigma Aldrich UK Ltd)
(decadienal) concentrations on cell structure and lipid content was investigated using a
randomized factorial experimental design. Four replicate cultures of D. salina and N.
oculata per decadienal concentration were set up and distributed randomly in a LabHeat
free standing incubator fitted with florescent light tubes, as shown in Figure 3.3. The
factorial design minimized the effects of any minor temperature and light variations

69
during the experimental period. A 100 mM decadienal stock solution was prepared by
dissolving 28.7 ml of 0.174 M decadienal (Mwt= 152.23 g mol-1, density= 0.872 g ml-
1) in 21.3 ml methanol in the case of D. salina or 21.3 ml ethanol in the case of N.
oculata. Specific volumes of the stock solution were added to sterile 50-ml conical
flasks containing 40 ml of F/2 medium to give the test range of decadienal
concentrations (Figure 3.3). The proportions of ethanol and methanol solvent controls
were equal to the equivalent dose of the highest concentration of the treated samples
(8.5 l in the case of the 50 M decadienal treatment).
D. salina treatments were inoculated with 1.8×10⁶ cells ml-1 in replicate flasks
containing 0 M, 2.M, and 50 M decadienal (Table 3.1). N. oculata treatments
were inoculated with 2.0×10⁶ cells ml-1 in flasks containing 0 M, 1 M, 10 M, and 50
M decadienal (Table 3.2). A solvent control was run with 8.5 l methanol. All flasks
were maintained at 19 °C with a 16 hours light: 8 hours dark photoperiod for 24 hours.
Due to restrictions on the number of samples that can be effectively processed for
electron microscopy at any one time, only one replicate flask was processed for each of
the two growth phases and decadienal treatments using the optimal fixation protocols
described in Chapter 2, section 2.3.1.1.

70
Table 3.1 Experimental set-up for Dunaliella salina.
Sample Flask constituents
0 M 40 ml of D. salina culture
Methanol control 39.9915 ml D. salina culture, 0.00852 ml 99% methanol
2.5 M 39.999 ml D. salina culture, 0.001 ml of 100 mM decadienal
50 M 39.98 ml D. salina culture. 0.02 ml of 100 mM decadienal
Table 3.2: Experimental set-up for Nannochloropsis oculata.
Sample Flask constituents
0 M 40 ml of N. oculata culture
Ethanol control 39.9915 ml N. oculata culture, 0.00852 ml 99% ethanol
1 M 39.9996 ml N. oculata culture, 0.0004 ml of 100 mM decadienal
10 M 39.996 ml N. oculata culture, 0.004 ml of 100 mM decadienal
50 M 39.98 ml N. oculata culture. 0.02 ml of 100 mM decadienal

71
A
B
Figure 3.3: Experimental set-up
A) Dunaliella salina experimental design. Each flask contained:
0 M: 40 ml of D. salina culture.
M (methanol control): 39.9915 ml D. salina culture, 0.00852 ml 99% methanol
2.5 M: 39.999 D. salina culture, 0.001 ml of 100 mM decadienal
50 M: 39.98 D. salina culture. 0.02 ml of 100 mM decadienal
B) Nannochloropsis oculata experimental design. Each flask contained:
0 M: 40 ml of N. oculata culture.
E (methanol control): 39.9915 ml N. oculata culture, 0.00852 ml 99% ethanol.
1 M: 39.9996 ml N. oculata culture, 0.0004 ml of 100 mM decadienal
10 M: 39.996 ml N. oculata culture, 0.004 ml of 100 mM decadienal
50 M: 39.98 ml N. oculata culture, 0.02 ml of 100 mM decadienal

72
3.2.3 Stereological and statistical analysis
Thirty micrographs representing a random sample from cells for each treatment were
acquired by sectioning two to three blocks for each treatment in various planes (Visviki
and Rachlin 1994a). These micrographs were analysed using a 1cm x 1 cm point lattice
grid as described by Steer (1981) and shown in Figure 3.4 A and B. Using a grid point
counting procedure, the volume fraction (Vv) of the following selected organelles was
calculated (for definition and illustration see Figure 3.4): nucleus, mitochondria, lipid,
cell wall, cytoplasm, vacuoles and chloroplast. In addition, chloroplasts were further
analysed to determine the volumes of thylakoid membranes, starch, plastoglobuli,
background matrix and pyrenoid (see Figure 3.4A, B). The mean organelle volume
fraction and standard error was calculated for each organelle in each treatment. Data
acquired from the calculation of Vv for the desired organelles were subjected to
statistical analysis using Minitab 16.
3.2.3.1 Dunaliella salina: testing the differences between volume fractions of log
and stationary phases
Anderson-Darling tests were conducted, one for each organelle, for active and
stationary growth phases. For the active growth phase, the data for the nucleus,
mitochondria, chloroplast, cytoplasm, thylakoid membrane, starch grains and matrix
conformed to normal distributions (Anderson-Darling test, Table A1, Appendix 2,
p>0.05); however, data for lipid, vacuoles, plastoglobuli, and pyrenoid were not normal
(Anderson-Darling test, Table A1, Appendix 2, p> 0.05). Data remained non-normal
despite arcsine transformation (Anderson-Darling test, Table A3, Appendix 2 p<0.05).
For the stationary phase growing cells, the data for lipid, cytoplasm, chloroplast,
thylakoid membrane, and starch grains conformed to normal distributions (Anderson-
Darling test, Table A2, Appendix 2, p>0.05); however, data for the nucleus,
mitochondria, vacuoles, plastoglobuli, pyrenoid, and matrix were not normal
(Anderson-Darling test, Table A2, Appendix 2, p<0.05) but data for the matrix and
mitochondria were normalised by arcsine transformation (Anderson-Darling test, Table
A4, Appendix 2, p>0.05).
Differences in volume fraction for non-normally distributed data (nucleus, lipid,
vacuoles, plastoglobuli and pyrenoid) between the log and stationary phases were tested
using Mann-Whitney U-tests (results, section 3.3.1.2). The volume fractions of
normally distributed data (mitochondria, cytoplasm, chloroplast, matrix, thylakoid

73
membranes and starch) in the active and stationary phases were tested using t-tests
(results, section 3.3.1.2). Equal variance tests (F-test) were conducted before t-tests. The
variances of the log and stationary phase volume fractions for cytoplasm, chloroplast,
thylakoid membrane and starch could be considered as equal (F-test, F values are shown
in Table A5 in Appendix 2, p>0.05); therefore a t-test for equal variances was
conducted to test significant differences in volume fractions of the organelles mentioned
in actively growing and stationary phase growing cells. The variances of the active and
stationary phase volume fractions for mitochondria and matrix could not be considered
as equal (F-test, p<0.0, F values Table A5, Appendix 2). Therefore, a t-test for non-
equal variances was used to test the significant differences in volume fraction of the
cell’s organelles in exponential and stationary phase growing cells (results section
3.3.1.2).
3.2.3.2 Dunaliella salina: testing the differences between volume fractions of
decadienal-treated cells
The same procedure (section 3.2.3.1) was carried out to test the normality of volume
fraction data for zero control, methanol control, 2.5 M and 50 M. Data for the
chloroplast, cytoplasm, thylakoid membrane, starch grains and matrix conformed to
normal distributions in all the four treatments (Anderson-Darling test, Tables A6-A10,
Appendix 2, p>0.05). Data for nucleus, lipid, mitochondria, vacuoles, plastoglobuli, and
pyrenoid did not conform to normal distribution (Anderson-Darling test, Tables A6-
A10, Appendix 2, p>0.05). Arcsine transformation of the zero control non-normally
distributed organelles did not achieve normality (Anderson-Darling test, Table A7,
Appendix 2, p<0.05). Detailed results of the statistical analysis are shown in Appendix
2.
The differences in volume fractions for organelles that are non-normally distributed in
zero control, methanol control, 2.5 M and 50 M samples (which are nucleus,
mitochondria, lipid, vacuoles, cytoplasm, chloroplast, plastoglobuli and pyrenoid) were
tested using the Kruskal-Wallis test (results, section 3.3.1.3). The data of organelles that
were normally distributed (which are chloroplast, cytoplasm, thylakoid membrane,
starch and matrix) were subjected to Levene’s test of homogeneity of variances and
showed no significant differences in the variances of cytoplasm, thylakoid membrane,
starch and matrix for the four treatments (zero control, methanol control, 2.5 M and 50
M). Therefore, it can be assumed that cytoplasm, thylakoid membrane, starch and

74
matrix were drawn from populations with equal or similar variances (Levene’s tests, L-
values are shown in Table A11, Appendix 2, p>0.05) and ANOVA was used to test
whether there were any significant differences in volume fractions of the organelles
mentioned in the four treatments (results, section 3.3.2). Levene’s test of homogeneity
of variances showed significant differences in the variance of chloroplast for the four
treatments (zero control, methanol control, 2.5 M and 50 M). Therefore, it cannot be
assumed that the chloroplast were drawn from populations of equal variance (Levene’s
tests, L-value are shown in Table A11, Appendix 2, p<0.05) and the Kruskal-Wallis test
were used to test whether there were any significant differences in volume fractions of
the chloroplast for the four treatments (zero control, methanol control, 2.5 M and 50
M) (results, section 3.3.1.3).
3.2.3.3 Nannochloropsis oculata: testing the differences between volume fractions
of log and stationary phases
Anderson-Darling tests were conducted for each organelle for active and stationary
growth phases. For actively growing (log phase) cells the data for the mitochondria,
chloroplast, cytoplasm, thylakoid membrane, cell wall and matrix conformed to normal
distributions (Anderson-Darling test, Table A12, Appendix 2, p>0.05), whereas the data
for nucleus, lipid, vacuoles, and plastoglobuli did not (Anderson-Darling test, Table
A12, Appendix 2, p<0.05). The absence of storage body in log phase cells prevented a
statistical analysis. The use of arcsine did not transform the data to normality
(Anderson-Darling test, Table A14, Appendix 2, p<0.05). For stationary phase cells, the
data for the lipid and cell wall conformed to normal distributions (Anderson-Darling
test, Table A13, Appendix 2, p>0.05), whereas the data for nucleus, mitochondria,
vacuoles, chloroplast, thylakoid membrane, plastoglobuli, matrix and storage bodies
were not normal (Anderson-Darling test, Table A13, Appendix 2, p<0.05). The use of
arcsine transformed the data of cytoplasm, chloroplast, matrix, and thylakoid
membranes to normality (Anderson-Darling test, Table A15, Appendix 2, p>0.05).
Based on the normality results, the volume fractions for nucleus, lipid, vacuoles,
mitochondria, and plastoglobuli in the active and stationary phases were tested using
Mann-Whitney U-tests (results, section 3.3.2.2), whereas the volume fractions of
cytoplasm, chloroplast, matrix, thylakoid membranes and cell wall were tested using t-
tests. Equal variance tests (F-test) were conducted before the t-tests. The active and
stationary phase volume fractions for cytoplasm, chloroplast, matrix, thylakoid

75
membrane and cell wall had equal variances (F-test, F values are shown in Table A16,
Appendix 2, p<0.05). Therefore, a t-test for equal variances was used to test that there
were no significant differences in volume fractions of the organelles mentioned in active
and stationary phase growing cells (results section 3.3.2.2).
3.2.3.4 Nannochloropsis oculata: testing the differences between volume fractions
of decadienal-treated cells
The testing for normality of volume fraction data for zero control, ethanol control, 1
M, 10 M and 50 M was conducted using the Anderson-Darling test. Data for the
matrix conformed to normal distributions in all five treatments (Anderson-Darling test,
Tables A17-A21, Appendix 2, p>0.05). Data of the cytoplasm volume fraction was
successfully arcsine-transformed (Anderson-Darling test, Table A22, Appendix 2,
p>0.05), whereas data for cell wall, nucleus, mitochondria, lipid, vacuoles, chloroplast,
plastoglobuli, and thylakoid membrane were not normal (Anderson-Darling test, Tables
A17-A21, Appendix 2, p<0.05).
The volume fractions for nucleus, mitochondria, lipid, vacuoles, cell wall, chloroplast,
thylakoid membranes and plastoglobuli were tested using the Kruskal-Wallis test and
showed there was no significant difference in volume fractions of different organelles
between the four different treatments (results, section 3.3.2.3). The volume fractions of
cytoplasm and matrix had no significant difference in variance between the four
treatments (Levene’s test, L-vales are shown in Table A23, Appendix 2, p>0.05) and
were therefore analysed using ANOVA to test that there were no significant differences
in volume fractions of the cytoplasm and matrix in the four treatment samples (zero
control, ethanol control, 1M, 10 M and 50 M) (results section 3.3.2.3).

76
Figure 3.4: Stereological analysis
A) Longitudinal section of cell of Dunaliella salina, showing superimposed 1cm x 1cm
lattice used to calculate volume fractions of the main organelle components. B)
Longitudinal section of cell of N. oculata, showing superimposed 1cm x 1cm lattice
used to calculate volume fractions of the main organelle components. Stereology is a
discipline of science based on a complex set of mathematical principles that provide
methods of calculating the three-dimensional structure of cells and cell organelles based
on their two-dimensional appearance in the thin section (Weibel 1969; Steer 1981; Russ
1986). The volume fraction (Vv: the volume occupied by an organelle within the whole
cell volume) occupied by an organelle is found by grid point counting. In grid point
counting, a lattice grid containing 1 cm lines separated from each other by 1 cm is
inserted over the micrograph. The number of points (at the end of each 1 cm line) that
lies over each organelle is counted then divided by the total number of points that cover
the cell. Steer (1981) showed that this method reduces the loss of accuracy.

77
3.3 Results
3.3.1 Dunaliella salina ultrastructure
3.3.1.1 Ultrastructure of actively growing 7-day-old cells
Dunaliella salina (CCAP19/30) cells were ovoid (Figure 3.5A-D, G) to pyriform
(Figure 3.5E, F and H) and somewhat variable in size, with the average cell length 9 m
(ranging from 6 m to 14 m), and an average cell width of 5.5 m (ranging from 4 m
to 8 m). The lower part of the cell contained the bright green cup-shaped plastid,
whereas the apical region, where the nucleus is located, was more translucent (Figure
3.5A-G). In some cells, the red plastid eyespot was seen (Figure 3.5B), as was the more
round pyrenoid (Figure 3.5A, B, G). Each cell had a pair of isokont (equal length)
flagella (Figure 3.5A-I, K), which were inserted in a small apical boss (projection,
Figure 3.5H, K). Under the SEM, the two smooth flagella (average length of around 15
m) had gently tapering tips (Figure 3.5I). Although appearing perfectly smooth at low
magnification (Figure 3.5I), at higher power there appeared to be two rows of bubble-
like projections either side of the axoneme (Figure 3.5K). In the SEM, the cell surface
could be seen to be coated with larger bubble-like structures or granules (Figure 3.5H
and J) which were not apparent under the light microscope (Figure 3.5A-G).
The internal cytoplasmic organisation of 10-day-old active growth phase D. salina cells
under the TEM revealed a cell structure similar to that previously described for this
species (Preisig 1992). D. salina cells lack rigid cell walls and have a thin flexible cell
coat, which presumably accounts for the variable cell shape (Figure 3.5H-M). The cell
coat layer that overlies the electron-dense plasma membrane was composed of an outer
layer of fine granular/fibrillar material (Figure 3.5L, M and J) from which there were
occasional stalked projections (Figure 3.5M arrowed).
The single cup-shaped chloroplast occupied just over half the cell volume (55%, Figure
3.7) and was packed with parallel arrays of tightly stacked thylakoids (Figures 3.5L, N,
and 3.6G, K). The lamella was made up of two to six thylakoids (Figures 3.5L and
3.6G). The prominent pyrenoid found in the basal part of the chloroplast was centrally
located (Figures 3.5N and 3.6K). The large amorphous core of the pyrenoid was
surrounded by a variable number of large starch grains. The individual starch grains had
a grey core surrounded by a halo of electron-lucent material (Figures 3.5N and 3.6K).
Starch grains were also found in distal parts of the chloroplast, where they were (not
usually) surrounded by the electron-lucent material (Figures 3.5L, N and 3.6G, K).

78
Single thylakoids also penetrated into the pyrenoid matrix and attached to the pyrenoid
core (Figure 3.6K). Small electron-dense plastoglobuli (lipid storage bodies) were also
scattered throughout the chloroplast (Figures 3.5N and 3.6K). The eyespot was well
developed and lateral (Figure 3.6E).
The outer rim of the chloroplast’s cup-shaped plastid extended into the anterior part of
the cell, and enclosed the zone where most of the main cytoplasmic organelles were
located (Figures 3.4A 3.5N). The nucleus was found in the anterior region of the cell
(Figure 3.5N). It was a large nucleus and the nuclear envelope with inner and outer
membranes was present. It was spherical in shape with concavity in the site associated
with dictyosomes of the Golgi body (Figure 3.5N). In addition, the nuclear pores could
be clearly seen (Figure 3.5N, red arrows). Ovoid to capsule-shaped (Figure 3.5N) or
branched (Figure 3.6I) mitochondrial profiles were also scattered throughout the
anterior region of the cytoplasm, usually lying close to the chloroplast envelope and
around the nucleus (Figures 3.5N and 3.6I).
The endoplasmic reticulum (ER) was found directly under the cell membrane.
Furthermore, it was parallel to it and the ribosomes found on the outer surface of the ER
(Figure 3.6A, red arrow). Two Golgi dictyosome profiles were seen, closely associated
with the nuclear envelope oriented towards the basal bodies of the flagellum at the
anterior end of the cell (Figures 3.5N, and 3.6A and C). One Golgi dictyosome was
perpendicular to the longitudinal axis of the cell, while the other was parallel to it
(Figure 3.6A). They were surrounded by several cytoplasmic vesicles lying between the
dictyosome and nucleus (Figures 3.5N and 3.6A). Small electron-lucent vacuoles were
also present in the cytoplasmic anterior zone of the cell. However, in these actively
growing cells, lipid globules were rarely observed (Figure 3.5N).
3.3.1.2 Ultrastructure of 14-day-old stationary phase cells
D. salina cells from a 14-day-old stationary phase culture had a much altered
cytoplasm, compared with their actively growing counterparts (Figure 3.5O). The
chloroplast remained the largest and most conspicuous organelle, and in stationary cells
occupied approximately 64% of cell volume (Figures 3.5O and 3.7), which represented
an approximately 15% increase compared with normal actively growing cells. There
was no significant difference between the chloroplast volume fraction of the active
phase growing cells and that of the stationary phase growing cells (Table 3.3, Figure
3.7). However, the statistical analysis of volume fractions of the chloroplast constituents

79
(thylakoid membranes, pyrenoid, matrix and starch) showed significant differences
between active phase growing cells and stationary phase growing cells. The most
conspicuous change within chloroplast constituents was that, in stationary cells, the
whole plastid appeared to be packed with starch grains which had their usual grey core
and electron-lucent outer region (Figure 3.5O). There was a significant increase in
starch mean volume fraction between the active phase growing cells (mean = 14.1%,
95% CI: (11.8, 16.9)) and the stationary phase growing cells (mean = 41.9%, 95% CI:
(38.4, 45.5))(t- test, Table 3.3, Figure 3.7). In contrast to starch, the thylakoid content of
the plastid showed a significant decrease in volume fraction (Figure 3.7). There was a
statistically significant reduction in mean volume fraction of thylakoid membranes in
active phase growing cells (mean = 27.8%, 95% CI: (26.0, 30.9)) compared to that in
the stationary phase growing cells (mean= 19.1%, 95% CI: (16.8, 21.4)) (t-test, Table
3.3, Figure 3.7). The thylakoid membranes were stacked and condensed into each other
(Figure 3.6H), in contrast to actively growing cells where they formed a grana-like
structure composed of 2-6 thylakoids membranes (Figure 3.6G). Furthermore, there was
a significant reduction in mean volume fraction of matrix between active phase growing
cells (mean = 9.7%, 95% CI: (8, 11.3)) and stationary phase cells (mean = 2%, 95% CI:
(1.4, 2.6)) (t-test, Table 3.3, Figure 3.7). The pyrenoid also was present in the stationary
phase cells (Figure 3.6L), although there was no statistically significant difference in
median volume fraction between growth phases (Mann-Whitney U-test, Table 3.4,
Figure 3.8).
In addition to the increase in plastid starch grains, stationary phase cells of D. salina
also had large lipid globules located between the nucleus and plastid (Figure 3.3O).
There was a statistically significant difference in the median lipid volume fraction
between the active phase growing cells (median = 0.00%, 95% CI: (-0.02, 0.05)) and
stationary phase growing cells (median = 7.12%, 95% CI: (5.22, 9)) (Mann-Whitney U-
test, Table 3.4 Figure 3.8).
The dictyosomes of the Golgi apparatus became attached to each other, were increased
in number and were separated by vacuoles (Figure 3.6B). The vacuoles had electron-
dense content (Figure 3.6B, D). On the other hand, there was no statistically significant
difference in median volume fraction of vacuoles between growth phases (Mann-
Whitney U-test, Table 3.4, Figure 3.8).

80
There was a statistically significant reduction in the volume fraction of the mitochondria
of the stationary phase growing cells (mean = 2%, 95% CI: (1.2, 6.7)) compared with
that of actively growing cells (mean = 3.2%, 95% CI: (1.2, 5.2)) (t-test, Table 3.3,
Figure 3.7). The eyespot/stigma in stationary cells had the same characteristics of this
organelle in active phase cells (Figure 3.6E, F), although the number of plastoglobuli
appeared greater in stationary phase cells (Figure 3.6L) than in active phase cells
(Figure 3.6K). There was no statistically significant difference in median volume
fractions of plastoglobuli in the active phase and stationary phase growing cells (Mann-
Whitney U-test, Table 3.4, Figure 3.8). Finally, no change in cell size was detected, as
the mean cell length was 9 m for both active and stationary growth phases, and the
mean cell width was 5 m for both.

81
Table 3.3: Results of t-tests for volume fractions of cytoplasm, mitochondria,
chloroplast, matrix, thylakoid membranes and starch in Dunaliella salina active and
stationary phase cells
Organelle t DF P
Cytoplasm 4.86 58 <0.001
Mitochondria 5.92 29 <0.001
Chloroplast -3.07 59 0.003
Matrix 9.75 29 <0.001
Thylakoid membranes 6.24 58 <0.001
Starch -12.01 58 <0.001
Table 3.4: Results of Mann-Whitney tests for volume fractions of nucleus, lipid,
vacuoles, plastoglobuli and pyrenoid in Dunaliella salina active and stationary phase
cells
Organelle W n p
Nucleus
Active
1169
30
0.001 Stationary 30
Lipid
Active 548.5
30 <0.001
Stationary 30
Vacuoles
Active
937.5
30
0.741 Stationary
30
30
Plastoglobuli Active
914.0 30
0.993 Stationary 30
Pyrenoid
Active
934.5
30
0.774 Stationary
30
30

82
Figur 3.5: Dunaliella salina cell structure under light, scanning electron microscopy and
comparison between exponential and stationary growth phases of Dunaliella salina
under lower magnification transmission electron microscopy
A-G) Light microscopy images of D. salina showing the variable cell shapes and the
two flagella. Scale bar 5 m. H-I) Scanning electron micrographs of D. salina showing
the equal length flagella and the granulated cell coat. Scale bars mentioned on each
figure. J) Higher power magnification of the flagellar apparatus base Scale bar 2 m. K)
Higher magnification of the cell coat showing different-sized granules. Scale bar 2 m
(L) Higher magnification of the cell coat under transmission electron microscope. Scale
bar 0.5 m. M) Higher magnification of the cell coat under transmission electron
microscope. Scale bar 0.5 m. N) Transmission electron micrograph of exponentially
growing cells. Scale bar 0.5 m. O) Transmission electron micrograph of stationary
phase cells. Scale bar 0.5 m. Chl: chloroplast; G: Golgi; L: lipid bodies; M:
mitochondria; N: nucleus; P: pyrenoid; S: starch; V: vacuoles.

83
Figure 3.6: Comparison of exponential and stationary growth phases of Dunaliella
salina at higher magnification of transmission electron microscope
A) Golgi apparatus in exponential growth phase. Scale bar 0.5 m. B) Golgi apparatus
in stationary growth phase. Scale bar 0.5 m. C) Golgi apparatus in exponential growth
phase with flagella origin. Scale bar 0.5 m. D) Golgi apparatus in stationary growth
phase with flagella origin. Scale bar 0.5 m. E) Stigma in exponential growth phase.
Scale bar 0.5 m. F) Stigma in stationary growth phase. Scale bar 0.5 m. G) Thylakoid
membranes in exponential growth phase. Scale bar 0.5 m. H) Thylakoid membranes in
stationary growth phase. Scale bar 0.1 m. I) Mitochondria in exponential growth
phase. Scale bar 0.5 m. J) Mitochondria in stationary growth phase. Scale bar 0.5 m.
K) Pyrenoid in exponential growth phase. Scale bar 0.5 m. L) Pyrenoid in stationary
growth phase. Scale bar 0.5 m. Chl: chloroplast; G: Golgi; L: lipid bodies; M:
mitochondria; N: nucleus; Pl: plastoglobuli; Py: pyrenoid; S: starch; St: stigmata; Thy:
thylakoid; V: vacuoles.

84
Figure 3.7: Mean and 95% confidence intervals of volume fractions of the cell
organelles in Dunaliella salina log and stationary phase cells
The volume fraction data for each organelle were subjected to a separate t-test. Stars
indicate significant differences between log and stationary phase volume fractions of an
organelle.

85
Figure 3.8: Median and 95% confidence intervals of volume fractions of the cell
organelles in Dunaliella salina log and stationary phase cells
Data of each organelle were tested using the Mann-Whitney test. Each pair represents a
separate test. Pairs with stars show significant differences.

86
3.3.1.3 Ultrastructure of decadienal-treated cells
Two control samples were used: one of 0 M decadienal, and the other a solvent blank
using methanol (Figures 3.9A, G). A comparison of actively growing cells (Figure
3.5N), control cells (Figure 3.9A, G) and those treated with 2.5 m decadienal (Figure
3.2N) indicated that ultrastructural differences were rare. There were no clear
differences between the methanol control (Figure 3.9G-K) and normal actively growing
cells (with 0 M decadienal) (Figure 3.9A-F). Only samples treated with 50 M
decadienal showed ultrastructural alterations. Its effect on the ultrastructure of D. salina
cells varied. Some cells remained intact and preserved their shape (Figure 3.11B),
whilst others became more rounded in shape without leakage of intracellular content
(Figure 3.10A). In contrast, other cells were lysed and cytoplasmic consumption was
obvious as all cellular organelles disappeared except for starch granules with intact cell
membranes (Figure 3.11E, F). Alterations to specific organelles are described below.
The ovoid to pyriform cell shape was maintained in all treatments (Figure 3.9A, G), as
was the variability in cell size. The mean cell length was 9 m (ranging from 6 m to
12m) and mean cell width 5 m (ranging from 1 m to 8 m) for 0 M decadienal.
For the methanol control, the mean cell length was 8 m (ranging from 7 m to 11m)
and mean cell width 5 m (ranging from 4 m to 7 m). The basal cup-shaped
chloroplast with a prominent central pyrenoid (Figure 3.9 A, G) constituted more than
50% of the volume fraction (57.4% for untreated cells, 55.7% for methanol control,
56.6% 2.5 M decadienal-treated cells and 55.9% for 50 M decadienal-treated cells).
There was no significant difference in the median volume fractions of the chloroplast
(Kruskal-Wallis test, Table 3.6, Figure 3.13).
The chloroplasts were packed with parallel arrays of tightly stacked thylakoids that
constituted 30% of cell volume fraction, with the pyrenoid found in the basal part. The
structure of thylakoids and photosynthetic lamellae showed alterations in 50 M
decadienal treatments. This varied between cells, with some having no changed
structures, where the thylakoids formed a grana-like structure (Figure 3.11B, C). Other
cells had condensed thylakoid membranes (Figure 3.11A). In other cells, both structures
were found (Figure 3.11D). There was a statistically significant difference in mean
volume fraction of the thylakoid membranes between different treatments (ANOVA
test, Table 3.5, Figure 3.12). Post-hoc Tukey pairwise comparison (P = 0.05) showed
that the thylakoid volume fraction was significantly lower in samples treated with 2.5

87
M decadienal (mean = 25.1%, 95% CI: (23.3, 26.8)) than in samples treated with 0 M
decadienal (mean = 29.6%%, 95% CI: (27.7, 31.9)) and the methanol control (mean =
30.1%%, 95% CI: (28.2, 32.1)). The starch grains surrounded the pyrenoid and were
found to be separated throughout the chloroplast (Figure 3.9A, G). There was no
significant difference in the median volume fractions of the pyrenoid (Kruskal-Wallis
test, Table 3.6, Figure 3.13). There were also no statistically significant differences in
the mean volume fractions of the starch between different treatments (ANOVA test,
Table 3.5, Figure 3.12). However, the matrix volume fraction showed significant
differences between the different treatments (ANOVA test, Table 3.5, Figure 3.12).
Small electron-dense plastoglobuli (lipid storage bodies) were also scattered throughout
the chloroplast (Figure 3.9A, G). There was no significant difference in the mean
volume fractions of plastoglobuli (Kruskal-Wallis test, Table 3.6, Figure 3.13). The
eyespot was well developed and lateral (Figure 3.9F, L).
The plastid again extended into the anterior part of the cell, and enclosed the zone where
most of the main cytoplasmic organelles were located (Figure 3.9A, C, G). The
cytoplasm density increased in samples treated with 50 M decadienal, and some
membranous organelles were hardly detectable, such as the Golgi dictyosome and
endoplasmic reticulum (Figure 3.11A, B). Cytoplam median volume fraction was not
significantly different between different treatments (ANOVA test, Tables 3.5, Figure
3.12).
The nucleus was located in the anterior region of the cell (Figure 3.6A, C, G). It was a
large nucleus and the nuclear envelope was present with inner and outer membranes. It
was spherical in shape with concavity in the site associated with dictyosomes (Figure
3.9A, C, D, and G). Cells treated with 50 M decadienal showed an increased gap in the
nuclear envelope, whose size in 50 M decadienal-treated cells was 125 nm (Figures
3.10B, 3.11B and C) while it was only 30 nm in control cells (Figure 3.9A, G). In
addition, some cells showed chromatin condensation and margination (Figure 3.11A, C,
and D), and others showed karyolysis (chromatin dissolution) (Figure 3.11B). There
was a statistically significant difference in the median volume fractions of the nucleus
between different decadienal treatments (Kruskal-Wallis test, Table 3.6, Figure 3.13).
The median volume fractions of the nucleus in samples treated with 50 M decadienal
(median = 8.2%, 95% CI: (6.3, 10)) were significantly lower than in all other treatments
(0 M decadienal median = 12.66%, 95% CI: (10.06, 15.36); 2.5 M decadienal median

88
= 14.9%, 95% CI: (12.7, 14.86); and methanol control median =13.7%, 95% CI: (11.75,
15.7) (Kruskal-Wallis test, Tables 3.6, 3.7, Figure 3.13).
The profiles of mitochondria were ovoid to capsule-shaped (Figure 3.9A, B, C, G, K)
and they were scattered throughout the anterior region of the cytoplasm, usually lying
close to the chloroplast envelope and around the nucleus (Figure 3.9 A, C, D, G). The
mitochondrial profiles in samples treated with 50 M decadienal showed evidence of
lysis and rupture (Figures 3.10B and 3.11A-D). Cavities appeared in the cytoplasm in
the region where mitochondria were usually present in the cell (Figure 3.11A-D). There
was a statistically significant difference in median volume fractions of mitochondria
between different decadienal treatments (Kruskal-Wallis test, Tables 3.6 and 3.7, Figure
3.13). The mitochondria median volume fraction in sample treated with 50 M
decadienal (median = 0%, 95% CI: (-0.6, 0.6)) were significantly lower than in all other
treatments (0 M decadienal median = 2.9%, 95% CI: (2.1, 3.7); 2.5 M decadienal
median = 2.62%, 95% CI: (2.02, 3.22); and methanol median = 9.5%, 95% CI: (9, 10))
(Kruskal-Wallis test, Tables 3.6 and 3.7, Figure 3.13). The mitochondria median
volume fractions in samples treated with 2.5 M decadienal (median = 2.62%, 95% CI:
(2.02, 3.22)) were significantly less than those in 0 M decadienal (median = 2.9%,
95% CI: (2.1, 3.7)) and methanol (median = 9.5%, 95% CI: (9, 10)) (Kruskal-Wallis
test, Tables 3.6 and 3.7, Figure 3.13). The mitochondria median volume fractions in
samples treated with 0 M decadienal (median = 2.9%, 95% CI: (2.1, 3.7) and methanol
control (median = 9.5%, 95% CI: (9, 10)) were not significantly different from each
other (Kruskal-Wallis test, Tables 3.6 and 3.7, Figure 3.13).
Two Golgi dictyosome profiles were seen, closely associated with the nuclear envelope
and oriented towards the basal bodies of the flagellum at the anterior end of the cell
(Figure 3.9A, D, G, J). They were surrounded by several cytoplasmic vesicles lying
between the dictyosome and nucleus (Figure 3.9D, J). Small electron-lucent vacuoles
were also present in the cytoplasmic anterior zone of the cell.
When compared to controls and 2.5 M decadienal-treated cells, the 50 M decadienal-
treated cell structure showed lipid production, with volume fractions of lipids increasing
from 0 for 0 M, methanol and 2.5 M decadienal to 0.72% in 50 M decadienal.
These observations revealed the presence of lipid bodies in 50 M decadienal (Figures
3.10B and 3.11A-D, G, H). These lipid bodies resembled lipid bodies found in the

89
stationary phase samples (Figure 3-5O). There was a statistically significant difference
in median volume fractions of lipid between different decadienal treatments (Kruskal-
Wallis test, Table 3.6).The lipid median volume fractions in samples treated with 50 M
decadienal (median = 0.72%, 95% CI: (0.12, 1.22)) were significantly higher than all
other treatments 0 M decadienal (median = 0%, 95% CI: (0, 0)), 2.5 M decadienal
(median = 0%, 95% CI: (-0.007, 0.04)) and methanol (median = 0%, 95% CI: (0, 0))
(Kruskal-Wallis test, Tables 3.6, 3.7 and Figure 3.13). There were no significant
differences between the remaining three treatments.
The distinctive alteration that presented frequently in 50 M decadienal-treated cells
was extensive cytoplasmic vacuolation. Compared with the control, decadiena-treated
D. salina showed vacuoles with a larger volume which contained different types of
inclusions varying in shape and electron density (Figure 3.11A-D). The only alteration
in the ultrastrucuture of cells treated with 2.5 M decadienal was that the vacuoles
contained electron dense (osmiophilic) inclusions (Figure 3.10C). There was a
statistically significant difference in median volume fractions of vacuoles between
different decadienal treatments (Kruskal-Wallis test, Table 3.6). The vacuole median
volume fractions in samples treated with 50 M decadienal (median = 8.1%, 95% CI:
(6.3, 10)) were significantly higher than in 2.5 M decadienal (median = 1.2%, 95% CI:
(0.5, 1.9)), 0 M decadienal (median = 0.96%, 95% CI: (0.46, 1.56 )) and methanol
(median = 0.15%, 95% CI: (-0.41, 0.85 )) (Kruskal-Wallis test, Tables 3.6, Mann-
Whitney U-test, 3.7, Figure 3.13). The vacuole median volume fractions in samples
treated with 0 M decadienal (median = 0.96%, 95% CI: (0.46, 1.56)) and 2.5 M
(median = 1.2%, 95% CI: (0.5, 1.9)) were not significantly different (Kruskal-Wallis
test, Tables 3.6 and Mann-Whitney U-test, 3.7, Figure 3.13). The vacuole median
volume fractions in samples treated with methanol (median = 0.15%, 95% CI: (-0.41,
0.85)) were significantly lower than those in 2.5 M decadienal (median = 1.2%, 95%
CI: (0.5, 1.9)), 0 M decadienal (median = 0.96%, 95% CI: (0.46, 1.56)) and 50 M
decadienal (median = 8.1%, 95% CI: (6.3, 10)) (Figure 3.13).

90
Table 3.5: Results of ANOVA tests on the effects of decadienal treatments on the
volume fraction of cytoplasm, thylakoid membranes, starch, and matrix in Dunaliella
salina
Organelle DF F-statistic P
Cytoplasm 3 1.17 0.323
116
119
Thylakoid
membranes
3 5.47 0.001
116
119
Starch 3 0.19 0.900
114
117
Matrix 3 2.8 0.038
116
119
Table 3.6: Results of Kruskal-Wallis tests for volume fraction of nucleus,
mitochondria, lipid, vacuoles, chloroplast, pyrenoid and plastoglobuli in Dunaliella
salina decadienal-treated cells
Organelle H DF P
Nucleus 18.39 3 <0.001
Mitochondria 39.58 3 <0.001
Lipid 69.3 3 <0.001
Vacuoles 61.11 3 <0.001
Chloroplast 1.3 3 0.722
Pyrenoid 2.84 3 0.416
Plastolobuli 1.9 3 0.594

91
Table 3.7: Results of Mann-Whitney tests for significant differences between volume
fractions of nucleus, mitochondria, lipid and vacuoles in Dunaliella salina decadienal-
treated cells
Organelle Tested concentrations n W P
Nucleus
0 M Vs M 30, 30 877.5 0.583
0 M Vs 2.5 M 30, 30 837.0 0.25
0 M Vs 50 M 30, 30 1073.5 0.019
2.5 M Vs M 30, 30 982.0 0.3255
2.5 M Vs 50 M 30, 30 1188.0 0.0001
50 M Vs M 30, 30 677.5 0.0005
Mitochondria
0 M Vs M 30, 30 930.0 0.8294
0 M Vs 2.5 M 30, 30 1245.0 <0.001
0 M Vs 50 M 30, 30 1298.0 <0.001
2.5 M Vs M 30, 30 488.0 <0.001
2.5 M Vs 50 M 30, 30 1255.0 <0.001
50 M Vs M 30, 30 473.0 <0.001
Lipid
0 M Vs M 30, 30 919.5 0.909
0 M Vs 2.5 M 30, 30 946.5 0.292
0 M Vs 50 M 30, 30 595.5 <0.001
2.5 M Vs M 30, 30 886.0 0.3298
2.5 M Vs 50 M 30, 30 536.0 <0.001
50 M Vs M 30, 30 1271.0 <0.001
Vacuoles
0 M Vs M 30, 30 1120.0 0.0023
0 M Vs 2.5 M 30, 30 859.0 0.4095
0 M Vs 50 M 30, 30 528.0 <0.001
2.5 M Vs M 30, 30 1170.5 0.0002
2.5 M Vs 50 M 30, 30 543.5 <0.001
50 M Vs M 30, 30 1333.5 <0.001

92
Figure 3.9: Comparisons of cell structures of two Dunaliella salina control samples
A-F) Negative control (0 M decadienal-treated cells). G-K) Methanol control cells. A)
Median longitudinal section of whole cell. Scale bar 0.5 m. B) Transverse section of
lower part of the cell. Scale bar 0.5 m. C) Enlarged section of the nucleus. Scale bar
0.5 m. D) Higher magnification of Golgi apparatus. Scale bar 0.5 m. E) Higher
magnification of mitochondrial profiles. Scale bar 0.5 m F) Higher magnification of
stigmata. Scale bar 0.5 m. G) Median longitudinal section of whole cell of methanol
control. Scale bar 0.5 m. H) Transverse section of lower part of the cell. Scale bar 0.5
m. I) Enlarged section of the nucleus. Scale bar 0.5 m. J) Higher magnification of
Golgi apparatus. Scale bar 0.5 m. K) Higher magnification of mitochondrial profiles.
Scale bar 0.5 m. L) Higher magnification of stigmata. Scale bar 0.5 m. Chl:
chloroplast; G: Golgi; M: mitochondria; N: nucleus; Nu: nucleolus;Py: pyrenoid; S:
starch; St: stigmata; V: vacuoles.

93
Figure 3.10: Dunaliella salina decadienal-treated cells
A) Median longitudinal section of whole cell treated with 2.5 M decadienal. Scale bar
2 m. B) Median longitudinal section of whole cell treated with 50 M decadienal.
Scale bar 2 m. C) Transverse section of lower part of cell treated with 2.5 mM
decadienal. Scale bar 0.5 m. D) Enlarged section of the nucleus and Golgi apparatus
cell treated with 2.5 M decadienal. Scale bar 0.5 m. E) Higher magnification of
mitochondrial profiles of cell treated with 2.5 M decadienal. Scale bar 0.5 m F)
Higher magnification of stigmata of cell treated with 2.5 M decadienal. Scale bar 0.5
m.Chl: chloroplast; G: Golgi; L: lipid bodies; M: mitochondria; N: nucleus; Nu:
nucleolus; Pl: plastoglobuli; Py: pyrenoid; S: starch; St: stigmata; V: vacuoles.

94
Figure 3.11: Detailed structural distortion of Dunaliella salina cells treated with 50 M
decadienal
A-D) Median longitudinal sections of whole cell treated with 50 M decadienal. Scale
bar 0.5 m unless mentioned. E-F) Membrane residuals of lysed cells. Scale bar 0.5 m.
G-H) Lipid bodies of different shapes and sizes. Scale bar 0.5 m. I-L) Different lysed
mitochondrial profiles. Scale bar 0.5 m. M-T) Different values appear in 50 M
treated cells only. Scale bar 0.5 m.Chl: chloroplast; L: lipid bodies; M: mitochondria;
N: nucleus; Nu: nucleolus; Py: pyrenoid; S: starch; V: vacuoles.

95
Figure 3.12: Means and 95% confidence intervals of volume fractions of the cytoplasm
and chloroplast constituents in Dunaliella salina treated with decadienal
Data for each organelle were tested with a separate ANOVA test. Treatments with the
same letters are not significantly different from each other (Post-hoc Tukey pairwise
comparison).
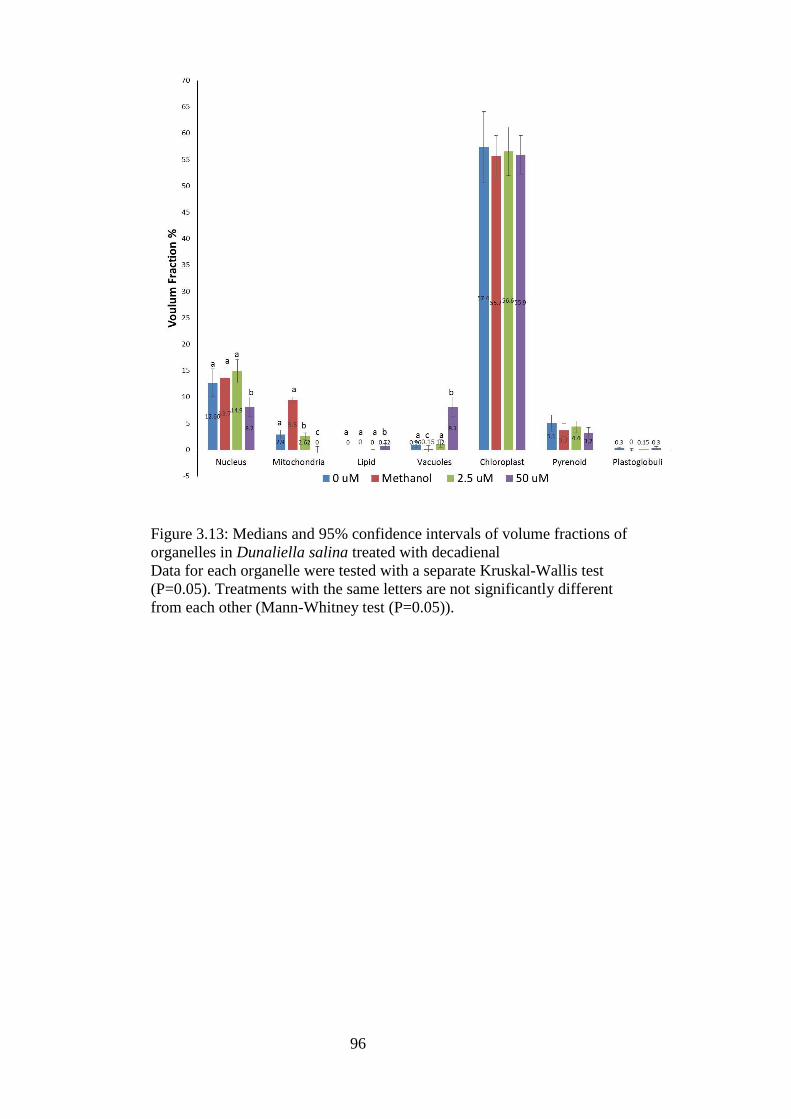
96
Figure 3.13: Medians and 95% confidence intervals of volume fractions of
organelles in Dunaliella salina treated with decadienal
Data for each organelle were tested with a separate Kruskal-Wallis test
(P=0.05). Treatments with the same letters are not significantly different
from each other (Mann-Whitney test (P=0.05)).

97
3.3.2 Nannochloropsis oculata ultrastructure
3.3.2.1 Ultrastructure of actively growing 6-day-old cells
Under the light microscope Nannochloropsis oculata (CCAP849/1) cells were small,
ovoid, non-motile (Figure 3.14A, B) and somewhat variable in size, with an average cell
length of 4 m (ranging from 3 m to 4.5m), and an average cell width of 2.6 m
(ranging from 1.5 m to 3.1 m). Each cell contained a single cup-shaped chloroplast
which gives the cells their overall green appearance (Figure 3.14C). Under the SEM
cells were ovoid (Figure 3.14D-E) and usually rather crumpled in appearance, even after
critical point drying (Figure 3.14D-E). The cells often appeared as if dried down onto
the coverslip with a halo of matrix material around them (Figure 3.14E arrowed).
The internal cytoplasmic organisation of 6-day-old active growth phase N. oculata is
shown in Figure 3.14G-H. The simple round to ovoid cells were enclosed in a thin
uniformly electron dense wall (8.9 m) (Figure 3.14G-H). The cells of N. oculata had a
comparatively simple organisation, containing a single cup-shaped chloroplast, a
nucleus, several mitochondria and a number of small lipid droplets and assorted
vacuoles (Figures 3.14 and 3.15). The most prominent organelles were the cup-shaped
peripheral chloroplasts, which enclosed the other organelles (Figure 3.14G, H) and
occupied around half the cell volume (57%, Figure 3.18). The chloroplast was packed
with linear bands of 3-ply thylakoids (Figures 3.14G, H and 3.15A) that typify the
chromophyte algae. Under the TEM, in most sections two chloroplast profiles were seen
(Figure 3.14G, H). Each lamella was made up of three closely adpressed thylakoids,
which always ran parallel to the long axis of the chloroplast. In this species there was no
girdle lamella running around the outer perimenter of the plastid (Figure 3.14G, Figure
3.15A). The plastid matrix contained granular ribosomes, which were particularly
clearly seen in the more electron-lucent regions where the thylakoids were less closely
packed (Figure 3.15A, black star). Also scattered throughout the chloroplast stroma
were small electron-dense plastoglobuli (lipid storage bodies) (Figure 3.14G). No
pyrenoid, grana-like stacks or starch grains were observed. The chloroplast was
surrounded by four closely adpressed membranes, which gave the plastid envelope its
characteristically electron-dense appearance (Figure 3.15A). The outer membrane was
the chloroplast endoplasmic reticulum (cER) and the inner membrane was the
chloroplast envelope.

98
The main cytoplasmic organelles were located in the centre of the cell (Figure 3.14G,
H). The central nucleus was spherical to ovoid in shape, although often had an irregular
profile in thin sectioned material (Figure 3.14G, H). Two mitochondrial profiles were
also present in the cell lying close to the chloroplast envelope and nucleus, near the cell
wall (Figure 3.14G, H and Figure 3.15C, E). Ribosomes were found in high density
throughout the cytoplasm (Figure 3.14G, H). Several cytoplasmic vacuoles which were
electron-lucent surrounded the nucleus (Figure 3.14G, H). Lipid globules were observed
in these actively growing cells (Figure 3.15D).
3.3.2.2 Ultrastructure of 14-day-old stationary phase cells
Nannochloropsis oculata from a 14-day-old stationary phase culture had a similar
overall appearance to those in actively growing cultures (e.g. Figure 3.14G, H) but had a
much altered cytoplasm (Figure 3.16A-D). The cytoplasm mean volume fraction of
stationary phase cells (mean = 15.9%, CI: (13.9, 17.9)) was significantly lower than the
mean volume fraction of log phase (mean = 18.7%, CI: (14.97, 21.7)). The nucleus
appearance showed no difference between the actively growing cultures (e.g. Figure
3.14G, H) and the stationary phase cells (Figure 3.16A-D). This was confirmed through
statistical analysis as there was no significant difference in median volume fraction of
stationary phase cells (median = 6.9%, CI: (4.09, 9.26)) and log phase cells (median =
4.5%, CI: (2.3, 7.6)) (Mann-Whitney test, Table 3.9, Figure 3.19). One of the most
obvious changes was that the homogeneous cell walls were thicker in stationary phase
cells (Figures 3.14 and 3.15), with a mean thickness of around 46 m, compared with
8.9 m in actively growing cells. The average total volume fraction of the cell wall in
stationary phase cells (mean =14.06%, CI: (12.8, 15.26)) was significantly different, at
nearly double that of active phase cells (mean = 7.2%, CI: (6.3, 8)) (t-test Table 3.8,
Figure 3.18).
In contrast, the mean volume fraction of the chloroplast was significantly reduced (t-
test, Table 3.8) in stationary phase cells (mean = 20.59%, CI: (14.99, 26.39)), compared
to active phase cells (mean = 57.4%, CI: (52.5, 62.3)) (Figures 3.16A-D and Figure
3.18, Table 3.8).
From the volume fraction analysis for chloroplast constituents, both thylakoid
membranes and matrix content of plastid decreased from 36.46% and 20.9% to 15.15%
and 5.25% respectively (Figure 3.18). The thylakoid membranes in some stationary

99
cells often appeared broader, with homogeneous contents, and their lamellae had fused
resulting in stacks of <6 thylakoids, as shown in Figure 3.17A. However, their volume
fractions decreased significantly in stationary phase cells which were (mean = 15.15%,
CI: (11.85, 19.25)) compared to active growth cells (mean = 36.4%, CI: (32.96, 39.96))
(t-test, Table 3.8, Figure 3.18). The mean volume fraction of matrix was significantly
decreased from 20.9% (CI: (17.5, 24.2)) in actively growing cells to 5.25% (CI: (3.45,
7.09)). The number of plastoglobuli remained statistically the same in stationary phase
cells (Figure 3.17A), compared to active phase ones (Figure 3.14G and Figure 3.19).
Mitochondria tended to be clustered around the nucleus (Figure 3.16C, D) and were
often irregular in shape (Figure 3.17B) but still packed with tubular cristae.
Mitochondrial median volume fraction of stationary phase cells (median = 4.49%, CI:
(2.49, 6.49)) was significantly lower than that of active phase cells (median = 8.3%, CI:
(6.01, 10.71)) (Mann-Whitney, Table 3.9, Figure 3.19). Stationary stage cells were
characterised by containing many more conspicuous vacuolar vesicles (Figures 3.16A,
B, and 3.17C-E) which contained rectangular inclusion bodies (IB) usually with fine
parallel lamellae (Figure 3.17C-E). These vascular vesicles were absent in the log phase
cells, which prevented the statistical analysis. In contrast, the cytoplasm of the log phase
cells contained more vacuoles than stationary phase cell cytoplasm. This was confirmed
statistically as the median volume fraction of active phase cells (median = 0.76%, CI: (-
0.6, 0.6)) was significantly higher than for stationary phase cells (median = 0%, CI:
(0.09, 0.09)) (Mann-Whitney, Table 3.9, Figure 3.19).
Stationary phase cells of N. oculata contained one large lipid globule or more
(Figure3.16 A-D, (L)) located near the nucleus which occupied around 28% of the cell
volume (Figure 3.19). The median volume fraction of the lipids significantly increased
(Mann-Whitney test, Table 3.9) in stationary phase cells (median = 28.25%, CI: (23.65,
32.85)), compared to active phase cells (median = 0%, CI: (-0.2, 0.2)) (Figures 3.16A-D
and 3.19, Table 3.9).

100
Table 3.8 : Results of t-tests of volume fractions of cytoplasm, cell wall, chloroplast,
matrix and thylakoid membranes and starch in Nannochloropsis oculata active and
stationary phase cells
Organelle t DF P
Cytoplasm 11.36 29 <0.001
Cell wall -9.59 50 <0.001
Chloroplast 23.67 29 <0.001
Matrix 12.42 29 <0.001
Thylakoid membrane 20.86 29 <0.001
Table 3.9: Results of Mann-Whitney tests of volume fractions of nucleus, lipid,
vacuoles, plastoglobuli and mitochondria in Nannochloropsis oculata active and
stationary phase cells
Organelle W N P
Nucleus
Active
861.0
30
0.429 Stationary 30
Lipid
Active 490
30 <0.001
Stationary 30
Vacuoles
Active
1169.0
30
0.0002 Stationary
30
30
Plastoglobuli Active
835.0 30
0.2398 Stationary 30
Mitochondria
Active
1075
30
0.0184 Stationary 30
Stationary 30

101
Figure 3.14: Nannochloropsis oculata cell structure under light and scanning electron
microscopy and exponential growing cells under electron microscopy
A-B) Light microscopy images of N. oculata showing coccoid cell shape. C)
Fluorecsent microscopy showing the choloroplast cup shape. Scale bar 10 m. D-F)
Scanning electron microscopy images showing the surrounding matrix (red arrow).
Scale bar 1 m. G-H) Transmission electron microscopy showing internal cell
organelles. Scale bar 0.5 m. Chl: chloroplast; M: mitochondria; N: nucleus; V:
vacuoles.

102
Figure 3.15: Higher magnification of the fine structure of exponentially growing cells
of Nannochloropsis oculata
A) Cross section showing the chloroplast structure. The chloroplast envelope
surrounded by two extra membranes of endoplasmic reticulum (red arrows) appears as a
thick membrane with high osmiophility. Thylakoids are in clusters of three membranes
(black arrows) and the matrix is indicated by a black star. B) Microbody surrounded by
two mictochondrial profiles which indicate a metabolically active cell, as the cell is in
the linear exponential growth phase. C) Higher magnification of a cross-section of
mitochondrial profile. D) Higher magnification of lipid body. E) Higher magnification
of a vertical section of a mitochondrial profile. Scale bars 0.5 m. IB: inclusion bodies;
M: mitochondria; mB: microbody; N: nucleus; V: vacuoles.

103
Figure 3.16: Nannochloropsis oculata stationary phase growing cells
A-D) The cell structure changes significantly as the lipid droplets occupy the vast
majority of cell volume and with the presence of inclusion bodies. The cell wall
becomes thicker. Scale bars 0.5 m Chl: chloroplast; CW: cell wall; IB: inclusion
bodies; L: lipid bodies; M: mitochondria; N: nucleus; V: vacuoles.

104
Figure 3.17: Higher magnification of fine structure of stationary phase growing cells of
Nannochloropsis oculata
A) Cross section showing the chloroplast structure, the chloroplast envelope surrounded
by two extra membranes of the endoplasmic reticulum and appears as a thick membrane
with high osmiophility. Thylakoids are condensed and backed onto each other in
clusters of 3-6 membranes (white arrows). B) Irregular shaped mictochondrial profile.
C-E) Higher magnification inclusion bodies that contain membranous structures. Scale
bars 500 m. Chl: chloroplast; CW: cell wall; IB: inclusion bodies; L: lipid bodies; M:
mitochondria; N: nucleus; Thy: thylakoid; V: vacuoles.

105
Figure 3.18: Mean and 95% confidence interval of volume fractions of the cell
organelles and chloroplast constituents in Nannochloropsis oculata log and stationary
phase samples
The volume fraction data for each organelle were subjected to a separate t-test. Stars
indicate significant differences between log and stationary phase volume fractions of an
organelle.

106
Figure 3.19: Median and 95% confidence interval fractions of cell organelles and
chloroplast constituents in Nannochloropsis oculata log and stationary phase samples
The significance of differences was tested using the Mann-Whitney test, P= 0.05. Each
pair represents a separate test. Pairs with stars show significant differences.

107
3.3.2.3 Ultrastructure of decadienal-treated cells
Two control samples were used; one treatment had no additions (indicated by 0 in tables
and Figures 3.28 and 3.29) (Figure 3.20A), while the second control had ethanol added
(Figure 3.20B-D).
The spherical cell shape was maintained (Figure 3.20A-D). The mean cell size was 3.5
m (ranging from 2.8 m to 4.3m) by 2.2 m (ranging from 1.5 m to 3 m) for the
untreated control and 3.5 m (ranging from 2.3 m to 5m) by 2.6 m (ranging from
1.8 m to 7.2 m) for the ethanol-treated control. Some cells in the ethanol-treated
suspension appeared to be surrounded by an additional outer wall layer (Figure 3.20B,
arrowed), which often occurs during internal autospore formation. The chloroplast
(Figure 3.20A-D) constituted approximately 50% of the volume fraction; 48% for the 6-
day-old control cultures and 45% in the ethanol-added control (Figure 3.29). The
overall volume occupied by the chloroplast showed no significant difference between
the two controls and all the decadienal-treated samples (Kruskal-Wallis test, Table 3.11,
Figure 3.29). In both control samples, the chloroplasts were packed with parallel arrays
of tightly stacked thylakoid lamellae, which constituted more than 30% of cell volume
fraction and with no significant differences in volume fraction in comparison to
decadienal-treated cells (Kruskal-Wallis test, Figure 3.16A-D, Figure 3.29, Table 3.11).
In control cells, the individual thylakoids were closely associated, and in sections the
three lamellae often appeared to be helically twisted around each other (Figure 3.21A,
C). In the ethanol-treated control (Figure 3.21E), the matrix appeared denser and the
thylakoid membranes often appeared to reveal a negative contrast. Small numbers of
electron-dense plastoglobuli were also scattered throughout the chloroplast (Figure
3.20A, B, D and Figure 3.21A-C). The matrix volume fraction of control samples was
statistically insignificant in comparison to that of decadienal-treated cells (ANOVA test,
Table 3.10, Figure 3.29).
The single nucleus was often located toward the margin of the cell (Figure 3.20A, D)
and was generally ovoid (Figure 3.20 A-D), but often with an irregular outline. An
electron-dense nucleolus was also found (Figure 3.20A). Mitochondria were ovoid or
capsule shaped (Figure 3.21B, D) and occasional looped profiles were seen (Figure
3.20A). They were packed with tubular cristae, although these were often difficult to
resolve against the granular matrix (Figure 3.21B, D). There was no statistically
significant difference between the median volume fraction of both nucleus and
108
mitochondria in control and decadienal-treated samples (Kruskal-Wallis test, Table
3.11, Figure 3.29).
Small electron-lucent vacuoles were also present in the cytoplasm of the cell (Figures
3.20C and Figure 3.21A). The only significant difference between the normal cells and
the culture to which 8.5 l of 99% ethanol had been added was the presence of lipid
bodies (Figure 3.16B- D), which occupied just under 10% of the cell volume (Figure
3.29).
Cells treated with decadienal all showed altered cell structure, although generally with
few significant differences in the overall volume fractions of the major cell components
(Figure 3.29). The only significant difference compared with the untreated controls was
an increase in lipid (Figure 3.29), but this was comparable to that observed when
ethanol was added on its own to the cultures (Figure 3.29). The Kruskal-Wallis test for
the volume fractions of lipids showed a significant difference (Table 3.11). The volume
fraction of lipid in decadienal-untreated samples (median = 0.0%, CI: (-2, 2)) was
significantly lower compared to all other treatments (ethanol, median = 8.3%, CI: (5.2,
11.7); 1 M, median = 6.6%, CI: (4.5, 9.3); 10 M, median = 6.5%, CI: (3.8, 9.2); and
50 M, median = 3.4%, CI: (0.2, 6.5) (Mann-Whitney test, Table 3.12).
The appearance of individual organelles was altered by the addition of increasing
concentrations of decadienal. The cells appeared to have an overall increased
cytoplasmic density, which often made discerning individual organelles more difficult
(Figures 3.22 and 3.27). Cell appearance was much more variable, and whilst some cells
looked healthy (Figure 3.22D), others appeared to be in advanced stages of degeneration
and autolysis with no clear cytoplasmic organelles (Figure 3.26E). Although some
micrographs showed evidence of cytoplasmic shrinkage (Figures 3.22C and 3.26D) the
statistical analysis showed that the volume fraction of cytoplasm in decadienal-untreated
samples (mean = 15.35%, CI: (12.8, 17.85) was significantly lower compared to
samples treated with 10 M decadienal (mean = 21.2%, CI: (18.5, 24.1)) and 50 M
decadienal (mean = 25.15%, CI: (21.6, 28.65)) (ANOVA test, Table 3.10, Figure 3.28).
Even cells treated with the lowest concentration (1 M) of decadienal contained many
membranous structures in their cytoplasm (Figure 3.23C, F), which were not observed
in either set of control cells. These structures appeared to be composed of concentric
whorls of membrane, and are thought to be elaborations of the vacuole system (Figures
109
3.23C, F; 3.25C and 3.27G). Cells contained vacuoles with osmiophilic inclusion
(Figure 3.23B, D; 3.25C and 3.27E, G). Some cells had detached cell walls (Figures
3.22A, C arrow and 3.26D, arrow) and the Kruskal-Wallis test for the volume fractions
of cell wall showed a significant difference (Table 3.11). The volume fraction of cell
wall in decadienal-untreated samples (median = 7.2%, CI: (6.4, 8)) was significantly
lower compared to treatments with ethanol (median = 8.7%, CI: (7.7, 9.8)), 1 M
decadienal (median = 8.9%, CI: (8, 9.9)) and 50 M decadienal (median = 7.9%, CI:
(6.5, 9.3) (Mann-Whitney test, Table 3.12).
One of the major changes that took place in higher levels (10 M and 50 M) of
decadienal was the increasing (but variable) disruption of the thylakoid membrane
system. The individual thylakoids seemed to have separated and simply formed a
continuous whorled array with the plastid matrix (Figures 3.21F, 23A-C, 3.24A-D and
2.25F). In general, it was much more difficult to discern the usual electron-dense
lamellar bands in decadienal-treated plastids. However, there was no significant
difference in thylakoid volume fractions between different treatments (Kruskal-Wallis
test, Table 3.11). Cells with 10 M decadienal showed numerous of membranous
structures in their cytoplasm (Figure 3.24A-D and 2.25C). Cells contained vacuoles
with membranous inclusion (Figures 3.22A, C and 3.23).

110
Table 3.10: Results of ANOVA tests on the effects of decadienal treatments on the
volume fractions of cytoplasm and matrix in Nannochloropsis oculata
Organelle DF F-statistic P
Cytoplasm 4 5.72 <0.000
145
149
Matrix 4 1.57 0.184
145
149
Table 3.11: Results of Kruskal-Wallis test of volume fractions of nucleus, mitochondria,
lipid, vacuoles, chloroplast, cell wall, plastoglobuli and thylakoid membranes in
Nannochloropsis oculata decadienal-treated cells
Organelle H DF P
Nucleus 5.23 4 0.264
Mitochondria 6.57 4 0.161
Lipid 31.9 4 <0.001
Vacuoles 3.7 4 0.448
Chloroplast 4.72 4 0.317
Cell wall 15.42 4 0.004
Plastoglobuli 5.93 4 0.431
Thylakoid membrane 3.21 4 0.524

111
Table 3.12: Results of Mann-Whitney tests for significant differences between volume
fractions of lipid and cell wall in Nannochloropsis oculata decadienal-treated cells
Organelle Tested
concentrations n W P
Lipid
0 M Vs E 30, 30 657 <0.001
0 M Vs 1 M 30, 30 591 <0.001
0 M Vs 10 M 30, 30 567 <0.001
0 M Vs 50 M 30, 30 675.0 <0.001
1 M Vs E 30, 30 891 0.725
1 M Vs 10 M 30, 30 913 0.982
M Vs 50 30, 30 986 0.292
10 M Vs E 30, 30 910 0.946
10 M Vs 50 M 30, 30 992.5 0.255
50 M Vs E 30, 30 853 0.354
Cell wall
0 M Vs E 30, 30 744 0.011
0 M Vs 1 M 30, 30 726 0.005
0 M Vs 10 M 30, 30 906 0.900
0 M Vs 50 M 30, 30 793 .0730
1 M Vs E 30, 30 949 0.620
1 M Vs 10 M 30, 30 1111 0.003
M Vs 50 30, 30 1004 0.190
10 M Vs E 30, 30 743 0.011
10 M Vs 50 M 30, 30 797 0.083
50 M Vs E 30, 30 849 0.332

112
Figure 3.20: Nannochloropsis oculata controls
A) Untreated control (0 decadienal) cells looks normal. B-D) Ethanol control cell
structures are similar to some decadienal-treated cells as the cell wall detached (red
arrow); lipid bodies and vacuoles present in large volumes. Scale bar 0.5 m. Chl:
chloroplast; G: Golgi; L: lipid bodies; M: mitochondria; N: nucleus; V: vacuoles.

113
Figure 3.21: Higher magnification of Nannochloropsis oculata cell organelles of both 0
M decadienal and ethanol control cells
A) Whole cells of 0 M decadienal. B) Mitochondrial profiles of 0 M decadienal. C)
chlroplast of 0 M decadienal. D) Vacuoles mitochondrial profiles of 0 M decadienal.
E) Chloroplasts of ethanol control cells. Scale bars 0.5 m. Chl: chloroplast; L: lipid
bodies; M: mitochondria; N: nucleus; Pl: plastoglobuli; V: vacuoles.

114
Figure 3.22: Nannochloropsis oculata cells treated with 1 decadienal
Red arrow shows detached cell walls. Visible membrane inclusion, vacuoles and lipid
bodies. Scale bars 0.5 m. Chl: chloroplast; L: lipid bodies; M: mitochondria; N:
nucleus; V: vacuoles.

115
Figure 3.23: Higher magnification of Nannochloropsis oculata cells treated with 1
decadienal
A) Section in a whole cell through the chloroplast amd showing mictochondria
surrounded by vacule and irregular-shaped lipid body. B) Vacuoles surrounded by
microbody which might be involved in lipid metabolism or cell detoxification. C)
Vacuoles with membranous inclusions. D-E) Mitochondrial profiles with altered and
condensed cristae. F) Vacuoles with membranous inclusions. Scale bars 0.5 M. Chl:
chloroplast; L: lipid bodies; M: mitochondria; mb: microbody; V: vacuoles.

116
Figure 3.24 : Nannochloropsis oculata cells treated with 10 decadienal
A-D) Thin sections of different cells showing the various signs af cell structutre
modification: the presence of lipid bodies, membranous inclusion with vacuoles,
increased vacuoles within the cytoplasm. Scale bars 0.5 m. Chl: chloroplast; L: lipid
bodies; M: mitochondria; N: nucleus.

117
Figure 3.25: Higher magnification of Nannochloropsis oculata cells treated with 10 M
decadienal
A) Detached cell wall (red arrow). B) Membranous invagination in nucleus. C) Lipid
bodies with various vacuoles in the cytoplasm. D-E) Mitochondrial profiles. F) The
individual thylakoids seem to have separated and simply formed a continuous whorled
array with the plastid matrix. Scale bars 0.5 m. Chl: chloroplast; L: lipid bodies; M:
mitochondria; N: nucleus; V: vacuoles.

118
Figure 3.26: Nannochloropsis oculata cells treated with 50 M decadienal
A-D) Thin sections of different cells showing the various signs of cell structure
modification: the presence of lipid bodies, membranous inclusion with vacuoles,
increased vacuoles within the cytoplasm, cytoplasmic shrinkage. Scale bars 0.5 m.
Chl: chloroplast; G: Golgi; L: lipid bodies; M: mitochondria; N: nucleus;V: vacuoles.

119
Figure 3.27: Higher magnification of Nannochloropsis oculata cells treated with 50 M
decadienal
A-C) Altered thylakoid structure, separated and simply forming a continuous whorled
array with the plastid matrix. C) Detached cell wall. D) Mitochondrial profile. E) Cell
with dark cytoplasm and vacule. F) Multivascular body in the proximity of the
chloroplast. G) Vacuoles with membranous inclusions. Scale bars 0.5 m. Chl:
chloroplast; mvb: multivascular body; V: vacuoles.

120
Figure 3.28: Mean and 95% confidence intervals of volume fraction of the cytoplasm
and matrix in Nannochloropsis oculata cells treated with deacadienal
Data for each organelle were tested with a separate ANOVA test (P=0.05).

121
Figure 3.29: Median and 95% confidence intervals of volume fraction of the cell
organelles in Nannochloropsis oculata cells treated with deacadienal
Data for each organelle were tested with a separate Kruskal-Wallis test (P=0.05).
Treatments with the same letters are not significantly different from each other (Mann-
Whitney test, P=0.05).

122
3.4 Discussion
It is well established that lipid accumulation in microalgae increases as the cells age and
enter the stationary phase, generally as a result of stressful environmental conditions
(Hu et al. 2008; Sharma et al. 2008). Eyden (1975) concluded that lipid accumulation in
ageing or stationary cultures could be explained on the basis that exponentially growing
cells use all lipids synthesised in the formation of new membranes, whilst in cells in
stationary phase, the synthesised lipids are accumulate in lipid bodies.
Exposure to certain infochemicals such as decadienal are also known to lead to faster
lipid accumulation (Taylor et al. 2012) and to changes in the life cycle of some
organisms (Caldwell et al. 2002, 2004; Adolph et al. 2004; Ribalet et al. 2007; Taylor et
al. 2007). Therefore, a main objective of this study was to investigate the effect of
decadienal on lipid production and cell ultrastructure in two microalgal species,
Dunaliella salina and Nannochloropsis oculata; both of which are cited as potential
candidates for biofuel production (Sharma et al. 2012). A comparison was also made
between naturally senescent stationary cells and cells treated with decadienal, to
determine if the main effect of this compound was simply to induce premature
senescence. The results of this study are discussed with reference to three main themes:
comparing the ultrastructural differences between active and stationary phase growing
cells in relation to the existing literature for the species studied; discussing the effects of
decadienal on lipid production; and, finally, discussing the effects of decadienal on
ultrastructure.
3.4.1 Ultrastructural differences between actively growing and stationary cells
3.4.1.1 Dunaliella salina
3.4.1.1.1 General morphology
Although describing features of taxonomic interest is not the primary aim of this
chapter, some of the differences in ultrastructure observed in this study of D. salina and
previously published studies will be highlighted. Dunaliella classification is based on
physiological and ultrastructural differences between different species. Previous
ultrastructural studies of Dunaliella are comparatively few and they are secondary
resources. They depend on the earliest intensive revision of Dunaliella taxonomy by
Massyuk in 1973 (in Borowitzka and Siva 2007). This was originally written in Russian
and summarized by Ginzburg (1987) and Preisig (1992). Borowitzka and Siva (2007)

123
revised the traits used to classify Dunaliella by studying all the isolates available to
them.
According to Ginzburg (1987), the genus Dunaliella has two groups with different cell
forms, which he gave species level assignation. The first is represented by Dunaliella
salina, which has rounded cells and is reddish or orange in colour (due to carotenoid
accumulation); the cell axes are 10-20 m long. These cells move slowly and the two
flagella are short relative to cell length (Ginzburg 1987). When grown at low light
intensities, the cells lose their carotenoid colouration, making the green chloroplast
visible. D. salian chloroplast volume occupies no more than half of the cell volume
(Ginzburg 1987). The second type of cells is represented by Dunaliella viridis, which
are cylindrical to ovoid in shape and coloured green (Ginzburg 1987). The two flagella
are attached to the front of the cell and point backwards and they are usually longer than
the cell length (Ginzburg 1987). Cells measure 3-5 m by 6-8 m and are similar to the
green cells referred to as chlamydomonads, or of the Volvocalean type. These cells
move comparatively quickly. The chloroplast appears to occupy most of the cell body
(Ginzburg 1987).
The strain D. salina CCAP 19/30 used in this present study showed morphological
features shared by both D. salina and D. viridis as defined by Ginzburg (1987) and D.
bioculata reported by Borowitzka and Siva (2007). Firstly, the cell shape varied from
rounded to cylindrical to ovoid. Secondly, the cell length was closer to D. salina, as it
measured from 10-20 m. Thirdly, the chloroplast occupied most of the cell body,
which is a feature of D. viridis. Finally, the flagellar length was larger than cell length,
which is different from the finding of Borowitzka and Siva (2007). They found that D.
salina CCAP 19/30 had a flagellar length shorter than the cell length. Further, they
found D. bioculata cells to have flagella 1.5-2 times the cell length (Borowitzka and
Siva 2007). In addition, they described D. salina species that had green to dark red cells,
which accumulated -carotene as a droplet in the chloroplast stroma, and their flagella
length was approximately equal to cell length. This study showed that the D. salina
CCAP 19/30 flagella were 1.6 times the cell length (similar to D. bioculata) and were
always green, wide from the posterior end and gradually narrowing towards the anterior
end. These are all characteristics of D. bioculata as reported by Borowitzka and Siva
(2007).

124
These differences in morphological features may be due to a number of reasons. One
factor could be the validity of the feature chosen to identify or classify the species. As
mentioned previously, the flagellar length was varied in this present study from that in
the literature. This could indicate it was not a stable feature to consider or there was
misidentification in the culture collections. The flagellar length could be unreliable
because observations were based on limited samples and isolates and there was not
much detail in the literature about their materials and methods. Therefore, it is possible
that the flagellar length could be either intraspecific (different within the species itself)
or interspecific (different between different species). However, because of the scarcity
of data this could not be unequivocally confirmed. Another reason for this variation
could be cultural misidentification. In support of the claim of misidentification, the
molecular studies by Gomez and Gonzalez (2004) indicated that there was genetic
diversity which supported the observed physiological diversity within the studied strains
of D. salina, indicating that more than one species could be found among them. This
diversity could reflect on ultrastructure. This might explain the difference described in
this study and the literature. However, the present wriyter does not have genetic
information regarding the strains used in ultrastructural studies.
3.4.1.1.2 Chloroplast structure and lipid reserves
The differences between the present findings and previous work might be due to
different culture conditions and age. This could be demonstrated by the effect of age
and stress factors affecting the plastid organization and cellular lipids location in the
cell. The internal cytoplasmic organisation of 10-day-old active phase D. salina cells
revealed a structure similar to that previously described for this species (Preisig 1992).
Chloroplast structure of 14-day-old stationary cells had noticeable ultrastructural
changes in the stationary phase cells. However, Leonardi and Caceres (1994) showed
that the lamellae (of their stationary phase cells) were made up of 2 to 9 thylakoids.
These findings match this study of actively growing cells. Leonardi and Caceres (1994)
used a 7-day-old culture as stationary phase cells and 4-day-old culture as actively
growing cells (leaner). In addition, Leonardi and Caceres (1994) showed that the
chloroplast in stationary phase cells was filled with lipid globules and only the pyrenoid
was surrounded by 1 to 2 layers of starch plates. In this study, stationary phase (14-day-
old) chloroplasts were mostly occupied by starch granules, resulting in the thylakoid
membranes becoming densely compacted. The lipid globules were largely in the
cytoplasm, rather than in the plastid stroma. Further, the strain of Leonardi and Caceres

125
(1994) was a brackish water strain, while in this study F/2 media with a salinity of sea
water was used. Borowitzka and Siva (2007) reported that the Dunaliella chloroplast
was smooth and changed to a granular appearance due to starch accumulation, as a
result of being stressed by higher salinities and/or the ageing of the culture, as found in
this study. However, they did not mention if their findings were based on laboratory
grown cultures. However, in the same paper, they presented micrographs resembling
field samples that show lipid globules in the chloroplast, which contradicts their
statement. This variation could be due to the culturing system, as the laboratory
culturing conditions result in the presence of starch in the chloroplast with ageing, while
in natural environment lipids are synthesised instead of starch due to limited carbon
availability and the differences of light intensity (Stoynova-Bakalova and Toncheva-
Panova 2003; Su et al. 2011). Furthermore, lipid accumulation in the eyespot increased
with age, the number of eyespot lipid droplets doubling between log and stationary
phases (Ginzburg 1987; Preisig 1992). In this present study there was no doubling in
droplet number between exponentially growing and stationary phase cells, but their size
did double (250 nm cf 125 nm) (Figure 3.6E and F).
Another lipid containg structure, which appears to be of taxonomic significance, is the
prominent red eyespot or stigma (Hoshaw and Maluf 1981). The stigmata of D.
tertiolecta and D. primolecta seemed to lie free in the chloroplast matrix, whereas in D.
bioculata and D. salina they were more closely associated with the chloroplast lamellae.
This present study showed that the stigma lipids of D. salina CCAP 19/30 occurred
between closely adpressed chloroplast thylakoids, which is similar to the observations
of Preisig (1992), being located within the anterior and peripheral part of the chloroplast
in both exponential and stationary phase cells. This is consistent with the findings of
Leonardi and Caceres (1994) but contradicts those of Melkonian and Preisig (1984),
who only found the eyespot sporadically and, when found, it was only one layer of lipid
globules. Eyden (1975) reported that the eyespot of D. primolecta was plate-like and
occured in the matrix, being composed of 1 or 2 layers of closely packed lipid globules
100-200 nm in diameter. The eyespot of D. tertiolecta also lay in the matrix, but in D.
salina it was connected with the thylakoids (Preisig 1992). Ginzburg (1987) reported
that the eyespot was made up of one or two rows of lipid globules and its presence
differed between strains.
Hoshaw and Maluf (1981) also described some differences in characteristics between
log and stationary phase cells. Lipid droplets accumulated in the cytoplasm. The

126
osmiophilicity of cytoplasmic lipid droplets was different from that of the chloroplast.
This variation in osmiophilicity could be as a result of the variable effects of growth
phase on lipid composition and yield (Dunstan et al. 1993; Brown et al. 1996; Lv et al.
2010). In stationary phase cells, the plastid thylakoids were stacked in 8 to 10 layers and
were tightly compacted, compared to those in exponentional phase cells. In the latter,
the thylakoid stacks were typically composed of only 2 to 4 layers. Finally, amounts of
both starch and lipid increased in stationary compared with exponential phase cells.
Whilst Hoshaw and Maluf (1981) found that starch deposits only increased slightly, the
number of lipid droplets increased twofold. However, they did not quantify these
changes as done in this present study.
Another explanation is that the presence of oil or starch in the Dunaliella chloroplast or
cytoplasm could be a species-specific (intraspecific) characteristic. Ginzburg (1987)
reported that in D. tertiolecta starch increased in the stationary phase and chloroplasts
contained oil droplets which were not as conspicuous as in D. salina. Eyden (1975)
reported that the chloroplast of stationary phase cells in D. primolecta also had very
large and numerous starch granules. Preisig (1992) reported that the starch grains,
which were plentiful in older cultures, encased the pyrenoid and were also found at
other sites in the chloroplast. In exponentially growing D. primolecta cultures, lipid
inclusions were sparsely scattered (Eyden 1975) throughout the chloroplast which had
interconnected groups of thylakoids in a fine granular matrix. Furthermore, the
refractive granules (probably representing intracellular lipid) were considered to be
amongst the most stable Dunaliella species characteristics (Butcher 1959; in Hoshaw
and Maluf 1981). For example, in D. tertiolecta the granules were present in the
cytoplasm and considered one of its main distinguishing features (Hoshaw and Maluf
1981). It is well known that both D. salina and D. parva accumulate large quantities of
β-carotene in oily globules within the inter-thylakoid spaces of the chloroplast, which
changes the cell colour to orange-red (Preisig 1992). This was not seen in the current D.
salina strain (CCAP19/30).
3.4.1.1.3 Other cell organelles
There are certain cytoplasmic organelles which develop ultrastructural features changed
by age and cannot be related to specific species. Rather, they with concerned to a
physiological function such as enabling survival in poor conditions in the exponential
growth phase or in stressful conditions. Examples of these organelles are mitochondria,

127
Golgi and vacuoles. Melkonian and Preisig (1984) and Leonardi and Caceres (1994)
noted that both exponential and stationary phase cells contained a single branched
mitochondrion. In the present study, the mitochondria profiles were always located
between the chloroplast and nucleus, although without serial sectioning it could not be
ascertained whether or not these represented a single branched organelle. Ginzburg
(1987) and Preisig (1992) reported the presence of mitochondrial profiles in other parts
of the cell, such as in proximity to the basal bodies and in more peripheral positions
between the chloroplast and the plasmalemma. Vladimirova’s study in 1978 (in
Ginzburg 1987) reported that the mitochondrial profiles were surrounded by extensions
of the chloroplast membrane, which was never observed in this study. The 1989 study
by Klut et al. (in Preisig 1992) showed that the number and size of mitochondria may
vary among cells at different stages of growth (Preisig 1992). In this present study, 2
Golgi dictyosomes were found in both active and stationary phase cells, as described by
Melkonian and Preisig (1984). In contrast, Leonardi and Caceres (1994) reported that
the Golgi apparatus was always made up of 3 dictyosomes in young cells and 6 to 8
dictyosomes in older cells. However, stress conditions may affect the Golgi apparatus in
different ways. In this present study it was noted that the number of cisternae in a single
Golgi dictoysome in stationary cells exceeded that of actively growing cells. Stoynova-
Bakalova and Toncheva-Panova (2003) considered that the Golgi usually appeared to be
rather non-functional in D. salina stressed cells and there were fewer in number
compared with D. bioculata. Under UV-B radiation, the cisternae in Golgi dictyosomes
became loosely associated (Tian and Yu 2009).
In this present study it was observed that vacuoles were present in both active and
stationary phase cells of D. salina, and although there was no significant difference in
volume fraction their ultrastructure differed markedly. Active phase vacuoles were
electron-lucent while stationary phase vacuoles contained electron-dense granules, as
has been illustrated in stationary phase vacuoles in many green flagellates (Dodge
1973). This was also reported by Eyden (1975), who noted that the vacuoles contained
either mitochondria or cytoplasm and ER; however, these may have been fixation
artefacts. Electron-transparent vacuoles have been described in exponentially growing
cells in D. primolecta (Eyden 1975), D. viridis (Anghel et al. 1980; in Parra et al. 1990)
and D. salina (Leonardi and Caceres 1994). Hoshaw and Maluf (1981) showed an
increase in vacuole number in stationary phase cells. Many studies have reported that
the vacuolar content of exponential phase cells was quite variable, ranging from

128
granular and thread-like material to concentric arrays of membrane (Trezzi et al. 1964;
in Hoshaw and Maluf 1981; Marano-LeBaron and Izard 1972; in Visviki and Rachlin
1994a); but, again, these may be fixation artefacts. Despite the nature of vacuolar
inclusions in most organisms being poorly understood, it has been reported that
stationary phase cell vacuoles often contained a compact, dark-staining material
surrounded by numerous small vesicles and they might contain small lipid-like granules
(Preisig 1992). However, this present study showed that the stationary phase cell
vacuoles had only a compact, dark staining material with no vesicles.
3.4.1.2 Nannochloropsis oculata
3.4.1.2.1 General morphology
There have been very few previous ultrastructural studies on Nannochloropsis oculata,
and most published studies describe other species in the genus. The cells of
Nannochloropsis are only 2-4 µm in size and were originally considered to be related to
Chlorella in the Chlorophyceae (Droop 1955; in Maruyama et al. 1986). However,
Hibberd (1981) placed Nannochloropsis in the Eustigmatophyceae, within what are now
defined as the Ochrophyta clade of algae. Even with the advent of electron microscopy
the cells proved difficult to fix and had relatively few non-ultrastructural anatomical
characteristics (Hibberd 1981). Karlson et al. (1996) described the ultrastructure of N.
granulata using a much improved fixation protocol. This species had globose cells
which contained one to two chloroplasts, a mitochondrion with tubular cristae, and a
nucleus. The cell wall was thin and appeared to consist of a single electron-dense layer.
However, Mohammady et al. (2005) reported that N. salina cells had a multi-layered
cell wall, which appeared to be covered by an irregular network of rib-like structures.
This present study showed that N. oculata CCAP849/1 had a rounded to globose cell
shape and its cell wall consisted of a single electron-dense layer similar to N. granulate
(Karlson et al. 1996) and not N. salina (Mohammady et al. 2005).
3.4.1.2.2 Chloroplast morphology and structure and lipid reserves
Nannochloropsis has a single chloroplast with three thylakoid lamellae, which is a
typical feature of chromophyte algae (Antia et al. 1975). The occurrence of pyrenoids is
problematic as they were not detected in N. oculata (CCAP849/1) by Maruyama et al.
(1986) but were described in an earlier study by Antia et al. (1975). Further, no girdle
lamella or pyrenoids were observed (Antia et al. 1975). However, another feature of N.

129
oculata that differs from those of typical chromophytes is the absence of a chloroplast-
associated endoplasmic reticulum (Hibberd and Leedale 1972). Neither pyrenoid nor
girdle lamella were observed in N. oculata CCAP849/1 in the present study.
Solomon et al. (1986) reported few inclusions in the stationary phase chloroplast and
lipid droplets present in both exponentially and stationary growing populations. Lipid
droplets were adjacent to mitochondria. Vesicles with finely lamellate contents as
reported by Solomon (1985) were also seen in the results of the present study. The
presence of membrane-bound lamellate vesicles in the cytoplasm of stationary phase N.
oculata (CCAP849/1) cells is a characteristic shared with other eustigmatophytes
(Hibberd 1981). The present writer did not observe any lamellate vesicles in the
chloroplasts of N. oculata, contrary to reports of lamellate inclusions within the plastids
in N. oculata and N.salina (Antia et al. 1975), but in this study lamellate structures did
occur in the cytoplasm. However, it is not clear whether these represent homologous
structures.
Cells are typically surrounded by multiple layers of an electron-lucent substance
(Solomon et al. 1986). Mohammady et al. (2005) also reported that in N. salina the
plastid thylakoids consisted of groups of three and the stroma contained plastoglobuli
(lipid bodies). There were no girdle lamellae. However, in this species they reported that
the chloroplast was associated with a stalked pyrenoid penetrated by thylakoids. Under
light microscopy, the eyespots in N. oculata were observed in this present study and this
appears similar to what Droop (1955; in Maruyama et al. 1986) described as a circular
pale orange-red stigma. When viewed at certain angles it appeared to be present in the
chloroplast, but generally appeared as a free body in the cytoplasm. Antia et al. (1975)
reported “copious cytoplasmic lipid accumulation” in ageing cells of N. oculata.
3.4.2 Effects of decadienal and culture age on lipid accumulation in Dunaliella
salina and Nannochloropsis oculata
A major aim of this chapter is to investigate the effects of decadienal on cell
ultrastructure and lipid production following on from the study of Taylor et al. (2012).
The effects of decadienal on cell structure of D. salina and N. oculata has been
described after subjecting these two organisms to different decadienal concentrations as
described in section 3.2.2. The assumption is that decadienal can trigger cells to shift
from normal growth phase to stationary phase quickly. This was investigated through
comparison of the ultrastructure of stationary phase cells and the decadienal-treated

130
cells. In this present study, both ultrastructural changes and the volume fractions of the
stationary phase cells were different from decadienal-treated cells. The stationary phase
cells of D. salina had an increased volume fraction of both lipid bodies (7.1%) and
starch (41.1%) and decreased thylakoid membranes volume fraction (19.1%). The low
decadienal concentration (2.5 M) did not trigger lipid production and did not differ
from the actively growing cell ultrastructure. There was no significant difference in cell
organelle volume fractions between 2.5 M decadienal-treated and untreated control (0
M decadienal-treated) cells, except for a significantly higher thylakoid membrane
volume fraction in control cells. In contrast, the higher concentration (50 M) resulted
in more lipid globules in the cytoplasm, but did not affect starch volume fraction in D.
salina and vesicular bodies volume fraction in N. oculata. In addition 50 M decadienal
decreased the volume fraction of nucleus, mitochondria and matrix in D. salina. The N.
oculata cell treated with ethanol and decadienal had a significant increase in lipid
bodies and cell wall fraction volumes (which might be attributed to either decadienal or
ethanol or their synergistic effects). Although, there was a significant increase in cell
wall volume fraction within 50 M decadienal-treated cells of N. oculata compared
with untreated cells, this was still much lower than that in normal stationary phase cells
(the mean cell wall volume fraction of stationary cells was 14%, whereas for the highest
decadienal treatment it was 9%). Increasing cell wall volume is a general mechanism to
adapt to harsh conditions (Fogg 2001). It should also be remembered that the cell wall is
an important cytological factor to consider in biofuel production as it can make cells
difficult to break and lipid extraction difficult. These observations suggested that
decadienal does not trigger the cells of D. salina and N. oculata to shift from the normal
growth phase to stationary.
On the other hand, the ultrastructural changes induced by decadienal indicated here
cytoplasmic changes similar to those induced by other types of stressors. The stressors
are divided into physical and mechanical factors such as visible radiation, UV-
radiation, temperature osmotic pressure and desiccation. The other types of factors are
nutritional and biochemical such as nutrient (N, P, C) deficiency, pH and toxic
substances. Lipid production is a general response mechanism that is caused by several
factors. The response mechanism is different and depends on the type of stressor,
exposure period and concentration. Lipid production has been reported in D. tetriolecta
cells grown in allantoic acid to develop frequently, in contrast with cells grown in
nitrate, urea or hypoxanthine (Oliveira and Huynh 1989) and in nitrogen depleted

131
conditions (Mendoza et al.1999). Similarly, subjecting D. salina to UV light also
triggered lipid globule formation (Tian and Yu 2009). These stress factors produced
lipid granules similar to those revealed by this study. However, previous studies did not
include any volume fraction measurements.
Cells treated with low concentrations (2.5 M) showed only minor effects on the major
cell organelles. In contrast, cells treated with the high concentration (50 M) showed
more significant but variable changes to cell structure. Exposing D. salina to 50 M
decadienal resulted in some cells remaining intact and maintaining their ovoid shape,
whilst others became more rounded and other cells lysed. This variation in response was
reported in the response of Dunaliella to salinity (Stoynova-Bakalova and Toncheva-
Panova 2003). Further, Stoynova-Bakalova and Toncheva-Panova (2003) reported the
formation of lipid globules in D. salina when stressed by 220 mol m-2 s-1 irradiance.
However, in their study the droplets were of different sizes and electron-densities
(osmiophility) compared with cells growing normally. Although these lipid droplets
were found in the cytoplasm, they were mainly located under the plasma lemma
(Stoynova-Bakalova and Toncheva-Panova 2003). The authors attributed the production
of lipid globules under the plasma membrane to the cell defence mechanism, which
forms a layer that prevents high irradiation from damaging the cells. In comparison, the
results of the present study showed that lipid globules formed following exposure to 50
M decadienal were uniformly electron-dense and had variable sizes. These results
suggest that lipid induction from irradiation differs from lipid induction from
decadienal.
Furthermore, lipid globules in D. salina have been reported to be formed under
carotenogenic conditions such as high light intensity and salinity nutrient starvation
(Ben-Amotz et al. 1982; Rabbani et al. 1998). More recently, carotene accumulation
in D. salina caused by different stress factors was studied by Lamers et al. (2010). They
studied eight stress combinations in batch experiments, of which five combinations
resulted in increased -carotene levels. carotene production was induced by high
light intensities, even if accompanied by other factors such as high salinity, low
temperature and nitrogen depletion. However, only the low light intensity when
combined with nitrogen depletion induced carotene production. Also, Alhassan
(1987) reported that elevated salinity induced numerous, small lipid globules in the cell
periphery. The carotenoid lipid globules differed in size, location and number from

132
those triggered by decadienal, as they were found in the cytoplasm, were larger in size
and fewer in number. This supports the earlier premise that ultrastructure variations
could be due to age and cultural conditions (section 3.4.1.1.2).
An example that supports the premise that the cellular response mechanism varies under
different conditions, even to the same stressor, is the study by Visviki and Rachlin
(1994a). In their study, lipid production in D. salina in response to copper and cadmium
was dependent on time and concentration. Acute exposure of Dunaliella to 4.55 M
Cd++ resulted in increased relative lipid volume by 91.7%, significantly increased cell
volume, and decreased relative nuclear volume. In contrast, combining copper and
cadmium decreased the relative lipid volume by 68.3%, with no changes in the mean
total cell volume or relative nuclear volumes. In addition, constantly exposing
Dunaliella to 4.9 x 10⁻⁴ mM copper and 4.5 x 10⁻⁶ mM Cd resulted in significantly
increased relative lipid volume (211.7% and 143% respectively). Although lipid
production increased, the overall culture growth decreased (Visviki and Rachlin 1994b).
These results resemble the decadienal results, which showed increased lipid production
at 50 M but not in 2.55 M treatment (The increase is 72% from control). Decadienal
also reduced culture growth (Taylor et al. 2012). In the case of N. oculata, the increase
in the lipid volume fraction was 840% for the ethanol control, 690% for 1 M
decadienal, 650% for 10 M decadienal, and 340% for 50 M decadienal, suggesting
that ethanol could also be used as a stress factor and that decadienal may potentially
interfere with its effect. Ethanol has been reported to increase phospholipid production
in Chlamydomonas eugametos gametes (Musgrave et al. 1992).
Another example that support the premise the cellular response mechanism varies under
different conditions is the study by Solomon et al. (1986), which reported increased
cytoplasmic and chloroplast lipid droplets as a result of nutrient starvation in N. salina.
The chloroplast lipid droplets were more electron dense than those in the cytoplasm. In
addition, the presence of vesicles within the chloroplast disrupted the thylakoid
arrangement, and lipid droplets were surrounded by crystalline structures in some cells.
These structures were not found in this present study, which showed decadienal induced
lipid bodies in the cytoplasm only in the case of N. oculata. In addition, they reported
that the mitochondria were in close association with the lipid droplets and chloroplasts,
suggesting close metabolic relationships between these organelles (Solomon et al.
1986).

133
Although decadienal resulted in the accumulation of lipid globules in active growth
cells, the amount of lipid did not approach that observed in the stationary phase cells.
The lipid volume fraction of 50 M decadienal-treated cells was 10% of the lipid
volume fraction of the stationary phase D. salina cells. For N. oculata, the lipid volume
fraction in the stationary phase was 28% and decadienal-treated cells had a lipid volume
fraction of 3.4%. However, these values are the volume fraction of lipid bodies only, in
contrast to chemical extraction methods that quantify the total lipids in the cell,
including membrane lipids. Therefore, the volume fraction of thylakoid membranes in
the decadienal-treated cells was similar to untreated cells, approximately constituting
30% of cell volume of both D. salina and N. oculata. These findings suggest that
decadienal did induce the production of pure lipid bodies (TAGs) in the cytoplasm of an
actively growing cells, which supports the findings of Taylor et al. (2012). This is
consistent with the results reported regarding other environmental factors that can affect
lipid production (Boussiba et al. 1987; Roessler 1990; Thompson 1996; Khozin-
Goldberg et al. 2002; Zhekisheva et al. 2002; Guschina and Harwood 2006;
Solovchenko et al. 2008). However, the volume fraction of lipid bodies induced by
decadienal suggests that it did increase the lipid bodies volume (which contains a pure
lipid, that will facilitate lipid extraction), but not in quantities that exceed the normal
lipid production rate of normal elderly cells. Therefore, decadienal would not be a
suitable lipid inducer for a cost-effective lipid extraction plant.
It was hoped that volume fractions of lipid in cells determined by electron-microscopy
could be related to actual levels of lipids in cells (by dry mass). However, in the absence
of quantitative analysis of lipids in the cultures that were fixed for electron microscopy,
it was found that it was not practical to undertaken this.
3.4.3 Effect of decadienal on other cell organelles of Dunaliella salina and
Nannocloropsis oculata
The present detailed ultrastructural study showed that when D. salina cells were
exposed to an increasing dose of decadienal, increased cell damage and lysis were
found. This is the first study to document the effects of decadienal on cell ultrastructure
in D. salina and N. oculata. The knowledge of how decadienal affects algal cells is
incomplete, decadienal has variable effects depending on the eukaryotic cell being
tested. For example, it is toxic to liver and kidney cells (Hageman et al. 1991) but
apparently increases the number of gastrointestinal epithelial cells (National Toxicology

134
Program 1993). Decadienal has been reported to trigger programmed cell death (PCD)
or survival pathways in human cells (Sansone et al. 2014) and is reported to have
irreversible effects due to covalent modifications of proteins or DNA (van Iersel et al.
1997; Ishii et al. 2003). Decadienal can break DNA strands by oxidative damage and
adduct formation (Nappez et al. 1996; Young et al. 2010). Membrane blebbing is
reported only in high concentrations in copopod embryos (Hansen et al. 2004).
Furthermore, it disrupts tubulin organisation and cell spindle formation during cell
division (Buttino et al. 1999). In addition, it is also reported as genotoxic (Hansen et al
2004; Romano et al. 2010), and high doses induce oxidative stress and ROS production
in immortalized BEAS-2B (a human lung cancer cell line) (Chang et al. 2005) and
oxidative DNA damage in A549 cells (another human lung cancer cell line) (Wu and
Yen 2004). Since D. salina and N. oculata are eukaryotic cells any of the previously
mentioned effects could occur. In the following, the possible effects based on the
ultrastructural features reported in this present study will be discussed, supported by the
evidence available in the literature.
This study suggests that decadienal is toxic to D. salina and N. oculata as it generates
cell morphological changes that resemble PCD. However, the mechanism of PCD can
only be confirmed by both the ultrastructural changes and the specific biochemical
inhibitors and activators that induce them and this study was limited to ultrastructural
analysis. Therefore, drawing firm conclusions about the precise PCD mechanism
invoked by decadienal is difficult. However, comparing the results here with
information present on the effects of decadienal on other eukaryotic cells may prove
helpful through determining the ultrastructural characteristics of different PCD
mechanisms (since different PCD mechanisms have unique ultrastructural features)
(Table 3.13). PCD is a universal biological phenomenon that has been identified in both
multicellular and single cell organisms with the same characteristics (Ameisen 2002). It
is a highly controlled process through which cells control their death in response to
injury, although it is often difficult to distinguish the different types of PCD and, despite
having specific and clearly defined characteristics, even apoptosis can be difficult to
recognise in cell model systems (Vaux 1999). Table 3.13 lists the types of PCD and
their signs and characteristics. In spite of this difficulty, a normal apoptotic-like PCD
pathway has been widely reported in vascular plants (Greenberg 1996; Pennell and
Lamb 1997; Lam et al. 2001) as well as in some unicellular eukaryotic organisms such
as chlorophytes (Berges and Falkowski 1998; Segovia et al. 2003; Segovia and Berges

135
2005), dinoflagellates (Vardi et al. 1999; Dunn et al. 2004; Franklin and Berges 2004),
diatoms (Casotti et al. 2005), yeasts (Frohlich and Madeo 2000), and kinetoplastids and
slime moulds (Cornillon et al. 1994). It has even been described in prokaryote groups
such as bacteria (Lewis 2000) and cyanobacteria (Berman-Frank et al. 2004). This
almost universal occurrence of PCD suggests that the origin of programmed cell death
is very ancient (Berman-Frank et al. 2004). Therefore, any one of D. salina and N.
oculata could have this mechanism. However, how PCD has evolved in unicellular
organisms is controversial (Deponte 2008).

136
Table 3.13: Programmed cell death mechanisms, their signs and mediator with the key
reference
PCD Signs Mediator
Necrosis
Identified by Rudofi Virchow
(Linkermann and Green 2014)
Cell swells, incomplete
degradation of plasma membrane
Passive process, not being
controlled by genes (Bredesen
2007)
Apoptosis Cytoplasmic shrinkage occurs but
the cell remains surrounded by an
intact plasma membrane
Gene-directed mechanism
controlled by an energy-
dependent process (Strasser et
al. 1994; Martin et al. 1995;
Gottlieb et al. 1996; Zhai et al.
1996)
Paraptosis Characterized by cytoplasmic
vacuolization and mitochondrial
swelling in the absence of caspase
activation or nuclear changes such
as pyknosis (chromatin
condensation followed by nuclear
fragmentation) and DNA
fragmentation
Mitogen-activated protein
kinases (MAPKs) (Sperandio
et al. 2000, 2004)
Autophagy/vacuolar-like cell
death
Characterized by the degradation
of target organelles (damaged
mitochondria; aggregates of
misfolded proteins) within the
lysosomal vacuolar system
without loss of cell integrity as
the plasma membrane remains
intact. Nuclear degradation and
pyknosis perhaps be also occurs
during this process (Jones 2000)
Lysosomal degradation pathway because of the
evidence from similar
lysosome-like organelles in
plants (Swanson et al. 1998)

137
Various PCD mechanisms could be induced by decadienal, one could be apoptosis. In
this present study of D. salina, the integrity of the plasma membrane was maintained,
and there appeared to be no significant cell shrinkage due to leaking cell contents. Both
of these features are considered as hallmarks of apoptosis (Lennon et al. 1991). In
addition, the cells of D. salina exposed to decadienal showed the condensation and
margination of heterochromatin in their nuclei. However, some of the other
ultrastructural hallmarks of apoptosis seen in animal cells, such as membrane blebbing,
and the formation of apoptotic bodies, were not seen (Bredesen 2007).
D. salina appeared to show mitochondrial lysis despite other organelles remaining
intact. This may indicate that decadienal could have induced intrinsic (mitochondrial-
initiated) apoptosis-like PCD. If this was the case, then had the cultures been given
sufficient time the nucleus would have lysed, followed by the full cell. There are various
studies that support this premise. Decadienal induces the release of calcium transients
and the generation of free radicals (Vardi et al. 2006). Vardi et al. (2006) reported that,
in diatoms, decadienal stimulated a dramatic increase in intracellular calcium that
persisted for several minutes. These authors suggested that this was a signalling
pathway by which decadienal induced cell death in diatoms. First, the diatom perceives
the decadienal and this is followed by changes in intracellular calcium that may activate
a plant-type NOS to subsequently generate NO. The reactive oxygen species are known
to participate in various biological processes, such as apoptosis and DNA damage
(Wiseman and Halliwell 1996; Ren et al. 2001). In addition, it has been reported that in
animal cells (Jones 2000) and in plants (Levine et al. 1994) high levels of calcium will
lead to the release of cytochrome c, and, in turn, this will cause ROS generation,
causing the mitochondria to start PCD. From this present study, it also appeared that
lysis first started in the mitochondria. Decadienal is known to induce reactive oxygen
stress (Chang et al. 2005), which, in turn, triggers mitochondria to become PCD-
inducing organelles in unicellular microalgae (Jones 2000).
The presence of extracellular signal-regulated kinase (ERK) in Dunaliella (Jimenez et
al. 2004) may provide another mechanism for PCD induction. Since both D. viridis
(Jimenez et al. 2004) and mammalian cell (Jimenez et al. 2007) division is regulated by
extracellular signal-regulated kinase (ERK). Furthermore, ERK has been proven to
cause different death mechanisms in different cell types (Wong et al. 2003; Arany et al.
2004; Schweyer et al. 2004; Subramaniam et al. 2004, Kim et al. 2005; Subramaniam
and Unsicker 2006). In ascidians, the caspase-3 is activated by NO (Comes et al. 2007),

138
which finally activates ERK (Castellano et al. 2014). ERK is a direct target for
decadienal in ascidians (Castellano et al. 2015). Subramaniam and Unsicker (2006)
reported that the inhibition of ERK in neurons prevented plasma membrane damage.
The intact plasma membrane was the hallmark sign reported in the results of the present
study of Dunaliella. Therefore, the decadienal could have used the ERK as a target and
the inhibition of ERK induced the PCD without damaging the plasma membrane.
Nevertheless, cell death with non-apoptotic morphology and which is independent of
caspase activation depends on the activation of ERK (Castro-Obregon et al. 2004), and
this could support the possibility of the other non-apoptotic pathways.
Another possibility is the autophagy type of PCD. The signs of autophagy in Dunaliella
cells treated with 50 M decadienal were clear, in the present study, including the lysis
of cytoplasm and other cell organelles. Other stress factors such as nitrogen starvation
caused the autophagy of the ribosomes and chloroplast membranes in Chlamydomonas
reinhardtii (Wang et al. 2009). In another study, nitrogen starvation was shown to cause
the degradation of the cytochrome b6-cytochrome f complex of the photosynthetic
apparatus (Bulte and Wollman 1992). A close inverse relationship between lipid body
formation and autophagy in mammalian systems has recently been reported (Singh et al.
2009). Signs of autophagy PCD were reported in prokaryotic and eukaryotic
phytoplankton (Segovia et al 2003; Berman-Frank et al. 2004), such as the increased
vacuolization and degradation of the internal cellular content while the plasma
membranes remained intact; this was present in D. salina cells subjected to 50 M
decadienal.
Segovia et al. (2003) described the effect of darkness on D. tertiolecta as autocatalysed
cell death that resembled apoptotic cell death with increasing caspase-like activity and
expression. The ultrastructural changes were chromatin condensation, loss of the
nucleus, and lysis of the starch layer that surrounded the pyrenoid; but the pyrenoid and
mitochondria did not change. Hyposalinity also caused heterochromatin condensation
(Hoshaw and Maluf 1981). In contrast, the present results showed that all cell organelles
lysed except for the starch granules, which indicates that a different cell death
mechanism had occurred. This is not a new finding since different cell-death
phenotypes were reported in D. viridis (Jimenez et al. 2009) in response to different
lethal stressors. For example, heat shock resulted in a necrosis-like cell death process,
and UV radiation triggered a cell death morphotype transitional between apoptotic and
necrotic features which resembled the aponecrotic type. Further, hyperosmotic shock

139
triggered cell death represented by a paraptotic-like phenomenon. Finally, incubating D.
viridis under nitrogen starvation resulted in a PCD resembling the autophagic/vacuolar-
like cell death. The present results showed a lysis of all cell constituents in the case of
D. salina, while the membranes remained intact. Therefore, the degradation process of
D. salina cell constituents could be similar to those found in plant cells: a process of
vacuolar autophagy, plastolysony (Krishnamurthy et al. 2000), or secondary necrosis
(Bianchi and Manfredi 2004). Table 3.14 summarizes the similarities and differences
between the results of the present study and those of Jimenez et al. (2009).
The case of Nannochloropsis is quite different. Although lipid production was similar in
all samples the ultrastructural changes were comparable to those seen following fixation
with glutaraldehyde alone (Chapter 2, protocols one, two, three). Decadienal, of course,
is also an aldehyde. The noticeable ultrastructual changes within N. oculata cells treated
with decadienal was an increase in overall cytoplasmic density that made it difficult to
discern cell organelles such as the nucleus and mitochondria. These observations
resemble those made of the effect of decadienal on cells of the diatom Thalassiosira
weissflogii as reported by Casotti et al. (2005). Both Nannochloropsis and T. weissflogii
belong to the same phylogenetic group. Firstly, the recognised morphological effect of
decadienal on T. weissflogii was the granularity of the cytoplasm due to the formation of
vesicles and refractive bodies in the cytoplasm (the higher the decadienal concentration,
the higher the granularity) (Casotti et al. 2005). This present study indicates that at 50
M decadienal, some cells were observed to be dense with no clear cytoplasmic
organelles. DNA degradation in T. weissflogii was also reported by Casotti et al. (2005),
where in cells treated with concentrations equal to or higher than 0.5 mg l-1 the
chromatins were scattered within the cell. Finally, DNA fragmentation followed by loss
of membrane integrity were reported with T. weissflogii cells subjected to decadienal
concentrations equal to or less than 1 mg l-1. Casotti et al. (2005) suggest that these cells
were undergoing apoptosis. N. oculata cells subjected to decadienal showed a great
alteration in their membranous system, starting from altered or loosened thylakoid
membranes in comparison to control cells, to the total loss of organelle membranes in
50 M decadienal. Furthermore, T. weissflogii had a variable response to decadienal
(Casotti et al. 2005), and at 0.18 mg l-1 the cells were able to recover from decadienal
stress. Vardi et al. (2006) reported that some marine diatom cells were less sensitive to
decadienal and produced a delayed response compared with others in the same culture.
They claimed that early response cells could induce an intercellular communication

140
system that could be transmitted within the diatom population. These observations
could explain the variable ultrastructural changes in decadienal-treated N. oculata cells
in the present study.
Apoptosis is reported to occur in aged cells of vascular plants (Fukuda 1994; Buchanan-
Wollaston et al. 2003) and as a mechanism to control phytoplankton blooms (Berges
and Falkowski 1998; Vardi et al. 1999). The ultrastructure of dead phytoplankton cells
found in the natural environment closely resembles senescent cultured cells (Veldhuis et
al. 2001). Jimenez et al. (2009) reported that late stationary phase cells of D. viridis die
in apoptotic-like pathways that resemble those described in D. tertiolecta under light
deprivation (Segovia et al. 2003). The ultrastructure of the decadienal-treated cells of
both D. salina and N. oculata never resembled the ultrastructure of the stationary phase
cells. This could confirm that different programmed cell death pathways are in
operation and confirm the results of section 3.4.2. These showed that decadienal did not
shift the cell growth from active phase to stationary phase.
This present study has shown that the vacuolar volume fraction in Dunaliella increased
from 2% in control cells to 8% in 50 M decadienal-treated cells. Not only were the
vacuoles larger, but they also had a different structure compared to, for example,
Dunaliella cells subjected to chronic selenium toxicity. Reunova et al. (2007) described
frequent lytic vacuoles associated with cytoplasmic autolysis. In their study, the small
“lysosomal” vacuoles fused to form larger ones, and generally these vacuoles
surrounded the nucleus or were in intimate contact with it. The vacuoles in 50 M
decadienal-treated D. salina and all decadienal-treated N. oculata cells contained
concentric masses of membranes and other particulate fractions. Stoynova-Bakalova
and Toncheva-Panova (2003) reported that vacuoles with osmiophilic inclusions
occupied the larger area of the cell in samples treated with high salinity concentrations
and high irradiance. This type of vacuolar inclusion has been widely described in many
different algal species, such as D. tertiolecta (Hoshaw and Maluf 1981) and the diatom
Diatoma tenue var. Elongatum (Sicko-Goad and Stoermer 1979). On the other hand, the
concentric masses of membranes were reported to increase with lead poisoning in the
Diatoma tenue (Sicko-Goad and Stoermer 1979) and poisoning by several heavy metals
in Plectonema boryanum (Rachlin et al. 1982) and D. salina and Chlamydomonas
bullosa (Visviki and Rachlin 1994a). The latter authors proposed that the lipids and
proteins of these membranes act as reservoirs to store the excess quantities of
intracellular cations as a mechanism to counter metal poisoning. The hypothesis behind

141
this detoxification mechanism is that the membranes can increase the surface area
within the cell in which metals can react with sulphydryl groups and thus prevent the
excess cations from reacting with susceptible and important cellular organelles or
machinery. This mechanism of detoxification could be applicable to decadienal
exposure, since the volume fraction and number of cells with membranous vacuoles
increased under 50 M decadienal exposure in D. salina and in all exposed N. oculata
cells. The vacuoles contained several layers of thick or thin membranes.
In conclusion, microalgae have superiority over conventional land-crop biofuels for
biodiesel production (Chisti 2008). One vital advantage of particular interest to this
present study is that they have the ability to produce large amounts of lipids, including
triacylglycerides (TAGs), which can be converted into biodiesel through
transesterification (Chisti 2007). The use of microalgae species for commercial
products, including biofuel production, is an important area of research. The species D.
salina is already successfully used to produce -carotene commercially and N. oculata
is successfully used commercially to feed fisheries (Boussiba et al. 1987). The focus of
this study was on the effect of decadienal on the ultrastruvture of two microalgae
species, D. salina and N. oculata as sources of lipids and subsequent biodiesel
production. The lipid volume fraction percentages under high and low decadienal as
well as stationary phase cells were compared for D. salina and N. oculata in 30
randomly selected micrographs. The highest lipid volume fraction percentage was found
in N. oculata stationary phase cultures. The highest lipid volume fraction percentage
induced by decadienal was found at 50 M in N. oculata cells. This study demonstrated
that although decadienal could increase the species lipid bodies production, the lipid
bodies volume fraction constituted a very low fraction of cell volume. Furthermore,
signs of PCD, which limit population growth, were induced by decadienal. This was
also revealed by Taylor et al. (2012), who showed that decadienal induced significant
lipid production and reduced the growth rate of N. oculata. Therefore, the main obstacle
in this area of research is the compromise between cell health and lipid productivity.
With reference to the results obtained, the smaller volume fraction in cells treated with
higher decadienal concentration 50 M suggests that the total lipid content of the cell is
important, not only the lipid bodies that contain TAGs, although TAGs are easier to
convert to biofuel by transesterification. Finally, with reference to the ultrastructural
changes induced by decadienal in the present study, different programmed cell death
mechanisms could be induced by decadienal in D. salina. These include, apotosis,

142
apoptitic-like PCD, paraptosis, autophagy because the main ultrastructural effect on D.
salina was mitochondrial cell lysis with intact plasma membrane. In N. oculata the main
ultrastructural effect was dense granules in the cytoplasm.

Table 3.14: Similarities and differences between results of this present study for Dunaliella salina programmed cell death and the results of Jimenez et
al. (2009)
Factor Hyperosmotic
shock
Results
of this
study
UV radiation
Results
of this
study
Acute heat-shock Results of
this study
Nutrient starvation and nitrogen
limitation
Results
of this
study
Stationary
phase
Results
of this
study
Cell death
process Paraptotic
Necrosis and
apoptosis
(aponecrosis)
Necrotic-like Autophagic/vascular cell death
Characteristics
Swollen X Cell swelling X Swelling X Migration of the nucleus X Chromatin
aggregation ?
Chromatin
condensation √
Disruption of
organelle
membranes
X Nuclear oedema X Pyknosis (nucleus
condensation) √
Karyorrhexis
(nuclear
fragmentation)
?
Extensive
cytoplasmic
vacuolation
√ Condensation of
mitochondria X Mitochondrial rupture √ Intact cell membrane √
Membrane
blebs X
Absence of
nuclear
fragmentation
and cellular
blebbing
√
Formation of
cytoplasmic blebs X or ??
Disrupted organelle
membranes X Blebbing X
Cytoplasmic
disassembling √
Intact cell
membrane √
Altered plasma-
membrane typical of
necrosis
X Absence of leakage of
intracelluar content √
Neat membrane
blebbing X
Chromatin clusters
can be identified as
spots within the
nucleus
√
Cytoplasmic consumption √
Disappearance of chloroplast
and other organelles √
143

144
Chapter 4. Gametogenesis of Pseudostaurosira trainorii
4.1 Introduction
4.1.1 Diatom classification: historical perspectives based on morphological
characteristics
Diatoms were described for the first time in the eighteenth century, and their
classification has been greatly affected by technological developments (Mann and
Evans 2007). An historical analysis shows many different attempts to classify
diatoms by many scientists (reviewed by Mann and Evans 2007; Williams 2007;
Williams and Kociolek 2011). The key systems are briefly described here to clarify
the current state of diatom classification. The earliest attempts at diatom
classification were by Carl Adolph Agardh in 1832, followed in 1843 by Friedrich
Traugott Kutzing. Their classifications were based on the microscopic
characteristics of living organisms, arranging diatoms based on the shape of
siliceous valves (Williams 2007). In 1871, Ernst Pfitzer suggested a classification
system for diatoms based on chloroplast structure. He proposed two divisions of
Coccochromaticae (numerous plastids) and Placochromaticae (one or two plastids)
(Mann and Evans 2007). In the following year (1872), Smith used the silica valve
parts as a criterion for classifying diatoms. The main feature was the presence of
the raphe, which is a true cleft generally on the valve (Williams 2007), which
meant that the diatoms were divided into three groups: the Raphidieae, with a true
raphe (equivalent to raphid diatoms); the Pseudo-raphidieae (equivalent to araphid
diatoms); and the Crypto-raphidieae (equivalent to centric diatoms). Following on
from the two systems of Pfitzer and Smith, Schutt, in 1896, introduced two major
groups, the Centricae and Pennatae, using a complex system composed of four
taxonomic levels (Williams and Kociolek 2011). In 1937, Hendey reclassified
diatoms as one order, Bacillariales, which he subdivided into ten sub-orders. In
1966 Patrick elevated Hendey’s sub-orders to orders, and in 1979 Simonsen
resurrected Schutt’s classification by considering Centrales and Pennales as the
major division in diatom classification. He considered frustule symmetry to be the
main criterion for categorizing them, which was also reflected in differences in

145
sexual reproduction. All Centrales reproduce by oogamous sexual reproduction
with motile sperm, whereas all pennates undergo conjugative sex (Williams 2007).
In 1990, Round et al. (1990) reused the three group system, dividing diatoms into
classes based on cell morphology using scanning electron microscopy. The first
class is the Coscinodiscophyceae, including the centric diatoms which have
frustules with radial and bipolar symmetry. The second class is the
Bacillariophyceae which include pennate diatoms having a raphe (so-called raphid
pennates). The final class is the Fragilariophyceae, which contains pennate diatoms
that lack a raphe (so-called araphid pennates). However, Williams and Kociolek
(2007) suggested that the classification system of Round et al.’s (1990) could be
represented in two ways. In the first, all three groups are considered as equal;
whereas in the second the araphid and raphid diatoms are included in the same
group encompassing the majority of bilaterally symmetrical species. This is
because they considered that “the araphid diatoms are more closely related to
raphid diatoms” (Williams and Kociolek 2007).
4.1.2 Diatom classification: molecular phylogeny and ultrastructural
characteristics
The molecular phylogeny of the diatoms has progressed in several stages.
Phylogenetic studies conducted in the 1990s based on the nuclear-encoded small
subunit ribosomal RNAs (SSU rRNAs) revealed that diatoms have heterokont algal
lineages (Bhattacharya et al. 1992; Leipe et al. 1994). In the late 1990s, Guillou et
al. (1999) demonstrated that they were most closely related to a group of free-living
phytoplankton in the Bolidophyceae (Guillou et al. 1999). Several molecular
phylogenetic studies have suggested that, within the diatoms, the araphid pennate
diatoms evolved from a lineage of centric diatoms (Kooistra et al. 2003 a, b). Two
molecular phylogenetic analyses were particularly significant. The first by Medlin
and Kaczmarska (2004) revealed that diatoms could be divided into two major
subdivision-level clades. The first subdivision was defined as the
Coscinodiscophytina (Clade 1), which includes centric diatoms that have valves
with radial symmetry (representing the class Coscinodiscophyceae). The other
major clade represents the subdivision Bacillariophytina (Clade 2) which has two
subgroups (class level): Clade 2a includes the bi- or multipolar centrics and the
radial Thalassiosirales (resembling traditional Mediophyceae); and Clade 2b that

146
includes all pennate diatoms (resembling traditional Bacillariophyceae) (Medlin
and Kaczmarska 2004). Therefore, there are three major clades. The second major
molecular phylogenetic analysis was by Mann (in Adl et al. 2005) which, although
using the same phylogenetic tree as Medlin and Kaczmarska (2004), considered
that the centric state was paraphyletic, although no further details were given about
other groups.
Following these molecular phylogenetic studies, there has been growing concern
about how to reconcile their conclusions with the morphological characteristics on
which diatom classification has traditionally depended. Both the morphological and
cytological evidence has been reviewed in Medlin et al. (2000) and Medlin and
Kaczmarska (2004), who concluded that it correlates with their molecular
phylogeny clades as summarized in Table 4.1. However, some morphological
features that have traditionally defined different diatom classes, such as pattern
centres, reproduction and plastid morphology, and the features that define different
orders, such as labiate and strutted processes, were found not to map well onto
molecular trees (Medlin et al. 2000). Nevertheless, these structures can still be used
to describe the more recent branches in the molecular tree at the order level in
diatom taxonomy (Medlin et al. 2000).
4.1.2.1 Golgi apparatus
Medlin (2009) and Medlin and Kaczmarska (2004) proposed that Golgi body
arrangement could help in classification, based on their analysis of data from the
available literature on Golgi bodies in diatom cells because the structure of the
Golgi apparatus correlates well with the major clades of diatom. Golgi bodies have
been classified into three types. In type 1, the dictyosomes (G) are associated with
endoplasmic reticulum (ER) cisterna and mitochondria (M) and with the so-called
G-ER-M unit found in species such as Coscinodiscus (Schmid 1988),
Stephanopyxis (Medlin et al. 2000) and Ellerbeckia (Schmid and Crawford 2001).
The type 2 Golgi apparatus consists of dictyosomes that surround the nucleus and
form a perinuclear shell or ring (Medlin and Kaczmarska 2004) and it is associated
with the Thalassiosirales, Aulacoseirales, and the majority of pennates and bipolar
centric diatoms. An example of genera that have these arrangements is
Stephanodiscus niagare (Drum et al. 1966; in Medlin and Kaczmarska 2004).

147
There are two varieties of the type 2 Golgi. Variation 2.1 occurs in Synedra ulna,
where the nuclear envelope, nuclear matrix and RNA form two long tentacles
which extend until they reach the cell poles (Schmid 1989). The tentacles have two
different sides, one with nuclear pores and the other with Golgi dictysomes lining
up along the outside (Figure 4.1). Golgi variation 2.2 is found in Pinnularia, where
the tentacles spread out in multipolar directions with Golgi dictysomes arranged on
both sides (Medlin et al. 2000). In type 3, the Golgi bodies are paired with filose
tentacles formed by the periplasmic nuclear membrane, and an example of genera
that have this arrangement is Biddulphiopsis titiana (Coscinodiscophycidae) (Clade
1) (Medlin and Kaczmarska 2004). Golgi variations correlate with the molecular
phylogeny tree, where type 1 Golgi are found in Clade 1 (Subdivision
Coscinodiscophytina) with the exception of Odontella sinensis (G-ER-M unit).
Type 2 Golgi, 2.1, 2.3, and type 3 Golgi variations are found in Clade 2
(Subdivision Bacillariophytina), and therefore they could all be considered as a
variant of one type called the perinuclear shell (Medlin 2009).

Table 4.1: Comparison of morphological features across the three molecular clades
(Source: Medlin and Kaczmarska 2004)
Feature Clade 1 Clade 2a Clade 2b
Morphological symmetry Radial centrics Bipolar centrics plus the radial
Thalassiosirales
Pennates
Golgi G-ER-M, one exception Perinuclear, one exception Perinuclear and its variations, no
exceptions
Pyrenoid One pore plastid, lamellae cross
pyrenoids not connected to
thylakoids
One or multiple numbers per
plastid usually not crossed by
lamellae, if so lying along
periphery of pyrenoids,
occasionally like clade 1; not
connected to thylakoids
One per plastid, very complicated
structures, lamellae crossing
pyrenoids are connected to
thylakoids
Sexual reproduction Oogamy, mostly merogenous
sperm with elongated nuclei
Oogamy, mostly hologenous,
sperm with rounded nuclei
Isogamy
Auxospore Isometric Nonisometric properizonia Perizonium
Processes raphae Marginal Central, also marginal in
Thalassiosirales
Central
148

149
Figure 4.1: Golgi arrangements
A) Type one Golgi arrangement, the G-ER-M unit. B) Type two perinuclear shell
Golgi arrangement. C) Type 2 variation 2.1. D) Type 2 variation 2.3. E) Type 3
Golgi. (Source: Medlin et al. 2000)

150
4.1.2.2 Pyrenoid structure
Pyrenoid structure could help in the classification and phylogeny of diatoms,
according to the primary results of Mann (1996) and Schmid (2001). Their findings
have been summarized by Medlin and Kaczmarska (2004). Table 4.2 shows a
detailed summary and brief sketches of the major types of byrenoid structures. The
first characteristic is the presence or absence of a membrane that surround the
pyrenoid. The second characteristic is the presence or absence of lamellae inside the
pyrenoid. The lamellae, if present, have different arrangement and could be
associated with chloroplast or not (Schmid 2001). Clade 1 contains centric species
which have a single membrane-bound embedded pyrenoid that is traversed by one
set or more of lamella. Clade 2a diatoms also have single membrane-bound
embedded pyrenoids but with two variations. The first is in the radial centrics of the
Thalassiosirales, where the pyrenoid is free of traversing membranes and some
species have lamellae invading the pyrenoid periphery (Medlin and Kaczmarska
2004). The second variation occurs in the bi- or tripolar species of clade 2a, whose
their pyrenoids resemble those of Clade 1 (crossed by a single thylakoid); however,
they differ from Clade 1 in that they form plastids with many pyrenoids. The
pyrenoid structure in Clade 2b (the pennate diatoms) is either embedded or
protruding, and these include a wide variety of pyrenoid morphologies even in the
same species (Schmid 2001). Therefore, the pyrenoids of phylogenetic Clade 2 are
more diverse than those of Clade 1 (Table 4.2).
4.1.2.3 Sexual reproduction
Regarding diatom sexual reproduction in relation to ultrastructure and molecular
phylogeny this has involved two scientific debates. The first concerns the evolution
of the diatom within the algal groups. For example, ultrastructural studies (listed in
Medlin and Kaczamarska 2004, non-English literature) have shown that male
gametes in both clades of centric diatoms have two transitional plates in the helix, a
feature that they share with the sister group of diatoms, the Bolidophyceae (Medlin
and Kaczmarska 2004). The second debate is over the evolution of isogamy from
anisogamy from oogamy, which contradicts that of other algae as the evolutionary
direction is reversed (Edlund and Stoermer 1997).

151
Sexual reproduction in diatoms is linked to the maximum cell size recovery, as the
diatom cell progressively decreases in size through asexual division. Early research
focused on vegetative cells only and it was not untill 1950, with von Stosch's study
of Melosira mrians, that oogamous sexual reproduction was first described in centric
diatoms (Rao 1970). In contrast, conjugative sex in pennate diatoms shows great
variability, although the proportion of species in which sexual reproduction has been
described is small (Round et al. 1990). The patterns of sexual reproduction
(including gametogenesis, gamete behaviour and auxosporulation) include changes
that occur independently in different periods, and therefore could not reflect the
evolutionary relationships among higher rank taxa (Mann 1993). However, based on
phonetic diatom classification, the three diatom groups have developed two different
sexual reproduction patterns (Edlund and Stoermer 1997). It is thought that centric
diatoms (Coscinodiscophyceae) were the earliest to evolve and are ancestral to the
pennates (Chepurnov et al. 2004). The centric diatoms reproduce by oogamy, which
is characterized by the presence of morphologically non-similar gametes. The egg
(female gamete) is large and non-motile while the sperm (male gamete) is small,
motile and anteriorly flagellated (reviewed by Drebes 1977) (Figure 4.2 1a, 2a and
b). Meanwhile the two other groups, Fragilariophyceae (araphids) and
Bacillariophyceae (raphids), reproduce by isogamy or behavioural anisogamy in
which the gametes are morphologically similar but exhibit behavioural differences.
The isogamy or behavioural anisogamy starts through contact and/or the production
of mucilage envelopes or copulation tubes (Edlund and Stoermer 1997), and
pheromones have recently been reported (Sato et al. 2011). These different types of
sexual reproduction are discussed next (sections 4.1.2.3.1 and 4.1.2.3.2).

152
Table 4.2: Summary of pyrenoid characteristics as described by Schmid (2001)
together with diagrammatic interpretations of the present writer
Clade Pyrenoid
characteristics
Sketch
Clade 1 Single
Membrane bound
Embedded pyrenoid per plastid
Traversed by one set more of
membranes, discontinuous with
thylakoids
Clade 2a,
variation 1
Single.
Membrane bound.
Embedded pyrenoid.
Lack membranes traversing the
pyrenoid.
Clade 2a,
variation 1,
exception 1
The genus Stephanodiscus has a
large undulating band with two
membranes traversing the pyrenoid
Clade 2a,
variation 1,
exception 2
Some species have only a fold of
pyrenoid membrane slightly
projecting along the pyrenoid
periphery into the matrix:
Cyclotella, Planktoniell,
Skeletonema, Stephanodiscus
Clade 2a,
variation 2:
Single
Membrane bound
Embedded pyrenoids
Tendency to form mega- plastids
with several pyrenoids
Pyrenoids are traversed by
membranes not continuous with
the thylakoids

153
Table 4.2: Summary of pyrenoid characteristics as described by Schmid (2001)
together with diagrammatic interpretations of the present writer (continued)
Clade 2b,
embeded
Membrane bound
with intra-pyrenoidal membranes
that are not continuous with the
thylakoids, which completely
surround them
Number of pyrenoids varies in
different plastids; some contain
many small pyrenoids while others
contain single large pyrenoid.
Clade 2b,
Peripheral
Protruding pyrenoids occupy the
space between the thylakoids and
the chloroplast envelope facing the
cell interior
Not separated by membrane
Not traversed thylakoids
Not traversed by membranes
Clade 2b,
Peripheral, non-
protruding
Not separated by membrane
Not traversed by membranes
Clade 2b,
Achnanthes
brevipes
Membrane bound with transverse
membranes continuous with
thylakoids
Eexo-
thylakoidal
Single, large, peripheral,
panduriform pyrenoid
projects conspicuously towards the
vacuole and consists of amorphous
dense matrix
Transgressed by irregular tubular
cytoplasm channels

154
Figure 4.2: Different types of sexual reproduction in different diatom groups as
summarised by Mann (1993)
1) Oogamy in centric diatoms: 1a) The oogonium produce two eggs. 1b) The male
gametes are flagellated and motile. 2) Morphological anisogamy in Rhabdonema
arcuatum. The female gametes are larger in size and non-motile while the male
gametes are flagellated and motile and smaller in size and during gametogenesis
leave a residual body. 3)-7) Allogamous reproduction in pennate diatoms. 3) Two
identical male and female gametangia produce one active gamete per each. 4) The
two active gametes produced by the same gametangium. 5) Isogamy where both
gametes are identical. 6, 7) One gamete produced per gametangium. 8) Paedogamy.
9) Autogamy. Stipple: Motile gametes. Heavy stipple: Functional haploid gametic
nuclei. Black: Degenerating, non-functional nuclei. Open circle: Unreduced diploid
nucleus or meiotic nucleus.

155
4.1.2.3.1 Sexual reproduction in centric diatoms
Since diatoms have a deplonitic life cycle, meiosis is a key step in the formation of
gametes in sexual reproduction, and the process by which eggs and sperm are
produced is known as gametogenesis (Round et al. 1990). Some centric diatoms
have a cell wall surrounding the gametangium and undergo what is known as
merogenous spermatogenesis, in which nuclei in the spermatogonia undergo the first
meiotic division without cytokinesis, resulting in the production of a binucleate
plasmodium which undergoes a second meiotic division and forms four flagellated
gametes and a residual body (Figure 4.3A). However, other centric diatoms have
non-shelled (frustule-less) spermatogonia which undergo a hologenous process in
which cytokinesis occurs in two meiotic nuclear divisions, and, therefore, four sperm
are produced with no residual body (Figure 4.3B).
In centric diatoms, the female gametes are large and sessile, and only one or two are
produced per gametangium (Chepurnov et al. 2004). The female gametangium is
produced directly from the vegetative cell and serves as the mother cell of the
resulting zygote or auxospore. However, auxospore formation is not limited to
sexual reproduction and can arise through automixis and asexually (Chepurnov et al.
2004). The process of oogenesis normally starts with cell elongation in the girdle
region, associated with an enlarged nucleus (in the prophase of meiosis I) and an
increase in pigmentation due to the increased number and size of chloroplasts
(Chepurnov et al. 2004). Meiosis consists of two divisions resulting in the
segregation of chromatids into haploid nuclei, prior to the formation of eggs
(oogenesis). Again, three distinct patterns of behaviour have been described, with
oogonia containing two eggs, oogonia with one egg and a polar body, and oogonia
with just a single egg (Drebes 1977). After the egg is fertilized, the oogonium cell
(zygote) is transformed into an auxospore, which not only is considerably enlarged
but has its own unique structure.

156
Figure 4.3: Sperm formation in centric diatoms
A) In the merogenous type, a spermatocyte (Sp) undergoes two meiotic nuclear
divisions to form four sperms (S) with a residual body (Rb). B) In the hologenous
type, two meiotic nuclear divisions are accompanied by cytokinesis in each, resulting
in four sperms (Source: Drebes 1977).

157
4.1.2.3.2 Sexual reproduction in pennate diatoms
Sexual reproduction in pennate diatoms takes different forms. One of the earliest
studied genera of pennate diatoms is Rhabdonema, whose patterns of sexual
reproduction appear to be somewhat intermediate between those of centric and
pennate diatoms (Figure 4.2 (2)). This genus is classified in the pennate diatoms;
however, it shares the characteristics of centric diatom mitosis in male
gametogenesis. This supports the hypothesis that isogamy evolved from oogamy in
diatoms. The pennate diatom Rhabdonema reproduces by oogamy, but this is
different from centric oogamy because the male gametes in Rhabdonema are non-
motile and naked (Round et al. 1990), but it matches centric oogamy in that the male
gametes are significantly smaller than the female gametes due to an imbalance in the
mitotic division plane. In addition, two pycnotic nuclei are also produced during
male Rhabdonema gametogenesis, whereas all meiotic nuclei survive in centric male
gametogenesis. Gametogenesis in the male produces two amoeboid gametes per
male gametangia, which is a characteristic of pennate gametogenesis (Edlund and
Stoermer 1997). The female gametangia represent centric diatom oogenesis by
producing one or two eggs per gametangium (Edlund and Stoermer 1997). This has
led to the hypothesis that the Rhabdonema lineage is likely to be an early diverging
member of the pennates, and is the most closely related to the centric diatoms
(Chepurnov et al. 2004). However, subsequent molecular studies have not confirmed
this hypothesis, since Rhabdonema does not have a stable position in the
phylogenetic tree (Medlin et al. 2000; Kooistra et al. 2003a). Although Rhabdonema
had for a long time been considered to be oogamous, von Stosch (1982) considered it
to be morphologically and physiologically anisogamous. Other ultrastructural
features that match well with molecular phylogeny are the merogenous forms found
in Clade 1 and the hologenous forms found in Clade 2a, though with some
exceptions (Jensen et al. 2003).
Other pennates do not form motile (non-flagellated) male gametes. They have
variable reproduction patterns, as summarized by Mann (1993) in Figure 4.2 (3-7).
Their reproduction is by allogamy (cross-fertilization as in plants) where the gametes
are anisogamous (Chepurnov et al. 2004). Furthermore, in anisogamous sexual
reproduction, the male gametes differ morphologically and behaviourally from
female gametes; however, they usually have the same overall morphology

158
(Chepurnov and Mann 2003). In addition, because the male gametes in pennate
diatoms do not have flagella, the gametangia conjugate first, followed by the
gametes. It has been reported that the male gametes of Rhabdonema adriaticum
show amoeboid movement (von Stosch 1958b; in Drebes 1977), whilst the female
gametes remained attached to their parental frustule. Two female gametes are
produced per gametangium and one haploid nucleus degenerates after the second
meiosis.
Only a few studies (mentioned in Chepurnov et al. 2004) have been carried out on
sexual reproduction in the araphid pennate diatoms. They are heterothallic and the
induction of gametogenesis requires interactions between sexual partners of opposite
mating types (Chepurnov et al. 2004). Recently, it has been shown experimentally
that they produce pheromones to induce gametogenesis (Sato et al. 2011). The
gametes differ in behaviour as the female gametes remain attached within the
gametangial valves/frustule/theca and are, therefore, described as passive (stationary)
gametes. On the other hand, the male gametes are discharged from the parental
frustule and move towards the female gametes, and are therefore described as the
active (migratory) gametes. These differ from other pennate diatoms in having
flagella-like structures called threads because their morphology is quite different
from a flagellum (Sato et al. 2011). The ultrastructure of these threads will confirm
whether they are flagella or not.
The raphid pennate diatoms are allogamous (isogamous) with most of them having
morphologically identical male and female gametes (Drebes 1977; Round et al.
1990). However, some of them reproduce by anisogamy, as reported in araphid
pennate diatoms (Chepurnov et al. 2004). The raphid gametes are motile and pairing
is active, and one or two gametes are produced per gametangium, in the first step by
gamete angiogamy. The combinations of gametogenesis fertilization and auxospore
development are extremely diverse (Figure 4.2).
4.1.2.4 Auxospore formation and structure in relation to molecular phylogeny
The auxospore is the cell resulting from sexual reproduction (Chepurnov et al. 2004)
as a result of the fusion of male and female gametes. It may contain a diploid
nucleus, or two haploid nuclei with a number of pycnotic nuclei, depending on the
species (Kaczmarska et al. 2001). However, auxospore types do not correlate well

159
with classical diatom systematics based on phenotypic characteristics. The centric
group has two types of auxospore structure (isodiametric and anisodiametric
properizonia auxospore) and pennate diatoms which have anisometric perizonium
auxospores (Kaczmarska et al. 2001). Thus, diatoms are divided into the centric
group, which have isodiametric auxospore and anisodiametric properizonia
auxospores, and araphid and raphid pennates which both have a perizonium
(Kaczmarska et al. 2001). According to Kaczmarska et al. (2001) and Medlin and
Kaczmarska (2004), the correlation between auxospore types and molecular
phylogeny (Table 4.1) is as follows. Clade 1 has isodiametric auxospores that can
swell in all directions and have only scales. Clade 2a has non-isometric auxospores
with scales and hoops or bands (aproperizonium) to restrict the swelling to the
bipolar or multipolar directions. Finally Clade 2b has anisodiametric auxospores that
form a complex tubular perizonium, usually consisting of transverse hoops and
longitudinal bands. These three main types of auxospore structure described in the
literature are illustrated in Figure 4.5, taken from Kaczmarska et al. (2001). These
findings accord with the hypothesis of von Stosch (1982), which suggests the
evolution of auxospore structure from a scaled auxospore wall with isometric
growth, to anisometric auxospore growth controlled by properizonial closed hoops,
then to anisometric growth controlled by closed hoops and open bands, and finally to
anisometric auxospore growth controlled by open bands. The Rhabdonema
auxospore shares the features of centric auxospores which are a scale-invested
auxospore (von Stosch 1982); however, it shares the pennate auxospore features of a
siliceous perizonium made of open hoops and longitudinal bands in the perizonia
(von Stosch 1982).
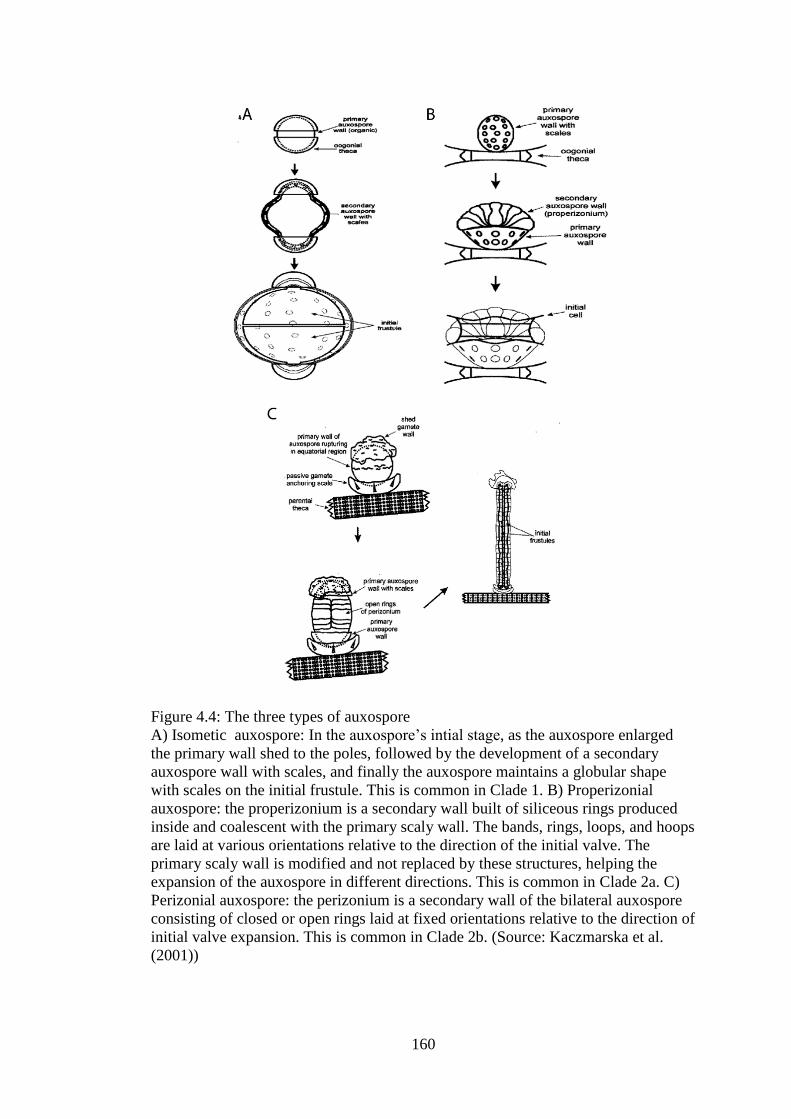
160
Figure 4.4: The three types of auxospore
A) Isometic auxospore: In the auxospore’s intial stage, as the auxospore enlarged
the primary wall shed to the poles, followed by the development of a secondary
auxospore wall with scales, and finally the auxospore maintains a globular shape
with scales on the initial frustule. This is common in Clade 1. B) Properizonial
auxospore: the properizonium is a secondary wall built of siliceous rings produced
inside and coalescent with the primary scaly wall. The bands, rings, loops, and hoops
are laid at various orientations relative to the direction of the initial valve. The
primary scaly wall is modified and not replaced by these structures, helping the
expansion of the auxospore in different directions. This is common in Clade 2a. C)
Perizonial auxospore: the perizonium is a secondary wall of the bilateral auxospore
consisting of closed or open rings laid at fixed orientations relative to the direction of
initial valve expansion. This is common in Clade 2b. (Source: Kaczmarska et al.
(2001))

161
Pseudostaurosira trainorii belongs to the araphid diatoms, which are paraphyletic
(Williams and Kociolek 1988, Medlin et al. 2008). The earliest molecular phylogeny
for the araphid diatoms (included Clade 2b of Medlin and Kaczmarska 2004) showed
that they are divided into two major clades (Kooistra et al. 2003a). Chepurnov et al.
(2004) stated that the sexual reproduction of Clade 1 (Kooistra et al. 2003a), which
includes Asterionellopsis, Asterioplanus and Rhaphoneis, had not been studied and
there was little information available about the second clade. The second clade
contains the genus Striatella and is considered as the sister group of the raphid
diatoms (Kooistra et al. 2003a).
4.1.3 Aims of this diatom study
Available studies describing the genus Pseudostaurosira were summarized in the
general introduction (Chapter 1, section 1.3.2). This chapter aims to add to existing
knowledge obtained by light and scanning electron microscopy using the
transmission electron microscope, which will enable firstly, description of the cell
structure of P. trainorii in different life cycle stages (vegetative cells, male and
female heterothallism, gametes, auxospore and initial cells), which has never been
done before. Secondly, the thread-like ultrastructure of the male gametes that have
been reported by Sato et al. (2011) is investigated to confirm whether or not it
resembles the flagella. Thirdly, the molecular phylogeny of diatoms described by
Medlin and Kaczmarska (2004) is correlated with ultrastructural features.
4. 2 Methods
Methods were described in Chapter 2, section 2.1.1 and section 2.3.3
4.3 Results
4.3.1 Vegetative cells
Pseudostaurosira trainorii is a chain-forming (filamentous) diatom (Figure 4.5A, B,
G) that on first appearance looked very like a centric species such as Melosira
(Figure 4.5 C-F). The adjacent cells were linked to each other with small
interlocking spines (Figure 4.5B-F). Valves had parallel striae (11 in 5 m) and
diatom dimensions of 6.5 m x 5.5 m in size, and were decorated with uniseriate
rows of linear to slightly curved striae, each with between 12 and 20 areoloae

162
(Figure 4.5C). The valve showed the typical bilateral symmetry of a pennate diatom,
with the striae being divided by a central sternum (approx. 0.4 µm in width), which
was only differentiated from the rest of the valve by the absence of areolae (Figure
4.5C and D).
Both male and female vegetative cells had the same structure. The vegetative cell
was bounded by the typical electron dense valve, and contained a single nucleus,
chloroplasts, vacuoles, dictyosomes, and mitochondria (Figure 4.5 G-J). The
vegetative cells prior to gamete formation were of rectangular shape in girdle view
and were on average 6.5 m x 5.5 m in size (Figure 4.5J, H and J) and circular to
elliptical in valve view (Figure 4.5I). Each vegetative cell contained a single nucleus
which was normally located at one end of the cell adjacent to the chloroplast and
Golgi dictyosomes at the site of the epitheica (Figure 4.6A, D). The nucleus was
bordered by a nuclear envelope interrupted by nuclear pores (Figure 4.6D-F). The
nucleoplasm was usually homogenous, with a fine granular appearance and
interspersed with small patches of more electron-dense heterochromatin. Each
nucleus also contained a prominent nucleolus, which is an electron-dense granular
spherical body situated at one peripheral side of the nucleus close to the nuclear
envelope (Figure 4.6A, D). It was intimately associated with a cup-shaped plastid
and perinculear Golgi dictyosomes (Figure 4.6A-F) and near the tonoplast of
vacuoles (Figure 4.6A, B). The nucleus was closely associated with the
endomembrane system of the cell, particularly the Golgi system and endoplasmic
reticulum (Figure 4.6C-F). Both girdle (Figure 4.7A, B; Figure 4.9A, B) and valve
(Figure 4.7C and 4.9C) sections of the vegetative cells revealed 2-3 Golgi
dictyosome profiles associated with the nucleus. Each dictyosome consisted of 4-6
cisternae (Figure 4.6E), which were formed by the fusion of vesicles produced from
the nuclear envelope (Figure 4.6D, E).
From the valve plane (Figure 4.5; 4.7A-B) and girdle (Figure 4.5J) sections it could
be seen that the chloroplast was restricted to the periphery of the cell, where it
formed an open cup around the cell. In thin-sectioned material each cell usually
contained one to three plastid profiles, which in the girdle plane could be seen to
underlie the valve (Figure 4.5H). Each plastid contained many electron-dense
lamellae that ran parallel to the cell surface. Each lamella consisted of three closely
stacked thylakoids (Figure 4.6A-C and F). The outermost lamella formed a

163
continuous loop underlying the plastid envelope, and this is called the girdle lamella
(Figure 4.6A-C and F). The thylakoid lamella was separate around the prominent
pyrenoid region (Figure 4.6A, C), which was traversed by a single lamella extending
across the centre of the pyrenoid from the perimeter (Figure 4.6A, C). The
chloroplast also contained scattered electron-dense plastoglobuli (osmiophilic
granules), that might occur singly or in groups of up to seven (Figure 4.6A-C).
The nuclear envelope and periplastid membrane formed electron-transparent
cisternae where the plastid abutted the nucleus (Figure 4.6A, C and F). There was an
additional cisternum of smooth ER which completely enveloped the chloroplast,
which is where the nucleus abuts the plastid in common with the nuclear envelope.
Where the plastid curved around to the other side of the cell, it enveloped the large
lipid droplet (Figure 4.6B).
The mitochondria were variable in shape but mostly rounded and containing tubular
cristae. They mainly lay at the periphery of the cell (Figure 4.7A). Storage products
in relatively electron-transparent droplets were found in the cytoplasm near vacuoles
and chloroplasts (Figure 4.5H). The most obvious storage product was the large
droplet of lipid (oil) which formed a large droplet that lay directly in the cytoplasm
and was not bounded by a membrane (Figure 4.6B). The lipid droplet in vegetative
cells appeared to abut both the nucleus and chloroplast (Figure 4.5H). The side of the
cell opposite where the nucleus resided was is mainly occupied by the large electron-
lucent vacuole(s) – this is shown clearly in Figure 4.5H; 4.6A.

164
Figure 4.5: Light, scanning and transmission electron micrographs of
Pseudostaurosira trainorii
A) P. trainorii under light microscope forming chain-like colony. Scale bar 10 m.
B) Chain like colony under scanning electron microscopy of P. trainorii. Scale bar 5
m. C-F) Scanning electron microscopy micrographs of P. trainorii. G) Girdle view
of chain of P. trainorii cells. Scale bar 10 m. H) Higher magnification of two
vegetative cells. I) Valve view of the cell. G) Girdle view of the cell. Chl:
chloroplast; G: Golgi; L: lipid bodies; N: nucleus; Py: pyrenoid; V: vacuoles.

165
Figure 4.6: Cytological features of Pseudostaurosira trainorii
A) Cross-section from valve view through the nucleus and pyrenoid. B) Cross-
section from valve view through lipid droplet. C) Higher magnification of
chloroplast throgh the pyrenoid. D, E) Higher magnification of nucleus and Golgi
body. F) Higher magnification of chloroplast through the girdle lamella. Chl:
chloroplast; G: Golgi; L: lipid bodies; M: mitochondria; N: nucleus; Nu: nucleolus;
Pl: plastoglobuli; Py: pyrenoid; Thy: thylakoid; V: vacuoles.

166
4.3.2 Gametogenesis
From the detected stages of both fertilized samples (20 minutes and 24 hours), the
first evidence of gametogenesis in both induced male and female clones was the
appearance of dividing vegetative cells, in which cells elongated to up to 12 m
(male Figure 4.7A-B, female Figure 4.9A-B). At this stage, the interphase nuclei
were spherical and ranged in size from ca 2.5 x 2 m and had an average volume of
around 50 µm3 (male Figure 4.7A-D, female Figure 4.9A-D). Following
enlargement, differences could be detected in the fine structure of male and female
gametes, although they appeared almost identical under light microscopy (Sato et al.
2011). Subsequent male and female gametogenesis are now be described in separate
sections.
4.3.2.1 Male gametogenesis and gametes
Cultures of P. trainorii were induced to produce male gametes as described in
Chapter 2 (section 2.1.2). As gametogenesis progressed, the developing
spermatogonia cells were elongated (in girdle plane) to around 12m in length
(Figure 4.7B). This contrasted with the <9 m in length of recently divided
vegetative cells (Figure 4.5H). The nucleus in non-dividing cells was located at the
cell periphery (Figure 4.5G, H) whereas when a cell was dividing the nucleus
migrated to the centre of the cell (Figure 4.7B). The elongated spermatogonia cell
had a basally located nucleus that had increased in size to approximately 4-4.5 x 3
m (Figure 4.7B). These findings are indicative that meiosis was about to take place.
The volume of these nuclei had increased to around 250 µm3 (Figure 4.7D). In spite
of the increase in overall cell size, there had not been any increase in the size and
volume of other organelles, such as vacuoles and lipids (Figure 4.7B). In some of the
nuclei, paired electron-dense structures could be seen (Figure 4.57B) which might be
indicative of a pre-synaptonemal complex stage. In these spermatogonia cells, the
Golgi was more compact and the chloroplasts appeared smaller and had a denser
overall appearance than in vegetative cells (Figure 4.7B). A pyrenoid was still
present but appeared to be surrounded by a zone of electron-lucent material (Figure
4.7B) which was also present, but less obvious, in vegetative cells (Figure 4.6A, C).
Following cell enlargement, the gametangium formed two male gametes per
gametangium. They were different in size (Figure 4.7D).

167
The fully differentiated male gametes were rounded or spherical in shape. When
observed under the light microscope with differential interference contrast light
microscopy (DIC), living sperm cells appeared remarkably pleomorphic and
constantly changed shape. As Sato et al. (2011) have reported, the sperm produced
fine protoplasmic threads, along which the cells appeared to glide (Figure 4.8A). In
the sequence of still images taken from a captured video sequence, a non-motile
sperm cell was approached by a motile cell (masked with an asterisk) which was
trailing its fine, almost flagellum-like protoplasmic thread. This was retracted as the
asterisked cell became more irregular in shape as it moved around the static cell.
Although these threads could be easily observed using DIC microscopy, they had
been very difficult to find in thin sectioned samples (Figure 4.8D-G). However, one
profile showed evidence of what could be a thread (Figure 4.8E, arrow). The male
gamete was motile, and Figure 4.8C shows the pseudopodia movement.
Thin-sectioned differentiated sperm cells had relatively small vacuoles and contained
a single functional nucleus (Figure 4.8D-G). However, there was also a second
smaller body, which had very electron-dense membranes and was presumed to be a
non-functional or partially degenerate nucleus (Figure 4.8B and D). The gamete
nucleus was significantly smaller than the spermatogonial nucleus, having a volume
of around 40 µm3 which was slightly less than that of a typical diploid vegetative
nucleus (Figure 4.7D). The volume of the electron-dense non-functional nucleus was
less than that of the functional nucleus (Figure 4.7D).
The male gamete also contained many mitochondrial and vacuole profiles, although
these were only was occupying a relatively small volume compared to those in the
female gamete. The sperm cell chloroplasts were much denser and narrower than
those in vegetative cells and up to four separate profiles could be seen (Figure 4.8B,
D-G). In contrast to the vegetative cells, the dense plastids were not closely
associated with the nucleus, although they remained in close contact with the single
prominent lipid globule. The Golgi bodies were of the perinuclear type (Figure 4.8D,
E and G).

168
Figure 4.7: Male dividing cells and gametogenesis
A) Cell before dividing, girdle view. B) Dividing cell, girdle view. C) Dividing cell,
valve view. D) Box plot of nuclei volume for male vegetative, male dividing, and
male gamete 1 which resemble the normal nucleus appearance profiles in the male
gamete; and male gamete 2 which resembles the degenerated nucleus within the
male gamete. E) Gametangium containing two male gametes. Scale bar 2 m. Chl:
chloroplast; G: Golgi; L: lipid bodies; M: mitochondria; N: nucleus; Nu: nucleolus;
Py: pyrenoid; V: vacuoles.

169
Figure 4.8: Mature male gamete
A) Successive light microscopy graphs for motile male gamete (asterisk). B)
Scanning electron micrograph. C-G) Different cross-sections of male gametes. Chl:
chloroplast; G: Golgi; L: lipid bodies; M: mitochondria; N: nucleus; N?: partially
degenerate nucleus; Py: pyrenoid; V: vacuoles..
170
4.3.2.2 Female gametogenesis and gametes
The female gametangium (egg) cell was also recognised by its greatly increased size
and large nucleus located at its centre (Figure 4.9A, B, E). Following division, the
egg cells were largely occupied by vacuoles which occupied nearly two thirds of the
cell volume. The chloroplasts also replicated and migrate to the gametangium poles
so that each egg (gamete) contained a single plastid (Figures 4.9E and 4.10A). Since
the nucleus always remained at the hypotheca side of the cell, this implies an
unequal division plane. Unfortunately, the final stage where a fully differentiated egg
is seen within the gametangium was not observed. The most frequently observed
stage in female gametogenesis was after the upper hypovalve had already been shed,
exposing the naked egg cell to the environment (Figure 4.10B-D). The differentiated
egg cell was much more vacuolated than its male equivalent (Figure 4.10B-D). The
retaining epivalve was very elongated (<8 µm – Figure 4.10B-C) compared with
typical vegetative cells where it rarely exceeded 5 µm (Figure 4.5H). In female
gametogenesis, following the shedding of the upper valve, the rather elongated
naked female gamete was still held in place by the parent frustule. As the female
gametes matured they appeared to slide out of the basal frustule and became more
rounded in shape. At this stage, they each had two large polar vacuoles and a narrow
crescent of cytoplasm containing the two gametic nuclei, which were completely
separated from the plastid (Figure 4.10C). At this stage, each egg cell contained 2
nuclei (Figure 4.10C, enlarged E, and F), and one or two relatively small, centrally
located lipid globules (Figure 4.10B, C). The two small centrally located egg nuclei
lay equatorially (Figure 4.10C) and were of similar overall appearance but tended to
be of unequal size, one having a volume of around 40 µm3 and the other only 20 µm3
(Figure 4.9D). Only the larger nucleus tended to be associated with Golgi
dictyosomes (Figure 4.10F). The developing egg had two nuclei and it seemed in the
later stages the second nucleus degenerated as the thin section showed a highly
vesicular membranous area besides the larger nucleus (Figure 4.10G).
The female gamete also contained a large expanding vacuole initially located
towards the cell poles (Figure 4.10C) and which appeared to occupy nearly half of
the egg volume. There were one or two dense but narrow (0.5-1.0 m wide) plastids
(Figure 4.10B, C), which were usually basally located. As development progressed,
the eggs moved out of the valve and became more rounded in shape and the mature
171
egg cells were highly vacuolated (Figure 4.10D). The scanning electron microscope
showed a mucilaginous region around the female gamete (Figure 4.10H).

172
Figure 4.9: Female dividing cells and gametogenesis
A) Cell before dividing, girdle view. B) Dividing cell, girdle view. C) Dividing cell,
valve view. D) Box plot of nuclei volume for female vegetative, female dividing, and
female gamete1 which resembles the first nucleus in the female gamete, and female
gamete 2 which resembles the second nucleus within the female gamete. E) Large
size of the gametangium. Chl: chloroplast; G: Golgi; L: lipid bodies; M:
mitochondria; N: nucleus; Py: pyrenoid; V: vacuoles.

173
Figure 4.10: Egg differentiation and maturation
A-C) Different stages in egg gametogenesis. D) Mature egg. E-G) High
magnification of the nucleus. H) Scanning electron micrograph of egg. Chl:
chloroplast; G: Golgi; L: lipid bodies; M: mitochondria; N: nucleus; V: vacuoles.

174
4.3.2.3 Fertilization and auxospore development
A thin section showing a male sperm cell lying close to a female gamete (egg) is
shown in Figure 4.11A and a possible post-fertilization cell is shown in Figure
4.11B. As P. trainorii is heterothallic and differentiated into compatible clones, one
male and the other female, the presence of a male gamete opposite a female gamete
in the same thallus could indicate a fertilized egg at the earlier stages (Figure 4.11B).
Figure 4.11C shows an enlarged fertilized egg, where the nucleus size was large
(radius is 4 m, 3.5 m) and the male’s degenerated nucleus had started to lyse as its
double membrane had become detached. The SEM micrograph shows the size of
what could be interpreted to be a fertilized egg in the 20 minutes sample, which was
huge in comparison to the normal gamete, far exceeding the frustule size, and the
shape was rounded (Figure 4.11D). Following this stage, the auxospore was
reshaped into the typical elongated bilateral cell embedded in a copious
mucilaginous matrix (Figure 4.11E). The transmission microscope thin sections
showed two cells that might represent auxospore initials, which were surrounded by
a thin wall which clearly differentiated them from male gametes (Figure 4.11F, J).
The 24 hours zygote sample showed a dramatically increased size of auxospores,
which by then were encased in open transverse bands, with the widest bands in the
centre (Figure 4.12B).

175
Figure 4.11: Fertilization and auxospore in the 20 minutes fertilized sampleA) Male
gamete approaching female gamete. B) Pseudostaurosira trainorii thallus containing
female gamete (upper one) and fertilized female gamete (lower one). C) High
magnification of the fertilized egg in B. D) Scanning electron micrograph of a zygote
showing the huge volume in comparision with the frustule size. E) Expanded
auxospore within the mucilaginous material. F-J) Cross-sections through the
expanded auxospore showing the organic cell wall. Chl: chloroplast; G: Golgi; L:
lipid bodies; M: mitochondria; N: nucleus; Nu: nucleolus; Py: pyrenoid; V: vacuoles.

176
Figure 4.12: Mature auxospore from 24 hours fertilized sample
A) Light microscopy of the auxospore. Scale bar 10 m. B-C) Scanning electron microscopy of the auxospore. D) Thin section montage of the
mature auxospore showing the huge volume of the cell and the two cell wall layers. Scale bar 10 m. E-F) Cross-section of the central part of the
auxospore with the nucleus surrounded by preinuclear Golgi apparatus.
176

177
4.4 Discussion
Advances in molecular approaches have changed views about diatom classification
systems and increased interest in reviewing old hypotheses and findings such as those
concerning the relationship between cell structure and classification (Kooistra et al.
2003a). The main reason for this is that molecular phylogenetic approaches differ from
those of phenetic phylogeny (Kaczmarska et al. 2001). The discovery of difficult-to-
place diatom species further complicates the situation. Therefore, elucidating the
hitherto undescribed ultrastructure of Pseudostaurosira trainorii vegetative cells and
gametogenesis, in one such anomalous genus, could help in resolving differing
morphological and molecular concepts of diatom relationships. A discussion of the
implications of ultrastructural features for molecular phylogeny will follow.
4.4.1 Organelles with significance for molecular phylogeny
This present study showed partial agreement with the morphological and cytological
support for the major clades and taxonomic revision proposed by Medlin and
Kaczmarska (2004). To start with, this study revealed that the structure of the Golgi
apparatus in P. trainorii resembled type 2 Golgi associations; that is, an array of
perinuclear Golgi that surround the nucleus. This arrangement was found in different
life cycle stages (i.e. vegetative cells; gametes and zygotes) and is a characteristic of the
Clade 2b diatoms to which P. trainorii belongs.Therefore, this present study supports
the conclusion of Medlin and Kacmarska (2004) concerning the relation of Golgi
structure to the major molecular phylogenetic clades. This is unlike the Bedoshvili and
Likhoshway (2012) study, which showed limitations in the application of cell
ultrastructure features to phylogenetic reconstruction, where two types of Golgi
arrangement are found in Ditylum brightwellii; the G-ER-M unit and perinuclear
dictyosomes (Bedoshvili and Likhoshway 2012). This species is a member of the Clade
2a diatoms; therefore, this hypothesis may need more study.
This study also showed that the pyrenoid structure of P. trainorii resembles the
commonly found form of the pyrenoid in the genera studied that belong to the class
Bacillariophyceae (Clade 2b of Medlin and Kaczmarska (2004)) as it is non-membrane-
bounded and contains lamellae. However, results of this present study showed that the
lamella was connected to the thylakoid in some micrographs and not connected in
others. This could indicate that the lamella was found as a sheath within the pyrenoid
and has different widths at different levels that are not continuous with thylakoids.

178
Medlin and Kaczmarska (2004) state that Clade 2b have pyrenoids with lamellae that
are continuous with thylakoids (Table 4.1, section 4.2.1); however, results of this
present study showed that P. trainorii is an exception to this rule. Examples of results
resembling the findings of this present study regarding traverse pyrenoid lamellae are in
Achnanthes minutissima, which also belong to Clade 2b and where the pyrenoid lamella
was not associated with the chloroplast thylakoids (Bedoshvili and Likhoshway 2012),
and in the genus Aulacoseira which belongs to Clade 1. In Aulacoseira granulata the
pyrenoid is crossed by lamellae not associated with other thylakoids (Drum et al. 1966;
in Medlin and Kaczmarska 2004). Meanwhile, in Aulacoseira baicalensis, the
transverse lamellae are associated with chloroplast thylakoids. No information is
available about how many thin or serial sections were taken in these studies; therefore,
their results could be variable due to a lacking of appropriate sectioning. The present
study has shown the presence of both states (association and non-association of lamella
with the thylakoids) at different levels of the chloroplast. In addition, recent studies
revealed more exceptions in other major clades. For example, the absence of a
membrane surrounding the pyrenoid in genera belonging to the Clade 2a, Chaetoceros
muelleri and Attheya ussurensis, contradicts Medlin and Kaczmarska’s (2004)
hypothesis (Bedoshvili and Likhoshway 2012). Furthermore, the same study also
revealed a new type of pyrenoid structure found in Clade 1. The pyrenoid of
Aulacoseira baicalensis has several lamellae associated with other thylakoids. This is an
exception for Clade 1 to which this species belongs. Thus, more research is needed to
confirm the cytological evidence concerning the molecular phylogeny of clades
suggested by Medlin and Kaczmarska (2004), since diatom diversity has not been well
studied. As Mann et al. (2013) state “the proportion of the studied species is still
extremely small.”.
4.4.2 Sexual reproduction, gametogenesis and auxosporulation
Chepurnov et al. (2004) believe that the diatom life cycle and size-dependent control of
sexuality have played an important role in the diatom’s evolutionary success. They
postulated that understanding sexual reproduction in diatoms would help in determining
the relationship between lifecycle dynamics, population biology and evolution
(Chepurnov et al. 2004). Therefore, these authors developed six rules for the lifecycle of
diatoms, as follows. Firstly, the life cycle is diplontic and gametogenesis involves the
process of meiotic division; secondly, the vegetative cells are reduced in size as a result
of successive mitosis; and, thirdly, therefore, the auxospore developed as a result of

179
sexual reproduction to restore the normal cell size. Fourthly, vegetative cells continue to
divide by mitosis until they die if they are unable to reproduce sexually; fifthly, the
small cells can be triggered to switch from meiosis to mitosis; and, finally, the
auxospore is not a dormant stage. However, although these rules are meant to apply
uniformly to all diatoms, variations in gametogenesis and sexual reproduction are, in
fact, common (Chepurnov et al. 2004).
Many studies support the first rule of Chepurnov et al. (2004), that meiosis is found in
all diatom sexual life cycles. For example, Mann and Stickle (1995; in Chepurnov et al.
2004) state that diatom meiosis is ordinary with no distinctive characteristics and a
review by Kociolek and Stoermer (1989; in Chepurnov et al. 2004) showed that meiosis
is a predominant feature of diatom gametogenesis. However, there are different
mechanisms of cytokinesis after meiosis I, which result in variations in the numbers of
gametes and of functional nuclei. In egg gametogenesis, the results of this present study
showed that P. trainorii produced two eggs per gametangium. However, Sato et al.
(2011) state that the P. trainorii female egg has one nucleus. The production of two
eggs could be explained by an equal cytokinesis occurring after meiosis I but not after
meiosis II; therefore, one haploid nucleus has degenerated (Round et al. 1990). This is
clearly shown by the results of the present study as the nucleus volume indicated the
smaller size of one nucleus in the gametes (see section 4.3.2, Figures 4.7 and 4.9). The
conflict between these results and those of Sato et al. (2011) regarding the number of
nuclei in the female gametes could be explained by the dependence of the latter on light
microscopy and DAPI staining which might not be absorbed by the degenerating
nucleus, whereas the TEM showed the presence of two nuclei in some sections. The
results of the present study suggest that the process of gametogenesis in P. trainorii
resembles that of Rhabdonema (which is considered to have gametogenesis
intermediate between the centric and pennate groups) (Drebes 1977). In the genus
Rhabdonema, the number of eggs per oocyte is different in different species. R.
adriaticum produces one egg per gametangium; this is explained by the unequal
cytokinesis after meiosis I (Round et al. 1990). Meanwhile, in R. minutum and R.
arcuatum two cells are produced per oocyte (Round et al. 1990). P. trainorii has two
eggs per oocyte, and so the number of eggs per oocyte could be variable with no
constant tendency within the genus.
In addition, in the genus Rhabdonema, the male gametangia form two male gametes
(consistent with results of this present study) and the male gametes have two nuclei, one

180
of which is degenerated (Drebes 1977). Chepurnov and Mann (2003) reviewed the types
of gametogenesis in pennate diatoms and concluded that anisogamy, in which one
gamete is active (movable) and the other is passive (sessile), represents the most
primitive type of reproduction within this group. P. trainorii gametogenesis differs from
that in Rhabdonema, which has “passive” male gametes (Derbes 1977), while in P.
trainorii the male gametes actively move along threads to reach the females (Sato et al.
2011). However, the male gametes of Rhabdonema were not reported to have either
flagella or thread-like structures. The male gametes in P. trainorii were non-flagellated
and had thread-like structures, which might indicate that these structures could have
developed as an adaptation to environmental conditions after the loss of flagella. In
addition, the fine structures of male and female gametes were dissimilar.
The flagella structure of male gametes has been shown to be an important feature that
reflects diatom evolution (Round et al. 1990). Earlier research suggested that the
ancestor of the diatom could be a flagellated cell (Manton and Stosch 1966; in
Chepurnov et al. 2004) and the flagella were retained only in sexual reproduction (Mann
and Marchant 1989). Therefore, research has been conducted on the structure of the
flagella of the diatom male gametes to investigate its evolutionary history. It has been
revealed that the structure of the flagella axoneme is a 9+0 configuration in both genera
closer to the diatom roots (Jensen et al. 2003; Theriot et al. 2010, 2011; Idei et al. 2013)
as well as genera not closer to diatom roots (Round et al. 1990; Graham and Wilcox
2000). In centric diatoms, the male gametes are flagellated, whereas those in pennates
are non-flagellated. The pennate diatoms are considered to be the most recently evolved
of the diatom lineages, and this suggests that the loss of flagella in diatoms is a
relatively recent development. However, it is not known, for instance, if there are any
non-flagellate centric diatoms and whether flagella loss occurred before or after the
emergence of pennate diatoms (Sato et al. 2011). Sato et al. (2011) speculated that the
threads observed in the centric-like pennate P. trainorii might represent some form of
reduced flagellum as an intermediate stage in the flagellar loss process. They showed
that the threads produced by the male gametes are rich in tubulin. However, the results
of this present study showed that the male gamete cell structure in P. trainoii lacked any
indication that they might have possessed a flagellum, since pennate gamete flagella
normally form a pair of nucleus-associated kinetosomes shortly after the completion of
meiosis I and they are always closely associated with the poles of the spindle (Idei et al.
2013; Round et al. 1990). The results her showed no evidence of any such basal body

181
associated with the gamete nuclei of P. trainorii. Rudimentary structures which might
possibly represent thread sections also showed no evidence of an axonemal structure.
This indicates that the threads investigated by Sato et al. (2011) almost certainly are not
homologues of flagella and are more likely to be filopodia-like structures. The lack of
flagella in this species does add support the view that P. trainorii is a typical araphid
diatom. The presence of slender, non-ramified cytoplasmic projections which expand
and retract in accordance with cell movement was reported by Davidovich et al. (2012),
who stated that araphid sexual reproduction mechanisms vary and further new gamete
movement patterns may be discovered; however, their study was limited to light
microscopy (Davidovich et al. 2012).
4.4.3 Auxospore development
Auxospore formation and development is important for the cytology and reproductive
behaviour of diatoms and their taxonomy (Mann 1982). Results of the present study
regarding for the auxospore structure of the P. trainorii revealed that it resembled the
Clade 2b auxospore structure, which is a perizonium with bilateral symmetry. It
develops out of the parental theca, which is consistent with the descriptions by Mann
(1993); Kaczmarska et al. (2001) and Sato and Mann (2012).
The auxospore cell wall is made up of organic matter and siliceous elements (von
Stosch 1982; Round et al. 1990; Kaczmarska et al. 2001). It is clear that the results of
the present study showed the presence of different cell wall layers, one being thicker
than the other. The TEM results for P. trainorii confirmed that, as described by Medlin
and Kaczmarska (2004), the auxospore starts in a spherical shape with a delicate
primary cell wall (which is the organic constituents), as such a phase was detected in the
20 minutes fertilised sample. Medlin and Kaczmarska (2004) state that the valves of the
primary wall may be retained by the older auxospore as apical caps and may or may not
remain as integral parts of the expanding cells. Results of this present study showed that
the auxospore of P. trainorii expanded in both directions and the primary wall ruptured
and surrounded the auxospore and covered the new walls of the perizonium, which
expanded to reach the size of the young auxospore. However, it retained a circular shape
at the centre of the auxospore in the TEM results. The scanning electron microscope
results of this study (section 4.2.3, Figure 4.16) showed that no scales and caps were
detected and the auxospore contained transverse bands with the widest in the centre in
the 24 hours mature sample. This is consistent with the results of Sato et al. (2011).

182
However, they indicated the presence of longitudinal bands beneath the transverse ones.
This present study aimed to study this using TEM with scanning electron microscopy as
an auxiliary tool, whereas Sato and Mann (2012) used SEM extensively. However, there
are no published micrographs for comparison. The TEM micrographs showed a
perinuclear Golgi arrangement in the auxospore and the nucleus was huge in size.
Bedoshvili and Likhoshway (2012) reported that the number of Golgi dictyosomes was
proportional to the cell size where the larger cell volume had the higher number of
Golgi dictyosomes. This present study showed that the auxospore stage had the higher
number of Golgi dictyosomes, and this could be related to the physiological state of the
cell, which is growing and increasing in size at an astonishing rate (Sato and Mann
2012).
In conclusion, diatom classification is a controversial field as the taxonomic features are
variable and molecular phylogeny adds another dimension of complexity. Araphids are
very abundant and have important environmental and economic implications (Round et
al. 1990), but their taxonomy has long been ignored, perhaps because of their
morphological simplicity (Round et al. 1990). The distinctive features of the main
groups of araphid diatoms are not fully established, and many new species are classified
as araphids that have characteristics intermediate between centric and araphid diatoms.
P. trainorii is an araphid pennate species that morphologically looks much more like a
typical centric species and for which there has been no previous ultrastructural
description. It has recently been shown to have a unique pattern of gametogenesis, with
motile male gametes that appear to glide along fine cytoplasmic threads which may or
may not be related to flagella (Sato et al. 2011). Transmission electron microscopy
resolved this issue and confirmed that the thread-like structures in P. trainorii are not
flagella, due to the absence of any basal body associated with the gamete nuclei of P.
trainorii. Further, gametogenesis in P. trainorii could be induced in the male and
female strains separated by agar through the pheromones, this species made an ideal
model in which to follow the separate ultrastructural differentiation of male and female
gametes and auxospore structure. Therefore, gametes were mixed and the development
of their resting zygotes followed. The results of the present study showed that the fine
structures of the male and female gametes were different, although they appeared
similar under light microscopy. Furthermore, the fine structure of the auxospores had
phylogenetic significance at higher taxonomic levels (Medlin and Kaczmarska 2004);
however, auxospore evolution is still not fully understood and further investigation is

183
needed. The ultrastructural features of P. trainorii’s auxospore resembled the Clade 2b
auxospore structure, in the context of the modern molecular phylogeny of diatoms as
defined by Medlin and Kaczmarska (2004). Further, the results of this study supported
the conclusion that the Golgi arrangement relative to the nucleus was consistent with the
characteristics of phylogenetic clades proposed by Medlin and Kacmarska (2004), and
that the pyrenoid structure was more variable than was previously supposed (Schmid
2001).

184
Chapter 5. Conclusion
Understanding cell ultrastructure has greatly enhanced the knowledge of how cells
work. Identifying the internal organization of cellular components and following their
changes during biological processes such as cell division (Pickett-Heaps et al. 1975),
gametogenesis (Jensen et al. 2003) and their response to environmental stressors
(Alhasan et al. 1987) has greatly enhanced the understanding of these processes. The
main aim of this thesis was to satisfy the requirements of the Kuwait Government
Scholarship so that the present writer can become qualified in microalgae ultrastructure.
To this end, two different scientific problems using the transmission electron
microscope (TEM) were investigated and described in this thesis. Firstly, the effects of
decadienal on cell structure and lipid production were investigated by quantifying lipid
production in two important biofuel producing algae, Dunaliella salina and
Nannochloropsis oculata. Secondly, for the first time, the ultrastructure of the
phylogenetically interesting araphid pennate diatom Pseudostaurosira trainorii was
documented. The ultrastructure of cellular organelles and gametogenesis was placed in
the context of current theories of diatom taxonomy based on molecular phylogeny.
Electron microscopy is the only technique that enables the distribution and structure of
intracellular organelles to be examined at high resolution.
Chapter 3 of this thesis summarised the first investigation of the effects of the so-called
infochemical decadienal on cell ultrastructure in two important biofuel producing
microalgal species. The sustainability of biofuel production depends on many factors,
one of them being the lipid content of algal cells. The higher the lipid content, the more
cost-effective the biofuel production will be. It has recently been shown that decadienal
induced lipid production in Nannochloropsis (Taylor et al. 2012), which could make the
process of biofuel production more economical. However, little is known about how
decadienal work. One assumption was that it may be bringing about premature
senescence of cells. Therefore, as part of this investigation, the effects of decadienal on
cell ultrastructure in Dunaliella and Nannochloropsis was compared with the
ultrastructural changes that occurred in naturally senescing (stationary) cultures. In,
addition, how lipid is structurally organised in cells, whether as discrete lipid globules
or as part of cellular structures such as membranes, will clearly impact on how easily it
can be extracted and, thus, on the cost effectiveness of biofuel production. Neutral lipids
are found in the cell as separate lipid bodies, and an increase in their volume may be

185
directly relevant to biofuel production. The use of electron microscopy can differentiate
between these discrete lipid bodies and structural lipids (Wang et al. 2009), which
cannot be discriminated by chemical extraction. This study showed an increase in lipid
production in D. salina at very high decadienal concentrations, which induced cell
apoptosis. This is consistent with the results of Taylor et al. (2012) who reported
significant increases in lipid production at high decadienal concentrations, which
limited cell growth. This present study quantified lipid production based on well-known
mathematical concepts using electron microscopy to estimate the lipid volume fraction
(Steer 1981), whereas, previous studies have quantified lipids by dry mass (Sharma et
al. 2012); or as arbitrary fluorescence units per cell (Tylor et al. 2012). It is difficult to
reconcile these different measurements and to compare dry mass values directly with
volume fractions. These results, together with the apparent induction of apoptosis,
support the conclusion that decadienal acts as a stressor. However, it does not appear to
cause the cell to enter the stationary phase prematurely, since it induced less lipid
production than in normal stationary phase cells.
The use of electron microscopy as a quantitative method may have some limitations, as
the volume fraction percentages based on microscopy might reflect the status within the
cell rather than the whole population (Solomon et al. 1985). On one hand, using
stereological principles to estimate the fraction volume of lipid droplets overcomes this
limitation as some sections contained lipid droplets while others did not due to random
sampling of the sections themselves, and the thickness of a section is tiny in comparison
to total cell thickness (Russ 1986). On the other hand, it has been reported that lipid
accumulation in Ankistrodesmus can be assessed on a daily basis using epifluorescence
microscopy, and it has been demonstrated that the number of cells accumulating lipid
increased over time rather than the quantity of lipid per individual cell increasing
(Solomon et al. 1986). In addition, Vardi et al. (2006) suggested that early responding
cells can induce intracellular communication that could be transmitted within a diatom
population in response to decadienal. Therefore, the volume fraction of the lipid body in
this present study was very small; however, the chemical extraction of lipid from the
whole population showed significant results (Taylor et al. 2012).
In order to reach a better understanding of lipid production and to increase its potential
using decadienal or any other similar chemical inducers, it is clear that two levels of
understanding are required: firstly, of lipid production and storage within a single (or
model) cell; and, secondly, of lipid production within a population. For example, the

186
real mechanism of lipid induction by decadienal could not be detected, although one of
its effects is the induction of oxidative stress (Vardi et al. 2006) and recent research has
shown that oxidative stress could increase lipid production in D. salina species
(Yilancioglu et al. 2014). Another example is the results found here for N. oculata. The
cell responses in this species to ethanol and decadienal seemed to result in similar
ultrastructural changes. Analysis of such results could indicate that it is a general
biological response of N. oculata to a chemical stressor or it may simply be an induced
artefact of fixation. The apparent induction of lipid in ethanol-treated cells as well as in
decadienal-treated cells suggests the induction of lipids by both of these chemicals
(Musgrave et al. 1992; Taylor et al. 2012). Furthermore, it could indicate a synergistic
effect of decadienal and ethanol. Previous reports suggest that decadienal was working
synergistically with heavy metals (Caldwell et al. 2005; Taylor et al. 2005). The
presence of ultrastructural changes seen in the present study were comparable to those
seen following fixation with glutaraldehyde alone (Chapter 2, protocols one, two, three)
and their absence in ethanol-treated samples may indicate that ethanol could make
decadienal stronger or that the fixation protocol did not work with ethanol and
decadienal together because of their synergistic effect. This indicates the importance of
understanding the effect of all chemical factors on the cell, as it is very problematic to
fix and embed N. oculata successfully (Hibberd 1981; Lubian 1982 in Solomon et al.
1986). As the electron microscope is expensive, the repetition of experiments using
methanol as solvent was difficult.
One important point that results from this study is that more detailed signs of apoptosis
were observed, as the internal apoptosis lesions that are invisible with light microscopy
are clearly visible with TEM. There is an active debate about the evolution of
programmed cell death and its origins in phytoplanktonic photosynthetic organisms
(Bidle and Falkowski 2004). The signs of apoptosis were different in D. salina and N.
oculata, and these two organisms evolved from two different algal groups from the
green and red lineages. Given the premise that metacaspases were found in
Chlamydomonas reinhardtii, which belongs to the green lineage, and the marine diatom
Thalassiosira pseudonana, which belong to the red lineage, the present results indicate
that both D. salina and N. oculata could have different programmed cell death
mechanisms in response to decadienal. This might indicate that the evolving
mechanisms of PCD in the two different lineages of microscopic algae are different.

187
Chapter 4 documented the cell ultrastructure of Pseudostaurosira trainorii for the first
time and permitted a detailed comparison with other diatom species in the context of
modern diatom classification based on molecular phylogeny. Regarding P. trainorii the
findings here support the classification of diatoms based on the type of Golgi, yet it has
an undescribed pyrenoid structure. Available information is very sparse, as diatom
research has shifted from description to a focus on silica biomineralization (Lopez et al.
2005) and nanotechnology (Gordon et al. 2008). On the other hand, molecular
phylogeny itself is a subject of extensive research. Molecular phylogeny techniques
vary in their accuracy and results. For example, the current status of the class
Mediophyceae is under debate, having been accepted by Medlin and Kaczmarska
(2004) and questioned by Alverson and Theriot (2005) and Williams and Kociolek
(2007). In addition, some features may be acquired separately as a result of other
factors, for example environmental pressure or natural selection, and may not indicate
the same ancestor. For example, Toxarium is a centric diatom with an elongated shape.
Studies have shown that it acquired its elongated shape separately (Kooistra et al.
2003b). Therefore, the molecular phylogeny and ultrastructural correlation evidence
provided by Medlin and Kaczmarska (2004) needs further investigation.
The detection of gametogenesis in P. trainorii has many limitations, because it is an
expensive and time-consuming procedure. In addition, the random sectioning of
samples makes it difficult to obtain micrographs for all of the stages of the
gametogenesis process. However, the present study provides significant information
concerning ultrastructure. Sato et al. (2011) reported that both male and female gametes
under light microscopy were similar; however, various differences between them have
been detected in this study. It has been confirmed that P. trainorii male gametes are
non-flagellated.
In conclusion, on the one hand, the transmission electron microscope, confirmed that
the lipid bodies volume fraction induced by decadienal constituted a very low fraction
of cell volume. Thefore, the induction of lipid bodies’ by high concentration decadienal
as here would not be suitable for commercial use and total lipid content of the cell is an
important factor in improving the cost effectiveness of biofuel extraction plants. The use
of the electron microscope is valuable to study structures that cannot be seen using a
light electron microscope. It was used in this study to detect the effects of decadienal on
the cell structure of D. salina and N. oculata. The effect of decadienal on the cell
structure of D. salina suggests it is a stress factor (or a toxin); at high concentration (50

188
M) it induced signs of programmed cell death. The cell could provide a suitable
detoxification mechanism for decadienal at very low concentrations (2 M) as the cell
structure was similar to controls.
On the other hand, the transmission electron microscope was useful in confirmaing that
the thread-like structures in the P. trainorii male gamete were not flagella. The results
of this present study showed partial agreement with the hypothesis of Medlin and
Kaczmarska (2004) as it confirmed that the Golgi structure in P. trainorii matched their
hypothesis, while the pyrenoid structure did not. Therefore, more studies are needed in
the future to investigate the relation between the ultrastructure and molecular
phylogeny.

189
6. Appendices
Appendix 1
Specimen processing for transmission electron microscopy
Fix in 2% Glutraldehyde in Cacodylate buffer.
Rinse in Cacodylate Buffer 2 X 15 minutes then leave in the buffer at 4 oC for 3
changes over several hours.
Secondary fix in 1% Osmium Tetraoxide in buffer for 1 hr, dispose of waste in
container provided in fume hood
Rinse in buffer for a minimum of 2 X15 minutes (can be left in buffer overnight
at 4 oC so rest of schedule can be completed in 2 days.
Dehydration
25% acetone 30 min
50% acetone 30 min
75% acetone 30 min
From this point on, use acetone stored in dessicator (not from wash bottles)
100% acetone 1 hr
100% acetone 1 hr
Using TAAB epoxy resin kit, mixed to manufacturer’s specifications:
Impregnate with
25% resin in acetone 1 hr
50% resin in acetone 1 hr
75% resin in acetone 1 hr
100% resin in acetone 1 hr
(can be left overnight on rotator at this stage, store the liquid resin in the dessicator)
100% resin 1hr
100% resin 1hr
100% resin at least 3 hrs
Embed in fresh 100% resin at 60 oC oven overnight
Polymerise all items contaminated with resin in 60 oC oven overnight before
appropriate disposal

190
Appendix 2
Statistical analysis
Dunaliella salina: testing the differences between volume fractions of log and
stationary phase
Testing normality for linear and stationary growing cells
Table A1: Results of Anderson-Darling tests of original data of organelles’ volume
fractions in Dunaliella salina log phase cells
Organelle A2 n p
Nucleus 0.511 30 0.181
Mitochondria 0.425 30 0.296
Lipid 9.356 30 <0.005
Vacuoles 2.191 30 <0.005
Chloroplast 0.227 30 0.798
Cytoplasm 0.340 30 0.474
Thylakoid membrane 0.286 30 0.601
Starch grains 0.370 30 0.403
Plastoglobuli 1.803 30 <0.005
Pyrenoid 1.621 30 <0.005
Matrix 0.345 30 0.461

191
Table A2: Results of Anderson-Darling tests of original data of organelles’ volume
fractions in Dunaliella salina stationary phase cells
Organelle A2 n p
Nucleus 2.561 30 <0.005
Mitochondria 3.764 30 <0.005
Lipid 0.295 30 0.574
Vacuoles 0.898 30 0.019
Cytoplasm 0.453 30 0.254
Chloroplast 0.348 30 0.454
Thylakoid membrane 0299 30 0.562
Starch grains 0.518 30 0.173
Plastoglobuli 1.443 30 <0.005
Pyrenoid 6.328 30 <0.005
Matrix 0.885 30 0.021
Table A3: Results of Anderson-Darling tests of transformed data of organelles’ volume
fractions in Dunaliella salina log phase cells. Transformation formula: =ASIN
(SQRT(A3/100))
Organelle A2 n p
Lipid 9.578 30 <0.005
Vacuoles 2.055 30 <0.005
Plastoglobuli 2.035 30 <0.005
Pyrenoid 2.885 30 <0.005

192
Table A4: Results of Anderson-Darling tests of transformed data of organelles’ volume
fractions in Dunaliella salina stationary phase cells. Transformation formula: =ASIN
(SQRT(A3/100))
Organelle A2 n p
Nucleus 2.063 30 <0.005
Mitochondria 0.808 30 0.032
Matrix 0.707 30 0.059
Test of variance
Table A5: Results of F-tests to test the variances for Dunaliella salina log phase and
stationary phase volume fractions of different organelles
Organelle DF F P value
Cytoplasm 29 0.58 0.374
Mitochondria 29 0.61 <0.005
Chloroplast 29 2595.58 0.07
Matrix 29 0.5 <0.005
Thylakoid membrane 29 356.57 0.183
Starch grains 29 1.40 0.15

193
Dunaliella salina: testing the differences between volume fractions of decadienal-
treated cells
Table A6: Results of Anderson-Darling tests for original data of organelles’ volume
fractions in Dunaliella salina cells treated with 0 M decadienal
Organelle A2 n p
Nucleus 1.478 30 <0.005
Mitochondria 0.953 30 <0.005
Lipid error
Vacuoles 1.941 30 <0.005
Chloroplast 0.369 30 0.405
Cytoplasm 0.294 30 0.578
Thylakoid membrane 0.475 30 0.223
Starch grains 0.537 30 0.155
Plastoglobuli 1.760 30 <0.005
Pyrenoid 0.813 30 0.031
Matrix 0.292 30 0.582
Table A7: Results Anderson-Darling tests of transformed data of organelles’ volume
fractions in Dunaliella salina cells treated with 0 M decadienal
Organelle A2 n p
Nucleus 1.557 30 <0.005
Mitochondria 1.138 30 <0.005
Lipid Error
Vacuoles 0.840 30 0.027
Plastoglobuli 1.557 30 <0.005

194
Table A8: Results of Anderson-Darling tests of original data of organelles’ volume
fractions in Dunaliella salina sample treated with methanol
Organelle A2 n p
Nucleus 0.625 30 0.094
Mitochondria 0.244 30 0.741
Lipid error
Vacuoles 1.332 30 <0.005
Chloroplast 0.412 30 0.319
Cytoplasm 0.480 30 0.217
Thylakoid membrane 0.541 30 0.152
Starch grains 0.657 30 0.078
Plastoglobuli 2.960 30 <0.005
Pyrenoid 1.044 30 0.008
Matrix 0.425 30 0.296
Table A9: Results of Anderson-Darling tests of original data of organelles’ volume
fractions in Dunaliella salina sample treated with 2.5 M decadienal
Organelle A2 n p
Nucleus 0.681 30 0.068
Mitochondria 0.889 30 0.020
Lipid 11.090 30 <0.005
Vacuoles 1.671 30 <0.005
Chloroplast 0.666 30 0.074
Cytoplasm 0.358 30 0.431
Thylakoid membrane 0.216 30 0.831
Starch grains 0.182 30 0.905
Plastoglobuli 2.358 30 <0.005
Pyrenoid 1.536 30 <0.005
Matrix 0.499 30 0.194

195
Table A10: Results of Anderson-Darling tests for original data of organelles’ volume
fractions in Dunaliella salina sample treated with 50 M decadienal
Organelle A2 n p
Nucleus 0.668 30 0.073
Mitochondria 5.914 30 <0.005
Lipid 1.103 30 0.006
Vacuoles 0.223 30 0.809
Chloroplast 0.349 30 0.451
Cytoplasm 0.323 30 0.512
Thylakoid membrane 0.551 30 0.142
Starch grains 0.242 30 0.7848
Plastoglobuli 2.331 30 <0.005
Pyrenoid 1.012 30 0.010
Matrix 0.387 30 0.367
Table A11: Results of Levene’s tests of normally distributed data of organelles’ volume
fractions in Dunaliella salina samples treated with methanol, 0 M, 2.5 M, and 50 M
decadienal
Organelle L p
Chloroplast 3.82 0.012
Cytoplasm 2.19 0.092
Thylakoid
membranes 0.68 0.568
Starch grains 1.02 0.385
Matrix 0.17 0.917

196
Nannochloropsis oculata: testing the differences between volume fraction of log
and stationary phase
Table A12: Results of Anderson-Darling tests of original data of organelles’ volume
fractions in Nannochloropsis oculata log phase sample
Organelle A2 n p
Nucleus 1.34 30 0.005
Mitochondria 0.37 30 0.407
Lipid 11.09 30 0.005
Vacuoles 2.10 30 0.005
Chloroplast 0.53 30 0.165
Cytoplasm 0.51 30 0.177
Thylakoid membrane 0.44 30 0.276
Cell wall 0.34 30 0.481
Plastoglobuli 7.55 30 0.005
Matrix 0.40 30 0.339

197
Table A13: Results of Anderson-Darling tests of original data of organelles’ volume
fractions in Nannochloropsis oculata stationary phase sample
Organelle A2 n p
Nucleus 1.02 30 0.010
Mitochondria 1.28 30 0.005
Lipid 0.43 30 0.286
Vacuoles 9.35 30 0.005
Cytoplasm 0.77 30 0.039
Chloroplast 1.11 30 0.005
Thylakoid membrane 1.20 30 0.005
Cell wall 0.39 30 0.360
Plastoglobuli 4.50 30 0.005
Matrix 1.11 30 0.006
Storage bodies 1.11 30 0.006
Table A14: Results of Anderson-Darling tests of transformed data of organelles’
volume fractions in Nannochloropsis oculata log phase sample. Transformatioin
formula: =ASIN (SQRT(A3/100))
Organelle A2 n p
Lipid 11.09 30 0.005
Vacuoles 1.31 30 0.005
Plastoglobuli 7.87 30 0.005
Nucleus 1.26 30 0.005

198
Table A15: Results of Anderson-Darling tests of transformed data of organelles’
volume fractions in Nannochloropsis oculata stationary phase cells. Transformation
formula: =ASIN (SQRT(A3/100))
Organelle A2 n p
Cytoplasm 0.30 30 0.553
Mitochondria 0.91 30 0.017
Chloroplast 0.50 30 0.190
Matrix 0.47 30 0.227
Thylakoid membrane 0.48 30 0.216
Table A16: Results of F-tests to test the variances for Nannochloropsis oculata log
phase and stationary phase volume fractions of different organelles
Organelle DF F p value
Cytoplasm 29 5726.21 <0.001
Chloroplast 29 9180.67 <0.001
Matrix 29 5876.72 <0.001
Thylakoid membrane 29 8785.65 <0.001
Cell wall 29 0.43 0.027

199
Nannochloropsis oculata: testing the differences between volume fractions of
decadienal-treated cells
Table A17: Results of Anderson-Darling tests of original data of organelles’ volume
fractions in Nannochloropsis oculata sample treated with 0 M decadienal
Organelle A2 n p
Nucleus 0.48 30 0.218
Mitochondria 0.37 30 0.407
Lipid 2.26 30 0.005
Vacuoles 1.57 30 0.005
Chloroplast 0.38 30 0.383
Cytoplasm 0.49 30 0.205
Thylakoid membrane 0.44 30 0.279
Cell wall 0.73 30 0.052
Plastoglobuli 10.19 30 0.005
Matrix 0.25 30 0.712
Table A18: Results of Anderson-Darling tests of original data of organelles’ volume
fractions in Nannochloropsis oculata sample treated with ethanol
Organelle A2 n p
Nucleus 1.40 30 0.005
Mitochondria 0.27 30 0.644
Lipid 0.97 30 0.013
Vacuoles 2.11 30 0.005
Chloroplast 0.53 30 0.159
Cytoplasm 0.49 30 0.210
Thylakoid membrane 0.44 30 0.277
Cell wall 0.43 30 0.282
Plastoglobuli 7.15 30 0.005
Matrix 0.62 30 0.100

200
Table A19: Results of Anderson-Darling tests of original data of organelles’ volume
fractions in Nannochloropsis oculata sample treated with 1 M decadienal
Organelle A2 n p
Nucleus 0.44 30 0.277
Mitochondria 1.72 30 0.005
Lipid 0.79 30 0.035
Vacuoles 1.87 30 0.005
Chloroplast 1.06 30 0.007
Cytoplasm 0.21 30 0.851
Thylakoid membrane 0.78 30 0.039
Cell wall 0.26 30 0.685
Plastoglobuli 4.76 30 0.005
Matrix 0.38 30 0.385
Table A20: Results of Anderson-Darling tests of original data of organelles’ volume
fractions in Nannochloropsis oculata sample treated with 10 M decadienal
Organelle A2 n p
Nucleus 0.83 30 0.029
Mitochondria 0.33 30 0.493
Lipid 0.67 30 0.071
Vacuoles 2.40 30 0.005
Chloroplast 0.29 30 0.600
Cytoplasm 0.37 30 0.405
Thylakoid membrane 0.33 30 0.490
Cell wall 0.62 30 0.097
Plastoglobuli 4.96 30 0.005
Matrix 0.35 30 0.445

201
Table A21: Results of Anderson-Darling tests for original data of organelles’ volume
fractions in Nannochloropsis oculata sample treated with 50 M decadienal
Organelle A2 n p
Nucleus 0.68 30 0.068
Mitochondria 1.43 30 0.005
Lipid 1.92 30 0.005
Vacuoles 2.30 30 0.005
Chloroplast 0.18 30 0.906
Cytoplasm 0.80 30 0.034
Thylakoid membrane 0.13 30 0.979
Cell wall 1.82 30 0.005
Plastoglobuli 5.12 30 0.005
Matrix 0.30 30 0.566
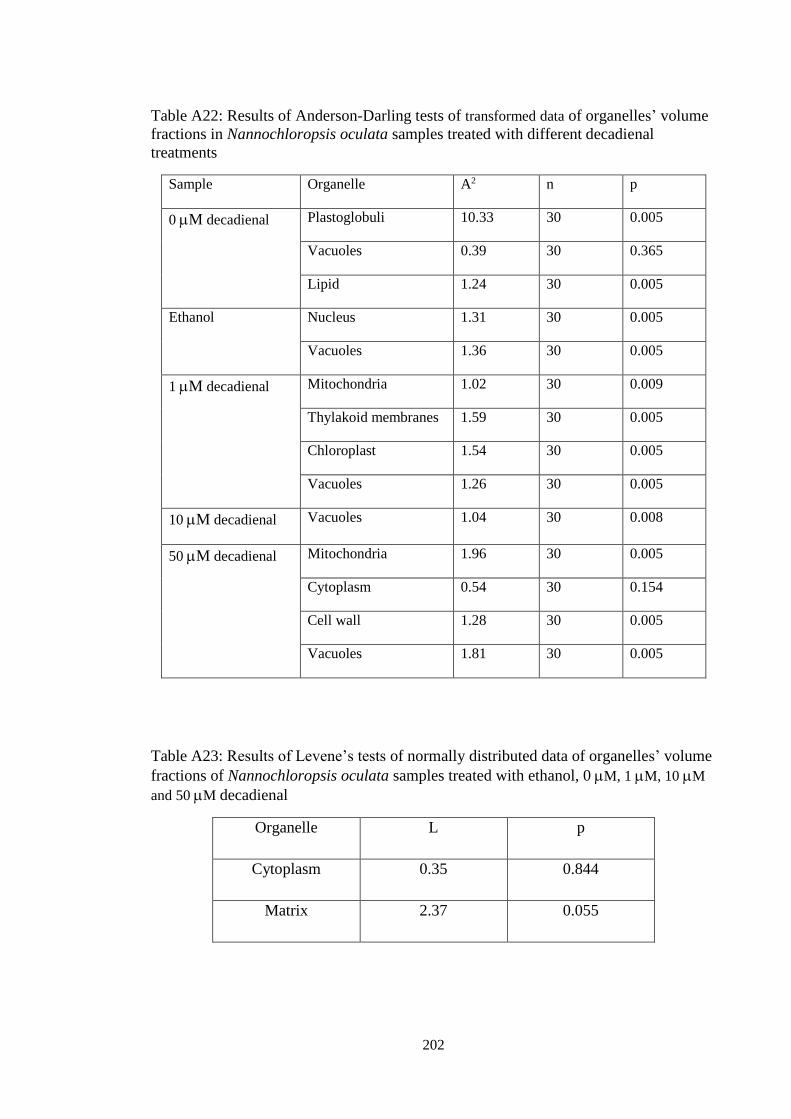
202
Table A22: Results of Anderson-Darling tests of transformed data of organelles’ volume
fractions in Nannochloropsis oculata samples treated with different decadienal
treatments
Sample Organelle A2 n p
0 M decadienal Plastoglobuli 10.33 30 0.005
Vacuoles 0.39 30 0.365
Lipid 1.24 30 0.005
Ethanol Nucleus 1.31 30 0.005
Vacuoles 1.36 30 0.005
1 M decadienal Mitochondria 1.02 30 0.009
Thylakoid membranes 1.59 30 0.005
Chloroplast 1.54 30 0.005
Vacuoles 1.26 30 0.005
10 M decadienal Vacuoles 1.04 30 0.008
50 M decadienal Mitochondria 1.96 30 0.005
Cytoplasm 0.54 30 0.154
Cell wall 1.28 30 0.005
Vacuoles 1.81 30 0.005
Table A23: Results of Levene’s tests of normally distributed data of organelles’ volume
fractions of Nannochloropsis oculata samples treated with ethanol, 0 M, 1 M, 10 M
and 50 M decadienal
Organelle L p
Cytoplasm 0.35 0.844
Matrix 2.37 0.055

203
7. References
Aaronson S (1973) Effect of incubation temperature on the macromolecular and lipid
content of the phytoflagellate Ochromonas danica. Journal of Phycology 9:
111-113.
Adl SM, Simpson AGB, Farmer MA, Andersen R A, Anderson OR, Barta JR, Bowser
SS, Brugerolle G, Fensome RA, Fredericq S, James TY, Karpov S, Kugrens
P, Krug J, Lane CE, Lewis LA, Lodge J, Lynn DH, Mann DG, Mccourt RM,
Mendoza L, Moestrup O, Mozley-Stanridge SE, Nerad TA, Shearer CA,
Smirnov AV, Spiegel FW, Taylor MFJR (2005) The new higher level
classification of eukaryotes with emphasis on the taxonomy of protists.
Journal of Eukaryotic Microbiology 52: 399-451.
Adl SM, Simpson AGB, Lane CE, Lukes J, Bass D, bowser SS, Brown MW, Burki, F,
Dunthorn M, Hampl V, Heiss A, Hoppenrath M, Lara E, Gall L, Lynn DH,
Mcmanus H, Mitchell EAD, Mozley-Stanridge SE, Parfrey LW, Pawlowski J,
Rueckert S, Shadwick L, Schoch CL, Smirnov A, Spiegeln FW (2012) The
revised classification of eukaryotes. Journal of Eukaryotic Microbiology 59:
429-493.
Adolph S, Bach S, Blondel M, Cueff A, Moreau M, Pohnert G, Poulet SA, Wichard T,
Zuccaro A (2004) Cytotoxicity of diatom-derived oxylipins in organisms
belonging to different phyla. Journal of Experimental Biology 207: 2935-
2946.
Alhasan RH, Ghannoum MA, Sallal A-K, Abu-Elteen KH, Radwan SS (1987)
Correlative changes of growth, pigmentation and lipid composition of
Dunaliella salina in reponse to halostress. Journal of General Microbiology
133: 2607-2616.
Alonso DL, Belarbi EH, Fernández-Sevilla JM, Rodríguez-Ruiz J, Grima EM (2000)
Acyl lipid composition variation related to culture age and nitrogen
concentration in continuous culture of the microalga Phaeodactylum
tricornutum. Phytochemistry 54: 461-471.

204
Alverson AJ, Theriot EC (2005) Comments on recent progress toward reconstructing
diatom phylogeny. Journal of Nanoscience and Nanotechnology 5: 57-62.
Ameisen JC (2002) On the origin, evolution, and nature of programmed cell death: a
timeline of four billion years. Cell Death and Differentiation 9: 367-393.
Antia NJ, Bisalputra T, Cheng JY, Kallery JP (1975) Pigment and cytological evidence
for reclassification of Nanochloris oculata and Monallantus salina in the
Eustigmatophyceae. Journal of Phycology 11: 339-343.
Arany I, Megyesi JK, Kaneto H, Price PM, Safirstein RL (2004) Cisplatin-induced cell
death is EGFR/src/ERK signaling dependent in mouse proximal tubule cells.
American Journal of Physiology and Renal Physiology 28: F543-F549.
Archibald JM (2005) Jumping genes and shrinking genomes: probing the evolution of
eukaryotic photosynthesis with genomics. IUBMB Life 57: 539-547.
Archibald JM (2008) Plastid evolution: Remnant algal genes in ciliates. Current
Biology 18: R663-R665.
Ban S, Burns C, Castel J, Chaudron Y, Christou E, Escribano R, Umani SF, Gasparini
S, Ruiz FG, Hoffmeyer M, Ianora A, Kang HK, Laabir M, Lacoste A, Miralto
A, Ning X, Poulet S, Rodriguez V, Runge J, Shi J, Starr M, Uye S, Wang Y
(1997). The paradox of diatom-copepod interactions. Marine Ecology
Progress Series 157: 287-293.
Barnwal BK, Sharma MP (2005) Prospects of biodiesel production from vegetables oils
in India. Renewable and Sustainable Energy Reviews 9: 363-78.
Bedoshvili YD, Likhoshway YV (2012) The cell ultrastructure of diatoms: implications
for phylogeny? In: The Transmission Electron Microscope, Maaz K (ed.),
ISBN: 978-953-51-0450-6, InTech, available from
http://cdn.intechopen.com/pdfs-wm/34882.pdf. Accessed 13 October 2015
Bedoshvili YD, Popkova TP, Likhoshway (2009) Chloroplast structure of diatoms of
different classes. Cell and Tissue Biology 3: 297-310.
Belarbi EH, Molina E, Chisti Y (2000) A process for high yield and scaleable recovery
of high purity eicosapentaenoic acid esters from microalgae and fish oil.
Enzyme and Microbial Technology 26: 516-29.

205
Beller M, Thiel K, Thul PJ, Jakle H (2010) Lipid droplets: a dynamic organelle moves
into focus. FEBS Letters 584: 2176-2182.
Ben-Amotz A, Avron M (1983) Accumulation of metabolites by halotolerant algae and
its industrial potential. Annual Reviews in Microbiology 37: 95-119.
Ben-Amotz A, Katz A, Avron M (1982) Accumulation of -carotene in halotolerant
algae: Purification and characterization of -carotene-rich globules from
Dunaliella bardawil (Chlorophyceae). Journal of Phycology 18: 529-537.
Berges JA, Falkowski PG (1998) Physiological stress and cell death in marine
phytoplankton: induction of proteases in response to nitrogen or light
limitation. Limnology Oceanography 43: 129-135.
Berman-Frank I, Bidle K, Haramaty L, Falkowski P (2004) The demise of the marine
cyanobacterium, Trichodesmium spp., via an autocatalyzed cell death
pathway. Limnology Oceanography 49: 997-1005.
Berner T (1993) Ultrastructure of Microalgae. CRC Press, London.
Berube K, Dodge J, Ford T (1999) Effects of chronic salt stress on the ultrastructure of
Dunaliella bioculata (Chlorophyta, Volvocales): mechanisms of response and
recovery. European Journal of Phycology 34: 117-123.
Bhattachary D, Medlin L, Wainwright PO, Ariztia EY, Bibeau C, Stickel SK, Sogin ML
(1992) Algae containing chlorophylls a + c are paraphyletic: molecular
evolutionary analysis of the Chromophyta. Evolution 46: 1808-1817.
Bianchi ME, Manfredi A (2004) Chromatin and cell death. Biochimica et Biophysica
Acta 1677: 181-6.
Bidle KD, Falkowski PG (2004) Cell death in planktonic, photosynthetic
microorganisms. Nature Reviews Microbiology 2: 643-655.
Borowitzka LJ, Borowitzka MA (1990) Commercial production of -carotene by
Dunaliella salina in open ponds. Bulletin of Marine Science 47: 244-252.
Borowitzka MA, Siva CJ (2007) The taxonomy of the genus Dunaliella (Chlorophyta,
Dunaliellales) with emphasis on the marine and halophilic species. Journal of
Applied Phycology 19: 567-590.

206
Borowitzka U, Brorowitzka MA, Moulton TP (1984) The mass culture of Dunaliella
salina for fine chemicals: From laboratory to pilot plant. Hydrobiologia
116/117: 115-134.
Boussiba S, Vonshak A, Cohen Z, Avissar Y, Richmond A (1987) Lipid and biomass
production by the halotolerant microalga Nannochloropsis salina. Biomass
12: 37-47.
Brand N, Arnold C (1986) Improved structural preservation of the mature zygote of
Chlamydomonas reinhardii by freeze-substitution fixation compared with
chemical fixation with special attention to the mitochondria. Endocytobiosis
and Cell Research 3: 79-95.
Bredesen DE (2007) Key note lecture: toward a mechanistic taxonomy for cell death
programs. Stroke 38: 652-660.
Brennan L, Owende P (2010) Biofuels from microalgae review of technologies for
production, processing, and extractions of biofuels and co-products.
Renewable and Sustainable Energy Reviews 14: 557-77.
Brown MR, Dunstan GA, Norwood SJ, Miller KA (1996). Effects of harvest stage and
light on the biochemical composition of the diatom Thalassiosira
pseudonana. Journal of Phycology 32: 64-73.
Brown MR, Garland CD, Jeffrey SW, Jameson ID, Leroi JM (1993) The gross and
amino acid compositions of batch and semi-continuous cultures of Isochrysis
sp. (clone T.ISO), Pavlova lutheri and Nannochloropsis oculata. Journal of
Applied Phycology 5: 285-296.
Buchanan-Wollaston V, Earl S, Harrison E, Mathas E, Navabpour S, Page T, Pink D
(2003) The molecular analysis of leaf senescence: a genomics approach. Plant
Biotechnology Journal 1: 3-22.
Bulte L, Wollman FA (1992) Evidence for a selective destabilization of an integral
membrane protein, the cytochrome b6/f complex, during gametogenesis in
Chlamydomonas reinhardtii. European Journal of Biochemistry 204: 327-
336.
207
Buttino I, Miralto A, Ianora A, Romano G, Poulet SA (1999) Water soluble extracts of
the diatom Thalassiosira rotula induce aberrations in embryonic tubulin
organisation of the sea urchin Paracentrotus lividus. Marine Biology 134
147-154.
Caldwell GS, Bentley MG, Olive PJW (2004) First evidence of sperm motility
inhibition by diatom aldehyde 2E, 4E-decadienal. Marine Ecology Progress
Series 273: 97-108.
Caldwell GS, Lewis C, Olive PJW, Bentley MG (2005). Exposure to 2, 4-decadienal
negatively impacts upon marine invertebrate larval fitness. Marine
Environmental Research 59: 405-417.
Caldwell GS, Olive PJW, Bentley MG (2002) Inhibition of embryonic development and
fertilisation in broadcast spawning marine invertebrates by water soluble
diatom extracts and the diatom toxin 2-trans, 4-trans decadienal. Aquatic
Toxicology 60: 123-137.
Cantrell KB, Ducey T, Ro KS, Hunt PG (2008) Livestock waste-to-bioenergy
generation opportunities. Bioresource Technology 99: 7941- 53.
Casotti R, Mazza S, Brunet C, Vantrepotte V, Ianora A, Miralto A (2005) Growth
inhibition and toxicity of the diatom aldehyde 2-trans, 4-trans-decadienal on
Thalassiosira weissflogii (Bacillariophyceae). Journal of Phycology 41: 7-20.
Castellano I, Ercolesi E, Palumbo A (2014) Nitric oxide affects ERK signalling through
down regulation of MAP kinase phosphatase levels during larval
development of the ascidian Ciona intestinalis. PLOS One 9: e102907. doi:
10.1371/journal.pone.0102907.
Castellano I, Ercolesi E, Romano G, Ianora A, Paluumbo A (2015) The diatom-derived
aldehyde decadienal affects life cycle transition in the ascidian Ciona
intestinalis through nitric oxide/ERK signalling. Open Biology 5: 140182.
Castro-Obregon S, Rao RV, del Rio G, Chen SF, Poksay KS, Rabizadeh S, Vesce S,
Zhang XK, Swanson RA, Bredesen DE (2004) Alternative, nonapoptotic
programmed cell death: mediation by arrestin 2, ERK2, and Nur77. Journal of
Biological Chemistry 279: 17543-17553.

208
Cavalier-Smith T (1999) Principles of protein and lipid targeting in secondary
symbiogenesis: euglenoid, dinoflagellate, and sporozoan plastid origins and
the eukaryote family tree. Journal of Eukaryotic Microbiology 46: 347-66.
Chang L, Lo W, Lin P (2005) Trans, Trans-2, 4-Decadienal, a product found in cooking
oil fumes, induces cell proliferation and cytokine production due to reactive
oxygen species in humans bronchial epithelial cells. Toxicological Sciences
87: 337-343.
Cheng-Wu Z, Zmora O, Kopel R, Richmond A (2001) An industrialised flat plate glass
reactor for mass production of Nannochloropsis sp. (Eustigmatophyceae).
Aquaculture 195: 35-49.
Chepurnov V, Mann D (2003) Auxosporulation of Licmophora communis
(Bacillarophyta) and a review of mating systems and sexual reproduction in
araphid pennate diatoms. Phycological Research 51: 1-12.
Chepurnov V, Mann D, Sabbe K, Vyverman W (2004) Experimental studies on sexual
reproduction in diatoms. International Reviews of Cytology 237: 91-154.
Chisti Y (2006) Microalgae as sustainable cell factories. Environmental Engineering
and Management Journal 5: 261-274.
Chisti Y (2007) Biodiesel from microalgae. Biotechnology Advances 25: 294-306.
Chisti Y (2008) Biodiesel from microalgae beats bioethanol. Trends in Biotechnology
26: 126-131.
Christenson L, Sims R (2011) Production and harvesting of microalgae for wastewater
treatment, biofuels, and bioproducts. Biotechnology Advances 29: 686-702.
Comes S, Locascio A, Silvestre F, d’Ischia M, Russo GL, Tosti E, Branno M, Palumbo
A (2007) Regulatory roles of nitric oxide during larval development and
metamorphosis in Ciona intestinalis. Developmental Biology 306: 772-784.
Converti A, Casazza AA, Ortiz EY, Perego P, Borghi MD (2009) Effect of temperature
and nitrogen concentration on the growth and lipid content of
Nannochloropsis oculata and Chlorella vulgaris for biodiesel production.
Chemical Engineering and Processing: Process Intensification 48: 1146-1151.

209
Cornillon S, Foa C, Davoust J, Buonavista N, Gross JD, Golstein P (1994) Programmed
cell-death in Dictyostelium. Journal of Cell Sciences 107: 2691- 2704.
Cowan AK, Rose PD, Horne LG (1992) Dunaliella salina: a model system for studying
the response of plant-cells to stress. Journal of Experimental Botany 43:
1535-1547.
Cox E (2011) Morphology: cell wall, cytology, ultrastructureal and morphogenetic
studies, in the diatom world, cellular origin, life in extreme habitats and
astrobiology 19: 21-45.
Cribb B, Armstrong W, Whittington I (2004) Simultaneous fixation using
glutaraldehyde and osmium tetroxide or potassium ferricyanide-reduced
osmium for the preservation of monogenean flatworms: an assessment for
merizocotyle icopae. Microscopy Research and Technique 63: 102- 110.
Davidovich N, Kaczmarska, Karpov S, Davidovich O (2012) Mechanism of male
gamete motility in araphid pennate diatoms from the genus Tabularia
(Bacillariophyta). Protist 163: 480-494.
Deponte M (2008) Programmed cell death in protists. Biochemica et Biophysica Acta
1783: 1396-1405.
Devi S, Santhanam AP, Rekha V, Ananth S, Prasath BB, Nandakumar R, Jeyanthi S,
Kumar D (2012) Culture and biofuel producing efficacy of marine
microalgae Dunaliella salina and Nannochloropsis sp.. Journal of Algal
Biomass Utilization 3: 38-44.
Dicke M, Sabelis M (1988) Infochemical terminology: based on cost–benefit analysis
rather than origin of compounds? Functional Ecology 2: 131-139.
Dodge JD (1973) The Structure of Algal Cells. Academic Press, London.
Drebes G (1977) Sexuality. In: The Biology of Diatoms: Botanical Monographs,
Warner D (ed) Vol. 13. Blackwell Scientific Publications, Oxford, pp. 250-
283.
Dunahay TG, Jarvis EE, Dais SS, Roessler PG (1996) Manipulation of microalgal lipid
production using genetic engineering. Applied Biochemistry and
Biotechnology 5758: 223-31.

210
Dunn SR, Thomason JC, Thissler ML, Bythell JC (2004) Heat stress induces different
forms of cell death in sea anemones and their endosymbiotic algae depending
on temperature and duration. Cell Death and Differentiation 1: 1213-1222.
Dunstan GA, Volkman JK, Barrett SM, Garland CD (1993) Changes in the lipid
composition and maximization of the polyunsaturated fatty acid content of
three microalgae grown in mass culture. Journal of Applied Phycology 5: 71-
83.
Edlund MB, Stoermer EF (1997) Ecology, evolution and systematic significance of
diatom life histories. Journal of Phycology 33: 897-918.
Einspahr KJ, Maeda M, Thompson GA (1988) Concurrent changes in Dunaliella salina
ultrastructure and membrane phospholipid metabolism after hyperosmoic
shock. Journal of Cell Biology 107: 529-538.
El-Sheek MM, Rady AA (1995) Effect of phosphorus starvation on growth,
photosynthesis and some metabolic processes in the unicellular green alga
Chlorella kessleri. Phyton 35: 139-151.
Eyden BP (1975) Light and electron microscope study of Dunaliella primolecta Bucher
(Volocida). Journal of Protozoology 22: 336-344.
Falciatore A, D’Alcala MR, Croot P, Bowler C (2000) Perception of environmental
signals by a marine diatom. Science 288: 2363-2366.
Falkowski PG, Katz M, Knoll AH, Quigg A, Raven JA, Schofield O, Taylor FJR (2004)
The evolution of modern eukaryotic phytoplankton. Science 305: 354-360.
Fedorov AS, Kosourov S, Ghirardi ML, Seibert M (2005) Continuous H2
photoproduction by Chlamydomonas reinhardtii using a novel two-stage,
sulfate-limited chemostat system. Applied Biochemistry and Biotechnology
121-124: 403-12.
Fogg GE (2001) Algal adaptation to stress: some general remarks. In: Algal Adaptation
to Environmental Stresses: Physiological, biochemical and molecular
mechanisms. Rai LC, Gaur JP (eds), Springer-Verlag Berlin, Germany, pp. 1-
19.

211
Fontana A, d’Ippolito G, Cutignano A, Romano G, Lamari N, Galluci AM, Cimino G,
Miralto A, Ianora A (2007) LOX-induced lipid peroxidation mechanism
responsible for the detrimental effect of marine diatoms on zooplankton
grazers. ChemBioChem 8: 1810-1818.
Franklin DJ, Berges JA (2004) Mortality in cultures of the dinoflagellate Amphidinium
carterae during culture senescence and darkness. Proceedings of the Royal
Society of London, Biology 271: 2099-2107.
Frohlich KU, Madeo F (2000) Apoptosis in yeast: a monocellular organism exhibits
altruistic behaviour. FEBS Letters 473: 6-9.
Fukuda H (1994) Programmed cell death of tracheary elements as a paradigm in plants.
Plant Molecular Biology 44: 245-253.
Fukuda H, Kond A, Noda H (2001) Biodiesel fuel production by transesterification of
oils. Journal of Bioscience and Bioengineering 92: 405- 416.
Gavrilescu M, Chisti Y (2005) Biotechnology: a sustainable alternative for chemical
industry. Biotechnology Advances 23:471-99.
Gerpen J (2005) Biodiesel processing and production. Fuel Processing Technology 86:
1097-107.
Ghirardi ML, Zhang JP, Lee JW, Flynn T, Seibert M, Greenbaum E (2000) Microalgae:
a green source of renewable H2. Trends in Biotechnology 18: 506-11.
Ginzburg M (1987) Dunaliella: a green alga adapted to salt. Advances in Botanical
Research 14: 93-183.
Glauert AM, Lewis PR (1998) Biological Specimen Preparation for Transmission
Electron Microscopy. Princeton University Press, Princeton, New Jersey,
USA.
Gomez PI, Gonzalez MA (2004) Genetic variation among seven strains of Dunaliella
salina (Chlorophyta) with industrial potential, based on RAPD banding
patterns and on nuclear ITS rDNA sequences. Aquaculture 233:149-162.

212
Gordon R, Losic D, Tiffany M, Nagy S, Sterrenburg F (2008) The glass menagerie:
diatoms for novel applications in nanotechnology. Trends in Biotechnology
27: 116-127.
Gottlieb RA, Nordberg J, Skowronski E, Babior BM (1996) Apoptosis induced in Jurkat
cells by several agents is preceded by intracellular acidification. Proceedings
of the National Academy of Sciences of the United States of America 93:
654-58.
Gouveia L, Oliveira A (2009) Microalgae as a raw material for biofuels production.
Journal of Industrial Microbiology and Biotechnology 36: 269-274.
Graham LE, Graham JM, Wilcox LW (2009) Algae (2nd ed). Pearson Education, San
Francisco, California, USA.
Graham LE, Wilcox LW (2000) Algae. Prentice-Hall, Inc., Upper Saddle River, New
Jersey, USA.
Greenberg JT (1996) Programmed cell death: a way of life for plants. Proceedings of
the Natural Academy of Sciences, USA 93: 12094-12097.
Greenwell HC, Laurens LML, Shields RJ, Lovitt RW, Flynn KJ (2010) Placing
microalgae on the biofuels priority list: a review of the technological
challenges. Journal of the Royal Society Interface 7: 703-726.
Griffiths MJ, Harrison SL (2009) Lipid productivity as a key characteristic for choosing
algal species for biodiesel production. Journal of Applied Phycology 21: 493-
507.
Guillard RRL, Ryther JH (1962) Studies of marine planktonic diatoms. I. Cyclotella
nana Hustedt and Detonula confervaceae (Cleve) Canadian Journal of
Microbiology 8: 229-239.
Guillou L, Chretiennot-Dinot MJ, Medlin LK, Claustre H, Loiseaux-Degoer S, Vaulot
D (1999) Bolidomonas, a new genus with two species belonging to a new
algal class: the Bolidophyceae. Journal of Phycology 35: 368-381.
Guschina I, Harwood J (2006) Lipids and lipid metabolism in eukaryotic algae.
Progress in Lipid Research 45: 160-186.

213
Hageman G, Verhagen H, Schutte B, Kleinjans J (1991) Biological effects of short-term
feeding to rats of repeatedly used deep-frying fats in relation to fat mutagen
content. Food and Chemical Toxicology 29: 689-698.
Hallmann A, Godl K, Wenzl S, Sumper M (1998) The highly efficient sex-inducing
pheromone system of Volvox. Trends in Microbiology 6: 185-189.
Hansen E, Even Y, Geneviere A-M (2004) The -unsaturated aldehyde 4-trans4-
trans-decadienal disturbs DNA replication and mitotic events in early sea
urchin embryos. Toxicological Sciences 81: 190-197.
Hayat MA (1989) Principles and Techniques of Electron Microscopy: Biological
Applications. Third edition, Macmillan Press Scientific and Medical,
Toronto, Ontario, Canada.
Hibberd DJ (1981) Notes on the taxonomy and nomenclature of the algal classes
Eustigmatophyceae and Tribophyceae (synonym Xanthophyceae). Botanical
Journal of the Linnean Society 82: 93-119.
Hibberd DJ, Leedale GF (1972) Observations on the cytology and ultrastructure of the
new algal class, Eustigmatophyceae. Annals of Botany 36: 49-71.
Hill J, Nelson E, Tilman D, Polasky S, Tiffany D (2006) Environmental economic and
energetic costs and benefits of biodiesel and ethanol biofuels. Proceedings of
the National Academy of Sciences of the United States of America 103:
11206-11210.
Hoshaw RW, Malouf LY (1981) Ultrastructure of the green flagellate Dunaliella
tertiolecta (Chlorophyceae, Volvocales) with comparative notes on three
other species. Phycologia 20: 199-206.
Hsieh CH, Wu WT (2009) Cultivation of microalgae for oil production with a
cultivation strategy of urea limitation. Bioresource Technology 100: 3921-
3926.
Hu Q, Sommerfeld M, Jarvis E, Ghirardi M, Posewitz M, Seibert M, Darzins A (2008)
Microalgal triacylglycerols as feedstocks for biofuel production: perspectives
and advances. Plant Journal 54: 621-639.

214
Ianora A, Poulet SA, Miralto A (2003) The effects of diatoms on copepod reproduction:
a review. Phycologia 42: 351-363.
Idei M, Osada K, Sato S, Nakayama T, Nagumo T, Mann DG (2013). Sperm
ultrastructure in the diatoms Melosira and Thalassiosira and the significance
of the 9+0 configuration. Protoplasma 250: 833-50.
Illman AM, Scragg AH, Shales SW (2000) Increase in Chlorella strains calorific values
when grown in low nitrogen medium. Enzyme and Microbial Technology 27:
631-635.
Ishii T, Tatsuda E, Kumazawa S, Nakayama T, Uchida K (2003) Molecular basis of
enzyme inactivation by an endogenous electrophile 4-hydroxy-2-nonenal:
identification of modification sites in glyceraldehyde- 3-phosphate
dehydrogenase. Biochemistry 42: 3474-3480.
Jensen KG, Mostrup O, Schmtd AM (2003) Ultrastructure of the male gametes from
two centric diatoms, Chaetoceros laciniosus and Coscinodiscus wailesii
(Bacillariophyceae). Phycologia 42: 98-105.
Jimenez C, Berl T, Rivard CJ, Edelstein C, Capasso JM (2004) Phosphorylation of
MAP kinase-like proteins mediates the response of the halotolerant alga
Dunaliella viridis to hypertonic shock. Biochimica et Biophysica (BBA)-
Molecular Cell Research 1644: 61-9.
Jimenez C, Capasso JM, Edelstein CL, Rivard CJ, Lucia S, Breusegem S, Berl T,
Segovia M (2009) Different ways to die: cell death modes of the unicellular
chlorophyte Dunaliella viridis exposed to various environmental stresses are
mediated by the caspase-like activity DEVDase. Journal of Experimental
Botany 60: 815-828.
Jimenez C, Cossio BR, Rivard CJ, Berl T, Capasso JM (2007) Cell division in the
unicellular microalga Dunaliella viridis depends on phosphorylation of
extracellular signal-regulated kinases (ERKs). Journal of Experimental
Botany 58: 1001-1011.
Jones A (2000) Does the plant mitochondrion integrate cellular stress and regulate
programmed cell death? Trends in Plant Science 5: 225-230.

215
Kaczmarska I, Ehrman JM, Bates SS (2001). A review of auxospore structure, ontogeny
and diatom phylogeny. In: 16th Proceeding of International Diatom
Symposium, 25 Aug.- 1 Sept. 2000, Athens & Aegean Islands, University of
Athens, Greece.
Kalin M, Wheeler WN, Meinrath G (2005) The removal of uranium from mining waste
water using algal/microbial biomass. Journal of Environmental Radioactivity
78: 151-77.
Karlson B, Potter D, Kuylenstierna M, Andersen RA (1996) Ultrastructure, pigment
composition, and 18S rRNA gene sequence for Nannochloropsis granulata
sp. nov. (Monodopsidaceae, Eustigmatophyceae), a marine ultraplankter
isolated from the Skagerrak, northeast Atlantic Ocean. Phycologia 35: 253-
260.
Kelly MG, Bennion H, Cox EJ, Goldsmith B, Jamieson J, Juggins S, Mann DG, Telford
RJ (2005) Common freshwater diatoms of Britain and Ireland: an interactive
key. Environment Agency, Bristol.
http://craticula.ncl.ac.uk/EADiatomKey/html/introduction.html. Accessed 1
September 2015.
Khairy HM (2009) Toxicity and accumulation of copper in Nannochloropsis oculata
(Eustigmatophyceae, Heterokonta). World Applied Sciences Journal 6: 378-
384.
Khozin-Goldberg I, Bigogno C, Shrestha P, Cohen Z (2002) Nitrogen starvation
induces the accumulation of arachidonic acid in the freshwater green alga
Parietochloris incisa (Trebouxiophyceae). Journal of Phycology 38: 991-994
Kilian O, Benemann CS, Niyogi KK, Vick B (2011) High-efficiency homologous
recombination in the oil-producing alga Nannochloropsis sp. Proceedings of
the National Academy of Sciences of the United States of America 108:
21265-21269.
Kim YK, Kim HJ, Kwon CH, Kim JH, Woo JS, Jung JS, Kim JM (2005) Role of ERK
activation in cisplatin-induced apoptosis in OK renal epithelial cells. Journal
of Applied Toxicology 25: 374-382.

216
King MW (2014) Fatty acid synthesis.
http://themedicalbiochemistrypage.org/lipids.php. Accessed 1 September
2015.
Kleinegris DMM, van Es MA, Janssen M, Brandenburg WA, Wijffels RH (2011) Phase
toxicity of dedecane on the microalgae Dunaliella salina. Journal of Applied
Phycology 23: 949-958.
Klyachko-Gurvich GL (1974) Changes in the content and composition of
triacylglyceride fatty acids during restoration of Chlorella pyrenoidosa cells
after nitrogen starvation. Soviet Plant Physiology 2: 611-618.
Knights BA, Brown AC, Conway E, Middleditch BS (1970) Hydrocarbons from the
green form of the freshwater alga Botryococcus braunii. Phytochemistry 9:
1317-24.
Kooistra WHCF, De Stefano M, Mann DG, Medlin LK (2003a). The phylogeny of the
diatoms. Progress in Molecular and Subcellular Biology 33: 59-97.
Kooistra WHCF, De Stefano M, Mann DG, Salma N, Medlin LK (2003b) The
phylogenetic position of Toxarium, a pennate-like lineage within centric
diatoms (Bacillariophyceae). Journal of Phycology 39: 185-197.
Krishnamurthy KV, Krishnaraj R, Chozhavendan R, Christopher SF (2000) The
programme of cell death in plants and animals: a comparison. Current
Science 79: 1169-81.
Lam E, Kato N, Lawton M (2001) Programmed cell death, mitochondria and the plant
hypersensitive response. Nature 411: 848-853.
Lamers PP, van de Laak CCW, Kaasenbrood PS, Lorier J, Janssen M, De Vos RCH,
Bino RJ, Wijffels RH (2010) Carotenoid and fatty acid metabolism in light-
stressed Dunaliella salina. Biotechnology and Bioengineering 106: 638-648.
Lee RE (1989) Phycology, (2nd ed.), Cambridge University Press, Cambridge.
Lee RE (1999) Phycology, (3rd ed.), Cambridge University Press, Cambridge.
Leipe DD, Wainright PO, Gunderson JH, Porter D, Patterson DJ, Valois F, Himmerich
S, Sogin ML (1994) The stramenopiles from a molecular perspective: 16S-
217
like rRNA sequences from Labyrinthuloides minuta and Cafeteria
roenbergensis. Phycologia 33: 369-377.
Lennon, SV, Martin SJ, Cotter TG (1991) Dose-dependent induction of apoptosis in
human tumour cell lines by widely divergent stimuli. Cell Proliferation 24:
203-14.
Leonardi PI, Caceres EJ (1994) Comparative analysis of the fine structure of young and
adult individuals of Dunaliella salina (polyblepharidaceae, chlorophyceae)
with emphasis on the flagellar apparatus. Journal of Phycology 30: 642-653.
Levine A, Tenhaken R, Dixon R, Lamb C (1994) H2O2 from the oxidative burst
orchestrates the plant hypersensitive disease resistance response. Cell 79:
583-593.
Lewis K (2000) Programmed cell death in bacteria. Microbiology and Molecular
Biology Reviews 64: 503-514.
Linkermann A, Green DR (2014) Necroptosis. New England Journal of Medicine 370:
455-465.
Liu ZY, Wang GC, Zhou BC (2008) Effect of iron on growth and lipid accumulation in
Chlorella vulgaris. Bioresource Technology 99: 4717- 4722.
Lopez P, Descles J, Allen A, Bowler C (2005) Prospects in diatom research. Current
Opinion in Biotechnology 16: 180-186.
Lorenz RT, Cysewski GR (2000) Commercial potential for Haematococcus microalgae
as a natural source of astaxanthin. Trends in Biotechnology 18:160-7.
Lv X, Zou L, Sun B, Wang J, Sun M-Y (2010) Variations in lipid yields and
compositions of marine microalgae during cell growth and respiration, and
within intracellular structures. Journal of Experimental Marine Biology and
Ecology 391: 73-83.
Maeda M, Thompson GA (1986) On the mechanism of rapid plasma membrane and
chloroplast envelope expansion in Dunaliella salina exposed to hypoosmsotic
shock. Journal of Cell Biology 102: 289-297.

218
Mallick N (2002) Biotechnological potential of immobilized algae for wastewater N, P
and metal removal: a review. Biometals 15: 377-90.
Mann D (1982) Auxospore formation in Licmophora (Bacillariophyta). Plant
Systematics and Evolution 139: 289-294.
Mann D (1993) Patterns of sexual reproduction in diatoms. Hydrobiologia 269/270: 11-
20.
Mann DG (1996) Chloroplast morphology, movements and inheritance in diatoms, In:
Cytology, Genetics an Molecular Biology of Alagae, Chaudharyb BR and
Agrawal SB (eds) SPB Academic, Amsterdam, Netherlands, pp. 249-274.
Mann DG, Evans KM (2007) Molecular genetics and the neglected art of diatomics. In:
Unravelling the Algae: The Past, Present, and Future of Algal Systematics,
Brodie J, and Lewis J (eds) Taylor and Francis, London, pp. 232-256.
Mann DG, Marchant HJ (1989) The origin of the diatom and its life cycle. In: The
Chromophyte Algae: Problems and Perspectives, Green J.C, Leadbeater BSC
and Diver WL (eds), Clarendon Press, Oxford, pp. 307-323.
Mann DG, Sato S, Rovira L, Trobajo R (2013) Paedogamy and auxosporulation in
Nitzschia sect. Lanceolatae (Bacillariophyta). Phycologia 52: 204-220.
Martin JS, Newmeyer DD, Mathias S, Farschan DM, Wang HG, Reed JC, Kolesnick
RN, Green DR (1995) Cell free reconstitution of Fas-UV radiation- and
ceramidae induced apoptosis. European Molecular Biology Organization
Journal 14: 5191-200.
Maruyama I, Nakamura T, Matsubayashi, T, Ando Y, Maeda T (1986) Identification of
the alga known as “marine Chlorella” as a member of the
Eustigmatophyceae. Japanese Journal of Phycology 34: 319-325.
McDonald K and Morphew M (1993) Improved preservation of ultrastructure in
difficult-to-fix organisms by high pressure freezing and freeze substitution: I.
Drosophila melanogaster and Strongylocentrotus purpuratus embryos.
Microscopy Research and Technique 24: 465-473.
Medlin LK (2009) Diatoms (Bacillariophyta). In: The Time Tree of Life, Hedges SB
and Kumar S (eds), Oxford University Press, Oxford, pp. 127-130.

219
Medlin LK, Jung I, Bahulikar R, Mendgen K, Kroth P, Kooistra WHCF (2008)
Evolution of the diatoms, VI: assessment of the new genera in the araphids
using molecular data. Nova Hedwigia, Beiheft 133: 81-100.
Medlin L, Kaczmarska I (2004) Evolution of the diatoms, V: morphological and
cytological support of the major clades and taxonomic revision. Phycologia
43: 245-273.
Medlin LK, Kooistra WCHF, Schmid AMM (2000) A review of the evolution of the
diatoms: a total approach using molecules, morphology and geology. In
Witkowski A and Sieminska J (eds). The Origin and Early Evolution of the
Diatoms: Fossil, Molecular and Biogeographical Approaches. W. Szafer
Institute of Botany, Polish Academy of Sciences, Cracow, Poland.
Melkonian M, Preisig HR (1984) An ultrastructural comparison between
Spermatozopms and Dunaliella (Chlorophyceae). Plant Systematics and
Evolution 146: 31-46.
Mendoza H, Martel A, del Rio MJ, Reina GG (1999) Oleic acid is the main fatty acid
related with carotenogenesis in Dunaliella salina. Journal of Applied
Phycology 11:15-19.
Metting FB (1996) Biodiversity and application of microalgae. Journal of Industrial
Microbiology and Biotechnology 17: 477-89.
Metzger P, Largeau C (2005) Botryococcus braunii: a rich source for hydrocarbons and
related ether lipids. Applied Microbiology and Biotechnology 66: 486-96.
Miao X, Wu Q (2006) Biodiesel production from heterotrophic microalgal oil.
Bioresource Technology 97: 841-846.
Miralto A, Barone G, Romano G, Poulet SA, Ianora A, Russo GL, Buttino I, Mazzarella
G, Laabir M, Cabrini M, Giacobbe MG (1999) The insidious effect of
diatoms on copepod reproduction. Nature 402: 173-176.
Mohammady NG, Chen Y-C, El-Mahdy AA, Mohammad RF (2005) Physiological
responses of the eustigmatophycean Nannochloropsis salina to aqueous
diesel fuel pollution. Oceanologia 47: 75-92.

220
Molina E, Fernandez FGA, Camacho G, Chisti Y (1999) Photobioreactors: light regime,
mass transfer, and scale up. Journal of Biotechnology 70: 231-247.
Morales EA (2001) Morphological studies in selected fragilarioid diatoms
(Bacillariophyceae) from Connecticut waters (USA). Proceedings of the
Academy of Natural Sciences of Philadelphia 151: 105-120.
Morales EA (2005) Observations of the morphology of some known and new
fragilaioid diatoms (Bacillariophyceae) from rivers in the USA. Phycological
Research 53: 113-133.
Morales EA, Edlund MB and Spaulding SA (2010) Description and ultrastructure of
araphid diatoms species (Bacillariophyceae) morphologically similar to
Pseudostaurosira elliptica (Schumann) Edlund et al. Phycological Research
58: 97- 107.
Munoz R, Guieysse B (2006) Algal-bacterial processes for the treatment of hazardous
contaminants: a review. Water Research 40: 2799- 815.
Murakami R, Hashimoto H (2009) Unusual nuclear division in Nannochloropsis
oculata (Eustigmatophyceae, Heterokonta) which may ensure faithful
transmission of secondary plastids. Protist 160: 41-49.
Musgrave A, Kuin H, Jongen M, Wildt PD, Schuring F, Klerk H, van den Ende H
(1992) Ethanol stimulates phospholipid turnover and inositol 1, 4, 5-
trisphosphate production in Chlamydomonas eugametos gametes. Planta 186:
442-449.
Nappez C, Battu S, Beneytout JL (1996) Trans, trans-2, 4-decadienal: cytotoxicity and
effect on glutathione level in human erythroleukemia (HEL) cells. Cancer
Letters 99:115-119.
National Toxicology Program (1993), National Institutes of Health, U.S. Department of
Health and Human Services. 2, 4-decadienal CAS No. 25152–84–5. Testing
Status of Agents at NTP.
https://ntp.niehs.nih.gov/ntp/htdocs/st_rpts/tox076.pdf. Accessed 13 October
2015.

221
Oliveira L, Huynh H (1989) Ultrastructure and cytochemistry of Dunaliella tertiolecta
Butcher and Pavlova lutheri (Droop) Green, grown on three different sources
of organic nitrogen. New Phytologist 113: 481-490.
Oren A (2005) A hundred years of Dunaliella research: 1905-2005. Saline Systems 1: 2,
doi:10.1186/1746-1448-1-2.
Paffenhöfer GA (2002) An assessment of the effects of diatoms on planktonic
copepods. Marine Ecology Progress Series 227: 305-310.
Pal D, Khozin-Goldberg I, Cohen Z (2011) The effect of light, salinity and nitrogen
availability on lipid production by Nannochloropsis Sp. Applied
Microbiology and Biotechnology 90: 1429-1441.
Parra O, Floyd G, wilcoxl L (1990) Taxonomic identification and ultrastructural
characterization of a Chilean strain of Dunaliella. Revista Chilena de Historia
Natural 63: 239-245.
Pennell RI, Lamb C (1997) Programmed plant cell in plants. Plant Cell 9: 1157-1168.
Pfeifhofer AO, Belton JC (1975) Ultrastructure changes in chloroplast resulting from
fluctuations in NaCl concentration: freeze-fracture of thylakoid membranes in
Dualiella salina. Journal of Cell Science 18: 287-299.
Pickett-Heaps J, McDonald K, Tippit D (1975) Cell division in the pennate diatom
Diatoma vulgare. Protoplasma 86: 205-242.
Pohnert G, Steinke M, Tollrian R (2007) Chemical cues, defence metabolites and the
shaping of pelagic interspecific interactions. Trends in Ecology and Evolution
22: 198-203.
Poulet SA, Richer de Forges M, Cueff A, Lennon JF (2003) Double labelling methods
used to diagnose apoptotic and necrotic cell degradations in copepod nauplii.
Marine Biology 143: 889-895.
Praveenkumar R, Shameera K, Mahalakshmi G, Akbarsha MA, Thajuddin N (2012)
Influence of nutrient deprivations on lipid accumulation in a dominant
indigenous microalga Chlorella sp., BUM1008: evaluation for biodiesel
production. Biomass and Bioenergy 37: 60-66.

222
Preisig H (1992) Morphology and taxonomy. In: Dunaliella: Physiology, Biochemistry
and biotechnology. Avron M and Ben-Amotz A (eds), CRC Press, London.
Rabbani S, Beyer P, Lintig J, Hugueney P, Kleinig H (1998) Induced -carotene
synthesis driven by triacylglycerol deposition in the unicellular alga
Dunaliella bardawil. Plant Physiology 116: 1239-1248.
Rachlin JW, Jensen TE, Baxter M, Jani V (1982) Utilization of morphometric analysis
in evaluating the response of Plectonnema boryanum (Cyanophyceae) to
exposure to eight heavy metals. Archives of Environmental Contamination
and Toxicology 11: 323-333.
Rao VNR (1970) Studies on Cyclotella meneghinina KOTZ. I. sexual reproduction and
auxospore formation. Proceedings of the Indian Academy of Sciences 72:
285-287.
Rebolloso-Fuentes MM, Navarro-Perez A, Garcıa-Camacho F, Ramos-Miras JJ, Guil-
Guerrero JL (2001) Biomass nutrient profiles of the microalga
Nannochloropsis. Journal of Agricultural and Food Chemistry 49: 2966-72.
Reitan KI, Rainuzzo JR, Olsen Y (1994) Effect of nutrient limitation on fatty acid and
lipid content of marine microalgae. Journal of Phycology 30: 972-979.
Ren JG, Xia HL, Just T, Dai YR (2001) Hydroxyl radical-induced apoptosis in human
tumor cells is associated with telomere shortening but not telomerase
inhibition and caspase activation. Federation of European Microbiological
Societies Letters 488: 123-13.
Renaud SM, Parry DL (1994) Microalgae for use in tropical aquaculture II: effect of
salinity on growth, gross chemical composition and fatty acid composition of
three species of marine microalgae. Journal of Applied Phycology 6: 347-56.
Renaud S, Parry D, Thinh L, Kuo C, Padovan A, Sammy N (1991) Effect of light
intensity on the proximate biochemical and fatty acid composition of
Isochrysis sp., and Nannochloropsis oculata for use in tropical aquaculture.
Journal of Applied Phycology 3: 43-53.
Reunova YA, Aizdaichera NA, Khristoforovab NK, Reunova AA (2007) Growth and
ultrastructure of the marine unicellular alga Dunaliella salina (Chlorophyta)

223
after chronic selenium intoxication. Russian Journal of Marine Biology 33:
166-172.
Reyes-Prieto A, Weber APM, Bhattacharya D (2007) The origin and establishment of
the plastid in algae and plants. Annual Review of Genetics 41: 147-168.
Ribalet F, Berges JA, Ianora A, Casotti R (2007) Growth inhibition of cultured marine
phytoplankton by toxic algal-derived polyunsaturated aldehdyes. Aquatic
Toxicology 85: 219-227.
Richmond A, Cheng-Wu Z (2001) Optimization of a flat plate glass reactor for mass
production of Nannochloropsis sp. outdoors. Journal of Biotechnology 85:
259-69.
Rittschof D, Cohen JH (2004) Crustacean peptide and peptide like pheromones and
kairomones. Peptides 25: 1503-1516.
Rodolfi L, Chini Zittelli G, Bassi N, Padovani G, Biondi N, Bonini G, Tredici MR
(2009) Microalgae for oil: strain selection, induction of lipid synthesis and
outdoor mass cultivation in a low-cost photobioreactor. Biotechnology and
Bioengineering 102: 100-12.
Rodolfi L, Zittelli CG, Barsanti L, Rosati G, Tredici MR (2003) Growth medium
recycling in Nannochloropsis sp. mass cultivation. Biomolecular Engineering
20: 243-8.
Roessler PG (1990) Environmental control of glycerolipid metabolism in microalgae:
commercial implications and future research directions. Journal of Phycology
26: 393-399.
Romano G, Miralto A, Ianora A (2010) Teratogenic effects of diatom metabolites on
sea urchin Paracentrotus lividus embryos. Marine Drugs 8: 950-967.
Romano G, Russo GL, Buttino I, Ianora A, Miralto A (2003) A marine diatom derived
aldehyde induces apoptosis in copepod and sea urchin embryos. Journal of
Experimental Biology 206: 3487-3494.
Round EF, Crawford RM, Mann DG (1990) The Diatoms: Biology and Morphology of
the Genera. Cambridge University Press, Cambridge.

224
Russ JC (1986) Practical Stereology. Plenum Press, New York, pp 35-56.
Sansone C, Braca A, Ercolesi E, Romano G, Palumbo A, Casotii R, Francone M, Ianora
A (2014) Diatom-derived polyunsaturated aldehydes activate cell death in
human cacer cell lines but not normal cells. PLOS One 9: e101220. doi:
10.1371/journal.pone.0101220.
Sato S, Beakes G, Idei M, Nagumo T, Mann DG (2011) Novel sex cells and evidence
for sex pheromones in diatoms. PLOS One 6: e26923.
doi:10.1371/journal.pone.0026923.
Sato S, Mann DG (2012) An astonishing expansion during auxosporulation in the
araphid pennate diatom Psudostaurosira trainorii. Paper presented at the 22nd
International Diatom Symposium, Ghent, Belgium, 26‐31 August 2012.
Sawayama S, Inoue S, Dote Y, Yokoyama S-Y (1995) CO2 fixation and oil production
through microalga. Energy Conversion and Management 36: 729-731.
Schenk P, Thomas-Hall S, Stephens E, Marx U, Mussgnug J, Posten C (2008) Second
generation biofuels: high-efficiency microalgae for biodiesel production.
BioEnergy Research 1: 20-43.
Schmid A-MM (1988) The special Golgi-ER-mitochondrium unit in the diatom genus
Coscinodiscus. Plant Systematics and Evolution 158: 211-233.
Schmid A-MM (1989) Geitler’s “Plattenband” in the diatom Synedra cf. ulna in the
light of TEM. Plant Systematics and Evolution 164: 239-252.
Schmid A-M M (2001) Value of pyrenoids in the systematics of the diatoms: their
morphology and ultrastructure. In: Proceedings of 16th International Diatom
Symposium, 25 Aug.- 1 Sept. 2000, Athens & Aegean Islands, University of
Athens, Greece.
Schmid A-MM, Crawford RM (2001) Ellerbeckia renaria (Bacillariophyta): formation
of the auxospores and initial cells. European Journal of Phycology 36: 307-
320.
Schweyer S, Soruri A, Meschter O, Heintze A, Zschunke F, Miosge N, Thelen P,
Schlott T, Radzun HJ, Fayyazi A (2004) Cisplatin-induced apoptosis in
225
human malignant testicular germ cell lines depends on MEK/ERK activation.
British Journal of Cancer 91: 589-598.
Scott SA, Davey MP, Dennis JS, Horst I, Howe CJ, Lea-Smith DJ, and Smith AG
(2010) Biodiesel from algae: challenges and prospects. Current Opinions in
Biotechnology 21: 277-286.
Segovia M, Berges JA (2005) Effect of inhibitors of protein synthesis and DNA
replication on the induction of proteolytic activities, caspase-like activities
and cell death in the unicellular chlorophyte Dunaliella tertiolecta. European
Journal of Phycology 40: 21-30.
Segovia M, Haramaty L, Berges JA, Falkowski PG (2003) Cell death in the unicellular
chlorophyte Dunaliella tertiolecta: an hypothesis on the evolution of
apoptosis in higher plants and metazoans. Plant Physiology 132: 99-105.
Sharma KK, Schuhmann H, Schenk P (2012) High lipid induction in microalgae for
biodiesel production. Energies 5: 1532-1553.
Sheehan J, Dunahay T, Benemann J, Roessler P (1998) A look back at the US
Department of Energy’s Aquatic Species Program: Biodiesel from Algae. In:
Closeout Report NREL/TP-580-24190, U.S. Department of Energy’s Office
of Fuels Development, National Renewable Energy Laboratory, Golden,
Colorado, USA.
Sicko-Goad L, Stoermer EF (1979) A morphometric study of lead and copper effects on
Diatoma tenue var. elongatum (Bacillariophyta). Journal of Phycology 15:
316-321.
Sigma-Aldrich (2015) Trans, trans-2, 4-Decadienal ≥89 %.
http://www.sigmaaldrich.com/catalog/product/aldrich/w313505?lang=en®
ion=GB. Accessed 1 September 2015.
Simionato D, Block M, Rocca NL, Jouhet J, Marechal E, Finazzi G, Morosinotto T
(2013) The response of nitrogen starvation includes De Novo biosynthesis of
triacylglycerols, a decrease of chloroplast galactolipids, and reorganization of
the photosynthetic apparatus. Eukaryotic Cell 12: 665-676.

226
Simon CA, Bentley MG, Caldwell GS (2010) 2, 4-Decadienal: exploring a novel
approach for the control of polychaete pests on cultured abalone. Aquaculture
310: 52-60.
Singh J, Gu S (2010) Commercialization potential of microalgae for biofuels
production. Renewable and Sustainable Energy Reviews 14: 2596-2610.
Singh RS, Kaushik Y, Wang Y, Xiang I, Novak M, Komatsu K, Tanaka AM, Cuervo
AM, Czaja MJ (2009) Autophagy regulates lipid metabolism. Nature 458:
1131-1135.
Singh S, Kate BN, Banerjee UC (2005) Bioactive compounds from cyanobacteria and
microalgae: an overview. Critical Reviews in Biotechnology 25: 73-95.
Solomon JA (1985) Ultrastructure evaluation of lipid accumulation in microalgae. In:
Aquatic Species Program Review: Proceedings of the March 1985 Principal
Investigators’ Meeting. Solar Energy Research Institute, US Department of
Energy, SERI/CR-23-2700, pp. 71-82.
Solomon JA, Hand REJr, Mann RC (1986) Ultrastructural and flow cytometric analyses
of lipid accumulation in microalgae. Solar Energy Research Institute, US
Department of Energy, doi: 10.2172/6757339.
Solovchenko A, Khozin-Goldberg I, Didi-Cohen S, Cohen Z, Merzlyak M (2008)
Effects of light intensity and nitrogen starvation on growth, total fatty acids
and arachidonic acid in the green microalga Parietochloris incisa. Journal of
Applied Phycology 20: 245-251.
Sorrell S, Speirs J, Bentley R, Brandt A, Miller R (2009) Global oil depletion: an
assessment of the evidence for a near-term peak in global oil production. A
report produced by the Technology and Policy Assessment function of the
UK Energy Research Centre.
https://www.gov.uk/government/uploads/system/uploads/attachment_data/file
/43201/1791-uk-erc-report-global-oil-depletion.pdf. Accessed 1 September
2015.
Sperandio S, de Belle I, Bredesen DE (2000) An alternative, nonapoptotic form of
programmed cell death. Proceedings of the National Academy of Sciences,
USA 97: 14376-14381.

227
Sperandio S, Poksay K, de Belle I, Lafuente MJ, Liu B, Nasir J, Bredesen D (2004)
Paraptosis: mediation by MAP kinases and inhibition by AIP-1/Alix. Cell
Death and Differentiation 11: 1066-1075.
Spolaore P, Joannis-Cassan C, Duran E, Isambert A (2006) Commercial applications of
microalgae. Journal of Bioscience and Bioengineering 101: 87-96.
Steer MW (1981) Understanding Cell Structure. Cambridge University Press,
Cambridge.
Steinke M, Malin G, Liss PS (2002) Trophic interactions in the sea: an ecological role
for climate relevant volatiles? Journal of Phycology 38: 630-638.
Stephenson AL, Dennis JS, Scott SA (2008) Improving the sustainability of the
production of biodiesel from oilseed rape in the UK. Chemical Engineering
Research and Design 86: 427-440.
Stoynova-Bakalova E, Toncheva-Panova T (2003) Subcellular adaptation to salinity and
irradiance in Dunaliella salina. Biologia Plantarum 47: 233-236.
Strasser A, Harris AW, Jacks T (1994) DNA damage can induce apoptosis in
proliferating lymphoid cells via p53-independent mechanisms inhibitable by
Bcl-2. Cell 79: 329-39.
Su C-H, Chein L-J, Gomes J, Lin Y-S, Yu Y-K, Liou J-S, Syu R-J (2011) Factors
affecting lipid accumulation by Nannochloropsis oculata in a two-stage
cultivaton process. Journal of Applies Phycology, 23: 903-908.
Subramaniam S, Unsicker K (2006) Extracellular signal-regulated kinase as an inducer
of non-apoptotic neuronal neuronal death. Neuroscience 138: 1055-1065.
Subramaniam S, Zirrgiebel U, Bohlen Und HO, Strelau J, Laliberte C,Kaplan DR,
Unsicker K (2004) ERK activation promotes neuronal degeneration
predominantly through plasma membrane damage and independently of
caspase-3. Journal of Cell Biology 165: 357-369.
Suen Y, Hubbard JS, Holzer G, Tornabene TG (1987) Total lipid production of the
green alga Nannochloropsis sp. QII under different nitrogen regimes. Journal
of Phycology 23: 289-297.

228
Sukenik A, Carmeli Y, Berner T (1989) Regulation of fatty acid composition by
irradiance level in the eustigmatophytes. Journal of Phycology 25: 686-692.
Sukenik A, Yamaguchi Y, Livne A (1993a) Alterations in lipid molecular species of the
marine eustigmatophyte Nannochloropsis sp. Journal of Phycology 29: 620-
626.
Sukenik A, Zamora O, Carmeli Y (1993b) Biochemical quality of marine unicellular
algae with emphasis on lipid composition. II. Nannochloropsis sp.
Aquaculture 117: 313-326.
Swanson SJ, Bethke PC, Jones RL (1998) Barley aleurone cells contain two types of
vacuoles: characterization of lytic organelles by use of fluorescent probes.
Plant Cell 10: 685-698.
Tafresh AH, Shariati M (2009) Dunaliella biotechnology: methods and applications.
Journal of Applied Microbiology 107: 14-35.
Tang H, Abunasser N, Garcia MED, Chen M, Ng KYS, Salley SO (2011) Potential of
microalgae oil from Dunaliella tertiolecta as a feedstock for biodiesel.
Applied Energy 88: 3324-3330.
Taylor R, Caldwell GC, Bentley MG (2005) Toxicity of algal-derived aldehydes to two
invertebrate species: do heavy metal pollutants have a synergistic effect?
Aquatic Toxicology 74: 20-31.
Taylor R, Caldwell GS, Dunstan HJ, Bentley MG (2007) Short-term impacts of
polyunsaturated aldehyde-producing diatoms on the harpacticoid copepod,
Tisbe holothuriae. Journal of Experimental Marine Biology and Ecology 341:
60-69.
Taylor R, Rand J, Caldwell G (2012) Treatment with algae extracts promotes
flocculation, and enhances growth and neutral lipid content in
Nannochloropsis oculata: a candidate for biofuel production. Marine
Biotechnology 14: 774-781.
Theriot EC, Ashworth M, Ruck E, Nakov T, Jansen RK (2010) A preliminary multigene
phylogeny of the diatoms (Bacillariophyta): challenges for future research.
Plant Ecology and Evolution 143: 278-296.

229
Theriot EC, Ruck E, Ashworth M, Nakov T, Jansen RK (2011) Status of the pursuit of
the diatom phylogeny: are traditional views and new molecular paradigms
really that different? In: The Diatom World: Cellular Origin, Life in Extreme
Habitats and Astrobiology, Vol. 19, Seckbach J, Kociolek JP (eds), Springer,
Dordrecht, pp. 123-142.
Thompson GA (1996) Lipids and membrane function in green alga. Biochimica et
Biophysica Acta 1302: 17-45.
Tian J, Yu J (2009) Changes in ultrastructure and responses of antioxidant systems of
algae (Dunaliella salina) during acclimation to enhanced ultraviolet-B
radiation. Journal of Photochemistry and Photobiology: B, Biology 97: 152-
160.
Tomaselli L (2004) The microalgal cell. In: Handbook of Microalgal Culture,
Biotechnology and Applied Phycology. Richmond A (ed) Blackwell Science,
Hoboken, New Jersey, USA.
Tonon T, Larson TR, Graham IA (2002) Long chain polyunsaturated fatty acid
production and partitioning to triacylglycerols in four microalgae.
Phytochemistry 61: 15-24.
Tsuzuki M, Gantar M, Aizawa K and Miyachi S (1986) Ultrastructure of Dunaliella
tertiolecta cells grown under low and high CO2 concentrations. Plant Cell
Physiology 27: 737-739.
Uchida K (1999) Current status of acrolein as a lipid peroxidation product. Trends in
Cardiovascular Medicine 9: 109-113.
Vaishampayan A, Sinha RP, Hader DP, Dey T, Gupta AK, Bhan U, Rao L (2001)
Cyanobacterial biofertilizers in rice agriculture. Botanical Reviews 67: 453-
516.
van den Hoek C, Mann DG, Jahns HM (1995) Algae: An Introduction to Phycology.
Cambridge University Press, Cambridge.
van Iersel M, Ploemen J, Lo Bello M, Federici G, van Bladeren PJ (1997) Interactions
of alpha,beta-unsaturated aldehydes and ketones with human glutathione S-
transferase P1-1. Chemo-Biological Interactions. 108: 67-78.

230
Vardi A, Berman-Frank I, Rozenberg T, Hadas O, Kaplan A, Levine A (1999)
Programmed cell death of the dinoflagellate Peridinium gatunense is
mediated by CO2 limitation and oxidative stress. Current Biology 9: 1061-
1064.
Vardi A, Formiggini F, Casotti R, Martino AD, Ribalet F, Miralto A, Bowler C (2006)
A stress surveillance system based on calcium and nitric oxide in marine
diatoms. PLOS Biology 4: e60.
Vaux DL (1999) Caspases and apoptosis: biology and terminology. Cell Death and
Diffentiation 6: 493-4.
Veldhuis MJW, Kraay GW, Timmermans KR (2001) Cell death in phytoplankton:
correlation between changes in membrane permeability, photosynthetic
activity, pigmentation and growth. European Journal of Phycology 36: 167-
177.
Vieler A, Brubaker SB, Vick B, Benning C (2012) A lipid droplet protein of
Nannochloropsis with functions partially analogous to plant oleosins. Plant
Physiology 158: 1562-1569.
Visviki I, Rachlin JW (1994a) Acute and chronic exposure of Dunaliella salina and
Chlamydomonas bullosa to copper and cadmium: effects on ultrastructure.
Archive of Environmental Contamination and Toxicology 26: 154-162.
Visviki I, Rachlin JW (1994b) Acute and chronic exposure of Dunaliella salina and
Chlamydomonas bullosa to copper and cadmium: effects on growth. Archive
of Environmental Contamination and Toxicology 26: 149-153.
Vladimirova MG (1978) Ultrastructural organization of the cell of Dunaliella salina and
functional changes of it in relation to light intensity and temperature.
Fiziologiya Rastenii 25: 443-449.
von Stosch HA (1982) On auxospore envelopes in diatoms. Bacillaria 5: 127-156.
Walter TL, Purton S, Becker DK, Collet C (2005) Microalgae as bioreactor. Plant Cell
Reports 24: 629-41.
Wang ZT, Ullrich N, Joo S, Waffenschmidt S, Goodenough U (2009) Algal lipid
bodies: stress induction, purification, and biochemical characterization in

231
wild-type and starchless Chlamydomonas reinhardtii. Eukaryote Cell 8:
1856-68.
Wawra E, Zollner H, Schaur RJ, Tillian HM, and Schauenstein E (1986) The inhibitory
effect of 4-hydroxy-nonenal on DNA-polymerases alpha and beta from rat
liver and rapidly dividing Yoshida ascites hepatoma. Cell Biochemistry and
Function 4: 31-36.
Weibel E (1969) Stereological principles for morphometry in electron microscopic
cytology. International Review of Cytology Supplement 26: 235-302.
Widjaja A, Chien CC, Ju YH (2009) Study of increasing lipid production from fresh
water microalgae Chlorella vulgaris. Journal of the Taiwan Institute of
Chemical Engineers 40: 13-20.
Williams DM (2007) Classification and diatom systematics: the past, the present, and
the future. In: Unravelling the Algae: The Past, Present, and Future of Algal
Systematics. Brodie J, Lewis J (eds). The Systematics Association Special
Volume Series 75, CRC Press, Taylor and Francis, London, pp. 57-91.
Williams DM, Kociolek JP (1988) The araphid diatoms: monophyletic, polyphyletic or
paraphyletic? In: The Chromophyte Algae: Problems and Perspectives,
Abstracts. Plymouth Polytechnic, England, UK, 1988.
Williams DM, Kociolek JP (2007) Pursuit of a natural classification of diatoms:
History, monophyly and the rejection of paraphyletic taxa. European Journal
of Phycology 42: 313-319.
Williams DM, Kociolek JP (2011) An overview of diatom classification with some
aspects for the future. In: The Diatom World, Cellular Origin, Life in Extreme
Habitats and Astrobiology 19, Seckbach J, Kociolek JP (eds), Springer,
Berlin, Heidelberg, Germany, pp. 47-91.
Williams DM, Round FE (1978) Revision of the genus Fragillaria. Diatom Research 2:
267-288.
Wiseman H, Halliwell B (1996) Damage to DNA by reactive oxygen and nitrogen
species: role in inflammatory disease and progression to cancer. Biochemical
Journal 313: 17-29.

232
Witz G (1989) Biological interactions of alpha, beta-unsaturated aldehydes. Free Radical
Biology and Medicine 7: 333-349.
Wolf FR, Nonomura AM, Bassham JA (1985) Growth and branched hydrocarbon
production in strain of Botryococcus braunii (Chlorophyta). Journal of
Phycology 21: 388-96.
Wong JK, Le HH, Zsarnovszky A, Belcher SM (2003) Estrogens and ICI182, 780
(Faslodex) modulate mitosis and cell death in immature cerebellar neurons
via rapid activation of p44/p42 mitogen-activated protein kinase. Journal of
Neurosciences 23: 4984-4995.
Wu SC, Yen GC (2004) Effects of cooking oil fumes on the genotoxicity and oxidative
stress in human lung carcinoma (A-549) cells. Toxicology In Vitro 18: 571-
580.
Xin L, Hong-ying H, Ke G, Ying-xue S (2010) Effects of different nitrogen and
phosphorus concentrations on the growth, nutrient uptake, and lipid
accumulation of a freshwater microalga Scenedesmus sp. Bioresource
Technology 101: 5494-5500.
Yasumoto K, Nishigami A, Yasumoto M, Kasai F, Okada Y, Kusumi T and Ooi T
(2005) Aliphatic sulfates released from Daphnia induce morphological
defense of phytoplankton: isolation and synthesis of kairomones. Tetrahedron
Letters 46: 4765-4767.
Yilancioglu K, Cokol M, Pastirmaci I, Erman B, Cetiner S (2014) Oxidative stress is a
mediator for increased lipid accumulation in newly isolated Dunaliella salina
strain. PLOS One 9:e91957.
Young SC, Chang LW, Lee HL, Tsai LH, Liu YC, Lin PP (2010) DNA damage induced
by trans, trans-2, 4-decadienal (tt-DDE), a component of cooking oil fume, in
human bronchial epithelial cells. Environmental and Molecular Mutagenesis
51: 315-321.
Yun YS, Lee SB, Park JM, Lee CL, Yang JW (1997) Carbon dioxide fixation by algal
cultivation using wastewater nutrients. Journal of Chemical Technology and
Biotechnology 6: 451-455.

233
Zhai S, Yaar M, Doyle SM, Gilchrest BA (1996) Nerve growth factor rescues pigment
cells from ultraviolet-induced apoptosis by up regulation of Bcl-2 levels. Cell
Research 224: 335-39.
Zhekisheva M, Boussiba S, Khozin-Goldberg I, Zarka A, Cohen Z (2002)
Accumulation of oleic acid in Haematococcus pluvialis (Chlorophyceae)
under nitrogen starvation or high light is correlated with that of astaxanthin
esters. Journal of Phycology 38: 325-331.
Zittelli CG, Lavista F, Bastianini A, Rodolfi L, Vincenzini M, Tredici MR (1999)
Production of eicosapentaenoic acid by Nannochloropsis sp. cultures in
outdoor tubular photobioreactors. Journal of Biotechnology 70: 299-312.