development of microalgae based biorefinery
TRANSCRIPT
DEVELOPMENT OF MICROALGAE BASEDBIOREFINERY TO IMPROVE ITS ENERGY
EFFICIENCY
AUTHOR: DANIEL FOZER
SUPERVISOR: PROF. DR. PETER MIZSEY
PHD THESIS
FACULTY OF CHEMICAL TECHNOLOGY AND BIOTECHNOLOGY
DEPARTMENT OF CHEMICAL AND ENVIRONMENTAL PROCESS ENGINEERING
BUDAPEST, BME, 2019


Acknowledgements
First and foremost, I would like to express my sincere and greatest gratitude to my
supervisor, Prof. Dr. Peter Mizsey for guiding my research under his supervision. I’m grateful
for mentoring me since I joined the Environmental and Process Engineering Research group
as a bachelor student. I appreciate his time, ideas and comments that made the present work
possible.
I’m also deeply thankful to Dr. Aron Nemeth for his continuous help and plenty of
advice in algae cultivation.
My sincere thanks also goes to Bernadett Kiss, Nora Valentinyi, Tibor Nagy, Andras
Jozsef Toth, Eniko Haaz, Anita Andre and Asmaa Selim for their assistance through my studies
and research.
I would like to thank Dr. Edit Szekely and Laszlo Lorincz for their help in hydrother-
mal gasification.
I am grateful to Dr. Jozsef Balla for his help in gas chromatography and Dr. Sandor
Tomoskozi for helping me in the determination of N content.
Herewith, I would like to thank all the colleagues at the Department of Chemical and
Environmental Process Engineering, for helping me in technical and scientific issues and for
providing a friendly atmosphere.
I would like to thank my parents and my brother for always providing supportive
background and giving continuous encouragement.
I would like to thank the financial support for the New National Talent Program
2018 (NTP-NFTÖ-18-B-0154), the New National Excellence Program 2017 (ÚNKP-13-3-I-BME-
022), Campus Mundi short study trip, OTKA-112699 and OTKA-128543. The dissertation was
supported by the European Union and the Hungarian State, co-financed by the European
Regional Development Fund in the framework of the GINOP-2.3.4-15-2016-00004 project,
iii

Acknowledgements
aimed to promote the cooperation between the higher education and the industry.
iv
Abstract
Biorefineries have received a great attention in recent decades due to the possible
application of biomass as energy carrier. Microalgae are a suitable feedstock to produce
biofuels with high energy density, however, it is questionable whether net energy gain is
achievable considering the whole conversion route. Cradle-to-grave overall energetic analysis
of microalgae based biorefinery alternatives are investigated in detail to determine the energy
balance and to identify technological bottlenecks. Based on the detected bottleneck points 3
main areas are investigated for the development of microalgae based biorefineries to improve
its efficiencies: (1) carbon capture from flue gas to provide CO2 for the cultivation of algae, (2)
cultivation of microalgae biomass and (3) the elimination of drying process or the application
of hydrothermal conversion technologies.
The carbon capture related bottleneck is evaluated conducting life cycle, PESTLE
and Multi-Criteria Decision analyses. It is found that the environmental effects of Carbon
Capture and Storage technology can be upgraded if fossil based energy carriers are excluded
and replaced by renewable sources and if the required heat for MEA absorber regeneration is
decreased by proper process improvements.
In the case of the cultivation step, it is demonstrated that the efficiency of the process
can be greatly affected by the illumination regimes. The light factorial optimization of Chlorella
vulgaris cultivation shows that applying ideal wavelength and optimized intensity levels
enhance the biomass productivity, while the biological composition (lipid and carbohydrate
content) of the biomass can be shifted according to the objectives of the refinery.
Hydrothermal conversion of the biomass is a favourable conversion technology
due to the possible elimination of the drying step. Throughout the investigation of targeted
cultivation and hydrothermal gasification (HTG) of microalgae biomass it is found that biogas
yield and gas composition (H2, CH4, CO2, CO) can be indirectly influenced already at the culti-
vation step, which highlights the importance of the application of ideal artificial illumination
conditions.
v

Résumé
Les bioraffineries ont fait l’objet d’une grande attention au cours des dernières
décennies en raison de l’utilisation possible de la biomasse en tant que vecteur d’énergie. Les
microalgues sont une matière pertinent pour la production de biocarburants à haute densité
énergétique. Cependant, on peut se demander si un gain d’énergie net est réalisable compte
tenu de l’ensemble du processus de conversion. L’analyse énergétique des alternatives de
bioraffinerie à base de microalgues est étudiée en détail afin de déterminer le bilan énergétique
et d’identifier les goulots d’étranglement technologiques. Sur la base des points de goulot
d’étranglement détectés, trois domaines principaux sont étudiés pour le développement de
bioraffineries à base de microalgues afin d’améliorer son efficacité : (1) capture du carbone à
partir des gaz de combustion pour fournir du dioxyde de carbone pour la culture d’algues, (2)
la production de microalgues et (3) l’élimination du processus de séchage ou l’application des
technologies de conversion hydrothermale.
Le goulot d’étranglement lié au capture du carbone est évalué lors de l’analyse du
cycle de vie, de PESTLE et de la décision multicritères. Il est trouvé que les effets environne-
mentaux de la technologie de captage et de stockage du carbone peuvent être améliorés si
les sources d’énergie fossile sont exclues et remplacées par des sources renouvelables et si
l’énergie requise pour la régénération de l’absorbeur MEA est réduite par des améliorations
appropriées du processus.
Dans le cas de l’étape de culture, il est démontré que l’efficacité du processus peut
être grandement affectée par les régimes d’éclairage. L’optimisation factorielle en lumière
de la culture de Chlorella vulgaris montre que l’application d’une longueur d’onde idéale
et de niveaux d’intensité optimisés améliore la productivité de la biomasse, tandis que la
composition biologique (lipides et glucides) de la biomasse peut être modifiée en fonction des
objectifs de la bioraffinerie.
La conversion hydrothermale de la biomasse est une technologie de transformation
favorable en raison de l’élimination possible de l’étape de séchage. Lors de l’investigation de
la culture et de la gazéification hydrothermale de la biomasse de microalgues, il est déterminé
vii

Acknowledgements
que le rendement en biogaz et la composition en gaz peuvent être indirectement influencés
dès la phase de culture, ce qui souligne l’importance de l’application de conditions idéales
d’éclairage artificiel.
viii

Contents
Acknowledgements iii
Abstract (English/Français) v
List of figures xiv
List of tables xviii
1 Introduction 1
2 Literature review 3
2.1 Microalgae biomass . . . . . . . . . . . . . . . . . . . . . . . . . . . . . . . . . . . 3
2.2 Properties of Chlorella vulgaris . . . . . . . . . . . . . . . . . . . . . . . . . . . . . 3
2.2.1 Morphology . . . . . . . . . . . . . . . . . . . . . . . . . . . . . . . . . . . . 3
2.2.2 Reproduction . . . . . . . . . . . . . . . . . . . . . . . . . . . . . . . . . . . 4
2.3 Biological composition . . . . . . . . . . . . . . . . . . . . . . . . . . . . . . . . . . 5
2.4 Influencing cultivation factors . . . . . . . . . . . . . . . . . . . . . . . . . . . . . 6
2.4.1 Light . . . . . . . . . . . . . . . . . . . . . . . . . . . . . . . . . . . . . . . . 6
2.4.2 Nutrients . . . . . . . . . . . . . . . . . . . . . . . . . . . . . . . . . . . . . . 7
2.4.3 Aeration . . . . . . . . . . . . . . . . . . . . . . . . . . . . . . . . . . . . . . 8
ix
Contents
2.5 Microalgae biorefineries . . . . . . . . . . . . . . . . . . . . . . . . . . . . . . . . . 8
2.6 Upstream technologies-Production and harvesting algae . . . . . . . . . . . . . 9
2.6.1 Microalgae cultivation . . . . . . . . . . . . . . . . . . . . . . . . . . . . . . 9
2.6.1.1 Open system . . . . . . . . . . . . . . . . . . . . . . . . . . . . . . 10
2.6.1.2 Closed photobioreactors . . . . . . . . . . . . . . . . . . . . . . . 11
2.6.2 Harvesting . . . . . . . . . . . . . . . . . . . . . . . . . . . . . . . . . . . . . 14
2.7 Downstream technologies-Processing algae biomass . . . . . . . . . . . . . . . . 14
2.7.1 Biochemical conversion . . . . . . . . . . . . . . . . . . . . . . . . . . . . . 14
2.7.1.1 Fermentation . . . . . . . . . . . . . . . . . . . . . . . . . . . . . . 14
2.7.1.2 Transesterification of lipids . . . . . . . . . . . . . . . . . . . . . . 15
2.7.2 Thermochemical conversion . . . . . . . . . . . . . . . . . . . . . . . . . . 16
2.7.2.1 Pyrolysis . . . . . . . . . . . . . . . . . . . . . . . . . . . . . . . . . 16
2.7.2.2 Atmospheric gasification . . . . . . . . . . . . . . . . . . . . . . . 16
2.7.3 Hydrothermal technologies . . . . . . . . . . . . . . . . . . . . . . . . . . . 16
2.7.3.1 Hydrothermal liquefaction (HTL) . . . . . . . . . . . . . . . . . . 18
2.7.3.2 Hydrothermal gasification (HTG) . . . . . . . . . . . . . . . . . . 19
2.7.3.3 Hydrothermal carbonization (HTC) . . . . . . . . . . . . . . . . . 21
2.8 The energy efficiency of biorefineries . . . . . . . . . . . . . . . . . . . . . . . . . 22
2.9 Carbon Capture and Storage (CCS) . . . . . . . . . . . . . . . . . . . . . . . . . . . 22
2.9.1 Carbon capture . . . . . . . . . . . . . . . . . . . . . . . . . . . . . . . . . . 23
2.9.2 Carbon storage . . . . . . . . . . . . . . . . . . . . . . . . . . . . . . . . . . 25
3 Materials and Methods 27
3.1 Calculating the energy balance of an algae-based biorefinery . . . . . . . . . . . 27
x
Contents
3.1.1 Energy requirements for the cultivation step . . . . . . . . . . . . . . . . . 27
3.1.2 Nutrients and related energy requirements for the cultivation . . . . . . 29
3.1.2.1 Energy requirements related to CO2 . . . . . . . . . . . . . . . . . 30
3.1.2.2 Energy requirements related to the nitrogen and phosphorus
sources . . . . . . . . . . . . . . . . . . . . . . . . . . . . . . . . . . 31
3.1.3 Harvesting and dewatering . . . . . . . . . . . . . . . . . . . . . . . . . . . 32
3.1.4 Pretreating for lipid extraction . . . . . . . . . . . . . . . . . . . . . . . . . 33
3.1.5 Extraction of lipids . . . . . . . . . . . . . . . . . . . . . . . . . . . . . . . . 34
3.1.6 Transesterification of lipids . . . . . . . . . . . . . . . . . . . . . . . . . . . 34
3.1.7 Thermochemical conversion of algae cake . . . . . . . . . . . . . . . . . . 35
3.1.8 Hydrotermal conversion of wet biomass . . . . . . . . . . . . . . . . . . . 36
3.1.9 The calculation of energy efficiency . . . . . . . . . . . . . . . . . . . . . . 37
3.2 Life Cycle Analysis (LCA) . . . . . . . . . . . . . . . . . . . . . . . . . . . . . . . . . 38
3.2.1 Goal & Scope . . . . . . . . . . . . . . . . . . . . . . . . . . . . . . . . . . . 38
3.2.2 Life Cycle Inventory (LCI) . . . . . . . . . . . . . . . . . . . . . . . . . . . . 39
3.2.3 Life Cycle Impact Assessment (LCIA) . . . . . . . . . . . . . . . . . . . . . 39
3.2.3.1 IPCC 2007 (100a) . . . . . . . . . . . . . . . . . . . . . . . . . . . . 39
3.2.3.2 Eco-indicator 99 (EI 99) . . . . . . . . . . . . . . . . . . . . . . . . 39
3.2.3.3 IMPACT 2002+ . . . . . . . . . . . . . . . . . . . . . . . . . . . . . 40
3.2.3.4 EPS 2000 . . . . . . . . . . . . . . . . . . . . . . . . . . . . . . . . . 42
3.3 PESTLE analysis . . . . . . . . . . . . . . . . . . . . . . . . . . . . . . . . . . . . . . 43
3.3.1 Political & Legal factor . . . . . . . . . . . . . . . . . . . . . . . . . . . . . . 43
3.3.2 Economic factor . . . . . . . . . . . . . . . . . . . . . . . . . . . . . . . . . 43
xi

Contents
3.3.3 Social factor . . . . . . . . . . . . . . . . . . . . . . . . . . . . . . . . . . . . 43
3.3.4 Technological factor . . . . . . . . . . . . . . . . . . . . . . . . . . . . . . . 43
3.3.5 Environmental factor . . . . . . . . . . . . . . . . . . . . . . . . . . . . . . 44
3.4 MCDA analysis . . . . . . . . . . . . . . . . . . . . . . . . . . . . . . . . . . . . . . 44
3.5 Microalgae cultivation . . . . . . . . . . . . . . . . . . . . . . . . . . . . . . . . . . 45
3.5.1 Organism . . . . . . . . . . . . . . . . . . . . . . . . . . . . . . . . . . . . . . 45
3.5.2 Microtiter plate (MTP) and RGB-LED panel set up and operation . . . . 45
3.5.3 Photobioreactors (PBRs) set up and operation . . . . . . . . . . . . . . . . 46
3.5.4 Analytical methods . . . . . . . . . . . . . . . . . . . . . . . . . . . . . . . . 48
3.5.4.1 Optical Density . . . . . . . . . . . . . . . . . . . . . . . . . . . . . 48
3.5.4.2 Cell number . . . . . . . . . . . . . . . . . . . . . . . . . . . . . . . 49
3.5.4.3 Dry weight content and biomass productivity . . . . . . . . . . . 49
3.5.4.4 Calibration curves . . . . . . . . . . . . . . . . . . . . . . . . . . . 49
3.5.4.5 Light intensity . . . . . . . . . . . . . . . . . . . . . . . . . . . . . 50
3.5.4.6 Ultimate analysis . . . . . . . . . . . . . . . . . . . . . . . . . . . . 50
3.5.4.7 Proximate analyis . . . . . . . . . . . . . . . . . . . . . . . . . . . 51
3.6 Biological composition of the algal biomass . . . . . . . . . . . . . . . . . . . . . 51
3.7 Hydrothermal gasification (HTG) . . . . . . . . . . . . . . . . . . . . . . . . . . . . 52
3.7.1 Design of equipment . . . . . . . . . . . . . . . . . . . . . . . . . . . . . . . 52
3.7.2 Operation . . . . . . . . . . . . . . . . . . . . . . . . . . . . . . . . . . . . . 53
3.7.3 Analitical methods . . . . . . . . . . . . . . . . . . . . . . . . . . . . . . . . 54
3.7.3.1 Biogas Analysis . . . . . . . . . . . . . . . . . . . . . . . . . . . . . 54
3.7.3.2 Total Carbon (TC) determination . . . . . . . . . . . . . . . . . . 54
xii

Contents
3.8 Experimental design and statistical analysis . . . . . . . . . . . . . . . . . . . . . 55
3.8.1 DoE for Light wavelength . . . . . . . . . . . . . . . . . . . . . . . . . . . . 55
3.8.2 DoE for Light intensity . . . . . . . . . . . . . . . . . . . . . . . . . . . . . . 55
3.8.3 DoE for the investigation of light intensity and aeration rate in PBR . . . 55
4 Results and Discussion 57
4.1 Energy balance of a third generation biorefinery . . . . . . . . . . . . . . . . . . . 57
4.2 Energy Balance, Net Energy Ratio of alternatives . . . . . . . . . . . . . . . . . . . 63
4.3 Identified refinery’s bottlenecks . . . . . . . . . . . . . . . . . . . . . . . . . . . . 65
4.4 Life Cycle Analysis of Carbon Capture and Storage process alternatives . . . . . 66
4.4.1 CCS system setup . . . . . . . . . . . . . . . . . . . . . . . . . . . . . . . . . 66
4.4.2 CCS via fossil fuel based absorbent regeneration . . . . . . . . . . . . . . 68
4.4.3 CCS via process improvement . . . . . . . . . . . . . . . . . . . . . . . . . 71
4.4.4 CCS via application of renewable energy . . . . . . . . . . . . . . . . . . . 72
4.5 PESTLE analysis of CCS process alternatives . . . . . . . . . . . . . . . . . . . . . 75
4.5.1 Political & Legal aspects . . . . . . . . . . . . . . . . . . . . . . . . . . . . . 76
4.5.2 Economic aspect . . . . . . . . . . . . . . . . . . . . . . . . . . . . . . . . . 77
4.5.3 Social aspect . . . . . . . . . . . . . . . . . . . . . . . . . . . . . . . . . . . . 79
4.5.4 Technological aspect . . . . . . . . . . . . . . . . . . . . . . . . . . . . . . . 79
4.5.5 Environental aspect . . . . . . . . . . . . . . . . . . . . . . . . . . . . . . . 80
4.6 Multi-Criteria Decision Analysis of CCS alternatives . . . . . . . . . . . . . . . . 85
4.7 Investigation of illumination conditions to influence the biomass productivity of
Chlorella vulgaris . . . . . . . . . . . . . . . . . . . . . . . . . . . . . . . . . . . . . 88
4.7.1 Optimal wavelength . . . . . . . . . . . . . . . . . . . . . . . . . . . . . . . 88
xiii

Contents
4.7.2 The effect of light intensity . . . . . . . . . . . . . . . . . . . . . . . . . . . 90
4.7.3 Scaled up fermentations . . . . . . . . . . . . . . . . . . . . . . . . . . . . . 94
4.8 Using targeted cultivation to increase the yield and composition of HTG biogas 98
5 Conclusions 103
6 Major New Results 105
References 110
Appendix 132
A List of symbols 133
B Supplementary materials 137
Declarations 141
xiv
List of Figures
2.1 Schematic ultrastructure of Chlorella vulgaris (Safi et al., 2014) . . . . . . . . . . 4
2.2 Daughter cell-wall formation during reproduction in Chlorella vulgaris (Ya-
mamoto et al., 2004, 2007) . . . . . . . . . . . . . . . . . . . . . . . . . . . . . . . . 4
2.3 Biochemical composition of microalgae biomass (Schmid-Staiger, 2009) . . . . 5
2.4 Spectra of electromagnetic radiation, where the photosynthetically active radia-
tion (PAR) ranges from 400 to 750 nm (Hall and Rao, 1999) . . . . . . . . . . . . . 6
2.5 Energy carriers and process units converting microalgae biomass (Amin, 2009) 9
2.6 A schematic figure of a raceway-pond unit with scaling. (a) Raceway-pond, (b)
paddlewheel. (Sompech et al., 2012). . . . . . . . . . . . . . . . . . . . . . . . . . 11
2.7 A schematic figure of a tubular photobioreactor (Chisti, 2008a). . . . . . . . . . 12
2.8 Other types of photobioreactors, (a) Airlift reactors, (b) Stirred tank photobiore-
actor, (c) Flat plate PBR (Singh and Sharma, 2012) . . . . . . . . . . . . . . . . . . 13
2.9 Phase diagram of water and static dielectric constant of water in function of
temperature at 200 bars (Tran, 2016). . . . . . . . . . . . . . . . . . . . . . . . . . 17
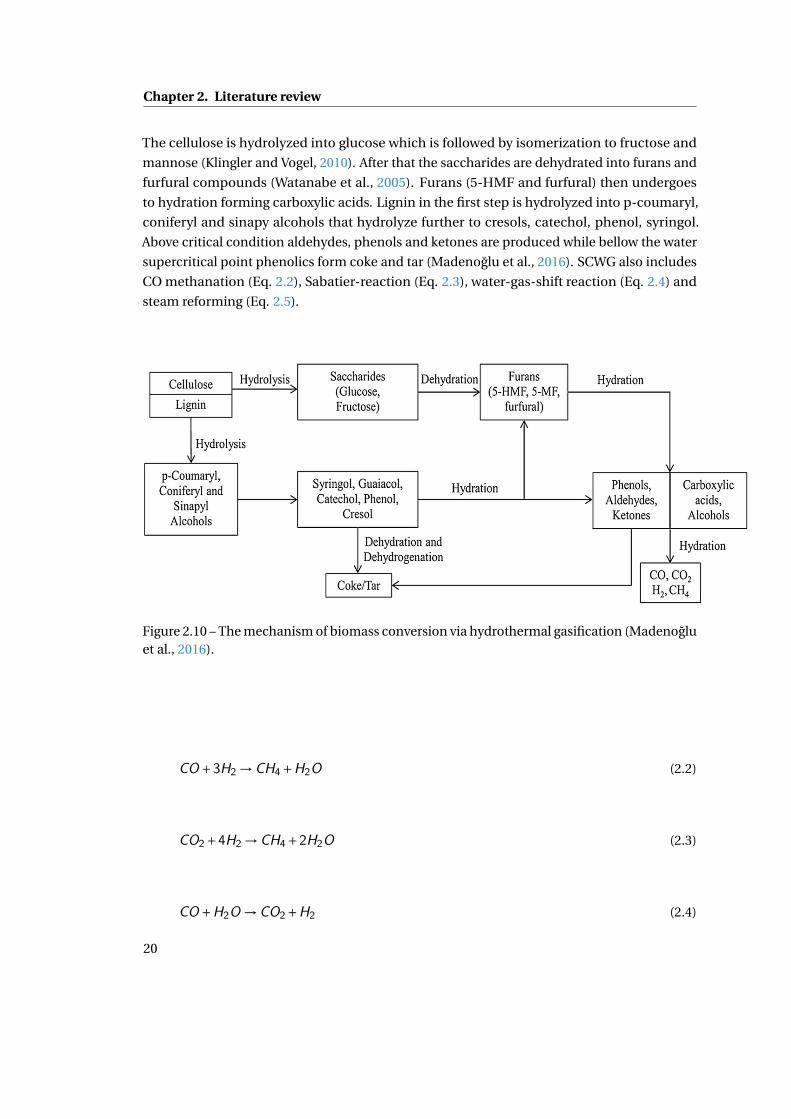
2.10 The mechanism of biomass conversion via hydrothermal gasification (Made-
noglu et al., 2016). . . . . . . . . . . . . . . . . . . . . . . . . . . . . . . . . . . . . . 20
2.11 Three different approaches to capture carbon dioxide (Rackley, 2017). . . . . . 24
3.1 The flowsheet of the investigated Carbon Capture and Storage technology. MEA:
monoethanolamine . . . . . . . . . . . . . . . . . . . . . . . . . . . . . . . . . . . 38
xv
List of Figures
3.2 Detailed representation of damage model of Eco-indicator 99 LCIA method
(MHSPE, 2000). . . . . . . . . . . . . . . . . . . . . . . . . . . . . . . . . . . . . . . 41
3.3 Overall scheme of IMPACT 2002+ LCIA method (Humbert et al., 2012). . . . . . 42
3.4 Microscopic image of Chlorella v. microalgae isolate with oil immersion lens
(1000x zoom, Bel). . . . . . . . . . . . . . . . . . . . . . . . . . . . . . . . . . . . . . 45
3.5 The structure of the RGB-panel and LED module. (a) The schematic figure of the
RGB-LED panel, (b) Monitoring biomass growth in microplate cells. . . . . . . . 47
3.6 Laboratory scaled stirred tank photobioreactor. (1) Photobioreactor, (2) RGB-
LED stand, (3) LED strip, (4) magnetic stirrer, (5) magnet, (6) sampling manifold,
(7) inlet air manifold, (8) sparger, (9) clucking, (10) sampling glass, (11) air filter,
(12) air filter, (13) B.Braun control unit, (14) rotameter . . . . . . . . . . . . . . . 48
3.7 The P&I diagram of microalgae cultivation and hydrothermal gasification. PBR:
photobioreactor, P-1,2,3,4,5,6,7,8,9,10,11,12,13,14: pipe sections, v-1,2,3,4,5,6:
needle valves, PUMP-1,2,3: pumps, HX-1,2,3: heat exchangers, R-1: HTG reactor
section, T-I2-I3: thermocouples. . . . . . . . . . . . . . . . . . . . . . . . . . . . . 53
4.1 Flowsheet of the investigated microalgae-based biofuel plant . . . . . . . . . . . 59
4.2 Energy demand distribution in the case of the dry route . . . . . . . . . . . . . . 60
4.3 Energy demand distribution in the case of the wet route . . . . . . . . . . . . . . 61
4.4 Energy gaining by products. Biodiesel and glycerol are produced through trans-
esterification; biochar, bio-oil and biogas are produced through atmospheric
gasification, Upgraded bio-oil, HTL bio-char and HTL bio-gas are produced via
hydrothermal liquefaction, bio-oil stabilization and hydroprocessing. . . . . . . 62
4.5 Energy demand and net energy ratio of the biorefinery alternatives. (NER values
are highlighted above the columns) (a) Wet route, ORP; (b) Wet route, tPBR; (c)
Dry route, tPBR; (d) Wet route, tPBR with flue gas purification; (e) Wet route, ORP
with flue gas purification; (f ) Dry route, ORP; (g) Dry route; tPBR with flue gas pu-
rification; (h) Dry route, ORP with flue gas purification, (i) Dry route, horizontal
tPBR with flue and (j) Wet route, horizontal tPBR with flue gas purification. . . 63
4.6 Total environmental impacts of the CCS Fossil alternative compared to the
uncontrolled CO2 release in case of (a) IPCC 2007, (b) Eco-indicator 99 and (c)
IMPACT 2002+ LCIA methods. . . . . . . . . . . . . . . . . . . . . . . . . . . . . . 69
xvi
List of Figures
4.7 The results of the multi-perspective impact assessment methods by impact
categories in case of CCS fossil LCA alternative. (a) Eco-indicator 99, (b) IMPACT
2002+ . . . . . . . . . . . . . . . . . . . . . . . . . . . . . . . . . . . . . . . . . . . . 70
4.8 Total environmental impacts of the CCS Improved alternative compared to the
uncontrolled CO2 release in the case of (a) IPCC 2007, (b) Eco-indicator 99 and
(c) IMPACT 2002+ LCIA methods. . . . . . . . . . . . . . . . . . . . . . . . . . . . 72
4.9 The total environmental impacts of different renewable energy sources for MEA
solvent regeneration. a.) Heavy fuel oil, burned in industrial furnace 1MW, non-
modulating/CH U; b.) Heat, at cogeneration with biogas engine, agricultural
covered, allocation exergy/CH U; c.) Heat, at cogeneration with biogas engine,
allocation exergy/CH U; d.) Heat, at cogeneration with ignition biogas engine,
agricultural covered, alloc. energy/CH U; e.) Heat, at cogeneration ORC 1400
kWth, wood, emission control, allocation energy/CH U; f.) Heat, at cogeneration
6400kWth, wood, allocation energy/CH U; g.) Heat, central or small-scale, other
than natural gas (Europe without Switzerland) heat production, wood pellet, at
furnace Alloc Def, U . . . . . . . . . . . . . . . . . . . . . . . . . . . . . . . . . . . 73
4.10 Total environmental impacts of the CCS Renewable alternative compared to the
uncontrolled CO2 release in the case of (a) IPCC 2007, (b) Eco-indicator 99 and
(c) IMPACT 2002+ LCIA methods. . . . . . . . . . . . . . . . . . . . . . . . . . . . 75
4.11 CCS and quota trading cost . . . . . . . . . . . . . . . . . . . . . . . . . . . . . . . 76
4.12 CO2 CCS and quota trading cost by three quota trading rate (AC5/t;AC18/t;AC25/t)
producing 1 MWhe . . . . . . . . . . . . . . . . . . . . . . . . . . . . . . . . . . . . 78
4.13 MCDA result of the reduced PESTLE factors using Multi Attribute Value Theory
(MAVT) for the evaluation. . . . . . . . . . . . . . . . . . . . . . . . . . . . . . . . . 86
4.14 Radial graph of the overall MCDA results . . . . . . . . . . . . . . . . . . . . . . . 87
4.15 Overall result of the Multi-Criteria Decision Analysis . . . . . . . . . . . . . . . . 87
4.16 Fermentations to determine ideal wavelength settings. Data are arithmetic
means of 3 replicates . . . . . . . . . . . . . . . . . . . . . . . . . . . . . . . . . . . 89
4.18 Productivity under different intensity levels, surface plot . . . . . . . . . . . . . . 92
xvii

List of Figures
4.17 Testing adequacy of the fitted statistical model for investigation of light intensity.
(a) Normal probability plot, (b) Predicted vs Observed values, (c) Raw residuals
vs Case number plot. . . . . . . . . . . . . . . . . . . . . . . . . . . . . . . . . . . . 93
4.19 Predicted versus experimental values, model verification . . . . . . . . . . . . . 94
4.20 Fermentations with the scaled up fermentors. . . . . . . . . . . . . . . . . . . . . 95
4.21 Specific component production of biomass . . . . . . . . . . . . . . . . . . . . . 96
4.22 Detecting interaction between aeration and light intensity parameters in case
of (a) biomass productivity, (b) protein, (c) carbohydrate and (d) lipid content.
Intensity level -1: 178.90 (Red) & 64.82 (Blue) µmol m−2 s−1; 1: 256.88 (Red) &
102.10 (Blue) µmol m−2 s−1. Aeration level -1: 0.50 vvm; 1: 0.75 vvm. . . . . . . 97
4.23 Yields of H2, CH4, CO2 and CO biogas components at 550°C, 30.0 MPa and
average 120 sec residence time. (a) 256.88(R) 102.10(B) µmol m−2 s−1, 0.50 vvm;
(b) 256.88(R) 102.10(B) µmol m−2 s−1, 0.75 vvm; (c) 178.90(R) 64.82(B) µmol m−2
s−1, 0.50 vvm; (d) 178.90(R) 64.82(B) µmol m−2 s−1, 0.75 vvm. . . . . . . . . . . . 99
4.24 Comparing biomass productivity, total gas and total specific yield of hydrother-
mal gasification. (a) 256.88(R) 102.10(B) µmol m−2 s−1, 0.50 vvm; (b) 256.88(R)
102.10(B) µmol m−2 s−1, 0.75 vvm; (c) 178.90(R) 64.82(B) µmol m−2 s−1, 0.50
vvm; (d) 178.90(R) 64.82(B) µmol m−2 s−1, 0.75 vvm. . . . . . . . . . . . . . . . . 100
4.25 Specific gas yield of biogas components. (a) 256.88(R) 102.10(B) µmol m−2 s−1,
0.50 vvm; (b) 256.88(R) 102.10(B) µmol m−2 s−1, 0.75 vvm; (c) 178.90(R) 64.82(B)
µmol m−2 s−1, 0.50 vvm; (d) 178.90(R) 64.82(B) µmol m−2 s−1, 0.75 vvm. . . . . 100
B.1 Calibration in the MTP device. (a) Chlorella vulgaris MACC555,Dry Weight (g
L−1) in function of (255-Green) code, (b) Chlorella vulgaris MACC555, Cell num-
ber (cells mL−1) in function of 255-Green code, (c) Chlorella vulgaris MACC555,
Optical Density (OD560) in function of 255-Green code. . . . . . . . . . . . . . . 138
B.2 Calibration for the laboratory scaled stirred tank photobioreactors (a) Chlorella
vulgaris MACC555, Dry Weight content (g L−1) in function of Optical density
(OD560), (b) Chlorella vulgaris MACC555, Cell number (cells mL−1) in function
of Optical density (OD560). . . . . . . . . . . . . . . . . . . . . . . . . . . . . . . . 139
xviii
List of Tables
2.1 Biological composition of different algae strains (Shuba and Kifle, 2018; Carpio
et al., 2015; Chia et al., 2013; Ho et al., 2013) . . . . . . . . . . . . . . . . . . . . . 5
2.2 Water properties under different states (Kumar et al., 2018) . . . . . . . . . . . . 18
3.1 Properties of open Raceway-ponds. All data refer to one unit of raceway-pond.
(Sompech et al., 2012; Jorquera et al., 2010) . . . . . . . . . . . . . . . . . . . . . . 29
3.2 Properties of helical tubular photobioreactor (tPBR). All data refer to one unit of
tPBR. (Chisti, 2008b; Molina et al., 2001; Gómez-Pérez et al., 2015) . . . . . . . . 29
3.3 Characterization in the case of Eco-indicator 99 method. . . . . . . . . . . . . . 40
4.1 Energy demand by operational units . . . . . . . . . . . . . . . . . . . . . . . . . . 58
4.2 Higher Heating Values (HHVs) of the produced energy carriers . . . . . . . . . . 59
4.3 Net energy ratios of biomass based refineries and energy fuels. ORP, Open
Raceway-ponds, tPBR, tubular photobioreactor, HTL, Hydrothermal liquefaction. 65
4.4 Life cycle inventory data of the investigated CCS process related to 774.5 kgCO2/MWhe 67
4.5 Cost analysis for 1 MWhe production; a(Zauba, 2016), b(BAC, 2016), c (Wesnaes
and Weidema, 2006), d (Eurostat, 2014), e(Metz et al., 2005) . . . . . . . . . . . . 77
4.6 Economic factors of each alternatives . . . . . . . . . . . . . . . . . . . . . . . . . 79
4.7 Social factors of each CCS alternatives . . . . . . . . . . . . . . . . . . . . . . . . . 79
4.8 Technological factors of each alternatives . . . . . . . . . . . . . . . . . . . . . . . 80
xix
List of Tables
4.9 Midpoint impacts of CO2 release and CCS technology using IMPACT 2002+
method. Fossil fuel: Heavy fuel oil, burned in industrial furnace; Renewable
energy source: biogas from agricultural waste. . . . . . . . . . . . . . . . . . . . 82
4.10 Midpoint impacts of CO2 release and CCS technology using Eco-indicator 99
(H) method. Fossil fuel: Heavy fuel oil, burned in industrial furnace; Renewable
energy source: biogas from agricultural waste. . . . . . . . . . . . . . . . . . . . 83
4.11 Summary of impact assessment results, IPCC 2007 GWP 100a method . . . . . 84
4.12 Summary of impact assessment results, weighting, IMPACT 2002+ method . . . 84
4.13 Summary of impact assessment results, weighting, Eco-indicator 99(H) method 84
4.14 Proximate and ultimate analysis of Chlorella vulgaris . . . . . . . . . . . . . . . . 88
4.15 Analysis of variance (ANOVA) for the investigation of wavelength effect. . . . . . 90
4.16 Biomass productivity under illumination by different wavelengths. Data are
arithmetic means (±S.E.) of 3 different experiments. . . . . . . . . . . . . . . . . 90
4.17 Central composite design. Data are arithmetic means (±S.E.) of 3 different
experiments. . . . . . . . . . . . . . . . . . . . . . . . . . . . . . . . . . . . . . . . . 91
4.18 Analysis of variance (ANOVA) for response surface model. . . . . . . . . . . . . . 92
4.19 Microalgae cultivation in stirred tank photobioreactor and final biological com-
position of Chlorella vulgaris . . . . . . . . . . . . . . . . . . . . . . . . . . . . . . 98
4.20 Hydrothermal gasification of microalgae biomass at 550°C and 30.0 MPa. . . . . 98
B.1 Estimated regression coefficients of the fitted response surface model in case of
intensity optimization. . . . . . . . . . . . . . . . . . . . . . . . . . . . . . . . . . . 140
B.2 Experimental and predicted results for model verification. Data are arithmetic
means (±S.E.) of 3 different experiments. . . . . . . . . . . . . . . . . . . . . . . . 140
xx
1 Introduction
The worldwide growing population and rising global energy demand enlarge the
necessity of finding alternative energy carriers and new sustainable solutions to prevent energy
shortages and climate change (Demirbas, 2011; IAE, 2011; Duic, 2015). Renewable energy
sources (such as wind, solar, geothermic, biomass) have the potential to mitigate the emission
of greenhouse gases and the negative effects of global warming. Microalgae based biorefineries
are able to contribute for achieving a greener economy by producing biofuels (bioethanol
via fermentation, biodiesel via transesterification, biogas via gasification) that pose lower
environmental damages compared to fossil fuels. Algae have many attractive characteristics
including high growth rate and photosynthetic efficiency, it does not compete with food
market and it can be cultivated on non-arable land. On the other hand the transformation
of microalgae into high energy density biofuels have several technological and economic
obstacles. These barriers are related to the cultivation of algae (it can be cultivated in extremely
dilute suspensions, difficult to control biological systems) and to the downstream processing
which consists of complex process units. Algae are capable to absorb the CO2 content of the
flue gas if it does not contain toxic compounds in high concentration. If it does other options
should be applied for the fixation of carbon dioxide to prevent the uncontrolled release of this
primary greenhouse gas (GHG). Fossil based power plants are responsible for around 30-40%
of the total annual anthropogenic carbon dioxide emission (Gohar and Shine, 2007) and these
point like emission sources provide an excellent opportunity for significant and efficient GHG
emission reduction. The separated CO2 can be stored and subsequently used in the algae
cultivation step which consequently decrease environmental pollution and support circular
economy.
The main motivation of the dissertation is addressing the above mentioned essential
environmental and technological concerns. The aim of the work is to improve the efficiency of
microalgae based biorefineries according to the following points:
1
Chapter 1. Introduction
• Investigation of cradle-to-grave energetic analysis of microalgae based biorefinery alter-
natives.
• Identification of possible refinery bottleneck(s) that can influence significantly the
energy efficiency of a biorefinery.
• Evaluation of Carbon Capture and Storage (CCS) technology using life cycle, PESTLE
and Multi-Criteria Decision Analyses.
• Reducing the environmental effects of the CCS process chain.
• Investigation of microalgae cultivation using artificial illumination.
• Improving the biomass productivity and biological composition (lipid and carbohydrate
content) of algae biomass.
• Influencing positively the yields of hydrothermal gasification and the biogas composi-
tion via the optimization of microalgae cultivation.
The dissertation is partitioned into 6 chapters. Chapter 1 contains the introduction
of the dissertation including the motivation and the aims of the work. The state-of-the-art and
the literature review are organized into Chapter 2. Chapter 3 describes the applied data and
methods throughout the research, while the results can be found in Chapter 4. The conclusions
of the dissertation are summarized in Chapter 5. The main findings of the dissertation are
presented in Chapter 6.
2

2 Literature review
2.1 Microalgae biomass
Microalgae are a simple autotrophic aquatic organisms that are capable to fix the
carbon dioxide from atmosphere and transform it into high value compounds such as proteins,
carbohydrates and lipids. The size of an algae cell ranges from a few micrometers to hundreds
of micrometers, they exist in unicellular and multi-cellular forms. Microalgae can grow in
marine and fresh water and in a wide range of climate zones varies from tundra to desert.
Microalgae are characterized by a wide range of biochemical properties which can be traced
back to their huge biodiversity with over 40 000 species (Rico et al., 2017).
Algae have many attractive characteristics over terrestrial biomass, such as high pho-
tosynthetic efficiency, possible cultivation on non-arable land, high growth rate, relatively low
land-use requirement, accumulation of lipids and absorption of carbon dioxide. Autotrophic
microalgae including bacteria (cyanobacteria), diatoms (Chromalveolata) and unicellular
organisms (e.g., Chromista, Chlorophyta) can be found in either marine or freshwater environ-
ments (Spolaore et al., 2006).
2.2 Properties of Chlorella vulgaris
2.2.1 Morphology
Chlorella vulgaris is classified as follows: Domain: Eukaryota, Kingdom: Protista,
Division: Chlorophyta, Class: Trebouxiophyceae, Order: Chlorellales, Family: Chlorellaceae,
Genus: Chlorella, Specie: Chlorella vulgaris. The structural elements of C. vulgaris are similar
to plants. It contains cell wall, mitochondrion, chloroplast, cytoplasm, Golgi body, chlorophyll,
carotenoids, thylakoids and nucleus as it is illustrated in Figure 2.1. The spherical cells
3

Chapter 2. Literature review
diameter is about 2-10 µm. The thickness and the structure of the cell wall depend on the
actual growth phase (Yamamoto et al., 2007).
Figure 2.1 – Schematic ultrastructure of Chlorella vulgaris (Safi et al., 2014)
2.2.2 Reproduction
C. vulgaris reproduces asexually as it is detailed in Figure 2.2. One cell can multi-
ply within 24 hours by autosporulation. In the first steps the cell is growing (a,b), then the
chloroplast (c) and protoplast (d,e) dividing. After the maturation 4 daughter cells are formed
with their own cell wall (f) and finally the mother cell wall ruptures and the daughter cells are
liberated. The asexual reproduction of algae comes to pass quickly. Thanks to the high growth
rate the total algae biomass can be doubled within 24 hours (Gikonyo, 2013).
Figure 2.2 – Daughter cell-wall formation during reproduction in Chlorella vulgaris (Yamamotoet al., 2004, 2007)
4
2.3. Biological composition
2.3 Biological composition
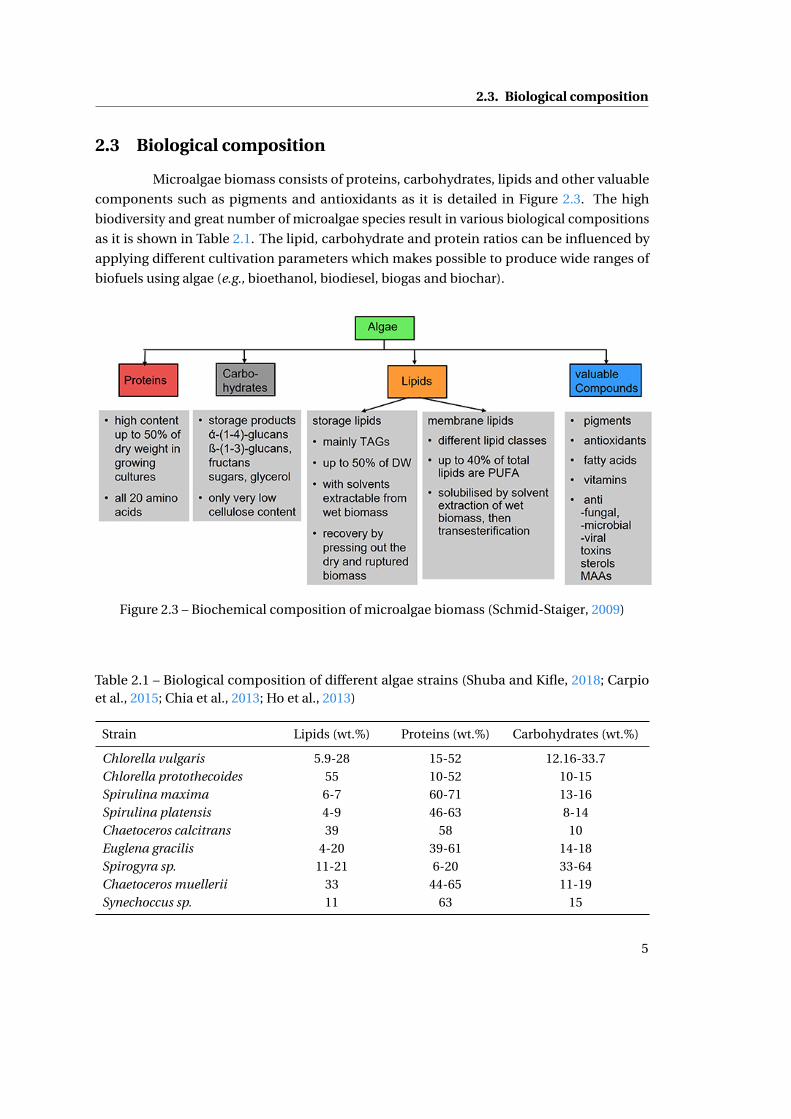
Microalgae biomass consists of proteins, carbohydrates, lipids and other valuable
components such as pigments and antioxidants as it is detailed in Figure 2.3. The high
biodiversity and great number of microalgae species result in various biological compositions
as it is shown in Table 2.1. The lipid, carbohydrate and protein ratios can be influenced by
applying different cultivation parameters which makes possible to produce wide ranges of
biofuels using algae (e.g., bioethanol, biodiesel, biogas and biochar).
Figure 2.3 – Biochemical composition of microalgae biomass (Schmid-Staiger, 2009)
Table 2.1 – Biological composition of different algae strains (Shuba and Kifle, 2018; Carpioet al., 2015; Chia et al., 2013; Ho et al., 2013)
Strain Lipids (wt.%) Proteins (wt.%) Carbohydrates (wt.%)
Chlorella vulgaris 5.9-28 15-52 12.16-33.7Chlorella protothecoides 55 10-52 10-15Spirulina maxima 6-7 60-71 13-16Spirulina platensis 4-9 46-63 8-14Chaetoceros calcitrans 39 58 10Euglena gracilis 4-20 39-61 14-18Spirogyra sp. 11-21 6-20 33-64Chaetoceros muellerii 33 44-65 11-19Synechoccus sp. 11 63 15
5
Chapter 2. Literature review
2.4 Influencing cultivation factors
2.4.1 Light
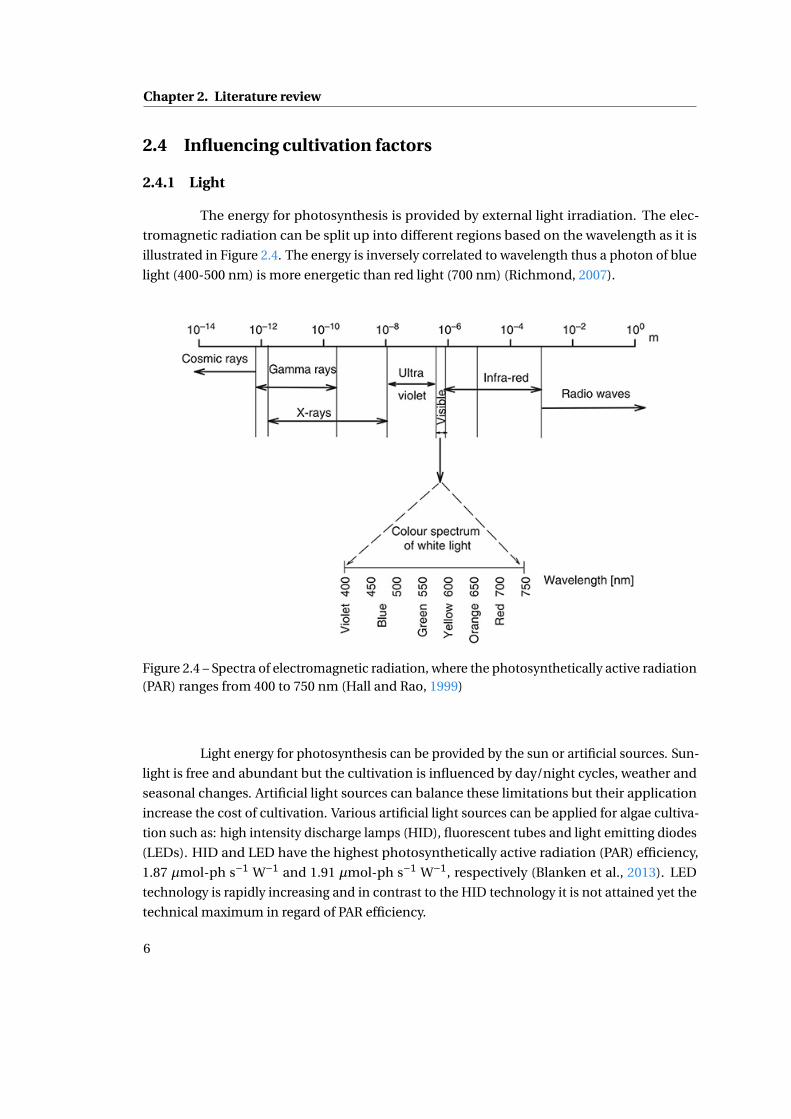
The energy for photosynthesis is provided by external light irradiation. The elec-
tromagnetic radiation can be split up into different regions based on the wavelength as it is
illustrated in Figure 2.4. The energy is inversely correlated to wavelength thus a photon of blue
light (400-500 nm) is more energetic than red light (700 nm) (Richmond, 2007).
Figure 2.4 – Spectra of electromagnetic radiation, where the photosynthetically active radiation(PAR) ranges from 400 to 750 nm (Hall and Rao, 1999)
Light energy for photosynthesis can be provided by the sun or artificial sources. Sun-
light is free and abundant but the cultivation is influenced by day/night cycles, weather and
seasonal changes. Artificial light sources can balance these limitations but their application
increase the cost of cultivation. Various artificial light sources can be applied for algae cultiva-
tion such as: high intensity discharge lamps (HID), fluorescent tubes and light emitting diodes
(LEDs). HID and LED have the highest photosynthetically active radiation (PAR) efficiency,
1.87 µmol-ph s−1 W−1 and 1.91 µmol-ph s−1 W−1, respectively (Blanken et al., 2013). LED
technology is rapidly increasing and in contrast to the HID technology it is not attained yet the
technical maximum in regard of PAR efficiency.
6

2.4. Influencing cultivation factors
The efficiency of LEDs must be developed in three different areas (Pimputkar et al.,
2009; Narukawa et al., 2010): (1) Overheating due to high currents decreases the lifetime of
LEDs, while high temperature of the light source can increase the temperature of culture in
case of closed system decreasing the biomass productivity. (2) The wall plug efficiency (WPE),
the ratio between radiant flux and electrical input power, decreases with increasing currents
limiting the efficient irradiation of photobioreactor surfaces. (3) High internal reflection of
photons should be decreased to prevent light loss.
Closed indoor systems require artificial light sources which expands the number of
possible influencing factors on cultivation with light’s wavelength distribution and intensity.
Light emitting diodes (LEDs) emerged recently as one of the most appropriate light sources for
microalgae cultivation (Helena et al., 2016; Atta et al., 2013; Schulze et al., 2017). LEDs provide
longer lifetime and better energy efficiency compared to fluorescent lamps or tubs. Cultivation
experiments under LEDs were successfully carried out in a number of works (Hu and Sato,
2017; Ra et al., 2016; Severes et al., 2017). Several studies showed that different wavelengths
influence growth and photosynthetic metabolism in algae (Aguilera et al., 2000; Samudra
et al., 2015; Carneiro et al., 2009; Teo et al., 2014). Photon flux density (PFD) and wavelength
are important cultivation factors (Schulze et al., 2014) because they have high impact on
photosynthesis: low light intensities can cause photolimitation, while excessive intensities lead
to photoinhibition, therefore as a consequence, economic microalgae cultivation demands
optimized illumination conditions.
2.4.2 Nutrients
One of the most important nutrient for microalgae growth is the nitrogen. Nitrogen
limitation as a stress condition affects lipid metabolism in algae. Nitrogen deficiency enhances
the accumulation of lipids in cells. Li et al. (2011) found that following nitrogen depletion starch
content of the biomass decreased while neutral lipid content increased up to 52.1% of cell
dry weight in case of Pseudochlorococcum sp. Nitrogen starvation can also affect astaxanthin
content in certain strains. Zhekisheva et al. (2002) reported that the astaxanthin and also the
fatty acid content was increased due to nitrogen limitation in case of Haematococcus pluvialis.
Phosphorus limitation is also increasing TAG content and influence lipid composi-
tion. Higher phosphorus content in the cultivation medium results in increasing amount of
16:0 and 18:1 in cells. Though, at the same time, deprivation was found in cases of 18:4ω3,
20:5ω3 and 22:6ω3 (Khozin-Goldberg and Cohen, 2006; Hu et al., 2008).
Osmotic environment changes the biological composition of algae. Takagi et al.
(2006) found that increasing the salt concentration (NaCl) from 0.5 to 1.0 M results in higher
intracellular lipid content (67%) though it is also reported that the photosynthesis and cell
7
Chapter 2. Literature review
growth rate was inhibited by high osmotic stress (up to 1.5 M NaCl concentration). Pal et al.
(2011) reported that the TFA content was increased to 47% of the DW at 13 g L−1 NaCl in case
of Nannochloropsis sp.
2.4.3 Aeration
Beyond sufficient illumination conditions, algae requires efficient gas transfer to
achieve high rates of photosynthesis. Carbon is an essential element for adequate algae growth
and it accounts to around 50 wt.% of algae biomass. CO2 is the primary carbon source for
phototrophic algae cells. Elevating the atmospheric concentration of CO2 in inlet air (0.039%)
to 1-5 % increases the biomass and chlorophyll productivities as well (Chinnasamy et al., 2009).
Tang et al. (2011) cultivated Scenedesmus and Chlorella sp. with 0.03%, 5%, 10%, 20%, 30%,
50% CO2. The investigated microalgae strains showed the best growth potential at 10% CO2.
Cheng et al. (2019) examined the effects of simulated flue gas containing 10% CO2, 200 ppm
NOx and 100 ppm SOx in the case of Chlorella sp. The results showed that the strain is able
to tolerate the toxic compounds during the cultivation, and the maximum CO2 fixation rate
was 1.2 g L−1 d−1. These results show that the CO2 biofixation of microlagae biomass has the
potential to become a sustainable way to mitigate anthropogenic CO2 emission. Li et al. (2018)
investigated the relationship between the elevated level of CO2 concentration and dark/light
cycles in the case of Ulva prolifera. They found significantly higher growth rate and lower dark
respiration rate at 16:8 h light:dark treatment comparing to 12:12 h cycles regardless of the
CO2 treatment.
Photoautotrophic conditions are also affected by dissolved oxygen (DO) concen-
tration which is produced as a co-product via photosynthesis. Higher oxygen concentration
elevates photoinhibition due to the fact that oxygen radicals have damaging effects on pho-
tosynthetic structures (Ugwu et al., 2007). Increasing the DO concentration from 22±2 mg
L−1 to 60±19 mg L−1 decreases the chlorophyl (from 6.02±0.18 to 2.57±0.05 mg L−1 d−1) and
biomass productivity (from 570±28 to 380±18 mg L−1 d−1) (Richmond, 2007).
2.5 Microalgae biorefineries
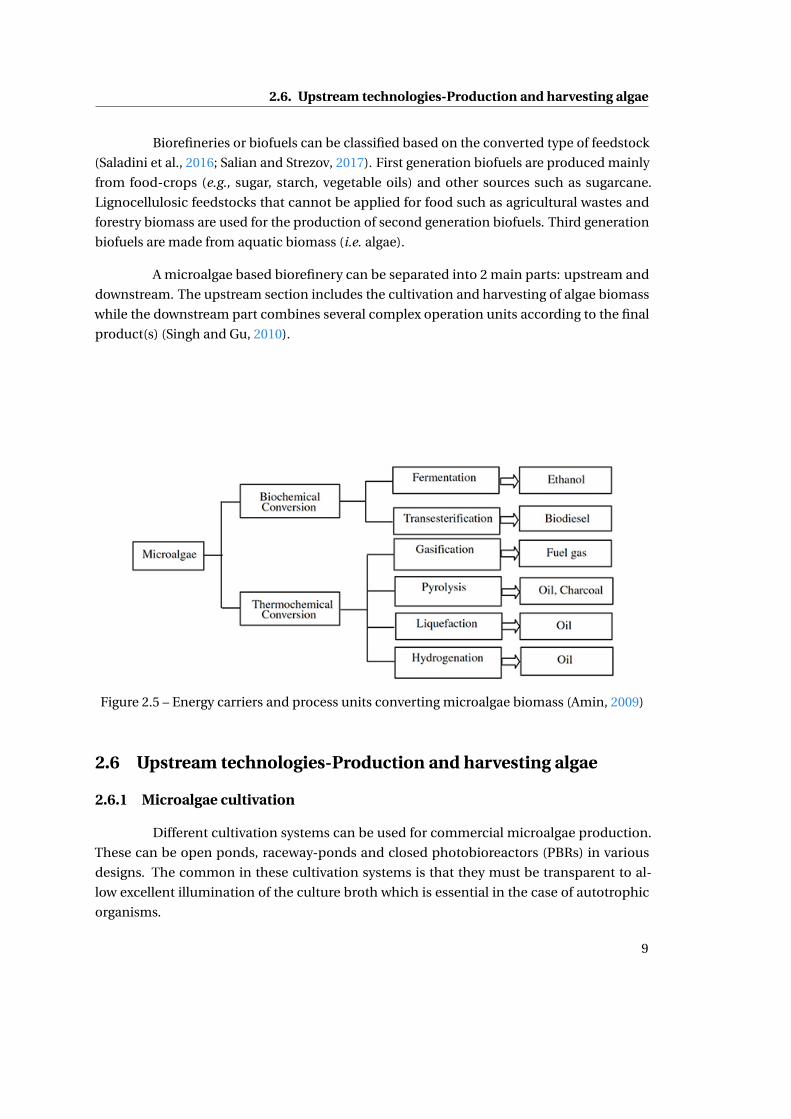
There is a growing interest in the concept of algae biorefineries, which are able
to produce a diverse products in a wide range, similarly to oil refineries. Beside biofuels,
biorefineries can provide valuable components such as proteins, polysaccharides, pigments,
pharmaceutical, animal feed and fertilizers (Gikonyo, 2013). Microalgae biomass can be
converted into biofuels via biochemical and thermochemical conversion routes as it is detailed
in Figure 2.5.
8
2.6. Upstream technologies-Production and harvesting algae
Biorefineries or biofuels can be classified based on the converted type of feedstock
(Saladini et al., 2016; Salian and Strezov, 2017). First generation biofuels are produced mainly
from food-crops (e.g., sugar, starch, vegetable oils) and other sources such as sugarcane.
Lignocellulosic feedstocks that cannot be applied for food such as agricultural wastes and
forestry biomass are used for the production of second generation biofuels. Third generation
biofuels are made from aquatic biomass (i.e. algae).
A microalgae based biorefinery can be separated into 2 main parts: upstream and
downstream. The upstream section includes the cultivation and harvesting of algae biomass
while the downstream part combines several complex operation units according to the final
product(s) (Singh and Gu, 2010).
Figure 2.5 – Energy carriers and process units converting microalgae biomass (Amin, 2009)
2.6 Upstream technologies-Production and harvesting algae
2.6.1 Microalgae cultivation
Different cultivation systems can be used for commercial microalgae production.
These can be open ponds, raceway-ponds and closed photobioreactors (PBRs) in various
designs. The common in these cultivation systems is that they must be transparent to al-
low excellent illumination of the culture broth which is essential in the case of autotrophic
organisms.
9
Chapter 2. Literature review
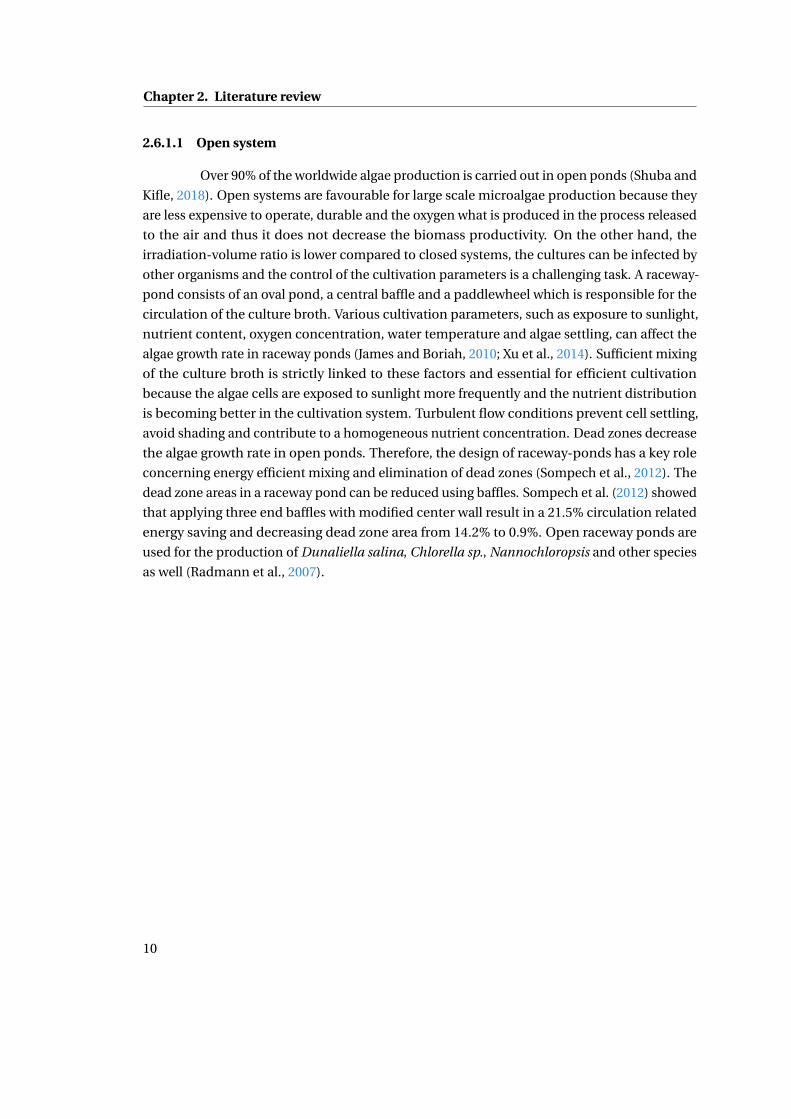
2.6.1.1 Open system
Over 90% of the worldwide algae production is carried out in open ponds (Shuba and
Kifle, 2018). Open systems are favourable for large scale microalgae production because they
are less expensive to operate, durable and the oxygen what is produced in the process released
to the air and thus it does not decrease the biomass productivity. On the other hand, the
irradiation-volume ratio is lower compared to closed systems, the cultures can be infected by
other organisms and the control of the cultivation parameters is a challenging task. A raceway-
pond consists of an oval pond, a central baffle and a paddlewheel which is responsible for the
circulation of the culture broth. Various cultivation parameters, such as exposure to sunlight,
nutrient content, oxygen concentration, water temperature and algae settling, can affect the
algae growth rate in raceway ponds (James and Boriah, 2010; Xu et al., 2014). Sufficient mixing
of the culture broth is strictly linked to these factors and essential for efficient cultivation
because the algae cells are exposed to sunlight more frequently and the nutrient distribution
is becoming better in the cultivation system. Turbulent flow conditions prevent cell settling,
avoid shading and contribute to a homogeneous nutrient concentration. Dead zones decrease
the algae growth rate in open ponds. Therefore, the design of raceway-ponds has a key role
concerning energy efficient mixing and elimination of dead zones (Sompech et al., 2012). The
dead zone areas in a raceway pond can be reduced using baffles. Sompech et al. (2012) showed
that applying three end baffles with modified center wall result in a 21.5% circulation related
energy saving and decreasing dead zone area from 14.2% to 0.9%. Open raceway ponds are
used for the production of Dunaliella salina, Chlorella sp., Nannochloropsis and other species
as well (Radmann et al., 2007).
10
2.6. Upstream technologies-Production and harvesting algae
Figure 2.6 – A schematic figure of a raceway-pond unit with scaling. (a) Raceway-pond, (b)paddlewheel. (Sompech et al., 2012).
2.6.1.2 Closed photobioreactors
Photobioreactors are closed illuminated culture vessels where there is not direct
exchange between the environment (gases and contaminants) and the culture. Adjustable
closed cultivation systems have several advantages over open systems. The application of
photobioreactors (PBRs) minimize the contamination by invasive organisms and allow axenic
algal cultivation and thus the fermentation of monoculture becomes more productive. PBRs
prevent water evaporation, enable higher cell concentration, hinder CO2 loss, permit the
production of complex biopharmaceuticals and offer better control of cultivation conditions
such as pH, temperature, illumination, and CO2 concentration (Singh and Sharma, 2012). It
is easier to optimize closed systems which makes possible to cultivate certain species that
otherwise cannot be cultivated in open systems (Mata et al., 2010).
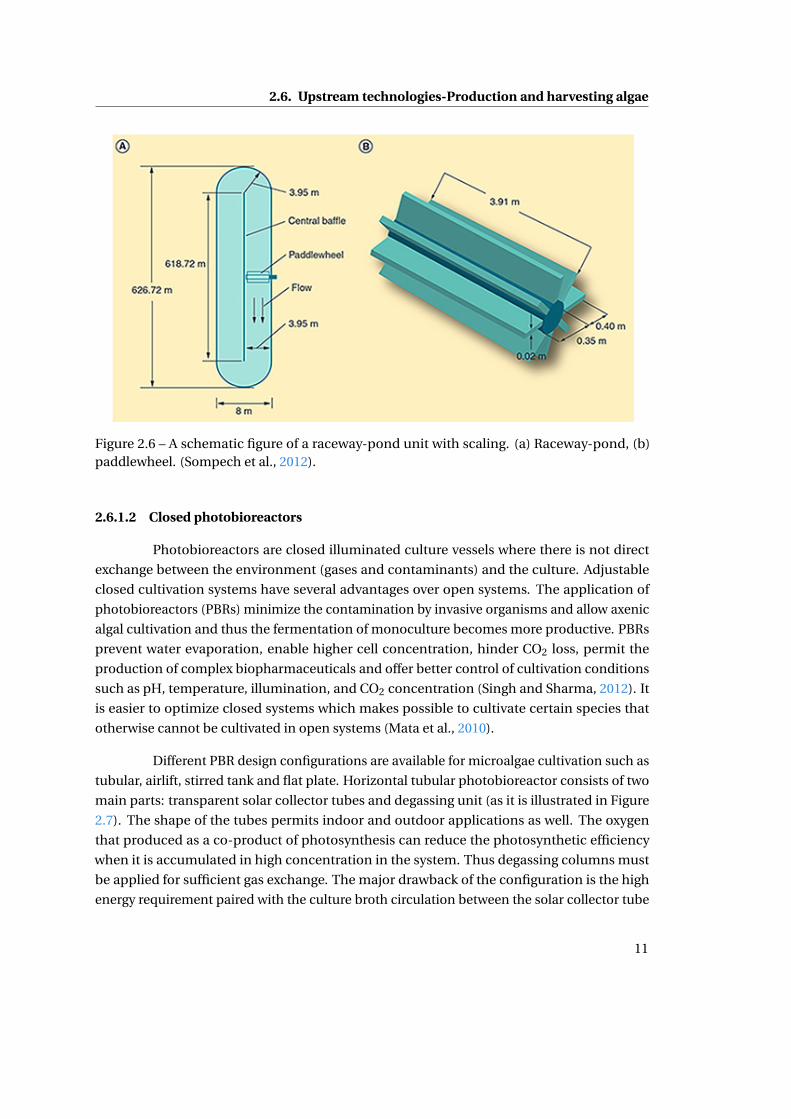
Different PBR design configurations are available for microalgae cultivation such as
tubular, airlift, stirred tank and flat plate. Horizontal tubular photobioreactor consists of two
main parts: transparent solar collector tubes and degassing unit (as it is illustrated in Figure
2.7). The shape of the tubes permits indoor and outdoor applications as well. The oxygen
that produced as a co-product of photosynthesis can reduce the photosynthetic efficiency
when it is accumulated in high concentration in the system. Thus degassing columns must
be applied for sufficient gas exchange. The major drawback of the configuration is the high
energy requirement paired with the culture broth circulation between the solar collector tube
11
Chapter 2. Literature review
and the degassing unit. The high energy input can be traced back to the required high velocity
of the suspension (20-50 cm s−1) which allows turbulent flow in the solar receiver tubes with
short light-dark cycles (Posten, 2009).
Figure 2.7 – A schematic figure of a tubular photobioreactor (Chisti, 2008a).
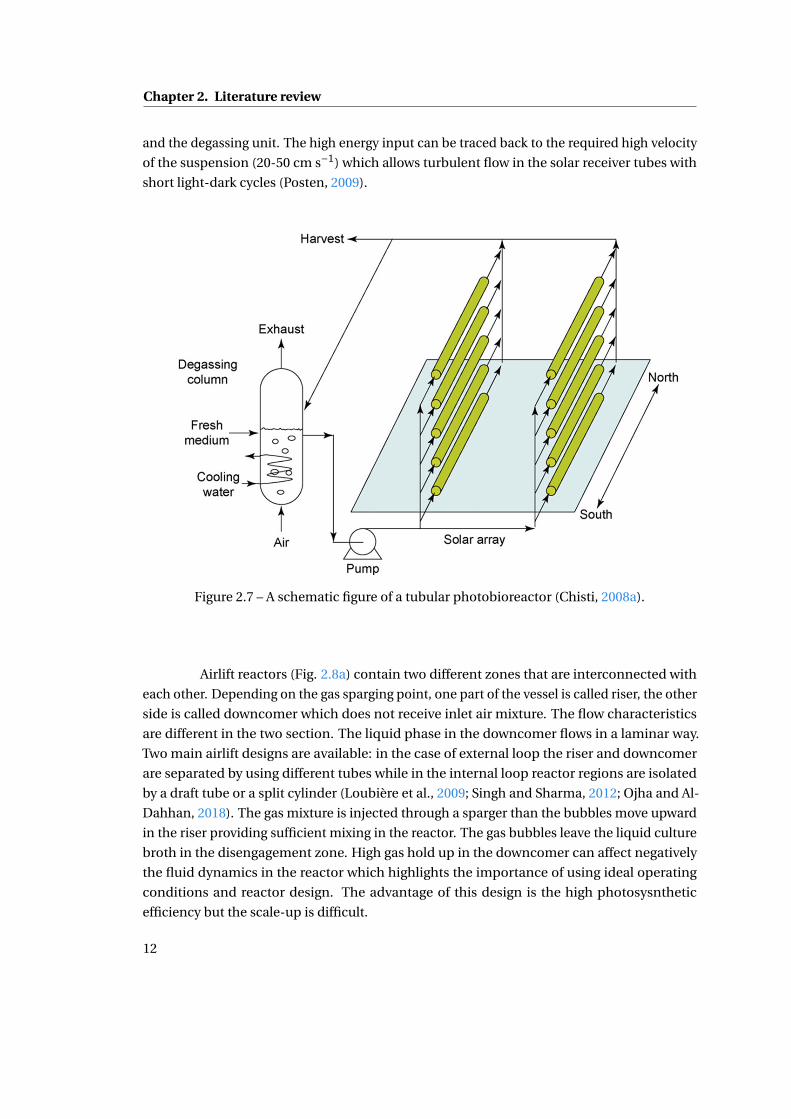
Airlift reactors (Fig. 2.8a) contain two different zones that are interconnected with
each other. Depending on the gas sparging point, one part of the vessel is called riser, the other
side is called downcomer which does not receive inlet air mixture. The flow characteristics
are different in the two section. The liquid phase in the downcomer flows in a laminar way.
Two main airlift designs are available: in the case of external loop the riser and downcomer
are separated by using different tubes while in the internal loop reactor regions are isolated
by a draft tube or a split cylinder (Loubière et al., 2009; Singh and Sharma, 2012; Ojha and Al-
Dahhan, 2018). The gas mixture is injected through a sparger than the bubbles move upward
in the riser providing sufficient mixing in the reactor. The gas bubbles leave the liquid culture
broth in the disengagement zone. High gas hold up in the downcomer can affect negatively
the fluid dynamics in the reactor which highlights the importance of using ideal operating
conditions and reactor design. The advantage of this design is the high photosysnthetic
efficiency but the scale-up is difficult.
12
2.6. Upstream technologies-Production and harvesting algae
(a)
(b)
(c)
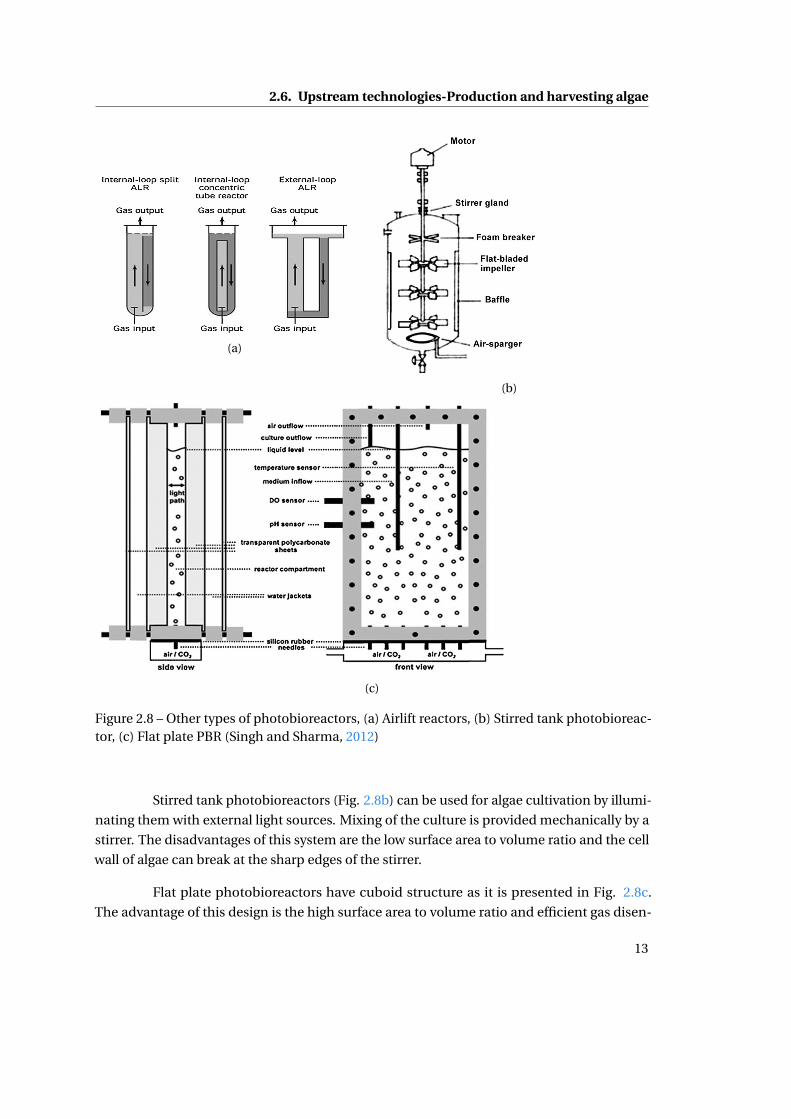
Figure 2.8 – Other types of photobioreactors, (a) Airlift reactors, (b) Stirred tank photobioreac-tor, (c) Flat plate PBR (Singh and Sharma, 2012)
Stirred tank photobioreactors (Fig. 2.8b) can be used for algae cultivation by illumi-
nating them with external light sources. Mixing of the culture is provided mechanically by a
stirrer. The disadvantages of this system are the low surface area to volume ratio and the cell
wall of algae can break at the sharp edges of the stirrer.
Flat plate photobioreactors have cuboid structure as it is presented in Fig. 2.8c.
The advantage of this design is the high surface area to volume ratio and efficient gas disen-
13
Chapter 2. Literature review
gagement system. The mixing of the culture can be done by bubbling air and mechanical
rotation using a motor to provide a rocking motion as it is shown in the work of Gilbert et al.
(2011). The air or the air/CO2 mixture is injected at the bottom of the reactor through a sparger.
Tubular photobioreactors have better biomass productivity but flat plate systems offer low
oxygen build-up, low cost and good control of biofouling (Bergmann et al., 2013; Khadim
et al., 2018). The light path is very thin between the transparent parallel walls which prevents
the self-shadowing of cells and results the highest photosynthetic efficiency and growth rate
among PBRs (Tamburic et al., 2011). The scale up of flate plate PBRs is a difficult technological
challenge. Widening the light path decrease the photosynthetic efficiency while lengthening
of the reactor is also not recommended due to bulging and cracking. Vertical glass dividers
can be used in every 90 to 100 cm to hold together the plates (Cheng-Wu et al., 2001). The
scale-up can be done by placing several units over an area. Pilot-scale cultivation (≥80 L) is
already demonstrated using K. veneficum by López-Rosales et al. (2018).
2.6.2 Harvesting
Harvesting of microalgae biomass is a challenging task because of the small cell size
(with a diameter ranges between 3-30µm) and the dilute cultivation broth (Slater et al., 2015).
The harvesting process can involve mechanical, chemical, biological and electrical methods.
Thickening methods (e.g., coagulation, flocculation, bioflocculation, gravity sedimentation,
flotation and electrical based methods) can be applied to increase the solid concentration of
the produced broth. Following the thickening methods dewatering processes (filtration and
centrifugation) can be used to decrease further the water content of the algae stream (Barros
et al., 2015).
2.7 Downstream technologies-Processing algae biomass
2.7.1 Biochemical conversion
2.7.1.1 Fermentation
The high sugar and starch content of certain strains make the algae biomass suitable
to produce bioethanol via fermentation (El-Dalatony et al., 2016). Yeasts and bacteria are
used as fermentative organisms in the process. Yeasts such as Saccharomyces cerevisiae and
Schizosaccharomyces pombe are able to produce ethanol in the presence of oxygen based on
the Crabtree effect. Kluyveromyces lactis and Candida albicans are Crabtree-negative yeast and
degrade sugars to CO2 (Piškur et al., 2006; Mussatto et al., 2012; Azhar et al., 2017; Phwan et al.,
2018). Bacteria such as Zymomonas mobilis, Klebsiella oxytoca and Escherichia coli can be
used to produce bioethanol. Bacteria offer high growth rates, the utilization of several different
14
2.7. Downstream technologies-Processing algae biomass
carbon sources and economic operation. High ethanol yield (0.4 g ethanol (g algae)−1) was
achieved by E. coli SJL2526 in case of Chlorella vulgaris algae (Lee et al., 2011) at 37°C and
pH 7.0. Bacteria are able to ferment wider range of sugars to ethanol compared to yeast,
however, the ethanol yield is lower because of the formation of co-products throughout the
fermentation and more sensitive to pH change (Balat et al., 2008).
The fermentation of algae biomass to ethanol is a promising technology but the
conversion of sugar and starch containing feedstocks competes with the food market which
makes these sources less attractive for the production of energy carriers (Mata et al., 2010).
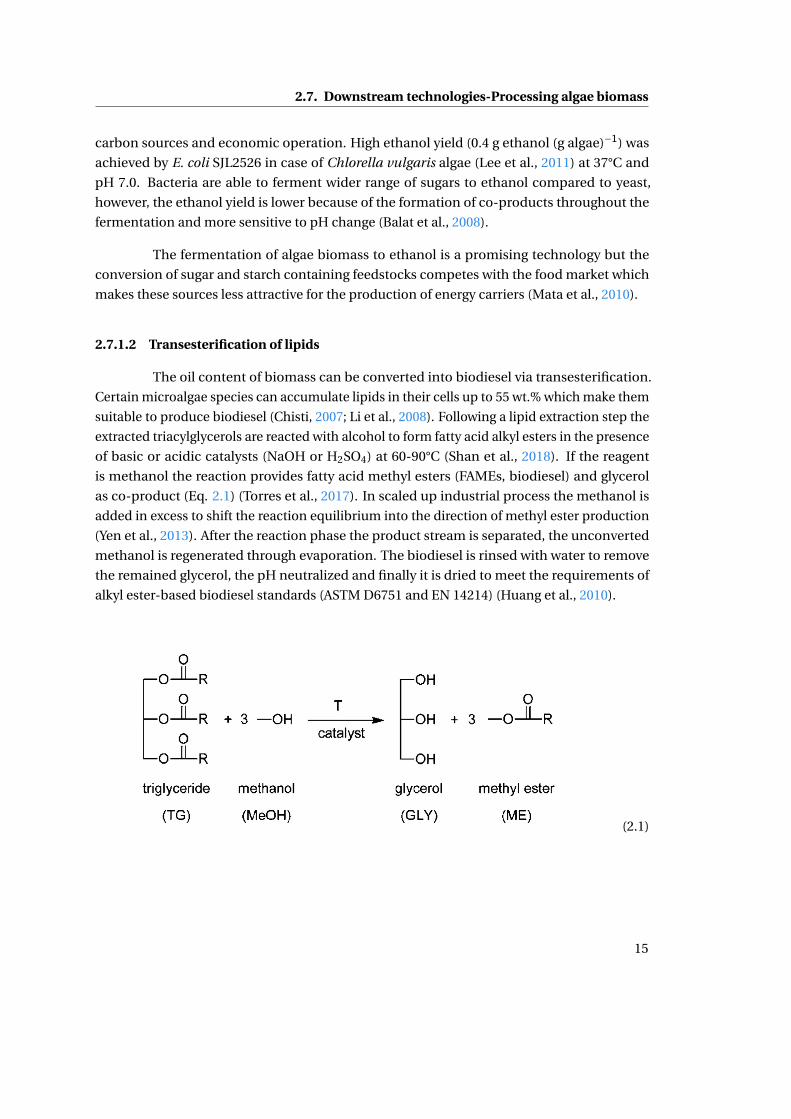
2.7.1.2 Transesterification of lipids
The oil content of biomass can be converted into biodiesel via transesterification.
Certain microalgae species can accumulate lipids in their cells up to 55 wt.% which make them
suitable to produce biodiesel (Chisti, 2007; Li et al., 2008). Following a lipid extraction step the
extracted triacylglycerols are reacted with alcohol to form fatty acid alkyl esters in the presence
of basic or acidic catalysts (NaOH or H2SO4) at 60-90°C (Shan et al., 2018). If the reagent
is methanol the reaction provides fatty acid methyl esters (FAMEs, biodiesel) and glycerol
as co-product (Eq. 2.1) (Torres et al., 2017). In scaled up industrial process the methanol is
added in excess to shift the reaction equilibrium into the direction of methyl ester production
(Yen et al., 2013). After the reaction phase the product stream is separated, the unconverted
methanol is regenerated through evaporation. The biodiesel is rinsed with water to remove
the remained glycerol, the pH neutralized and finally it is dried to meet the requirements of
alkyl ester-based biodiesel standards (ASTM D6751 and EN 14214) (Huang et al., 2010).
(2.1)
15
Chapter 2. Literature review
2.7.2 Thermochemical conversion
2.7.2.1 Pyrolysis
The pyrolysis of biomass is conducted at high temperature between 400-600°C in
inert atmospheric environment (Chiaramonti et al., 2015). Three types of the pyrolysis can be
differentiated: (1) slow pyrolysis is performed with long residence time (>30 minutes) and low
heating rate (8.3·10−2-1.7·10−1°C s−1), (2) fast pyrolyis is typically carried out with moderate
residence time (10-20 sec) and at high temperature (500°C) and heating rate (1-200°C s−1),
while (3) flash pyrolysis is conducted with short residence time (about 1 sec) and high heating
rate up to 1000°C s−1 (Marcilla et al., 2013). Flash pyrolysis provides liquid bio-oil (75%), solid
char (2%) and noncondensable pyrogas (13%), while in the case of slow pyrolysis these values
are 30%, 35%, 35%, respectively (Brennan and Owende, 2010).
2.7.2.2 Atmospheric gasification
Atmospheric gasification of dry biomass results in combustible gaseous product
containing mainly CH4, H2, CO2, CO and N2. The partial oxidation of biomass occurs at high
temperature range from 800-1000°C in air, oxygen and water (steam) media (Mathimani et al.,
2019). The process consists of 4 stages: (a) pre-dyring the feedstock to remove its moisture
content, (b) pyrolysis to break the biomass into smaller pieces, (c) oxidation of the smaller
fragments and (d) final gasification to produce small molecules with high energy content.
Gasifying algae biomass (Spirulina; Nannochloropsis sp.) result in high quality biogas (H2:
20-46%, CH4: 4-10%, CO: 6-35%, CO2:12-40%) as it is reported by Sanchez-Silva et al. (2013);
Yang et al. (2013); Duman et al. (2014).
2.7.3 Hydrothermal technologies
The hydrothermal treatment of biomass is a thermochemical process where the
feedstock is decomposed in hot compressed water. Depending on the reaction parameters
(temperature and pressure) biomass can be converted into solid (hydrochar), liquid (bio-oil)
and gaseous (fuel gas) energy carriers. The byproducts that are formed during the process are
useful nutrients that can be recovered and used in other processes. The main advantage of
hydrothermal treatment compared to conventional thermochemical processes is that high
moisture content biomass (up to even 90%) can be used as feedstock because the water next
to the dry matter are used as a reagent and a solvent at same time in the process. These
processes do not require the drying of the feedstock which allows the elimination of the drying
process resulting a significant amount of energy saving. The hydrothermal treatment becomes
favourable compared to conventional processes if the moisture content of the feedstock is
higher than 30% (Savage et al., 2010; Kumar et al., 2018).
16
2.7. Downstream technologies-Processing algae biomass
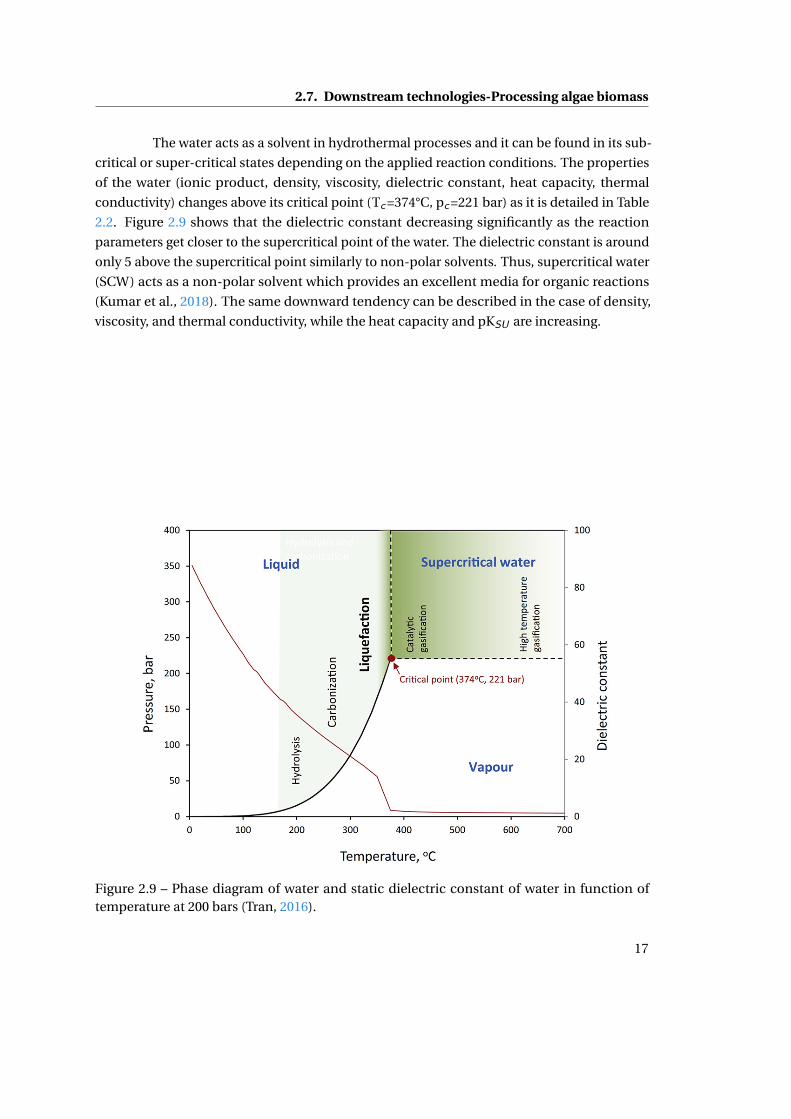
The water acts as a solvent in hydrothermal processes and it can be found in its sub-
critical or super-critical states depending on the applied reaction conditions. The properties
of the water (ionic product, density, viscosity, dielectric constant, heat capacity, thermal
conductivity) changes above its critical point (Tc =374°C, pc =221 bar) as it is detailed in Table
2.2. Figure 2.9 shows that the dielectric constant decreasing significantly as the reaction
parameters get closer to the supercritical point of the water. The dielectric constant is around
only 5 above the supercritical point similarly to non-polar solvents. Thus, supercritical water
(SCW) acts as a non-polar solvent which provides an excellent media for organic reactions
(Kumar et al., 2018). The same downward tendency can be described in the case of density,
viscosity, and thermal conductivity, while the heat capacity and pKSU are increasing.
Figure 2.9 – Phase diagram of water and static dielectric constant of water in function oftemperature at 200 bars (Tran, 2016).
17

Chapter 2. Literature review
Table 2.2 – Water properties under different states (Kumar et al., 2018)
Parameters Normal water Sub-critical water Super-critical water
Temperature (°C) 25 250 400Pressure (MPa) 0.1 5 25Density (g cm−1) 0.997 0.800 0.170Viscosity (m Pa s) 0.89 0.11 0.03Dielectric constant 78.5 27.1 5.9Heat capacity(kJ kg−1 K−1)
4.22 4.86 13
pKsu 14.0 11.2 19.4Thermal conductivity(mW m−1 K−1)
608 620 160
Water has a prominent role in hydrothermal reactions. Free-radical reactions occur
at high temperature and low water density, while ionic reaction mechanism can be assumed at
high water density bellow the critical temperature or at supercritical condition and very high
pressures (Henrikson et al., 2003; Tran, 2016).
From technological point of view, there are various challenges that arise during
the hydrothermal treatment of wet biomass. These are related to corrosion, precipitation of
inorganic salts, char and coke formation, energy and conversion efficiency, product separation,
slurry feeding, biocrude stabilization, water management and process costs (Tekin et al., 2014;
Tran, 2016; Dãrãban et al., 2015).
2.7.3.1 Hydrothermal liquefaction (HTL)
The main product of hydrothermal liquefaction is liquid fuel also known as biocrude
or bio-oil. The process takes place at high temperature (300-374°C) and pressure (50-200 bar)
at subcritical water condition. Many complex reactions occur during the decomposition of
biomass. The degradation mechanisms include (Tekin et al., 2014; Toor et al., 2011):
• depolymerization of biomass,
• degradation of monomers (cleavage, dehydration, and decarboxylation reactions),
• recombination or polymerization of fragmented components.
Most of the HTL reactors are based on CSTR (continuous stirred tank reactor) batch
type design (Zhang et al., 2011; Jena et al., 2011; Brand et al., 2014) where the heat transfer is
18
2.7. Downstream technologies-Processing algae biomass
carried out through the reactor wall using fluidized sand, molten tin, oil batches or external
electric heaters. Continuous operation can be carried out using tubular plug-flow reactors
though there are some requirements that must be taken care of: (i) short residence time
must be used to minimize coke formation and to prevent the decrease of heat transfer and
the fouling and plugging of the reactor, (ii) high heating rate should be used to prevent side
reactions, (iii) application of special alloys that can resist to high corrosion.
Catalysts can be used to improve component yields, process efficiency and to de-
crease the formation of char, coke and tar. In the case of NaOH the hydroxide ions prevent
polymerization and thus less char is produced (Sugano et al., 2008; Durak and Aysu, 2016).
Homogeneous and heterogeneous catalyst are also reported for the transformation of biomass.
Alkali salts (KOH, Na2CO3, KHCO3) are regarded as efficient catalysts in the process reducing
the char and tar formation and improving product yield. Karagöz et al. (2005) investigated low
temperature catalytic hydrothermal treatment of wood biomass and they ranked the catalytic
activity of alkali salts as follows: K2CO3>KOH>Na2CO3>NaOH. Alkali catalysts accelerate
water-gas shift reaction, increase the pH of the media decreasing dehydration reactions and
their utilization is considered to be economic. The general problem of applying homogeneous
catalyst is that the separation from the products are complicated and expensive.
Several heterogeneous catalyst also reported as efficient HTL catalysts such as ZrO2,
CeO2, La2O3, MnO, MgO, NiO, ZnO, ZnCl2, NiCl2 (Hammerschmidt et al., 2011; Yim et al., 2017;
Long et al., 2016; Christensen et al., 2014; Lee et al., 2016). The application of heterogeneous
catalyst in HTL process improves biocrude quality. Noble metals (Pt, Pd) can also be used
but their application is very expensive (Zhou et al., 2016). Ni/SiO2 and Co/CNTs catalyst were
used for the transformation of microalgae biomass, the catalysts improved the bio-oil yield
using low temperature (250°C) and improved the quality of bio-oil resulting low O/C ratios
(Saber et al., 2016; Chen et al., 2017).
2.7.3.2 Hydrothermal gasification (HTG)
Fuel gas (H2, CH4, CO2, CO, C2H4, C2H6) can be produced via supercritical water
gasification (SCWG) or hydrothermal gasification where water is at supercritical state. The
reaction temperature and pressure in the process are between 500-700°C and higher than
221 bar, respectively (Sert et al., 2018). The process has several advantages over atmospheric
gasification: (1) wet biomass with high moisture content (30-90%) can be applied as feedstock
without using any pre-drying step, (2) high quality syngas (H2/CO) can be produced, (3)
product stream contains less impurities and char/tar, (4) the biogas composition can be
controlled with the reaction parameters (temperature, pressure, feedstock concentration).
Figure 2.10 shows the conversion mechanisms of biomass to gaseous products.
19
Chapter 2. Literature review
The cellulose is hydrolyzed into glucose which is followed by isomerization to fructose and
mannose (Klingler and Vogel, 2010). After that the saccharides are dehydrated into furans and
furfural compounds (Watanabe et al., 2005). Furans (5-HMF and furfural) then undergoes
to hydration forming carboxylic acids. Lignin in the first step is hydrolyzed into p-coumaryl,
coniferyl and sinapy alcohols that hydrolyze further to cresols, catechol, phenol, syringol.
Above critical condition aldehydes, phenols and ketones are produced while bellow the water
supercritical point phenolics form coke and tar (Madenoglu et al., 2016). SCWG also includes
CO methanation (Eq. 2.2), Sabatier-reaction (Eq. 2.3), water-gas-shift reaction (Eq. 2.4) and
steam reforming (Eq. 2.5).
Figure 2.10 – The mechanism of biomass conversion via hydrothermal gasification (Madenogluet al., 2016).
CO+3H2 →CH4+H2O (2.2)
CO2+4H2 →CH4+2H2O (2.3)
CO+H2O →CO2+H2 (2.4)
20
2.7. Downstream technologies-Processing algae biomass
C6H10O5+H2O → 6CO+6H2 (2.5)
High process temperature requires high energy input which decreases energy effi-
ciency. Catalytic HTG can be used to decrease the operational temperature and to improve
the produced biogas quality. Homogeneous and heterogeneous catalysts can also be used
similarly to HTL process (Peng et al., 2017; Onwudili and Williams, 2013; Zöhrer and Vogel,
2013; Elif and Nezihe, 2016).
Hydrothermal gasification of biomass were carried out on horse manure and model
compounds such as humic acid, and cellulose (Nanda et al., 2016; Gong et al., 2017). These
studies apply batch type reactors with high residence time (around 40-75 minutes). A few
studies deal with microalgae biomass where generally the main objectives are the evaluation
of different strains and catalysts to raise yields and decrease high reaction temperature (Deniz
et al., 2015; Graz et al., 2016; Safari et al., 2016; Cherad et al., 2016; Norouzi et al., 2017). Jiao
et al. (2017) processed Chlorella pyrenoidosa, S.platensis, Schizochytrium limacinum and
Nannochloropsis species where the highest hydrogen yield was found to be 6.17 mol kg−1
dry microalgae. Onwudili et al. (2013) used Spirulina platensis and Saccharina latissima as
feedstock for catalytic HTG, within their work the H2 yield was 15.1 mol kg−1 working with
NaOH homogeneous catalyst.
2.7.3.3 Hydrothermal carbonization (HTC)
Hydrothermal carbonization is performed at moderate reaction conditions (180-
250°C, 2-6 MPa, 5-240 min) compared to the other two hydrothermal process (Zhang et al.,
2015). The main product is solid hydrochar which has better properties comparing it to the
raw feedstock in terms of mass and energy density, combustion performance, volatile matter
and fixed carbon content (Tradler et al., 2018; Heidari et al., 2018). Based on the quality
of the solid product it can be utilized in various fields such as carbon sequestration as an
efficient adsorbent, soil amelioration, bioenergy production, functionalized carbon material
and wastewater pollution remediation. The yield and product quality (higher heating value,
energy densification, fuel ratio) are influenced by the reaction temperature, pressure, residence
time, feedstock concentration, feedwater pH and heating rate (Brand et al., 2014; Mäkelä et al.,
2016; Wang et al., 2018). Increased temperature levels decrease the product yield but at the
same time improve combustion properties (H/C, O/C, VM/FC ratios) (Fang and Xu, 2014). The
feedstock of the HTC process can be any wet biological raw material (e.g., food waste, algae,
cocconut fiber, empty fruit bunch, bark, bamboo, sewage sludge, etc.) which highlights the
attractiveness of the process (Liu et al., 2013; Novianti et al., 2014; Zhang et al., 2015; Peng
21
Chapter 2. Literature review
et al., 2016; Zhuang et al., 2018).
2.8 The energy efficiency of biorefineries
Sustainability of the energy sector and the need to mitigate the emission of green-
house gases require alternative energy resources and engineering solutions to produce renew-
able energy carriers. Biorefineries show a great potential in their application as they meet these
criteria, however, the efficiencies of these refineries must be investigated and upgraded to be
able to operate profitable plants at large scale. Several Life Cycle Assessments (LCAs) were
prepared to investigate the efficiencies of microalgae based refineries incorporating various
processes and conversion routes (Adesanya et al., 2014; Brentner et al., 2011; Collet et al.,
2014). Some of the former works surveyed hydrothermal technologies as well (de Boer et al.,
2012; Bennion et al., 2015). Bennion et al. (2015) investigated microalgae based biorefineries
conducting a well-to-pump life cycle and energetic analysis. Their investigation included the
growth phase of algae, dewatering, and thermochemical processing of algae. The calculated
net energy ratio (NER) of their system was 1.23. Jorquera et al. (2010) investigated the energy
efficiency of biodiesel production cultivation Nannochloropsis sp. in raceway ponds, flat plate
reactors and horizontal tubular reactor. Within their work they found that horizontal tPBRs
are not economically feasible (NER<1), but on the other hand NER values higher than 1 are
achievable in the case of raceway ponds and flat plate PBRs. Tredici et al. (2015) used flat panel
GWP reactors for the cultivation of Tetraselmis suecica and they determined a NER ratio of
0.6 for the investigated system. If photovolatics integrated into the refinery concept the NER
value is increased up to 1.7. These results suggest that positive energy balance is reachable
throughout the cultivation and transformation of microalgae biomass, however, the ideal
structure of biorefinery plants, conversion routes and expanded system bounderies need to
be determined and examined.
2.9 Carbon Capture and Storage (CCS)
Carbon dioxide is the primary greenhouse gas (GHG) and its uncontrolled emission
to the Earth atmosphere cause global warming, climate change and irreversible changes in
the nature. The increasing level of carbon dioxide (higher than 400 ppm in 2017) in the air
urges the spread of technological solutions that can prevent or at least mitigate the emission
of CO2. Carbon Capture and Storage (CCS) is a promising technology to lower the global CO2
emissions (Gohar and Shine, 2007; Boot-Handford et al., 2014). Power plants are responsible
for around the 30-40% of CO2 emissions and it is assumed that this value is going to increase
up to 60% by the end of this century (Alonso et al., 2017; Anwar et al., 2018). These point
carbon dioxide sources provide excellent opportunities for carbon capture.
22

2.9. Carbon Capture and Storage (CCS)
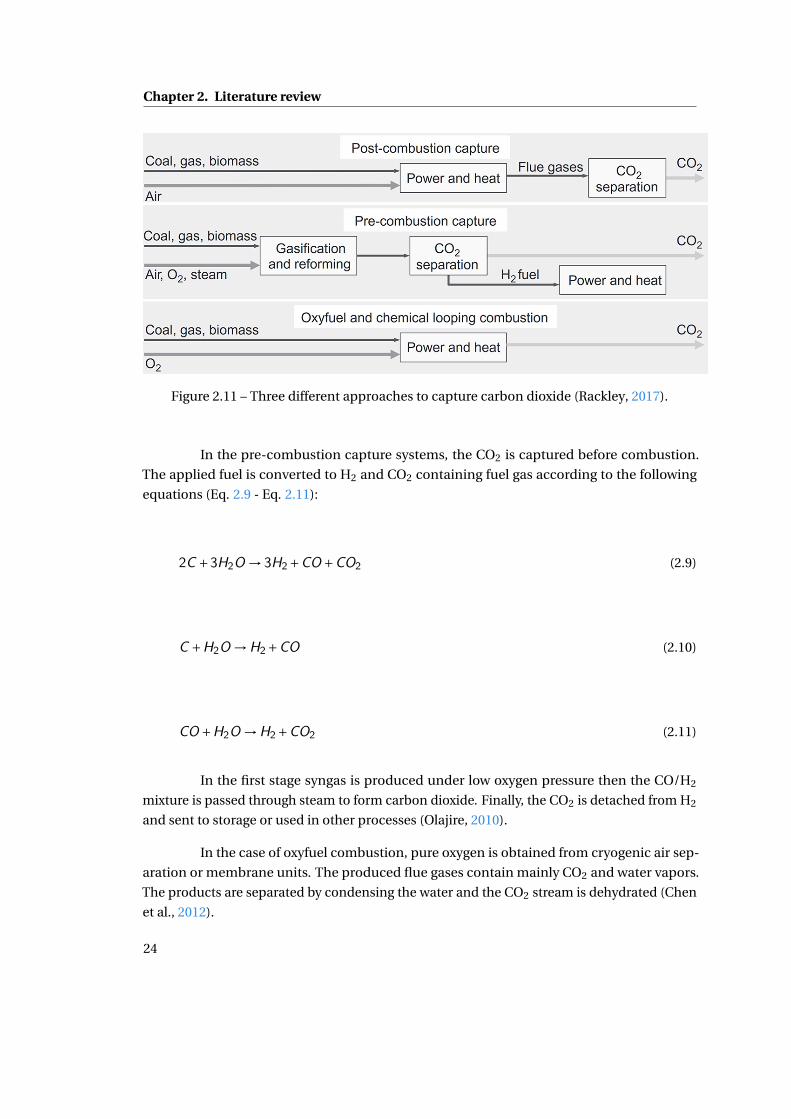
There are 3 different approaches to capture CO2, these are: (1) post combustion cap-
ture, (2) pre-combustion capture and (3) oxyfuel combustion capture (Fig. 2.11). Other sources
such as algae, biochar and charcoal show promising ways for carbon dioxide sequestration, as
well.
2.9.1 Carbon capture
During post combustion capture the CO2 content of the flue gas is separated using
various amine solutions like monoethanolamine, diethanolamine, potassium carbonate and
piperazine (Olajire, 2010). After the chemical reaction(s) (in the case of MEA absorbent: Eq. 2.6 -
Eq. 2.8) absorbent regenerated under high temperature (100-200°C depending on the absorber)
by steam (Kazemi and Mehrabani-Zeinabad, 2016). Other capturing technologies such as
membrane process (ceramic and polymeric) cryogenic distillation and algae cultivation can
be also applied in the case of post combustion capture. The post combustion technology can
be used in the case of flue gas with low CO2 content between 4 and 14 v/v % (Raza et al., 2018).
2RNH2+CO2+H2O → (RNH3)2CO3 (2.6)
(RNH3)2CO3+H2O+CO2 → 2RNH3HCO3 (2.7)
2RNH3HCO3 → 2RNH2+2H2O+2CO2 (2.8)
23
Chapter 2. Literature review
Figure 2.11 – Three different approaches to capture carbon dioxide (Rackley, 2017).
In the pre-combustion capture systems, the CO2 is captured before combustion.
The applied fuel is converted to H2 and CO2 containing fuel gas according to the following
equations (Eq. 2.9 - Eq. 2.11):
2C +3H2O → 3H2+CO+CO2 (2.9)
C +H2O →H2+CO (2.10)
CO+H2O →H2+CO2 (2.11)
In the first stage syngas is produced under low oxygen pressure then the CO/H2
mixture is passed through steam to form carbon dioxide. Finally, the CO2 is detached from H2
and sent to storage or used in other processes (Olajire, 2010).
In the case of oxyfuel combustion, pure oxygen is obtained from cryogenic air sep-
aration or membrane units. The produced flue gases contain mainly CO2 and water vapors.
The products are separated by condensing the water and the CO2 stream is dehydrated (Chen
et al., 2012).
24

2.9. Carbon Capture and Storage (CCS)
Biofixation of carbon dioxide can be carried out by microalgae biomass. Some
species are able to tolerate the toxic compounds (SO2, NOx, heavy metals) in the flue gas up to
a certain concentration. 1 kg of algae can fix 1.83-2.06 kg of CO2 (Pate et al., 2011; Zhou et al.,
2017) depending on the biological composition. Thus the direct injection of flue gas to the
cultivation medium can be used to mitigate GHG emission and to convert CO2 into valuable
compounds.
2.9.2 Carbon storage
The captured CO2 can be stored under the ground for thousands of years with low
leakage rate (only 0.1%) (van der Zwaan and Smekens, 2009). Efficient and long term storage
requires porous, permeable storage site with impermeable rock cap. Saline aquafiers, depleted
oil and gas reserves can also be used for the storage of CO2. (Underschultz et al., 2011; Anwar
et al., 2018)
25

3 Materials and Methods
3.1 Calculating the energy balance of an algae-based biorefinery
3.1.1 Energy requirements for the cultivation step
Three different cultivation systems were considered in the calculations: (1) open
raceway ponds (2) closed helical tubular photobioreactors (tPBRs) and (3) horizontal PBRs.
Open ponds were considered to be 0.3 m deep and have a total of 0.5 ha surface area. The
circulation energy demand can be decreased by applying three-end baffles which provide
more efficient circulation and decrease the dead-zone area to only 0.9%. The energy input
for a pond with buffles is 2.896 kW at 35 rpm paddle-wheel frequency (Sompech et al., 2012).
The energy requirements of the paddlewheels (Ep) in the ponds were calculated based on the
following equation (Eq. 3.1.):
Ep (MJ)=Pp ·NORP , (3.1)
where Pp is the energy requirement of a paddlewheel (MJ), NORP is the number of ponds.
As for closed systems helical and horizontal tubular photobioreactors (tPBRs) were
examined. The internal diameter was 0.053 m, the outer tube diameter was considered to be
0.060 m, the length of one PBR unit was 80 m. The total reactor volume was 0.2 m3. Within this
cultivation system, the volumetric productivity of the biomass can be as high as 1.535 g L−1 d−1,
with a biomass dry weight of 4 g L−1 and a dilution rate of 0.384 d−1 (Chisti, 2008b). In tubular
photobioreactors good mixing has to be maintained to achieve high biomass productivity and
avoid the creation of dark zones and cells shading. Turbulent flow regime and ideal mixing
can be provided by achieving high Reynolds number (>104), which can be attained at 0.5 m
s−1 liquid velocity (Molina et al., 2001). The energy requirement related to the circulation in
27
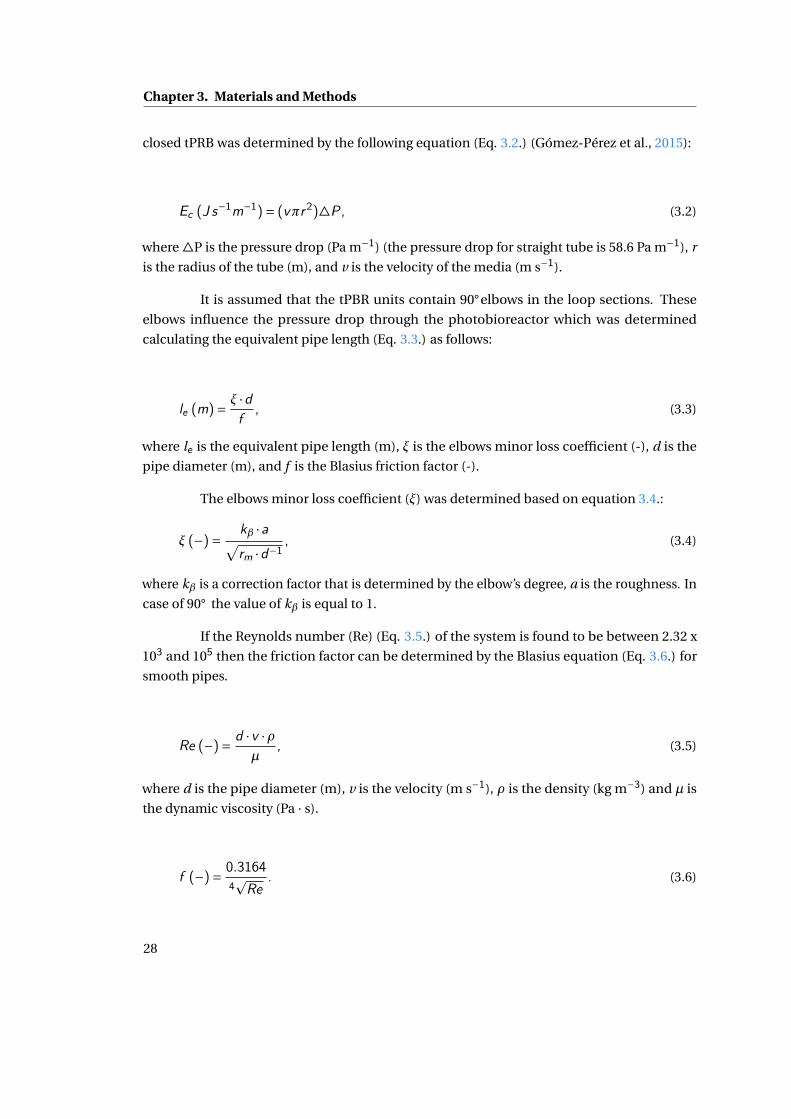
Chapter 3. Materials and Methods
closed tPRB was determined by the following equation (Eq. 3.2.) (Gómez-Pérez et al., 2015):
Ec (J s−1m−1)= (vπr2)4P, (3.2)
where 4P is the pressure drop (Pa m−1) (the pressure drop for straight tube is 58.6 Pa m−1), r
is the radius of the tube (m), and v is the velocity of the media (m s−1).
It is assumed that the tPBR units contain 90°elbows in the loop sections. These
elbows influence the pressure drop through the photobioreactor which was determined
calculating the equivalent pipe length (Eq. 3.3.) as follows:
le (m)= ξ ·df
, (3.3)
where le is the equivalent pipe length (m), ξ is the elbows minor loss coefficient (-), d is the
pipe diameter (m), and f is the Blasius friction factor (-).
The elbows minor loss coefficient (ξ) was determined based on equation 3.4.:
ξ (−)= kβ ·a√rm ·d−1 , (3.4)
where kβ is a correction factor that is determined by the elbow’s degree, a is the roughness. In
case of 90° the value of kβ is equal to 1.
If the Reynolds number (Re) (Eq. 3.5.) of the system is found to be between 2.32 x
103 and 105 then the friction factor can be determined by the Blasius equation (Eq. 3.6.) for
smooth pipes.
Re (−)= d ·v ·ρµ
, (3.5)
where d is the pipe diameter (m), v is the velocity (m s−1), ρ is the density (kg m−3) and µ is
the dynamic viscosity (Pa · s).
f (−)= 0.31644pRe
. (3.6)
28
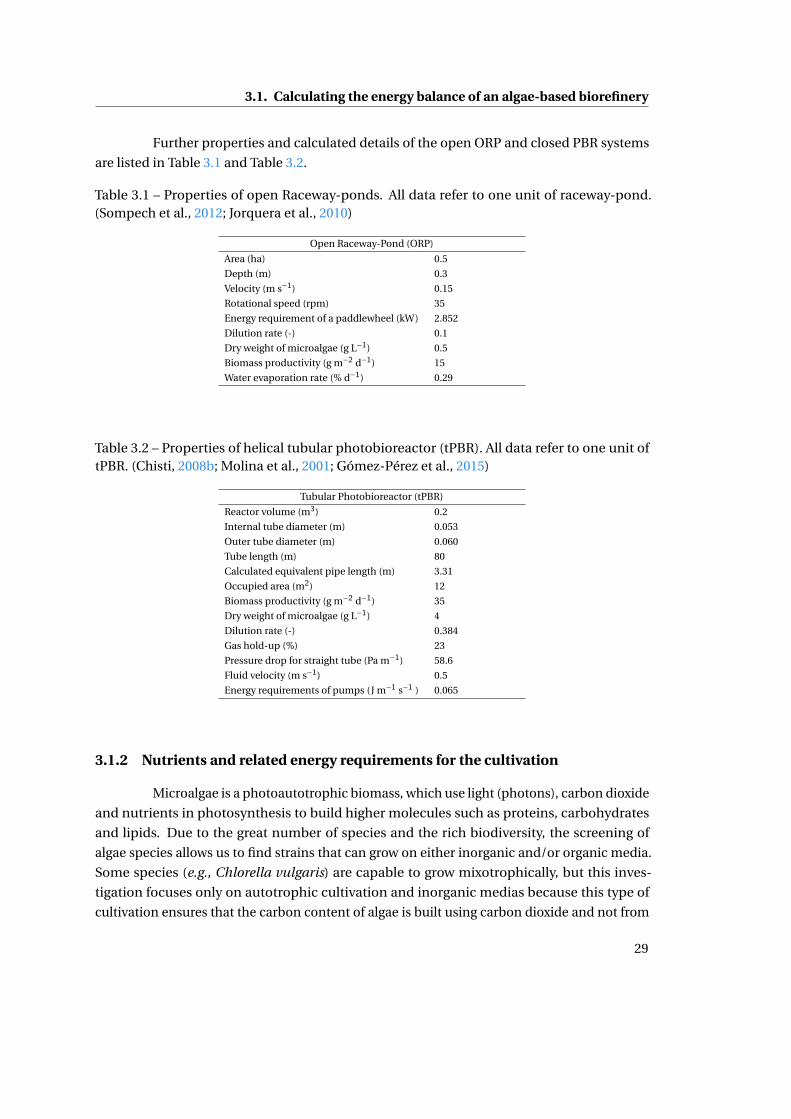
3.1. Calculating the energy balance of an algae-based biorefinery
Further properties and calculated details of the open ORP and closed PBR systems
are listed in Table 3.1 and Table 3.2.
Table 3.1 – Properties of open Raceway-ponds. All data refer to one unit of raceway-pond.(Sompech et al., 2012; Jorquera et al., 2010)
Open Raceway-Pond (ORP)
Area (ha) 0.5
Depth (m) 0.3
Velocity (m s−1) 0.15
Rotational speed (rpm) 35
Energy requirement of a paddlewheel (kW) 2.852
Dilution rate (-) 0.1
Dry weight of microalgae (g L−1) 0.5
Biomass productivity (g m−2 d−1) 15
Water evaporation rate (% d−1) 0.29
Table 3.2 – Properties of helical tubular photobioreactor (tPBR). All data refer to one unit oftPBR. (Chisti, 2008b; Molina et al., 2001; Gómez-Pérez et al., 2015)
Tubular Photobioreactor (tPBR)
Reactor volume (m3) 0.2
Internal tube diameter (m) 0.053
Outer tube diameter (m) 0.060
Tube length (m) 80
Calculated equivalent pipe length (m) 3.31
Occupied area (m2) 12
Biomass productivity (g m−2 d−1) 35
Dry weight of microalgae (g L−1) 4
Dilution rate (-) 0.384
Gas hold-up (%) 23
Pressure drop for straight tube (Pa m−1) 58.6
Fluid velocity (m s−1) 0.5
Energy requirements of pumps (J m−1 s−1 ) 0.065
3.1.2 Nutrients and related energy requirements for the cultivation
Microalgae is a photoautotrophic biomass, which use light (photons), carbon dioxide
and nutrients in photosynthesis to build higher molecules such as proteins, carbohydrates
and lipids. Due to the great number of species and the rich biodiversity, the screening of
algae species allows us to find strains that can grow on either inorganic and/or organic media.
Some species (e.g., Chlorella vulgaris) are capable to grow mixotrophically, but this inves-
tigation focuses only on autotrophic cultivation and inorganic medias because this type of
cultivation ensures that the carbon content of algae is built using carbon dioxide and not from
29
Chapter 3. Materials and Methods
other organic sources. This factor is important from the perspectives of carbon capture and
utilization.
The essential nutrients for autotroph microalgae cultivation are nitrogen and phos-
phorus containing compounds. Urea and diammonium phosphate were selected as nitrogen
and phosphorus source.
3.1.2.1 Energy requirements related to CO2
The carbon dioxide content of the flue gas can be used to provide inorganic carbon
sources to algae biomass. Some of the algae species are able to absorb the CO2 content of the
flue gas, though, the toxic compounds in high concentration (e.g., SO2, NOx above 100 ppm
and heavy metals) are lethal for the culture.
In order to determine the energy requirements related to carbon source, the required
amount of the CO2 has to be determined. The carbon requirement for the cultivation is
calculated based on Eq. 3.7. (Pate et al., 2011):
rC (kg CO2
kg algae)= Mass of CO2 input
Mass of dry weight algae= (44 ·C%)
1200, (3.7)
where rC shows the required amount of CO2 (kg) related to the amount of fermented microal-
gae biomass (kg), and C% is the weight percent of carbon in algae biomass (wt.%).
It is assumed that the algae biomass is cultivated continuously and based on the
dilution rate some of the produced algae is harvested daily. The required amount of CO2 for
the cultivation of algae biomass was calculated as follows (Eq. 3.8.):
m′CO2
(kg d−1)=malgae · rC +mharv · rC ·Nd , (3.8)
where m′CO2
is the required amount of CO2 (kg d−1), mharv is the amount of harvested algae
(kg), Nd is the number of days. The mass of algae (malgae , kg) is defined by equation 3.9.:
malgae (kg)=mharv · r−1harv100%−Lalgae
100%
, (3.9)
where rharv is the rate of harvesting (=dilution rate) (-), while Lalgae is the microalgae mass lost
during drying process (%).
If the flue gas contains high amount of toxic compounds it cannot be injected directly
to the algal culture broth, thus it is required to separate the CO2 content of the flue gas from
30
3.1. Calculating the energy balance of an algae-based biorefinery
other compounds. For this purpose, absorption process with monoethanolamine (MEA)
absorbent was considered. The required energy for the carbon dioxide separation is calculated
based on Eq. 3.10.:
Epurif (MJ)=mCO2 · (msEs +Ev ), (3.10)
where Epurif is the required energy to purify the carbon dioxide stream (MJ), mCO2 is the mass
of carbon dioxide (kg), ms is the required mass of steam (kg kg CO−12 ), Es is the energy required
for the production of 1 kg of steam (MJ), while Ev is the required electric utility (MJ). MEA
based retrofit carbon capture plants have an energy demand of 3.2-4.5 MJ (kg CO2)−1 (Stec
et al., 2016; Wang et al., 2015a) which is used mainly for the regeneration of the absorbent.
This amount of energy can be saved if we can assume that the algae biomass can tolerate the
toxic compounds next to the carbon dioxide. The energy need for the injection of CO2 to the
culture broth was assumed to be 22.2 Wh (kg CO2)−1 (Lardon et al., 2009).
3.1.2.2 Energy requirements related to the nitrogen and phosphorus sources
To determine the required energy consumption which is related to the use of nitrogen
containing nutrient, the amount of required nitrogen was determined. The Redfield molar
ratio (C:N:P = 106:16:1) was used to calculate the required amount of nitrogen and phosphorus
nutrients. The required amount of nutrients were determined based on the work of Dassey
et al. (2014) (Equations 3.11 and 3.12):
N%= 224g ·C%
1272g, (3.11)
P%= 31g ·C%
1272g. (3.12)
Urea selected as nitrogen source, which can be produced reacting ammonia with
carbon dioxide in a two stage process, where the overall energy requirement of the process is
4.23 MJ (kg urea)−1. Diammonium phosphate (DAP) was considered as phosphorus source.
Liquid phosphoric acid is sprayed into a vessel with ammonia which result in DAP. The energy
requirement for the production of DAP was calculated based on Eq. 3.13 (Johnson et al., 2013):
EDAP (MJkg−1)= (Eelectr .+Enat.gas +ENH3 ·mNH3+EH3PO4 ·mH3PO4) ·mDAP , (3.13)
where EDAP is the energy requirement of the production of DAP (MJ kg−1), Eelectr . is the used
31
Chapter 3. Materials and Methods
electricity (MJ kg−1), Enat.gas is the used natural gas, ENH3 and EH3PO4 are the energy required
(MJ kg−1) to produce 1 kg of ammonia and phosphoric acid, respectively. mNH3, mH3PO4 and
mDAP are the amount of ammonia, phosphoric acid and DAP (kg). The energy requirement
for the production of DAP was found to be 15.07 MJ (kg DAP)−1.
3.1.3 Harvesting and dewatering
Microalgae biomass can be cultivated in extremely dilute suspensions (the dry weight
content of the culture broth ranges typically between 0.5-4 g L−1 depending on the cultivation
system (Slater et al., 2015)) which brings difficulties in the downstream stage of the biorefinery.
Thus, dewatering of the fermented broth is necessary for further processing of the biomass.
Flocculation and sedimentation were considered as pre-concentration steps prior
the transformation of the biomass into energy carriers. Surendhiran and Vijay (2013) reported
that the efficiency of the flocculation of microalgae biomass can be as high as 82.27% using
Al2(SO4)3. Dong et al. (2014) reported that the optimal dosage of this type of chemical floccu-
lant is 20 mg L−1 at pH 5. Flocculation and sedimentation are suitable processes to achieve an
average final dry weight content of 30 g L−1. The required energy for the production of Al2SO4
was calculated based on Yao (2010) and it was found to be 9.26 MJ (kg Al2SO4)−1. Further
dewatering was considered to reach 200 g L−1 dry weight using centrifugation. The energy
requirement for the concentration of algae broth was calculated based on Zhang et al. (2013),
where the operational unit required 1 kWh (m−3 water) energy.
The separated water can be recycled and used again in the cultivation phase. The
energy need for the recycling was determined by using Equations 3.14 and 3.15 (Rogers et al.,
2014):
Erec (Wh)= (Vflocc +Vcentr ) ·ϕ ·h, (3.14)
ϕ (kg m−2 s−2)= γ ·ρwater ·g1000J kJ−1
, (3.15)
where Erec is the energy required for the recirculation (Wh), Vflocc and Vcentr are the volume
of the separated water by flocculation and centrifugation (m3), ϕ is a coefficient, h is the
differential head (m), γ is the efficiency of pumping (0.4-0.7), ρwater is the density of water (kg
m−3) and g is the gravitational constant (m2 s−1).
32
3.1. Calculating the energy balance of an algae-based biorefinery
3.1.4 Pretreating for lipid extraction
Pretreatment of the cells are required for the further conversion of biomass. Pretreat-
ment of the biomass involves the disruption of algae cells, drying process and grinding. The
cell walls can be ruptured via several methods (e.g., ultrasonication, high-pressure homog-
enization, bead milling, chemical and enzymatic treatments (Slegers et al., 2014; Yap et al.,
2014)).
In this investigation it is assumed that the cells are disrupted by wet milling tech-
nology using bead mills. Dyno®-mill ECM Ultra type bead mill (WAB, 2018) was considered
for this process due to its high efficiency and robustness with a capacity of 0.5-6 m3 h−1 and
electricity consumption of 100-132 kWh.
Traditional solvent extraction of lipids can be carried out efficiently on feedstock
that contains moisture content less than 10 weight percent. In order to meet this criteria
drying step was considered to evaporate the excess water content of the biomass. The energy
requirement of the drying process Edryer (MJ) was calculated by Eq. 3.16.:
Edryer (MJ)= mw · (cw +cv ·4T )
1000 kJMJ ·ηdryer
, (3.16)
where mw is the amount of evaporated water (kg), cw is the latent heat of evaporation (kJ kg−1),
cv is the specific heat of water (kJ kg−1 °C−1), 4T is the temperature difference (°C) and ηdryer
is the efficiency of the dryer which was estimated to be 0.75.
After the drying process the dry bulk algae biomass was grinded into powder to
increase the efficiency of the extraction. The energy requirement of the grinder was calculated
based on Equation 3.17:
Egrinder (kWh)=mdryalgae ·Pgrinder , (3.17)
where Egrinder is the energy requirement of grinding (kWh), mdryalgae is the mass of grinded dry
algae (kg), Pgrinder is the performance of the grinder, which was considered to be 16 kWh (t dry
algae)−1 (Zhang et al., 2013).
33
Chapter 3. Materials and Methods
3.1.5 Extraction of lipids
The extraction of lipids was considered to be done with traditional solvent extraction
using n-hexane as solvent. The efficiency of the solvent extraction was estimated to be 91.75%
which is an average value calculated based on the works of Sander and Murthy (2010) and
Brentner et al. (2011), while the mixing performance inside the extractor was assumed to be
30 kWh (t lipid)−1. The amount of solvent was calculated based on Xu et al. (2006) and it was
0.030 kg hexane (kg dry algae)−1.
The extraction step is followed by the regeneration of the solvent and the separation
of the extract and the solid residue. Solid-liquid separation should be applied to separate
the cell debris and the solvent containing extracted lipids, then in liquid-liquid separation
the lipid fraction should be separated from the organic solvent. Distillation selected for the
regeneration of hexane with an estimated overall solvent loss of 0.05 wt.% (Pokoo-Aikins et al.,
2010). The energy requirement of the solvent recovery was determined using equation :
Erec,hex (kJ h−1)= cp,hex ·whex · (Tb −T0), (3.18)
where Erec,hex is the energy needed for the separation of hexane and lipids (kJ h−1), cp,hex is
the specific heat capacity of hexane (2.26 kJ kg−1 °C−1), whex is the amount of hexane entering
the column (kg h−1), Tb is the boiling point of hexane (69°C), T0 is the temperature of hexane
right before entering the column (25°C).
3.1.6 Transesterification of lipids
Transesterification reaction is a suitable way to convert the separated lipids into
liquid energy carriers, biodiesel. During the reaction triacylglycerols are reacted with alcohol
(MeOH) in the presence of acidic or basic compounds (sulfuric acid or sodium hydroxid). The
main product of the reaction is fatty acid methyl ester (FAME) and glycerol as a co-product.
Yen et al. (2013) reported that methanol is added in excess in case of industrial scale
(twice more which is required stoichiometrically), the surplus methanol shifts the reaction
equilibrium to the formation of FAMEs. In this calculation NaOH was selected as for catalyst
of the reaction which was carried out at 60°C. The required heat was calculated based on
Equation 3.19:
Qtrans (kJ)= (mMeOH ·cp,MeOH +mlipid ·cp,lipid) ·4T , (3.19)
34
3.1. Calculating the energy balance of an algae-based biorefinery
where Qtrans is the required heat of transesterification (kJ), mMeOH and mlipid are the mass
of methanol and lipids, while cp,MeOH and cp,lipid are the specific heat capacity of methanol
(2.528 kJ kg−1 °C−1) and lipids (1.991 kJ kg−1 °C−1 which was calculated based on the empirical
equation provided by Morad et al. (1995)). The energy requirement of the production of NaOH
(21.30 MJ (kg NaOH)−1) was calculated based on Kent (2007).
The product stream contains unconverted lipids, excess methanol, glycerol and
biodiesel. The methanol recovery through distillation process was simulated using ChemCAD
6.3.1.4168 software. The NRTL (Non-Random Two-Liquid) model was used in the simulation
to calculate phase equilibria. The methanol recovery efficiency was 96%, while the overall
energy investment (condensers, reboilers, pumps) was found to be 1.69 MJ (kg biodiesel)−1. It
is considered that the recovered methanol was feeded back to the transesterification reactor
with additional make up MeOH. The distillation residue contains glycerol, remaining catalyst
and FAMEs where the glycerol and the catalyst were separated in a hot water (50°C) washing
tank from the biodiesel. Subsequently, the dehydration of the biodiesel stream was considered
in the final purification step of biodiesel to meet the requirements of the EN 14214 (2008)
standard.
3.1.7 Thermochemical conversion of algae cake
The algae cake which is the extraction residue can be utilized for the production of
energy carriers through atmospheric thermochemical conversion involving processes such as
pyrolysis and gasification and hydrothermal conversion technologies such as hydrothermal
carbonization, liquefaction and gasification.
Gaseous energy carriers (hydrogen and methane rich biogas) can be combusted
in combined cycle gas turbines (CCGT) to produce heat and electricity with high efficiency
(ηelectricity >62%, GE Power (2018)), though the CO2 content of the biogas has to be removed
or upgraded prior combustion (Keche et al., 2014). Bio-oil can be used as liquid energy
carrier, though its high viscosity and N and O heteroatom containing compounds limit their
utilizations. Biochar is a co-product of liquefaction and gasification technologies but it can be
formed purposely through carbonization process. Biochar or hydrochar can be used as a solid
combustible or as a catalyst due to its properties is similar to active carbon (Cha et al., 2016;
Jafri et al., 2018).
Gasification was selected to transform the algae cake into energy carriers. Khoo et al.
(2013) showed experimentally that through the atmospheric gasification of lipid-depleted
biomass biochar, bio-oil and biogas can be formed in the following concentration: 58.18, 13.74
and 28.08 wt.%, respectively. It is considered that the higher heating values (HHVs) of the
product were 17.5, 34.1 and 32.9 MJ kg−1, respectively (Khoo et al., 2013). The higher heating
35
Chapter 3. Materials and Methods
value is the amount of heat released by a specified mass of a fuel once it is combusted and the
resulted products have returned to 25°C. The energy requirement of the gasification process
was reported to be 8.26 MJ (kg feedstock)−1 with a conversion efficiency of 0.9 (Khoo et al.,
2013). The required energy investment of the gasification process (E′gasif ) for Nd days was
calculated according to equation 3.20:
E′gasif (MJ)= mac ·8.26MJkg−1 ·Nd
ηgasif, (3.20)
where mac is the mass of the lipid-depleted algae cake (kg), Nd is the number of days and
ηgasif is the conversion efficiency of gasificiation (-).
3.1.8 Hydrotermal conversion of wet biomass
The benefit of using hydrothermal technologies is that they are able to use wet
biomass as feedstock, and the moisture content of the biomass can be as high as 95 wt.%,
which value is far better compared to atmospheric thermochemical technologies, where the
acceptable maximum moisture content ranges between 15-20% (Blasi, 2008; Mohan et al.,
2006). The moisture content of the biomass is used as a process parameter, water acts as a
solvent and a reagent above its supercritical point (>374°C and 221 bar) (Barreiro et al., 2013;
Chaudry et al., 2015). Therefore, the hydrothermal liquefaction (HTL) process does not require
the pre-treating (cells rupture, drying, grinding) of biomass which results in a significant
energy saving potential.
The HTL unit requires an energy investment of 6.51 MJ (kg microalgae)−1 (Bennion
et al., 2015). This value can be decreased using energy recovery, thus the overall energy input
of the process was considered to be 5.90 MJ (kg microalgae)−1 (Bennion et al., 2015). The
energy need of the HTL process (EHTL, MJ) was calculated according to Eq. 3.21:
EHTL (MJ)=malgae ·5.90MJ kg−1, (3.21)
where malgae is the mass of algae (kg).
The produced HTL bio-oil is not suitable for direct combustion application because
it contains compounds that cause (1) high viscosity and (2) instability. The non-desirable
compounds can be extracted with near-supercritical state liquid propane (Agblevor et al.,
36
3.1. Calculating the energy balance of an algae-based biorefinery
2014). The energy requirement of this process is calculated based on Equation 3.22:
Estab (MJ)=malgae ·Ybio−oil ·Eprp,extr , (3.22)
where Estab is the energy requirement for the stabilization of the bio-oil (MJ), malgae is the
mass of algae (kg), Ybio−oil is the yield of bio-oil (0.37 kgkg ) and Eprp,extr is the specific energy
demand of stabilization process (0.77 MJ (kg bio-oil)−1) (Bennion et al., 2015).
After the stabilization, the stabilized bio-oil still contains N and O atoms in excess.
Hydroprocessing can be used to remove nitrogen and oxygen heteroatoms. The energy re-
quirement of hydrogenation was calculated based on the work of Bennion et al. (2015) with
equations 3.23 and 3.24:
EH2 (MJ)=mstab−oil ·mH2 ·EH2,production, (3.23)
Ehydropr (MJ)=mstab−oil ·Phydropr , (3.24)
where EH2 is the energy required to produce H2 for hydrogenation (MJ), mstab−oil is the mass
of stabilized bio-oil (kg), mH2 is the mass of hydrogen (0.0488 kg H2 (kg stable bio-oil)−1),
EH2,production is the energy requirement to produce hydrogen (56.95 MJ (kg H2)−1), Ehydropr
is the energy need for hydroprocessing (MJ) and Phydropr is the specific energy need for the
hydrogenation process (0.8381 MJ kg−1).
3.1.9 The calculation of energy efficiency
The Net Energy Ratio (NER) was calculated to measure the efficiency of different
biorefinery alternatives. The NER is defined as follows (Eq. 3.25):
NER (−)=∑energy output∑energy input
, (3.25)
where∑
energy output is the total energy gained throughout the transformation of algae
biomass (MJ), while∑
energy input is the total invested amount of energy (MJ) which is
required by the processes in the upstream and downstream parts of a refinery.
37
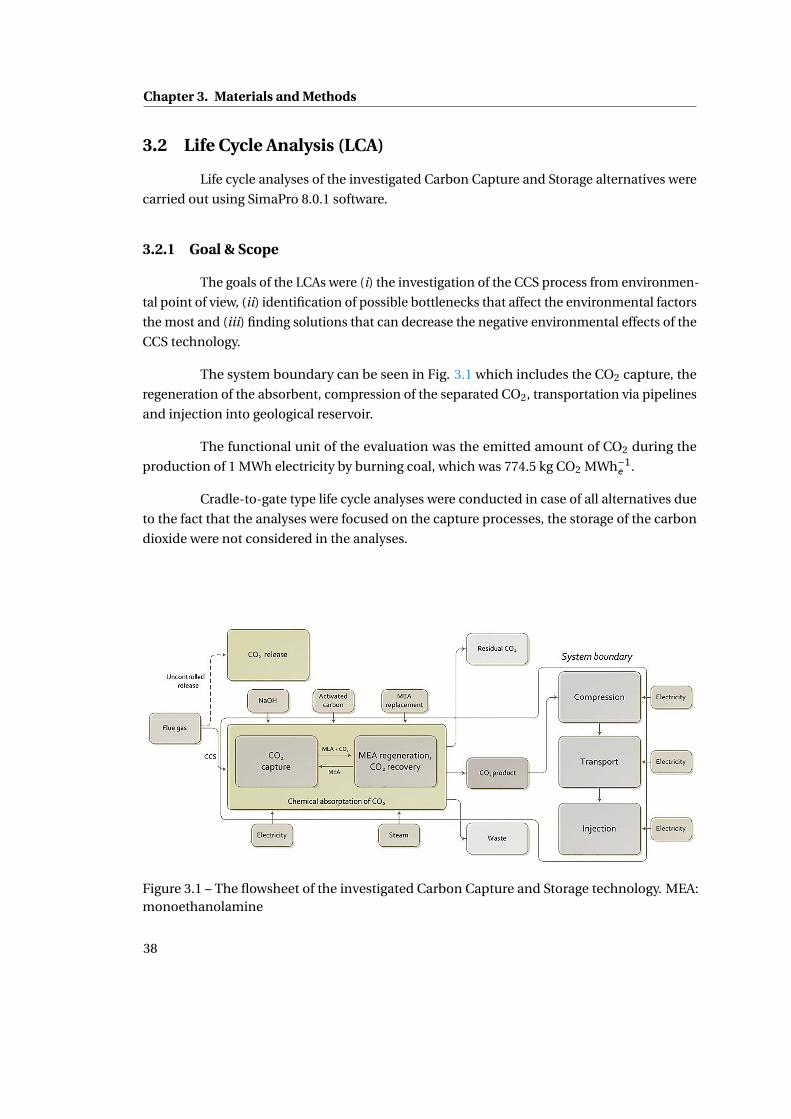
Chapter 3. Materials and Methods
3.2 Life Cycle Analysis (LCA)
Life cycle analyses of the investigated Carbon Capture and Storage alternatives were
carried out using SimaPro 8.0.1 software.
3.2.1 Goal & Scope
The goals of the LCAs were (i) the investigation of the CCS process from environmen-
tal point of view, (ii) identification of possible bottlenecks that affect the environmental factors
the most and (iii) finding solutions that can decrease the negative environmental effects of the
CCS technology.
The system boundary can be seen in Fig. 3.1 which includes the CO2 capture, the
regeneration of the absorbent, compression of the separated CO2, transportation via pipelines
and injection into geological reservoir.
The functional unit of the evaluation was the emitted amount of CO2 during the
production of 1 MWh electricity by burning coal, which was 774.5 kg CO2 MWh−1e .
Cradle-to-gate type life cycle analyses were conducted in case of all alternatives due
to the fact that the analyses were focused on the capture processes, the storage of the carbon
dioxide were not considered in the analyses.
Figure 3.1 – The flowsheet of the investigated Carbon Capture and Storage technology. MEA:monoethanolamine
38
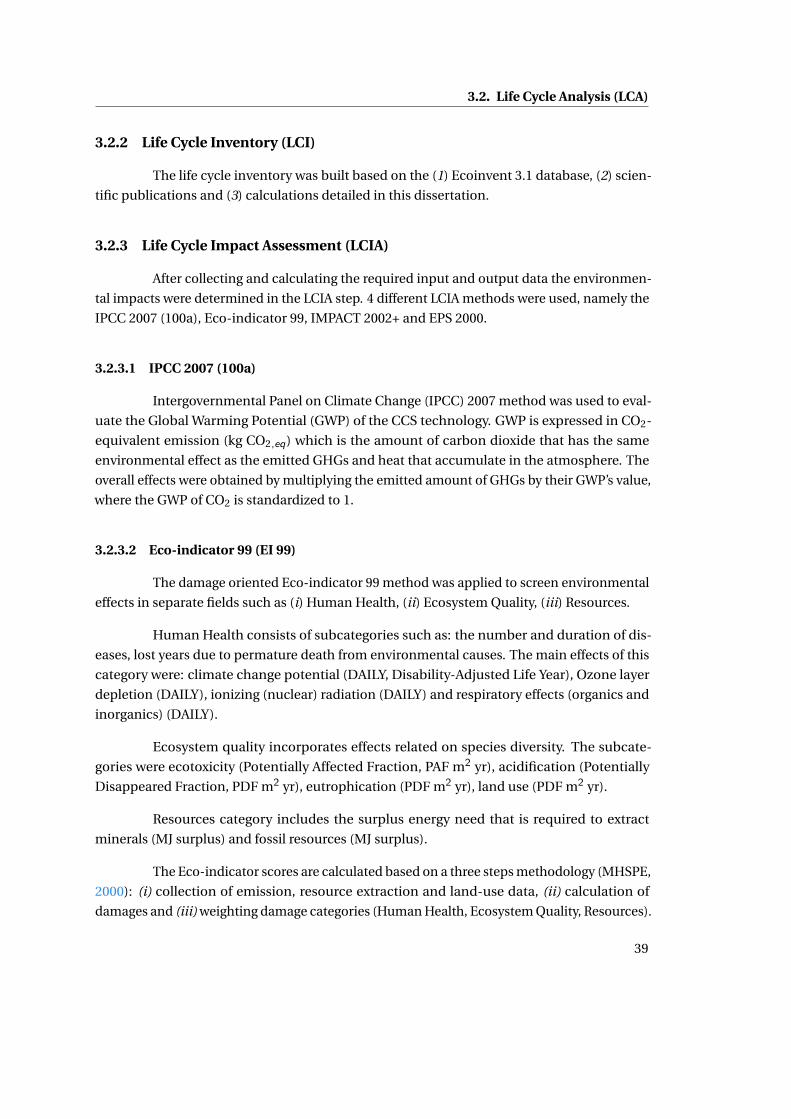
3.2. Life Cycle Analysis (LCA)
3.2.2 Life Cycle Inventory (LCI)
The life cycle inventory was built based on the (1) Ecoinvent 3.1 database, (2) scien-
tific publications and (3) calculations detailed in this dissertation.
3.2.3 Life Cycle Impact Assessment (LCIA)
After collecting and calculating the required input and output data the environmen-
tal impacts were determined in the LCIA step. 4 different LCIA methods were used, namely the
IPCC 2007 (100a), Eco-indicator 99, IMPACT 2002+ and EPS 2000.
3.2.3.1 IPCC 2007 (100a)
Intergovernmental Panel on Climate Change (IPCC) 2007 method was used to eval-
uate the Global Warming Potential (GWP) of the CCS technology. GWP is expressed in CO2-
equivalent emission (kg CO2,eq) which is the amount of carbon dioxide that has the same
environmental effect as the emitted GHGs and heat that accumulate in the atmosphere. The
overall effects were obtained by multiplying the emitted amount of GHGs by their GWP’s value,
where the GWP of CO2 is standardized to 1.
3.2.3.2 Eco-indicator 99 (EI 99)
The damage oriented Eco-indicator 99 method was applied to screen environmental
effects in separate fields such as (i) Human Health, (ii) Ecosystem Quality, (iii) Resources.
Human Health consists of subcategories such as: the number and duration of dis-
eases, lost years due to permature death from environmental causes. The main effects of this
category were: climate change potential (DAILY, Disability-Adjusted Life Year), Ozone layer
depletion (DAILY), ionizing (nuclear) radiation (DAILY) and respiratory effects (organics and
inorganics) (DAILY).
Ecosystem quality incorporates effects related on species diversity. The subcate-
gories were ecotoxicity (Potentially Affected Fraction, PAF m2 yr), acidification (Potentially
Disappeared Fraction, PDF m2 yr), eutrophication (PDF m2 yr), land use (PDF m2 yr).
Resources category includes the surplus energy need that is required to extract
minerals (MJ surplus) and fossil resources (MJ surplus).
The Eco-indicator scores are calculated based on a three steps methodology (MHSPE,
2000): (i) collection of emission, resource extraction and land-use data, (ii) calculation of
damages and (iii) weighting damage categories (Human Health, Ecosystem Quality, Resources).
39
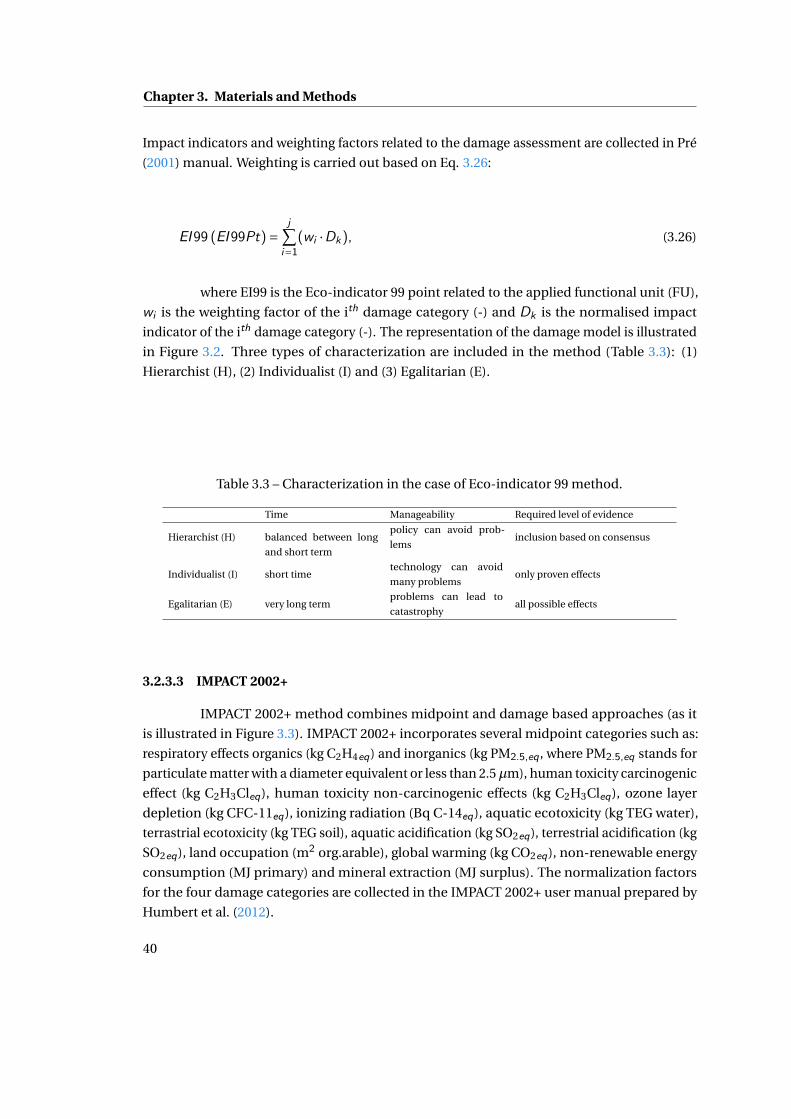
Chapter 3. Materials and Methods
Impact indicators and weighting factors related to the damage assessment are collected in Pré
(2001) manual. Weighting is carried out based on Eq. 3.26:
EI99 (EI99Pt)=j∑
i=1(wi ·Dk), (3.26)
where EI99 is the Eco-indicator 99 point related to the applied functional unit (FU),
wi is the weighting factor of the ith damage category (-) and Dk is the normalised impact
indicator of the ith damage category (-). The representation of the damage model is illustrated
in Figure 3.2. Three types of characterization are included in the method (Table 3.3): (1)
Hierarchist (H), (2) Individualist (I) and (3) Egalitarian (E).
Table 3.3 – Characterization in the case of Eco-indicator 99 method.
Time Manageability Required level of evidence
Hierarchist (H) balanced between long
and short term
policy can avoid prob-
lemsinclusion based on consensus
Individualist (I) short timetechnology can avoid
many problemsonly proven effects
Egalitarian (E) very long termproblems can lead to
catastrophyall possible effects
3.2.3.3 IMPACT 2002+
IMPACT 2002+ method combines midpoint and damage based approaches (as it
is illustrated in Figure 3.3). IMPACT 2002+ incorporates several midpoint categories such as:
respiratory effects organics (kg C2H4eq) and inorganics (kg PM2.5,eq , where PM2.5,eq stands for
particulate matter with a diameter equivalent or less than 2.5µm), human toxicity carcinogenic
effect (kg C2H3Cleq), human toxicity non-carcinogenic effects (kg C2H3Cleq), ozone layer
depletion (kg CFC-11eq), ionizing radiation (Bq C-14eq), aquatic ecotoxicity (kg TEG water),
terrastrial ecotoxicity (kg TEG soil), aquatic acidification (kg SO2eq), terrestrial acidification (kg
SO2eq), land occupation (m2 org.arable), global warming (kg CO2eq), non-renewable energy
consumption (MJ primary) and mineral extraction (MJ surplus). The normalization factors
for the four damage categories are collected in the IMPACT 2002+ user manual prepared by
Humbert et al. (2012).
40
3.2. Life Cycle Analysis (LCA)
Figure 3.2 – Detailed representation of damage model of Eco-indicator 99 LCIA method(MHSPE, 2000).
41
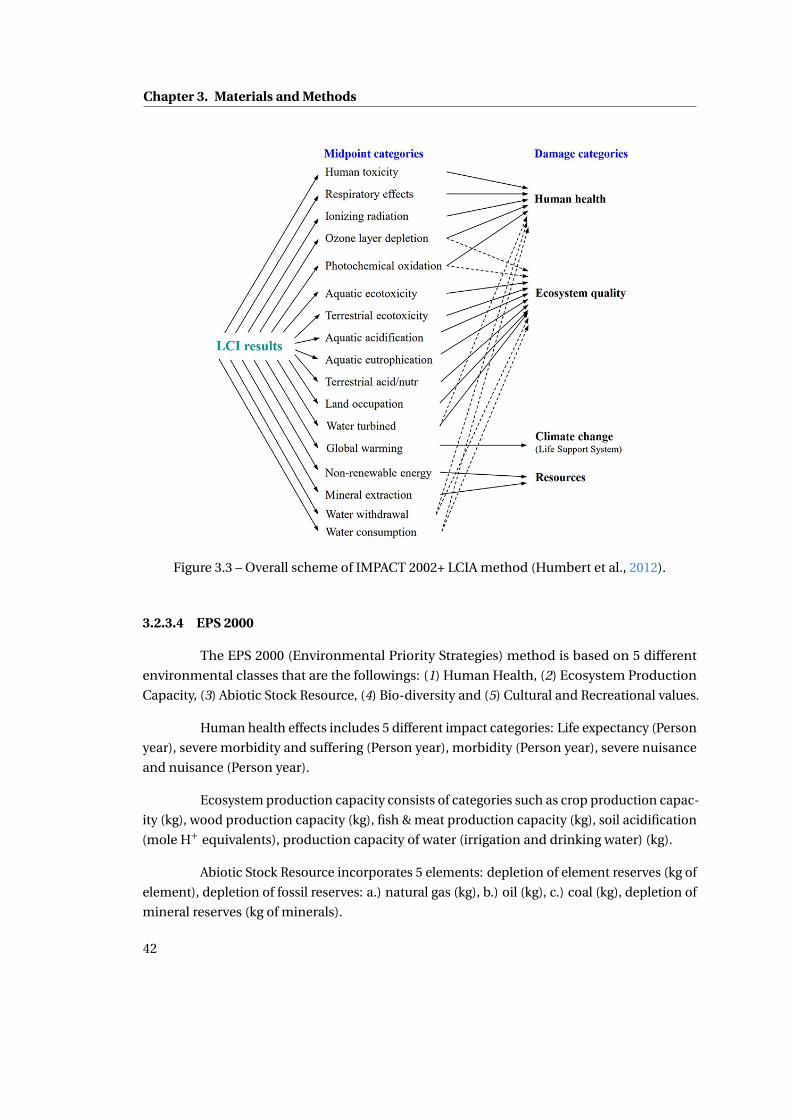
Chapter 3. Materials and Methods
Figure 3.3 – Overall scheme of IMPACT 2002+ LCIA method (Humbert et al., 2012).
3.2.3.4 EPS 2000
The EPS 2000 (Environmental Priority Strategies) method is based on 5 different
environmental classes that are the followings: (1) Human Health, (2) Ecosystem Production
Capacity, (3) Abiotic Stock Resource, (4) Bio-diversity and (5) Cultural and Recreational values.
Human health effects includes 5 different impact categories: Life expectancy (Person
year), severe morbidity and suffering (Person year), morbidity (Person year), severe nuisance
and nuisance (Person year).
Ecosystem production capacity consists of categories such as crop production capac-
ity (kg), wood production capacity (kg), fish & meat production capacity (kg), soil acidification
(mole H+ equivalents), production capacity of water (irrigation and drinking water) (kg).
Abiotic Stock Resource incorporates 5 elements: depletion of element reserves (kg of
element), depletion of fossil reserves: a.) natural gas (kg), b.) oil (kg), c.) coal (kg), depletion of
mineral reserves (kg of minerals).
42
3.3. PESTLE analysis
Bio-diversity is described with extinction of species impact category (no dimension
for this category).
3.3 PESTLE analysis
PESTLE (Political, Economic, Social, Technological, Legal and Environmental) analy-
sis was applied as a framework to identify and determine external and internal factors that
can affect the Carbon Capture and Storage process. The results of the PESTLE analysis was
evaluated with Multi-Criteria Decision Analysis which requires numerical input values, there-
fore, the main focus of the PESTLE analysis was the examination of numerical quantitative
impact categories.
3.3.1 Political & Legal factor
In some cases it is not possible to describe factors with quantitative values because
of the cross-complexity of the examined system makes difficult such examination. This was
the situation concerning political and legal categories, therefore these factors were merged
into one main factor which was analyzed generally based on literature data and industrial
forecasts.
3.3.2 Economic factor
A cost analysis was carried out to evaluate the CCS alternatives from economic point
of view. Two main economic subfactors were considered and evaluated: (i) the relativized
operational cost (-) and (ii) the specific capital cost (-). All of the calculations through the
economic assessment was related to the functional unit (FU) (774.5 kg CO2 MWh−1e ) of the
LCA.
3.3.3 Social factor
For the evaluation of possible social factors, impact categories of the EPS 2000 LCIA
and EI99 methods were used. These were: (i) Severe morbidity (PersonYr), (ii) Life expectancy
(PersonYr), (iii) Nuisance (PersonYr) and (iv) Human Health (EI99 Pt).
3.3.4 Technological factor
The technological aspect of the CCS process was investigated by determining the
Technical Readiness Level (TRL) and the Resource Consumption (GJ FU−1).
43
Chapter 3. Materials and Methods
3.3.5 Environmental factor
The conducted life cycle analyses was used for the environmental evaluation of
effects related to the application of the CCS process chain.
3.4 MCDA analysis
Multi-Criteria Decision Analysis (MCDA) was used for ranking and selecting the
investigated alternatives. The CCS process alternatives were evaluated based on the identified
and determined numerical PESTLE factors. DECERNS (Decision Evaluation in Complex Risk
Network System) software was applied to conduct MCDA.
The Multi Attribute Value Theory (MAVT) was used in the investigation, where the
objective is the generation of value function V(x) as it is shown in Eq. 3.27.:
V (x)=F (V1(x1), ...,Vm(xm)), (3.27)
where x is an alternative that is defined as a vector x=(x1,...,xm). The final score of the alterna-
tives Vi (xi ) were calculated depending on their performance on criterion i, where
Vi (x)= 0≤Vi (x)≤ 1. (3.28)
The goal of the MAVT method is the identification of the x alternative which maxi-
mizes the value of V(x). This model is additive as it is described by Equations 3.29 and 3.30.:
V (x)=w1V1(x1)+ ...+wmVm(xm), (3.29)
wj > 0,∑
wi = 1, j = 1,...,m, (3.30)
where wj is the criterion weight.
44
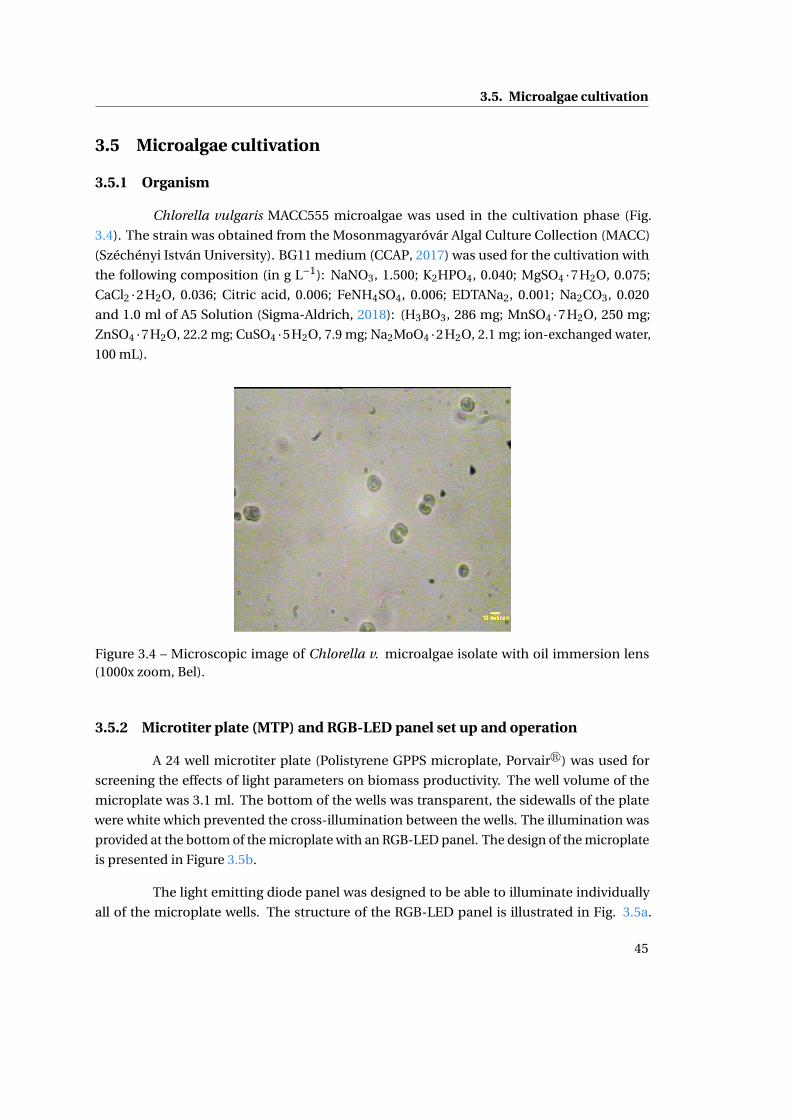
3.5. Microalgae cultivation
3.5 Microalgae cultivation
3.5.1 Organism
Chlorella vulgaris MACC555 microalgae was used in the cultivation phase (Fig.
3.4). The strain was obtained from the Mosonmagyaróvár Algal Culture Collection (MACC)
(Széchényi István University). BG11 medium (CCAP, 2017) was used for the cultivation with
the following composition (in g L−1): NaNO3, 1.500; K2HPO4, 0.040; MgSO4 ·7H2O, 0.075;
CaCl2 ·2H2O, 0.036; Citric acid, 0.006; FeNH4SO4, 0.006; EDTANa2, 0.001; Na2CO3, 0.020
and 1.0 ml of A5 Solution (Sigma-Aldrich, 2018): (H3BO3, 286 mg; MnSO4 ·7H2O, 250 mg;
ZnSO4 ·7H2O, 22.2 mg; CuSO4 ·5H2O, 7.9 mg; Na2MoO4 ·2H2O, 2.1 mg; ion-exchanged water,
100 mL).
Figure 3.4 – Microscopic image of Chlorella v. microalgae isolate with oil immersion lens(1000x zoom, Bel).
3.5.2 Microtiter plate (MTP) and RGB-LED panel set up and operation
A 24 well microtiter plate (Polistyrene GPPS microplate, Porvairr) was used for
screening the effects of light parameters on biomass productivity. The well volume of the
microplate was 3.1 ml. The bottom of the wells was transparent, the sidewalls of the plate
were white which prevented the cross-illumination between the wells. The illumination was
provided at the bottom of the microplate with an RGB-LED panel. The design of the microplate
is presented in Figure 3.5b.
The light emitting diode panel was designed to be able to illuminate individually
all of the microplate wells. The structure of the RGB-LED panel is illustrated in Fig. 3.5a.
45
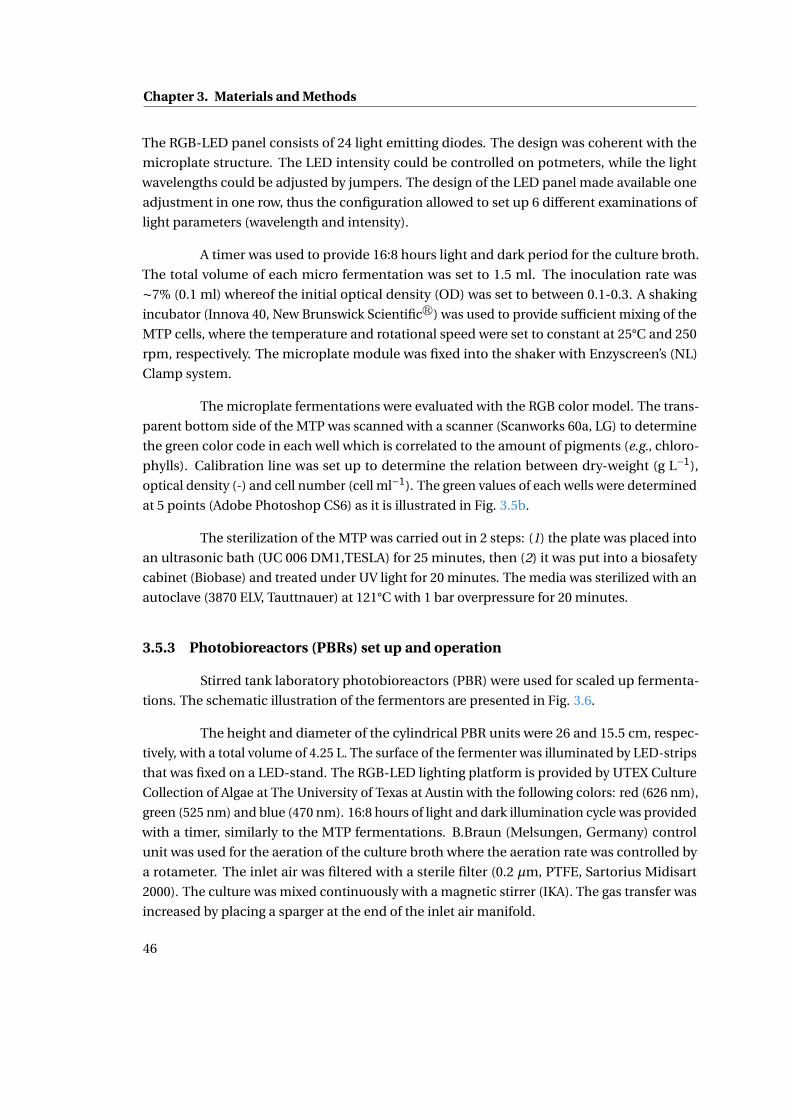
Chapter 3. Materials and Methods
The RGB-LED panel consists of 24 light emitting diodes. The design was coherent with the
microplate structure. The LED intensity could be controlled on potmeters, while the light
wavelengths could be adjusted by jumpers. The design of the LED panel made available one
adjustment in one row, thus the configuration allowed to set up 6 different examinations of
light parameters (wavelength and intensity).
A timer was used to provide 16:8 hours light and dark period for the culture broth.
The total volume of each micro fermentation was set to 1.5 ml. The inoculation rate was
∼7% (0.1 ml) whereof the initial optical density (OD) was set to between 0.1-0.3. A shaking
incubator (Innova 40, New Brunswick Scientificr) was used to provide sufficient mixing of the
MTP cells, where the temperature and rotational speed were set to constant at 25°C and 250
rpm, respectively. The microplate module was fixed into the shaker with Enzyscreen’s (NL)
Clamp system.
The microplate fermentations were evaluated with the RGB color model. The trans-
parent bottom side of the MTP was scanned with a scanner (Scanworks 60a, LG) to determine
the green color code in each well which is correlated to the amount of pigments (e.g., chloro-
phylls). Calibration line was set up to determine the relation between dry-weight (g L−1),
optical density (-) and cell number (cell ml−1). The green values of each wells were determined
at 5 points (Adobe Photoshop CS6) as it is illustrated in Fig. 3.5b.
The sterilization of the MTP was carried out in 2 steps: (1) the plate was placed into
an ultrasonic bath (UC 006 DM1,TESLA) for 25 minutes, then (2) it was put into a biosafety
cabinet (Biobase) and treated under UV light for 20 minutes. The media was sterilized with an
autoclave (3870 ELV, Tauttnauer) at 121°C with 1 bar overpressure for 20 minutes.
3.5.3 Photobioreactors (PBRs) set up and operation
Stirred tank laboratory photobioreactors (PBR) were used for scaled up fermenta-
tions. The schematic illustration of the fermentors are presented in Fig. 3.6.
The height and diameter of the cylindrical PBR units were 26 and 15.5 cm, respec-
tively, with a total volume of 4.25 L. The surface of the fermenter was illuminated by LED-strips
that was fixed on a LED-stand. The RGB-LED lighting platform is provided by UTEX Culture
Collection of Algae at The University of Texas at Austin with the following colors: red (626 nm),
green (525 nm) and blue (470 nm). 16:8 hours of light and dark illumination cycle was provided
with a timer, similarly to the MTP fermentations. B.Braun (Melsungen, Germany) control
unit was used for the aeration of the culture broth where the aeration rate was controlled by
a rotameter. The inlet air was filtered with a sterile filter (0.2 µm, PTFE, Sartorius Midisart
2000). The culture was mixed continuously with a magnetic stirrer (IKA). The gas transfer was
increased by placing a sparger at the end of the inlet air manifold.
46
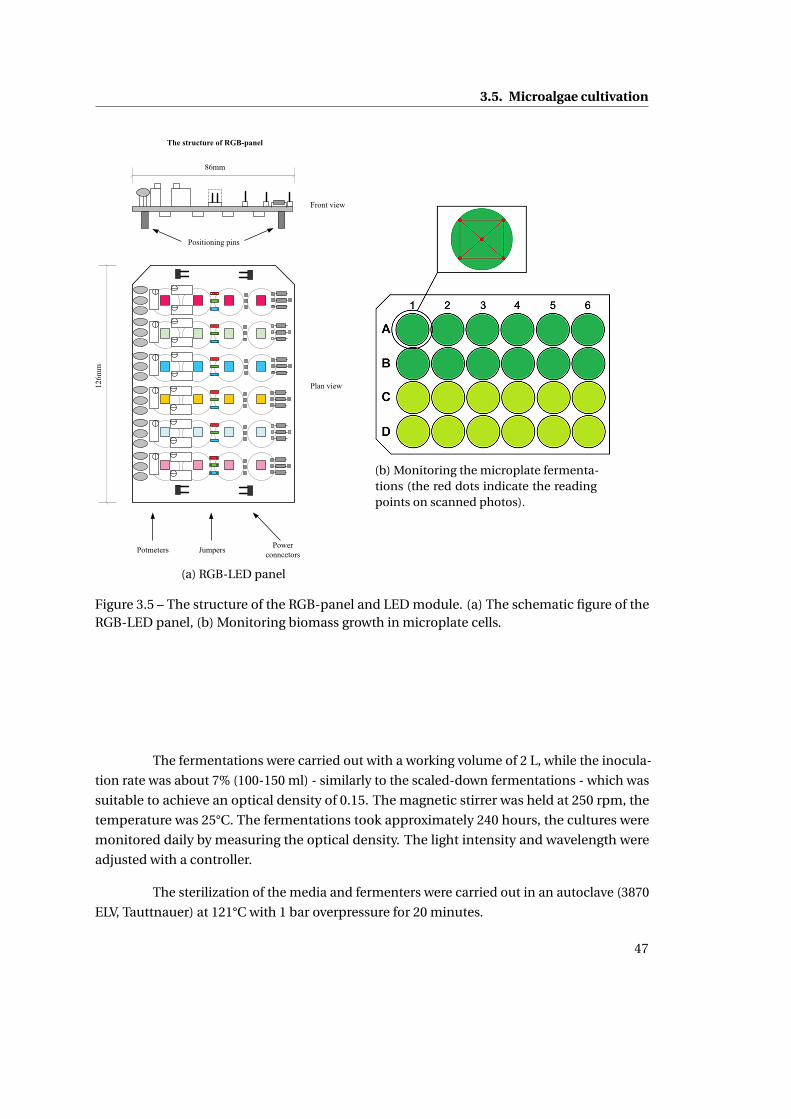
3.5. Microalgae cultivation
86mm
126m
m
Potmeters Jumpers
Plan view
Front view
Power
conncetors
Positioning pins
The structure of RGB-panel
(a) RGB-LED panel
(b) Monitoring the microplate fermenta-tions (the red dots indicate the readingpoints on scanned photos).
Figure 3.5 – The structure of the RGB-panel and LED module. (a) The schematic figure of theRGB-LED panel, (b) Monitoring biomass growth in microplate cells.
The fermentations were carried out with a working volume of 2 L, while the inocula-
tion rate was about 7% (100-150 ml) - similarly to the scaled-down fermentations - which was
suitable to achieve an optical density of 0.15. The magnetic stirrer was held at 250 rpm, the
temperature was 25°C. The fermentations took approximately 240 hours, the cultures were
monitored daily by measuring the optical density. The light intensity and wavelength were
adjusted with a controller.
The sterilization of the media and fermenters were carried out in an autoclave (3870
ELV, Tauttnauer) at 121°C with 1 bar overpressure for 20 minutes.
47
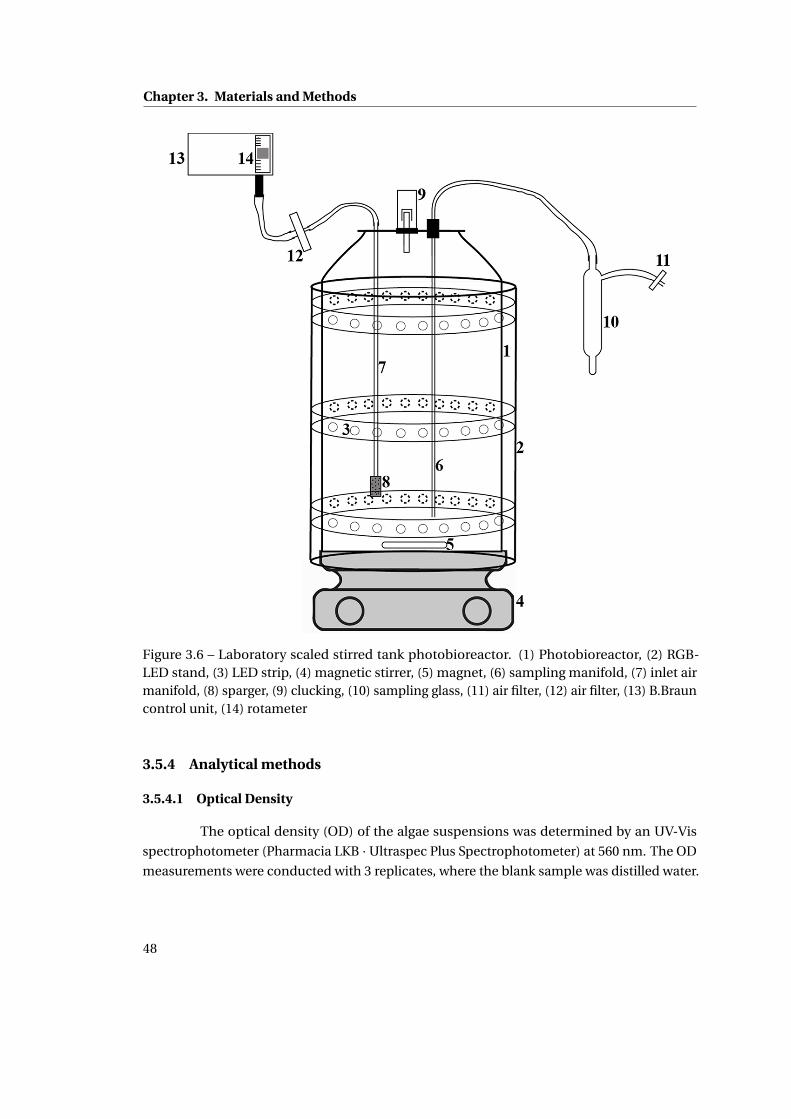
Chapter 3. Materials and Methods
Figure 3.6 – Laboratory scaled stirred tank photobioreactor. (1) Photobioreactor, (2) RGB-LED stand, (3) LED strip, (4) magnetic stirrer, (5) magnet, (6) sampling manifold, (7) inlet airmanifold, (8) sparger, (9) clucking, (10) sampling glass, (11) air filter, (12) air filter, (13) B.Brauncontrol unit, (14) rotameter
3.5.4 Analytical methods
3.5.4.1 Optical Density
The optical density (OD) of the algae suspensions was determined by an UV-Vis
spectrophotometer (Pharmacia LKB · Ultraspec Plus Spectrophotometer) at 560 nm. The OD
measurements were conducted with 3 replicates, where the blank sample was distilled water.
48
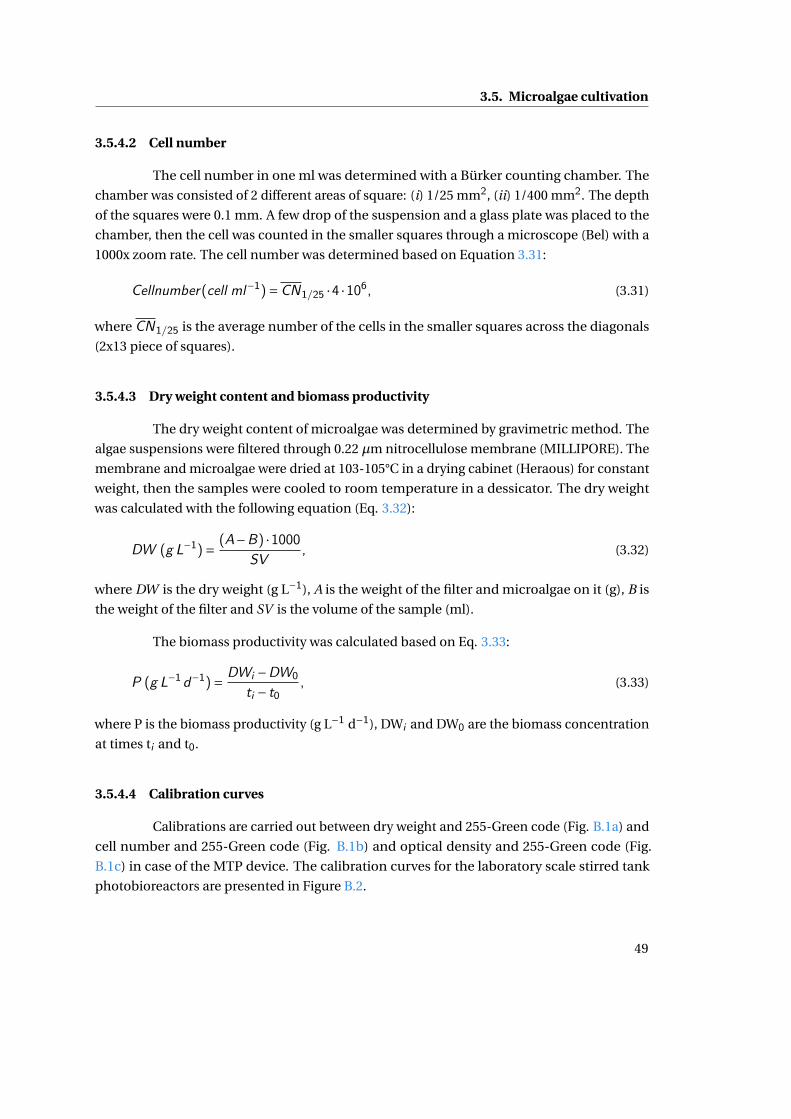
3.5. Microalgae cultivation
3.5.4.2 Cell number
The cell number in one ml was determined with a Bürker counting chamber. The
chamber was consisted of 2 different areas of square: (i) 1/25 mm2, (ii) 1/400 mm2. The depth
of the squares were 0.1 mm. A few drop of the suspension and a glass plate was placed to the
chamber, then the cell was counted in the smaller squares through a microscope (Bel) with a
1000x zoom rate. The cell number was determined based on Equation 3.31:
Cellnumber(cell ml−1)=CN1/25 ·4 ·106, (3.31)
where CN1/25 is the average number of the cells in the smaller squares across the diagonals
(2x13 piece of squares).
3.5.4.3 Dry weight content and biomass productivity
The dry weight content of microalgae was determined by gravimetric method. The
algae suspensions were filtered through 0.22 µm nitrocellulose membrane (MILLIPORE). The
membrane and microalgae were dried at 103-105°C in a drying cabinet (Heraous) for constant
weight, then the samples were cooled to room temperature in a dessicator. The dry weight
was calculated with the following equation (Eq. 3.32):
DW (g L−1)= (A−B) ·1000SV
, (3.32)
where DW is the dry weight (g L−1), A is the weight of the filter and microalgae on it (g), B is
the weight of the filter and SV is the volume of the sample (ml).
The biomass productivity was calculated based on Eq. 3.33:
P (g L−1d−1)= DWi −DW0
ti − t0, (3.33)
where P is the biomass productivity (g L−1 d−1), DWi and DW0 are the biomass concentration
at times ti and t0.
3.5.4.4 Calibration curves
Calibrations are carried out between dry weight and 255-Green code (Fig. B.1a) and
cell number and 255-Green code (Fig. B.1b) and optical density and 255-Green code (Fig.
B.1c) in case of the MTP device. The calibration curves for the laboratory scale stirred tank
photobioreactors are presented in Figure B.2.
49
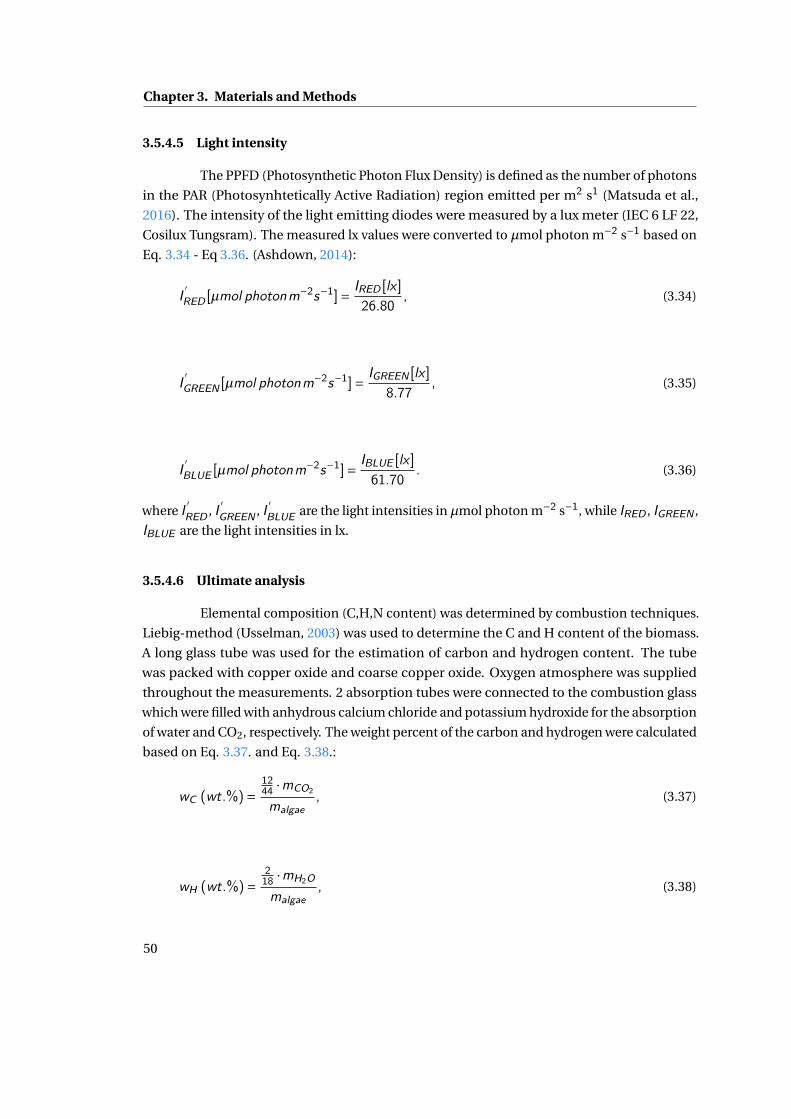
Chapter 3. Materials and Methods
3.5.4.5 Light intensity
The PPFD (Photosynthetic Photon Flux Density) is defined as the number of photons
in the PAR (Photosynhtetically Active Radiation) region emitted per m2 s1 (Matsuda et al.,
2016). The intensity of the light emitting diodes were measured by a lux meter (IEC 6 LF 22,
Cosilux Tungsram). The measured lx values were converted to µmol photon m−2 s−1 based on
Eq. 3.34 - Eq 3.36. (Ashdown, 2014):
I′RED [µmol photonm−2s−1]= IRED [lx ]
26.80, (3.34)
I′GREEN [µmol photonm−2s−1]= IGREEN [lx ]
8.77, (3.35)
I′BLUE [µmol photonm−2s−1]= IBLUE [lx ]
61.70. (3.36)
where I′RED , I
′GREEN , I
′BLUE are the light intensities in µmol photon m−2 s−1, while IRED , IGREEN ,
IBLUE are the light intensities in lx.
3.5.4.6 Ultimate analysis
Elemental composition (C,H,N content) was determined by combustion techniques.
Liebig-method (Usselman, 2003) was used to determine the C and H content of the biomass.
A long glass tube was used for the estimation of carbon and hydrogen content. The tube
was packed with copper oxide and coarse copper oxide. Oxygen atmosphere was supplied
throughout the measurements. 2 absorption tubes were connected to the combustion glass
which were filled with anhydrous calcium chloride and potassium hydroxide for the absorption
of water and CO2, respectively. The weight percent of the carbon and hydrogen were calculated
based on Eq. 3.37. and Eq. 3.38.:
wC (wt.%)=1244 ·mCO2
malgae, (3.37)
wH (wt.%)=218 ·mH2O
malgae, (3.38)
50
3.6. Biological composition of the algal biomass
where wC and wH are the weight percent (wt.%) of the carbon and hydrogen in the biomass,
mCO2 is the mass of carbon dioxide (g), mH2O is the mass of water (g), malgae is the mass of
algae biomass (g).
The nitrogen content of the biomass was determined based on Dumas-method
(Sainju, 2017) using FP-528, LECO device. Known weight of algae samples were placed into
sample holders then into the loading head of the FP-528. The rapid combustion was carried
out dropping the samples into a hot furnace. The nitrogen content was measured with a
thermal conductivity cell.
3.5.4.7 Proximate analyis
The proximate analyis (Volatile Matter (VM), Fixed Carbon (FC) and Ash content)
was determined based on the standards of American Society for Testing Materials (ASTM):
D3175 for volatile matter, D3172 for fixed carbon and D3174 for ash content. The samples
were burned in a Pt crucible by an electric furnace (1.4/1000, DENKAL). The weight of the
samples were determined before and after the combustion using analytical balance.
3.6 Biological composition of the algal biomass
The protein content of the biomass was determined by Eq. 3.39.:
wprotein (wt.%)=wN ·6.25, (3.39)
where wprotein is the weight percent (wt.%) of the protein in the biomass, wN is the weight
percent (wt.%) of the nitrogen in the biomass. The 6.25 is a conversion factor which assumes
that 1 kg of plant or animal protein contains 160 g N (1000g/160g=6.25). This 6.25 factor does
not relate to any specific feedstock (Sriperm et al., 2011). The lipid content of the biomass was
determined by extracting the lipids with hexane:methanol (2:1) solvent mixture. The resulted
two phase extract was separated in a shaking separating funnel. Then the hexane rich phase
was distilled with a rotadest (Laborota 4000, SIMEX), the residue, which contained the lipids,
was weighted. The carbohydrate content of the biomass was calculated based on Eq. 3.40.:
wcarbohydrate (wt.%)= 100%−wprotein −wlipid −wash, (3.40)
where wcarbohydrate , wprotein, wlipid , wash are the weight percent (wt.%) of the carbohydrate,
protein, lipid and ash in the biomass, respectively.
51
Chapter 3. Materials and Methods
3.7 Hydrothermal gasification (HTG)
3.7.1 Design of equipment
Hydrothermal gasification (HTG) of microalgae biomass was carried out in a con-
tinuous plug flow tubular reactor system. The P&I diagram of the HTG process is shown in
Fig. 3.7. The algae feedstock was concentrated with a centrifuge (Hettich ROTINA 380) prior
loading the gasification reactor. The outer diameter of the stainless steel 316 tubular reactor
was 1/8 inch (=3.175 mm), while the wall thickness was 0.7 mm. An electric oven was used to
provide the required temperature for the process. The length of the reactor in the oven was
2 m. The algae suspension and water stream were transferred with HPLC pumps (PU-980,
Jasco; Model 303, Gilson). The algae and water streams were mixed at the inlet of the reactor to
obtain the required temperature value at the beginning of the measurements. The volumetric
flow was set to 2.5 ml min−1 thus the average residence time was 118.8 sec. The design of the
reactor system provides turbulent flow across the length of the reactor, the Reynolds number
was higher than 105. Two K-type thermocouples were installed directly at the beginning and
at the end of the reactor.
A phase separator was installed after the reactor section where the liquid and gaseous
products were separated. The produced gas was collected in a calibrated gas burette with a
volume of 425 ml. A 3 cm long glass tube attachment with a septum was installed on the gas
burette for sampling the gaseous product.
52
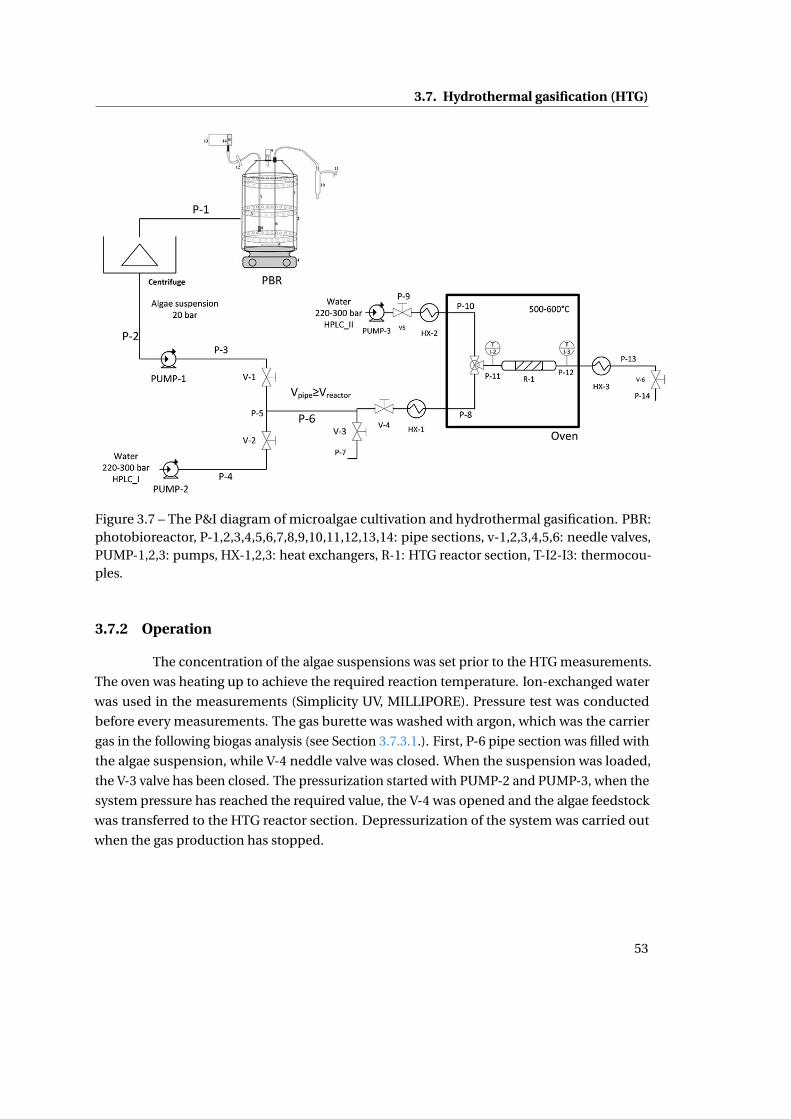
3.7. Hydrothermal gasification (HTG)
Figure 3.7 – The P&I diagram of microalgae cultivation and hydrothermal gasification. PBR:photobioreactor, P-1,2,3,4,5,6,7,8,9,10,11,12,13,14: pipe sections, v-1,2,3,4,5,6: needle valves,PUMP-1,2,3: pumps, HX-1,2,3: heat exchangers, R-1: HTG reactor section, T-I2-I3: thermocou-ples.
3.7.2 Operation
The concentration of the algae suspensions was set prior to the HTG measurements.
The oven was heating up to achieve the required reaction temperature. Ion-exchanged water
was used in the measurements (Simplicity UV, MILLIPORE). Pressure test was conducted
before every measurements. The gas burette was washed with argon, which was the carrier
gas in the following biogas analysis (see Section 3.7.3.1.). First, P-6 pipe section was filled with
the algae suspension, while V-4 neddle valve was closed. When the suspension was loaded,
the V-3 valve has been closed. The pressurization started with PUMP-2 and PUMP-3, when the
system pressure has reached the required value, the V-4 was opened and the algae feedstock
was transferred to the HTG reactor section. Depressurization of the system was carried out
when the gas production has stopped.
53
Chapter 3. Materials and Methods
The biogas yield was determined based on Eq. 3.41.:
YGAS (molkg−1)= nbiogas
malgae, (3.41)
where YGAS is the total gas yield (mol kg−1), nbiogas is the mole number of the produced biogas,
malgae is the mass of the dry feedstock (kg).
The carbon gasification efficiency was calculated using Eq. 3.42.:
GEC (%)= mC ,gas
mC ,feed −mTC ,liq·100%, (3.42)
where GEC (%) is the carbon gasification efficiency, mC ,gas is the carbon content of the biogas
(g), mC ,feed is the carbon content of the feed (g), mTC ,liq is the total carbon (TC) content of
residue (g) which was measured with Shimadzu TOC-VCSH (Section 3.7.3.2.).
3.7.3 Analitical methods
3.7.3.1 Biogas Analysis
The produced biogas was analyzed with a HP5890SII/TCD/FID gas chromatograph.
The thermal conductivity and flame ionization detectors were connected simultaneously, thus
every gas components could be analyzed with one injection. Packed stainless steel column
(1.9 m, 1/8" OD) was installed and filled with Porapak Q (80/100 mesh) load. The Porapak Q
was appropriate to separate the biogas components. Argon was selected as carrier gas because
of the presence of H2 in the biogas. The column head pressure of the carrier flow was set to
150 kPa. The initial temperature was 50°C and held for 0.5 min, the final temperature was
150°C for 2 minutes, which was reached with 20°C min−1 heating rate. Measurements were
carried out in 4 replicates.
3.7.3.2 Total Carbon (TC) determination
Shimadzu TOC-VCSH was used to determine the total carbon content of the pro-
duced liquid product. The catalytic oxidation of the samples were carried out at 680°C, where
nondispersive infrared sensor (NDIR) was used as a gas detector. The measurements were
conducted with 3 replicates.
54
3.8. Experimental design and statistical analysis
3.8 Experimental design and statistical analysis
Design of experiments (DoEs) and statistical evaluation of the experimental results
were carried out using Dell™Statistica™13.1 software.
3.8.1 DoE for Light wavelength
The ideal illumination of wavelength was determined with One-way Analysis of
Variance (ANOVA). The effects of six different levels of settings were investigated based on
RGB-color mixing: red (R:626 nm, G:-, B-), green (R:-, G: 525 nm, B:-), blue (R:-, G:-, B:470 nm),
yellow (R: 626 nm, G: 525 nm, B:-), aquamarine (R: -, G: 525 nm, B: 470 nm) and purple (R: 626
nm, G: -, B: 470 nm) on biomass productivity (mg L−1 d−1).
3.8.2 DoE for Light intensity
The optimization of light intensity was carried out based on a Central Composite
Design (CCD). Red (X1) and Blue (X2) LED intensities were investigated with 5 levels as inde-
pendent variables, while the dependent variable was selected to be the biomass productivity
(Y1). Response Surface Methodology (RSM) was used for the evaluation of the experimental
results. The polinomical quadratic response model was defined by Eq. 3.43.:
Yp =β0+k∑
i=1βi Xi +
k∑i=1
βii X2i +
k∑i=1
k∑j=1
βij Xiβii Xj +ε, (3.43)
where Yp is the predicted response variable (biomass productivity), Xi , Xj are independent
variables (red and blue intensities), β0,βi ,βii ,βij are the regression coefficients and ε is the
random error.
3.8.3 DoE for the investigation of light intensity and aeration rate in PBR
A 22 full factorial design was applied where the investigated factors were RGB LED
intensity (RED: 178.9-256.9 µmol m−2 s−1; BLUE: 64.8-102.1 µmol m−2 s−1) and PBR aeration
rate (0.50-0.75 vvm) on two levels. The dependent variables were biomass productivity (mg
L−1 d−1), protein, carbohydrate and lipid content (wt.%).
55

4 Results and Discussion
4.1 Energy balance of a third generation biorefinery
The energy balances of the algae based biorefinery alternatives were calculated and
compared to each other. The results of the energy demand calculations by processes are listed
in Table 4.1. The functional unit (FU) of the calculations was 1.00 kg of the highest HHV’s
liquid energy carrier (biodiesel in case of the transesterification pathway and upgraded bio-oil
for the hydrothermal process). Two downstream processing routes were investigated based
on the moisture content of the biomass as it is detailed in Fig. 4.1: (1) traditional dry route
(where the dry weight content of algae is higher than 90 wt.%), (2) hydrothermal pathway
(where the dry weight content of algae can be as low as 5 wt.%). The dry route consists of
the following processes: (1.) cell disruption, (2.) drying of wet biomass, (3.) grinding, (4.)
extraction of lipids, (5.) transesterification of extracted lipids, (6.) separation of biodiesel and
glycerol, (7.) purification of biodiesel, and (8.) atmospheric gasification of lipid depleted cell
debris. The hydrothermal wet route involves (1.) hydrothermal liquefaction, (2.) stabilization
of the produced bio-oil, and (3.) hydroprocessing. The product yields of the dry route were
the following: 1.00 kg of biodiesel, 0.10 kg of glycerol, 1.70 kg of biochar, 0.40 kg of bio-oil and
0.82 kg of biogas. While, in case of the hydrothermal - wet - route 1.00 kg of upgraded bio-oil,
0.46 kg of biochar and 0.86 kg of biogas were produced transforming microalgae biomass. The
higher heating value of the products was given in Table 4.2.
57

Ch
apter
4.R
esults
and
Discu
ssion
Table 4.1 – Energy demand by operational units
Process Relative energy demandEnergy demand [ORP],[tPBR]
MJ (kg biodiesela)−1Energy demand [ORP],[tPBR]
MJ (kg upgraded bio-oilb)−1Source
UPSTREAMc
CO2 absorption 3.2 MJ (kg CO2)−1 50.31, 31.85 31.39, 27.82 Wang et al. (2015b)
CO2 transportation 0.022 kWh (kg CO2)−1 1.25, 0.79 0.78, 0.69 Zaimes and Khanna (2013)
CO2 injection 22 Wh (kg CO2)−1 1.25, 0.79 0.78, 0.69 Gikonyo (2013)
DAP production 15.07 MJ (kg DAP)−1 5.04, 4.25 3.14, 3.71 Current estimation
Urea production 4.23 MJ (kg Urea)−1 4.54, 3.83 2.83, 3.34 Johnson et al. (2013)
ORP mixing 2.852 kW (pond)−1 19.21, - 11.98, - Sompech et al. (2012)
tPBR mixing 6.46·10−2 J (m·s)−1 -, 13.00 -, 11.35 Current estimation
Al2SO4 production 9.26 MJ (kg Al2SO4)−1 2.17, 0.25 1.35, 0.22 Yao (2010)
Clarifier & mixer 5.96 kWh 0.13,0.13 0.08, 0.12 Rogers et al. (2014)
Pumping to centrifuge 0.414 kJ s−1 0.01, 0.00 0.01, 0.00 Current estimation
Dewatering with centrifuge 1 kWh m−3 0.70, 0.53 0.44, 0.46 Zhang et al. (2013)
Water recycling 27.5 kWh 0.62, 0.07 0.39, 0.06 Current estimation
Traditional DRY routed
Bead milling 20.83 kW m−3 2.81, 2.81 - WAB (2018)
Drying 3.43 MJ (kg evaporated water)−1 98.76, 56.00 - Current estimation
Grinding 16 kWh (t algae)−1 0.25, 0.18 - Zhang et al. (2013)
Hexane regeneration 26.99 Wh (kg C6H14)−1 0.01, 0.01 - Current estimation
Mixing during extraction 30 kWh (t lipid)−1 0.11,0.11 - Zhang et al. (2013)
Hexane production 0.48 MJ (kg dry algae)−1 2.08,1.49 -Wang (1999); Shirvani et al.
(2011)
MeOH production 58.89 MJ (kg MeOH)−1 2.55, 0.25 - Barrañon (2006)
NaOH production 21.30 MJ (kg NaOH)−1 0.42, 0.42 - Kent (2007)
Heat demand for transesterifica-
tion
87.55 kJ (kg biodiesel)−1 0.09, 0.09 - Current estimation
MeOH regeneration 1.69 GJ (t biodiesel)−1 1.69, 1.69 - Current estimation
Heating distilled water 53.29 MJ (t biodiesel)−1 0.05,0.05 - Current estimation
Biodiesel purification 330 MJ (t biodiesel)−1 0.33,0.33 - Current estimation
Atmospheric gasification 8.26 MJ (kg algae cake)−1 26.89, 15.82 Khoo et al. (2013)
Hydrothermal liquefaction - WET routee
HTL unit 5.9 MJ (kg microalgae)−1 - 16.82 Bennion et al. (2015)
Na2CO3 production 16.67 MJ (kg Na2CO3−1) - 1.90 ITP Mining (1997)
Bio-oil stabilization 0.77 MJ (kg bio-oil)−1 - 0.81 Bennion et al. (2015)
Propane production 51.80 MJ (kg propane)−1 - 1.09 Bennion et al. (2015)
Hydrogen production 56.95 MJ (kg H2)−1 - 2.93 Bennion et al. (2015)
Hydroprocessing 0.8381 MJ (kg stabilized oil)−1 - 0.88 Bennion et al. (2015)a Biodiesel is the liquid energy carrier product that produced through transesterification of algae lipids.bUpgraded bio-oil is the liquid energy carrier that produced through hydrothermal liquefaction and upgraded via bio-oil stabilization and hydroprocessing.c The UPSTREAM section of the biorefinery is responsible for the production of microalgae biomass.d The aim of the Traditional DRY route is the transformation of algae biomass to biodiesel through the transesterification of extracted lipids.eThe aim of the WET route is the transformation of wet algae biomass to upgraded bio-oil through hydrothermal liquefaction, bio-oil stabilization and hydroprocessing.
58
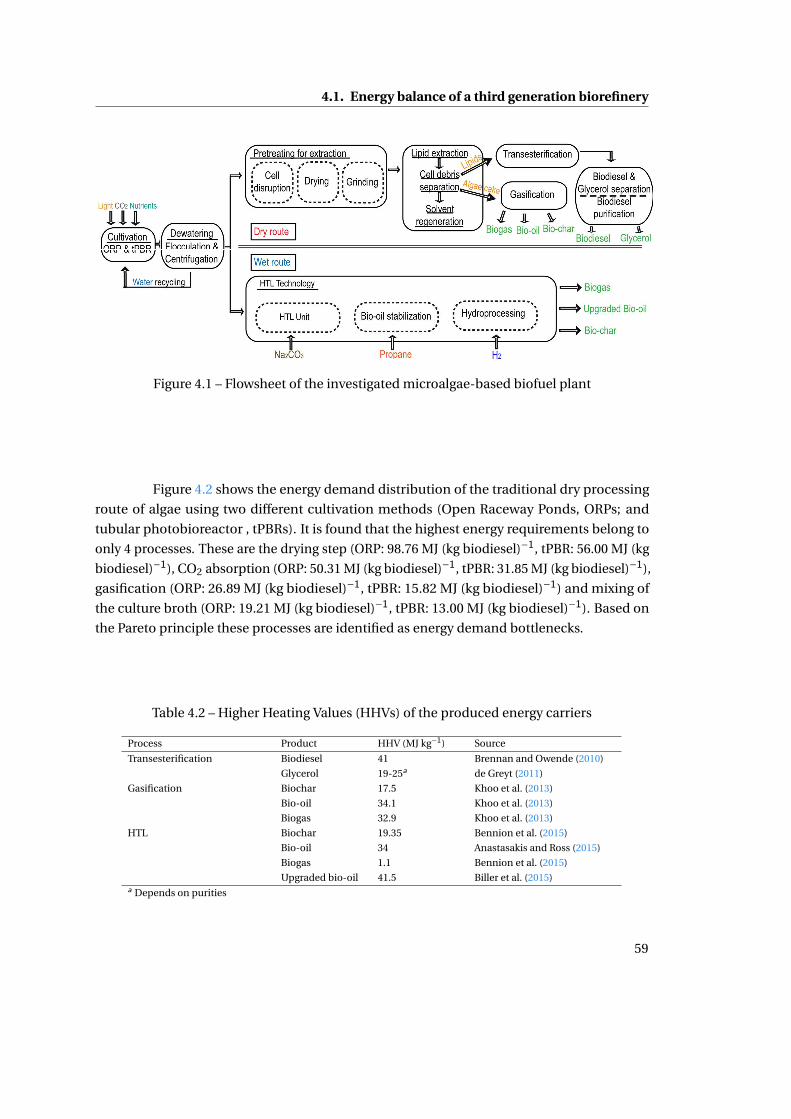
4.1. Energy balance of a third generation biorefinery
Figure 4.1 – Flowsheet of the investigated microalgae-based biofuel plant
Figure 4.2 shows the energy demand distribution of the traditional dry processing
route of algae using two different cultivation methods (Open Raceway Ponds, ORPs; and
tubular photobioreactor , tPBRs). It is found that the highest energy requirements belong to
only 4 processes. These are the drying step (ORP: 98.76 MJ (kg biodiesel)−1, tPBR: 56.00 MJ (kg
biodiesel)−1), CO2 absorption (ORP: 50.31 MJ (kg biodiesel)−1, tPBR: 31.85 MJ (kg biodiesel)−1),
gasification (ORP: 26.89 MJ (kg biodiesel)−1, tPBR: 15.82 MJ (kg biodiesel)−1) and mixing of
the culture broth (ORP: 19.21 MJ (kg biodiesel)−1, tPBR: 13.00 MJ (kg biodiesel)−1). Based on
the Pareto principle these processes are identified as energy demand bottlenecks.
Table 4.2 – Higher Heating Values (HHVs) of the produced energy carriers
Process Product HHV (MJ kg−1) Source
Transesterification Biodiesel 41 Brennan and Owende (2010)
Glycerol 19-25a de Greyt (2011)
Gasification Biochar 17.5 Khoo et al. (2013)
Bio-oil 34.1 Khoo et al. (2013)
Biogas 32.9 Khoo et al. (2013)
HTL Biochar 19.35 Bennion et al. (2015)
Bio-oil 34 Anastasakis and Ross (2015)
Biogas 1.1 Bennion et al. (2015)
Upgraded bio-oil 41.5 Biller et al. (2015)a Depends on purities
59
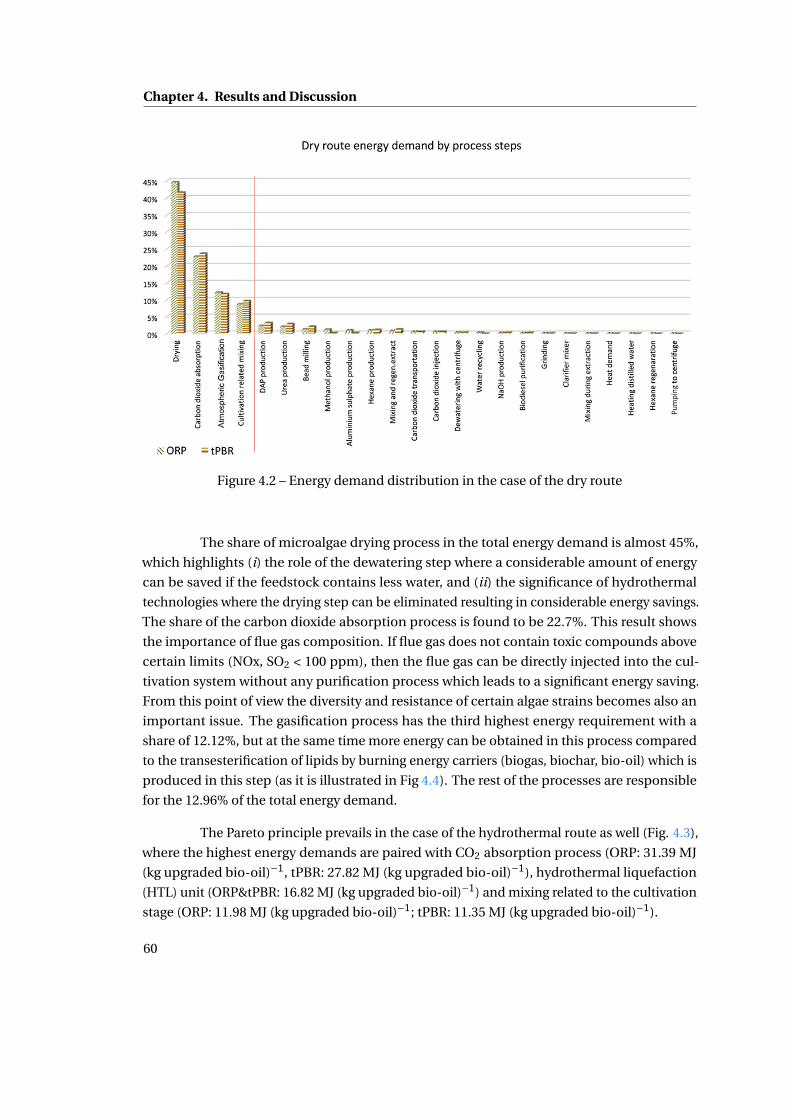
Chapter 4. Results and Discussion
Figure 4.2 – Energy demand distribution in the case of the dry route
The share of microalgae drying process in the total energy demand is almost 45%,
which highlights (i) the role of the dewatering step where a considerable amount of energy
can be saved if the feedstock contains less water, and (ii) the significance of hydrothermal
technologies where the drying step can be eliminated resulting in considerable energy savings.
The share of the carbon dioxide absorption process is found to be 22.7%. This result shows
the importance of flue gas composition. If flue gas does not contain toxic compounds above
certain limits (NOx, SO2 < 100 ppm), then the flue gas can be directly injected into the cul-
tivation system without any purification process which leads to a significant energy saving.
From this point of view the diversity and resistance of certain algae strains becomes also an
important issue. The gasification process has the third highest energy requirement with a
share of 12.12%, but at the same time more energy can be obtained in this process compared
to the transesterification of lipids by burning energy carriers (biogas, biochar, bio-oil) which is
produced in this step (as it is illustrated in Fig 4.4). The rest of the processes are responsible
for the 12.96% of the total energy demand.
The Pareto principle prevails in the case of the hydrothermal route as well (Fig. 4.3),
where the highest energy demands are paired with CO2 absorption process (ORP: 31.39 MJ
(kg upgraded bio-oil)−1, tPBR: 27.82 MJ (kg upgraded bio-oil)−1), hydrothermal liquefaction
(HTL) unit (ORP&tPBR: 16.82 MJ (kg upgraded bio-oil)−1) and mixing related to the cultivation
stage (ORP: 11.98 MJ (kg upgraded bio-oil)−1; tPBR: 11.35 MJ (kg upgraded bio-oil)−1).
60
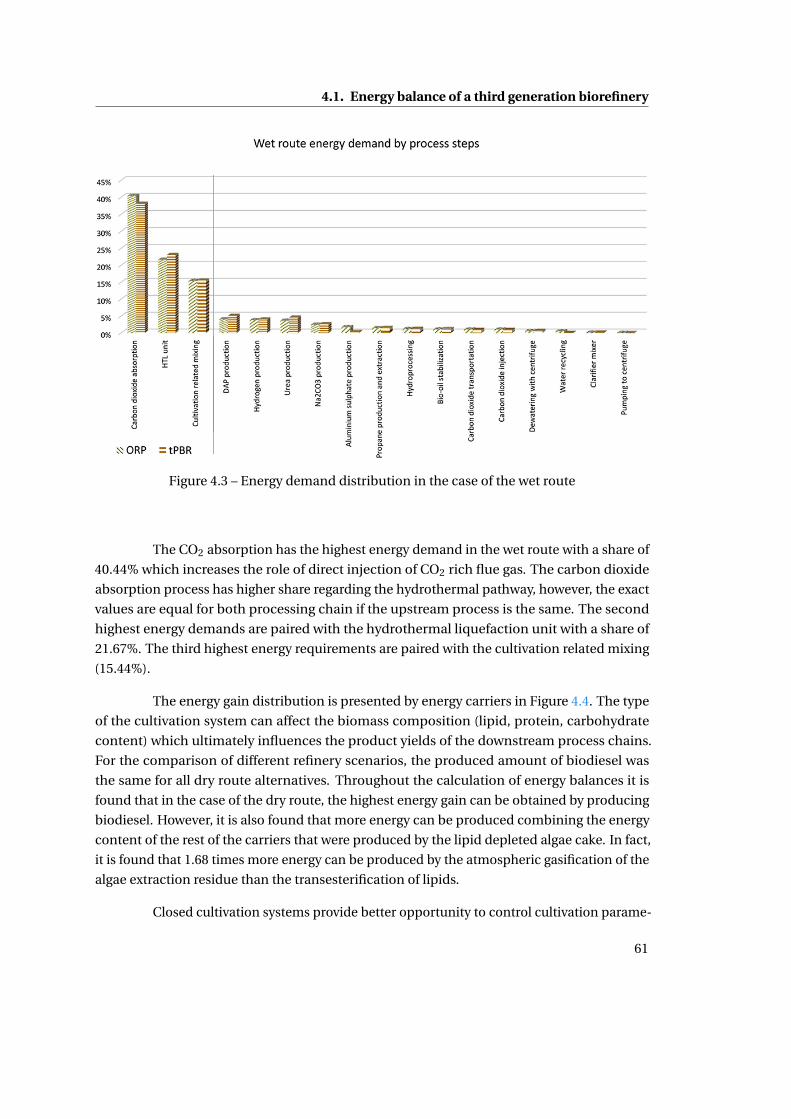
4.1. Energy balance of a third generation biorefinery
Figure 4.3 – Energy demand distribution in the case of the wet route
The CO2 absorption has the highest energy demand in the wet route with a share of
40.44% which increases the role of direct injection of CO2 rich flue gas. The carbon dioxide
absorption process has higher share regarding the hydrothermal pathway, however, the exact
values are equal for both processing chain if the upstream process is the same. The second
highest energy demands are paired with the hydrothermal liquefaction unit with a share of
21.67%. The third highest energy requirements are paired with the cultivation related mixing
(15.44%).
The energy gain distribution is presented by energy carriers in Figure 4.4. The type
of the cultivation system can affect the biomass composition (lipid, protein, carbohydrate
content) which ultimately influences the product yields of the downstream process chains.
For the comparison of different refinery scenarios, the produced amount of biodiesel was
the same for all dry route alternatives. Throughout the calculation of energy balances it is
found that in the case of the dry route, the highest energy gain can be obtained by producing
biodiesel. However, it is also found that more energy can be produced combining the energy
content of the rest of the carriers that were produced by the lipid depleted algae cake. In fact,
it is found that 1.68 times more energy can be produced by the atmospheric gasification of the
algae extraction residue than the transesterification of lipids.
Closed cultivation systems provide better opportunity to control cultivation parame-
61
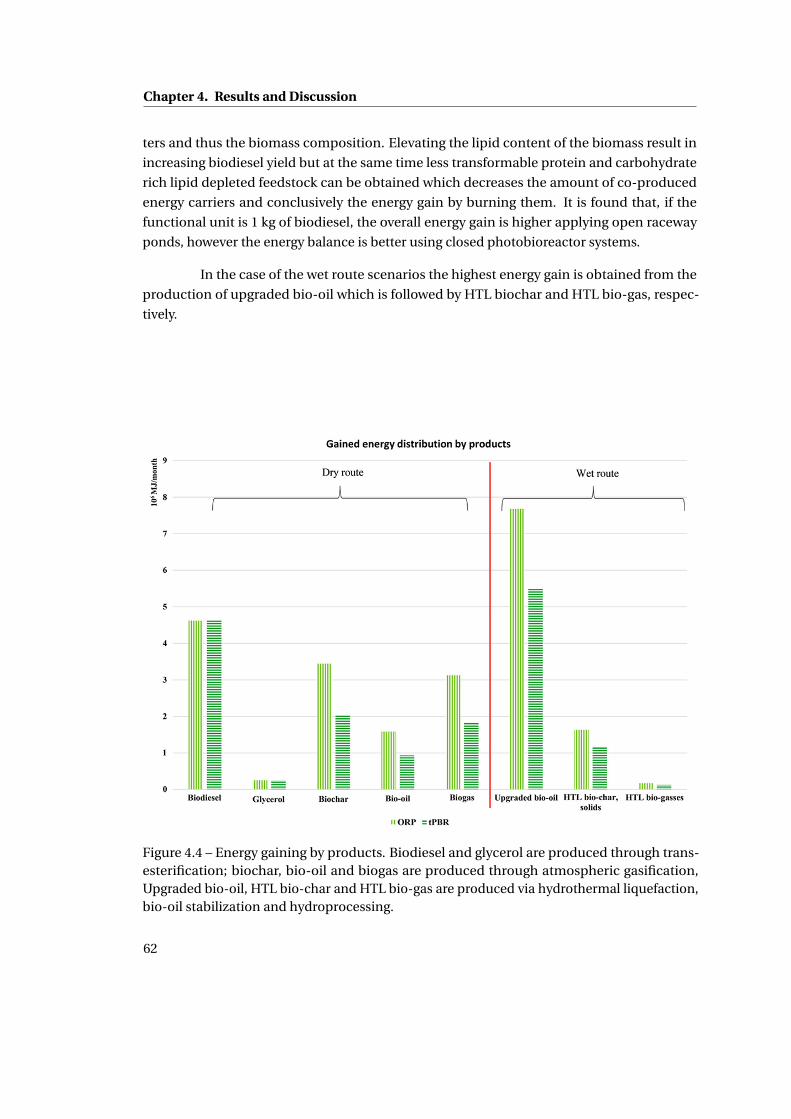
Chapter 4. Results and Discussion
ters and thus the biomass composition. Elevating the lipid content of the biomass result in
increasing biodiesel yield but at the same time less transformable protein and carbohydrate
rich lipid depleted feedstock can be obtained which decreases the amount of co-produced
energy carriers and conclusively the energy gain by burning them. It is found that, if the
functional unit is 1 kg of biodiesel, the overall energy gain is higher applying open raceway
ponds, however the energy balance is better using closed photobioreactor systems.
In the case of the wet route scenarios the highest energy gain is obtained from the
production of upgraded bio-oil which is followed by HTL biochar and HTL bio-gas, respec-
tively.
Figure 4.4 – Energy gaining by products. Biodiesel and glycerol are produced through trans-esterification; biochar, bio-oil and biogas are produced through atmospheric gasification,Upgraded bio-oil, HTL bio-char and HTL bio-gas are produced via hydrothermal liquefaction,bio-oil stabilization and hydroprocessing.
62
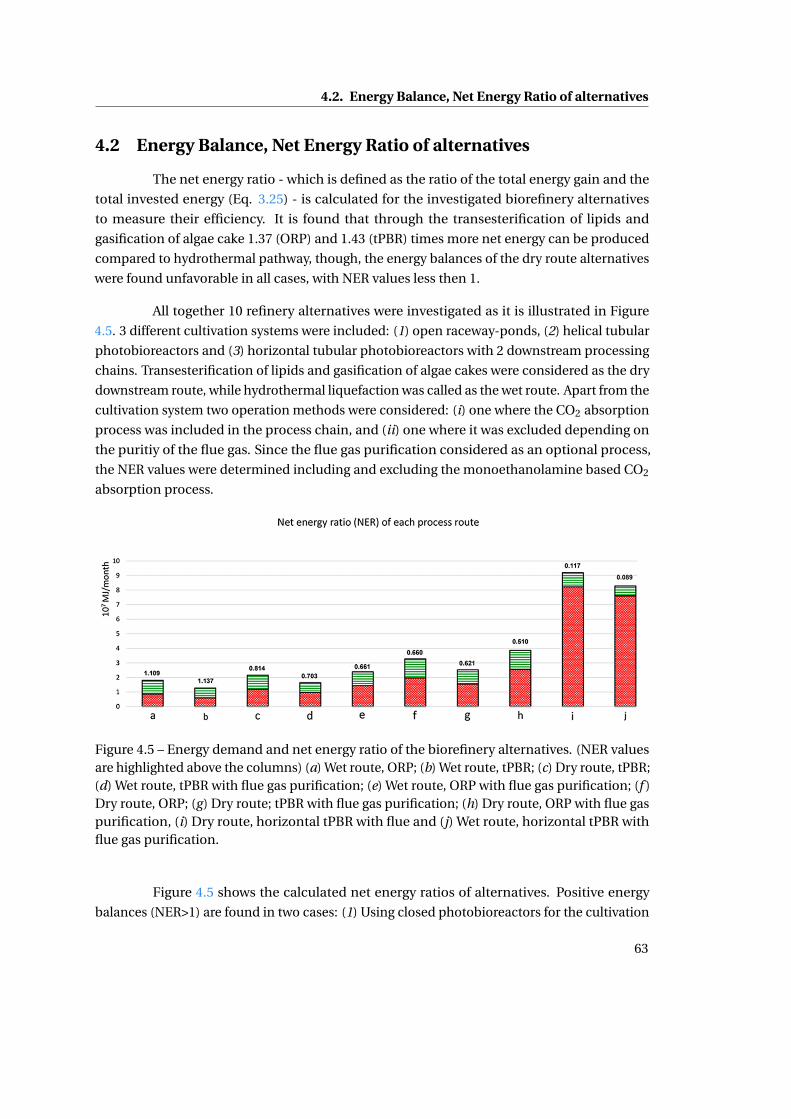
4.2. Energy Balance, Net Energy Ratio of alternatives
4.2 Energy Balance, Net Energy Ratio of alternatives
The net energy ratio - which is defined as the ratio of the total energy gain and the
total invested energy (Eq. 3.25) - is calculated for the investigated biorefinery alternatives
to measure their efficiency. It is found that through the transesterification of lipids and
gasification of algae cake 1.37 (ORP) and 1.43 (tPBR) times more net energy can be produced
compared to hydrothermal pathway, though, the energy balances of the dry route alternatives
were found unfavorable in all cases, with NER values less then 1.
All together 10 refinery alternatives were investigated as it is illustrated in Figure
4.5. 3 different cultivation systems were included: (1) open raceway-ponds, (2) helical tubular
photobioreactors and (3) horizontal tubular photobioreactors with 2 downstream processing
chains. Transesterification of lipids and gasification of algae cakes were considered as the dry
downstream route, while hydrothermal liquefaction was called as the wet route. Apart from the
cultivation system two operation methods were considered: (i) one where the CO2 absorption
process was included in the process chain, and (ii) one where it was excluded depending on
the puritiy of the flue gas. Since the flue gas purification considered as an optional process,
the NER values were determined including and excluding the monoethanolamine based CO2
absorption process.
Figure 4.5 – Energy demand and net energy ratio of the biorefinery alternatives. (NER valuesare highlighted above the columns) (a) Wet route, ORP; (b) Wet route, tPBR; (c) Dry route, tPBR;(d) Wet route, tPBR with flue gas purification; (e) Wet route, ORP with flue gas purification; (f )Dry route, ORP; (g) Dry route; tPBR with flue gas purification; (h) Dry route, ORP with flue gaspurification, (i) Dry route, horizontal tPBR with flue and (j) Wet route, horizontal tPBR withflue gas purification.
Figure 4.5 shows the calculated net energy ratios of alternatives. Positive energy
balances (NER>1) are found in two cases: (1) Using closed photobioreactors for the cultivation
63
Chapter 4. Results and Discussion
of algae then processing the biomass via hydrothermal liquefaction, and (2) utilizing ORPs
and HTL process where the NER values are 1.137 and 1.109, respectively.
It is found that positive energy balance is not achievable with configurations that
contain flue gas purification process. The reason for that can be traced back to the regeneration
of MEA absorbent after the carbon capture. The regeneration of monoethanolamine requires
high temperature and thus it has an enormous energy demand. The NER of the wet route with
tPBR system is found to be 0.703 (d), wet route with ORPs with 0.661 (e), dry route & tPBR is
0.621 (g), dry route and ORPs with 0.510 (h). Therefore, resistant algae species and toxic-free
flue gas sources are playing a key role to achieve a net energy ratio above 1.
The wet route which contains the hydrothermal technology is obtaining more fa-
vorable net energy ratio compared to the dry route. The elimination of the drying process
result in significant energy saving: 80.3% in the case of ORP system and 39.7% in the case of
tPBR. The alternatives that imply tubular photobioreactors achieved better NER scores than
the ones with open raceway ponds although both the invested and gained energy values are
higher applying ORPs.
Horizontal type tubular photobioreactor option was also investigated in the overall
energy evaluation but it is found that this cultivation system has unfavorable energy demand
which makes it unsuitable to use for energy efficient algae cultivation. Negative energy bal-
ances are found both with dry and wet routes with NER values of 0.117 and 0.089, respectively.
Some NER values which determined in former studies using renewable and fossil
sources as feedstock are collected in Table 4.3. The highest score is paired with conventional
diesel where the energy gain is approximately 5-times higher compared to the herein presented
values. Among the renewable sources, the heterotrophic algae based refinery has a higher NER
score but the difference is not significant and organic carbon sources are not required in the
case of autotrophic algae sources.
As a conclusion, positive energy balances of third generation biorefineries are achiev-
able in present technological levels, however, the energy gain is not significant (NER is slightly
higher than 1) and all of the products has to be combusted in order to attain the positive
energy balance.
64
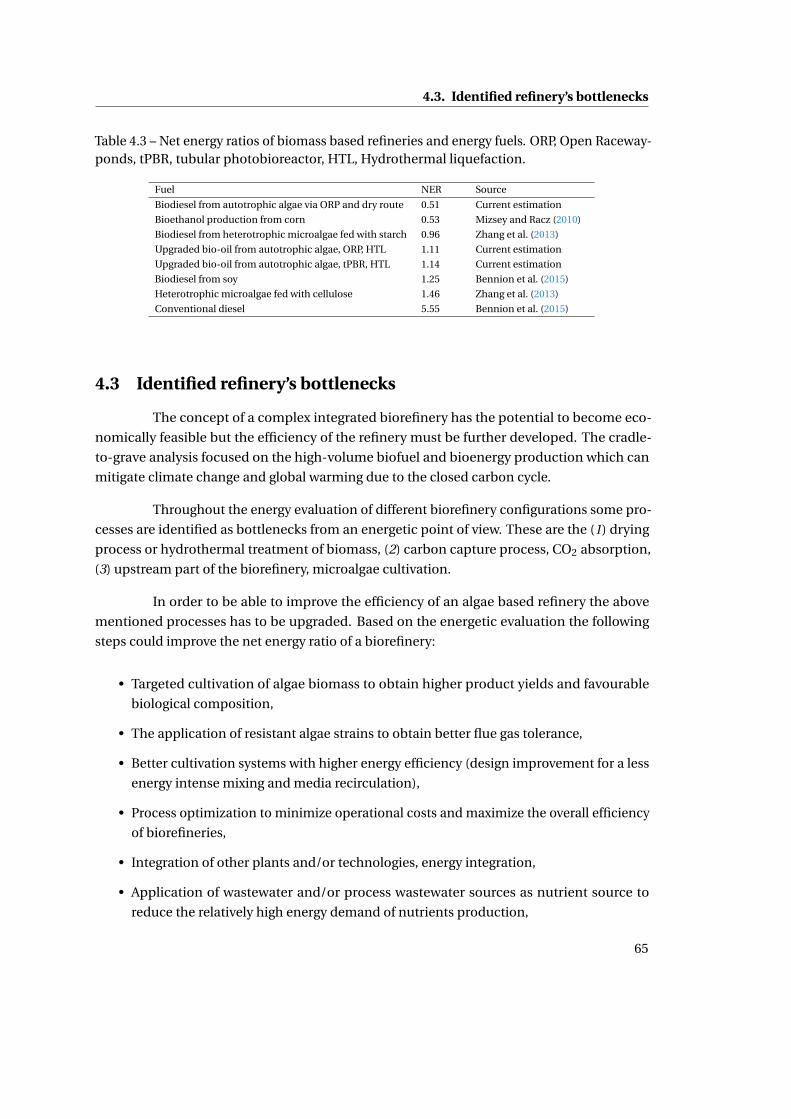
4.3. Identified refinery’s bottlenecks
Table 4.3 – Net energy ratios of biomass based refineries and energy fuels. ORP, Open Raceway-ponds, tPBR, tubular photobioreactor, HTL, Hydrothermal liquefaction.
Fuel NER Source
Biodiesel from autotrophic algae via ORP and dry route 0.51 Current estimation
Bioethanol production from corn 0.53 Mizsey and Racz (2010)
Biodiesel from heterotrophic microalgae fed with starch 0.96 Zhang et al. (2013)
Upgraded bio-oil from autotrophic algae, ORP, HTL 1.11 Current estimation
Upgraded bio-oil from autotrophic algae, tPBR, HTL 1.14 Current estimation
Biodiesel from soy 1.25 Bennion et al. (2015)
Heterotrophic microalgae fed with cellulose 1.46 Zhang et al. (2013)
Conventional diesel 5.55 Bennion et al. (2015)
4.3 Identified refinery’s bottlenecks
The concept of a complex integrated biorefinery has the potential to become eco-
nomically feasible but the efficiency of the refinery must be further developed. The cradle-
to-grave analysis focused on the high-volume biofuel and bioenergy production which can
mitigate climate change and global warming due to the closed carbon cycle.
Throughout the energy evaluation of different biorefinery configurations some pro-
cesses are identified as bottlenecks from an energetic point of view. These are the (1) drying
process or hydrothermal treatment of biomass, (2) carbon capture process, CO2 absorption,
(3) upstream part of the biorefinery, microalgae cultivation.
In order to be able to improve the efficiency of an algae based refinery the above
mentioned processes has to be upgraded. Based on the energetic evaluation the following
steps could improve the net energy ratio of a biorefinery:
• Targeted cultivation of algae biomass to obtain higher product yields and favourable
biological composition,
• The application of resistant algae strains to obtain better flue gas tolerance,
• Better cultivation systems with higher energy efficiency (design improvement for a less
energy intense mixing and media recirculation),
• Process optimization to minimize operational costs and maximize the overall efficiency
of biorefineries,
• Integration of other plants and/or technologies, energy integration,
• Application of wastewater and/or process wastewater sources as nutrient source to
reduce the relatively high energy demand of nutrients production,
65
Chapter 4. Results and Discussion
• Decreasing the energy requirement of the carbon capture process.
The identified bottlenecks, carbon capture, microalgae cultivation and hydrothermal
treatment of the feedstock are investigated further in Section 4.4, 4.7 and 4.8, respectively. The
aim of these investigation was finding solutions that enable to improve these processes and
the rentability and the efficiency of the microalgae biorefinery chain.
4.4 Life Cycle Analysis of Carbon Capture and Storage process alter-
natives
The energetic analysis showed that MEA based carbon dioxide absorption is a tech-
nological bottleneck in the biorefineries configuration. In this section, the life cycle of Carbon
Capture and Storage (CCS) chain is investigated to improve its efficiency and to decrease the
possible environmental impacts that arises through the application of the CCS technology.
4.4.1 CCS system setup
The investigated Carbon Capture and Storage process chain is presented in Figure 3.1.
It is assumed that the flue gas comes from a fossil plant. The investigated system incorporates
the carbon capture process, where chemical absorption with monoethanolamine absorbent
is considered. The regeneration of the solvent is based on a temperature swing method. For
evaluation of the absorption and regeneration process additional elements (such as: make-
up MEA, NaOH, activated carbon, steam and electricity) are included. Korre et al. (2010)
presented input and output data for a fossil based power plant equipped with MEA-based
post combustion CO2 capture process, which data set is used in the herein presented life cycle
analysis as a base case. These data and additional input and output life cycle inventory data
are listed in Table 4.4. It is considered that the carbon depleted flue gas is emitted in the air,
while the separated CO2 rich stream is compressed, then it is transported through pipelines to
a geological reservoir, where it is injected into the storage system. The energy demand of the
compression, transportation and injection processes were determined. The output of the CO2
capture process is a purified flue gas stream which can be released into the atmosphere, and a
separated CO2 stream with high purity.
In the LCAs the flue gas composition is simplified and only the CO2 content of the
flue is considered in the environmental evaluation, thus the environmental effects of SOx,
NOx and CO are omitted when the carbon depleted flue gas is emitted into the air. The
separated carbon dioxide is compressed up to 100 bars because the transportation of CO2 is
more advantageous in its liquid form. The energy requirements of the compression step was
calculated based on House et al. (2009).
66

4.4. Life Cycle Analysis of Carbon Capture and Storage process alternatives
Table 4.4 – Life cycle inventory data of the investigated CCS process related to 774.5kgCO2/MWhe
Input/Output Quantity
Matter and energy consumption to capture
MEA 1.1 kg
Activated carbon 27 g
NaOH 47 g
Steam 4.14 GJ
Electricity 34 kWh
End products of capture
Separated CO2 735.7 kg
Waste 4.5 kg
Compression to 100 bar
Energy 229 MJ
Injection
Energy 35 MJ
Transport
Pipeline 100 km
The transportation of the purified CO2 is considered to be done via pipelines. Trans-
portation of the compressed CO2 is possible by several ways like via railway, on road with
transport tanker and on sea with tanker ships. However, these options have high risk of
accidents and cost more. Wei et al. (2016) expressed in a techno-economic analysis that
transportation through pipelines is a cost-effective method. The CAPEX and OPEX (capital
investment and operating cost) of CO2 transportation to 100 km are about between 0.83 and
11.7 USD t−1CO2depending on the CO2 mass flow rate (1-10 Mt a−1). Further input data about
the pipeline installation, material and energy requirements were collected from the Ecoinvent
(2013) database. At the end, the CO2 stream is injected into the geological reservoir.
In this study 4 different cases are investigated. The uncontrolled CO2 release is
compared to three CCS alternatives: (1) Basic CCS technology using fossil fuels ("CCS Fossil"),
(2) Technologically improved CCS process chain, using heat integration in order to decrease
the energy demand of the absorbent regeneration process ("CCS Improved") and (3) the basic
CCS technology using renewable energy for heat generation ("CCS Renewable").
67
Chapter 4. Results and Discussion
4.4.2 CCS via fossil fuel based absorbent regeneration
The environmental impact assessment results of the CCS fossil alternative are illus-
trated in Fig. 4.6. The global warming potential (GWP) is investigated by IPCC 2007 method.
It is found that 278 kg CO2,eq emission can be prevented during the operation of a 1 MWhe
coal fueled power plant (Fig. 4.6a). Screening the environmental effects with multiperspective
impact assessment methods (such as Eco-indicator 99 and IMPACT 2002+) give contradictory
results as it is shown in Figures 4.6b and 4.6c. It turns out that the application of CCS technol-
ogy has higher environmental load than the direct release of the CO2 to the atmosphere. The
environmental impacts of the process chain are 1.8 and 5.8 times higher compared them to
the uncontrolled release in the case of IMPACT 2002+ and EI 99, respectively.
The effects of multi-perspective impact categories are shown in Figure 4.7. Three
impact categories are identified as significant elements in the case of the EI 99 method (Fig.
4.7a). These are the Respiratory inorganics (15.4 EI99 Pt), Climate change (4.9 EI99 Pt) and
Fossil fuels (20.1 EI99 Pt) categories. The highest environmental damage is paired with the
application of fossil fuels (e.g., natural gas, heavy fuel oil) during the operation of CCS process.
In the case of EI 99 methods it accounts to the 46.2% of the total environmental effects.
The same tendency is found in the case of IMPACT 2002+ LCIA method, where the highest
environmental damage is identified on human health factor. The significant subcategories
are found to be the inorganic air pollutants (Respiratory inorganics), Non-renewable energy
sources and Global warming, approximately with the same magnitude (Fig. 4.7b).
The multi-perspective LCIA methods (both EI 99 and IMPACT 2002+) give the similar
result if only the global warming potential impact category investigated, thus it can be stated
that the CCS process is beneficial in regards of the prevention of CO2 emission. However, when
broader environmental categories are examined the result shows that the CCS process is not
preferred over the direct release of CO2. The simulation results show that the environmental
impacts of the Carbon Capture and Storage technology must be upgraded further in order
to become a favourable technology regarding the emission prevention of greenhouse gases.
In the following sections two main solution are investigated to decrease the environmental
hazards of CCS technology: (1.) decreasing the energy requirement of MEA regeneration using
process improvements and (2.) replace fossil fuels to renewable ones because the application
of fossil fuels are found to be significant from environmental point of view (Figs. 4.7a and
4.7b).
68
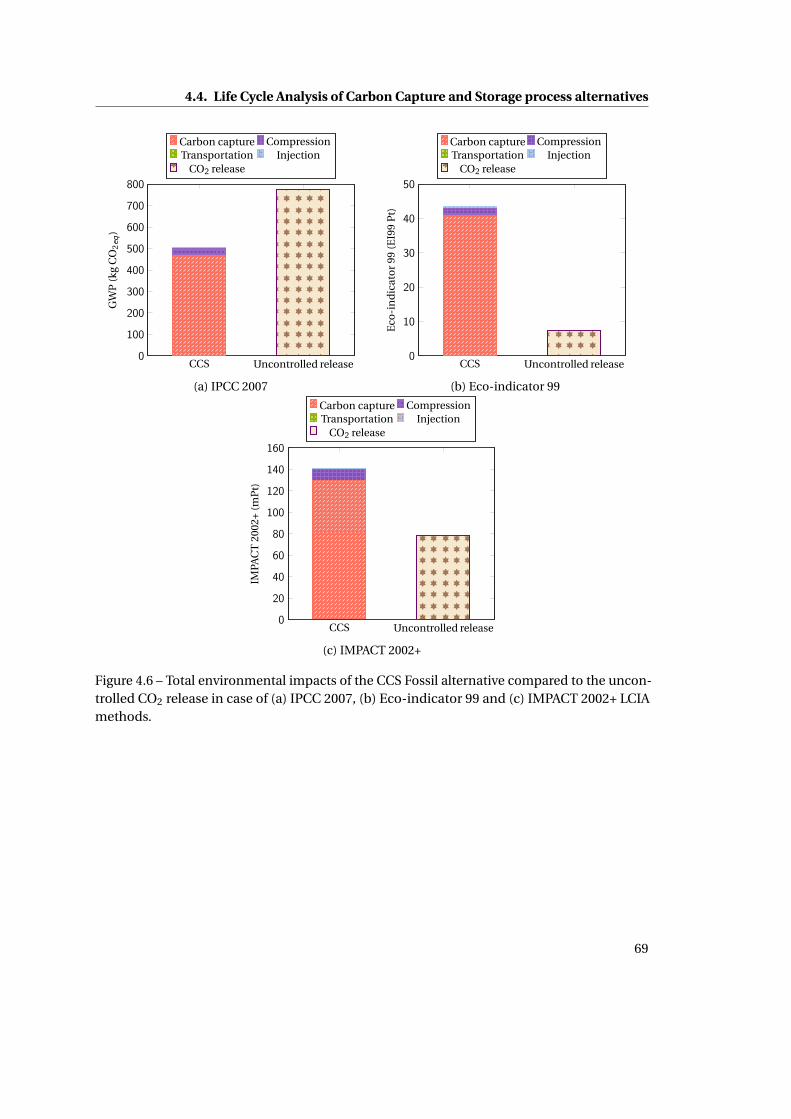
4.4. Life Cycle Analysis of Carbon Capture and Storage process alternatives
CCS Uncontrolled release0
100
200
300
400
500
600
700
800
GW
P(k
gC
O2
eq)
Carbon capture CompressionTransportation Injection
CO2 release
(a) IPCC 2007
CCS Uncontrolled release0
10
20
30
40
50
Eco
-in
dic
ato
r99
(EI9
9P
t)
Carbon capture CompressionTransportation Injection
CO2 release
(b) Eco-indicator 99
CCS Uncontrolled release0
20
40
60
80
100
120
140
160
IMPA
CT
2002
+(m
Pt)
Carbon capture CompressionTransportation Injection
CO2 release
(c) IMPACT 2002+
Figure 4.6 – Total environmental impacts of the CCS Fossil alternative compared to the uncon-trolled CO2 release in case of (a) IPCC 2007, (b) Eco-indicator 99 and (c) IMPACT 2002+ LCIAmethods.
69
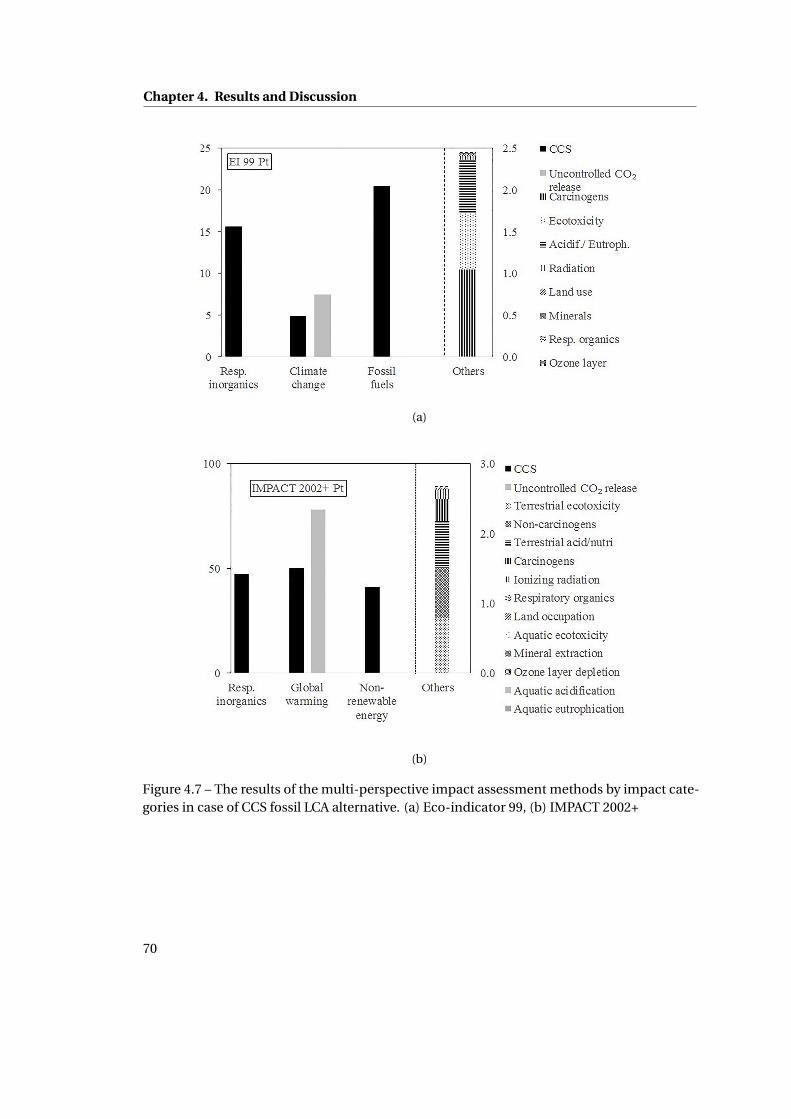
Chapter 4. Results and Discussion
(a)
(b)
Figure 4.7 – The results of the multi-perspective impact assessment methods by impact cate-gories in case of CCS fossil LCA alternative. (a) Eco-indicator 99, (b) IMPACT 2002+
70

4.4. Life Cycle Analysis of Carbon Capture and Storage process alternatives
4.4.3 CCS via process improvement
Figure 4.6 illustrates that the highest environmental impact by processes is asso-
ciated with the carbon capture process, more precisely with the regeneration of the MEA
absorbent after the CO2 capture which has the highest energy input requirement among the
processes (Table 4.4). The works of Nagy and Mizsey (2015) and Yu et al. (2016) proved that the
MEA based carbon capture process can be significantly improved by the proper optimization
of absorbent/flue gas ratio and the utilization of energy integration option that recovers the
heat content of the regenerated hot absorbent. These process improvements can reduce the
energy requirement of the capture process to approximately the 60% of the presented base
case in Table 4.4.
Figure 4.8 shows the recalculated environmental damages applying process im-
provements. The results show that the environmental issues can be decreased using process
improvements compared to the base case. Based on the IPCC 2007 method the GWP is de-
creased by 550.4 kg CO2,eq (Fig. 4.8a) compared to the uncontrolled carbon dioxide release. In
the case of the IMPACT 2002+ multi-perspective method, the overall environmental damage is
decreased from 141.2 mPt to 63.3 mPt (Fig. 4.8c), which is a meaningful environmental effect
reducement. However, according to the results obtained with EI 99 method, the uncontrolled
carbon dioxide release remains still better from environmental viewpoint since this evaluation
option emphasizes the human health much higher than IMPACT 2002+ LCIA (Fig. 4.8b).
71

Chapter 4. Results and Discussion
CCS Uncontrolled release0
100
200
300
400
500
600
700
800
GW
P(k
gC
O2
eq)
Carbon capture CompressionTransportation Injection
CO2 release
(a) IPCC 2007
CCS Uncontrolled release0
2
4
6
8
10
12
14
16
18
20
Eco
-in
dic
ato
r99
(EI9
9P
t)
Carbon capture CompressionTransportation Injection
CO2 release
(b) Eco-indicator 99
CCS Uncontrolled release0
20
40
60
80
100
IMPA
CT
2002
+(m
Pt)
Carbon capture CompressionTransportation Injection
CO2 release
(c) IMPACT 2002+
Figure 4.8 – Total environmental impacts of the CCS Improved alternative compared to theuncontrolled CO2 release in the case of (a) IPCC 2007, (b) Eco-indicator 99 and (c) IMPACT2002+ LCIA methods.
4.4.4 CCS via application of renewable energy
The application of fossil fuels for absorber regeneration and supplementary elec-
tricity generation throughout the CCS process result in a strange outcome, i.e., the direct flue
gas release becomes a favourable option from the viewpoint of the multi-perspective impact
assessment methods.
Figures 4.6 and 4.8 demonstrate that carbon capture has the highest environmental
72
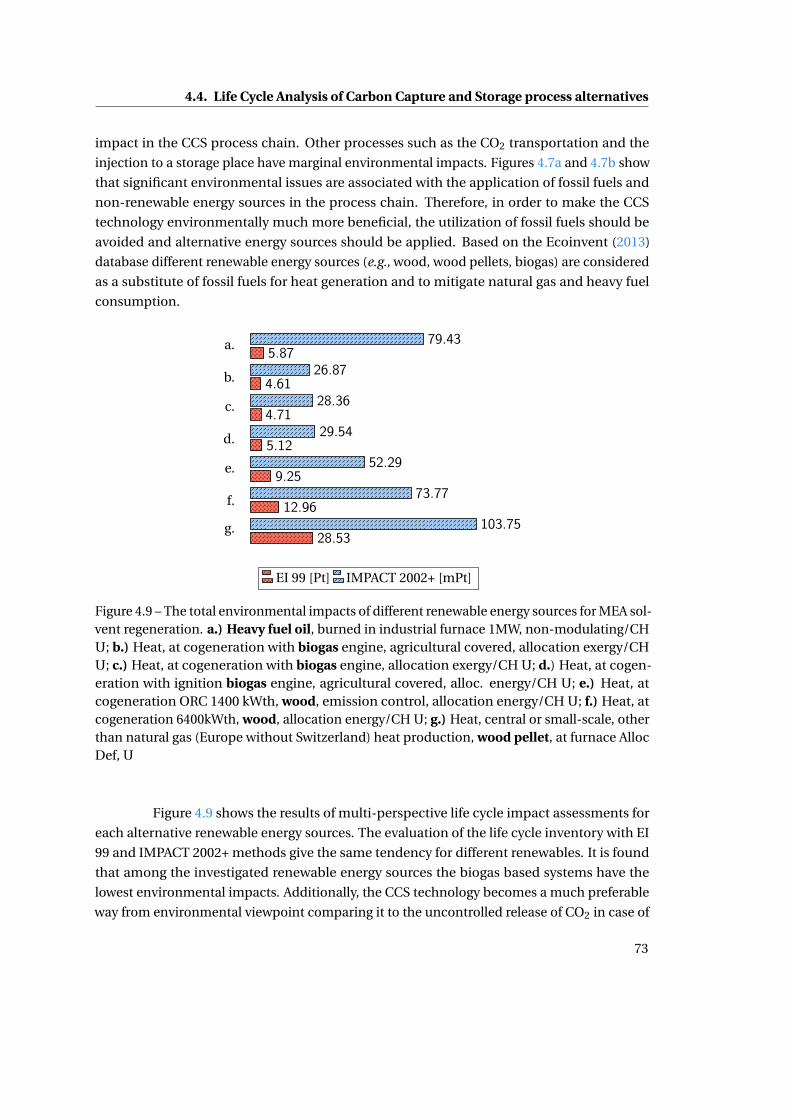
4.4. Life Cycle Analysis of Carbon Capture and Storage process alternatives
impact in the CCS process chain. Other processes such as the CO2 transportation and the
injection to a storage place have marginal environmental impacts. Figures 4.7a and 4.7b show
that significant environmental issues are associated with the application of fossil fuels and
non-renewable energy sources in the process chain. Therefore, in order to make the CCS
technology environmentally much more beneficial, the utilization of fossil fuels should be
avoided and alternative energy sources should be applied. Based on the Ecoinvent (2013)
database different renewable energy sources (e.g., wood, wood pellets, biogas) are considered
as a substitute of fossil fuels for heat generation and to mitigate natural gas and heavy fuel
consumption.
a.
b.
c.
d.
e.
f.
g.
5.87
4.61
4.71
5.12
9.25
12.96
28.53
79.43
26.87
28.36
29.54
52.29
73.77
103.75
EI 99 [Pt] IMPACT 2002+ [mPt]
Figure 4.9 – The total environmental impacts of different renewable energy sources for MEA sol-vent regeneration. a.) Heavy fuel oil, burned in industrial furnace 1MW, non-modulating/CHU; b.) Heat, at cogeneration with biogas engine, agricultural covered, allocation exergy/CHU; c.) Heat, at cogeneration with biogas engine, allocation exergy/CH U; d.) Heat, at cogen-eration with ignition biogas engine, agricultural covered, alloc. energy/CH U; e.) Heat, atcogeneration ORC 1400 kWth, wood, emission control, allocation energy/CH U; f.) Heat, atcogeneration 6400kWth, wood, allocation energy/CH U; g.) Heat, central or small-scale, otherthan natural gas (Europe without Switzerland) heat production, wood pellet, at furnace AllocDef, U
Figure 4.9 shows the results of multi-perspective life cycle impact assessments for
each alternative renewable energy sources. The evaluation of the life cycle inventory with EI
99 and IMPACT 2002+ methods give the same tendency for different renewables. It is found
that among the investigated renewable energy sources the biogas based systems have the
lowest environmental impacts. Additionally, the CCS technology becomes a much preferable
way from environmental viewpoint comparing it to the uncontrolled release of CO2 in case of
73
Chapter 4. Results and Discussion
all life cycle impact assessment methods including the multi-perspective ones as well. The
environmental effects of the carbon capture and regeneration process decrease immensely
so its environmental effects become comparable with other processes (e.g., compression,
transportation, injection).
Figure 4.10 illustrates the total environmental impacts of the Carbon Capture and
Storage chain when the most favourable renewable energy source (biogas from agricultural
waste) is applied for heat generation. It is demonstrated that according to each life cycle
impact assessment method (Figs. 4.10a-4.10c) the total environmental impacts of the CCS
chain is lower than that of the CO2 release.
The LCA scores for woods and woods pellets are found to be greater than the uncon-
trolled carbon dioxide release in case of the multi-perspective methods. Woods are considered
renewable energy sources but logging requires lots of energy and the time that is required
to grow up trees could take decades, consequently burning trees for heat generation is not
considered as an environmental friendly method.
74
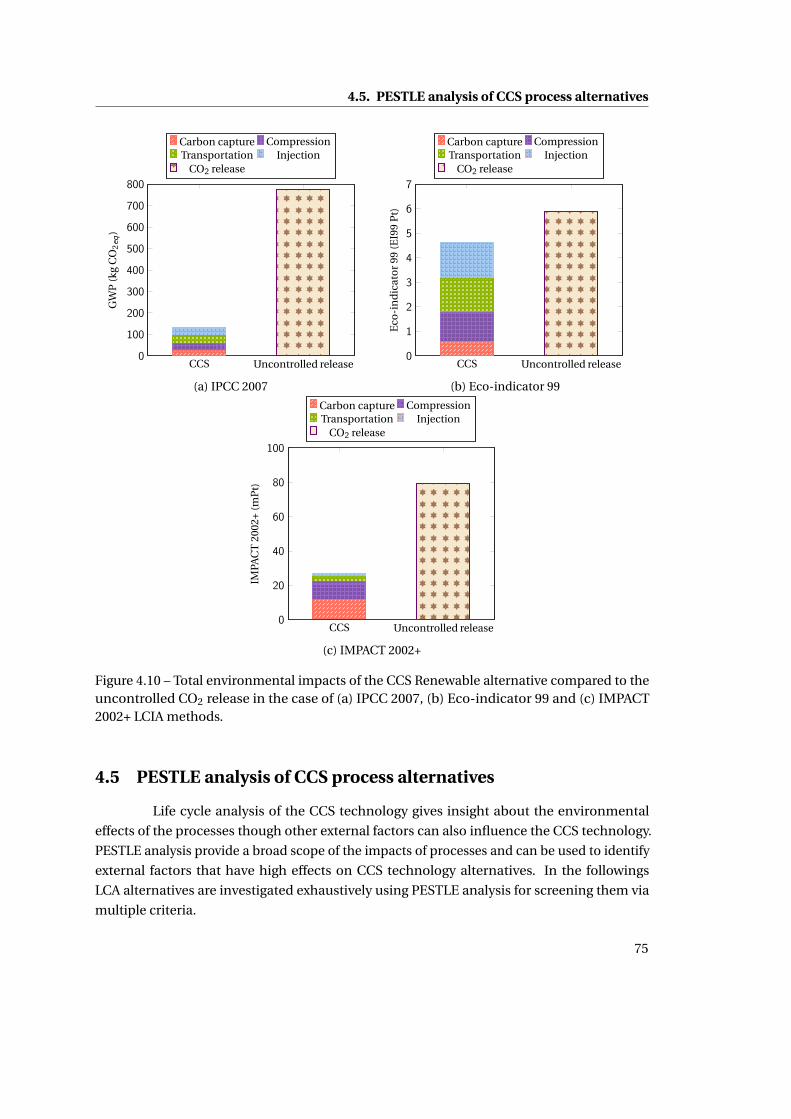
4.5. PESTLE analysis of CCS process alternatives
CCS Uncontrolled release0
100
200
300
400
500
600
700
800
GW
P(k
gC
O2
eq)
Carbon capture CompressionTransportation Injection
CO2 release
(a) IPCC 2007
CCS Uncontrolled release0
1
2
3
4
5
6
7
Eco
-in
dic
ato
r99
(EI9
9P
t)
Carbon capture CompressionTransportation Injection
CO2 release
(b) Eco-indicator 99
CCS Uncontrolled release0
20
40
60
80
100
IMPA
CT
2002
+(m
Pt)
Carbon capture CompressionTransportation Injection
CO2 release
(c) IMPACT 2002+
Figure 4.10 – Total environmental impacts of the CCS Renewable alternative compared to theuncontrolled CO2 release in the case of (a) IPCC 2007, (b) Eco-indicator 99 and (c) IMPACT2002+ LCIA methods.
4.5 PESTLE analysis of CCS process alternatives
Life cycle analysis of the CCS technology gives insight about the environmental
effects of the processes though other external factors can also influence the CCS technology.
PESTLE analysis provide a broad scope of the impacts of processes and can be used to identify
external factors that have high effects on CCS technology alternatives. In the followings
LCA alternatives are investigated exhaustively using PESTLE analysis for screening them via
multiple criteria.
75
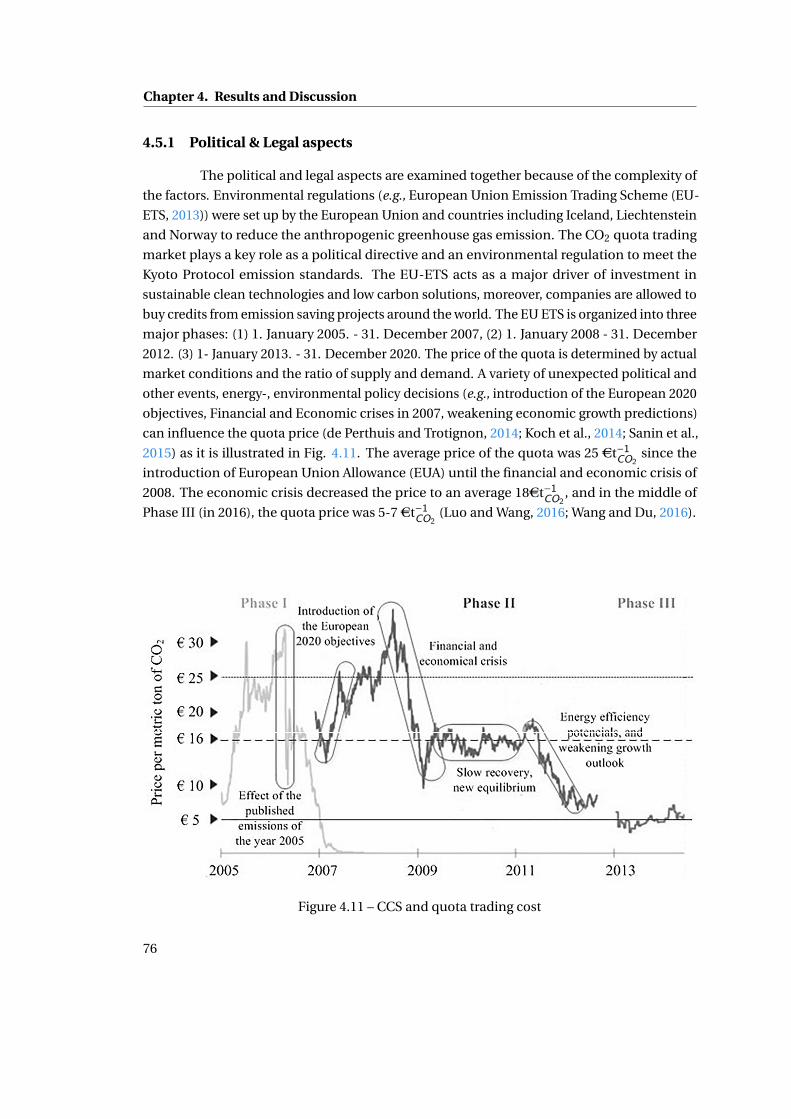
Chapter 4. Results and Discussion
4.5.1 Political & Legal aspects
The political and legal aspects are examined together because of the complexity of
the factors. Environmental regulations (e.g., European Union Emission Trading Scheme (EU-
ETS, 2013)) were set up by the European Union and countries including Iceland, Liechtenstein
and Norway to reduce the anthropogenic greenhouse gas emission. The CO2 quota trading
market plays a key role as a political directive and an environmental regulation to meet the
Kyoto Protocol emission standards. The EU-ETS acts as a major driver of investment in
sustainable clean technologies and low carbon solutions, moreover, companies are allowed to
buy credits from emission saving projects around the world. The EU ETS is organized into three
major phases: (1) 1. January 2005. - 31. December 2007, (2) 1. January 2008 - 31. December
2012. (3) 1- January 2013. - 31. December 2020. The price of the quota is determined by actual
market conditions and the ratio of supply and demand. A variety of unexpected political and
other events, energy-, environmental policy decisions (e.g., introduction of the European 2020
objectives, Financial and Economic crises in 2007, weakening economic growth predictions)
can influence the quota price (de Perthuis and Trotignon, 2014; Koch et al., 2014; Sanin et al.,
2015) as it is illustrated in Fig. 4.11. The average price of the quota was 25 ACt−1CO2since the
introduction of European Union Allowance (EUA) until the financial and economic crisis of
2008. The economic crisis decreased the price to an average 18ACt−1CO2, and in the middle of
Phase III (in 2016), the quota price was 5-7ACt−1CO2(Luo and Wang, 2016; Wang and Du, 2016).
Figure 4.11 – CCS and quota trading cost
76
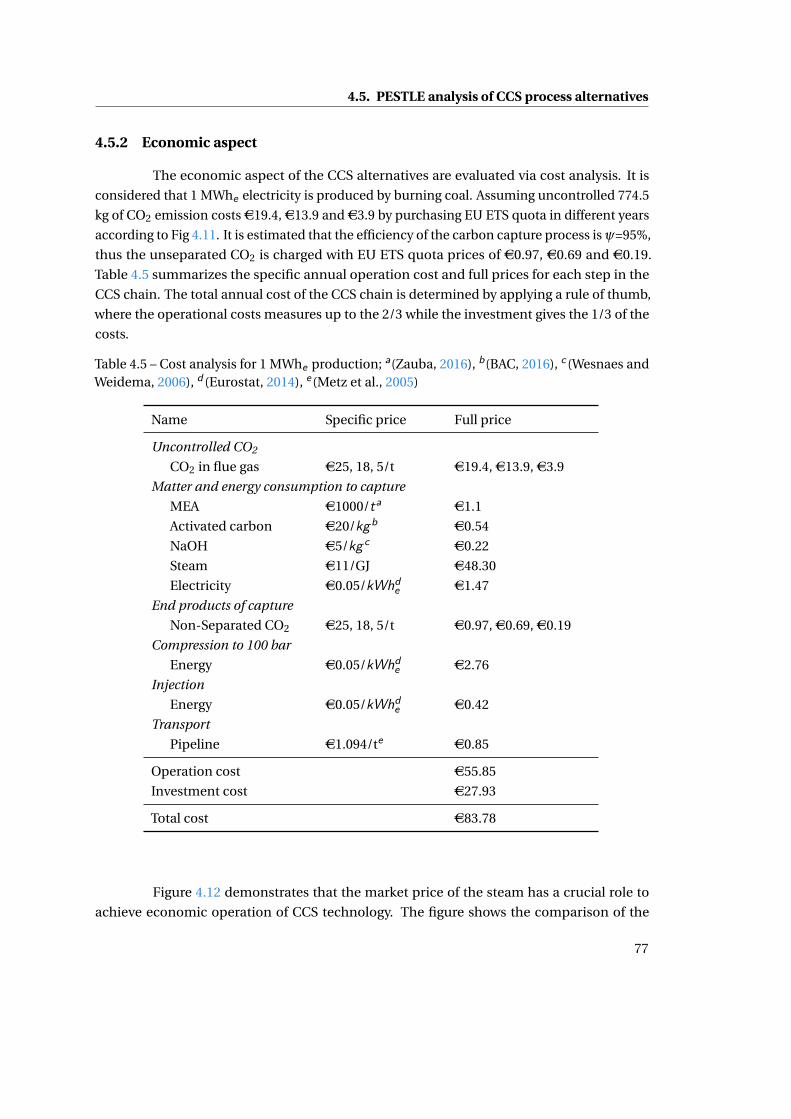
4.5. PESTLE analysis of CCS process alternatives
4.5.2 Economic aspect
The economic aspect of the CCS alternatives are evaluated via cost analysis. It is
considered that 1 MWhe electricity is produced by burning coal. Assuming uncontrolled 774.5
kg of CO2 emission costsAC19.4,AC13.9 andAC3.9 by purchasing EU ETS quota in different years
according to Fig 4.11. It is estimated that the efficiency of the carbon capture process isψ=95%,
thus the unseparated CO2 is charged with EU ETS quota prices of AC0.97, AC0.69 and AC0.19.
Table 4.5 summarizes the specific annual operation cost and full prices for each step in the
CCS chain. The total annual cost of the CCS chain is determined by applying a rule of thumb,
where the operational costs measures up to the 2/3 while the investment gives the 1/3 of the
costs.
Table 4.5 – Cost analysis for 1 MWhe production; a(Zauba, 2016), b(BAC, 2016), c (Wesnaes andWeidema, 2006), d (Eurostat, 2014), e(Metz et al., 2005)
Name Specific price Full price
Uncontrolled CO2
CO2 in flue gas AC25, 18, 5/t AC19.4,AC13.9,AC3.9
Matter and energy consumption to capture
MEA AC1000/ta AC1.1
Activated carbon AC20/kgb AC0.54
NaOH AC5/kg c AC0.22
Steam AC11/GJ AC48.30
Electricity AC0.05/kWhde AC1.47
End products of capture
Non-Separated CO2 AC25, 18, 5/t AC0.97,AC0.69,AC0.19
Compression to 100 bar
Energy AC0.05/kWhde AC2.76
Injection
Energy AC0.05/kWhde AC0.42
Transport
Pipeline AC1.094/te AC0.85
Operation cost AC55.85
Investment cost AC27.93
Total cost AC83.78
Figure 4.12 demonstrates that the market price of the steam has a crucial role to
achieve economic operation of CCS technology. The figure shows the comparison of the
77

Chapter 4. Results and Discussion
fossil based CCS technology and the CO2 release charged with quota prices. The dashed
solid lines indicate the emitted 774.5 kg CO2 quota prices in different years. The results show
that the CCS becomes beneficial at low steam prices between 0ACGJ−1 to 1ACGJ−1, preferably
close to 0 ACGJ−1. The operational cost rises if the steam is produced via biogas engine. A
gas engine thermal efficiency is about 50% (ClarkeEnergy, 2013), and 1 GJ biogas costsAC8.3
(Probiopol, 2016) as a result the required steam generation costs aroundAC69 which is a higher
price compared to the fossil based steam production. The application of biogas increases the
total costs toAC108 t−1CO2including the carbon capture process, tax regulations, compression,
injection and transportation of the captured CO2 via pipelines. Significant cost reduction
can be achieved by applying process improvement (AC70.2 t−1CO2). The calculated costs are
comparable with literature data, where the total cost of the CCS process can be found between
$70-89 t−1CO2(Vaccarelli et al., 2014; Jeong et al., 2015).
Figure 4.12 – CO2 CCS and quota trading cost by three quota trading rate (AC5/t;AC18/t;AC25/t)producing 1 MWhe
Table 4.6 shows the economic subfactors (OPEX and specific capital cost) of each
CCS alternatives. The fossil based CCS process is selected as a base case and the other alter-
78
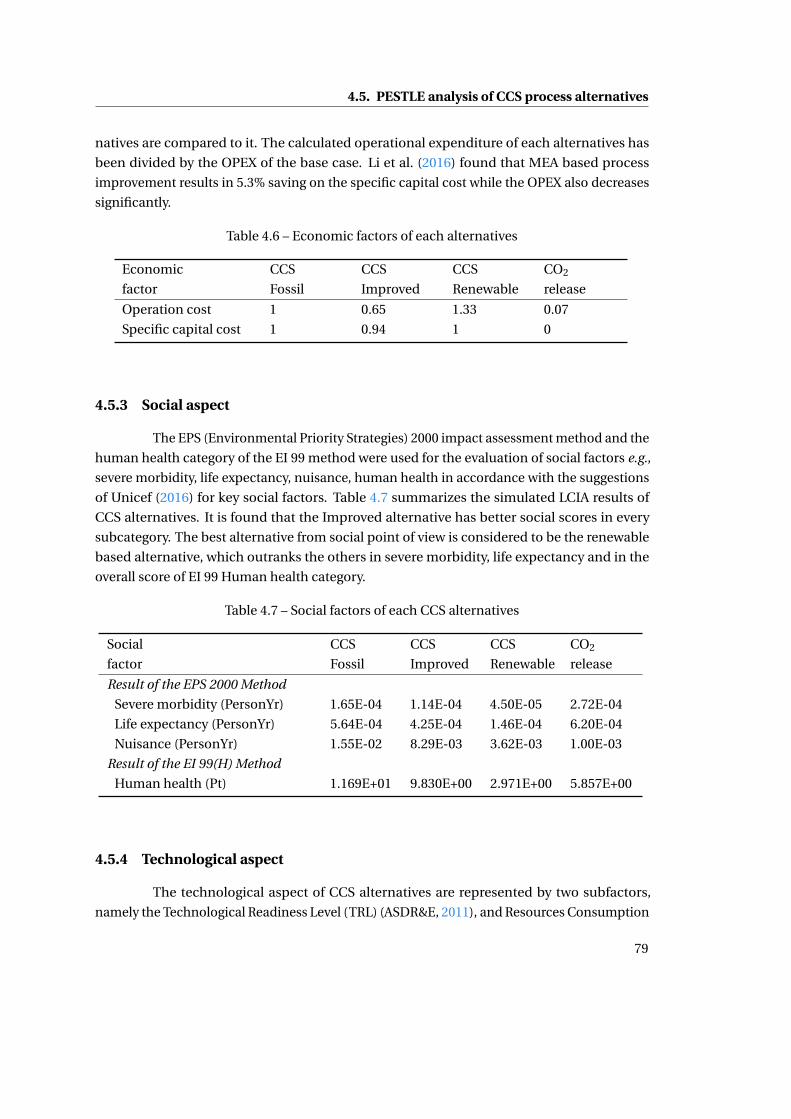
4.5. PESTLE analysis of CCS process alternatives
natives are compared to it. The calculated operational expenditure of each alternatives has
been divided by the OPEX of the base case. Li et al. (2016) found that MEA based process
improvement results in 5.3% saving on the specific capital cost while the OPEX also decreases
significantly.
Table 4.6 – Economic factors of each alternatives
Economic
factor
CCS
Fossil
CCS
Improved
CCS
Renewable
CO2
release
Operation cost 1 0.65 1.33 0.07
Specific capital cost 1 0.94 1 0
4.5.3 Social aspect
The EPS (Environmental Priority Strategies) 2000 impact assessment method and the
human health category of the EI 99 method were used for the evaluation of social factors e.g.,
severe morbidity, life expectancy, nuisance, human health in accordance with the suggestions
of Unicef (2016) for key social factors. Table 4.7 summarizes the simulated LCIA results of
CCS alternatives. It is found that the Improved alternative has better social scores in every
subcategory. The best alternative from social point of view is considered to be the renewable
based alternative, which outranks the others in severe morbidity, life expectancy and in the
overall score of EI 99 Human health category.
Table 4.7 – Social factors of each CCS alternatives
Social
factor
CCS
Fossil
CCS
Improved
CCS
Renewable
CO2
release
Result of the EPS 2000 Method
Severe morbidity (PersonYr) 1.65E-04 1.14E-04 4.50E-05 2.72E-04
Life expectancy (PersonYr) 5.64E-04 4.25E-04 1.46E-04 6.20E-04
Nuisance (PersonYr) 1.55E-02 8.29E-03 3.62E-03 1.00E-03
Result of the EI 99(H) Method
Human health (Pt) 1.169E+01 9.830E+00 2.971E+00 5.857E+00
4.5.4 Technological aspect
The technological aspect of CCS alternatives are represented by two subfactors,
namely the Technological Readiness Level (TRL) (ASDR&E, 2011), and Resources Consumption
79
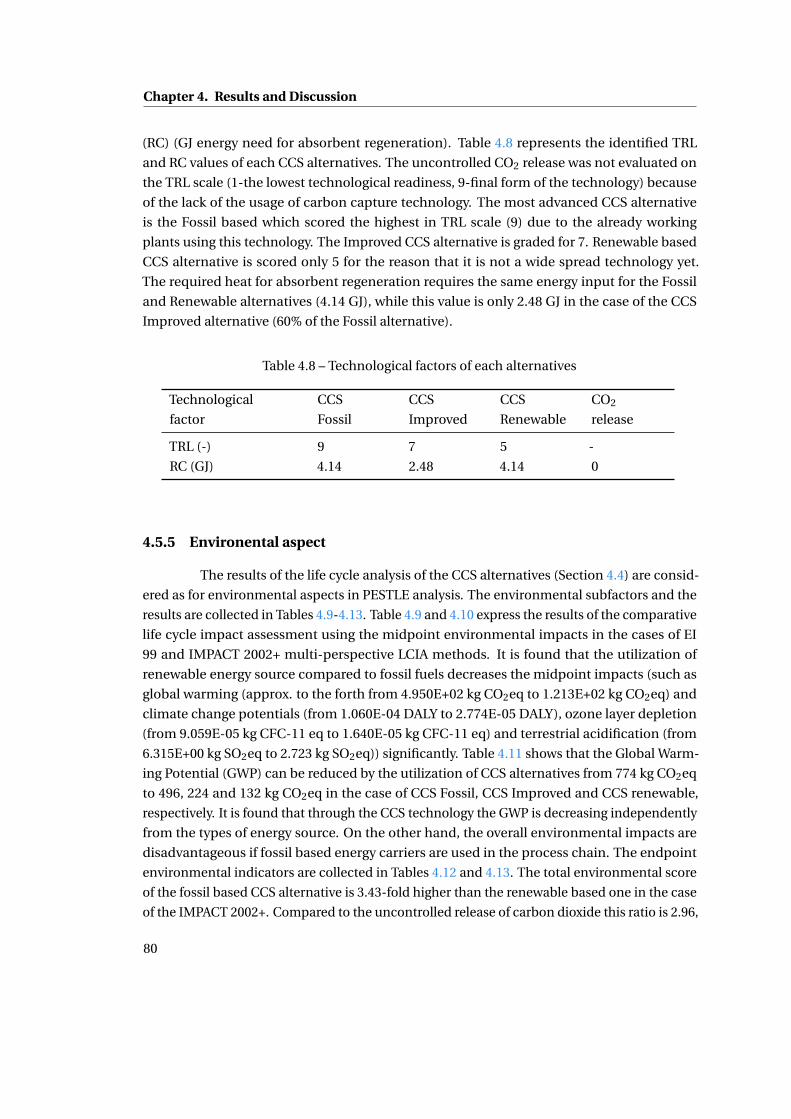
Chapter 4. Results and Discussion
(RC) (GJ energy need for absorbent regeneration). Table 4.8 represents the identified TRL
and RC values of each CCS alternatives. The uncontrolled CO2 release was not evaluated on
the TRL scale (1-the lowest technological readiness, 9-final form of the technology) because
of the lack of the usage of carbon capture technology. The most advanced CCS alternative
is the Fossil based which scored the highest in TRL scale (9) due to the already working
plants using this technology. The Improved CCS alternative is graded for 7. Renewable based
CCS alternative is scored only 5 for the reason that it is not a wide spread technology yet.
The required heat for absorbent regeneration requires the same energy input for the Fossil
and Renewable alternatives (4.14 GJ), while this value is only 2.48 GJ in the case of the CCS
Improved alternative (60% of the Fossil alternative).
Table 4.8 – Technological factors of each alternatives
Technological
factor
CCS
Fossil
CCS
Improved
CCS
Renewable
CO2
release
TRL (-) 9 7 5 -
RC (GJ) 4.14 2.48 4.14 0
4.5.5 Environental aspect
The results of the life cycle analysis of the CCS alternatives (Section 4.4) are consid-
ered as for environmental aspects in PESTLE analysis. The environmental subfactors and the
results are collected in Tables 4.9-4.13. Table 4.9 and 4.10 express the results of the comparative
life cycle impact assessment using the midpoint environmental impacts in the cases of EI
99 and IMPACT 2002+ multi-perspective LCIA methods. It is found that the utilization of
renewable energy source compared to fossil fuels decreases the midpoint impacts (such as
global warming (approx. to the forth from 4.950E+02 kg CO2eq to 1.213E+02 kg CO2eq) and
climate change potentials (from 1.060E-04 DALY to 2.774E-05 DALY), ozone layer depletion
(from 9.059E-05 kg CFC-11 eq to 1.640E-05 kg CFC-11 eq) and terrestrial acidification (from
6.315E+00 kg SO2eq to 2.723 kg SO2eq)) significantly. Table 4.11 shows that the Global Warm-
ing Potential (GWP) can be reduced by the utilization of CCS alternatives from 774 kg CO2eq
to 496, 224 and 132 kg CO2eq in the case of CCS Fossil, CCS Improved and CCS renewable,
respectively. It is found that through the CCS technology the GWP is decreasing independently
from the types of energy source. On the other hand, the overall environmental impacts are
disadvantageous if fossil based energy carriers are used in the process chain. The endpoint
environmental indicators are collected in Tables 4.12 and 4.13. The total environmental score
of the fossil based CCS alternative is 3.43-fold higher than the renewable based one in the case
of the IMPACT 2002+. Compared to the uncontrolled release of carbon dioxide this ratio is 2.96,
80

4.5. PESTLE analysis of CCS process alternatives
therefore, it can be stated that using renewables are considered to be a much more beneficial
option from environmental point of view compared to the others. The same tendency can
be drawn using the Eco-indicator 99 LCIA method: the total impact of fossil based CCS is
3.22-fold, the direct CO2 release is 1.27-fold higher in comparison with the application of
renewable energy carrier.
81
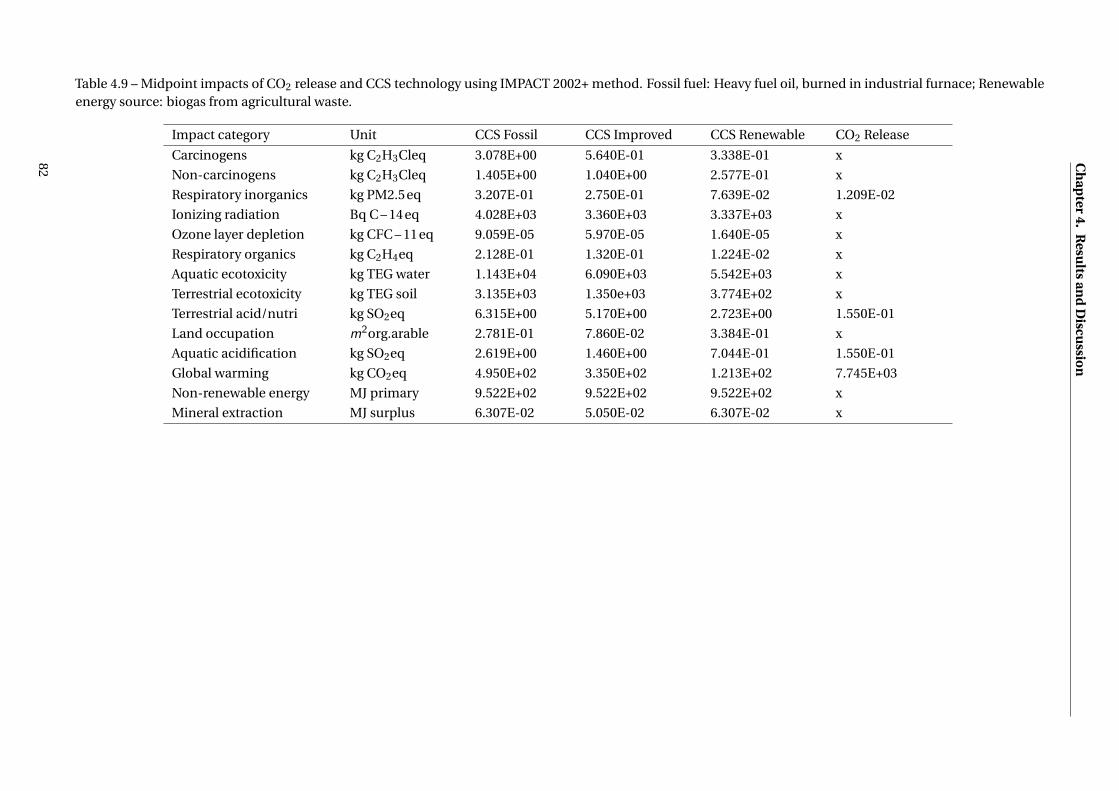
Ch
apter
4.R
esults
and
Discu
ssion
Table 4.9 – Midpoint impacts of CO2 release and CCS technology using IMPACT 2002+ method. Fossil fuel: Heavy fuel oil, burned in industrial furnace; Renewableenergy source: biogas from agricultural waste.
Impact category Unit CCS Fossil CCS Improved CCS Renewable CO2 Release
Carcinogens kg C2H3Cleq 3.078E+00 5.640E-01 3.338E-01 x
Non-carcinogens kg C2H3Cleq 1.405E+00 1.040E+00 2.577E-01 x
Respiratory inorganics kg PM2.5eq 3.207E-01 2.750E-01 7.639E-02 1.209E-02
Ionizing radiation Bq C – 14eq 4.028E+03 3.360E+03 3.337E+03 x
Ozone layer depletion kg CFC – 11eq 9.059E-05 5.970E-05 1.640E-05 x
Respiratory organics kg C2H4eq 2.128E-01 1.320E-01 1.224E-02 x
Aquatic ecotoxicity kg TEG water 1.143E+04 6.090E+03 5.542E+03 x
Terrestrial ecotoxicity kg TEG soil 3.135E+03 1.350e+03 3.774E+02 x
Terrestrial acid/nutri kg SO2eq 6.315E+00 5.170E+00 2.723E+00 1.550E-01
Land occupation m2org.arable 2.781E-01 7.860E-02 3.384E-01 x
Aquatic acidification kg SO2eq 2.619E+00 1.460E+00 7.044E-01 1.550E-01
Global warming kg CO2eq 4.950E+02 3.350E+02 1.213E+02 7.745E+03
Non-renewable energy MJ primary 9.522E+02 9.522E+02 9.522E+02 x
Mineral extraction MJ surplus 6.307E-02 5.050E-02 6.307E-02 x
82
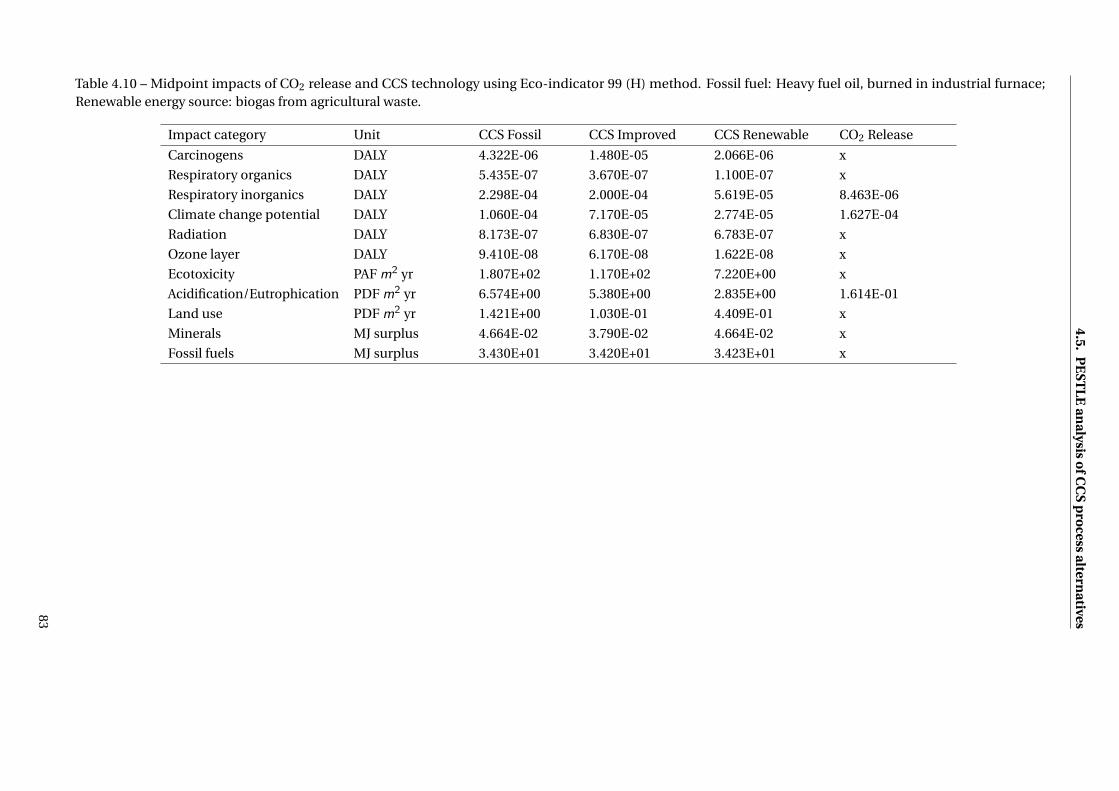
4.5.P
EST
LE
analysis
ofC
CS
pro
cessaltern
atives
Table 4.10 – Midpoint impacts of CO2 release and CCS technology using Eco-indicator 99 (H) method. Fossil fuel: Heavy fuel oil, burned in industrial furnace;Renewable energy source: biogas from agricultural waste.
Impact category Unit CCS Fossil CCS Improved CCS Renewable CO2 Release
Carcinogens DALY 4.322E-06 1.480E-05 2.066E-06 x
Respiratory organics DALY 5.435E-07 3.670E-07 1.100E-07 x
Respiratory inorganics DALY 2.298E-04 2.000E-04 5.619E-05 8.463E-06
Climate change potential DALY 1.060E-04 7.170E-05 2.774E-05 1.627E-04
Radiation DALY 8.173E-07 6.830E-07 6.783E-07 x
Ozone layer DALY 9.410E-08 6.170E-08 1.622E-08 x
Ecotoxicity PAF m2 yr 1.807E+02 1.170E+02 7.220E+00 x
Acidification/Eutrophication PDF m2 yr 6.574E+00 5.380E+00 2.835E+00 1.614E-01
Land use PDF m2 yr 1.421E+00 1.030E-01 4.409E-01 x
Minerals MJ surplus 4.664E-02 3.790E-02 4.664E-02 x
Fossil fuels MJ surplus 3.430E+01 3.420E+01 3.423E+01 x
83
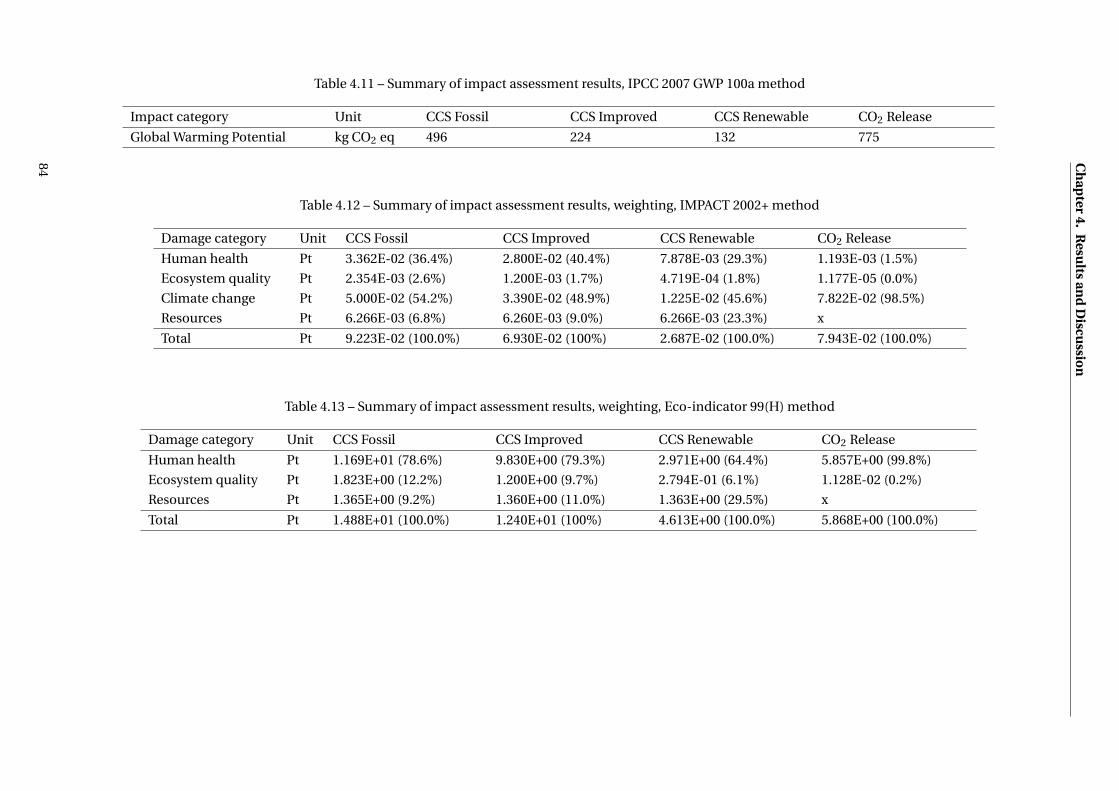
Ch
apter
4.R
esults
and
Discu
ssion
Table 4.11 – Summary of impact assessment results, IPCC 2007 GWP 100a method
Impact category Unit CCS Fossil CCS Improved CCS Renewable CO2 Release
Global Warming Potential kg CO2 eq 496 224 132 775
Table 4.12 – Summary of impact assessment results, weighting, IMPACT 2002+ method
Damage category Unit CCS Fossil CCS Improved CCS Renewable CO2 Release
Human health Pt 3.362E-02 (36.4%) 2.800E-02 (40.4%) 7.878E-03 (29.3%) 1.193E-03 (1.5%)
Ecosystem quality Pt 2.354E-03 (2.6%) 1.200E-03 (1.7%) 4.719E-04 (1.8%) 1.177E-05 (0.0%)
Climate change Pt 5.000E-02 (54.2%) 3.390E-02 (48.9%) 1.225E-02 (45.6%) 7.822E-02 (98.5%)
Resources Pt 6.266E-03 (6.8%) 6.260E-03 (9.0%) 6.266E-03 (23.3%) x
Total Pt 9.223E-02 (100.0%) 6.930E-02 (100%) 2.687E-02 (100.0%) 7.943E-02 (100.0%)
Table 4.13 – Summary of impact assessment results, weighting, Eco-indicator 99(H) method
Damage category Unit CCS Fossil CCS Improved CCS Renewable CO2 Release
Human health Pt 1.169E+01 (78.6%) 9.830E+00 (79.3%) 2.971E+00 (64.4%) 5.857E+00 (99.8%)
Ecosystem quality Pt 1.823E+00 (12.2%) 1.200E+00 (9.7%) 2.794E-01 (6.1%) 1.128E-02 (0.2%)
Resources Pt 1.365E+00 (9.2%) 1.360E+00 (11.0%) 1.363E+00 (29.5%) x
Total Pt 1.488E+01 (100.0%) 1.240E+01 (100%) 4.613E+00 (100.0%) 5.868E+00 (100.0%)
84
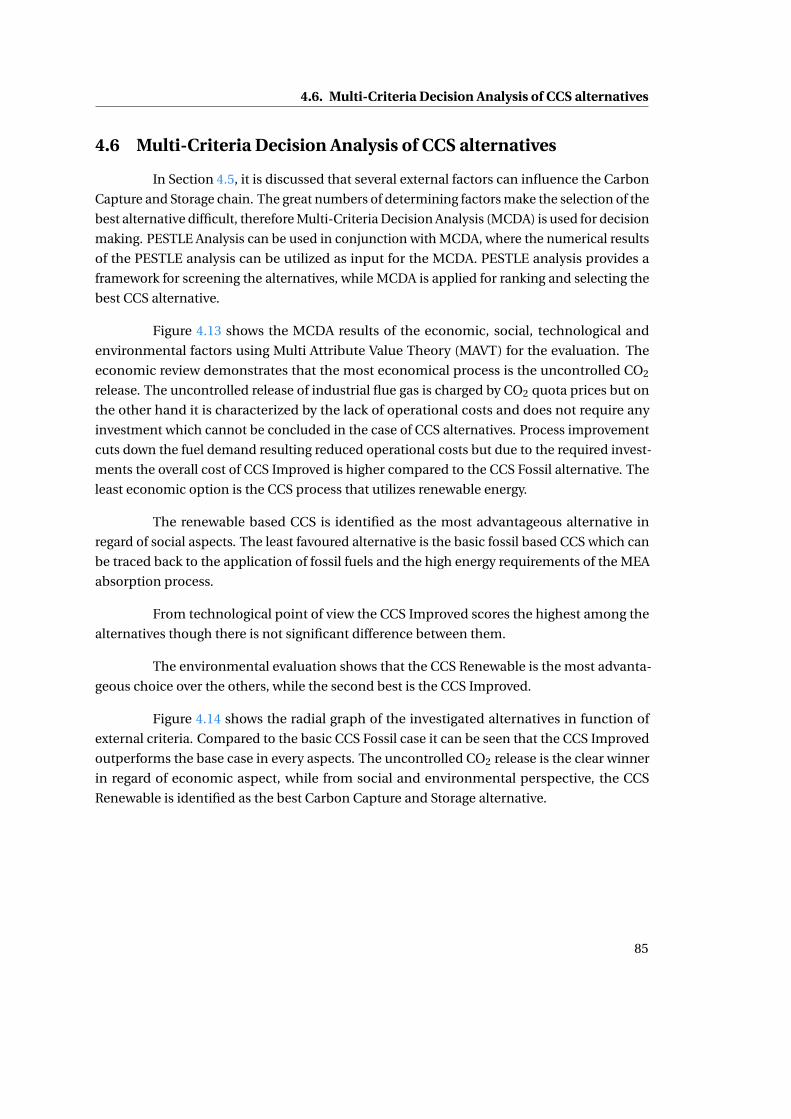
4.6. Multi-Criteria Decision Analysis of CCS alternatives
4.6 Multi-Criteria Decision Analysis of CCS alternatives
In Section 4.5, it is discussed that several external factors can influence the Carbon
Capture and Storage chain. The great numbers of determining factors make the selection of the
best alternative difficult, therefore Multi-Criteria Decision Analysis (MCDA) is used for decision
making. PESTLE Analysis can be used in conjunction with MCDA, where the numerical results
of the PESTLE analysis can be utilized as input for the MCDA. PESTLE analysis provides a
framework for screening the alternatives, while MCDA is applied for ranking and selecting the
best CCS alternative.
Figure 4.13 shows the MCDA results of the economic, social, technological and
environmental factors using Multi Attribute Value Theory (MAVT) for the evaluation. The
economic review demonstrates that the most economical process is the uncontrolled CO2
release. The uncontrolled release of industrial flue gas is charged by CO2 quota prices but on
the other hand it is characterized by the lack of operational costs and does not require any
investment which cannot be concluded in the case of CCS alternatives. Process improvement
cuts down the fuel demand resulting reduced operational costs but due to the required invest-
ments the overall cost of CCS Improved is higher compared to the CCS Fossil alternative. The
least economic option is the CCS process that utilizes renewable energy.
The renewable based CCS is identified as the most advantageous alternative in
regard of social aspects. The least favoured alternative is the basic fossil based CCS which can
be traced back to the application of fossil fuels and the high energy requirements of the MEA
absorption process.
From technological point of view the CCS Improved scores the highest among the
alternatives though there is not significant difference between them.
The environmental evaluation shows that the CCS Renewable is the most advanta-
geous choice over the others, while the second best is the CCS Improved.
Figure 4.14 shows the radial graph of the investigated alternatives in function of
external criteria. Compared to the basic CCS Fossil case it can be seen that the CCS Improved
outperforms the base case in every aspects. The uncontrolled CO2 release is the clear winner
in regard of economic aspect, while from social and environmental perspective, the CCS
Renewable is identified as the best Carbon Capture and Storage alternative.
85
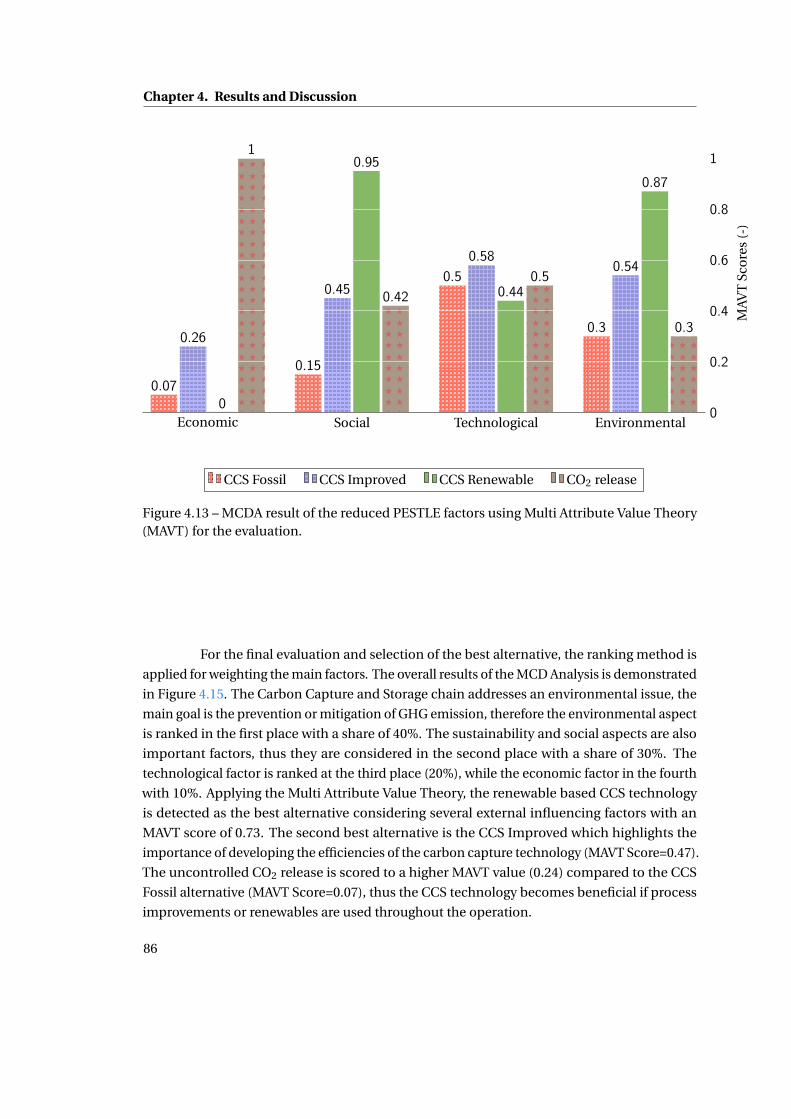
Chapter 4. Results and Discussion
Economic Social Technological Environmental0
0.2
0.4
0.6
0.8
1
0.07
0.15
0.5
0.30.26
0.45
0.580.54
0
0.95
0.44
0.87
1
0.42
0.5
0.3
MAV
TSc
ore
s(-
)
CCS Fossil CCS Improved CCS Renewable CO2 release
Figure 4.13 – MCDA result of the reduced PESTLE factors using Multi Attribute Value Theory(MAVT) for the evaluation.
For the final evaluation and selection of the best alternative, the ranking method is
applied for weighting the main factors. The overall results of the MCD Analysis is demonstrated
in Figure 4.15. The Carbon Capture and Storage chain addresses an environmental issue, the
main goal is the prevention or mitigation of GHG emission, therefore the environmental aspect
is ranked in the first place with a share of 40%. The sustainability and social aspects are also
important factors, thus they are considered in the second place with a share of 30%. The
technological factor is ranked at the third place (20%), while the economic factor in the fourth
with 10%. Applying the Multi Attribute Value Theory, the renewable based CCS technology
is detected as the best alternative considering several external influencing factors with an
MAVT score of 0.73. The second best alternative is the CCS Improved which highlights the
importance of developing the efficiencies of the carbon capture technology (MAVT Score=0.47).
The uncontrolled CO2 release is scored to a higher MAVT value (0.24) compared to the CCS
Fossil alternative (MAVT Score=0.07), thus the CCS technology becomes beneficial if process
improvements or renewables are used throughout the operation.
86
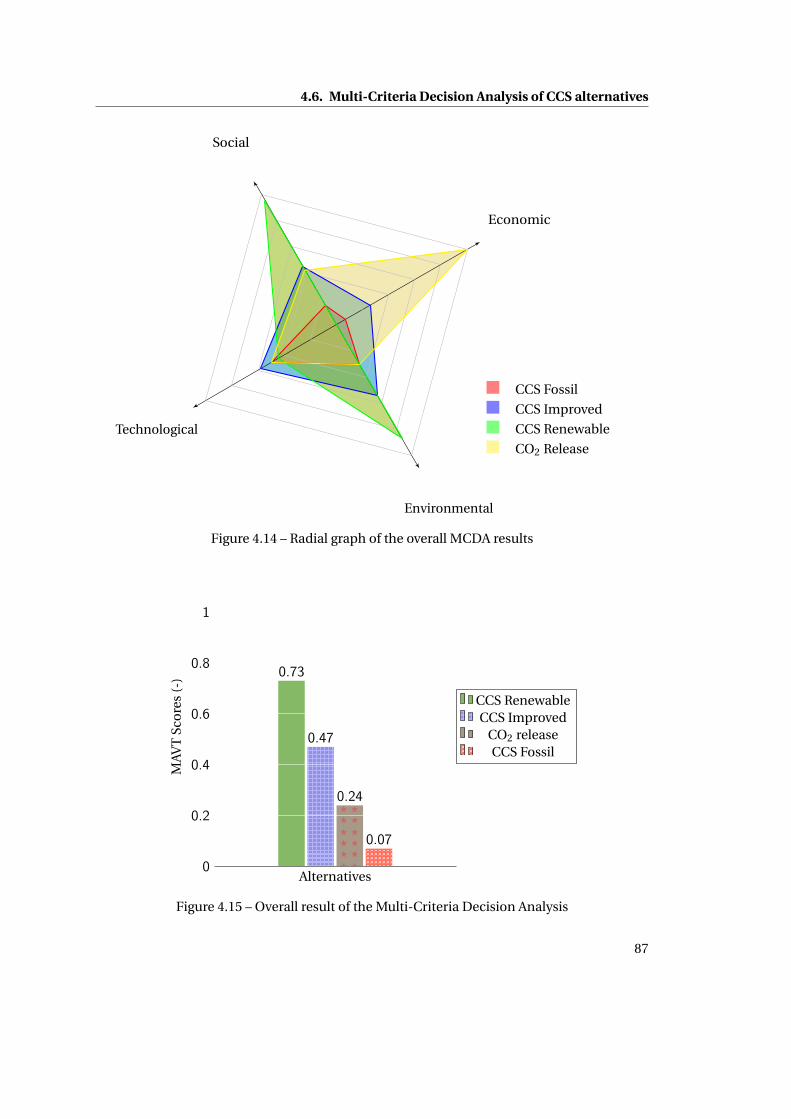
4.6. Multi-Criteria Decision Analysis of CCS alternatives
Economic
Social
Technological
Environmental
CCS Fossil
CCS Improved
CCS Renewable
CO2 Release
Figure 4.14 – Radial graph of the overall MCDA results
Alternatives0
0.2
0.4
0.6
0.8
1
0.73
0.47
0.24
0.07
MAV
TSc
ore
s(-
)
CCS RenewableCCS Improved
CO2 releaseCCS Fossil
Figure 4.15 – Overall result of the Multi-Criteria Decision Analysis
87
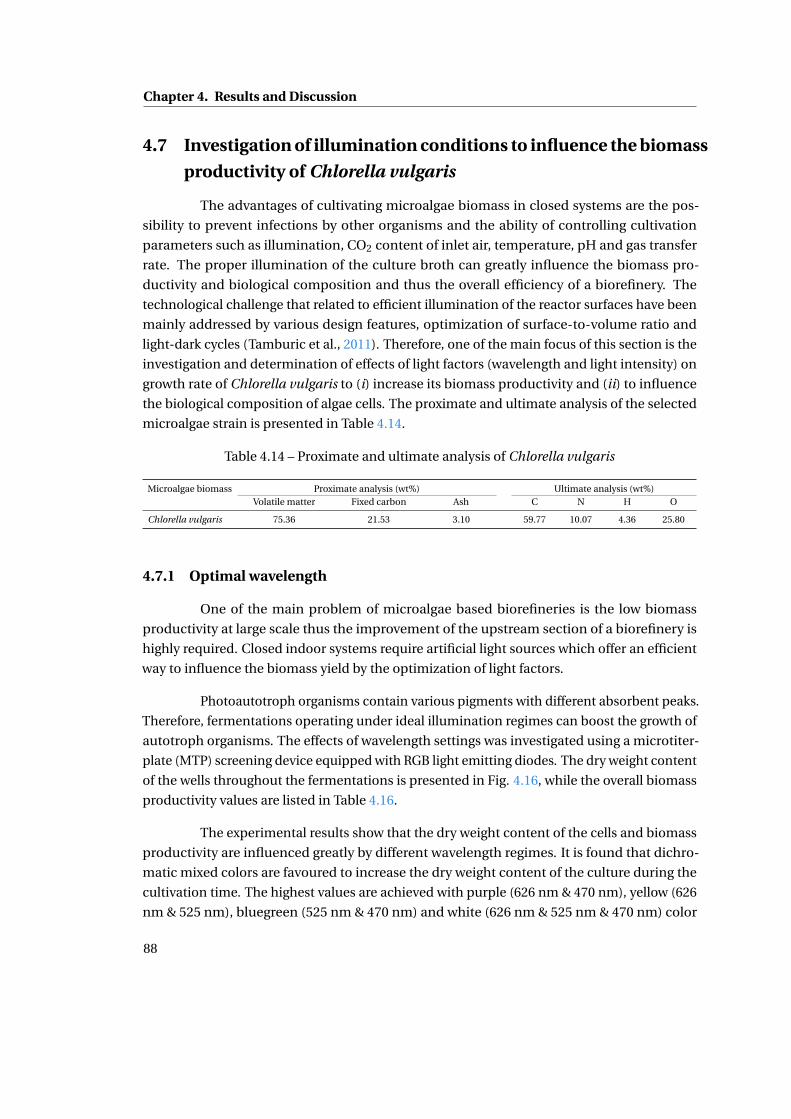
Chapter 4. Results and Discussion
4.7 Investigation of illumination conditions to influence the biomass
productivity of Chlorella vulgaris
The advantages of cultivating microalgae biomass in closed systems are the pos-
sibility to prevent infections by other organisms and the ability of controlling cultivation
parameters such as illumination, CO2 content of inlet air, temperature, pH and gas transfer
rate. The proper illumination of the culture broth can greatly influence the biomass pro-
ductivity and biological composition and thus the overall efficiency of a biorefinery. The
technological challenge that related to efficient illumination of the reactor surfaces have been
mainly addressed by various design features, optimization of surface-to-volume ratio and
light-dark cycles (Tamburic et al., 2011). Therefore, one of the main focus of this section is the
investigation and determination of effects of light factors (wavelength and light intensity) on
growth rate of Chlorella vulgaris to (i) increase its biomass productivity and (ii) to influence
the biological composition of algae cells. The proximate and ultimate analysis of the selected
microalgae strain is presented in Table 4.14.
Table 4.14 – Proximate and ultimate analysis of Chlorella vulgaris
Microalgae biomass Proximate analysis (wt%) Ultimate analysis (wt%)Volatile matter Fixed carbon Ash C N H O
Chlorella vulgaris 75.36 21.53 3.10 59.77 10.07 4.36 25.80
4.7.1 Optimal wavelength
One of the main problem of microalgae based biorefineries is the low biomass
productivity at large scale thus the improvement of the upstream section of a biorefinery is
highly required. Closed indoor systems require artificial light sources which offer an efficient
way to influence the biomass yield by the optimization of light factors.
Photoautotroph organisms contain various pigments with different absorbent peaks.
Therefore, fermentations operating under ideal illumination regimes can boost the growth of
autotroph organisms. The effects of wavelength settings was investigated using a microtiter-
plate (MTP) screening device equipped with RGB light emitting diodes. The dry weight content
of the wells throughout the fermentations is presented in Fig. 4.16, while the overall biomass
productivity values are listed in Table 4.16.
The experimental results show that the dry weight content of the cells and biomass
productivity are influenced greatly by different wavelength regimes. It is found that dichro-
matic mixed colors are favoured to increase the dry weight content of the culture during the
cultivation time. The highest values are achieved with purple (626 nm & 470 nm), yellow (626
nm & 525 nm), bluegreen (525 nm & 470 nm) and white (626 nm & 525 nm & 470 nm) color
88
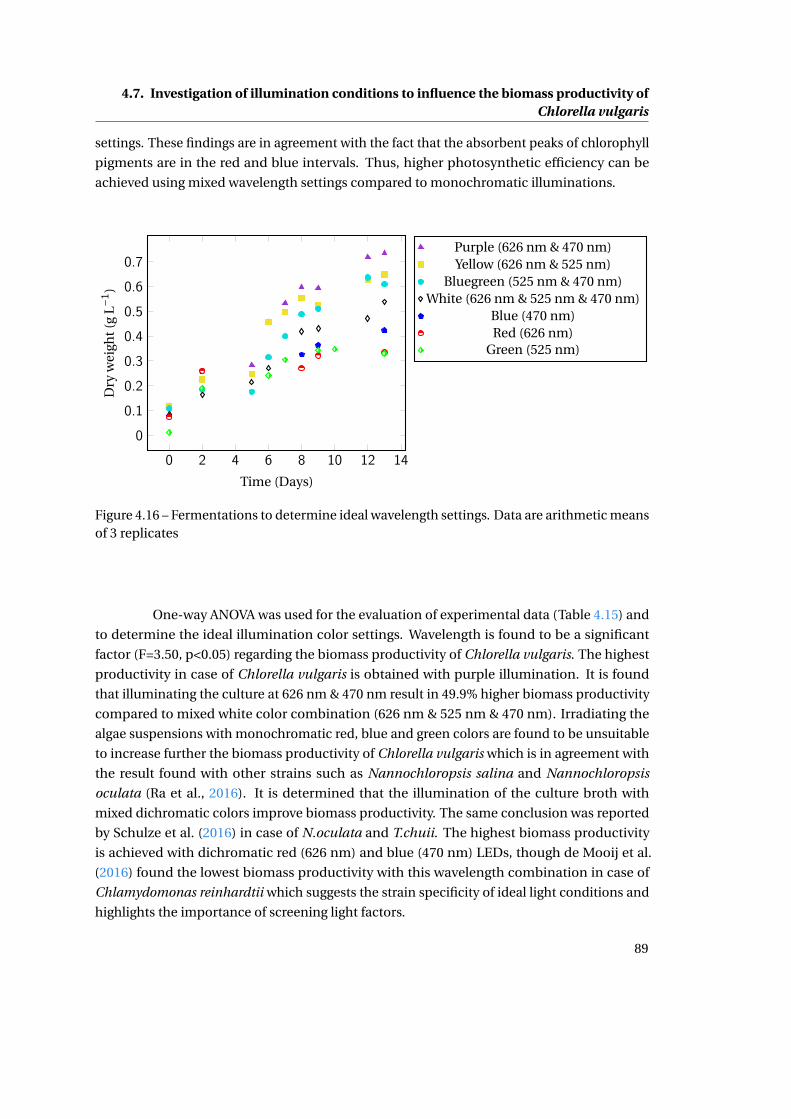
4.7. Investigation of illumination conditions to influence the biomass productivity ofChlorella vulgaris
settings. These findings are in agreement with the fact that the absorbent peaks of chlorophyll
pigments are in the red and blue intervals. Thus, higher photosynthetic efficiency can be
achieved using mixed wavelength settings compared to monochromatic illuminations.
0 2 4 6 8 10 12 14
0
0.1
0.2
0.3
0.4
0.5
0.6
0.7
Time (Days)
Dry
wei
ght(
gL−
1)
Purple (626 nm & 470 nm)Yellow (626 nm & 525 nm)
Bluegreen (525 nm & 470 nm)White (626 nm & 525 nm & 470 nm)
Blue (470 nm)Red (626 nm)
Green (525 nm)
Figure 4.16 – Fermentations to determine ideal wavelength settings. Data are arithmetic meansof 3 replicates
One-way ANOVA was used for the evaluation of experimental data (Table 4.15) and
to determine the ideal illumination color settings. Wavelength is found to be a significant
factor (F=3.50, p<0.05) regarding the biomass productivity of Chlorella vulgaris. The highest
productivity in case of Chlorella vulgaris is obtained with purple illumination. It is found
that illuminating the culture at 626 nm & 470 nm result in 49.9% higher biomass productivity
compared to mixed white color combination (626 nm & 525 nm & 470 nm). Irradiating the
algae suspensions with monochromatic red, blue and green colors are found to be unsuitable
to increase further the biomass productivity of Chlorella vulgaris which is in agreement with
the result found with other strains such as Nannochloropsis salina and Nannochloropsis
oculata (Ra et al., 2016). It is determined that the illumination of the culture broth with
mixed dichromatic colors improve biomass productivity. The same conclusion was reported
by Schulze et al. (2016) in case of N.oculata and T.chuii. The highest biomass productivity
is achieved with dichromatic red (626 nm) and blue (470 nm) LEDs, though de Mooij et al.
(2016) found the lowest biomass productivity with this wavelength combination in case of
Chlamydomonas reinhardtii which suggests the strain specificity of ideal light conditions and
highlights the importance of screening light factors.
89
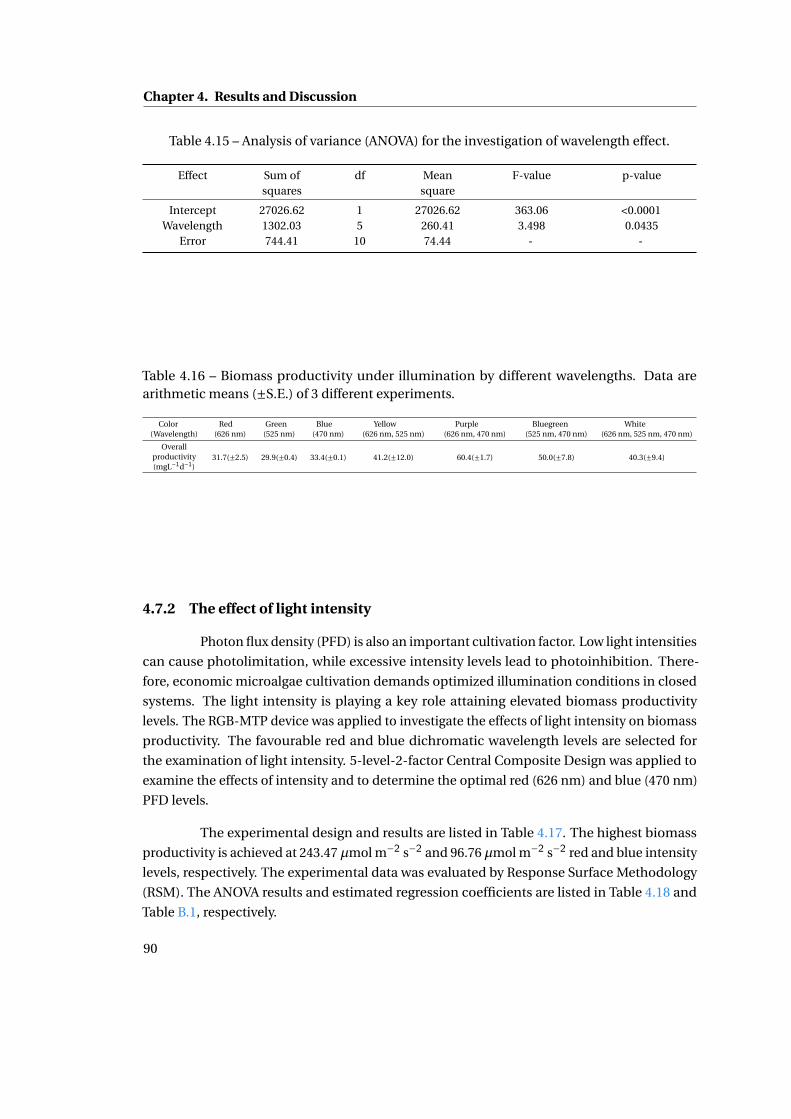
Chapter 4. Results and Discussion
Table 4.15 – Analysis of variance (ANOVA) for the investigation of wavelength effect.
Effect Sum ofsquares
df Meansquare
F-value p-value
Intercept 27026.62 1 27026.62 363.06 <0.0001Wavelength 1302.03 5 260.41 3.498 0.0435
Error 744.41 10 74.44 - -
Table 4.16 – Biomass productivity under illumination by different wavelengths. Data arearithmetic means (±S.E.) of 3 different experiments.
Color(Wavelength)
Red(626 nm)
Green(525 nm)
Blue(470 nm)
Yellow(626 nm, 525 nm)
Purple(626 nm, 470 nm)
Bluegreen(525 nm, 470 nm)
White(626 nm, 525 nm, 470 nm)
Overallproductivity(mgL−1d−1)
31.7(±2.5) 29.9(±0.4) 33.4(±0.1) 41.2(±12.0) 60.4(±1.7) 50.0(±7.8) 40.3(±9.4)
4.7.2 The effect of light intensity
Photon flux density (PFD) is also an important cultivation factor. Low light intensities
can cause photolimitation, while excessive intensity levels lead to photoinhibition. There-
fore, economic microalgae cultivation demands optimized illumination conditions in closed
systems. The light intensity is playing a key role attaining elevated biomass productivity
levels. The RGB-MTP device was applied to investigate the effects of light intensity on biomass
productivity. The favourable red and blue dichromatic wavelength levels are selected for
the examination of light intensity. 5-level-2-factor Central Composite Design was applied to
examine the effects of intensity and to determine the optimal red (626 nm) and blue (470 nm)
PFD levels.
The experimental design and results are listed in Table 4.17. The highest biomass
productivity is achieved at 243.47 µmol m−2 s−2 and 96.76 µmol m−2 s−2 red and blue intensity
levels, respectively. The experimental data was evaluated by Response Surface Methodology
(RSM). The ANOVA results and estimated regression coefficients are listed in Table 4.18 and
Table B.1, respectively.
90
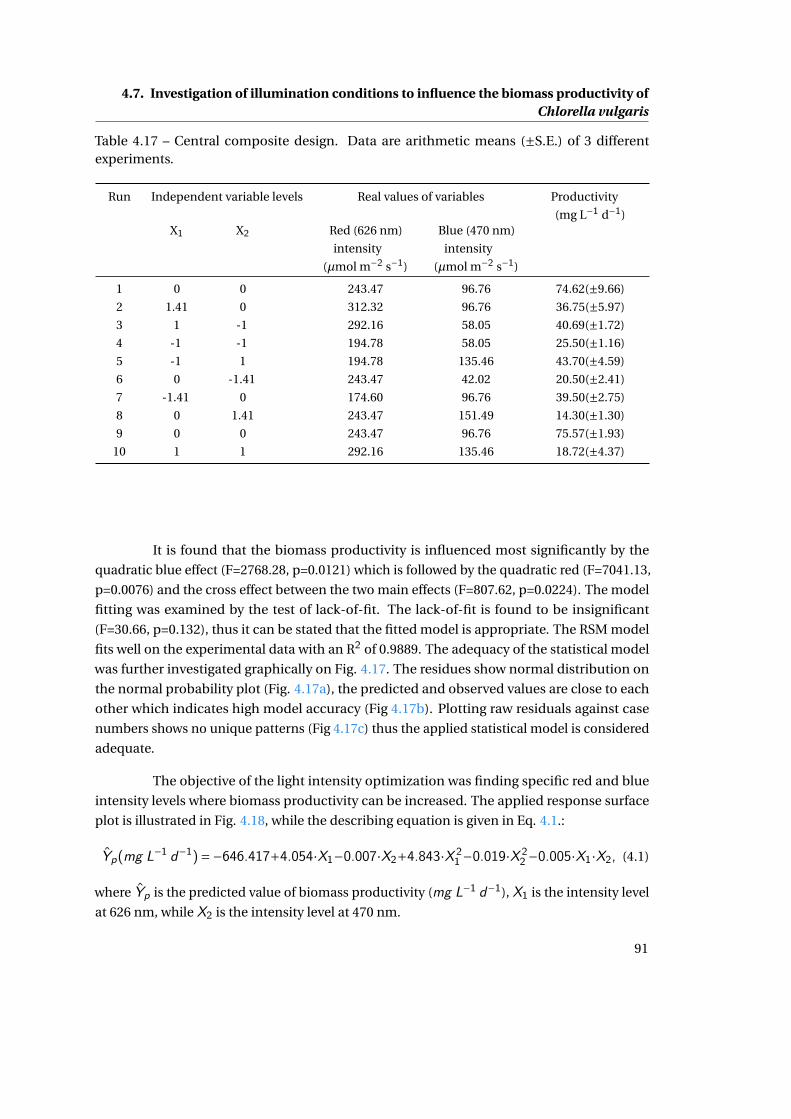
4.7. Investigation of illumination conditions to influence the biomass productivity ofChlorella vulgaris
Table 4.17 – Central composite design. Data are arithmetic means (±S.E.) of 3 differentexperiments.
Run Independent variable levels Real values of variables Productivity
(mg L−1 d−1)X1 X2 Red (626 nm)
intensity
(µmol m−2 s−1)
Blue (470 nm)
intensity
(µmol m−2 s−1)
1 0 0 243.47 96.76 74.62(±9.66)
2 1.41 0 312.32 96.76 36.75(±5.97)
3 1 -1 292.16 58.05 40.69(±1.72)
4 -1 -1 194.78 58.05 25.50(±1.16)
5 -1 1 194.78 135.46 43.70(±4.59)
6 0 -1.41 243.47 42.02 20.50(±2.41)
7 -1.41 0 174.60 96.76 39.50(±2.75)
8 0 1.41 243.47 151.49 14.30(±1.30)
9 0 0 243.47 96.76 75.57(±1.93)
10 1 1 292.16 135.46 18.72(±4.37)
It is found that the biomass productivity is influenced most significantly by the
quadratic blue effect (F=2768.28, p=0.0121) which is followed by the quadratic red (F=7041.13,
p=0.0076) and the cross effect between the two main effects (F=807.62, p=0.0224). The model
fitting was examined by the test of lack-of-fit. The lack-of-fit is found to be insignificant
(F=30.66, p=0.132), thus it can be stated that the fitted model is appropriate. The RSM model
fits well on the experimental data with an R2 of 0.9889. The adequacy of the statistical model
was further investigated graphically on Fig. 4.17. The residues show normal distribution on
the normal probability plot (Fig. 4.17a), the predicted and observed values are close to each
other which indicates high model accuracy (Fig 4.17b). Plotting raw residuals against case
numbers shows no unique patterns (Fig 4.17c) thus the applied statistical model is considered
adequate.
The objective of the light intensity optimization was finding specific red and blue
intensity levels where biomass productivity can be increased. The applied response surface
plot is illustrated in Fig. 4.18, while the describing equation is given in Eq. 4.1.:
Yp(mg L−1 d−1)=−646.417+4.054·X1−0.007·X2+4.843·X 21 −0.019·X 2
2 −0.005·X1·X2, (4.1)
where Yp is the predicted value of biomass productivity (mg L−1 d−1), X1 is the intensity level
at 626 nm, while X2 is the intensity level at 470 nm.
91
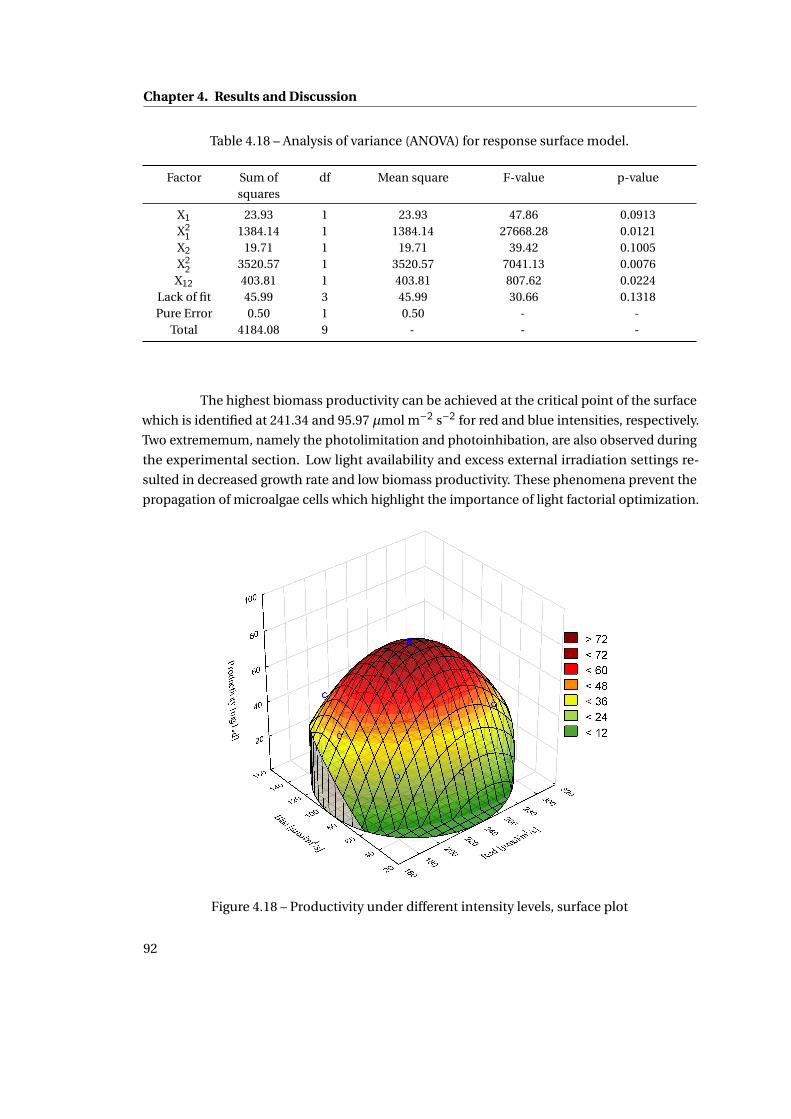
Chapter 4. Results and Discussion
Table 4.18 – Analysis of variance (ANOVA) for response surface model.
Factor Sum ofsquares
df Mean square F-value p-value
X1 23.93 1 23.93 47.86 0.0913X21 1384.14 1 1384.14 27668.28 0.0121
X2 19.71 1 19.71 39.42 0.1005X22 3520.57 1 3520.57 7041.13 0.0076
X12 403.81 1 403.81 807.62 0.0224Lack of fit 45.99 3 45.99 30.66 0.1318Pure Error 0.50 1 0.50 - -
Total 4184.08 9 - - -
The highest biomass productivity can be achieved at the critical point of the surface
which is identified at 241.34 and 95.97 µmol m−2 s−2 for red and blue intensities, respectively.
Two extrememum, namely the photolimitation and photoinhibation, are also observed during
the experimental section. Low light availability and excess external irradiation settings re-
sulted in decreased growth rate and low biomass productivity. These phenomena prevent the
propagation of microalgae cells which highlight the importance of light factorial optimization.
Figure 4.18 – Productivity under different intensity levels, surface plot
92
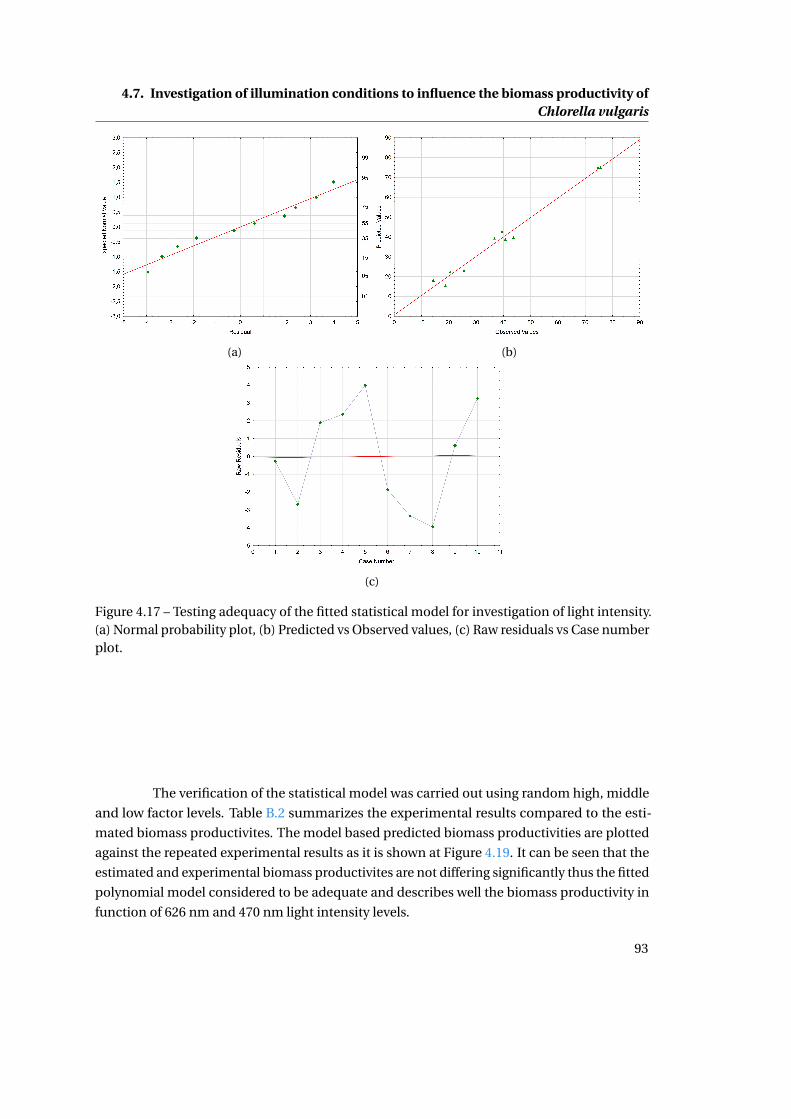
4.7. Investigation of illumination conditions to influence the biomass productivity ofChlorella vulgaris
(a) (b)
(c)
Figure 4.17 – Testing adequacy of the fitted statistical model for investigation of light intensity.(a) Normal probability plot, (b) Predicted vs Observed values, (c) Raw residuals vs Case numberplot.
The verification of the statistical model was carried out using random high, middle
and low factor levels. Table B.2 summarizes the experimental results compared to the esti-
mated biomass productivites. The model based predicted biomass productivities are plotted
against the repeated experimental results as it is shown at Figure 4.19. It can be seen that the
estimated and experimental biomass productivites are not differing significantly thus the fitted
polynomial model considered to be adequate and describes well the biomass productivity in
function of 626 nm and 470 nm light intensity levels.
93
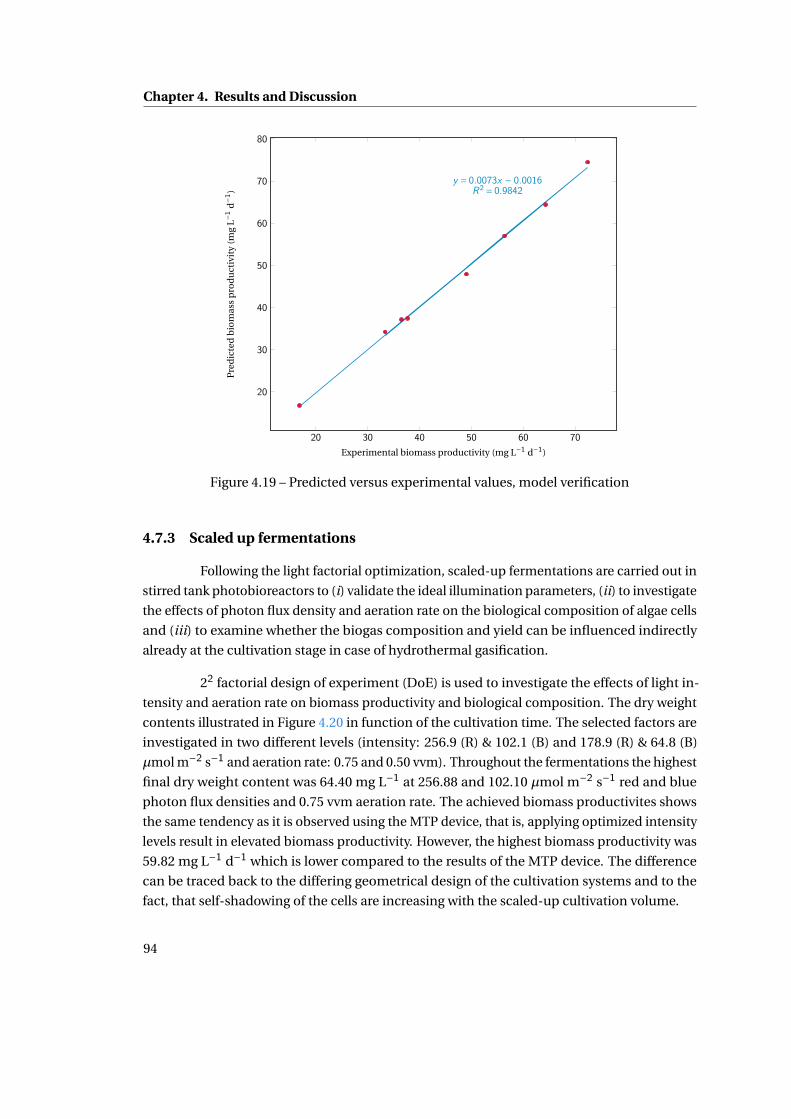
Chapter 4. Results and Discussion
20 30 40 50 60 70
20
30
40
50
60
70
80
y = 0.0073x − 0.0016R2 = 0.9842
Experimental biomass productivity (mg L−1 d−1)
Pre
dic
ted
bio
mas
sp
rod
uct
ivit
y(m
gL−
1d−1
)
Figure 4.19 – Predicted versus experimental values, model verification
4.7.3 Scaled up fermentations
Following the light factorial optimization, scaled-up fermentations are carried out in
stirred tank photobioreactors to (i) validate the ideal illumination parameters, (ii) to investigate
the effects of photon flux density and aeration rate on the biological composition of algae cells
and (iii) to examine whether the biogas composition and yield can be influenced indirectly
already at the cultivation stage in case of hydrothermal gasification.
22 factorial design of experiment (DoE) is used to investigate the effects of light in-
tensity and aeration rate on biomass productivity and biological composition. The dry weight
contents illustrated in Figure 4.20 in function of the cultivation time. The selected factors are
investigated in two different levels (intensity: 256.9 (R) & 102.1 (B) and 178.9 (R) & 64.8 (B)
µmol m−2 s−1 and aeration rate: 0.75 and 0.50 vvm). Throughout the fermentations the highest
final dry weight content was 64.40 mg L−1 at 256.88 and 102.10 µmol m−2 s−1 red and blue
photon flux densities and 0.75 vvm aeration rate. The achieved biomass productivites shows
the same tendency as it is observed using the MTP device, that is, applying optimized intensity
levels result in elevated biomass productivity. However, the highest biomass productivity was
59.82 mg L−1 d−1 which is lower compared to the results of the MTP device. The difference
can be traced back to the differing geometrical design of the cultivation systems and to the
fact, that self-shadowing of the cells are increasing with the scaled-up cultivation volume.
94
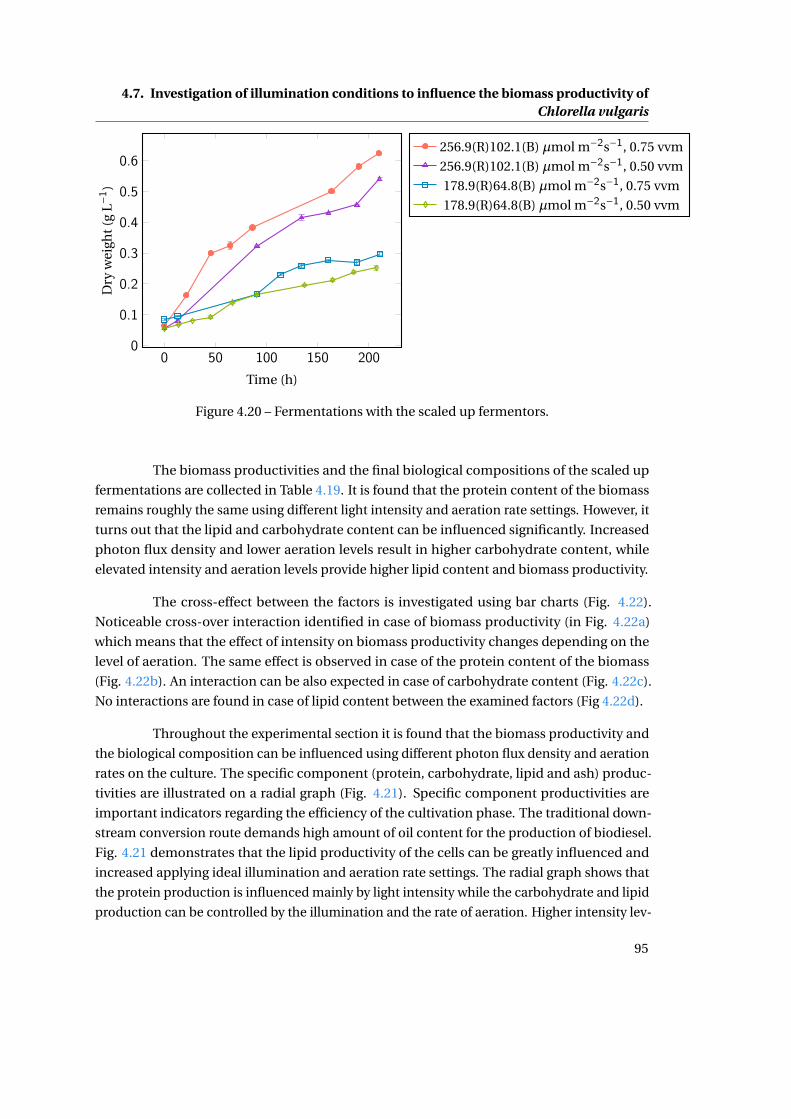
4.7. Investigation of illumination conditions to influence the biomass productivity ofChlorella vulgaris
0 50 100 150 2000
0.1
0.2
0.3
0.4
0.5
0.6
Time (h)
Dry
wei
ght(
gL−
1)
256.9(R)102.1(B) µmol m−2s−1, 0.75 vvm
256.9(R)102.1(B) µmol m−2s−1, 0.50 vvm
178.9(R)64.8(B) µmol m−2s−1, 0.75 vvm
178.9(R)64.8(B) µmol m−2s−1, 0.50 vvm
Figure 4.20 – Fermentations with the scaled up fermentors.
The biomass productivities and the final biological compositions of the scaled up
fermentations are collected in Table 4.19. It is found that the protein content of the biomass
remains roughly the same using different light intensity and aeration rate settings. However, it
turns out that the lipid and carbohydrate content can be influenced significantly. Increased
photon flux density and lower aeration levels result in higher carbohydrate content, while
elevated intensity and aeration levels provide higher lipid content and biomass productivity.
The cross-effect between the factors is investigated using bar charts (Fig. 4.22).
Noticeable cross-over interaction identified in case of biomass productivity (in Fig. 4.22a)
which means that the effect of intensity on biomass productivity changes depending on the
level of aeration. The same effect is observed in case of the protein content of the biomass
(Fig. 4.22b). An interaction can be also expected in case of carbohydrate content (Fig. 4.22c).
No interactions are found in case of lipid content between the examined factors (Fig 4.22d).
Throughout the experimental section it is found that the biomass productivity and
the biological composition can be influenced using different photon flux density and aeration
rates on the culture. The specific component (protein, carbohydrate, lipid and ash) produc-
tivities are illustrated on a radial graph (Fig. 4.21). Specific component productivities are
important indicators regarding the efficiency of the cultivation phase. The traditional down-
stream conversion route demands high amount of oil content for the production of biodiesel.
Fig. 4.21 demonstrates that the lipid productivity of the cells can be greatly influenced and
increased applying ideal illumination and aeration rate settings. The radial graph shows that
the protein production is influenced mainly by light intensity while the carbohydrate and lipid
production can be controlled by the illumination and the rate of aeration. Higher intensity lev-
95
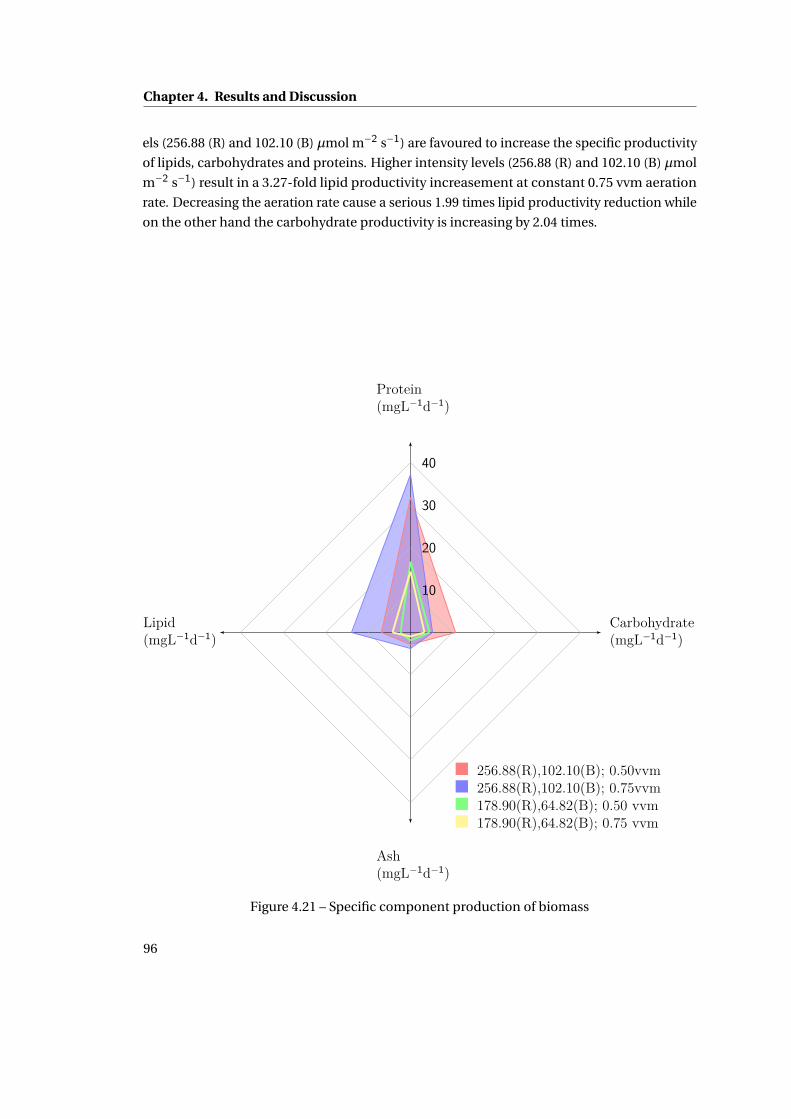
Chapter 4. Results and Discussion
els (256.88 (R) and 102.10 (B) µmol m−2 s−1) are favoured to increase the specific productivity
of lipids, carbohydrates and proteins. Higher intensity levels (256.88 (R) and 102.10 (B) µmol
m−2 s−1) result in a 3.27-fold lipid productivity increasement at constant 0.75 vvm aeration
rate. Decreasing the aeration rate cause a serious 1.99 times lipid productivity reduction while
on the other hand the carbohydrate productivity is increasing by 2.04 times.
Carbohydrate(mgL−1d−1)
Protein(mgL−1d−1)
Lipid(mgL−1d−1)
Ash(mgL−1d−1)
10
20
30
40
256.88(R),102.10(B); 0.50vvm256.88(R),102.10(B); 0.75vvm178.90(R),64.82(B); 0.50 vvm178.90(R),64.82(B); 0.75 vvm
Figure 1: Specific component production of biomass
1
Figure 4.21 – Specific component production of biomass
96
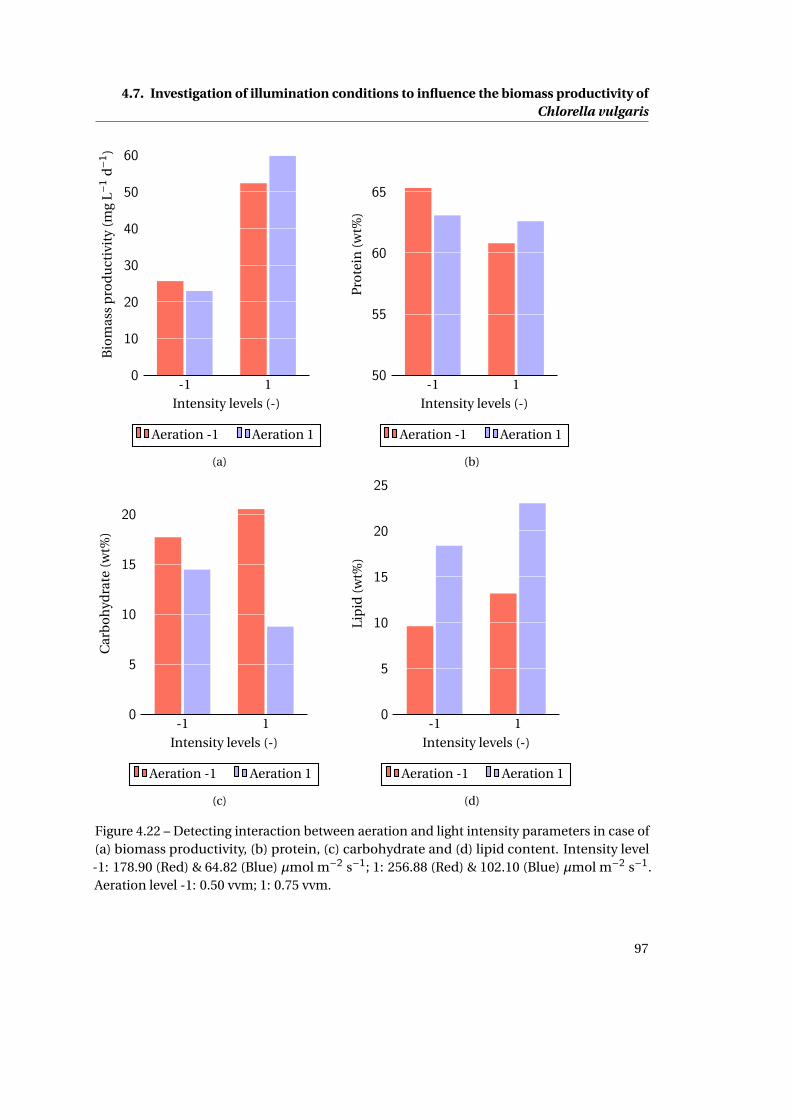
4.7. Investigation of illumination conditions to influence the biomass productivity ofChlorella vulgaris
-1 10
10
20
30
40
50
60
Intensity levels (-)
Bio
mas
sp
rod
uct
ivit
y(m
gL−
1d−1
)
Aeration -1 Aeration 1
(a)
-1 150
55
60
65
Intensity levels (-)
Pro
tein
(wt%
)
Aeration -1 Aeration 1
(b)
-1 10
5
10
15
20
Intensity levels (-)
Car
bo
hyd
rate
(wt%
)
Aeration -1 Aeration 1
(c)
-1 10
5
10
15
20
25
Intensity levels (-)
Lip
id(w
t%)
Aeration -1 Aeration 1
(d)
Figure 4.22 – Detecting interaction between aeration and light intensity parameters in case of(a) biomass productivity, (b) protein, (c) carbohydrate and (d) lipid content. Intensity level-1: 178.90 (Red) & 64.82 (Blue) µmol m−2 s−1; 1: 256.88 (Red) & 102.10 (Blue) µmol m−2 s−1.Aeration level -1: 0.50 vvm; 1: 0.75 vvm.
97
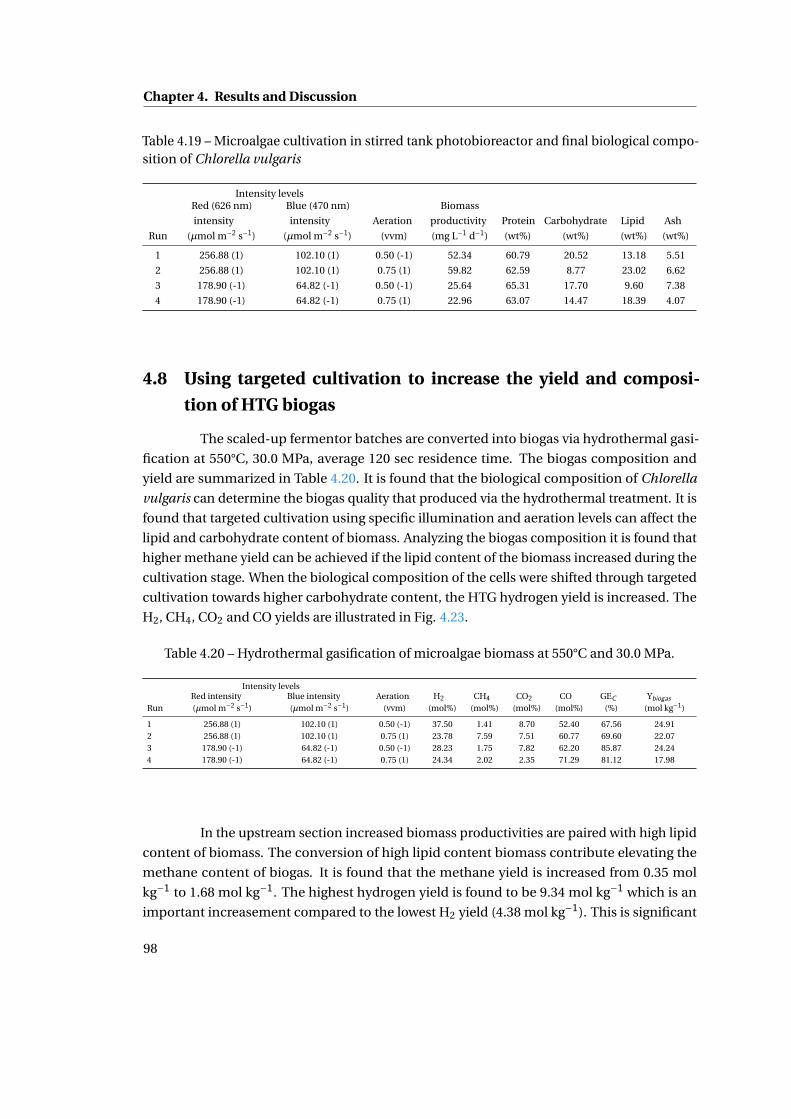
Chapter 4. Results and Discussion
Table 4.19 – Microalgae cultivation in stirred tank photobioreactor and final biological compo-sition of Chlorella vulgaris
Intensity levels
Run
Red (626 nm)
intensity
(µmol m−2 s−1)
Blue (470 nm)
intensity
(µmol m−2 s−1)
Aeration
(vvm)
Biomass
productivity
(mg L−1 d−1)
Protein
(wt%)
Carbohydrate
(wt%)
Lipid
(wt%)
Ash
(wt%)
1 256.88 (1) 102.10 (1) 0.50 (-1) 52.34 60.79 20.52 13.18 5.51
2 256.88 (1) 102.10 (1) 0.75 (1) 59.82 62.59 8.77 23.02 6.62
3 178.90 (-1) 64.82 (-1) 0.50 (-1) 25.64 65.31 17.70 9.60 7.38
4 178.90 (-1) 64.82 (-1) 0.75 (1) 22.96 63.07 14.47 18.39 4.07
4.8 Using targeted cultivation to increase the yield and composi-
tion of HTG biogas
The scaled-up fermentor batches are converted into biogas via hydrothermal gasi-
fication at 550°C, 30.0 MPa, average 120 sec residence time. The biogas composition and
yield are summarized in Table 4.20. It is found that the biological composition of Chlorella
vulgaris can determine the biogas quality that produced via the hydrothermal treatment. It is
found that targeted cultivation using specific illumination and aeration levels can affect the
lipid and carbohydrate content of biomass. Analyzing the biogas composition it is found that
higher methane yield can be achieved if the lipid content of the biomass increased during the
cultivation stage. When the biological composition of the cells were shifted through targeted
cultivation towards higher carbohydrate content, the HTG hydrogen yield is increased. The
H2, CH4, CO2 and CO yields are illustrated in Fig. 4.23.
Table 4.20 – Hydrothermal gasification of microalgae biomass at 550°C and 30.0 MPa.
Intensity levels
RunRed intensity(µmol m−2 s−1)
Blue intensity(µmol m−2 s−1)
Aeration(vvm)
H2
(mol%)CH4
(mol%)CO2
(mol%)CO
(mol%)GEC
(%)Ybiogas
(mol kg−1)
1 256.88 (1) 102.10 (1) 0.50 (-1) 37.50 1.41 8.70 52.40 67.56 24.912 256.88 (1) 102.10 (1) 0.75 (1) 23.78 7.59 7.51 60.77 69.60 22.073 178.90 (-1) 64.82 (-1) 0.50 (-1) 28.23 1.75 7.82 62.20 85.87 24.244 178.90 (-1) 64.82 (-1) 0.75 (1) 24.34 2.02 2.35 71.29 81.12 17.98
In the upstream section increased biomass productivities are paired with high lipid
content of biomass. The conversion of high lipid content biomass contribute elevating the
methane content of biogas. It is found that the methane yield is increased from 0.35 mol
kg−1 to 1.68 mol kg−1. The highest hydrogen yield is found to be 9.34 mol kg−1 which is an
important increasement compared to the lowest H2 yield (4.38 mol kg−1). This is significant
98
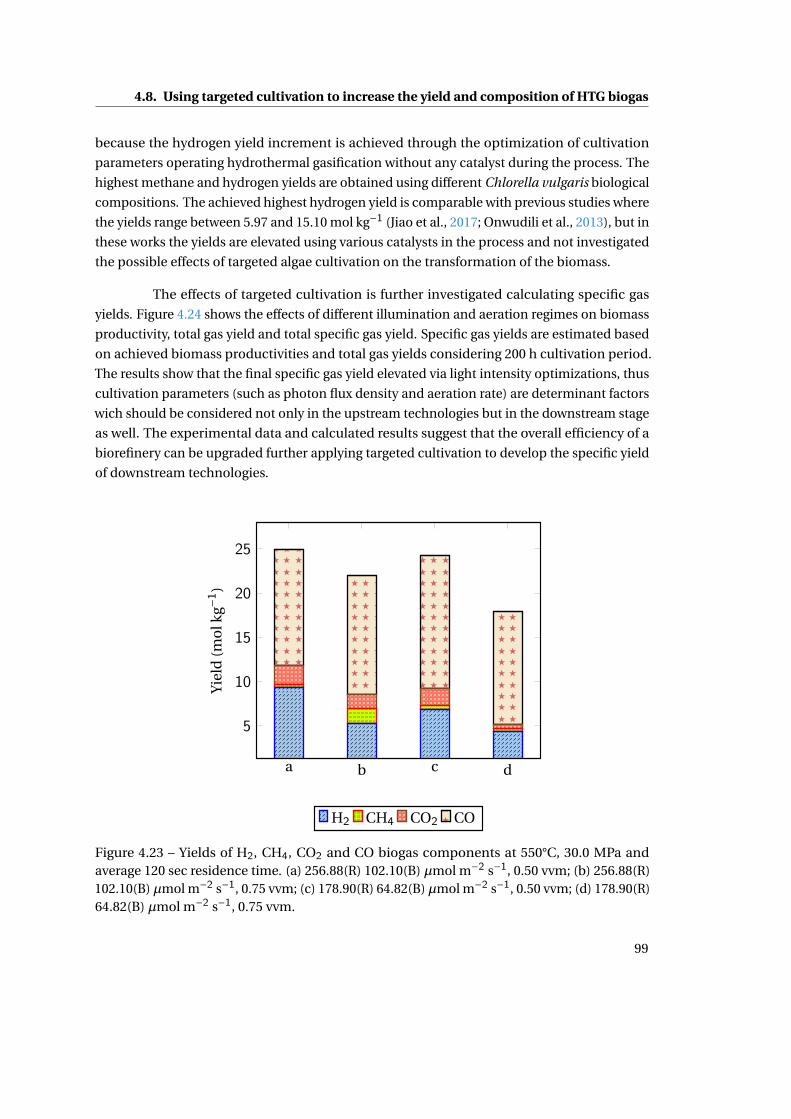
4.8. Using targeted cultivation to increase the yield and composition of HTG biogas
because the hydrogen yield increment is achieved through the optimization of cultivation
parameters operating hydrothermal gasification without any catalyst during the process. The
highest methane and hydrogen yields are obtained using different Chlorella vulgaris biological
compositions. The achieved highest hydrogen yield is comparable with previous studies where
the yields range between 5.97 and 15.10 mol kg−1 (Jiao et al., 2017; Onwudili et al., 2013), but in
these works the yields are elevated using various catalysts in the process and not investigated
the possible effects of targeted algae cultivation on the transformation of the biomass.
The effects of targeted cultivation is further investigated calculating specific gas
yields. Figure 4.24 shows the effects of different illumination and aeration regimes on biomass
productivity, total gas yield and total specific gas yield. Specific gas yields are estimated based
on achieved biomass productivities and total gas yields considering 200 h cultivation period.
The results show that the final specific gas yield elevated via light intensity optimizations, thus
cultivation parameters (such as photon flux density and aeration rate) are determinant factors
wich should be considered not only in the upstream technologies but in the downstream stage
as well. The experimental data and calculated results suggest that the overall efficiency of a
biorefinery can be upgraded further applying targeted cultivation to develop the specific yield
of downstream technologies.
a b c d
5
10
15
20
25
Yie
ld(m
olk
g−1
)
H2 CH4 CO2 CO
Figure 4.23 – Yields of H2, CH4, CO2 and CO biogas components at 550°C, 30.0 MPa andaverage 120 sec residence time. (a) 256.88(R) 102.10(B) µmol m−2 s−1, 0.50 vvm; (b) 256.88(R)102.10(B) µmol m−2 s−1, 0.75 vvm; (c) 178.90(R) 64.82(B) µmol m−2 s−1, 0.50 vvm; (d) 178.90(R)64.82(B) µmol m−2 s−1, 0.75 vvm.
99
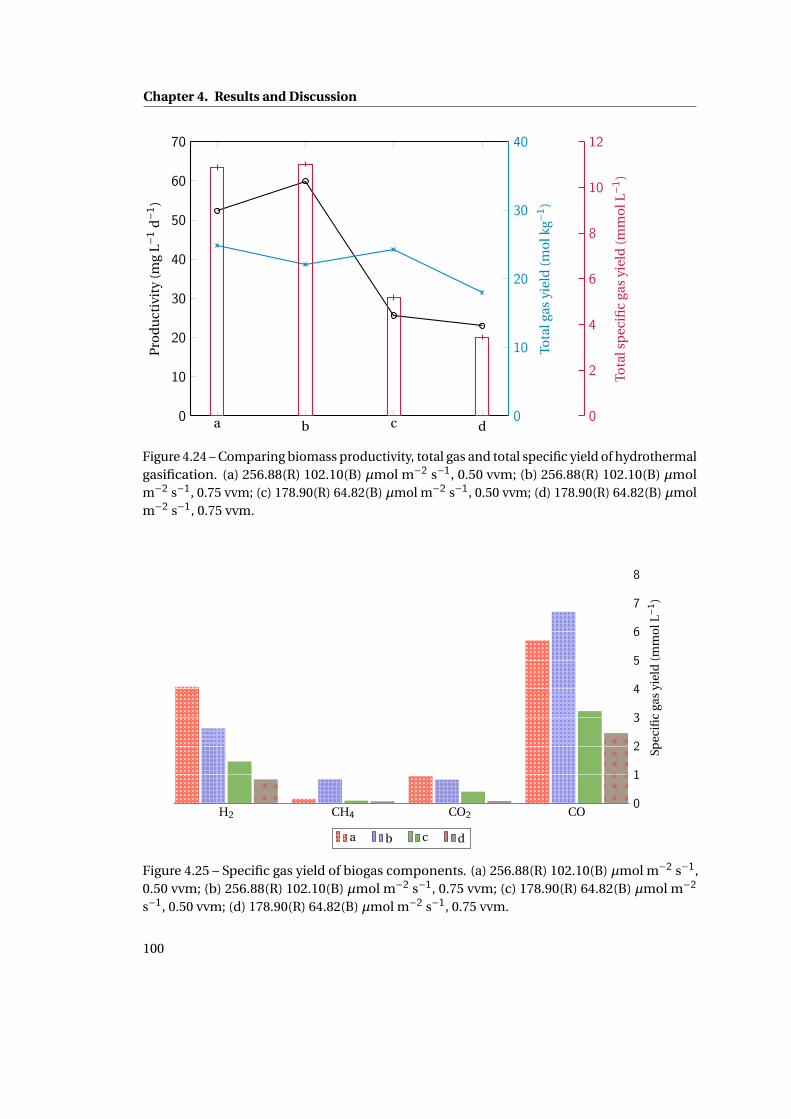
Chapter 4. Results and Discussion
a b c d0
10
20
30
40
50
60
70P
rod
uct
ivit
y(m
gL−
1d−1
)
0
10
20
30
40
Tota
lgas
yiel
d(m
olk
g−1
)
0
2
4
6
8
10
12
Tota
lsp
ecifi
cga
syi
eld
(mm
olL
−1)
Figure 4.24 – Comparing biomass productivity, total gas and total specific yield of hydrothermalgasification. (a) 256.88(R) 102.10(B) µmol m−2 s−1, 0.50 vvm; (b) 256.88(R) 102.10(B) µmolm−2 s−1, 0.75 vvm; (c) 178.90(R) 64.82(B) µmol m−2 s−1, 0.50 vvm; (d) 178.90(R) 64.82(B) µmolm−2 s−1, 0.75 vvm.
H2 CH4 CO2 CO0
1
2
3
4
5
6
7
8
Spec
ific
gas
yiel
d(m
mo
lL−1
)
a b c d
Figure 4.25 – Specific gas yield of biogas components. (a) 256.88(R) 102.10(B) µmol m−2 s−1,0.50 vvm; (b) 256.88(R) 102.10(B) µmol m−2 s−1, 0.75 vvm; (c) 178.90(R) 64.82(B) µmol m−2
s−1, 0.50 vvm; (d) 178.90(R) 64.82(B) µmol m−2 s−1, 0.75 vvm.
100

4.8. Using targeted cultivation to increase the yield and composition of HTG biogas
The specific gas component yields are presented in Figure 4.25 in function of dif-
ferent illumination and aeration settings. It is demonstrated that the targeted cultivation
indirectly influence the obtainable amount of fuel gases (CH4, synthesis gas (H2/CO)). As
a consequence, targeted cultivation plays key role elevating the overall efficiency of a third
generation’s biorefinery.
101

5 Conclusions
The cradle-to-grave energetic analysis shows that the net energy ratio of an algae
based biorefinery can be higher than 1, if the flue gas can be injected directly into the culture
broth and transformation of biomass involves the application of hydrothermal treatment. The
energetic bottlenecks of biorefinery alternatives are identified, these are the drying process
(44.6%), MEA based carbon dioxide absorption (22.7%), atmospheric gasification (12.1%)
and cultivation step (8.7%) in case of the traditional dry route while CO2 absorption (40.4%),
hydrothermal liquefaction unit (21.7%) and cultivation step (15.4%) are spotted in case of the
wet/hydrothermal route. The determined energy flows demonstrate that the dry downstream
pathway has significantly higher energy demand compared to the wet route. The highest net
energy ratio is found to be 1.137 in the case of tubular photobioreactor cultivation system and
through the transformation of wet microalgae biomass via hydrothermal conversion.
The life cycle analysis of the carbon capture and storage technology shows that
the environmental impacts of CCS using monoethanolamine absorbent are more beneficial
from the viewpoint of carbon footprint compared to the uncontrolled CO2 release if process
improvement (-550.4 kg CO2, eq) or renewable energy sources are applied (-642.0 kg CO2, eq).
The application of multi-perspective life cycle impact assessment methods demonstrate that
applying renewable energy sources reduce the environmental damages of CCS technology
by 3.22- and 3.43-times in the case of IMPACT 2002+ and Eco-indicator 99 LCIA methods,
respectively. The highest environmental impact is associated with the absorbent regeneration
process in case of every CCS alternatives. The performed PESTLE analysis shows that beyond
the environmental factors, economic, social and technological factors also affect the CCS
process chain. The Multi-Criteria Decision Analysis demonstrates that among the investigated
CCS alternatives the renewable based technology is the best carbon capture alternative in
regard of multiple aspects.
The light factorial optimization of Chlorella vulgaris cultivation results in a biomass
103
Chapter 5. Conclusions
productivity increment from 14.30 mg L−1 d−1 to 75.57 mg L−1 d−1 in the MTP system. The
highest microalgae productivity is attained using red (626 nm) and blue (470 nm) color illumi-
nations at 243.5 and 96.8 µmol m−2 s−1. Scaled up fermentations at stirred tank photobiore-
actors shows that the biological composition can be shifted by changing the levels of light
illumination and aeration rate. It is found that these parameters affect the overall efficiency of
a biorefinery.
It is demonstrated that the yields of hydrothermal gasification and the produced
biogas composition can be influenced by the illumination conditions throughout the culti-
vation stage. During the experimental section high H2 yield is achieved (4.38-9.34 mol kg−1)
which is comparable with literature data where the HTG of the feedstock was performed in the
presence of various heterogeneous and homogeneous catalysts.
104
6 Major New Results
Thesis 1 [I, IV, V, VII]
I determined the energy flow of autotroph microalgae based biorefineries containing
of different cultivation systems and downstream processing routes. I identified their bottle-
necks that are mainly responsible for the efficiency decrease. These elements of the refinery
are the drying, CO2 absorption, atmospheric gasification, hydrothermal treatment and hy-
drodinamics in cultivation systems. I determined that energy gain is achievable through the
utilization of tubular photobioreactors and hydrothermal conversion technologies.
Thesis 2 [II, VIII]
I developed the carbon capture related biorefineries. Applying life cycle analysis,
I detected that the Global Warming Potential of the CO2 capture and storage process chain
can be decreased by 71% if the MEA-Water absorbent regeneration is more efficient due to
heat integration. The CO2 capture shows reduced environmental effects by 67% in the case of
multiperspective Eco-indicator 99 method if renewables are applied and fossil energy carriers
are excluded.
Thesis 3 [II, VIII]
I developed an algorithm for the comprehensive study of Carbon Capture and Stor-
age technology. I expanded the environmental assessment of the CCS chain by external
factors using PESTLE analysis and I applied Multi-Criteria Decision Analysis for ranking and
selecting CCS alternatives. I identified the renewables based technology as the best carbon
capture process alternative comparing it to the fossil and improved CCS alternatives and to
the uncontrolled release of CO2.
105
Chapter 6. Major New Results
Thesis 4 [III, VI, IX]
I determined the best artificial illumination condition for Chlorella vulgaris MACC555
microalgae strain to increase its biomass productivity. This can be completed with the dichro-
matic light emitting diodes (LED) working at 626 nm and 470 nm using optimized light
intensity levels at 241.34 and 95.97 µmol photon m−2 s−1, respectively.
Thesis 5 [III, IX]
I determined that the lipid content of Chlorella vulgaris MACC555 can be favourably
influenced by the parameters of light intensity and aeration level in stirred tank photobioreac-
tor at 250 rpm stirring rate. Increasing the aeration level from 0.50 to 0.75 vvm elevates the
lipid content by 1.75-times but decrease the carbohydrate content by 2.34-times at optimized
light intensity levels.
Thesis 6 [III, IX, X]
I determined that the light factorial optimization and ideal aeration levels of Chlorella
vulgaris MACC555 cultivation can improve the composition and yield of biogas produced by
hydrothermal gasification of the feedstock. I determined that the hydrogen yield can be raised
by 4.96 mol kg−1 if the carbohydrate content of the cells increased by 2.34-times
106
Articles related to the thesis
[I] Fozer, D., Valentinyi, N., Racz, L., Mizsey, P., Evaluation of microalgae-based
biorefinery alternatives, Clean Technologies and Environmental Policy, 2017, 19(2) 501-515,
doi: 10.1007/s10098-016-1242-8
[II] Fozer, D., Sziraky, F.Z., Racz, L., Nagy, T., Tarjani, A.J., Toth, A. J., Haaz, E., Benko, T.,
Mizsey, P., Life cycle, PESTLE, and Multi-Criteria Decision Analysis of CCS process alternatives,
Journal of Cleaner Production, 2017, 147, 75-85, doi: 10.1016/j.jclepro.2017.01.056
[III] Fozer, D., Kiss, B., Lorincz, L., Szekely, E., Mizsey, P., Nemeth, A., Improve-
ment of microalgae biomass productivity and subsequent biogas yield of hydrothermal
gasification via optimization of illumination, Renewable Energy, 2019, 138:1262-1272, doi:
10.1016/j.renene.2018.12.122
[IV] Fozer, D., Valentinyi, N., Racz, L., Mizsey, P., Harmadik generációs biofinomítói
alternatívák értékelése, Ipari Ökológia, 2016, 3-22 (in Hungarian)
Oral presentations
[V] Fozer, D., Valentinyi, N., Racz, L., Mizsey, P., Harmadik generációs – mikroalgán
alapuló – biofinomítói alternatívák értékelése, XXXIX. Kémiai Eloadói Napok, 17.10.2016,
Szeged, Hungary (in Hungarian)
[VI] Fozer, D., Kiss, B., Nemeth, A., Determine optimal growth conditions for Chlorella
vulgaris, Proceedings of the 12th Fermentation Colloquium, 19-21.10.2016, Keszthely, Hungary
[VII] Fozer, D., Mizsey, P., Mikroalgák az energiaiparban, egy harmadik generációs
biofinomító energiamérlege, MTA Vegyipari Muveleti és Gépészeti Munkabizottság és az MKE
Muszaki Kémiai Szakosztály ülése, 08.06.2017 Budapest, Hungary, (in Hungarian)
[VIII] Fozer, D., Sziraky, F.Z., Racz, L., Nagy, T., Tarjani, A.J., Toth, A. J., Haaz, E., Benko,
T., Mizsey, P., Life cycle and PESTLE analysis of CCS alternatives, 7th European Young Engineers
Conference, 23-25.04.2018, Warsaw, Poland
[IX] Fozer, D., Farkas, C., Kiss B., Lorincz L., Toth AJ., Andre, A., Nagy, T., Tarjani AJ.,
Haaz, E., Valentinyi, N., Nemeth, A., Szekely, E., Mizsey, P., The investigation and improvement
of hydrothermal gasification parameters on microalgal biomass, 7th European Young Engineers
Conference, 23-25.04.2018, Warsaw, Poland
[X] Fozer, D., Mizsey, P., Szén-dioxid megkötés és hatékony hasznosítása mikroalga
alapú technológiával, Magyar Kémikusok Egyesülete BAZ megyei Területi Szervezete és a
Miskolci Akadémiai Bizottság Vegyészeti Szakbizottsága - 35. Borsodi Vegyipari Nap, 22.11.2018,
107

Chapter 6. Major New Results
Miskolc, Hungary (in Hungarian)
[XI] Fozer, D., Sztancs, G., Kiss, B., Toth, A.J., Nemeth, A., Nagy, T., Mizsey, P., Hy-
drothermal carbonization of Chlorella vulgaris for upgrading the yields of hydrothermal
gasification, Application of supercritical fluids 2018 conference, 17.05.2018, Budapest, Hun-
gary
[XII] Fozer, D., Sztancs, G., Kiss B., Toth A.J., Haaz E., Nemeth A., Mizsey P., Biogáz
eloállítás Chlorella vulgaris és Chlorella zofingiensis hidrotermális elgázosításával, III. Gazdálkodás
és Menedzsment Tudományos Konferencia 2018, 27.09.2018, Kecskemét, Hungary
[XIII] Fozer, D., Toth, A.J., Kiss, B., Nagy, T., Nemeth, A., Mizsey, P., Hydrothermal
Gasification of Chlorella vulgaris and Chlorella zofingiensis for the Production of Fuel Gases,
51th GOMA Fuels Symposium, 17-19.10.2018, Opatija, Croatia
[XIV] Fozer, D., Greenery - Közösségi alapú zöldhálózati információs rendszer, Klí-
makonferencia - Klímastratégia és éghajlatváltozási platform létrehozása Budapesten, 17.11.2017,
Budapest, Hungary (in Hungarian)
Other Articles
[XV] Cespi, D., Passarini, F., Cavani, F., Volanti, M., Neri, Mizsey, P., Fozer, D., Tereph-
thalic acid from renewable sources: early stage sustainability analysis of a bio-PET precursor,
Green Chemistry, 2019, doi: 10.1039/C8GC03666G
[XVI] Andre, A., Nagy, T., Toth, A.J., Haaz, E., Fozer, D., Tarjani, A.J., Mizsey, P., Dis-
tillation contra pervaporation: comprehensive investigation of isobutanol-water separation,
Journal of Cleaner Production, 2018, 187:804-818., doi: 10.1016/j.jclepro.2018.02.157
[XVII] Toth, A.J., Haaz, E., Valentinyi, N., Nagy, T., Tarjani, A.J., Fozer, D., Andre, A.,
Selim, A., Solti, Sz., Mizsey, P., Selection between separation alternatives: Membrane Flash
Index (MFLI), Industrial & Engineering Chemistry Research, 2018, 57(33):11366-11373, doi:
10.1021/acs.iecr.8b00430
[XVIII] Tarjani, A.J., Toth, A.J., Nagy, T., Haaz, E., Valentinyi, N., Andre, A., Fozer, D.,
Mizsey, P., Thermodynamic and Exergy Analysis of Energy-Integrated Distillation Technologies
Focusing on Dividing-Wall Columns with Upper and Lower Partitions, Industrial & Engineering
Chemistry Research, 2018, 57(10):3678-3684, doi: 10.1021/acs.iecr.7b04247
[XIX] Racz L., Fozer D., Nagy T., Toth A.J., Haaz E., Tarjani A.J., Andre A., Selim A.K.M.,
Valen-tinyi N., Mika L.T., Deak, Cs., Mizsey, P., Extensive comparison of biodiesel production
alternatives with Life Cycle, PESTLE and Multi-Criteria Decision Analyses, Clean Technologies
and Environmental Policy, 2018, 20(9):2013-2024, doi: 10.1007/s10098-018-1527-1
108
[XX] Haaz, E., Fozer, D., Nagy, T., Valentinyi, N. Andre, A. Matyasi, J. Balla J., Mizsey,
P., Toth, A.J., Vacuum evaporation and reverse osmosis treatment of process wastewaters
containing surfactant material: COD reduction and water reuse, Clean Technologies and
Environmental Policy, 2019, doi: 10.1007/s10098-019-01673-5
[XXI] Haaz E., Valentinyi N., Tarjani A.J., Fozer D., Andre A., Selim A.K.M., Rahimli F.,
Nagy, T., Deak Cs., Mizsey P., Toth A.J., Platform molecule removal from aqueous mixture with
organophilic pervaporation: experiments and modelling, Periodica Polytechnica-Chemical
Engineering, 2019, 63:138-146., doi: 10.3311/PPch.12151
[XXII] Valentinyi, N., Andre, A., Haaz, E., Fozer, D., Toth A.J., Nagy, T., Mizsey, P.,
Experi-mental investigation and modelling of the separation of ternary mixtures by hydrophilic
pervaporation, Separation Science and Technology, 2019, doi: 10.1080/01496395.2019.1569692
[XXIII] Selim, A., Valentinyi, N., Nagy, T., Toth, A.J., Fozer, D., Haaz, E., Mizsey, P., Effect
of Ag-nanoparticles generated in poly (vinyl alcohol) membranes on ethanol dehydration via
pervaporation, Chinese Journal of Chemical Engineering, 2018, doi: 10.1016/j.cjche.2018.11.002
[XXIV] Tarjani, A.J., Toth, A.J., Nagy, T., Haaz, E., Fozer, D., Andre, A., Mizsey, P.,
Controllability features of dividing-wall column, Chemical Engineering Transactions, 2018,
63:403-408, doi: 10.3303/CET1869068
[XXV] Toth, A.J., Haaz, E., Nagy, T., Tarjani, A.J., Fozer, D., Andre, A., Valentinyi, N.,
Mizsey, P., Novel method for the removal of organic halogens from process wastewaters en-
abling water reuse, Desalination and Water Treatment, 2018, 13:54-62, doi: 10.5004/dwt.2018.22987
[XXVI] Toth, A.J., Haaz, E., Solti, Sz., Valentinyi, N., Andre, A., Fozer, D., Nagy, T.,
Mizsey, P., Parameter estimation for modelling of organophilic pervaporation, Computer-Aided
Chemical Engineering, 2018, 43:1287-1292, doi: 10.1016/B978-0-444-64235-6.50226-6
[XXVII] Toth, A,J, Haaz, E., Nagy, T., Tarjani, A.J., Fozer, D., Andre, A., Valentinyi, N.,
Solti, Sz., Mizsey, P., Treatment of pharmaceutical process wastewater with hybrid separation
method: distillation and hydrophilic pervaporation, Liquid Waste Recovery, 2018, 3:8-13, doi:
10.1515/wtr-2018-0002
[XXVIII] Toth, A.J., Haaz, E., Szilagyi, B., Nagy, T., Tarjani, A.J., Fozer, D., Andre,
A., Valentinyi, N., Solti, Sz., Mizsey, P., COD reduction of process wastewater with vacuum
evapora-tion, Liquid Waste Recovery, 2018, 3:1-7, doi: 10.1515/wtr-2018-0001
[XXIX] Fozer, D., Kiss, B., Lorincz, L., Toth, A.J., Andre, A., Tarjani A.J., Nagy, T., Haaz
E., Valen-tinyi, N., Nemeth A., Szekely, E., Mizsey, P., Metán és hidrogén tartalmú biogáz eloál-
lításának vizsgálata mikroalga biomassza hidrotermális elgázosításával, Körforgásos Gazdaság
és Környezetvédelem/Circular Economy and Environmental Protection, 2017, 1(4):5-16, doi:-
109

Bibliography
Adesanya, V.O., Cadena, E., Scott, S.A., Smith, A.G., 2014. Life cycle assessment on microalgal
biodiesel production using a hybrid cultivation system. Bioresource Technology 163, 343–
355. doi:10.1016/j.biortech.2014.04.051.
Agblevor, F., Petkovic, L., Bennion, E., Quinn, J., Moses, J., Newby, D., Ginosar, D., 2014. Bio-
Oil Separation and Stabilization by Supercritical Fluid Fractionation. 2014 Final Report
doi:10.2172/1136314.
Aguilera, J., J., F., Gordillo, L., Karsten, U., Figueroa, F.L., Niell, F.X., 2000. Light quality effect on
photosynthesis and efficiency of carbon assimilation in the red alga porphyra leucosticta.
Journal of Plant Physiology 157, 86 – 92. dx.doi.org/10.1016/S0176-1617(00)80140-6.
Alonso, A., Moral-Vico, J., Markeb, A.A., Busquets-Fité, M., Komilis, D., Puntes, V., Sánchez, A.,
Font, X., 2017. Critical review of existing nanomaterial adsorbents to capture carbon dioxide
and methane. Science of The Total Environment 595, 51 – 62. doi:10.1016/j.scitotenv.2017.03.229.
Amin, S., 2009. Review on biofuel oil and gas production processes from microalgae. Energy
Conversion and Management 50, 1834 – 1840. doi:10.1016/j.enconman.2009.03.001.
Anastasakis, K., Ross, A., 2015. Hydrothermal liquefaction of four brown macro-algae com-
monly found on the UK coasts: An energetic analysis of the process and comparison with
bio-chemical conversion methods. Fuel 139, 546–553. doi:10.1016/j.fuel.2014.09.006.
Anwar, M., Fayyaz, A., Sohail, N., Khokhar, M., Baqar, M., Khan, W., Rasool, K., Rehan, M.,
Nizami, A., 2018. CO2 capture and storage: A way forward for sustainable environment.
Journal of Environmental Management 226, 131 – 144. doi:10.1016/j.jenvman.2018.08.009.
ASDR&E, 2011. Assistant secretary of defense for research and engineering: Technology
readiness assessment ({TRA}) guidance. URL: http://www.acq.osd.mil/chieftechnologist/
publications/docs/TRA2011.pdf. (accessed: 30.10.16).
111
Bibliography
Ashdown, I., 2014. Photometry and Photosynthesis From Illuminance to PPFD.
agi32.com/blog/2014/12/10/photometry-and-photosynthesis/ (accessed 10.02.18).
Atta, M., Idris, A., Bukhari, A., Wahidin, S., 2013. Intensity of blue LED light: A potential stimu-
lus for biomass and lipid content in fresh water microalgae Chlorella vulgaris. Bioresource
Technology 148, 373 – 378. Dx.doi.org/10.1016/j.biortech.2013.08.162.
Azhar, S.H.M., Abdulla, R., Jambo, S.A., Marbawi, H., Gansau, J.A., Faik, A.A.M., Rodrigues, K.F.,
2017. Yeasts in sustainable bioethanol production: A review. Biochemistry and Biophysics
Reports 10, 52 – 61. doi:10.1016/j.bbrep.2017.03.003.
BAC, 2016. Activated carbon price. URL: http://www.buyactivatedcharcoal.com. (accessed:
04.08.16).
Balat, M., Balat, H., Öz, C., 2008. Progress in bioethanol processing. Progress in Energy and
Combustion Science 34, 551 – 573. doi:10.1016/j.pecs.2007.11.001.
Barrañon, D.C.C., 2006. Methanol and Hydrogen Production Energy and Cost Analysis. Master’s
thesis. Luleá University of Technology. URL: http://www.diva-portal.se/smash/get/diva2:
1032600/FULLTEXT01.pdf. (accessed 08.10.18).
Barreiro, D.L., Prins, W., Ronsse, F., Brilman, W., 2013. Hydrothermal liquefaction (HTL) of
microalgae for biofuel production: State of the art review and future prospects. Biomass
and Bioenergy 53, 113–127. doi:10.1016/j.biombioe.2012.12.029.
Barros, A.I., Gonçalves, A.L., Simões, M., Pires, J.C., 2015. Harvesting techniques applied to
microalgae: A review. Renewable and Sustainable Energy Reviews 41, 1489–1500. doi:10.1016/j.rser.2014.09.037.
Bennion, E.P., Ginosar, D.M., Moses, J., Agblevor, F., Quinn, J.C., 2015. Lifecycle assessment
of microalgae to biofuel: Comparison of thermochemical processing pathways. Applied
Energy 154, 1062–1071. doi:10.1016/j.apenergy.2014.12.009.
Bergmann, P., Ripplinger, P., Beyer, L., Trösch, W., 2013. Disposable Flat Panel Airlift Pho-
tobioreactors. Chemie Ingenieur Technik 85, 202–205. doi:10.1002/cite.201200132,
arXiv:https://onlinelibrary.wiley.com/doi/pdf/10.1002/cite.201200132.
Biller, P., Sharma, B.K., Kunwar, B., Ross, A.B., 2015. Hydroprocessing of bio-crude from
continuous hydrothermal liquefaction of microalgae. Fuel 159, 197–205. doi:10.1016/j.fuel.2015.06.077.
Blanken, W., Cuaresma, M., Wijffels, R.H., Janssen, M., 2013. Cultivation of microalgae on
artificial light comes at a cost. Algal Research 2, 333 – 340. doi:10.1016/j.algal.2013.09.004.
112
Bibliography
Blasi, C.D., 2008. Modeling chemical and physical processes of wood and biomass pyrolysis.
Progress in Energy and Combustion Science 34, 47 – 90. doi:10.1016/j.pecs.2006.12.001.
de Boer, K., Moheimani, N.R., Borowitzka, M.A., Bahri, P.A., 2012. Extraction and conversion
pathways for microalgae to biodiesel: a review focused on energy consumption. Journal of
Applied Phycology 24, 1681–1698. doi:10.1007/s10811-012-9835-z.
Boot-Handford, M.E., Abanades, J.C., Anthony, E.J., Blunt, M.J., Brandani, S., Mac Dowell,
N., Fernandez, J.R., Ferrari, M.C., Gross, R., Hallett, J.P., Haszeldine, R.S., Heptonstall, P.,
Lyngfelt, A., Makuch, Z., Mangano, E., Porter, R.T.J., Pourkashanian, M., Rochelle, G.T., Shah,
N., Yao, J.G., Fennell, P.S., 2014. Carbon capture and storage update. Energy Environ. Sci. 7,
130–189. doi:10.1039/C3EE42350F.
Brand, S., Hardi, F., Kim, J., Suh, D.J., 2014. Effect of heating rate on biomass liquefaction:
Differences between subcritical water and supercritical ethanol. Energy 68, 420 – 427.
doi:10.1016/j.energy.2014.02.086.
Brennan, L., Owende, P., 2010. Biofuels from microalgae—A review of technologies for produc-
tion, processing, and extractions of biofuels and co-products. Renewable and Sustainable
Energy Reviews 14, 557–577. doi:10.1016/j.rser.2009.10.009.
Brentner, L.B., Eckelman, M.J., Zimmerman, J.B., 2011. Combinatorial Life Cycle Assessment
to Inform Process Design of Industrial Production of Algal Biodiesel. Environmental Science
& Technology 45, 7060–7067. doi:10.1021/es2006995.
Carneiro, R.L., dos Santos, M.E.V., Pacheco, A.B.F., Azevedo, S.M.F.d.O.e., 2009. Effects of light
intensity and light quality on growth and circadian rhythm of saxitoxins production in
Cylindrospermopsis raciborskii (Cyanobacteria). Journal of Plankton Research 31, 481–488.
dx.doi.org/10.1093/plankt/fbp006.
Carpio, R.B., de Leon, R.L., Martinez-Goss, M.R., 2015. Growth, lipid content, and lipid profile
of the green alga, Chlorella vulgaris beij., under different concentrations of Fe and CO2.
Journal of Engineering Science and Technology 1, 19–30.
CCAP, 2017. Culture collection of algae and protozoa, BG11 media.
ccap.ac.uk/media/documents/BG11.pdf (accessed 10.02.18).
Cha, J.S., Park, S.H., Jung, S.C., Ryu, C., Jeon, J.K., Shin, M.C., Park, Y.K., 2016. Production and
utilization of biochar: A review. Journal of Industrial and Engineering Chemistry 40, 1 – 15.
doi:10.1016/j.jiec.2016.06.002.
Chaudry, S., Bahri, P.A., Moheimani, N.R., 2015. Pathways of processing of wet microalgae for
liquid fuel production: A critical review. Renewable and Sustainable Energy Reviews 52,
1240–1250. doi:10.1016/j.rser.2015.08.005.
113
Bibliography
Chen, L., Yong, S.Z., Ghoniem, A.F., 2012. Oxy-fuel combustion of pulverized coal: Characteri-
zation, fundamentals, stabilization and CFD modeling. Progress in Energy and Combustion
Science 38, 156 – 214. doi:10.1016/j.pecs.2011.09.003.
Chen, Y., Mu, R., Yang, M., Fang, L., Wu, Y., Wu, K., Liu, Y., Gong, J., 2017. Catalytic hydrother-
mal liquefaction for bio-oil production over cnts supported metal catalysts. Chemical
Engineering Science 161, 299 – 307. doi:10.1016/j.ces.2016.12.010.
Cheng, D., Li, X., Yuan, Y., Yang, C., Tang, T., Zhao, Q., Sun, Y., 2019. Adaptive evolution
and carbon dioxide fixation of Chlorella sp. in simulated flue gas. Science of The Total
Environment 650, 2931–2938. doi:10.1016/j.scitotenv.2018.10.070.
Cheng-Wu, Z., Zmora, O., Kopel, R., Richmond, A., 2001. An industrial-size flat plate glass
reactor for mass production of Nannochloropsis sp. (Eustigmatophyceae). Aquaculture 195,
35–49. doi:10.1016/S0044-8486(00)00533-0.
Cherad, R., Onwudili, J., Biller, P., Williams, P., Ross, A., 2016. Hydrogen production from the
catalytic supercritical water gasification of process water generated from hydrothermal
liquefaction of microalgae. Fuel 166, 24 – 28. Dx.doi.org/10.1016/j.fuel.2015.10.088.
Chia, M.A., Lombardi, A.T., da Graca G. Melao, M., 2013. Growth and biochemical composition
of Chlorella vulgaris in different growth media. Anais da Academia Brasileira de Ciências 85,
1427–1438. doi:10.1590/0001-3765201393312.
Chiaramonti, D., Prussi, M., Buffi, M., Casini, D., Rizzo, A.M., 2015. Thermochemical Con-
version of Microalgae: Challenges and Opportunities. Energy Procedia 75, 819 – 826.
doi:10.1016/j.egypro.2015.07.142. clean, Efficient and Affordable Energy for a Sus-
tainable Future: The 7th International Conference on Applied Energy (ICAE2015).
Chinnasamy, S., Ramakrishnan, B., Bhatnagar, A., Das, K.C., 2009. Biomass Production Poten-
tial of a Wastewater Alga Chlorella vulgaris ARC 1 under Elevated Levels of CO2 and Tempera-
ture. International Journal of Molecular Sciences 10, 518–532. doi:10.3390/ijms10020518.
Chisti, Y., 2007. Biodiesel from microalgae. Biotechnology Advances 25, 294 – 306. doi:10.1016/j.biotechadv.2007.02.001.
Chisti, Y., 2008a. Biodiesel from microalgae beats bioethanol. Trends in Biotechnology 26, 126
– 131. doi:10.1016/j.tibtech.2007.12.002.
Chisti, Y., 2008b. Biodiesel from microalgae beats bioethanol. Trends in Biotechnology 26,
126–131. doi:10.1016/j.tibtech.2007.12.002.
Christensen, P.R., Mørup, A.J., Mamakhel, A., Glasius, M., Becker, J., Iversen, B.B., 2014. Ef-
fects of heterogeneous catalyst in hydrothermal liquefaction of dried distillers grains with
solubles. Fuel 123, 158 – 166. doi:10.1016/j.fuel.2014.01.037.
114

Bibliography
ClarkeEnergy, 2013. {CHP} efficiency for biogas. URL: https://www.clarke-energy.com/2013/
chp-cogen-efficiency-biogas/. (accessed: 31.10.16).
Collet, P., Lardon, L., Hélias, A., Bricout, S., Lombaert-Valot, I., Perrier, B., Lépine, O., Steyer, J.P.,
Bernard, O., 2014. Biodiesel from microalgae – Life cycle assessment and recommendations
for potential improvements. Renewable Energy 71, 525–533. doi:10.1016/j.renene.2014.06.009.
Dassey, A.J., Hall, S.G., Theegala, C.S., 2014. An analysis of energy consumption for algal
biodiesel production: Comparing the literature with current estimates. Algal Research 4, 89
– 95. doi:10.1016/j.algal.2013.12.006. progress and Perspectives on Microalgal Mass
Culture.
Demirbas, M.F., 2011. Biofuels from algae for sustainable development. Applied Energy 88,
3473 – 3480. doi:10.1016/j.apenergy.2011.01.059. special Issue of Energy from algae:
Current status and future trends.
Deniz, I., Vardar-Sukan, F., Yüksel, M., Saglam, M., Ballice, L., Yesil-Celiktas, O., 2015. Hydrogen
production from marine biomass by hydrothermal gasification. Energy Conversion and
Management 96, 124 – 130. Dx.doi.org/10.1016/j.enconman.2015.02.048.
Dong, C., Chen, W., Liu, C., 2014. Flocculation of algal cells by amphoteric chitosan-based
flocculant. Bioresource Technology 170, 239 – 247. doi:10.1016/j.biortech.2014.07.108.
Dãrãban, I.M., Rosendahl, L.A., Pedersen, T.H., Iversen, S.B., 2015. Pretreatment methods
to obtain pumpable high solid loading wood–water slurries for continuous hydrothermal
liquefaction systems. Biomass and Bioenergy 81, 437 – 443. doi:10.1016/j.biombioe.2015.07.004.
Duic, N., 2015. Is the success of clean energy guaranteed? Clean Technologies and Environ-
mental Policy 17, 2093–2100. doi:10.1007/s10098-015-0969-y.
Duman, G., Uddin, M.A., Yanik, J., 2014. Hydrogen production from algal biomass via steam
gasification. Bioresource Technology 166, 24 – 30. doi:10.1016/j.biortech.2014.04.096.
Durak, H., Aysu, T., 2016. Structural analysis of bio-oils from subcritical and supercritical
hydrothermal liquefaction of datura stramonium l. The Journal of Supercritical Fluids 108,
123 – 135. doi:10.1016/j.supflu.2015.10.016.
Ecoinvent, 2013. The ecoinvent database. URL: http://www.ecoinvent.org/database/
older-versions/ecoinvent-31/ecoinvent-31.html. (accessed: 05.08.16).
115
Bibliography
El-Dalatony, M.M., Kurade, M.B., Abou-Shanab, R.A., Kim, H., Salama, E.S., Jeon, B.H., 2016.
Long-term production of bioethanol in repeated-batch fermentation of microalgal biomass
using immobilized Saccharomyces cerevisiae. Bioresource Technology 219, 98 – 105. doi:10.1016/j.biortech.2016.07.113.
Elif, D., Nezihe, A., 2016. Hydrogen production by supercritical water gasification of fruit pulp
in the presence of ru/c. International Journal of Hydrogen Energy 41, 8073 – 8083. doi:10.1016/j.ijhydene.2015.12.005. special Issue on Progress in Hydrogen Production and
Applications (ICH2P-2015), 3-6 May 2015, Oshawa, Ontario, Canada.
EN 14214, 2008. Fatty acid methyl ester (FAME) for diesel engines: Requirements, test methods
and threshold values. URL: https://www.ds-bremen.com/tl_files/media/pdf/eng_biodiesel.
pdf. (accessed 06.10.18).
EU-ETS, 2013. The european union emission trading scheme. doi:10.2834/55480.
Eurostat, 2014. Electricity prices for industrial consumers. URL: http://ec.europa.eu/eurostat/
statistics-explained/index.php/File:Electricity_prices_for_industrial_consumers_2014s1.
png. (accessed: 04.08.16).
Fang, Z., Xu, C., 2014. Near-critical and Supercritical Water and Their Applications for Biore-
fineries. Springer, Dordrecht. doi:10.1007/978-94-017-8923-3.
GE Power, 2018. 9HA Power Plants: 9HA.01/.02 Gas Turbine. URL: https://www.ge.com/
content/dam/gepower-pgdp/global/en_US/documents/product/gas%20turbines/Fact%
20Sheet/2017-prod-specs/9ha-power-plants.pdf. accessed (06.10.18).
Gikonyo, B., 2013. Advances in biofuel production algae and aquatic plants. Apple Academic
Press, Oakville.
Gilbert, J.J., Ray, S., Das, D., 2011. Hydrogen production using Rhodobacter sphaeroides (O.U.
001) in a flat panel rocking photobioreactor. International Journal of Hydrogen Energy 36,
3434–3441. doi:10.1016/j.ijhydene.2010.12.012.
Gómez-Pérez, C., Espinosa, J., Ruiz, L.M., van Boxtel, A., 2015. CFD simulation for reduced
energy costs in tubular photobioreactors using wall turbulence promoters. Algal Research
12, 1 – 9. doi:10.1016/j.algal.2015.07.011.
Gohar, L.K., Shine, K.P., 2007. Equivalent {CO2} and its use in understanding the climate effects
of increased greenhouse gas concentrations. Weather 62, 307–311. doi:10.1002/wea.103.
Gong, M., Nanda, S., Romero, M.J., Zhu, W., Kozinski, J.A., 2017. Subcritical and
supercritical water gasification of humic acid as a model compound of humic sub-
stances in sewage sludge. The Journal of Supercritical Fluids 119, 130 – 138.
Dx.doi.org/10.1016/j.supflu.2016.08.018.
116
Bibliography
Graz, Y., Bostyn, S., Richard, T., Bocanegra, P.E., de Bilbao, E., Poirier, J., Gokalp, I., 2016.
Hydrothermal conversion of ulva macro algae in supercritical water. The Journal of Super-
critical Fluids 107, 182 – 188. Dx.doi.org/10.1016/j.supflu.2015.07.038.
de Greyt, W., 2011. Introduction on Glycerol as co-product from biodiesel plants. URL: https://
pdfs.semanticscholar.org/presentation/cb95/7b4375ad4e73b10fb815d6f9aa834464d705.
pdf. (accessed 10.10.18).
Hall, D., Rao, K., 1999. Photosynthesis, 6th edition. Cambridge University Press, UK.
Hammerschmidt, A., Boukis, N., Hauer, E., Galla, U., Dinjus, E., Hitzmann, B., Larsen, T.,
Nygaard, S.D., 2011. Catalytic conversion of waste biomass by hydrothermal treatment.
Fuel 90, 555 – 562. doi:10.1016/j.fuel.2010.10.007.
Heidari, M., Dutta, A., Acharya, B., Mahmud, S., 2018. A review of the current knowledge and
challenges of hydrothermal carbonization for biomass conversion. Journal of the Energy
Institute doi:10.1016/j.joei.2018.12.003.
Helena, S., Zainuri, M., Suprijanto, J., 2016. Microalgae Dunaliella salina (Teodoresco, 1905)
Growth Using the LED Light (Light Limiting Dioda) and Different Media. Aquatic Procedia
7, 226 – 230. doi:10.1016/j.aqpro.2016.07.031.
Henrikson, J.T., Chen, Z., Savage, P.E., 2003. Inhibition and Acceleration of Phenol Oxidation
by Supercritical Water. Industrial & Engineering Chemistry Research 42, 6303–6309. doi:10.1021/ie030020k, arXiv:https://doi.org/10.1021/ie030020k.
Ho, S.H., Huang, S.W., Chen, C.Y., Hasunuma, T., Kondo, A., Chang, J.S., 2013. Characterization
and optimization of carbohydrate production from an indigenous microalga Chlorella
vulgaris FSP-E. Bioresource Technology 135, 157–165. doi:10.1016/j.biortech.2012.10.100.
House, K.Z., Harvey, C.F., Aziz, M.J., Schrag, D.P., 2009. The energy penalty of post-combustion
{CO2} capture & storage and its implications for retrofitting the {U.S.} installed base. Energy
Environ. Sci. 2, 193–205. doi:10.1039/B811608C.
Hu, J.Y., Sato, T., 2017. A photobioreactor for microalgae cultivation with internal illumi-
nation considering flashing light effect and optimized light-source arrangement. Energy
Conversion and Management 133, 558 – 565. Dx.doi.org/10.1016/j.enconman.2016.11.008.
Hu, Q., Sommerfeld, M., Jarvis, E., Ghirardi, M., Posewitz, M., Seibert, M., Darzins, A.,
2008. Microalgal triacylglycerols as feedstocks for biofuel production: perspectives and
advances. The Plant Journal 54, 621–639. doi:10.1111/j.1365-313X.2008.03492.x,
arXiv:https://onlinelibrary.wiley.com/doi/pdf/10.1111/j.1365-313X.2008.03492.x.
117
Bibliography
Huang, G., Chen, F., Wei, D., Zhang, X., Chen, G., 2010. Biodiesel production by microalgal
biotechnology. Applied Energy 87, 38 – 46. doi:10.1016/j.apenergy.2009.06.016.
Humbert, S., Schryver, A.D., Margni, M., Jolliet, O., 2012. Impact 2002+: User guide. URL: https:
//www.quantis-intl.com/pdf/IMPACT2002_UserGuide_for_vQ2.2.pdf. accessed 24.02.19.
IAE, 2011. Biofuels for Transport. OECD Publishing, Paris. doi:10.1787/9789264118461-en.
ITP Mining, 1997. Energy and environmental profile of the US mining industry, Chapter 3,
Potash, Soda Ash and Borates. URL: https://www.energy.gov/sites/prod/files/2013/11/f4/
potash_soda_borate.pdf. accessed (08.10.18).
Jafri, N., Wong, W., Doshi, V., Yoon, L., Cheah, K., 2018. A review on production and char-
acterization of biochars for application in direct carbon fuel cells. Process Safety and
Environmental Protection 118, 152 – 166. doi:10.1016/j.psep.2018.06.036.
James, S.C., Boriah, V., 2010. Modeling Algae Growth in an Open-Channel Race-
way. Journal of Computational Biology 17, 895–906. doi:10.1089/cmb.2009.0078,
arXiv:https://doi.org/10.1089/cmb.2009.0078. pMID: 20575668.
Jena, U., Das, K., Kastner, J., 2011. Effect of operating conditions of thermochemical liquefac-
tion on biocrude production from spirulina platensis. Bioresource Technology 102, 6221 –
6229. doi:10.1016/j.biortech.2011.02.057.
Jeong, Y.S., Jung, J., Lee, U., Yang, C., Han, C., 2015. Techno-economic analysis of mechani-
cal vapor recompression for process integration of post-combustion {CO2} capture with
downstream compression. Chemical Engineering Research and Design 104, 247 – 255.
doi:10.1016/j.cherd.2015.08.016.
Jiao, J.L., Wang, F., Duan, P.G., Xu, Y.P., Yan, W.H., 2017. Catalytic hydrother-
mal gasification of microalgae for producing hydrogen and methane-rich gas. En-
ergy Sources, Part A: Recovery, Utilization, and Environmental Effects 39, 851–860.
Doi.org/10.1080/15567036.2016.1270375.
Johnson, M.C., Palou-Rivera, I., Frank, E.D., 2013. Energy consumption during the manufacture
of nutrients for algae cultivation. Algal Research 2, 426–436. doi:10.1016/j.algal.2013.08.003.
Jorquera, O., Kiperstok, A., Sales, E.A., Embiruçu, M., Ghirardi, M.L., 2010. Comparative energy
life-cycle analyses of microalgal biomass production in open ponds and photobioreactors.
Bioresource Technology 101, 1406–1413. doi:10.1016/j.biortech.2009.09.038.
Karagöz, S., Bhaskar, T., Muto, A., Sakata, Y., Oshiki, T., Kishimoto, T., 2005. Low-temperature
catalytic hydrothermal treatment of wood biomass: analysis of liquid products. Chemical
Engineering Journal 108, 127 – 137. doi:10.1016/j.cej.2005.01.007.
118
Bibliography
Kazemi, A., Mehrabani-Zeinabad, A., 2016. Post combustion carbon capture: Does optimiza-
tion of the processing system based on energy and utility requirements warrant the lowest
possible costs? Energy 112, 353 – 363. doi:10.1016/j.energy.2016.06.063.
Keche, A., Gaddale, A., Tated, R., 2014. Simulation of biomass gasification in downdraft gasifier
for different biomass fuels using ASPEN PLUS. Clean Technologies and Environmental
Policy 17, 465. doi:10.1007/s10098-014-0804-x.
Kent, J.A. (Ed.), 2007. Kent and Riegel’s Handbook of Industrial Chemistry and Biotechnology.
Springer, Boston, MA. doi:10.1007/978-0-387-27843-8.
Khadim, S.R., Singh, P., Singh, A.K., Tiwari, A., Mohanta, A., Asthana, R.K., 2018. Mass cul-
tivation of dunaliella salina in a flat plate photobioreactor and its effective harvesting.
Bioresource Technology 270, 20 – 29. doi:10.1016/j.biortech.2018.08.071.
Khoo, H., Koh, C., Shaik, M., Sharratt, P., 2013. Bioenergy co-products derived from microalgae
biomass via thermochemical conversion – Life cycle energy balances and CO2 emissions.
Bioresource Technology 143, 298 – 307. doi:10.1016/j.biortech.2013.06.004.
Khozin-Goldberg, I., Cohen, Z., 2006. The effect of phosphate starvation on the lipid and fatty
acid composition of the fresh water eustigmatophyte monodus subterraneus. Phytochem-
istry 67, 696 – 701. doi:10.1016/j.phytochem.2006.01.010.
Klingler, D., Vogel, H., 2010. Influence of process parameters on the hydrothermal decomposi-
tion and oxidation of glucose in sub- and supercritical water. The Journal of Supercritical
Fluids 55, 259 – 270. doi:10.1016/j.supflu.2010.06.004.
Koch, N., Fuss, S., Grosjean, G., Edenhofer, O., 2014. Causes of the {EU} {ETS} price drop:
Recession, cdm, renewable policies or a bit of everything?-new evidence. Energy Policy 73,
676 – 685. doi:10.1016/j.enpol.2014.06.024.
Korre, A., Nie, Z., Durucan, S., 2010. Life cycle modelling of fossil fuel power generation
with post-combustion {CO2} capture. International Journal of Greenhouse Gas Control 4,
289 – 300. doi:10.1016/j.ijggc.2009.08.005. the Ninth International Conference on
Greenhouse Gas Control Technologies.
Kumar, M., Oyedun, A.O., Kumar, A., 2018. A review on the current status of various hydrother-
mal technologies on biomass feedstock. Renewable and Sustainable Energy Reviews 81,
1742 – 1770. doi:10.1016/j.rser.2017.05.270.
Lardon, L., Hélias, A., Sialve, B., Steyer, J.P., Bernard, O., 2009. Life-Cycle Assessment of
Biodiesel Production from Microalgae. Environmental Science & Technology 43, 6475–6481.
doi:10.1021/es900705j.
119

Bibliography
Lee, J.H., Hwang, H., Moon, J., Choi, J.W., 2016. Characterization of hydrothermal liquefaction
products from coconut shell in the presence of selected transition metal chlorides. Journal
of Analytical and Applied Pyrolysis 122, 415 – 421. doi:10.1016/j.jaap.2016.11.005.
Lee, S., Oh, Y., Kim, D., Kwon, D., Lee, C., Lee, J., 2011. Converting Carbohydrates Extracted
from Marine Algae into Ethanol Using Various Ethanolic Escherichia coli Strains. Applied
Biochemistry and Biotechnology 164, 878–888. doi:10.1007/s12010-011-9181-7.
Li, K., Leigh, W., Feron, P., Yu, H., Tade, M., 2016. Systematic study of aqueous mo-
noethanolamine ({MEA})-based {CO2} capture process: Techno-economic assessment
of the {MEA} process and its improvements. Applied Energy 165, 648 – 659. doi:10.1016/j.apenergy.2015.12.109.
Li, Y., Han, D., Sommerfeld, M., Hu, Q., 2011. Photosynthetic carbon partitioning and lipid
production in the oleaginous microalga Pseudochlorococcum sp. (Chlorophyceae) under
nitrogen-limited conditions. Bioresource Technology 102, 123 – 129. doi:10.1016/j.biortech.2010.06.036. special Issue: Biofuels - II: Algal Biofuels and Microbial Fuel
Cells.
Li, Y., Horsman, M., Wang, B., Wu, N., Lan, C.Q., 2008. Effects of nitrogen sources on cell growth
and lipid accumulation of green alga Neochloris oleoabundans. Applied Microbiology and
Biotechnology 81, 629–636. doi:10.1007/s00253-008-1681-1.
Li, Y., Zhong, J., Zheng, M., Zhuo, P., Xu, N., 2018. Photoperiod mediates the effects of elevated
CO2 on the growth and physiological performance in the green tide alga Ulva prolifera.
Marine Environmental Research 141, 24–29. doi:10.1016/j.marenvres.2018.07.015.
Liu, Z., Quek, A., Hoekman, S.K., Balasubramanian, R., 2013. Production of solid biochar fuel
from waste biomass by hydrothermal carbonization. Fuel 103, 943 – 949. doi:10.1016/j.fuel.2012.07.069.
Long, J., Li, Y., Zhang, X., Tang, L., Song, C., Wang, F., 2016. Comparative investigation on
hydrothermal and alkali catalytic liquefaction of bagasse: Process efficiency and product
properties. Fuel 186, 685 – 693. doi:10.1016/j.fuel.2016.09.016.
Loubière, K., Olivo, E., Bougaran, G., Pruvost, J., Robert, R., Legrand, J., 2009. A new photobiore-
actor for continuous microalgal production in hatcheries based on external-loop airlift and
swirling flow. Biotechnology and Bioengineering 102, 132–147. doi:10.1002/bit.22035,
arXiv:https://onlinelibrary.wiley.com/doi/pdf/10.1002/bit.22035.
López-Rosales, L., Sánchez-Mirón, A., García-Camacho, F., Place, A., Chisti, Y., Molina-Grima,
E., 2018. Pilot-scale outdoor photobioreactor culture of the marine dinoflagellate karlo-
dinium veneficum: Production of a karlotoxins-rich extract. Bioresource Technology 253,
94 – 104. doi:10.1016/j.biortech.2017.12.101.
120
Bibliography
Luo, X., Wang, M., 2016. Optimal operation of {MEA}-based post-combustion carbon capture
for natural gas combined cycle power plants under different market conditions. Interna-
tional Journal of Greenhouse Gas Control 48, Part 2, 312 – 320. doi:10.1016/j.ijggc.2015.11.014.
Madenoglu, T.G., Saglam, M., Yüksel, M., Ballice, L., 2016. Hydrothermal gasification of
biomass model compounds (cellulose and lignin alkali) and model mixtures. The Journal of
Supercritical Fluids 115, 79 – 85. doi:10.1016/j.supflu.2016.04.017.
Marcilla, A., Catalá, L., García-Quesada, J., Valdés, F., Hernández, M., 2013. A review of
thermochemical conversion of microalgae. Renewable and Sustainable Energy Reviews 27,
11 – 19. doi:10.1016/j.rser.2013.06.032.
Mata, T.M., Martins, A.A., Caetano, N.S., 2010. Microalgae for biodiesel production and
other applications: A review. Renewable and Sustainable Energy Reviews 14, 217 – 232.
doi:10.1016/j.rser.2009.07.020.
Mathimani, T., Baldinelli, A., Rajendran, K., Prabakar, D., Matheswaran, M., van Leeuwen,
R.P., Pugazhendhi, A., 2019. Review on cultivation and thermochemical conversion of
microalgae to fuels and chemicals: Process evaluation and knowledge gaps. Journal of
Cleaner Production 208, 1053 – 1064. doi:10.1016/j.jclepro.2018.10.096.
Matsuda, R., Yamano, T., Murakami, K., Fujiwara, K., 2016. Effects of spectral distribution and
photosynthetic photon flux density for overnight LED light irradiation on tomato seedling
growth and leaf injury. Scientia Horticulturae 198, 363–369. doi:10.1016/j.scienta.2015.11.045.
Metz, B., Davidson, O., Coninck, H., 2005. Ipcc special report on carbon dioxide capture
and storage. URL: http://www.ipcc.ch/pdf/special-reports/srccs/srccs_wholereport.pdf.
(accessed: 05.08.16).
MHSPE, 2000. Eco-indicator 99 Manual for Designers. URL: https://www.pre-sustainability.
com/download/EI99_Manual.pdf. accessed (15.01.19).
Mizsey, P., Racz, L., 2010. Cleaner production alternatives: Biomass utilisation options. Journal
of Cleaner Production 18, 767–770. doi:10.1016/j.jclepro.2010.01.007.
Mäkelä, M., Fraikin, L., Léonard, A., Benavente, V., Fullana, A., 2016. Predicting the drying
properties of sludge based on hydrothermal treatment under subcritical conditions. Water
Research 91, 11 – 18. doi:10.1016/j.watres.2015.12.043.
Mohan, D., Pittman, C.U., Steele, P.H., 2006. Pyrolysis of wood, biomass for bio oil: A critical
review. Energy & Fuels 20, 848–889. doi:10.1021/ef0502397.
121
Bibliography
Molina, E., Fernández, J., Acién, F., Chisti, Y., 2001. Tubular photobioreactor design for algal
cultures. Journal of Biotechnology 92, 113 – 131. doi:10.1016/S0168-1656(01)00353-4.
biochemical Engineering: Trends and Potentials.
de Mooij, T., Schediwy, K., Wijffels, R.H., Janssen, M., 2016. Modeling the competition be-
tween antenna size mutant and wild type microalgae in outdoor mass culture. Journal of
Biotechnology 240, 1 – 13. doi:10.1016/j.jbiotec.2016.10.009.
Morad, N.A., Idrees, M., Hasan, A.A., 1995. Specific heat capacities of pure triglycerides
by heat-flux differential scanning calorimetry. Journal of thermal analysis 45, 1449–1461.
doi:10.1007/BF02547438.
Mussatto, S.I., Machado, E.M., Carneiro, L.M., Teixeira, J.A., 2012. Sugars metabolism and
ethanol production by different yeast strains from coffee industry wastes hydrolysates.
Applied Energy 92, 763 – 768. doi:10.1016/j.apenergy.2011.08.020.
Nagy, T., Mizsey, P., 2015. Model verification and analysis of the {CO2}-{MEA} ab-
sorber–desorber system. International Journal of Greenhouse Gas Control 39, 236 – 244.
doi:10.1016/j.ijggc.2015.05.017.
Nanda, S., Dalai, A.K., Gökalp, I., Kozinski, J.A., 2016. Valorization of horse manure through
catalytic supercritical water gasification. Waste Management 52, 147 – 158. doi:10.1016/j.wasman.2016.03.049.
Narukawa, Y., Ichikawa, M., Sanga, D., Sano, M., Mukai, T., 2010. White light emitting diodes
with super-high luminous efficacy. Journal of Physics D: Applied Physics 43, 354002. URL:
http://stacks.iop.org/0022-3727/43/i=35/a=354002. accessed (15.01.19).
Norouzi, O., Safari, F., Jafarian, S., Tavasoli, A., Karimi, A., 2017. Hydrothermal gasification
performance of Enteromorpha intestinalis as an algal biomass for hydrogen-rich gas produc-
tion using Ru promoted Fe–Ni/γ-Al2O3 nanocatalysts. Energy Conversion and Management
141, 63 – 71. doi:10.1016/j.enconman.2016.04.083.
Novianti, S., Biddinika, M., Prawisudha, P., Yoshikawa, K., 2014. Upgrading of palm oil empty
fruit bunch employing hydrothermal treatment in lab-scale and pilot scale. Procedia En-
vironmental Sciences 20, 46 – 54. doi:10.1016/j.proenv.2014.03.008. the 4th Interna-
tional Conference on Sustainable Future for Human Security SUSTAIN 2013.
Ojha, A., Al-Dahhan, M., 2018. Local gas holdup and bubble dynamics investigation during
microalgae culturing in a split airlift photobioreactor. Chemical Engineering Science 175,
185 – 198. doi:10.1016/j.ces.2017.08.026.
Olajire, A.A., 2010. CO2 capture and separation technologies for end-of-pipe applications – A
review. Energy 35, 2610 – 2628. doi:10.1016/j.energy.2010.02.030. 7th International
Conference on Sustainable Energy Technologies.
122
Bibliography
Onwudili, J.A., Lea-Langton, A.R., Ross, A.B., Williams, P.T., 2013. Catalytic hydrothermal gasifi-
cation of algae for hydrogen production: Composition of reaction products and potential for
nutrient recycling. Bioresource Technology 127, 72 – 80. doi:10.1016/j.biortech.2012.10.020.
Onwudili, J.A., Williams, P.T., 2013. Hydrogen and methane selectivity during alkaline super-
critical water gasification of biomass with ruthenium-alumina catalyst. Applied Catalysis B:
Environmental 132-133, 70 – 79. doi:10.1016/j.apcatb.2012.11.033.
Pal, D., Khozin-Goldberg, I., Cohen, Z., Boussiba, S., 2011. The effect of light, salinity, and
nitrogen availability on lipid production by nannochloropsis sp. Applied Microbiology and
Biotechnology 90, 1429–1441. doi:10.1007/s00253-011-3170-1.
Pate, R., Klise, G., Wu, B., 2011. Resource demand implications for US algae biofuels production
scale-up. Applied Energy 88, 3377 – 3388. doi:10.1016/j.apenergy.2011.04.023. special
Issue of Energy from algae: Current status and future trends.
Peng, C., Zhai, Y., Zhu, Y., Xu, B., Wang, T., Li, C., Zeng, G., 2016. Production of char from sewage
sludge employing hydrothermal carbonization: Char properties, combustion behavior and
thermal characteristics. Fuel 176, 110 – 118. doi:10.1016/j.fuel.2016.02.068.
Peng, G., Ludwig, C., Vogel, F., 2017. Catalytic supercritical water gasification: Interaction of
sulfur with zno and the ruthenium catalyst. Applied Catalysis B: Environmental 202, 262 –
268. doi:10.1016/j.apcatb.2016.09.011.
de Perthuis, C., Trotignon, R., 2014. Governance of CO2 markets: Lessons from the {EU} {ETS}.
Energy Policy 75, 100 – 106. doi:10.1016/j.enpol.2014.05.033.
Phwan, C.K., Ong, H.C., Chen, W.H., Ling, T.C., Ng, E.P., Show, P.L., 2018. Overview: Comparison
of pretreatment technologies and fermentation processes of bioethanol from microalgae.
Energy Conversion and Management 173, 81 – 94. doi:10.1016/j.enconman.2018.07.054.
Piškur, J., Rozpedowska, E., Polakova, S., Merico, A., Compagno, C., 2006. How did Saccha-
romyces evolve to become a good brewer? Trends in Genetics 22, 183–186. doi:10.1016/j.tig.2006.02.002.
Pimputkar, S., Speck, J.S., DenBaars, S.P., Nakamura, S., 2009. Prospects for LED lighting.
Nature Photonics 3, 180–182. doi:10.1038/nphoton.2009.32.
Pokoo-Aikins, G., Heath, A., Mentzer, R.A., Mannan, M.S., Rogers, W.J., El-Halwagi, M.M.,
2010. A multi-criteria approach to screening alternatives for converting sewage sludge to
biodiesel. Journal of Loss Prevention in the Process Industries 23, 412 – 420. doi:10.1016/j.jlp.2010.01.005.
123
Bibliography
Posten, C., 2009. Design principles of photo-bioreactors for cultivation of microal-
gae. Engineering in Life Sciences 9, 165–177. doi:10.1002/elsc.200900003,
arXiv:https://onlinelibrary.wiley.com/doi/pdf/10.1002/elsc.200900003.
Pré, 2001. The Eco-indicator 99A damage oriented method forLife Cycle Impact Assess-
ment. URL: https://www.pre-sustainability.com/download/EI99_annexe_v3.pdf. accessed
(15.01.19).
Probiopol, 2016. Cost and profits: An example. URL: http://www.probiopol.de/Cost_and_
Profits_Exemplary_A.73.0.html. accessed: (31.10.16).
Ra, C.H., Kang, C.H., Jung, J.H., Jeong, G.T., Kim, S.K., 2016. Effects of light-emitting diodes
(LEDs) on the accumulation of lipid content using a two-phase culture process with three
microalgae. Bioresource Technology 212, 254 – 261. doi:10.1016/j.biortech.2016.04.059.
Rackley, S.A., 2017. 2 - overview of carbon capture and storage, in: Rackley, S.A. (Ed.), Carbon
Capture and Storage (Second Edition). second edition ed.. Butterworth-Heinemann, Boston,
pp. 23 – 36. doi:10.1016/B978-0-12-812041-5.00002-7.
Radmann, E., Reinehr, C., Costa, J., 2007. Optimization of the repeated batch cultivation of
microalga spirulina platensis in open raceway ponds. Aquaculture 265, 118 – 126. doi:10.1016/j.aquaculture.2007.02.001.
Raza, A., Gholami, R., Rezaee, R., Rasouli, V., Rabiei, M., 2018. Significant aspects of carbon
capture and storage – a review. Petroleum doi:10.1016/j.petlm.2018.12.007.
Richmond, A., 2007. Handbook of Microalgal Culture: Biotechnology and Applied Phycology.
Blackwell Publishing Ltd. doi:10.1002/9780470995280.
Rico, M., González, A.G., Santana-Casiano, M., González-Dávila, M., Pérez-Almeida, N.,
de Tangil, M.S., 2017. Production of Primary and Secondary Metabolites Using Algae.
Springer Singapore, Singapore. pp. 311–326. doi:10.1007/978-981-10-1950-0_12.
Rogers, J.N., Rosenberg, J.N., Guzman, B.J., Oh, V.H., Mimbela, L.E., Ghassemi, A., Betenbaugh,
M.J., Oyler, G.A., Donohue, M.D., 2014. A critical analysis of paddlewheel-driven raceway
ponds for algal biofuel production at commercial scales. Algal Research 4, 76 – 88. doi:10.1016/j.algal.2013.11.007.
Saber, M., Golzary, A., Hosseinpour, M., Takahashi, F., Yoshikawa, K., 2016. Catalytic hy-
drothermal liquefaction of microalgae using nanocatalyst. Applied Energy 183, 566 – 576.
doi:10.1016/j.apenergy.2016.09.017.
124
Bibliography
Safari, F., Norouzi, O., Tavasoli, A., 2016. Hydrothermal gasification of cladophora glomerata
macroalgae over its hydrochar as a catalyst for hydrogen-rich gas production. Bioresource
Technology 222, 232 – 241. doi:10.1016/j.biortech.2016.09.082.
Safi, C., Zebib, B., Merah, O., Pontalier, P.Y., Vaca-Garcia, C., 2014. Morphology, composition,
production, processing and applications of chlorella vulgaris: A review. Renewable and
Sustainable Energy Reviews 35, 265 – 278. doi:10.1016/j.rser.2014.04.007.
Sainju, U.M., 2017. Determination of nitrogen balance in agroecosystems. MethodsX 4, 199 –
208. doi:10.1016/j.mex.2017.06.001.
Saladini, F., Patrizi, N., Pulselli, F.M., Marchettini, N., Bastianoni, S., 2016. Guidelines for
emergy evaluation of first, second and third generation biofuels. Renewable and Sustainable
Energy Reviews 66, 221 – 227. doi:10.1016/j.rser.2016.07.073.
Salian, K., Strezov, V., 2017. Biofuels from microalgae, in: Abraham, M.A. (Ed.), Ency-
clopedia of Sustainable Technologies. Elsevier, Oxford, pp. 107 – 120. doi:10.1016/B978-0-12-409548-9.10114-9.
Samudra, T.T., Nasution, H.W., Pratama, W., Pradhitaningrum, C., Alyza, R., Suyono, E.A., 2015.
Effect of red light-blue and nitrogen starvation on growth of microalgae Tetraselmis sp. KnE
Life Sciences 2, 670–672. doi:10.18502/kls.v2i1.245.
Sanchez-Silva, L., López-González, D., Garcia-Minguillan, A., Valverde, J., 2013. Pyrolysis,
combustion and gasification characteristics of nannochloropsis gaditana microalgae. Biore-
source Technology 130, 321 – 331. doi:10.1016/j.biortech.2012.12.002.
Sander, K., Murthy, G., 2010. Life cycle analysis of algae biodiesel. The International Journal of
Life Cycle Assessment 15, 704. doi:10.1007/s11367-010-0194-1.
Sanin, M.E., Violante, F., Mansanet-Bataller, M., 2015. Understanding volatility dynamics in
the eu-ets market. Energy Policy 82, 321 – 331. doi:10.1016/j.enpol.2015.02.024.
Savage, P., R.B., L., C.M., H., 2010. Chapter 8 hydrothermal processing of biomass. Thermo-
chemical conversion of biomass to liquid fuels and chemicals. 192–221, The Royal Society
of Chemistry.
Schmid-Staiger, U., 2009. Algae Biorefinery - Concepts, in: National German Workshop on
Biorefineries. URL: https://iea-bioenergy.task42-biorefineries.com/upload_mm/6/4/f/
649ca712-b194-4426-9479-0ba50f8f3313_15.%20Algae%20Biorefinery%20Worms0909.
pdf. accessed (11.01.2019).
Schulze, P.S., Barreira, L.A., Pereira, H.G., Perales, J.A., Varela, J.C., 2014. Light emitting diodes
(LEDs) applied to microalgal production. Trends in Biotechnology doi:10.1016/j.tibtech.2014.06.001.
125
Bibliography
Schulze, P.S., Guerra, R., Pereira, H., Schüler, L.M., Varela, J.C., 2017. Flashing leds for microal-
gal production. Trends in Biotechnology 35, 1088 – 1101. doi:10.1016/j.tibtech.2017.07.011.
Schulze, P.S., Pereira, H.G., Santos, T.F., Schueler, L., Guerra, R., Barreira, L.A., Perales, J.A.,
Varela, J.C., 2016. Effect of light quality supplied by light emitting diodes (leds) on growth
and biochemical profiles of nannochloropsis oculata and tetraselmis chuii. Algal Research
16, 387 – 398. doi:10.1016/j.algal.2016.03.034.
Sert, M., Gökkaya, D.S., Cengiz, N., Ballice, L., Yüksel, M., Saglam, M., 2018. Hydrogen
production from olive-pomace by catalytic hydrothermal gasification. Journal of the Taiwan
Institute of Chemical Engineers 83, 90–98. doi:10.1016/j.jtice.2017.11.026.
Severes, A., Hegde, S., D’Souza, L., Hegde, S., 2017. Use of light emitting diodes (leds) for
enhanced lipid production in micro-algae based biofuels. Journal of Photochemistry and
Photobiology B: Biology 170, 235–240. doi:10.1016/j.jphotobiol.2017.04.023.
Shan, R., Lu, L., Shi, Y., Yuan, H., Shi, J., 2018. Catalysts from renewable resources for biodiesel
production. Energy Conversion and Management 178, 277–289. doi:10.1016/j.enconman.2018.10.032.
Shirvani, T., Yan, X., Inderwildi, O.R., Edwards, P.P., King, D.A., 2011. Life cycle energy and
greenhouse gas analysis for algae-derived biodiesel. Energy & Environmental Science 4,
3773–3778. doi:10.1039/C1EE01791H.
Shuba, E., Kifle, D., 2018. Microalgae to biofuels: ‘Promising’ alternative and renewable energy,
review. Renewable and Sustainable Energy Reviews 81, 743 – 755. doi:10.1016/j.rser.2017.08.042.
Sigma-Aldrich, 2018. A5 Solution.
sigmaaldrich.com/catalog/product/sial/92949?lang=hu®ion=HU (accessed 10.02.18).
Singh, J., Gu, S., 2010. Commercialization potential of microalgae for biofuels production.
Renewable and Sustainable Energy Reviews 14, 2596 – 2610. doi:10.1016/j.rser.2010.06.014.
Singh, R., Sharma, S., 2012. Development of suitable photobioreactor for algae production – A
review. Renewable and Sustainable Energy Reviews 16, 2347 – 2353. doi:10.1016/j.rser.2012.01.026.
Slater, C.S., Savelski, M.J., Kostetskyy, P., Johnson, M., 2015. Shear-enhanced microfiltration
of microalgae in a vibrating membrane module. Clean Technologies and Environmental
Policy 17, 1743–1755. doi:10.1007/s10098-015-0907-z.
126
Bibliography
Slegers, P., Koetzier, B., Fasaei, F., Wijffels, R., van Straten, G., van Boxtel, A., 2014. A model-
based combinatorial optimisation approach for energy-efficient processing of microalgae.
Algal Research 5, 140 – 157. doi:10.1016/j.algal.2014.07.004.
Sompech, K., Chisti, Y., Srinophakun, T., 2012. Design of raceway ponds
for producing microalgae. Biofuels 3, 387–397. doi:10.4155/bfs.12.39,
arXiv:https://doi.org/10.4155/bfs.12.39.
Spolaore, P., Joannis-Cassan, C., Duran, E., Isambert, A., 2006. Commercial applications of
microalgae. Journal of Bioscience and Bioengineering 101, 87 – 96. doi:10.1263/jbb.101.87.
Sriperm, N., Pesti, G.M., Tillman, P.B., 2011. Evaluation of the fixed nitrogen-to-protein (N:P)
conversion factor (6.25) versus ingredient specific N:P conversion factors in feedstuffs. J.
Sci. Food Agric. doi:10.1002/jsfa.4292.
Stec, M., Tatarczuk, A., Wiecław-Solny, L., Krótki, A., Spietz, T., Wilk, A., Spiewak, D., 2016.
Demonstration of a post-combustion carbon capture pilot plant using amine-based solvents
at the łaziska power plant in poland. Clean Technologies and Environmental Policy 18,
151–160. doi:10.1007/s10098-015-1001-2.
Sugano, M., Takagi, H., Hirano, K., Mashimo, K., 2008. Hydrothermal liquefaction of plantation
biomass with two kinds of wastewater from paper industry. Journal of Materials Science 43,
2476–2486. doi:10.1007/s10853-007-2106-8.
Surendhiran, D., Vijay, M., 2013. Study on Flocculation Efficiency for Harvesting Nannochlorop-
sis oculata for Biodiesel Production. International Journal of Green Chemistry and Biopro-
cess URL: https://www.urpjournals.com/tocjnls/15_13v3i1_3.pdf. (accessed 04.10.18).
Takagi, M., Karseno, Yoshida, T., 2006. Effect of salt concentration on intracellular accu-
mulation of lipids and triacylglyceride in marine microalgae Dunaliella cells. Journal of
Bioscience and Bioengineering 101, 223 – 226. doi:10.1263/jbb.101.223.
Tamburic, B., Zemichael, F.W., Crudge, P., Maitland, G.C., Hellgardt, K., 2011. Design of a
novel flat-plate photobioreactor system for green algal hydrogen production. International
Journal of Hydrogen Energy 36, 6578 – 6591. doi:10.1016/j.ijhydene.2011.02.091.
Tang, D., Han, W., Li, P., Miao, X., Zhong, J., 2011. CO2 biofixation and fatty acid composition
of Scenedesmus obliquus and Chlorella pyrenoidosa in response to different CO2 levels.
Bioresource Technology 102, 3071–3076. doi:10.1016/j.biortech.2010.10.047.
Tekin, K., Karagöz, S., Bektas, S., 2014. A review of hydrothermal biomass processing. Renew-
able and Sustainable Energy Reviews 40, 673 – 687. doi:10.1016/j.rser.2014.07.216.
127
Bibliography
Teo, C.L., Atta, M., Bukhari, A., Taisir, M., Yusuf, A.M., Idris, A., 2014. Enhanc-
ing growth and lipid production of marine microalgae for biodiesel production
via the use of different LED wavelengths. Bioresource Technology 162, 38 – 44.
dx.doi.org/10.1016/j.biortech.2014.03.113.
Toor, S.S., Rosendahl, L., Rudolf, A., 2011. Hydrothermal liquefaction of biomass: A review of
subcritical water technologies. Energy 36, 2328 – 2342. doi:10.1016/j.energy.2011.03.013.
Torres, S., Acien, G., García-Cuadra, F., Navia, R., 2017. Direct transesterification of microalgae
biomass and biodiesel refining with vacuum distillation. Algal Research 28, 30 – 38. doi:10.1016/j.algal.2017.10.001.
Tradler, S.B., Mayr, S., Himmelsbach, M., Priewasser, R., Baumgartner, W., Stadler, A.T., 2018.
Hydrothermal carbonization as an all-inclusive process for food-waste conversion. Biore-
source Technology Reports 2, 77 – 83. doi:10.1016/j.biteb.2018.04.009.
Tran, K.Q., 2016. Fast hydrothermal liquefaction for production of chemicals and biofuels from
wet biomass – the need to develop a plug-flow reactor. Bioresource Technology 213, 327 –
332. doi:10.1016/j.biortech.2016.04.002. international Conference on New Horizons
in Biotechnology (NHBT-2015).
Tredici, M., Bassi, N., Prussi, M., Biondi, N., Rodolfi, L., Zittelli, G.C., Sampietro, G., 2015.
Energy balance of algal biomass production in a 1-ha “Green Wall Panel” plant: How to
produce algal biomass in a closed reactor achieving a high Net Energy Ratio. Applied Energy
154, 1103–1111. doi:10.1016/j.apenergy.2015.01.086.
Ugwu, C.U., Aoyagi, H., Uchiyama, H., 2007. Influence of irradiance, dissolved oxygen con-
centration, and temperature on the growth of Chlorella sorokiniana. Photosynthetica 45,
309–311. doi:10.1007/s11099-007-0052-y.
Underschultz, J., Boreham, C., Dance, T., Stalker, L., Freifeld, B., Kirste, D., Ennis-King, J.,
2011. CO2 storage in a depleted gas field: An overview of the CO2CRC Otway Project and
initial results. International Journal of Greenhouse Gas Control 5, 922 – 932. doi:10.1016/j.ijggc.2011.02.009.
Unicef, 2016. Swot and pestel. URL: http://www.unicef.org/knowledge-exchange/files/SWOT_
and_PESTEL_production.pdf. accessed (30.10.16).
Usselman, M.C., 2003. Liebig’s alkaloid analyses: the uncertain route from elemental content
to molecular formulae. Ambix 50, 71–89. doi:10.1179/amb.2003.50.1.71.
Vaccarelli, M., Carapellucci, R., Giordano, L., 2014. Energy and economic analysis of the {CO2}
capture from flue gas of combined cycle power plants. Energy Procedia 45, 1165 – 1174.
doi:10.1016/j.egypro.2014.01.122.
128
Bibliography
WAB, 2018. Dyno-mill ECM. URL: https://www.wab-group.com/fileadmin/brochure/
downloads/WAB_AGITATOR_BEAD_MILL_DYNO-MILL_ECM-AP_fr.pdf. accessed
(05.10.18).
Wang, M., Joel, A.S., Ramshaw, C., Eimer, D., Musa, N.M., 2015a. Process intensification for
post-combustion CO2 capture with chemical absorption: A critical review. Applied Energy
158, 275 – 291. doi:10.1016/j.apenergy.2015.08.083.
Wang, M., Joel, A.S., Ramshaw, C., Eimer, D., Musa, N.M., 2015b. Process intensification for
post-combustion CO2 capture with chemical absorption: A critical review. Applied Energy
158, 275–291. doi:10.1016/j.apenergy.2015.08.083.
Wang, M.Q., 1999. GREET 1.5 - transportation fuel-cycle model - Vol. 1 : methodology, devel-
opment, use, and results. doi:10.2172/14775.
Wang, T., Zhai, Y., Zhu, Y., Li, C., Zeng, G., 2018. A review of the hydrothermal carboniza-
tion of biomass waste for hydrochar formation: Process conditions, fundamentals, and
physicochemical properties. Renewable and Sustainable Energy Reviews 90, 223 – 247.
doi:10.1016/j.rser.2018.03.071.
Wang, X., Du, L., 2016. Study on carbon capture and storage ({CCS}) investment decision-
making based on real options for china’s coal-fired power plants. Journal of Cleaner Produc-
tion 112, Part 5, 4123 – 4131. doi:10.1016/j.jclepro.2015.07.112.
Watanabe, M., Aizawa, Y., Iida, T., Levy, C., Aida, T.M., Inomata, H., 2005. Glucose reactions
within the heating period and the effect of heating rate on the reactions in hot compressed
water. Carbohydrate Research 340, 1931 – 1939. doi:10.1016/j.carres.2005.05.019.
Wei, N., Li, X., Wang, Q., Gao, S., 2016. Budget-type techno-economic model for onshore {CO2}
pipeline transportation in china. International Journal of Greenhouse Gas Control 51, 176 –
192. doi:10.1016/j.ijggc.2016.05.010.
Wesnaes, M., Weidema, B., 2006. Long-term market reactions to changes in demand for NaOH.
URL: http://lca-net.com/files/naoh.pdf. accessed (04.08.16).
Xu, B., Li, P., Waller, P., 2014. Study of the flow mixing in a novel ARID raceway for algae
production. Renewable Energy 62, 249 – 257. doi:10.1016/j.renene.2013.06.049.
Xu, H., Miao, X., Wu, Q., 2006. High quality biodiesel production from a microalga Chlorella
protothecoides by heterotrophic growth in fermenters. Journal of Biotechnology 126, 499 –
507. doi:10.1016/j.jbiotec.2006.05.002.
129
Bibliography
Yamamoto, M., Fujishita, M., Hirata, A., Kawano, S., 2004. Regeneration and maturation
of daughter cell walls in the autospore-forming green alga chlorella vulgaris (chloro-
phyta, trebouxiophyceae). Journal of Plant Research 117, 257–264. doi:10.1007/s10265-004-0154-6.
Yamamoto, M., Nishikawa, T., Kajitani, H., Kawano, S., 2007. Patterns of asexual reproduction
in Nannochloris bacillaris and Marvania geminata (Chlorophyta, Trebouxiophyceae). Planta
226, 917–927. doi:10.1007/s00425-007-0538-7.
Yang, K.C., Wu, K.T., Hsieh, M.H., Hsu, H.T., Chen, C.S., Chen, H.W., 2013. Co-gasification
of woody biomass and microalgae in a fluidized bed. Journal of the Taiwan Institute of
Chemical Engineers 44, 1027 – 1033. doi:10.1016/j.jtice.2013.06.026.
Yao, T. (Ed.), 2010. Zero-Carbon Energy Kyoto 2010, Proceedings of the Second International
Symposium of Global COE Program “Energy Science in the Age of Global Warming—Toward
CO2 Zero-emission Energy System”. Kyoto, Japan.
Yap, B.H., Crawford, S.A., Dumsday, G.J., Scales, P.J., Martin, G.J., 2014. A mechanistic study of
algal cell disruption and its effect on lipid recovery by solvent extraction. Algal Research 5,
112 – 120. doi:10.1016/j.algal.2014.07.001.
Yen, H.W., Hu, I.C., Chen, C.Y., Ho, S.H., Lee, D.J., Chang, J.S., 2013. Microalgae-based
biorefinery – From biofuels to natural products. Bioresource Technology 135, 166 – 174.
doi:10.1016/j.biortech.2012.10.099.
Yim, S.C., Quitain, A.T., Yusup, S., Sasaki, M., Uemura, Y., Kida, T., 2017. Metal oxide-catalyzed
hydrothermal liquefaction of malaysian oil palm biomass to bio-oil under supercritical
condition. The Journal of Supercritical Fluids 120, 384 – 394. doi:10.1016/j.supflu.2016.05.044. special Issue - 11th International Symposium on Supercritical Fluids.
Yu, Y., Zhang, T., Wu, X., Mu, D., Zhang, Z., Wang, G.G., 2016. Mass and heat transfer character-
istic in {MEA} absorption of {CO2} improved by meso-scale method. International Journal
of Greenhouse Gas Control 47, 310 – 321. doi:10.1016/j.ijggc.2016.01.044.
Zaimes, G.G., Khanna, V., 2013. Microalgal biomass production pathways: evaluation
of life cycle environmental impacts. Biotechnology for Biofuels 6, 88. doi:10.1186/1754-6834-6-88.
Zauba, 2016. {MEA} (monoethanolamine) price. URL: https://www.zauba.com/
import-monoethanolamine-mea-hs-code.html. (accessed: 04.08.16).
Zhang, L., Champagne, P., Xu, C.C., 2011. Bio-crude production from secondary pulp/paper-
mill sludge and waste newspaper via co-liquefaction in hot-compressed water. Energy
130
Bibliography
36, 2142 – 2150. doi:10.1016/j.energy.2010.05.029. 5th Dubrovnik Conference on
Sustainable Development of Energy, Water & Environment Systems.
Zhang, L., Wang, Q., Wang, B., Yang, G., Lucia, L.A., Chen, J., 2015. Hydrothermal Carbonization
of Corncob Residues for Hydrochar Production. Energy & Fuels 29, 872–876. doi:dx.doi.org/10.1021/ef502462p, arXiv:https://doi.org/10.1021/ef502462p.
Zhang, X., Yan, S., Tyagi, R.D., Surampalli, R.Y., 2013. Energy balance and greenhouse gas
emissions of biodiesel production from oil derived from wastewater and wastewater sludge.
Renewable Energy 55, 392 – 403. doi:10.1016/j.renene.2012.12.046.
Zhekisheva, M., Boussiba, S., Khozin-Goldberg, I., Zarka, A., Cohen, Z., 2002. Ac-
cumulation of oleic acid in haematococcus pluvialis (chlorophyceae) under
nitrogen starvation or high light is correlated with that of astaxanthin esters.
Journal of Phycology 38, 325–331. doi:10.1046/j.1529-8817.2002.01107.x,
arXiv:https://onlinelibrary.wiley.com/doi/pdf/10.1046/j.1529-8817.2002.01107.x.
Zhou, C., Zhu, X., Qian, F., Shen, W., Xu, H., Zhang, S., Chen, J., 2016. Catalytic hydrothermal
liquefaction of rice straw in water/ethanol mixtures for high yields of monomeric phenols
using reductive cuznal catalyst. Fuel Processing Technology 154, 1 – 6. doi:10.1016/j.fuproc.2016.08.010.
Zhou, W., Wang, J., Chen, P., Ji, C., Kang, Q., Lu, B., Li, K., Liu, J., Ruan, R., 2017. Bio-mitigation
of carbon dioxide using microalgal systems: Advances and perspectives. Renewable and
Sustainable Energy Reviews 76, 1163 – 1175. doi:10.1016/j.rser.2017.03.065.
Zöhrer, H., Vogel, F., 2013. Hydrothermal catalytic gasification of fermentation residues from a
biogas plant. Biomass and Bioenergy 53, 138 – 148. doi:10.1016/j.biombioe.2012.12.030. 20th European Biomass Conference.
Zhuang, X., Zhan, H., Huang, Y., Song, Y., Yin, X., Wu, C., 2018. Denitrification and desulphur-
ization of industrial biowastes via hydrothermal modification. Bioresource Technology 254,
121 – 129. doi:10.1016/j.biortech.2018.01.061.
van der Zwaan, B., Smekens, K., 2009. CO2 Capture and Storage with Leakage in an Energy-
Climate Model. Environmental Modeling & Assessment 14, 135–148. doi:10.1007/s10666-007-9125-3.
131

A List of symbols
a Roughness (-)
ASTM American Society for Testing Materials
C% Weight percentage of carbon in algae biomass (wt.%)
CC Climate change
CCD Central Composite Design
CCGT Combined Cycle Gas Turbine
CH U Switzerland, Unit
cp,hex Specific heat capacity of hexane (2.26 kJ kg−1 °C−1)
cp,lipid Specific heat capacity of lipid (kJ kg−1 °C−1)
cp,MeOH Specific heat capacity of methanol (kJ kg−1 °C−1)
cv Specific heat of water (kJ kg−1 °C−1)
cw Latent heat of evaporation (kJ kg−1)
CCS Carbon Capture and Storage
CCU Carbon Capture and Utilization
d Diameter of pipe (m)
DAILY Disability-Adjusted Life Year
DAP Diammonium phosphate
DECERNS Decision Evaluation in Complex Risk Network System
df degree of freedom
DoE Desing of Experiment
DW Dry weight (g L−1)
EDAP Energy requirement of the production of DAP (MJ kg−1)
EI 99 Eco-indicator 99
EP Energy requirement of the paddlewheels (MJ)
EPS Environmental Priority Strategies
EUA European Union Allowance
133
Appendix A. List of symbols
f Blasius friction factor (-)
FC Fixed carbon (wt.%)
GEC (%) Carbon gasification efficiency (-)
GHG Greenhouse gas
GWP Global warming potential
h Differential head (m)
HHV Higher Heating Value (MJ kg−1)
HS Hazard severity
HTC Hydrothermal carbonization
HTL Hydrothermal liquefaction
HTG Hydrothermal gasification
I′RED Red light intensity µmol photonm−2s−1
I′BLUE Blue light intensity µmol photonm−2s−1
I′GREEN Gren light intensity µmol photonm−2s−1
le Equivalent pipe length (m)
LCA Life Cycle Analysis
LCI Life Cycle Inventory
LCIA Life Cycle Impact Assessment
LED Light Emitting Diode
kβ Correction factor that is determined by the elbow’s degree (-)
MAVT Multi Attribute Value Theory
MCDA Multi-Criteria Decision Analysis
malgae Mass of algae (kg)
mCO2 Mass of CO2 (kg)
MEA Monoethanolamine
mPt 10−3 Point (-)
MTP Microtiter plate
µ Dynamic viscosity (Pa · s)
mw Amount of evaporated water (kg)
NER Net Energy Ratio
NGCC Natural gas combined cycle
NORP Number of ORP Units (-)
ηdryer Efficiency of the dryer
ηgasif Conversion efficiency of gasificiation (-)
OD Optical Density (-)
OP Ozone depletion
ORP Open Raceway-pond
P Biomass productivity (g L−1d−1)
PAF Potentially Affected Fraction (m2 yr)
134
PDF Potentially Disappeared Fraction (m2 yr)
PCC Post carbon capture
Pgrinder Performance of the grinder (kWh)
Pp Energy requirement of a paddlewheel (MJ)
Qtrans Required heat of transesterification (kJ)
r Radius of PBR tube (m)
rC Required amount of CO2 (kg)
rharv Rate of harvesting (=dilution rate) (-)
R Risk level
Re Reynolds number (-)
RC Resource Consumption
RGB Red, Green, Blue
RSM Response Surface Methodology
ρ Density (kg m−3)
TA Terrastrial acidification
TAG Triacylglycerol
tPBR Tubular photobioreactor
TDS Total dissolved solids
TRL Technical Readiness Level
ξ Elbows minor loss coefficient (-)
γ Efficiency of pumping (-)
Ybio−oil Yield of bio-oil (-)
YGAS Gas yield (mol kg−1)
VM Volatile matter (wt.%)
whex Amount of hexane entering the column (kg h−1)
135


137
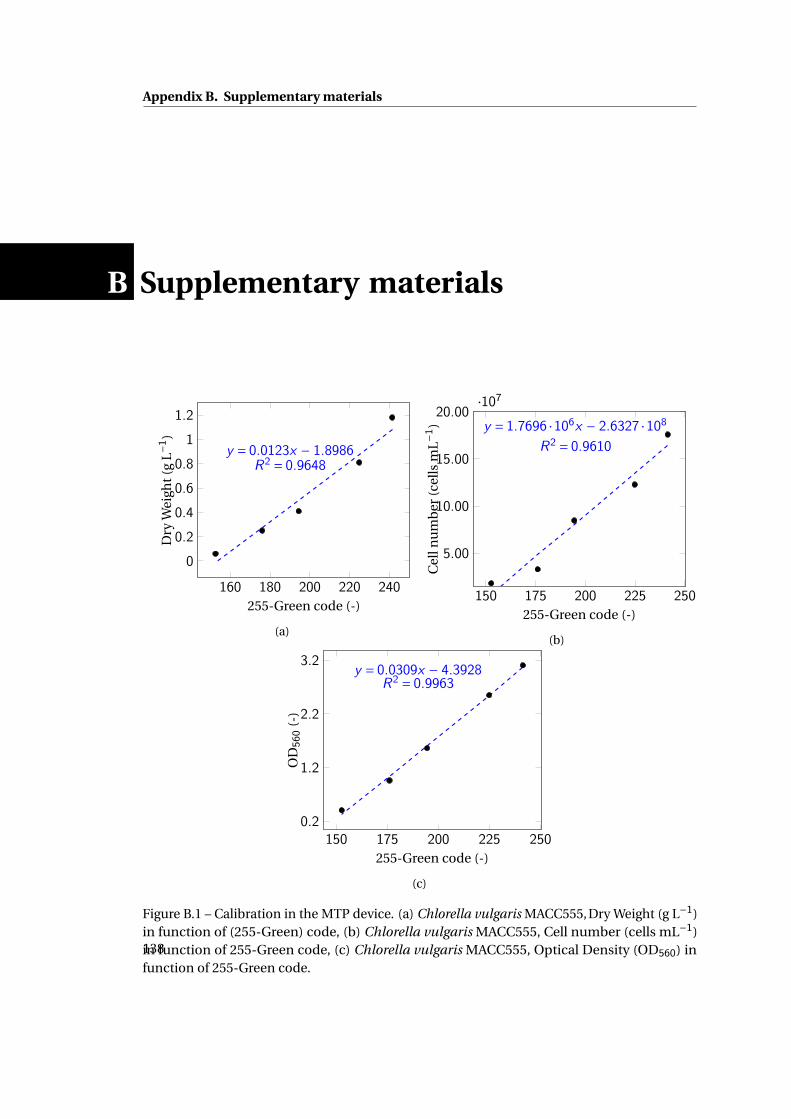
Appendix B. Supplementary materials
B Supplementary materials
160 180 200 220 240
0
0.2
0.4
0.6
0.8
1
1.2
y = 0.0123x − 1.8986R2 = 0.9648
255-Green code (-)
Dry
Wei
ght(
gL−
1)
(a)
150 175 200 225 250
5.00
10.00
15.00
20.00·107y = 1.7696 ·106x − 2.6327 ·108
R2 = 0.9610
255-Green code (-)
Cel
lnu
mb
er(c
ells
mL−
1)
(b)
150 175 200 225 2500.2
1.2
2.2
3.2y = 0.0309x − 4.3928
R2 = 0.9963
255-Green code (-)
OD560
(-)
(c)
Figure B.1 – Calibration in the MTP device. (a) Chlorella vulgaris MACC555,Dry Weight (g L−1)in function of (255-Green) code, (b) Chlorella vulgaris MACC555, Cell number (cells mL−1)in function of 255-Green code, (c) Chlorella vulgaris MACC555, Optical Density (OD560) infunction of 255-Green code.
138

0.2 0.6 1 1.4 1.8 2.2 2.6 3
0
0.2
0.4
0.6
0.8
1
1.2 y = 0.4014x − 0.1471R2 = 0.9779
OD560 (-)
Dry
Wei
ght(
gL−1
)
(a)
0.2 1.2 2.2 3.20.00
5.00
10.00
15.00
20.00·107
y = 0.5760 ·108x − 1.2072 ·107R2 = 0.9748
OD560 (-)
Cel
lnu
mb
er(c
ells
mL−
1)
(b)
Figure B.2 – Calibration for the laboratory scaled stirred tank photobioreactors (a) Chlorellavulgaris MACC555, Dry Weight content (g L−1) in function of Optical density (OD560), (b)Chlorella vulgaris MACC555, Cell number (cells mL−1) in function of Optical density (OD560).
139
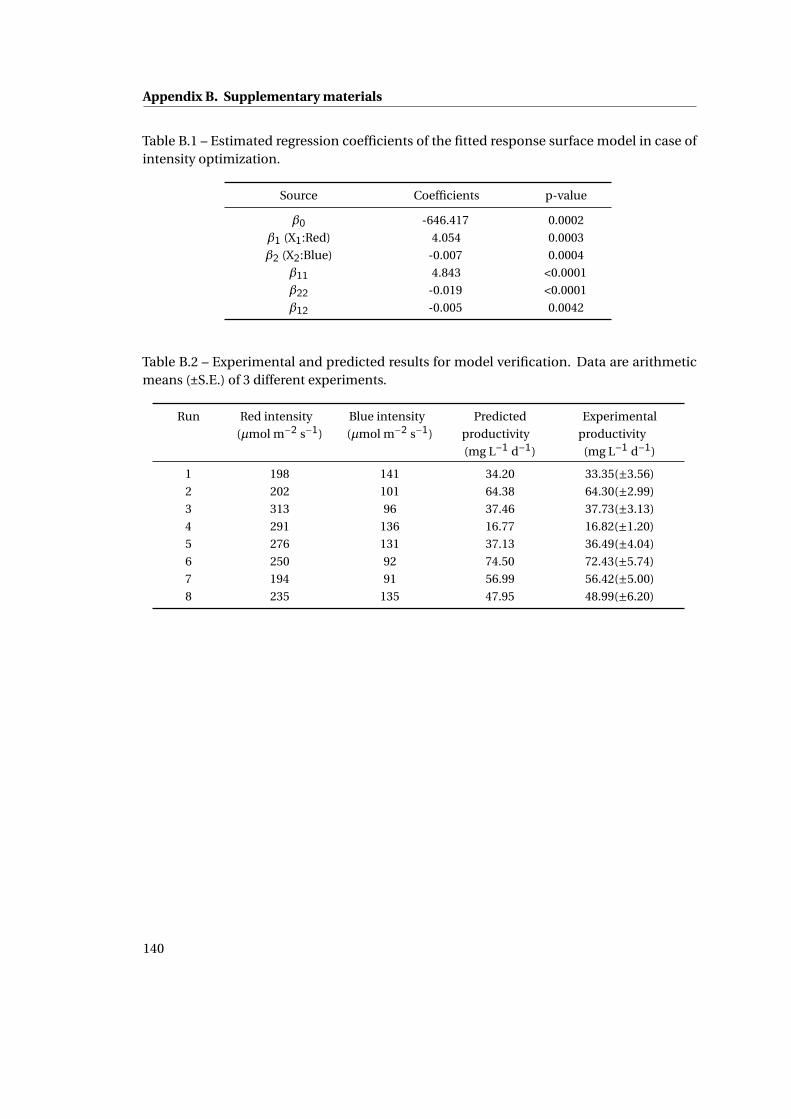
Appendix B. Supplementary materials
Table B.1 – Estimated regression coefficients of the fitted response surface model in case ofintensity optimization.
Source Coefficients p-value
β0 -646.417 0.0002
β1 (X1:Red) 4.054 0.0003
β2 (X2:Blue) -0.007 0.0004
β11 4.843 <0.0001
β22 -0.019 <0.0001
β12 -0.005 0.0042
Table B.2 – Experimental and predicted results for model verification. Data are arithmeticmeans (±S.E.) of 3 different experiments.
Run Red intensity
(µmol m−2 s−1)
Blue intensity
(µmol m−2 s−1)
Predicted
productivity
(mg L−1 d−1)
Experimental
productivity
(mg L−1 d−1)
1 198 141 34.20 33.35(±3.56)
2 202 101 64.38 64.30(±2.99)
3 313 96 37.46 37.73(±3.13)
4 291 136 16.77 16.82(±1.20)
5 276 131 37.13 36.49(±4.04)
6 250 92 74.50 72.43(±5.74)
7 194 91 56.99 56.42(±5.00)
8 235 135 47.95 48.99(±6.20)
140
DECLARATION
I, Daniel Fozer, the undersigned, hereby declare, that this Ph.D. dissertation is my
own work, and I have only used the sources listed in the reference list. I have
clearly indicated all parts that were taken from other sources and quoted literally
or paraphrase.
Budapest, 25.01.2019
Daniel Fozer
NYILATKOZAT
Alulírott Fózer Dániel kijelentem, hogy ezt a doktori értekezést magam
készítettem és abban csak a megadott forrásokat használtam fel. Minden olyan
részt, amelyet szó szerint, vagy azonos tartalomban, de átfogalmazva más
forrásból átvettem, egyértelműen, a forrás megadásával megjelöltem.
Budapest, 2019. 01. 25.
Fózer Dániel