trend analysis of monthly total rainfall and monthly mean air
TRANSCRIPT
Çukurova Üniversitesi Mühendislik ve Mimarlık Fakültesi Dergisi, 32(2), ss. 65-75, Haziran 2017 Çukurova University Journal of the Faculty of Engineering and Architecture, 32(2), pp. 65-75, June 2017
Ç.Ü. Müh. Mim. Fak. Dergisi, 32(2), Haziran 2017 65
Trend Analysis of Monthly Total Rainfall and Monthly Mean Air
Temperature Variables of Yozgat in Turkey
Murat AY*1
, Serhat ÖZYILDIRIM2
1Bozok Üniversitesi, Mühendislik Mimarlık Fakültesi, İnşaat Mühendisliği Bölümü,
Yozgat/Türkiye 2Devlet Meteoroloji İşleri 7. Bölge Müdürlüğü, Yozgat/Türkiye
Abstract
The purpose of this study is to detect possible trends in monthly total rainfall and monthly mean air
temperature on the basis of Mann-Kendall (MK) and a new method recently proposed by Şen. The new
method is used for trend analysis of both variables’ data recorded at Yozgat province in Turkey over the
period 1970-2016. For comparison purpose, the well-known MK trend test is also applied to the same
data. In the first step, the historical data were divided into two time periods: 1970-1992 (276 values) and
1993-2016 (288 values). Each time part was analysed individually, and both parts were compared with
each other. Consequently, there is no statistically significant trend for both variables at 95% two-tailed
confidence interval in the period 1970-1992 and 1993-2016 according to the Mann-Kendall trend test.
However, there is an increasing trend for monthly total rainfall at 95% one-way confidence interval in the
period 1970-1992 according to the Şen trend test. Moreover, there is an increasing trend for monthly
mean air temperature in the period 1993-2016 according to the Şen trend test.
Keywords: Mann-Kendall test, Rainfall, Şen’s trend test, Temperature, Turkey, Yozgat
Yozgat’ın Aylık Toplam Yağış ve Aylık Ortalama Hava Sıcaklıklarının Trend
Analizi
Öz
Bu çalışmanın amacı, aylık toplam yağış ve ortalama aylık hava sıcaklığında olası trendleri Mann-
Kendall (MK) ve yakın zamanda Şen tarafından önerilen yeni bir yöntem ile belirlemektir. Şen metodu,
1970 ve 2016 tarihleri arasında Türkiye’de Yozgat’ta kaydedilen iki değişkenin trend analizi için
kullanılmıştır. Karşılaştırma amacıyla iyi bilinen MK trend testi de aynı verilere uygulanmıştır. İlk
adımda, veriler 1970-1992 ve 1993-2016 olmak üzere iki zaman aralığına ayrılmıştır. Her iki zaman
aralığı ayrı ayrı analiz edilmiş ve birbiriyle karşılaştırılmıştır. Sonuç olarak, MK testine göre 1970-1992
ve 1993-2016 zaman aralıklarında her iki değişken için %95 çift yönlü güven aralığında istatistiksel
olarak anlamlı bir trend bulunmamıştır. Ancak, Şen trend testine göre 1970-1992 döneminde aylık toplam
yağış için %95 tek yönlü güven aralığında artan bir trendin olduğu bulunmuştur. Ayrıca, Şen trend testine
göre 1993-2016 döneminde ortalama aylık hava sıcaklığı için de artan bir trendin olduğu bulunmuştur.
Anahtar Kelimeler: Mann-Kendall test, Sıcaklık, Şen’s trend test, Türkiye, Yağış, Yozgat
*Sorumlu yazar (Corresponding author): Murat AY, [email protected]
Geliş tarihi: 20.02.2017 Kabul tarihi: 31.05.2017
Trend Analysis of Monthly Total Rainfall and Monthly Mean Air Temperature Variables of Yozgat in Turkey
66 Ç.Ü. Müh. Mim. Fak. Dergisi, 32(2), Haziran 2017
1. INTRODUCTION
Low, medium and high values of a variable are
very important issue in hydrological,
meteorological and climatological events.
Moreover, these values are used to decide various
design parameters based on scientific aspects and
real applications everywhere in the world.
According to the IPCC reports and some
documents about global climate change, mean
surface temperature has increased by 0.6 ± 0.2°C
over the last century, and it is expected the
increase in temperature could be 1.4 - 5.8 °C by
2100 [1-4]. Temperature and precipitation changes
have not been uniform globally, but have varied
different regions and parts around the world. As
for some studies about this issue, detection trend of
the precipitation variable has been investigated in
many studies in different countries of the world
[5-19]. For instance, Yavuz and Erdogan (2012)
[20] analysed precipitation trends by using MK
rank correlation test for all regions of Turkey and
performed by using monthly and annual
precipitation data, recorded at 120 stations during
the period 1975-2009. Haktanir et al. (2013) [21]
investigated on 48-year-long complete and 79-
year-long incomplete maximum daily precipitation
series recorded at Alexandria, Egypt, and on 61-
year-long maximum daily precipitation series
recorded at Antalya. Dinpashoh et al. (2014) [22]
analysed trends of precipitation by using the MK
trend detection test and determined the trends on
monthly, seasonal, and annual time scales by using
the precipitation data for the period of time 1955-
2004 of the 16 stations selected from Iran. Fathian
et al. (2014) [23] used three non-parametric
statistical tests, the MK, Spearman rho, and Sen’s
T, and applied to estimate the trends in the annual
and seasonal time series of temperature,
precipitation, and streamflow at 95 stations in
Urmia Lake basin, Iran. They found that
temperature has significantly increased whereas
trends in precipitation were not basin-wide. It was
seen that two parameters have different trend.
Addisu et al., (2015) [24] found that MK trend test
gave the maximum and minimum temperature
analysis resulted in a general increasing trend
whereas, rainfall amount resulted in a general
decreasing trend in Ethiopia. Chattopadhyay and
Edwards (2016) [25] analysed the long-term trends
in annual precipitation and mean annual air
temperature (for the period 1950-2010) for the
state of Kentucky.
In this study, monthly total rainfall (mm) and
average monthly air temperature (°C) data were
analysed with two different trend tests. In this
context, study area and data are given in Section 2;
the trend tests are given in Section 3, applications
are given in Section 4, and conclusion and remarks
are given in Section 5.
2. STUDY AREA AND DATA
Yozgat Province is in Middle-Kizilirmak basin and
is the border of the Kizilirmak River starting from
Zara/Sivas province in the Central Anatolia, Bozok
Plateau. The province is nearly at 34º05'-36º10'
eastern longitudes and 38º40'-40º18' northern
latitudes. The number of people was determined as
421041 people according to the 2016 year’s
survey. Generally, livelihood of the province is
agriculture and livestock, and industry has
medium-sized structure. About 14037 km2 area of
Yozgat is the 15th
largest city in Turkey in terms of
geographical area. The city centre that has the
rugged terrain is approximately 1298 m elevation.
The annual average rainfall is about 400-600 mm
and this value is smaller than annual mean rainfall
(643 mm/year) of Turkey. Many irrigation,
drinking water, flood protection, energy structures
and dams were also constructed and there are some
projects on under construction in the province [26].
Data of the monthly total rainfall and monthly
mean air temperature recorded at Yozgat were
used in the study, and the name of gauging station
for both variables is Yozgat-17140, only station in
the city centre, according to State Meteorology
Works in Yozgat. Number of the data is 564, and
Table 1 shows the basic statistics of monthly total
rainfall and monthly mean air temperature for the
period 1970-2016 (47 years, 564 values). There is
no missing data in all of rainfall and temperature
time series. But, there is some unrecorded rainfall
data in some times (for instance: August 1977,
September 1985, July 1997, July 2006, and August
2013) owing to non-existing rainfall in Yozgat.

Murat AY, Serhat ÖZYILDIRIM
Ç.Ü. Müh. Mim. Fak. Dergisi, 32(2),Haziran 2017 67
Table 1. Basic statistics of monthly total rainfall
and monthly mean air temperature of
Yozgat for the time period 1970-2016
(47 years)
Parameters
Monthly
total rainfall
(mm)
Monthly
mean air
temperature
(°C)
Date ranges 1970-2016 1970-2016
Number of data 564 564
Minimum value 0 -7
Maximum value 192.03 +24.4
Mean value (µ) +49.04 +9.07
Standard deviation (σ) 38.04 7.94
Variation coefficient (Cvx) 0.78 0.88
Skewness coefficient (Csx) +0.84 -0.089
3. TREND TESTS
3.1. Mann-Kendall (MK) Trend Test
The MK test is one of the non-parametric tests to
detect trend in a time series especially for
climatological, meteorological, and hydrological
data. Commonly used MK trend test is not
described here because it can be found in related
studies [27-33].
3.2. Şen Trend Test
A recorded hydrological time series is divided into
two equal halves from the first date to the end date,
and both sub-series are separately sorted in
ascending manner. The first sub-series (Xi) is
located on X-axis, and the other sub-series (Xj) is
located on Y-axis (Figure 1) based on the
Cartesian coordinate system. If data are collected
on the 1:1 (45˚) straight line, it can be said that
there is no trend (a trendless time series). If data
are in the below triangular area of the 1:1 straight
line, it can be said that there is a decreasing trend
in time series. If data are in the upper triangular
area of the 1:1 straight line, it can be said that there
is an increasing trend in time series [34-37].
Moreover, low, medium and high values of a
parameter can be graphically evaluated with this
method.
Figure 1. Illustration of decreasing, increasing
and trendless areas [35]
Şen (2015) [34] proposed a new statistical process
to the method. Steps of this method are given by
the following formulas 1-6.
(s)
n[ y
- y
] (1)
s
n [ y
- (y
y )- y
] (2)
y y
(y y )- (y )- (y )
y y
(3)
s
n
n( -
y y ) (4)
s √
n n √( -
y y ) (5)
L - s riti al s (6)
In here, : mean of the first data, : mean of the
second data, ρ: correlation between first and
second data, s: slope value, n: number of data, σ:
standard deviation of all data, : slope standard
deviation, and scritical denotes Z critical values in
one-way hypothesis at 95% confidence level.
Critical upper and lower limits values calculated
by Equation 6 are established to make limits for
hypothesis test. If slope value, s, of each station is
in outside the lower and upper confidence limits,
0
400
800
1200
0 400 800 1200
Th
e s
eco
nd
ord
ered
da
ta, X
j The first ordered data, Xi
Decreasing trend area
Medium
values
1:1
straight
line (45°)
Trendless
time series
Low
values
Increasing trend area
High
values
Trend Analysis of Monthly Total Rainfall and Monthly Mean Air Temperature Variables of Yozgat in Turkey
68 Ç.Ü. Müh. Mim. Fak. Dergisi, 32(2), Haziran 2017
and thus, the alternative hypotheses, H1, are
approved, and it can be said that there is a trend
(Yes) in time series. The type of trend is stated
depending on the slope (s) sign. Slope value (s)
can be positive or negative. This means that there
is an increasing (+) or a decreasing (-) trend in
time series [35]. This method was applied annual
flow, annual total flow, annual total precipitation
by Şen [35], and the long-term recorded air
temperature [37]. Ay and Kisi [38] investigated
rainfall variations of some provinces in Turkey.
Kisi and Ay [39] determined the trend of some
water quality variables. Ay and Kisi [40] applied
to the precipitation data. Şen [34] applied to air
temperature, streamflow and rainfall data.
4. APPLICATION
The consequences of changes in monthly total
rainfall and monthly mean air temperature make it
crucial for water resource designers to accurately
evaluate their behaviour and impacts on related
hydrologic variables. This case also brings about
various problems in order to solve this issue. In
this perspective, trend analysis is also one of the
most important issues in any global climate change
problem, and it provides a significant view for
meteorological, hydrological, and climatological
variables in past and future time’s changes.
In this context, trend analysis of monthly total
rainfall and monthly mean air temperature is
individually considered in two time periods,
1970-1992 (23 years, 276 values) and 1993-2016
(24 years, 288 values). These parts are examined in
following subsections.
4.1. Trend Analysis of the Period 1970-1992
(23 Years) for Monthly Total Rainfall and
Monthly Mean Air Temperature
First part of the study is for monthly total rainfall
and monthly mean air temperature in the period
1970-1992. Assumptions such as pre-whitening
process [41] were not applied to the data in this
study. Original recorded data were taken into
consideration in order not to lose originality of the
time series in the trend methods [14, 42, 43, and
44]. Moreover, H0 hypothesis refers to “There is
no statistically significant trend in the time series”.
Opposite hypothesis, H1, refers to “There is a
statistically significant trend in the time series”.
Table 2 shows the results of MK trend test of
monthly total rainfall and monthly mean air
temperature for the period 1970-1992. Z value of
each variable was calculated and compared with
normal distribution critical Z values at 95% two-
tailed confidence intervals. It can be seen that the
calculated Z values (+1.09 and -0.082) are smaller
than the critical Z value (±1.96). Thus, monthly
total rainfall and monthly mean air temperature
have no trend (trendless time series) according to
the MK trend test; and there is no statistically
significant trend. Therefore, H0 hypothesis (the
null hypothesis) is accepted for both variables.
Table 2. Results of the Mann-Kendall trend test
for Yozgat over the period 1970-1992
(23 years)
Parameters
Monthly
total rainfall
(mm)
Monthly mean
air temperature
(°C)
Data ranges 1970-1992 1970-1992
Number of data 276 276
Test statistic (S) 1665 -126
Calculated
± Z value +1.09 -0.082
Z critical value
(α=0.05, Two-tailed) ±1.96 ±1.96
Trend
No
(Trendless
time series)
No
(Trendless
time series)
H0, null hypothesis Accepted Accepted
Results of the Şen trend test are also given in
Figures 2, 3 and Table 3. Low, medium and high
values of the monthly total rainfall and monthly
mean air temperature can be clearly seen in these
graphics. Moreover, some statistical features and
type of trend can be seen in Table 3 (in the last
row). For instance, an increasing trend in medium
and high values is clearly seen for monthly total
rainfall in Figure 2 (b); moreover, monthly total

Murat AY, Serhat ÖZYILDIRIM
Ç.Ü. Müh. Mim. Fak. Dergisi, 32(2),Haziran 2017 69
rainfall has the increasing time series as seen in
Table 3; therefore, H1 hypothesis is accepted.
Slope value (+0.04), as seen in Table 3, is out of
critical limits (-0.00244<s<+0.00244) for 95%
confidence interval. Moreover, it can be seen the
linear increasing trend from the Figure 2(a).
Figure 2. Results of Şen [34] trend of monthly
total rainfall and (a) time series and (b)
scatter diagrams for the period 1970-
1992
For monthly mean air temperature, a trendless time
series in high, medium and low values is seen in
Figure 3(b); moreover, monthly mean air
temperature has a trendless time series as seen in
Table 3; therefore, H0 hypothesis is accepted for
this variable. Slope value (-0.0001) of this variable
in Table 3 is in critical limits
(-0.000415<s<+0.000415) for 95% confidence
interval. Moreover, it can be seen the results of
linear trend method from the Figure 3(a).
Figure 3. Results of Şen [34] trend of monthly
mean air temperature and (a) time series
and (b) scatter diagrams for the period
1970-1992
It can be seen the linear function
(y=0.041x+43.05) in Figure 2(a). This trend line
can refer to increasing way; and slope of the
function is positive way. This result is also similar
with Şen’s trend test (see Table 3) but Mann-
Kendall trend test (see Table 2). In Figure 3(a), the
linear function is y=-0.01x+54.74. Slope of the
function is slightly negative way, and linear trend
is too close to the zero value. This result is also
similar with Şen’s trend test (see Table 3) and
Mann-Kendall trend test (see Table 2).
y = 0.041x + 43.05
R² = 0.0076
0
40
80
120
160
200
Ra
infa
ll (
mm
)
Time, t (1970-1992)
Intercept, a= 43.05
Slope, s= +0.04 (a)
y = 1.181x - 2.83
R² = 0.99
0
40
80
120
160
200
0 40 80 120 160 200
Ra
infa
ll (
mm
) 1
98
1-1
992
Rainfall (mm) 1970-1981
y = -0.01x + 54.74
R² = 0.0003
-10
-5
0
5
10
15
20
25
30
Tem
pera
ture, (°
C )
Time, t (1970-1992)
Intercept, a=54.74
Slope, s= -0.0001
y = 1.017x - 0.16
R² = 0.99
-10
-5
0
5
10
15
20
25
30
-10 -5 0 5 10 15 20 25 30
Tem
pera
ture (
°C )
19
81
-1992
Temperature (°C) 1970-1981
1:1 line no-
trend (45˚)
Trend line
(45.48˚)
(a)
(b)
Trend line
(49.74˚ )
1:1 line no-
trend (45˚)
(b)

Trend Analysis of Monthly Total Rainfall and Monthly Mean Air Temperature Variables of Yozgat in Turkey
70 Ç.Ü. Müh. Mim. Fak. Dergisi, 32(2), Haziran 2017
Table 3. Results of Şen [34] trend test for the
period 1970-1992 (23 years)
Parameters Monthly total
rainfall
Monthly mean
air
temperature
Unit mm °C
Number of data, n 276 276
Slope, s (+ or -) +0.04 -0.0001
Intercept, a 43.05 54.74
Standard deviation, σn 38.44 7.88
Mean value, n 48.85 8.49
Correlation coefficient
(r), +0.9961 +0.9973
Slope standard
deviation, σs 0.00148 0.00025
Significance level,
α=0.05 (One-way) 0.05 0.05
Z critical value
(α=0.05)(One-way) ±1.645 ±1.645
Lower CL (confidence
limit) (95%) -0.00244 -0.000415
Upper CL (confidence
limit) (95%) +0.00244 +0.000415
Hypothesis (H0 or H1) H1 H0
Decision (Yes or No) Yes No
Type of trend
(increasing, decreasing
or no trend)
Increasing
trend
Trendless
time series
4.2. Trend Analysis in the Period 1993-2016
(24 Years) for Monthly Total Rainfall and
Monthly Mean Air Temperature
Data were divided into two sets because it provides
both sufficient data for each time period and to see
how trend changes for two time periods (for 23
years and 24 years). As we know, climate change
effects around the world and our region are very
important. It is thought that it may be seen these
effects especially in the second time period,
1993-2016.
Second part of the study includes the other time
period 1993-2016. Table 4 shows the results of the
MK trend test for monthly total rainfall and
monthly mean air temperature. Z value of each
variable was calculated and compared with normal
distribution critical Z values at 95% two-tailed
confidence intervals. It can be seen that the
calculated Z values (-0.64 and +0.78) are smaller
than the critical Z value. Thus, monthly total
rainfall and monthly mean air temperature have no
trend (trendless time series) according to the MK
trend test; and there is no statistically significant
trend. Therefore, H0 hypothesis (the null
hypothesis) is accepted for monthly total rainfall
and monthly mean air temperature of Yozgat.
Table 4. Results of the Mann-Kendall trend test
for Yozgat over the period 1993-2016
(24 years)
Parameters
Monthly total
rainfall
(mm)
Monthly mean
air temperature
(°C)
Data ranges 1993-2016 1993-2016
Number of data 288 288
Test statistic (S) -1043 1270
Calculated
± Z value -0.64 +0.78
Z critical value
(α=0.05, Two-
tailed)
±1.96 ±1.96
Trend
No
(Trendless time
series)
No
(Trendless time
series)
H0, null hypothesis Accepted Accepted
Results of the Şen [34] trend test are also given in
Figures 4, 5 and Table 5. Low, medium and high
values of the monthly total rainfall and monthly
mean air temperature can be clearly seen in these
graphics over the period 1993-2016. In the same
way, some statistical features and type of trend can
be seen in Table 5 (in the last row). For instance, a
trendless time series in high, medium, and low
values is seen for monthly total rainfall in Figure
4(b); moreover, monthly total rainfall has a
trendless time series as seen in Table 5; therefore,
H0 hypothesis is accepted. Slope value (+0.0018)
of this variable in Table 5 is in critical limits
(-0.0030<s<+-0.0030) for 95% confidence
interval. Moreover, it can be seen the results of
linear trend method from the Figure 4(a).
Murat AY, Serhat ÖZYILDIRIM
Ç.Ü. Müh. Mim. Fak. Dergisi, 32(2),Haziran 2017 71
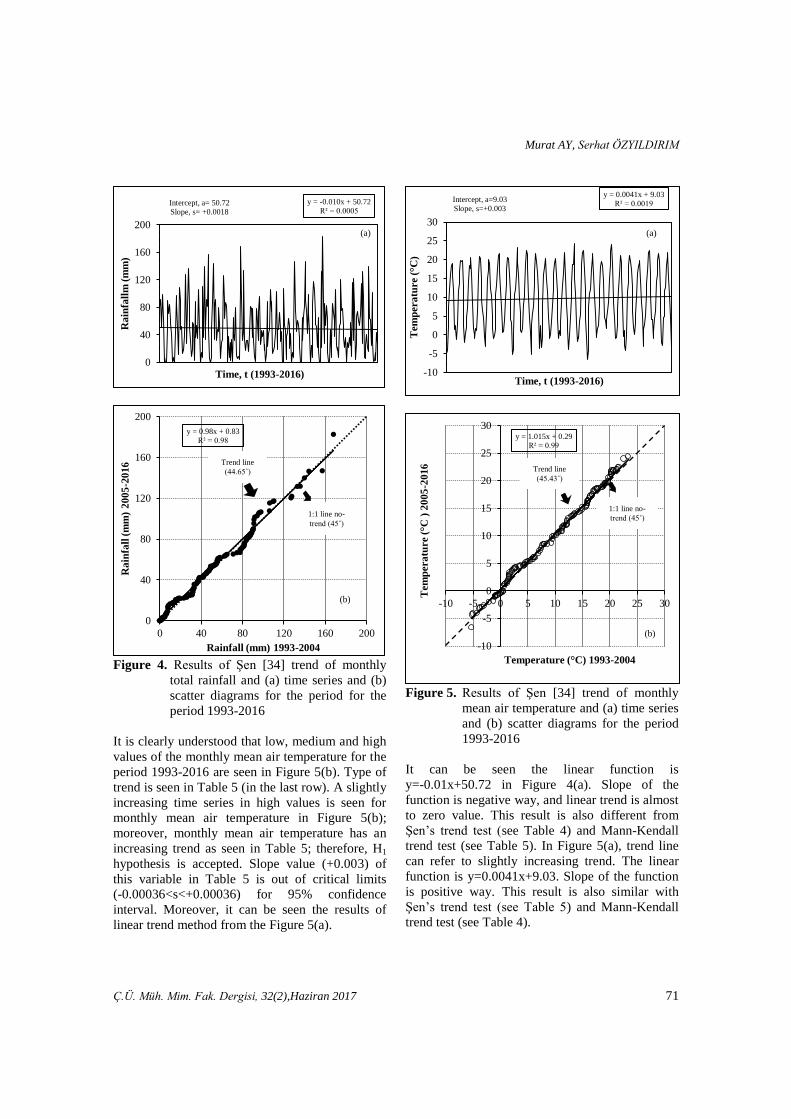
Figure 4. Results of Şen [34] trend of monthly
total rainfall and (a) time series and (b)
scatter diagrams for the period for the
period 1993-2016
It is clearly understood that low, medium and high
values of the monthly mean air temperature for the
period 1993-2016 are seen in Figure 5(b). Type of
trend is seen in Table 5 (in the last row). A slightly
increasing time series in high values is seen for
monthly mean air temperature in Figure 5(b);
moreover, monthly mean air temperature has an
increasing trend as seen in Table 5; therefore, H1
hypothesis is accepted. Slope value (+0.003) of
this variable in Table 5 is out of critical limits
(-0.00036<s<+0.00036) for 95% confidence
interval. Moreover, it can be seen the results of
linear trend method from the Figure 5(a).
Figure 5. Results of Şen [34] trend of monthly
mean air temperature and (a) time series
and (b) scatter diagrams for the period
1993-2016
It can be seen the linear function is
y=-0.01x+50.72 in Figure 4(a). Slope of the
function is negative way, and linear trend is almost
to zero value. This result is also different from
Şen’s trend test (see Table 4) and Mann-Kendall
trend test (see Table 5). In Figure 5(a), trend line
can refer to slightly increasing trend. The linear
function is y=0.0041x+9.03. Slope of the function
is positive way. This result is also similar with
Şen’s trend test (see Table 5) and Mann-Kendall
trend test (see Table 4).
y = -0.010x + 50.72
R² = 0.0005
0
40
80
120
160
200
Ra
infa
llm
(m
m)
Time, t (1993-2016)
Intercept, a= 50.72
Slope, s= +0.0018
y = 0.98x + 0.83
R² = 0.98
0
40
80
120
160
200
0 40 80 120 160 200
Ra
infa
ll (
mm
) 2
00
5-2
016
Rainfall (mm) 1993-2004
y = 0.0041x + 9.03
R² = 0.0019
-10
-5
0
5
10
15
20
25
30
Tem
pera
ture (
°C)
Time, t (1993-2016)
Intercept, a=9.03
Slope, s=+0.003
(a)
y = 1.015x + 0.29
R² = 0.99
-10
-5
0
5
10
15
20
25
30
-10 -5 0 5 10 15 20 25 30
Tem
pera
ture (
°C )
20
05
-2016
Temperature (°C) 1993-2004
Trend line
(45.43˚)
(b)
1:1 line no-
trend (45˚)
Trend line
(44.65˚)
1:1 line no-
trend (45˚)
(a)
(b)
Trend Analysis of Monthly Total Rainfall and Monthly Mean Air Temperature Variables of Yozgat in Turkey
72 Ç.Ü. Müh. Mim. Fak. Dergisi, 32(2), Haziran 2017
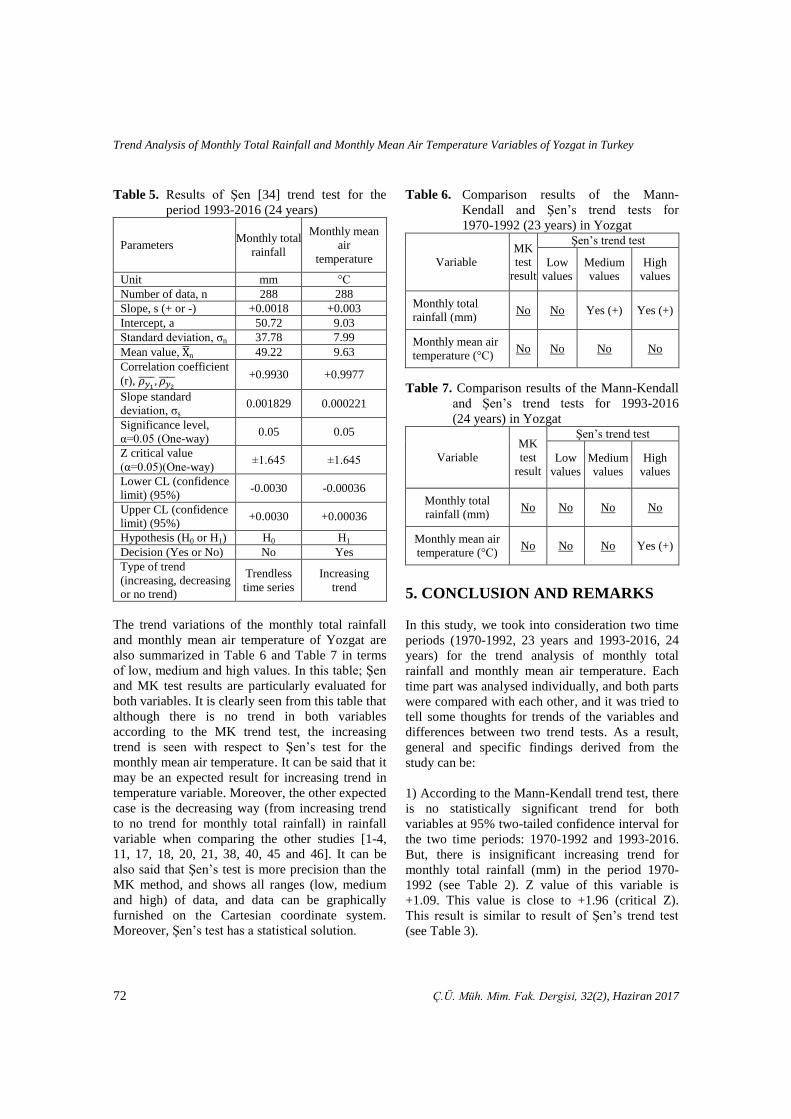
Table 5. Results of Şen [34] trend test for the
period 1993-2016 (24 years)
Parameters Monthly total
rainfall
Monthly mean
air
temperature
Unit mm °C
Number of data, n 288 288
Slope, s (+ or -) +0.0018 +0.003
Intercept, a 50.72 9.03
Standard deviation, σn 37.78 7.99
Mean value, n 49.22 9.63
Correlation coefficient
(r), +0.9930 +0.9977
Slope standard
deviation, σs 0.001829 0.000221
Significance level,
α=0.05 (One-way) 0.05 0.05
Z critical value
(α=0.05)(One-way) ±1.645 ±1.645
Lower CL (confidence
limit) (95%) -0.0030 -0.00036
Upper CL (confidence
limit) (95%) +0.0030 +0.00036
Hypothesis (H0 or H1) H0 H1
Decision (Yes or No) No Yes
Type of trend
(increasing, decreasing
or no trend)
Trendless
time series
Increasing
trend
The trend variations of the monthly total rainfall
and monthly mean air temperature of Yozgat are
also summarized in Table 6 and Table 7 in terms
of low, medium and high values. In this table; Şen
and MK test results are particularly evaluated for
both variables. It is clearly seen from this table that
although there is no trend in both variables
according to the MK trend test, the increasing
trend is seen with respect to Şen’s test for the
monthly mean air temperature. It can be said that it
may be an expected result for increasing trend in
temperature variable. Moreover, the other expected
case is the decreasing way (from increasing trend
to no trend for monthly total rainfall) in rainfall
variable when comparing the other studies [1-4,
11, 17, 18, 20, 21, 38, 40, 45 and 46]. It can be
also said that Şen’s test is more precision than the
MK method, and shows all ranges (low, medium
and high) of data, and data can be graphically
furnished on the Cartesian coordinate system.
Moreover, Şen’s test has a statistical solution.
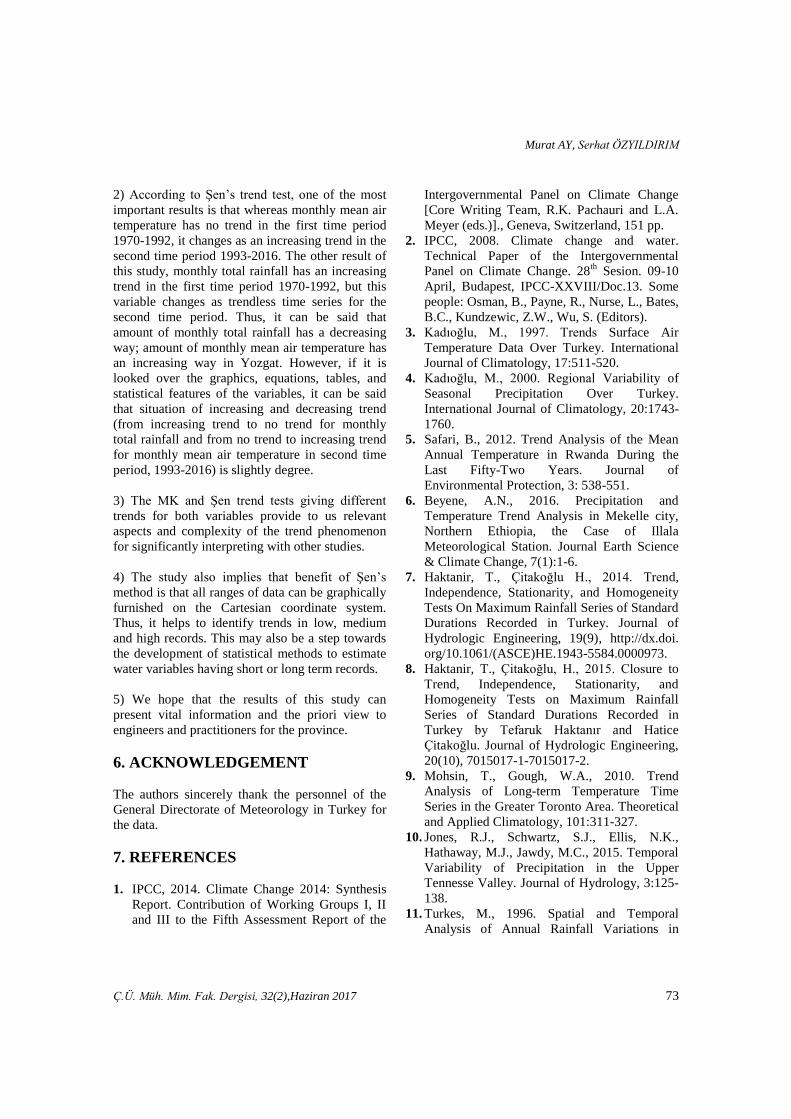
Table 6. Comparison results of the Mann-
Kendall and Şen’s trend tests for
1970-1992 (23 years) in Yozgat
Variable
MK
test
result
Şen’s trend test
Low
values
Medium
values
High
values
Monthly total
rainfall (mm) No No Yes (+) Yes (+)
Monthly mean air
temperature (°C) No No No No
Table 7. Comparison results of the Mann-Kendall
and Şen’s trend tests for 1993-2016
(24 years) in Yozgat
Variable
MK
test
result
Şen’s trend test
Low
values
Medium
values
High
values
Monthly total
rainfall (mm) No No No No
Monthly mean air
temperature (°C) No No No Yes (+)
5. CONCLUSION AND REMARKS
In this study, we took into consideration two time
periods (1970-1992, 23 years and 1993-2016, 24
years) for the trend analysis of monthly total
rainfall and monthly mean air temperature. Each
time part was analysed individually, and both parts
were compared with each other, and it was tried to
tell some thoughts for trends of the variables and
differences between two trend tests. As a result,
general and specific findings derived from the
study can be:
1) According to the Mann-Kendall trend test, there
is no statistically significant trend for both
variables at 95% two-tailed confidence interval for
the two time periods: 1970-1992 and 1993-2016.
But, there is insignificant increasing trend for
monthly total rainfall (mm) in the period 1970-
1992 (see Table 2). Z value of this variable is
+1.09. This value is close to +1.96 (critical Z).
This result is similar to result of Şen’s trend test
(see Table 3).
Murat AY, Serhat ÖZYILDIRIM
Ç.Ü. Müh. Mim. Fak. Dergisi, 32(2),Haziran 2017 73
2) According to Şen’s trend test, one of the most
important results is that whereas monthly mean air
temperature has no trend in the first time period
1970-1992, it changes as an increasing trend in the
second time period 1993-2016. The other result of
this study, monthly total rainfall has an increasing
trend in the first time period 1970-1992, but this
variable changes as trendless time series for the
second time period. Thus, it can be said that
amount of monthly total rainfall has a decreasing
way; amount of monthly mean air temperature has
an increasing way in Yozgat. However, if it is
looked over the graphics, equations, tables, and
statistical features of the variables, it can be said
that situation of increasing and decreasing trend
(from increasing trend to no trend for monthly
total rainfall and from no trend to increasing trend
for monthly mean air temperature in second time
period, 1993-2016) is slightly degree.
3) The MK and Şen trend tests giving different
trends for both variables provide to us relevant
aspects and complexity of the trend phenomenon
for significantly interpreting with other studies.
4) The study also implies that benefit of Şen’s
method is that all ranges of data can be graphically
furnished on the Cartesian coordinate system.
Thus, it helps to identify trends in low, medium
and high records. This may also be a step towards
the development of statistical methods to estimate
water variables having short or long term records.
5) We hope that the results of this study can
present vital information and the priori view to
engineers and practitioners for the province.
6. ACKNOWLEDGEMENT
The authors sincerely thank the personnel of the
General Directorate of Meteorology in Turkey for
the data.
7. REFERENCES
1. IPCC, 2014. Climate Change 2014: Synthesis
Report. Contribution of Working Groups I, II
and III to the Fifth Assessment Report of the
Intergovernmental Panel on Climate Change
[Core Writing Team, R.K. Pachauri and L.A.
Meyer (eds.)]., Geneva, Switzerland, 151 pp.
2. IPCC, 2008. Climate change and water.
Technical Paper of the Intergovernmental
Panel on Climate Change. 28th
Sesion. 09-10
April, Budapest, IPCC-XXVIII/Doc.13. Some
people: Osman, B., Payne, R., Nurse, L., Bates,
B.C., Kundzewic, Z.W., Wu, S. (Editors).
3. Kadıoğlu, M., 1997. Trends Surface Air
Temperature Data Over Turkey. International
Journal of Climatology, 17:511-520.
4. Kadıoğlu, M., 2000. Regional Variability of
Seasonal Precipitation Over Turkey.
International Journal of Climatology, 20:1743-
1760.
5. Safari, B., 2012. Trend Analysis of the Mean
Annual Temperature in Rwanda During the
Last Fifty-Two Years. Journal of
Environmental Protection, 3: 538-551.
6. Beyene, A.N., 2016. Precipitation and
Temperature Trend Analysis in Mekelle city,
Northern Ethiopia, the Case of Illala
Meteorological Station. Journal Earth Science
& Climate Change, 7(1):1-6.
7. Haktanir, T., Çitakoğlu H., 2014. Trend,
Independence, Stationarity, and Homogeneity
Tests On Maximum Rainfall Series of Standard
Durations Recorded in Turkey. Journal of
Hydrologic Engineering, 19(9), http://dx.doi.
org/10.1061/(ASCE)HE.1943-5584.0000973.
8. Haktanir, T., Çitakoğlu, H., 2015. Closure to
Trend, Independence, Stationarity, and
Homogeneity Tests on Maximum Rainfall
Series of Standard Durations Recorded in
Turkey by Tefaruk Haktanır and Hatice
Çitakoğlu. Journal of Hydrologic Engineering,
20(10), 7015017-1-7015017-2.
9. Mohsin, T., Gough, W.A., 2010. Trend
Analysis of Long-term Temperature Time
Series in the Greater Toronto Area. Theoretical
and Applied Climatology, 101:311-327.
10. Jones, R.J., Schwartz, S.J., Ellis, N.K.,
Hathaway, M.J., Jawdy, M.C., 2015. Temporal
Variability of Precipitation in the Upper
Tennesse Valley. Journal of Hydrology, 3:125-
138.
11. Turkes, M., 1996. Spatial and Temporal
Analysis of Annual Rainfall Variations in
Trend Analysis of Monthly Total Rainfall and Monthly Mean Air Temperature Variables of Yozgat in Turkey
74 Ç.Ü. Müh. Mim. Fak. Dergisi, 32(2), Haziran 2017
Turkey. International Journal of Climatology,
16:1057-1076.
12. Buffoni, L., Maugeri, M., Nanni, T., 1999.
Precipitation in Italy from 1833 to 1996.
Theoretical and Applied Climatology,
63:33-40.
13. Whitfield, P.H., Cannon, A.J., 2000. Recent
Variations in Climate and Hydrology in
Canada. Water Resource Journal, 25(1):19-65.
14. Yue, S., Hashino, M., 2003. Long Term Trends
of Annual and Monthly Precipitation in Japan.
Journal of the American Water Resources
Association, 39(3):587-596.
15. Gemmer, M., Becker, S., Jiang, T., 2004.
Observed Monthly Precipitation Trends in
China 1951-2002. Theoretical and Applied
Climatology, 77:39-45.
16. Cannarozzo, M., Noto, L.V., Viola, F., 2006.
Spatial Distribution of Rainfall Trends in Sicily
(1921-2000). Physics and Chemistry of the
Earth, Parts A/B/C, 31(18):1201-1211.
17. Partal, T., Kahya, E., 2006. Trend Analysis in
Turkey Precipitation Data. Hydrological
Process, 20: 2011-2026.
18. Turkes, M., Koc, T., Sarıs, F., 2009. Spatio-
temporal Variability of Precipitation Total
Series Over Turkey. International Journal of
Climatology, 29(8):1056-1074.
19. Tabari, H., Hosseinzadeh Talaee, P., 2011.
Temporal Variability of Precipitation Over
Iran: 1966-2005. Journal of Hydrology, 396
(3-4):313-320.
20. Yavuz, H., Erdogan, S., 2012. Spatial Analysis
of Monthly and Annual Precipitation Trends in
Turkey. Water Resource Management, 26:
609-612.
21. Haktanir, T., Bajabaa, S., Masoud, M., 2013.
Stochastic Analyses of Maximum Daily
Rainfall Series Recorded at Two Stations
Across the Mediterranean Sea. Arabian Journal
of Geoscience, 6(10):3943-3958.
22. Dinpashoh, Y., Mirabbasi, R., Jhajharia, D.,
Abianeh, H.Z., Mostafaeipour, A., 2014. Effect
of Short Term and Long-term Persistence
on Identification of Temporal Trends.
Journal of Hydrologic Engineering, 19(3),
doi:10.1061/(ASCE)HE.1943-5584.0000819
23. Fathian, F., Morid, S., Kahya, E., 2014.
Identification of Trends in Hydrological and
Climatic Variables in Urmia Lake Basin, Iran.
Theoretical and Applied Climatology,
119(3):443-464.
24. Addisu, S., Selassie, Y.G., Fissha, G., Gedif,
B., 2015. Time Series Trend Analysis
of Temperature and Rainfall in Lake Tana Sub-
Basin, Ethiopia. Environmental System
Research, 4(25): 01-12.
25. Chattopadhyayi, S., Edwards, D.R., 2016.
Long-Term Trend Analysis of Precipitation
and Air Temperature for Kentucky, United
States. Climate, 4(10), doi:10.3390/cli4010010.
26. Ay, M., 2016. Water Structures, Water
Resources and Features of Yozgat Province in
Turkey. 01st International Bozok Symposium,
Abstract Book, 294-295p, Bozok University,
May 05-07, 2016, Yozgat, Turkey.
27. Mann, H.B., 1945. Nonparametric Tests
Against Trend. Econometrica, 13(3):245-259.
28. Yevjevich, V., 1972. Stochastic Processes in
Hydrology. Water Resources Publications,
276p. Fort Collins, CO.
29. Kendall, M.G., 1975. Rank Correlation
Methods. Oxford University Press, New York.
30. Kottegoda, N.T., 1980. Stochastic Water
Resources Technology. The MacMillan Press.
31. Helsel, D.R., Hirsch, R.M., 2002. Statistical
Methods in Water Resources. Techniques of
Water-Resources Investigations of the United
States Geological Survey Book 4, Chapter A3,
Hydrologic Analysis and Interpretation.
32. Yue, S., Pilon, P., Caradias, G., 2002. Power of
the Mann-Kendall and Spearman's Rho Tests
for Detecting Monotonic Trends in
Hydrological Series. Journal of Hydrology,
259:254-271.
33. Onoz, B., Bayazit, M., 2003. The Power of
Statistical Tests for Trend Detection. Turkish
Journal of Engineering & Environmental
Sciences, 27:247-251.
34. Şen, Z., 2015. Innovative Trend Significance
Test and Applications. Theoretical and Applied
Climatology, DOI10.1007/s00704-015-1681-x.
35. Şen, Z., 2012. Innovative Trend Analysis
Methodology. Journal of Hydrologic
Engineering, 17(9):1042-1046.
36. Şen, Z., 2013. Square Diagonal Trend Test
Procedure. 6th
International Perspective on
Murat AY, Serhat ÖZYILDIRIM
Ç.Ü. Müh. Mim. Fak. Dergisi, 32(2),Haziran 2017 75
Water Resources & The Environment. January,
07-09, (in CD), Izmir.
37. Şen, Z., 2014. Trend Identification Simulation
and Application. Journal of Hydrologic
Engineering, 19(3):635-642.
38. Ay, M., Kişi, Ö., 2013. Investigation of
Precipitation Trends of Some Provinces in
Turkey. 3rd
Turkey Climate Change Congress,
ISBN: 978-605-62559-0-8, 109-117, 03-05
June, Istanbul Technical University (ITU).
39. Kisi, O., Ay, M., 2014. Comparison of Mann
Kendall and Innovative Trend Method for
Water Quality Parameters of the Kizilirmak
River, Turkey. Journal of Hydrology, 513:
362-375.
40. Ay, M., Kisi, O., 2015. Investigation of Trend
Analysis of Monthly Total Precipitation by an
Innovative Method. Theoretical and Applied
Climatology, 120(3): 617-629.
41. Von Storch, H., 1995. Misuses of Statistical
Analysis in Climate Research. Analysis of
Climate Variability: Applications of Statistical
Techniques. H.V. Storch and A. Navarra
(Editors), Springer, Berlin, pp.11-26.
42. Douglas, E.M., Vogel, R.M., Kroll, C.N., 2000.
Trends in Floods and Low Flows in the United
States: Impact of Spatial Correlation. Journal
of Hydrology, 240(1-2):90-105.
43. Sang, Y-F., Wang, Z., Liu, C., 2014.
Comparison of the MK Test and EMD Method
for Trend Identification in Hydrological Time
Series. Journal of Hydrology, 510:293-298.
44. Bayazit, M., Onoz, B., 2007. To Prewhiten or
not to Prewhiten in Trend Analysis?
Hydrological Sciences Journal, 52(4): 611-624.
45. Sen, B., Topcu, S., Türkes¸ M., Sen, B.,
Warner, J.F., 2012. Projecting Climate Change,
Drought Conditions and Crop Productivity in
Turkey. Climate Research, 52:175-191.
46. General Directorate of Meteorology (GDM),
2015. Research Department, Symposium
Articles in 2015 of Climatology Branch
Directorate, 118 pp, Ankara.

Trend Analysis of Monthly Total Rainfall and Monthly Mean Air Temperature Variables of Yozgat in Turkey
76 Ç.Ü. Müh. Mim. Fak. Dergisi, 32(2), Haziran 2017