monthly insight
TRANSCRIPT

January 2018
Monthly InsighTOutlook for IT appears solidWonjae [email protected]
Chuljoong [email protected]
Young-gun [email protected]
Seungho [email protected]
Analysts who prepared this report are registered as research analysts in Korea but not in any other jurisdiction, including the U.S.PLEASE SEE ANALYST CERTIFICATIONS AND IMPORTANT DISCLOSURES & DISCLAIMERS IN APPENDIX 1 AT THE END OF REPORT.

Mirae Asset Daewoo Research2| Monthly InsighT
Contents
I. Investment strategy
II. Top picks
III. Sector view
IV. Think big
V. Global IT navigation
Spotlight stocks & other notable stocks
.......................................... 3
........................................................... 8
....................................................... 10
......................................................... 15
...................................... 21
…………….… 24

Mirae Asset Daewoo Research3| Monthly InsighT
I. Investment strategyPositive 4Q17 results expected despite won appreciation; IT shares to rise in steps
II. Top picks
III. Sector view
IV. Think big
V. Global IT navigation
Spotlight stocks & other notable stocks
Mirae Asset Daewoo Research4| Monthly InsighT
I. Investment strategy Mirae Asset Daewoo IT universe share performance
Monthly InsighT cumulative returns
Note: September 2014 – December 2017
November
December
Cumulative returns
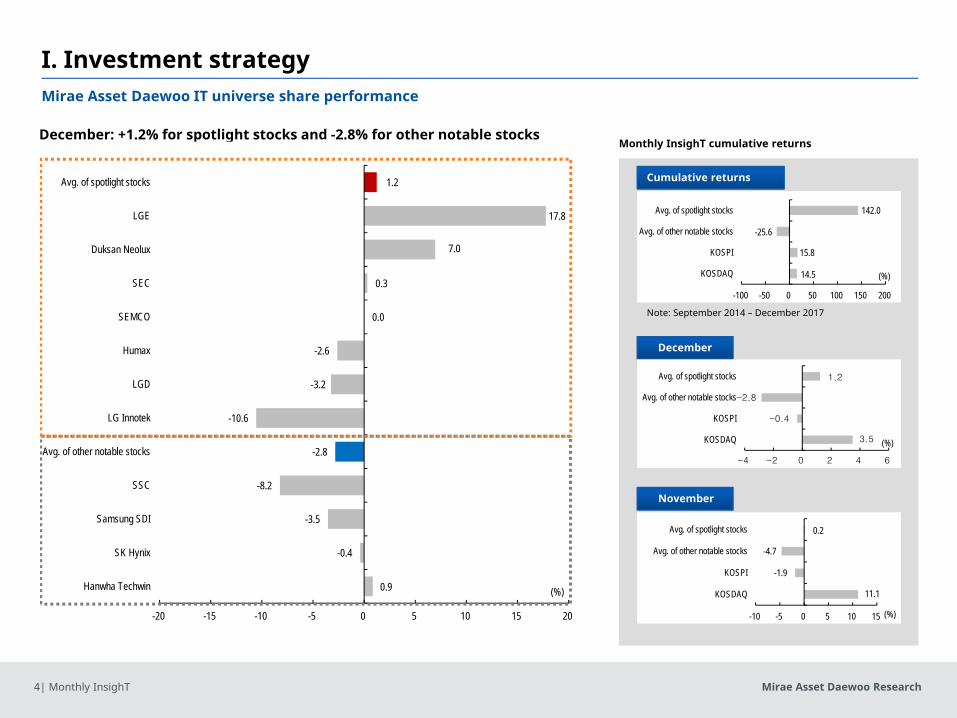
December: +1.2% for spotlight stocks and -2.8% for other notable stocks
3.5
-0.4
-2.8
1.2
-4 -2 0 2 4 6
KOSDAQ
KOSPI
Avg. of other notable stocks
Avg. of spotlight stocks
(%)
14.5
15.8
-25.6
142.0
-100 -50 0 50 100 150 200
KOSDAQ
KOSPI
Avg. of other notable stocks
Avg. of spotlight stocks
(%)
0.9
-0.4
-3.5
-8.2
-2.8
-10.6
-3.2
-2.6
0.0
0.3
7.0
17.8
1.2
-20 -15 -10 -5 0 5 10 15 20
Hanwha Techwin
SK Hynix
Samsung SDI
SSC
Avg. of other notable stocks
LG Innotek
LGD
Humax
SEMCO
SEC
Duksan Neolux
LGE
Avg. of spotlight stocks
(%) 11.1
-1.9
-4.7
0.2
-10 -5 0 5 10 15
KOSDAQ
KOSPI
Avg. of other notable stocks
Avg. of spotlight stocks
(%)

Mirae Asset Daewoo Research5| Monthly InsighT
I. Investment strategy
Source: WISEfn, Mirae Asset Daewoo Research
Share performance & OP consensus revision rates for Korean IT large caps
Mirae Asset Daewoo IT large-cap universe
Source: WISEfn, Mirae Asset Daewoo Research
(W, %, x)
Company Rating TP Currentprice (12/28) Upside
Share performance P/E P/B ROE1W 1M 17F 18F 17F 18F 17F 18F
LGE Buy 129,000 106,000 21.7 6.7 17.8 9.7 8.5 1.4 1.2 15.2 15.0LGD Buy 42,000 29,900 40.5 1.4 -3.2 5.7 11.7 0.8 0.7 14.2 6.4Samsung SDI Buy 270,000 204,500 32.0 1.2 -3.5 19.5 12.6 1.2 1.1 6.7 9.7SEMCO Buy 131,000 100,000 31.0 1.3 0.0 46.4 25.6 1.7 1.6 3.9 6.7LG Innotek Buy 210,000 144,000 45.8 3.6 -10.6 15.5 11.3 1.7 1.5 11.7 14.0SSC Buy 37,800 27,850 35.7 2.4 -8.2 26.4 19.8 2.5 2.2 9.8 12.0Hanwha Techwin Buy 45,400 35,550 27.7 0.9 0.9 39.3 21.3 0.8 0.8 2.1 3.7SEC - - 2,548,000 - 3.7 0.3 9.4 7.5 1.6 1.4 20.2 20.7SK Hynix - - 76,500 - -0.6 -0.4 5.1 4.3 1.6 1.2 37.3 32.0
Positive 4Q17 results expected despite won appreciation; IT shares to rise in steps
■ IT sector update- Semiconductor: Share performance will likely be better than expected despite
concerns over the potential peaking of earnings; SEC is forecast to fare better than peers based on its market leadership.
- Display: Panel prices remained on the decline in December, and are projected to hit bottom in 1Q18; OLED materials and component shipments are projected to continue to grow robustly in 1Q18.
- Handset/component: New smartphone models could provide a boost to component producers’ earnings in the traditional low-demand season of 4Q17; concerns about iPhone X shipments and Apple’s battery issue will likely have only a limited impact on earnings.
- Consumption will become increasingly polarized; the sales mixes of high-priced products, including home appliances and TVs, will likely remain on the rise.
- Companies continue to search for new growth drivers; the recent won appreciation is concerning.
■ Strategy1) Semiconductor supply/demand conditions are expected to be more positive than expected. 2) LGD is worthy of attention in light of expectations for a market recovery in 2Q and a potential re-rating of large-sized OLED panel prices. 3) OLED materials producers merit attention as OLED capacities are projected to increase. 4) New smartphone models, namely the Galaxy S9 and X, could further boost the shares of mobile component players.
■ Spotlight stocks- LGE, LGD, Samsung SDI, SEMCO, LG Innotek, SSC
-12
-6
0
6
12
18
-16
-8
0
8
16
24
LGE HanwhaTechwin
SEC SEMCO SK Hynix LGD SamsungSDI
SSC LG Innotek
(%)(%)Share performance (1M,L) 4Q OP consensus revision rate(R)

Mirae Asset Daewoo Research6| Monthly InsighT
Previous Revised % chg. Notes4Q17F 2017F 2018F 4Q17F 2017F 2018F 4Q17F 2017F 2018FLGE Revenue 16,029 60,462 65,266 16,268 60,701 65,308 1.5 0.4 0.1
OP 523 2,624 3,626 562 2,664 3,618 7.5 1.5 -0.2 LG Innotek’s earnings growth NP 356 1,967 2,250 356 1,967 2,250 -0.1 0.0 0.0
LGD Revenue 6,813 27,477 27,401 6,813 27,477 27,401 0.0 0.0 0.0 OP 326 2,743 1,393 326 2,743 1,393 0.0 0.0 0.0 NP 182 1,949 945 182 1,949 945 0.0 0.0 0.0
Samsung SDI Revenue 2,027 6,493 8,246 2,027 6,493 8,246 0.0 0.0 0.0
OP 109 108 501 109 108 501 0.0 0.0 0.0
NP 319 738 1,142 319 738 1,142 0.0 0.0 0.0
SEMCO Revenue 1,726 6,847 7,825 1,726 6,847 7,825 0.0 0.0 0.0
OP 106 305 535 106 305 535 0.0 0.0 0.0
NP 60 167 303 60 167 303 0.0 0.0 0.0
LG Innotek Revenue 2,570 7,341 8,518 2,809 7,581 8,561 9.3 3.3 0.5
OP 155 310 461 194 350 453 25.5 12.7 -1.7 Optic solutions earnings improvedNP 107 195 312 132 220 301 23.4 12.8 -3.7
SSC Revenue 287 1,115 1,264 287 1,115 1,264 0.0 0.0 0.0
OP 25 103 123 25 103 123 0.0 0.0 0.0
NP 16 61 82 16 61 82 0.0 0.0 0.0
Hanwha Revenue 1,552 4,232 4,322 1,552 4,232 4,322 0.0 0.0 0.0
Techwin OP 56 92 133 56 92 133 0.0 0.0 0.0
NP 38 48 88 38 48 88 0.0 0.0 0.0
SEC Revenue 68,069 241,382 271,372 67,045 240,660 271,163 -1.5 -0.3 -0.1 (Based on the market consensus)OP 16,292 54,691 64,558 15,951 54,449 66,157 -2.1 -0.4 2.5
NP 12,302 41,459 48,625 12,012 41,274 49,858 -2.4 -0.4 2.5
SK Hynix Revenue 8,883 29,932 35,225 8,976 30,064 36,254 1.0 0.4 2.9 (Based on the market consensus)OP 4,229 13,495 15,668 4,310 13,566 16,369 1.9 0.5 4.5
NP 3,393 10,809 12,403 3,414 10,843 12,860 0.6 0.3 3.7
I. Investment strategy
(Wbn, %)
Source: Mirae Asset Daewoo Research
Earnings forecast revisions for large-cap IT plays

Mirae Asset Daewoo Research7| Monthly InsighT
I. Investment strategy
(Wbn, %)
Source: WISEfn, Mirae Asset Daewoo Research
Consensus vs. Mirae Asset Daewoo estimates
Mirae Asset Daewoo Consensus % diff. Notes4Q17F 2017F 2018F 4Q17F 2017F 2018F 4Q17F 2017F 2018FLGE Revenue 16,029 60,462 65,266 16,083 60,591 64,656 -0.3 -0.2 0.9
OP 523 2,624 3,626 457 2,569 3,103 14.3 2.2 16.9 Robust home appliance salesNP 356 1,967 2,250 262 1,818 1,918 35.7 8.2 17.3
LGD Revenue 6,813 27,477 27,401 6,893 27,530 26,641 -1.2 -0.2 2.9
OP 326 2,743 1,393 311 2,725 1,384 4.9 0.7 0.7
NP 182 1,949 945 217 2,014 953 -16.1 -3.2 -0.8
Samsung SDI Revenue 2,027 6,493 8,246 1,976 6,432 7,821 2.6 0.9 5.4
OP 109 108 501 101 93 390 7.9 16.1 28.5 Improvement in mid/large-sized battery earnings
NP 319 738 1,142 288 689 1,096 10.8 7.1 4.2
SEMCO Revenue 1,726 6,847 7,825 1,783 6,912 8,211 -3.2 -0.9 -4.7
OP 106 305 535 110 311 603 -3.6 -1.9 -11.3
NP 60 167 303 75 176 394 -20.0 -5.1 -23.1
LG Innotek Revenue 2,809 7,581 8,561 2,604 7,366 8,846 7.9 2.9 -3.2
OP 194 350 453 162 318 504 19.7 9.8 -10.0 The iPhone X impactNP 132 220 301 98 200 346 34.8 9.9 -13.2
SSC Revenue 287 1,115 1,264 287 1,114 1,218 0.0 0.0 3.8
OP 25 103 123 27 105 125 -5.2 -1.3 -1.9
NP 16 61 82 14 65 86 12.4 -6.0 -5.1
Hanwha Revenue 1,552 4,232 4,322 1,494 4,230 4,524 3.9 0.0 -4.5
Techwin OP 56 92 133 55 98 148 1.2 -5.9 -10.1
NP 38 48 88 41 60 96 -5.6 -20.5 -8.3
SEC Revenue - - - 67,045 240,660 271,163 - - -
OP - - - 15,951 54,449 66,157 - - -
NP - - - 12,012 41,274 49,858 - - -
SK Hynix Revenue - - - 8,976 30,064 36,254 - - -
OP - - - 4,310 13,566 16,369 - - -
NP - - - 3,414 10,843 12,860 - - -

Mirae Asset Daewoo Research8| Monthly InsighT
I. Investment strategy
II. Top picksLGE, LGD, Samsung SDI, SEMCO, LG Innotek, SSC
III. Sector view
IV. Think big
V. Global IT navigation
Spotlight stocks & other notable stocks

Mirae Asset Daewoo Research9| Monthly InsighT
II. Top picks(W, Wbn, %) 4Q16 3Q17
4Q17FNotesMirae Asset
Daewoo Consensus YoY QoQ
LGE Revenue 14,777.8 15,224.1 16,268.1 16,083.4 10.1 6.9 - 4Q17 preview: Revenue of W16.27tr (+10.1% YoY) and OP of W562bn (TTB YoY)- Home appliance/TV OP is projected at W3.21tr for 2017 and W3.32tr for 2018. TV earnings are expected to
improve on panel price declines and a greater mix of OLED TVs; sales of vacuums, dryers, and aesthetic products are growing.
- The MC unit’s losses are expected to narrow from W737.6bn in 2017 to W184.7bn in 2018.
CP: 106,000 OP -35.2 516.1 562.0 457.0 TTB 8.9
TP: 129,000 (OPM) -0.2 3.4 3.5 2.8 3.7 0.1
Upside: 21.7% Pretax -83.1 515.7 576.5 413.5 TTB 11.8
NP -322.7 318.1 355.6 262.0 TTB 11.8
LGD Revenue 7,936.0 6,973.0 6,812.8 6,893.1 -14.2 -2.3 - 4Q17 preview: Revenue of W6.8tr (-2.3% QoQ) and OP of W326bn (-44.3% QoQ)- OP downtrend will likely continue in 4Q, due to steady panel price declines.- Depreciation cost burden will likely increase, resulting from the operation of new small/mid-sized OLED lines. - Won appreciation should also be negative. - The LCD market should rebound in 2Q, on the back of: 1) TV demand growth; and 2) yield issues at BOE’s new
facilities. - We advise investors to accumulate LGD shares before CES 2018 (scheduled for January 8th).
CP: 29,900 OP 904.3 586.0 326.1 310.9 -63.9 -44.4
TP: 42,000 (OPM) 11.4 8.4 4.8 4.5 -6.6 -3.6
Upside: 40.5% Pretax 1,064.5 598.6 334.0 309.7 -68.6 -44.2
NP 798.0 443.7 181.8 216.6 -77.2 -59.0
Samsung SDI Revenue 1,302.9 1,707.3 2,026.6 1,976.3 55.5 18.7 - 4Q17 preview: Revenue of W2tr (+18.7% QoQ) and OP of W109bn (+81.5% QoQ) - Small batteries: Galaxy 9-bound component supplies may begin in 4Q, amid continued growth in North
America-bound shipments. - Mid/large-sized batteries: Entered peak-demand season- Earnings for OLED/semiconductor materials business to remain solid- EV battery business is forecast to turn to profit in 2Q18, with its revenue set to climb to W2.2tr in 2018 (from
W1.4tr in 2017).
CP: 204,500 OP -58.0 60.2 109.2 100.8 TTB 81.4
TP: 270,000 (OPM) -4.5 3.5 5.4 5.1 9.8 1.9
Upside: 32.0% Pretax 99.6 174.3 369.2 320.1 270.7 111.8
NP 7.5 145.3 319.0 287.7 4,153.3 119.5
SEMCO Revenue 1,345.1 1,841.1 1,725.7 1,782.7 28.3 -6.3 - 4Q17 preview: Relatively strong earnings, despite weak seasonality
• Camera/telecom modules: Began to supply components for SEC’s Galaxy S9• Substrates: Growth in RF-PCB revenue from a US customer to drive up profitability • Components: Sales mix of value-added MLCC products to expand; ASP to rise for fourth consecutive quarter
- 2018 OP forecast to climb 75.1% on uptrend in MLCC prices
CP: 100,000 OP -46.5 103.2 106.1 110.2 TTB 2.8
TP: 131,000 (OPM) -3.5 5.6 6.1 6.2 9.6 0.5
Upside: 31.0% Pretax -59.0 98.5 81.8 101.2 TTB -17.0
NP -35.3 71.9 59.7 74.7 TTB -17.0
LG Innotek Revenue 2,054.6 1,787.2 2,809.2 2,604.1 36.7 57.2 - 4Q17 preview: Record-breaking earnings likely, with revenue of W2.81tr (+36.7% YoY)- Solid iPhone X sales should drive up the firm’s revenue from dual camera/3D sensing modules.
• The outlook for new businesses is also positive.• The firm has begun supplying other components, like RFPCBs (annual revenue of W200bn) and wireless
charging modules (revenue of W150bn).- Earnings will likely remain solid in 1Q18, although our OP forecast has been lowered to W130.4bn due to won
appreciation.
CP: 144,000 OP 117.8 55.9 194.4 162.5 65.0 247.8
TP: 210,000 (OPM) 5.7 3.1 6.9 6.2 1.2 3.8
Upside: 45.8% Pretax 115.3 42.3 173.2 144.8 50.2 309.5
NP 87.0 34.8 131.6 97.6 51.3 278.2
SSC Revenue 241.5 304.5 286.9 286.8 18.8 -5.8 - 4Q17 preview: OP of W25.3bn (+23.5% YoY)
• For 4Q17, we see revenue of W286.9bn (+18.8% YoY) and operating profit of W25.3bn (+23.5% YoY).• Increased exposure to automotive lighting and tight SG&A expense control should keep OP margin steady.• LED market conditions are gradually improving; ongoing restructuring in the TV BLU industry has led to a
slowdown in the decline in LED chip prices (and even some hikes); the company is exploring new markets, including the automotive market.
CP: 27,850 OP 20.5 30.6 25.3 26.7 23.4 -17.3
TP: 37,800 (OPM) 8.5 10.0 8.8 9.3 0.3 -1.2
Upside: 35.7% Pretax 25.6 30.4 23.4 24.3 -8.6 -23.0
NP 17.6 17.3 16.0 14.3 -9.1 -7.5

Mirae Asset Daewoo Research10| Monthly InsighT
I. Investment strategy
II. Top picks
III. Sector view
• Display: LCD market conditions to bottom out in 1Q18
• Handsets/components: iPhone X and Galaxy S9 serving as dual drivers; Watch out for won appreciation
IV. Think big
V. Global IT navigation
Spotlight stocks & other notable stocks

Mirae Asset Daewoo Research11| Monthly InsighT
Source: WitsView, Mirae Asset Daewoo Research
Decline in 55” panel prices starting to slow down
Source: IHS, Mirae Asset Daewoo Research
LCD panel inventory trends
III. Sector view Display
LG Electronics
Growth rate (R)
Other
-8
-6
-4
-2
0
2
4
1/16 7/16 1/17 7/17
(%)
55인치패널가격변동률55” panel price change
2.5
3.0
3.5
4.0
4.5
5.0
1/14 7/14 1/15 7/15 1/16 7/16 1/17 7/17 1/18
(Weeks)IT용패널재고일수TV용패널재고일수IT panel inventoryTV panel inventory
■ Key issues
- In December, panel prices continued to decline
- 1) TV panel prices: -1.7% for 5.5”; -3.3% for 6.5”; -4% to -6% for 40-50” panels
- 2) IT panel prices: –0.5% for notebook panels; -0.4% for monitor panels
- November LCD TV shipments: 24.43mn units (+2.7% YoY)
- November OLED TV shipments: 271,000 units (+133% YoY)
- The Korean government granted conditional approval for LGD’s plan to build an OLED plant in Guangzhou, China.
- SKC announced investments in CPI lines.
■ Implications
- Declines in prices for 55” and 65” TV panels slowed on solid demand, while prices for 40-50” panels continued falling on shipment growth driven by Chinese and Taiwanese panel makers.
- LCD market conditions should turn around in 2Q18 on a pickup in TV demand amid stabilizing LCD panel inventory. Major sporting events, including the Winter Olympics (early February) and FIFA World Cup (June), the Chinese New Year (mid-February), and new TV product launches (April) are expected to bolster TV demand.
- LGD confirmed significant OLED spending in Guangzhou in December: Large-sized OLED equipment makers include YAS, Jusung Engineering, Avaco, and Invenia.
- SEC is highly likely to launch foldable devices in 2018: Focus on relevant materials and component suppliers.
- Samsung Display will likely make additional investments upon the launch of foldable devices. Shares of OLED equipment suppliers should bottom out in 1Q.
Check point
LCD market conditions to bottom out in 1Q18
TV set makers’ new products (e.g., rollable displays, Mini LED) to be unveiled at CES2018
Apple to report 4Q17 results at end-January

Mirae Asset Daewoo Research12| Monthly InsighT
-15
-10
-5
0
5
10
15
0
7
14
21
28
1/15 7/15 1/16 7/16 1/17 7/17
LCD TV 출하량 (L)YoY 증감률 (R)
(Mn) (%)
-8
-6
-4
-2
0
2
4
6
1/14 7/14 1/15 7/15 1/16 7/16 1/17 7/17
NotebookMonitorTV (Open-cell)TV (4K x 2K)
(%)
Key charts
Monthly LCD TV shipments
LCD panel prices
Monthly LCD panel shipment area (by application)
LCD panel cumulative inventory
Source: IHS, Mirae Asset Daewoo Research
Source: WitsView, Mirae Asset Daewoo Research
Source: IHS, Mirae Asset Daewoo Research
Source: IHS, Mirae Asset Daewoo Research
III. Sector view Display
LCD TV shipments (L)YoY growth (R)
-25
0
25
50
0
6,000
12,000
18,000
1/15 7/15 1/16 7/16 1/17 7/17
(%)(Km2) TV panel (L) Monitor panel (L)Notebook panel (L) Tablet panel (L)Others (L) YoY growth (R)
-15
-10
-5
0
5
10
15
8
10
12
14
16
18
1/15 7/15 1/16 7/16 1/17 7/17 1/18
Production Area (L)Shipment Area (L)MoM 누적재고증감률 (R)
(mn m2) (%)
MoM cumulative inventory growth (R)

Mirae Asset Daewoo Research13| Monthly InsighT
Handsets/components III. Sector view
Source: Company data, Mirae Asset Daewoo Research
SEC smartphone shipments and OP margin of IM division
Source: Counterpoint, FactSet, Company data, Mirae Asset Daewoo Research
Apple smartphone shipments and OP margin
-30
-15
0
15
30
0
25
50
75
100
1Q11 1Q12 1Q13 1Q14 1Q15 1Q16 1Q17
(%)(mn units) Smartphone shipments (L)Shipments YoY growth (R)ASP YoY growth (R)IM OP margin (R)
GalaxyS8
GalaxyNote 7
GalaxyS7/E
GalaxyNote 8
GalaxyS6E+Note 5Galaxy
S6/E
GalaxyNote 4Galaxy
S5
GalaxyNote 3
-20
0
20
40
60
0
25
50
75
100
1Q11 1Q12 1Q13 1Q14 1Q15 1Q16 1Q17
(%)(mn units) iPhone shipments (L)Shipments YoY growth (R)Apple M/S (R)OP margin (R)
iPhone8/8+/X
iPhone7/7+
iPhoneSE
iPhone X and Galaxy S9 serving as dual drivers; Watch out for won appreciation
■ Key issues- The global smartphone market is maturing. - SEC: Attention is now turning to the Galaxy S9 and Galaxy X (tentatively named;
expected to feature a foldable display).- LGE: The firm looks set to report wider-than-expected smartphone losses for 2017,
leading to concerns over its brand value.- Apple: Sales of the iPhone X have been faring well; the new model is projected to have
a greater impact on pricing than on volume; Korean parts makers should benefit.- Chinese players’ competitiveness continues to improve; however, there are risks of a
slowdown in growth.- Memory chip/panel price growth in China is pushing up the prices of components,
including MLCC and LED.
■ Implications- SEC needs to focus on protecting its brand value and market share to boost sales
volume in 2018.- LGE needs to restore its brand value by leveraging unique and differentiated
products; the company needs to improve profitability via cost controls in 2018.- Apple is likely to post decent sales of the iPhone X: Improvement in earnings needs to
be confirmed during its 4Q17 earnings call (slated for January 30th).- Chinese smartphone makers have begun to show differentiated performances;
attention needs to be paid to the possibility of restructuring (risks to domestic component suppliers).
- Parts suppliers will likely benefit from price growth and the 4th Industrial Revolution.
■ Strategy- We advise investors to lower expectations for smartphone market growth; new model
releases will benefit select parts makers; follow closely those that are able to secure new technologies/new markets.
- SEC’s strategy for 2018 deserves attention; high pricing vs. high volume; new models (foldable).
- Parts makers are becoming more differentiated; focus on those that have secured medium/long-term competitiveness and/or new technologies; further rallies of the tech-heavy KOSDAQ market are likely.
- Parts makers that stand to benefit from the price uptrend and the 4th Industrial Revolution (e.g., the development of autonomous cars and AI technologies) deserve attention.
iPhone X and Galaxy S9 to drive market through 1Q18 Component stocks related to 4th Industrial Revolution
Check point

Mirae Asset Daewoo Research14| Monthly InsighT
Key charts
Source: IDC, Mirae Asset Daewoo Research
Smartphone shipments and market value
Source: IDC, Mirae Asset Daewoo Research
Smartphone shipments by price
Source: IDC, Mirae Asset Daewoo Research
Smartphone quarterly M/S trends
Source: IDC, Mirae Asset Daewoo Research
Smartphone shipments by pixel count
Handsets/components III. Sector view
0
25
50
75
100
1Q10 1Q11 1Q12 1Q13 1Q14 1Q15 1Q16
(%) High-end(>12MP) Mid-end(8-12MP) Low-end(<8MP)
0
25
50
75
100
1Q10 1Q11 1Q12 1Q13 1Q14 1Q15 1Q16
(%) Premium (>US$700) High-end (US$400-700) Mid-end (US$150-400) Low-end (<US$150)
0
10
20
30
40
1Q11 1Q12 1Q13 1Q14 1Q15 1Q16 1Q17
(%)Apple Samsung HuaweiOppo+Vivo Xiaomi LG
1.7 5.0
9.2 6.5
-30
0
30
60
90
0.0
0.5
1.0
1.5
2.0
2006 2009 2012 2015 2018F
(%)(bn units) Shipments (L) Shipments YoY (R) Value YoY (R)

Mirae Asset Daewoo Research15| Monthly InsighT
I. Investment strategy
II. Top picks
III. Sector view
IV. Think big
V. Global IT navigation
Spotlight stocks & other notable stocks

Mirae Asset Daewoo Research16| Monthly InsighT
First CES (1967) vs CES 2017
Source: Press materials
IV. Think big: CES 2018 previewCES 2018: The future of smart cities
Flagship products presented in past CES
Source: Press materials, Mirae Asset Daewoo Research
1970: VCR (Philips)
1967: First CES
1996: DVD
2008: OLED TVs (Panasonic)
1981: CD & camcorders (Sony)
1998: HD TVs
2011: Tablets
2001: Xbox (Microsoft)
2017: AI robots
■ CES: 50 years as the IT trendsetter
- First held in New York in 1967, CES now takes place in in Las Vegas each January.
- New IT products/technologies unveiled at past CES events include the following: VCRs (1970); camcorders (1981); DVD players (1996); HDTVs (1998); and OLED TVs (2008).
- New products/technologies showcased at recent CES events include the following: 3D TVs (2011), smart watches (2012); UHD TVs (2013); curved TVs and wearables (2014); IoT (2015); smart cars and VR devices (2016); and autonomous vehicles 2017).
- While the Mobile World Congress (MWC) held in March each year focuses on mobile devices, CES is a home appliance-oriented show.
- Technologies related to smart cities and cyber security and future growth engines related to AI technologies should garner attention at CES 2018.
- Key words for CES 2018 (January 9th to 12th) include: 1) 5G mobile technology; 2) autonomous driving; 3) cyber security; 4) robotics; and 5) IoT.

Mirae Asset Daewoo Research17| Monthly InsighT
■ 5G to give rise to a super-connected world - In a super-connected world, humans and humans, humans and devices, and
devices and devices will be connected via networks; IoT technologies, namely smart homes and smart cars, are the key to fostering the rise of a super-connected world.
- At CES 2018, the potential of 5G to aid in the establishment of smart cities is expected to be put on the spotlight.
- 5G, which could offer mobile speeds 40 to 100 times faster than 4G LTE, is anticipated to sharply improve connectivity between devices.
- 5G should enable the smooth operation of smart roads (traffic congestion analysis, intelligent traffic management, etc.), autonomous vehicles, automated EV charging stations, and emergency control systems.
- According to the Consumer Technology Association (CTA), the global smart city project market expanded by 38% in 2013-16, and will grow to US$34.4bn by 2020.
- Recently, Intel unveiled a 5G modem chip, announcing its shift of focus from personal computers to servers and communication.
- Once 5G gains traction, inter-device communication costs will likely decrease significantly, and the markets for wearable fitness devices, smartwear, and security devices will likely expand sharply.
IV. Think big: CES 2018 preview
Source: Press materials, Mirae Asset Daewoo Research
4G vs. 5G wireless technology
Source: Press materials, Mirae Asset Daewoo Research
Intel releases 5G modem lineup
4G 5G
Max. data transfer rate 1Gbps 20Gbps
Effective transfer rate 10Mbps 100-1,000Mbps
Relative spectral efficiency - 3x 4G
Mobility 350km/h 500km/h
Relative energy efficiency - 100x 4G
Area traffic capacity 0.1Mbps/m² 10Mbps/m²
Source: CTA, Mirae Asset Daewoo Research
Global smart city project market
1) Smart cities based on 5G mobile technology
34.4
0
5
10
15
20
25
30
35
40
2014 2015 2016 2020F
(US$bn)
Mirae Asset Daewoo Research18| Monthly InsighT
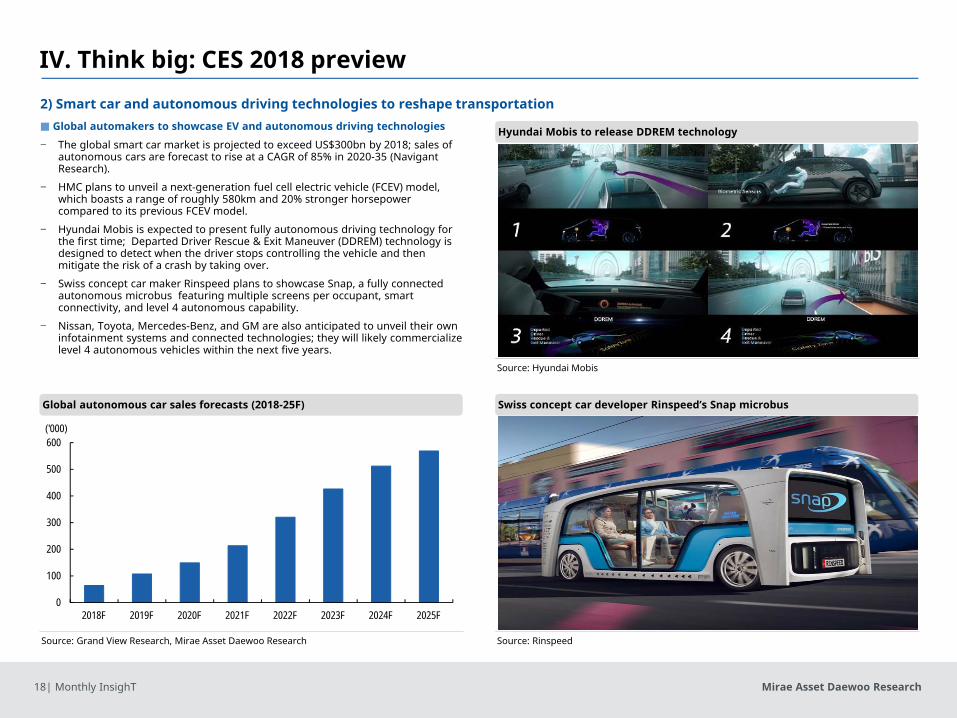
■ Global automakers to showcase EV and autonomous driving technologies
- The global smart car market is projected to exceed US$300bn by 2018; sales of autonomous cars are forecast to rise at a CAGR of 85% in 2020-35 (Navigant Research).
- HMC plans to unveil a next-generation fuel cell electric vehicle (FCEV) model, which boasts a range of roughly 580km and 20% stronger horsepower compared to its previous FCEV model.
- Hyundai Mobis is expected to present fully autonomous driving technology for the first time; Departed Driver Rescue & Exit Maneuver (DDREM) technology is designed to detect when the driver stops controlling the vehicle and then mitigate the risk of a crash by taking over.
- Swiss concept car maker Rinspeed plans to showcase Snap, a fully connected autonomous microbus featuring multiple screens per occupant, smart connectivity, and level 4 autonomous capability.
- Nissan, Toyota, Mercedes-Benz, and GM are also anticipated to unveil their own infotainment systems and connected technologies; they will likely commercialize level 4 autonomous vehicles within the next five years.
Source: Hyundai Mobis
Hyundai Mobis to release DDREM technology
Source: Rinspeed
Swiss concept car developer Rinspeed’s Snap microbus
Source: Grand View Research, Mirae Asset Daewoo Research
Global autonomous car sales forecasts (2018-25F)
IV. Think big: CES 2018 preview2) Smart car and autonomous driving technologies to reshape transportation
0
100
200
300
400
500
600
2018F 2019F 2020F 2021F 2022F 2023F 2024F 2025F
('000)

Mirae Asset Daewoo Research19| Monthly InsighT
■ Robots becoming part of our daily lives
- The International Federation of Robotics (IFR) expects China’s robot sales to triple (to 150,000 units) from 2015 to 2017, and China’s commercial robot market to expand 10-fold by end-2019.
- At CES 2018, Honda is set to unveil its new 3E (empower, experience, empathy) robotics concept.
- At the trade show, the Industrial Technology Research Institute (ITRI), a Taiwan-based high-tech applied research organization, plans to showcase a robot running on its Intelligent Vision System. The robot, designed to recognize the surrounding environment, is expected to be used at companies, hotels, hospitals, and shopping malls.
- LGE has continued launching new commercial robots, deploying cleaning robots at Incheon International Airport and a guide robot at Starfield Hanam in Gyeonggi Province. Sony has recently begun to develop robots for ordinary consumers by reviving its Aibo robot dog 11 years after shelving its original line of robot dogs.
- Hancom Group is also set to showcase a variety of commercial robots (e.g., educational service bots) that are currently being developed via Hancom MDS.
Source: Press materials, Mirae Asset Daewoo Research
LGE and Hancom Group begin production of commercial robots
Source: Honda, Mirae Asset Daewoo Research
Honda to release four types of 3E commercial robots
Source: IFR, Mirae Asset Daewoo Research
Global commercial robot sales
IV. Think big: CES 2018 preview3) Robots enter the mainstream
13.2
9.1
1.2 1.01.2 1.0
0
2
4
6
8
10
12
14
Household robot Entertainment robot
2016-19F 2015 2014(US$mn)

Mirae Asset Daewoo Research20| Monthly InsighT
Source: SEC, Mirae Asset Daewoo Research
One Samsung: Connecting smartphones, TVs, and home appliances
Source: LGE
LGE’s ThinQ AI network
Source: Press materials, Mirae Asset Daewoo Research
Smart home network centering on the consumer
IV. Think big: CES 2018 preview
■ IOT-connected devices - CES 2018 will showcase a variety of smart home devices, with existing AI
speakers, such as the Amazon Echo and Google Home, providing upgraded features and more seamless connectivity to TVs and other entertainment systems.
- Smart home-related devices expected to garner the most attention at the upcoming tech fair include 4K UHD TVs, voice recognition devices, wearable devices, and wireless speakers.
- SEC and LGE are set to unveil consumer electronics integrated with AI and big data technologies to enhance user convenience.
- SEC is expected to reveal a new IoT-connected AI device, as well as a proprietary AI platform that offers connectivity to smartphones, TVs, and other home appliances.
- LGE announced plans to promote its deep learning-driven AI brand, ThinQ (which is set to be employed by all AI-enabled devices of LGE), operating a dedicated booth at the upcoming show.
4) Smart home devices (IoT)
AI platformBixby
Homeappliances
AutoAI speaker
TV
Smartphone
Smart TV
Smartphone Smart work
Smart education
Smart city
Smart appliancesSmart Car
Smart care
Smart grid
Health/wellness
Safety
Economic benefits
Smart home

Mirae Asset Daewoo Research21| Monthly InsighT
I. Investment strategy
II. Top picks
III. Sector view
IV. Think big
V. Global IT navigation
Spotlight stocks & other notable stocks

Mirae Asset Daewoo Research22| Monthly InsighT
Source: Bloomberg, Mirae Asset Daewoo Research
Global IT index performance table (12/28)
Source: Bloomberg, Mirae Asset Daewoo Research
December share performance (MoM)
IndexPerformance (%)
1W 1M 3M 6M 12MDow Jones 24,719 -0.3 2.0 10.3 15.8 25.1 NASDAQ 6,903 -0.9 0.8 6.3 12.4 28.2 KOSPI 2,467 -0.2 -1.8 3.0 3.0 21.8 KOSDAQ 798 5.7 2.1 22.3 19.5 26.4
MSCI IT
World 221 -1.0 0.6 8.1 16.9 36.9 US 253 -1.1 0.6 8.7 17.5 36.8 Korea 1,282 -0.1 -3.0 -0.2 6.9 43.5 Japan 167 -1.7 -1.3 7.5 16.2 35.3
Taiwan 202 0.8 -1.9 0.3 -0.8 18.3
China 690 0.9 2.0 9.4 33.6 93.2
Source: Bloomberg, Mirae Asset Daewoo Research
December sector performance (MoM)
V. Global IT navigation Concerns over slowing iPhone sales
■ Global industry performance- While the MSCI World IT index rose 0.6%, the MSCI Korea IT index slipped 3.0%.- IT companies in Korean, Japan, and Taiwan largely underwent corrections.
■ Sector performance- Some stocks experienced strong rallies driven by non-operating events: Sharp
by 9.5% after returning to the Tokyo Stock Exchange first section; Toshiba by 14.9% thanks to its successful issuance of new shares worth JPY600bn.
- Apple supply chain stocks broadly dropped amid concerns over the iPhone sales slowdown and the recent battery issue: Sunny Optical (-23.2%), Largan (-21.8%), AAC (-10.8%), and LG Innotek (-10.6%).
- The display panel and semiconductor foundry segments advanced, driven by BOE and Sharp, respectively.
■ Company performance- Sunny Optical (-23.2%): Weaker investment sentiment on iPhone supply chain
stocks and camera module shipment decline in November (-3.9% MoM)
-10
-5
0
5
10
Dis
play
pan
el
Foun
dry
Auto
mat
ion
PC
Dis
play
com
pone
nts
Non
-mem
ory
Mem
ory
Dis
play
gla
ss
Dis
tribu
tion
Han
dset LIB
Sem
icon
. equ
ip.
Appl
ianc
es
Dis
play
equ
ip.
Mat
eria
ls
EMS/
OD
M
LED
Touc
hscr
een
Com
pone
nts
(%)
-30
0
30
60
SMIC
KC T
ech
Acer
LGE
Best
Buy
Tosh
iba
Lite
-On
Shar
p
Anap
ass
Rad
iant
Skyw
orks
Med
iaTe
k
Alps
Ele
ctric
LG In
note
k
AAC
Iljin
Dis
play
APS
Hol
ding
s
Epis
tar
Larg
an
Sunn
y O
ptic
al
(%)

Mirae Asset Daewoo Research23| Monthly InsighT
Source: Bloomberg, Mirae Asset Daewoo Research
MSCI World and MSCI World IT
Source: Bloomberg, Mirae Asset Daewoo Research
P/E comparison by country (2017F)
Source: Bloomberg, Mirae Asset Daewoo Research
MSCI IT performance by country
Source: Bloomberg, Mirae Asset Daewoo Research
IT sector P/B-ROE comparison (2017F)
V. Global IT navigation Key charts
80
120
160
200
240
280
1/12 1/13 1/14 1/15 1/16 1/17 1/18
MSCI World MSCI World IT(1/1/12=100)
80
130
180
230
280
1/12 1/13 1/14 1/15 1/16 1/17 1/18
MSCI US ITMSCI Korea ITMSCI Japan ITMSCI Taiwan IT
(1/1/12=100)
35.3
21.3 19.9 19.5 15.2
8.9
0
10
20
30
40
China Japan World US Taiwan Korea
(x)
0
2
4
6
8
0 5 10 15 20 25 30
ROE (%)
P/B (x)
WorldUS
China
TaiwanJapan
Korea

Mirae Asset Daewoo Research24| Monthly InsighT
I. Investment strategy
II. Top picks
III. Sector view
IV. Think big
V. Global IT navigation
Spotlight stocks
• LGE, LGD, Samsung SDI, SEMCO, LG Innotek, SSC
Other notable stocks
• Hanwha Techwin

Mirae Asset Daewoo Research25| Monthly InsighT
LG Electronics (066570 KS)
Notes: All figures are based on consolidated K-IFRS; NP refers to net profit attributable to controlling interestsSource: Mirae Asset Daewoo Research estimates
FY (Dec.) 12/14 12/15 12/16 12/17F 12/18F 12/19F
Revenue (Wbn) 59,041 56,509 55,367 60,701 65,308 69,466
OP (Wbn) 1,829 1,192 1,338 2,664 3,618 3,991
OP margin (%) 3.1 2.1 2.4 4.4 5.5 5.7
NP (Wbn) 399 124 77 1,967 2,250 2,446
EPS (W) 2,208 688 425 10,875 12,440 13,527
ROE (%) 3.4 1.1 0.7 15.2 15.0 14.2
P/E (x) 26.8 78.2 121.4 9.7 8.5 7.8
P/B (x) 0.9 0.8 0.8 1.4 1.2 1.0
(Maintain) Buy
Target Price (12M, W) ▲129,000
Share price (12/28/17, W) 106,000
Expected Return 22%
OP (17F, Wbn) 2,664
Consensus OP (17F, Wbn) 2,569
EPS Growth (17F, %) 2,458.0
Market EPS Growth (17F, %) 46.7
P/E (17F, x) 9.7
Market P/E (17F, x) 10.0
KOSPI 2,467.49
Market Cap (Wbn) 17,347
Shares Outstanding (mn) 181
Free Float (%) 65.6
Foreign Ownership (%) 33.6
Beta (12M) 0.93
52-Week Low 51,500
52-Week High 107,000
(%) 1M 6M 12M
Absolute 15.5 33.7 105.8
Relative 17.7 29.1 68.9
Wonjae [email protected]
Smartphone losses expected to narrow in 2018
■ 4Q17 preview: OP of W562.0bn (TTB YoY) - For 4Q17, we project revenue of W16.27tr (+10.1% YoY) and operating profit of W562.0bn (TTB YoY). Excluding LG Innotek, revenue is projected at W13.46tr (+3.4% YoY) and operating profit at W367.6bn (TTB YoY).
- The home entertainment (HE) division is expected to post operating profit of W426.2bn and an OP margin of 8% (+4.6%p YoY); margins will likely be supported by an increasing mix of premium products (including OLED TVs), panel price declines, and wonappreciation.
- The home appliance & air solution (H&A) division is expected to post operating profit of W19.3bn and OP margin of W4.5% (+0.9%p YoY).
- The mobile communications (MC) division is expected to suffer an operating loss of W233.6bn (narrowing QoQ and YoY).
■ Home appliance/TV units to generate annual OP of W3tr; Smartphone business to stabilize - For 2017, we forecast revenue of W3.21tr and operating profit of W3.32tr. TV earnings are expected to improve on panel price declines and a higher sales mix of OLED TVs. Sales of vacuum cleaners, dryers, and aesthetic products are growing.
- The MC division’s losses are anticipated to narrow from W737.6bn in 2017 to W184.7bn in 2018.
■ Maintain Buy and raise TP to W129,000 from W113,000 - Margins are improving in line with top-line growth; we are positive about the automotive electronics business; the smartphone
business is expected to recover in 2018. - In deriving our target price, we applied a P/B of 1.45x (20% premium to the upper end of the five-year average) to our 2018F
BPS of W89,004.
Spotlightstocks
70
100
130
160
190
220
250
12/16 4/17 8/17 12/17
LGE KOSPI

Mirae Asset Daewoo Research26| Monthly InsighT
LG Electronics (066570 KS)
Source: Company data, Mirae Asset Daewoo Research
(Wbn, %,, ‘000 units)2017F 2018F
2016 2017F 2018F4Q17F
1Q 2Q 3QP 4QF 1QF 2QF 3QF 4QF YoY QoQ Previous Diff.
MC(MobileCommunications)
Revenue 3,091.7 2,701.4 2,807.7 2,956.8 2,974.2 3,155.9 3,238.0 3,065.9 12,023.9 11,557.6 12,434.0 -0.8 5.3 2,956.8 0.0 OP 3.7 -132.4 -375.3 -233.6 -89.2 -31.6 -48.6 -15.3 -1,218.1 -737.6 -184.7 -49.1 -37.8 -233.6 0.0 OPM 0.1 -4.9 -13.4 -7.9 -3.0 -1.0 -1.5 -0.5 -10.1 -6.4 -1.5 7.5 5.5 -7.9 0.0
HE(HomeEntertainment)
Revenue 4,326.1 4,234.9 4,637.6 5,327.1 4,456.6 4,668.6 5,367.0 5,283.8 17,425.4 18,525.7 19,776.1 11.1 14.9 5,327.1 0.0 OP 382.2 343.0 458.0 426.2 371.5 368.8 476.4 428.0 1,237.4 1,609.4 1,644.6 159.9 -6.9 426.2 0.0 OPM 8.8 8.1 9.9 8.0 8.3 7.9 8.9 8.1 7.1 8.7 8.3 4.6 -1.9 8.0 0.0
H&A(HomeAppliance & Air Solution)
Revenue 4,647.7 5,264.6 4,984.4 4,293.1 4,877.2 5,573.4 5,393.5 4,419.4 17,278.1 19,189.8 20,263.5 5.9 -13.9 4,293.1 0.0 OP 519.1 464.3 424.9 193.2 471.6 551.8 449.0 207.7 1,317.6 1,601.5 1,680.0 31.6 -54.5 193.2 0.0 OPM 11.2 8.8 8.5 4.5 9.7 9.9 8.3 4.7 7.6 8.3 8.3 0.9 -4.0 4.5 0.0
VC(VehicleComponents)
Revenue 876.4 882.6 873.4 873.4 917.1 962.9 1,011.1 1,061.6 2,773.1 3,505.8 3,952.7 0.9 0.0 873.4 0.0 OP -14.5 -16.4 -29.0 -26.2 -27.5 5.8 15.2 18.0 -63.3 -86.1 11.5 80.7 -9.6 -26.2 0.0 OPM -1.7 -1.9 -3.3 -3.0 -3.0 0.6 1.5 1.7 -2.3 -2.5 0.3 -1.3 0.3 -3.0 0.0
Internal&other
Revenue 609.4 679.1 1,088.6 709.2 737.0 790.9 1,137.3 783.4 2,578.5 3,086.3 3,448.6 13.7 -34.9 709.2 0.0 OP -32.4 -4.4 31.6 6.3 8.6 15.0 30.6 8.2 -16.1 1.1 62.4 -51.0 -80.0 6.3 0.0 OPM -5.3 -0.6 2.9 0.9 1.2 1.9 2.7 1.0 -0.6 0.0 1.8 -1.2 -2.0 0.9 0.0
LGInnotek Revenue 1,644.7 1,339.6 1,787.2 2,809.2 2,122.1 1,606.4 1,941.3 2,890.8 5,754.6 7,580.7 8,560.6 36.7 57.2 2,569.9 9.3 OP 66.8 32.5 55.9 194.4 130.4 58.7 93.2 171.0 104.8 349.7 453.3 65.0 247.6 154.9 25.5
Total Revenue 14,657.2 14,551.4 15,224.1 16,268.1 15,358.2 16,064.5 17,158.1 16,727.6 55,367.0 60,700.9 65,308.4 10.1 6.9 16,028.9 1.5 OP 921.5 664.0 516.1 562.0 863.1 956.2 981.4 817.0 1,337.7 2,663.7 3,617.7 -1,693.0 8.9 522.5 7.6 OPM 6.3 4.6 3.4 3.5 5.6 6.0 5.7 4.9 2.4 4.4 5.5 3.7 0.1 3.3 0.2
LGE Revenue 13,012.5 13,211.8 13,436.9 13,459.0 13,236.1 14,458.1 15,216.8 13,836.8 50,845.7 53,120.2 56,747.8 3.4 0.2 13,459.0 0.0 (excludingLG Innotek) OP 854.7 631.5 460.2 367.6 732.7 897.6 888.2 646.0 1,245.2 2,314.0 3,164.4 -342.5 -20.1 367.6 0.0
OPM 6.6 4.8 3.4 2.7 5.5 6.2 5.8 4.7 2.4 4.4 5.6 3.9 -0.7 2.7 0.0 Pretaxprofit 1,091.9 742.3 515.7 576.5 918.7 1,011.4 940.9 776.0 721.7 2,926.3 3,647.0 -793.7 11.8 538.1 7.1 Pretaxmargin 7.4 5.1 3.4 3.5 6.0 6.3 5.5 4.6 1.3 4.8 5.6 4.1 0.2 3.4 0.2 Netprofit 795.3 497.5 318.1 355.6 566.7 623.9 580.4 478.7 76.9 1,966.5 2,249.7 -210.2 11.8 331.9 7.1 Netmargin 5.4 3.4 2.1 2.2 3.7 3.9 3.4 2.9 0.1 3.2 3.4 4.4 0.1 2.1 0.1 Handsetsalesvolume 16,200 14,700 15,600 16,107 15,813 16,425 17,246 17,189 68,900 62,607 66,673 -1.8 3.2 16,107 0.0
-Smartphones 14,800 13,300 13,700 14,844 14,588 15,236 16,116 16,116 55,000 56,644 62,056 5.3 8.3 14,844 0.0 TVsalesvolume 6,100 6,100 6,800 7,024 5,709 6,026 6,792 6,556 27,500 26,024 25,083 -8.8 3.3 7,024 0.0
-OLEDTVsalesvolume 188 200 255 357 321 386 463 555 666 1,000 1,725 22.3 40.0 357 0.0
Spotlightstocks
Earnings table

Mirae Asset Daewoo Research27| Monthly InsighT
LG Display (034220 KS)
FY (Dec.) 12/14 12/15 12/16 12/17F 12/18F 12/19F
Revenue (Wbn) 26,456 28,384 26,504 27,477 27,401 31,827
OP (Wbn) 1,357 1,626 1,311 2,743 1,393 2,722
OP margin (%) 5.1 5.7 4.9 10.0 5.1 8.6
NP (Wbn) 904 967 907 1,949 945 1,876
EPS (W) 2,527 2,701 2,534 5,448 2,641 5,243
ROE (%) 8.2 8.2 7.2 14.2 6.4 11.7
P/E (x) 13.3 9.1 12.4 5.7 11.7 5.9
P/B (x) 1.1 0.7 0.9 0.8 0.7 0.7
(Maintain) Buy
Target price (12M, W) 42,000
Share price (12/28/17, W) 29,900
Expected Return 40%
OP (17F, Wbn) 2,743
Consensus OP (17F, Wbn) 2,725
EPS growth (17F, %) 115.0
Market EPS growth (17F, %) 46.7
P/E (17F, x) 5.5
Market P/E (17F, x) 10.0
KOSPI 2,467.49
Market cap (Wbn) 10,699
Shares outstanding (mn) 358
Free float (%) 62.1
Foreign ownership (%) 24.8
Beta (12M) 0.45
52-week low 27,300
52-week high 38,900
(%) 1M 6M 12M
Absolute -2.9 -19.7 -6.0
Relative -1.1 -22.5 -22.9Notes: All figures are based on consolidated K-IFRS; NP refers to net profit attributable to controlling interestsSource: Mirae Asset Daewoo Research estimatesChuljoong Kim
Panel price downtrend is slowing
■ 4Q17 preview: Revenue of W6.8tr (-2.3% QoQ) and OP of W326bn (-44.3% QoQ)
- Operating profit is expected to remain on the decline QoQ in 4Q amid the steady downtrend in TV panel prices. - Depreciation cost burden will likely increase, as a result of the operation of new small/mid-sized OLED lines. - Won appreciation should also be negative.
■ Catalysts: To transform into an OLED maker in 2018
- The LCD market is expected to rebound in 2Q18, on the back of: 1) improvement in TV demand, driven by the FIFA World Cup; and 2) yield issues at BOE’s new facilities.
- Large-sized OLED: Losses are expected to narrow on solid OLED TV sales and customer base expansion.- Investments in OLED lines in Guangzhou are expected to be confirmed in December; the OLED TV market will likely enter a
virtuous cycle in 2018.
■ Valuation: Maintain Buy and TP of W42,000
- The stock has fallen to a P/B of 0.7-0.8x amid falling panel prices. We recommend buying at the lower end of the P/B band.
- Earnings are expected to pick up starting in 2Q18, in line with market recovery. To be re-rated as an OLED maker - Historically, LGD’s share price hit bottom whenever the panel price downtrend began to slow. - We advise investors to accumulate LGD shares before CES 2018.
Spotlightstocks
70
80
90
100
110
120
130
12/16 4/17 8/17 12/17
LGD KOSPI
Mirae Asset Daewoo Research28| Monthly InsighT
LG Display (034220 KS)
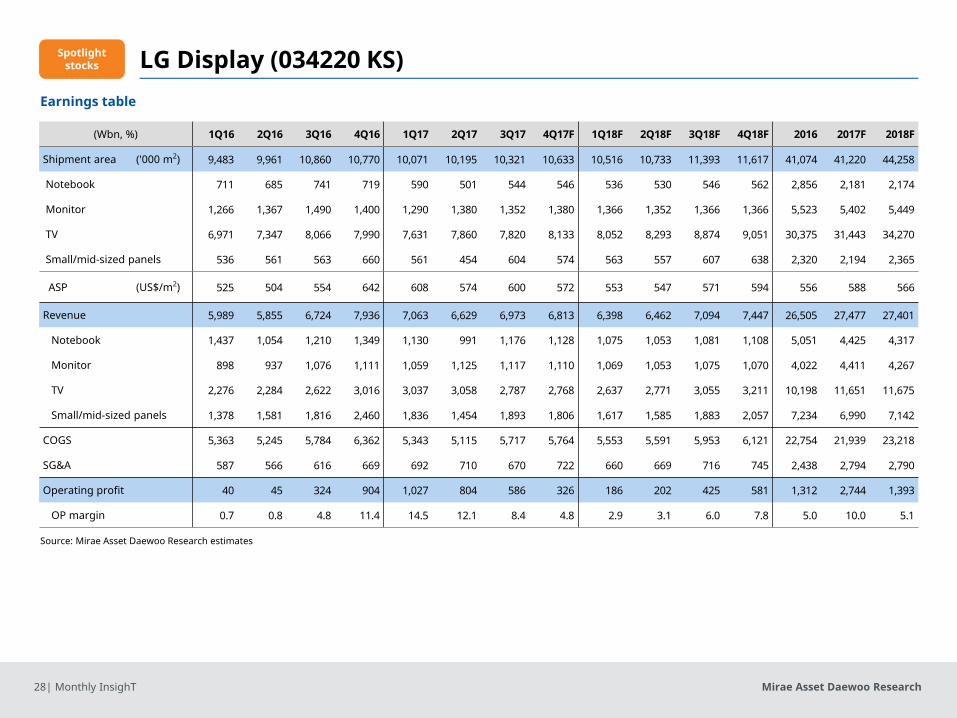
(Wbn, %) 1Q16 2Q16 3Q16 4Q16 1Q17 2Q17 3Q17 4Q17F 1Q18F 2Q18F 3Q18F 4Q18F 2016 2017F 2018F
Shipment area ('000 m2) 9,483 9,961 10,860 10,770 10,071 10,195 10,321 10,633 10,516 10,733 11,393 11,617 41,074 41,220 44,258
Notebook 711 685 741 719 590 501 544 546 536 530 546 562 2,856 2,181 2,174
Monitor 1,266 1,367 1,490 1,400 1,290 1,380 1,352 1,380 1,366 1,352 1,366 1,366 5,523 5,402 5,449
TV 6,971 7,347 8,066 7,990 7,631 7,860 7,820 8,133 8,052 8,293 8,874 9,051 30,375 31,443 34,270
Small/mid-sized panels 536 561 563 660 561 454 604 574 563 557 607 638 2,320 2,194 2,365
ASP (US$/m2) 525 504 554 642 608 574 600 572 553 547 571 594 556 588 566
Revenue 5,989 5,855 6,724 7,936 7,063 6,629 6,973 6,813 6,398 6,462 7,094 7,447 26,505 27,477 27,401
Notebook 1,437 1,054 1,210 1,349 1,130 991 1,176 1,128 1,075 1,053 1,081 1,108 5,051 4,425 4,317
Monitor 898 937 1,076 1,111 1,059 1,125 1,117 1,110 1,069 1,053 1,075 1,070 4,022 4,411 4,267
TV 2,276 2,284 2,622 3,016 3,037 3,058 2,787 2,768 2,637 2,771 3,055 3,211 10,198 11,651 11,675
Small/mid-sized panels 1,378 1,581 1,816 2,460 1,836 1,454 1,893 1,806 1,617 1,585 1,883 2,057 7,234 6,990 7,142
COGS 5,363 5,245 5,784 6,362 5,343 5,115 5,717 5,764 5,553 5,591 5,953 6,121 22,754 21,939 23,218
SG&A 587 566 616 669 692 710 670 722 660 669 716 745 2,438 2,794 2,790
Operating profit 40 45 324 904 1,027 804 586 326 186 202 425 581 1,312 2,744 1,393
OP margin 0.7 0.8 4.8 11.4 14.5 12.1 8.4 4.8 2.9 3.1 6.0 7.8 5.0 10.0 5.1
Earnings table
Source: Mirae Asset Daewoo Research estimates
Spotlightstocks

Mirae Asset Daewoo Research29| Monthly InsighT
Samsung SDI (006400 KS)
FY (Dec.) 12/14 12/15 12/16 12/17F 12/18F 12/19F
Revenue (Wbn) 5,474 4,955 5,201 6,493 8,246 9,818
OP (Wbn) 71 -267 -926 108 501 730
OP margin (%) 1.3 -5.4 -17.8 1.7 6.1 7.4
NP (Wbn) -84 54 219 738 1,142 1,274
EPS (W) -1,426 765 3,117 10,490 16,227 18,104
ROE (%) -0.9 0.5 2.0 6.7 9.7 9.9
P/E (x) - 149.0 35.0 19.5 12.6 11.3
P/B (x) 0.7 0.7 0.7 1.2 1.1 1.0
(Maintain) Buy
Target price (12M, W) 270,000
Share price (11/30/17, W) 204,500
Expected Return 32%
OP (17F, Wbn) 108
Consensus OP (17F, Wbn) 93
EPS growth (17F, %) 236.5
Market EPS growth (17F, %) 46.7
P/E (17F, x) 19.5
Market P/E (17F, x) 10.0
KOSPI 2,467.49
Market cap (Wbn) 14,062
Shares outstanding (mn) 70
Free float (%) 74.6
Foreign ownership (%) 41.7
Beta (12M) 2.45
52-week low 105,500
52-week high 232,500
(%) 1M 6M 12M
Absolute -7.0 19.9 90.2
Relative -5.3 15.8 56.1
Notes: All figures are based on consolidated K-IFRS; NP refers to net profit attributable to controlling interestsSource: Mirae Asset Daewoo Research estimates
Chuljoong [email protected]
EV market’s growth potential is indisputable
■ 4Q17 preview: Revenue of W2tr (+18.7% QoQ), OP of W109bn (+81.5% QoQ)
- Small batteries: Galaxy 9-bound component supplies may begin in 4Q, amid continued growth in North America-bound shipments.
- Mid/large-sized batteries: Entered peak-demand season
- Earnings for the OLED/semiconductor materials business should remain solid.
■ Catalyst: Robust mid/large-sized battery earnings; Rising value of stake in Samsung Display
- The EV battery business is forecast to turn to profit in 2Q18, and its revenue is set to climb to W2.2tr in 2018 (from W1.4tr in2017).
- Safety issues have emerged in the small and mid/large-sized battery markets: top-tier firms with advanced technology will likely continue to benefit.
- Solid sales of the iPhone X and China-bound OLED panel shipments should boost earnings at subsidiary Samsung Display in 2018.
■ Valuation: Maintain Buy and TP of W270,000
- Our target price was derived by summing the value of investment assets (W9.6tr; including Samsung Display stake) and operations (W9.1tr; including the mid/large-sized battery business).
- The firm should see its cost structure improvement accelerate, driven by EV market expansion and market share gains.
- Conditions are ripe for a re-rating of the mid/large-sized battery division.
80
110
140
170
200
230
260
290
11/16 3/17 7/17 11/17
Samsung SDI KOSPI
Other notable stocks
Spotlightstocks

Mirae Asset Daewoo Research30| Monthly InsighT
Samsung SDI (006400 KS) Earnings table
Source: Mirae Asset Daewoo Research estimates
(Wbn, %) 1Q17 2Q17 3Q17 4Q17F 1Q18F 2Q18F 3Q18F 4Q18F 2016 2017F 2018F
Revenue 1,305 1,454 1,707 2,027 1,992 1,948 2,090 2,215 5,203 6,493 8,246
LIB 823 987 1,169 1,467 1,425 1,345 1,457 1,562 3,425 4,447 5,790
Small-sized (IT) 551 690 814 945 962 845 907 901 2,488 3,000 3,615
Mid/large-sized (EV, ESS) 272 298 355 523 463 501 551 660 937 1,447 2,175
Electronic materials 482 467 538 559 567 603 633 653 1,773 2,046 2,456
Operating profit -67 6 60 109 110 94 133 165 -926 108 501
LIB -114 -48 3 49 47 29 66 96 -349 -110 239
Small-sized (IT) -23 15 49 73 73 43 60 60 -28 114 236
Mid-large-sized (EV, ESS) -90 -63 -45 -25 -26 -13 6 37 -321 -223 3
Electronic materials 46 54 57 60 63 65 67 69 167 218 263
Other -744 0 0
OP margin -5.2 0.4 3.5 5.4 5.5 4.8 6.3 7.5 -17.8 1.7 6.1
LIB -13.8 -4.9 0.3 3.3 3.3 2.2 4.5 6.2 -10.2 -2.5 4.1
Electronic materials 9.6 11.5 10.5 10.8 11.0 10.8 10.5 10.5 9.4 10.6 10.7
Other notable stocks
Spotlightstocks

Mirae Asset Daewoo Research31| Monthly InsighT
FY (Dec.) 12/14 12/15 12/16 12/17F 12/18F 12/19F
Revenue (Wbn) 6,100 6,176 6,033 6,847 7,825 8,637
OP (Wbn) 65 301 24 305 535 609
OP margin (%) 1.1 4.9 0.4 4.5 6.8 7.1
NP (Wbn) 503 11 15 167 303 355
EPS (W) 6,478 144 190 2,154 3,902 4,580
ROE (%) 11.5 0.3 0.3 3.9 6.7 7.4
P/E (x) 8.4 436.3 268.0 46.4 25.6 21.8
P/B (x) 0.9 1.1 0.9 1.7 1.6 1.5
(Maintain) Buy
Target Price (12M, W) 131,000
Share price (11/30/17, W) 100,000
Expected Return 31%
(%) 1M 6M 12M
Absolute -2.4 -2.4 98.4
Relative -0.6 -5.8 62.8
Samsung Electro-Mechanics (009150 KS)
Notes: All figures are based on consolidated K-IFRS; NP refers to net profit attributable to controlling interestsSource: Mirae Asset Daewoo Research estimatesWonjae Park
Higher MLCC prices to drive up 2018 earnings
■ 4Q17 preview: OP of W106.1bn (TTB YoY); Strong seasonality expected for 1Q18
- For 4Q17, we project solid revenue (W1.73tr) and operating profit (W106.1bn; TTB YoY) despite weak seasonality.• Camera/telecom modules: Supply of components for SEC’s Galaxy S9 has begun. • Substrates (HDI, RF-PCB, etc.): Growth in RF-PCB revenue from a US customer to drive up profitability• Components (MLCC, inductors, etc.): Sales mix of value-added MLCC products to expand; ASP to rise for the fourth consecutive quarter
- For 1Q18, we forecast revenue of W1.84tr (+17.1% YoY) and operating profit of W136.6bn (+435.1% YoY).• The anticipated launch of the Galaxy S9 will likely boost dual-camera module and SLP (substrate-like PCB) sales. Despite 4Q being a weak season, the company will likely move straight into a high season, thanks to the
launches of new smartphone models; however, the won’s recent appreciation is negative.
■ 2018 OP forecast to climb 75.1% on uptrend in MLCC prices
- SEMCO’s full-year operating profit is projected to come in at W305.5bn for 2017, and climb 75.1% to W535bn in 2018 (supported by full-fledged sales of dual camera modules and a continued uptrend in MLCC prices).
■ Maintain Buy and TP of W131,000
- The won’s recent appreciation and changes in FO-PLP technology trend deserve attention.
OP (17F, Wbn) 305
Consensus OP (17F, Wbn) 311
EPS Growth (17F, %) 1,036.5
Market EPS Growth (17F, %) 46.7
P/E (17F, x) 46.4
Market P/E (17F, x) 10.0
KOSPI 2,467.49
Market Cap (Wbn) 7,469
Shares Outstanding (mn) 78
Free Float (%) 73.3
Foreign Ownership (%) 20.3
Beta (12M) 1.62
52-Week Low 50,400
52-Week High 112,000
70
110
150
190
230
270
12/16 3/17 6/17 9/17 12/17
SEMCO KOSPI
Spotlightstocks

Mirae Asset Daewoo Research32| Monthly InsighT
Earnings table
Source: Company data, Mirae Asset Daewoo Research estimates
Samsung Electro-Mechanics (009150 KS) Spotlightstocks
(Wbn, %)2017F 2018F
2016 2017F 2018F1Q 2Q 3Q 4QF 1QF 2QF 3QF 4QF
Revenue Module solutions 773.0 835.5 822.0 639.2 792.3 908.4 912.3 781.3 2,658.2 3,069.7 3,394.2
Component solutions 490.4 542.4 608.0 630.6 623.8 678.0 754.2 707.0 1,929.2 2,271.4 2,763.0
Substrate solutions 292.5 319.5 399.6 438.4 403.6 320.7 381.5 482.2 1,316.0 1,450.0 1,587.9
Other 14.6 12.5 11.5 17.4 18.9 22.7 20.0 18.4 129.7 56.0 80.0
Total 1,570.5 1,709.9 1,841.1 1,725.7 1,838.6 1,929.8 2,068.0 1,988.8 6,033.1 6,847.1 7,825.2
Operating profit Module solutions 18.9 39.7 32.7 17.1 38.1 47.8 42.7 26.5 28.8 108.4 155.2
Component solutions 45.6 60.5 86.0 97.7 90.5 89.2 110.5 77.8 132.9 289.8 367.9
Substrate solutions -39.0 -29.5 -15.5 -8.8 8.1 -3.2 9.5 -2.4 -137.3 -92.8 12.0
Total 25.5 70.7 103.2 106.1 136.6 133.8 162.7 101.9 24.4 305.5 535.0
OP margin Module solutions 2.4 4.7 4.0 2.7 4.8 5.3 4.7 3.4 1.1 3.5 4.6
Component solutions 9.3 11.2 14.1 15.5 14.5 13.2 14.6 11.0 6.9 12.8 13.3
Substrate solutions -13.3 -9.2 -3.9 -2.0 2.0 -1.0 2.5 -0.5 -10.4 -6.4 0.8
Total 1.6 4.1 5.6 6.1 7.4 6.9 7.9 5.1 0.4 4.5 6.8
Pretax profit 11.5 64.0 98.5 81.8 118.1 117.3 147.2 77.7 32.1 255.8 460.3
Net profit 2.2 33.3 71.9 59.7 75.9 77.8 97.6 51.5 14.7 167.2 302.8
Pretax margin 0.7 3.7 5.4 4.7 6.4 6.1 7.1 3.9 0.5 3.7 5.9
Net margin 0.1 2.0 3.9 3.5 4.1 4.0 4.7 2.6 0.2 2.4 3.9

Mirae Asset Daewoo Research33| Monthly InsighT
FY (Dec.) 12/14 12/15 12/16 12/17F 12/18F 12/19F
Revenue (Wbn) 6,466 6,138 5,755 7,581 8,561 8,754
OP (Wbn) 314 224 105 350 453 456
OP margin (%) 4.9 3.6 1.8 4.6 5.3 5.2
NP (Wbn) 113 95 5 220 300 303
EPS (W) 5,020 4,018 209 9,296 12,697 12,786
ROE (%) 7.5 5.5 0.3 11.7 14.0 12.4
P/E (x) 22.4 24.5 422.4 15.5 11.3 11.3
P/B (x) 1.6 1.3 1.2 1.7 1.5 1.3
(Maintain) Buy
Target Price (12M, W) ▼210,000
Share price (11/30/17, W) 144,000
Expected Return 46%
OP (17F, Wbn) 350
Consensus OP (17F, Wbn) 318
EPS Growth (17F, %) 4,342.0
Market EPS Growth (17F, %) 46.7
P/E (17F, x) 15.5
Market P/E (17F, x) 10.0
KOSPI 2,467.49
Market Cap (Wbn) 3,408
Shares Outstanding (mn) 24
Free Float (%) 59.2
Foreign Ownership (%) 22.9
Beta (12M) 1.10
52-Week Low 85,600
52-Week High 184,500
(%) 1M 6M 12M
Absolute -14.8 -10.8 63.6
Relative -13.2 -13.9 34.3
LG Innotek (011070 KS)
Notes: All figures are based on consolidated K-IFRS; NP refers to net profit attributable to controlling interestsSource: Mirae Asset Daewoo Research estimatesWonjae Park
Spotlightstocks
Strong competitiveness remains intact
■ 4Q17 preview: OP estimate raised to W194.4bn (from W154.9bn)
- For 4Q17, we expect LG Innotek to deliver record-breaking earnings, with revenue of W2.81tr (+36.7% YoY).
- We believe that solid iPhone X sales are driving up the firm’s revenue from dual camera/3D sensing modules. • The outlook for new businesses is also positive.• The firm has begun supplying other components, like RFPCBs (annual revenue of W200bn) and wireless
charging modules (revenue of W150bn).
■ Earnings to remain robust in 1Q18; Automotive electronics business is also positive; Won appreciation is negative
- Earnings will likely remain solid in 1Q18, although our operating profit forecast has been lowered to W130.4bn (from W147bn) due to the won’s recent appreciation.
- LG Group’s potential acquisition of an automotive components supplier would also benefit LG Innotek by boosting sales of the firm’s automotive LEDs.
■ Maintain Buy and lower TP to W210,000 (from W232,000)
- Our new target price is based on our 2018F BPS of 97,775 and a target P/B of 2.16x (20% discount to the five-year peak), lowered from 2.5x due to the won’s recent appreciation and deteriorating investor sentiment.
80
120
160
200
240
12/16 4/17 8/17 12/17
LG Innotek KOSPI
Mirae Asset Daewoo Research34| Monthly InsighT
Earnings table
Source: Company data, Mirae Asset Daewoo Research estimates
LG Innotek (011070 KS) Spotlightstocks
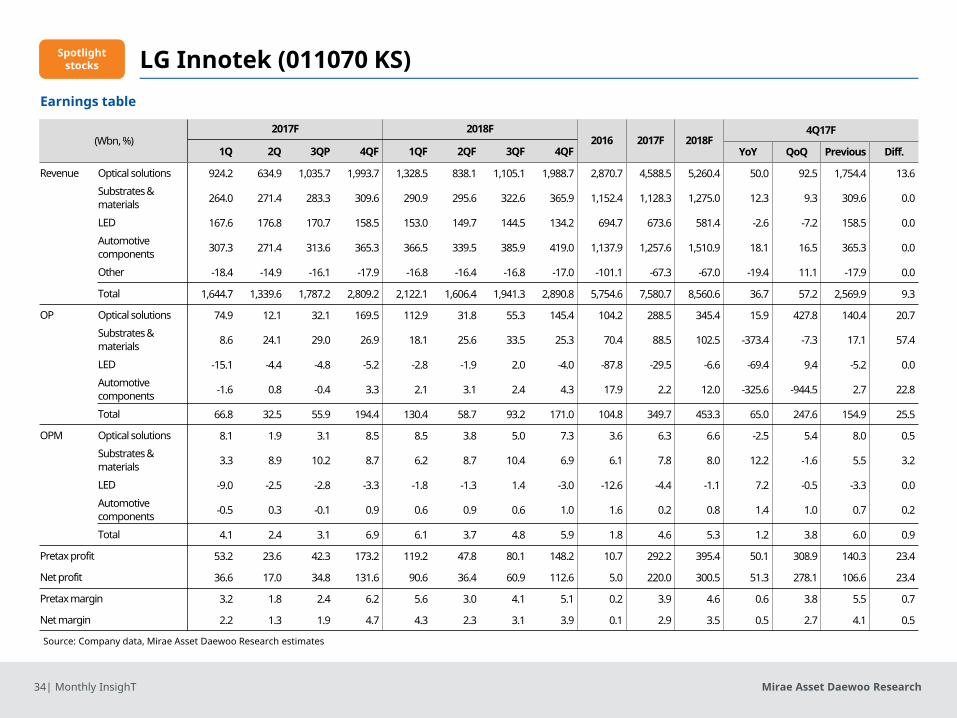
(Wbn, %)2017F 2018F
2016 2017F 2018F4Q17F
1Q 2Q 3QP 4QF 1QF 2QF 3QF 4QF YoY QoQ Previous Diff.
Revenue Optical solutions 924.2 634.9 1,035.7 1,993.7 1,328.5 838.1 1,105.1 1,988.7 2,870.7 4,588.5 5,260.4 50.0 92.5 1,754.4 13.6
Substrates & materials 264.0 271.4 283.3 309.6 290.9 295.6 322.6 365.9 1,152.4 1,128.3 1,275.0 12.3 9.3 309.6 0.0
LED 167.6 176.8 170.7 158.5 153.0 149.7 144.5 134.2 694.7 673.6 581.4 -2.6 -7.2 158.5 0.0
Automotive components 307.3 271.4 313.6 365.3 366.5 339.5 385.9 419.0 1,137.9 1,257.6 1,510.9 18.1 16.5 365.3 0.0
Other -18.4 -14.9 -16.1 -17.9 -16.8 -16.4 -16.8 -17.0 -101.1 -67.3 -67.0 -19.4 11.1 -17.9 0.0
Total 1,644.7 1,339.6 1,787.2 2,809.2 2,122.1 1,606.4 1,941.3 2,890.8 5,754.6 7,580.7 8,560.6 36.7 57.2 2,569.9 9.3
OP Optical solutions 74.9 12.1 32.1 169.5 112.9 31.8 55.3 145.4 104.2 288.5 345.4 15.9 427.8 140.4 20.7
Substrates & materials 8.6 24.1 29.0 26.9 18.1 25.6 33.5 25.3 70.4 88.5 102.5 -373.4 -7.3 17.1 57.4
LED -15.1 -4.4 -4.8 -5.2 -2.8 -1.9 2.0 -4.0 -87.8 -29.5 -6.6 -69.4 9.4 -5.2 0.0
Automotive components -1.6 0.8 -0.4 3.3 2.1 3.1 2.4 4.3 17.9 2.2 12.0 -325.6 -944.5 2.7 22.8
Total 66.8 32.5 55.9 194.4 130.4 58.7 93.2 171.0 104.8 349.7 453.3 65.0 247.6 154.9 25.5
OPM Optical solutions 8.1 1.9 3.1 8.5 8.5 3.8 5.0 7.3 3.6 6.3 6.6 -2.5 5.4 8.0 0.5
Substrates & materials 3.3 8.9 10.2 8.7 6.2 8.7 10.4 6.9 6.1 7.8 8.0 12.2 -1.6 5.5 3.2
LED -9.0 -2.5 -2.8 -3.3 -1.8 -1.3 1.4 -3.0 -12.6 -4.4 -1.1 7.2 -0.5 -3.3 0.0
Automotive components -0.5 0.3 -0.1 0.9 0.6 0.9 0.6 1.0 1.6 0.2 0.8 1.4 1.0 0.7 0.2
Total 4.1 2.4 3.1 6.9 6.1 3.7 4.8 5.9 1.8 4.6 5.3 1.2 3.8 6.0 0.9
Pretax profit 53.2 23.6 42.3 173.2 119.2 47.8 80.1 148.2 10.7 292.2 395.4 50.1 308.9 140.3 23.4
Net profit 36.6 17.0 34.8 131.6 90.6 36.4 60.9 112.6 5.0 220.0 300.5 51.3 278.1 106.6 23.4
Pretax margin 3.2 1.8 2.4 6.2 5.6 3.0 4.1 5.1 0.2 3.9 4.6 0.6 3.8 5.5 0.7
Net margin 2.2 1.3 1.9 4.7 4.3 2.3 3.1 3.9 0.1 2.9 3.5 0.5 2.7 4.1 0.5

Mirae Asset Daewoo Research35| Monthly InsighT
Seoul Semiconductor (046890 KQ)
Notes: All figures are based on consolidated K-IFRS; NP refers to net profit attributable to controlling interestsSource: Mirae Asset Daewoo Research estimates
FY (Dec.) 12/13 12/14 12/15 12/16 12/17F 12/18F
Revenue (Wbn) 939 1,011 954 1,115 1,264 1,445
OP (Wbn) 3 46 58 103 123 142
OP margin (%) 0.3 4.5 6.1 9.2 9.7 9.8
NP (Wbn) -7 17 36 61 82 95
EPS (W) -118 291 621 1,054 1,407 1,635
ROE (%) -1.2 3.0 6.1 9.8 12.0 12.5
P/E (x) - 54.0 25.1 26.4 19.8 17.0
P/B (x) 2.1 1.6 1.5 2.5 2.2 2.0
(Maintain) Buy
Target Price (12M, W) 37,800
Share price (12/28/17, W) 27,850
Expected Return 36%
OP (17F, Wbn) 103
Consensus OP (17F, Wbn) 105
EPS Growth (17F, %) 69.8
Market EPS Growth (17F, %) 46.7
P/E (17F, x) 26.4
Market P/E (17F, x) 10.0
KOSDAQ 798.42
Market Cap (Wbn) 1,624
Shares Outstanding (mn) 58
Free Float (%) 64.2
Foreign Ownership (%) 18.5
Beta (12M) 0.68
52-Week Low 14,750
52-Week High 33,150
(%) 1M 6M 12M
Absolute -12.7 29.5 78.5
Relative -15.5 8.0 40.3
Wonjae [email protected]
Other notable stocks
Spotlightstocks
80
120
160
200
240
12/16 4/17 8/17 12/17
Seoul Semiconductor
KOSDAQ
Improving market conditions
■ 4Q17 preview: OP of W25.3bn (+23.5% YoY)
- For 4Q17, we see revenue of W286.9bn (+18.8% YoY) and operating profit of W25.3bn (+23.5% YoY).
- Increased exposure to automotive lighting and tight SG&A expense control should keep OP margin steady.
- LED market conditions are gradually improving: The ongoing restructuring in the TV BLU industry has led to a slowdown in the decline in LED chip prices (and even some price hikes); the company is exploring new markets, including the automotive market.
■ 2018F revenue of W1.26tr; Patents, top-line growth, and potential industry restructuring are positives
- We expect 2017 revenue to exceed the W1tr mark again, reaching W1.11tr (+16.8% YoY).
- Top-line growth will likely continue in 2018, with record-high revenue of W1.26tr (+13.4% YoY) supported by expansion of automotive LED sales and operation of a new Vietnam plant (due to be completed in March 2018).
- Growth of the OLED market is a risk, but at the same time could accelerate LED industry restructuring.
■ Maintain Buy and TP of W37,800
- Although the stock is not undervalued, expectations for the LED industry could provide a boost.

Mirae Asset Daewoo Research36| Monthly InsighT
Seoul Semiconductor (046890 KQ)Earnings table
Source: Company data, Mirae Asset Daewoo Research estimates
(Wbn, W, %)2017F 2018F
2016 2017F 2018F1Q 2Q 3Q 4QF 1QF 2QF 3QF 4QF
Revenue 256.2 267.0 304.5 286.9 284.5 307.8 346.9 324.4 953.8 1,114.5 1,263.6
Operating profit 23.4 24.1 30.6 25.3 26.6 29.6 37.7 28.9 57.5 103.4 122.8
Pretax profit 10.5 29.7 30.4 23.4 25.9 29.0 37.0 28.2 49.6 94.0 119.9
Net profit 6.8 21.4 17.3 16.0 17.7 19.8 25.3 19.3 36.2 61.4 82.0
EPS 116 366 296 275 303 340 434 330 621 1,054 1,407
OP margin 9.1 9.0 10.1 8.8 9.4 9.6 10.9 8.9 6.0 9.3 9.7
Pretax margin 4.1 11.1 10.0 8.2 9.1 9.4 10.7 8.7 5.2 8.4 9.5
Net margin 2.6 8.0 5.7 5.6 6.2 6.4 7.3 5.9 3.8 5.5 6.5
Other notable stocks
Spotlightstocks

Mirae Asset Daewoo Research37| Monthly InsighT
Hanwha Techwin (012450 KS)
Notes: All figures are based on consolidated K-IFRS; NP refers to net profit attributable to controlling interestsSource: Mirae Asset Daewoo Research estimates
FY (Dec.) 12/14 12/15 12/16 12/17F 12/18F 12/19F
Revenue (Wbn) 2,616 2,613 3,519 4,232 4,322 4,918
OP (Wbn) 8 -60 151 92 133 173
OP margin (%) 0.3 -2.3 4.3 2.2 3.1 3.5
NP (Wbn) -119 6 345 48 88 119
EPS (W) -2,236 108 6,498 905 1,669 2,257
ROE (%) -7.1 0.3 15.1 2.1 3.7 4.9
P/E (x) - 329.2 6.7 39.3 21.3 15.8
P/B (x) 0.8 0.8 1.0 0.8 0.8 0.7
(Maintain) Buy
Target Price (12M, W) ▼45,400
Share price (12/28/17, W) 35,550
Expected Return 52%
OP (17F, Wbn) 92
Consensus OP (17F, Wbn) 98
EPS Growth (17F, %) -86.1
Market EPS Growth (17F, %) 46.7
P/E (17F, x) 39.3
Market P/E (17F, x) 10.0
KOSPI 2,467.49
Market Cap (Wbn) 1,870
Shares Outstanding (mn) 53
Free Float (%) 67.3
Foreign Ownership (%) 18.0
Beta (12M) 0.89
52-Week Low 32,750
52-Week High 53,100
(%) 1M 6M 12M
Absolute 0.7 -21.7 -17.3
Relative 2.6 -24.4 -32.2
Wonjae [email protected]
Earnings to normalize in 2018
■ 4Q17 preview: OP to rise 83.3% YoY to W55.9bn on self-propelled howitzer exports
- After remaining sluggish through 3Q, earnings will likely see a pickup in 4Q (revenue of W1.55tr and operating profit of W55.9bn), driven by increased exports of the K9 self-propelled howitzer (estimated at W170bn).
■ Operating profit to normalize in 2018
- We forecast 2017 operating profit at a mere W92.5bn (-38.6% YoY), in light of the persistent sluggishness of the security camera business.
- For 2018, operating profit is projected to recover to W133.2bn (+44% YoY), on a turnaround of the security camera business and continuous exports of defense products.
- The engine division will likely continue to incur revenue & risk-sharing program expenses, but such expenses need to be viewed as investments for the future.
■ Maintain Buy but lower TP to W45,400 (from W54,000)
- Our new target price is based on 2018F BPS of W45,437 and a P/B of 1.0x (20% discount to the five-year average).
- We continue to recommend expanding positions in the event of correction.
- We caution that the results of the ongoing tax investigation could be reflected in 4Q17.
Other notable stocks
50
70
90
110
130
12/16 4/17 8/17 12/17
Hanwha Techwin KOSPI

Mirae Asset Daewoo Research38| Monthly InsighT
Hanwha Techwin (012450 KS)Earnings table
Source: Company data, Mirae Asset Daewoo Research estimates
(Wbn, %, %p)2017F 2018F
2016 2017F 2018F1Q 2Q 3Q 4QF 1QF 2QF 3QF 4QF
Revenue CCTV 136.7 168.1 143.5 165.0 143.5 184.9 200.9 178.2 637.8 613.3 707.5 Engine/energy equip. 221.2 234.6 213.3 354.5 238.9 254.3 266.6 283.6 1,050.7 1,023.6 1,043.4 Hanwha Power Systems 23.5 67.7 36.6 75.0 47.0 47.4 54.9 71.3 197.1 202.8 220.5 Hanwha Precision Machinery 55.9 73.1 56.3 59.5 56.5 62.2 71.5 67.9 169.3 244.8 258.1 Hanwha Systems 134.6 153.0 150.3 345.0 155.3 176.5 194.2 242.7 217.3 782.9 768.7
Hanwha Land Systems 110.5 187.7 149.8 301.0 150.5 165.6 173.8 208.6 714.4 749.0 698.5
Hanwha Defense 92.0 152.1 129.5 263.0 105.2 167.1 183.8 211.4 532.0 636.6 667.6
Total 774.3 1,036.3 868.6 1,552.3 886.2 1,047.3 1,135.1 1,253.0 3,518.8 4,231.5 4,321.7
Operatingprofit
CCTV -0.1 -3.7 -10.3 -21.5 -4.3 0.0 5.0 3.4 33.7 -35.6 4.1
Engine/energy equip. 12.6 5.2 -1.3 4.6 6.0 5.6 7.5 3.7 58.0 21.1 22.7
Hanwha Power Systems -7.1 -2.2 -0.7 -3.0 -1.4 -1.4 -0.9 -1.4 -12.8 -13.0 -5.1 Hanwha Precision Machinery 3.7 10.0 4.1 3.3 2.9 4.0 5.1 3.8 -15.4 21.2 15.9
Hanwha Systems -1.5 -1.8 2.2 20.4 2.3 2.6 6.8 8.5 13.5 19.2 20.3
Hanwha Land Systems 1.3 9.9 2.6 42.1 15.1 14.1 14.8 11.5 38.6 56.0 55.4
Hanwha Defense 2.3 5.8 9.4 13.7 3.4 8.3 12.0 11.5 35.1 31.2 35.2
Total 11.2 23.2 2.2 55.9 20.1 29.4 46.4 37.2 150.7 92.5 133.2
OP margin 1.4 2.2 0.3 3.6 2.3 2.8 4.1 3.0 4.3 2.2 3.1
Pretax profit 5.9 19.1 -10.1 48.0 14.9 24.0 40.4 30.4 418.5 62.9 109.8
Net profit 9.9 17.1 -17.6 38.4 11.9 19.2 32.3 24.4 345.2 47.8 87.8
Pretax margin 0.8 1.8 -1.2 3.1 1.7 2.3 3.6 2.4 11.9 1.5 2.5
Net margin 1.3 1.7 -2.0 2.5 1.3 1.8 2.8 1.9 9.8 1.1 2.0
Other notable stocks

Mirae Asset Daewoo Research39| Monthly InsighT
APPENDIX 1
Important Disclosures & Disclaimers 2-Year Rating and Target Price History
Company (Code) Date Rating Target Price Company (Code) Date Rating Target Price LG Electronics(066570) 01/01/2018 Buy 129,000 01/01/2017 Buy 38,000 10/26/2017 Buy 113,000 12/31/2016 No Coverage 08/30/2017 Buy 100,000 07/27/2016 Buy 37,000 07/10/2017 Buy 95,000 04/01/2016 Buy 32,000 04/09/2017 Buy 96,000 01/27/2016 Buy 29,000 03/13/2017 Buy 87,700 11/29/2015 Buy 31,000 03/01/2017 Buy 79,000 Samsung SDI(006400) 10/31/2017 Buy 270,000 01/26/2017 Buy 65,600 09/01/2017 Buy 240,000 10/28/2016 Buy 64,000 07/27/2017 Buy 210,000 10/03/2016 Buy 67,000 07/03/2017 Trading Buy 180,000 07/28/2016 Buy 75,000 01/01/2017 Hold 03/01/2016 Buy 78,000 12/31/2016 No Coverage 01/26/2016 Buy 67,000 10/28/2016 Trading Buy 107,000 11/27/2015 Buy 70,000 09/11/2016 Trading Buy 120,000 LG Display(034220) 10/25/2017 Buy 42,000 04/29/2016 Trading Buy 129,000 07/03/2017 Buy 50,000 01/25/2016 Buy 138,000 04/26/2017 Buy 40,000 11/29/2015 Buy 148,000
0
50,000
100,000
150,000
Jan 16 Jan 17 Jan 18
(W) LG Electronics
0
10,000
20,000
30,000
40,000
50,000
60,000
Jan 16 Jan 17 Jan 18
(W) LG Display
0
50,000
100,000
150,000
200,000
250,000
300,000
Jan 16 Jan 17 Jan 18
(W) Samsung SDI

Mirae Asset Daewoo Research40| Monthly InsighT
2-Year Rating and Target Price History
Company (Code) Date Rating Target Price Company (Code) Date Rating Target Price Samsung Electro-Mechanics(009150) 07/23/2017 Buy 131,000 01/25/2016 Buy 115,000 07/03/2017 Buy 123,000 07/26/2015 Buy 123,000 05/31/2017 Buy 100,000 Seoul Semiconductor(046890) 11/30/2017 Buy 37,800 05/01/2017 Buy 93,000 10/25/2017 Buy 34,300 04/02/2017 Buy 85,000 10/10/2017 Buy 31,000 02/20/2017 Buy 76,000 09/01/2017 Buy 28,000 01/26/2017 Buy 68,000 07/03/2017 Buy 26,900 10/03/2016 Buy 65,300 04/02/2017 Buy 23,400 08/31/2016 Buy 72,200 02/02/2017 Buy 20,300 04/26/2016 Buy 73,700 10/03/2016 Buy 19,900 01/31/2016 Buy 74,600 07/31/2016 Buy 21,500 10/30/2015 Buy 93,000 02/01/2016 Buy 19,500 LG Innotek(011070) 01/01/2018 Buy 210,000 10/27/2015 Buy 24,000 10/25/2017 Buy 232,000 Hanwha Techwin(012450) 01/02/2018 Buy 45,400 09/01/2017 Buy 230,000 11/05/2017 Buy 54,000 07/03/2017 Buy 199,000 10/10/2017 Buy 47,000 04/02/2017 Buy 171,000 07/18/2017 Buy 57,000 03/01/2017 Buy 156,000 05/01/2017 Buy 69,000 01/25/2017 Buy 130,000 04/23/2017 Buy 61,000 01/01/2017 Buy 119,000 01/31/2017 Buy 62,000 11/29/2016 Buy 115,000 11/02/2016 Buy 71,000 10/03/2016 Buy 105,000 10/03/2016 Buy 80,000 07/27/2016 Buy 117,000 07/31/2016 Buy 77,000 06/01/2016 Buy 107,000 06/08/2016 Buy 61,000 04/27/2016 Buy 96,000 05/01/2016 Buy 59,000 04/01/2016 Buy 102,000 10/28/2015 Buy 49,000
0
50,000
100,000
150,000
Jan 16 Jan 17 Jan 18
(W) Samsung Electro-Mechanics
0
50,000
100,000
150,000
200,000
250,000
Jan 16 Jan 17 Jan 18
(W) LG Innotek
0
10,000
20,000
30,000
40,000
Jan 16 Jan 17 Jan 18
(W) Seoul Semiconductor
0
20,000
40,000
60,000
80,000
100,000
Jan 16 Jan 17 Jan 18
(W) Hanwha Techwin

Mirae Asset Daewoo Research41| Monthly InsighT
Equity Ratings Distribution & Investment Banking Services Buy Trading Buy Hold Sell
Equity Ratings Distribution 74.52% 12.50% 12.98% 0.00% Investment Banking Services 70.73% 19.51% 9.76% 0.00% * Based on recommendations in the last 12-months (as of September 30, 2017)
Disclosures As of the publication date, Mirae Asset Daewoo Co., Ltd. and/or its affiliates do not have any special interest with the subject company and do not own 1% or more of the subject company's shares outstanding.
Analyst Certification The research analysts who prepared this report (the “Analysts”) are registered with the Korea Financial Investment Association and are subject to Korean securities regulations. They are neither registered as research analysts in any other jurisdiction nor subject to the laws or regulations thereof. Each Analyst responsible for the preparation of this report certifies that (i) all views expressed in this report accurately reflect the personal views of the Analyst about any and all of the issuers and securities named in this report and (ii) no part of the compensation of the Analyst was, is, or will be directly or indirectly related to the specific recommendations or views contained in this report. Mirae Asset Daewoo Co., Ltd. (“Mirae Asset Daewoo”) policy prohibits its Analysts and members of their households from owning securities of any company in the Analyst’s area of coverage, and the Analysts do not serve as an officer, director or advisory board member of the subject companies. Except as otherwise specified herein, the Analysts have not received any compensation or any other benefits from the subject companies in the past 12 months and have not been promised the same in connection with this report. Like all employees of Mirae Asset Daewoo, the Analysts receive compensation that is determined by overall firm profitability, which includes revenues from, among other business units, the institutional equities, investment banking, proprietary trading and private client division. At the time of publication of this report, the Analysts do not know or have reason to know of any actual, material conflict of interest of the Analyst or Mirae Asset Daewoo except as otherwise stated herein.
Stock Ratings Industry Ratings Buy : Relative performance of 20% or greater Overweight : Fundamentals are favorable or improving Trading Buy : Relative performance of 10% or greater, but with volatility Neutral : Fundamentals are steady without any material changes Hold : Relative performance of -10% and 10% Underweight : Fundamentals are unfavorable or worsening Sell : Relative performance of -10%
Ratings and Target Price History (Share price (─), Target price (▬), Not covered (■), Buy (▲), Trading Buy (■), Hold (●), Sell (◆)) * Our investment rating is a guide to the relative return of the stock versus the market over the next 12 months. * Although it is not part of the official ratings at Mirae Asset Daewoo Co., Ltd., we may call a trading opportunity in case there is a technical or short-term material development. * The target price was determined by the research analyst through valuation methods discussed in this report, in part based on the analyst’s estimate of future earnings. * The achievement of the target price may be impeded by risks related to the subject securities and companies, as well as general market and economic conditions.
Mirae Asset Daewoo Research42| Monthly InsighT
Disclaimers This report was prepared by Mirae Asset Daewoo, a broker-dealer registered in the Republic of Korea and a member of the Korea Exchange. Information and opinions contained hereinhave been compiled in good faith and from sources believed to be reliable, but such information has not been independently verified and Mirae Asset Daewoo makes no guarantee,representation or warranty, express or implied, as to the fairness, accuracy, completeness or correctness of the information and opinions contained herein or of any translation intoEnglish from the Korean language. In case of an English translation of a report prepared in the Korean language, the original Korean language report may have been made available toinvestors in advance of this report. The intended recipients of this report are sophisticated institutional investors who have substantial knowledge of the local business environment, its common practices, laws andaccounting principles and no person whose receipt or use of this report would violate any laws or regulations or subject Mirae Asset Daewoo or any of its affiliates to registration orlicensing requirements in any jurisdiction shall receive or make any use hereof. This report is for general information purposes only and it is not and shall not be construed as an offer or a solicitation of an offer to effect transactions in any securities or otherfinancial instruments. The report does not constitute investment advice to any person and such person shall not be treated as a client of Mirae Asset Daewoo by virtue of receiving thisreport. This report does not take into account the particular investment objectives, financial situations, or needs of individual clients. The report is not to be relied upon in substitutionfor the exercise of independent judgment. Information and opinions contained herein are as of the date hereof and are subject to change without notice. The price and value of theinvestments referred to in this report and the income from them may depreciate or appreciate, and investors may incur losses on investments. Past performance is not a guide tofuture performance. Future returns are not guaranteed, and a loss of original capital may occur. Mirae Asset Daewoo, its affiliates and their directors, officers, employees and agents donot accept any liability for any loss arising out of the use hereof. Mirae Asset Daewoo may have issued other reports that are inconsistent with, and reach different conclusions from, the opinions presented in this report. The reports may reflectdifferent assumptions, views and analytical methods of the analysts who prepared them. Mirae Asset Daewoo may make investment decisions that are inconsistent with the opinionsand views expressed in this research report. Mirae Asset Daewoo, its affiliates and their directors, officers, employees and agents may have long or short positions in any of the subjectsecurities at any time and may make a purchase or sale, or offer to make a purchase or sale, of any such securities or other financial instruments from time to time in the open marketor otherwise, in each case either as principals or agents. Mirae Asset Daewoo and its affiliates may have had, or may be expecting to enter into, business relationships with the subjectcompanies to provide investment banking, market-making or other financial services as are permitted under applicable laws and regulations. No part of this document may be copied or reproduced in any manner or form or redistributed or published, in whole or in part, without the prior written consent of Mirae AssetDaewoo. Distribution United Kingdom: This report is being distributed by Mirae Asset Securities (UK) Ltd. in the United Kingdom only to (i) investment professionals falling within Article 19(5) of the FinancialServices and Markets Act 2000 (Financial Promotion) Order 2005 (the “Order”), and (ii) high net worth companies and other persons to whom it may lawfully be communicated, fallingwithin Article 49(2)(A) to (E) of the Order (all such persons together being referred to as “Relevant Persons”). This report is directed only at Relevant Persons. Any person who is not aRelevant Person should not act or rely on this report or any of its contents. United States: Mirae Asset Daewoo is not a registered broker-dealer in the United States and, therefore, is not subject to U.S. rules regarding the preparation of research reports andthe independence of research analysts. This report is distributed in the U.S. by Mirae Asset Securities (USA) Inc., a member of FINRA/SIPC, to “major U.S. institutional investors” inreliance on the exemption from registration provided by Rule 15a-6(b)(4) under the U.S. Securities Exchange Act of 1934, as amended. All U.S. persons that receive this document bytheir acceptance hereof represent and warrant that they are a major U.S. institutional investor and have not received this report under any express or implied understanding that theywill direct commission income to Mirae Asset Daewoo or its affiliates. Any U.S. recipient of this document wishing to effect a transaction in any securities discussed herein shouldcontact and place orders with Mirae Asset Securities (USA) Inc. Mirae Asset Securities (USA) Inc. accepts responsibility for the contents of this report in the U.S., subject to the termshereof, to the extent that it is delivered to a U.S. person other than a major U.S. institutional investor. Under no circumstances should any recipient of this research report effect anytransaction to buy or sell securities or related financial instruments through Mirae Asset Daewoo. The securities described in this report may not have been registered under the U.S.Securities Act of 1933, as amended, and, in such case, may not be offered or sold in the U.S. or to U.S. persons absent registration or an applicable exemption from the registrationrequirements. Hong Kong: This document has been approved for distribution in Hong Kong by Mirae Asset Securities (HK) Ltd., which is regulated by the Hong Kong Securities and FuturesCommission. The contents of this report have not been reviewed by any regulatory authority in Hong Kong. This report is for distribution only to professional investors within themeaning of Part I of Schedule 1 to the Securities and Futures Ordinance of Hong Kong (Cap. 571, Laws of Hong Kong) and any rules made thereunder and may not be redistributed inwhole or in part in Hong Kong to any person. All Other Jurisdictions: Customers in all other countries who wish to effect a transaction in any securities referenced in this report should contact Mirae Asset Daewoo or its affiliates onlyif distribution to or use by such customer of this report would not violate applicable laws and regulations and not subject Mirae Asset Daewoo and its affiliates to any registration orlicensing requirement within such jurisdiction.

Mirae Asset Daewoo Research43| Monthly InsighT
Mirae Asset Daewoo International Network
Mirae Asset Daewoo Co., Ltd. (Seoul) Mirae Asset Securities (HK) Ltd. Mirae Asset Securities (UK) Ltd. Global Equity Sales Team
Mirae Asset Center 1 Building 26 Eulji-ro 5-gil, Jung-gu, Seoul 04539 Korea
Suites 1109-1114, 11th Floor Two International Finance Centre 8 Finance Street, Central Hong Kong China
41st Floor, Tower 42 25 Old Broad Street, London EC2N 1HQ United Kingdom
Tel: 82-2-3774-2124 Tel: 852-2845-6332 Tel: 44-20-7982-8000
Mirae Asset Securities (USA) Inc. Mirae Asset Wealth Management (USA) Inc. Mirae Asset Wealth Management (Brazil) CCTVM 810 Seventh Avenue, 37th Floor
New York, NY 10019 USA
555 S. Flower Street, Suite 4410, Los Angeles, California 90071 USA
Rua Funchal, 418, 18th Floor, E-Tower Building Vila Olimpia Sao Paulo - SP 04551-060 Brasil
Tel: 1-212-407-1000 Tel: 1-213-262-3807 Tel: 55-11-2789-2100
PT. Mirae Asset Sekuritas Indonesia Mirae Asset Securities (Singapore) Pte. Ltd. Mirae Asset Securities (Vietnam) LLC Equity Tower Building Lt. 50
Sudirman Central Business District Jl. Jend. Sudirman, Kav. 52-53 Jakarta Selatan 12190 Indonesia
6 Battery Road, #11-01 Singapore 049909 Republic of Singapore
7F, Saigon Royal Building 91 Pasteur St. District 1, Ben Nghe Ward, Ho Chi Minh City Vietnam
Tel: 62-21-515-3281 Tel: 65-6671-9845 Tel: 84-8-3911-0633 (ext.110)
Mirae Asset Securities Mongolia UTsK LLC Mirae Asset Investment Advisory (Beijing) Co., Ltd Beijing Representative Office
#406, Blue Sky Tower, Peace Avenue 17 1 Khoroo, Sukhbaatar District Ulaanbaatar 14240 Mongolia
2401B, 24th Floor, East Tower, Twin Towers B12 Jianguomenwai Avenue, Chaoyang District Beijing 100022 China
2401A, 24th Floor, East Tower, Twin Towers B12 Jianguomenwai Avenue, Chaoyang District Beijing100022 China
Tel: 976-7011-0806 Tel: 86-10-6567-9699 Tel: 86-10-6567-9699 (ext. 3300)
Shanghai Representative Office Ho Chi Minh Representative Office
38T31, 38F, Shanghai World Financial Center 100 Century Avenue, Pudong New Area Shanghai 200120 China
7F, Saigon Royal Building 91 Pasteur St. District 1, Ben Nghe Ward, Ho Chi Minh City Vietnam
Tel: 86-21-5013-6392 Tel: 84-8-3910-7715