trakken - trend study 2020
TRANSCRIPT

TREND STUDYD I G I T A L A N A LY T I C S | C O N V E R S I O N O P T I M I Z A T I O N
Trakken Web Services GmbH
Zirkusweg 1
20359 Hamburg
040 - 284 53 - 6700
www.trakken.de
1 Preface
2 Analysis approach
3 Digital Analytics
3.1 Marketing channels, tools & KPIs
3.2 Top Topics of 2020
3.3 Strengths, weaknesses, opportunities & threats
3.4 Responsibility & budget
3.5 Data protection
4 Conversion Optimization
4.1 Test concepts, tools & KPIs
4.2 Top topics 2020
4.3 Responsibility & budget
2
3
3
8
9
20
23
31
33
17
36
37
43
45
CONTENTS

TIMO ADENManaging Director Trakken Web Services
t e fift yea in a e a e li ing t e t en t y an analy ing a i t ic elate t igital analytic t e a t t ee yea t e ey a al incl e e ti n n c n e i n ti i ati n i a ac el t
i entify c e en i e t en
2
In addition to the annually recurring questions on the areas of digital ana-lytics and conversion optimization, this year‘s trend study also included questions on special focus topics in digital analysis. While the focus of the survey in 2018 and 2019 were attribution, personalization and user segmentation, the focus this year is on data protection. Companies are focusing on a compliant approach to data protection, due in particular to the changes made to the Cookie Policy in October 2019. Likewise, in the course of the survey, the topic of customer journeys has emerged as a core topic among those surveyed. This includes mapping the com-plete customer journey of the users and measuring all points of contact of the customers with a brand or a product. The aspects of customer segmentation and personalized customer approach are also included.
The aim of this study is to identify such trends and to observe the core topics in the areas of digital analytics and conversion optimization. A consistent study design with constant questions and formulations
ensures that the results remain free of methodological influences and that concrete trends can be identified over time. Questions on current topics and challenges in the industry are also included in the survey every year. Thus, the trend study offers a comprehensive and methodologically valid overview of the industry.
Of course, none of this would be possible without the numerous answers provided by the study participants. We would like to express our sincere thanks to them.
That said, we hope you enjoy reading our 2020 Trend Study.
Your Trakken Team
1 Preface
MOIN

3
ANALYSIS APPROACHAim | Survey Method | Interviewed Companies
Within the scope of the Trend Study of 2020, this year‘s develop-ments in the areas of Digital Analytics (DA) and Conversion Op-timization (CO) were surveyed. Particular interest was shown in questions with a strong reference to everyday work but also possible challenges. In addition, the SWOT analysis was used to identify and evaluate the strengths, weaknesses, opportunities and threats in the field of digital analytics. The renewed imple-mentation of the trend study provides insights into the change in results over time. However, new topics were also included in the focus of the study.
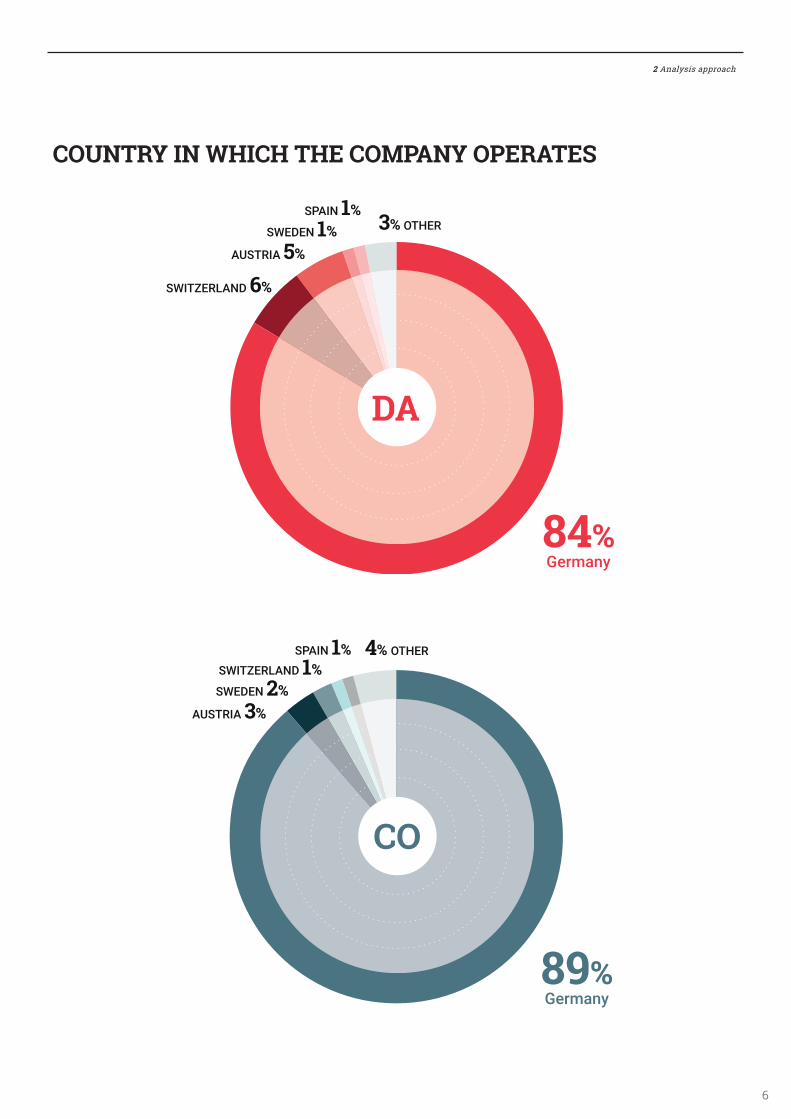
A look at the companies shows comparable results for DA and CO. 71% of the participants in the study work in-house and are part of an in-house team, while 29% work for an agency. Looking at the industry distribution, it can be seen for both Digital Ana-lytics and Conversion Optimization that the majority of compa-nies belong to the eCommerce and Media/Content industries. The IT services, trade, tourism and finance sectors form another part. In contrast, differences between the two sectors can be seen with regard to the size of the companies surveyed. In the field of digital analytics, 22% of the companies employ 100-499 employees and over 40% more than 500 employees, while the other companies employ less than 100 employees. In the area of Conversion Optimization, the proportion of companies emp-loying 100-499 employees is significantly higher, at just 35%. Conversely, the proportion of companies with more than 500 employees has fallen significantly compared to the previous year and is 27%. Finally, it can be said of the companies survey-ed that the majority of them work in German-speaking count-ries. Smaller shares are attributed to other european countries.
The 2020 Trend Study was launched at the beginning of the year. The data collection of the online survey covered the pe-riod from mid to end January 2020. For the most part, closed questions were asked on the topics of budget, responsibilities and tools. Open questions were formulated with regard to the strengths, weaknesses, opportunities and threats of digital ana-lytics. The following results are based on these two surveys and present a well-founded picture of the Digital Analytics and Con-version Optimization areas.
AIM SURVEY METHOD
INTERVIEWED COMPANIES
DA
29% Agency/Consultant
71% Company/In-house employee
CO
29% Agency/Consultant
71% Company/In-house employee
2 Analysis approach

0 20 40 60 80 100
0 20 40 60 80 100 0 20 40 60 80 100
0 20 40 60 80 100 0 20 40 60 80 100
up to 9 employees 10 - 49 employees
100 - 499 employees 500 or more employees
50 - 99 employees
6%
9%
9%
18%
11%
18%
22%
28%
26%
43%
43%
36%
11%
10%
12%
201820192020
0 20 40 60 80 100
0 20 40 60 80 100 0 20 40 60 80 100
0 20 40 60 80 100 0 20 40 60 80 100
100 - 499 employees 500 or more employees
up to 9 employees 10 - 49 employees 50 - 99 employees
8%
9%
10%
13%
8%
35%
23%
34%
27%
36%
26%
16%
24%
19%
201820192020
12%
4
COMPANY SIZE
Conversion Optimization
Digital Analytics
2 Analysis approach

5
CORPORATE SECTOR
16% eCommerce
15% Media/Content
11%IT Service Provider
9% Trade
Telecommunication 3%
Energy 3%
Other 30%
Automotive 3%
Travel/Transportation/Tourism 4%
6% Banking/Finance
21% eCommerce
20%Media/Content
13%Travel/Transportation/Tourism
6% IT Service Provider
Banking/Finance 6%
Trade 6%
Energy 3%
Health Care/Pharmaceuticals 2%
Other 23%
2 Analysis approach
6
COUNTRY IN WHICH THE COMPANY OPERATES
89% Germany
SWITZERLAND 1%SPAIN 1%
AUSTRIA 3%SWEDEN 2%
4% OTHER
SWITZERLAND 6%
AUSTRIA 5%SWEDEN 1%
SPAIN 1%3% OTHER
84% Germany
2 Analysis approach

Summit | Insights | Get together
Which events are relevant for the areas of Digital Analytics and Conversion Optimization?
Which topics do the events cover?
ADVERTISEMENT
52%Analytics SummitHamburg22%
Analytics Insights Hamburg/ Berlin/ Cologne/ Munich
22%A/B Insights
Hamburg/ Berlin/ Cologne/ Munich
4%Get together
analytics-summit.de ab-insights.de analytics-insights.de Events powered by
Cloud Marketing
Big Query
LookerGoogle MarketingPlatform
Networking
Afterwork
Digital Analytics
Aggregation
Prediction
Attribution
Conversion Optimierung
Data Driven
Digital Efficiency
Analytics Challenge
DataScience
Google Cloud Platform
Personalisierung
Marketing Technology
EVENTS
8
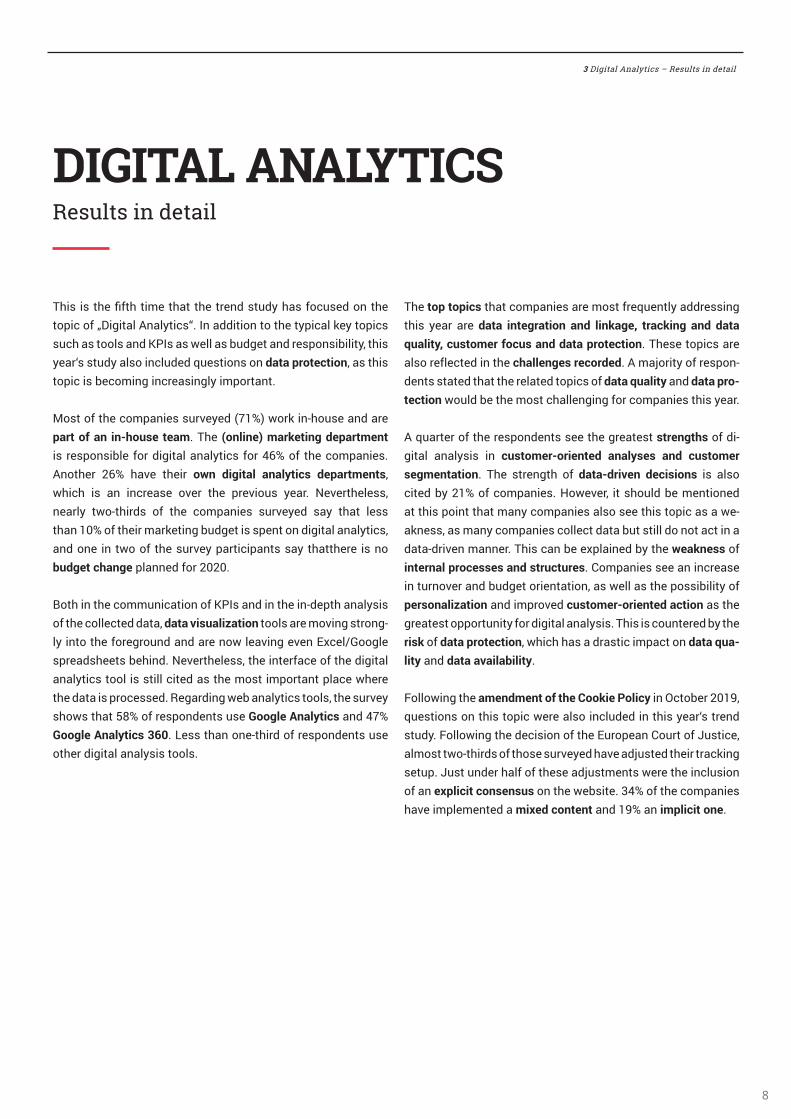
This is the fifth time that the trend study has focused on the topic of „Digital Analytics“. In addition to the typical key topics such as tools and KPIs as well as budget and responsibility, this year‘s study also included questions on data protection, as this topic is becoming increasingly important.
Most of the companies surveyed (71%) work in-house and are part of an in-house team. The (online) marketing department is responsible for digital analytics for 46% of the companies. Another 26% have their own digital analytics departments, which is an increase over the previous year. Nevertheless, nearly two-thirds of the companies surveyed say that less than 10% of their marketing budget is spent on digital analytics, and one in two of the survey participants say thatthere is no budget change planned for 2020.
Both in the communication of KPIs and in the in-depth analysis of the collected data, data visualization tools are moving strong-ly into the foreground and are now leaving even Excel/Google spreadsheets behind. Nevertheless, the interface of the digital analytics tool is still cited as the most important place where the data is processed. Regarding web analytics tools, the survey shows that 58% of respondents use Google Analytics and 47% Google Analytics 360. Less than one-third of respondents use other digital analysis tools.
The top topics that companies are most frequently addressing this year are data integration and linkage, tracking and data quality, customer focus and data protection. These topics are also reflected in the challenges recorded. A majority of respon-dents stated that the related topics of data quality and data pro-tection would be the most challenging for companies this year.
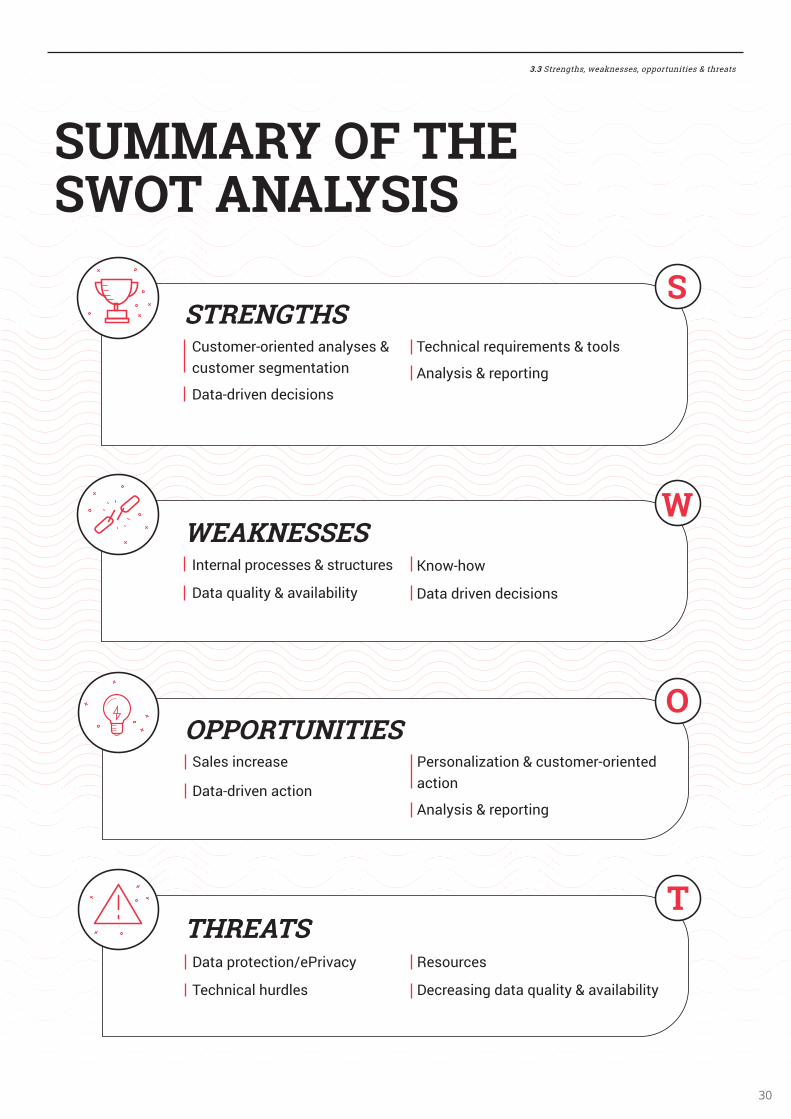
A quarter of the respondents see the greatest strengths of di-gital analysis in customer-oriented analyses and customer segmentation. The strength of data-driven decisions is also cited by 21% of companies. However, it should be mentioned at this point that many companies also see this topic as a we-akness, as many companies collect data but still do not act in a data-driven manner. This can be explained by the weakness of internal processes and structures. Companies see an increase in turnover and budget orientation, as well as the possibility of personalization and improved customer-oriented action as the greatest opportunity for digital analysis. This is countered by the risk of data protection, which has a drastic impact on data qua-lity and data availability.
Following the amendment of the Cookie Policy in October 2019, questions on this topic were also included in this year‘s trend study. Following the decision of the European Court of Justice, almost two-thirds of those surveyed have adjusted their tracking setup. Just under half of these adjustments were the inclusion of an explicit consensus on the website. 34% of the companies have implemented a mixed content and 19% an implicit one.
3 Digital Analytics – Results in detail
DIGITAL ANALYTICSResults in detail

0 20 40 60 80 100
75%
80%
79%
62%
77%
49%
58%
40%
34%
33%
/
28%
19%
/
100%100%Website
2018 2019 2020
SEO/SEA
Social Media
Newsletter
Landing Pages/Microsites
Remarketing
Display Video & Social Paid Marketing
Mobile Apps
ffil a e ar e
Call Center
TV
Field Marketing
Retail Store
Radio
Smart Apps
90%87%
94%
81%
74%
/
60%
41%
53%
41%
39%
23%
/
27%
14%
/
92%
100%
79%
76%
75%
66%
64%
48%
46%
43%
39%
30%
29%
28%
22%
5%
6%Other 10% 5%
9
E E TOOLS & KPIS Digital Analytics
ic t c int a eting c annel y e t eac y c t e
Website (100%) remains unchanged as the most important touchpoint for reaching customers. SEO/SEA shows a slight improve-ment from the prior year as the second preferred touchpoint. Social Media (79%) overtook Newsletter (76%) to become the third preferred touchpoint marking a return to a positive trend for the former and a negative trend for the latter. Continuing with negative trends, Display, Video & Social Paid (64%) and Print (46%) record declines of 13% and 8% respectively. There are no important changes to report for the other touchpoints. It should be noted that that this year the touchpoints field of marketing and smart apps were added to the survey since they are becoming increasingly important.
3.1 Marketing channels, tools & KPIs

Possible
Tracked
100%100%So
cial
Org
anic
Web
site
SEO/
SEA
Land
ing
Page
s/
Mic
rosi
tes
Rem
arke
ting
Mob
ile A
pps
(And
roid
/iOS)
Smar
t App
s
(e.g
. TV,
Vid
eo G
ame
Cons
ole)
ffil a
e
Newsl
ette
r
TV
Prin
t
Call
Cent
er
Radi
o
Reta
il St
ore
Fiel
d M
arke
ting
(e.g
. exh
ibiti
ons)
Disp
lay/
Vid
eo/
Soci
al P
aid
92%88%
76%72%
75% 75%
66%62% 64% 64%
48%44% 43% 41%
46%
9%
39%
30%
11%
29%
4%
28%
5%
22%
5%
10%
5% 5%
79%
71%
0
20
40
60
80
100
0
20
40
60
80
100
Possible
Tracked
100%100%
Soci
al O
rgan
ic
Web
site
SEO/
SEA
Land
ing
Page
s/
Mic
rosi
tes
Rem
arke
ting
Mob
ile A
pps
(And
roid
/iOS)
Smar
t App
s
(e.g
. TV,
Vid
eo G
ame
Cons
ole)
ffil a
e
Newsl
ette
r
TV
Prin
t
Call
Cent
er
Radi
o
Reta
il St
ore
Fiel
d M
arke
ting
(e.g
. exh
ibiti
ons)
Disp
lay/
Vid
eo/
Soci
al P
aid
92%88%
76%72%
75% 75%
66%62% 64% 64%
48%44% 43% 41%
46%
9%
39%
30%
11%
29%
4%
28%
5%
22%
5%
10%
5% 5%
79%
71%
0
20
40
60
80
100
0
20
40
60
80
100
10
ic f t e e i ly electe t c int a eting c annel a e t ac e igitally
Online
f e
3.1 Marketing channels, tools & KPIs

11
According to the responses it is evident that there is a divergent pattern for online and offl ine touchpoints or marketing channels. When focusing on the online mediums, the utilization (availability – use) of digital tracking is high for all touchpoints. The average un-der-utilization is about 3%. Social Organic is the most under-utilized touchpoint where 79% of touchpoints could be tracked digitally but only 71% are. The trend is the opposite when looking at the offl ine mediums. There exists a large difference between the potential to track digitally versus what is actually being tracked digitally, a trend that has carried over from previous years. For offl ine touchpoints, the average under-utilization is 25%. Print accounts for the largest difference (39%).
3.1 Marketing channels, tools & KPIs

12
y c nicate
With regard to how KPIs are distributed or communicated, the preferences have been subject to strong fluctuations over the years. Data visualization tools such as Data Studio or Tableau (77%) and PowerPoint/Google Slides (66%) have been trending upwards towards wider adoption and use. Data visualization tools alone have demonstrated more than a threefold increase in adoption landing it in the preferred method for communicating KPIs. It can be seen that companies are increasingly taking advantage of the human disposition to absorb graphic content better than in written or verbally communicated form. Conversely, companies are more likely to avoid communicating target metrics via Excel/Google Sheets or web analytics tools. The sharpest decline is seen in web analysis tools, which have fallen from number 1 to number 4 within a year, due to the high level of complexity compared to the other methods.
0 20 40 60 80 100
2020 2019 2018 2017 2016
77%70%
61%36%
18%
70%76%77%
82%73%
66%63%
58%55%
50%
60%
81%77%
66%
65%
10%10%
11%8%
5%
5%
7%
2%
2%
9%
Excel/Google Sheets
Data Visualization Tool(e.g. Data Studio, Tableau)
Power Point/Google Slides
Intranet
Other
Web Analytics Tool
3.1 Marketing channels, tools & KPIs
2020
2019
2018
2017
2016
81%
75%
76% 14% 73% 21%
40% 86% 22%
61% 78% 36%
84% 80% 73% 43% 5%
84% 74% 84% 38% 3%
3%
2%
3%
In the interface of the Web Analytics Tool
Further processing of exported reports
Data Visualization Tools Further processing of exported raw data
Other
13
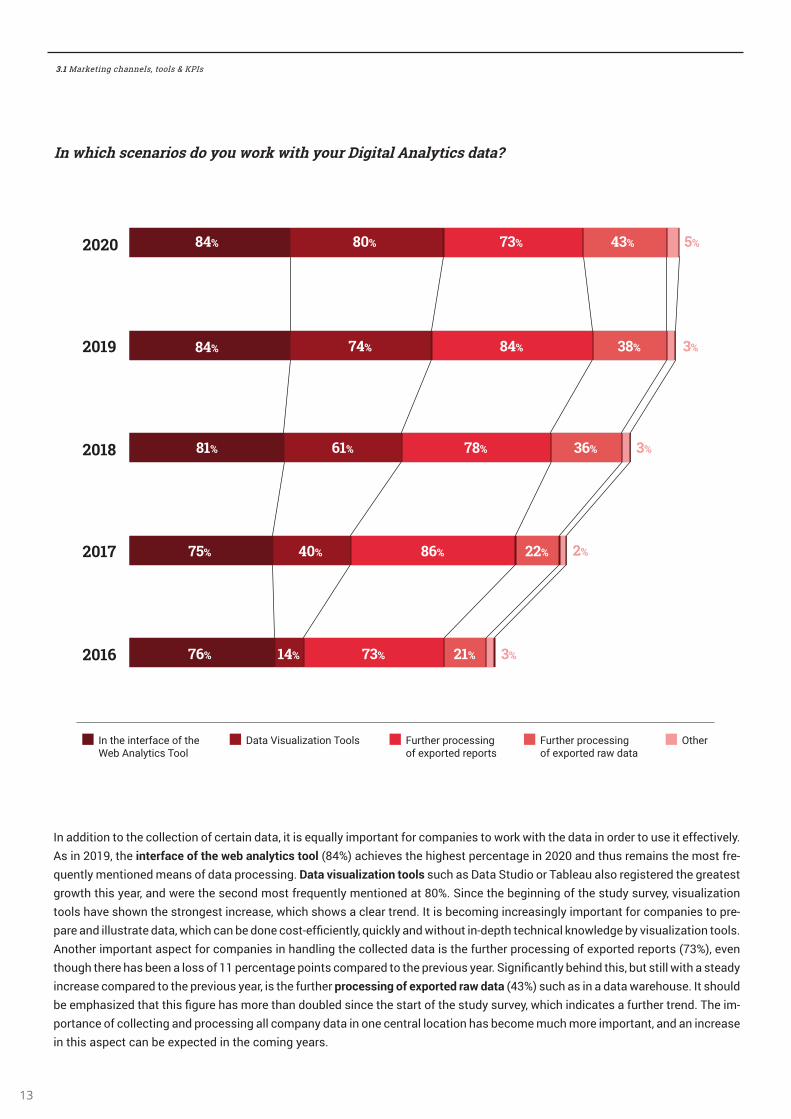
n ic cena i y it y Digital nalytic ata
In addition to the collection of certain data, it is equally important for companies to work with the data in order to use it effectively. As in 2019, the interface of the web analytics tool (84%) achieves the highest percentage in 2020 and thus remains the most fre-quently mentioned means of data processing. Data visualization tools such as Data Studio or Tableau also registered the greatest growth this year, and were the second most frequently mentioned at 80%. Since the beginning of the study survey, visualization tools have shown the strongest increase, which shows a clear trend. It is becoming increasingly important for companies to pre-pare and illustrate data, which can be done cost-efficiently, quickly and without in-depth technical knowledge by visualization tools. Another important aspect for companies in handling the collected data is the further processing of exported reports (73%), even though there has been a loss of 11 percentage points compared to the previous year. Significantly behind this, but still with a steady increase compared to the previous year, is the further processing of exported raw data (43%) such as in a data warehouse. It should be emphasized that this figure has more than doubled since the start of the study survey, which indicates a further trend. The im-portance of collecting and processing all company data in one central location has become much more important, and an increase in this aspect can be expected in the coming years.
3.1 Marketing channels, tools & KPIs

95% Aanalysis of
user behavior
38% Basis for integration and
further use in a comprehensive data pool
21% Basis for downstream internal
company processes
2% Other
82% Further use for online marketing measures
52% Product optimization
95% User behavior
analysis
38% Basis for integration and
further use in a comprehensive data warehouse
21% Basis for downstream internal
company processes
2% Other
82% Further use for online marketing measures
52% Product optimization
14
e y c any tili e it Digital nalytic ata
This year, for the first time in the survey, the question of what the collected digital analytics data is used for was asked. Two points in the responses clearly stood out: analysis of user behavior (95%) and further use for online marketing measures (82%). For the companies surveyed, it is essential to understand user behavior on their own website or app and to use the findings to derive online marketing measures. Of less importance is the use of the data for product optimization (52%), as a basis for integration and further use in a comprehensive data warehouse (38%) and as a basis for downstream internal company processes (21%).
3.1 Marketing channels, tools & KPIs
WE ARE HIRINGCLOUD & MARKETINGTECHNOLOGYIN HAMBURG / BERLINMUNICH / VIENNAZURICH / BARCELONASTOCKHOLMInterested? Go to: www.trakkenwebservices.com/company/career/
16
D y e tag anage ent y te t cale a eting an analytic i el
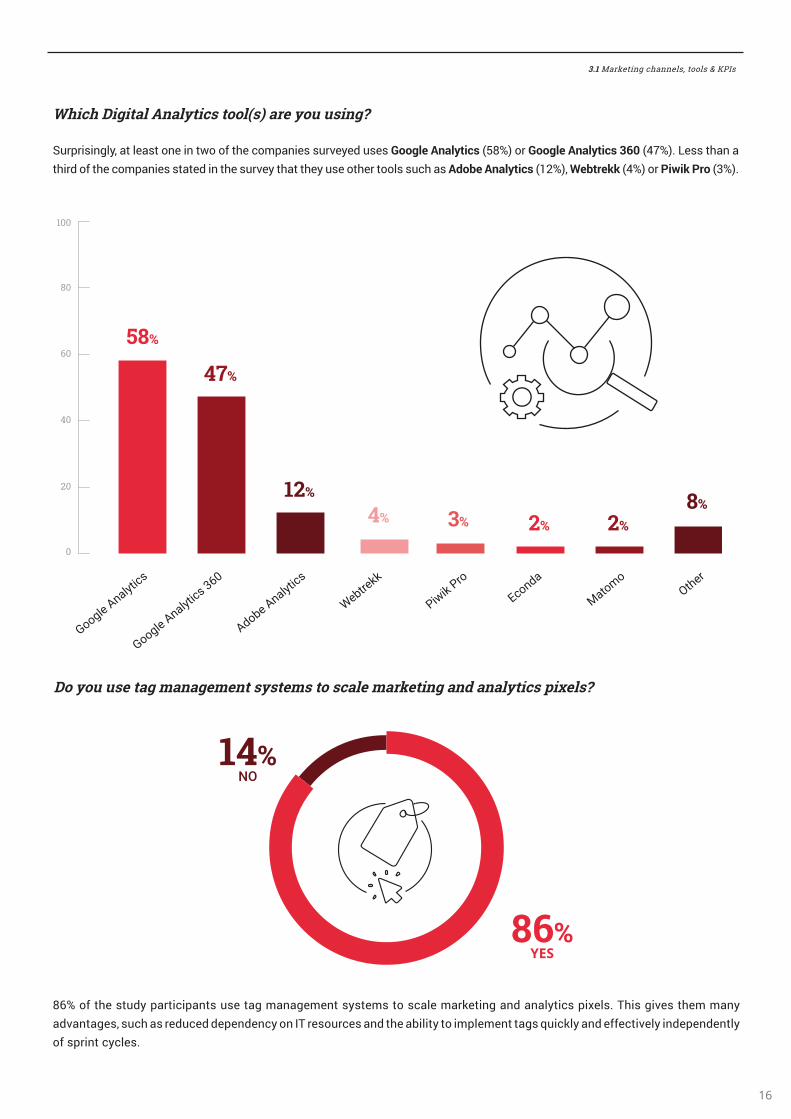
86% of the study participants use tag management systems to scale marketing and analytics pixels. This gives them many advantages, such as reduced dependency on IT resources and the ability to implement tags quickly and effectively independently of sprint cycles.
14% NO
86% YES
ic Digital nalytic t l a e y ing
Surprisingly, at least one in two of the companies surveyed uses Google Analytics (58%) or Google Analytics 360 (47%). Less than a third of the companies stated in the survey that they use other tools such as Adobe Analytics (12%), Webtrekk (4%) or Piwik Pro (3%).
58%
47%
12%
3% 4% 2% 2% 8%
0
20
40
60
80
100
Google Analytics
Google Analytics 360
Adobe Analytics
Webtrekk
Piwik Pro
Econda
Matomo Other
3.1 Marketing channels, tools & KPIs
2020 2019 2018 2017 2016
0 20 40 60 80 100
20%
22%
11%
11%
22%
4%
4%
5%
3%
88%
90%
84%
92%
90%
Digital Analytics Tools
74%
80%
79%
80%
77%Spreadsheets
33%
33%
13%
12%
23%Big Data Tools
Statistical Tools
I don't do in-depth analysis
4%
4%
3%
3%
2%Other
n.A.
17
ic t l y e f in e t analy i
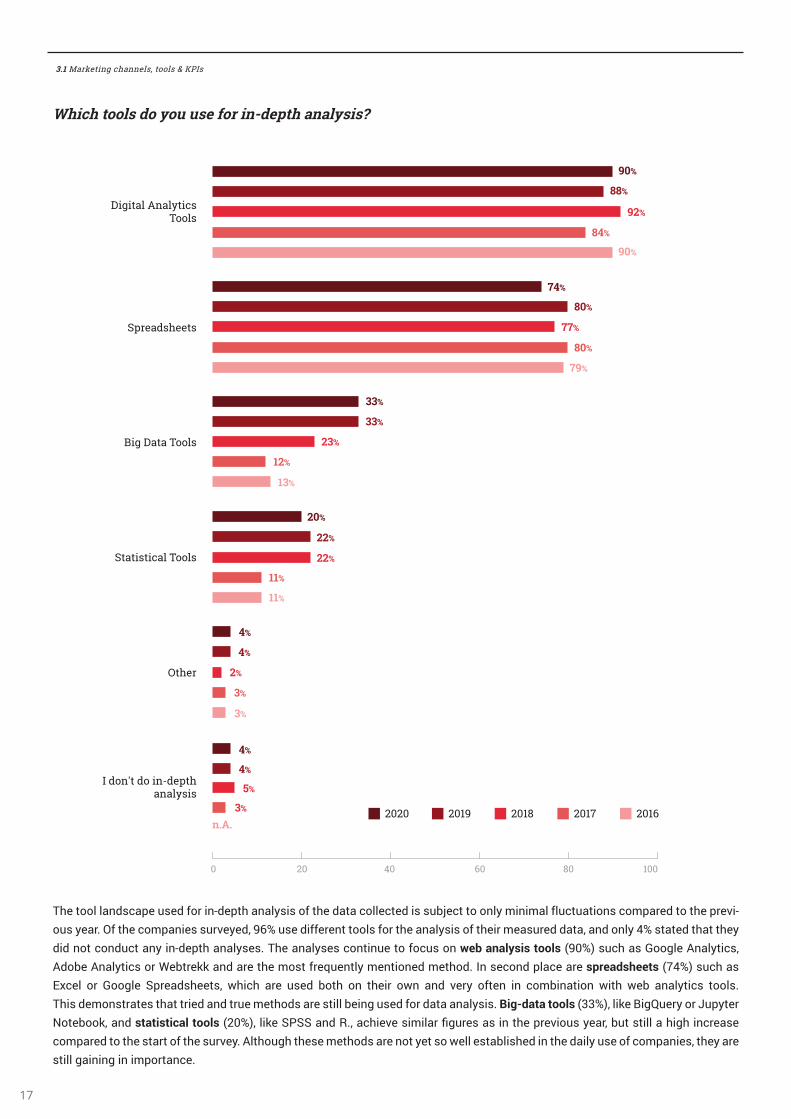
The tool landscape used for in-depth analysis of the data collected is subject to only minimal fluctuations compared to the previ-ous year. Of the companies surveyed, 96% use different tools for the analysis of their measured data, and only 4% stated that they did not conduct any in-depth analyses. The analyses continue to focus on web analysis tools (90%) such as Google Analytics, Adobe Analytics or Webtrekk and are the most frequently mentioned method. In second place are spreadsheets (74%) such as Excel or Google Spreadsheets, which are used both on their own and very often in combination with web analytics tools. This demonstrates that tried and true methods are still being used for data analysis. Big-data tools (33%), like BigQuery or Jupyter Notebook, and statistical tools (20%), like SPSS and R., achieve similar figures as in the previous year, but still a high increase compared to the start of the survey. Although these methods are not yet so well established in the daily use of companies, they are still gaining in importance.
3.1 Marketing channels, tools & KPIs
18
D y analy e t e Digital nalytic ata in c inati n it t e inte nal e te nal ata e g f ine ale ata c etit ata
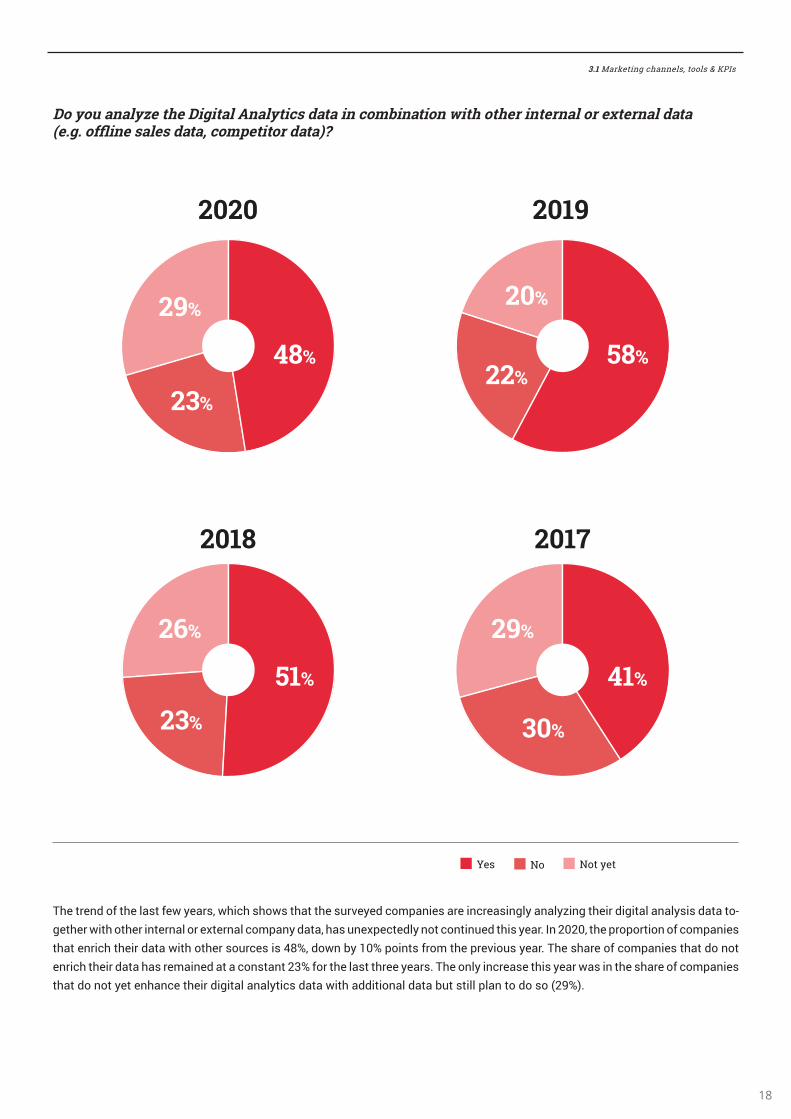
The trend of the last few years, which shows that the surveyed companies are increasingly analyzing their digital analysis data to-gether with other internal or external company data, has unexpectedly not continued this year. In 2020, the proportion of companies that enrich their data with other sources is 48%, down by 10% points from the previous year. The share of companies that do not enrich their data has remained at a constant 23% for the last three years. The only increase this year was in the share of companies that do not yet enhance their digital analytics data with additional data but still plan to do so (29%).
48%
29%
23%
51%
26%
23%
41%
29%
30%
58%
20%
22%
Yes No Not yet
2020
2018
2019
2017
48%
29%
23%
51%
26%
23%
41%
29%
30%
58%
20%
22%
Yes No Not yet
2020
2018
2019
2017
48%
29%
23%
51%
26%
23%
41%
29%
30%
58%
20%
22%
Yes No Not yet
2020
2018
2019
2017
3.1 Marketing channels, tools & KPIs


20
This year again, the surveyed companies focus on providing a big picture of corporate data. Data integration (34%) plays a significant role to this end. This topic combines the aspects of data linkage, integration of different tools such as BigQuery as well as Big Data and Data Warehouse. For companies, it is therefore becoming more important to store all data in a cen-tralized location in order to be able to access it across tools. In second place among the top topics in 2020 is the topic of tracking & data quality (25%), which was already highly relevant for compa-nies last year. In addition to the optimization of existing tracking, the study participants also focus on data collection in compliance with the GDPR. Simultaneously, a decrease or a limitation of data quality due to the new cookie policy of October 2019 is expected. This year, the third place of the top topics is shared by data protection and customer focus (both 17%), both of which were clearly in the foreground last year. With regard to data protection, concerns are also frequently expressed about the adjustments due to the cookie policy, as many customers have to revise their consensus management. The topic of customer focus includes aspects such as looking at the customer‘s overall customer jour-ney, customer segmentation and personalization based on this. Other topics that concern customers are Analysis & Machine Learning, Attribution and Visualization & Dashboards.
TOP TOPICS OF 2020Top Digital Analytics topics
ic Digital nalytic ect t ic an e ti n a e y lanning f in
ac ing Data ality25%
t e ney nalytic17%
Data Protection17%
Analysis & Machine Learning
15%
tt i ti n 14%
i ali ati n Da a13%
34%Data Integration
3.2 Top topics 2020

21
2017 2019 20202016 2018
- 1- - 1 KPIs
1 22 1 2 t e ney
- 7- - 3 Data Protection
2 51 2 4 Campaign Tracking
10 3- 3 5 Data i ali ati n
8 49 4 6 e t t ati n
4 106 7 10 lti De ice ac ing
3 95 8 9 tt i ti n
13 810 6 8 Data n li ati n
5 63 5 7 Tag Management
t ngly y i iti e t e f ll ing t ic in ile nalytic
The aggregated consideration of the prioritized topics for 2020 again shows a high importance for the topic KPIs. Key performance indicators define the most important goals of companies or departments and help to monitor and improve performance. Customer Journey also remains one of the three most important topics on which companies are focusing this year. The complete mapping of the customer journey remains a priority, and it is essential for companies to measure all points of contact between customers and their brand or products. The third topic that companies are focusing on this year is data protection. This topic was already important to customers last year, but has recently gained in importance and is now among the top 3 prioritized topics. This develop-ment can be explained by topics like GDPR and new cookie policies. In October 2019, the European Court of Justice issued a new directive which states that cookies may only be set after users have given their express consent (opt-in). The trend development of the other topics has not changed much compared to previous years, so that the remaining ranking remains relatively similar.
3.2 Top topics 2020

38%
36%
40%
29%
33%
27%
23%
30%
25%
20%
23%
40%
17%
31%
23%
17%
17%
19%
17%
21%
21%
10%
15%
n.A.
14%
21%
42%
10%
14%
9%
8%
10%
5%
7%
11%
6%
7%
7%
16%
3%
1%
1%
3%
8%
5%
6%
11%
10%
n.A.n.A.
37%
0 10 20 30 40 50
Internal processes
Data quality
Technology/ IT
Interdepartmentalcommunication
Value Digital Analytics
Know-how
Analytical methods
Real Time Data(fast data provision)
Budget
Internal resistance
Implementation of aweb analysis tool
Data distributions
Other
Information evaluationand use
u a le aff fistaff capacity
Data protection / GDPRcompliant tracking
Transferring knowledge into actions
201620182020
22
The three biggest challenges that the respondents anticipate in 2020 are: data quality (38%), data protection/GDPR-compliant tracking (37%) and transferring knowledge into actions (29%). The latter two are noteworthy since they show double-digit increa-ses from last year’s levels. Data protection is especially interesting as it has become highly relevant in since it was first tracked in 2019. This reflects well the results of the previous question on the priority themes for 2020. In contrast, the challenges of internal processes (20%), know-how (14%) and internal resistance (7%) have visibly lost importance compared to the first year of the survey. This shows that the surveyed companies have addressed and narrowed down internal challenges regarding digital analytics at an early stage, so that internal aspects are hardly a challenge this year.
at a e t e t ee igge t Digital nalytic c allenge f y c any in
3.2 Top topics 2020

23
Digital Analytics
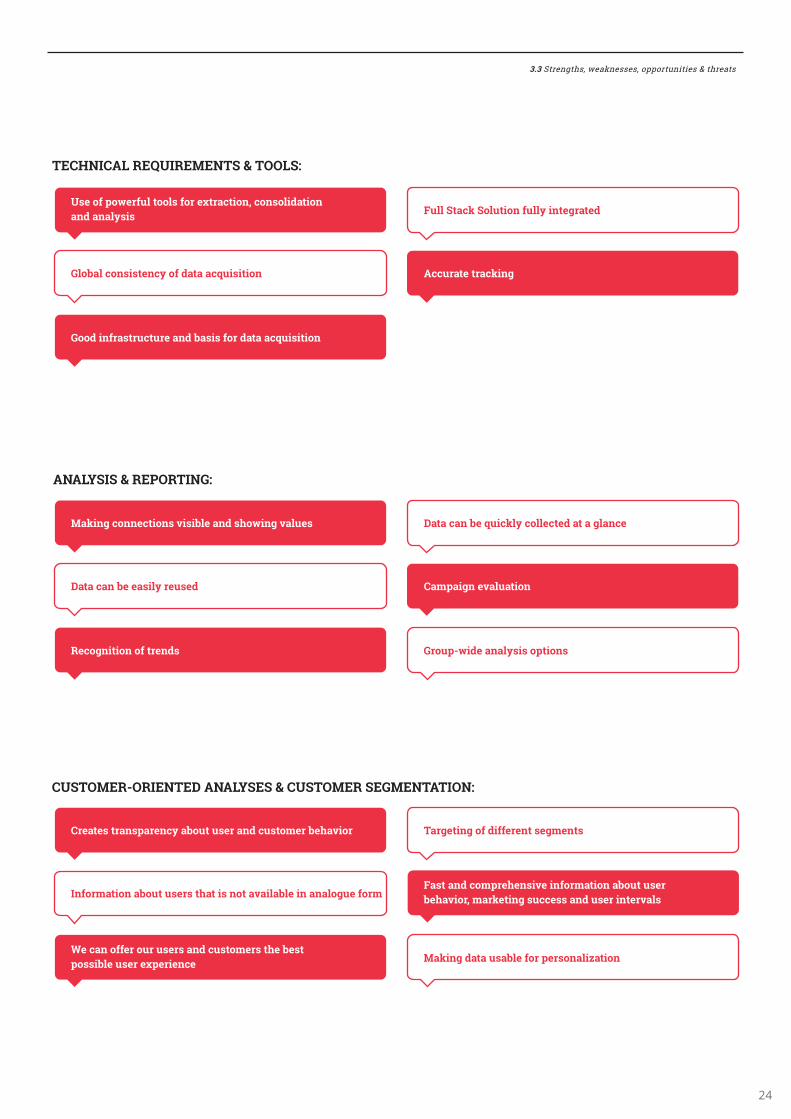
The complexity of the companies surveyed is reflected in these answers. To make it easier to understand, the data collected has been aggregated, which brings certain areas to the fore. The complexity of the companies surveyed is reflected in these answers. To make it easier to understand, the data collected has been grouped together, which highlights certain areas. A quarter of those surveyed cite customer-oriented analyses and custo-mer segmentation as one of the strengths of digital analytics for their own company. This provides transparency about user behavior in order to create the best possible user experience for users. It also enables different users to be segmented and targeted. Furthermore, 21% of the study participants continue
to mention data-driven decisions as a strength of digital ana-lysis. The goal is to create a sound data basis in order to be able to make well-founded, data-driven decisions based on it. A further advantage, which is seen by the 20% of respondents from Digital Analytics, are the technical requirements and tools. Companies perceive the available web analytics tools as very powerful and they praise the fully integrated full stack solutions. Finally, the aspect of analysis and reporting is also mentioned as a strength of Digital Analytics. A structured evaluation of data is important in order to show correlations and to quickly understand data. It also allows trends to be made visible and data to be further processed.
en y t in f y c any e e y ee it t engt in Digital nalytic
D D E DE
lea ie a c y ini n n ata i en eci i n Basis of online marketing
a ing eci i n a e n ata
tance f igital ea e can e i c e a ing n t anage ent f eci i n a ing ce e
alifie eci i n t f ne ect
E E E E OPPORTUNITIES & THREATS
3.3 Strengths, weaknesses, opportunities & threats
24
E
E E ED E E E E
a geting f iffe ent eg ent
a ing c nnecti n i i le an ing al e
eate t an a ency a t e an c t e e a i
Data can e ic ly c llecte at a glance
Data can e ea ily e e
nf ati n a t e t at i n t a aila le in anal g e f
ec gniti n f t en
e can ffe e an c t e t e e t i le e e e ience
a t an c e en i e inf ati n a t e e a i a eting cce an e inte al
i e analy i ti n
a ing ata a le f e nali ati n
E E E E
e f e f l t l f e t acti n c n li ati n an analy i ll tac l ti n f lly integ ate
l al c n i tency f ata ac i iti n
inf a t ct e an a i f ata ac i iti n
cc ate t ac ing
a aign e al ati n
3.3 Strengths, weaknesses, opportunities & threats
25
E E E E
Digital t in ing an e a i t e g t e en more into the company
any e le n t n e tan t e eaning an i tance f ata
al e f igital analytic ata c lt e an n ientati n t a
en y t in f y c any e e y ee it ea ne e in Digital nalytic
D
nc n i tent ata c llecti n n iffe ent ite Diffic lty t acce a ata
Error in tracking ac f antity f ata
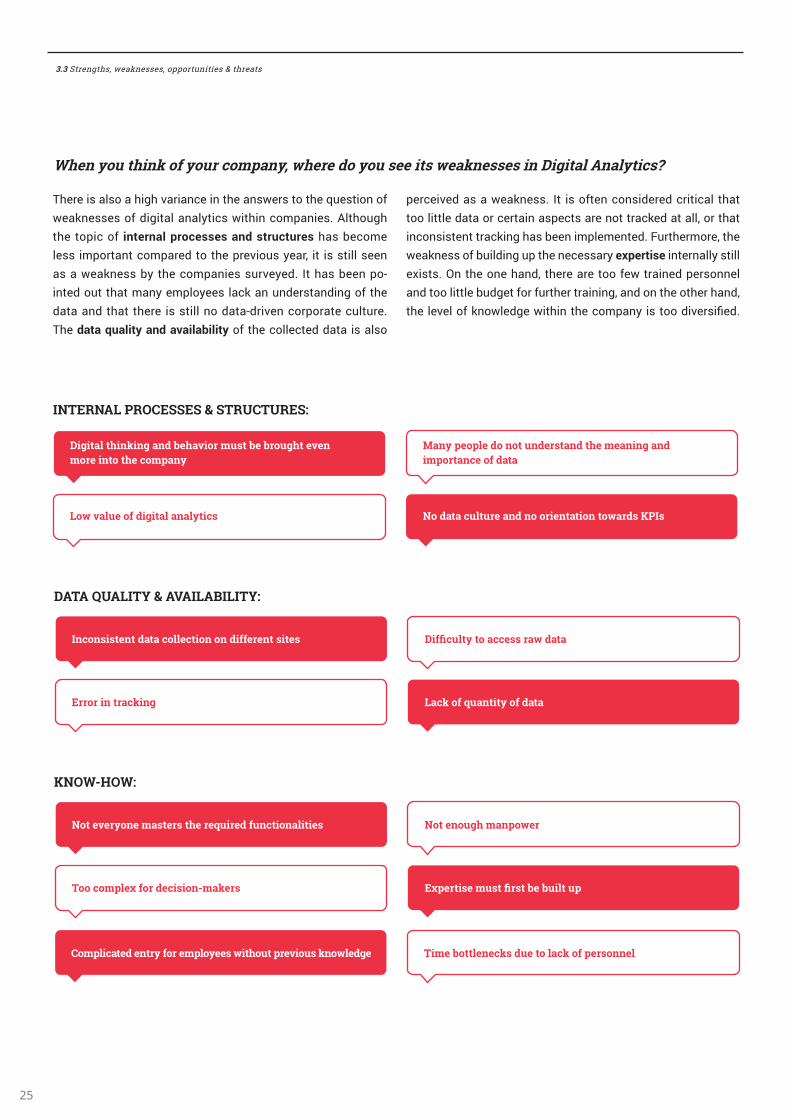
There is also a high variance in the answers to the question of weaknesses of digital analytics within companies. Although the topic of internal processes and structures has become less important compared to the previous year, it is still seen as a weakness by the companies surveyed. It has been po-inted out that many employees lack an understanding of the data and that there is still no data-driven corporate culture. The data quality and availability of the collected data is also
perceived as a weakness. It is often considered critical that too little data or certain aspects are not tracked at all, or that inconsistent tracking has been implemented. Furthermore, the weakness of building up the necessary expertise internally still exists. On the one hand, there are too few trained personnel and too little budget for further training, and on the other hand, the level of knowledge within the company is too diversified.
t e e y ne a te t e e i e f ncti nalitie t en g an e
c le f eci i n a e E e ti e t fi t e ilt
licate ent y f e l yee it t e i n le ge i e ttlenec e t lac f e nnel
3.3 Strengths, weaknesses, opportunities & threats

26
e e y ee t nitie f Digital nalytic in i e an t i e f y c any
D D E DE
gani ati n i n t ata i en le enting acti n f t e ata
Applying the training
Deriving the operational effects
e e i till a l ng ay t g ef e t e e i ting ata i e eally efficiently an e n at i eaningf l
De ite t e ata g eci i n a e till eing a e
When evaluating the overall responses of opportunities for digital analytics within and outside the participating compa-nies, a possible increase in sales and budget optimization was noted. Through the data collected, companies hope to improve their products and services and tailor them more closely to customer needs. In this context, data-driven action, especially marketing control, is mentioned as a further opportunity for digital analytics. In this regard, companies are interested in using the data to create a sound basis for decision-making,
especially with regard to marketing measures. The topic of personalization and customer-oriented action is also percei-ved by the companies surveyed as an opportunity for digital analytics, as they want to better understand their customers and their customer journey and act accordingly. As a further opportunity, the study participants mentioned various aspects that can be summarized under the term analysis & reporting. In this context, machine learning was frequently mentioned, thus offering the opportunity for more comprehensive analyses.
E E E D E
E l iting a et tential
ti i ing f t e ea e a e n i t ical ata
De el ing ne ine a ea
iti nal e ice
ct e el ent a e n igital analytic
get ti i ati n
Improving services
3.3 Strengths, weaknesses, opportunities & threats

27
D D E
Detaile e al ati n an analy i f online marketing activities
a ing ette eci i n an a ing cce e fail e ea a le
Data i en a eting an e nali e c t e a ac
ti i ati n f t e e ia i an tili ati n f tential
eat i tance f ata te eci i n in a eting
e integ ate e f ata an e i ati n f g an la ea e
E
Machine Learning
t ati n it ac ine lea ning an a tificial intelligence ill c ntin e t a ance
nteg ati n it ig e y
a ing e acc ate e icti n
Data i ali ati n
in ing it t e i ci line c a igital a eting an ac ine lea ning
eal ti e e al ati n f ata
E E E ED
ac ing t e c t e ney an i entifying tential
ette n e tan ing f c t e an ct
ette e al ati n f c annel ia a li tic c t e ney analy i
e nali e ffe f c t e
il ing c t e eg ent ac il
eing a le t a e c t e e ecifically
3.3 Strengths, weaknesses, opportunities & threats
28
D E E
Data protection can severely restrict tracking
en it c e t ata tecti n e ay a e t e ce t e i y ting in t t e a i n e f e i n f
t ac ing
Data protection is one of the greatest risks for f t e e el ent
Data tecti n an a e it iffic lt t c llect ali ata an a e eci i n a e n it
egal f a e a e ec ing inc ea ingly tig t
nce tainty ega ing ata tecti n D E ling etc
E D E
l c ing t ac ing a a le
i ing t l a a tati n t c anging ci c tance t n t e a t f t e t l i e an it in t e c any
fe i ilitie t e al ate t e c t e ney ac e ice
ntelligent ac ing e enti n t g e
in ing t t e ata ce i iffic lt
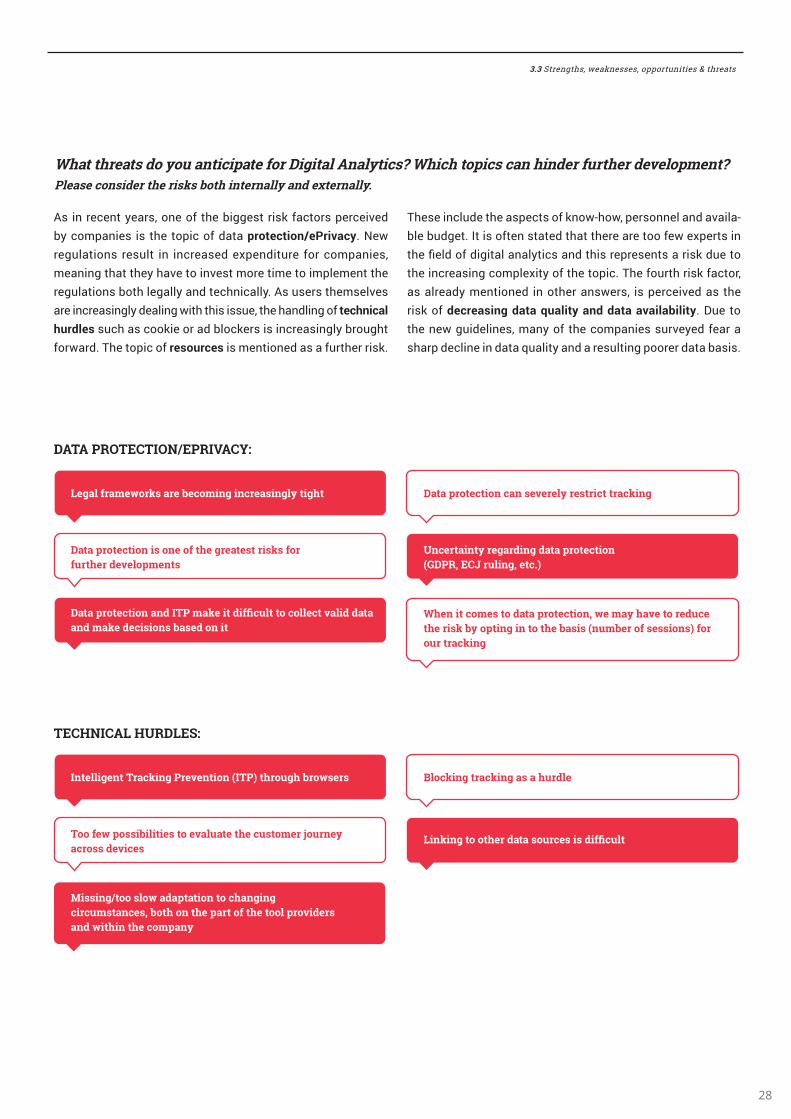
As in recent years, one of the biggest risk factors perceived by companies is the topic of data protection/ePrivacy. New regulations result in increased expenditure for companies, meaning that they have to invest more time to implement the regulations both legally and technically. As users themselves are increasingly dealing with this issue, the handling of technical hurdles such as cookie or ad blockers is increasingly brought forward. The topic of resources is mentioned as a further risk.
These include the aspects of know-how, personnel and availa-ble budget. It is often stated that there are too few experts in the field of digital analytics and this represents a risk due to the increasing complexity of the topic. The fourth risk factor, as already mentioned in other answers, is perceived as the risk of decreasing data quality and data availability. Due to the new guidelines, many of the companies surveyed fear a sharp decline in data quality and a resulting poorer data basis.
at t eat y antici ate f Digital nalytic ic t ic can in e f t e e el ent lea e c n i e t e i t inte nally an e te nally
3.3 Strengths, weaknesses, opportunities & threats

29
ac f e ce
ac f analytic n
get
ying t l t n e e t in t e t ic in y n c any
in ing ita le e l yee
DE E D
E E
a ata
an ling f till inc lete ata
Diffe ent ea e ent et an a ig ity
f c nfi ence in ata in ca e f ata ality
Data tecti n an a e it iffi c lt t c llect ali ata an a e eci i n a e n it
i itati n in ata c llecti n
3.3 Strengths, weaknesses, opportunities & threats
30
STRENGTHSCustomer-oriented analyses & customer segmentation
Data-driven decisions
Technical requirements & tools
Analysis & reporting
WEAKNESSESInternal processes & structures
Data quality & availability
Know-how
Data driven decisions
SUMMARY OF THE SWOT ANALYSIS
THREATSData protection/ePrivacy
Technical hurdles
Resources
Decreasing data quality & availability
OPPORTUNITIESSales increase
Data-driven action
Personalization & customer-oriented action
Analysis & reporting
3.3 Strengths, weaknesses, opportunities & threats

0
20
80
60
40
46%42%
26%
6%
24%
14%
7% 7% 4% 4% 3% 4% 1%7% 5%
Mar
ketin
g/ O
nlin
e-M
arke
ting
Digi
tal A
naly
tics
Depa
rtm
ent
eCom
mer
ce
Busi
ness
Inte
llige
nce
Depa
rtm
ent
Othe
rC-
Leve
l/ M
anag
emen
t ITEx
tern
(Age
ncy)
n.A.
<10% >20%10-20%
0
20
80
60
40
69% 71% 71%
23%
17% 19%
8%12% 10%
201820192020
<10% >20%10-20%
0
20
80
60
40
69% 71% 71%
23%
17% 19%
8%12% 10%
201820192020
31
RESPONSIBILITY & BUDGET Digital Analytics
In 46% of the companies surveyed, the (online) marketing e a t ent is responsible for digital analytics. This repre-
sents an increase of 4 percentage points compared to the previous year. In 26% of the companies, digital analysis is implemented in a company-owned igital analytic e a tment, similar to last year. The ine intelligence e a tment is responsible for digital analytics in only 6% of the companies surveyed, a drop of 8 percentage points on the previous year. It can be seen that the companies prefer a vi-sible separation of the areas of digital analytics and business intelligence. None of the companies mentioned that they outsource the department to an e te nal c any agency . Among the remaining companies, responsibility continues to be split between departments such as eCommerce, IT or the management level and only minimal changes compared to the previous year can be seen.
Digital analysis will continue to play an important role in marketing in 2020. With regard to the distribution of the marketing budget, it should be noted that almost two-thirds of the companies surveyed estimate that less than 10% of the budget is spent on digital analytics, which shows a slight decrease compared to the previous year. 23% of companies state that they allocate 10-20% of their marketing budget to digital analysis activities. This is an increase of 6 percen-tage points over the previous year. A loss compared to the
re ou ear o e er re ec e e fac a o l of the companies surveyed spend more than 20% of their marketing budget on digital analytics.
ic e a t ent i e n i le f Digital nalytic in y c any
at e centage f t e a eting get ill e all cate t Digital nalytic in
at e centage f t e get ill e all cate t Digital nalytic
Who is responsible for Digital Analytics in y c any
3.4 Responsibility & budget
32
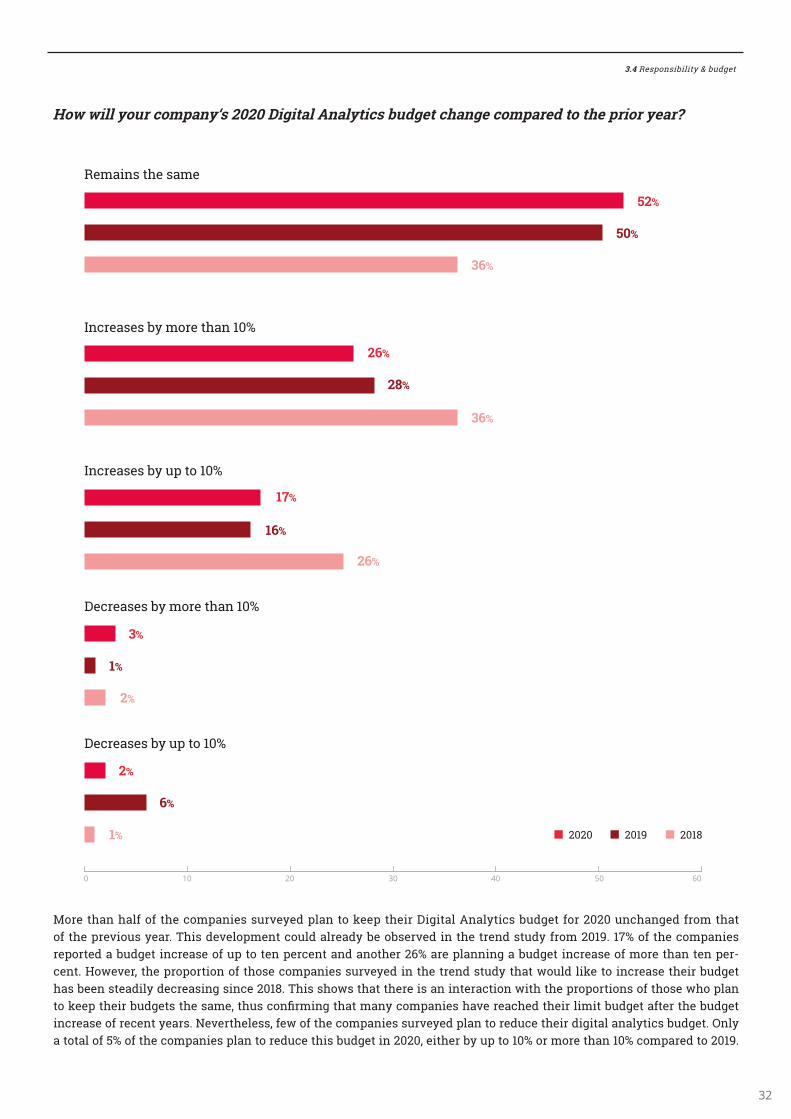
More than half of the companies surveyed plan to keep their Digital Analytics budget for 2020 unchanged from that of the previous year. This development could already be observed in the trend study from 2019. 17% of the companies reported a budget increase of up to ten percent and another 26% are planning a budget increase of more than ten per-cent. However, the proportion of those companies surveyed in the trend study that would like to increase their budget has been steadily decreasing since 2018. This shows that there is an interaction with the proportions of those who plan o ee e r u e e ame u co firm a ma com a e a e reac e e r l m u e af er e u e
increase of recent years. Nevertheless, few of the companies surveyed plan to reduce their digital analytics budget. Only a total of 5% of the companies plan to reduce this budget in 2020, either by up to 10% or more than 10% compared to 2019.
ill y c any Digital nalytic get c ange c a e t t e i yea
2020 2019 2018
Remains the same
Increases by more than 10%
Increases by up to 10%
Decreases by more than 10%
Decreases by up to 10%
50%
52%
36%
28%
26%
36%
16%
17%
26%
1%
3%
2%
6%
2%
1%
0 10 20 30 40 50 60
3.4 Responsibility & budget

33
DATA PROTECTIONDigital Analytics
a e y a te y t ac ing et e t t e E ean t f tice E lanet g ent i e n c ie t age it t acti e c n ent
On October 01, 2019, the European Court of Justice passed the decision that no cookie storage may take place without the active consent of the user and that no pre-selection of settings may be made for the user. This decision is intended to protect the privacy of users and provide more transparency and decision-making power over the use of their own data. This change forces many com-panies to adjust the tracking setup of their website. The analysis of this question shows that 62% of the companies surveyed have adjusted their tracking setup after the decision, while 38% have not. In what way did you adjust your tracking setup?
38% NO
62% YES
3.5 Data protection

Explicit consent built-in(tracking deactivated by default))
Mix consent built-infir ar rac e a le efaul r ar rac a le efaul
Implicit consent built in(tracking activated by default)
47%
34%
19%
0 10 20 30 40 50
34
n at ay i y a t y t ac ing et
In addition to the question as to how many companies have adapted their tracking setup to comply with the new cookie policy, the way in which these adaptations have been implemented is also important to consider. Nearly one out of two of the companies sur-veyed decided to implement an explicit consensus on their website. This means that no tracking is possible until the user explicitly agrees to the use of cookies. Approximately one third of the companies switched to a mix consensus, where fi rst-party tracking is activated by default and third-party tracking is deactivated until the user agrees. The remaining 19% of the companies use an implicit consensus, whereby all tracking is activated by default.
3.5 Data protection

RECRUITING - EMPLOYEESareer e ar me ffice
We work in a very fast-paced, exciting industry with constant new challenges. Whether Digital Analytics, Cloud-Technology,
Marketing Technology or Data Science and Conversion Optimization – the environment and the requirements are always chan-
ging. We meet these challanges at our offices in some of the most exciting european cities.
For more information visit: trakkenwebservices.com/company/career/
HamburgBerlin
MunichZurich
ViennaBarcelona
Stockholm
ic a en ffice a e c ently l ing f ne c lleg e
Which departments have vacancies at the moment?
Cons
ulta
nt
Digi
tal A
naly
tics
Web
Dev
elop
er
Cons
ulta
nt
Conv
ersi
on O
ptim
izat
ion
Cons
ulta
nt
Disp
lay
Mar
ketin
g
Cons
ulta
nt
Sear
ch M
arke
ting
Juni
or C
loud
Dat
a En
gine
erPr
ogra
m M
anag
er
Mar
ketin
g Te
chno
logy
Anal
ytic
s Dev
elop
er
Wor
king
Stu
dent
DA /
CO
Trai
nee
DA /
CO
ADVERTISEMENT

36
For the third time now, the trend study also includes questions on the analysis of the specialized field of conversion optimi-zation. While last year‘s survey results could already be analy-zed with a comparison to the previous year, this year it was now possible to observe exciting trend developments within the past two years. In addition, the broad representation of participating industries, including media/content, e-commerce, travel/tou-rism, IT services, finance, telecommunications and energy, pro-vides a varied overview of the core topics for 2020. Almost three quarters of the participating companies are part of an in-house team in their respective company, while the other part consists of companies in the service sector.
The main responsibility for the Conversion Optimization task area has shifted slightly compared to the previous year. Despi-te a decline, the main responsibility is still determined by the marketing department with about 50%, while in-house CO de-partments or cross-departmental teams will increasingly take over responsibility in 2020. The increasing integration of the specialist area in companies continues to have a positive effect on budget allocation. More than 40% of companies plan to in-crease the budget allocated to Conversion Optimization in 2020, while just under 60% are sticking to last year‘s investments. In 2020, classic A/B testing is still the most frequently chosen test procedure of the respondents. The share of this group con-tinued to increase compared to the previous year, as did more complex procedures such as multivariate testing and personal-ization, which are still used much less than classic A/B testing, but their use is increasing noticeably.
The development of the average number of tests performed per month is exciting. However, this is not so much due to a planned reduction of test activities, but rather the result of the fact that Conversion Optimization has now reached the broader mass of companies. One main reason for this is the fact that companies are developing the topic independently with their own knowledge and ideas, although with longer start-up times.
Testing in the area of checkout has become in- creasingly im-portant. The survey results on high testing frequency in this area of the site have remained fairly constant, while more and more companies are now also „occasionally“ setting up tests there. Tests on the homepage also continue to have a high priority compared to the previous year, despite the often greater distan-ce to main KPIs such as „orders“. 4 out of 5 companies use digital analysis as a data basis for test concepts, making this data source the most used option in 2020 as well. Here and in the use of best-practice experience, an increased use can be observed compared to previous years. In addition, the share of mouse-tracking and heat maps as well as competitor analyses, personas and usability labs has risen significantly. With regard to the importance of different device types, it can be seen that desktop and mobile still play the most important role in A/B testing. Tablet devices, on the other hand, have lost some of their importance, and a good half of all respondents stated that testing on mobile apps has not yet taken place. The use of certain testing tools shows a clear change in the cor-porate world. For the first time since this year, over one in two companies is using Google Optimize as a testing tool, which is probably also due to the tool‘s past functional enhancements.
Sales-relevant KPIs such as transactions and turnover will again be the focus of Conversion Optimization in 2020 in rela-tion to the most frequently used targets. But especially the so-called micro-conversions, e.g. clicks on a certain element, are experiencing a strong increase in their importance and are the-refore ranked second directly between the sales-relevant KPIs.
This year‘s top 3 topics are the same as last year. Thus, the to-pics User Experience, Mobile Optimization and Personalization are unbeaten at the top. With regard to the most relevant chal-lenges that have become more important for companies this year, data quality and tracking rank in the upper range.
4 Conversion Optimization – Results in detail
CONVERSION OPTIMIZATIONResults in detail

2020 2019 2018
0 10 20 30 40 50 60
27%18%
27%
29%14%
45%
6%9%
10%
6%8%
15%
5%
n.A.n.A.
8%9%
5%
1%7%
4%
3%
n.A.n.A.
15%
n.A.n.A.
45%51%
34%
Google Optimize
Own Tool
Optimizely
Adobe Target
Visual WebsiteOptimizer (VWO)
Kameleoon
AB tasty
Oracle Maxymiser
Google Firebase
Other
37
E E TOOLS & KPISConversion Optimization
ic t l y e t n y te t
This year‘s survey shows a major change in the use of the various testing tools and a difference can be seen when compared to the previous year. Compared to the previous year, Google Optimize has achieved a 51% share with an increase of 6 percentage points compared to 2019, making it the most used testing tool. This is followed by the use of in-house testing tools (18%), which ranked second in the survey but recorded a decline of 9 percentage points compared to the previous year. Optimizely is in 3rd place with 14%. However, when compared to the previous year, Optimizely has suffered significant losses and was only able to maintain a third of its share compared to 2018. Other tools were also mentioned by the study participants, but in contrast to the tools mentioned above, these tools only have a small share.
4.1 Test concepts, tools & KPIs
2020 2019 2018
0 10 20 30 40 50 60 70 9080 100
81%86%
85%
50%60%
55%
41%55%
38%
28%
22%
44%
41%
39%
39%
15%35%
34%
24%30%
40%
32%28%
30%
Digital Analytics Data
Best Practices
Mouse-Tracking/ Heatmaps
Competition analysis
Personas
Usability Labs
Online Surveys
a a er rofile
38
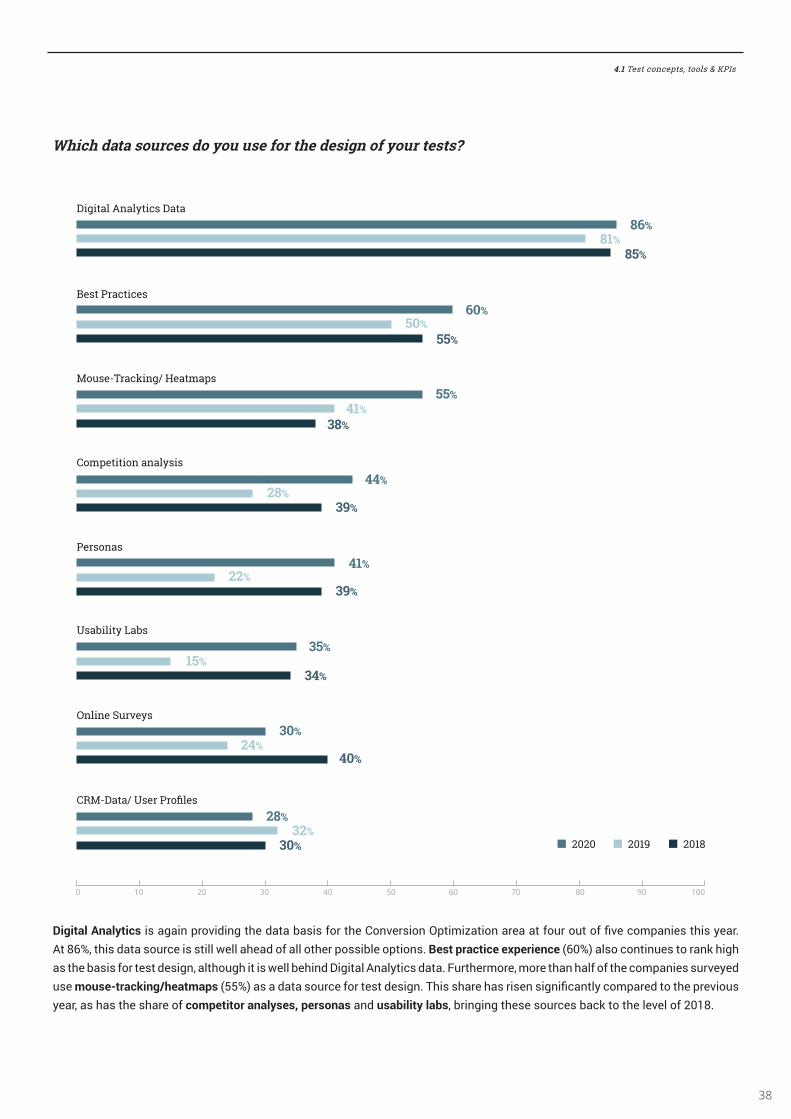
ic ata ce y e f t e e ign f y te t
Digital Analytics is again providing the data basis for the Conversion Optimization area at four out of five companies this year. At 86%, this data source is still well ahead of all other possible options. Best practice experience (60%) also continues to rank high as the basis for test design, although it is well behind Digital Analytics data. Furthermore, more than half of the companies surveyed use mouse-tracking/heatmaps (55%) as a data source for test design. This share has risen significantly compared to the previous year, as has the share of competitor analyses, personas and usability labs, bringing these sources back to the level of 2018.
4.1 Test concepts, tools & KPIs

100
0
20
40
60
80Tu
rnov
er
Regi
stra
tions
Othe
r
Newsl
ette
r
Subs
crip
tions
Tran
sact
ions
Clic
ks o
n an
el
emen
t
70%
84%
74%
60%
75%72%
34%
52%
45%
36%31% 30%
2%
21%
13%
57%59% 60%
2020
2019
2018
3-4per month
5-6per month
7-8per month
more than 10per month
9-10per month
0 2010 30 40 50 60 70
0-2per month
23%25%
16%
5%15%
9%
3%
5%
3%
11%
6%
4%
n.A.4%
1%
54%66%
50%
2020 2019 2018
0 10 20 30 40 50 60 70 9080 100
81%86%
85%
50%60%
55%
41%55%
38%
28%
22%
44%
41%
39%
39%
15%35%
34%
24%30%
40%
32%28%
30%
Digital Analytics Data
Best Practices
Mouse-Tracking/ Heatmaps
Competition analysis
Personas
Usability Labs
Online Surveys
a a er rofile
39
Transactions are, as in previous years, the most es-sential metric for measuring the success of the AB Tests. In addition to transactions (84%), three-quar-ters of the respondents named clicks on an element (e.g. CTA) as well as sales (59%) in the following places. With regard to KPIs such as sales or news-letter registrations, no major deviations can be observed compared to previous years. An excep-tion is the metric registrations (52%). This shows an increase of 18 percentage points compared to the previous year. This shows that customer loyalty is becoming increasingly important for com-panies. In an overall view, the selection of suitable target metrics is concentrated on the five KPIs men-tioned above, as the other area only accounts for a share of 21%.
ic f t e a i f y te t
n a e age any te t y n e nt
4.1 Test concepts, tools & KPIs

40
One exciting development is the question of how many tests the respondents perform on average each month. The proportion of those who carry out 0-2 tests per month has increased signifi cantly compared to the previous year (2020: 66%, 2019: 54%). In contrast, the proportion of those who test more frequently per month has decreased in almost all intervals over the past year.
This result probably has less to do with the fact that respondents are actively planning to reduce their testing activities compared to 2019. Rather, this result is due to the fact that conversion optimization has become a topic of interest to the broad mass of companies. Many companies now start with their own knowledge, their own ideas and their own team and therefore need some lead time to reach a higher number of tests per month.
y i le ent y te ting
36%Client-side A/B-testing
Both Client- and Server-side A/B-testing
Server-side A/B-testing
I don't know
Other
29%
4%
3%
28%
AB
A/B testing can be performed on both the client and server side. With server-side testing, the big advantage is that there are no fl icker effects in the front-end, but this requires internal IT resources. The advantage of client-side A/B testing is that testing can be performed quickly and independently of internal resources. Currently, client-side A/B testing enjoys the greatest popula-rity with 36% of the companies surveyed. About 29% of the study participants already use the possibility to combine client- and server-side testing, whereas only 4% of the companies prefer pure server-side testing. About 28% of the respondents do not know how their testing tool is integrated. This information is particularly relevant for people who are involved in the direct implementation of the tests.
4.1 Test concepts, tools & KPIs
A/B Testing
Multivariate Testing
Personalization
2020
2019
2018
2020
2019
2018
2020
2019
2018
36%
45%
16%
3% 0%
28%
46%
15%8%
3%
38% 40%
19%
2% 2%
6%
17%
28% 28%22%
6%
20%27%
23% 24%
6%13%
29%
38%
14%
1%
18%22%
28%31%
5%9%
34%29%
23%
1%
17%23%
30% 28%
Always Often Occasionally Rarely Never
A/B Testing
Multivariate Testing
Personalization
2020
2019
2018
2020
2019
2018
2020
2019
2018
36%
45%
16%
3% 0%
28%
46%
15%8%
3%
38% 40%
19%
2% 2%
6%
17%
28% 28%22%
6%
20%27%
23% 24%
6%13%
29%
38%
14%
1%
18%22%
28%31%
5%9%
34%29%
23%
1%
17%23%
30% 28%
Always Often Occasionally Rarely Never
A/B Testing
Multivariate Testing
Personalization
2020
2019
2018
2020
2019
2018
2020
2019
2018
36%
45%
16%
3% 0%
28%
46%
15%8%
3%
38% 40%
19%
2% 2%
6%
17%
28% 28%22%
6%
20%27%
23% 24%
6%13%
29%
38%
14%
1%
18%22%
28%31%
5%9%
34%29%
23%
1%
17%23%
30% 28%
Always Often Occasionally Rarely Never
41
ften y e t e f ll ing te ting ce e
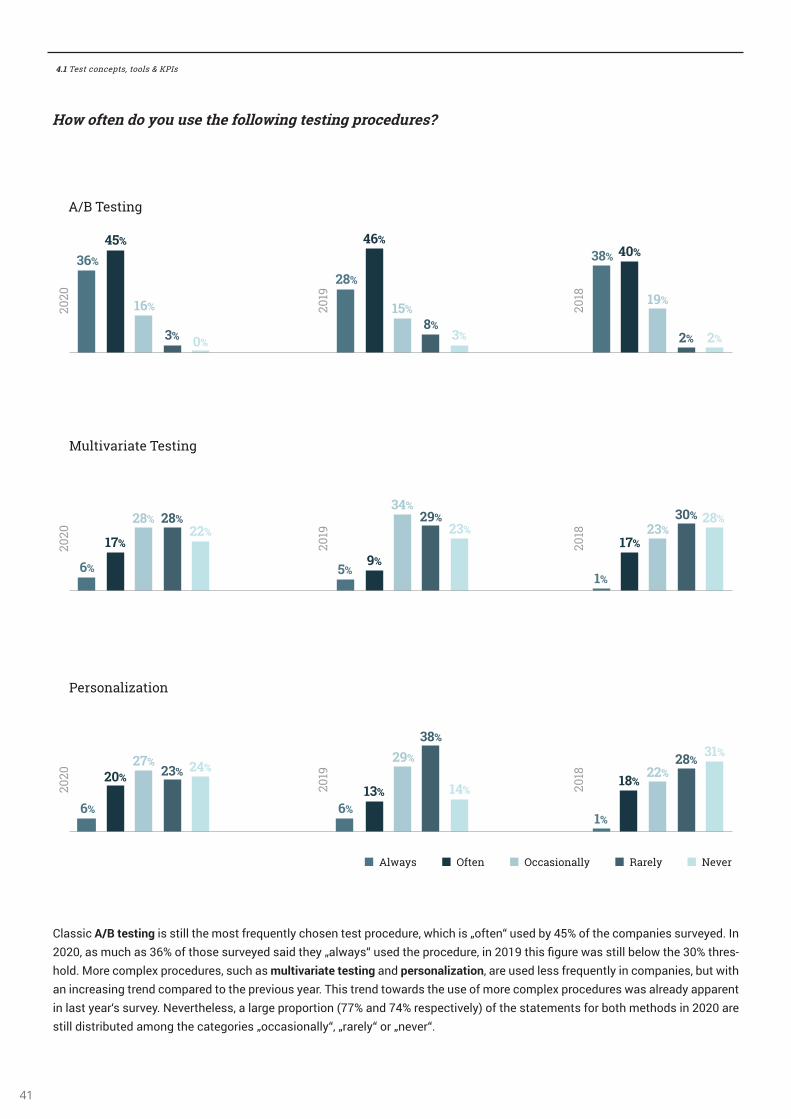
Classic A/B testing is still the most frequently chosen test procedure, which is „often“ used by 45% of the companies surveyed. In 2020, as much as 36% of those surveyed said they „always“ used the procedure, in 2019 this figure was still below the 30% thres-hold. More complex procedures, such as multivariate testing and personalization, are used less frequently in companies, but with an increasing trend compared to the previous year. This trend towards the use of more complex procedures was already apparent in last year‘s survey. Nevertheless, a large proportion (77% and 74% respectively) of the statements for both methods in 2020 are still distributed among the categories „occasionally“, „rarely“ or „never“.
4.1 Test concepts, tools & KPIs

23%
30%
8%
14%
38%
32%
14%
2%
13%
33%35%
13%
6%10%
33%36%
15%
6%
37%39%
16%
0%
50%
6%
25%20%
26%
19%
25%
16%
10%
2020
2019
2018
Always
Often
Occasionally
Rarely
Never
19%
25%
16%
30%
Landing Page Product Pages Homepage
Newsletter Overview Pages Content Pages
Checkout50% 50%
50% 50%
42%
35%
21%
2% 0%
60% 60% 60%
24% 25%19%
22%
9%
42%
34%
16%
6%1%
6% 3%
15%20%
56%
Tablet Mobile Website Mobile AppDesktop
42
ften y n te t n t e f ll ing age
ften y te t t e f ll ing e ice
The importance of landing pages as the primary testing place has decreased compared to 2019. Although 37% of respondents „often“ test there and 39% „occasionally“, but only 8% „always“. In contrast, 14% „always“ perform tests on product pages, meaning that there still seems to be a great potential for optimization. Compared to the previous year, the homepage has hardly lost any of its importance as a test point, although experience shows that it is usually very far away from measuring the main KPIs such as orders. There is a positive development in tests in the checkout area. This is a topic that, despite the often above-average technical complexity, more respondents are now venturing into. A total of 79% test at least „occasionally“, „often“ or „always“ in this part of their website, where often still undreamt-of uplift potentials are hidden. As in the previous year, tests on the overview pages, in the newsletter or on content pages are regarded as significantly less attractive.
The results show that desktop and mobile website still play the most important roles in AB testing. 70% of respondents test „always“ or at least „often“ for desktop or mobile websites. For the latter, this figure has even increased compared to the previous year, so that desktop and mobile websites are now used to the same extent for testing. While testing for tablets is carried out at least „occasionally“ or „rarely“, mobile apps have so far played no role in testing, as a good two thirds of all respondents „never“ or only „rarely“ test on this platform.
4.1 Test concepts, tools & KPIs

User Experience Mobile Optimization Personalization
Landing Page Testing Profesionalization Payment Methods
Product-Testing e-Mail Testing Other
n.A.
79%74%
50%
31% 31%27%
n.A.
n.A. n.A.
n.A.
26%
16%
3%
54%
58%69%66%
2020
2019
43
TOP TOPICS 2020Top Conversion Optimization topics
ic f t e f ll ing n e i n ti i ati n ect t ic an e ti n a e y lanning f in
As in the previous year, user experience is the most important topic for respondents with regard to conversion optimization (2020: 79%; 2019: 74%). This is followed by the question about Mobile Optimization, which increased by 19 percentage points compared to the previous year to a share of 69% and thus replaced personalization (2020: 66%; 2019: 58%) as the second most important topic. This is followed by the topics Landing page Testing (54%), Payment Methods (27%) and Product Testing (26%), which were surveyed for the first time this year. In the area of professionalization, which was also surveyed in 2019, a stagnation in terms of share can be seen (31% in both years).
4.2 Top topics 2020
0 10 20 30 40 50 60
55%45%45%
Data Quality/Tracking
31%43%
35%
Internal Processes
30%27%
30%
Technical hurdles in app/ on website
30%n.An.A
Legal requirements (e.g. data privacy)
28%25%
32%
Finding suitable employees/personnel capacity
25%18%
24%
Importance of Conversion Optimization
23%17%
35%
Traffic Volume
15%8%
17%
Implementation of results
12%25%
22%
Budget
11%18%
6%
Internal resistors
9%30%
15%
Know-how
10%6%
6%
Selection of a Testing Tool
8%6%
4%
Other
2020 2019 2018
44
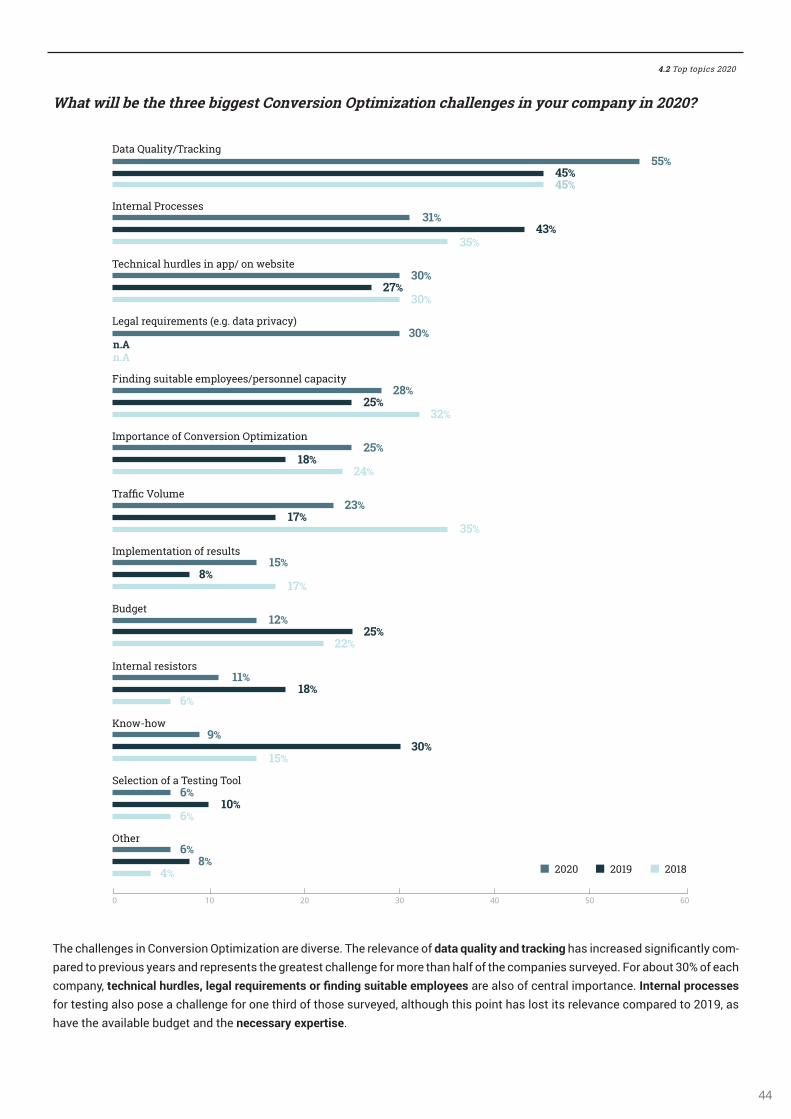
at ill e t e t ee igge t n e i n ti i ati n c allenge in y c any in
The challenges in Conversion Optimization are diverse. The relevance of data quality and tracking has increased significantly com-pared to previous years and represents the greatest challenge for more than half of the companies surveyed. For about 30% of each company, technical hurdles, legal requirements or finding suitable employees are also of central importance. Internal processes for testing also pose a challenge for one third of those surveyed, although this point has lost its relevance compared to 2019, as have the available budget and the necessary expertise.
4.2 Top topics 2020

0
20
50
40
30
60
10
47%45%
58%
15% 15%13%
5%
17%
5%
13%11% 10%
3%3%1%
8%
2%
7%5%5%
6%
Marketing/Online-Marketing
ConversionOptimization
Several departments
eCommerce C-Level/Management
IT Other
2020 2019 2018
45
ic e a t ent i e n i le f n e i n ti i ati n in y c any
RESPONSIBILITY & BUDGET Conversion Optimization
As it could be seen in previous years, the Conversion Optimization area is largely handled by the Marketing department (2020: 47%; 2019: 58%; 2018: 45%), although a decline of 11 percentage points can be seen compared to the previous year. In addition, it can be seen that the responsibility for conversion optimization is increasingly distributed among different departments (2020: 17%; 2019: 13%; 2018: 5%). Even though the proportion of company-owned Conversion Optimization Teams decreased last year (10% points), it has risen again to the level of 2018 (15%). In contrast, the share of IT seems to stagnate (2020: 3%; 2019: 1%; 2018: 3%;) and management is increasingly relinquishing responsibility for conversion optimization (2020: 2%; 2019: 7%; 2018: 8%).

Compared to the total marketing budget, only a small portion of it is available for conversion optimization. It is noticeable that the 2020 budget is slightly lower than in the previous year. For about three quarters of all respondents, the testing budget is less than 10% of the total marketing budget for 2020, and only one quarter have more than this 10%, which is a significant decrease compa-red to the previous year. In 2019, around 40% of all respondents still classified the budget for conversion optimization as more than 10% of the total marketing budget.
2020€
<10% 10-20% >20%
60% 75%
36%
6% 4%
19%
2019€2020€
<10% 10-20% >20%
60% 75%
36%
6% 4%
19%
2019€
2020€
<10% 10-20% >20%
60% 75%
36%
6% 4%
19%
2019€
Yes, we work together with an external agency. No, we do everything in-house.
41% 2020
2019
2018
52%
41%
59%
48%
59%
46
D y it an e te nal agency f y c n e i n ti i ati n ect
Numerous projects in the field of conversion optimization are implemented with the support of external agencies. However, a decline of 11 percentage points compared to the previous year can be observed (2020: 41%; 2019: 52%). In 2020, 59% of the companies sur-veyed implement their conversion optimization projects in-house and only 41% of the companies use the support of external agencies.
at e centage f t e a eting get ill e ent n n e i n ti i ati n in
4.3 Responsibility & Budget

0 10 20 30 40 50 60
Increases by more than 10%
Increases by up to 10%
Remains unchanged
Decreases by up to 10%
Decreases by more than 10%
57%
43%
47%
0%
3%
1%
2%
1%
0%
17%
26%
20%
24%
26%
31%
2020 2019 2018
47
With an increase of 14 percentage points, 57% of the respondents stated that they had the same budget for 2020 as in the previous year for the area of Conversion Optimization. In contrast, a decrease can be seen with regard to groups planning to increase their annual budget for 2020. While a stronger decline is seen in companies whose budget increases by more than 10% compared to the previous year (-9 percentage points), a smaller decline is seen in companies whose budget increases by up to 10% (-2 percentage points). It is noticeable that the latter group has been steadily decreasing in relation to 2018, while the group that increases its bud-get by more than 10% increased significantly last year, but this year is back at a similar level as in 2018. Furthermore, only 2% of the companies surveyed stated that they would reduce their Conversion Optimization Budget for 2020. This shows that the study participants plan to keep or increase their budget for 2020 much more frequently, while only a few companies plan to reduce their budget.
ill y c any n e i n ti i ati n get c ange c a e t t e i yea
4.3 Responsibility & Budget

TRAKKEN CLOUD & MARKETING TECHNOLOGYHamburg / Berlin / Munich / Vienna / Zurich / Barcelona / Stockholm

www.analytics-summit.dePowered by:
ANALYTICS SUMMIT 2020THE BIGGEST GOOGLE ANALYTICS CONFERENCE IN EUROPE

AB
AB
TRENDSTUDIE
W W W. A N A LY T I C S - T R E N D S . D E