treatment, by-products reuse and sensors' system - core
TRANSCRIPT

Júri:
Presidente: Virgílio António Cruz Machado Professor Catedrático, NOVA-FCT
Arguentes: Francesca Pagnanelli Professora Associada, Sapienza University of Rome
Helena Isabel Caseiro Rego Gomes Anna McLaren Research Fellow, University of Nottingham
Vogais: Fernando José Pires Santana Professor Catedrático Jubilado, NOVA-FCT
Maria de Fátima Guerreiro da Silva Campos Raposo Professora Associada com Agregação, NOVA-FCT
Ana Cristina Moreira Simões Doutora Coordenadora da HiTech@Lisboa Eduardo Manuel Hipólito Pires Mateus
Investigador CENSE, Técnico Superior, NOVA-FCT
Cátia Joana Costa Magro [Nome completo do autor] [Nome completo do autor] [Nome completo do autor] [Nome completo do autor] [Nome completo do autor] [Nome completo do autor] [Nome completo do autor]
Mestre em Engenharia do Ambiente
Ramo de Sistemas Ambientais
[Habilitações Académicas]
[Habilitações Académicas]
[Habilitações Académicas]
[Habilitações Académicas]
[Habilitações Académicas]
[Habilitações Académicas]
[Habilitações Académicas]
Outubro, 2019
Advances in applied electrokinetics: Treatment,
by-products reuse and sensors’ system
[Título da Tese]
Dissertação para obtenção do Grau de Doutor em Ambiente e Sustentabilidade
Orientadores: Eduardo Manuel Hipólito Pires Mateus
Investigador CENSE, Técnico Superior, Faculdade de
Ciencias e Tecnologia da Universidade Nova de Lisboa
Alexandra de Jesus Branco Ribeiro
Professora Associada com Agregacao, Faculdade de
Ciencias e Tecnologia da Universidade Nova de Lisboa
Juan Manuel Paz-Garcia
Professor Assistente, Universidad de Málaga


Advances in applied electrokinetics: Treatment, by-products reuse and sensors’ system
[Título da Tese]
- Cátia Joana Costa Magro -
[Nome completo do autor]
[Nome completo do autor]
[Nome completo do autor]
[Nome completo do autor]
[Nome completo do autor]
[Nome completo do autor]
[Nome completo do autor]


Advances in applied electrokinetics: Treatment, by-products reuse and
sensors’ system
Copyright © [Cátia Joana Costa Magro], NOVA School of Science and Technology, NOVA University
Lisbon
A Faculdade de Ciências e Tecnologia e a Universidade Nova de Lisboa têm o direito, perpétuo e sem
limites geográficos, de arquivar e publicar esta dissertação através de exemplares impressos
reproduzidos em papel ou de forma digital, ou por qualquer outro meio conhecido ou que venha a ser
inventado, e de a divulgar através de repositórios científicos e de admitir a sua cópia e distribuição com
objectivos educacionais ou de investigação, não comerciais, desde que seja dado crédito ao autor e
editor.


“I have no special talent. I am only passionately curious.” - Albert Einstein -
To my parents,
“We’ve all got both light and dark inside us.
What matters is the part we choose to act on.
That’s who we really are.”
- Sirius Black, Harry Potter and the Order of the Phoenix -


iii
Preface
This dissertation is submitted in partial fulfilment of the requirements for the Doctoral Degree in
Environment and Sustainability and includes the results of my PhD study carried out from October 2015
to September 2019 at the NOVA School of Science and Technology, NOVA University Lisbon. Most of
the research work developed during the PhD project was undertaken at Resolution Lab, CENSE,
Departamento de Engenharia e Ciencias do Ambiente (DCEA), NOVA School of Science and Technology,
NOVA University Lisbon, under the supervision of the Doctor Eduardo P. Mateus (Cense Researcher)
and the co-supervision of the Associate Professor with Habilitation Alexandra B. Ribeiro and of the
Assistance Professor Juan M. Paz-Garcia (University of Málaga, Spain). Additionally, the sensors’
development and measurements were performed at the Centre of Physics and Technological Research,
CEFITEC, hosted by the Associate Professor Maria Raposo. The Business Plan and market assessment
were undertaken during the Hiseedtech training programme at the NOVA School of Business and
Economics, NOVA University Lisbon.
During the period of my PhD scholarship, I worked abroad twice, hosted by prestigious international
universities:
March-July 2017. Department of Civil Engineering, Technical University of Denmark, BYG·DTU,
Lyngby, Denmark. Hosted by the Associate Professor Lisbeth M. Ottosen
July-October 2019. ECORECYCLING, at Sapienza Università di Roma, Italy. Hosted by the
Associate Professor Francesca Pagnanelli
The present research is part of the projects entitled “Development of Nanostrutures for Detection of
Triclosan Traces on Aquatic Environments, PTDC/FIS-NAN/0909/2014”, sponsored by Fundação para a
Ciência e a Tecnologia and e.THROUGH - Thinking rough towards sustainability, sponsored by Grant
Agreement 778045, H2020-MSCA-RISE-2017 from the European Commission and Fundação para a
Ciência e a Tecnologia for the research grand SFRH/BD/114674/2016.
Therefore, the dissertation is organized as follows:
Part I - The knowledge collected in the appended publications is compiled with the aim of organizing
the information and explaining the methodology used. Part I contains a general introduction and a
description of the PhD project, the statement of the research objectives and a summary of the main

iv
achieved results from the papers published, submitted and planned (manuscripts) during the research
period. Part I it is designed to organize the content and define the links between the peer-reviewed
scientific publications submitted and published during the PhD project.
Part II - Collects the relevant peer-reviewed scientific publications submitted and published during the
PhD project, including journal papers and conference contributions.
I hereby declare that, as the first author, I provided the major contribution to the research and
experimental work developed, as well as to the interpretation of the results and the preparation of the
publications submitted during the PhD project.
Monte de Caparica, 23nd September 2019
Cátia Magro

v
Acknowledgments
“Let us be grateful to the people who make us happy;
They are the charming gardeners who make our souls blossom.”
- Marcel Proust -
I would like to express my gratitude to my advisers, Eduardo Mateus, Alexandra Ribeiro and Juan Paz-
Garcia, for always fight by my side for my ideas. Thank you so much! A special word of thanks is due to
Eduardo Mateus for his continuous support and outstanding scientific discussions, no one has ever
pushed me so far intellectually.
I had the opportunity to work with top research groups and I would like to thank:
Maria Fátima Raposo, Susana Sério and Paulo Ribeiro: CEFITEC group, Department of Physics
of NOVA-FCT
Lisbeth Ottosen, Pernille Jensen, Gunvor Kirkelund, Ebba Schnell and Malene Møller: BYG·DTU
group, Department of Civil Engineering, Technical University of Denmark
Francesca Pagnanelli and António Rubino: ECORECYCLING, at the Department of Chemistry
in Sapienza Università di Roma
Success is never individual. Therefore, I do thank my research group, Resolution lab. Thank you so much
Flávia Freitas and Cátia Santos for all the help and emotional support. Thank you to Nazaré Couto,
Marco Silva, Davide Mendes, Vanda Lopes, João Brinco and André Jorge, for all the assistance during
my journey. A special thanks to Paula Guedes, for always being there to help, listen and support the
craziness of a PhD student. As all help is important in times of need, thank you all the REQUIMTE’s
analysis team, Nuno Costa, Carla Rodrigues and Nuno Lapa, who always had his experience and
laboratory available for me.
I am very grateful to Marta Cerejo, from Research and Innovation Accelerator – FCT, Cristina Simões
and Pedro Vilarinho from HiseedTech and Paulo Amaral from Recipharm, for all the support, best efforts
to put our scientific work into a real-life solution and, most of all, for believing in me: “if you try hard,
you may change the world a bit”. Thanks to my colleagues in CENSE communication, Inês Cosme, Luis

vi
Dias and Rita Domingues, you are the best guys! Thank you to Marta Martins for showing that it is
possible to be a great scientist, professor and the coolest mother.
Thank you to my Danish family, for always make me feel that I am at home. To my Climate-KIC Journey
sweeties’ and their brilliant minds. Thank you to Bruno Moura who took care of my physical and mental
health during these years.
To Paulo Zagalo, João Pereira-da-Silva and Filipa Fernandes my favourite nerds, who always help and
have a smile for me, thank you for teaching me that sensors can be the trendiest subject and that strong
friendship can happen any time.
To the sweetest and kindest, Joana Almeida, your support was a rock in my entire PhD journey. Thank
you for your friendship, for the laughs and all the fun that we had in our complex laboratory
experiments.
To my oldest and my always present friends, Daniela Sousa, Cláudia Silva, Rita Ferreira, Sílvia Dias,
Vanessa Nunes, Joana Silva, Sofia Pereira, and José Santos, thank you as you are a gift in my life.
To João, thank you for the advice, the debates and the infinite encouragement. We indeed are the best
team!
To my parents Jorge e Joana, my grandparents Cecília, Mariana, Francisco and António, my uncle Pedro
and aunt Sandra, thank you for being the best family, thank you for being there for everything,
unconditionally.

vii
Resumo
As principais barreiras encontradas para alterar o paradigma das soluções de reutilização de água estão
relacionadas com o nível de maturação das tecnologias desenvolvidas, com a remoção de
contaminantes orgânicos emergentes, com a carência de ferramentas de análise rápida, fiável e
economicamente viáveis para monitorização ambiental. Neste sentido, a presente dissertação propõe
a aplicação de tecnologias de base elétrica a efluente secundário com o objetivo de promover a sua
reutilização através (i) da remoção de triclosan e de contaminantes inorgânicos, (ii) da concepção e
estudo de línguas eletrónicas como potenciais ferramentas para monitorizar processos de degradação;
(iii) da recuperação/reutilização de hidrogénio para fins energéticos e da produção de materiais de
construção.
De acordo com os objetivos mencionados, os principais resultados do presente projeto de
doutoramento são descritos de seguida:
(i)
Os reatores eletroquímicos testados são eficazes para degradar triclosan e os seus
produtos de degradação/metabolito. O tipo de elétrodo utilizado no processo é uma
variável importante, uma vez que afeta a eficiência e cinética de degradação, assim
como os subprodutos gerados após o tratamento;
A seletividade e sensibilidade de um GC/MS/MS permite, após otimização operacional,
a deteção e quantificação de triclosan (em efluente na gama dos ng/L), sem a
derivatização do analíto, demonstrando que os métodos-padrão devem ser ajustados
consoante a matriz e os compostos em estudo.
(ii)
Línguas eletrónicas revestidas com filmes finos de polieletrólitos orgânicos são capazes
de distinguir com uma resolução de pico-molar, por meio de uma Análise de
Componentes Principais, entre água mineral e efluente secundário, discriminando
simultaneamente triclosan a diferentes concentrações;
A estabilidade do revestimento nas línguas eletrónicas é afetada pelas características
da matriz (p.e. pH e teor em elementos), em detrimento da molécula a ser detetada;
tendo em conta esta dependência, filmes finos produzidos com a técnica de
pulverização catódica, mais robustos e estáveis, foram adicionados à composição da
língua eletrónica desenvolvida;

viii
A língua eletrónica desenvolvida tem potencial como ferramenta de monitorização
ambiental e seguimento da degradação dos compostos em estudo, quando conectada
a um reator eletroquímico dinâmico; observou-se a semi-quantificação de triclosan e
metil-triclosan usando uma língua eletrónica composta por cinco sensores; observou-
se a semi-quantificação de 2,4,6-triclorofenol e 2,4-diclorofenol usando um único
sensor revestido com filmes de menor espessura.
(iii)
O hidrogénio, um subproduto gerado durante o processo electrodialítico, provou,
conceitualmente, potencial para ser armazenado, reutilizado e/ou utilizado numa
célula de combustível com membrana de troca de protões, para gerar energia;
A utilização de efluente tratado com o processo electrodialítico é uma solução com
potencial para substituir a água potável utilizada na produção de materiais de
construção. Esta substituição produz materiais com características indicadas para a
indústria da construção, aumentando a sustentabilidade do processo e a valorização
do reator desenvolvido, no mercado.
Palavras-chave: água; processos eletroquímicos; contaminantes orgânicos emergentes; monitorização
ambiental em tempo real; línguas eletrónicas; hidrogénio; reutilização de efluente secundário; materiais
de construção.

ix
Abstract
Some of the barriers for a paradigm change on water reuse solutions are related to their maturing
technology level, to the removal of emerging organic contaminants and to the availability of rapid,
reliable and cost-effective monitoring tools. Thus, in this dissertation, electro-based techniques were
applied to secondary effluents aiming to promote water reuse through the (i) removal of triclosan and
inorganic contaminants, (ii) development and test of electronic tongue sensors that may be used as
complementary monitoring tools coupled with degradation processes, and (iii) enhancing of the
technology maturity level with the recovery of self-produced hydrogen and freshwater replacement in
the production of construction materials.
With these objectives, the main findings in this PhD project are described hereunder:
(i)
Electrochemical reactors are effective for degrading triclosan and its by-products. The
type of electrodes is an important variable that strongly impacts the degradation
efficiency, the kinetics and the by-products generated after treatment;
GC/MS/MS selectivity and sensitivity allows, after operational optimization, the
detection and quantification of triclosan, without the analyte derivatization, in the
effluent at ng/L level, showing that standard methods should be adjusted “case-by-
case”.
(ii)
Electronic tongues coated with organic polyelectrolyte thin films are able to distinguish
at pico-molar resolution, by means of principal component analysis, between mineral
water and secondary effluent matrices and discriminating triclosan at different
concentrations;
The coating’s stability is affected by characteristics of the water to be analysed (e.g.
such as pH and elements content), rather than by the molecule to be detected; Due to
this dependency, sputtering thin films, more robust and stable, should be added to the
electronic tongue array;
A customized electronic tongue proved be a potential complementary monitoring tool
to follow the degradation pathway of the target compounds across the treatment,
when coupled to a dynamic electrochemical reactor; It was possible to semi-quantify
methyl-triclosan and triclosan using the array, whereas for phenolic compounds (2,4-

x
dichlorophenol and 2,4,6-trichlorophenol) best results were obtained by using a single
sensor and thinner film as coating.
(iii)
The remediation process by-product, hydrogen, showed, on a proof of concept level,
its potential to be stored, reused or used as fuel in a proton-exchange membrane fuel
cell, to generate energy;
The use of electro-treated effluent showed to be sustainable for replacing freshwater
in construction materials production. This replacement can provide high quality
materials with features that are valued by construction materials industry, increasing
the market value of the reactor developed.
Keywords: water; electrochemical processes; emerging organic contaminants; real time monitoring;
electronic tongue’s systems; hydrogen; secondary effluent reuse; construction materials.

xi
Abbreviations
DCP 2,4-Dichlorophenol
E-tongue Electronic Tongue
ED Electrodialytic
EK Electrokinetic
EOCs Emerging organic contaminants
GC/MS/MS Gas chromatography-triple quadrupole mass spectrometry
GO Graphene Oxide
HPLC-DAD High-Performance Liquid Chromatography with Diode-Array Detection
LbL Layer-by-layer
MTCS Methyl-Triclosan
Nb/BDD Niobium/boron-doped diamond
PAH Poly(allylamine hydrochloride)
PEI Poly(ethyleneimine)
PSS Poly(sodium 4-styrene sulfonate)
TCP 2,4,6-Trichlorophenol
TCS Triclosan
Ti/MMO Titanium/ Mixed Metal Oxide
TRL Technology readiness level

xii

xiii
Contents
Preface ............................................................................................................................................................................ iii
Acknowledgments ........................................................................................................................................................... v
Resumo ......................................................................................................................................................................vii
Abstract .......................................................................................................................................................................ix
Abbreviations ................................................................................................................................................................. xi
Contents ....................................................................................................................................................................... xiii
Part I
1. Introduction ................................................................................................................................................................. 3
2. Objectives .................................................................................................................................................................... 7
3. Summary of the research ........................................................................................................................................... 9
3.1 Electrochemical reactors for triclosan and its by-products degradation ...................................................... 11
3.2 Chromatography methods for triclosan detection in effluent ....................................................................... 13
3.3 E-tongues to triclosan detection and quantification ...................................................................................... 15
3.4 Multi-analyte e-tongue coupled to an electrochemical reactor .................................................................... 17
3.5 Electrokinetic Hydrogen self-energy generation ............................................................................................ 19
3.6 Potential of replacing freshwater by electro-treated effluent in construction materials ............................ 21
3.7 Future work ....................................................................................................................................................... 23
References .................................................................................................................................................................... 25
Part II
Papers
Emerging organic contaminants in wastewater: Understanding electrochemical reactors for triclosan and its
by-products degradation
Published in: Chemosphere, 2019a .................................................................................................................. 31
Analytical method for the monitoring of underivatized Triclosan by gas chromatography-triple quadrupole
mass spectrometry in effluent
Under preparation, 2019b ............................................................................................................................... 43
Overview of electronic tongue sensing in environmental aqueous matrices: Potential for monitoring emerging
organic contaminants
Published in: Environmental Reviews, 2019c ….………………………………………………………………………………………………….55
Polyelectrolyte based sensors as key to achieve quantitative electronic tongues: Detection of triclosan on
aqueous environmental matrices
Submitted, 2019d…………….………………………………………………………………..……………………………………………………………….71
Electronic tongue coupled to an electrochemical flow reactor for emerging organic contaminants degradation
monitoring

xiv
Published in: Sensors, 2019e……………………………………………………………………………………………………………………….…...…95
Exploring hydrogen production for self-energy generation in electroremediation: a proof of concept
Published in: Applied Energy, 2019f ......................................................................................................................... 111
Sustainability of construction materials: electrodialytic technology as a tool for mortars production
Published in: Journal of Hazardous Materials, 2019g .............................................................................................. 121
Provisional Patent Application
Electrodialytic reactor and process for the treatment of contaminated aqueous matrices
Registration number: 115384, 2019 ........................................................................................................................ 131
Market Assessment
Business plan for 2Resource potential solution
In: Hitech program, 2018…………………………………………………………............................................................................135
Chapters
Sensors potential to monitoring electroremediation systems: emerging organic contaminants in wastewater
Under preparation, 2019*.......................................................................................................................................... 139
Self-hydrogen recovery in electro-based technologies applied to environmental contaminated matrices
Under preparation, 2019** ........................................................................................................................................ 143
Conference Papers
Detection and adsorption of Triclosan on sensors based on PAH/PVS thin-films
Published in: Proceedings IEEE, 2019 ……………………………………………………………………………………………………………… 147
Detection of Triclosan in tuned solutions by pH and ionic strength using PAH/PAZO thin films
Published in: Sensors Proceedings I3S, 2019 …………………………………………………………………………………………………… 153
Triclosan Detection in Aqueous Environmental Matrices by Thin-Films Sensors
Published in: Sensors Proceedings I3S, 2019h……………………….………………………………………………………………………… 159
Conference Contributions
Triclosan detection in aqueous environmental matrices by thin-films sensors: impedantiometric electronic tongue
Oral presented in: 7th International Symposium on Sensor Science, 2019…………………………………………………...... 167
Electrodialytic technology as effluent treatment for reuse in construction materials Oral presented in: 5th International Conference on Sustainable Solid Waste Management, 2017………………… 171
Development of target methods for triclosan monitorization in effluents at trace levels using gas chromatography-triple quadrupole mass spectrometry and electronic tongues
Poster presented in: 11th Encontro Nacional de Cromatografia, 2019............................................................... 175
Innovating from Science: 2Resource - Recovering water, creating Resources to build Poster presented in: HiTech Clossing Session, 2018………………………………………………………….................................. 179
Prospective energy savings in electro-based technologies – PEM fuel cell Poster presented in: 6th International Conference on Sustainable Solid Waste Management, 2018……………… 183

xv
Optimization of an analytical method for the determination of underivatized triclosan and related compounds by gas chromatography-triple quadrupole mass spectrometry
Poster presented in: 10th Encontro Nacional de Cromatografia, 2017................................................................ 187
Assessment of emergent contaminants removal from wastewater by electrokinetics Poster presented in: 15th International Symposium on Electrokinetic Remediation, 2017….……………………….....191

xvi

Part I
“Anyone who has never made a mistake has never tried anything new. “
- Albert Einstein -

2

3
1. Introduction
Water scarcity can be defined as the shortage of the freshwater resources required to meet demand.
Every continent is affected by water scarcity, and it was classified by the World Economic Forum (2015)
[1] as the highest global risk regarding potential its effects over the next decade. Climate change, rapidly
growing population and increased urbanization are the main reasons for this trend. Today, an estimated
3.6 billion people - nearly half the world’s population - already live in areas that are potentially water-
scarce at least one month per year. According to the United Nations, this number could increase to
between 4.8 and 5.7 billion by 2050, as two out of every three people are likely to be living in cities or
other urban centres. Logically, both the European Economic Area and the United Nations Environment
Programme call for action to increase water-use efficiency in all sectors. Of the barriers to a wider
uptake of water reuse solutions, technical and scientific uncertainties are considered to be among the
top six main challenges: “the water reuse sector in Europe seems to be mature, technical solutions are
well-known and available to cover a wide range of applications and environments. However, these
solutions are not always cheap and there remain a few technical challenges, in particular, the removal
of emerging organic contaminants (EOCs) and the need for rapid monitoring techniques that are reliable
and cost-effective” (European Commission, 2015).
EOCs are defined as “chemical substances that have no regulation and are suspected to negatively
affect the environment or whose effects are unknown” [3,4]. Among EOCs, triclosan (TCS, 2,4,4'-
Trichloro-2'-hydroxydiphenyl ether) is an antimicrobial agent that has been used for more than 50 years
as an antiseptic, disinfectant or preservative in clinical settings and in several consumer products. TCS
has been detected in wastewater treatment plants [5–7] and in surface water [8,9]. Recent reviews of
TCS recount numerous health effects, ranging from endocrine-disruption to uncoupling mitochondria
[10,11]. Although, in 2016, the US Food and Drug Administration banned TCS from certain washing
products, namely hand soap and body wash [12] and from hospital products by the end of 2018 [13], it
is still permissible to have TCS in e.g. toothpastes, cosmetics, clothes or toys [14]. Furthermore, TCS
derivatives, such as the metabolite methyl-triclosan (MTCS) [15], which is even more persistent [16]
and TCS by-products formed by repeated exposure to chlorine in water, such as 2,4-Dichlorophenol
(DCP) and 2,4,6-Trichlorophenol (TCP) are also a cause for concern, since they present a health risk to
humans and are recognized as persistent priority pollutants in the United States, Europe and China [17].

4
The electrokinetic (EK) technique also referred to as “electroremediation” has been used to remove,
separate, and promote contaminants degradation since the early nineteenth century, targeting soil
remediation [18]. Favourable results have been observed for the removal of EOCs in soil [19,20], sludge
[21] and effluent [22]. EK consists in the application of a low-level direct current, inducing
physicochemical changes in the media, leading to species transports by (1) electromigration - the
movement of ions in solution, (2) electrophoresis - the movement of charged, dissolved or suspended
particles in pore fluid and (3) electroosmosis - the movement of fluids across a conduit. Additionally,
the electrolysis of water occurs at the electrodes, generating H+ by water oxidation at the anode and
OH- by water reduction at the cathode. The “phenomenon” is a useful feature when
remediation/degradation/removal/recovery processes are involved since the generated by-product,
hydrogen, can be used as fuel in proton-exchange membrane fuel cells to produce electrical energy, to
reduce the energy costs of electro-remediation, and to generate value. Moreover, as an energy carrier,
H2 can be used to accumulate energy during electric power demand valleys, and to generate electric
power during peak periods. Therefore, a reservoir can be integrated into the electrodialytic (ED) system,
from where the H2 produced can be recovered and used for different purposes.
Furthermore, not only cutting-edge technologies for contaminants removal are under the spotlight, but
also sensors as monitoring tools. Electronic tongue (e-tongue) devices are gaining special attention for
liquid matrices. One of the most interesting aspects that motivate the development of e-tongues is their
potential for real time parallel monitoring of multi-analyte determination in a single sample analysis
[23]. E-tongue is “a multi-sensory system, formed by an array of sensors with low-selective thin film
layers or sensorial layers, combined with advanced mathematical procedures for signal processing
based on pattern recognition and/or multi-variate data analysis” [24]. From a structural and
manufacturing point of view the choice of the type of thin film or sensorial layer is a critical step for the
accomplishment of a reliable qualitative and quantitative device. Compared to traditional sampling and
analysis, sensors can provide a fast response on the output data in a continuous, safe, and cost-effective
way. Notwithstanding the potential advantages of e-tongues, there are still many challenges related to
the stability and monitoring reliability, including recognition and transduction elements, matrix effects,
reversibility, and the need of in situ calibration. Finally, e-tongues are not intended to replace traditional
methods, but they can be useful and complementary tools when speed and a lower-cost routine
response are required.
The removal of EOCs using EK technologies in combination with fast monitoring tools has potential to
ensure an effective, competitive and integrated solution for water reuse.

5
After water, concrete is the most widely consumed material in the world [25]. The concrete industry
represents 9% of all industry withdrawals and 1.7% of all global water consumption [26] . In a concrete
mix, the water-cement ratio is around 0.45 to 0.60. In other words, more than 17 billion m3 of
freshwater is used in the production of concrete each year. Today, freshwater is the only type of water
that meets the industry standards for concrete production. Moreover, if inadequate water is used, the
quality of the concrete can significantly decrease, leading to a structural failure that would represent
between 5% and 9.4% of the total costs of concrete production [27]. However, tap water supply is
highly limited, especially in dry regions such as the Middle East and Africa, where construction
companies often have no other option than to rely on water that is at least partially polluted. The EK
technology has the potential to reduce the need of freshwater by replacing it with electro-treated
effluent in concrete production. The versatility of the EK reactor can provide full control of water
characteristics (e.g. pH, salts content), allowing the production of high-quality construction materials,
without jeopardizing reference parameters, e.g. compressive strength or setting times.
Different issues are discussed in Part I: electrochemical reactors for the degradation of TCS and its by-
products (in Magro et al. submitted 2019a), GC/MS/MS as a monitoring technique for TCS detection
and quantification in effluent (in Magro et al. under preparation 2019b), e-tongue build up with LbL thin
films for detection and semi-quantification of TCS (in Magro et al. 2019c, Pereira-da-Silva et al. 2019,
Zagalo et al. 2019, Magro et al. 2019h; Magro et al. submitted 2019d), customized e-tongue coupled to
an electrochemical reactor to “follow” the analytes electro-degradation (in Magro et al. submitted
2019e; Magro et al. chapter under preparation 2020*), EK hydrogen self-energy generation (in Magro
et al. 2019f; Magro et al. chapter under preparation**), potential of replacing freshwater with electro-
treated effluent in construction materials production (in Magro et al. 2019g; Provisional patent
application 2019; Market assessment 2018).

6

7
2. Objectives
The main objectives of this PhD project were: (i) to promote water reuse through the removal of
contaminants by electro-based technologies, (ii) to develop and test sensors to be used as
complementary, rapid and reliable monitoring tools, and (iii) to provide a market assessment of the
potential of using electro-treated effluent in the construction sector.
The specific objectives and its achievements through this project are summarized as follows:
Study electrokinetics as an effective and viable technology to remove and/or degrade emerging organic
compounds and inorganic species in a wastewater matrix
o Different batch, flow and customized EK reactors were evaluated to optimize the
removal/degradation of TCS, its derivative by-products and inorganic elements
o Chromatographic techniques were developed and optimized for the analysis of TCS and its
derivative by-products: DCP, TCP and MTCS
Develop and test new monitoring tools for rapid, reliable and cost-effective detection of triclosan and its
by-products during an electrochemical process, applied to a wastewater
o Evaluation of Layer-by-layer polyelectrolytes and sputtering thin films as sensorial layers for e-
tongue systems
o Evaluation of the combination of both layer-by-layer and sputtering thin films in a new e-tongue
prototype coupled to a flow EK reactor - to detect and follow the degradation dynamics of
target compounds
Enhance the maturity level of electrokinetics technology
o Self-produced hydrogen was evaluated as proof of concept concerning its purity, potential
energy generation and remediation process savings
o Wastewater valorisation in the production of construction materials was studied and assessed
at a market level

8

9
3. Summary of the research
As both the scarcity and price of clean drinking water continue to rise across the world, the value of
wastewater, as a source of water recovery, has a tendency to increase. One of the opportunities for
improvement is the establishment of legal regulations to define how to manage wastewater and to
establish which treatment technologies should be used for different types of reuse purposes. Over the
last three decades, many research projects have focused their attention on the different applications
of electrochemical technology in environmental remediation. Thousands of publications (bibliometric
evaluation through SCOPUS, with keywords “electrochemical process” or “electrokinetic process”) have
sought to develop new technologies or improve existing processes. Now, at the end of this long period,
very few are being applied at their full-scale and most of them remain at the stage of ‘promising’
technologies. Most have recognisable benefits, but important technological difficulties and cost
handicaps can be identified, which are related to missing components in the value chain of the
technology and the existence of only a few highly specialized stakeholders [28]. When competitive
solutions are fully marketed, it is difficult to displace them, unless the advantages of the new technology
would help to obtain the same or increased level of performance and payback. Lessons must be learned
in order to achieve full applicability of electrochemical technologies and to allow returns on invested
money to companies and society. Among electrochemical technologies, the EK processes are now in
the position of improving their technology maturity level and, thus, to play a role in the practical
solutions that may be implemented in the wastewater reuses value chain.
The methodology and results of the PhD research are summarized in the following subsections, 3.1 to
3.7.

10

11
3.1 Electrochemical reactors for triclosan and its by-products degradation
TCS and its derivative by-products reach water bodies due to the inefficient removal on wastewater
treatment plants [29]. The electrochemical treatments, at bench scale, applied to EOCs, attains high
performance in terms of TCS removal, mainly due to the, stability and activity of the anode which
significantly affects the generation of reactive species, such as •OH [30]. Magro et al. (submitted 2019a)
studied the degradation of TCS and its derivative by-products (MTCS, DCP and TCP) in effluent by two
different electrochemical reactors. A batch and a flow reactor (mimicking a secondary settling tank in a
wastewater treatment plant) were tested with two different working anodes: Titanium/mixed metal
oxide (Ti/MMO) and niobium/boron-doped diamond (Nb/BDD). For both reactors, the best electrode
combination was achieved with Ti/MMO as the anode. The batch reactor with 7 mA/cm2 during 4h
attained degradation rates below the detection limit for TCS and TCP, and 94% and 43% for DCP and
MTCS, respectively. The flow reactor, in approximately 1h with the same current density as the batch
reactor, achieved degradation efficiencies of between 41% and 87% for the four contaminants. The
results suggest a possible alternative technology that may be implemented in a secondary settling tank,
since the combination of a low current density with the flow and matrix induced disturbance increased
and speeded up the elimination of compounds.
An upgraded “designed reactor” was developed and is the one included in the provisional patent
application (2019). Being not in the patent application core, the reactor design also offers possibilities
for the degradation of TCS and its by-products, as the design configuration includes the direct contact
of electrodes into the matrix. In the “designed reactor”, the EOCs had two stages of degradation, in the
cathode and the anode compartments, separately. EOCs suffer direct anodic oxidation when the
contaminants come into contact with the anode surface and indirect oxidation in the liquid bulk,
mediated by the oxidants that are formed electrochemically. From the point of view of removal rates,
92% to below the detection limit was achieved for TCS, DCP and TCP with direct oxidation as the main
factor of degradation. For MTCS, the direct and indirect oxidation showed equal contributions to the
compounds’ degradation. Differently from the batch and flow reactor presented in Magro et al.
(submitted 2019a), the “designed reactor”, includes ion-exchange membranes. The movement of the
EOCs through the membranes was not detected. The use of membranes in the degradation solutions
can be a potential disadvantage as it may contribute to the membrane fouling. A voltage increase due
to fouling was not observed. Only a slightly yellow colour was observed in the anion exchange
membrane at the end of the experiments, suggesting the adsorption of organic matter. Comparing the
adsorption of compounds between both membranes, the phenomenon is greater with anion exchange

12
membrane and may be explained by the electrostatic interactions between organics and the membrane
(anion exchange membrane 17% vs cation exchange membrane 8% adsorption, for MTCS).

13
3.2 Chromatography methods for triclosan detection in effluent
When using High-Performance Liquid Chromatography with Diode-Array Detection (HPLC-DAD) it was
not possible to detect TCS in the raw effluents used on the study. TCS is usually found in trace
concentration in effluent matrices (2 ng/L - 40 µg/L) (Dhillon et al., 2015), a level below the LOD of the
DAD method (around 0.5 mg/L). Therefore, it was necessary to develop a more sensitive and selective
method using a gas chromatography-triple quadrupole mass spectrometry (GC/MS/MS) system. Magro
et al. (2017) presented an optimized GC/MS/MS method for TCS detection, without analyte
derivatization, using Multiple Reaction Monitoring (MRM) mode. To achieve the optimized conditions,
the operational parameters tested are: splitless time, liner type, injector temperature, MS source and
interface temperature, Q1 and Q3 resolution (peak shape and area offset), collision gas pressure,
collision energy and dwell time. Results from injector temperature showed that too high temperatures
(>270 °C) can lead to thermo-degradation. The most critical factor was the liner’s type which can
jeopardize the shape of the peak and its S/N on the chromatograph. Thus, if the liners are packed with
quartz wool (normally used for “dirty” environmental matrices), TCS will react with the material even if
it is deactivated and/or become adsorbed on it. Concerning the interface and source temperature,
through a Design Expert programme and comparing TCS peak areas, the best results were obtained for
the temperatures of 290 °C and 260 °C, respectively. The analyte peak area and shape are critical
parameters for the quantitative analysis. Thus, Q1 and Q3 resolution, collision gas pressure (mtorr) and
collision energy (eV) and dwell time (ms) were evaluated. The best results were achieved with Q1
resolution = 0.7 and Q3 resolution = 2, collision gas pressure at 2.4 mTorr, collision energy at 20eV and
a dwell time of 100 ms.
The detection and optimized method conditions were reported preliminary in Magro et al. (2017) and
comprehensively in Magro et al. (under preparation 2019b). For quantification purposes in effluent
matrices, a calibration curve was built, using standard concentrations that were expected to be found
in real samples: eight-points (20, 40, 80, 120, 240, 320, 400, 700) ng/L, with a correlation factor of R2 =
0.9801. For TCS analysis in effluent, a solid phase extraction method was optimized (Magro et al.
submitted 2019a). Thus, different pH values, spiking stirring time before extraction, volume elution with
different solvents, cartridges and syringe filters were evaluated. The best operational results concerning
the analyte recovery (95 ± 3%) were achieved using (1) pH = 2 (no precipitation of organic matter; TCS
in unionized form, less susceptible to photodegradation according to [31]); (2) 30 minutes of stirring
time and a 30 minutes pause prior to extraction; (3) MeOH/ACE as the extraction solvent; (4) cartridges
Oasis HLB; (5) PTFE syringe filters of (0.45 µm; 2% analyte loss). Six effluents (collected at two different

14
wastewater treatment plants at different times of the year) were analysed and TCS levels were found
of between 106 and 624 ng/L.

15
3.3 E-tongues to triclosan detection and quantification
E-tongues have been gaining greater attention in liquid matrices since 1997. There has been an increase
in the number of scientific articles, with several applications, although those whose focus is on the
detection of EOCs are still few and are applied to simplified solutions. However, as it was investigated
in Magro et al. (2019c), there is a high potential of e-tongues for qualitative and semi-quantitative multi-
analyte analysis in complex matrices. If the e-tongues are well built and properly trained they can be
used as tools for EOCs monitoring in aqueous environment matrices. The working electrodes in the e-
tongues array can be covered with films (coatings), improving the sensitivity of the electrical
measurements. The ability to tune the composition of nanostructured thin films allow for an
improvement in the sensor´s intrinsic (chemical or physical) properties for sensing applications. The
layer-by-layer (LbL) nano-assembly technique is a flexible, easily-scalable, reproducible and versatile
approach that allows the precise control of the coating thickness, composition and structure. This nano-
assembly technique is a powerful tool for the incorporation of a wide variety of coating types, such as
polyelectrolytes. Polyelectrolytes are polymers with ionizable functional groups that form charged
polyions (with an overall positive or negative charge). A substance with positively charged functional
groups, mostly quaternary ammonium or amino groups, is used as a polycation, for instance
poly(allylamine hydrochloride) (PAH) and poly(ethyleneimine) (PEI); whereas a substance with
negatively charged groups, mostly sulfonic acids or carboxylic acids, are the most common functional
groups used in polyanions, such as, poly(sodium 4-styrene sulfonate) (PSS). In preliminary works about
sensors for TCS detection, Pereira-da-Silva et al. (2019), Zagalo et al. (2019) and Magro et al. (2019h)
proved that if the outer layer is a negatively charged polyelectrolyte, less adsorption into the sensing
layers is observed. Additionally, the influence of the solution’s pH and ionic strength in the electrical
impedance measurements was demonstrated.
Magro et al. (submitted, 2019d) studied the e-tongue concept in an array of sensors based on uncoated
and coated gold interdigitated electrodes with (PAH/Graphene Oxide (GO))5 and (PEI/PSS)5 layer-by-layer
thin films. The main objective was to study the e-tongue performance (stability, detection and semi-
quantification) for TCS analysis in mineral water and secondary effluent matrices by measuring the
impedance spectra of the sensor device. The stability tests related with adsorption/desorption
phenomena revealed that: (1) (PAH/GO)5 LbL films should be used to analyse acid matrices with low
ionic strength, since the salts in the solution tend to discharge the GO film; (2) (PEI/PSS)5 LbL films
combination reveals potential to be employed in alkaline aqueous matrices, such as secondary effluent,
with high ionic strength; (3) uncoated gold sensors react with ions in the effluent and are damaged by
S and Zn elements, and therefore should be avoided for these type of matrices. The data showed that

16
increasing the thickness (number of bi-layers to 10 or 20) did not directly increase the potential to TCS
quantification. On the contrary, increasing the distance between the gold electrode and the outer layer
of film that interacted with the TCS molecules, decreased the electrical signal. The choice of target
sensing layers for each type of matrices is crucial to have a stable and robust device. Thus, if the highest
performance sensors (uncoated gold sensors for mineral water and (PEI/PSS)5 for effluent) are used for
the array’s composition, by means of Principal Component Analysis, it was possible to reach a device
capable of distinguishing between aqueous matrices (mineral water vs effluent) and discriminate TCS
according to its concentrations: (1) detection and semi-quantification of the target analyte in mineral
and secondary effluent for a range of concentration from 10-13 to 10-7M (0.3 ng/L - 30 μg/L); (2) device’s
sensitivity of 0.19 ± 0.02 per decade (~ limit of quantification); (3) device’s resolution of 0.13 pM (~ limit
of detection).

17
3.4 Multi-analyte e-tongue coupled to an electrochemical reactor
According to Magro et al. (submitted 2019d), a combination of (PEI/PSS)5 is suitable for TCS detection
and semi-quantification in a secondary effluent matrix. However, when the matrix’s pH is below 7,
desorption of the thin film occurred when immersed in the solutions. In this regard and taking into
account the fact that pH changes can occur in electrochemical remediation, stable thin films of TiO2 and
ZnO built up with the sputtering technique were considered to be part of the e-tongue’s sensorial
layers. Those films presented high mechanical stability under pH fluctuations. Magro et al. (submitted
2019e) reported a customized e-tongue, built up with an array of layer-by-layer and sputtering thin film
sensors. The aim of the array set-up was to access real time degradation in a dynamic electrochemical
flow reactor and provide a sensor that is capable of performing semi-quantification analysis for TCS and
its derivative by-products: DCP, TCP and MTCS. The e-tongue’s capability to “follow” the analytes
electro-degradation kinetics in a secondary effluent was supported by the data obtained using HPLC-
DAD. Monitoring and semi-quantitative analysis was accomplished using the sensor’s array for TCS and
MTCS. For DCP and TCP more accurate results were achieved using a single sensor device. These data
observations lead to the discussion of the importance of characterizing the nanomaterial used to
perform the impedance measurements. This characterization, using field emission scanning electron
microscope, allowed total understanding of the “sensorial” impedance response. The observations
supported that the “sensorial response” is related to the final morphology, structure and properties of
the thin films and their consequent interactions with the different EOCs’ physical-chemical behaviour
on the effluent matrix. For DCP and TCP (with molecular weight of 163 and 197 g/mol), the better
responses were achieved with the polyelectrolyte thin films (built with 5 bi-layers) or using a thin film,
built by sputtering technique (TiO2), but with low thickness (≤160 nm). For TCS and MTCS (with
molecular weight of 290 and 303 g/mol) detection and semi-quantification, the sputtering technique
with bilayers of semi conductive oxides (thickness = 713 nm) was the one giving better impedance
response. According to the experimental data, the thin films with more “hydrophobic character” should
be used for TCS and MTCS, the analytes with higher Log kow, whereas the more “hydrophilic” ones are
best suited for DCP and TCP, the analytes with lower Log kow.
Although sensors’ systems are becoming attractive to the market [32], as potential tools for
environmental monitoring, there is still a lack of information when these sensor devices are targeting
multi-analyte analysis. In Magro et al. (chapter under preparation 2019*), the drawbacks, advantages
and challenges of having electronic tongues coupled with electrochemical processes are discussed.

18

19
3.5 Electrokinetic Hydrogen self-energy generation
The hydrogen feedstock market has a total estimated value of €105 billion and is expected to grow in
the coming years, reaching €142 billion by 2022 [33]. Hydrogen is gaining a more prominent role as an
enabler of the clean energy transition. Technologies for H2 production are taking advantage of the
current market expansion, promoting their optimization and development to higher maturity levels.
One of the most established technologies for hydrogen production from renewable energy sources is
water electrolysis. Around 4 % of the global hydrogen supply is produced via electrolysis [33]. However,
due to the high production costs,H2 is still not economically competitive with other fuels [34] .
Hydrogen is a by-product of EK technologies and thus they can be part of hydrogen market production.
As in a symbiotic system, the remediation treatment can take the advantage of H2 market technologies
maturity trend, enhancing the technology readiness level (TRL) and minimizing, due to the potential of
energy generation, one of its drawbacks for scaling-up. As a novel feature, the H2 produced during the
treatment in the cathode compartment may be used as fuel in a proton-exchange membrane fuel cell
to produce electrical energy and reduce the energy costs of electroremediation processes. In this
context, the design of the ED reactor may be reconfigured with the incorporation of a gas collection
system that may avoid the H2 dissipation during remediation of the environmental matrices. Thus, the
H2 produced in the process can be collected and recovered to be used for different purposes.
Magro et al. (2019f) addressed the feasibility (proof-of-concept) of using the H2 produced by
electrochemically-induced remediation of secondary effluent and mine tailings matrices. The results
shown that the H2 captured and reused is promising because: (1) The H2 flow rate production is not
dependent of the matrix under treatment. No statistically significant differences between the matrices
were found when the highest current density was applied; (2) self-produced H2 achieved average
purities ranged between 73% and 98%; (3) for both matrices a stable open circuit voltage (~1V, cell
maximum nominal voltage) was generated by a proton-exchange membrane fuel; (4) treatment energy
savings of around 7% were reached (restriction due to fuel cell full capacity). This study supported that
the H2 purity, flow rate production and voltage generation are not directly affected by the matrices
under treatment, when a three compartment ED reactor was used. Moreover, some improvements can
be obtained. Thus, in the provisional patent application (2019), for its “designed reactor”, the H2 flow
rate was found to be 60% faster than in the conventional three compartments ED reactor. Also, for the
“designed reactor”, when H2 was directly collected from the matrix compartment, a similar level of gas
purity was achieved.

20
Additionally, Magro et al. (chapter under preparation 2019**), observed that for the conventional
reactor, if the salty water is replaced by effluent in a mine tailings suspension, the proton-exchange
membrane fuel voltage increases, as does its stability. A higher conductivity was measured, meaning
more free ions in the system, which directly affects the fuel cell efficiency. Furthermore, the removal
of hazardous contaminants and the recovery of critical raw materials can be enhanced (3% for Cu, 5%
for As, 22% for Sn and 27% for W), increasing their further reuse.

21
3.6 Potential of replacing freshwater by electro-treated effluent in construction materials
The construction industry already recognizes the value of improving resources productivity and
sustainability, namely in the replacement of cement and water sources [35]. However, the transition to
a more circular economy requires changes throughout value chains, from product design to new
business models, from new ways of turning waste into resources and by new modes of consumer
behaviour [36]. Nowadays, the increased demand for construction materials, as a result of global
growth, calls for an alternative way of developing construction materials from different sources. In this
perspective of “changing times”, Magro et al. (2019g) reported the feasibility of replacing freshwater by
electro-treated effluent in the production of mortars (construction materials). After the ED treatment
applied to an effluent, the data showed removal rates of 50-100% for cations, 85-99.7% for anions and
an acid final matrix pH, parameters that affect the quality and durability of materials. Using 50% and
100% of treated effluent in the materials mix showed higher setting times and workability, and similar
flexural/compressive strengths compared to the reference mortars.
To overcome the parameters that were different to the reference values, such as setting times,
workability and matrix final pH, a tuning reactor was developed: the provisional patent application
(2019) “designed reactor”. In this application an optimal combination was disclosed: acid media -
breaking complexes between elements; alkaline media - removing salts and electrodes in contact with
the contaminated matrices - promoting electro-degradation (see section 3.1). The design modifications
ensured that the alkaline pH does not change the setting time and workability values significantly.
Design differences do not affect the overall removal efficiencies. The removal process, for the “designed
reactor”, is slower compared to the three compartment reactors described in Magro et al. (2019g), but
the process became more easier to control. 99% of the salts removal was achieved in the conventional
reactor, but the “designed reactor” encompasses fewer hardness matrices in the end (approximately
70% of the elements removal) and offers a dynamic process which is easier to further work. It is
important to point out that all the parameters studied are key-factors for the standards in the
construction industry: EN 1015-3, EN-196 and EN 206-1 and NBR 15900. In addition, one of the positive
features of the final materials, when the product is used as a pre-treatment is the change in the colour
(grey to light brown – although not always, depending on the effluent source) or texture (rough to
softer) of the materials, which may, for instance, avoid the use of artificial pigments.
As one of the main objectives of this PhD project was to enhance maturity level of EK process
development, a market assessment was performed for provisional patent application (2019) “designed

22
reactor”. The TRL of the developed technology, on a scale of 1 to 7 is considered to be at level 3
(experimental proof of concept) to 4 (technology validated in laboratory), accordingly to the European
Commission definition.
The primary market assessment was built for three potential markets segments: construction materials
industry, municipal and industrial wastewater treatment plants. Following an 18 week study, the
construction materials industry was found to be the priority market for the reuse of treated secondary
effluent. There are several reasons for entering this market. First of all, the provisional patent
application reactor performance is higher in this segment. More precisely, after the cleaning process,
the treated effluent characteristics fulfil all the requirements stated by construction materials standards
(e.g. salt content, conductivity) that allows its use in the production of materials while ensuring a high-
quality concrete. Secondly, the analysis among the potential company’s stakeholders showed that entry
barriers are lower in the concrete production segment, in comparison with the wastewater treatment
segments. Thirdly, for the construction segment the novelty of the application is higher. Distributing
effluents to concrete batch plants and/or reuse this “reclaimed water”, with the ultimate goal of
producing high-quality concrete, is a practice which does not yet exist, accordingly to the conducted
research. However, the potential control of the water characteristics used to materials production was
seen as a feature that a client value significantly.
In a top-down approach, as the world’s demand for water will increase in the next few decades, making
the total market of construction companies located in the United States, the Middle East and Africa,
Europe and Asia more relevant. Therefore, in the market value simulations performed in the business
plan and market assessment (2018), multiplying the number of companies located in these four regions
(1 658 104) by the average reactor price (current water solutions product average price: €65 000)
equals a total market value of €108 billion. The target market considers construction companies in
which the need is already high. The water scarcity issue is higher in dry regions located in the Middle
East and Africa as well as in Asia. Asia has the most polluted water [37] in the planet and the biggest
concrete production accounting for 5 billion tons of concrete per year. Following the same logic, the
target market will have the size of €440 million. The size of the target market shows the potential for
starting the market entry strategy that will focus on scaling-up with an industrial partner in a win-win
solution, with the purpose of testing the hypothesis that a full-scale product is viable.

23
3.7 Future work
Despite the conclusions in the appended papers regarding the three main core subjects on this PhD
project, there are still gaps in the knowledge to be explored and some ideas to be developed, regarding
the full application of electrokinetic process for the degradation of emerging organic contaminants,
evaluation of new sensor systems for their monitoring and the viability of scaling-up electro-based
technologies. Thus, some of the most important topics for future work are summarized as follows:
o The independent manufacture of mixed metal oxide electrodes, to be used in the ED process,
should be evaluated. It is expected that at industrial level, significant additional costs may be
incurred due to the outsourcing of this manufacture. The building of electrodes in-house would
also be extremely important to have less dependency of electrodes production suppliers.
o The “sensorial” output impedance data are complex, demanding a time-consuming analysis. In
order to compare sensor systems and therefore, their performance and drawbacks, it is
important to develop of a standard analysis method. Additionally, it is needed a trained librarian,
to gather all the information from previous sensors measurements. If standardized data
treatment was employed in all research groups, the comparison between methods, sensors and
their characteristics would be more accurate.
o The efficiency of e-tongue multi-analyte quantification may improve if: (1) biosensors build up
with lipids are considered as sensing layers, since some EOCs are, e.g, TCS, lipophilic molecules;
(2) hybrid layers are developed, such as TiO2/PSS, that will provide a negative charge to the
outcome layer, resulting in “sensorial” signal increase.
o The study of increasing the nominal voltage of the proton-exchange membrane fuel and
understanding its full potential to feed a larger system.
o Regarding the provisional patent application “designed reactor”, the scaling-up is required to the
next phase in order to conduct tests on industrial mortars production in a construction company,
together with the reactor pilot implementation on the facility.
o One of the main obstacles in the EU wastewater reuse implementation is the price of wastewater.
In this PhD project, initial values were achieved in an integrated solution that includes:
wastewater as a raw material in a product reactor solution. However, we still do not fully
understand its behaviour on a larger scale. It is believed that the scaling-up on an industrial level
will improve the process, price and market knowledge. Additionally, a bottom-up approach
regarding the market size is also recommended for further actions.

24

25
References
[1] United Nations World Water Assessment Programme, The United Nations World Water Development Report 2018: Nature-Based Solutions for Water, Paris, 2018.
[2] EC, European Commission, Optimising water reuse in the EU - Final report, Part I, 2015. doi:10.2779/603205.
[3] C.G. Daughton, Non-regulated water contaminants: Emerging research, Environ. Impact Assess. Rev. 24 (2004) 711–732. doi:10.1016/j.eiar.2004.06.003.
[4] V. Geissen, H. Mol, E. Klumpp, G. Umlauf, M. Nadal, M. Van Der Ploeg, S.E.A.T.M. Van De Zee, C.J. Ritsema, Emerging pollutants in the environment: A challenge for water resource management, Int. Soil Water Conserv. Res. 3 (2015) 57–65. doi:10.1016/j.iswcr.2015.03.002.
[5] R. Halden, The Great Sewage Census in The Analytical Scientist, 79 (2019) 22–30. https://theanalyticalscientist.com/fields-applications/the-great-sewage-census.
[6] D.A. Brose, K. Kumar, A. Liao, L.S. Hundal, G. Tian, A. Cox, H. Zhang, E.W. Podczerwinski, A reduction in triclosan and triclocarban in water resource recovery facilities’ influent, effluent, and biosolids following the U.S. Food and Drug Administration’s 2013 proposed rulemaking on antibacterial products, Water Environ. Res. 91 (2019) 715–721. doi:10.1002/wer.1101.
[7] J. Chen, X. Meng, A. Bergman, R.U. Halden, Nationwide reconnaissance of five parabens, triclosan, triclocarban and its transformation products in sewage sludge from China, J. Hazard. Mater. 365 (2019) 502–510. doi:10.1016/j.jhazmat.2018.11.021.
[8] W. Hua, E. Bennett, R. Letcher, Triclosan in waste and surface waters from the upper Detroit River by liquid chromatography-electrospray-tandem quadrupole mass spectrometry, Environ. Int. 31 (2005) 621–630. doi:10.1016/j.envint.2004.10.019.
[9] D.C. McAvoy, B. Schatowitz, M. Jacob, A. Hauk, W.S. Eckhoff, Measurement of triclosan in wastewater treatment systems, Environ. Toxicol. Chem. 21 (2002) 1323–1329. doi:10.1002/etc.5620210701.
[10] L.W.B. Olaniyan, N. Mkwetshana, A.I. Okoh, Triclosan in water, implications for human and environmental health, Springerplus. 5 (2016). doi:10.1186/s40064-016-3287-x.
[11] L.M. Weatherly, J.A. Gosse, Triclosan exposure, transformation, and human health effects, J. Toxicol. Environ. Heal. - Part B Crit. Rev. (2017). doi:10.1080/10937404.2017.1399306.
[12] Food and Drug Administration, FDA issues final rule on safety and effectiveness of antibacterial soaps, US, DHHS - Department Of Health And Human Services, 2016.
[13] Food and Drug Administration, Safety and Effectiveness for Health Care Antiseptics; Topical Antimicrobial Drug Products for Over-the-Counter Human Use., US, DHHS - Department Of Health And Human Services, 2017.
[14] C.S. Bever, A.A. Rand, M. Nording, D. Taft, K.M. Kalanetra, D.A. Mills, M.A. Breck, J.T. Smilowitz,

26
J.B. German, B.D. Hammock, Effects of triclosan in breast milk on the infant fecal microbiome, Chemosphere. 203 (2018) 467–473. doi:10.1016/j.chemosphere.2018.03.186.
[15] J.-H. Guo, X.-H. Li, X.-L. Cao, Y. Li, X.-Z. Wang, X.-B. Xu, Determination of triclosan, triclocarban and methyl-triclosan in aqueous samples by dispersive liquid–liquid microextraction combined with rapid liquid chromatography, J. Chromatogr. A. 1216 (2009) 3038–3043. doi:10.1016/j.chroma.2009.02.021.
[16] M.E. Balmer, T. Poiger, C. Droz, K. Romanin, P.A. Bergqvist, M.D. Müller, H.R. Buser, Occurrence of Methyl Triclosan, a Transformation Product of the Bactericide Triclosan, in Fish from Various Lakes in Switzerland, Environ. Sci. Technol. 38 (2004) 390–395. doi:10.1021/es030068p.
[17] L. Xing, J. Sun, H. Liu, H. Yu, Combined toxicity of three chlorophenols 2,4-dichlorophenol, 2,4,6-trichlorophenol and pentachlorophenol to Daphnia magna, J. Environ. Monit. 14 (2012) 1677–1683. doi:10.1039/c2em30185g.
[18] Y.B. Acar, A.N. Alshawabkeh, Principles of Electrokinetic Remediation, Environ. Sci. Technol. 27 (1993) 2638–2647. doi:10.1021/es00049a002.
[19] H.I. Gomes, C. Dias-Ferreira, A.B. Ribeiro, Overview of in situ and ex situ remediation technologies for PCB-contaminated soils and sediments and obstacles for full-scale application, Sci. Total Environ. 445–446 (2013) 237–260. doi:10.1016/j.scitotenv.2012.11.098.
[20] P. Guedes, E.P. Mateus, N. Couto, Y. Rodríguez, A.B. Ribeiro, Electrokinetic remediation of six emerging organic contaminants from soil, Chemosphere. 117 (2014) 124–131. doi:10.1016/j.chemosphere.2014.06.017.
[21] P. Guedes, C. Magro, N. Couto, A. Mosca, E.P. Mateus, A.B. Ribeiro, Potential of the electrodialytic process for emerging organic contaminants remediation and phosphorus separation from sewage sludge, Electrochim. Acta. 181 (2015) 109–117. doi:10.1016/j.electacta.2015.03.167.
[22] A.R. Ferreira, N. Couto, P. Guedes, J. Pinto, E.P. Mateus, A.B. Ribeiro, Electrodialytic 2-compartment cells for emerging organic contaminants removal from effluent, J. Hazard. Mater. 358 (2018) 467–474. doi:10.1016/j.jhazmat.2018.04.066.
[23] M.H.M. Facure, L.A. Mercante, L.H.C. Mattoso, D.S. Correa, Detection of trace levels of organophosphate pesticides using an electronic tongue based on graphene hybrid nanocomposites, Talanta. 167 (2017) 59–66. doi:10.1016/j.talanta.2017.02.005.
[24] Y. Vlasov, A. Legin, A. Rudnitskaya, C. Di Natale, A. D’Amico, Nonspecific sensor arrays (“electronic tongue”) for chemical analysis of liquids (IUPAC Technical Report), Pure Appl. Chem. 77 (2005) 1965–1983. doi:10.1351/pac200577111965.
[25] C.R. Gagg, Cement and concrete as an engineering material: An historic appraisal and case study analysis, Eng. Fail. Anal. (2014). doi:10.1016/j.engfailanal.2014.02.004.
[26] S.A. Miller, A. Horvath, P.J.M. Monteiro, Impacts of booming concrete production on water resources worldwide, Nat. Sustain. 1 (2018) 69–76. doi:10.1038/s41893-017-0009-5.
[27] P.E. Josephson, Y. Hammarlund, Causes and costs of defects in construction a study of seven building projects, Autom. Constr. 8 (1999) 681–687. doi:10.1016/S0926-5805(98)00114-9.

27
[28] E. Lacasa, S. Cotillas, C. Saez, J. Lobato, P. Cañizares, M.A. Rodrigo, Environmental applications of electrochemical technology. What is needed to enable full-scale applications?, Curr. Opin. Electrochem. 16 (2019) 149–156. doi:https://doi.org/10.1016/j.coelec.2019.07.002.
[29] J. Lyndall, T. Barber, W. Mahaney, M. Bock, M. Capdevielle, Evaluation of triclosan in Minnesota lakes and rivers: Part I – ecological risk assessment, Ecotoxicol. Environ. Saf. 142 (2017) 578–587. doi:https://doi.org/10.1016/j.ecoenv.2017.04.049.
[30] J. Wang, D. Zhi, H. Zhou, X. He, D. Zhang, Evaluating tetracycline degradation pathway and intermediate toxicity during the electrochemical oxidation over a Ti/Ti4O7 anode, Water Res. 137 (2018) 324–334. doi:https://doi.org/10.1016/j.watres.2018.03.030.
[31] A. Lindström, I.J. Buerge, T. Poiger, P.A. Bergqvist, M.D. Müller, H.R. Buser, Occurrence and environmental behavior of the bactericide triclosan and its methyl derivative in surface waters and in wastewater, Environ. Sci. Technol. 36 (2002) 2322–2329. doi:10.1021/es0114254.
[32] K. Walia, Global IoT Sensor Market Report 2018-2025, 2019.
[33] IRENA, Hydrogen From Renewable Power: Technology outlook for the energy transition, Abu Dhabi, 2018. www.irena.org.
[34] P. Nikolaidis, A. Poullikkas, A comparative overview of hydrogen production processes, Renew. Sustain. Energy Rev. 67 (2017) 597–611. doi:10.1016/j.rser.2016.09.044.
[35] European Commission, Resource efficiency opportunities in the building sector, 2014. http://eur-lex.europa.eu/.
[36] A. Favier, C. De Wolf, K. Scrivener, G. Habert, A sustainable future for the european cement and concrete industry - Technology assessment for full decarbonisation of the industry by 2050, 2019. doi:10.3929/ethz-b-000301843.
[37] World Health Organization, National systems to support drinking-water, sanitation and hygiene: global status report 2019. UN-Water global analysis and assessment of sanitation and drinking-water (GLAAS) 2019 report, 2019.

28

Part II
“Of course, it is happening inside your head, Harry, but why on earth should that mean that it
is not real? “
– Albus Dumbledore, Harry Potter and the Deathly Hallows -


31
Paper
“Emerging organic contaminants in wastewater: Understanding electrochemical reactors for triclosan and its by-products degradation”
C Magro, EP Mateus, JM Paz-Garcia & AB Ribeiro
Published in: Chemosphere, 2019

32

Emerging organic contaminants in wastewater: Understandingelectrochemical reactors for triclosan and its by-products degradation
Catia Magro a, *, Eduardo P. Mateus a, Juan M. Paz-Garcia b, Alexandra B. Ribeiro a, **
a CENSE, Department of Sciences and Environmental Engineering, NOVA School of Science and Technology, NOVA University Lisbon, Caparica Campus, 2829-516, Caparica, Portugalb Department of Chemical Engineering, Faculty of Sciences, University of Malaga, Teatinos Campus, 29010, Malaga, Spain
h i g h l i g h t s g r a p h i c a l a b s t r a c t
Electrochemical degradation reactorsevaluation for triclosan and its by-products. Batch and flow reactors tested withtwo different anodes: Ti/MMO & Nb/BDD. Electro-batch reactor degradation ef-ficiencies from 43% - < detectionlimit in 4 h. Electro-batch reactor kinetics higherwith Ti/MMO used as anode. Electro-flow reactor degradation ef-ficiencies from 41 to 87% in 1 h.
a r t i c l e i n f o
Article history:Received 12 September 2019Received in revised form16 December 2019Accepted 23 December 2019Available online 30 December 2019
Handling Editor: Ignasi Sires
Keywords:Emerging organic contaminantsTriclosanBy-productsElectrochemical processElectrokineticsElectro-degradation
a b s t r a c t
Degradation technologies applied to emerging organic contaminants from human activities are one ofthe major water challenges in the contamination legacy. Triclosan is an emerging contaminant,commonly used as antibacterial agent in personal care products. Triclosan is stable, lipophilic and it isproved to have ecotoxicologic effects in organics. This induces great concern since its elimination inwastewater treatment plants is not efficient and its by-products (e.g. methyl-triclosan, 2,4-dichlorophenol or 2,4,6-trichlorophenol) are even more hazardous to several environmental compart-ments. This work provides understanding of two different electrochemical reactors for the degradation oftriclosan and its derivative by-products in effluent. A batch reactor and a flow reactor (mimicking asecondary settling tank in a wastewater treatment plant) were tested with two different working anodes:Ti/MMO and Nb/BDD. The degradation efficiency and kinetics were evaluated to find the best combi-nation of current density, electrodes and set-up design. For both reactors the best electrode combinationwas achieved with Ti/MMO as anode. The batch reactor at 7 mA/cm2 during 4 h attained degradationrates below the detection limit for triclosan and 2,4,6-trichlorophenol and, 94% and 43% for 2,4-dichlorophenol and methyl triclosan, respectively. The flow reactor obtained, in approximately 1 h,degradation efficiencies between 41% and 87% for the four contaminants. This study suggests an alter-native technology for emerging organic contaminants degradation, since the combination of a low
Abbreviations: BDD, Boron-doped diamond; DCP, 2,4-dichlorophenol; EBR, Electrochemical Batch Reactor; EFR, Electrochemical Flow Reactor; EOCs, emerging organiccontaminants; MTCS, methyl-triclosan; MMO, Mixed metal oxides; TCP, 2,4,6-trichlorophenol; TCS, triclosan.* Corresponding author.** Corresponding author.E-mail addresses: [email protected] (C. Magro), [email protected] (A.B. Ribeiro).
Contents lists available at ScienceDirect
Chemosphere
journal homepage: www.elsevier .com/locate/ chemosphere
https://doi.org/10.1016/j.chemosphere.2019.1257580045-6535/© 2019 Elsevier Ltd. All rights reserved.
Chemosphere 247 (2020) 125758

current density with the flow and matrix induced disturbance increases and speeds up the compounds’elimination in a real environmental matrix.
© 2019 Elsevier Ltd. All rights reserved.
1. Introduction
The world’s rapid population growth over the last century hasbeen a major factor into the demand for water resources usage andreuse. To overcome these water challenges, water contaminationmust be taken into account. Recently, the environmental qualitycriteria of water resources have been linked to a new class ofenvironmental pollutants, the emerging organic contaminants(EOCs), a reality that has increased the need for sustainable toolsthat guarantee their quality and safety standards, enable theirmonitoring and promote the prosperity of a healthy population andenvironment (Corcoran et al., 2010). EOCs are defined as “chemicalsubstances that have no regulation and are suspected to negativelyaffect the environment or whose effects are unknown” (Daughton,2004; Geissen et al., 2015). Among EOCs, triclosan (TCS, 2,4,40-tri-chloro-20-hydroxydiphenyl ether) is an antimicrobial agent that hasbeen used for more than 50 years as an antiseptic, disinfectant orpreservative in clinical settings and several consumer products. TCShas been detected in wastewater treatments plants (Brose et al.,2019; Chen et al., 2019; Halden, 2019) and in surface water (Huaet al., 2005; McAvoy et al., 2002). Recent reviews on TCS recountnumerous health effects ranging from endocrine-disruption touncoupling mitochondria (Olaniyan et al., 2016; Weatherly andGosse, 2017). Although in 2016 the US Food and Drug Administra-tion banned TCS from certain wash products, namely hand soapand body wash (Food and Drug Administration, 2016) and hospitalproducts by the end of 2018 (Food and Drug Administration, 2017),it is permissible to have TCS in e.g. toothpastes, cosmetics, clothesor toys (Bever et al., 2018). Furthermore, TCS derivates, such as themetabolite methyl-triclosan (MTCS) (Guo et al., 2009), which iseven more persistent (Balmer et al., 2004) and TCS by-products,formed by repeated exposure to chlorine in water such as 2,4-dichlorophenol (DCP) and 2,4,6-trichlorophenol (TCP) are alsounder concern, since they present health risk to humans and arerecognized as persistent priority pollutants in the United States,Europe and China (Xing et al., 2012).Several clean-up technologies have been developed and used to
improve the quality and safety of water reuses. Among thesetechnologies, the electrochemically-induced advanced oxidationprocesses (e.g. Fenton’s reaction and anodic oxidation) have beenreceiving special attention (Glaze et al., 1987; Oturan and Aaron,2014; Panizza and Cerisola, 2009). Another alternative is the elec-trokinetic process which is based on the application of a low-leveldirect current between a pair of electrodes, that in addition toremove contaminants from the contaminated matrix by electricpotential also promotes the generation of OH and therefore en-hances the oxidation of EOCs. This technology proved to be efficientin the degradation of EOCs in soil (Guedes et al., 2014), sludge(Guedes et al., 2015) and effluent (Ferreira et al., 2018). The optimalcombination between the electrode materials (e.g. titanium/mixedmetal oxides (Ti/MMO), boron-doped diamond (BDD), platinum)and the reactor design are key factors, since the oxidation process isdependent on the materials nature and the reactor workability(Schranck and Doudrick, 2020; Walsh and Ponce de Leon, 2018).Regarding the reported works on different electrode materials andbatch/flow reactors, Ren et al. (2016) presented a vertical-flowelectro-Fenton reactor, composed of 10 cell compartments using
PbO2 anode and modified graphite felt mesh cathode for thedegradation of tartrazine, reaching with the optimal conditions,TOC removal efficiency of 100%. Perez et al. (2017) studied amicrofluidic flow-through electrochemical reactor for wastewatertreatment that achieved, with diamond anodes, complete miner-alization of clopyralid spiked in a low-conductive matrix. Wanget al. (2019) reported a continuous-flow reactor for electro-chemical oxidation of various alcohols using a carbon anode, where800 mA enabled effective oxidation up to 99% yield in 10 min.Moreover, comparative studies in electrodes combinations weredescribed: Yoon et al. (2012) reported a flow reactor for the elec-trochemical degradation of phenol and 2-chlorophenol using Pt/Tiand BDD electrodes, as well as Ambauen et al. (2019) comprised anelectrochemical oxidation batch reactor for salicylic acid degrada-tion with BDD and Pt electrodes. In both studies similar removalrates in the different electrodes combinations were attained,showing that not only the electrodes type highly influence thecompounds degradation efficiencies, but also the physicochemicalcharacteristics of the contaminants to be degraded. BDD and MMOhave been mainly and equally used as anodes (Moreira et al., 2017),both showing similar performances in the degradation efficiency(Brillas and Martínez-Huitle, 2015; Skoumal et al., 2008; Yoon et al.,2012). BDD was reported as electrochemical inactivator of phenoliccompounds (Sires et al., 2007; Wang and Farrell, 2004), and Ti/MMO was used to degrade organic contaminants in wastewater(Yuan et al., 2013).The aim of this study was to carry out an experimental elec-
trochemical treatment for the degradation of TCS and its by-products MTCS, DCP and TCP, in a real wastewater matrix: a sec-ondary effluent. A batch reactor was the starting core, with ex-periments on (1) electrodes combination (Ti/MMO as anode andcathode; BDD/Nb as anode and Ti/MMO as cathode); (2) currentdensities; (3) degradation kinetics. Furthermore, a flow reactor,designed to mimic a secondary settling tank in a wastewatertreatment plant, was introduced to find a system that has the po-tential for operational implementation.
2. Materials and methods
2.1. Chemical, standards and effluent characteristics
TCS (99%), MTCS (99%), DCP (98%) and TCP (98%) were pur-chased from SigmaeAldrich (Steinheim, Germany), see Table S1, atsupplementary data. Individual stock solutions for calibrationpurposes were prepared with 1000 mg/L in methanol and storedat 18 C. The methanol, acetonitrile, acetone and formic acid usedwere from SigmaeAldrich (Steinheim, Germany) in gradient gradetype. Water (Type I) was from a Millipore system (Bedford, MA,USA). The effluent used was the liquid fraction collected in thesecondary settling tank at a wastewater treatment plant (Lisbon,Portugal). Effluent samples were collected in April and May and itsinitial characterization, for future works comparison, is presentedin Table S2, at supplementary data.
C. Magro et al. / Chemosphere 247 (2020) 1257582

2.2. Methods
2.2.1. Electrochemical degradation reactorsTwo different set-ups are represented in Fig. 1. The experiments
were carried out in an electrochemical batch reactor (EBR) and inan electrochemical flow reactor (EFR). The electrodes used weremade of Ti/MMO Permaskand wire: Ø ¼ 3 mm, L ¼ 80 mm(Grønvold & Karnov A/S, Denmark) and Nb/BDD plate: H ¼ 50 mm,L ¼ 80 mm, T ¼ 1 mm (Neocoat, Switzerland), assembled indifferent configurations (as anode or as cathode). A power supplyE3612A (Hewlett Packard, Palo Alto, USA) was used to maintain aconstant current in the electrochemical reactors and the voltagewas monitored. The volume of effluent treated was approximately500 mL for each reactor. The effluent flow (9 mL/min) in the EFRwas maintained by a peristaltic pump (Watson-Marlow 503 U/R,Watson-Marlow Pumps Group, Falmouth, Cornwall, UK).All electrochemical experiments were carried out in duplicate,
in dark conditions, and at a controlled room temperature of 22 C,according to the conditions presented in Table 1. Control experi-ments, without applying current, were also carried out. During theexperiments, the pH was measured with a Radiometer pH-electrode EDGE (HANNA, USA) and the conductivity with a Radi-ometer Analytic LAQUA twin (HORIBA Ltd., Japan). In both reactors(EBR and EFR) the matrix was spiked with the four compoundsunder study (TCS, MTCS, DCP and TCP), in order to monitor theirdegradation process (0.8 mg/L for each). To assess EOCs removalkinetics in the EBR, samples were collected every 15 min, during
4 h. For EOCs determination and quantification, initial and finalsamples were extracted following the procedures described insection 2.2.2.
2.2.2. Instruments and analytical proceduresThe effluent initial characterization was performed for the
following chemical parameters: Chemical Oxygen Demand, COD(determined by volumetric method after a previous oxidation withpotassium dichromate in an open-reflux, at 160 C, in an acidicenvironment, for 60 min); biological oxygen demand, BOD5(determined by using a specific probe: OxiTop IS6, GlobalW GoldRiver, CA, USA); Total P concentration was determined by Induc-tively Coupled Plasmawith Optical Emission Spectrometry, ICP-OES(HORIBA Jobin-Yvon Ultima, Japan), equipped with generator RF(40.68 MHz), monochromator Czerny-Turner with 1.00 m(sequential), automatic sampler AS500 and dispositive CMA-Concomitant Metals Analyzer. Cl, NO3 and SO42 were analyzedby Ion Chromatography, IC (DIONEX ICS-3000, USA), equippedwithconductivity detector.The extraction of the analytes in the effluent was performed by
solid-phase extraction using Oasis HLB (200 mg, 6 mL; WatersCorporation, Saint-Quentin-en-Yvelines Cedex, France). The solid-phase extraction cartridges were conditioned by washing with3 (6mL) of methanol, followed by re-equilibriumwith 3 (6 mL)of Milli-Q water. For organic compounds enrichment, the sampleswere acidified to pH ¼ 2 before extraction using nitric acid. The200 mL aqueous samples were passed through the cartridge at a
Fig. 1. Electrochemical reactors under study: (a) case 1 Ti/MMO as anode and cathode; (b) case 2 Nb/BDD as anode and Ti/MMO as cathode (EBR and EFR related to ElectrochemicalBatch Reactor and Electrochemical Flow Reactor, respectively).
C. Magro et al. / Chemosphere 247 (2020) 125758 3

flow rate of approximately 10 mL/min by applying a moderatevacuum, followed by a dried period of approximately 3 min byvacuum. The retained analytes were eluted sequentially with2 (4 mL) of methanol and 1 (4 mL) of acetone, conferring aconcentration factor of 16.7x to the analysis.Determination of the target compounds was performed in an
Agilent 1260 Infinity II high-performance liquid chromatography(HPLC) equipped with a quaternary pump and auto-sampler, and adiode array detector (DAD)/fluorescence detector 1100 Series(Agilent Technologies Inc., USA). An EC-C18 column (InfinityLabPoroshell 120 High Efficiency with 4.6 mm 100 mm, 2.7 mm,Agilent Technologies Inc., USA) was used. All HPLC runs were per-formed at a constant flow (1.5 mL/min), in gradient mode, with theoven set to 36 C. A mixture of acetonitrile/Milli-Q water/formicacid was used as eluents (A: 5/94.5/0.5% and B: 94.5/5/0.5%) with agradient of 60% of B (0e2 min) followed by 97% of B (2e3.5 min)and 98% of B until 5 min. Calibration curve was performed in therange between 0.5 and 20.0 mg/L. The limits of detection andquantification in this work were, respectively, 0.7 and 2.0 mg/L forTCS, 1.3 and 3.9 mg/L for MTCS, 0.7 and 2.0 mg/L for DCP, 1.0 and3.0 mg/L for TCP. Recovery tests were made with fortified effluentfor 1 h of contact time (30 min of slow agitation). The recoverypercentages were between 62 and 120% in all cases. The same HPLCsystem was used to monitor the EOCs’ degradation rates and ki-netics behavior. The percentage of degradation was calculated ac-cording to Equation (1):
1 Final EOC mg=LInitial EOC mg=L
100 (1)
Themineralization of EOCswas analyzed from the decay of theirtotal organic carbon, TOC, which was determined on a Vario TOCselect analyzer (Elementar, Langenselbold, Germany), after filtra-tion using 0.70 mm membrane filters. The screen and diagnostic ofnew peaks related to compounds formed after the electrochemicaltreatments was performed by liquid chromatography/mass spec-trometry (LC/MS)L, LC Agilent 1200 Series with Binary pump - MSAgilent 6130 B Single Quadrupole (Agilent Technologies Inc., USA).All sample analysis was carried out in duplicate. The statistical
data obtained was analyzed by the GraphPad Prism version 8.0e.Statistically significant differences among samples for 95% level ofconfidence were calculated through t-test on way and ANOVA.
3. Results and discussion
In the following section, electrochemical reactors for thedegradation of EOCs in effluent were tested (cases according toTable 1 conditions), correspondingly:
i. EBR was tested to find the best current for both electrodes’combination: Cases 1 and 2;
ii. EBR degradation kinetics was studied for the most appro-priated current, for both electrodes’ combination: Cases 1and 2; electro-byproducts were investigated as well.
iii. EFR degradation was studied for both electrodes combina-tion: Cases 1 and 2, in order to have a final decision onwhichone is the best option for a reactor operationalimplementation.
3.1. Electrochemical treatment evaluation
3.1.1. Electrochemical batch reactor (EBR): pH, conductivity andvoltageTable 2 presents the pH, conductivity and voltage measured at
the beginning and after 4 h of the EBR treatment.In the control experiments (data not shown) there were no
significant pH and conductivity changes in the effluent. pHwith theTi/MMO as anode remained approximately constant, whereas forNb/BDD as anode, acidification occurred, as the applied currentincreased (initial vs final at different pH: p value ¼ 0.001e0.01 at95% of confidence level). This indicates that Nb/BDD anode has abetter tendency for water oxidation promoting, the acidification ofthe media (pH decreases from around 8 to 3.8).The conductivity of the matrix increased in the experiment with
the highest current density and only when using Nb/BDD as anode.The degradation process may cause the presence of more ions insolution, and consequently higher conductivity at the end of theexperiments. The voltage drop behavior is in accordance with thechanges observed in the conductivity. A slight variation of voltagebetween theworking electrodes was observed in all cases, except inthe control assay, related to the changes in conductivity due toelectrolysis reactions. Concentration profiles within the reactorwere observed, indicating that mixing could play an effect on en-ergy requirements.
3.1.2. Electrochemical batch reactor (EBR): current densityFig. 2 shows the removal of the target EOCs, measured as the
Table 1Experimental scheme: evaluated parameters.
Current density at anode(mA/cm2)
Kinetics study Reactor type
Case 1: Ti/MMO as anode and cathode 2, 3, 7, 14 7 mA/cm2 EBRCase 2: Nb/BDD as anode and Ti/MMO as cathode 2, 4, 8.5, 10 10 mA/cm2 EBRCase 1: Ti/MMO as anode and cathode 7 e EFRCase 2: Nb/BDD as anode and Ti/MMO as cathode 10 e EFR
Table 2pH, conductivity and voltage before and after the EBR treatment during 4 h, with Ti/MMO or Nb/BDD as anode.
Current density at anode(mA/cm2)
pH Conductivity(mS/cm)
Voltage (V)
Initial 8.3 ± 0.1 1.2 ± 0.2 13.7 ± 7.6
Ti/MMO2 8.0 ± 0.1 0.7 ± 0.1 6.5 ± 0.63 7.9 ± 0.1 1.0 ± 0.5 9.4 ± 3.57 8.5 ± 0.5 1.1 ± 0.1 14.2 ± 0.8C
14 8.5 ± 0.6 1.0 ± 0.0 17.6 ± 5.6
Initial 8.4 ± 0.2A 1.4 ± 0.9 15.4 ± 10.2
Nb/BDD2 7.0 ± 0.0B 1.1 ± 0.5 9.6 ± 1.94 5.8 ± 1.3a 1.0 ± 0.5 11.0 ± 0.18.5 3.9 ± 0.0a,b 1.2 ± 0.2 25.0 ± 5.410 3.8 ± 0.1a,b 2.4 ± 0.2 12.0 ± 1.4c
Statistical analysis: Multiple comparisons were statistically performed at p < 0.05;data with lower case letters are statistically significantly different from the oneswith the same capital letter.
C. Magro et al. / Chemosphere 247 (2020) 1257584

percentage of degradation. Control experiments showed nodegradation. As the experiments were carried out in dark condi-tions, photodegradation was not taking place. Compound volatili-zation from effluent is not expected to be an important degradationprocess based on the estimated Henry’s law constant of the studiedcompounds (kH > 10
6) (Table S1 at supplementary data). Thus, thedegradation rates are attributed namely to (1) biotic factors, (2)direct anodic oxidation, and (3) indirect oxidation in the liquid bulk.Direct anodic oxidation occurs as the contaminants get in contactwith anode surface and are destroyed by the electron transfer re-action. Indirect oxidation in the liquid bulk is mediated by the ox-idants that are formed electrochemically, such as chlorine,hypochlorite, hydroxyl radicals, ozone and hydrogen peroxide(Klavarioti et al., 2009). Also, if the pH during the experiments isgreater than EOC’s pKa (Ti/MMO 7 and 14mA/cm2), the compoundswere in their ionized form, more susceptible to degradation(Chianese et al., 2016).In a simpler design as EBR (Fig. 1), the main removal mechanism
is the electro-degradation that corresponds to compounds’ oxida-tion and reduction. At the anode, the EOCs suffer both direct andindirect degradation whereas, in the cathode, only indirect degra-dation will occur. As mentioned before, in the case 2 experiments(4, 8.5, 10 mA/cm2, with Nb/BDD as anode) the pH turned acidic,thus, the hydroxyl radical had a standard reduction potential of2.8 V (OH þ e þ Hþ¼H2O). In the case 1 experiments the alkalinepH decreases the standard reduction potential to 1.8 V(OH þ e ¼ OH). Moreover, chemical structures (Table S1 atsupplementary data) and reactivity will play a role in the degra-dation process. For instance, the phenolic ring of TCS can be acti-vated by the two O-containing groups and may be attacked by OHradicals, with production of hydroxylated TCS (Yuan et al., 2013). Inboth cases 1 and 2, TCS was degraded below its detection limit.Additionally, if an aromatic molecule carries an aliphatic side chain,O- attacks there by H abstraction whilst OH adds preferentially tothe aromatic ring (applied to TCS in its ionized: EBR experimentswith 7 and 14mA/cm2) (Buxton et al., 1988). Performing a statisticalcomparison with a one-way t-test, with 95% confidence, for thehighest current densities, in case 1 (Ti/MMO as anode at 14 mA/cm2) and case 2 (Nb/BDD as anode at 10 mA/cm2) regarding theremoval rates, Ti/MMO is slightly better at the degradation of TCP(<LOD and ~91%, with a p value ¼ 0.0061). BDD is clearly moreefficient at degrading MTCS (~47%e84% with a p value ¼ 0.015).According to the above data, the decision for the best current
density in the following sections were based on: (1) Ti/MMO anode,7 mA/cm2 was chosen because either less intermediate peaks (by-
products formed after electro-degradation) were detected in theLC/MS analysis or also, in the case of the highest current tested, theratio between the energy consumption and the degradation rateswere similar and less costly; (2) Nb/BDD anode, 10 mA/cm2 waschosen due to the higher degradation observed for MTCScompound.
3.1.3. Electrochemical batch reactor (EBR): degradation kineticsNormalized decay of concentration as a function of time over
4 h, for the two electrodes combination at the best current densityconditions, are present in Fig. S1 at supplementary data. Consid-ering a pseudo first-order degradation for all contaminants, thecorresponding law rate can be written as Equation (2):
LnðC = C0Þ¼ kt (2)
where k (min1) is the apparent constant rate of the reaction.According to experimental data, Table 3, the EOCs removal
follow a pseudo first-order kinetics (R2 0:9).From the kinetics obtained it is possible to estimate that the
contaminants removal starts immediately after the application ofthe electric current (see Fig. S1 at supplementary data). The fastestrate was achieved with Ti/MMO for TCS and the slowest for MTCS inboth electrodes combination (Table 3). Comparing both anodes, thedegradation velocity is lower with Nb/BDD that also presentsidentical degradation rates for all the analytes under study,showing amore constant degradation velocity behavior. The higheradsorption’s strength of OH radicals on each electrode surface(adsorption enthalpy) the lower oxidizing power (Kapałka andComninellis, 2009). Even though, the BDD electrodes are wellknown by their high oxidizing power (Alfaro et al., 2006; Kapałkaet al., 2008; Kapałka and Comninellis, 2009), the presence ofchloride species can slow down the electrodes performance in theEOCs degradation, and therefore the indirect oxidation by active
Fig. 2. Emerging organic contaminants degradation with different currents intensities: (a) case 1: Ti/MMO as anode and cathode; (b) case 2: Nb/BDD as anode and Ti/MMO ascathode; during 4 h treatment (error bars related to the standard deviation: n ¼ 2; TCP - 2,4,6-trichlorophenol; DCP - 2,4-dichlorophenol; TCS e triclosan; MTCS - methyl-triclosan).
Table 3Pseudo first-order kinetics (LnðC =C0Þ ¼ kt) of EOCs removal through (k x 102h1).
Anode Ti/MMO anode at7 mA/cm2
Nb/BBD anode at10 mA/cm2
EOCs k R2 k R2
TCP 1.67 0.94 0.61 0.96DCP 1.97 0.92 0.60 0.99TCS 7.61 0.97 0.60 0.90MTCS 0.44 0.91 0.60 0.97
C. Magro et al. / Chemosphere 247 (2020) 125758 5

chlorine species may not occur (Anglada et al., 2009; Mascia et al.,2007; Pereira et al., 2015; Scialdone et al., 2009).Following the kinetics, it is important to mention that EOCs
degradation was considered as the elimination of parent organiccompound. The parent compound loss indicates transformation atan unknown degree, and not necessarily mineralization (thatshowed in section 3.1.4), where sometimes the by-products can bemore harmful than the parent compounds. In this sense, theexperimental samples were screened by LC/MS. Comparing Ti/MMO and Nb/BDD as working anodes, the latter presents possibleby-products from electro-EOCs degradation pathways, while theformer produced no detectable by-products (results not shown).The degradation of TCS in chlorine matrices (effluent initial Cl
concentration was 192.6 ± 83.9 mg/L) led to the formation of twotetra- and one penta-chlorinated hydroxylated diphenyl ether, aswell as 2,4-dichlorophenol. Chlorination of the phenolic ring andcleavage of the ether bond were identified as the main triclosandegradation pathways (Canosa et al., 2005). Free chlorine mediatedoxidation of triclosan leads to the formation of chloroform andother chlorinated organics (Fiss et al., 2007; Rule et al., 2005).Therefore, TCS is assumed as the main contributor for the identifiedby-products, since the other three EOCs are TCS natural by-products or metabolite. Thus, the diagnostic of ions masses incase 2 (10 mA/cm2) were screened and estimated from the profileisotopes of a mass spectrum: ion 128 with one hydroxyl and onechlorine in the phenolic ring, 161 and 196 ions (from TCS ringbreaking or from spiking DCP and TCP), 177 ionwith two hydroxylsand two chlorines that are not possible to conclude the position onthe ring, and 272 ion corresponding to TCS losing the hydroxyls.Due to the obtained data, a more thorough study is needed to assessthe exact mechanisms pathways for the four compounds understudy, when an electrochemical treatment is applied.
3.1.4. Electrochemical flow reactor (EFR): emerging organiccontaminants degradation at the best conditionsAn EFR reactor, mimicking the secondary settling tank in a
wastewater treatment plant was developed and tested. The EFR hada flow rate of 9 mL/min, meaning 55 min of retention time to every500 mL of a batch of effluent spiked with EOCs. The path of theeffluent goes through an internal chamber where the electricalcurrent is being applied, followed by a second chamber, the reactoroutlet (Fig. 1). Using a flow will have significant effect on theoxidation rates, since it can enhance the mass transport of organicspecies to the electrode surface where they undergo oxidationmainly by the hydroxyl radicals, and increase the turbulence in thesystem, that is, at that moment, hydrodynamic.Table 4 presents the effluent pH, conductivity and voltage before
and after the EFR treatment, where there were no statisticallysignificant differences between these parameters, contrarily to EBRtreatment (see Table 2). All the parameters remained approxi-mately constant.Fig. 3 shows the removal of the target EOCs. Similar to the EBR,
the photodegradation and compound volatilizationwere not takingplace in the degradation process, thus the degradation only occursdue to the direct anodic oxidation or indirect oxidation in the liquid
bulk.Accordingly, in approx. 1 h of electrokinetic treatment, the set-
up achieved degradation rates for TCP 61% (± 7%), DCP 41% (±1%), TCS 87% (± 1%) and, MTCS 41% (± 1%) when Ti/MMO was usedas the working anode. The lower rates observed for DCP may beexplained by the hypothesis that, due to the TCS degradation path,DCP will be formed when the OH radicals attached the phenolicring (Yuan et al., 2013). Comparing the degradations rates in case 1and 2, there are statistically significant differences at 95% confi-dencewhen different anodes are used: for TCP p value¼ 0.0196, forDCP p value ¼ 0.0079 and for TCS p value ¼ 0.0055. However, forMTCS degradation in both cases 1 and 2, no statistically significantdifferences were found. MTCS degradation data, points out for thecompound’s dependency in the matrix composition and treat-ment’s retention time. Regarding the removal rates of TCS, DCP andTCP when Nb/BDD was used as anode in the EFR treatment, someclarifications can be pointed out: (1) processes such as polymeri-zation of phenolic compounds on the electrode surface can occur,thus decreasing the performance of the electrode; (2) formation oforganochloride molecules that are resistant to degradation(Korshin et al., 2006); (3) in alkaline conditions (end pH around 7.1)the Nb/BDD reacts with hydroxide (OH), which can recombinewith OH to form H2O. At alkaline pH and lower current densities,the abundance of OH retarded the oxidation of compounds by OH(Hayashi et al., 2016); (4) additionally, though not observed incurrent work, at alkaline conditions the surface morphology of Nb/BDD may also change, producing inhibitory conditions for organicoxidation, and ultimately degrading the Nb/BDD surface(DeClements,1997; Gonzalez-Gonzalez et al., 2010; Griesbach et al.,2005). Wachter et al. (2019) also observed a decrease in theremoval efficiencies using Nb/BDD as anode, when lower appliedcurrent densities (5 and 10 mA/cm2) and pH 10 were combined.In order to understand the dynamics of the degradation process
between the two tested reactor designs, an estimation of the fourEOCs was performed in the EBR using the pseudo first-order ki-netics for 1 h treatment. Thus, the data suggested (estimationsvalues obtained from Fig. S1, at supplementary data) that EFR leadsto an improvement of degradation for TCP (EBR 45% vs EFR 61%),DCP (EBR 28% vs EFR 41%), and MTCS (EBR 12% vs EFR 41%), whenTi/MMO was used as working anode. In the case 2, Nb/BDD asanode, only MTCS (EBR 20% vs EFR 49%) increased its degradationusing a dynamic system. For TCS, the degradation occurs in bothanodes from the first 15 min on, however the degradation betweenthe flow vs the batch reactors are not statistically different.The Total Organic Carbon, TOC was analyzed for the different
electrode combination (Ti/MMO anode, 7 mA/cm2 and Nb/BDDanode, 10 mA/cm2) in both EBR and EFR treatments. The potentialto mineralization was given by comparison data from the TOC inthe initial inlet (effluent spiked with EOCs) and the TOC data of thefour experiments. Therefore, the TOC decay when Ti/MMO is usedas working anode with 7 mA/cm2 in EBR and EFR was 36% and 27%,respectively, in effluent. If Nb/BDD is used as working anode with10 mA/cm2 in EBR and EFR was 30% and 22%, respectively ineffluent. Accordingly, the Ti/MMO as anode seems to present moreefficiency to mineralization of the compounds under study.
Table 4The pH, conductivity and voltage before and after EFR treatment during 1 h.
Anode Current density at anode(mA/cm2)
pH Conductivity(mS/cm)
Voltage (V)
Ti/MMO 7 initial 7.6 ± 0.5 1.6 ± 1.0 14.5 ± 2.2end 7.6 ± 0.6 1.2 ± 0.5 13.4 ± 2.8
Nb/BDD 10 initial 7.3 ± 0.0 2.3 ± 0.0 16.8 ± 6.4end 7.1 ± 0.0 1.5 ± 0.4 13.8 ± 3.3
C. Magro et al. / Chemosphere 247 (2020) 1257586

Wachter et al. (2019) reported that, for a complete TOC removalmany oxidation steps, higher current densities and longtimetreatment should be applied. A non-dependence of the TOCremoval rate on the electrodes characteristics may be expected for asystemwhere the organic molecule and its oxidation intermediatesare oxidized on the anode surface. The results obtained in thepresent work were in agreement with those reported by theMedeiros de Araújo et al., 2014 on the mineralization of the dyeRhodamine B and Souza et al. (2016) on the mineralization of theDCP.In terms of reactor design, EFR using Ti/MMO anode could be a
valid choice to a scale-up reactor for EOCs degradation, both by afinancial point of view (Ti/MMO cheaper compared to Nb/BDD), anenergy consumption perspective (lower current density, samedegradation rates; energy consumption according to Portugueseenergy price for householders (0.2154 V) and the kWh required forthe EBR and EFR treatments: 0.0014 V for EBR using Ti/MMO anodeand 0.0029 V using Nb/BDD anode or for EBR 0.0003 V for EFRusing Ti/MMO anode and 0.0009 V using Nb/BDD anode, werecalculated), but also due to the faster degradation kinetics (whent ¼ 1; LnðC =C0Þ ¼ k ). Furthermore, according to LC/MS anal-ysis, no detectable by-products were observed with this set-up.
4. Conclusion
Applied to a secondary effluent, two different electrochemicalreactors were tested for the degradation of triclosan and its de-rivative by-products: methyl-triclosan, 2,4-dichlorophenol and2,4,6-trichlorophenol. The compounds elimination promoted bytwo different anodes, Ti/MMO and Nb/BDD, in the electrochemicalbatch reactor and in the electrochemical flow reactor were evalu-ated. In both reactors the best electrode combination was accom-plished with Ti/MMO, presenting faster kinetics degradation andless dependency on electrical current, achieving similar elimina-tions with a cheaper electrode. In the batch reactor at 7 mA/cm2,during 4 h, the degradation rates were below the detection limit fortriclosan and 2,4,6-trichlorophenol, and 94% and 43% for 2,4-dichlorophenol and methyl triclosan. In the flow reactor, in a 1 htreatment, the degradation efficiencies varied from 41% to 87% forthe four contaminants under study. Electrochemical flow reactorimplementation inwastewater treatment plants may be consideredas viable option from an operational point of view. The combinationof a low current density with the flow, and induced matrixdisturbance, increased and speed up EOCs degradation.
Author contribution
Catia Magro: Conceptualization; Methodology; Writing - Orig-inal Draft; Writing - Review & Editing; Software; Investigation,Eduardo P. Mateus: Validation; Supervision; Resources; Writing -Review & Editing, Juan Manuel Paz-Garcia: Validation; Supervi-sion;Writing - Review& Editing; Alexandra B. Ribeiro:Validation;Supervision; Writing - Review & Editing; Funding acquisition;Resources.
Acknowledgements
This research was funded by Fundaç~ao para a Ciencia e Tecno-logia through projects UID/AMB/04085/2019, UID/FIS/00068/2019and PTDC/FIS-NAN/0909/2014. This work has received fundingfrom the European Union’s Horizon 2020 research and innovationprogramme under the Marie Skłodowska-Curie grant agreementNo. 778045. C Magro acknowledges Fundaç~ao para a Ciencia e aTecnologia for her PhD fellowship SFRH/BD/114674/2016. Paz-Garcia acknowledges the financial support from the ExcellenceNetwork E3TECH under project CTQ2017-90659-REDT (MCIUN,Spain), and from “Proyectos I þ D þ i en el marco del ProgramaOperativo FEDER Andalucia 2014e2020” e UMA18-FEDERJA-279.The authors thank Catia de Almeida Santos and Andre Nunes Jorgefor their help, valuable discussion and suggestions given in the LC/MS by-products diagnostic. The authors also thank Ricardo Faria forhis help with the reactors drawing and Professor Nuno Lapa, Inte-grated Member of UBiA-NOVA-FCT, for providing the analyticalequipment for effluent characterization. This research wasanchored by the RESOLUTION LAB, an infrastructure at NOVASchool of Science and Technology.
Appendix A. Supplementary data
Supplementary data to this article can be found online athttps://doi.org/10.1016/j.chemosphere.2019.125758.
References
Alfaro, M.A.Q., Ferro, S., Martínez-Huitle, C.A., Vong, Y.M., 2006. Boron doped dia-mond electrode for the wastewater treatment. J. Braz. Chem. Soc. 17, 227e236.https://doi.org/10.1590/S0103-50532006000200003.
Ambauen, N., Muff, J., Mai, N.L., Halle, C., Trinh, T.T., Meyn, T., 2019. Insights into thekinetics of intermediate formation during electrochemical oxidation of theorganic model pollutant salicylic acid in chloride electrolyte. Water(Switzerland) 11, 1322. https://doi.org/10.3390/w11071322.
Anglada, A., Urtiaga, A., Ortiz, I., 2009. Pilot Scale scale performance of the electro-oxidation of landfill leachate at boron-doped diamond anodes. Environ. Sci.Technol. 43, 2035e2040. https://doi.org/10.1021/es802748c.
Balmer, M.E., Poiger, T., Droz, C., Romanin, K., Bergqvist, P.A., Müller, M.D.,
Fig. 3. Emerging organic contaminants degradation in electrochemical flow reactor with: Ti/MMO as anode with 7 mA/cm2 and Nb/BDD as anode with 10 mA/cm2 during 1 htreatment (error bars related to the standard deviation: n ¼ 2; TCP - 2,4,6-trichlorophenol; DCP - 2,4-dichlorophenol; TCS e triclosan; MTCS - methyl-triclosan).
C. Magro et al. / Chemosphere 247 (2020) 125758 7

Buser, H.R., 2004. Occurrence of methyl triclosan, a transformation product ofthe bactericide triclosan, in fish from various lakes in Switzerland. Environ. Sci.Technol. 38, 390e395. https://doi.org/10.1021/es030068p.
Bever, C.S., Rand, A.A., Nording, M., Taft, D., Kalanetra, K.M., Mills, D.A., Breck, M.A.,Smilowitz, J.T., German, J.B., Hammock, B.D., 2018. Effects of triclosan in breastmilk on the infant fecal microbiome. Chemosphere 203, 467e473. https://doi.org/10.1016/j.chemosphere.2018.03.186.
Brillas, E., Martínez-Huitle, C.A., 2015. Decontamination of wastewaters containingsynthetic organic dyes by electrochemical methods. An updated review. Appl.Catal. B Environ. 166e167, 603e643. https://doi.org/10.1016/j.apcatb.2014.11.016.
Brose, D.A., Kumar, K., Liao, A., Hundal, L.S., Tian, G., Cox, A., Zhang, H.,Podczerwinski, E.W., 2019. A reduction in triclosan and triclocarban in waterresource recovery facilities’ influent, effluent, and biosolids following the U.S.Food and Drug Administration’s 2013 proposed rulemaking on antibacterialproducts. Water Environ. Res. 91, 715e721. https://doi.org/10.1002/wer.1101.
Buxton, G.V., Greenstock, C.L., Helman, W.P., Ross, A.B., 1988. Critical review of rateconstants for reactions of hydrated electrons, hydrogen atoms and hydroxylradicals (,OH/,O in aqueous solution. J. Phys. Chem. Ref. Data 17, 513e886.https://doi.org/10.1063/1.555805.
Canosa, P., Morales, S., Rodríguez, I., Rubí, E., Cela, R., Gomez, M., 2005. Aquaticdegradation of triclosan and formation of toxic chlorophenols in presence oflow concentrations of free chlorine. Anal. Bioanal. Chem. 383, 1119e1126.https://doi.org/10.1007/s00216-005-0116-4.
Chen, J., Meng, X., Bergman, A., Halden, R.U., 2019. Nationwide reconnaissance offive parabens, triclosan, triclocarban and its transformation products in sewagesludge from China. J. Hazard Mater. 365, 502e510. https://doi.org/10.1016/j.jhazmat.2018.11.021.
Chianese, S., Iovino, P., Canzano, S., Prisciandaro, M., Musmarra, D., 2016. Ibuprofendegradation in aqueous solution by using UV light. Desalin. Water Treat. 57,22878e22886. https://doi.org/10.1080/19443994.2016.1153908.
Corcoran, E., Nellemann, C., Baker, E., Bos, R., Osborn, D., 2010. Sick Water ? theCentral Role of Wastewater Management in Sustainable Development. UNEP/Earthprint (eds), H.S.
Daughton, C.G., 2004. Non-regulated water contaminants: emerging research. En-viron. Impact Assess. Rev. 24, 711e732. https://doi.org/10.1016/j.eiar.2004.06.003.
DeClements, R., 1997. the formation and electrochemical activity of microporousdiamond thin film electrodes in concentrated KOH. J. Electrochem. Soc. 144,856. https://doi.org/10.1149/1.1837500.
Ferreira, A.R., Couto, N., Guedes, P., Pinto, J., Mateus, E.P., Ribeiro, A.B., 2018. Elec-trodialytic 2-compartment cells for emerging organic contaminants removalfrom effluent. J. Hazard. Mater. 358 (15), 467e474. https://doi.org/10.1016/j.jhazmat.2018.04.066.
Fiss, E.M., Rule, K.L., Vikesland, P.J., 2007. Formation of chloroform and otherchlorinated byproducts by chlorination of triclosan-containing antibacterialproducts. Environ. Sci. Technol. 41, 2387e2394. https://doi.org/10.1021/es062227l.
Food and Drug Administration, 2017. Safety and Effectiveness for Health Care An-tiseptics; Topical Antimicrobial Drug Products for Over-the-counter HumanUse. US, DHHS - Department of Health And Human Services.
Food and Drug Administration, 2016. FDA Issues Final Rule on Safety and Effec-tiveness of Antibacterial Soaps. DHHS - Department of Health and HumanServices, US.
Geissen, V., Mol, H., Klumpp, E., Umlauf, G., Nadal, M., Ploeg, M., Van Der Zee, S.E.,Ritsema, C.J., 2015. Emerging pollutants in the environment: a challenge forwater resource management. Int. Soil Water Conserv. Res. 3, 57e65. https://doi.org/10.1016/j.iswcr.2015.03.002.
Glaze, W.H., Kang, J.-W., Chapin, D.H., 1987. The chemistry of water treatmentprocesses involving ozone, hydrogen peroxide and ultraviolet radiation. OzoneSci. Eng. 9, 335e352. https://doi.org/10.1080/01919518708552148.
Gonzalez-Gonzalez, I., Hernandez-Lebron, Y., Nicolau, E., Cabrera, C.R., 2010.Ammonia oxidation enhancement at square-wave treated platinum particlemodified boron-doped diamond electrodes. ECS Trans. 33, 201e209. https://doi.org/10.1149/1.3484517.
Griesbach, U., Zollinger, D., Pütter, H., Comninellis, C., 2005. Evaluation of borondoped diamond electrodes for organic electrosynthesis on a preparative scale.J. Appl. Electrochem. 35, 1265e1270. https://doi.org/10.1007/s10800-005-9038-2.
Guedes, P., Magro, C., Couto, N., Mosca, A., Mateus, E.P., Ribeiro, A.B., 2015. Potentialof the electrodialytic process for emerging organic contaminants remediationand phosphorus separation from sewage sludge. Electrochim. Acta 181,109e117. https://doi.org/10.1016/j.electacta.2015.03.167.
Guedes, P., Mateus, E.P., Couto, N., Rodríguez, Y., Ribeiro, A.B., 2014. Electrokineticremediation of six emerging organic contaminants from soil. Chemosphere 117(1), 124e131. https://doi.org/10.1016/j.chemosphere.2014.06.017.
Guo, J.-H., Li, X.-H., Cao, X.-L., Li, Y., Wang, X.-Z., Xu, X.-B., 2009. Determination oftriclosan, triclocarban and methyl-triclosan in aqueous samples by dispersiveliquideliquid microextraction combined with rapid liquid chromatography.J. Chromatogr. A 1216, 3038e3043. https://doi.org/10.1016/j.chroma.2009.02.021.
Halden, R., 2019. The great sewage census. The Anal. Sci. 79, 22e30.Hayashi, H., Akamine, S., Ichiki, R., Kanazawa, S., 2016. Comparison of OH radicalconcentration generated by underwater discharge using two methods. Int. J.Plasma Environ. Sci. Technol. 10, 24e28. http://www.iesj.org/content/files/pdf/
IJPEST_Vol10_No1_06_pp, 024e028.Hua, W., Bennett, E., Letcher, R., 2005. Triclosan in waste and surface waters fromthe upper Detroit River by liquid chromatography-electrospray-tandem quad-rupole mass spectrometry. Environ. Int. 31, 621e630. https://doi.org/10.1016/j.envint.2004.10.019.
Kapałka, A., Comninellis, C., 2009. The importance of electrode material in envi-ronmental electrochemistry: formation and reactivity of free hydroxyl radicalson boron-doped diamond electrodes. Electrochim. Acta 54, 2018e2023. https://doi.org/10.1016/j.electacta.2008.06.045.
Kapałka, A., Comninellis, C., 2008. Kinetic modelling of the electrochemicalmineralization of organic pollutants for wastewater treatment. J. Appl. Elec-trochem. 38, 7e16. https://doi.org/10.1007/s10800-007-9365-6.
Klavarioti, M., Mantzavinos, D., Kassinos, D., 2009. Removal of residual pharma-ceuticals from aqueous systems by advanced oxidation processes. Environ. Int.35, 402e417. https://doi.org/10.1016/j.envint.2008.07.009.
Korshin, G.V., Kim, J., Gan, L., 2006. Comparative study of reactions of endocrinedisruptors bisphenol A and diethylstilbestrol in electrochemical treatment andchlorination. Water Res. 40, 1070e1078. https://doi.org/10.1016/j.watres.2006.01.003.
Mascia, M., Vacca, A., Palmas, S., Polcaro, A.M., 2007. Kinetics of the electrochemicaloxidation of organic compounds at BDD anodes: modelling of surface reactions.J. Appl. Electrochem. 37, 71e76. https://doi.org/10.1007/s10800-006-9217-9.
McAvoy, D.C., Schatowitz, B., Jacob, M., Hauk, A., Eckhoff, W.S., 2002. Measurementof triclosan in wastewater treatment systems. Environ. Toxicol. Chem. 21,1323e1329. https://doi.org/10.1002/etc.5620210701.
Medeiros de Araújo, D., Ca~nizares, P., Martínez-Huitle, C.A., Rodrigo, M.A., 2014.Electrochemical conversion/combustion of a model organic pollutant on BDDanode: role of sp3/sp2 ratio. Electrochem. Commun. 47, 37e40. https://doi.org/10.1016/j.elecom.2014.07.017.
Moreira, F.C., Boaventura, R.A.R., Brillas, E., Vilar, V.J.P., 2017. Electrochemicaladvanced oxidation processes: a review on their application to synthetic andreal wastewaters. Appl. Catal. B Environ. 202, 217e261. https://doi.org/10.1016/j.apcatb.2016.08.037.
Olaniyan, L.W.B., Mkwetshana, N., Okoh, A.I., 2016. Triclosan in water, implicationsfor human and environmental health. SpringerPlus 5, 1639. https://doi.org/10.1186/s40064-016-3287-x.
Oturan, M.A., Aaron, J.-J., 2014. Advanced oxidation processes in water/wastewatertreatment: principles and applications: a review. Crit. Rev. Environ. Sci. Technol.44, 2577e2641. https://doi.org/10.1080/10643389.2013.829765.
Panizza, M., Cerisola, G., 2009. Direct and mediated anodic oxidation of organicpollutants. Chem. Rev. 109, 6541e6569. https://doi.org/10.1021/cr9001319.
Pereira, G.F., Rocha-Filho, R.C., Bocchi, N., Biaggio, S.R., 2015. Electrochemicaldegradation of the herbicide picloram using a filter-press flow reactor with aboron-doped diamond or b-PbO2 anode. Electrochim. Acta 179, 588e598.https://doi.org/10.1016/j.electacta.2015.05.134.
Perez, J.F., Llanos, J., Saez, C., Lopez, C., Ca~nizares, P., Rodrigo, M.A., 2017.A microfluidic flow-through electrochemical reactor for wastewater treatment:a proof-of-concept. Electrochem. Commun. 82, 85e88. https://doi.org/10.1016/j.elecom.2017.07.026.
Ren, G., Zhou, M., Liu, M., Ma, L., Yang, H., 2016. A novel vertical-flow electro-Fentonreactor for organic wastewater treatment. Chem. Eng. J. 298, 55e67. https://doi.org/10.1016/j.cej.2016.04.011.
Rule, K.L., Ebbett, V.R., Vikesland, P.J., 2005. Formation of chloroform and chlori-nated organics by free-chlorine-mediated oxidation of triclosan. Environ. Sci.Technol. 39, 3176e3185. https://doi.org/10.1021/es048943þ.
Schranck, A., Doudrick, K., 2020. Effect of reactor configuration on the kinetics andnitrogen byproduct selectivity of urea electrolysis using a boron doped dia-mond electrode. Water Res. 168, 115130 https://doi.org/10.1016/j.watres.2019.115130.
Scialdone, O., Randazzo, S., Galia, A., Silvestri, G., 2009. Electrochemical oxidation oforganics in water: role of operative parameters in the absence and in thepresence of NaCl. Water Res. 43, 2260e2272. https://doi.org/10.1016/j.watres.2009.02.014.
Sires, I., Oturan, N., Oturan, M.A., Rodríguez, R.M., Garrido, J.A., Brillas, E., 2007.Electro-Fenton degradation of antimicrobials triclosan and triclocarban. Elec-trochim. Acta 52, 5493e5503. https://doi.org/10.1016/j.electacta.2007.03.011.
Skoumal, M., Arias, C., Cabot, P.L., Centellas, F., Garrido, J.A., Rodríguez, R.M.,Brillas, E., 2008. Mineralization of the biocide chloroxylenol by electrochemicaladvanced oxidation processes. Chemosphere 71, 1718e1729. https://doi.org/10.1016/j.chemosphere.2007.12.029.
Souza, F.L., Saez, C., Lanza, M.R.V., Ca~nizares, P., Rodrigo, M.A., 2016. The effect of thesp3/sp2 carbon ratio on the electrochemical oxidation of 2,4-D with p-Si BDDanodes. Electrochim. Acta 187, 119e124. https://doi.org/10.1016/j.electacta.2015.11.031.
Wachter, N., Aquino, J.M., Denadai, M., Barreiro, J.C., Silva, A.J., Cass, Q.B., Bocchi, N.,Rocha-Filho, R.C., 2019. Electrochemical degradation of the antibiotic cipro-floxacin in a flow reactor using distinct BDD anodes: Reaction kinetics, iden-tification and toxicity of the degradation products. Chemosphere 234, 461e470.https://doi.org/10.1016/j.chemosphere.2019.06.053.
Walsh, F.C., Ponce de Leon, C., 2018. Progress in electrochemical flow reactors forlaboratory and pilot scale processing. Electrochim. Acta 280, 121e148. https://doi.org/10.1016/j.electacta.2018.05.027.
Wang, D., Wang, P., Wang, S., Chen, Y.-H., Zhang, H., Lei, A., 2019. Direct electro-chemical oxidation of alcohols with hydrogen evolution in continuous-flowreactor. Nat. Commun. 10, 2796. https://doi.org/10.1038/s41467-019-10928-0.
C. Magro et al. / Chemosphere 247 (2020) 1257588

Wang, J., Farrell, J., 2004. Electrochemical inactivation of triclosanwith boron bopeddiamond film electrodes. Environ. Sci. Technol. 38, 5232e5237. https://doi.org/10.1021/es035277o.
Weatherly, L.M., Gosse, J.A., 2017. Triclosan exposure, transformation, and humanhealth effects. J. Toxicol. Environ. Health Part B 20, 447e469. https://doi.org/10.1080/10937404.2017.1399306.
Xing, L., Sun, J., Liu, H., Yu, H., 2012. Combined toxicity of three chlorophenols 2,4-dichlorophenol, 2,4,6-trichlorophenol and pentachlorophenol to Daphniamagna. J. Environ. Monit. 14, 1677e1683. https://doi.org/10.1039/c2em30185g.
Yoon, J.H., Shim, Y.B., Lee, B.S., Choi, S.Y., Won, M.S., 2012. Electrochemical degra-dation of phenol and 2-chlorophenol using Pt/Ti and boron-doped diamondelectrodes. Bull. Korean Chem. Soc. 33, 2274e2278. https://doi.org/10.5012/bkcs.2012.33.7.2274.
Yuan, S., Gou, N., Alshawabkeh, A.N., Gu, A.Z., 2013. Efficient degradation of con-taminants of emerging concerns by a new electro-Fenton process with Ti/MMOcathode. Chemosphere 93, 2796e2804. https://doi.org/10.1016/J.Chemosphere.2013.09.051.
C. Magro et al. / Chemosphere 247 (2020) 125758 9

42

43
Paper
“Analytical method for the monitoring of underivatized Triclosan by gas chromatography-triple quadrupole mass spectrometry in wastewater”
C Magro, D Mendes, F Freitas, EP Mateus, M Silva & AB Ribeiro
Under preparation, 2019

44

Analytical method for the monitoring of underivatized Triclosan by gaschromatography-triple quadrupole mass spectrometry in effluent
C. Magroa∗, D. Mendesb, F. Freitasb, M. Silvab, A.B. Ribeiroa and E.P. Mateusa∗
aCENSE, Departamento de Ciencias e Engenharia do Ambiente, Faculdade de Ciencias e Tecnologia, Universidade Novade Lisboa, Caparica 2829-516, Portugal
bLAQV, REQUIMTE, Departamento de Quimica, Ciencias e Engenharia do Ambiente, Faculdade de Ciencias e Tecnologia,Universidade Nova de Lisboa, Caparica 2829-516, Portugal
∗Corresponding authors: [email protected], [email protected]
under preparation, 2019
Keywords: Gas chromatography-triple quadrupole mass spectrometry, MRM mode, triclosan, effluent
Abstract:Triclosan (TCS) an antimicrobial agent is a personal care products widely used on a daily basis. TCS is beingreleased to the environment by wastewater treatment plants processing at sub-ppb effluent concentrations,presenting toxic and endocrine disrupting activity. A method for detection and quantification of TCS in effluentwas developed. The optimization of the method complies the different triple quadrupole gas chromatographymass spectrometer conditions: injector, transfer line and source temperature, collision gas pressure and energy,injection mode. This method will allow the fast and efficient environmental monitoring of TCS and relatedcompounds in aqueous matrices.
1 INTRODUCTION
Emerging organic contaminants (EOC), amongthem the personal care products class, have gatheredincreasing interest in recent years [1]. This groupof EOC encompasses a wide range of chemicals, in-cluding several phenolic compounds such as triclosan(TCS), see Table 1.
TCS is employed as antimicrobial and preserva-tive agents in several consumer products, e.g. de-odorants and toothpastes. The continuous detectionof TCS has led to debate on its safety, effectivenessand usage regulation, that comply with the needs ofenvironmentally friendly monitoring techniques [2].Due to advances in analytical technology, a plethoraof organic compounds, from pharmaceuticals to per-sonal care products, are detectable and quantifiable inwater if extremely sensitive techniques are applied.However, identification and quantification of environ-mental matrices is challenging due to the low sensi-tivity of available instrumentation, the vast physio-chemical properties of target analytes, and the rela-tively low levels that occur in aqueous environmental
matrices (2 ng/L-1 - 40µg/L of TCS found ) [3–5].Several detectors have been applied in tandem withGC and LC separations, yet, mass spectrometric de-tection has emerged as the most commonly employeddue to its selectivity and sensitivity, where the triplequadrupole mass spectrometer is generally consideredthe most sensitive [6–8]. In this study an effective andnon derivatization method for determination of TCSin effluent , by gas chromatography-triple quadrupolemass spectrometry in Multiple Reaction Monitoringmode (MRM), was developed. Solid phase extraction(SPE) was used to concentrate and purify the TCSin real effluent, prior to analysis. To the best of ourknowledge, most studies do not challenge the stan-dard conditions of the instrumentation, even thougheach case is different, and many analytes would ben-efit from this type of optimization.

2 EXPERIMENTAL
2.1 Chemicals and standards
TCS (99%) was purchased from Sigma–Aldrich(Steinheim, Germany). Individual stock solutionsfor calibration purposes were prepared at 200 mg/Lin methanol/ACE (2:1) and stored at -18oC. Themethanol and acetone used were from Sigma–Aldrich(Steinheim, Germany) in gradient grade type. Water(Type I) was from a Millipore system (Bedford, MA,USA). The effluent used was the liquid fraction col-lected in the secondary settling tank at a wastewatertreatment plant (Lisbon, Portugal). The gas Helliumwas 99.9% pure.
2.2 Standard solutions
A concentrated solution of TCS (200 mg/L) was pre-pared by dissolving in methanol/ACE (2:1). Eight-point calibration (20, 40, 80, 120, 240, 320, 400, 700)ng/L were performed in triplicate.
2.3 Samples and extraction
The extraction of TCS present in the effluent was per-formed by solid phase extraction (SPE), using OasisHLB (200 mg, 6 mL) from Waters (Saint-Quentin EnYvelines Cedex, France). The SPE cartridges wereconditioned by washing with 3 x 6 mL of methanol,followed by re-equilibrium with 3 x 6 mL of Milli-Qwater. For TCS enrichment, the samples were acidi-fied to pH 2 before extraction using nitric acid, with30 min of slow stirring and 30 min pause time after thespiking. The 200 mL aqueous samples were passedthrough the cartridge at a flow-rate of approximately10 mL/min by applying a moderate vacuum, flow by adried period of approximately 3 min by vacuum. Theretained analytes were eluted sequentially with 2 x 4mL of methanol and 1 x 4 mL of acetone and filtratedby PTFE syringe filters before GC-MS/MS analysis.
2.4 Instrumentation
The GC-MS/MS method used for effluent detectionand quantification is described in Tables 2.
To achieve the optimized conditions, it was testedin GC: splitless time, liner type, injector. In the MS:source and interface temperature, Q1 and Q3 resolu-tion (peak shape and area offset), collision gas pres-sure, collision energy and dwell time. The tests wereconducted in a standard solution of 1 mg/L of TCS tobetter understanding parameters changes.
3 RESULTS AND DISCUSSION
GC–MS/MS in MRM mode has become a popu-lar analytical tool for the analysis of complex matricesdue to its high specificity, and most of all selectivity.The identification of analytes is based on chromato-graphic retention time and specific transitions fromthe MS/MS analysis. The initial step for developing aGC–MS/MS method was establishing the chromato-graphic retention time in order to select an appropri-ate precursor ion for TCS. The GC–MS/MS analy-sis of triclosan standard in full-scan and SIM modeshowed the molecular ion peaks of m/z 288 for thenative triclosan at time 21.1 min. The detection oftriclosan and the established chromatographic reten-tion time can be confirmed through the NIST EI-massspectrum library search. The ion resulted from theloss of two chlorines was m/z 218 for triclosan. Thus,the ions at m/z 218 was chosen as the precursor ionsfor the second-stage mass spectrometric analysis, andafter that ions at m/z 155.
In the following section, the first phase was find-ing the best conditions in GC-MS, meaning the opti-mization of injection volume, split time and interfaceand injector temperature.
3.1 Optimization of GC–MS/MSconditions
The plots for the best splitless time and injector tem-perature are presented in Figure 1. These two pa-rameters are crucial for success in the analysis, whenthe goal is to achieve a quantification method. Re-garding Figure 1, the splitless at 1min is the one thatpresents less standard error, being the suitable choice.To injector temperature, the signal decrease beyond260oC suggested possible degradation, therefore, forTCS analysis a temperature of 250oC was chosen, toguarantee the non-termo-degradation. Additionally,not only the temperature or injector mode are crit-ical factors, but also the type of liner’s type whichcan jeopardize the shape of the peak and its S/N onthe chromatograph (Figure 2). Thus, if the liners arepacked with quartz wool (usually used for “dirty” en-vironmental matrices), TCS will react with the mate-rial even if it is deactivated and/or become adsorbedon it.
The Design Expert program was used to findthe maximum peak area, when temperatures of in-terface and source are combined, Figure 3. Thecurve obtained, implies the great dependency of TCS,mostly, on the interface’s temperature. The higherarea achieved for TCS was with a combination of 290oC for the interface temperature and 260oC for the

source temperature.
3.2 MS/MS conditions
The optimization of the MS/MS parameters for tri-closan analysis was reached by monitoring, not onlythe peak intensities, but also the shape of the se-lected quantification ions. In environmental samples,commonly present trace concentrations, where thepeak shape is an imperative parameter for the anal-ysis quantification. Thus, four parameters were stud-ied and optimized: Q1 and Q3 resolution (peak shapeand area offset), collision gas pressure, collision en-ergy and dwell time.
Figure 4 present the Q1 and Q3 resolutions, whereit can be observed for both combinations, peak shapeand area offset, the best results were with Q1 at 0.7and Q3 at 2.
Contrary to the typical energy used in organiccompounds, to TCS, the highest area was achievedwith 20eV of energy (Figure 5). Therefore, for thecollision gas, it was found that both too high and toolow pressures decreased the analyte signal. The idealcollision gas pressure, for the 20 eV of collision en-ergy was 2.4 mTorr (Figure 5).
Moreover, the dwell time was evaluated. Thelower (100 ms), in Figure 6, was the one with bestpeak shape and higher area.
The optimization of these parameters is crucial intrace analysis of environmental samples. The linearityand TCS peak shape were determined with standardsolutions (section 2, standard solutions, n = 3). Figure7, show the calibration line through the different con-centrations and the respective TCS chromatograms.
3.2.1 Effluent samples
For effluent SPE extraction, different pH values(2,7 and 12), volume elution with different solvents(MeOH or MeOH/ACE), stirring time (1. spiked andstirred overnight; 2. spiked, 30 min stirred, 30 minof pause; 3. spiked immediately prior to extraction),cartridges (Oasis HLB, Strata-X, Strata C18-E, StrataC18-U) and syringe filters (RC, Nylon and PTFE)were evaluated. The experiments were performed byspiking TCS in effluent (0.8 mg/L) where all the ex-periments data were an average of duplicates. It wasfound that the recovery was higher at low and neu-tral pH values (2 and 7). The pH 2 was chosen asit will avoid precipitation of organic matter and el-ements that are in the matrix composition, and de-crease the potential to photodegradation of TCS, asat pH 2 most molecules will be in their ionized form.At pH 12 the organic matter or fats/oil were not dis-solved and promoted the saturation of SPE packings
after 50 mL in the loading sample step. For the stir-ring time the best option was a slow agitation (30min), but not sufficient to promote the degradation,and a pause time where the TCS was diluted in thematrix (30 min). Methanol and a methanol/acetonesolutions were examined as extraction solvent. TheMeOH/ACE was found to be the most effective op-tion, since ACE is a strong solvent for hydrophobiccompounds, e.g. TCS. Additionally, the extractionvolume of (4 x 4) mL MeOH + 4 mL ACE was foundto be ideal, as 95% (± 3%) of TCS was recovered.
For effluent sample cleanup, the SPE cartridgeswere also studied. Recovery for TCS, when employ-ing HLB showed a better result (95%) comparing toStrata-X (78%), Strata C18-E (114%), Strata C18-U(67%). The filtration with PTFE syringe filter ob-tained the lower losses (2% analyte loss).
Accordingly, a total of six effluent were analyzedfor TCS using the present method and the results areshown in Table 3. Prior to the analysis, the SPE de-scribed above was applied. In the effluent samples,106-624 ng/L of TCS was detected. The typical chro-matogram is shown in Figure 8.
4 CONCLUSIONS
GC/MS/MS in MRM mode allowed the success-ful determination of trace amounts of TCS in effluentreal samples, in a fast and efficient monitoring. TCSis an instable compound, with low volatility, foundin trace concentration in aqueous environmental sam-ples. Therefore, our proposed method has many prac-tical advantages, including simplicity, higher selectiv-ity and can be included in the green analytical moni-toring techniques, since no derivative agent was used.
ACKNOWLEDGEMENTS
This research was anchored by the RESOLUTIONLAB, an infrastructure at NOVA School of Scienceand Technology. Project “Development of Nanostruc-tures for Detection of Triclosan Traces on Aquatic En-vironments” (PTDC/FIS-NAN/0909/2014). CENSE-which is financed by national funds from FCT/MEC(UID/AMB/04085/2013). C. Magro acknowledgesFundacao para a Ciencia e a Tecnologia for her PhDfellowship (SFRH/BD/114674/2016).

REFERENCES
[1] C.G. Daughton, Non-regulated water contami-nants: Emerging research, 24 (2004) 711–732.doi:10.1016/j.eiar.2004.06.003.
[2] E. Corcoran, C. Nellemann, E. Baker, R. Bos,D. Osborn, H.S. (eds), Sick water? The centralrole of wastewater management in sustainabledevelopment, UNEP/Earthprint., 2010.
[3] W. Hua, E. Bennett, R. Letcher, Triclosanin waste and surface waters from the up-per Detroit River by liquid chromatography-electrospray-tandem quadrupole mass spec-trometry, Environ. Int. 31 (2005) 621–630.doi:10.1016/j.envint.2004.10.019.
[4] A. Lindstrom, I.J. Buerge, T. Poiger, P.A.Bergqvist, M.D. Muller, H.R. Buser, Oc-currence and environmental behavior of thebactericide triclosan and its methyl deriva-tive in surface waters and in wastewater, En-viron. Sci. Technol. 36 (2002) 2322–2329.doi:10.1021/es0114254.
[5] P.E. Stackelberg, E.T. Furlong, M.T. Meyer,S.D. Zaugg, A.K. Henderson, D.B. Reiss-man, Persistence of pharmaceutical com-pounds and other organic wastewater con-taminants in a conventional drinking-water-treatment plant, Sci. Total Environ. 329 (2004)99–113. doi:10.1016/j.scitotenv.2004.03.015.
[6] A. Togola, H. Budzinski, Analytical de-velopment for analysis of pharmaceuticalsin water samples by SPE and GC-MS,Anal. Bioanal. Chem. 388 (2007) 627–635.doi:10.1007/s002160071251x.
[7] F. Tohidi, Z. Cai, GC/MS analysis of triclosanand its degradation by-products in wastewa-ter and sludge samples from different treat-ments, Environ. Sci. Pollut. Res. 22 (2015)11387–11400. doi:10.1007/s113560154289x.
[8] A. Klancar, M. Zakotnik, R. Roskar, J. Tron-telj, Multi-residue analysis of selected phar-maceuticals in wastewater samples by stir-bar sorptive extraction followed by liquid des-orption and liquid chromatography-mass spec-trometry, Anal. Methods. 9 (2017) 5310–5321.doi:10.1039/c7ay01310h.

Table 1. Triclosan physical and chemical characteristics*.
Chemical structure Formula Molar mass
g mol -1
Log Kow pKa Solubility in water
mg L-1
Polarizability
Å3
Boiling
Point
5-chloro-2-(2,4-
dichlorophenoxy)phenol
C12H7Cl3O2 289.54 4.76 7.9 10 (20°C) 26.96 120ºC
* Pubchem, https://pubchem.ncbi.nlm.nih.gov.
Table 2. GC-MS/MS final method.
Instrument
Gas Chromatography - Triple Quadrupole MS
Systems – EVOQ Bruker
Column
DB-5 30 m, 0.25 mm i.d., 0.25 μm film (df)
Running
Initial Temperature 40 ºC for 1 min
Heating Ramp 10 ºC/min
Final Temperature 300 ºC for 3 min
Carrier Gas helium
Constant Flow 1 mL/min
Injector 250 ºC, 1 min splitless
Interface 290 ºC
Source 260 ºC
MRM TCS (288>218, 288>155)
Collision gas pressure 2.4
Collision energy 20eV
Table 3. Concentrations of triclosan in SPE effluent extract samples.
TCS (ng/L)
Effluent
I II III IV V VI
127.80 106.58 472.41 623.61 519.92 458. 37

Figure 1. Interface and source temperature (injector at 250ºC).
Figure 2. Q1 and Q3 resolution: peak shape (a-c) and area offset (d).
0
100
200
300
400
500
600 Q1 3 Q3 0.7
Q1 3 Q3 2
Q1 3 Q3 3
0
100
200
300
400
500
600
Are
a
Q1 0.7 Q3 0.7
Q1 0.7 Q3 2
Q1 0.7 Q3 3
0
100
200
300
400
500
600 Q1 2 Q3 0.7
Q1 2 Q3 2
Q1 2 Q3 3
(a) (b) (c)
(d)

Figure 3. Relation between collision energy and collision gas pressure.
LOD LOQ
TCS (ng/L) 20 40 80 120 240 320 400 600
RSD (%) 8 9 5 5 5 13 15 18 132 395
Figure 4. Calibration line and chromatograph for all the concentrations under study.
1,6 1,8
2 2,2 2,4 2,6 2,8
3
0.E+00
2.E+05
4.E+05
6.E+05
8.E+05
5
15
25
35
mTorr
Are
a
eV
y = 15.653x + 486.13
R² = 0.9801
0
2000
4000
6000
8000
10000
12000
0 100 200 300 400 500 600
Are
a
Concentrações, ppbobserved Calculated 21.1 20.9 21.1 21.2 21.3
600 ppt
320 ppt
400 ppt
120 ppt
80 ppt
40 ppt
20 ppt
Ab
un
dan
ce

Supplementary Material
Figure S1. Splitless time and injector temperature.
Figure S2. Liner type: (a) with glass fiber; (b) without glass fiber.
Figure S3. Dwell Time
0.E+00
5.E+05
1.E+06
2.E+06
2.E+06
3.E+06
3.E+06
4.E+06
4.E+06
5.E+06
0.00 1.00 2.00 3.00
Are
a
Splitless Time (min)
0.E+00
5.E+05
1.E+06
2.E+06
2.E+06
3.E+06
3.E+06
4.E+06
4.E+06
220 270 320
Area
Injector temperature (ºC)
0
700
1400
2100
2800
3500
4200
4900
21.2 21.4 21.6 21.8 22 22.2
Are
a
Time (min)
100 MS
150 MS
200 MS
21.018.4 19.2 22.6 23.4
0
500
1000
1500
2000
0
500
1000
1500
21.2 21.4 21.6 21.8 22
Are
a
Time (min)
Default
parameters
Optimized
parameters

Figure S4. Typical MRM chromatogram of triclosan in effluent sample.
Time (min)
218 < 155
288 < 218
Abundan
ce

54

55
Paper
“Overview of electronic tongue sensing in environmental aqueous matrices: Potential for monitoring emerging organic contaminants”
C Magro, EP Mateus, M Raposo & AB Ribeiro
Published in: Environmental Reviews, 2019

56
REVIEW
Overview of electronic tongue sensing in environmentalaqueous matrices: potential for monitoring emerging organiccontaminantsCátia Magro, Eduardo P. Mateus, Maria Raposo, and Alexandra B. Ribeiro
Abstract: Emerging organic contaminants (EOC) are synthetic or naturally occurring chemicals that have the potential to enterthe environment and cause known or suspected adverse ecological and human health effects. Despite not being commonlymonitored, EOC are often detected in effluents and water bodies because of their inefficient removal in conventional wastewatertreatment plants. There is a growing concern about the presence and impact of EOC as well as the need for reliable and effectivewater monitoring using sensors capable of detecting the target molecules in complex media. Due to their specificities, such asfast response times, low cost, portability and user-friendly operation, electronic tongue (e-tongue) systems present some advan-tages over the traditional analytical techniques (e.g., chromatographic systems) used for environmental monitoring. We re-viewed e-tongue sensors, focusing on their ability for real-time environmental monitoring. A bibliometric evaluation was carriedout, along with a study of the status of the existing e-tongue systems, how they worked, and their applications in different fields.The potential of e-tongue sensors to detect organic contaminants in aqueous environmental matrices is discussed, with aparticular focus on EOC.
Key words: electronic tongue, environmental monitoring sensing, emergent organic contaminants, pharmaceuticals andpersonal care products.
Résumé : Les contaminants organiques émergents (COE) sont des produits chimiques synthétiques ou d’origine naturelle quipourraient s’immiscer dans l’environnement et causer des effets défavorables, connus ou soupçonnés, sur le plan écologique etsur la santé des humains. Malgré qu’ils ne soient pas généralement surveillés, les COE sont souvent détectés dans les effluents etles plans d’eau, à cause de la difficulté à les éliminer des stations d’épuration conventionnelles. Il y a une préoccupationcroissante quant à la présence et à l’impact des COE, ainsi qu’un besoin de surveillance fiable et efficace de la pollution de l’eauen utilisant des capteurs capables de détecter les molécules cibles dans des milieux complexes. En raison de leurs spécificités,comme des temps de réponse rapides, leur prix avantageux, leur portabilité et fonctionnement simple, les systèmes de langueélectronique (ou capteur organoleptique) présentent quelques avantages par rapport aux techniques analytiques traditionnelles(p. ex., systèmes chromatographiques) utilisées pour la surveillance de l’environnement. Dans le cadre de cet examen, les languesélectroniques (capteurs organoleptiques) sont passés en revue, en se penchant sur leur capacité de surveiller l’environnement entemps réel. On a effectué une évaluation en utilisant la bibliométrie, de pair avec une étude de l’état des systèmes de langueélectronique existants, de comment ils ont fonctionné et des applications de ceux-ci dans différents domaines. Le potentiel de cescapteurs organoleptiques à détecter des contaminants organiques dans des matrices environnementales aqueuses est discuté, avec unaccent particulier sur les COE. [Traduit par la Rédaction]
Mots-clés : langue électronique, surveillance de l’environnement par capteurs, contaminants organiques émergents, produitspharmaceutiques et de soins personnels.
1. IntroductionCurrently, the world faces a rising global demand for water due
to an increasing population and climate change. Both water avail-ability and quality are under stress (Pal et al. 2014). The globalpopulation is expected to exceed 9 billion by 2050, and 70% ofpeople will be living in urban areas. This growing problem isusually coupled with poor wastewater management, old wastewa-ter infrastructure plants, and limited disposal strategies with ei-ther minimal treatment practices or none at all (Corcoran et al.2010). Consequently, wastewater treatment plants are releasingnew classes of potential organic contaminants into water bodies,
known as emerging organic contaminants (EOC), as these are notcompletely removed by the existing technologies (Stülten et al.2008; Matamoros et al. 2009).
EOC are defined as “chemical substances that have no regula-tion, are suspected of affecting the environment or whose effectsare unknown” (Daughton 2004; Geissen et al. 2015). Some of theEOC are included in the priority pollutant lists developed by boththe European Union and the United States Environmental Protec-tion Agency. In 2000, an initial list of 33 priority substances wasalso identified under the Eurpoean Union Water Framework Di-rective 2000/60/EC (European Commission) to be used as a control
Received 20 February 2018. Accepted 5 October 2018.
C. Magro, E.P. Mateus, and A.B. Ribeiro. CENSE, Departamento de Ciências e Engenharia do Ambiente, Faculdade de Ciências e Tecnologia,Universidade Nova de Lisboa, Caparica 2829-516, Portugal.M. Raposo. CEFITEC, Functional Molecular Systems Group, Departmento de Física, Faculdade de Ciências e Tecnologia, Universidade Nova de Lisboa,Caparica 2829-516, Portugal.Corresponding authors: Cátia Magro (email: [email protected]) and Eduardo Mateus (email: [email protected]).Copyright remains with the author(s) or their institution(s). Permission for reuse (free in most cases) can be obtained from RightsLink.
202
Environ. Rev. 27: 202–214 (2019) dx.doi.org/10.1139/er-2018-0019 Published at www.nrcresearchpress.com/er on 10 October 2018.
Env
iron
. Rev
. Dow
nloa
ded
fro
m w
ww
.nrc
rese
arch
pre
ss.c
om b
y M
rs C
átia
Mag
ro o
n 10
/16/
19F
or p
erso
nal
use
only
.

measure for the next 20 years (Ellis 2008). In 2007, pharmaceuti-cals and personal care products (PPCP) such as diclofenac, iopami-dol, musks, and carbamazepine were identified as future emergingpriority candidates. Ibuprofen, clofibric acid, triclosan, phtha-lates, and bisphenol A are proposed additions to this list. Stuartand Lapworth (2013) have a clearer definition: “Emerging organiccontaminants are compounds now being found in groundwaterfrom agricultural and urban sources that were previously notdetectable, or thought to be significant. EOC include pesticidesand degradates, PPCP, industrial compounds, fragrances, watertreatment byproducts, flame retardants, and surfactants, as well as‘life-style’ compounds such as caffeine and nicotine”.
It is necessary to find suitable sensors that allow for monitoringof EOC molecules. The development of reliable real-time sensorsfor environmental monitoring of EOC in wastewater treatmentplants (WWTP) is challenging, as sensors must be selective fortarget compounds and sensitive enough to detect them at tracelevels. One of the main challenges is to ensure analyte detection inenvironmental complex matrices that contain countless spuriousmolecules (potential interfering compounds) as well as micro-scopic life (Albareda-Sirvent et al. 2001). These matrix effects canjeopardize the analysis of a target molecule.
Sensors are an integral part of many engineered products, sys-tems, and manufacturing processes as they provide feedback,monitoring, safety, and some other benefits (Stroble et al. 2009).The term sensor started to gain currency during the 1970s. TheAmerican National Standards Institute describes a sensor as “adevice which provides a usable output in response to a specificmeasurand, where the output is defined as an electrical quantity,and a measurand is defined as a physical quantity, property, orcondition which is measured” (American National StandardsInstitute (ANSI) 1982). Sensors should be in direct contact with theobject under investigation, transform nonelectric informationinto electric signals, respond quickly, operate continuously or atleast in repeated cycles, and be small in size (Gründler 2007).
Depending on the purpose, there are different types of sensors.Ranging from very simple to complex classifications (Fraden 2010),the sensor properties (materials and detection means used, specifi-cations, conversion phenomena, field of applications, or stimuli) canbe used to classify them. However, considering the purpose ofmonitoring target molecules in aqueous complex matrices, theoptimal sensor would detect the presence of the target molecule,determine its concentration, and give general information aboutthe complex matrix where the target molecules are inserted.Therefore, it seems that suitable sensors for providing that infor-mation are chemical sensors, taking into account the definitionsgiven by Hulanicki et al. (1991).
Chemical sensors are complex devices optimized for a particu-lar application. An ideal chemical sensor will respond instanta-neously to a target compound (analyte) in a medium, producing ameasurable signal output at a determined analyte concentration(Council 1995). However, despite significant advances in the lastfew decades, the way in which these devices respond to differentstimuli in the sample is still relatively unknown. The complexityof a chemical sensor application is related to technical difficultiesrelated with the measurements and specific nature (i.e., elementalor molecular) of the substance to be analyzed (Hulanicki et al.1991). According to the International Union of Pure and AppliedChemistry, chemical sensors are defined “as devices or instru-ments that determine the detectable presence, concentration, orquantity of a given analyte.”
Chemical sensors are based on two functional units: a receptorpart and a transducer part. In the receptor, the chemical informa-tion is transformed into a form of energy, which may be measuredby the transducer. The receptor may account for different princi-ples: (i) physical, no chemical reaction takes place; (ii) chemical,where there is a chemical reaction with the analyte that gives riseto the analytical signal; and (iii) biochemical, in which a biochem-
ical process is the source of the analytical signal. In some cases, itis not possible to decide whether a sensor operates in a chemicalor a physical mode, e.g., an absorption process. In the transducersection, the device transforms the energy-carrying chemical infor-mation on the sample into a useful analytical signal (Council1995).
Regarding detection of EOC molecules in an environmental ma-trix, both physical and (bio)chemical principles are adequate. Forphysical detection, the electrical properties of a device consti-tuted by a thin layer of film, for example, prepared from mole-cules with affinity to the target compound and deposited on thesolid support with electrical electrodes, will change as the targetmolecules are being adsorbed. On the other hand, electrochemi-cal sensors are based on the current measurement resulting fromthe oxidation–reduction reactions of the analyte at a suitable elec-trode. Electrochemical sensors achieve selectivity through molec-ular coatings, film coatings on electrodes, or chemically modifiedelectrodes. The design of molecular selectivity for analytes in-volves an accurate choice of the sensing chemistry and associatedmaterials (Ciosek and Wró 2007). Selectivity in sensing devices isrelated to a preferred response to a single sample substance,where the remaining substances can be considered formally asinterfering substances. In a sensor’s array, each sensor must havea specific capacity to distinguish between components of the mix-ture, i.e., it should distinguish between sample and interferent.The sensor can respond to both analyte and interferent with adifferent sensitivity (Gründler 2007). Chemical reactivity can in-volve a wide range of chemical phenomena, including: (i) recog-nition of size/shape/dipolar properties of molecular analytes bymolecular films, phases, or sites; (ii) selective permeation of ana-lyte in a thin-film sensor; and (iii) catalytic reaction cycle ofthe sensing materials, which results in analyte consumption(National Academy Press 1995).
The concept of electronic tongue (e-tongue) emerged throughthe need for the detection, classification, and differentiation ofcomplex substances. Since the first prototype in 1990 by Hayashiet al. (1990), e-tongue has become one of the most promisingmonitoring systems to develop a fast, cheap, and objectivemethod for evaluating different matrices (Sìliwinìska et al. 2014).Sensing tongue systems were inspired by the human tongue,which can detect five tastes: salty, sour, sweet, bitter, and umami(Winquist 2008). The tasting senses in a human tongue are chem-ical senses, as they respond to a stimulus produced by food mol-ecules on the tongue’s taste cells, thus producing the sensation oftaste. The taste receptor organs are located in the taste buds. Inthe process of flavor detecting, a series of electrical impulses aregenerated with different intensities and are transmitted to thebrain–transducer, where they are compared to identify flavors(Smith and Margolskee 2001). In a similar way, the e-tongue withan array of sensors that measure electrical signals can be inter-preted by mathematical methods, leading to information aboutthe presence of the target molecule and its concentration in thecomplex matrix.
Given the importance of this new way of using sensors, thefocus of this review is e-tongues, because of their scientific rele-vance for the detection of compounds in aqueous matrices andthe growing number of scientific publications using this system.There are, however, other types of tongues or noses that may beconsidered for the detection of organic molecules, for exampleusing optical sensors as in the work of the Suslick group (Rakowand Suslick 2000), and the Lundstrom and D’Amico groups(Filippini et al. 2006). The number of scientific publications onEOC detection is not yet strong enough.
To better recognize and assess the research status on e-tongues,we performed a bibliometric study (June 2018), making use ofthe online version of SCOPUS. With the search word “electronictongue” (Fig. 1a), a total of 1297 scientific papers (articles andreviews) was obtained. In the 1297 papers with the subject of
Magro et al. 203
Published by NRC Research Press
Env
iron
. Rev
. Dow
nloa
ded
fro
m w
ww
.nrc
rese
arch
pre
ss.c
om b
y M
rs C
átia
Mag
ro o
n 10
/16/
19F
or p
erso
nal
use
only
.

e-tongues, the dominant research areas are chemistry (36.3%), en-gineering (29.8%), and environmental sciences (6%), for whichChina, Spain, and USA are the top 3 countries, contributing 34% ofthe papers. The search word “electronic tongue” was refined withthe sub-subject “water” (Fig. 1b) to link the subject to aqueousmatrices. We also examined the connection between the searchword “electronic tongue” and the sub-subject “organic contami-nants” (e.g., EOC), obtaining an additional 22 papers from 2004 to2017 (Fig. 1b).
Although the number of published papers on e-tongues thatfocused on the detection of organic components is still small, thisdetection method is considered a promising monitoring tool.Since its development, it has been used for a variety of purposes,e.g., water, wastewater and food analysis (Zhuiykov 2012; Panasiuket al. 2015; Cetó et al. 2016; Díaz-gonzález et al. 2016; Goméz-Cravacaet al. 2016; Peris and Escuder-gilabert 2016; Wei et al. 2017; Son andHyun 2018), while fulfilling environmental monitoring needs(Di Natale et al. 1997; Krantz-Rülcker et al. 2001; Gutiérrez et al. 2008;Winquist 2008; Campos et al. 2012; Askim et al. 2013; Tahara andToko 2013; Capelli et al. 2014; Justino et al. 2015).
Conventionally, chemical sensing of unknown substances isperformed in an analytical laboratory with complex benchtopequipment, including mass spectrometry, chromatography, nu-clear magnetic resonance, X-ray, and infrared technology. Thesemethods are very accurate enabling the identification of mostunidentified chemical classes with a high degree of confidenceand precision (Banerjee et al. 2016), which can be used to calibratesensors. Nonetheless, the e-tongue presents potential advantages:(i) sample pretreatment may not be mandatory, (ii) the source oferrors due to sample transport or storage may be drastically re-duced or eliminated, and (iii) a fast response may be achieved inenvironmental emergencies (Albaladejo et al. 2010). The possibil-ity of environmental monitoring in real-time mode and operatingon long-term scales can enable data collection that may be crucial
for understanding the full range of potential contamination in allits phases and environmental compartments. Moreover, real-timetools used for environmental monitoring represent a cutting-edgetechnology that, with the right approval and support from gov-ernment agencies, along with an increase in the quality of theproduced data, will undoubtedly become a part of modern envi-ronmental monitoring laboratories (Gałuszka et al. 2015).
This review aims to present how pollutants in aqueous mediacan be detected using the e-tongue, and to highlight the opportu-nities for the detection of EOC–PPCP in these matrices. In addi-tion, the concept of the e-tongue and examples of its successfulapplications are analyzed.
2. Electronic tongue—the conceptThe e-tongue is based on chemical sensors with low selectivity,
that display cross-sensitivity to multiple components in liquids(Ciosek and Wró 2007), and can be considered as “a multi-sensorysystem, formed by an array of low-selective sensors, combinedwith advanced mathematical procedures for signal processing,based on pattern recognition and (or) multi-variate data analysis”(Vlasov et al. 2005). The seminal work of Di Natale et al. (1997), oneof the pioneers on the subject of the e-tongue, used a chalcogenideglass sensor array with an artificial neural network analysis forthe detection of heavy metal cations and inorganic anions in acomplex aqueous solution. Thus, if the e-tongue is configured andproperly trained (e.g., the choice of materials), it can be used tocharacterize complex liquid samples and recognize the quali-tative and quantitative composition of multi-species solutions(Escuder-gilabert and Peris 2010).
2.1. ComponentsThe e-tongue system with its base components is schematized
in Fig. 2. Typically, the electrical signals measured in an array ofsensors immersed in, or covered with, liquid samples are recorded
Fig. 1. (a) Annual distribution of published scientific papers on e-tongues from 1989 to 2017 and (b) number of scientific papers published one-tongues applied to water and organic contaminants (data adapted from SCOPUS, accessed in June 2018).
020406080
100120140160
1989
1990
1991
1992
1993
1994
1995
1996
1997
1998
1999
2000
2001
2002
2003
2004
2005
2006
2007
2008
2009
2010
2011
2012
2013
2014
2015
2016
2017
Num
ber o
f art
icle
s or
revi
ews
Year
012345678910
0
10
20
30
40
50
60
70
2000 2002 2004 2006 2008 2010 2012 2014 2016
Num
ber o
f art
icle
s or
revi
ews
YearE-Tonge + Water E-tonge + Organic contaminants
204 Environ. Rev. Vol. 27, 2019
Published by NRC Research Press
Env
iron
. Rev
. Dow
nloa
ded
fro
m w
ww
.nrc
rese
arch
pre
ss.c
om b
y M
rs C
átia
Mag
ro o
n 10
/16/
19F
or p
erso
nal
use
only
.

and processed by mathematical procedures to achieve a pattern.This pattern allows for a comparison of the results obtained withthe data of calibrated libraries already gathered from previouscomplex solutions in which its composition was also carefullyanalyzed in conventional laboratories. This means that a libraryshould be attained for each sensor array. In most cases, the liquidsample must be placed in a controlled temperature or at a con-trolled flux, if the electrical properties are dependent on the tem-perature or atmosphere.
The e-tongue’s components are explained in more detail as fol-lows.
2.1.1. Methods for measuring the electrical signalThere are several types of sensors that can be applied in e-tongues.
A wide variety of chemical sensors have been employed,but the onesmost commonly used for detecting pollutants are electrochemicalsystems (e.g., potentiometric, voltammetric, and amperometric) andelectrochemical–physical systems (e.g., impedance) (Krantz-Rülckeret al. 2001; del Valle 2010; Zou et al. 2015). The classification isrelated to the primary signal after an interaction with the analytewhen a potential electrochemical current or resistivity–capacitancechange is generated and measured.
Voltammetric and potentiometric sensors have several applica-tions in environmental monitoring and the detection of pharma-ceuticals in food (Gutiérrez et al. 2008; Mimendia et al. 2010; Weiand Wang 2011). In potentiometric sensors the current is moni-tored without current flow, whereas in voltammetry sensors apotential is applied, and the resulting current is measured(Winquist 2008). Voltammetric methods are more versatile androbust, as they are usually less influenced by electrical distur-bances, and the potentiometric measurements are considered tobe simpler (Holmin et al. 2001). From the point of view of detec-tion, potentiometry operates in terms of the system’s net chargebeing disadvantageous in nonelectrolyte media, whereas cyclicvoltammetry operates in complex liquids requiring compoundsthat can be oxidized or reduced actively onto the working elec-trode (Legin et al. 1999; Holmin et al. 2001; Ivarsson et al. 2001).
Amperometry is preferred for monitoring a time-dependentchange with a wide dynamic range (Wang et al. 2015). Amperomet-ric systems are directly measured in electrochemical reaction
rates taking place at the electrodes, where the current derivesfrom the oxidation or reduction of electroactive compounds at aworking electrode while a constant potential is applied (Kirsanovet al. 2004).
In the impedance system, the full scan of different alternatedcurrent frequencies or a selected number of discrete values, maybe used (conductivity or capacitance) in a simpler conceptual im-plementation (del Valle 2010). The impedance technique is basedon the electrode perturbation caused by an external signal ofsmall magnitude. Measurements can be performed in an equilib-rium or stationary state, allowing for the characterization of aque-ous environmental matrices by analyzing the electrical impedanceas a function of frequency signals applied to nanostructures ad-sorbed onto solid substrates (Riul et al. 2002). E-tongue systemsthat measure the electric impedance using conducting polymers(alone or combined with lipids) can work as sensorial unities, asthey recognize the taste below the biological limit (Ferreira et al.2003), eliminating the need for human panels.
According to SCOPUS (accessed in June 2018), the number ofpublications referring to the term “electronic tongue” (brokendown according to the different sensors: potentiometric, voltam-metric, amperometric, and impedance) has been growing steadilysince the research in 1997. On potentiometric, voltammetric andamperometric systems, the number of articles published appearsto have stabilized over the last few years, whereas the number ofarticles published for impedance systems is increasing.
2.1.2. Array of sensorsThe choice of sensors is dependent on the measuring method.
In voltammetric measurements, for instance, a reference elec-trode (e.g., Ag/AgCl), a counter electrode (e.g., Platinum (Pt)), and aworking electrode are typically required. Working electrodes aremade of noble and non-noble metals, such as Copper (Cu), Gold(Au), Nickel (Ni), Palladium (Pd), Pt, and Silver (Ag), and othermaterials such as glassy carbon (GC). Working electrodes can alsobe covered with films, increasing the sensitivity of the sensor. Thephysical properties measured (e.g., capacitance and resistance)can be improved if the interdigitated electrodes (IE) are coveredwith thin films (Riul et al. 2002).
Fig. 2. Schematic components of an electronic tongue.
Magro et al. 205
Published by NRC Research Press
Env
iron
. Rev
. Dow
nloa
ded
fro
m w
ww
.nrc
rese
arch
pre
ss.c
om b
y M
rs C
átia
Mag
ro o
n 10
/16/
19F
or p
erso
nal
use
only
.

A thin film, deposited onto IE, based on insulator, semiconduc-tor, or conductive materials with affinity for the target molecule,will have a different resistance and (or) capacity as the analytemolecules are being adsorbed onto it, allowing for the detectionof a target compound or analyte in a solution. Taylor andMacdonald (1987) analyzed this situation and presented a simpleequivalent circuit that describes the AC electrical behavior. Suchimpedance or conductance spectra will be dependent on both thenumber of molecules adsorbed onto the thin film surface and theother constituents of the solution matrix. The adsorption of targetmolecules could be due to both physical interactions (ionic, hy-drogen bonds, van der Waals, dipolar) and chemical bonds, wherethe measured electrical signal will incorporate information fromthem in greater or lesser detail depending on the film used. There-fore, thin films should be prepared in view of their ability toadsorb the analyte or adsorb other constituents of the aqueousmatrix. Hence, several thin films should be prepared to developthe e-tongue, based on both physical and chemical methods ofdetection. Different kinds of thin molecular films could be pre-pared, namely Langmuir–Blodgett or self-assembled or layer-by-layer films (Oliveira et al. 2014).
2.1.3. Mathematical treatment of measured dataRegardless of the system used (potentiometric, voltammetric,
amperometric, or impedance systems) for monitoring aqueousenvironmental matrices, the complexity of the information ex-tracted will involve an analysis of a large number of variables.Some of these variables are not significant in the interpretation ofresults, and only the relevant information is collected, therebyreducing the volume of data (Wilson and Baietto 2009). Thus,without losing any information, relevant data can be obtainedusing statistical methods that will reduce data volume. Some ex-amples of the discussion on the processing methods of multi-variate data in e-tongues and noses can be found in Richards et al.(2002), Scott et al. (2007), Palit et al. (2010), and Cetó et al. (2013).
Pattern recognition techniques (Fig. 2b) consist of the followingsequential stages: signal preprocessing, dimensionality reduc-tion, and prediction–validation (Rodríguez Méndez et al. 2016).The signal preprocessing prepares the feature vector for futureprocessing. It includes compensation for sensor drift, scaling ofthe data, and extracting representative parameters (Raposo et al.2016). The intrinsic complexity, richness, and cross-selectivity ofthe signals generated by sensor arrays provide certain advantages,as the resulting data set contains meaningful information aboutthe sample. The choice of method depends on the type of availableinput data acquired from the sensors and the type of informationthat is sought. The digital outputs generated by e-tongue sensorsneed to be analyzed and interpreted to provide useful informationto the operator (Wilson and Baietto 2009).
There are different advanced methods based on the statisticaltreatment of data that can be used for feature extraction and forfinding the most important parameters (Rodríguez Méndez et al.2016). Multi-variate data analysis comprises a set of techniquesthat can be used for the analysis of data sets with more than onevariable by reducing high dimensionality in a multi-variate prob-lem when variables are partly correlated (Wilson and Baietto2009). The first approach for the classification of the sample typ-ically involves graphical analysis and comparing samples or com-paring the identification of unknown elements with those fromknown sources in libraries (Dymerski et al. 2011). This involves thedevelopment of calibrated libraries, which are required for eache-tongue. Multi-variate analysis can be divided into unsupervisedor supervised techniques. Unsupervised methods are used to findor confirm patterns, making comparisons between different un-known samples to discriminate between them in cases where thedatabase of known samples has not been previously constructed.Supervised methods use the response variable to discover pat-terns associated with the response.
Unsupervised methods include singular value decompositionand principal components analysis (PCA), which use only the ma-trix of features by samples, as well as clustering. Supervised meth-ods include multiple regression and classification as well as morerecently developed techniques, such as sliced inverse regression,requiring a variable response, which is usually a phenotype, inaddition to the feature by sample matrix (Rodríguez Méndez et al.2016). The training process for supervised methods, e.g., artificialneural networks, involves a discrete amount of known sampledata to train the system and is very efficient in comparing un-known samples to known references (Hodgins 1997).
2.1.4. Conditioning of the liquid samplesWhen electrical signals are temperature dependent, a thermo-
stat and (or) thermal bath enables continuous maintenance–monitoring of the sample temperature during analysis, providingreproducibility and repeatability of measurements (Sìliwinìskaet al. 2014).
In some instances, flow techniques are important for e-tonguesystems, providing automation of the analytical methods. Themain benefits of automation of the analytical procedures are theincrease in sample frequency, minimization of sample contami-nation, improvement of analyst security, and lower reagent–sample consumption, which implies lower personal and consum-able costs (Cerdà et al. 2014). In an e-tongue system, there are twomain flow mechanisms that are commonly used for water analysis(Mesquita and Rangel 2009): flow injection analysis (FIA) operatedexclusively by hand and sequential injection analysis (SIA) basedon multi-commutation operation. Comparing the two techniquesSIA presents advantages over FIA, as it uses fewer reagents andresults in less waste production, being an environmentallyfriendly methodology that can perform the largest number ofanalyses. SIA systems have been successfully used with potentio-metric e-tongues (Cortina et al. 2005). When these techniques areused, FIA and SIA have the potential to decrease analysis time andincrease repeatability (Sìliwinìska et al. 2014). Nonetheless, thereis no solid argument in favor of using a particular flow techniqueseparately, but the advantages increase if they are combined ordeveloped specifically for the purpose, e.g., Richards et al. (2003).
2.2 ApplicationsBecause of the ease with which the e-tongue can be operated,
research efforts have been dedicated to the development and useof a wide range of applications, e.g., carcinogenic trihalomethanes inpublic water supply systems (Carvalho et al. 2007); detection ofphenolic compounds (Olivati et al. 2009); detection and monitor-ing of ammonium, nitrite, and nitrate ions in waters (Nuñez et al.2013); and quantification of ammonium and phosphate ions inwastewaters (Campos et al. 2014). Di Natale et al. (2000) combinede-nose and e-tongue sensors to classify urine, merging data ob-tained from each of the sensor arrays. Also, e-tongue coupled withe-nose was used for analyzing different types of Moroccan waters(Haddi et al. 2014). Table 1 presents a summary of some e-tongueand hybrid systems in different fields: aqueous environmentalmatrices and complex liquid matrices. Published manuscriptswere chosen based on either their importance for improving thesensing field or the complexity of the matrices, which can activelycontribute to the development of a new e-tongue system. Theresults from all these papers can serve to contribute to an up-graded e-tongue system for detecting EOC in aqueous environ-mental matrices.
Portable environmental sensing technology is particularly ap-pealing for pollution monitoring, but it is more limiting than itsnonportable counterparts. However, e-tongue systems have greatpotential and are highly relevant for continuous environmentalpollutant monitoring (Kim et al. 2012). It is important to stress thatenvironmental portable sensing technology meets the criteria ofgreen analysis: automation, low power consumption, avoidance
206 Environ. Rev. Vol. 27, 2019
Published by NRC Research Press
Env
iron
. Rev
. Dow
nloa
ded
fro
m w
ww
.nrc
rese
arch
pre
ss.c
om b
y M
rs C
átia
Mag
ro o
n 10
/16/
19F
or p
erso
nal
use
only
.

Tab
le1.
App
lica
tion
sof
e-to
ngu
ean
dh
ybri
dse
nsi
ng
syst
ems.
Sen
sin
gty
pe
Sen
sor
spec
ifica
tion
sM
atri
ces
Mea
sure
dp
aram
eter
sM
eth
ods
ofd
ata
anal
ysis
Con
cen
trat
ion
sD
etec
tion
lim
itM
ain
Con
clu
sion
sR
efer
ence
s
Envi
ron
men
talM
atri
ces
E-to
ngu
e22
elec
trod
esba
sed
onch
alco
gen
ide
glas
ses
vari
ousl
ysp
ike
and
con
ven
tion
alel
ectr
odes
Poll
uted
wat
er—
rive
rC
u,C
d,Fe
,Cr,
Zn,C
l,SO
4an
dH
MLR
,PLS
,NLL
San
dBP
–NN
[Cu
(6–8
),C
d(6
–7),
Zn(3
–5),
Cr
(4–7
),Fe
(4–7
),C
l(3–
5.3)
,SO
4(3
–3.9
),H
(2.6
–8)]
–log
[C]
—PL
S,N
LLS
and
BP–
NN
wer
esi
mil
arin
qual
itat
ive
info
rmat
ion
.D
iNat
ale
etal
.19
97
E-to
ngu
eM
onol
ith
ical
lyin
tegr
ated
arra
yof
chem
ical
sen
sors
,co
mp
osed
bysi
xIS
FETs
,ID
San
dsi
lico
ndi
ode
Min
eral
wat
erN
a+,K
+ ,C
a2+ ,
Cl−
,con
du
ctiv
ity
and
pot
enti
alre
dox
HC
Aan
dPC
A—
—Th
ed
evic
ere
spon
ded
wit
hgo
odre
pro
duc
ibil
ity
todi
ffer
ent
kin
ds
ofm
iner
alw
ater
byu
sin
gp
atte
rnre
cogn
itio
nm
eth
ods.
Mo
ren
oet
al.2
006
E-to
ngu
ePQ
Cse
nso
rar
ray
base
don
MIP
coat
ing
Ton
icw
ater
Qui
nin
ean
dsa
cch
arin
e—
Qu
inin
e(1
0–10
80)m
g/L
and
sacc
har
ine
(51–
3420
)mg/
LQ
uin
ine
2.04
mg/
Lan
dsa
cch
arin
e32
.8m
g/L
The
sen
sor
pro
vide
da
sati
sfac
tory
resp
onse
dete
ctin
gth
ech
ange
inbi
tter
tast
eof
drin
ks
and
beve
rage
sat
pra
ctic
alco
nce
ntr
atio
ns,
com
para
ble
toth
eta
ste
asse
ssm
ent
from
ah
um
anta
ste
pan
el.
Sun
etal
.200
8
E-to
ngu
eIm
ped
ance
resp
onse
-N
iTPP
Sco
mp
oun
don
aca
rbon
nan
otub
e-co
ated
glas
syca
rbon
elec
trod
e
Un
derg
roun
d,ta
pw
ater
and
lak
ew
ater
Bisp
hen
olA
,non
ylp
hen
ol,a
nd
eth
ynyl
estr
adio
l—
1
mol
/L15
–260
nm
ol/L
The
resu
lts
show
edth
atth
ese
nsi
tivi
ty,s
tabi
lity
and
dete
ctio
nli
mit
ofth
eco
mp
osit
eel
ectr
ode
wer
esi
gnifi
can
tly
imp
rove
d,co
mp
ared
wit
hth
ose
obta
ined
atel
ectr
odes
coat
edw
ith
carb
onn
anot
ubes
orot
her
mat
eria
ls.
Liu
etal
.201
1
Oth
ers
Vol
tam
met
ric
resp
onse
and
elec
troc
hem
ical
dete
ctio
n-
pol
ymer
/CN
Tfi
lmco
ated
elec
trod
e
Lake
and
rive
rw
ater
4-te
rt-O
ctyl
ph
enol
—6.
5–20
nM
0.5
nM
This
met
hod
avoi
dsa
ted
iou
sex
trac
tion
pro
cess
,it
isti
me
savi
ng
and
cost
effe
ctiv
e.T
his
met
hod
ther
efor
eca
nbe
appl
ied
for
the
dete
ctio
nof
4-te
rt-o
ctyl
phen
olat
low
con
cen
trat
ion
leve
lsan
dfo
rin
-sit
ean
don
-lin
em
onit
orin
gof
4-te
rtoc
tylp
hen
olin
wat
er.
Wan
etal
.201
3
E-to
ngu
ePo
ten
tiom
etri
cU
rban
wat
erre
serv
oirs
Dap
hnia
mag
nabi
oass
ayPC
A,C
CA
,PLS
Ran
dPR
M—
—It
was
fou
nd
that
root
mea
nsq
uar
ep
redi
ctio
ner
rors
,giv
enby
PRM
and
PLS,
did
not
exce
ed20
%.
Kir
san
ovet
al.
2014
Hyb
rid,
e-n
ose
cou
ple
dw
ith
e-to
ngu
e.
E-n
ose:
MO
Sh
ome-
fab
rica
ted;
e-to
ngu
e:p
oten
tiom
etri
c
Nat
ura
l,sp
ark
lin
g,ri
ver
and
tap
wat
eran
dw
aste
wat
er
E-n
ose:
CH
4an
dco
mbu
stib
les
gase
s,al
coh
ols,
xyle
ne,
tolu
ene,
NH
3,h
ydro
gen
,su
lfid
e,m
eth
ane;
E-t
ongu
e:C
a2+ ,
K+ ,
Cd2
+ ,F−
,Na+
,Cl−
,N
O3−
and
H+
PCA
and
LDA
——
The
met
alox
ide
sen
sors
toge
ther
wit
hPC
A,d
isti
ngu
ish
esth
ep
otab
lean
dn
onp
otab
lew
ater
sam
ple
sw
ith
ato
talv
aria
nce
of86
.98
%.T
he
pot
enti
omet
ric
sen
sor
show
edan
accu
racy
of10
0%su
cces
sra
tein
the
reco
gnit
ion
ofth
eei
ght
Mo
rocc
anw
ater
sou
rces
wit
hLC
Aco
up
led
wit
hle
ave-
one-
out
cros
s-va
lid
atio
nm
eth
od.
Had
diet
al.2
014
Oth
ers
All
ylm
erca
ptan
e-m
odifi
edgo
ldsu
rfac
ep
lasm
onre
son
ance
chip
and
imp
rin
ted
p(H
EMA
GA
)n
anofi
lm
Was
tew
ater
Tric
losa
n—
0.10
,0.2
0,an
d0.
30n
g/m
L0.
017
ng/
mL
Rec
over
yra
tes
wer
e98
%–1
02%
;C
omp
ared
wit
hot
her
com
ple
xan
alyt
icte
chn
iqu
es,T
CS-
imp
rin
ted
SPR
nan
osen
sor
dem
onst
rate
dco
mp
arab
leor
bett
erp
erfo
rman
ce.
Ata
ret
al.2
015
E-to
ngu
ePo
ten
tiom
etri
cC
omm
erci
alm
iner
alw
ater
,tap
wat
eran
dtw
oty
pes
ofsu
rfac
ew
ater
Cya
nob
acte
rial
mic
rocy
stin
toxi
ns
PLS
and
PLS-
DA
0.1
to10
g/
L10
−6m
ol/L
The
exp
erim
ents
dem
onst
rate
the
succ
ess
ofth
ee-
ton
gue
inth
em
icro
cyst
into
xin
sco
nce
ntr
atio
np
redi
ctio
nco
mp
arin
gto
stan
dard
chro
mat
ogra
ph
icte
chn
iqu
eU
HPL
C-D
AD
and
colo
rim
etri
cen
zym
atic
anal
ysis
.
Lvov
aet
al.2
016
Magro et al. 207
Published by NRC Research Press
Environ. Rev. Downloaded from www.nrcresearchpress.com by Mrs Cátia Magro on 10/16/19For personal use only.

Tab
le1
(con
tinu
ed).
Sen
sin
gty
pe
Sen
sor
spec
ifica
tion
sM
atri
ces
Mea
sure
dp
aram
eter
sM
eth
ods
ofd
ata
anal
ysis
Con
cen
trat
ion
sD
etec
tion
lim
itM
ain
Con
clu
sion
sR
efer
ence
s
E-to
ngu
eO
pti
cal–
colo
rim
etri
cse
nso
rar
ray
Min
eral
wat
erC
yclo
hex
anon
e,di
met
hylm
ethy
lpho
spho
nate
,pi
pera
zine
,im
idac
lopr
id,5
-fluo
-ro
urac
il,an
dpa
raox
on.
PCA
110
−6m
ol/L
to3.
910
−4m
ol/L
Belo
w3.
910
−4m
ol/L
Res
ults
show
that
the
sen
sors
are
sen
siti
ve,b
ut
wit
hlo
wse
lect
ivit
y,in
the
inte
rval
from
10−7
mol
/Lto
10−4
mol
/L.T
he
sen
sor
sign
als
show
ali
nea
rco
rrel
atio
nw
ith
the
loga
rith
mof
the
con
cen
trat
ion
.Alt
hou
ghth
eli
mit
edse
lect
ivit
yof
indi
vidu
alse
nso
rs,t
he
diff
eren
tse
nsi
tivi
typ
atte
rns
allo
wfo
ra
clea
rid
enti
fica
tion
ofth
eco
mp
oun
ds,
inde
pen
den
tof
thei
rco
nce
ntr
atio
n.
Gua
nai
sG
onca
lves
etal
.201
6
E-to
ngu
eV
olta
mm
etri
c–go
ldel
ectr
ode
Spik
edta
pw
ater
Brom
inat
edtr
ihal
oace
tic
acid
sPC
Aan
dA
NN
0–12
00
g/L
—Sa
tisf
acto
ryre
cove
ryva
lues
wer
eob
tain
edin
the
anal
ysis
ofsp
iked
wat
ersa
mp
les,
asde
mon
stra
ted
from
the
lack
ofm
atri
xef
fect
s.
Cet
óet
al.2
017
E-to
ngu
eIm
ped
ance
–red
ucti
onof
grap
hen
eox
ide
inth
ep
rese
nce
ofco
ndu
ctin
gp
olym
ers
(PED
OT:
PSS
and
pol
ypyr
-ro
le)a
nd
Au
NPs
Min
eral
and
tap
wat
erO
rgan
oph
osp
hat
ep
esti
cide
sPC
A0.
1–5
nm
olL−
10.
1n
mol
L−1
The
grap
hen
eox
ide
asso
ciat
edw
ith
con
duct
ive
pol
ymer
san
dgo
ldn
anop
arti
cles
gran
ted
good
stab
ilit
y,h
igh
rep
rod
ucib
ilit
yan
dh
igh
sen
siti
vity
toth
ede
velo
ped
e-to
ngu
e.W
ith
PCA
anal
ysis
,th
ee-
ton
gue
was
able
tocl
assi
fyso
luti
ons
ofdi
ffer
ent
pes
tici
des
atd
isti
nct
nan
omo
lar
con
cen
trat
ion
s,an
ddi
scri
min
ate
real
sam
ple
sfr
omth
esa
mpl
esp
rep
ared
inbu
ffer
solu
tion
s,p
rese
nti
ng
aco
rrel
atio
nw
ith
the
con
cen
trat
ion
and
the
valu
eof
the
PCco
mp
onen
t.
Facu
reet
al.2
017
Com
ple
xM
atri
ces
E-to
ngu
eV
olta
mm
etri
cBo
vin
em
ilk
Ch
lora
mp
hen
icol
,er
yth
rom
ycin
,kan
amyc
insu
lfat
e,n
eom
ycin
sulf
ate,
stre
pto
myc
insu
lfat
e,te
trac
ycli
ne,
and
dim
eth
ylsu
lfox
ide
PCA
,DFA
,PC
R,
PLSR
and
LS-S
VM
0.5,
1.0,
1.5,
and
2.0
g/
kg—
The
six
anti
biot
ics
atth
em
axim
um
resi
dual
leve
lsco
uld
not
bese
par
ated
from
bovi
ne
mil
kco
mp
lete
lyby
PCA
;all
the
sam
ple
sw
ere
dem
arca
ted
clea
rly
byD
FA;P
CR
had
the
mos
tst
able
resu
lts
inre
gres
sion
mod
els.
Wei
and
Wan
g20
11
Hyb
rid,
e-to
ngu
eco
up
led
wit
he-
nos
e
E-to
ngue
:po
tent
iom
etri
cel
ectr
ode
sens
ors;
e-no
se:P
orph
yrin
-ba
sed
quar
tzm
icro
bala
nce
gas
sens
orar
ray
Uri
ne
and
mil
kU
rin
e:p
rote
in,g
luco
se,
ket
ones
,uro
bil
inog
en,
bil
iru
bin
,blo
od,p
H,
spec
ific
wei
ght.
Mil
k:p
aste
uri
sed
and
ult
rah
igh
tem
per
atur
edi
stin
ctio
n
PCA
——
Hig
hab
stra
ctio
nle
vel
(pre
-an
alys
isof
each
syst
eman
dsu
cces
sive
mer
gin
gof
the
mos
tp
rom
inen
tfe
atu
res)
app
ears
tobe
the
mos
tsi
gnifi
can
tw
ayto
pre
serv
eth
ebe
stk
now
ledg
eco
nte
nt
from
each
sep
arat
ean
alys
is.
DiN
atal
eet
al.
2000
E-to
ngu
eIn
sen
tTS
-500
0Zan
dA
stre
e2So
diu
msa
cch
arin
,ib
upro
fen
lysi
nate
,ib
upro
fen,
acet
amin
oph
en,
caff
eine
,caf
fein
eci
trat
e,an
dqu
inin
ehy
droc
hlor
ide
Iden
tifi
cati
onPC
ASo
diu
msa
cch
arin
(8co
nce
ntr
atio
ns
betw
een
1an
d50
0m
mol
/L),
ibu
prof
enly
sin
ate
(10
con
cen
trat
ion
sbe
twee
n0.
01an
d30
mm
ol/L
),ib
up
rofe
n(10
conc
entr
atio
nsbe
twee
n0.
013
and
0.13
mm
ol/L
),ac
etam
inop
hen
(10co
ncen
trat
ions
betw
een
0.13
and
66m
mol
/L),
caff
ein
e(10
conc
entr
atio
nsbe
twee
n0.
05an
d90
mm
ol/L
),ca
ffei
ne
citr
ate
(10co
ncen
trat
ions
betw
een
0.03
and
45m
mol
/L),
quin
ine
hydr
ochl
orid
e(9
conc
entr
atio
nsbe
twee
n0.
02an
d5
mm
ol/L
)
—Io
nic
subs
tan
ces
are
easi
erto
dete
ctth
ann
eutr
alon
es;
qual
ifica
tion
cou
ldon
lybe
per
form
edfo
rth
eT
S-50
00Z;
Inse
nt
tast
ese
nso
rp
rovi
des
mor
ere
liab
le(in
vitr
o/in
vivo
corr
elat
ion
)an
dp
reci
se(r
epro
duci
bil
ity
and
rep
eata
bili
ty).
Woe
rtz
etal
.201
1
208 Environ. Rev. Vol. 27, 2019
Published by NRC Research Press
Environ. Rev. Downloaded from www.nrcresearchpress.com by Mrs Cátia Magro on 10/16/19For personal use only.

Tab
le1
(con
clud
ed).
Sen
sin
gty
pe
Sen
sor
spec
ifica
tion
sM
atri
ces
Mea
sure
dp
aram
eter
sM
eth
ods
ofd
ata
anal
ysis
Con
cen
trat
ion
sD
etec
tion
lim
itM
ain
Con
clu
sion
sR
efer
ence
s
Oth
ers
Mu
lti-w
alle
dca
rbon
nan
otub
esm
odifi
edgl
assy
carb
onel
ectr
ode
Eth
anol
4-n
-oct
ylp
hen
ol—
5×
10−8
to1
×10
−5m
ol/L
1.5
×10
−8m
ol/L
The
mod
ified
elec
trod
esh
owed
good
sele
ctiv
ity,
sen
siti
vity
,re
pro
duc
ibil
ity,
and
hig
hst
abil
ity.
Zhen
get
al.2
012
E-to
ngu
e15
pot
enti
omet
ric
pol
y(vi
nyl
chlo
ride
)m
embr
ane
sen
sors
sen
siti
veto
cati
ons
and
anio
ns
Mil
li-Q
dist
ille
dw
ater
NO
− 3,N
O− 2,
Cl−
,NH
+ 4,K
+,an
dN
a+A
NN
NO
− 3(0
.01–
1m
M),
NO
− 2(0
.05–
5m
M),
Cl−
(0.2
–20
mM
),N
H+ 4
(0.0
1–1
mM
),K
+(0
.01–
1m
M)a
nd
Na+
(0.2
–20
mM
)
NO
− 3(4
.6×
10−6
mol
/L),
NO
− 2(3
.4×
10−5
mol
/L),
Cl−
(7.9
×10
−5m
ol/L
),N
H+ 4
(1.0
×10
−7m
ol/L
),K
+(7
.3×
10−8
mol
/L)
and
Na+
(6.4
×10
−7m
ol/L
E-t
ongu
esy
stem
allo
wed
the
quan
tifi
cati
onof
nit
rate
,n
itri
te,a
nd
amm
oniu
min
anaq
ueo
us
med
ium
inth
ep
rese
nce
ofin
terf
erin
gsp
ecie
ssu
chas
sodi
um
,pot
assi
um
and
chlo
ride
ion
s.It
was
pos
sibl
eto
dist
ingu
ish
betw
een
nit
rate
and
nit
rite
spec
ies
wit
hso
me
devi
atio
ns
for
amm
oniu
m.
Nu
ñez
etal
.201
3
Oth
ers
Elec
tric
alim
ped
ance
ofPA
H/P
AZO
nan
ofilm
Eth
anol
Del
tam
eth
rin
—10
−10
Mto
10−6
MB
elow
0.1
nM
Elec
tric
alre
sist
ance
mea
sure
men
tat
100
Hz,
reve
aled
tob
ean
adeq
uat
eva
riab
lefo
rde
ltam
eth
rin
con
cen
trat
ion
tran
sdu
ctio
n.
Abe
gão
etal
.201
3
E-to
ngu
ePo
ten
tiom
etri
c–8
min
iatu
rize
del
ectr
odes
base
don
PVC
mem
bra
nes
(pla
stic
ized
usin
gD
OS
oro-
NPO
E),
con
tain
ing
anap
pro
pri
ate
lip
oph
ilic
salt
,ex
hib
itin
gge
ner
ican
ion
(TD
MA
C,
TBH
DPB
,IL)
orca
tion
(KTF
BB)
resp
onse
Act
ive
Phar
mac
euti
cal
Ingr
edie
nts
Ace
tam
inop
hen
,asc
orb
icac
id,
acet
ylsa
licy
lic
acid
,an
dca
ffei
ne
asan
inte
rfer
ent
PLS
and
AN
NA
ceta
min
oph
en(1
–20
mm
ol/L
),as
corb
icac
id(0
.3–7
mm
ol/L
),ac
etyl
salic
ylic
acid
(1.4
–8m
mol
/L),
caff
eine
(0.13
–1.3
mm
ol/L
)
—Th
eex
trac
tion
ofdy
nam
icco
mp
onen
tsof
the
tran
sien
tre
spon
seem
plo
yin
gth
eW
avel
ettr
ansf
orm
sth
ere
mov
alof
the
less
sign
ifica
nt
inp
uts
bym
ean
sof
Cau
sal
Inde
xp
run
ing
and
trai
nin
gof
anA
NN
wit
hth
ese
lect
edco
effi
cien
tsal
low
edth
esi
mu
ltan
eous
dete
rmin
atio
nof
the
3A
PIs
cou
nte
rbal
anci
ng
any
inte
rfer
ence
cau
sed
byca
ffe
ine.
Wes
oły
etal
.201
6
Oth
ers
Pote
nti
omet
ric
Phar
mac
euti
cals
Dis
solu
tion
iden
tifi
cati
on:
Nap
roxe
nSo
diu
man
dD
iph
enh
ydra
min
eH
ydro
chlo
rid
e
—22
0m
gof
nap
roxe
nso
diu
man
d25
mg
ofdi
ph
enh
ydra
min
eh
ydro
chlo
ride
per
tabl
et.
Nap
roxe
nSo
diu
m:
8.28
×10
−5M
Dip
hen
hyd
ram
ine
Hyd
roch
lori
de:
7.94
×10
−6M
In-li
ne
pot
enti
omet
ryin
the
sim
ult
aneo
usas
say
and
diss
olut
ion
mon
itor
ing
ofbi
nar
yfo
rmu
late
dor
also
lid
dosa
gefo
rms.
Sheh
ata
etal
.201
7
E-to
ngu
eV
olta
mm
etri
c:ar
ray
of4
sen
sors
,ref
eren
ceA
g/A
gCla
nd
Ptco
un
ter
elec
trod
e
Aqu
eou
sco
mp
lex
solu
tion
2,4-
dini
trop
hen
ol,4
-nit
roph
enol
and
picr
icac
idA
NN
0–30
0
g/L
—Th
em
odel
succ
essf
ully
pre
dict
edth
eco
nce
ntr
atio
nof
the
thre
eco
nsi
der
edp
hen
ols
wit
ha
nor
mal
ized
root
mea
nsq
uar
eer
ror
of0.
030
and
0.07
6fo
rth
etr
ain
ing
and
test
subs
ets,
resp
ecti
vely
,an
dr
≥0.
95.
Gon
zále
z-C
alab
uig
etal
.201
8
No
te:M
LR,m
ult
iple
lin
ear
regr
essi
on;P
LS,p
arti
alle
ast
squ
ares
;NLL
S,n
onli
nea
rle
ast
squ
ares
;BP–
NN
,bac
k-p
ropa
gati
on–n
eura
lnet
wor
k;I
SFET
,ion
-sel
ecti
vefi
eld-
effe
cttr
ansi
stor
s;ID
S,in
terd
igit
ated
pla
tin
um
elec
trod
e;H
CA
,hie
rarc
hic
alcl
ust
erin
gan
alys
is;P
CA
,pri
nci
palc
ompo
nen
tan
alys
is;C
CA
,can
onic
alco
rrel
atio
nan
alys
is;P
QC
,pie
zoel
ectr
icq
uar
tzcr
ysta
l;M
IP,m
olec
ula
rly
imp
rin
ted
pol
ymer
;NiT
PPS,
Ni(
II)t
etra
kis
(4-
sulf
onat
oph
enyl
)p
orp
hyr
i;C
NT,
carb
onn
anot
ube
s;C
CA
,ca
non
ical
corr
elat
ion
anal
ysis
;PL
SR,
par
tial
leas
tsq
uar
esre
gres
sion
;PR
M,
par
tial
rob
ust
M-r
egre
ssio
n;
MO
S,m
etal
oxid
ese
mic
ondu
ctor
;LD
A,
linea
rdi
scri
min
ant
anal
ysis
;p(H
EMA
GA
),po
ly(2
-hyd
roxy
eth
ylm
eth
acry
late
–met
hac
rylo
ylam
idog
luta
mic
acid
);TC
S,tr
iclo
san
;SPR
,su
rfac
ep
lasm
onre
sona
nce;
PLS-
DA
,par
tial
leas
tsq
uare
s-di
scri
min
anta
nal
ysis
;UH
PLC
-DA
D,U
ltra
Hig
hPe
rfor
man
ceLi
quid
Ch
rom
atog
raph
yco
uple
dto
Dio
deA
rray
Det
ecti
on;A
NN
,art
ifici
aln
eura
lnet
wor
k;PE
DO
T:PS
S,Po
ly(3
,4-e
thyl
ened
ioxy
thio
phen
e):P
olys
tyre
ne
sulf
onat
e;A
uN
Ps,g
old
nan
opar
ticl
es;D
FA,d
iscr
imin
ant
fun
ctio
nan
alys
is;
PCR
,p
rin
cip
alco
mpo
nen
tre
gres
sion
;LS
-SV
M,
leas
tsq
uar
es–s
up
por
tve
ctor
mac
hin
es;
PAH
,p
oly(
ally
lam
ine
hyd
roch
lori
de);
PAZO
,p
oly[
1-[4
-(3-c
arb
oxy-
4-h
ydro
xyp
hen
ylaz
o)be
nze
ne
sulf
onam
ido]
-1,2
-eth
aned
iyl,
sodi
um
salt
];PV
C,
pol
y(vi
nyl
chlo
ride
);D
OS,
bis(
2-et
hyl
hex
yl)
120
seba
cate
;o-
NPO
E,p
last
iciz
ers:
o-n
itro
-ph
enyl
octy
let
her
;T
DM
AC
,tr
idod
ecyl
met
hyl
–am
mon
ium
chlo
ride
;T
BH
DPB
,tr
ibu
tylh
exad
ecyl
ph
os-p
hon
ium
brom
ide;
IL,i
onic
liqu
id;K
TFPB
,pot
assi
um
tetr
akis
[3,5
-bis
(tri
-flu
orom
eth
yl)p
hen
yl]b
orat
e.
Magro et al. 209
Published by NRC Research Press
Environ. Rev. Downloaded from www.nrcresearchpress.com by Mrs Cátia Magro on 10/16/19For personal use only.

of reagent use, and no waste generation (Tobiszewski et al. 2010).Traditional analytical instruments can be less attractive, as theyare not able to provide continuous monitoring or work as remotesensing, and have high operating costs.
3. Opportunities in sensing technology applied toaqueous matrices
Environmental samples can be extremely complex. Thereforethe main obstacles when dealing with liquid samples are the lowconcentrations of EOC occurrence in water media (Bourgeois et al.2003; Justino et al. 2015).
Either e-tongue systems or chromatography methods can beused to detect and determine such pollutants at low concentra-tions (ng/L or pg/L) levels. Consequently, to validate e-tongue data,chromatography methods are often used to confirm the concen-tration levels of the target compound. Tahri et al. (2018) showedthat Headspace (HS) Gas Chromatography – Mass Spectrometry(MS) could contribute to the validation results obtained from avoltammetric e-tongue system. Here are some examples of studiesthat can be coupled with an e-tongue system. (i) Gas chromatog-raphy and liquid cromatography (LC), both coupled with tandemMS, were used to determine the contaminants of emerging con-cern (e.g., nonlyphenol–PPCP) in municipal wastewater effluentsand marine receiving water (Vidal-Dorsch et al. 2012). (ii) Ronanand Mchugh (2013) used LC coupled with tandem MS with electro-spray ionization in negative mode to determine natural and syn-thetic steroid estrogens in seawater and marine biota. (iii) Li et al.(2016) also used the LC-MS–MS method to determine 45 commonlyused PPCP in sludge. To achieve equal ranges of accuracy in detec-tion and analysis when compared with chromatography methods,many electronic sensing investigations focused their efforts onthe detection of contaminants in real environmental matrices.
A SWOT (strengths, weaknesses, opportunities, threats) analy-sis was carried out, Fig. 3 highlights some of advantages and lim-itations of e-tongue sensing; additionally, it emphasizes thepositive external aspects that would enhance the benefits of thissystem and points out some of the negative aspects that can jeop-ardize the competitive advantages of e-tongue sensing. One of themain advantages of this technology is that it enables quick accessto information in simple or complex liquid, which, combinedwith its relatively easy production, will soon allow the e-tongue tobe used on a global scale. Moreover, e-tongue systems are embod-ied in the trend of Industry 4.0, allowing for the use of portable
instruments in environmental site assessments, automation, andonline detection (the internet of things). Environmental samplesrepresent a composite mixture of various compounds in gaseous,liquid, or solid states. This complexity can result in analyticalproblems, such as interferences, which usually pose a challengefor field analysts. From a global point of view, traditional environ-mental assessment techniques using off-side analysis provide bet-ter data quality, but the trade-off is a poorer understanding of thepollution distribution and a lower information value of the dataset compared with on-site analysis.
The fast progress in e-tongue technology in recent years hasincreased the number of applications for environmental sampleanalysis. An example of a successful e-tongue system used in aque-ous environment media is the work of Campos et al. (2013), whodeveloped an e-tongue to monitor the presence of ammoniumnitrate in water based on pulse voltammetry. It consisted of anarray of eight working electrodes (Au, Pt, Rh, Ir, Cu, Co, Ag, and Ni)encapsulated in a stainless steel cylinder. The electrochemicalresponse of these different electrodes was studied in the presenceof ammonium nitrate in water to further improve the design ofthe wave form used in the voltammetric tongue. Afterwards, theresponse was tested with a set of 15 common inorganic salts(NH4NO3, MgSO4, NH4Cl, NaCl. Na2CO3, (NH4)2SO4, MgCl2, Na3PO4,K2SO4, K2CO3, CaCl2, NaH2PO4, KCl, NaNO3, K2HPO4). PCA showedgood discrimination between ammonium nitrate and the remainingstudied salts. One year later, the same research team used a voltam-metric e-tongue to evaluate the concentration of ammonia andorthophosphate in influent and effluent wastewater, since the quan-tification of these components in WWTP has further implications inthe eutrophication process (Campos et al. 2014).
Regarding detection of EOC, e.g., PPCP, and excluding the casesof pharmaceutical applications, the publications mentioninge-tongues are practically nonexistent in the literature (Raposoet al. 2016 and the references therein). PPCP are of increasingconcern because of their environmental persistence, accumula-tion in the environment at a global scale, and their steady detec-tion in all environmental water compartments. Pharmaceuticalproducts, for instance, are additionally designed to maintain theiractive forms and chemical properties long enough to performtheir therapeutic purposes, and thus at least 50% of a dose may bepotentially excreted unchanged into the environment, wherethese products will then remain (Bila and Dezotti 2003). Conse-quently, PPCP have been widely detected in the effluents of
Fig. 3. Electronic tongue SWOT (strengths, weaknesses, opportunities, threats) analysis.
210 Environ. Rev. Vol. 27, 2019
Published by NRC Research Press
Env
iron
. Rev
. Dow
nloa
ded
fro
m w
ww
.nrc
rese
arch
pre
ss.c
om b
y M
rs C
átia
Mag
ro o
n 10
/16/
19F
or p
erso
nal
use
only
.

WWTP due to their incomplete removal treatment rates and intheir receiving water bodies (Matamoros et al. 2009; Zhang et al.2014). PPCP and their metabolites (generated by metabolizationand abiotic processes, such as hydrolysis or photolysis) are usuallydetected in trace concentrations, and many of them have raisedconsiderable ecotoxicological concerns (Stülten et al. 2008).
To address detection of these micropollutants, attempts have beencarried out to develop sensors that can work on the continuous mon-itoring in aqueouscomplex matrices. Arvandet al. (2012) developed avoltammetric sensor based on GC electrodes modified with carbonnanotubes for the detection of diclofenac (anti-inflammatory) inblood serum and seawater. Their aim was to develop a new technol-ogy that: (i) is simple, (ii) has a reduced-cost nanocomposition, (iii) hasmulti-functional properties benefitting from multi-walled carbontubes (MWCNT) – Cu(OH)2 nanoparticles and hydrophobic ionic liq-uid 1-ethyl-3-methylimidazolium hexafluorophosphate, and (iv) hasgood electrocatalytic activity for the electro-oxidation of diclo-fenac. The authors achieved a new voltammetric sensor sensitivein the range of 0.18–119 mM, with a detection limit of 0.04 mM(Arvand et al. 2012). Liu et al. (2011) developed an impedanceNi(II)tetrakis(4-sulfonatophenyl) porphyrin (NiTPPS) carbon nanotubecomposite electrode for the detection of three endocrine disruptingcompounds—bisphenol A, nonylphenol, and ethynylestradiol—inunderground, tap, and lake water. The authors optimized experi-mental parameters: hydrodynamic potential of 0.7 V for FIA andNiTPPS surface coverage of 2.2 nmol cm−2. The final results showedan improvement in the sensitivity, stability, and detection limit(from 15 nmol/L to 260 nmol/L).
To detect 4-n-octylphenol (OP) in solutions with a concentrationrange of 5 × 10⁻⁸ to 1 × 10⁻⁵ mol/L, Zheng et al. (2012) developed aMWCNT modified GC electrode (GCE). The oxidation peak of OP(oxidized directly on the MWCNT/GCE) showed an improvementwith the use of MWCNT/GCE, compared with those using a bareGCE. The detection limit achieved was 1.5 × 10⁻⁸ mol/L. Wan et al.(2013) conducted studies in the detection of 4-tert-octylphenol inlake and river waters with a polymer–carbon nanotube film-coated electrode. The electrode was prepared by coating a pol-ished and clean GCE with a carbon nanotube film and thencovering it with a conducting film from L-lysine. The detectionlimit achieved was 0.5 nM, and the method could be applied forlow concentration, in-site and online monitoring of 4-tertoctylphenolin water (Wan et al. 2013).
A sensing layer, based on layer-by-layer films prepared withthe common polyelectrolyte poly (allylamine hydrochloride)and pazo-polyectrolyte poly[1-[4-(3-carboxy–4-hydroxyphenyl-azo)benzenesulfonamido]-1,2-ethanediyl, sodium salt] was used forthe detection of deltamethrin, a pesticide, where the sensorresponse was obtained from impedance spectroscopy measure-ments (100 Hz) (Abegão et al. 2013). Sensor sensitivity was 41.1 ±0.7 k per decade of concentration and had a reproducibility ofapproximately 2% in a binary solution of ethanol and deltame-thrin. The sensor was able to detect concentrations below 0.1 nM.One year later, Pimentel (2014) also worked with an e-tongue sys-tem based on impedance spectroscopy, which attempted to detecta low concentration (nM and pM) of ibuprofen in an aqueousmedium. The same working group developed a nano-sensor thatcan detect picomolar concentrations of triclosan in an aqueousmedium (Marques et al. 2017). Also seeking to detect triclosan, Gaoet al. (2010) synthesized molecularly imprinted core-shell carbonnanotubes and detected PPCP in aqueous matrices in concentra-tion ranges from 0.01 to 40 g/mL.
For sensitive and selective detection of the Carmine pigment in li-quidsamples,Zhaoetal. (2018) developedascreen-printedcarbon-baseddisposable electrochemical sensor: PEDOT (Polystyrene sulfonate –gold nanoparticles – carbon-Poly(3,4-ethylenedioxythiophene) andMercaptoethylamine. The sensor response was obtained by cyclicvoltammetry, differential pulse stripping voltammetry, and imped-ance spectroscopy in a range of concentrations between 9.0 × 10⁻⁹ to
3.9 × 10⁻⁶ mol/L, with a detection limit of 6.05 × 10⁻⁹ mol/L showinggood stability and reproducibility.
The full implementation of the e-tongue system will require ahigh-sensitivity EOC concentration in the environment with long-term stability, together with amenability of being incorporatedinto automatic systems and then in the field. In contrast to theinorganic compound e-tongue applications (e.g., heavy metalsthat will potentially be deployable in the near future), e-tonguesystems designed to detect organic molecules in complex aqueousmatrices will require further development, especially regardingselectivity and stability (Díaz-gonzález et al. 2016).
4. ConclusionsSince 1989, there has been an ever greater number of scientific
publications regarding the applications of e-tongue systems forenvironmental monitoring. E-tongue prototypes can have differ-ent types of measuring methods (e.g., potentiometric, voltammet-ric, amperometric, or impedance), and several applications havebeen developed and studied over the years, resulting in a deeperunderstanding of these devices.
The choice of e-tongue methods is highly dependent on thecomposition and complexity of the solution to be examined.In real-time monitoring of EOC contaminants, such as PPCP,e-tongue sensing technologies are still under development. To thebest of the authors’ knowledge, there are a few works concerningboth environmental aqueous matrices and EOC. Nevertheless, theefforts to properly train these devices to characterize complexliquid samples and detect contaminants in aqueous media haveincreased the possibility of constructing a device that is sensitiveenough to be comparable with conventional techniques. How-ever, despite the high sensitivity, low-cost, easy operation, andrapid response that will enhance its commercial value, there re-mains a lack of selectivity as far as e-tongue data are concerned.
E-tongue technology will undoubtedly find important applica-tions in environmental monitoring. With continuing strides be-ing made in scientific research, the e-tongue approach employedwithout sample preconditioning and using a simple analysis canaddress the problem of EOC in aqueous matrices. The hybrid sys-tems that reap the advantages of different sensing devices, or thee-tongue system working with the impedance spectroscopy re-sponse and nanofilms produced (i.e., with the layer-by-layer tech-nique) may present possible solutions that are of interest for thefurther development of real-time sensors.
AcknowledgementsFinancial support was provided by project “Development of
Nanostrutures for Detection of Triclosan Traces on Aquatic Envi-ronments” (PTDC/FIS-NAN/0909/2014). CENSE-Center for Environ-mental and Sustainability Research, which is financed by nationalfunds from FCT/MEC (UID/AMB/04085/2013). This paper is part ofa project that has received funding from the European Union’sHorizon 2020 research and innovation programme under theMarie Skłodowska-Curie grant agreement No 778045. C. Magroacknowledges to Fundação para a Ciência e a Tecnologia for herPhD fellowship (SFRH/BD/114674/2016).
ReferencesAbegão, L., Ribeiro, J., Ribeiro, P., and Raposo, M. 2013. Nano-molar deltamethrin
sensor based on electrical impedance of PAH/PAZO layer-by-layer sensingfilms. Sensors, 13(8): 10167–10176. doi:10.3390/s130810167. PMID:23966185.
Albaladejo, C., Sánchez, P., Iborra, A., Soto, F., López, J.A., and Torres, R. 2010.Wireless sensor networks for oceanographic monitoring: a systematic re-view. Sensors, 10(7): 6948–6968. doi:10.3390/s100706948. PMID:22163583.
Albareda-Sirvent, M., Merkoçi, A., and Alegret, S. 2001. Pesticide determinationin tap water and juice samples using disposable amperometric biosensorsmade using thick-film technology. Anal. Chim. Acta, 442(1): 35–44. doi:10.1016/S0003-2670(01)01017-0.
American National Standards Institute (ANSI). 1982. Electrical transducer no-menclature and terminology. Instrument Society of America, Research Tri-angle Park, N. C.
Magro et al. 211
Published by NRC Research Press
Env
iron
. Rev
. Dow
nloa
ded
fro
m w
ww
.nrc
rese
arch
pre
ss.c
om b
y M
rs C
átia
Mag
ro o
n 10
/16/
19F
or p
erso
nal
use
only
.

Arvand, M., Gholizadeh, T.M., and Zanjanchi, M.A. 2012. MWCNTs/Cu (OH)2 nanoparticles/IL nanocomposite modified glassy carbon electrode as a volta-mmetric sensor for determination of the non-steroidal anti-inflammatorydrug diclofenac. Mater. Sci. Eng. C, 32(6): 1682–1689. doi:10.1016/j.msec.2012.04.066.
Askim, J.R., Mahmoudi, M., and Suslick, K.S. 2013. Optical sensor arrays forchemical sensing: the optoelectronic nose. Chem. Soc. Rev. 42(22): 8649.doi:10.1039/c3cs60179j. PMID:24091381.
Atar, N., Eren, T., Yola, M.L., and Wang, S. 2015. A sensitive molecular imprintedsurface plasmon resonance nanosensor for selective determination of tracetriclosan in wastewater. Sens. Actuators, B, 216: 638–644. doi:10.1016/j.snb.2015.04.076.
Banerjee, R., Tudu, B., Bandyopadhyay, R., and Bhattacharyya, N. 2016. A reviewon combined odor and taste sensor systems. J. Food Eng. 190: 10–21. doi:10.1016/j.jfoodeng.2016.06.001.
Bila, D.M., and Dezotti, M. 2003. Fármacos no meio ambiente. Quim. Nova, 26(4):523–530. doi:10.1590/S0100-40422003000400015.
Bourgeois, W., Romain, A.C., Nicolas, J., and Stuetz, R.M. 2003. The use of sensorarrays for environmental monitoring: interests and limitations. J. Environ.Monit. 5: 852–860. doi:10.1039/b307905h. PMID:14710922.
Campos, I., Alcañiz, M., Aguado, D., Barat, R., Ferrer, J., Gil, L., et al. 2012. Avoltammetric electronic tongue as tool for water quality monitoring inwastewater treatment plants. Water Res. 46(8): 2605–2614. doi:10.1016/j.watres.2012.02.029. PMID:22424964.
Campos, I., Pascual, L., Soto, J., Gil-Sánchez, L., and Martínez-Máñez, R. 2013. Anelectronic tongue designed to detect ammonium nitrate in aqueous solu-tions. Sensors, 13(10): 14064–14078. doi:10.3390/s131014064. PMID:24145916.
Campos, I., Sangrador, A., Bataller, R., Aguado, D., Barat, R., Soto, J., andMartínez-Máñez, R. 2014. Ammonium and phosphate quantification inwastewater by using a voltammetric electronic tongue. Electroanalysis,26(3): 588–595. doi:10.1002/elan.201300538.
Capelli, L., Sironi, S., and Del Rosso, R. 2014. Electronic noses for environmentalmonitoring applications. Sensors, 14(11): 19979–20007. doi:10.3390/s141119979.PMID:25347583.
Carvalho, E.R., Consolin Filho, N., Venancio, E.C., Jr., O, O.N., Mattoso, L.H.C.,and Martin-neto, L. 2007. Detection of brominated by-products using a sensorarray based on nanostructured thin films of conducting polymers. Sensors,7(12): 3258–3271. doi:10.3390/s7123258. PMID:28903292.
Cerdà, V., Ferrer, L., Avivar, J., and Cerdà, A. 2014. Evolution and description ofthe principal flow techniques. In Flow Analysis. pp. 1–42. doi:10.1016/B978-0-444-59596-6.00001-2.
Cetó, X., Céspedes, F., and del Valle, M. 2013. Comparison of methods for theprocessing of voltammetric electronic tongues data. Microchim. Acta, 180:319–330. doi:10.1007/s00604-012-0938-7.
Cetó, X., Voelcker, N.H., and Prieto-Simón, B. 2016. Bioelectronic tongues: newtrends and applications in water and food analysis. Biosens. Bioelectron. 79:608–626. doi:10.1016/j.bios.2015.12.075. PMID:26761617.
Cetó, X., Saint, C., Chow, C.W.K., Voelcker, N.H., and Prieto-Simón, B. 2017.Electrochemical fingerprints of brominated trihaloacetic acids (HAA3) mix-tures in water. Sens. Actuators, B, 247: 70–77. doi:10.1016/j.snb.2017.02.179.
Ciosek, P., and Wróblewski, W. 2007. Sensor arrays for liquid sensing –electronic tongue systems. Analyst, 132(10): 963–978. doi:10.1039/b705107g.PMID:17893798.
Corcoran, E., Nellemann, C., Baker, E., Bos, R., Osborn, D., and Savelli, H. (eds).2010. Sick water? The central role of wastewater management in sustainabledevelopment. A rapid response assessment. UNEP/Earthprint.
Cortina, M., Gutés, A., Alegreta, S., and del Valle, M. 2005. Sequential injectionsystem with higher dimensional electrochemical sensor signals Part 2. Po-tentiometric e-tongue for the determination of alkaline ions. Talanta, 66:1197–1206. doi:10.1016/j.talanta.2005.01.023. PMID:18970109.
Daughton, C.G. 2004. Non-regulated water contaminants: emerging research.Environ. Impact Assess. Rev. 24: 711–732. doi:10.1016/j.eiar.2004.06.003.
del Valle, M. 2010. Electronic tongues employing electrochemical sensors. Elec-troanalysis, 22(14): 1539–1555. doi:10.1002/elan.201000013.
Di Natale, C., Macagnano, A., Davide, F., D’Amico, A., Legin, A., Vlasov, Y., et al.1997. Multicomponent analysis on polluted waters by means of an electronictongue. Sens. Actuators, B, 44(1–3): 423–428. doi:10.1016/S0925-4005(97)00169-X.
Di Natale, C., Paolesse, R., Macagnano, A., Mantini, A., D’Amico, A., Legin, A.,et al. 2000. Electronic nose and electronic tongue integration for improvedclassification of clinical and food samples. Sens. Actuators, B, 64(1–3): 15–21.doi:10.1016/S0925-4005(99)00477-3.
Díaz-González, M., Gutiérrez-capitán, M., Niu, P., Baldi, A., Jiménez-Jorquera, C.,and Fernández-Sánchez, C. 2016. Electrochemical devices for the detection ofpriority pollutants listed in the EU water framework directive. TrAC,TrendsAnal. Chem. 77: 186–202. doi:10.1016/j.trac.2015.11.023.
Dymerski, T.M., Chmiel, T.M., and Wardencki, W. 2011. An odor-sensing system-powerful technique for foodstuff studies. Rev. Sci. Instrum. 82(11). doi:10.1063/1.3660805.
Ellis, J.B. 2008. Assessing sources and impacts of priority PPCP compounds inurban receiving waters. 11th Int. Conf. Urban Drainage, Edinburgh, Scotland,U.K. pp. 1–10.
Escuder-Gilabert, L., and Peris, M. 2010. Review: highlights in recent applications
of electronic tongues in food analysis. Anal. Chim. Acta, 665(1): 15–25. doi:10.1016/j.aca.2010.03.017. PMID:20381685.
Facure, M.H.M., Mercante, L.A., Mattoso, L.H.C., and Correa, D.S. 2017. Detectionof trace levels of organophosphate pesticides using an electronic tonguebased on graphene hybrid nanocomposites. Talanta, 167: 59–66. doi:10.1016/j.talanta.2017.02.005.
Ferreira, M., Riul, A., Wohnrath, K., Fonseca, F.J., Oliveira, O.N., andMattoso, L.H.C. 2003. High-performance taste sensor made from Langmuir-Blodgett films of conducting polymers and a ruthenium complex. Anal.Chem. 75(4): 953–955. doi:10.1021/ac026031p. PMID:12622390.
Filippini, D., Alimelli, A., Di Natale, C., Paolesse, R., D’Amico, A., andLundström, I. 2006. Chemical sensing with familiar devices. Angew. Chem.,Int. Ed. 45: 3800–3803. doi:10.1002/anie.200600050. PMID:16671131.
Fraden, J. 2010. Handbook of modern sensors: physics, designs, and applications,Fourth Edition. Edited by J. Fraden. Springer Science+Business Media, NewYork, N.Y., USA. doi:10.1007/978-1-4419-6466-3.
Gałuszka, A., Migaszewski, Z.M., and Namiesnik, J. 2015. Moving your laborato-ries to the field – advantages and limitations of the use of field portableinstruments in environmental sample analysis. Environ. Res. 140: 593–603.doi:10.1016/j.envres.2015.05.017. PMID:26051907.
Gao, R., Kong, X., Su, F., He, X., Chen, L., and Zhang, Y. 2010. Synthesis andevaluation of molecularly imprinted core-shell carbon nanotubes for thedetermination of triclosan in environmental water samples. J. Chromatogr.A, 1217(52): 8095–8102. doi:10.1016/j.chroma.2010.10.121. PMID:21093867.
Geissen, V., Mol, H., Klumpp, E., Umlauf, G., Nadal, M., van der Ploeg, M., et al.2015. Emerging pollutants in the environment: a challenge for water re-source management. International Soil and Water Conservation Research,3(1): 57–65. doi:10.1016/j.iswcr.2015.03.002.
Goméz-Caravaca, A.M., Maggio, R.M., and Cerretani, L. 2016. Chemometric ap-plications to assess quality and critical parameters of virgin and extra-virginolive oil, a review. Anal. Chim. Acta, 913: 1–21. doi:10.1016/j.aca.2016.01.025.PMID:26944986.
González-Calabuig, A., Cetó, X., and Del Valle, M. 2018. A voltammetric elec-tronic tongue for the resolution of ternary nitrophenol mixtures. Sensors,18(1): 1–11 doi:10.3390/s18010216.
Gründler, P. 2007. Chemical sensors - an introduction for scientists and engi-neers. Springer Berlin Heidelberg, Germany. doi:10.1007/978-3-540-45743-5.
Guanais Goncalves, C., Dini, F., Martinelli, E., Catini, A., Lundström, I.,Paolesse, R., et al. 2016. Detection of diverse potential threats in water withan array of optical sensors. Sens. Actuators, B, 236: 997–1004. doi:10.1016/j.snb.2016.04.080.
Gutiérrez, M., Gutiérrez, J.M., Alegret, S., Leija, L., Hernández, P.R., Muñoz, R.,et al. 2008. New sensor system for environmental monitoring: the potentio-metric electronic tongue. In International Congress on Environmental Mod-elling and Software, Barcelona, Spain. pp. 54–60.
Haddi, Z., Bougrini, M., Tahri, K., Braham, Y., Souiri, M., El Bari, N., et al. 2014. Ahybrid system based on an electronic nose coupled with an electronic tonguefor the characterization of Moroccan waters. Sens. Transducers J. 27: 190–197.
Hayashi, K., Yamanaka, M., Toko, K., and Yamafuji, K. 1990. Multichannel tastesensor using lipid membranes. Sens. Actuators, B, 2(3): 205–213. doi:10.1016/0925-4005(90)85006-K.
Hodgins, D. 1997. The electronic nose: sensor array-based instruments that em-ulate the human nose. In Techniques for analyzing food aroma. Edited byR. Marsili. Marcel Dekker, New York, USA.
Holmin, S., Spångeus, P., Krantz-Rülcker, C., and Winquist, F. 2001. Compressionof electronic tongue data based on voltammetry – a comparative study. Sens.Actuators, B, 76: 455–464. doi:10.1016/S0925-4005(01)00585-8.
Hulanicki, A., Glab, S., and Ingman, F. 1991. Chemical sensors: definitions andclassification. Pure Appl. Chem. 63(9): 1247–1250. doi:10.1351/pac199163091247.
Ivarsson, P., Holmin, S., Höjer, N.E., Krantz-Rülcker, C., and Winquist, F. 2001.Discrimination of tea by means of a voltammetric electronic tongue anddifferent applied waveforms. Sens. Actuators, B,76(1–3): 449–454. doi:10.1016/S0925-4005(01)00583-4.
Justino, C.I.L., Freitas, A.C., Duarte, A.C., and Santos, T.A.P.R. 2015. Sensors andbiosensors for monitoring marine contaminants. Trends Environ. Anal.Chem. 6–7: 21–30. doi:10.1016/j.teac.2015.02.001.
Kim, H., Konnanath, B., Sattigeri, P., Wang, J., Mulchandani, A., Myung, N., et al.2012. Electronic-nose for detecting environmental pollutants: signal process-ing and analog front-end design. Analog Integr. Circ. Sig. Process. 70(1): 15–32.doi:10.1007/s10470-011-9638-1.
Kirsanov, D., Legin, E., Zagrebin, A., Ignatieva, N., Rybakin, V., and Legin, A. 2014.Mimicking Daphnia magna bioassay performance by an electronic tonguefor urban water quality control. Anal. Chim. Acta, 824: 64–70. doi:10.1016/j.aca.2014.03.021. PMID:24759749.
Krantz-Rülcker, C., Stenberg, M., Winquist, F., and Lundström, I. 2001. Electronictongues for environmental monitoring based on sensor arrays and patternrecognition: a review. Anal. Chim. Acta, 426(2): 217–226. doi:10.1016/S0003-2670(00)00873-4.
Legin, A.V., Selenev, B.L., Rudnitskaya, A.M., Vlasov, Y.G., Tverdokhlebov, S.V.,Mack, B., et al. 1999. Multisensor system for determination of iron (II), iron(III), uranium (VI) and uranium (IV) in complex solutions. Czech. J. Phys. 49:679–685. doi:10.1007/s10582-999-1049-5.
Li, M., Sun, Q., Li, Y., Lv, M., Lin, L., Wu, Y., et al. 2016. Simultaneous analysis of
212 Environ. Rev. Vol. 27, 2019
Published by NRC Research Press
Env
iron
. Rev
. Dow
nloa
ded
fro
m w
ww
.nrc
rese
arch
pre
ss.c
om b
y M
rs C
átia
Mag
ro o
n 10
/16/
19F
or p
erso
nal
use
only
.

45 pharmaceuticals and personal care products in sludge by matrix solid-phase dispersion and liquid chromatography tandem mass spectrometry.Anal. Bioanal. Chem. 408(18): 4953–4964. doi:10.1007/s00216-016-9590-0.PMID:27137519.
Liu, X., Feng, H., Liu, X., and Wong, D.K.Y. 2011. Electrocatalytic detection ofphenolic estrogenic compounds at NiTPPS|carbon nanotube composite elec-trodes. Anal. Chim. Acta, 689(2): 212–218. doi:10.1016/j.aca.2011.01.037. PMID:21397076.
Lvova, L., Guanais Gonçalves, C., Petropoulos, K., Micheli, L., Volpe, G.,Kirsanov, D., et al. 2016. Electronic tongue for microcystin screening in wa-ters. Biosens. Bioelectron. 80: 154–160. doi:10.1016/j.bios.2016.01.050. PMID:26827145.
Marques, I., Magalhâes-Mota, G., Pires, F., Sério, S., Ribeiro, P.A., and Raposo, M.2017. Detection of traces of triclosan in water. Appl. Surf. Sci. 421: 142–147.doi:10.1016/j.apsusc.2016.12.170.
Matamoros, V., Arias, C., Brix, H., and Bayona, J.M. 2009. Preliminary screeningof small-scale domestic wastewater treatment systems for removal of phar-maceutical and personal care products. Water Res. 43(1): 55–62. doi:10.1016/j.watres.2008.10.005. PMID:18986673.
Mesquita, R.B.R., and Rangel, A.O.S.S. 2009. A review on sequential injectionmethods for water analysis. Anal. Chim. Acta, 648: 7–22. doi:10.1016/j.aca.2009.06.030. PMID:19616686.
Mimendia, A., Gutiérrez, J.M., Leija, L., Hernández, P.R., Favari, L., Muñoz, R.,et al. 2010. A review of the use of the potentiometric electronic tongue in themonitoring of environmental systems. Environ. Model. Softw. 25(9): 1023–1030. doi:10.1016/j.envsoft.2009.12.003.
Moreno, L., Merlos, A., Abramova, N., Jiménez, C., and Bratov, A. 2006. Multi-sensor array used as an “electronic tongue” for mineral water analysis. Sens.Actuators, B, 116: 130–134. doi:10.1016/j.snb.2005.12.063.
National Academy Press. 1995. Expanding the vision of sensor materials. Wash-ington, D.C. doi:10.17226/4782.
National Research Council (NRC). 1995. Chemical sensors. In Expanding thevision of sensor materials. National Academies Press, Washington, D.C.pp. 73–88. doi:10.17226/4782.
Nuñez, L., Cetó, X., Pividori, M.I., Zanoni, M.V.B., and del Valle, M. 2013. Devel-opment and application of an electronic tongue for detection and monitor-ing of nitrate, nitrite and ammonium levels in waters. Microchem. J. 110:273–279. doi:10.1016/j.microc.2013.04.018.
Olivati, C.A., Riul, A., Balogh, D.T., Oliveira, O.N., Jr., and Ferreira, M. 2009.Detection of phenolic compounds using impedance spectroscopy measure-ments. Bioprocess Biosyst. Eng. 32(1): 41–46. doi:10.1007/s00449-008-0218-4.PMID:18408956.
Oliveira, O.N., Jr., Iost, R.M., Siqueira, J.R., Jr., Crespilho, F.N., and Caseli, L. 2014.Nanomaterials for diagnosis: challenges and applications in smart devicesbased on molecular recognition. ACS Appl. Mater. Interfaces, 6(17): 14745–14766. doi:10.1021/am5015056. PMID:24968359.
Pal, A., He, Y., Jekel, M., Reinhard, M., and Gin, K.Y.H. 2014. Emerging contami-nants of public health significance as water quality indicator compounds inthe urban water cycle. Environ. Int. 71: 46–62. doi:10.1016/j.envint.2014.05.025. PMID:24972248.
Palit, M., Tudu, B., Bhattacharyya, N., Dutta, A., Dutta, P.K., Jana, A., et al. 2010.Comparison of multivariate preprocessing techniques as applied to elec-tronic tongue based pattern classification for black tea. Anal. Chim. Acta,675(1): 8–15. doi:10.1016/j.aca.2010.06.036. PMID:20708109.
Panasiuk, O., Hedström, A., Marsalek, J., Ashley, R.M., and Viklander, M. 2015.Contamination of stormwater by wastewater: A review of detection methods.Journal of Environmental Management, 152: 241–250. doi:10.1016/j.jenvman.2015.01.050. PMID:25662485.
Peris, M., and Escuder-Gilabert, L. 2016. Electronic noses and tongues to assessfood authenticity and adulteration. Trends Food Sci. Technol. 58: 40–54.doi:10.1016/j.tifs.2016.10.014.
Pimentel, R. 2014. Desenvolvimento de um Sensor de Ibuprofeno em meioaquoso. Master thesis, Faculdade de Ciências e Tecnologia da UniversidadeNova de Lisboa.
Rakow, N.A., and Suslick, K.S. 2000. A colorimetric sensor array for odour visu-alization. Nature, 406: 710–713. doi:10.1038/35021028. PMID:10963592.
Raposo, M., Ribeiro, P.A., El Bari, N., and Bouchikhi, B. 2016. Sensing of compo-nent traces in complex systems. In Electrokinetics across disciplines andcontinents. Edited by B.A. Ribeiro, P.E. Mateus, and N. Couto. Springer Inter-national Publishing, Cham. pp. 401–426. doi:10.1007/978-3-319-20179-5_20.
Richards, E., Bessant, C., and Saini, S. 2002. Multivariate data analysis in electro-analytical chemistry. Electroanalysis, 14(22): 1533–1542. doi:10.1002/1521-4109(200211)14:22<1533::AID-ELAN1533>3.0.CO;2-T.
Richards, E., Bessant, C., and Saini, S. 2003. A liquid handling system for theautomated acquisition of data for training, validating and testing calibrationmodels. Sens. Actuators, B, 88: 149–154.
Riul, A., dos Santos, D.S., Wohnrath, K., Di Tommazo, R., Carvalho, A.C.P.L.F.,Fonseca, F.J., et al. 2002. Artificial taste sensor: efficient combination of sen-sors made from Langmuir-Blodgett films of conducting polymers and a ru-thenium complex and self-assembled films of an azobenzene-containingpolymer. Langmuir, 18(1): 239–245. doi:10.1021/la011017d.
Rodríguez Méndez, M.L., De Saja, J.A., Medina-Plaza, C., and García-Hernández, C.2016. Electronic tongues for the organoleptic characterization of wines. In
Electronic noses and tongues in food science. Edited by M.L. Rodríguez Méndez.Academic Press, San Diego. pp. 265–273. doi:10.1016/B978-0-12-800243-8.00026-3.
Ronan, J.M., and Mchugh, B. 2013. A sensitive liquid chromatography/tandemmass spectrometry method for the determination of natural and syntheticsteroid estrogens in seawater and marine biota, with a focus on proposedWater Framework Directive Environmental Quality Standards. Rapid Com-mun. Mass. Spectrom. 27(7): 738–746. doi:10.1002/rcm.6505. PMID:23495020.
Scott, S.M., James, D., and Ali, Z. 2007. Review data analysis for electronic nosesystems. Microchim. Acta, 207: 183–207. doi:10.1007/s00604-006-0623-9.
Shehata, M.A., Fawaz, E.M., El-Rahman, M.K.A., and Abdel-Moety, E.M. 2017.Double-track electrochemical green approach for simultaneous dissolutionprofiling of naproxen sodium and diphenhydramine hydrochloride. J. Pharm.Biomed. Anal. 146: 179–187. doi:10.1016/j.jpba.2017.08.041. PMID:28881315.
Sìliwinìska, M., Wisniewska, P., Dymerski, T., Namiesnik, J., and Wardencki, W.2014. Food analysis using artificial senses. J. Agric. Food Chem. 62: 1423–1448.doi:10.1021/jf403215y. PMID:24506450.
Smith, D.V., and Margolskee, R.F. 2001. Making sense of taste. Sci. Am. March284(March): 32–39. doi:10.1038/scientificamerican0301-32.
Son, M., and Park, T.H. 2018. The bioelectronic nose and tongue using olfactoryand taste receptors: analytical tools for food quality and safety assessment.Biotechnol. Adv. 36(2): 371–379. doi:10.1016/j.biotechadv.2017.12.017. PMID:29289691.
Stroble, J.K., Stone, R.B., and Watkins, S.E. 2009. An overview of biomimeticsensor technology. Sens. Rev. 22(2): 112–119. doi:10.1108/02602280910936219.
Stuart, M., and Lapworth, D. 2013. Emerging organic contaminants inhroundwater – smart sensors for real-time water quality monitoring. Edited byS.C. Mukhopadhyay and A. Mason. Springer Berlin Heidelberg, Berlin,Heidelberg. pp. 259–284. doi:10.1007/978-3-642-37006-9_12.
Stülten, D., Zühlke, S., Lamshöft, M., and Spiteller, M. 2008. Occurrence ofdiclofenac and selected metabolites in sewage effluents. Sci. Total Environ.405: 310–316. doi:10.1016/j.scitotenv.2008.05.036. PMID:18640705.
Sun, H., Mo, Z.H., Choy, J.T.S., Zhu, D.R., and Fung, Y.S. 2008. Piezoelectric quartzcrystal sensor for sensing taste-causing compounds in food. Sens. Actuators, B,131: 148–158. doi:10.1016/j.snb.2007.12.014.
Tahara, Y., and Toko, K. 2013. Electronic tongues-a review. IEEE Sens. J. 13(8):3001–3011. doi:10.1109/JSEN.2013.2263125.
Tahri, K., Duarte, A.A., Carvalho, G., Ribeiro, P.A., da Silva, M.G., Mendes, D.,et al. 2018. Distinguishment, identification and aroma compound quantifi-cation of Portuguese olive oils based on physicochemical attributes,HS-GC/MS analysis and voltammetric electronic tongue. J. Sci. Food Agric.98(2): 681–690. doi:10.1002/jsfa.8515. PMID:28671261.
Taylor, D.M., and Macdonald, A.G. 1987. AC admittance of the metal/insulator/electrolyte interface. J. Phys. D. Appl. Phys. 20(10): 1277. doi:10.1088/0022-3727/20/10/010.
Tobiszewski, M., Mechlin, A., and Namiesnik, J. 2010. Green analytical chemistry —theory and practice. Chem. Soc. Rev. 8: 2869–2878. doi:10.1039/b926439f.
Vidal-Dorsch, D.E., Bay, S.M., Maruya, K., Snyder, S.A., Trenholm, R.A., andVanderford, B.J. 2012. Contaminants of emerging concern in municipalwastewater effluents and marine receiving water. Environ. Toxicol. Chem.31(12): 2674–2682. doi:10.1002/etc.2004. PMID:22987561.
Vlasov, Y., Legin, A., Rudnitskaya, A., Di Natale, C., and D’Amico, A. 2005. Non-specific sensor arrays (“electronic tongue”) for chemical analysis of liquids(IUPAC Technical Report). Pure Appl. Chem. 77(11): 1965–1983. doi:10.1351/pac200577111965.
Wan, Q., Yang, P., Cai, H., Song, H., and Yang, N. 2013. Voltammetry of nanomo-lar leveled environmental hazards on the polymer/CNT coated electrodes.J. Electroanal. Chem. 689: 252–256. doi:10.1016/j.jelechem.2012.11.003.
Wang, H., Ohnuki, H., Endo, H., and Izumi, M. 2015. Impedimetric and ampero-metric bifunctional glucose biosensor based on hybrid organic–inorganicthin films. Bioelectrochemistry, 101: 1–7. doi:10.1016/j.bioelechem.2014.06.007.
Wei, Z., and Wang, J. 2011. Detection of antibiotic residues in bovine milk by avoltammetric electronic tongue system. Anal. Chim. Acta, 694(1–2): 46–56.doi:10.1016/j.aca.2011.02.053. PMID:21565301.
Wei, Z., Yang, Y., Wang, J., Zhang, W., and Ren, Q. 2017. The measurementprinciples, working parameters and configurations of voltammetric elec-tronic tongues and its applications for foodstuff analysis. J. Food Eng. doi:10.1016/j.jfoodeng.2017.08.005.
Wesoły, M., Cetó, X., del Valle, M., Ciosek, P., and Wróblewski, W. 2016. Quan-titative analysis of active pharmaceutical ingredients (APIs) using a potentio-metric electronic tongue in a SIA flow system. Electroanalysis, 28(3): 626–632.doi:10.1002/elan.201500407.
Wilson, A.D., and Baietto, M. 2009. Applications and advances in electronic-nose technologies. Sensors, 9(7): 5099–5148. doi:10.3390/s90705099. PMID:22346690.
Winquist, F. 2008. Voltammetric electronic tongues – basic principles and ap-plications. Microchim. Acta, 163(1–2): 3–10. doi:10.1007/s00604-007-0929-2.
Woertz, K., Tissen, C., Kleinebudde, P., and Breitkreutz, J. 2011. A comparativestudy on two electronic tongues for pharmaceutical formulation develop-ment. J. Pharm. Biomed. Anal. 55(2): 272–281. doi:10.1016/j.jpba.2011.02.002.PMID:21353433.
Zhang, D., Gersberg, R.M., Ng, W.J., and Tan, S.K. 2014. Removal of pharmaceu-
Magro et al. 213
Published by NRC Research Press
Env
iron
. Rev
. Dow
nloa
ded
fro
m w
ww
.nrc
rese
arch
pre
ss.c
om b
y M
rs C
átia
Mag
ro o
n 10
/16/
19F
or p
erso
nal
use
only
.

ticals and personal care products in aquatic plant-based systems: a review.Environ. Pollut. 184: 620–639. doi:10.1016/j.envpol.2013.09.009. PMID:24080393.
Zhao, X., Ding, J., Bai, W., Wang, Y., Yan, Y., Cheng, Y., and Zhang, J. 2018.PEDOT:PSS/AuNPs/CA modified screen-printed carbon based disposable elec-trochemical sensor for sensitive and selective determination of carmine.J. Electroanal. Chem. 824: 14–21. doi:10.1016/j.jelechem.2018.07.030.
Zheng, Q., Yang, P., Xu, H., Liu, J., and Jin, L. 2012. A simple and sensitive methodfor the determination of 4-n-octylphenol based on multi-walled carbon nano-
tubes modified glassy carbon electrode. J. Environ. Sci. 24(9): 1717–1722. doi:10.1016/S1001-0742(11)60970-4.
Zhuiykov, S. 2012. Solid-state sensors monitoring parameters of water qualityfor the next generation of wireless sensor networks. Sens. Actuators, B,161(1): 1–20. doi:10.1016/j.snb.2011.10.078.
Zou, Y., Wan, H., Zhang, X., Ha, D., and Wang, P. 2015. Electronic nose andelectronic tongue. In Bioinspired smell and taste sensors. Edited by K.J. Wang,P. Liu, Q. Wu, and C. Hsia. Springer Netherlands. pp. 19–44. doi:10.1007/978-94-017-7333-1_2.
214 Environ. Rev. Vol. 27, 2019
Published by NRC Research Press
Env
iron
. Rev
. Dow
nloa
ded
fro
m w
ww
.nrc
rese
arch
pre
ss.c
om b
y M
rs C
átia
Mag
ro o
n 10
/16/
19F
or p
erso
nal
use
only
.

70

71
Paper
“Polyelectrolyte based sensors as key to achieve quantitative electronic tongues: Detection of triclosan on aqueous environmental matrices”
C Magro, PM Zagalo, J Pereira-da-Silva, EP Mateus, AB Ribeiro, PA Ribeiro & M Raposo
Submitted, 2019

72

Polyelectrolyte based sensors as key to achieve quantitative electronictongues: Detection of triclosan on aqueous environmental matrices
C. Magroa∗, P. Zagalob, J. Pereira-da-Silvab, E.P. Mateusa, A.B. Ribeiroa, P. Ribeirob and M. Raposob∗
aCENSE, Departamento de Ciências e Engenharia do Ambiente, Faculdade de Ciências e Tecnologia, Universidade Novade Lisboa, Caparica 2829-516, Portugal
bCEFITEC, Departamento de Fisica, Faculdade de Ciências e Tecnologia, Universidade Nova de Lisboa, Caparica2829-516, Portugal
∗Corresponding authors: [email protected], [email protected]
Submitted, 2019
Keywords: environmental monitoring; triclosan; layer-by-layer technique; interdigitated sensors; electronic tongue;impedance spectroscopy
Abstract:Triclosan (TCS) is a bacteriostatic used in household items that has been raising health concerns, due to thepromotion of antimicrobial resistance and endocrine disruption effects both to humans and biota, demandingtherefore new devices for its continuous supervising in complex matrices. This work explores the potentialof the electronic tongue concept to be used as an environmental monitoring tool. The sensor was based onpolyelectrolyte layer-by-layer (LbL) films prepared onto gold interdigitated electrodes (IDE) and, the use ofelectrical impedance spectroscopy as a means of transduction, together with Principal Component Analysis(PCA). An electronic tongue, composed by sensors arrays with (polyethyleneimine (PEI)/ polysodium 4-styrenesulfonate (PSS))5 and (poly(allylamine hydrochloride/graphene oxide)5 LbL films together with goldIDE without coating were used to detect TCS concentrations from 10−15 to 10−5 M, in deionized water,mineral water and waste water. Results show the electronic tongue’s ability to: 1) distinguish between TCSdoped and non-doped solutions; 2) sort out the TCS range of concentrations. Regarding film stability, strongpolyelectrolytes, as (PEI/PSS)n, presented more firmness as no significant desorption was observed whenimmersed in waste water, making them reliable sensor devices. Finally, the data of gold IDE sensors and(PEI/PSS)5, for the mineral water and waste water matrices, respectively, show the ability to distinguish thetwo matrices. A sensitivity value of 0.19±0.02 per decade to TCS concentration and a resolution of 0.13 pMwere found from PCA second principal component, showing that the choice of stable sensing layers is the keyto develop quantitative electronic tongues.
Highlights:
• An e-tongue based on polyelectrolyte sensors to detect triclosan was developed;
• Traces of triclosan on waste water were monitored;
• Stable thin-films sensing layers are the key to develop quantitative e-tongues;
• PCA was used determine the sensitivity and resolution of the e-tongue;
• E-tongue achieved a resolution of 0.13 pM.
Abbreviations:
DW, deionized water; E-tongue, electronic tongue; EF, waste water; GO, graphene oxide; IC, Ion Chromatog-raphy; ICP, Inductively Coupled Plasma with Optical Emission; IE, interdigitated electrodes; LbL, layer-by-layer; MW, mineral water; PAH, poly(allylamine hydrochloride; PCA, Principal Component Analysis; PEI,polyethyleneimine; PSS, poly(sodium 4-styrenesulfonate; TCS, triclosan.

1 INTRODUCTION
Triclosan (5-chloro-2-(2,4-dichlorophenoxy) phe-nol) (TCS) is widely used as an antimicrobial, an-tibacterial and preservative agent in different personalcare and consumer products [1]. TCS main physi-cal and chemical characteristics are presented in Table1. Structurally, TCS molecule has functional groupsfor both phenol (5-chloro-2-(2,4-dichlorophenoxy)phenol) and ether (2,4,4-trichloro-2-hydroxydiphenylether) and its lipophilicity (log Kow = 4.8) results ina potential for bioaccumulation. Several studies hadproved its allergy risk, antimicrobial resistance, de-velopmental toxicity, and endocrine disruption, bothin humans and biota [2-8]. Due to its characteristicsand inefficient removal in the waste water treatmentplants, TCS and its bioactive metabolites and/or by-products, have been detected in waste waters and su-perficial waters, at 10−8 M to 10−12 M concentrationsrange (2 ng L−1 - 40 µg L−1; Table A supplemen-tary material ) [9–11]. Consequently, TCS is contin-ually being introduced in the aquatic environment viaa number of routes, primarily by both untreated andtreated waste water [12].
Hence, nowadays, the monitoring of TCS is a mat-ter of concern and an important hot topic. Tradi-tional analytical methods for TCS determination usegas or liquid chromatography and mass spectrome-try [13–18] . However, chromatographic and massspectrometric methods in spite of their high reliabil-ity are rather complex, time consuming and expensive[19]. Subsequently, there is a need for rapid, low-cost, and sensitive tools for real time monitoring ofTCS in environmental matrices [20-23]. Due to theirspecificities, such as fast response times, and user-friendly operation the electronic tongue (e-tongue)systems present a great potential to compete, com-plement or replace traditional analytical techniques[24], used for environmental monitoring. Conceptu-ally, an e-tongue is “a multi-sensory system, formedby an array of low-selective sensors, combined withadvanced mathematical procedures for signal pro-cessing, based on pattern recognition and/or multi-variate data analysis” [25]. TCS is one of the moststudied pollutant in sensors development, as exam-ples: a strand of carbon fibers has been designedand characterized for use in a voltammetric detec-tor for high-performance liquid chromatography todetect triclosan in rabbit serum and urine [26]; anelectropolymerizing o-phenylenediamine (o-PD) on aglassy carbon electrode was used to create an am-perometric sensor over a linear range of 2.0x10⁻⁷ to3.0x10−6 mol/L and a detection limit of 8.0x10⁻⁸
mol/L [21]; a multiwall carbon nanotube film was
developed for the rapid detection of TCS as electro-chemical sensor with a linear range from 50 µg L−1
to 1.75 mg L−1, and the limit of detection of 16.5 µgL−1 (about 57 nM) [27]. Accordingly, recent stud-ies [28-32] have reported well succeeded applicationswith sensors composed of layer-by-layer (LbL) thin-films, that were produced with polyelectrolytes andused to detect organic compounds (in ultra-pure wa-ter matrices) using impedance measurements.
An impedance system, in a simpler conceptual im-plementation, is the full scan of different alternatedcurrent frequencies or a selected number of discretefrequency values, that can be used (conductivity or ca-pacitance) [33]. The impedance technique approachis based on the electrode perturbation caused by anexternal signal of small magnitude [34]. Measure-ments can be performed in equilibrium or station-ary. The characterization of aqueous environmen-tal matrices is performed by analyzing the electricalimpedance components (reactance, resistance, capac-itance and loss tangent) as a function of frequencysignals applied to nanostructures adsorbed onto solidsubstrates with interdigitated electrodes [31]. It hasbeen reported that TCS adsorbed amount per unit ofarea on thin-films is reduced if the outer layers havenegative charged polyelectrolyte [35]. The stability ofthe sensorial layers produced by the LbL technique isdependent of the solution’s pH and the degree of ion-ization of the uppermost polyelectrolyte layer. Con-sequently, the TCS pKa (see Table 1) will play an es-sential role in its adsorption or non-absorption ontothe used thin-films. The aim of the present study wasto explore the potential of the e-tongue concept usingimpedantiometric detection of TCS in environmentalcomplex aqueous matrices. A deionized water, a Por-tuguese mineral water and a waste water effluent froma waste water treatment plant (considered the primarysource of TCS into water bodies) were used as exper-imental matrices. TCS was spiked to the aqueous ma-trices and these “measured” using thin-films sensorsbased on polyethyleneimine (PEI), poly(sodium 4-styrenesulfonate) (PSS), poly(allylamine hydrochlo-ride) (PAH) and graphene oxide (GO) (Figure 1), thathave been prepared with the LbL technique onto solidsupports with deposited gold electrodes.
To the best of our knowledge, regarding wastewater real samples and these two combinations ofthin-films sensors, this is the first study that explores:(1) an e-tongue based in a set of five sensor devicesproviding the possibility to distinguish different TCSconcentrations; (2) the use of electrical impedancespectroscopy measurements for TCS detection in en-vironmental aqueous matrices; (3) the stability of thethin-films layers, analysis of adsorption and desorp-

tion phenomena, submitted to different aqueous ma-trices and pH values.
2 MATERIALS AND METHODS
The experimental matrices were deionized water(DW), a Portuguese mineral water (MW) and a wastewater (EF). DW was produced using a Millipore sys-tem (Bedford, MA, USA), MW was a commercialPortuguese mineral water and EF was the liquid frac-tion collected in the secondary clarifier at a wastewater treatment plant (Lisbon, Portugal). Table 2presents the characterization of the experimental ma-trices for conductivity, pH, and total ion concentra-tion parameters. These features were measured be-cause (1) pH of aqueous solutions can lead to desorp-tion phenomena of thin-film layers, as well as, maychange the TCS degree of ionization: from Table 2one can observe that the studied matrices present pHvalues in the range of 6.1 - 8.4; and (2) ion species andrespective concentration can interact with the outer-most layer of the sensor’s thin-films or with the goldin the gold IDE. All these measured parameters playa crucial role in the stability of the thin-film sensorsand matrix-sensor interactions with the TCS molecule(pKa 7.9). pH was measured with a Radiometer pH-electrode EDGE (HANNA, USA). The conductiv-ity values were measured in a Radiometer AnalyticLAQUA twin (HORIBA Ltd., Japan). Ca, Cu, K,Mg, Na, P, S and Zn were determined by InductivelyCoupled Plasma with Optical Emission Spectrome-try (ICP-OES) (HORIBA Jobin-Yvon Ultima, Japan).Cl− and SO2−
4 were analyzed by Ion Chromatogra-phy (IC) (DIONEX ICS-3000, USA), equipped witha conductivity detector. Triclosan (TCS ≥ 97%) andmethanol (MeOH; gradient grade) used were fromSigma–Aldrich (Steinheim, Germany). Experimen-tal TCS dilutions range, 10−5 to 10−15 M were madesequentially from a mother solution with a concentra-tion of 10−4 M and analyzed immediately after prepa-ration. All dilutions were prepared using experimen-tal matrices/MeOH (9:1) solutions. A solution of eachexperimental matrix/MeOH, without TCS, was usedas the blank standard (0 M).
The sensor devices used in this work were pur-chased from DropSens (Llanera Asturias, Spain) andare constituted by glass BK7 solid support with de-posited gold interdigitate electrodes (IDE) compris-ing 250 “fingers” each. The supports’ dimensionswere 22.8 x 7.6 x 0.7 mm and each “finger” has5 µm of width which is the same spacing betweenthe “fingers”. An array of sensor devices withoutand with different polyelectrolyte thin films deposited
onto IDE surface were used to detect the TCS in aque-ous solutions. The deposited thin films were pre-pared with polyethyleneimine (PEI), poly(sodium 4-styrenesulfonate) (PSS), poly(allylamine hydrochlo-ride) (PAH) and graphene oxide (GO) polyelec-trolytes, all from Sigma-Aldrich (St Louis, MO,USA), by the LbL technique [36]. Accordingly, thinfilms of PAH/GO and of PEI/PSS deposited on BK7solid support with gold IDE were obtained by ad-sorbing alternate layers of electrically charged poly-electrolytes at solid/liquid interface, washing awaywith water the already adsorbed layers after beingimmersed in the polyelectrolyte solution in orderto remove any polyelectrolyte molecules that werenot completely adsorbed. The polyelectrolytes weremade with a monomeric concentration of 10−2 M di-luted in water Type I, produced with a Millipore sys-tem (Bedford, MA, USA). The adsorption time pe-riod of each layer ( i.e. immersion time in each poly-electrolyte solution), was 30 seconds and, after theadsorption of each layer, the thin-film was dried us-ing nitrogen gas. Films of PAH/GO were preparedwith 5 bilayers, (PAH/GO)5, while films of PEI/PSSwere prepared with 5, 10 and 20 bilayers, designatedby (PEI/PSS)5, (PEI/PSS)10 and (PEI/PSS)20, respec-tively. Table 3 lists the thin-films used to characterizethe aqueous solutions matrices under study.
The electrical analysis of aqueous matrices wasperformed by measuring the impedance spectra ofthese sensor devices when immersed in the aqueousmatrices with different TCS concentrations with a So-lartron 1260 Impedance Analyzer in the frequencyrange of 1 Hz to 1 MHz, applying an AC voltage of 25mV. To avoid contamination of the sensor devices, theimpedance spectra of thin-films sensors and gold IDEwere recorded for the TCS experimental matrices in asequence of increasing concentrations from 0 to 10−5
M. All measurements were performed at room tem-perature 25C. The stability of thin-films on the dif-ferent experimental matrices was also studied by mea-suring the ultraviolet-visible spectra of the LbL thin-films before and after being immersed in the experi-mental matrices/MeOH solutions spiked with 10−9 Mof TCS. The absorbance spectra were attained usinga double beam spectrophotometer UV-2101PC (Shi-madzu) with a sampling interval between 800 nm to200 nm, with a resolution of 0.5 nm. For each thin-film combination, three absorbance spectra were ob-tained: (1) before being immersed in the TCS solution(t = 0 min) to establish a baseline; (2) after five min-utes of immersion (t = 5 min); (3) after a cumulativeimmersion time of ten minutes (t = 10 min). Char-acterization of LbL thin-films stability, in EF at pHvalues of 3, 6, and 8, were also performed.

Principal component analysis (PCA) was car-ried out, regarding the normalized (Z normalization)impedance spectroscopy data, to reduce the size ofdata and to obtain a new space of orthogonal com-ponents, in which different concentration patterns canbe observed and explained. Additionally, an array ofsensors, composed by all the thin-films and gold IDEsensors, was analyzed as an e-tongue for TCS detec-tion in EF experimental matrix. The ANOVA t-testwas performed at 95% of confidence (p<0.05), con-cerning the Table 2 data, to prove that they are statis-tically different.
3 RESULTS AND DISCUSSION
3.1 Impedance spectroscopymeasurements: Sensor response
To evaluate the prepared sensors’ ability to detectTCS in DW, MW and EF, impedance spectra, of sen-sor devices without and with thin-films adsorbed onthe IDE surface were measured. Figure 2 shows theimaginary impedance spectra, also designated as elec-trical reactance, measured by the different sensor de-vices when immersed in the different aqueous matri-ces doped with TCS concentrations from 0 to 10−5
M. The data points are related to the average of threeimpedimetric measurements (reproducibility in sup-plementary material Figure B for the lowest TCS con-centration).
Different footprints were observed according tothe experimental aqueous matrices and sensor de-vices. Similar behaviour is observed for DW forall sensors. The gold IDE sensor presents a sim-ilar footprint for the MW and EF matrices. The(PAH/GO)5 sensor shows a similar behaviour, but dif-ferent from the gold IDE, for the same matrices. The(PEI/PSS)5 sensor shows different behaviour for MWand EF matrices, however similar to the gold IDE and(PAH/GO)5 sensor, for MW and EF matrices, respec-tively. Sensor physical properties (PP), such as re-actance, loss tangent and resistance at constant fre-quency, may present increasing or decreasing mono-tone functions as a function of TCS concentration. Inorder to allow operational TCS measurements (sen-sor sensitivity), a trend function of its concentrationmust be found, for example at a given frequency, ex-pressed as normalized reactance, loss tangent or resis-tance spectra. A normalized response can be achieveusing the following relation:
PP(C)−PP(M)
(PP(0M))(1)
where PP(C) is the physical property measuredat a given concentration, and PP(0 M) is the physi-cal property measured at a reference solution for thedifferent type of matrices (TCS 0M in DW, MW orEF). Plots I, II and III of Figure 3 present examplesof the normalized PP spectra to fixed frequencies, forthe different films and type of environmental aqueousmatrices.
The accomplished detailed analysis of obtainedspectra in TCS solutions prepared with all the experi-mental matrices, Figure 2, shown that, the imaginaryimpedance or reactance can be used as a transducingvariable. Regarding DW matrix (Figure 2 I a, b, c),the gold IDE sensor does not show a clear trend, com-pared to the thin-films sensors that present a more pro-nounced sensitivity to discriminate different concen-trations in the frequency ranges of 1 to 10 kHz, and of100 to 1000 kHz. Thus, in order to better analyze theresponse of these sensors, the reactance values mea-sured in the gold IDE, (PAH/GO)5 and (PEI/PSS)5sensors, at frequencies of 6.3, 25119 and 25119 Hz,respectively, were normalized and plotted as a func-tion of TCS concentrations in Figure 3 I. This figurereveals that the reactance at these frequencies tends toincrease or decrease, depending on the type of sensorfor the TCS concentration ranges under study. Thegold IDE sensor appears to be insensitive (no visibletrend) to TCS presence in the studied concentrations,while (PEI/PSS)5 sensor displays only significant sen-sitivity in the 10−5 to 10−7 M concentration range.Regarding DW matrix, the (PAH/GO)5 sensor (Fig-ure 3 I) presents almost constant values of reactanceat 25119 Hz, was concerning data discrimination (dis-cussed in section 3.2), the most “efficient” sensor.
Concerning the TCS detection in MW solutions,the reactance spectra, represented in Figures 2 II a andc, revealed analogous behavior for both gold IDE and(PEI/PSS)5 sensors. In the present case (Figure 3 II),the loss tangent at fixed frequencies, was used as thetransducing variable. The frequency values chosenwere 63, 100, and 16 kHz, respectively, for the goldIDE, (PEI/PSS)5 and (PAH/GO)5 sensors. It shouldbe remarked that all sensors tend to follow a decreasein loss tangent with decreasing TCS concentrations.
Overall, for the EF, the (PEI/PSS)5 sensor show tobe the most sensitive in the studied TCS concentrationrange. At frequencies between 1 and 10 kHz, the reac-tance spectra present a good response discrimination(Figure 2, III(c)). The normalized responses at 4 kHzas exhibited in Figure 3 III, clearly shows an electricalresistance trend with increasing TCS concentrations.It is important to remark, concerning the sensitivityof the sensor, that TCS is being detected/measuredin a range of concentrations in accordance with real

samples. For instance, the results showed that forthe EF matrix, as the TCS concentrations increase,the measured electrical resistance also increases in therange of 10−8 to 10−12 M, in accordance with the re-ported for waste water samples [9–11], supporting itspotential field applicability. Should also be referredthat EF matrix has a high amount of anions, Table 2,which directly contribute to the increase of electricalcharge that can flow between electrodes, EF conduc-tivity takes a value of 1400 µS/cm [2]. Concerningthe gold IDE sensors, the electrical response was op-erationally difficult to obtain, due to the high conduc-tivity of the medium, and only lower measurable val-ues of resistance were obtained, as can be observed inFigure 3 III. The EF matrix is composed by a highconcentration of ions, such as Zn and S (Table 2),that interact with the gold electrodes, thus promotingan overload of electrical resistance and contributingto sensor damage during the electrical measurements(optical microscopy images, in supplementary mate-rial Figure D).
3.2 Principal Component Analysis:Sensor capabilities
In this section three questions will be addressed:(1) Are the tested sensors able to detect concentra-tions of TCS equal and higher than zero?; (2) Are thetested sensors able of distinguish different TCS con-centrations?; (3) Do the tested sensors produce PCAplots with observable patterns and trends accordingto TCS concentrations? To look for sensor “dis-crimination” from different concentrations of TCS,on different matrices, the principal component analy-sis (PCA), a multivariate analysis technique, was per-formed after data normalization (Z type). The PCAwas used to explore the sensors sensory attributes toproduce different patterns for the range of TCS con-centrations. The PCA was applied for the most sensi-tive sensor, regarding impedance normalized data (av-erage of 3 loops impedance measurements). The PCAwith the best score plots obtained for the sensors whenimmersed in DW, EF and MW matrices, respectively,are presented in Figure 4 I, II, III. The characterizationassociated to the best sensor is the one where the vari-ations in the plot among TCS concentrations are moresignificant [37]. The first component F1, explains thegreatest data variation and is considered the most im-portant, explaining more than 79.69% of the variance.With the exception of the measurements on DW (Fig-ure 4, I), PCA plots produced clearly distinguish thesample matrices without TCS from the samples withTCS (Figure 4, II and III).
Regarding the DW experimental matrices (Figure
4 I), although the PCA plot distinguishes the differentconcentrations, one can observe that a trend of TCSconcentration per principal components according toconcentrations was not achieved. In the case of the(PAH/GO)5 sensor, the non-doped solution is in thesame quadrant of the higher TCS concentration. Aconcentration pattern and trend, related to TCS con-centrations, is visible for the data plot obtained bythe gold IDE sensor (Figure 4, II), where eigenvec-tors points tend to increase over the range of con-centrations. The first two principal components, F1and F2, explain 98.63% of the total variance. Evenmore, this distinction is better when compared to theone obtained by the thin-films sensors. For the EFmatrix, the best discrimination among concentrationswas achieved by the (PEI/PSS)5 sensor (Figure 4 III).It can be observed that TCS concentrations produce aclear trend between 10−5 and 10−13 M. The first twoprincipal components F1 and F2 account 99.65% ofthe total variance. This sensor is capable of detec-tion and semi quantification, having a clear trend andpattern within the PCA plot. Considering MW andEF experimental matrices, there is an evident pattern,where the concentration of the non-doped solutions(TCS = 0) may be regarded as an outlier point, be-ing the nearest concentration, in both cases 10−15 M.Additionally, for EF the effect of the number of bilay-ers was tested for the most sensitive sensor obtained,(PEI/PSS)5. The PCA plots, showed that 5 bilay-ers revealed better response (PCA separation to TCSconcentrations) and signal intensity for impedance,when compared to the ones with 10 or 20 bi-layersof (PEI/PSS)5 (PCA plots in supplementary materialFigures E and F). This could be due to the thicknessincrease with the number of bilayers which leads tothe increase of the distance between the gold elec-trode and the outer layer of film that interacted withthe TCS molecules. As the film thickness increases,the capacitance decreases, reducing the electrical sig-nals intensity measured in TCS solutions with differ-ent concentrations, i.e, for two distinct concentrationsthe difference of any measured electric property issmaller. The decrease in double-layer capacitance isassociated with a higher resistance imposed to elec-tron spillover, where this phenomenon reduces themetal capacitance according to jellium model[38].
The combination of sensor arrays is expected toimprove the capability of TCS concentration discrim-ination. The array of sensors composed by the sen-sor devices without any film deposited (gold IDE)and with (PAH/GO)5, (PEI/PSS)5, (PEI/PSS)10 and(PEI/PSS)20 thin-films deposited, was used to test thee-tongue concept and to analyses its ability to producediscrimination among TCS concentrations in the EF

matrix. The respective PCA plot, Figure 5, clearlydistinguish the sample matrices without TCS fromthe samples with TCS. A concentration pattern andtrend, related to TCS concentrations, can be seen onthe PCA plot along the main axis. The first two prin-cipal components F1 and F2 accounts for 81.71% ofthe total variance. As it was observed in Figure 4 IIand III, the data followed the same direction, from re-gion A (TCS) = 0 to region B where (TCS) > 0, prov-ing that the electronic based in those sensor devicesis able to distinguish between non-doped waste waterand doped TCS waste water, producing an observablepattern and trend regarding the different concentrationvalues.
3.3 Sensorial layers’ evaluation - sensorstability
Notwithstanding the positive response behaviorof the thin-films sensors in the presence of the TCSmolecules in different aqueous matrices, both indi-vidually and in array tell us that we are on the righttrack for TCS detection, there is a need to evalu-ate the stability of the thin-films in order to confirmthat the positive results are due to the presence ofTCS in the aqueous matrix and not to the loss ofpolyelectrolyte molecules from the films by desorp-tion. It is known that the LbL film stability is re-lated with the electrostatic interactions, in the rangeof one hundred of kJ/mol, between the opposite ion-ized groups of cationic and polyelectrolyte molecules[39,40]. Therefore electrostatic interactions play avital role in the adsorption of these molecular bilay-ers but are also strongly pH dependent since the de-gree of ionization of each polyelectrolyte is a func-tion of pH [39,40]. Having in mind the goal of de-velop a sensor dedicated to detect a specific moleculein complex media that can present different pH, theelectrostatic interactions must be taken into account.Moreover, the salts and/or other elements present inthe environmental matrices, change the degree of ion-ization of LbL films and of molecules involved [41]and therefore affecting the electrical properties (e.g.impedance) of the sensor. Additionally, the ionic ele-ments present in the matrices, can be adsorbed ontothe polyelectrolyte’s layers, changing the electricalproperties of the sensor. Thus, in order to ascertainwhich sensor holds the best features for the detec-tion of TCS with no loss/desorption of thin-film lay-ers and no irreversible adsorption of TCS onto thin-film, the adsorbed amount on the different thin-filmswas analyzed before and after the thin-films to be im-mersed on the different TCS aqueous matrices. Theadsorbed amount per unit of area can be easily es-
timated by measuring the UV-visible spectra of thefilms since they absorb in this wavelength region andTCS presents two main absorbance bands at 230 andat 280 nm. In figures 6 are shown the UV-vis ab-sorbance spectra of the LbL films, before and aftertheir immersion (t = 0, 5 and 10 minutes) into 10−9
M TCS aqueous solutions, prepared with DW, MWand EF (see Materials and Methods section). Theseobtained spectra were plotted together by type of filmand aqueous matrix, thus allowing for an insight onthe effects of adsorption and/or desorption occurringon each LbL thin-film. Accordantly, if the absorbanceis seen to increase compared to the t = 0 is likely thatTCS molecules are being adsorbed on the thin-filmoutermost surface. Contrarily, if the absorbance isseen to decrease when compared to the spectrum mea-sured before immersion of the film on the aqueousmatrix, t = 0, it is likely that polyelectrolyte moleculesare being desorbed from the thin-film. This desorp-tion is related with losses in the electrostatic interac-tions with consequence in changes in the electricalimpedance measured during the sensing procedure.By analysing the spectra of (PAH/GO)5 thin-film dis-played in Figures 6 I a), b) and c) it is possible toobserve that in both DW (a) and MW (b) there wasadsorption of TCS molecules on the films being moresignificant in the case of DW. Also, in the DW, resultsshow that a slight desorption took place when the filmwas immersed from five to ten minutes. This could bedue to the more surface-located layers not being prop-erly adsorbed during the film preparation, and whenimmersed for a second time suffer a washing process,resulting in a loss of previous adsorbed matter. Theadsorption phenomenon in these cases holds an addi-tional relevance aside from the detection factor, as itcan be used for removing TCS from solutions.
According to spectra of Figure 6 I(a) and I(b),the GO outer layer does not seem to be deeply in-fluenced by pH, given that both waters have differentpH values (5.7 for MW and 7.2 for DW, Table 1), andthere was adsorption, nonetheless. Moreover, giventhe chemical structures of the TCS molecule and thepolyelectrolyte (GO), the adsorption observed couldbe a result of either the formation of hydrogen bondsor from the interactions of π-π stacking [42]. In thecase of EF, Figure 6 I(c), desorption takes place sincethe absorbance decrease as the immersion time in theEF matrix increased. This behaviour can be attributedto the abundant presence of ions such as Mg2+, Na+,SO2−
4 (Table 1), which strongly interacting with theGO outer layer of, facilitating the change of chargewithin GO layer, from negatively charged to a pre-dominantly neutral one. By turning neutral, the strongelectrostatic interactions between the GO outer layer

and the remaining layers were weakened, which inturn leads to polyelectrolyte molecules detachment asshown in Figure 6(c) [43]. The effect of pH on thedegree of ionization of PAH and GO has been al-ready discussed in literature [39,44,45]. In fact, itwas shown that although at higher pH GO is elec-trically charged, the PAH film molecules lost a largeamount of charge, leading to both PAH and GO des-orption. Due to this fact, this type of film (PAH/GO)5should not be considered as sensing film for futureworks containing EF.
From the characterization of UV-vis spectra of(PEI/PSS)5 thin-films, Figure 6II, there was a cleareffect of film desorption in the cases of DW (a) andMW (b). While for the DW the observed desorp-tion increased with the immersion time, for the MW,although desorption to be significant after five min-utes, remained seemingly constant after the secondimmersion, suggesting that a desorption plateau wasreached. As desorption was observed in both DW andMW, (PEI/PSS)5 thin-films should not be elected assensing films for these aqueous matrices.
Regarding the thin-films in EF, spectra of Figure6 II(c) show that the absorbance between immersiontimes from t = 0 to t = 10 minutes slightly varied.This indicate that there was no significant adsorptioneither desorption, i.e., TCS adsorption or film losses.It is also possible to infer that pH plays a fundamen-tal role in the adsorption and desorption phenomenaregarding (PEI/PSS)5 LbL films. According to [46],the PEI degree of ionization is strongly pH dependentbut the PSS is a strong polyelectrolyte, with a pKanear 1 [41,47], it can be influenced by solution pHdue to the presence of a sulfonate group in its chem-ical structure and furthermore, reaching a more sta-ble state at pH > 7 [48]. Therefore, not only dueto this last referred reason but also due to the min-eral waters (both have pH < 7), while for EF (pHabove 8, see Table 1) the (PEI/PSS)5 LbL films arehighly stable. To better understand the involved phe-nomena, a subsequent study about the stability of(PEI/PSS)5 thin-films was conducted by measuringthe absorbance spectra of (PEI/PSS)5 thin-films be-fore and after to be immersed during different peri-ods in EF matrices with different pH, namely, 3, 6and 8, see Figures 7 a), b) and c), respectively. Cleardesorption occurred after immersion in Figures 7 (a)and (b) while in (c) a seemingly constant pattern hap-pens among the three spectra. Furthermore, as pHincreases in the TCS solutions from pH 3 to pH 8, thephenomenon of desorption decreases, suggesting thatpH has a direct effect on the interaction between thethin-film and TCS. The behaviours displayed in Fig-ures 7 further show that the absorbance of TCS onto
the outer layer of PSS is deeply influenced by pH,confirming what was observed in Figure 6 II(c). AtpH 8, the film exhibits a stable behaviour, due to PSSbeing fully charged and PEI maintaining about 40%of its electrical charge which is sufficient to maintainthe polyelectrolyte layers adsorbed in the LbL filmand, therefore, no desorption occurs. As the outer-most layer of the (PEI/PSS)5 thin-film is negative and,at high pH, the TCS is negatively charged, the TCSmolecules are repelled by the films and are not ad-sorbed on its surface. Thus, neither desorption noradsorption phenomena are observed.
3.4 Electronic Tongue - Sensorsensitivity and resolution
The results of the previous sections indicate that(PAH/GO)5 LbL sensor should be applied to acidaqueous matrices with lower ionic strengths, whilethe (PEI/PSS)5 LbL sensor should be used with al-kaline aqueous matrices with higher ionic strengths.Additionally, the gold IDE sensor should be appliedto medium ionic strength in neutral solutions. Thus,to the environmental aqueous matrices under study,an array of sensors, composed by the gold IDE and(PEI/PSS)5 sensors was set in order to understandif the e-tongue concept were capable of “tasting”,through the impedance data, MW and EF, doped withTCS.
The PCA plot corresponding to the use of the ad-equate sensor devices to the matrix is presented inFigure 8(a). This plot clearly distinguishes the MWfrom EF matrix. Inside each matrix PCA region itwas also possible to discriminate the TCS concen-trations across the principal component F2. In Fig-ure 8(b) the values of F2 were plotted as a functionof TCS concentrations for both type of matrices, anda linear relation and working range of the e-tonguewas attained. The principal component F2 linear ten-dency suggests that F2 data can be used to determinethe sensitivity, the slope of a linear function, of thesensor. Analyzing F2 curves, in detail, one can infera linear range between 10−13 and 10−7 M range ofTCS concentrations. Considering the data within thisconcentration range, the F2 feature plot vs. the loga-rithm of concentration, allows fitting the plotted datapoints to a straight line with a slope, (∆F2)/∆logC =0.19±0.02, which corresponds to the sensor sensitiv-ity or limit of quantification. Additionally, the sen-sor resolution (smallest concentration that can be de-tected) can be found near the smallest concentration(Cs). The Cs 0.1 pM, the minimum value which canbe measured is 0.02, therefore, ∆logC = (0.02)/(0.19)meaning, ∆logC = logC - logCs and, thus, C - Cs ∼

0.13pM, which corresponds to the sensor resolution,or limit of detection, of 0.13pM ( 0.3pg/L).
4 CONCLUSIONS
An electronic tongue, consisting of an array ofsensors based on uncoated IDE and coated with dif-ferent LbL films was shown to be able to detectand quantify triclosan trace concentrations, within therange of 10−15 to 10−5 M, in a MW and in EF matri-ces, by measuring the impedance spectra of the sensordevice. Sensor devices stability tests related with ad-sorption/desorption phenomena revealed that some ofthe films are not appropriate as TCS monitoring toolsas they are highly influenced by both matrices’ ioncomposition and pH. The experimental data suggeststhat: 1) (PAH/GO)5 LbL films may be used to ana-lyze acid matrices with low ionic strength, since thesalts in the solution tend to discharge the GO film; 2)(PEI/PSS)5 LbL films combination reveals potentialand capacity to be employed in alkaline aqueous ma-trices, such as waste water, with high ionic strength;3) gold IDE (uncoated) sensors react with ions in thesolutions and are damaged by S and Zn elements and,may be considered to analyze neutral solutions withlow ionic strengths.
Regarding the aim of this proof-of-concept study,an e-tongue, which can be used as an “analytical” sen-sor for the detection and quantification of TCS in themonitoring of environmental aqueous matrices (EFand MW), was achieved. The experimental data, ana-lyzed through a PCA, supported and demonstrated thesensor’s ability and potential to distinguish betweenaqueous matrices and to discriminate TCS concentra-tions using the principal component F2. For an ex-perimental/environmental range of triclosan concen-trations of 10−13 to 10−7 M (0.3 ng/L - 30 µg/L), thee-tongue presents a sensitivity value of 0.19±0.02 anda resolution of 0.13 pM. Finally, these results showthat the choice of more stable sensing layers is the keyto develop quantitative e-tongues and, in the case ofLbL films that stability is only achieved when strongpolyelectrolytes are employed in its preparation.
ACKNOWLEDGEMENTS
This work was supported by the Project “Devel-opment of Nanostrutures for Detection of TriclosanTraces on Aquatic Environments” (PTDC/FIS-NAN/0909/2014). The Center for Environmen-tal and Sustainability Research CENSE, whichis financed by national funds from FCT/MEC
(UID/AMB/04085/2019). J. Pereira-da-Silvaand P.M. Zagalo acknowledge their fellowshipsPD/BD/142768/2018, PD/BD/142767/2018 fromRaBBiT Doctoral Programme, respectively. C.Magro acknowledges to Fundação para a Ciên-cia e a Tecnologia for her PhD fellowship(SFRH/BD/114674/2016).
REFERENCES
[1] L. Sanchez-prado, C. Garcia-jares, M.Llompart, Microwave-assisted extrac-tion: Application to the determination ofemerging pollutants in solid samples, J.Chromatogr. A. 1217 (2010) 2390–2414.doi:10.1016/j.chroma.2009.11.080.
[2] J. Fang, R.L. Stingley, F.A. Beland, W.Harrouk, D.L. Lumpkins, P. Howard,Occurrence, Efficacy, Metabolism,and Toxicity of Triclosan, J. Environ.Sci. Heal. Part C. 28 (2010) 147–171.doi:10.1080/10590501.2010.504978.
[3] D. Sabaliunas, S.F. Webb, A. Hauk, M. Ja-cob, W.S. Eckhoff, Environmental fate of Tri-closan in the River Aire Basin, UK, Water Res.37 (2003) 3145–3154. doi:10.1016/S0043-1354(03)00164-7.
[4] J. Skarha, L. Mínguez-alarcón, P.L. Williams,T.I.M. Korevaar, R.A. De Poortere, M.A.C.Broeren, J.B. Ford, M. Eliot, R. Hauser,J.M. Braun, Cross-sectional associations be-tween urinary triclosan and serum thy-roid function biomarker concentrations inwomen, Environ. Int. 122 (2019) 256–262.doi:10.1016/j.envint.2018.11.015.
[5] X. Ma, Y. Wan, M. Wu, Y. Xu, Q. Xu, Z.He, W. Xia, Occurrence of benzophenones ,parabens and triclosan in the Yangtze River ofChina , and the implications for human ex-posure, Chemosphere. 213 (2018) 517–525.doi:10.1016/j.chemosphere.2018.09.084.
[6] A. Juric, K. Singh, X.F. Hu, H.M. Chan,Exposure to triclosan among the Cana-dian population: Results of the Cana-dian Health Measures Survey ( 2009 –2013 ), Environ. Int. 123 (2019) 29–38.doi:10.1016/j.envint.2018.11.029.
[7] R.F. Lehutso, A.P. Daso, J.O. Okonkwo, Oc-currence and environmental levels of triclosanand triclocarban in selected wastewater treat-ment plants in Gauteng Province , South

Africa, Emerg. Contam. 3 (2017) 107–114.doi:10.1016/j.emcon.2017.07.001.
[8] R. Freitas, F. Coppola, S. Costa, C. Pretti, L.Intorre, V. Meucci, A.M.V.M. Soares, M. Solé,The influence of temperature on the effects in-duced by Triclosan and Diclofenac in mus-sels, Sci. Total Environ. 663 (2019) 992–999.doi:10.1016/j.scitotenv.2019.01.189.
[9] W. Hua, E.R. Bennett, R.J. Letcher, Triclosanin waste and surface waters from the up-per Detroit River by liquid chromatography-electrospray-tandem quadrupole mass spec-trometry, Environ. Int. 31 (2005) 621–630.doi:10.1016/j.envint.2004.10.019.
[10] A. Lindström, I.J. Buerge, T. Poiger, P.A.Bergqvist, M.D. Müller, H.R. Buser, Oc-currence and environmental behavior of thebactericide triclosan and its methyl deriva-tive in surface waters and in wastewater, En-viron. Sci. Technol. 36 (2002) 2322–2329.doi:10.1021/es0114254.
[11] P.E. Stackelberg, E.T. Furlong, M.T. Meyer,S.D. Zaugg, A.K. Henderson, D.B. Reiss-man, Persistence of pharmaceutical com-pounds and other organic wastewater con-taminants in a conventional drinking-water-treatment plant, Sci. Total Environ. 329 (2004)99–113. doi:10.1016/j.scitotenv.2004.03.015.
[12] C.G. Daughton, T. a. Ternes, Pharmaceuti-cals and personal care products in the en-vironment: Agents of subtle change?, Env-iron. Health Perspect. 107 (1999) 907–938.doi:10.1289/ehp.99107s6907.
[13] F. Tohidi, Z. Cai, GC/MS analysis of triclosanand its degradation by-products in wastewa-ter and sludge samples from different treat-ments, Environ. Sci. Pollut. Res. 22 (2015)11387–11400. doi:10.1007/s11356-015-4289-x.
[14] S.C.N. Queiroz, K. Lazou, P. Sandra, I.C.S.F.Jardim, Determination of pesticides in wa-ter by liquid chromatography-(electrosprayionization)-mass spectrometry (LC-ESI-MS),Pestic. Rev. Ecotoxicologia e Meio Ambient.14 (2004) 53–60. doi:10.5380/pes.v14i0.3123.
[15] J. Sun, C.L. Yi, R.S. Zhao, X. Wang,W.Q. Jiang, X.K. Wang, Determination oftrace triclosan in environmental water by mi-croporous bamboo-activated charcoal solid-phase extraction combined with HPLC-ESI-MS, J. Sep. Sci. 35 (2012) 2781–2786.doi:10.1002/jssc.201200328.
[16] J. Regueiro, E. Becerril, C. Garcia-Jares,M. Llompart, Trace analysis of parabens,triclosan and related chlorophenols in wa-ter by headspace solid-phase microextrac-tion with in situ derivatization and gaschromatography–tandem mass spectrometry,J. Chromatogr. A. 1216 (2009) 4693–4702.doi:10.1016/j.chroma.2009.04.025.
[17] J.-H. Guo, X.-H. Li, X.-L. Cao, Y. Li,X.-Z. Wang, X.-B. Xu, Determinationof triclosan, triclocarban and methyl-triclosan in aqueous samples by disper-sive liquid–liquid microextraction com-bined with rapid liquid chromatography, J.Chromatogr. A. 1216 (2009) 3038–3043.doi:10.1016/j.chroma.2009.02.021.
[18] L. Sanchez-Prado, M. Llompart, M. Lores,C. García-Jares, J.M. Bayona, R. Cela,Monitoring the photochemical degradationof triclosan in wastewater by UV lightand sunlight using solid-phase microextrac-tion, Chemosphere. 65 (2006) 1338–1347.doi:10.1016/j.chemosphere.2006.04.025.
[19] W. Bourgeois, R.M. Stuetz, Use of achemical sensor array for detecting pollu-tants in domestic wastewater, Water Res.36 (2002) 4505–4512. doi:10.1016/S0043-1354(02)00183-5.
[20] T. Wu, T. Li, Z. Liu, Y. Guo, C. Dong, TalantaElectrochemical sensor for sensitive detectionof triclosan based on graphene / palladiumnanoparticles hybrids, Talanta. 164 (2017)556–562. doi:10.1016/j.talanta.2016.12.027.
[21] Y. Liu, Q.J. Song, L. Wang, Developmentand characterization of an amperometric sen-sor for triclosan detection based on elec-tropolymerized molecularly imprinted poly-mer, Microchem. J. 91 (2009) 222–226.doi:10.1016/j.microc.2008.11.007.
[22] J. Zheng, M. Zhang, Y. Ling, J. Xu, S. Hu,T. Hayat, N.S. Alharbi, F. Yang, Fabrica-tion of one dimensional CNTs / Fe 3 O 4@ PPy / Pd magnetic composites for the ac-cumulation and electrochemical detection oftriclosan, J. Electroanal. Chem. 818 (2018)97–105. doi:10.1016/j.jelechem.2018.04.026.
[23] B. Petrie, R. Barden, B. Kasprzyk-Hordern, Areview on emerging contaminants in wastewa-ters and the environment: Current knowledge,understudied areas and recommendations forfuture monitoring, Water Res. 72 (2015) 3–27.doi:10.1016/j.watres.2014.08.053.

[24] C. Magro, E. Mateus, M. Raposo, A.B.Ribeiro, Overview of electronic tonguesensing in environmental aqueous matrices:Potential for monitoring emerging organiccontaminants, Environ. Rev. (2019) 1–13.doi:10.1139/er-2018-0019.
[25] Y. Vlasov, A. Legin, A. Rudnitskaya, C.Di Natale, D’Amico, Nonspecific sensor ar-rays (“electronic tongue”) for chemical anal-ysis of liquids ( IUPAC Technical Report), Pure Appl. Chem. 77 (2005) 1965–1983.doi:10.1351/pac200577111965.
[26] L.-H. Wang, S.-C. Chu, Voltammetric De-tector for Liquid Chromatography: Deter-mination of Triclosan in Rabbit Urine andSerum, Chromatographia. 60 (2004) 385–390.doi:10.1365/s10337-004-0414-6.
[27] J. Yang, P. Wang, X. Zhang, K. Wu, Elec-trochemical sensor for rapid detection of tri-closan using a multiwall carbon nanotube film,J. Agric. Food Chem. 57 (2009) 9403–9407.doi:10.1021/jf902721r.
[28] E.R. Carvalho, N.C. Filho, E.C. Venancio,O.N.O. Jr, L.H.C. Mattoso, L. Martin-neto,Detection of Brominated By-Products Us-ing a Sensor Array Based on NanostructuredThin Films of Conducting Polymers, (2007)3258–3271.doi:10.3390/s7123258
[29] H. Wang, H. Ohnuki, H. Endo, M. Izumi,Impedimetric and amperometric bifunc-tional glucose biosensor based on hy-brid organic – inorganic thin fi lms,Bioelectrochemistry. 101 (2015) 1–7.doi:10.1016/j.bioelechem.2014.06.007.
[30] L. Abegão, J. Ribeiro, P. Ribeiro, M. Ra-poso, Nano-Molar Deltamethrin Sensor Basedon Electrical Impedance of PAH/PAZO Layer-by-Layer Sensing Films, Sensors. 13 (2013)10167–10176. doi:10.3390/s130810167.
[31] A. Riul, D.S. Dos Santos, K. Wohnrath, R.Di Tommazo, A.C.P.L.F. Carvalho, F.J. Fon-seca, O.N. Oliveira, D.M. Taylor, L.H.C. Mat-toso, Artificial taste sensor: Efficient combina-tion of sensors made from Langmuir-Blodgettfilms of conducting polymers and a ruthe-nium complex and self-assembled films of anazobenzene-containing polymer, Langmuir. 18(2002) 239–245. doi:10.1021/la011017d.
[32] I. Marques, G. Magalhâes-Mota, F. Pires,S. Sério, P.A. Ribeiro, M. Raposo, De-tection of traces of triclosan in water,
Appl. Surf. Sci. 421 (2017) 142–147.doi:10.1016/j.apsusc.2016.12.170.
[33] M. del Valle, Electronic tongues em-ploying electrochemical sensors, Elec-troanalysis. 22 (2010) 1539–1555.doi:10.1002/elan.201000013.
[34] Y. Elamine, P.M.C. Inácio, B. Lyoussi, O.Anjos, L.M. Estevinho, M. da Graça Miguel,H.L. Gomes, Insight into the sensing mecha-nism of an impedance based electronic tonguefor honey botanic origin discrimination, Sen-sors Actuators B Chem. 285 (2019) 24–33.doi:10.1016/j.snb.2019.01.023.
[35] J.P. da Silva, P.M. Zagalo, Paulo A. Ribeiro,Maria Raposo, Adsorption of Triclosan onsensors based on PAH/PAZO thin-films: theeffect of pH, in: 15th Int. Conf. Com-put. Intell. Methods Bioinforma. Biostat., Ca-parica, Portugal (6-8 September), 2018: pp.1–48.doi:10.1109/ENBENG.2019.8692527
[36] O.N. Oliveira, M. Raposo, A. Dhanabalan,Langmuir-Blodgett (LB) and Self-assembled(SA) polymeric filmsin, in: H.S.B.T.-H. of S.and I. of M. Nalwa (Ed.), Handb. SurfacesInterfaces Mater., Academic Press, Burling-ton, 2001: pp. 1–63. doi:10.1016/B978-012513910-6/50047-5.
[37] V. Parra, Á.A. Arrieta, J.A. Fernández-Escudero, M.L. Rodríguez-Méndez, J.A. DeSaja, Electronic tongue based on chemicallymodified electrodes and voltammetry for thedetection of adulterations in wines, SensorsActuators, B Chem. 118 (2006) 448–453.doi:10.1016/j.snb.2006.04.043.
[38] J.O. Bockris, A.K.N. Reddy, The ElectrifiedInterface, in: Mod. Electrochem. Vol. 2, 1970.doi:10.1007/97894011069172.
[39] Q. Ferreira, P.J. Gomes, P.A. Ribeiro, N.C.Jones, S. V. Hoffmann, N.J. Mason, O.N.Oliveira, M. Raposo, Determination of de-gree of ionization of poly(allylamine hy-drochloride) (PAH) and poly[1-[4-(3-carboxy-4 hydroxyphenylazo)benzene sulfonamido]-1,2- ethanediyl, sodium salt] (PAZO) in layer-by-layer films using vacuum photoabsorptionspectroscopy, Langmuir. 29 (2013) 448–455.doi:10.1021/la304036h.
[40] M. Raposo, O.N. Oliveira, Energies of ad-sorption of poly(o-methoxyaniline) layer-by-layer films, Langmuir. 16 (2000) 2839–2844.doi:10.1021/la990945y.

[41] M. Raposo, J.M.C. Lourenço, A.M. Botelhodo Rego, A.M. Ferraria, P.A. Ribeiro, Coun-terions - A new approach to control thedegree of ionization of polyelectrolytes inlayer-by-layer films, Colloids Surfaces APhysicochem. Eng. Asp. 412 (2012) 1–10.doi:10.1016/j.colsurfa.2012.05.005.
[42] M. Raposo, O.N. Oliveira Jr, Adsorptionmechanisms in layer-by-layer films, Brazil-ian J. Phys. 28 (1998). doi:10.1590/s0103-97331998000400014.
[43] C.-W. Chang, S.R. Kumar, C.-B. Wong,S.J. Lue, F. Baskoro, C.-H. Chen, D.W.Chen, Graphene oxide-cation interaction:Inter-layer spacing and zeta potentialchanges in response to various salt solu-tions, J. Memb. Sci. 554 (2018) 253–263.doi:10.1016/j.memsci.2018.03.006.
[44] J. Choi, M.F. Rubner, Influence of the degreeof ionization on weak polyelectrolyte multi-layer assembly, Macromolecules. 38 (2005)116–124. doi:10.1021/ma048596o.
[45] B. Konkena, S. Vasudevan, Understandingaqueous dispersibility of graphene oxide andreduced graphene oxide through p K a mea-surements, J. Phys. Chem. Lett. 3 (2012)867–872. doi:10.1021/jz300236w.
[46] X. Zhu, F. Tang, T.S. Suzuki, Y. Sakka, Role ofthe initial degree of ionization of polyethylen-imine in the dispersion of silicon carbidenanoparticles, J. Am. Ceram. Soc. (2003).doi:10.1111/j.1151-2916.2003.tb03302.x.
[47] J.M.C. Lourenço, P.A. Ribeiro, A.M.B. DoRego, F.M.B. Fernandes, A.M.C. Moutinho,M. Raposo, Counterions in poly(allylaminehydrochloride) and poly(styrene sulfonate)layer-by-layer films, Langmuir. (2004).doi:10.1021/la049872v.
[48] R.N. Smith, M. McCormick, C.J. Barrett, L.Reven, H.W. Spiess, NMR studies of PAH/PSSpolyelectrolyte multilayers adsorbed onto sil-ica, Macromolecules. 37 (2004) 4830–4838.doi:10.1021/ma049797v.

Table 1. Triclosan physical and chemical characteristics
Chemical structure Formula
Molar
mass g mol
-1
Log
Kow
pKa Solubility in
water mg L-1
Polarizability
Å3 CAS-No
5-chloro-2-(2,4-
dichlorophenoxy)phenol
C12H7Cl3O2 289.54 4.76 7.9 10 (20°C) 26.96 3380-34-5
References: http://pubchem.ncbi.nlm.nih.gov/; https://chemicalize.com/
Table 2. Characterization of the environmental matrices under study.
DW MW EF*
pH 7.2 0.1 5.7 0.3 8.4 0.1
Conductivity (S/cm) 46.5 0.7 113 37 1400 500
ICP analysis (mg/L)
Ca - 0.75 0.1 39.1 2.8
Cu - - 0.02 0.01
K - - 22.9 0.4
Mg - 7.3 0.6 18.2 5.1
Na - 1.7 0.1 161 58
P - - 2.2 0.2
S - - 32.9 8.6
Zn - - 0.07 0.02
IC analysis (mg/L)
Cl- - 9.3 0.4 488.7 593.2
SO42- - 1.3 0.3 84.1 92.4
DW - deionized water; MW - mineral water; EF - waste water
*collected between September and December 2018

Table 3. Characteristics of the thin-films deposited on BK7 solid support with gold IDE to characterize the
aqueous solutions matrices.
Aqueous
matrices
Thin-film
combinations
Number of
bilayers
DW PAH/GO and PEI/PSS 5
MW PAH/GO and PEI/PSS 5
EF PAH/GO 5
PEI/PSS 5, 10 and 20

Figure 1. Chemical structure of polyethyleneimine (PEI), poly (sodium 4-styrenesulfonate) (PSS),
poly(allylamine hydrochloride) (PAH) and graphene oxide (GO).
I (a) I (b) I (c)
DW
II (a) II (b) II (c)
MW
III (a) III (b) III (c)
EF
Figure 2. Reactance (imaginary) impedance spectra of sensor device (a) of gold IDE sensor, (b) (PAH/GO)5
sensor and (c) of (PEI/PSS)5 sensor, immersed in TCS DW (I) MW (II) and EF (III) at different TCS
concentrations.
Reacta
nce (
) R
eacta
nce (
) R
eacta
nce (
)

Figure 3. Transducing variables normalization as function of TCS concentrations at fixed frequencies: I) DW -
Reactance spectra at 6.3, 25119, 25119 Hz; II) MW - Loss tangent spectra at 63095, 16000, 100000 Hz and III)
EF - Resistance spectra at 100000, 16000, 3981 Hz; to Gold IDE, (PAH/GO)5 and (PEI/PSS)5 sensors,
respectively (n=3, average and standard deviations of the respective impedance data used for the normalization,
in supplementary material C 1-3)
10-5M
10-7M
10-9M10-11M
10-13M
10-15M 0M
-4
-2
0
2
4
6
-8 -6 -4 -2 0 2 4 6 8
F2
(1
3.1
6 %
)
F1 (79.69 %)
0M 10-5M10-7M10-9M
10-11M110-13M
10-15M
-10
-5
0
5
10
-15 -10 -5 0 5 10
F2
(3
.23
%)
F1 (95.40 %)
B (TCS > 0)
A (TCS = 0)
-0.5
-0.4
-0.3
-0.2
-0.1
0
0.1
0.2
0.3
0.4
Re
acta
nce
(Ω)
TCS Concentrations (M)
-0.12
-0.1
-0.08
-0.06
-0.04
-0.02
0
0.02
0.04
Loss T
angent
(a.u
)
TCS Concentrations (M)
-0.1
-0.05
0
0.05
0.1
0.15
Re
sis
tance
(Ω
)
TCS Concentrations (M)
I III II
(PAH/GO)5 (PEI/PSS)5 Gold IDE
II
III

Figure 4. PCA plots of TCS concentrations (10-5 to 10-15 M) distinguished with: I) (PAH/GO)5 sensor for DW, II)
gold IDE sensor for MW; III) (PEI/PSS)5 sensor for EF.
Figure 5. PCA plot of TCS concentrations (10-5 to 10-15 M) distinguished with an electronic tongue sensor for EF.
Figure 6. UV-Vis spectra of I) (PAH/GO)5 films and II) (PEI/PSS)5 before and after immersions times in 10 -9 M
TCS solutions of: (a) DW; (b) MW and (c) EF.
0M
10-5M
10-7M
10-9M10-11M
10-13M
10-15M
-8
-6
-4
-2
0
2
4
6
-14 -12 -10 -8 -6 -4 -2 0 2 4 6
F2
(1
1.7
8 %
)
0M
10-5M
10-7M
10-9M
10-11M10-13M
10-15M
-10
-5
0
5
10
15
-10 -5 0 5 10 15 20 25
F2
(2
4.5
5 %
)
F1 (57.16 %)
B (TCS > 0)
A (TCS = 0)
III
B (TCS > 0)
A (TCS = 0)
0
0.1
0.2
0.3
0.4
0.5
200 400 600 800
Ab
so
rba
nc
e (
a.u
.)
Wavelenght (nm)
DW t=0
DW t=5
0
0.1
0.2
0.3
0.4
0.5
0.6
200 400 600 800Wavelenght (nm)
0
0.2
0.4
0.6
0.8
200 400 600 800
Wavelenght (nm)
EF t=0
EF t=5
EF t=10
0.1
0.6
1.1
1.6
2.1
200 250 300 350 400
Ab
so
rba
nc
e (
a.u
.)
Wavelenght (nm)
DW t = 0DW t = 5DW t = 10
0
0.5
1
1.5
200 250 300 350 400Wavelenght (nm)
MW t=0MW t=5MW t=10
0
0.5
1
1.5
2
2.5
3
190 240 290 340 390
Wavelenght (nm)
EF t=0
EF t=5
EF t=10
I(a) I(b) I(c)
II(a) II(b) II(c)

Figure 7. UV-Vis spectra of (PEI/PSS)5 films before and after immersions in 𝟏𝟎−𝟗 M TCS solutions in EF with
pH of: (a) 3; (b) 6 and (c) 8.
Figure 8. (a) PCA plot of TCS concentrations (10-5 to 10-15 M) distinguished gold IDE sensor for MW and
(PEI/PSS)5 sensor for EF; (b) ((a) PCA data) principal components F2 factor scores as function of TCS
concentrations for gold IDE sensor in MW and (PEI/PSS)5 sensor in EF.
0
0.2
0.4
0.6
0.8
1
1.2
1.4
1.6
1.8
2
190 240 290 340 390
Ab
so
rba
nc
e (
a.u
.)
Wavelenght (nm)
pH 3 t = 0
pH 3 t = 5
pH 3 t = 10
0
0.5
1
1.5
2
190 240 290 340 390
Wavelenght (nm)
pH 6 t = 0pH 6 t = 5pH 6 t = 10
0
0.5
1
1.5
2
2.5
190 240 290 340 390
Wavelenght (nm)
pH 8 t = 0pH 8 t = 5pH 8 t = 10
(a) (b) (c)
10 -5 M
10 -7 M
10 -9 M10 -11 M
10 -13 M
10 -15 M
10 -5 M
10 -7 M
10 -9 M
10 -11 M10 -13 M
10 -15 M
-4
-2
0
2
4
6
-8 -6 -4 -2 0 2 4 6 8
F2
(8
.15
%)
F1 (91.42 %)
Waste water
Mineral Water
Working Range
Linear Range
(a)
(b)

Supplementary Material
Table A. Concentration guidance: molar, µg/, ng/L and pg/L
M µg/L ng/L pg/L
10-5 3000
10-6 300
10-7 30
10-8 3
10-9 0.3
10-10
30
10-11 3
10-12 0.3 300
10-13
30
10-14 3
10-15 0.3
Figure B. Reactance (imaginary) impedance spectra of sensor device of gold IDE sensor, (PAH/GO)5 sensor and
of (PEI/PSS)5 sensor, immersed in deionized water, mineral water and waste water with 10-15M of TCS (Related
to the measurements in Figure 2)
Gold IDE (PAH/GO)5 (PEI/PSS)5
Deionized
water
0
50
100
150
200
250
0 1 2 3 4 5 6 7
Reacta
nce (Ω
)
Log Frequency (Hz)
n=1 n=2 n=3
0
20
40
60
80
100
120
140
0 1 2 3 4 5 6 7
Reacta
nce (Ω
)
Log Frequency (Hz)
n=1 n=2 n=3
0
20
40
60
80
100
120
0 1 2 3 4 5 6 7
Reacta
nce (Ω
)
Log Frequency (Hz)
n=1 n=2 n=3
Mineral
water
0
50000
100000
150000
200000
250000
0 1 2 3 4 5 6 7
Reacta
nce (Ω
)
Log Frequency (Hz)
n=1 n=2 n=3
0
50
100
150
200
250
0 1 2 3 4 5 6 7
Reacta
nce (Ω
)
Log Frequency (Hz)
n=1 n=2 n=3
0
50000
100000
150000
200000
250000
0 1 2 3 4 5 6 7
Reacta
nce (Ω
)
Log Frequency (Hz)
n=1 n=2 n=3
Waste
water
0
100000
200000
300000
400000
500000
600000
0 1 2 3 4 5 6 7
Reacta
nce (Ω
)
Log Frequency (Hz)
n=1 n=2 n=3
0
5
10
15
20
25
30
35
40
0 1 2 3 4 5 6 7
Reacta
nce (Ω
)
Log Frequency (Hz)
n=1 n=2 n=3
0
20
40
60
80
100
120
140
0 1 2 3 4 5 6 7
Reacta
nce (Ω
)
Log Frequency (Hz)
n=1 n=2 n=3

Table C.1 Impedance data measurements, reactance (imaginary), used for the normalization of Plots I in Figure
3
Fixed Frequency (Hz)
Reactance
(imaginary) (Ω)
for deionized
water
6.3 25119 25119
TCS (M) Gold IDE (PAH/GO)5 (PEI/PSS)5
Average SD Average SD Average SD
0 13.035 0.654 87.201 0.112 16.837 0.021
10-15 7.466 0.041 84.483 0.030 16.338 0.004
10-14 7.508 0.028 84.460 0.048 16.576 0.004
10-13 7.270 0.032 83.752 0.092 16.616 0.005
10-12 7.085 0.027 83.488 0.053 16.379 0.012
10-11 7.035 0.030 83.668 0.017 16.461 0.003
10-10 7.051 0.041 83.694 0.029 16.508 0.008
10-9 6.976 0.019 83.889 0.017 16.541 0.003
10-8 7.015 0.029 83.834 0.023 16.638 0.002
10-7 6.939 0.023 84.166 0.015 16.538 0.011
10-6 6.939 0.014 85.315 0.136 18.439 0.100
10-5 6.795 0.020 87.068 0.086 21.371 0.044
SD – standard deviation
Table C.2 Impedance data measurements, loss tangent, used for the normalization of Plots II in Figure 3
Fixed Frequency (Hz)
Loss Tangent
(a.u) for mineral
water
63095 16000 100000
TCS (M) Gold IDE (PAH/GO)5 (PEI/PSS)5
Average SD Average SD Average SD
0 6.586 0.038 2.956 0.000 4.454 0.001
10-15 6.613 0.009 2.961 0.005 4.600 0.008
10-14 6.547 0.009 2.892 0.003 4.578 0.006
10-13 6.492 0.010 2.877 0.003 4.517 0.002
10-12 6.413 0.005 2.876 0.005 4.522 0.002
10-11 6.382 0.001 2.877 0.006 4.423 0.003
10-10 6.347 0.001 2.863 0.003 4.457 0.001
10-9 6.327 0.002 2.887 0.002 4.419 0.001
10-8 6.256 0.001 2.870 0.003 4.386 0.004
10-7 6.272 0.003 2.863 0.004 4.388 0.002
10-6 6.210 0.003 2.854 0.004 4.329 0.004
10-5 5.942 0.036 2.826 0.002 4.206 0.009
SD – standard deviation

Table C.3 Impedance data measurements, resistance, used for the normalization of Plots III in Figure 3
Fixed Frequency (Hz)
Resistance (Ω)
for waste water
100000 16000 3981
TCS (M) Gold IDE (PAH/GO)5 (PEI/PSS)5
Average SD Average SD Average SD
0 40.920 0.057 98.217 0.338 149.621 1.055
10-15 40.781 0.041 94.688 0.561 150.891 0.286
10-14 41.064 0.027 94.458 0.289 151.813 0.168
10-13 41.241 0.066 93.091 0.145 153.332 0.217
10-12 40.712 0.011 93.272 0.095 154.904 0.241
10-11 40.906 0.032 93.219 0.076 154.231 0.124
10-10 40.716 0.029 93.034 0.068 155.732 0.124
10-9 40.596 0.030 92.116 0.047 156.077 0.153
10-8 40.645 0.043 93.234 0.066 158.578 0.192
10-7 40.794 0.023 92.224 0.039 158.783 0.142
10-6 40.718 0.009 93.262 0.004 161.490 0.401
10-5 41.151 0.021 92.677 0.218 167.916 0.771
SD – standard deviation
Figure D. Optical Microscopy Images of gold interdigitated electrodes without coating, gold IDE; Magnitude:
(a) 4x, (b)10x and (c) 40x, analysed in waste water
Figure E. PCA plot of TCS concentrations (10-5M to 10-15M) distinguished with (PEI/PSS)10 sensor for waste
water
(a) (b) (c)

Figure F. PCA plot of TCS concentrations (10-5M to 10-15M) distinguished with (PEI/PSS)20 sensor for waste
water

94

95
Paper
“Electronic Tongue Coupled to an Electrochemical Flow Reactor for Emerging Organic Contaminants Real Time Monitoring”
C Magro, EP Mateus, JM Paz-Garcia, S Sério, M Raposo & AB Ribeiro
Published in: Sensors, 2019

96

sensors
Article
Electronic Tongue Coupled to an ElectrochemicalFlow Reactor for Emerging Organic ContaminantsReal Time Monitoring
Cátia Magro 1,* , Eduardo P. Mateus 1, Juan M. Paz-Garcia 2 , Susana Sério 3 ,Maria Raposo 3 and Alexandra B. Ribeiro 1,*
1 CENSE, Department of Sciences and Environmental Engineering, NOVA School of Science and Technology,NOVA University Lisbon, Caparica Campus, 2829-516 Caparica, Portugal; [email protected]
2 Department of Chemical Engineering, Faculty of Sciences, University of Malaga, Teatinos Campus, 29010Malaga, Spain; [email protected]
3 CEFITEC, Department of Physics, NOVA School of Science and Technology, NOVA University Lisbon,Caparica Campus, 2829-516 Caparica, Portugal; [email protected] (S.S.); [email protected] (M.R.)
* Correspondence: [email protected] (C.M.); [email protected] (A.B.R.)
Received: 31 October 2019; Accepted: 2 December 2019; Published: 4 December 2019
Abstract: Triclosan, which is a bacteriostatic used in household items, has raised health concerns,because it might lead to antimicrobial resistance and endocrine disorders in organisms. The detection,identification, and monitoring of triclosan and its by-products (methyl triclosan, 2,4-Dichlorophenoland 2,4,6-Trichlorophenol) are a growing need in order to update current water treatments and enablethe continuous supervision of the contamination plume. This work presents a customized electronictongue prototype coupled to an electrochemical flow reactor, which aims to access the monitoring oftriclosan and its derivative by-products in a real secondary effluent. An electronic tongue device, basedon impedance measurements and polyethylenimine/poly(sodium 4-styrenesulfonate) layer-by-layerand TiO2, ZnO and TiO2/ZnO sputtering thin films, was developed and tested to track analytedegradation and allow for analyte detection and semi-quantification. A degradation pathway trendwas observable by means of principal component analysis, being the sample separation, according tosampling time, explained by 77% the total variance in the first two components. A semi-quantitativeelectronic tongue was attained for triclosan and methyl-triclosan. For 2,4-Dichlorophenol and2,4,6-Trichlorophenol, the best results were achieved with only a single sensor. Finally, working asmulti-analyte quantification devices, the electronic tongues could provide information regarding thedegradation kinetic and concentrations ranges in a dynamic removal treatment.
Keywords: triclosan; electrochemical treatment; real time monitoring; layer-by-layer technique;sputtering technique; electronic tongue; sensors
1. Introduction
Nowadays, both water quality and availability are under stress. The global population isexpected to exceed nine-billion by 2050, where 70% will be, living in urban areas [1]. This risingdemand for water, together with poor or inefficient wastewater management and limited disposalstrategies with minimal treatment practices, increases the need of sustainable tools to assure thequality, monitoring, and prosperity of a healthy population and environment [2]. Emerging organiccontaminants (EOCs) are defined as “chemical substances that have no regulation and are suspectedto negatively affect the environment or whose effects are unknown” [3,4]. Among EOCs, antibiotics,disinfectants, and antiseptics are especially relevant, as thousands of tons are yearly consumedworldwide in medicine, agricultural, and as daily consumer products [5]. Furthermore, the reported
Sensors 2019, 19, 5349; doi:10.3390/s19245349 www.mdpi.com/journal/sensors

Sensors 2019, 19, 5349 2 of 13
data show that conventional wastewater treatment plants are inefficient in their elimination [6–12].Triclosan (TCS or 2,4,4′-Trichloro-2′-hydroxydiphenyl ether) is a broad antimicrobial agent, with lowwater-solubility (more susceptible to bio-accumulation) and that has been used for more than 50 yearsas an antiseptic, disinfectant, or preservative in clinical settings and several consumer products, i.e.,toothpastes, cosmetics, and plastics. On the basis of the available studies, it is now accepted that ithas extensive environmental and health effects, also being toxic to water living organisms due to itsphotodegradation to chlorodioxins [13,14]. TCS has been detected in wastewater treatments plantsand surface waters [15,16]. Moreover, TCS derivatives have also been found, such as the metabolitemethyl-triclosan (M-TCS) [17], which is considered to be more persistent [18] and TCS by-products,such as 2,4-Dichlorophenol (DCP) and 2,4,6-Trichlorophenol (TCP), which pose a health risk to humansand are recognized as persistent priority pollutants in the United States, Europe, and China [19].
Innovative green tools for monitoring the degradation processes are currently in the spotlight.Sensors, as compared to traditional sampling and analysis procedures, can provide fast responseon the output data in a continuous, safe, and cost-effective way, and therefore may play a role inmonitoring contaminants’ dynamics [20]. Among sensors, the electronic tongue (e-tongue) is gainingspecial attention for liquid matrices. An e-tongue is a multi-sensory system, which formed by anarray of sensors with low-selective thin film layers or sensorial layers, and combined with advancedmathematical procedures for signal processing based on pattern recognition and/or multi-variate dataanalysis [21]. E-tongues have proved to be suitable devices for monitoring aqueous environmentalmatrices contaminated with EOCs [22,23]. Some examples are Campos et al. (2012) [24], who developeda voltammetric e-tongue [set of noble (Au, Pt, Rh, Ir, and Ag) and non-noble (Ni, Co, and Cu) electrodesto the prediction of concentration levels of soluble chemical oxygen demand, soluble biological oxygendemand, ammonia, orthophosphate, sulphate, acetic acid, and alkalinity from influent and effluentwastewater. Years later, Cetó at al. (2015) [25] used a voltammetric bio e-tongue for simultaneousmonitoring of catechol, m-cresol, and guaiacol mixtures in wastewater. Thus, one of the most interestingaspects that motivate the development of e-tongues is their potential for real-time parallel monitoringof multiple species and multi-analyte determination in a single sample analysis [26,27]. The workingelectrodes in the e-tongues array can be covered with films (coatings), which improves the sensitivityof the electrical measurements. The ability to tune the composition of nanostructured thin films allowfor an improvement in the sensor’s intrinsic (chemical or physical) properties for sensing applications.The layer-by-layer (LbL) nano-assembly technique, where the Brazilian group was the pioneer in thesubject [28–31], is a flexible, easily-scalable, reproducible, and versatile approach that allows for theprecise control of the coating thickness, composition, and structure. This nano-assembly techniqueis a powerful tool for the incorporation of a wide variety of coating types, such as polyelectrolytes.The type of thin film or sensorial layer chosen is a critical step for the accomplishment of a reliablequalitative and quantitative device. In a preliminary study, Magro et al (2019) [32] found that the LbLfilms prepared with polyethylenimine (PEI) and poly (sodium 4-styrenesulfonate) (PSS) build up withfive bilayers were suitable for TCS detection in wastewater. However, the polyelectrolyte layers ofthese thin films may desorb when they are immersed in solutions below pH = 7. According to Zhu etal. (2003) [33], even if the PEI degree of ionization is strongly pH dependent and the PSS is a strongpolyelectrolyte, with a pKa near 1, it can be influenced by solution pH due to the presence of a sulfonategroup in its chemical structure and furthermore. Studies on layer-by-layer films that were preparedfrom aqueous solution with pH below 7 revealed that the PSS is completely ionized [34,35]. In thisregard, thin films of TiO2 and ZnO build-up with the sputtering technique can also be consideredas sensorial layers. These films proved to be efficient for the detection of molecules with phenolicrings and they presented high mechanical stability under pH fluctuations [36–38]. This study aimed toachieve a customized e-tongue device to follow real-time degradation and quantification of TCS and itsderivative by-products in an electrochemical flow reactor (EFR) treatment. The EFR, which mimics thesecondary clarifier in a wastewater treatment plant, was considered to be the most appropriate choice

Sensors 2019, 19, 5349 3 of 13
to couple with a monitoring real time tool device, due to its potential to operational implementationand final matrix conditions (non-aggressive for thin film layers, e.g., pH effluent around 7.6).
To attain this proof-of-concept goal: (1) an array of thin films were prepared by LbL and sputteringtechniques and were characterized by a field emission scanning electron microscope, in order tounderstand the device response for each EOCs; (2) the impedance electrical properties of these filmswhen immersed in effluent spiked with EOCs’ were acquired; (3) “calibration curves”, to individuallydistinguish each EOCs were the base to train the customized e-tongue; and, (4) PCA results fromthe e-tongue attached to a dynamic EFR were analysed to apprehend the potential for working as amonitoring real time tool for EOCs’ degradation detection and semi-quantification.
2. Materials and Methods
2.1. Chemical and Standards
TCS (99%), M-TCS (99%), DCP (98%), and TCP (98%) were purchased from Sigma-Aldrich(Steinheim, Germany, Table S1). Individual stock solutions for calibration purposes were preparedwith 1000 mg/L in methanol and stored at −18 C. The methanol, acetonitrile, acetone, and formic acidused were from Sigma-Aldrich (Steinheim, Germany) in gradient grade type. Water (Type I) was froma Millipore system (Aqua Solutions, Bedford, MA, USA).
The sensor devices were purchased from DropSens (Llanera Asturias, Spain) and they wereformed by either a BK7 glass solid substrate with deposited interdigitated electrodes comprising 125“fingers” each or by a ceramic solid substrate with deposited gold interdigitated electrodes comprisingeight “fingers” each. The supports’ dimensions were 22.8 × 7.6 × 0.7 mm and each “finger” had 10 or200 µm of width, which was the same spacing between them. PEI and PSS from Sigma-Aldrich (StLouis, MO, USA) were the chemicals used to prepare the sensing layers on the interdigitated electrodes.The used gases argon, oxygen, and nitrogen had ≥ 99.9% of purity. The used effluent, pH (7.6 ± 0.5)and conductivity (1.6 ± 1.0), was the liquid fraction that was collected in the secondary settling tank ata wastewater treatment plant (Lisbon, Portugal).
2.2. Methods
2.2.1. Emerging Organic Contaminants Extraction and Quantification: Chromatography Approach
The extraction of EOCs in the effluent was performed by solid-phase extraction (SPE) while usingOasis HLB (200 mg, 6 mL) from Waters (Saint-Quentin-En-Yvelines Cedex, France). The SPE cartridgeswere conditioned by washing with 3 × (6 mL) of methanol, followed by re-equilibrium with 3 × (6mL) of Milli-Q water. For EOCs enrichment, the samples were acidified to pH = 2 before extractionusing nitric acid. The 200 mL aqueous samples passed through the cartridge at a flow rate of approx.10 mL/min by applying a moderate vacuum, followed by a dried period of approx. 3 min by vacuum.The retained EOCs were eluted sequentially with 2 × (4 mL) of methanol and 1 × (4 mL) of acetone.
The EOCs determination was performed in an Agilent 1260 Infinity II high-performance liquidchromatography (HPLC) that was equipped with a quaternary pump and auto-sampler and a diodearray detector (DAD)/fluorescence detector 1100 Series. An EC-C18 column (InfinityLab Poroshell120 High Efficiency, 100 mm × 4.6 mm; 2.7 µm with Column ID, Agilent, Santa Clara, CA, USA) wasused. All of the HPLC runs were performed at a constant flow of 1.5 mL/min in gradient mode, withthe oven set to 36 C. A mixture of acetonitrile, Milli-Q water and formic acid was used as eluents (A:5/94.5/0.5% and B: 94.5/5/0.5%) with a gradient of 60% of B (0–2 min), followed by 97% of B (2–3.5 min)and 98% of B until 5 min “Calibration curves” were performed in the range between 0.5 and 20.0 mg/L.The limits of detection and quantification were, respectively, 0.7 and 2.0 mg/L for TCS, 1.3 and 3.9 mg/Lfor M-TCS, 0.7 and 2.0 mg/L for DCP, and 1.0 and 3.0 mg/L for TCP. The recovery tests were madewith fortified effluent for 1 h of contact time (30 min of slow agitation). The recovery percentages werebetween 62% and 120% in all cases.

Sensors 2019, 19, 5349 4 of 13
2.2.2. Emerging Organic Contaminants Quantification: Customized Electronic Tongue Concept
An array of sensor devices with different thin films that were prepared by LbL and sputteringtechniques deposited onto solid substrates with gold interdigitated electrodes were coupled to an EFR(Figure 1). The e-tongue (Figure S1 for the information of the five sensors that composed the e-tongue)was used to detect the TCS, M-TCS, DCP, and TCP degradation in the effluent.
Figure 1. Electrochemical flow reactor used to attach the e-tongue.
The LbL thin films were prepared with PEI and PSS polyelectrolytes by the LbL technique [28].Accordingly, thin films of PEI/PSS that were deposited onto solid support with gold interdigitatedelectrodes were obtained by adsorbing alternate layers of electrically charged polyelectrolytes atsolid/liquid interface, carefully washing with water (Type I) the already adsorbed layers after immersionin the polyelectrolyte solution to remove the polyelectrolyte molecules that were not completelyadsorbed. The polyelectrolytes solutions were performed with a polymeric concentration of 10−2 Mdiluted in water Type I, produced with a Millipore system (Bedford, MA, USA). The adsorption timeperiod of each layer (immersion time in each polyelectrolyte solution) was 30 s and the thin film wasdried [39] while using a nitrogen flow after the adsorption of each layer. The aforementioned sequencewas repeated five times in order to obtain a film with five bilayers, denoted as (PEI/PSS)5.
Monolayered films: TiO2, ZnO and bilayered film: TiO2/ZnO (being ZnO the upper layer) weredeposited at room temperature onto gold interdigitated electrodes glass substrates (22.8 × 7.6 ×0.7 mm), by DC (voltage source, Huttinger PFG 10000) reactive magnetron sputtering in a custom-madesystem. Tianium and zinc discs (Goodfellow, 99.99% purity) with 64.5 mm of diameter and 4 mmof thickness each were used as the sputtering targets. A turbomolecular pump (Pfeiffer TMH 1001)was used to achieve a base pressure of 10-4–10-5 Pa (before introducing the sputtering gas). Beforethe sputter-deposition step of the films, a movable shutter was interposed between the target and thesubstrates. The target was pre-sputtered in the Ar atmosphere for 2 min to clean the target surface.The target-to-substrate distance was kept constant at 100 mm. Gases in the system were pure Ar and O2
and needle valves separately controlled their pressures. TiO2 and ZnO depositions were both carriedout in 100% O2 atmosphere. For the TiO2 film the total pressure was kept constant at 2 Pa, the sputteringpower was 530 W, and the deposition time was 25 min. In the case of ZnO film, the total pressurewas fixed at 4.8 Pa, the sputtering power was 300 W, and the deposition time was 30 min. TiO2/ZnObilayered films were prepared while using the aforementioned deposition conditions for TiO2 andZnO. No external substrate heating was used during the deposition. The substrate temperature wasmeasured by a thermocouple passing through a small hole in a copper piece that was in contact withthe substrate. During the deposition process, the sample temperature increased up to 60 C due to theplasma particle bombardment of the substrate. The characterization of the thin films thickness andmorphology was performed by a field emission scanning electron microscope (FEG-SEM JEOL 7001F)operating at 15 keV. A gold thin film was coated on the films surface before SEM analysis to charge

Sensors 2019, 19, 5349 5 of 13
build-up prevention. The images of the cross section allowed for the estimation of the films’ thickness.Therefore, the measured thickness is given by the trigonometric equation since the positioning of thesample has a slope relative to the axis of incidence of the electron beam which can be deduced throughthe geometry involved. The indicated correction was calculated while using Equation (1).
dSEM =dobs
cosα(1)
where the dSEM is the real thickness, dobs is an average of the measured thickness values estimated fromthe cross-section images and α is the beam incident angle (20).
The electrical analysis of the aqueous matrices was performed by measuring sequentially theimpedance spectra of each sensor device when immersed (about 3 min each) in effluent with differentEOCs concentrations, while using a Solartron 1260 Impedance Analyzer (Solartron Analytical, AMETEKscientific instruments, Berwyn, PA, USA) in the frequency range of 1 Hz to 1 MHz, while applying anAC voltage of 25 mV. The impedance data was collected from the SMaRT Impedance MeasurementSoftware (AMETEK scientific instruments, Berwyn, PA, USA). Calibration solutions were performed at25 C and then prepared while using effluent spiked with EOCs concentrations in the degradationrange that were expected in the electrochemical flow reactor (0 to 0.8 mg/L). For all measurements ablank standard (0 mg/L) was used. For the electro-degradation monitoring, every 15 min (total timeof treatment 120 min) was assembled an aliquot to be measured for each sensor, in the impedanceconditions that are described above.
2.2.3. Data Analysis
Principal component analysis (PCA) was carried out regarding the normalized Z-scorenormalization, z =
x− µσ impedance spectroscopy data (capacitance, impedance, imaginary, and real
and loss tangent measurements), where x is the mean of three impedance measurements at a fixedfrequency, µ the average of all the frequency ranges, and σ the standard deviation of all the frequencyranges. PCA was the choice of data proceeding to reduce the size of data and obtain a new space oforthogonal components, in which different concentration patterns can be observed and explained withExcel XLSTAT Programme. All of the sample analyses were carried out in duplicate or triplicate.
3. Results and Discussion
3.1. Sensors Characterization: Morphology and Thickness
As described in the Materials and Methods section, (PEI/PSS)5 LbL films and TiO2, ZnO,and TiO2/ZnO sputtered films (see sensors composition in Figure S1 in Supplementary Materials) wereprepared and characterized. Figure 2a,b presents the SEM images and the respective thickness of thosethin films. The characterization of the sensors layers is important to explain the sensors performance,since the homogeneity, particle size, and thickness will affect the electrical measurements: resistance,molecules’ adsorption, capacitance, and further capability of detection.
In agreement with Figure 2a, glass conducting substrates are covered by homogeneous films.However, the surface morphology of these films changes according to the deposition technique. Thus,the LbL films exhibited a smooth surface with evidence of very small agglomerates or grains. On thecontrary, sputtering films presented a rougher surface and much larger agglomerates with differentshapes, depending on the oxide used. In particular, for TiO2 films, the agglomerates of grains with anaverage lateral size of 30 nm are distributed over the substrate surface with a ‘blooming flower-like’appearance. In the case of ZnO films, the surface presents a pronounced cone-like morphology andlateral average size of approximately 100–120 nm. The outermost ZnO layer of the TiO2/ZnO bilayeredfilms show globular shape agglomerates, with the lateral average size approximately 100–150 nm.The formation of agglomerates or particulates are a product of individual nano-phase grains thatexhibit different dimensions (ZnO > TiO2), which result in an increase of the active surface area and

Sensors 2019, 19, 5349 6 of 13
also promotes the formation of porous films. These characteristics are critical in the response device toEOCs detection. The films thickness was evaluated from FEG-SEM cross-section images and Figure 2bsummarizes the obtained values. It can be observed that the thickness of the (PEI/PSS)5, TiO2, ZnO,and TiO2/ZnO increases from 133 to 713 nm, in the mentioned order.
Figure 2. Scanning electron microscope (SEM) image of (PEI/PSS)5, TiO2, ZnO and TiO2/ZnO thin filmscombinations: (a) Top and (b) cross section.
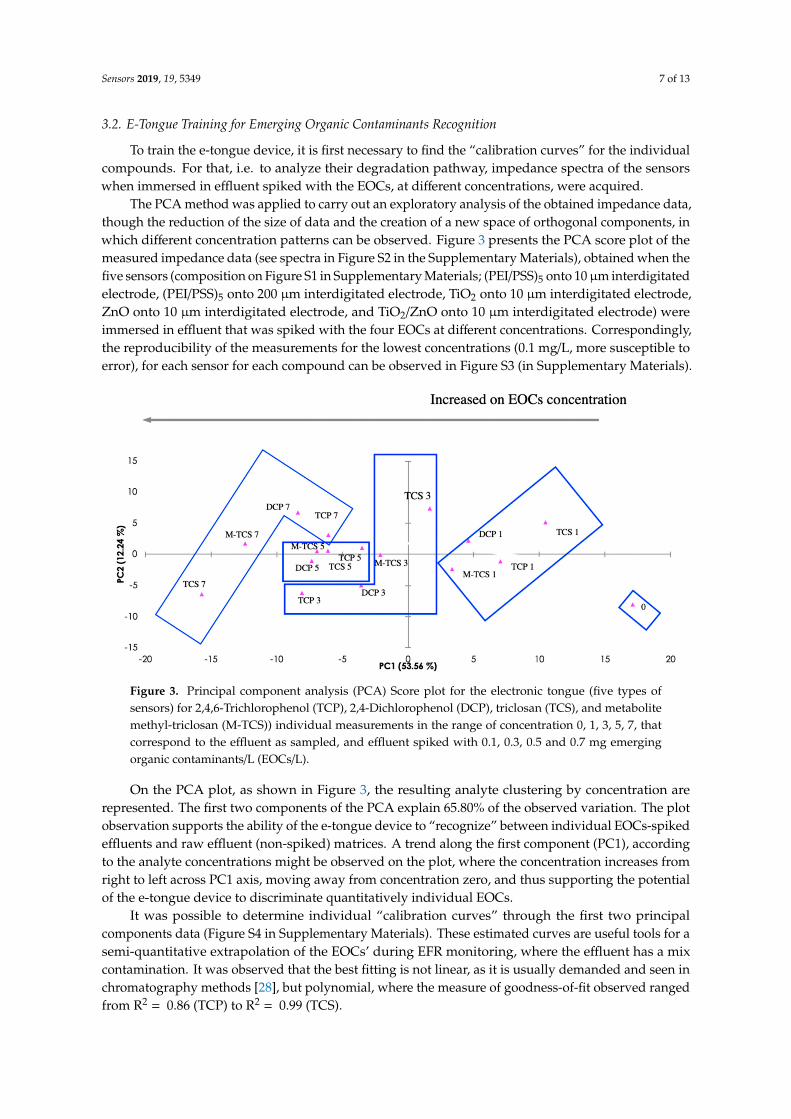
Sensors 2019, 19, 5349 7 of 13
3.2. E-Tongue Training for Emerging Organic Contaminants Recognition
To train the e-tongue device, it is first necessary to find the “calibration curves” for the individualcompounds. For that, i.e. to analyze their degradation pathway, impedance spectra of the sensorswhen immersed in effluent spiked with the EOCs, at different concentrations, were acquired.
The PCA method was applied to carry out an exploratory analysis of the obtained impedance data,though the reduction of the size of data and the creation of a new space of orthogonal components, inwhich different concentration patterns can be observed. Figure 3 presents the PCA score plot of themeasured impedance data (see spectra in Figure S2 in the Supplementary Materials), obtained when thefive sensors (composition on Figure S1 in Supplementary Materials; (PEI/PSS)5 onto 10µm interdigitatedelectrode, (PEI/PSS)5 onto 200 µm interdigitated electrode, TiO2 onto 10 µm interdigitated electrode,ZnO onto 10 µm interdigitated electrode, and TiO2/ZnO onto 10 µm interdigitated electrode) wereimmersed in effluent that was spiked with the four EOCs at different concentrations. Correspondingly,the reproducibility of the measurements for the lowest concentrations (0.1 mg/L, more susceptible toerror), for each sensor for each compound can be observed in Figure S3 (in Supplementary Materials).
Figure 3. Principal component analysis (PCA) Score plot for the electronic tongue (five types ofsensors) for 2,4,6-Trichlorophenol (TCP), 2,4-Dichlorophenol (DCP), triclosan (TCS), and metabolitemethyl-triclosan (M-TCS)) individual measurements in the range of concentration 0, 1, 3, 5, 7, thatcorrespond to the effluent as sampled, and effluent spiked with 0.1, 0.3, 0.5 and 0.7 mg emergingorganic contaminants/L (EOCs/L).
On the PCA plot, as shown in Figure 3, the resulting analyte clustering by concentration arerepresented. The first two components of the PCA explain 65.80% of the observed variation. The plotobservation supports the ability of the e-tongue device to “recognize” between individual EOCs-spikedeffluents and raw effluent (non-spiked) matrices. A trend along the first component (PC1), accordingto the analyte concentrations might be observed on the plot, where the concentration increases fromright to left across PC1 axis, moving away from concentration zero, and thus supporting the potentialof the e-tongue device to discriminate quantitatively individual EOCs.
It was possible to determine individual “calibration curves” through the first two principalcomponents data (Figure S4 in Supplementary Materials). These estimated curves are useful tools for asemi-quantitative extrapolation of the EOCs’ during EFR monitoring, where the effluent has a mixcontamination. It was observed that the best fitting is not linear, as it is usually demanded and seen inchromatography methods [28], but polynomial, where the measure of goodness-of-fit observed rangedfrom R2 = 0.86 (TCP) to R2 = 0.99 (TCS).

Sensors 2019, 19, 5349 8 of 13
3.3. E-tongue Performance for Emerging Organic Contaminants Semi-Quantification
Figure 4 shows the PCA plot from the normalized impedance data that were obtained by thecustomized e-tongue for the EFR treatment dataset. The dataset is composed by the analysed aliquotsthat were collected every 15 min in the course of the EFR treatment (120 min; t0–t120). A pattern in theplot, through the two first principal components, related to the time of EFR treatment is identifiable.The first two components of the PCA explain 77.27% of the observed variation. This observable trendsupports the device responsiveness towards the EOCs decreasing concentration (observation that issupported by HPLC data) across time. The trend follows a similar behaviour from that observed for theindividual EOCs measurements, as on the mixed EOCs measurements are the highest concentrationsthat drift away from concentration zero (see Figure S5 in Supplementary Materials). As noted forthe individual EOCs calibration plot (Figure 3), the e-tongue, when monitoring the mixed EOCS inthe effluent (Figure 4), is also able to “recognize” between EOCs-spiked effluent and raw effluent(non-spiked) matrices.
Figure 4. PCA Score plot for electrochemical flow reactor (EFR) degradation path measured by theelectronic tongue in the effluent spiked with the four EOCs: t0 to t120 correspond to sampling every15 min.
A three-dimensional (3D) plot was developed (Figure 5), by adding to the PC1 and PC2 dataaxis, a Z axis with the EOCs concentration values t0 cross-check the individual EOCS e-tonguesemi-quantitative “sensorial signal” (Figure 3) with the mixed EOCs “sensorial signal” at the end ofEFR treatment (Figure 4). The purpose of adding the z axis was to allow for a visual evaluation of theconcentration range dimension obtained for the EOCs at the end of EFR treatment. Three parameterscompose the plot data: (1) the EOCs estimated concentrations by HPLC at t120 (TCP = 0.3 mg/L;DCP = 0.45 mg/L; TCS = 0.03 mg/L; and, M-TCS = 0.29 mg/L) and (2) the PC1 and PC2 data attainedfrom Figure 4 at t120 (pink dots); (3) the interpolated PC1 and PC2 values from the data in Figure 3 thatare close to the HPLC estimated concentrations (TCP = 0.3 mg/L; DCP = 0.5 mg/L; TCS = 0.0 mg/L;and, M-TCS = 0.3 mg/L) for each of the EOCs at t120 (blue dots)
It is observed on Figure 5 that, for TCS and M-TCS, the distance between the interpolation pointsand the calibration points was lower, when compared with DCP and TCP. It is important to refer thatTCP and DCP are the most common by-products for the TCS and M-TCS degradation pathway, andthus they are created at the same time that they are degraded, which might explain the experimentalresults for these compounds.
Additionally, it was also important to understand which individual sensor, of the multi sensore-tongue, had the higher influence in the impedance “sensorial signal” for each EOCs. Thus, forTCS and M-TCS, the best response was obtained with TiO2/ZnO, with the first two components ofthe PCA explaining 96.65% and 96.92% (see PCA data on Supplementary Materials, Figure S6a,b)of the total variance, respectively. For TCP, the best semi-qualitative analysis was achieved whileusing the TiO2 sensor, with the first two components of the PCA explaining 99.96% (see PCA dataon Supplementary Materials, Figure S6c) of the total variance. Finally, for DCP, and apart from the

Sensors 2019, 19, 5349 9 of 13
others three EOCs, the (PEI/PSS)5 sensor with 10 µm interdigitated gold electrode had the highestsemi-qualitative response with the first two components of the PCA, explaining 98.68% (see PCA dataon Supplementary Materials, Figure S6d) of the total variance.
Figure 5. Visual evaluation of individual EOCs e-tongue semi-quantitative “sensorial signal” (individualvs mix measurements). Blue dots: EOCs Individual PC1 and PC2 data from Figure 3; Pink dots:high-performance liquid chromatography (HPLC) EOCs estimated concentrations for PC1 and PC2data attained from Figure 4 at t120.
Figure 6 presents the same methodology for TCP and DCP, but only with TiO2 or (PEI/PSS)5
sensor impedance data for the semi-quantitative analyse of TCP and DCP.Hence, analysing Figure 6, the distance between the interpolation points and the calibration points
was lower (distance units decreased 3.2 to DCP and 1.8 to TCP), while comparing to Figure 5 e-tonguemultisensory analyses for DCP and TCP.
The experimental data points to the importance of the nanomaterial used to build the e-tongue thatwill influence the impedance response as the thin film final morphology, structure, and properties ofthe thin films, and their consequent interactions with the different EOCs’ physical-chemical behaviouron the effluent matrix [29].
According to [30] reported data, the thickness of the film is related to the hydrophobic orhydrophilic final character. Thus, the film presents a more hydrophobic character when the thickness ishigher. The thin film morphology of the tested sensors, as presented at Figure 2a, suggests a hydrophiliccharacter for all the films tested, although, as the thickness increases, the hydrophobic characters alsoincrease (Figure 2a, (PEI/PSS)5 < rough surface < TiO2/ZnO). According to the experimental data, thethin films with more “hydrophobic character”, due to film thickness, such as the TiO2/ZnO and ZnOthin films presented better impedance responses in the semi-quantitative analysis of TCS and M-TCS,the analytes with higher Log kow (Table S1 in Supplementary Materials).
For the sensors that were considered to be “more hydrophilic”, the TiO2 and (PEI/PSS)5 filmspresented the best responses for DCP and TCP, the less lipophilic analytes. To DCP, for instance, thehigher porous size in the films with higher thickness, endorsed the molecule “semi-permeability”through the thin film net, “giving” to the molecules a fluid character, which may be masking their

Sensors 2019, 19, 5349 10 of 13
detection. Thus, in the TiO2/ZnO and ZnO thin films (“hydrophobic character”), the phenolic moleculesmovement will be faster than the detection, not allowing for the complete analysis understanding.In the polyelectrolytes thin film, (PEI/PSS)5, this behaviour does not occur, since the film layers areorganic and without hole structures, only providing an impedance response to the electronegativity ofthe DCP and TCP, as the film combination is itself negatively charged.
Figure 6. Visual evaluation of individual semi-quantitative “sensorial signal” (individual vs mixmeasurements) for TCP with TiO2 sensor and for DCP with (PEI/PSS)5 sensor. Blue dots: EOCsindividual PC1 and PC2 data for TCP with TiO2 sensor and for DCP with (PEI/PSS)5 sensor; Pink dots:HPLC EOCs estimated concentrations for PC1 and PC2 data attained from Figure 4 at t120.
4. Conclusions
At an electrochemical reactor’s outlet a customized e-tongue was attached, which was composedof five sensors, built up with layer-by-layer and sputtering thin-films, to access the degradationmonitoring of TCS, M-TCS, DCP, and TCP. Three main issues were evaluated to analyse this hypothesis:(1) characterization of the thin-films; (2) e-tongue training for the recognition of the different EOCs;and, (3) e-tongue array performance in the detection and semi-quantification of the EOCs in amix contaminated effluent. Therefore, performing impedance measurements into the e-tonguearray, was observed analytes clustering by concentration in the calibration curves, where the firsttwo components of the PCA explained 65.80% of the total variance. The e-tongue array showedresponsiveness towards the EOCs decreasing concentrations during the electrochemical treatment,showing a pattern trend through the first two principal components, being explained by 77.27% of thetotal variance. The e-tongue recognized between individual EOCs-spiked effluents and raw effluent(non-spiked) matrices. At the end of the treatment, t120, the cross-check of the analytes individualsemi-quantification was achieved for TCS and M-TCS with the e-tongue array. For DCP and TCP, betterresults were accomplished with a single sensor, (PEI/PSS)5 with 10 µm interdigitated gold electrodeand TIO2, respectively. The characterization of thin films, while using field emission scanning electronmicroscope, allowed for a total understanding of the “sensorial” impedance response. The presentstudy suggests innovative alternatives for complementing the traditional analysis with sensors devices,

Sensors 2019, 19, 5349 11 of 13
since the customized e-tongue was capable of semi-qualitative analyses thought electro-dynamicdegradation’s kinetics.
Supplementary Materials: The following are available online at http://www.mdpi.com/1424-8220/19/24/5349/s1,Figure S1. Scheme of the thin films used in the electronic tongue array; Figure S2. Resistance impedance spectra ofeach sensor device under study to TCP; DCP, TCS and M-TCS; Figure S3. Resistance impedance spectra of eachsensor device under study to the effluent spiked with 0.1 mg/L of TCP; DCP, TCS and M-TCS (Reproducibility ofn = 3 impedance measurements); Figure S4. Electronic tongue calibration curves for each EOCs under study:TCP, DCP, TCS and M-TCS, in the range of concentration: 0-0.8 ppm (x axis): data from Figure 3, first componentPC1 (y axis); Figure S5. EFR degradation path measured by an electronic tongue in the effluent with the 4 EOCs: 0mg/L (non-spiked; t0 to t120 (spiked with the 4 EOCs) sampled every 15 min; Figure S6. PCA Score plot for thebest sensors, concerning effluent spiked (0–0.7 mg/L) with the 4 EOCs. Table S1. Chemical properties of the EOCsunder study; Table S2. Average and standard deviation error to the electronic tongue presented at Figure 4.
Author Contributions: Conceptualization, C.M. and S.S.; Data curation, C.M.; Formal analysis, E.P.M., J.M.P.-G.,S.S., M.R. and A.B.R.; Funding acquisition, M.R. and A.B.R.; Methodology, C.M.; Project administration, M.R. andA.B.R.; Resources, E.P.M., M.R. and A.B.R.; Supervision, E.P.M., J.M.P.-G. and A.B.R.; Validation, E.P.M., J.M.P.-G.,M.R. and A.B.R.; Writing–original draft, C.M.; Writing–review & editing, C.M., E.P.M., J.M.P.-G., S.S and A.B.R.
Funding: This study was partially funded by Fundação para a Ciência e a Tecnologia through projectsUID/AMB/04085/2019, UID/FIS/00068/2019 and PTDC/FIS-NAN/0909/2014. This work has received fundingfrom the European Union’s Horizon 2020 research and innovation programme under the Marie Skłodowska-Curiegrant agreement No. 778045. C. Magro acknowledges Fundação para a Ciência e a Tecnologia for her PhDfellowship SFRH/BD/114674/2016.
Acknowledgments: This research was anchored by the RESOLUTION LAB, an infrastructure at NOVA School ofScience and Technology. C. Magro acknowledges Fundação para a Ciência e a Tecnologia for her PhD fellowshipSFRH/BD/114674/2016. The authors thank Ricardo Faria for his help with the reactors drawing.
Conflicts of Interest: The authors declare no conflict of interest.
References
1. United Nations. World Population Prospects 2019 (ST/ESA/SER.A/423); United Nations Department of Economicand Social Affairs: New York, NY, USA, 2019.
2. Corcoran, E.; Nellemann, C.; Baker, E.; Bos, R.; Osborn, D.; Savelli, H. Sick Water ? The Central Role of WastewaterManagement in Sustainable Development; UNEP/Earthprint: Nairobi, Kenya, 2010; ISBN 9788277010755.
3. Daughton, C.G. Non-regulated water contaminants: Emerging research. Environ. Impact Assess. Rev. 2004,24, 711–732. [CrossRef]
4. Geissen, V.; Mol, H.; Klumpp, E.; Umlauf, G.; Nadal, M.; Van Der Ploeg, M.; Van De Zee, S.E.A.T.M.;Ritsema, C.J. Emerging pollutants in the environment: A challenge for water resource management. Int. SoilWater Conserv. Res. 2015, 3, 57–65. [CrossRef]
5. Sirés, I.; Oturan, N.; Oturan, M.A.; Rodríguez, R.M.; Garrido, J.A.; Brillas, E. Electro-Fenton degradation ofantimicrobials triclosan and triclocarban. Electrochim. Acta 2007, 52, 5493–5503. [CrossRef]
6. Daughton, C.G.; Ternes, T.A. Pharmaceuticals and personal care products in the environment: Agents ofsubtle change? Environ. Health Perspect. 1999, 107, 907–938. [CrossRef]
7. Rivera-Utrilla, J.; Sánchez-Polo, M.; Ferro-García, M.Á.; Prados-Joya, G.; Ocampo-Pérez, R. Pharmaceuticalsas emerging contaminants and their removal from water. A review. Chemosphere 2013, 93, 1268–1287.[CrossRef]
8. López-Serna, R.; Petrovic, M.; Barceló, D. Occurrence and distribution of multi-class pharmaceuticals andtheir active metabolites and transformation products in the Ebro River basin (NE Spain). Sci. Total Environ.2012, 440, 280–289. [CrossRef]
9. Jurado, A.; López-Serna, R.; Vázquez-Suné, E.; Carrera, J.; Pujades, E.; Petrovic, M.; Barceló, D. Occurrenceof carbamazepine and five metabolites in an urban aquifer. Chemosphere 2014, 115, 47–53. [CrossRef]
10. Paíga, P.; Santos, L.H.M.L.M.; Ramos, S.; Jorge, S.; Silva, J.G.; Delerue-Matos, C. Presence of pharmaceuticalsin the Lis river (Portugal): Sources, fate and seasonal variation. Sci. Total Environ. 2016, 573, 164–177.[CrossRef]
11. Roberts, J.; Kumar, A.; Du, J.; Hepplewhite, C.; Ellis, D.J.; Christy, A.G.; Beavis, S.G. Pharmaceuticals andpersonal care products (PPCPs) in Australia’s largest inland sewage treatment plant, and its contribution toa major Australian river during high and low flow. Sci. Total Environ. 2016, 541, 1625–1637. [CrossRef]

Sensors 2019, 19, 5349 12 of 13
12. Wu, Y.; Yu, C.P.; Yue, M.; Liu, S.P.; Yang, X.Y. Occurrence of selected PPCPs and sulfonamide resistance genesassociated with heavy metals pollution in surface sediments from Chao Lake, China. Environ. Earth Sci.2016, 75, 1–8. [CrossRef]
13. Aranami, K.; Readman, J.W. Photolytic degradation of triclosan in freshwater and seawater. Chemosphere2007, 66, 1052–1056. [CrossRef] [PubMed]
14. Constantin, L.A.; Nitoi, I.; Cristea, N.I.; Constantin, M.A. Possible degradation pathways of triclosan fromaqueous systems via TiO2 assisted photocatalyis. J. Ind. Eng. Chem. 2018, 58, 155–162. [CrossRef]
15. Hua, W.; Bennett, E.; Letcher, R. Triclosan in waste and surface waters from the upper Detroit River byliquid chromatography-electrospray-tandem quadrupole mass spectrometry. Environ. Int. 2005, 31, 621–630.[CrossRef] [PubMed]
16. McAvoy, D.C.; Schatowitz, B.; Jacob, M.; Hauk, A.; Eckhoff, W.S. Measurement of triclosan in wastewatertreatment systems. Environ. Toxicol. Chem. 2002, 21, 1323–1329. [CrossRef]
17. Guo, J.-H.; Li, X.-H.; Cao, X.-L.; Li, Y.; Wang, X.-Z.; Xu, X.-B. Determination of triclosan, triclocarban andmethyl-triclosan in aqueous samples by dispersive liquid–liquid microextraction combined with rapid liquidchromatography. J. Chromatogr. A 2009, 1216, 3038–3043. [CrossRef]
18. Balmer, M.E.; Poiger, T.; Droz, C.; Romanin, K.; Bergqvist, P.A.; Müller, M.D.; Buser, H.R. Occurrenceof methyl triclosan, a transformation product of the bactericide triclosan, in fish from various lakes inSwitzerland. Environ. Sci. Technol. 2004, 38, 390–395. [CrossRef]
19. Xing, L.; Sun, J.; Liu, H.; Yu, H. Combined toxicity of three chlorophenols 2,4-dichlorophenol,2,4,6-trichlorophenol and pentachlorophenol to Daphnia magna. J. Environ. Monit. 2012, 14, 1677–1683.[CrossRef]
20. Zhao, N.; Li, X.; Jin, X.; Angelidaki, I.; Zhang, Y. Integrated electrochemical-biological process as an alternativemean for ammonia monitoring during anaerobic digestion of organic wastes. Chemosphere 2018, 195, 735–741.[CrossRef]
21. Vlasov, Y.; Legin, A.; Rudnitskaya, A.; Di Natale, C.; D’Amico, A. Nonspecific sensor arrays (“electronictongue”) for chemical analysis of liquids ( IUPAC Technical Report ). Pure Appl. Chem. 2005, 77, 1965–1983.[CrossRef]
22. Magro, C.; Mateus, E.P.; Raposo, M.; Ribeiro, A.B. Overview of electronic tongue sensing in environmentalaqueous matrices: Potential for monitoring emerging organic contaminants. Environ. Rev. 2019, 27, 202–214.[CrossRef]
23. Mimendia, A.; Gutiérrez, J.M.; Leija, L.; Hernández, P.R.; Favari, L.; Muñoz, R.; del Valle, M. A review of theuse of the potentiometric electronic tongue in the monitoring of environmental systems. Environ. Model. Softw.2010, 25, 1023–1030. [CrossRef]
24. Campos, I.; Alcañiz, M.; Aguado, D.; Barat, R.; Ferrer, J.; Gil, L.; Marrakchi, M.; Martínez-Mañez, R.; Soto, J.;Vivancos, J.-L. A voltammetric electronic tongue as tool for water quality monitoring in wastewater treatmentplants. Water Res. 2012, 46, 2605–2614. [CrossRef] [PubMed]
25. Cetó, X.; González-Calabuig, A.; del Valle, M. Use of a bioelectronic tongue for the monitoring of thephotodegradation of phenolic compounds. Electroanalysis 2015, 27, 225–233. [CrossRef]
26. Facure, M.H.M.; Mercante, L.A.; Mattoso, L.H.C.; Correa, D.S. Detection of trace levels of organophosphatepesticides using an electronic tongue based on graphene hybrid nanocomposites. Talanta 2017, 167, 59–66.[CrossRef]
27. Liu, X.; Feng, H.; Liu, X.; Wong, D.K.Y. Electrocatalytic detection of phenolic estrogenic compounds atNiTPPS|carbon nanotube composite electrodes. Anal. Chim. Acta 2011, 689, 212–218. [CrossRef]
28. Oliveira, O.N.; Raposo, M.; Dhanabalan, A. Langmuir-blodgett and self-assembled polymeric films.In Handbook of Surfaces and Interfaces of Materials; Nalwa, H.S., Ed.; Elsevier: Burlington, NJ, USA, 2001;pp. 1–63. ISBN 978-0-12-513910-6.
29. Riul, A.; Dos Santos, D.S.; Wohnrath, K.; Di Tommazo, R.; Carvalho, A.C.P.L.F.; Fonseca, F.J.; Oliveira, O.N.;Taylor, D.M.; Mattoso, L.H.C. Artificial taste sensor: Efficient combination of sensors made fromLangmuir-Blodgett films of conducting polymers and a ruthenium complex and self-assembled filmsof an azobenzene-containing polymer. Langmuir 2002, 18, 239–245. [CrossRef]
30. Paulovich, F.V.; De Oliveira, M.C.F.; Oliveira, O.N. A future with ubiquitous sensing and intelligent systems.ACS Sens. 2018, 3, 1433–1438. [CrossRef]

Sensors 2019, 19, 5349 13 of 13
31. Riul, A.; Dantas, C.A.R.; Miyazaki, C.M.; Oliveira, O.N. Recent advances in electronic tongues. Analyst 2010,135, 2481–2495. [CrossRef]
32. Magro, C.; Zagalo, P.M.; Mateus, E.P.; Ribeiro, A.B.; Ribeiro, P.A.; Raposo, M. Triclosan Detection in AqueousEnvironmental Matrices by Thin-films Sensors: Impedantiometric Electronic Tongue. In Proceedings of the7th International Symposium on Sensor Science, Napoli, Italy, 9–11 May 2019; MDPI: Basel, Switzerland,2019; pp. 1–4.
33. Zhu, X.; Tang, F.; Suzuki, T.S.; Sakka, Y. Role of the initial degree of ionization of polyethylenimine in thedispersion of silicon carbide nanoparticles. J. Am. Ceram. Soc. 2003, 86, 189–191. [CrossRef]
34. Raposo, M.; Lourenço, J.M.C.; Botelho do Rego, A.M.; Ferraria, A.M.; Ribeiro, P.A. Counterions - A newapproach to control the degree of ionization of polyelectrolytes in layer-by-layer films. Colloids Surf. APhysicochem. Eng. Asp. 2012, 412, 1–10. [CrossRef]
35. Lourenço, J.M.C.; Ribeiro, P.A.; Do Rego, A.M.B.; Fernandes, F.M.B.; Moutinho, A.M.C.; Raposo, M.Counterions in poly(allylamine hydrochloride) and poly(styrene sulfonate) layer-by-layer films. Langmuir2004, 20, 8103–8109. [CrossRef] [PubMed]
36. Zhu, B.L.; Xie, C.S.; Wang, W.Y.; Huang, K.J.; Hu, J.H. Improvement in gas sensitivity of ZnO thick film tovolatile organic compounds (VOCs) by adding TiO2. Mater. Lett. 2004, 58, 624–629. [CrossRef]
37. Chaudhary, S.; Umar, A.; Bhasin, K.K.; Baskoutas, S. Chemical sensing applications of ZnO nanomaterials.Materials 2018, 11, 1–38. [CrossRef] [PubMed]
38. Siopa, D.; Sério, S.; Jorge, M.E.M.; Viana, A.S.; Gomes, A. ZnO seed layers prepared by DC reactive magnetronsputtering to be applied as electrodeposition substrates. J. Electrochem. Soc. 2016, 163, H697–H704. [CrossRef]
39. De Souza, N.C.; Silva, J.R.; Pereira-da-Silva, M.A.; Raposo, M.; Faria, R.M.; Giacometti, J.A.; Oliveira, O.N.Dynamic scale theory for characterizing surface morphology of layer-by-layer films of poly(o-methoxyaniline).J. Nanosci. Nanotechnol. 2004, 4, 548–552. [CrossRef]
© 2019 by the authors. Licensee MDPI, Basel, Switzerland. This article is an open accessarticle distributed under the terms and conditions of the Creative Commons Attribution(CC BY) license (http://creativecommons.org/licenses/by/4.0/).

110

111
Paper
“Exploring hydrogen production for self-energy generation in electroremediation: a proof of concept”
C Magro, J Almeida, JM Paz-Garcia, EP Mateus & AB Ribeiro
Published in: Applied Energy, 2019

112

Contents lists available at ScienceDirect
Applied Energy
journal homepage: www.elsevier.com/locate/apenergy
Exploring hydrogen production for self-energy generation inelectroremediation: A proof of concept
C. Magroa,⁎,1, J. Almeidaa,1, J.M. Paz-Garciab, E.P. Mateusa, A.B. Ribeiroa,⁎
a CENSE, Department of Sciences and Environmental Engineering, NOVA School of Science and Technology, NOVA University Lisbon, Caparica Campus, 2829-516Caparica, PortugalbDepartment of Chemical Engineering, Faculty of Sciences, University of Malaga, Teatinos Campus, 29010 Málaga, Spain
H I G H L I G H T S
• Self-produced H2 from electrodialytictreatment of environmental matricescollected.
• Collected H2 average purity (% mol/mol) of ≈98%.
• A fuel cell used to produce electricityfrom the self-produced H2 (~1 V).
• Experimental self-generated energypromotes savings on electroremedia-tion (≈7%).
G R A P H I C A L A B S T R A C T
A R T I C L E I N F O
Keywords:Electrodialytic treatmentHydrogen productionProton-exchange membrane fuel cellEnergy savings
A B S T R A C T
Electrodialytic technologies are clean-up processes based on the application of a low-level electrical current toproduce electrolysis reactions and the consequent electrochemically-induced transport of contaminants. Thesetreatments inherently produce electrolytic hydrogen, an energy carrier, at the cathode compartment, in additionto other cathode reactions. However, exploring this by-product for self-energy generation in electroremediationhas never been researched. In this work we present the study of hydrogen production during the electrodialytictreatment of three different environmental matrices (briny water, effluent and mine tailings), at two currentintensities (50 and 100mA). In all cases, hydrogen gas was produced with purities between 73% and 98%,decreasing the electrical costs of the electrodialytic treatment up to ≈7%. A proton-exchange membrane fuelcell was used to evaluate the possibility to generate electrical energy from the hydrogen production at thecathode, showing a stable output (~1 V) and demonstrating the proof of concept of the process.
1. Introduction
Global energy demands from an increasing human population is amajor concern for the planet sustainability. Extensive research andtechnology development have been focused on renewable energysources and other strategies to reduce CO2 emissions [1]. Fuel cell
technology, which can efficiently generate electricity using hydrogen asfuel, has attracted widespread attention in recent years [2]. The proton-exchange membrane fuel cells success depends on their ability to obtainoptimal fuel to electricity conversion with a high current density, aswell as the sustainable and economical production of the fuel [3]. Purehydrogen gas is scarce in Earth's atmosphere. However, it can be
https://doi.org/10.1016/j.apenergy.2019.113839Received 21 March 2019; Received in revised form 11 August 2019; Accepted 1 September 2019
⁎ Corresponding authors.E-mail addresses: [email protected] (C. Magro), [email protected] (A.B. Ribeiro).1 The authors had an equal contribution.

produced from different primary-energy sources. For instance, it can begenerated from fossil fuels through steam reforming, partial oxidationor gasification and from renewable sources through biomass gasifica-tion and water electrolysis [4,5]. Generation of H2 via water electrolysisis still limited by the high cost, namely ≈ 3.8 times more expensivethan gasification, and ≈ 5 times more expensive than from methanesteam reforming [6]. Hence, steam reforming, which combines high-temperature steam with natural gas, currently accounts for the majorityof the H2 produced. Hydrogen production via water electrolysis iscurrently only applied in combination with renewable energy sources,like solar or wind, and used as an energy storage system.Electro-based technologies, such as electrokinetic and electro-
dialytic processes, have been the focus of vast environmental re-mediation research over the last three decades [7,8], both in-situ [9,10],and ex-situ [11–13]). Despite such research efforts, the technologyreadiness level (TRL) for many of those technologies remains very low;although most are considered promising, many are far from being in-troduced as efficient processes into the market. Important barriers needto be overcome to reach high TRLs [14]. Operational energy costs haveto be considered and, are related not only to the electrolysis reactionsbut mainly with the stirring, the ohmic losses and the energy requiredfor the transport of charge through the porous matrix. In fact, the dis-tance between electrodes (cell size) plays a crucial role in the energycosts of the specific-energy required for the target contaminants re-moval [7,15]. To the best of our knowledge, there has been minimalresearch conducted related to the reuse of the elemental gases producedin the electrolysis reactions during electrochemically-induced treat-ments. The drawbacks found in the current literature are associated tothe reactors' design. Most electrokinetic and electrodialytic (ED) setupsare designed to allow for the produced gases to flow freely into theatmosphere, while aiming to reduce pressure-related transport me-chanisms. Thus, a gas collection strategy during the treatment is notincluded in the system, causing gas losses to the atmosphere. As a novelfeature, the H2 produced during the treatment at the cathode com-partment may be used as fuel in a proton-exchange membrane fuel cellsto produce electrical energy and reduce the energy costs of electro-remediation. Additionally, as an energy carrier, H2 can be used to ac-cumulate energy during the electric power demand valleys, and togenerate electric power during the peaks. Therefore, a reservoir can beintegrated into the ED system where it can recover and use the H2produced for different purposes.This work evidences the possibility of using the H2 produced during
electrochemically-induced remediation of three different environ-mental matrices: (1) moderately-salted water – briny water, (2) sec-ondary effluent from a wastewater treatment plant, and (3) mine tail-ings. Our proof of concept demonstrates that the H2 captured andreused from these ED treatments is feasible. Herein, a three-compart-ment ED set-up was used to minimize the interactions of the sample andthe contaminants with the electrolysis reactions (Fig. 1).
2. Theory
2.1. Proton-exchange fuel cell
A fuel cell is an electrochemical device that converts the chemicalenergy from a fuel into electricity through the reaction of the fuel withoxygen or another oxidizing agent. For example, a proton-exchangemembrane fuel cell (PEMFC) combines H2 and O2 to produce electricityand heat without emitting other products which are different from thewater formed in the reaction Eq. (1) [16]:
+ →H 12
O H O2 2 2 (1)
A fuel cell, unlike a battery, produces electricity as long as fuel issupplied, never losing its charge. The pollution-free production of en-ergy and high power density makes the fuel cell technology a viable
approach for future energy industries [2]. Fuel cells show high energyconversion efficiency, up to 60%, higher than traditional internalcombustion engines [17]. This efficiency can increase up to 80% withheat-recovery systems [18].
2.2. Electro-based technologies
Electrokinetic and ED strategies are commonly applied to removeorganic [19] and/or inorganic contaminants from soils or other porousmatrices, such as sewage sludge, fly ash or construction materials[20–22]. The electrochemically-induced transport is based on the ap-plication of a low level direct current which promotes electrolysis re-actions at the electrodes [20,23,24], involving in most cases wateroxidation at the anode, Eq. (2), and water reduction at the cathode, Eq.(3): + + → =+ − °e l EO (g) 4H 4 2H O( ); (25 C) 1.23 Vanode2 2
o (2)
+ → + =− − °l e EH (g) 2OH 2H O( ) 2 ; (25 C) 0.83 Vcathode2 2o (3)
Competing redox reactions may occur as, for example, the produc-tion of chlorine at the anode in systems with high chloride contents[25], Eq. (4):+ → =− − °ECl (g) 2e 2Cl ; (25 C) 1.36 Vanode2
o (4)
or the deposition of metals (Me) at the cathode, Eq. (5):+ →+ −eMe 2 Me2 o (5)
The electrochemical-induced transport of chemical species takesplace by three main transport mechanisms: electromigration, electro-osmosis, and electrophoresis. Diffusion and advection may also play animportant role [20]. In the case of the ED process, electrodialysis alsooccurs, as ion-exchange membranes are used to separate the matrixfrom the electrode compartments (aiming to control the pH conditionsof the electrolytes and the treated matrix while improving the se-lectivity on the contaminant removal [20]). Over the years, differentelectro-based remediation set-ups have been proposed, where theconfiguration of the sample and the electrode compartments have beenmodified depending on the nature of the contaminant and matrix[26,27].
3. Materials and methods
3.1. Materials
The briny water solution was prepared with NaCl (PA grade, Merck,Germany) and tap water (Almada, Portugal). Effluent, the liquid frac-tion that results from wastewater treatments, was collected in the sec-ondary clarifier at a wastewater treatment plant (Lisbon, Portugal).Mine tailings were collected at Panasqueira mine (Covilhã, Portugal,40°10′11.0604″N, 7°45′23.8752″W). Panasqueira mine producesaround 900 t WO3/year [28] and the pond where the residues are de-posited is an open air impoundment that contains rejected ore con-centrates with high metal levels [29]. The matrix used for this study is arejected fraction from the sludge circuit, that is directly pumped to thePanasqueira dam.
3.2. Experimental set-up
The ED cell set-up was a 3 compartment acryl XT cell [30] (RIAS A/S, Roskilde, Denmark), as represented in Fig. 1. The internal diameterwas 8 cm and the central and electrolyte compartments length were5 cm. The two electrode compartments were separated from the centralsection by an anion exchange membrane, AR204SZRA, MKIII, Blank(Ionics, USA) and a cation exchange membrane, CR67, MKIII, Blank(Ionics, USA). The electrodes were made of Ti/MMO Permaskand wire:Ø = 3mm, L=50mm (Grønvold & Karnov A/S, Denmark). Ti/MMO
C. Magro, et al.

anodes are used to degrade organic contaminants in wastewaters, andTi/MMO is also applied as cathode to reduce chlorinated and nitrocompounds in groundwater [31]. A power supply E3612A (HewlettPackard, Palo Alto, USA) was used to maintain a constant current in theED cell.For briny water and effluent experiments, 250mL of liquid sample
was added to the central cell compartment. For the mine tailings ex-periments, suspensions were prepared at a liquid/solid (L/S) ratio of 9,by mixing 22.2 g of solid mine tailings within 200mL of briny water.The anolyte and catholyte compartments were set with 250mL of0.01M NaNO3.Twelve ED experiments were carried out in duplicate according to
the conditions presented in Table 1. In experiments 1–6 the gas pro-duced at the cathode, rich in H2, was collected in a 30mL storage cy-linder (Horizon Fuel Cell Technologies, USA) (experimental scheme atsupplementary data B.1), where the volume was verified every 10min.In experiments 7–9, the cathode compartment exhaust was directlyconnected to the tedlar sample bag, single polypropylene fitting with500 mL of capacity (SKC, USA), for purity analysis. In experiments10–12, the cathode compartment exhaust was directly connected to thePEMFC. In all cases, the ED cell voltage and the fuel cell open circuitvoltage were registered every 10min. The fuel cell open circuit voltagewas measured in order to validate the H2 catchment and conversioninto power needs.
The single PEMFC (Horizon Fuel Cell Technologies, USA) was used(32×32×10mm), with a nominal voltage of≈ 1 V. The PEMFC has acathodic plate, designed as a part of the cell's membrane electrode
Fig. 1. Electrodialytic cell with 3 compartments [ø = 8 cm, central and electrolyte compartments with L=5 cm, CEM – cation exchange membrane; AEM – anionexchange membrane, An- – anions, Cat+ – cations], stirrer (only used for mine tailings suspension) connected to a proton-exchange membrane fuel cell.
Table 1Electrodialytic experimental conditions.
Experiment ED Code Duration (h) Current intensity (mA)
ED tests with gas capture at the cell cathode compartment (n= 2)1 BW 50 2 502 EF 50 2 503 BW 100 1 1004 EF 100 1 1005 MTBW 50 2 506 MTBW 100 1 100
ED tests to H2 purity (n= 2)7 BW 6 1008 EF 6 1009 MTBW 6 100
ED tests with direct connection to PEMFC (n=2)10 BW 1 10011 EF 1 10012 MTBW 1 100
BW-Briny Water; EF-Effluent; MT-Mine Tailings; PEMFC – Proton-ExchangeMembrane Fuel Cell.
C. Magro, et al.

assembly that collects O2 directly from the air by natural convection.PEMFC voltage and resistance were measured and monitored by amultimeter KT1000H (KIOTTO, Portugal).
3.3. Methods
pH and conductivity were measured at the beginning and at the endof all ED experiments, both in central and electrode compartments.Briny water, effluent and mine tailings pH were measured with aRadiometer pH-electrode EDGE (HANNA, USA), and conductivity wasmeasured in a Radiometer Analytic LAQUA twin (HORIBA Ltd., Japan).The mine tailings pH and conductivity measurements are referred to theliquid phase resulting from the suspension from a liquid component(either deionized H2O or briny water), with a L/S ratio of 9.Total concentrations of As, Ca, Cu, K, Mg, Na, P, S, Sn, W, and Zn
were determined by Inductively Coupled Plasma with Optical EmissionSpectrometry (ICP-OES) (HORIBA Jobin-Yvon Ultima, Japan),equipped with generator RF (40.68MHz), monochromator Czerny-Turner with 1.00 m (sequential), automatic sampler AS500 and dis-positive CMA-Concomitant Metals Analyser. Cl– and SO42– were ana-lyzed by Ion Chromatography (IC) (DIONEX ICS-3000, USA), equippedwith conductivity detector. To quantify the elements in the solid matrix,an acid extraction was carried out mixing 0.5 g of mine tailings, 3mL ofHCl (37%) and 9mL of HNO3 (65%) and, placed on a shaking table for48 h at 125 rpm. For the IC analysis of the mine tailings (Cl– and SO42–
content), microwave assisted acid extraction was carried out accordingto EPA method 3051 A: 0.5 g of mine tailings were placed in a vesselwith 3mL of HCl (37%), and 9 mL of HNO3 (65%) and placed in amicrowave Ethos (Milestone S.r.l, Bergamo, Italy). At the end, all thesamples were diluted in deionized water (1:25), filtered by vacuumusing 0.45 μm MFV3 glass microfibre filters (Filter lab, Barcelona,Spain) and analyzed by ICP-OES and IC.The H2 purity percentage was determined by Gas Chromatography
Thermal Conductivity Detector (GC-TCD) using a Trace GC Ultra(Thermo Electron Corporation, USA), with a Carboxen 1010 plotcolumn (length: 30m, diameter: 0,32 mm). The analytical run wasperformed in an isothermal mode at 35 °C for 50min. A gastight syringe(vici precision sampling, Baton Rouge, Lousiana, USA) was used toinject a volume of 250 μL (injector at 200 °C), detector/transfer line at120 °C. To calculate the H2 purity two methods were used: (1) internallinear calibration and response factor (H2 peak area/response factor),where the standard deviation is related to error of these methods, bycomparing with the injection of 100% H2; (2) molar proportions (mol/mol), were determined assuming air as impurity in the H2. Thus, the H2was calculated considering the number of H2 mol in 100mol of air(H2+ air gases).All sample analysis was carried out in duplicate. The data from the
experiments were analyzed by the software Origin Pro 8.5 and thestatistical data obtained by the GraphPad Prism version 7.0e.Statistically significant differences among samples for 95% level ofsignificance were calculated through ANOVA tests.
4. Results and discussion
4.1. Matrix characterization
Matrices selection is an important step as the matrices’ character-istics will affect H2 purity and further energy generation. PEMFC, de-spite the robustness and stability, may be sensitive to contaminants inthe fuel [32]. The briny water was chosen as a working system blank,where NaCl was added to emulate the effluent without interferences.Briny water, with sufficient ionic conductivity to maintain the currentapplied for the remediation period chosen (1 and 2 h), is typically usedin systems for the electrolytic production of H2. The effluent and minetailings are, individually, matrices with high potential to be reused asraw materials in several sectors. For example, ED treated effluent has
recently been tested for cement based construction materials [33]. Minetailings are an example of solid matrix that can be successfully treatedvia ED as stirred suspensions mixtures [34]. In these cases, H2 pro-duction and exploitation is highly attractive, since it can allow thedecrease of energy costs in an industrial scale application.Table 2 presents the initial characterization of the three studied
matrices. The matrices had enough initial conductivity to allow currentpassage and facilitate the electrolysis reactions to occur at the imposedrate. The initial pH of the studied matrices was in the range 4.6–7.7.Mine tailings were slightly acidic (pH ≈ 4.57), presenting a high con-centration of arsenic (218.57 ± 132.31 mg As/kg), and significantamounts of other metals (76.82 ± 39.30mg Cu/kg, 1.95 ± 0.53mgSn/kg and 5.34 ± 1.42mgW/kg), as well as a high sulfur content(240.9 ± 4.6mg/kg).The ED process was applied to briny water, effluent and mine tail-
ings suspension in briny water. In all cases, the pH at the anode com-partment decreased to ~2 and the pH at the cathode compartmentincreased until ~12. The pH at the central compartment also decreasedin all cases. This phenomenon was expected as anion exchange mem-branes are known to have limited perm-selectivity, which means thatonly protons (H+) are able to cross this membrane. The acidification ofthe central compartment was more noticeable in the experiments at100mA (Fig. 2). The acidification phenomena proved to be influencedby the current intensity. The smallest variation in the potential appliedin the ED cell will increase the H+ production in the media. Thus, notonly the current intensity should be considered to analyze the results,but also the error associated to the power supplier ( ± 3 mA).Final concentrations of the major concerned elements in the liquid
matrices (Cl– and SO42–) and in the mine tailings suspension (As, Cu, Snand W) are presented in Tables 3 and 4, respectively.In general, the target contaminants removal from the matrices was
higher in the experiments operated at 100mA, for the same amount ofcirculated charge. When ED treatment is performed at higher currentintensities, the electromigration transport is predominant over diffusionor other transportation phenomena. The amount of salts amount isextremely heterogeneous in the effluent. The season periods of thesampling procedure affected chemical and physical properties of the
Table 2Initial characterization of briny water, effluent and mine tailings.
Matrix
BW* EF** MT*
pH 6.89 ± 0.08 7.67 ± 0.16 4.57 ± 1.74Conductivity (mS/cm)
1.81 ± 0.11 2.41 ± 2.12 0.84 ± 0.52
ICP-OES analysis (mg/L) (mg/L) (mg/kg)Ca 29.06 ± 0.02 51.74 ± 18.34 91.11 ± 27.08K 5.33 ± 0.01 47.80 ± 29.10 –Mg 10.30 ± 0.38 118.00 ± 137.17 –Na 602.5 ± 17.68 524.55 ± 532.55 –P 0.07 ± 0.10 3.21 ± 0.04 36.57 ± 18.74S 49.04 ± 26.07a 84.89 ± 65.27 789.59 ± 214.13A
As n.d. n.d. 218.57 ± 132.31Cu 0.09 ± 0.01 0.04 ± 0.00 76.82 ± 39.30Sn n.d.b n.d.b 1.95 ± 0.53B
W n.d.c n.d.c 5.34 ± 1.42C
Zn 1.07 ± 0.88 0.07 ± 0.06 –
IC analysis (mg/L) (mg/L) (mg/kg)Cl– 499.3 ± 8.1 908.1 ± 1013.7 5.6 ± 2.3SO42– 66.8 ± 1.5de 149.45 ± 127.07dE 240.9 ± 4.6D
BW-Briny Water; EF-Effluent; MT-Mine Tailings.*collected at 2-09-2018; ** collected at 5-09-2018 and 12-09-2018; nd- notdetected.Statistical analysis: Multiple comparisons were statistically performed atp < 0.05 (95% confidence interval); data with lower case letters is statisticallysignificantly different to the ones with the same capital letter.
C. Magro, et al.

samples collected due to the fluctuations in weather conditions and alsothe wastewater treatment plant process efficiency.The slightly extraction of Sn and W from mine tailings may be re-
lated to specific chemical limitations, such as desorption or dissolutionmechanisms. For example, W complexes are quickly decomposed andstabilized by high concentrations of chloride ions (MT: 5.6 ± 2.3 mg/kg; BW: 499.3 ± 8.1 mg/kg), where the most common product of thedecomposition is [W2Cl9]3−. Alternatively, the adsorption of sulfateions on metallic W surface results in the electronic structure mod-ification. The O2 reduction reaction is blocked during the ED process,which is already low in cationic dissolution in electrochemical pro-cesses [35].
4.2. Hydrogen generation and use
Fig. 3 shows the volume of collected gas produced at the cathodecompartment during experiments 1–6. As the volume of the gas depositwas 30mL, it was filled before the ED process ended. Experiments at50mA showed matrix related differences in the gas flow rate, reachingthe 30 mL of H2 production at different rates. There are no statisticallysignificant differences for the flow rates obtained at 100mA (Table E at
supplementary data). However, the flow rates of H2 are significantlydifferent (p < 0.001) in the experiments at 50mA.The gas generated at the cathode compartment, in the experimental
setup 3, 4 and 6 during 6 h, was captured and analyzed via GC-TCD, in atedlar sample bag. Table 5 presents the purity of the captured gas forthese experiments carried out at 100mA.The average H2 purity (% w/w) of the produced gas was≈ 73% (w/
w), where the highest value observed was in the ED experiment appliedto the effluent, that produced a gas with 90.4 ± 0.3% of H2. Thus, onlythe H2 purity in the effluent experiment has a statistically significantdifference (p < 0.05) compared to briny water and mine tailings sus-pension, while briny water and mine tailings suspension does not havea statistically significant difference between each other (Table 5). Inorder to validate and make a comparison with the purity results ob-tained in % w/w, another approach to determine the H2 purity wascarried out. Thus, the calculation of the gas was also performed con-sidering the molar fraction of the H2 in the air gases. Comparing the twomethods, the % mol/mol of H2 of the produced gas was 19% higher, inaverage, comparing to the % w/w (Table 5). In the % mol/mol analysis,the purity of the H2 was higher than 97% in all samples, whereas in the% w/w the H2 purity oscillated between 72% and 90%. The mass andthe molar compositions are different, and it is expected a higher molarpurity, as long as the other components in the gaseous phase are hea-vier (e.g. N2, O2).As mentioned before, the flow rate production for H2 in the ED
treatments can be directly related to the current intensity and the ma-trix. Assuming the H2 captured at 1 atm and 25 °C, a total of≈ 45.6mLof pure dry H2 would be theoretically obtained, at a rate of 0.76 mL/min in the experiments at 100mA. The volume of collected gas at thecathode, shown in Fig. 3 (Table B.2 at supplementary data), was clearlyhigher than the expected during the first few minutes of treatment, with
Fig. 2. pH of the liquid phase at the central cell compartment before and afterthe electrodialytic experiments at 50mA and 100mA (error bars related to thestandard deviation: n=2). BW-Briny Water; EF-Effluent; MT-Mine Tailings.
Table 3Concentration of anions in briny water and effluent, before and after theelectrodialytic experiments at 50mA (2 h) and 100mA (1 h).
50mA 100mAInitial (mg/L) Final (mg/L) Final (mg/L)
Cl– BW 499.3 ± 8.1 285.5 ± 40.3 15.7 ± 22.2EF1 1624.9 490.5 129.1EF2 191.3 83.0 20.5
SO42– BW 66.8 ± 1.5 16.8 ± 2.3 14.1 ± 5.0EF1 239.3 114.4 36.1EF2 59.6 30.0 27.9
BW – Briny Water; EF-Effluent.EF1 – collected at 5-09-2018.EF2 – collected at 12-09-2018.
Table 4Concentration of elements in mine tailings before and after the electrodialyticexperiments at 50mA (2 h) and 100 mA (1 h).
50mA 100mAInitial solid phase (mg/kg)
Final solid phase (mg/kg)
Final solid phase (mg/kg)
As 218.6 ± 132.3 196.2 ± 50.73 113.9 ± 19.7Cu 76.8 ± 39.3 38.3 ± 13.9 26.4 ± 3.5Sn 2.0 ± 0.5 2.2 ± 0.2 1.7 ± 0.4W 5.3 ± 1.4 5.7 ± 0.4 4.9 ± 1.6
Fig. 3. Gas flow rate generation (mL/min) during the electrodialytic experi-ments with BW, EF and MTBW, at 50mA and 100mA (collected maximumvolume 30mL). BW-Briny Water; EF-Effluent; MT-Mine Tailings.
Table 5H2 purity analysis by GC-TCD.
Matrix H2 (% w/w) H2 (% mol/mol)*
BW 74.19 ± 0.63A 97.63 ± 0.08B
EF 90.43 ± 0.25a 99.26 ± 0.02b
MTBW 72.39 ± 0.68A 97.41 ± 0.09B
*Calculated assuming air as impurity in the H2; Statistical analysis: Multiplecomparisons were statistically performed at p < 0.05 (95% confidence in-terval); data with lower case letters is statistically significantly different to theones with the same capital letter; BW-Briny Water; EF-Effluent; MT-MineTailings.
C. Magro, et al.

a change in the production rate after the first 10 to 20min. This mayindicate that competing cathode reactions took place. For example, apossible electrode reaction that could have taken place is the formationof NO2 (g) from the reduction of the nitrates (E0= 0.803 V), shown inEq. (6).+ → + + =− + − °NO g H O NO aq H e E( ) ( ) 2 ; (25 C) 0.803 Vcathode
o2 2 3
(6)
This reaction produces 1mol of NO2 (g) per circulated electron,twice as much as the H2 reaction and would increase the pH of thecathode compartment twice as fast. However, the pH changes at thecathode and the decrease of nitrate concentration in time will promotethat the water reduction electrolysis reaction become predominant afterthe first several minutes of the reaction. NO2 (g) might be in a solutionin the form of N2O4 below 21 °C.
4.3. Electrical energy requirements in the ED experiments
Among the ED experiments with H2 capture (experiments 1–6 inTable 1), the ED cell voltage decreased overtime. The rapid decrease ofthe cell voltage was more evident in the experiments at 100 mA (Fig. 4).According to the Ohm’s law, if the current intensity (I) is constant,
the voltage (V) and the resistivity (R, or conductivity) are strongly re-lated, Eq. (7):=V RI(V) (7)
where I is the current intensity, V the voltage and, R is the re-sistance.The decrease of the ED cell voltage is related to a conductivity in-
crease in the electrode compartments. The initial conductivity of theelectrolyte was moderately low, 0.90 ± 0.06 mS/cm, and it increasedto values between 3 and 4 mS/cm at the anode, and 2–3 mS/cm at thecathode, at the end of all experiments, which is consistent with the pHchanges observed. In the central compartment, the conductivitychanged depending on the matrix (Fig. 5). Due to the highly hetero-geneous environmental samples under study, high standard deviationsin the ED experiments’ behavior were observed. Nevertheless, in gen-eral, it stayed with values that assure conductivity. However, the ex-periment MTBW at 100mA had a voltage increase after half an hourand a decrease on the conductivity at the end of the experiment (Fig. 5).The treatment at 100mA produced the reduction of ions (related to theH+ migration through the anion exchange membrane) in the centralcompartment, and an energy efficiency decrease of the process due toan increase of the ohmic losses. In the experiments at 50mA, the longer
running times allowed diffusion and dissolution/desorption kinetics toreplete the ion content in the central cell compartment. Effluent andmine tailings are matrices with high dependency on the sampling andweather conditions (effluent high standard deviations in the salts con-tent, in line with the conductivity values). Mine tailings are a hetero-geneous matrix implying different amounts of metals and salts content,with different variations in the charged species during the sampling.As the ED experiments are carried out at a constant current, the
electrical energy required during the process, accounting only for theenergy applied by the DC power source, can be calculated from Eq. (8):∫=E I V t dt( )
t
tcell
0 (8)
Using a numerical chained-trapezoidal integration, the estimatedelectrical energy is presented in Fig. 6. As expected, the electrical en-ergy required increases as the electrical current increases, for the sameamount of circulated charge. These results are consistent with theconductivity of those matrices. According to the results presented in theFig. 6, the experiments carried out at 100 mA required ~8.7 ± 0.8 kJof electrical energy, while the experiments carried out at 50 mA re-quired an average of ~4.8 ± 0.7 kJ.
4.4. Energy savings
Considering a faradaic efficiency of 100% and no competition to thewater reduction as the cathode electrolysis reaction, ~1.86mmol of H2would be produced in experiments 1–6 at the end of the ED experiment,either at 50 mA in 2 h or at 100mA in 1 h. Using a fuel cell at low
Fig. 4. Cell voltage during the electrodialytic experiments with BW, EF andMTBW, at 50mA and 100mA. BW-Briny Water; EF-Effluent; MT-Mine Tailings.
Fig. 5. Conductivity of the liquid phase at the central cell compartment beforeand after the electrodialytic experiments (error bars related to the standarddeviation: n= 2). BW-Briny Water; EF-Effluent; MT-Mine Tailings.
Fig. 6. Estimation of the cumulative electrical energy consumed during theelectrodialytic experiments. BW-Briny Water; EF-Effluent; MT-Mine Tailings.
C. Magro, et al.

temperatures and considering the higher heat of combustion of H2 as141.8 MJ kg−1, a total of 0.53 kJ may have been recovered from theprocess. The efficiency of the chemical energy conversion to electricalenergy at the fuel cell depends on the quality of the H2 gas produced,where a maximum of 98% (mol/mol) hydrogen average purity wasachieved during the ED treatments. Considering that current fuel cellhas energy conversion efficiencies of around 60%, a total of 0.32 kJcould have been transformed into electrical energy. This translates to~3.1% of the electrical energy required in experiment 4 (EF 100mA,the worst case), and ~6.9% of the electrical energy required in ex-periment 5 (MTBW 50mA, the best case). Reducing the electrical en-ergy dependency, mainly due to stirring needs (for solid fine matrices),transport of charge through the porous matrix, and to feed a powersupply for the electrode’s reactions, may also have impact in the totalvariable costs of the overall ED process (~7%).As expected, the higher the current intensity used in the ED treat-
ment, the higher the electrical energy requirements for the sameamount of circulated charge. In the experiments presented, those car-ried out at 50mA during 2 h required almost half of the electrical en-ergy to produce the electrolysis reactions than those carried out at100 mA during 1 h. On the other hand, higher applied currents obtainbetter removal efficiencies, provided that there are no phase-transferkinetic limitations, such as dissolution or desorption processes.In general, one of the main advantages of the ED treatment applied
to liquid matrices compared to ED treatments applied solid porousmatrices is that the energy requirements for the electrolysis reactionsare considerably smaller, due to the higher conductivity of the matrices.Thus, in solid porous matrices, the ED treatment would reach highervoltage gradients due to the lower conductivity and will require long-lasting treatments. The ED treatments presented show requirements ofelectrical power for the electrolysis in the range of 1–5W. However, EDtreatments carried out for the mine tailings suspension required addi-tional energy for the stirring system at the sample central cell com-partment. A 10W stirrer system was used, meaning that the electricalenergy required for the stirring system could be up to ten-fold com-pared to the energy required for the electrolysis reactions. For thepurpose of energy optimization in ED treatments applied to suspen-sions, the reduction of stirring costs is critical. In this sense, PEMFCcould be an important factor in ED energy savings by reducing theoperation costs by powering a low-energy stirring system.To evaluate the possibility of reducing energy requirements from
the ED treatments by the in-operando production of electricity from H2gas formed at the cathode, a PEMFC was connected directly to theexhaust pipe of the cathode compartment in experiments 7–9, corre-sponding to the same matrices under ED treatment at 100mA during1 h.The initial open circuit voltage of the PEMFC was, in all cases, near
1.4 V, and it decreased and stabilized at a value of ~1V (Fig. 7), asexpected for a single PEMFC [32]. To obtain higher voltages, a stack ofFCs connected in series could be used. Comparing the voltage generatedby PEMFC in the different cases, there are no statistically significantdifferences (p < 0.05) (see Table C at supplementary data). The datasupported the statement that the production of electricity by a PEMFCis independent of environmental matrices used in the ED treatmentspresented, despite the fluctuation observed for the case of effluent.The data presented in this study indicates that the gas produced at
the cathode has a purity between 72.4% and 99.3%. Therefore, in afield scale ED treatment, the produced H2 could also be stored and soldfor transportation or other industrial sectors. The production costs of H2via electrolysis vary around 8–11 €/kg, which is higher than that ob-tained via steam methane reforming using natural gas or biogas[36,37]. The H2 produced during ED treatments, that until now hasbeen an unexploited byproduct, may be an alternative source of H2 fortransportation or energy storage.
5. Conclusions
In this study it is proved the possibility to produce H2 with averagepurities between 73% and 98% from electrodialytic treatments andused to generate electrical energy with a proton-exchange membranefuel cell. This estimation was performed according to the H2 formed atthe cathode electrolysis reaction, which can reduce the energy costsassociated to the electrodialytic treatments, as well as any other re-mediation treatment based on electrochemically-induced transport.The efficiency of chemical to electrical energy conversion at the fuel
cell would depend on the quality of the H2 gas produced. Thus, specificstudies on possible competitive cathode reactions are needed dependingon the system. However, in the matrices tested in this study, H2 gas wasproduced in all cases. This suggests that H2 purity seems to be moreaffected by external factors (experimental errors, nitrate reduction toNO2 or temperature increase) than the matrices composition. Flowingthe produced H2 gas through a single proton-exchange membrane fuelcell, resulted in a stable open circuit voltage (~1 V), that demonstratedthe potential to recover energy from the H2 byproduct, that otherwisewould be released to the atmosphere and lost.This research shows there are new possibilities for energy saving
and H2 production for different purposes in electrodialytic treatment,leading to an increase in the sustainability and applicability of theelectro-remediation, decontamination or degradation contaminantśprocesses.
Acknowledgments
This work has received fundings from the European Union’s Horizon2020 research and innovation programme under Grant Agreement No.776811, under the Marie Skłodowska-Curie grant agreement No.778045, and from Portuguese funds from FCT/MCTES through grantsUID/AMB/04085/2019 and PTDC/FIS-NAN/0909/2014. C. Magro andJ. Almeida acknowledge Fundação para a Ciência e a Tecnologia fortheir PhD fellowships SFRH/BD/114674/2016 and PD\BD\135170\2017, respectively. The authors acknowledge Carla Rodriguesand Nuno Costa from REQUIMTE for the ICP and IC analysis, andRicardo Chagas from LAQV- REQUIMTE.
Appendix A. Supplementary material
Supplementary data to this article can be found online at https://doi.org/10.1016/j.apenergy.2019.113839.
Fig. 7. Proton-exchange membrane fuel cell (PEMFC) generated open circuitvoltage during the electrodialytic experiments at 100mA. BW-Briny Water; EF-Effluent; MT-Mine Tailings.
C. Magro, et al.

References
[1] Hart PS, Feldman L. Would it be better to not talk about climate change? The impactof climate change and air pollution frames on support for regulating power plantemissions. J Environ Psychol 2018:1–33. https://doi.org/10.1016/j.jenvp.2018.08.013.
[2] Pei P, Jia X, Xu H, Li P, Wu Z, Li Y, et al. The recovery mechanism of protonexchange membrane fuel cell in micro-current operation. Appl Energy2018;226:1–9. https://doi.org/10.1016/j.apenergy.2018.05.100.
[3] Majlan EH, Rohendi D, Daud WRW, Husaini T, Haque MA. Electrode for protonexchange membrane fuel cells: a review. Renew Sustain Energy Rev2018;89:117–34. https://doi.org/10.1016/j.rser.2018.03.007.
[4] Abdalla AM, Hossain S, Nisfindy OB, Azad AT, Dawood M, Azad AK. Hydrogenproduction, storage, transportation and key challenges with applications: a review.Energy Convers Manag 2018;165:602–27. https://doi.org/10.1016/j.enconman.2018.03.088.
[5] Nikolaidis P, Poullikkas A. A comparative overview of hydrogen production pro-cesses. Renew Sustain Energy Rev 2017;67:597–611. https://doi.org/10.1016/j.rser.2016.09.044.
[6] Baykara SZ. Hydrogen: A brief overview on its sources, production and environ-mental impact. Int J Hydrogen Energy 2018;43:10605–14. https://doi.org/10.1016/j.ijhydene.2018.02.022.
[7] Alshawabkeh AN. Electrokinetic soil remediation: challenges and opportunities. SepSci Technol 2009;44:2171–87. https://doi.org/10.1080/01496390902976681.
[8] Ribeiro AB, Mateus EP, Couto N, editors. Electrokinetic across disciplines andcontinents. New strategies for sustainable development. Springer InternationalPublishing; 2016, 427p, 10.1007/978-3-319-20179-5.
[9] Gomes HI, Dias-Ferreira C, Ribeiro AB. Overview of in situ and ex situ remediationtechnologies for PCB-contaminated soils and sediments and obstacles for full-scaleapplication. Sci Total Environ 2013;445–446:237–60. https://doi.org/10.1016/j.scitotenv.2012.11.098.
[10] Yukselen-Aksoy Y, Reddy KR. Effect of soil composition on electrokinetically en-hanced persulfate oxidation of polychlorobiphenyls. Electrochim Acta2012;86:164–9. https://doi.org/10.1007/s12520-016-0397-x.
[11] Ferreira C, Jensen P, Ottosen L, Ribeiro A. Removal of selected heavy metals fromMSW fly ash by the electrodialytic process. Eng Geol 2005;77:339–47. https://doi.org/10.1016/j.enggeo.2004.07.024.
[12] Kirkelund GM, Magro C, Guedes P, Jensen PE, Ribeiro AB, Ottosen LM.Electrodialytic removal of heavy metals and chloride from municipal solid wasteincineration fly ash and air pollution control residue in suspension – test of a newtwo compartment experimental cell. Electrochim Acta 2015;181:73–81. https://doi.org/10.1016/j.electacta.2015.03.192.
[13] Ebbers B, Ottosen LM, Jensen PE. Electrodialytic treatment of municipal waste-water and sludge for the removal of heavy metals and recovery of phosphorus.Electrochim Acta 2015;181:90–9. https://doi.org/10.1016/j.electacta.2015.04.097.
[14] Lacasa E, Cotillas S, Saez C, Lobato J, Cañizares P, Rodrigo MA. Environmentalapplications of electrochemical technology. What is needed to enable full-scaleapplications? Curr Opin Electrochem 2019;16:149–56. https://doi.org/10.1016/j.coelec.2019.07.002.
[15] Villen-Guzman M, Gomez-Lahoz C, Garcia-Herruzo F, Vereda-Alonso C, Paz-GarciaJM, Rodriguez-Maroto JM. Specific energy requirements in electrokinetic re-mediation. Transp Porous Media 2018;121:585–95. https://doi.org/10.1007/s11242-017-0965-2.
[16] Kone J-P, Zhang X, Yan Y, Hu G, Ahmadi G. CFD modeling and simulation of PEMfuel cell using OpenFOAM. Energy Procedia 2018;145:64–9. https://doi.org/10.1016/j.egypro.2018.04.011.
[17] Staffell I, Green R, Kendall K. Cost targets for domestic fuel cell CHP. J PowerSources 2008;181:339–49. https://doi.org/10.1016/j.jpowsour.2007.11.068.
[18] Ahmadi MH, Mohammadi A, Pourfayaz F, Mehrpooya M, Bidi M, Valero A, et al.Thermodynamic analysis and optimization of a waste heat recovery system forproton exchange membrane fuel cell using transcritical carbon dioxide cycle andcold energy of liquefied natural gas. J Nat Gas Sci Eng 2016;34:428–38. https://doi.org/10.1016/j.jngse.2016.07.014.
[19] Cameselle C, Gouveia S. Electrokinetic remediation for the removal of organiccontaminants in soils. Curr Opin Electrochem 2018;11:41–7. https://doi.org/10.1016/j.coelec.2018.07.005.
[20] Ribeiro AB, Rodríguez-Maroto JM. Electroremediation of heavy metal-con-taminated soils. Processes and applications. Cap. 18. In: Prasad MNV, Sajwan KS,
Naidu R, editors. Trace Elements in the environment: biogeochemistry, bio-technology and bioremediation, Taylor & Francis, Florida, USA: CRC Press; 2006, p.341–68.
[21] Magro CC, Guedes PR, Kirkelund GM, Jensen PE, Ottosen LM, Ribeiro AB.Incorporation of different fly ashes from MSWI as substitute for cement in mortar:an overview of the suitability of electrodialytic pre-treatment. In: Ribeiro AB,Mateus EP, Couto N, editors. Electrokinetic across disciplines and continents. newstrategies for sustainable development. Springer International Publishing; 2016, p.225–47. 10.1007/978-3-319-20179-5_12.
[22] Guedes P, Mateus EP, Couto N, Rodríguez Y, Ribeiro AB. Electrokinetic remediationof six emerging organic contaminants from soil. Chemosphere 2014;117:124–31.https://doi.org/10.1016/j.chemosphere.2014.06.017.
[23] Guedes P, Couto N, Ottosen LM, Ribeiro AB. Phosphorus recovery from sewagesludge ash through an electrodialytic process. Waste Manag 2014;34:886–92.https://doi.org/10.1016/j.wasman.2014.02.021.
[24] Villen-Guzman M, Paz-Garcia JM, Rodriguez-Maroto JM, Gomez-Lahoz C, Garcia-Herruzo F. Acid enhanced electrokinetic remediation of a contaminated soil usingconstant current density: Strong vs. weak acid. Sep Sci Technol 2014;49:1461–8.https://doi.org/10.1080/01496395.2014.898306.
[25] Paz-García JM, Johannesson B, Ottosen LM, Alshawabkeh AN, Ribeiro AB,Rodríguez-Maroto JM. Modeling of electrokinetic desalination of bricks.Electrochim Acta 2012;86:213–22. https://doi.org/10.1016/j.electacta.2012.05.132.
[26] Hansen HK, Rojo A, Ottosen LM. Electrodialytic remediation of copper mine tail-ings. Procedia Eng 2012;44:2053–5. https://doi.org/10.1016/j.proeng.2012.09.042.
[27] Pedersen KB, Jensen PE, Ottosen LM, Barlindhaug J. Influence of electrode place-ment for mobilising and removing metals during electrodialytic remediation ofmetals from shooting range soil. Chemosphere 2018;210:683–91. https://doi.org/10.1016/j.chemosphere.2018.07.063.
[28] Lefebvre G, García R, Arragonés M, Moya M, Monge Q, Maund N. Report on balancebetween demand and supply of refractory metals in the EU. MSP-REFRAM2016;D1(3):40.
[29] Ávila PF, Da Silva EF, Salgueiro AR, Farinha JA. Geochemistry and mineralogy ofmill tailings impoundments from the panasqueira mine (Portugal): Implications forthe surrounding environment. Mine Water Environ 2008;27:210–24. https://doi.org/10.1007/s10230-008-0046-4.
[30] Ribeiro AB, Mexia JT. A dynamic model for the electrokinetic removal of copperfrom a polluted soil. J Hazard Mater 1997;56:257–71. https://doi.org/10.1016/S0304-3894(97)00060-5.
[31] Yuan S, Gou N, Alshawabkeh AN, Gu AZ. Efficient degradation of contaminants ofemerging concerns by a new electro-Fenton process with Ti/MMO cathode.Chemosphere 2013;93:2796–804. https://doi.org/10.1016/J. chemosphere.2013.09.051.
[32] Joshua OS, Ejura GJ, Essien VE, Olokungbemi IB, Oluwaseun AY, Okon EP. Fuel celltypes and factors affecting them. Int J Sci Eng Res 2014; 2:11–4, ISSN (Online):2347-3878.
[33] Magro C, Paz-garcia JM, Ottosen LM, Mateus EP, Ribeiro AB. Sustainability ofconstruction materials: Electrodialytic technology as a tool for mortars production.J Hazard Mater 2019;363:421–7. https://doi.org/10.1016/j.jhazmat.2018.10.010.
[34] Zhang Z, Ottosen LM, Wu T, Jensen PE. Electro-remediation of tailings from a multi-metal sulphide mine: comparing removal efficiencies of Pb, Zn, Cu and Cd. ChemEcol 2019;35:54–68. https://doi.org/10.1080/02757540.2018.1529173.
[35] Tuvić T, Pašti I, Mentus S. Tungsten electrochemistry in alkaline solutions—Anodicdissolution and oxygen reduction reaction. Russ J Phys Chem A 2011;85:2399–405.https://doi.org/10.1134/S0036024411130322.
[36] How Middlehurst T. much does a hydrogen car cost to run? Evening Stand 2017.[37] Baxley P, Verdugo-Peralta C, Weiss W. Rollout strategy topic team report: California
2010 Hydrogen highway network; 2005.
Glossary
ED: ElectrodialyticGC-TCD: Gas Chromatography with Thermal Conductivity DetectorIC: Ion ChromatographyICP-OES: Inductively Coupled Plasma with Optical Emission SpectrometryPEMFC: Proton-exchange membrane fuel cell
C. Magro, et al.

121
Paper
“Sustainability of construction materials: electrodialytic technology as a tool for mortars production”
C Magro, JM Paz-Garcia, LM Ottosen, EP Mateus & AB Ribeiro
Published in: Journal of Hazardous Materials, 2019

122

Contents lists available at ScienceDirect
Journal of Hazardous Materialsjournal homepage: www.elsevier.com/locate/jhazmat
Sustainability of construction materials: Electrodialytic technology as a toolfor mortars productionC. Magroa,b,⁎, J.M. Paz-Garciac, L.M. Ottosenb, E.P. Mateusa, A.B. Ribeiroa,⁎a CENSE, Departamento de Ciências e Engenharia do Ambiente, Faculdade de Ciências e Tecnologia, Universidade Nova de Lisboa, Caparica, 2829-516, Portugalb Department of Civil Engineering, Technical University of Denmark, Lyngby, DenmarkcDepartment of Chemical Engineering, University of Malaga, Malaga, Spain
A R T I C L E I N F O
Keywords:Electrodialytic technologyMortars productionSecondary water resourcesCircular economy
A B S T R A C T
The reduction of tap water consumption in all activity sectors, including the building industry, is crucial to thesustainability of water resources. Effluents from wastewater treatment plants have the potential to replacefreshwater in the construction sector but they contain a critical mixture of impurities, which hampers their use inmortars production. In this work, the viability of using effluent as an alternative to potable water for the pro-duction of mortars, after electrodialytic treatment, was assessed. Electrodialytic technology (ED-T) is a proventechnique for decontamination of porous and aqueous matrices.
ED-T experiments were conducted with 500mL of effluent for 6, 12 and 24 h, with a current intensity of25mA. The results showed that after ED-T 6 h, the removal efficiencies of critical components were above 85%of their initial concentrations. Mortar properties such as setting time, workability, flexural strength, compressivestrength and morphology were obtained for 100% effluent and tap water/effluent mixtures (50:50) with andwithout ED-T pre-treatment. The mortars with the ED-T treated effluent showed similar initial setting times andworkability, higher flexural and compressive strength compared to the mortars reference.
1. Introduction
The world’s freshwater resources are in short supply, as economicactivities, population growth, climate change, and the lack of appro-priated resources management have caused a significant increase ofwater use. The United Nations’ Sustainable Development Goals stated in2015 that: water scarcity affects more than 40% of the global popula-tion and is estimated to rise [1]. Currently, water scarcity affects anestimated 1.9 billion people and 2.1 billion people live with drinkingwater services not safely managed [2]. The critical point of waterscarcity has led scientists to look for new and efficient ways to make themost out of nontraditional sources, including sea water, brackish waterand wastewater. To match the demand of “zero-waste” system, it isessential to find solutions that minimize the consumption of freshwater.
Concrete is the second most consumed material in the world afterwater, being directly related to the use of freshwater [3]. Water use forthe concrete industry represents 9% of all industry withdrawals and1.7% of all global water consumption [4]. In a concrete mix, the water-cement ratio is around 0.45 to 0.60. In other words, more than 17billion m3 of freshwater are used in the production of concrete per year
[4]. Nowadays, freshwater is the only type of water that fulfils the in-dustrial standards, for quality and safety demands. In fact, if pollutedwater was used, the quality of the concrete would be significantlylower, leading to structural failures that would represent 5%–9.4% ofthe total costs in concrete production [5].
Various sources of non-freshwater have already been tested as al-ternatives to freshwater in concrete mixtures, such as (a) processedwastewater sludge [6], (b) polyvinyl acetate resin wastewater [7], (c)car washing wastewater [8], (d) untreated/treated textile effluent [9]and (e) domestic wastewater before chlorination [10]. Noruzman et al.[11] proved that the use of non-freshwater in the concrete mix canprovide a proper mix design and acceptable standards regarding tol-erable limits. However, due to the composition specifications and todifferent types of impurities that can exist in each type of water, it isdifficult to draw a sound conclusion. Thus, some improvements in paststudies need to be addressed in order to take water reuse into con-sideration: (1) expected degree of human contact, (2) concentration ofmicrobiological and chemicals and, (3) which pre-treatments are ne-cessary [12].
The electrodialytic technology (ED-T) consists on the application of
https://doi.org/10.1016/j.jhazmat.2018.10.010Received 3 October 2017; Received in revised form 22 September 2018; Accepted 3 October 2018
⁎ Corresponding authors at: CENSE, Departamento de Ciências e Engenharia do Ambiente, Faculdade de Ciências e Tecnologia, Universidade Nova de Lisboa,Caparica, 2829-516, Portugal.
E-mail addresses: [email protected] (C. Magro), [email protected] (A.B. Ribeiro).

a low level current density, either direct current or alternate current, ofa few mA/cm and a low potential gradient of V/cm, between suitablylocated electrodes [13]. In the ED-T, ion-exchange membranes are usedto separate the matrix to be treated from the electrode compartments.An anion-exchange membrane (AEM) is used at the anode end and acation-exchange membrane (CEM) at the cathode end. This set-up al-lows selective separation of anions and cations from the matrix. Ca-tionic species move towards the cathode through the CEM, that hindersthe transport of anions and anions move towards the anode through theAEM, that only partially hinders the transport of protons, as it does notwork as a perfect rectifier. The ED-T has proved to be efficient for theremoval of organic or/and inorganic contaminants, such as heavy me-tals and salts [14], in decreasing organic matter and fats [15] and in theinactivation of microorganisms in fresh sewage sludge from wastewatertreatment plant (WWTP) [16].
Therefore, the present study aims to investigate the use of effluentfrom an urban WWTP secondary treatment, after electrodialytic processin mortars’ production. The physical and functional mortar propertieswere performed and compared with the industry main standards.
2. Materials and methods
2.1. Materials
Tap water was collected at the Technical University of Denmark,Lyngby, Denmark. The effluent was sampled after the secondary clari-fier at Mølleåværket A/S WWTP in Lyngby, Denmark. The plant usesthe BioDenitro method in the aeration tanks and no tertiary treatment[17]. The plant treats 8–12 million m3 of wastewater on a yearly basis,corresponding to a 115 000 population equivalent.
The cement used for mortar preparation was the Ordinary PortlandCement (OPC) and the sand was the CEN standard sand.
2.2. Tap water and effluent characterization
All experiments were carried out in triplicate.The pH in the effluent and tap water were measured with a
Radiometer pH-electrode and conductivity in a Radiometer Analytic.Total concentrations of Ca, K, Mg, Ni, P, S, Si and Zn were de-
termined by Inductively Coupled Plasma with Optical EmissionSpectrometry (ICP-OES), and Cl–, NO3– and SO4
2– by IonChromatography (IC).
The regulatory parameters for effluent discharge in water bodies –namely biological oxygen demand (BOD5), chemical oxygen demand(COD), NH4
+, NO2 and Ntotal – were determined by SpectrophotometerDR2800 kits, and total suspended solids (TSS) by gravimetric analysis.
2.3. Electrodialytic experiments
Three different electrodialytic experiments ED-T were carried out,in triplicate, according to the conditions presented in Table 1.
The ED-T cell used (Fig. 1) was a 3 compartment conventional one[18], made of plastic (RIAS, Acryl XT). The internal diameter was 8 cmand the central compartment length was 10 cm. The 2 electrode com-partments were separated from the central one by ion exchange mem-branes, an AEM AR204SZRA, MKIII, Blank and a CEM CR67, MKIII,
Blank, both from Ionics. The electrodes were platinum coated titaniumwire (Ø=3mm) by Grønvold & Karnov A/S. A power supply (HewlettPackard E3612 A) was used, maintaining a constant current of 25mA.
The effluent (500mL) was placed on the central cell compartment.Both anolyte and catholyte compartments were set with 500mL of0.01M NaNO3 adjusted to pH 2 with HNO3, and recirculated by using“Pan World” magnetic pumps (Plastomec Magnet Pump model P05).
Control experiments for each treatment, without applied current,were also carried out.
pH and conductivity in the electrolytes and in the central com-partment were measured twice (T0 and T6,12,24h) per treatment.
At the end of the ED-T experiments, the effluent in the centralcompartment was analyze by ICP-OES and IC (as in Section 2.2).Membranes were soaked in 1M HNO3 and the electrodes in 5M HNO3,overnight, being their aqueous phases collected and analyzed for Ca, K,Mg, Ni, P, S, Si and Zn by ICP-OES, as well as the electrolytes.
2.4. Mortars bars: physical and functional tests
After ED-T, the treated effluent was used to prepare mortars ac-cording to EN 196-7 [19]. The mixture consisted of 225mL water (tapwater or effluent), 450 g of OPC and 1350 g of CEN standard sand, with0.5 water/binder ratio of and a sand/cement ratio of 3%. Mortarsamples were performed using tap water, ED-T pre-treated effluent andmixtures of 50% each. The tested mortar samples consisted of hor-izontal prismatic specimens (160×40 x 40mm) made in triplicates.The mortar bars were defined as:
• Reference (100% tap water)• Raw (effluent without pre-treatment; 50% or 100%)• ED-T (effluent with ED-T pre-treatment during 24 h, 12 h, 6 h; 50%or 100%)
Mortars demolding was carried out after 24 h and the samples werecured horizontally in a tap water bath for 7, 14 or 28 days at 20–21 °C.
The following tests were carried out on the mortar specimens inaccordance with:
• Setting time (min) - Standard ASTM C 191 [20] performed by aVicat Needle. The period of penetration tests was performed by al-lowing a 1mm Vicat needle to settle into this paste. The Vicat initialsetting time was the time elapsed between the initial contact of rawmaterials and the time when penetration was measured to be 25mmor less. The Vicat final setting time was the end point to be the first
Table 1Electrodialytic experimental conditions.Experiment Code Effluent treated (mL) Duration (h) Current
intensity (mA)
1 ED-T 6 h 500 6 252 ED-T 12 h 123 ED-T 24 h 24
Fig. 1. Electrodialytic 3 compartments cell with ø=8 cm, central compartmentL=10 cm and electrolyte compartment L=5 cm. CEM – cation exchangemembrane; AEM – anion exchange membrane.
C. Magro et al.

penetration measure that does not mark the specimen surface with acomplete circular impression.• Workability - Standard EN-1015-3 [21] using a flow table test,where vertical difference between the top of the mold and the dis-placed original center of the top surface of the specimen was mea-sured as the slump value.• Flexural strength at 28-day - Standard EN 196-1 [22] with thirdpoint loading (two steel supporting rollers of Ø 10.0 ± 0.5mm anda third steel loading roller of the same diameter placed centrallybetween the other two) at a loading rate of 0.2 kN/s, performed byInstron 6022 10 kN;• Compressive strength at 7, 14 and 28 days - Standard EN 196-1C[22] by a Toni machine using a loading rate of 2.5 kN/s (t-test wasperformed to find statistical differences, 95% of confidence level)• Morphology at 28 days with 100% of replacement by raw and ED-Teffluent - performed by scanning electron microscope (SEM). Nosample pre-treatment was performed. Acceleration voltage of theSEM was 20–25 kV with large field detector, in low vacuum with amagnification of 800x.
3. Results and discussion
3.1. Characterization of tap water and effluent before and afterelectrodialytic treatment
3.1.1. Initial characterizationTable 2 presents the characteristics of water samples under study:
Tap water and effluent. The data shows that almost all raw effluentcomponents were higher than those found in tap water. The exceptionwas for Ca, Mg, Si, Zn average concentrations, nevertheless within theBS EN 1008 (2002) requirements [23].
Chemical impurities in water are active players in the reactionsbetween water and cement and, being prone to interfere with the set-ting and hardening of cement and consequently with the developmentof strength and durability of concrete [24].
Comparing the chloride content in the raw effluent and in tap water(207.3 vs 63.0 mg/L, Table 2), and according to BS EN 1008 (2002)
[23] requirements (to pre-stressed concrete or grout propose, chlorideshall not exceed the level of 500mg/L; Cl2 residual ≤ 1mg/L), both areunder the standard, but not under NP 423≤50mg/L [25]. The lowerthe chloride concentration the better, as a high Cl− content will in-crease the potential for corrosion in reinforced concrete. Also, sulfate(65.7 vs 31.7mg/L; BS EN 1008≤2000mg/L; NP 413≤30mg/L[26]) together with macro elements, can lead to the formation ofcomplexes, increasing the cracking formation.
The value of COD, was higher in the raw effluent (comparing withthe other experiments), and presented a large variability betweensamples (69% RSD). This parameter plays an important role in waterand cement reaction, promoting a negative effect in the control of thecement paste of mortars (delays in setting time) [27]. Moreover, whenhandling effluents, their pathogen content is also relevant due to safetyreasons and material acceptance for further uses.
Thereby, the ED-T proposed as a pre-treatment with the potentialfor the removal of unwanted parameters was studied.
3.1.2. ED-T experimentsThe conductivity decreased with time, from 1.3mS/cm to 0.1 μS/
cm in about 12 h (Table 2), which is a consequence of the desalinationof the effluent, leading to increase system resistivity (expressed by thecell voltage). In the ED-T experiments the final voltage achieved 35.9,74.2 and 74.1 V, for respectively 6, 12 and 24 h. In the case of the ex-periments with 12 and 24 h, the voltage increased up to the limit of thepower supply and, thus, the current decreased below the stablished25mA, down to almost open-circuit conditions.
The final pH of the ED-T effluent was 4–5 (Table 2), inside the rangeof the standard BS EN 1008 (2002) ≥ 4–8 [23].
3.1.3. Removal ratesThe ED-T treatment reduced the concentration of all ions, elements
and parameters in the effluent in all experiments (Table 2).The data shows that the transport in the bench reactor is fast
achieving, in a few hours, the necessary removal of ions to prevent theside effects on the mortar properties (Table 2). Anions removal at theend of the ED-T experiments ranged between 85–99.7%. The results
Table 2Characterization of the tap water and effluent before and after 24, 12 and 6 h of ED-T.
Tap Water Effluent
Raw ED-T 24 h ED-T 12 h ED-T 6 h
pH 7.7 ± 0.1 7.9 ± 0.3 4.0 ± 0.3 4.0 ± 0.5 5.0 ± 0.3Conductivity (μs/cm) 755.5 ± 23.3 1304.5 ± 109.6 0.1 ± 0.02 0.1 ± 0.01 0.2 ± 0.01Parameters (mg/L)TSS – < 4 n.d. n.d. n.d.BOD5 – 3.55 ± 0.05 3.1 ± 0.0 5.1 ± 0.4 4.1 ± 0.4COD – 403.5 ± 279.3 226 230 ± 4.2 221 ± 8.5Ntotal – 7 2 6 1NO2 – 0.11 ± 0.00 0.02 ± 0.00 0.02 ± 0.00 0.02 ± 0.00NH4
+ – 0.16 ± 0.01 0.08 ± 0.01 0.07 ± 0.01 0.09 ± 0.01Ptotal – 0.63 ± 0.42 n.d. n.d. n.d.Elements (mg/L)Ca 105.3 ± 12.1 99.7 ± 13.3 0.3 ± 0.0 0.3 ± 0.1 5.9 ± 3.6K 4.9 ± 0.7 24.2 ± 0.7 0.5 ± 0.2 0.3 ± 0.2 1.2 ± 0.4Mg 20.3 ± 0.7 15.7 ± 0.9 0.05 ± 0.01 0.04 ± 0.01 1.2 ± 0.7Na 35.6 ± 4.2 118.7 ± 0.7 0.5 ± 0.1 1.5 ± 1.8 10.2 ± 8.3S 11.1 ± 3.3 20.6 ± 1.9 0.2 ± 0.1 0.2 ± 0.1 3.0 ± 1.1Ni 0.005 ± 0.000 0.06 ± 0.02 0.004 ± 0.005 0.003 ± 0.004 0.004 ± 0.004Si 9.3 ± 0.7 8.4 ± 0.4 5.8 ± 0.6 6.6 ± 0.2 7.5 ± 0.6Zn 0.8 ± 0.6 0.05 ± 0.02 ±0.01 0.01 ± 0.01 0.02 ± 0.02Anions (mg/L)Cl– 63.0 ± 2.2 207.3 ± 3.9 2.0 ± 0.2 2.1 ± 0.8 23.1 ± 10.5NO3– 2.0 ± 2.8 13.5 ± 3.2 8.3 ± 3.8 9.1 ± 15.7 11.9 ± 19.4SO4
2– 31.7 ± 2.2 65.7 ± 2.3 0.4 ± 0.1 0.2 ± 0.3 9.9 ± 3.9
*n.d. – not detected.
C. Magro et al.

showed (Table 2) that an optimal removal of the ions was achieved inapprox. 6 h, indicating that there is no need of expending more energyas in ED-T 12 h or 24 h. The anions removal is an important variabledue to its weak interaction with cement, for example, on the mortarsfinal compressive strength.
The removal of the elements quantified by ICP analysis was in therange of 50–97.8%.
The parameters TSS and COD, that interfere with the cement pastefinal properties, were also reduced after ED-T (COD removal rates: ED-T24 h 44%; ED-T 12 h 43%; ED-T 6 h 45%) complying with the re-quirements of standard NP 1414 (COD≤500 mg/L) [27]. The effluentvalues of BOD5 before and after ED-T experiments were in accordancewith USEPA limit of BOD5 ≤ 30mg/L [28]. Furthermore, Guedes et al.2016 [29] reported the inactivation of biological activity in similarenvironmental matrices using ED-T, thus is expected the same phe-nomena in the present work.
The qualitative and quantitative analysis of ED-T treated effluentshows that its overall composition after 6 h of treatment matches thestandards and can supply a product with less risk components, such ascorrosion, than the used conventional tap water.
Assuming a linear behavior of the voltage in time, for the ED-T 6 hexperiment at 25mA, the treatment required approximately 4.05 kWh/m3 of pre-treated effluent. With an average energy price in Denmark of0.30 € per kWh (in Europe is ∼ 0.2 € per kWh), the estimated costrelated to the energy consumption is 1.215 €/m3 of pre-treated effluent.The electricity energy cost can be significantly reduced by an optimi-zation study on the duration of the ED-T pre-treatment based on thematerial’s mechanical properties.
The results suggest that the operational time, and therefore theenergy costs, could be reduced by using less concentrated electrolytes inthe electrode compartments. The low pH found in the effluent at theend of the experiments suggests that protons are entering the centralcompartment via permeation through the non-ideal AEM or by diffu-sion from the cathode compartment. Optimizing the electrolyte con-centrations for the process will increase the selectivity and improve theenergy efficiency.
Nevertheless, for optimization purposes, a variability in the effluentcharacteristics is expected to occur as they are influenced by dailyfactors such as weather conditions, influent composition or operationalconditions at the biological reactor, and must be taken into account.
3.2. Mortars bars: physical and functional quality parameters
3.2.1. Effects on cement paste – setting time and workabilitySetting time and workability are important properties of materials.
Setting time is defined as a specified time required for concrete ormortar to change from liquid state (initial setting time) to a solid state(final setting time), where the surface becomes sufficiently rigid towithstand a definite amount of pressure. Workability can be dividedinto three different categories (low, medium and high), describing theability to mix, place, consolidate and finish with minimal loss ofhomogeneity a mortar preparation. Workability is a property that di-rectly impacts strength, quality, appearance, and the cost of labor op-erations. Setting time and workability are influenced by pH, dissolvedorganic matter, COD and salts. The aim of the tests was to understand ifthe moderately low pH after the ED-T would affect those two para-meters.
Table 3 presents the initial and final setting time, workability ca-tegory and slump values tests according to pH of the aqueous matricesused. Standards BS EN 1008 (2002) [23] and ASTM C94 [30] re-commend that the water used for concrete production should have apH≥4–8, since a lower pH can promote the dissolution of cement inthe mortar mix. The final pH obtained in all effluents was in accordanceto the values referred in the two standards (pH between 8-4).
Setting time can be divided into initial setting time and final settingtime based on the degree of rigidity. Comparing the different mixtures,
with reference tap water, there was a delay on the initial setting time of20min, when the mix was performed with 100% or 50% raw effluentand 10min when performed with 50% ED-T treated effluent (Table 3).Using 100% ED-T treated effluent no measurable difference was ob-served comparing to the reference mortar. The final setting time in-creased when raw and ED-T effluent is incorporated, having a referencetime difference of 50–130 min.
Delay in setting times is related to pH, temperature, humidity, su-gars and dissolved organic matter (constituent of COD) presented onraw effluent. Sugars adsorb on the surface of the cement grains and thusmight delay the cement hydration. The obtained results are in line withother studies [31,32]. Dissolved salts also influence the setting timeprocess [31]. The ammonia in the raw effluent has been reported tocause bleeding action (flow of water to the top of the concrete due toosmotic pressure) [33]. In the current study, applying ED-T as a pre-treatment decreased approximately 60% the NH4
+ concentration. Thiswill eliminate the possible bleeding action and turn the paste similarwith the reference’s setting time. According to BS EN 1008 the initialtime shall not be less than 1 h from the reference mortar (experimentsachieved a range of difference 0–20 min) and the final setting timeshould not exceed 12 h (experiments between 4.8 and 7 h).
Workability tests were conducted as described in Section 2.4, wherevertical difference between the top of the mold and the displaced ori-ginal center on the specimen top surface was measured as the slumpvalue. The use of effluent, either with or without ED-T treatment, in-creased the slump: 16–33mm differences (Table 3). The cement pasteproduced with reference water was considered, according to EN 1015-3[21], as a high workability mortar. The experiments using mixed ef-fluents resulted in a high workability category cement paste as well[21]. High workability paste can be used in inaccessible locations, largeflat areas, underwater applications and pumping concrete over longdistances (BS EN 206) [34]. This similarity in the paste prepared witheffluent, can present a positive enhancement in the mortars production,since it can be an alternative to the use of superplasticizer to stabilizeand manipulate the paste [10,35,8].
3.2.2. Effects on mortar properties – flexural strength, compressive strengthand morphology
Flexural strength of concrete is a key mechanical property, whichrepresents the ability of a beam or slab to resist failure in bending. Theload, extension and flexural strength (also known as modulus of rup-ture, or bend strength, or transverse rupture strength) results weredetermined for three 40×40 x 160mm prisms specimens. These spe-cimens were casted and tested after 28 days of curing, as showed inFig. 2.
Comparing with the reference, flexural strength results showed ED-T 12 h experiment effluent replacement as the highest strength (data inline with the similar morphology as Fig. 4a and d). Consequently, thesame experiment had the highest load, where the most similar to thereference were ED-T 6 h and 24 h with 50% of tap water replacement.Comparing the 100% of replacement (Fig. 2b), the highest flexural
Table 3Setting times and slump values using: tap water (reference), raw effluent (50and 100% replacement) and effluent with ED-T treatment (50% and 100% re-placement).
Mix InitialSettingtime (min)
FinalSettingtime (min)
Workability(mm)
Slump (mm)
pH 7.7 Reference(tap water)
140 290 High100 – 150
101 ± 2
pH 7 - 8 Raw 50% 160 340 117 ± 2Raw 100% 160 420 129 ± 3
pH 4 - 5 ED-T 50% 150 400 131 ± 2ED-T 100% 140 420 134 ± 9
C. Magro et al.

stress was obtained after ED-T 6 h treated effluent, followed by ED-T12 h. Regarding the extension - deflection of the material - for all themortars made with untreated or treated effluent, after the application ofthe load, the moment of failure occurred earlier comparing to the re-ference. In this way, the largest extension for the reference mortar in-dicates that the strengthening was more required in this experimentthan in the ED-T or raw effluent experiments.
Fig. 3 presents the compressive strength of mortars produced withtap water, 50% and 100% of raw effluent and treated effluents (ED-T 6,12 and 24 h) with 7, 14 and 28 days of curing age. The increase ofmaterial strength is related with mortar age. The higher the strengthvalue, less deformable is the material.
The strength variations addressed between the reference (7,14 and28 days) and the other mortar experiments (7, 14 and 28 days) arewithin BS EN 1008 [23] (Fig. 3), which refers that the average
compressive strength shall be at least 90% of the average compressivestrength of corresponding specimens prepared with tap water.
Comparing 7 days cured specimens, with 100% of raw effluent and50% of ED-T 12 h treated effluent, with the reference mortar, a trend inincreased mortar strength was observed, c.a. 5 and 11% of gain; σ= 0.2and 1.4, respectively). Still, this was only statistical relevant when the50% of effluent treated in ED-T for 12 h was used (p < 0.05). The sametrend for increased strength was also observed for the specimens after28 days of curing, ED-T 12h effluent either with 50% or 100% re-placement and ED-T 6h effluent with 50% of replacement (55.9, 56.8,58.6 MPa; σ = 1.3, 2.1 and 0.8, respectively), although without sta-tistical relevance at 95% confidence level. This highest “early” strengthcould be a result of changes in effluent chemical properties during EDtreatment, that highly influences mortar physico-chemical parameters.This might be due to the decreased COD in the effluent after
Fig. 2. Load, vertical displacement and flexural stress values of mortar at 28 days of curing age for tap water (reference), (a) raw effluent and effluent after ED-Ttreatment with 50% of replacement and (b) raw effluent and effluent after ED-T treatment with 100% of replacement.
Fig. 3. Compressive strength of age 7, 14 and 28 days using: tap water (reference), raw effluent (50 and 100% replacement) and effluent with ED-T treatment (6, 12and 24 h - 50% and 100% replacement).
C. Magro et al.

electrochemical treatment (Table 2), a parameter that is known to de-crease material strength [36]. After the ED-T pre-treatment, a CODremoval was achieved in the three ED-T experiments (43–45%;Table 2).
3.2.3. Morphology SEMScanning electron microscope was used to visualize the dimensional
morphology of the prepared mortar samples to compare visual char-acteristics, such as formation of different crystals, void spaces and crackformation, in relation to the reference (using tap water Fig. 4a). Fig. 4showed that the most significant difference was obtained when the tapwater was replaced by 100% of raw effluent. It was also possible toobserve the new formation of subhedral to anhedral crystals, morepronounced in Fig. 4b) and e). The bed matrix became denser and withless void spaces compared to the reference. In the case of ED-T 6, 12 and24 h (Fig. 4e, d and c), mortar specimens’ structures between aggregate
are structurally intact. This observation corroborates the higherstrength in compressive tests in ED-T specimens, as less interatomicspacing requires higher stresses for unwanted cracks to occur, being,therefore, a positive outcome [37]. In all mortar specimens’ microcracks effect were not observed.
4. Conclusion
Concerned with water scarcity around the world, the aim of thepresent study was to explore alternatives for freshwater use in thebuilding industry. Herein, the feasibility of using ED-T as a pre-treat-ment in mortar preparation was investigated, to remove effluent con-taminants such as Ca, Zn, Cl–, SO4
2− and COD that influence propertiesof the mortars’ material. Based on the experimental conditions observedthe following main conclusions are drawn:
Fig. 4. Images of SEM: (a) reference mortar, (b) 100% of replacement with raw effluent, (c) 100% of replacement with ED-T 24 h effluent, (d) 100% of replacementwith ED-T 12 h effluent, (e) 100% of replacement with ED-T 6 h effluent; magnification: 800x.
C. Magro et al.

1 The electrodialytic pre-treatment achieved a high removal of criticalelements and a decrease in the effluent discharged parameters thataffect materials’ quality and durability.
2 Workability that affect the mortar were moderate and tolerable. Theworkability increased in all the mortars compared to the reference.These results can avoid further use of superplasticizer. Compressivetests had an increase on resistance in specimens prepared with ED-Teffluent, comparing with the reference and raw effluent. SEMshowed changes in the morphology, where the replacement withraw effluent seems to show no space between pours, causing apossible problem. However, even if the void spaces are inferior withED-T 12 h and ED-T 6 h, they are still tolerable and had a positiveimpact in flexural and compressive strength.
3 In some specimens, even if the raw effluent showed the potential toreplace water in construction materials, the authors are concernedabout the pathogens and other impurities that affect the materialfinal quality, durability and safety. Hence, the ED-T can be a way tomake effluents non-hazardous contributing for a large scale use.
Further studies are needed on the long-term durability performanceand micro-biological activity of mortars mixed with urban effluenttreated with ED-T, as well as on the process optimization.
Acknowledgments
C. Magro acknowledges Fundação para a Ciência e a Tecnologia forher PhD fellowship (SFRH/BD/114674/2016). Paz–Garcia acknowl-edges the financial support from the “Plan Propio de Investigación yTransferencia de la Universidad de Málaga”, code: PPIT.UMA.B1.2017/20 and PPIT.UMA.B5.2018/17, and the “Ministerio de Educación,Cultura y Deporte - Subprograma Estatal de movilidad, y Plan Estatal deInvestigación Científica y Técnica y de Investigación 2013–2016”, code:CAS17/00196. This work has received funding from the EuropeanUnion’s Horizon 2020 research and innovation programme under theMarie Skłodowska-Curie grant agreement No. 778045, and from FCT/MEC through grant UID/AMB/04085/2013.
References
[1] United Nations General Assembly, Transforming our world: The 2030 agenda forsustainable development, http://www.un.org/ga/search/view_doc.asp?symbol=A/RES/70/1&Lang=E. (2015) 1–5. doi:10.1007/s13398-014-0173-7.2.
[2] WWAP (United Nations World Water Assessment Programme)/UN-Water, TheUnited Nations World Water Development Report 2018: Nature-Based Solutions forWater, Paris (2018).
[3] M.-S. Low, Material Flow Analysis of Concrete in the United States, MassachusettsInstitute of Technology, MA, US, 2005, p. 189 M.Sc. Thesis in Building Technology.
[4] S.A. Miller, A. Horvath, P.J.M. Monteiro, Impacts of booming concrete productionon water resources worldwide, Nat. Sustain. 1 (2018) 69–76, https://doi.org/10.1038/s41893-017-0009-5.
[5] P.E. Josephson, Y. Hammarlund, The causes and costs of defects in construction: astudy of seven building projects, Autom. Constr. 8 (1999) 681–687, https://doi.org/10.1016/S0926-5805(98)00114-9.
[6] C. Barrera-Díaz, G. Martínez-Barrera, O. Gencel, L.A. Bernal-Martínez, W. Brostow,Processed wastewater sludge for improvement of mechanical properties of con-cretes, J. Hazard. Mater. 192 (2011) 108–115, https://doi.org/10.1016/j.jhazmat.2011.04.103.
[7] Z.Z. Ismail, E.A. Al-Hashmi, Assessing the recycling potential of industrial waste-water to replace fresh water in concrete mixes: application of polyvinyl acetateresin wastewater, J. Clean. Prod. 19 (2011) 197–203, https://doi.org/10.1016/j.jclepro.2010.09.011.
[8] K.S. Al-Jabri, A.H. Al-Saidy, R. Taha, A.J. Al-Kemyani, Effect of using wastewateron the properties of high strength concrete, Procedia. Eng. 14 (2011) 370–376,https://doi.org/10.1016/j.proeng.2011.07.046.
[9] S.B.M. Kanitha, P. Ramya, V. Revathi, Potential utilisation of untreated/treatedtextile effluent in concrete, Int. J. Res. Eng. Technol. 3 (2014) 518–522, https://doi.
org/10.15623/ijret.2014.0319093.[10] G. Asadollahfardi, M. Delnavaz, V. Rashnoiee, N. Ghonabadi, Use of treated do-
mestic wastewater before chlorination to produce and cure concrete, Constr. Build.Mater. 105 (2016) 253–261, https://doi.org/10.1016/j.conbuildmat.2015.12.039.
[11] A.H. Noruzman, B. Muhammad, M. Ismail, Z. Abdul-Majid, Characteristics oftreated effluents and their potential applications for producing concrete, J. Environ.Manage. 110 (2012) 27–32, https://doi.org/10.1016/j.jenvman.2012.05.019.
[12] M. Silva, T.R. Naik, Sustainable use of resources – recycling of sewage treatmentplant water in concrete, in: J. Zachar, P. Claisse, T.R. Naik, E. Ganjian (Eds.),Second Int. Conf. Sustain. Constr. Mater. Technol. 2010, pp. 1–10 INC.
[13] Y.B. Acar, A.N. Alshawabkeh, Principles of electrokinetic remediation, Environ. Sci.Technol. 27 (1993) 2638–2647, https://doi.org/10.1021/es00049a002.
[14] G.M. Kirkelund, C. Magro, P. Guedes, P.E. Jensen, A.B. Ribeiro, L.M. Ottosen,Electrodialytic removal of heavy metals and chloride from municipal solid wasteincineration fly ash and air pollution control residue in suspension - test of a newtwo compartment experimental cell, Electrochim. Acta 181 (2015) 73–81, https://doi.org/10.1016/j.electacta.2015.03.192.
[15] B. Ebbers, L.M. Ottosen, P.E. Jensen, Electrodialytic treatment of municipal was-tewater and sludge for the removal of heavy metals and recovery of phosphorus,Electrochim. Acta 181 (2015) 90–99, https://doi.org/10.1016/j.electacta.2015.04.097.
[16] P. Guedes, C. Magro, N. Couto, A. Mosca, E.P. Mateus, A.B. Ribeiro, Potential of theelectrodialytic process for emerging organic contaminants remediation and phos-phorus separation from sewage sludge, Electrochim. Acta 181 (2015) 109–117,https://doi.org/10.1016/j.electacta.2015.03.167.
[17] Lyngby-Taarbæk Kommune - Økonomiudvalget, (2014), pp. 1–90 https://lyngbytaarbaek.plan.ramboll.dk/view.html?planid=08541641-0f8e-45b1-87fd-820222c7840e.
[18] A.B. Ribeiro, J.T. Mexia, A dynamic model for the electrokinetic removal of copperfrom a polluted soil, J. Hazard. Mater. 56 (1997) 257–271, https://doi.org/10.1016/S0304-3894(97)00060-5.
[19] BS EN 196-7:2007 - Methods of Testing Cement. Methods of Taking and PreparingSamples of Cement, British Standards Institution, 2008.
[20] ASTM C191-18, Standard Test Methods for Time of Setting of Hydraulic Cement byVicat Needle, West Conshohocken, PA, (2018), https://doi.org/10.1520/C0191-18.
[21] BS EN 1015-3:1999 - Methods of Test for Mortar for Masonry Part 3: Determinationof Consistence of Fresh Mortar (by Flow Table), British Standards Institution, 1999.
[22] BS EN-196-3:2016 - Methods of Testing Cement. Determination of Setting Timesand Soundness, British Standards Institution, 2016.
[23] BS EN 1008:2002 - Mixing Water for Concrete. Specification for Sampling, Testingand Assessing the Suitability of Water, Including Water Recovered From Processesin the Concrete Industry, As Mixing Water for Concrete, British StandardsInstitution, 2002.
[24] P. Tiwari, R. Chandak, R.K. Yadav, Effect of salt water on compressive strength ofconcrete, Int. J. Eng. Res. Appl. 4 (2014) 38–42 ISSN 2248-9622 https://ijera.com/papers/Vol4_issue4/Version%205/H044053842.pdf.
[25] NP 423:1966, Água. Determinação do teor de cloretos, IGPAI (in Portuguese),Lisboa, 1966.
[26] NP 413:1966, Água. Determinação do teor de sulfatos, IGPAI (in Portuguese),Lisboa, 1966.
[27] NP 1414:1977, Determinação do consumo químico de oxigénio de águas deamassadura e de águas em contacto com betões. Processo do dicromato de potássio,IGPAI (in Portuguese), Lisboa, 1977.
[28] Environmental Protection Agency (EPA), Guidelines for Water Reuse TechnicalIssues in Planning Water Reuse Systems, Washington (DC) (2004).
[29] P. Guedes, E.P. Mateus, J. Almeida, A.R. Ferreira, N. Couto, A.B. Ribeiro,Electrodialytic treatment of sewage sludge: current intensity influence on phos-phorus recovery and organic contaminants removal, Chem. Eng. J. 306 (2016)1058–1066, https://doi.org/10.1016/j.cej.2016.08.040.
[30] ASTM C94/C94M-17A - Standard Specification for Ready-mixed Concrete, (2017),https://doi.org/10.1520/C0094_C0094M-17A West Conshohocken, PA.
[31] O.S. Lee, M.R. Salim, M. Ismail, M.D.I. Ali, Reusing treated effluent in concretetechnology, J. Teknol. 34 (2001) 1–10, https://doi.org/10.11113/jt.v34.648.
[32] I. Al-Ghusain, M.J. Terro, Use of treated wastewater for concrete mixing in Kuwait,Kuwait J. Sci. Eng. 30 (2003) 213–228.
[33] A.M. Neville, Properties of Concrete, Pearson Education Limited, England, 2011,https://doi.org/10.4135/9781412975704.n88.
[34] BS EN 206-1:2000 Concrete - Part 1: Specification, Performance, Production andConformity, British Standards Institution, 2001.
[35] P.C. Aïtcin, Cements of yesterday and today - concrete of tomorrow, Cem. Concr.Res. 30 (2000) 1349–1359, https://doi.org/10.1016/S0008-8846(00)00365-3.
[36] K. Sarkor, T.M. Miretu, B. Bhattacharjee, Curing of concrete with wastewater andcuring compounds: effect on strength and water absorption, Indian Concr. J. 88(2014) (2014) 87–93.
[37] B. Muhammad, M. Ismail, M.A.R. Bhutta, Z. Abdul-Majid, Influence of non-hydro-carbon substances on the compressive strength of natural rubber latex-modifiedconcrete, Constr. Build. Mater. 27 (2012) 241–246, https://doi.org/10.1016/j.conbuildmat.2011.07.054.
C. Magro et al.

130

Confidential information
131
Provisional Patent Application
“Electrodialytic reactor and process for the treatment of contaminated aqueous matrices”
Inventors: C Magro, AB Ribeiro, EP Mateus P Guedes
Registration number: 115384

Confidential information
132

Confidential information
133
ABSTRACT
“ELECTRODIALYTIC REACTOR AND PROCESS FOR THE TREATMENT OF
CONTAMINATED AQUEOUS MATRICES”
The present application relates to an electrodialytic reactor suitable
for the treatment of contaminated aqueous matrices by removing macro
and micro elements. The present application also relates to a process
for the removal of said elements from the contaminated aqueous
matrices. The reactor described herein is a three compartment
apparatus and takes advantage of electrodes and separators to remove
positively charged compounds from the matrix in a first step and
elements with negative charge in a second step, assessing also
differences in the pH. Enhancements in the reactor configuration lead
to an improvement of the final characteristics of the aqueous matrix
and increase its value for further use. Additionally, it is possible
to couple a fuel cell to the reactor in order to recover and use the
hydrogen produced and transform it to energy to power the reactor or
stored and sold.
Registration number: 115384
Priority data: 21 March 2019

Confidential information
134

Confidential information
135
Market assessment
C Magro, AB Ribeiro & EP Mateus
Business plan for 2 Resource potential solution, in: Hitech program, NOVA SBE, March-July, 2018

Confidential information
136

Confidential information
137
EXECUTIVE SUMMARY
2Resource is an electrodialytic reactor that convert treated
wastewater into water that can be reused in several applications, with
a main focus on the production of concrete, an industry that represents
1.7% of all global water consumption. The solution will reduce the
fresh water consumption on concrete production, replacing 100% of the
fresh water by treated wastewater. Climate change, rapidly growing
populations and increased urbanization are some of the factors that
have a high impact on water consumption around the globe. Focusing on
the concept of circular economy, 2Resource aims to have a direct
contribution to solve water problems namely in water scarce regions
(Middle east) or with high water pollution (Asia). In these regions,
concrete batch plants oftentimes have no other choice than to use
reclaimed or low quality water in a concrete mix. This can result in
low quality concrete, hence in construction defects, structural
failure leading to safety and insurance problems. 2Resource has lower
capital expenditures and lower operation costs, including maintenance
and energy consumption, no chemicals are used during the entire
process, electrodes are not destroyed during the process and does not
produce hazardous by-products. Also, 2Resource has the flexibility on
the customizable reactor that will fit for the client’s needs. After
the cleaning process, the water characteristics are ideal (e.g. salt
content) to be reused in the production of concrete, ensuring highest
material quality. 2Resource consists of an interdisciplinary team with
a mix of members with more than 20 years of electro-based technology
technologies and project management, together with the energy and
knowledge of PhD students all with a remarkable passion for climate
innovation and entrepreneurship. After completing the registration
priority data in the patent process, 2Resource will need 3 years until
the go to market with the final product and the breakeven will be
reached before the end of the second year in the market. Total funding
is estimated to be around €1,9 million.
Our vision
Providing an eco-friendly, efficient and effective wastewater
treatment for a wide range of industries through an electro-based
reactor technology.
Our mission
Providing wastewater as a safe renewable resource for citizens,
industries and companies contributing to sustainable water use.

Confidential information
138

139
Chapter
“Sensors potential to monitoring electroremediation systems: emerging organic contaminants in wastewater”
C Magro, EP Mateus, M Raposo & AB Ribeiro
Under preparation, 2019

140

Chapter to be part of the book Electrokinetic Remediation for Environmental Security and
Sustainability, by John Wiley & Sons Ltd, UK, to be edited by AB Ribeiro and MNV Prasad.
141
Sensors potential to monitoring electroremediation systems: emerging
organic contaminants in wastewater
C. Magro1, EP. Mateus1, M. Raposo2 & AB. Ribeiro1
1CENSE, Department of Sciences and Environmental Engineering, NOVA School of Science and Technology,
NOVA University Lisbon, Caparica Campus, 2829-516 Caparica, Portugal
2CEFITEC, Department of Physics, NOVA School of Science and Technology, NOVA University Lisbon,
Caparica Campus, 2829-516 Caparica, Portugal
Abstract
Chromatography conventional techniques are the gold standards to detect pollutants in environmental
matrices. Those methods are known to be highly selective, when compared to modern alternatives, such
as sensors. Nevertheless, sensors have shown advantages in sample’s manipulation and preparation,
accelerating contamination’s cloud responses in a cost-effective way. Thus, sensors are now attractive
to the market, being sustainable and highly sensitive to organic molecules, with the nano-material
choice as the key point for success. Not only the methods for detection are under the spotlight, but also
the new removal technologies. The combination between sensors and removal treatments can provide
powerful tools for the future of environmental monitoring. However, there is a lack of information when
a multi-analyte analysis is the ultimate goal. This chapter will discuss the drawbacks, challenges and
advantages on having electronic tongues coupled with electrokinetic processes, to access the detection
on emerging organic contaminants in wastewater.
Keywords: sensors; electronic tongue; nano-materials; electrokinetic process; environmental
monitoring

142

143
Chapter
“Self-hydrogen recovery in electro-based technologies applied to environmental contaminated matrices”
C Magro, J Almeida, JM Paz-Garcia, EP Mateus & AB Ribeiro
Under preparation, 2019

144

Chapter to be part of the book Electrokinetic Remediation for Environmental Security and
Sustainability, by John Wiley & Sons Ltd, UK, to be edited by AB Ribeiro and MNV Prasad.
145
Self-hydrogen recovery in electro-based technologies applied to
environmental contaminated matrices
C. Magro1, J. Almeida1, JM. Paz-Garcia2, EP. Mateus1 & AB. Ribeiro1
1CENSE, Department of Sciences and Environmental Engineering, NOVA School of Science and Technology,
NOVA University Lisbon, Caparica Campus, 2829-516 Caparica, Portugal
2Department of Chemical Engineering, Faculty of Sciences, University of Malaga, Teatinos Campus, 29010
Málaga, Spain
Abstract
Electro-based technologies consist on the application of a low-level electrical current to produce
electrolysis reactions and consequent electrochemically-induced transport of contaminants. Although
the in-depth research on pollutants removal efficiencies carried out in the past two decades, the
technology readiness level is still far to leverage its introduction in the market. In an electrodialytic
reactor, the self-hydrogen recovery from the electrolytic production at the cathode compartment is now
raising awareness to innovative strategies, mitigating electroremediation drawbacks. Hydrogen
production during the electrodialytic treatment of three different matrices: briny water; wastewater; and
mine residues suspensions, was recently reviewed with positive achievements. The improvement of the
removal and recovery ratio of substances was studied by the combination of solid and liquid matrices.
Also, hydrogen purity and energy savings within the process were accessed.
Keywords: Technology transfer, scale-up potential market, electroremediation, wastewater, mine
residues, hydrogen, energy.

146

147
Conference Paper
“Detection and adsorption of Triclosan on sensors based on PAH/PVS thin-films”
J Pereira-da-Silva, PM Zagalo, C Magro, I Pinto, PA Ribeiro & M Raposo
Published in: Proceedings IEEE, 2018

148


153
Conference Paper
“Detection of Triclosan in tuned solutions by pH and ionic strength using PAH/PAZO thin films”
PM Zagalo, C Magro, J Pereira-da-Silva, B Bouchikhi, N el Bari, PA Ribeiro & M Raposo
Published in: Sensors Proceedings I3S, 2019

154

Proceedings 2019, 15, 25; doi:10.3390/proceedings2019015025 www.mdpi.com/journal/proceedings
Proceedings
Detection of Triclosan in Tuned Solutions by pH and Ionic Strength Using PAH/PAZO Thin Films † Paulo M. Zagalo 1,*, Cátia Magro 2,*, João Pereira-da-Silva 1, Benachir Bouchikhi 3, Nezha El Bari 4, Paulo António Ribeiro 1 and Maria Raposo 1
1 CEFITEC, Departamento de Física, Faculdade de Ciências e Tecnologia, Universidade Nova de Lisboa, 2829-516 Caparica, Portugal
2 CENSE, Departamento de Ciências e Engenharia do Ambiente, Faculdade de Ciências e Tecnologia, Universidade Nova de Lisboa, 2829-516 Caparica, Portugal
3 Sensor Electronic and Instrumentation Group, Physics Department, Faculty of Sciences, Moulay Ismaïl University, Meknes 50003, Morocco
4 Sensor Biotechnology Agroalimentary and Biomedical Analysis Group, Biology Department, Faculty of Sciences, Moulay Ismaïl University, Meknes 50003, Morocco
* Correspondence: [email protected] (P.M.Z.); [email protected] (C.M.) † Presented at 7th International Symposium on Sensor Science, Napoli, Italy, 9–11 May 2019.
Published: 15 July 2019
Abstract: The electronic tongue concept based on layer-by-layer (LbL) films can be used to the detection in water of triclosan (TCS), a pernicious molecule used in personal care products and widely released in the environment. In this work, we analyzed the adsorption of TCS on poly(allylaminehydrochloride) (PAH) and poly[1-[4-(3-carboxy-4hydroxyphenylazo) benzenesulfonamido]-1,2-ethanediyl, sodium salt] (PAZO) layers of PAH/PAZO LbL films. We demonstrate that the adsorbed amount is strongly dependent of pH, the efficiency of adsorption of TCS on PAH layer is higher, and, when PAZO is the outmost layer, the electrical parameters can discriminate the ionic strength on solutions of TCS.
Keywords: triclosan; LbL; sensor; impedance spectroscopy; adsorption
1. Introduction
Water is an essential and indispensable good to human health and nature’s wellbeing, and therefore it is of the utmost importance to preserve and maintain its quality and cleanliness. That is why the detection and monitorization of triclosan in water bodies, such as rivers, groundwater, as well as soils, remains as a paramount necessity due to it being present in a multitude of day-to-day products (dubbed PPCPs—pharmaceuticals and personal care products) and displaying fairly high levels of toxicity [1–5]. Therefore, and also related to the non-regulation of this compound, there is a growing concern about the presence and impact of PPCPs, as well as the need for reliable and effective water monitoring using sensors capable of detecting the target molecules in complex media [6]. One of the main challenges in sensors’ monitoring is the ensure analyte effective detection in environmental complex matrices that contain countless spurious molecules (potential interfering compounds), as well as microscopic life. These molecules, such as salts or even fluctuations of pH can jeopardize the analysis of a target molecule.
The purpose of this study was to assess the sensitivity of a sensor based on the electronic tongue concept [7] composed by an array of thin films prepared by layer-by-layer (LbL) technique [6]. In the present case, LbL films of poly(allylamine hydrochloride) (PAH) and poly[1-[4-(3-carboxy-4hydroxyphenylazo) benzene sulfonamido]-1,2-ethanediyl, sodium salt] (PAZO) (PAH/PAZO) were prepared onto quartz supports or gold interdigitated electrode deposited on glass (DropSens) by

Proceedings 2019, 15, 25 2 of 4
alternated adsorbed layers using 10−2 M aqueous solutions of these polyelectrolytes. In the present case, thin-films with 10 bilayers of PAH/PAZO ((PAH/PAZO)10 and (PAH/PAZO)10/PAH) were prepared. The amount of TCS adsorbed on these films was measured by ultraviolet-visible (UV-vis) spectroscopy using a UV 2101 PC Scanning Spectrophotometer while the characterization of electrical measurements when these films are immersed in 10−5 M aqueous solutions of TCS prepared with different salt concentrations was done using a Solartron 1260 Impedance Analyzer (frequency range of [1–1M] Hz, AC voltage of 25 mV).
2. Results
Figure 1a,b presents the absorbances at 232 nm and 280 nm of reused sensors based on (PAH/PAZO)10 and (PAH/PAZO)10/PAH LbL films after immersion in 10−4 M TCS solutions with decreasing pH of 9.04, 8.04, 7.0, 6.13, 4.68, 3.70 and 2.30. These absorbances were calculated by subtracting the UV-Vis spectrum after immersion from the initial one of each thin film.
Figure 1. Absorbance of TCS at: (a) 232 nm and (b) 280 nm in the LbL thin films vs. pH.
From data presented in Figure 1 it is possible to observe that the adsorbed amounts of TCS, proportional to measured absorbances, are higher for all pHs when the TCS is adsorbed on (PAH/PAZO)10/PAH films. Despite presenting different values of absorbances, the adsorption behaviour of TCS in both thin films is similar confirming that we are analyzing the same adsorbed amount. Starting at alkaline pH, as pH decreases the absorbances tend to increase until pH 6.13. Then, as pH decreases the absorbances tend to decrease. However, at the lowest pH of 2.30, the (PAH/PAZO)10 presents a slight increment of absorbances. At acidic pH (lower than 6.13), the absorbance tends to decrease due to desorption phenomena, particularly of PAH/PAZO thin-films. Adsorption studies of PAZO onto PAH/PAZO LbL films revealed that the electrostatic forces, governing the interactions between PAH and PAZO layers, are strongly dependent on solutions pH [8]. It has been reported that the adsorbed amount of PAZO decreases as the pH of PAH aqueous solutions become more acidic, namely at pH 4 [9]. It is also important to note that at pH 2.30, the absorbance of (PAH/PAZO)10 thin film revealed a slight increment. This fact is justified by a shift in the absorption bands of PAZO at acidic pH [10]. In fact, we also measured the spectra of 10−4 M PAZO solutions at pH 2.5 and pH 6, data not shown here, and an increase of absorbance, namely at 232 nm, was observed as well as a shift on the PAZO peak position which proves that the increase of absorbance at pH 2.30 is not related to adsorption of TCS.
The pH and ionic strength of the TCS solutions can also influence the electrical properties measured when these films are immersed in these solutions, namely, the ionic strength affects the impedance spectra at higher frequencies. In order to conduct this study, seven solutions were

Proceedings 2019, 15, 25 3 of 4
prepared, each with different concentrations of NaCl: 0 M, 10−3 M, 10−2.5 M, 10−2 M, 10−1.5 M, 10−1 M and 0.5 M. Figure 2a,b illustrate the principle components analysis (PCA) [11] of this study.
Figure 2. PCA plot of: (a) (PAH/PAZO)10 and (b) (PAH/PAZO)10/PAH thin films immersed in TCS aqueous solutions with different NaCl concentrations (0 M to 0.5 M).
The obtained PCA plots, Figure 2a,b, demonstrate that the impedance spectra data obtained with both type of films allow the distinction between different salt concentrations. However, the one obtained with (PAH/PAZO)10 LbL films has succeeded in distinguishing of the NaCl concentration, displaying a sequential-like pattern. For example, considering the obtained values of PC1, if one plots its values versus NaCl concentration, a function is obtained.
3. Conclusions
This study allowed to conclude that TCS adsorbs on both (PAH/PAZO)10 and (PAH/PAZO)10/ PAH LbL films but there is an adsorption increase of TCS when the outmost layer is positive. We also verified that the adsorbed amount of TCS increases when the pH decreases attaining a maximum and followed by a decrease as pH also decreases. We proved that this last decrease is not related to the decrease of TCS on the surface but to the change of PAZO spectra for lower pH. We also demonstrated that although pH and ionic strength have a strong influence in the impedance spectra of these films when immersed in solutions, one can find patterns that allow to distinguish between different ionic strengths. Interestingly, when we consider (PAH/PAZO)10 films one can attain a pattern in which the values of PC1 follow a function when plotted versus the salt concentration. Finally, it should be referred that the characterization of adsorption variables are fundamental in the choice of the adequate LbL films that can be used in the development of electronic tongue to detect, in the present case, TCS.

Proceedings 2019, 15, 25 4 of 4
Author Contributions: Conceptualization, P.M.Z.; methodology, P.M.Z.; software, P.M.Z., C.M. and J.P.-d.-S.; validation, P.M.Z., C.M. and J.P.-d.-S.; formal analysis, P.M.Z.; investigation, P.M.Z.; resources, M.R.; data curation, P.M.Z., C.M. and J.P.-d.-S.; writing—original draft preparation, P.M.Z.; writing—review and editing, P.M.Z.; visualization, P.M.Z.; supervision, P.A.R. and M.R.; project administration, P.A.R. and M.R.; funding acquisition, N.E.B., B.B., P.A.R. and M.R.
Funding: This research was funded by Fundação para a Ciência e a Tecnologia through projects UID/AMB/04085/2013, PTDC/FIS-NAN/0909/2014 and a Portugal-Morocco bilateral project.
Acknowledgments: P.M. Zagalo and J. Pereira-da-Silva acknowledge their fellowships PD/BD/142768/2018, PD/BD/142767/2018 from RABBIT Doctoral Programme, respectively. C Magro acknowledges Fundação para a Ciência e a Tecnologia for her PhD fellowship SFRH/BD/114674/2016.
Conflicts of Interest: The authors declare no conflict of interest. The funders had no role in the design of the study; in the collection, analyses, or interpretation of data; in the writing of the manuscript, or in the decision to publish the results.
References
1. Adolfsson-Erici, M.; Pettersson, M.; Parkkonen, J.; Sturve, J. Triclosan, a commonly used bactericide found in human milk and in the aquatic environment in Sweden. Chemosphere 2002, 46, 1485–1489.
2. Roberts, J.; Kumar, A.; Du, J.; Hepplewhite, C.; Ellis, D.J.; Christy, A.G.; Beavis, S.G. Pharmaceuticals and personal care products (PPCPs) in Australia’s largest inland sewage treatment plant, and its contribution to a major Australian river during high and low flow. Sci. Total Environ. 2016, 541, 1625–1637.
3. Yueh, M.-F.; Tukey, R.H. Triclosan: A Widespread Environmental Toxicant with Many Biological Effects. Annu. Rev. Pharmacol. Toxicol. 2016, 56, 251–272.
4. Mendez, M.O.; Valdez, E.M.; Martinez, E.M.; Saucedo, M.; Wilson, B.A. Fate of Triclosan in Irrigated Soil: Degradation in Soil and Translocation into Onion and Tomato. J. Environ. Qual. 2016, 45, 1029.
5. Olaniyan, L.W.B.; Mkwetshana, N.; Okoh, A.I. Triclosan in water, implications for human and environmental health. SpringerPlus 2016, 5, 1485.
6. Marques, I.; Magalhâes-Mota, G.; Pires, F.; Sério, S.; Ribeiro, P.A.; Raposo, M. Detection of traces of triclosan in water. Appl. Surf. Sci. 2017, 421, 142–147.
7. Magro, C.; Mateus, E.P.; Raposo, M.; Ribeiro, A. B. Overview of electronic tongue sensing in environmental aqueous matrices: Potential for monitoring emerging organic contaminants. Environ. Rev. 2018, 27, 202–214
8. Raposo, M.; Ferreira, Q.; Timóteo, A.R.M.; Ribeiro, P.A.; Rego, A.M.B.D. Contribution of counterions and degree of ionization for birefringence creation and relaxation kinetics parameters of PAH/PAZO films. J. Appl. Phys. 2015, 118, 114504.
9. Ferreira, Q.; Ribeiro, P.A.; Oliveira, O.N.; Raposo, M. Long-Term Stability at High Temperatures for Birefringence in PAZO/PAH Layer-by-Layer Films. ACS Appl. Mater. Interfaces 2012, 4, 1470–1477.
10. Ferreira, Q.; Gomes, P. J.; Ribeiro, P. A.; Jones, N. C.; Hoffmann, S. V.; Mason, N. J.; Oliveira, O. N.; Raposo, M. Determination of degree of ionization of poly(allylamine hydrochloride) (PAH) and poly[1-[4-(3-carboxy-4 hydroxyphenylazo)benzene sulfonamido]-1,2-ethanediyl, sodium salt] (PAZO) in layer-by-layer films using vacuum photoabsorption spectroscopy. Langmuir 2013, 29, 448–455.
11. Shlens, J. A Tutorial on Principal Component Analysis. 2014. Available online: https://arxiv.org/pdf/ 1404.1100.pdf (accessed on 12 September 2018).
© 2019 by the authors. Licensee MDPI, Basel, Switzerland. This article is an open access article distributed under the terms and conditions of the Creative Commons Attribution (CC BY) license (http://creativecommons.org/licenses/by/4.0/).

159
Conference Paper
“Triclosan Detection in Aqueous Environmental Matrices by Thin-Films Sensors”
C Magro, PM Zagalo, J Pereira-da-Silva, EP Mateus, AB Ribeiro, PA Ribeiro & M Raposo
Published in: Sensors Proceedings I3S, 2019

160

Proceedings 2019, 15, 24; doi:10.3390/proceedings2019015024 www.mdpi.com/journal/proceedings
Proceedings
Triclosan Detection in Aqueous Environmental Matrices by Thin-Films Sensors † Cátia Costa Magro 1,*, Paulo Morgado Zagalo 2, João Pereira-da-Silva 2, Eduardo Pires Mateus 1, Alexandra Branco Ribeiro 1, Paulo António Ribeiro 2 and Maria Fátima Raposo 2
1 CENSE, Departamento de Ciências e Engenharia do Ambiente, Faculdade de Ciências e Tecnologia, Universidade Nova de Lisboa, Caparica 2829-516, Portugal
2 CEFITEC, Departamento de Física, Faculdade de Ciências e Tecnologia, Universidade Nova de Lisboa, Caparica 2829-516, Portugal
* Correspondence: [email protected] † Presented at the 7th International Symposium on Sensor Science, Napoli, Italy, 9–11 May 2019.
Published: 15 July 2019
Abstract: Triclosan (TCS), a bacteriostatic detected in water bodies, have inauspicious effects in human and biota. Consequently, there is a critical need of monitoring these type of compounds in aqueous matrices. In this sense, sensors, based on polyethyleneimine and polysodium 4-styrenesulfonate layer-by-layer thin-films adsorbed on supports with gold interdigitated electrodes deposited, were developed. The aim was analyze the sensitivity of discrimination of TCS (10−15 M to 10−5 M) in deionized water, Luso® and in an effluent, by measuring the impedance spectra. LbL films can distinguish TCS concentrations in EF, while in LW was achieved an acceptable sensibility when interdigitated electrodes without films were used.
Keywords: triclosan monitoring; thin-films interdigitated sensors; impedance spectroscopy
1. Introduction
Water management is one of the most serious economic, political, social and ecological issues that mankind faces today. A major challenge is to keep water resources clean and safe, taking into account that the mixture of potential contaminants is continuously changing in a dynamic society. Over the last decade, beyond the legacy contaminants, (e.g., “priority” pollutants and industrial intermediates) that display persistence in the environment, new classes of environmental emerging organic contaminants, mainly composed of products used in a large scale in everyday life, are being detected and reported worldwide and accumulating in water, soil and biota [1]. Among them Pharmaceuticals and Personal Care Products, a group that includes numerous chemical classes, is under increased concern due to its continuous detection in water compartments and permanent introduction into environment across the world [2]. Triclosan (TCS) is a bacteriostatic used in household items such as toothpaste or soaps. TCS has raised health concerns that include allergy risk, antimicrobial resistance, developmental toxicity, and endocrine disruption [3–8]. The actual non-regulation demands the urgency of having reliable tools that will allow the real time monitoring of these emergent compounds [9–11].
The aim of the present work was explore the potential of electronic tongue concept [12,13] using thin-films sensors based on polyethyleneimine (PEI) and poly(sodium 4-styrenesulfonate) (PSS)—to detect TCS spiked aqueous solutions: deionized water (DW), Luso® Portuguese mineral water (LW) and an effluent from a wastewater treatment plant (EF), with different concentrations (10−15 M to 10−5 M). The PEI/PSS thin-films with 5 bilayers [PEI/PSS]5, with 10−2 M monomeric concentrations, were prepared by the layer-by-layer (LbL) technique onto solid supports with deposited gold electrodes sensors as described in [14]. The detection of TCS was achieved by measuring the

Proceedings 2019, 15, 24 2 of 5
impedance spectra of thin-films when immersed in the TCS aqueous solutions. The impedance spectra were measured, using a Solartron 1260 Impedance Analyzer, in the frequency range of 1 Hz to 1 MHz applying an AC voltage of 25 mV.
2. Results
The impedance spectra of [PEI/PSS]5 LbL films adsorbed on glass supports with interdigitated electrodes when immersed in TCS solutions prepared with different waters were measured. For comparison, the impedance spectra of glass support with interdigitated electrodes were also measured in the same conditions. Some examples of the obtained results are presented here. Figure 1a1,c1 show the resistance spectra of [PEI/PSS]5 LbL film immersed in TCS solutions prepared with DW and EF, respectively. While Figure 1b1 shows the loss tangent spectra of interdigitated electrodes without LbL films immersed in TCS solutions prepared with LW. The dependence of electrical resistance and loss tangent as a function of the frequency for the [PEI/PSS]5 combination was the better for DW and EF, contrary to LW where the best solution was the use of interdigitated electrodes without deposited thin-films. It seems that for more complex media, as LW or EF, the sensor is capable of discriminating TCS concentrations at high frequencies (LW [38,000 to 100,000 Hz]; EF [1000 to 10,000 Hz]), contrarily to DW [100 to 250 Hz]. From the measured spectra data, resistance and/or loss tangent at fixed frequencies were prepared. Figure 1a2,b2,c2 shows the resistance at 250 Hz, loss tangent at ~64 kHz and resistance at ~4 kHz plotted as a function of TCS concentration of the solutions prepared with DW, LW and EF, respectively. In the case of Figure 1a2, there is no clear tendency behavior, only a slight increment on the resistance between 10−15 M to 10−13 M, but still poor sensibility for the target molecule. Moreover, to LW the loss tangent tends to decrease with the increase of the TCS concentration, opposite to EF that increase the resistance with the increase of the TCS concentrations.
The adsorption of TCS onto polyelectrolytes thin-films, is affected by the pH of TCS solution [15]. The pH affected both the degree of ionization of the last polyelectrolyte in the LbL thin-film and the dissociation of TCS [16]. DW, LW and EF pH: 8.00, 5.80, 8.26. The acidic pH in in the LW, contributed to the slight desorption of the film. The desorption results, not shown here, were obtained measuring the ultraviolet-visible spectra of the films before and after immersion in the TCS solutions in an UV-VIS 2101 PC Scanning spectrophotometer. Hence, as previous observed, the best sensor to this water was gold interdigitated electrodes without deposited thin-films. Also, in more complex media, as EF matrix, [higher conductivity] the high amount of molecules promotes a higher fixed of the thin-films into the solid supports, having therefore less propensity to desorption or adsorption phenomena.

Proceedings 2019, 15, 24 3 of 5
Figure 1. (a1) Resistance spectra of [PEI/PSS]5 LbL film immersed in TCS solutions prepared with DW and (a2) Resistance at 250 Hz vs. TCS solutions prepared with DW; (b1) loss tangent spectra of interdigitated electrodes without LbL films immersed in TCS solutions prepared with LW and (b2) Loss tangent at 64 kHz vs. TCS solutions prepared with LW; (c1) Resistance spectra of [PEI/PSS]5
LbL film immersed in TCS solutions prepared with EF and (c2) Resistance at 4000 Hz vs. TCS solutions prepared with EF.
3. Conclusions
The detection of TCS through impedance spectroscopy yielded acceptable results for [PEI/PSS]5 in EF and interdigitated sensor with films in LW. To EF there was not observed desorption of the molecules of the films neither adsorption of TCS, confirming the sensor capability to detected TCS target molecule.
Author Contributions: Conceptualization, C.C.M.; methodology, C.C.M.; software, C.C.M., P.M.Z. and J.P.-d.-S.; validation, C.C.M., P.M.Z. and J.P.-d.-S.; formal analysis, C.C.M.; investigation, C.C.M.; resources, A.B.R. and M.F.R.; data curation, C.C.M., P.M.Z. and J.P.-d.-S.; writing—original draft preparation, C.C.M.;

Proceedings 2019, 15, 24 4 of 5
writing—review and editing, C.C.M.; visualization, C.C.M.; supervision, E.P.M., A.B.R. and M.F.R.; project administration, A.B.R. and M.F.R.; funding acquisition, E.P.M., A.B.R., P.A.R. and M.F.R.
Funding: This research was funded by Fundação para a Ciência e Tecnologia through projects UID/AMB/ 04085/2013, UID/FIS/00068/2013, PTDC/FIS-NAN/0909/2014 and FCT-CNRST Transnational Cooperation (FCT-UNL, Portugal and Meknes University, Morocco).
Acknowledgments: C Magro acknowledges Fundação para a Ciência e a Tecnologia for her PhD fellowship SFRH/BD/114674/2016. J Pereira-da-Silva and PM Zagalo acknowledge their fellowships PD/BD/142768/2018, PD/BD/142767/2018 from RABBIT Doctoral Programme, respectively.
Conflicts of Interest: The authors declare no conflict of interest. The funders had no role in the design of the study; in the collection, analyses, or interpretation of data; in the writing of the manuscript, or in the decision to publish the results.
References
1. Daughton, C.G.; Ternes, T.A. Pharmaceuticals and personal care products in the environment: Agents of subtle change? Environ. Health Perspect. 1999, 107, 907–938.
2. Chalew, E.A.; Halden, R.U. Environmental exposure of aquatic and terrestrial biota to triclosan and triclocarban. J. Am. Water Resour. Assoc. 2009, 45, 4–13.
3. Fang, J.; Stingley, R.L.; Beland, F.A.; Harrouk, W.; Lumpkins, D.L.; Howard, P. Occurrence, Efficacy, Metabolism, and Toxicity of Triclosan. J. Environ. Sci. Health Part C 2010, 28, 147–171.
4. Sabaliunas, D.; Webb, S.F.; Hauk, A.; Jacob, M.; Eckhoff, W.S. Environmental fate of Triclosan in the River Aire Basin, UK. Water Res. 2003, 37, 3145–3154.
5. Skarha, J.; Mínguez-alarcón, L.; Williams, P.L.; Korevaar, T.I.M.; de Poortere, R.A.; Broeren, M.A.C.; Ford, J.B.; Eliot, M.; Hauser, R.; Braun, J.M. Cross-sectional associations between urinary triclosan and serum thyroid function biomarker concentrations in women. Environ. Int. 2019, 122, 256–262.
6. Ma, X.; Wan, Y.; Wu, M.; Xu, Y.; Xu, Q.; He, Z.; Xia, W. Occurrence of benzophenones, parabens and triclosan in the Yangtze River of China , and the implications for human exposure. Chemosphere 2018, 213, 517–525.
7. Juric, A.; Singh, K.; Hu, X.F.; Chan, H.M. Exposure to triclosan among the Canadian population: Results of the Canadian Health Measures Survey (2009–2013). Environ. Int. 2019, 123, 29–38.
8. Lehutso, R.F.; Daso, A.P.; Okonkwo, J.O. Occurrence and environmental levels of triclosan and triclocarban in selected wastewater treatment plants in Gauteng Province, South Africa. Emerg. Contam. 2017, 3, 107–114.
9. Wu, T.; Li, T.; Liu, Z.; Guo, Y.; Dong, C. Talanta Electrochemical sensor for sensitive detection of triclosan based on graphene / palladium nanoparticles hybrids. Talanta 2017, 164, 556–562.
10. Liu, Y.; Song, Q.J.; Wang, L. Development and characterization of an amperometric sensor for triclosan detection based on electropolymerized molecularly imprinted polymer. Microchem. J. 2009, 91, 222–226.
11. Zheng, J.; Zhang, M.; Ling, Y.; Xu, J.; Hu, S.; Hayat, T.; Alharbi, N.S.; Yang, F. Fabrication of one dimensional CNTs/Fe3O4@PPy/Pd magnetic composites for the accumulation and electrochemical detection of triclosan. J. Electroanal. Chem. 2018, 818, 97–105.
12. Magro, C.; Mateus, E.; Raposo, M.; Ribeiro, A.B. Overview of electronic tongue sensing in environmental aqueous matrices: Potential for monitoring emerging organic contaminants. Environ. Rev. 2018, 27, 202–214.
13. Marques, I.; Magalhâes-Mota, G.; Pires, F.; Sério, S.; Ribeiro, P.A.; Raposo, M. Detection of traces of triclosan in water. Appl. Surf. Sci. 2017, 421, 142–147.
14. Abegão, L.; Ribeiro, J.; Ribeiro, P.; Raposo, M. Nano-Molar Deltamethrin Sensor Based on Electrical Impedance of PAH/PAZO Layer-by-Layer Sensing Films. Sensors 2013, 13, 10167–10176.

Proceedings 2019, 15, 24 5 of 5
15. da Silva, J.P.; Zagalo, P.M.; Magalhões-Mota, G.; Ribeiro, P.A.; Raposo, M. Adsorption of Triclosan on sensors based on PAH/PAZO thin-films: the effect of pH. In Proceedings of 15th International Conference on Computational Intelligence methods for Bioinformatics and Biostatistics, Caparica, Portugal, 6–8 September 2018; pp. 1–48.
16. Ferreira, Q.; Gomes, P.J.; Ribeiro, P.A.; Jones, N.C.; Hoffmann, S.V.; Mason, N.J.; Oliveira, O.N., Jr.; Raposo, M. Determination of Degree of Ionization of Poly(allylamine hydrochloride) (PAH) and Poly[1-[4-(3-carboxy-4 hydroxyphenylazo)benzene sulfonamido]-1,2-ethanediyl, sodium salt] (PAZO) in Layer-by-Layer Films using Vacuum Photoabsorption Spectroscopy. Langmuir 2013, 29, 448–455.
© 2019 by the authors. Licensee MDPI, Basel, Switzerland. This article is an open access article distributed under the terms and conditions of the Creative Commons Attribution (CC BY) license (http://creativecommons.org/licenses/by/4.0/).

166

167
Conference Contribution
“Triclosan detection in aqueous environmental matrices by thin-films sensors”
C Magro, PM Zagalo, J Pereira-da-Silva, EP Mateus, AB Ribeiro, PA Ribeiro & M Raposo
Oral presented in: 7th International Symposium on Sensor Science, Naples, Italy, May 9-11, 2019

168

Proceedings 2019, 3, x; doi: FOR PEER REVIEW www.mdpi.com/journal/proceedings
Triclosan Detection in Aqueous Environmental Matrices by Thin-Films Sensors †
Cátia Costa Magro 1,*, Paulo Morgado Zagalo 2, João Pereira-da-Silva 2, Eduardo Pires Mateus 1,
Alexandra Branco Ribeiro 1; Paulo AntónioRibeiro 2 and Maria Fátima Raposo 2
1 CENSE, Departamento de Ciências e Engenharia do Ambiente, Faculdade de Ciências e Tecnologia,
Universidade Nova de Lisboa, Caparica 2829-516, Portugal; [email protected] (E.P.M.); [email protected] (A.B.R.) 2 CEFITEC, Departamento de Física, Faculdade de Ciências e Tecnologia, Universidade Nova de Lisboa,
Caparica 2829-516, Portugal; [email protected] (P.M.Z.); [email protected] (J.P.-d.-S.);
[email protected] (P.A.R.); [email protected] (M.F.R.)
* Correspondence: [email protected]
† Presented at the 7th International Symposium on Sensor Science, Napoli, Italy, 9–11 May 2019.
Abstract: The widespread use of pharmaceuticals and personal care products (PPCPs) over the
years has resulted in the contamination of aquatic environments. Triclosan (TCS) is a bacteriostatic
used in household items, such as toothpaste or soaps. TCS has raised health concerns that include
antimicrobial resistance and endocrine disruption both to humans and biota. The actual non-
regulation demands the urgency of having reliable tools that can allow the real time monitoring of
these emergent compounds.
The aim of the present work was to explore the potential of using thin-films sensors based on
poly(allylamine hydrochloride (PAH), graphene oxide (GO), polyethyleneimine (PEI) and
polysodium 4-styrenesulfonate (PSS) - to detect different TCS concentrations (10-15M to 10-5M).
Deionized water, Luso® a Portuguese mineral water and an effluent from a wastewater treatment
plant, were used to prepare the TCS solutions which were characterized by impedance spectroscopy
(1Hz to 1MHz, electrical resistance, electrical capacitance and loss tangent as the transducing
variables at fixed frequencies, AC voltage of 25 mV) using a Solartron 1260 Impedance Analyzer.
The obtained data was analyzed by Principal Component Analysis. The results demonstrated
discrimination of TCS concentrations in effluent wastewater for combination of [PEI/PSS]5 or
[PEI/PSS]20. Additionally, in order to understand the thin-film behavior (desorption and/or
adsorption) in the different waters and, consequently, different pHs (3, 6 and ≈ 8), the thin films
were characterized with a UV-VIS 2101 PC Scanning spectrophotometer. These stability studies
verified that thin-films molecules do not desorb or adsorb in the TCS solutions at pH ≈ 8
Keywords: triclosan monitoring; thin-films interdigitated sensors; impedance spectroscopy

170

171
Conference Contribution
“Electrodialytic technology as effluent treatment for reuse in construction materials”
C Magro, LM Ottosen, EP Mateus & AB Ribeiro
Oral presented in: 5th International Conference on Sustainable Solid Waste Management,
Athens, Greece, June 21–24, 2017

172

ATHENS 2017
Electrodialytic technology as effluent treatment for reuse in construction materials
Cátia Magro1, Lisbeth Ottosen2, Eduardo P. Mateus1, Alexandra B. Ribeiro1*
1CENSE, Departamento de Ciências e Engenharia do Ambiente, Faculdade de Ciências e Tecnologia,
Universidade Nova de Lisboa, Caparica 2829-516, Portugal 2Department of Civil Engineering, Technical University of Denmark, Lyngby, Denmark
Keywords: effluent, electrodialytic process, construction materials *presenting author email: [email protected]
Nowadays, keeping water resources clean and safe is one of the biggest challenges in water management
systems. Water crisis is increasing due to the population growth, improvement of lifestyle, climate changes
and also because of the lack of appropriate water resource management. Therefore, it is crucial to reduce
tap water consumption in all activity sectors, including the high volume in building industry. In this industry
potable water is usually used since it is recommended by most specifications and its chemical composition
is known and well regulated. However, in order to create a balance between the resource and the demand,
other alternatives are needed to re-cycle non-fresh water and promote the “zero-waste circular economy”.
Effluents from wastewater treatment plants have a potential to replace water in construction sector
due to their characteristics. On the other hand, effluents may contain a complex mixture of anthropogenic
and natural compounds that are not removed by conventional treatments and, consequently, different types
of impurities are present, making difficult to draw a sound conclusion concerning their utilization in
concrete mixtures.
To handle with these barriers, a clean water technology before the reuse is required. Electrodialytic
(ED) process is a remediation technique applied to contaminated matrices. The main principle is that when
a low level direct current is applied between a pair of electrodes, the generated electric field induces
transport processes and physicochemical changes in the applied matrix. These changes lead to species
transport by coupled mechanisms, acting as the “cleaning agent”, by which the contaminants move out of
the matrix towards one of the electrode compartments. The ED process has proved to be efficient for the
removal of organic or/and inorganic contaminants, such as heavy metals and salts.
In this work the viability to use ED treated effluent in construction materials (e.g. mortars) as an
alternative to tap water was assessed, thus promoting water management.
The ED process was optimized to remove or immobilize the heavy metals and salts from effluents
collected from different wastewater treatment plants. Effluents were characterized before and after the ED
process. The treated effluent was then used in the production of mortars. Characterization of cement was
performed by X-ray diffraction, SEM-EDX and laser diffraction to understand the influence in the
replacement of tap water by ED treated effluent. Materials tests were conducted (e.g. permeability,
workability, compressive strength) as well as environmental safety tests (e.g. concentration levels and
leaching of heavy metals and salts).
Acknowledgments
Financial support was provided by projects PTDC/FIS-NAN/0909/2014 - Development of Nanostrutures
for Detection of Triclosan Traces on Aquatic Environments, UID/AMB/04085/2013 and by ERASMUS+
programme.

174

175
Conference Contribution
“Development of target methods for triclosan monitorization in effluents at trace levels using gas chromatography-triple quadrupole mass spectrometry and electronic tongues”
C Magro, D Mendes, F Freitas, MG Silva, AB Ribeiro & EP Mateus
Poster presented in: 11th Encontro Nacional de Cromatografia, Costa de Caparica, Portugal,
December 9–11, 2019

176


178

179
Conference Contribution
“Innovating from Science: 2Resource – Recovering water, creating Resources to build”
C Magro, EP Mateus & AB Ribeiro
Poster presented in: HiTech Clossing Session, July 3, 2018

180

Roadmap & Financial Projection
Our team*
Senior Researcher
PhD student
Management student
Associate Professor
Eureka Moment Market
Entry
Sales MEA and Asia
Scale-up III 30 m3
Final productConsortium with
early adopter
Prototype5 m3
Improvements & operational problems
Scale-up II15 m3
Marketing and Stakeholders’
Communication
Technical feasibility
assessment
Final optimization & validation
IP Negotiations & registration
Cost-efficiency analysis
Market needs
“Reuse of wastewater in construction materials and agriculture, will have strict regulations - starting on 2020. We will see a war of water solution technologies, because a pre-treatment will be required before reuse.”
Workshop in Reuse of wastewater in Portugal (May 2018)
“In areas where we don’t know the water sources and its characteristics, the material’s quality is compromised. Meaning losing money, time and resources”
Pedro Pinto Lopes, Grupo Casais (April 2018)
The Problem
Main benefits
Fulfilling the regulatory standards
Fine- tune treated wastewater e.g. manipulation of pH
of the global population will be living in cities
Business model
x 2Resource reactorx Membranesx Consulting & maintenance
x Construction industryx Manufacturingx Water distributors
Reactor’s delivery & assembling : Outsourcing
Transforms treated wastewater in reusable water for high quality concrete
Remove salts, heavy metals, organic contaminants & micro-organisms
Solution
Competitors
x 2050 scenario in from
x Increasing use of concrete concurrent with and industrialization, finding demand exceeding
x Water use for the concrete industry is 9% of all industry withdrawals and
x Concrete production is responsible for consuming
x Concrete production needs regulated water that fulfils industry standards – to achieve high quality materials – if polluted water is used –
structural failures will happen
Avoid problems of contaminating concrete
º Lower capital expenditureº Lower operational costsº No need of chemicalsº By-products reuse
Fresh & untreated water
º High capital expenditureº Lower operational costsº Avoid structural failureº Manipulation of the water
characteristics
Water solution technologies
-5
0
5
10
15
20
25
30
35
2019 2020 2021 2022 2023 2024 2025 2026
Mill
ion
s €
Revenue
Net Profit
Cummulative cash flow
Market Entry

182

183
Conference Contribution
“Prospective energy savings in electro-based technologies – PEM fuel”
C Magro, J Almeida, JM Paz-Garcia, EP Mateus & AB Ribeiro
Poster presented in: 6th International Conference on Sustainable Solid Waste Management, Naxos, Greece, June 13-16, 2018

184

PROSPECTIVE ENERGY SAVINGS IN ELECTRO-BASED TECHNOLOGIES – PEM FUEL CELL
C. Magro1*, J. Almeida1, JM. Paz-Garcia2, EP. Mateus1 & AB. Ribeiro1
1CENSE, Departamento de Ciências e Engenharia do Ambiente, Faculdade de Ciências e Tecnologia, Universidade NOVA de Lisboa2Department of Chemical Engineering, Faculty of Sciences, University of Malaga
Electrodialytic technology (ED-T) is a clean-up process with feasible applications in environmental aqueous matrices. This process is based on the application of an electric currentdensity of mA/cm2 to the cross-sectional area of a matrix between pairs of electrodes. Water oxidation and reduction reactions are dominant, involving the generation of hydrogen gas:
Thus, collecting the hydrogen (H2) produced, there is a potential to increase ED-T cost-effectiveness, either using a proton exchange membrane fuel cell (PEM-FC), that converts thechemical energy into power needs or by selling H2 for other applications.
Project “Development of Nanostructures for Detection of Triclosan Traces on Aquatic Environments” (PTDC/FIS-NAN/0909/2014). CENSE-which is financed by national funds from FCT/MEC (UID/AMB/04085/2013). C. Magro and J. Almeida acknowledges Fundação para a Ciência e a Tecnologia for their PhD fellowships: SFRH/BD/114674/2016 & PD\BD\135170\2017.
CONCLUSIONS ACKNOWLEDGMENTS
This study suggests new possibilities for energy savings in ED-T and H2 production for different purposes.
RESULTS & DISCUSSION
METHODOLOGY
INTRODUCTION
H2 production in an ED-T laboratory scale – Figure 1
3 compartments cell → L= 15 cm & Ø = 8 cm
Electrodes MMO/Ti (from Permaskand) → L= 5 cm & Ø = 0.3 cm
CEM Cation exchange membrane & AEM Anion exchange membrane (from Ionics)
Electrolyte → 250 mL NaNO3 10-2 M
Parameters monitoredVoltage, pH, conductivity, H2 volume (mL), % of H2 purity by Gas Chromatography Thermal Conductivity Detector (GC-TCD)
Conditions tested
DC current → 100 or 50 mA & Duration → 1 and 2 h
H2 energy conversion
Mini PEM Fuel cell (from Fuelcell store) → (w × h × d ) 32 mm×32 mm×10 mm *max power output → appx. 0.6 V
Matrices tested
SW Salty Water → 250 mL tap water + 0.2 g NaCl
EF Secondary Effluent ( (from a WWTP, 760,000 equivalent inhabitants, Lisbon, PT) → 250 mL
⁃ GC-TCD: H2 produced by ED-T ≈ 95% purity⁃ ED-T final parameters: SW 50 mA (pH 6.5, 1.4 mS/cm) & 100 mA (pH 3.2, 0.9 mS/cm); EF 50 mA (pH
6.4, 1.2 mS/cm) & 100 mA (pH 3.3, 1.3 mS/cm)⁃ Time to reach 30 mL of H2 (full volume capacity): SW 50 mA - 70 min; SW 100 mA - 30 min; EF 50 mA
n- 50 min; EF 100 mA - 30 min⁃ ED-T: The flow rate production for H2 is directly related to current intensity and matrix (Figure 2A)⁃ A strong relation between voltage and H2 volume is supported by data shown in Figure 2B (R2 ≥ 0.93)⁃ The voltage in conventional ED-T systems (Control: O2 and H2 are released to the atmosphere,
recirculation/agitation), shows a different behavior comparing to the ED-T-PEM-FC systems (H2 gas iscollected-isolated reactor). The voltage increased in the Control while in ED-T-PEM-FC systems a droppedvoltage was observed (Figure 2C). The second behavior may happen due to the activated polarization:‣ Overpotential → more pressure → increased particle's collisions → increasing the velocity of the H2
reaction generation⁃ 100 mA of current intensity means more energy consumption and costs in both matrices (Figure 3)
PEM-FC – Energy potential generation⁃ To decrease the energy consumption of the ED-T 100 mA and take advantage of the H2 produced during
the treatment, a PEM-FC was connected to the ED-T gas collector for H2 power conversion⁃ Considering PEM-FC maximum output voltage (appx. 0.6 V): 1) SW produced 0.1 V in 100 min (until the
average voltage in 3h of ED-T); 2) EF produced 0.8 V in 50 min (until the average voltage in 3h of ED-T)⁃ Comparing SW with EF, the latest showed 3.5% more efficiency in the potential measured, meaning higher
savings/year in a full scale reactor (Figure 4) - more ions in the effluent matrix (data supported by IonChromatography). Also, the voltage was more stable during the complete ED-T process
⁃ The efficiency of the PEM-FC is directly proportional to the PEM area (10 cm2). Extrapolating PEM areato 300 cm2, PEM-FC would cover the total power needs of a complete ED-T treatment (≤ 3h)
Figure 2. (A) H2 volume variation, (B) Relation between H2
volume production and voltage & (C) Normalized voltage
Measurement volume limit
C. Magro J. Almeida
Figure 1. Graphical ideation scheme
Environmental aqueous matrices
Electrodialytic process
PEM Fuel Cell
+
Power
CEM AEM
Figure 4. ED-T energy savings with PEM-FC
Savings/year in a 400 m3
capacity ED-T reactor
1% SW4.5% EF
€ 2,000 SW€ 9,000 EF
R² = 0.97
R² = 0.93
R² = 0.96
R² = 0.94
0
5
10
15
20
25
30
35
0 5 10 15 20 25 30 35
H2
Vo
lum
e (m
L)
Voltage (V)
SW 100 mA SW 50 mA EF 100 mA EF 50 mA
(B)
0,0
0,3
0,6
0,9
1,2
1,5
0 20 40 60 80
No
rmal
ized
Vo
ltag
e (V
)
Time (min)
SW 100 mA SW 50 mA EF 100 mA EF 50 mA SW 100 mA - CONTROL
Voltage Drop- 47%28%34%29%30%
Control 100 mA
(C)
(A)
y = 1,03x
y = 0,47x
y = 1,13x
y = 0,65x
0
5
10
15
20
25
30
35
0 20 40 60 80
H2
Vo
lum
e (m
L)
Time (min)
SW 100 mA SW 50 mA EF 100 mA EF 50 mA
€ 2.12
€ 1.01
€ 2.02
€ 1.09
SW/m3 EF/m3
100 mA50 mA
100 mA50 mA
Figure 3. ED-T energy consumption

186

187
Conference Contribution
“Optimization of an analytical method for the determination of underivatized triclosan and related compounds by gas chromatography-triple quadrupole mass spectrometry”
C Magro, D Mendes, M Silva AB Ribeiro & EP Mateus
Poster presented in: 10th Encontro Nacional de Cromatografia, Bragança, Portugal,
December 4–6, 2017

188


190

191
Conference Contribution
“Assessment of emergent contaminants removal from wastewater by electrokinetics”
C Magro, EP Mateus & AB Ribeiro
Poster presented in: 15th International Symposium on Electrokinetic Remediation, Montreal, Canada, August 6- 8, 2017

192


194