transcriptome profiling of the theca interna in transition from small to large antral ovarian...
TRANSCRIPT

Transcriptome Profiling of the Theca Interna inTransition from Small to Large Antral Ovarian FolliclesNicholas Hatzirodos, Katja Hummitzsch, Helen F. Irving-Rodgers¤, Raymond J. Rodgers*
Research Centre for Reproductive Health, Discipline of Obstetrics and Gynaecology, School of Paediatrics and Reproductive Health, Robinson Research Institute, University
of Adelaide, Adelaide, Australia
Abstract
The theca interna layer of the ovarian follicle forms during the antral stage of follicle development and lies adjacent to anddirectly outside the follicular basal lamina. It supplies androgens and communicates with the granulosa cells and the oocyteby extracellular signaling. To better understand developmental changes in the theca interna, we undertook transcriptomeprofiling of the theca interna from small (3–5 mm, n = 10) and large (9–12 mm, n = 5) healthy antral bovine follicles,representing a calculated .7-fold increase in the amount of thecal tissue. Principal Component Analysis and hierarchicalclassification of the signal intensity plots for the arrays showed no clustering of the theca interna samples into groupsdepending on follicle size or subcategories of small follicles. From the over 23,000 probe sets analysed, only 76 weredifferentially expressed between large and small healthy follicles. Some of the differentially expressed genes wereassociated with processes such as myoblast differentiation, protein ubiquitination, nitric oxide and transforming growthfactor b signaling. The most significant pathway affected from our analyses was found to be Wnt signaling, which wassuppressed in large follicles via down-regulation of WNT2B and up-regulation of the inhibitor FRZB. These changes in thetranscriptional profile could have been due to changes in cellular function or alternatively since the theca interna iscomposed of a number of different cell types it could have been due to any systematic change in the volume density of anyparticular cell type. However, our study suggests that the transcriptional profile of the theca interna is relatively stableduring antral follicle development unlike that of granulosa cells observed previously. Thus both the cellular compositionand cellular behavior of the theca interna and its contribution to follicular development appear to be relatively constantthroughout the follicle growth phase examined.
Citation: Hatzirodos N, Hummitzsch K, Irving-Rodgers HF, Rodgers RJ (2014) Transcriptome Profiling of the Theca Interna in Transition from Small to Large AntralOvarian Follicles. PLoS ONE 9(5): e97489. doi:10.1371/journal.pone.0097489
Editor: Wei Yan, University of Nevada School of Medicine, United States of America
Received January 15, 2014; Accepted April 17, 2014; Published May 15, 2014
Copyright: � 2014 Hatzirodos et al. This is an open-access article distributed under the terms of the Creative Commons Attribution License, which permitsunrestricted use, distribution, and reproduction in any medium, provided the original author and source are credited.
Funding: This work was supported by the National Health and Medical Research Council of Australia, the Australian Research Council and the University ofAdelaide. The funders had no role in study design, data collection and analysis, decision to publish, or preparation of the manuscript.
Competing Interests: T&R Pastoral donated the ovaries. There are no patents, products in development or marketed products to declare. This does not alterthe authors’ adherence to all the PLOS ONE policies on sharing data and materials.
* E-mail: [email protected]
¤ Current address: School of Medical Science, Griffith University, Gold Coast, Queensland, Australia
Introduction
The mammalian ovary produces oocytes for fertilization and
the hormones estradiol and progesterone. Oocytes mature in
ovarian follicles surrounded by pregranulosa cells at the primordial
follicle stage and by granulosa cells which start replicating at the
primary follicle stage. Both cell types are surrounded and
separated from the ovarian stroma by the follicular basal lamina.
At about the time when a fluid-filled antrum forms in the middle of
the follicle, a specialized thecal layer differentiates within the
stroma adjacent to the follicular basal lamina. The major functions
of the thecal layer are to produce androgens, which are used by
granulosa cells for estradiol synthesis, and to supply nutrients and
structural support for the growing follicle. This layer can be
divided into the theca interna, which contains the fibroblasts,
endothelial cells, immune cells and androgen-producing cells, and
the theca externa, which contains fibroblast-like cells and larger
vasculature elements.
The early stages of thecal cell recruitment from ovarian stromal
cells and differentiation into functional thecal cells are considered
to be controlled by paracrine factors secreted by granulosa cells
and oocytes (reviewed in [1,2]). After the primary follicle stage, it
has been suggested that stem cells located in the stroma [3–5] are
induced to proliferate by stem cell factor [6] and insulin-like
growth factor-1 (IGF-1) [7], which are both secreted by the
granulosa cells, and oocyte-secreted factors such as growth
differentiation factor 9 [3,8–10]. The steroidogenic cells of the
theca interna express luteinizing hormone receptor (LHCGR) and
the enzymes necessary for the production of androgens including:
cholesterol side-chain cleavage enzyme (CYP11A1), 3b-hydroxy-
steroid dehydrogenase (HSD3B) and 17a-hydroxylase (CYP17A1)
[11]. They also express insulin-like factor 3 (INSL3) [12]. The
proliferation, differentiation and steroidogenesis of the steroido-
genic cells in the theca interna is mainly under the external control
of luteinizing hormone (LH) which is secreted by the anterior
pituitary [13,14]. Recently it has been shown in thecal cell
cultures, that INSL3 might play a role in maintaining androgen
synthesis, while bone-morphogenetic proteins (BMPs) can act as
suppressors of androgen production by inhibiting INSL3 action
[15]. Activin can also suppress androgen synthesis [16] and
inhibins can antagonize BMP [15] and activin actions [16]. The
steroidogenic cells continue to produce androgen continuously
PLOS ONE | www.plosone.org 1 May 2014 | Volume 9 | Issue 5 | e97489

until ovulation providing sufficient precursors for the increasing
production of estradiol by the granulosa cells.
The development of a healthy follicle with the opportunity to
ovulate depends on a sufficient supply of hormones, e.g.
gonadotropins and growth factors, and oxygen and metabolites
via the blood stream. Early follicle stages depend upon the
vascular system of the ovarian stroma for their supply, whereas
antral follicles have an autonomous capillary network provided by
the theca interna and externa [17,18]. The establishment of the
thecal vascular network is induced and regulated by granulosa cell-
secreted factors such as vascular endothelial growth factor
(VEGF), basic fibroblast growth factor (FGF2), epidermal growth
factor, IGF-1 and transforming growth factor b (TGFb) (reviewed
in [18]). The mRNA for VEGF and its receptor, FGF2 receptor
and IGF-1 receptor have been shown to be expressed in the bovine
theca interna and increase with further development of the antral
follicle [19,20]. Furthermore, receptors for angiotensin II, a
vasoconstrictor, are expressed in the theca interna and even
stronger in the theca externa of the bovine ovary [21,22].
In small antral follicles (,5 mm), two types of follicles have been
classified based upon the appearance of the follicular basal lamina
in electron microscopic studies, in particular, follicles with an
aligned or a loopy basal lamina [23]. Interestingly, antral follicles
larger than 5 mm show only the aligned basal lamina type. The
morphology of the follicular basal lamina at this stage has been
linked to oocyte competence [24]. Additionally the shape of the
basally-situated granulosa cells is related to the basal lamina
phenotype with rounded cells present in follicles with an aligned
basal lamina and columnar cells in follicles with a loopy basal
lamina [23].
Microarray analysis of bovine preovulatory follicles before and
after LH surge showed that only 2% of the 11,000 genes expressed
in preovulatory follicles were differentially expressed in cells of the
theca interna after the LH surge [25]. Genes involved in
steroidogenesis (CYP17A1, CYP11A1, HSD3B1, STAR), gonadotro-
pin receptors (LHCGR) and cell proliferation/cycle (CCND2,
PCNA) were down regulated, whereas pentraxin 3 (PTX3) and
TIMP metallopeptidase inhibitor 1 (TIMP1) were up regulated
after LH surge [25]. Furthermore, these cells appeared to be less
affected by the LH surge than the corresponding granulosa cells
[25].
Table 1. Primer sequences used for qRT-PCR.
Gene NameGeneSymbol
GenBankAccession No. Forward Primer (59- 39) Reverse Primer (59- 39)
ProductSize (bp)
Glyceraldehyde 3-phosphatedehydrogenase
GAPDH XR_027767 ACCACTTTGGCATCGTGGAG GGGCCATCCACAGTCTTCTG 76
Peptidylprolyl isomeraseA (cyclophilin A)
PPIA NM_178320.2 CTGGCATCTTGTCCATGGCAAA CCACAGTCAGCAATGGTGATCTTC 202
Frizzled-related protein FRZB NM_174059 GTGAGCCCGTTCGCATTC GGTTGGGCATCTTAGTCATGTTC 63
Insulin growth factorbinding protein 3
IGFBP3 NM_174556 CGCCTGCGCCCTTACC TTCTTCCGACTCACTGCCATT 57
Retinoic acid receptorresponder (tazaroteneinduced) 1
RARRES1 NM_001075430 AAGCCCCTTGAATGCAGTCA TGGGTCTCAGAGATGGAGCAA 65
Claudin 11 CLDN11 NM_001035055 TGGGTCTGCCGGCTATTCT GGCCCATTCGGATGCA 57
Aldehyde oxidase 1 AOX1 NM_176668 CTGGGAGAGTCTGGGATATTCCT CGTGCTGCCCTTATTGCAT 71
Latent TGFb bindingprotein 1
LTBP1 NM_001103091 GATTTGGGCCAGATCCTACCT CGGTAACACGGCCCTTTCT 79
Wingless-type MMTVintegration site family,member 2B
WNT2B NM_001099363 CGGACTGACCTGGTCTACTTTG AGGGAACCTGCAGCCTTGT 67
Cyclin E2 CCNE2 NM_001015665 CCTCATTATTCATTGCTTCCAAAC TTCACTGCAAGCACCATCAG 89
Centromere proteinF, 350/400 kDa (mitosin)
CENPF XM_002694283 CGACATCCCAACCGGAAAG TTGGAGGTCTCGGTGAGATTTT 141
doi:10.1371/journal.pone.0097489.t001
Figure 1. Unsupervised PCA of arrays for thecal cells fromsmall and large healthy follicles. The graph is a scatter plot of thevalues for the first (X) and second (Y) principal components based onthe correlation matrix of the total normalized array intensity data.Abbreviations are thecal small healthy rounded (TSHR), thecal smallhealthy columnar (TSHC) and thecal large healthy (TLH).doi:10.1371/journal.pone.0097489.g001
Transcriptome of Theca during Growth of Follicles
PLOS ONE | www.plosone.org 2 May 2014 | Volume 9 | Issue 5 | e97489

To further investigate the changes which occur in the theca
interna during antral follicle development but prior to the effect of
LH, we collected cells from the theca interna from small healthy
follicles of both follicular basal lamina types (3–5 mm) and large
(9–12 mm) healthy bovine follicles and identified differentially
expressed genes by microarray analyses.
Materials and Methods
Bovine ovarian follicle selectionPairs of ovaries were collected from non-pregnant cycling Bos
taurus heifers at an abattoir (T&R Pastoral, Murray Bridge, SA,
Australia). Follicles in two size ranges of external diameter (3–
5 mm and 9–12 mm) as measured by callipers corresponding
approximately to the stages of pre- and post-deviation were
dissected for classification and analysis. Granulosa cells were
scraped from each follicle with a Pasteur pipette tip, previously
blunted by heating with a Bunsen burner, and the granulosa cells
were removed. The theca interna was then dissected from the
follicle wall under a Zeiss Stemi D4 stereomicroscope (Zeiss Pty
Ltd., North Ryde, NSW, Australia) in ice-cold Hank’s balanced-
salt solution with Mg2+ and Ca2+ (Sigma-Aldrich, Castle Hill,
NSW, Australia) and stored at 280uC prior to RNA extraction.
An excised portion of the follicle wall (26262 mm) was taken
prior to granulosa and thecal cell removal and fixed in 2.5%
glutaraldehyde in 0.1 M phosphate buffer for histological assess-
ment. Follicles were classified as healthy or atretic based upon the
morphology of the membrana granulosa and the presence or
absence of apoptotic cells, as previously described [23,26]. Healthy
follicles were chosen for further analysis and the small follicles were
classified into rounded or columnar as determined by the shape of
the granulosa cells forming the layer closest to the follicular basal
lamina [23].
RNA preparation and microarray analysesRNA was extracted from thecal cells by the Trizol method (Life
Technologies, Mt Waverley, VIC, Australia). Briefly, each thecal
sample was homogenized in 1 ml of Trizol with 1.4 mm ceramic
beads in a Precellys 24 Bead Mill Homogenizer (Omni Interna-
tional, Kennesaw, Georgia, USA) with two 10 s cycles of
6,000 rpm each. The samples were then extracted with 200 ml
of chloroform and the aqueous phase was purified through a
Qiagen RNEasy mini prep column (Qiagen, Hilden, Germany)
according to the manufacturer’s instructions. Five mg of RNA was
treated to remove genomic DNA contamination with 2 units of
DNAse 1 (Ambion/Life Technologies) prior to labeling for
microarray analysis. All RNA samples were found to have a
RNA integrity number $8 when assessed by microfluidic analysis
on a 2000 BioAnalyzer (Agilent, Santa Clara, CA, USA).
DNAse-treated RNA (100 ng) was labeled using the 39IVT
Express labeling kit (Affymetrix, Santa Clara, CA, USA). In brief,
the RNA was reverse transcribed using a T7 oligo dT primer
followed by second strand synthesis. In vitro transcription reactions
were performed in batches to generate biotinylated cRNA targets,
which were subsequently chemically fragmented at 95uC for
35 min. Ten mg of the fragmented, biotinylated cRNA was
hybridized at 45uC for 16 h to Affymetrix GeneChip Bovine
Genome Arrays, which contain 24,027 probe sets representing
over 23,000 transcripts and variants, including 19,000 UniGene
clusters. The arrays were then washed and stained with
streptavidin-phycoerythrin (final concentration 10 mg/ml). Signal
amplification was achieved by using a biotinylated anti-streptavi-
din antibody. The array was then scanned according to the
manufacturer’s instructions (Affymetrix GeneChip Expression
Analysis Technical Manual). The arrays were inspected for defects
or artefacts. The array data was converted to CEL file format for
analysis.
Microarray data analysisThe quality control for the cDNA labeling was determined by
the use of internal array controls. The array data were subjected
to Robust Multi-Array Average summarization [27] and quantile
normalization [28] which was considered to be statistically
appropriate treatment for normally distributed data for arrays
of this size (greater than 20,000 probe sets). Probe sets were
filtered such that only those with a log2 signal intensity of .3.0
for $50% of the arrays of one follicle type were considered to be
above the detection threshold. The fold change determination
and statistical analysis of the data were performed as detailed
previously in [29]. The microarray CEL files, normalized data
and experimental information have been deposited in the Gene
Expression Omnibus [30], and are available by the accession
number GSE49505.
Function, pathway, network and upstream regulator analysis
were conducted in IPA and GOEAST similarly as described in
previous studies [29,31].
Measurement of gene expression by quantitative RT-PCRTotal RNA (200 ng) from the theca interna of small and large
healthy follicles (n = 7 and n = 4) was extracted and used to
synthesize cDNA similarly as detailed previously [32]. Real time
RT-PCR assays were designed against nine genes using web based
software and quantitative RT-PCR was performed as further
described in [32]. The sequence information of the primers used
for quantitative RT-PCR is shown in Table 1.
Table 2. Number of probe sets and genes differentially expressed in large healthy follicles with respect to small follicles.
Fold-Change Probe Sets Genes
Up-regulated Down-regulated Total Up-regulated Down-regulated Total
.2 71 7 76 53 4 57
.3 19 1 20 13 1 14
.4 5 0 5 3 0 3
Statistical difference with P,0.05 was determined by ANOVA using the step up Benjamini-Hochberg False Discovery Rate method for multiple corrections in PartekGenomics Suite Software.doi:10.1371/journal.pone.0097489.t002
Transcriptome of Theca during Growth of Follicles
PLOS ONE | www.plosone.org 3 May 2014 | Volume 9 | Issue 5 | e97489

Results and Discussion
Statistical analyses of differentially expressed genesTheca interna from two groups of healthy follicles, small (n = 10)
and large (n = 5), were histologically classified as described in the
methods and examined by microarray analysis of gene expression.
The small healthy follicles were sub-classified into two groups
possessing either columnar (n = 5) or rounded (n = 5) basally-
situated granulosa cells. The original analysis across the three
groups by one-way ANOVA did not indicate any gene differences
with a minimum two-fold change and False Discovery Rate (FDR)
of P,0.05 between the two healthy sub-groups, therefore these
were treated as a single group for further analyses.
Principal Component Analysis (PCA) mapped the overall
differences in gene expression between the individual arrays as
shown in Fig. 1. There was some degree of relatedness based on
follicle size detected by this analysis and by hierarchical clustering
(Fig. S1), however, the overall differences were not as distinct when
compared with granulosa cells in a similar study in our laboratory
[31]. This suggests that the theca has a relatively stable
transcriptional profile during antral follicle development up to
the period where follicle growth becomes largely under the control
of LH. One thecal sample, TLH4, was found to have relatively
high expression levels of granulosa- specific genes such as
CYP19A1, FSHR, INHBA and FST, and was therefore considered
to be contaminated by granulosa cells and excluded from further
analyses.
A total of 76 probe sets (out of 15,530 detected), representing 57
genes (Table S1), 53 of which were up regulated and 4 down
regulated (Table 2), were determined to be differentially expressed
between the large and small healthy theca layers ($2 fold change,
FDR P,0.05) by ANOVA analysis in Partek. This data set was
considerably smaller than the statistically equivalent group
generated for granulosa cells for the comparison of large versus
small healthy follicles where more than 10% of the probe sets
(n = 2714) were differentially regulated [31]. This further supports
the assumption that the theca interna is quite stable and does not
substantially alter overall gene expression with increasing follicle
size to this stage of maturation. The most highly up regulated gene
was found to be CLDN11 (8 fold), a known tight junction marker of
the blood-brain and blood-testis barriers [33,34]. The n = 76 data
set was uploaded for pathway and network analysis into Ingenuity
Pathway Analysis (IPA) and into Gene Ontology Enrichment
Analysis Toolkit (GOEAST) software [35].
Figure 2. Measurement of gene expression by qRT-PCR. The data are shown as the mean 6 SEM (n = 7 for small follicle group, n = 4 for largefollicle group). qRT-PCR values were determined from the mean of the ratio of 22DCt of the target genes to cyclophilin A (PPIA) and glyceraldehydephosphate dehydrogenase (GAPDH), and the microarray values are signal intensities (normalized but not log transformed). Significantly differentresults for qRT-PCR were determined by Student’s t-test. The P values for the microarray results are corrected for multiple testing using the FDR (*P,0.05, **P,0.01 and ***P,0.001).doi:10.1371/journal.pone.0097489.g002
Transcriptome of Theca during Growth of Follicles
PLOS ONE | www.plosone.org 4 May 2014 | Volume 9 | Issue 5 | e97489
Functional and pathway analyses of differentiallyexpressed genes
The expression levels of nine genes selected to include up- and
down regulated genes and genes with no change between small
and large follicles were determined by qRT-PCR and the results
are presented in Fig. 2. The fold-change data from the arrays and
the qRT-PCR experiments (Fig. 2) were highly correlated with
each other (Pearson’s correlation, R2 = 0.95, P,0.001; Fig. S2),
indicating that the arrays were correctly identifying differentially
expressed genes. Genes which were differentially regulated
between large and small follicle theca interna and eligible for
network analyses in IPA are listed in Table 3, which consisted of
47 in total, including 45 up and 2 down regulated.
Analysis in IPA and GOEAST to determine canonical pathway
and gene ontology (GO) term association showed that some
molecules which were differentially regulated between large and
small follicles map to the Wnt signaling pathway (Figs 3A and B,
respectively). This involved the inhibition of WNT2B, which
encodes a ligand which can activate the canonical pathway, and
activation of FRZB, encoding a secreted frizzled receptor which
modulates the effect of Wnt ligands by direct interaction and up-
regulation of cadherin 3. There were also associations with
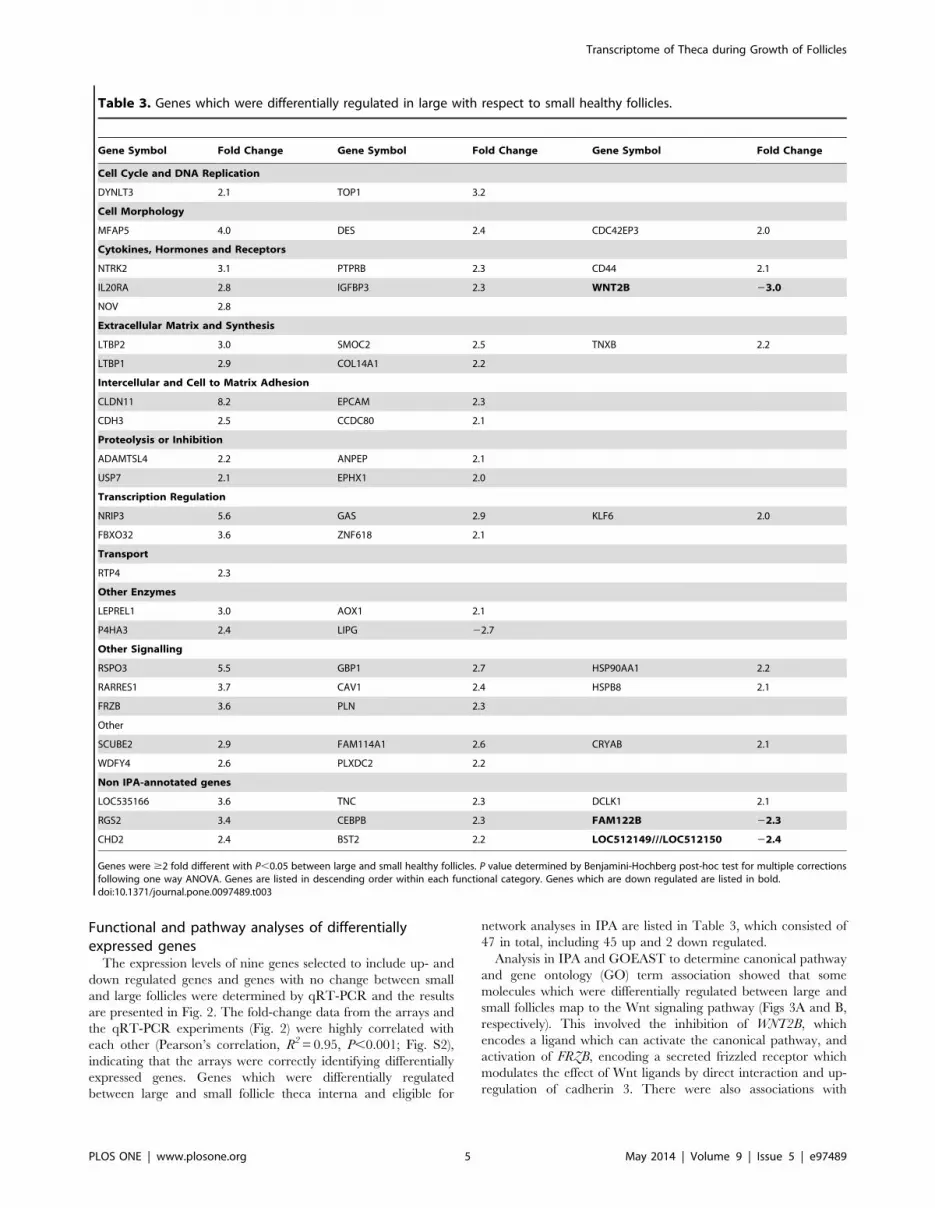
Table 3. Genes which were differentially regulated in large with respect to small healthy follicles.
Gene Symbol Fold Change Gene Symbol Fold Change Gene Symbol Fold Change
Cell Cycle and DNA Replication
DYNLT3 2.1 TOP1 3.2
Cell Morphology
MFAP5 4.0 DES 2.4 CDC42EP3 2.0
Cytokines, Hormones and Receptors
NTRK2 3.1 PTPRB 2.3 CD44 2.1
IL20RA 2.8 IGFBP3 2.3 WNT2B 23.0
NOV 2.8
Extracellular Matrix and Synthesis
LTBP2 3.0 SMOC2 2.5 TNXB 2.2
LTBP1 2.9 COL14A1 2.2
Intercellular and Cell to Matrix Adhesion
CLDN11 8.2 EPCAM 2.3
CDH3 2.5 CCDC80 2.1
Proteolysis or Inhibition
ADAMTSL4 2.2 ANPEP 2.1
USP7 2.1 EPHX1 2.0
Transcription Regulation
NRIP3 5.6 GAS 2.9 KLF6 2.0
FBXO32 3.6 ZNF618 2.1
Transport
RTP4 2.3
Other Enzymes
LEPREL1 3.0 AOX1 2.1
P4HA3 2.4 LIPG 22.7
Other Signalling
RSPO3 5.5 GBP1 2.7 HSP90AA1 2.2
RARRES1 3.7 CAV1 2.4 HSPB8 2.1
FRZB 3.6 PLN 2.3
Other
SCUBE2 2.9 FAM114A1 2.6 CRYAB 2.1
WDFY4 2.6 PLXDC2 2.2
Non IPA-annotated genes
LOC535166 3.6 TNC 2.3 DCLK1 2.1
RGS2 3.4 CEBPB 2.3 FAM122B 22.3
CHD2 2.4 BST2 2.2 LOC512149///LOC512150 22.4
Genes were $2 fold different with P,0.05 between large and small healthy follicles. P value determined by Benjamini-Hochberg post-hoc test for multiple correctionsfollowing one way ANOVA. Genes are listed in descending order within each functional category. Genes which are down regulated are listed in bold.doi:10.1371/journal.pone.0097489.t003
Transcriptome of Theca during Growth of Follicles
PLOS ONE | www.plosone.org 5 May 2014 | Volume 9 | Issue 5 | e97489
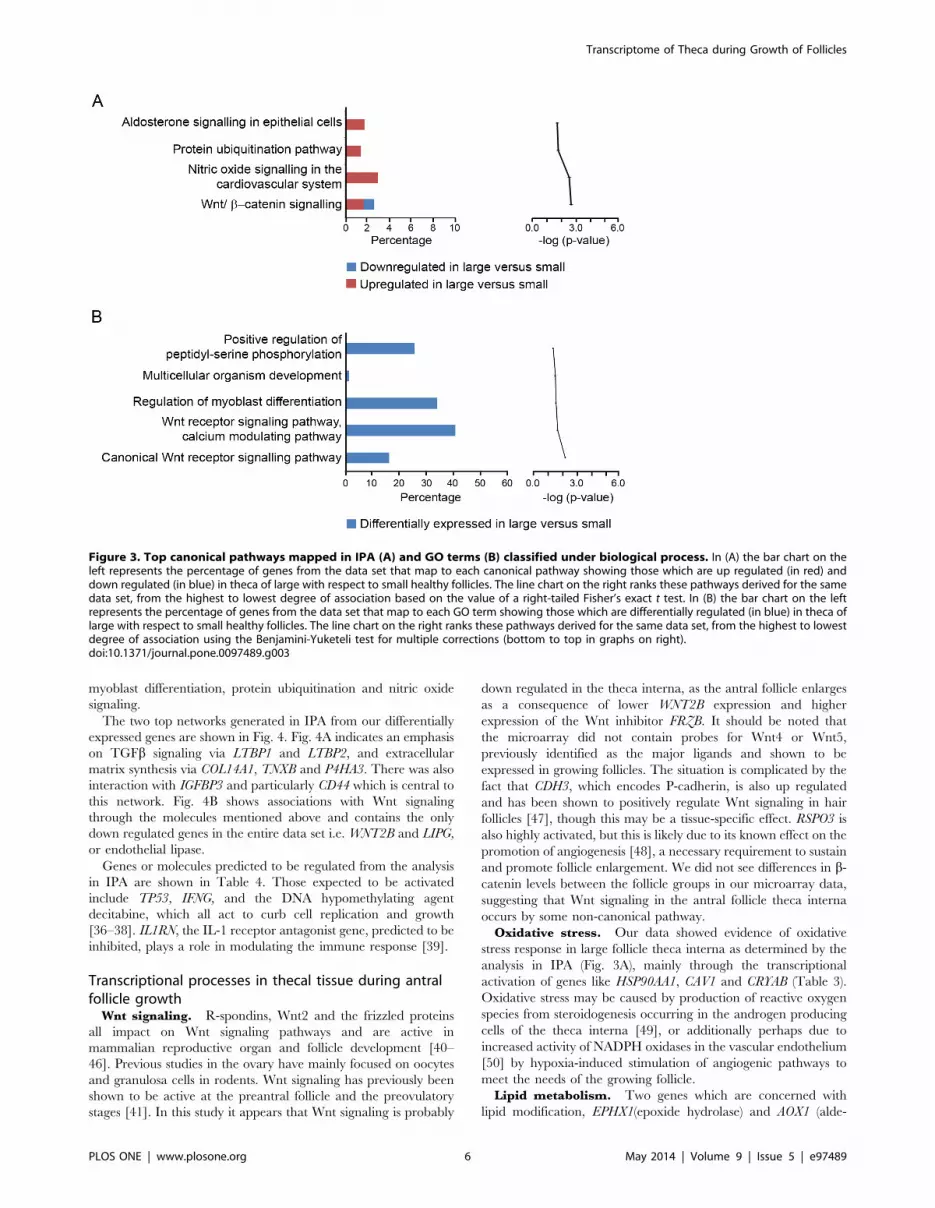
myoblast differentiation, protein ubiquitination and nitric oxide
signaling.
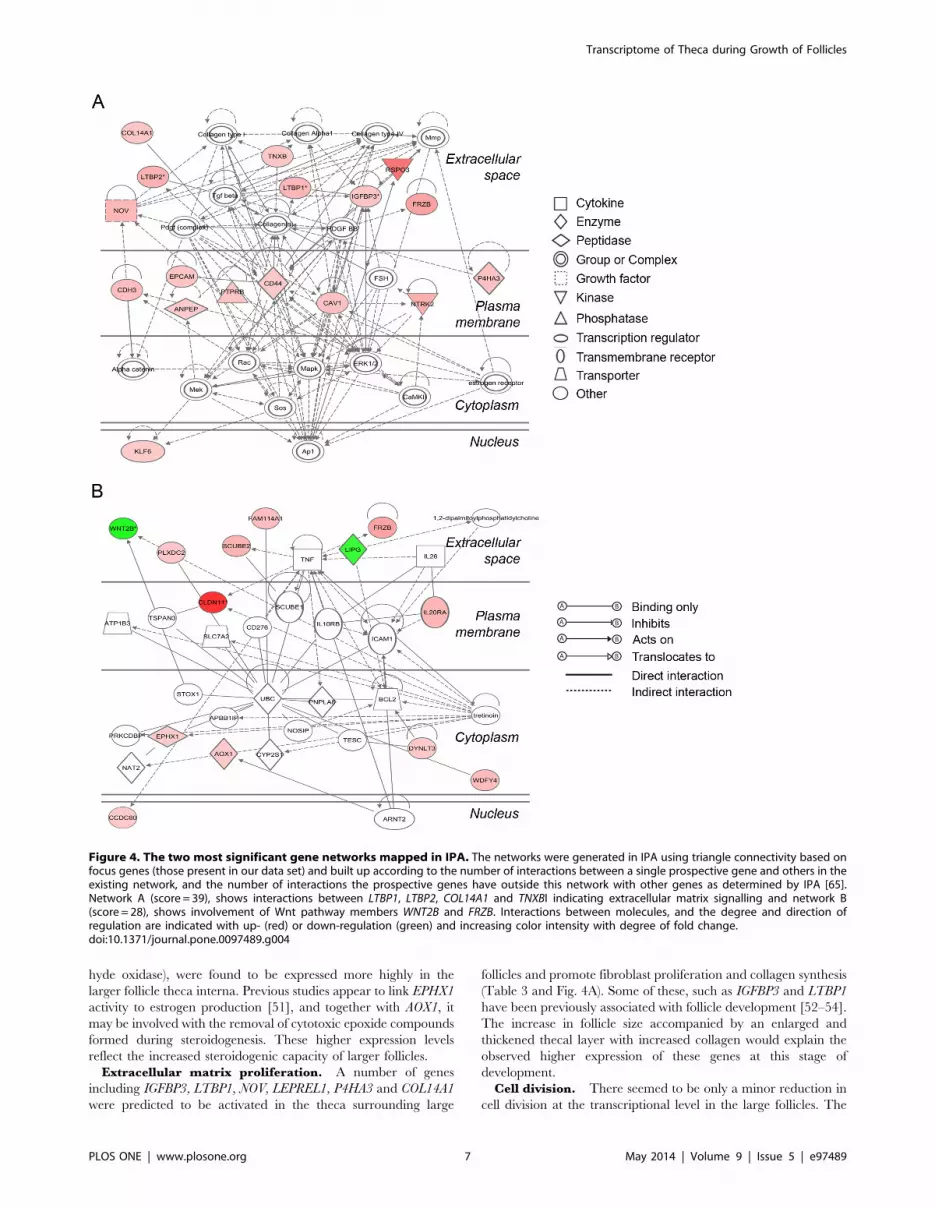
The two top networks generated in IPA from our differentially
expressed genes are shown in Fig. 4. Fig. 4A indicates an emphasis
on TGFb signaling via LTBP1 and LTBP2, and extracellular
matrix synthesis via COL14A1, TNXB and P4HA3. There was also
interaction with IGFBP3 and particularly CD44 which is central to
this network. Fig. 4B shows associations with Wnt signaling
through the molecules mentioned above and contains the only
down regulated genes in the entire data set i.e. WNT2B and LIPG,
or endothelial lipase.
Genes or molecules predicted to be regulated from the analysis
in IPA are shown in Table 4. Those expected to be activated
include TP53, IFNG, and the DNA hypomethylating agent
decitabine, which all act to curb cell replication and growth
[36–38]. IL1RN, the IL-1 receptor antagonist gene, predicted to be
inhibited, plays a role in modulating the immune response [39].
Transcriptional processes in thecal tissue during antralfollicle growth
Wnt signaling. R-spondins, Wnt2 and the frizzled proteins
all impact on Wnt signaling pathways and are active in
mammalian reproductive organ and follicle development [40–
46]. Previous studies in the ovary have mainly focused on oocytes
and granulosa cells in rodents. Wnt signaling has previously been
shown to be active at the preantral follicle and the preovulatory
stages [41]. In this study it appears that Wnt signaling is probably
down regulated in the theca interna, as the antral follicle enlarges
as a consequence of lower WNT2B expression and higher
expression of the Wnt inhibitor FRZB. It should be noted that
the microarray did not contain probes for Wnt4 or Wnt5,
previously identified as the major ligands and shown to be
expressed in growing follicles. The situation is complicated by the
fact that CDH3, which encodes P-cadherin, is also up regulated
and has been shown to positively regulate Wnt signaling in hair
follicles [47], though this may be a tissue-specific effect. RSPO3 is
also highly activated, but this is likely due to its known effect on the
promotion of angiogenesis [48], a necessary requirement to sustain
and promote follicle enlargement. We did not see differences in b-
catenin levels between the follicle groups in our microarray data,
suggesting that Wnt signaling in the antral follicle theca interna
occurs by some non-canonical pathway.
Oxidative stress. Our data showed evidence of oxidative
stress response in large follicle theca interna as determined by the
analysis in IPA (Fig. 3A), mainly through the transcriptional
activation of genes like HSP90AA1, CAV1 and CRYAB (Table 3).
Oxidative stress may be caused by production of reactive oxygen
species from steroidogenesis occurring in the androgen producing
cells of the theca interna [49], or additionally perhaps due to
increased activity of NADPH oxidases in the vascular endothelium
[50] by hypoxia-induced stimulation of angiogenic pathways to
meet the needs of the growing follicle.
Lipid metabolism. Two genes which are concerned with
lipid modification, EPHX1(epoxide hydrolase) and AOX1 (alde-
Figure 3. Top canonical pathways mapped in IPA (A) and GO terms (B) classified under biological process. In (A) the bar chart on theleft represents the percentage of genes from the data set that map to each canonical pathway showing those which are up regulated (in red) anddown regulated (in blue) in theca of large with respect to small healthy follicles. The line chart on the right ranks these pathways derived for the samedata set, from the highest to lowest degree of association based on the value of a right-tailed Fisher’s exact t test. In (B) the bar chart on the leftrepresents the percentage of genes from the data set that map to each GO term showing those which are differentially regulated (in blue) in theca oflarge with respect to small healthy follicles. The line chart on the right ranks these pathways derived for the same data set, from the highest to lowestdegree of association using the Benjamini-Yuketeli test for multiple corrections (bottom to top in graphs on right).doi:10.1371/journal.pone.0097489.g003
Transcriptome of Theca during Growth of Follicles
PLOS ONE | www.plosone.org 6 May 2014 | Volume 9 | Issue 5 | e97489
hyde oxidase), were found to be expressed more highly in the
larger follicle theca interna. Previous studies appear to link EPHX1
activity to estrogen production [51], and together with AOX1, it
may be involved with the removal of cytotoxic epoxide compounds
formed during steroidogenesis. These higher expression levels
reflect the increased steroidogenic capacity of larger follicles.
Extracellular matrix proliferation. A number of genes
including IGFBP3, LTBP1, NOV, LEPREL1, P4HA3 and COL14A1
were predicted to be activated in the theca surrounding large
follicles and promote fibroblast proliferation and collagen synthesis
(Table 3 and Fig. 4A). Some of these, such as IGFBP3 and LTBP1
have been previously associated with follicle development [52–54].
The increase in follicle size accompanied by an enlarged and
thickened thecal layer with increased collagen would explain the
observed higher expression of these genes at this stage of
development.
Cell division. There seemed to be only a minor reduction in
cell division at the transcriptional level in the large follicles. The
Figure 4. The two most significant gene networks mapped in IPA. The networks were generated in IPA using triangle connectivity based onfocus genes (those present in our data set) and built up according to the number of interactions between a single prospective gene and others in theexisting network, and the number of interactions the prospective genes have outside this network with other genes as determined by IPA [65].Network A (score = 39), shows interactions between LTBP1, LTBP2, COL14A1 and TNXBI indicating extracellular matrix signalling and network B(score = 28), shows involvement of Wnt pathway members WNT2B and FRZB. Interactions between molecules, and the degree and direction ofregulation are indicated with up- (red) or down-regulation (green) and increasing color intensity with degree of fold change.doi:10.1371/journal.pone.0097489.g004
Transcriptome of Theca during Growth of Follicles
PLOS ONE | www.plosone.org 7 May 2014 | Volume 9 | Issue 5 | e97489

expression of two cell cycle genes CENPF (mitosin) and cyclin E2
was additionally examined by qRT-PCR (Fig. 2), and the results
also confirmed only a slight reduction in expression of these cell
cycle genes.CLDN11. (Claudin-11), a tight junction protein, has been
shown to be present in locations where strict homeostasis control
and protection from xenobiotics is important, such as the blood-
testis [34] and the blood-cerebrospinal fluid [55] barriers. There is
some evidence of the influence of androgens on increased
expression of claudin-11 in the Sertoli cells of the testis [56,57].
It is possible that the gene for this protein becomes more highly
expressed in response to increased production of steroids at the
later antral stage of follicle development, but the functional role for
an increase in expression in the theca is unknown.RARRES1. (Retinoic Acid Receptor Responder 1) has
been identified as a tumor-suppressor gene with probable
carboxypeptidase inhibitor function [58] and it may play a role
in repression of stem cell phenotype [59]. There has been only one
report of expression of this gene in non-pathological ovarian
function, specifically in cumulus cells [60], although we identified
RARRES1 to be down regulated by tumor necrosis factor -a in
cultured granulosa cells [61]. This gene also appears to be
hormonally regulated in endometrial tissue studies [62,63], and
Nguyen et al. [63] demonstrated a link between endometrium
development and Wnt signaling. The significance of RARRES1
expression in the theca interna may be due to a similar
developmental function, whereby cell replication is controlled
and differentiation of cells into a more mature phenotype is
promoted.
Conclusions
In this study we compared the theca interna from small and
large follicles that represents a calculated .7 fold increase in the
amount of thecal tissue. Observed changes in the transcriptional
profile could have been due to changes in cellular function or
alternatively since the theca interna is composed of a number of
different cell types it could have been due to any systematic change
in the volume density of any particular cell type. However, our
study suggests that the transcriptional profile of the theca interna is
relatively stable during antral follicle development, unlike that of
granulosa cells observed previously [64]. Thus both the cellular
composition and cellular behavior of the theca interna and its
contribution to follicular development appear to be relatively
constant throughout the follicle growth phase examined.
Supporting Information
Figure S1 Unsupervised hierarchical clustering acrossall probe sets (n = 24,182) for 15 arrays. The analysis was
performed using the Euclidian dissimilarity algorithm with the
average linkage method in Partek Genomics Suite. The heatmap
represents the distribution of normalized signal intensity, grouping
by pattern similarity for both probe set and array. Abbreviations
for identification of array samples are identical to Fig. 1.
(TIF)
Figure S2 Scatter plot of fold changes in microarrayintensity versus fold-changes in expression determinedby qRT-PCR. Values represent nine selected genes as presented
in Fig. 2. The two sets of data were highly correlated with each
other (Pearson’s correlation, R2 = 0.95, P,0.001).
(TIF)
Table S1 Probe sets which are up regulated in large with respect
to small healthy follicles. Analysis by ANOVA in Partek, with $2
fold-change and P,0.05 (n = 76), in alphabetical order. Probe sets
which do not have gene assignations are placed at the end of the
list. The P value for multiple corrections was determined by the
step up FDR method.
(PDF)
Acknowledgments
We thank T&R Pastoral for donation of ovaries and Wendy Bonner for
technical assistance.
Author Contributions
Conceived and designed the experiments: HFI-R RJR. Performed the
experiments: NH KH HFI-R. Analyzed the data: NH KH RJR.
Contributed reagents/materials/analysis tools: NH KH RJR. Wrote the
paper: NH KH HFI-R RJR. Read and approved the final manuscript: NH
KH RJR.
References
1. Young JM, McNeilly AS (2010) Theca: the forgotten cell of the ovarian follicle.
Reproduction 140: 489–504.
2. Tajima K, Orisaka M, Mori T, Kotsuji F (2007) Ovarian theca cells in follicular
function. Reprod Biomed Online 15: 591–609.
Table 4. A list of 4 upstream regulators predicted to be activated or inhibited in IPA.
UpstreamRegulator Molecule Type
PredictedActivation State {
Bias-Correctedz-score {{
P Value ofOverlap** Target Molecules in Data Set
decitabine chemical drug Activated 2.587 3.08E-04 CAV1, CD44, CDH3, HSPB8, IGFBP3, RARRES1, RTP4
TP53 transcriptionregulator
Activated 2.001 7.99E-04 CAV1, CCDC80, CD44, CDC42EP3, CDH3, COL14A1,CRYAB, EPHX1, GBP1, HSP90AA1, IGFBP3, LTBP1
IFNG cytokine Activated 2.135 3.69E-02 CD44, GBP1, HSP90AA1, KLF6, PTPRB, RARRES1, RTP49
IL1RN cytokine Inhibited 22.000 4.49E-04 GBP1, KLF6, RARRES1, RTP4
{The predicted activation state is inferred from the bias-corrected z-score.{{The bias-corrected z-score is computed based on the proportion of target genes present in the data set which are directionally regulated as expected according toknown effects of the regulator on the target compiled from the literature.**The P value of overlap measures the statistical significance of overlap using Fisher’s exact t-test, between genes from the data set and those known to be acted uponby an upstream regulator.doi:10.1371/journal.pone.0097489.t004
Transcriptome of Theca during Growth of Follicles
PLOS ONE | www.plosone.org 8 May 2014 | Volume 9 | Issue 5 | e97489

3. Orisaka M, Tajima K, Mizutani T, Miyamoto K, Tsang BK, et al. (2006)
Granulosa cells promote differentiation of cortical stromal cells into theca cells in
the bovine ovary. Biol Reprod 75: 734–740.
4. Honda A, Hirose M, Hara K, Matoba S, Inoue K, et al. (2007) Isolation,
characterization, and in vitro and in vivo differentiation of putative thecal stem
cells. Proc Natl Acad Sci U S A 104: 12389–12394.
5. Hatzirodos N, Nigro J, Irving-Rodgers HF, Vashi AV, Hummitzsch K, et al.
(2012) Glycomic analyses of ovarian follicles during development and atresia.
Matrix Biol 31: 45–56.
6. Parrott JA, Skinner MK (2000) Kit ligand actions on ovarian stromal cells:
effects on theca cell recruitment and steroid production. Mol Reprod Dev 55:
55–64.
7. Huang CT, Weitsman SR, Dykes BN, Magoffin DA (2001) Stem cell factor and
insulin-like growth factor-I stimulate luteinizing hormone-independent differen-
tiation of rat ovarian theca cells. Biol Reprod 64: 451–456.
8. Elvin JA, Yan C, Wang P, Nishimori K, Matzuk MM (1999) Molecular
characterization of the follicle defects in the growth differentiation factor 9-
deficient ovary. Mol Endocrinol 13: 1018–1034.
9. Solovyeva EV, Hayashi M, Margi K, Barkats C, Klein C, et al. (2000) Growth
differentiation factor-9 stimulates rat theca-interstitial cell androgen biosynthesis.
Biol Reprod 63: 1214–1218.
10. Wu X, Chen L, Brown CA, Yan C, Matzuk MM (2004) Interrelationship of
growth differentiation factor 9 and inhibin in early folliculogenesis and ovarian
tumorigenesis in mice. Mol Endocrinol 18: 1509–1519.
11. Logan KA, Juengel JL, McNatty KP (2002) Onset of steroidogenic enzyme gene
expression during ovarian follicular development in sheep. Biol Reprod 66: 906–
916.
12. Irving-Rodgers HF, Bathgate RA, Ivell R, Domagalski R, Rodgers RJ (2002)
Dynamic changes in the expression of relaxin-like factor (INSL3), cholesterol
side-chain cleavage cytochrome p450, and 3beta-hydroxysteroid dehydrogenase
in bovine ovarian follicles during growth and atresia. Biol Reprod 66: 934–943.
13. Baird DT, Swanston IA, McNeilly AS (1981) Relationship between LH, FSH,
and prolactin concentration and the secretion of androgens and estrogens by the
preovulatory follicle in the ewe. Biol Reprod 24: 1013–1025.
14. Palermo R (2007) Differential actions of FSH and LH during folliculogenesis.
Reprod Biomed Online 15: 326–337.
15. Glister C, Satchell L, Bathgate RA, Wade JD, Dai Y, et al. (2013) Functional
link between bone morphogenetic proteins and insulin-like peptide 3 signaling in
modulating ovarian androgen production. Proc Natl Acad Sci U S A 110:
E1426–1435.
16. Young JM, McNeilly AS (2012) Inhibin removes the inhibitory effects of activin
on steroid enzyme expression and androgen production by normal ovarian
thecal cells. J Mol Endocrinol 48: 49–60.
17. Martelli A, Bernabo N, Berardinelli P, Russo V, Rinaldi C, et al. (2009) Vascular
supply as a discriminating factor for pig preantral follicle selection. Reproduction
137: 45–58.
18. Stouffer RL, Martinez-Chequer JC, Molskness TA, Xu F, Hazzard TM (2001)
Regulation and action of angiogenic factors in the primate ovary. Arch Med Res
32: 567–575.
19. Berisha B, Schams D, Kosmann M, Amselgruber W, Einspanier R (2000)
Expression and localisation of vascular endothelial growth factor and basic
fibroblast growth factor during the final growth of bovine ovarian follicles.
J Endocrinol 167: 371–382.
20. Schams D, Berisha B, Kosmann M, Amselgruber WM (2002) Expression and
localization of IGF family members in bovine antral follicles during final growth
and in luteal tissue during different stages of estrous cycle and pregnancy.
Domest Anim Endocrinol 22: 51–72.
21. Brunswig-Spickenheier B, Mukhopadhyay AK (1992) Characterization of
angiotensin-II receptor subtype on bovine thecal cells and its regulation by
luteinizing hormone. Endocrinology 131: 1445–1452.
22. Schauser KH, Nielsen AH, Winther H, Dantzer V, Poulsen K (2001)
Localization of the renin-angiotensin system in the bovine ovary: cyclic variation
of the angiotensin II receptor expression. Biol Reprod 65: 1672–1680.
23. Irving-Rodgers HF, Rodgers RJ (2000) Ultrastructure of the basal lamina of
bovine ovarian follicles and its relationship to the membrana granulosa. J Reprod
Fertil 118: 221–228.
24. Irving-Rodgers HF, Morris S, Collett RA, Peura TT, Davy M, et al. (2009)
Phenotypes of the ovarian follicular basal lamina predict developmental
competence of oocytes. Hum Reprod 24: 936–944.
25. Christenson LK, Gunewardena S, Hong X, Spitschak M, Baufeld A, et al. (2013)
Research Resource: Preovulatory LH Surge Effects on Follicular Theca and
Granulosa Transcriptomes. Mol Endocrinol 27: 1153–1171.
26. Irving-Rodgers HF, Catanzariti KD, Master M, Grant PA, Owens PC, et al.
(2003) Insulin-like growth factor binding proteins in follicular fluid from
morphologically distinct healthy and atretic bovine antral follicles. Reprod Fertil
Dev 15: 241–248.
27. Irizarry RA, Hobbs B, Collin F, Beazer-Barclay YD, Antonellis KJ, et al. (2003)
Exploration, normalization, and summaries of high density oligonucleotide array
probe level data. Biostatistics 4: 249–264.
28. Bolstad BM, Irizarry RA, Astrand M, Speed TP (2003) A comparison of
normalization methods for high density oligonucleotide array data based on
variance and bias. Bioinformatics 19: 185–193.
29. Hatzirodos N, Hummitzsch K, Irving-Rodgers HF, Harland ML, Morris SE,
et al. (2014) Transcriptome profiling of granulosa cells from bovine ovarian
follicles during atresia. BMC Genomics 15: 40.
30. Barrett T, Troup DB, Wilhite SE, Ledoux P, Rudnev D, et al. (2009) NCBI
GEO: archive for high-throughput functional genomic data. Nucleic Acids Res
37: D885–890.
31. Hatzirodos N, Irving-Rodgers HF, Hummitzsch K, Harland ML, Morris SE,
et al. (2014) Transcriptome profiling of granulosa cells of bovine ovarian follicles
during growth from small to large antral sizes. BMC Genomics 15: 24.
32. Hatzirodos N, Irving-Rodgers HF, Hummitzsch K, Rodgers RJ (2014)
Transcriptome profiling of theca interna from bovine ovarian follicles during
atresia. PLoS ONE (Submitted).
33. Hellani A, Ji J, Mauduit C, Deschildre C, Tabone E, et al. (2000) Developmental
and hormonal regulation of the expression of oligodendrocyte-specific protein/
claudin 11 in mouse testis. Endocrinology 141: 3012–3019.
34. Mazaud-Guittot S, Gow A, Le Magueresse-Battistoni B (2011) Phenotyping the
claudin 11 deficiency in testis: from histology to immunohistochemistry.
Methods Mol Biol 763: 223–236.
35. Zheng Q, Wang XJ (2008) GOEAST: a web-based software toolkit for Gene
Ontology enrichment analysis. Nucleic Acids Res 36: W358–363.
36. Al-Salihi M, Yu M, Burnett DM, Alexander A, Samlowski WE, et al. (2011) The
depletion of DNA methyltransferase-1 and the epigenetic effects of 5-aza-
2’deoxycytidine (decitabine) are differentially regulated by cell cycle progression.
Epigenetics 6: 1021–1028.
37. Beckerman R, Prives C (2010) Transcriptional regulation by p53. Cold Spring
Harb Perspect Biol 2: a000935.
38. Oleszak E (1988) Inhibition of mitogenic activity of PDGF, EGF, and FGF by
interferon-gamma. Exp Cell Res 179: 575–580.
39. Conti P, Dempsey RA, Reale M, Barbacane RC, Panara MR, et al. (1991)
Activation of human natural killer cells by lipopolysaccharide and generation of
interleukin-1 alpha, beta, tumour necrosis factor and interleukin-6. Effect of IL-1
receptor antagonist. Immunology 73: 450–456.
40. Cheng Y, Kawamura K, Takae S, Deguchi M, Yang Q, et al. (2013) Oocyte-
derived R-spondin2 promotes ovarian follicle development. FASEB J 27: 2175–
2184.
41. Hsieh M, Johnson MA, Greenberg NM, Richards JS (2002) Regulated
expression of Wnts and Frizzleds at specific stages of follicular development in
the rodent ovary. Endocrinology 143: 898–908.
42. Kim KA, Wagle M, Tran K, Zhan X, Dixon MA, et al. (2008) R-Spondin
family members regulate the Wnt pathway by a common mechanism. Mol Biol
Cell 19: 2588–2596.
43. Wang HX, Li TY, Kidder GM (2010) WNT2 regulates DNA synthesis in mouse
granulosa cells through beta-catenin. Biol Reprod 82: 865–875.
44. Castanon BI, Stapp AD, Gifford CA, Spicer LJ, Hallford DM, et al. (2012)
Follicle-stimulating hormone regulation of estradiol production: possible
involvement of WNT2 and beta-catenin in bovine granulosa cells. J Anim Sci
90: 3789–3797.
45. Mehta V, Abler LL, Keil KP, Schmitz CT, Joshi PS, et al. (2011) Atlas of Wnt
and R-spondin gene expression in the developing male mouse lower urogenital
tract. Dev Dyn 240: 2548–2560.
46. Ricken A, Lochhead P, Kontogiannea M, Farookhi R (2002) Wnt signaling in
the ovary: identification and compartmentalized expression of wnt-2, wnt-2b,
and frizzled-4 mRNAs. Endocrinology 143: 2741–2749.
47. Samuelov L, Sprecher E, Tsuruta D, Biro T, Kloepper JE, et al. (2012) P-
cadherin regulates human hair growth and cycling via canonical Wnt signaling
and transforming growth factor-beta2. J Invest Dermatol 132: 2332–2341.
48. Kazanskaya O, Ohkawara B, Heroult M, Wu W, Maltry N, et al. (2008) The
Wnt signaling regulator R-spondin 3 promotes angioblast and vascular
development. Development 135: 3655–3664.
49. Hanukoglu I (2006) Antioxidant protective mechanisms against reactive oxygen
species (ROS) generated by mitochondrial P450 systems in steroidogenic cells.
Drug Metab Rev 38: 171–196.
50. Gorlach A, Diebold I, Schini-Kerth VB, Berchner-Pfannschmidt U, Roth U,
et al. (2001) Thrombin activates the hypoxia-inducible factor-1 signaling
pathway in vascular smooth muscle cells: Role of the p22(phox)-containing
NADPH oxidase. Circ Res 89: 47–54.
51. Newman JW, Stok JE, Vidal JD, Corbin CJ, Huang Q, et al. (2004) Cytochrome
p450-dependent lipid metabolism in preovulatory follicles. Endocrinology 145:
5097–5105.
52. Monget P, Monniaux D, Pisselet C, Durand P (1993) Changes in insulin-like
growth factor-I (IGF-I), IGF-II, and their binding proteins during growth and
atresia of ovine ovarian follicles. Endocrinology 132: 1438–1446.
53. Nicholas B, Scougall RK, Armstrong DG, Webb R (2002) Changes in insulin-
like growth factor binding protein (IGFBP) isoforms during bovine follicular
development. Reproduction 124: 439–446.
54. Prodoehl MJ, Irving-Rodgers HF, Bonner WM, Sullivan TM, Micke GC, et al.
(2009) Fibrillins and latent TGFbeta binding proteins in bovine ovaries of
offspring following high or low protein diets during pregnancy of dams. Mol Cell
Endocrinol 307: 133–141.
55. Kratzer I, Vasiljevic A, Rey C, Fevre-Montange M, Saunders N, et al. (2012)
Complexity and developmental changes in the expression pattern of claudins at
the blood-CSF barrier. Histochem Cell Biol 138: 861–879.
Transcriptome of Theca during Growth of Follicles
PLOS ONE | www.plosone.org 9 May 2014 | Volume 9 | Issue 5 | e97489

56. Kaitu’u-Lino TJ, Sluka P, Foo CF, Stanton PG (2007) Claudin-11 expression
and localisation is regulated by androgens in rat Sertoli cells in vitro.Reproduction 133: 1169–1179.
57. Tan KA, De Gendt K, Atanassova N, Walker M, Sharpe RM, et al. (2005) The
role of androgens in sertoli cell proliferation and functional maturation: studiesin mice with total or Sertoli cell-selective ablation of the androgen receptor.
Endocrinology 146: 2674–2683.58. Jing C, El-Ghany MA, Beesley C, Foster CS, Rudland PS, et al. (2002)
Tazarotene-induced gene 1 (TIG1) expression in prostate carcinomas and its
relationship to tumorigenicity. J Natl Cancer Inst 94: 482–490.59. Oldridge EE, Walker HF, Stower MJ, Simms MS, Mann VM, et al. (2013)
Retinoic acid represses invasion and stem cell phenotype by induction of themetastasis suppressors RARRES1 and LXN. Oncogenesis 2: e45.
60. Lee YS, VandeVoort CA, Gaughan JP, Midic U, Obradovic Z, et al. (2011)Extensive effects of in vitro oocyte maturation on rhesus monkey cumulus cell
transcriptome. Am J Physiol Endocrinol Metab 301: E196–209.
61. Glister C, Hatzirodos N, Hummitzsch K, Knight PG, Rodgers RJ (2014) The
global effect of follicle-stimulating hormone and tumour necrosis factor alpha on
gene expression in cultured bovine ovarian granulosa cells. BMC Genomics 15:
72.
62. Dassen H, Punyadeera C, Kamps R, Klomp J, Dunselman G, et al. (2007)
Progesterone regulation of implantation-related genes: new insights into the role
of oestrogen. Cell Mol Life Sci 64: 1009–1032.
63. Nguyen HP, Sprung CN, Gargett CE (2012) Differential expression of Wnt
signaling molecules between pre- and postmenopausal endometrial epithelial
cells suggests a population of putative epithelial stem/progenitor cells reside in
the basalis layer. Endocrinology 153: 2870–2883.
64. Hatzirodos N, Irving-Rodgers HF, Hummitzsch K, Harland ML, Morris SE,
et al. (2014) Transcriptome profiling of granulosa cells of bovine ovarian follicles
during growth from small to large antral sizes. BMC Genomics 15: 24.
65. (2005) IPA Network Generation Algorithm, White paper. Ingenuity Systems.
Transcriptome of Theca during Growth of Follicles
PLOS ONE | www.plosone.org 10 May 2014 | Volume 9 | Issue 5 | e97489
Gonadotropin secretion and pituitary responsiveness to GnRH in mares with granulosa-theca cell tumor
Exposure of adult rats to estradiol valerate induces ovarian cyst with early senescence of follicles