transcriptional (chip-chip) analysis of elf1, ets2, runx1 and stat5 in human abdominal aortic...
TRANSCRIPT

Int. J. Mol. Sci. 2015, 16, 11229-11258; doi:10.3390/ijms160511229
International Journal of
Molecular Sciences ISSN 1422-0067
www.mdpi.com/journal/ijms
Article
Transcriptional (ChIP-Chip) Analysis of ELF1, ETS2, RUNX1 and STAT5 in Human Abdominal Aortic Aneurysm
Matthew C. Pahl 1,†,‡, Robert Erdman 1,†, Helena Kuivaniemi 1,2, John H. Lillvis 3,
James R. Elmore 4 and Gerard Tromp 1,*
1 Sigfried and Janet Weis Center for Research, Geisinger Health System, Danville, PA 17822, USA;
E-Mails: [email protected] (M.C.P.); [email protected] (R.E.);
[email protected] (H.K.) 2 Department of Surgery, Temple University School of Medicine, Philadelphia, PA 19140, USA 3 Department of Ophthalmology, Wayne State University School of Medicine, Detroit, MI 48202,
USA; E-Mail: [email protected] 4 Department of Vascular and Endovascular Surgery, Geisinger Health System, Danville, PA 17822,
USA; E-Mail: [email protected]
† These authors contributed equally to this work.
‡ Current address: Department of Biology, University of Virginia, Charlottesville, VA 22904, USA.
* Author to whom correspondence should be addressed; E-Mail: [email protected];
Tel.: +1-570-271-5592; Fax: +1-570-214-3074.
Academic Editor: Jonathan Golledge
Received: 26 October 2014 / Accepted: 31 December 2014 / Published: 18 May 2015
Abstract: We investigated transcriptional control of gene expression in human abdominal
aortic aneurysm (AAA). We previously identified 3274 differentially expressed genes in
human AAA tissue compared to non-aneurysmal controls. Four expressed transcription
factors (ELF1, ETS2, STAT5 and RUNX1) were selected for genome-wide chromatin
immunoprecipitation. Transcription factor binding was enriched in 4760 distinct genes
(FDR < 0.05), of which 713 were differentially expressed in AAA. Functional classification
using Gene Ontology (GO), KEGG, and Network Analysis revealed enrichment in several
biological processes including “leukocyte migration” (FDR = 3.09 × 10−05) and “intracellular
protein kinase cascade” (FDR = 6.48 × 10−05). In the control aorta, the most significant GO
categories differed from those in the AAA samples and included “cytoskeleton organization”
(FDR = 1.24 × 10−06) and “small GTPase mediated signal transduction” (FDR = 1.24 × 10−06).
OPEN ACCESS

Int. J. Mol. Sci. 2015, 16 11230
Genes up-regulated in AAA tissue showed a highly significant enrichment for GO categories
“leukocyte migration” (FDR = 1.62 × 10⁻¹¹), “activation of immune response” (FDR =
8.44 × 10⁻¹¹), “T cell activation” (FDR = 4.14 × 10⁻¹⁰) and “regulation of lymphocyte
activation” (FDR = 2.45 × 10−09), whereas the down-regulated genes were enriched in GO
categories “cytoskeleton organization” (FDR = 7.84 × 10−05), “muscle cell development”
(FDR = 1.00 × 10−04), and “organ morphogenesis” (FDR = 3.00 × 10−04). Quantitative PCR
assays confirmed a sub-set of the transcription factor binding sites including those in
MTMR11, DUSP10, ITGAM, MARCH1, HDAC8, MMP14, MAGI1, THBD and SPOCK1.
Keywords: aneurysm; aorta; genes; transcription factor; chromatin immunoprecipitation;
gene expression; gene ontology; KEGG pathway; network
1. Introduction
Abdominal aortic aneurysms (AAAs) are a chronic disease whose pathogenesis is poorly
understood [1–6]. The lack of knowledge about the underlying molecular mechanisms is hampering the
development of treatment modalities. Currently surgical intervention is successful, but is used at a late
stage of the disease leaving patients with small AAAs in the situation of “watchful waiting” until the
AAA has grown large enough to require surgery. Slowing down growth of AAA will make many
operations unnecessary. Development of methods to slow down the growth of small AAAs requires
better understanding of the molecular pathways involved in this process.
We previously carried out a whole-genome microarray-based expression analysis comparing aortic
tissue samples obtained from patients with AAAs to those without the disease and identified 3274 genes
whose expression was significantly decreased (n = 1793) or increased (n = 1481) in the AAA tissue [7].
In silico analysis of the promoters of the up-regulated genes showed that they were enriched for binding
sites of a small number (n = 13) of transcription factors (TFs), suggesting co-regulation and a significant
role in the pathogenesis of AAAs [8]. Protein expression of the TFs binding to these sites was confirmed
in control aorta and AAA tissue by immunohistochemical staining [8].
Understanding the transcriptional networks that control human AAA development requires
experimental cataloging of the target genes of each TF [9–11]. In the current study we carried out further
analyses with four of the previously identified TFs (ELF1, ETS2, RUNX1 and STAT5; Table 1)
predicted to control the expression of differentially expressed genes in AAA. Two of the TFs studied
here, ELF1 and ETS2, are members of the highly evolutionarily conserved Ets family of TFs that
contains an 85 amino acids long motif called the ETS domain [12]. Unlike other TFs, the Ets family
tends to form complexes with members of other TF families rather than with one another [13].
The binding behavior of ELF1 and ETS2 differs in that ELF1 binds strictly to its core motif, while ETS2
binds weakly to its targets [13]. Both ELF1 and ETS2 are expressed in human AAA and non-aneurysmal
infrarenal aorta with ELF1 showing significantly increased expression in AAA (Table 1).

Int. J. Mol. Sci. 2015, 16 11231
Table 1. mRNA and protein expression of transcription factors ELF1, ETS2, RUNX1 and
STAT5 in human aneurysmal and non-aneurysmal infrarenal aorta.
TF Gene ID mRNA Levels * Protein Expression *
AAA vs. Control FDR AAA Control
ELF1 1997 1.8-fold increase 0.0263 +++ ++
ETS2 2114 1.4-fold decrease NS ++ ++
RUNX1 861 2.5-fold increase 0.0058 ++ +
STAT5 6776 (STAT5A)
No difference NS +++ ++ 6777 (STAT5B)
* These results are based on our previous studies in which mRNA levels were assessed by microarray analysis [7]
and protein levels by immunohistochemical analyses [8,14]; NS: Not significant; +: Detectable, low level of
expression; ++: Moderate level of expression; +++: High level of expression.
The third TF found to have a role in the transcriptional control of gene expression in AAA is AML1,
acute myeloid leukemia 1 (NCBI official symbol: RUNX1, runt-related transcription factor 1, also called
EVI-1), which belongs to a complex of two TFs (Moloney murine leukemia virus enhancer core binding
factor (CBF) and polyomavirus enhancer binding protein 2; PEBP2) [15]. Its mRNA levels were
significantly increased in AAA tissue (Table 1). RUNX1, which plays a role in hematopoietic
development through specifying the hematopoietic stem cell [16], has been studied extensively in
leukemia due to chromosome 21 to chromosome 8 translocation that is often found in leukemia, but is
by itself insufficient to cause leukemia in mouse models [17]. Knock out of Runx1 in early stages of
development results in an embryologically lethal phenotype in mice; knock out in later stages results in
abnormalities in hematopoiesis [18]. RUNX1 has three protein coding isoforms (RUNX1A, RUNX1B,
and RUNX1C), each of which has different roles in embryonic hematopoiesis [16]. Post-translational
modification of RUNX1 affects its affinity to its targets [19].
The fourth TF studied here, STAT5 (signal transducer and activator of transcription 5) was found to
play a significant role in the transcriptional regulation of many members of the complement cascade [14].
It is stimulated in the JAK-STAT pathway, where a trans-membrane binding protein will bind to a
cytokine (interleukins, erythropoietin, thrombopoietin, growth hormone, and prolactin [20]) which
results in a conformational change of the receptor’s intercellular region that induces the phosphorylation
of the STAT protein by Janus kinase (JAK), which can lead to the formation of a dimer (STAT5A/B) or
a tetramer (STAT5A).
The current study presents the results from analyses using chromatin immunoprecipitation
followed by microarray hybridization (ChIP-chip). Independent experiments were carried out with the
four TFs—ELF1, ETS2, RUNX1 and STAT5—in human AAA and non-aneurysmal aortic tissue.
Combined analysis with ChIP-chip and genome-wide mRNA expression data on human AAA tissue was
also carried out to provide biologically relevant and disease-centered information.

Int. J. Mol. Sci. 2015, 16 11232
2. Results and Discussion
2.1. Expression of TFs by Cultured Aortic and Inflammatory Cells
Before experimenting with hard-to-get human aortic tissue samples, we carried out experiments with
human cell lines representing the different types of cells present in the aortic wall. We used commercially
available human aortic smooth muscle (HASMC), endothelial (HAEC) and macrophage (THP-1) cell
lines. In disease states, such as AAA, cells in the aortic wall are exposed to different stressors including
cytokines, reactive oxygen species, and matrix metalloproteinases. To mimic this environment,
we cultured the cells in the presence or absence of lipopolysaccharides (LPS) or interferon γ (IFNγ),
which have been shown to activate these cells [21,22].
We tested antibody specificity to ensure that we can identify binding sites specific for ELF1, ETS2,
and RUNX1, the TFs chosen for the study based on our previous in silico analyses [8], as well as STAT5
identified as a key regular in our previous study on the complement cascade [14]. Figure 1 shows results
using an antibody against ELF1 [23,24] in a Western blot against protein lysates obtained from the cell
cultures (A), as well as an immunoprecipitation with this antibody, followed by Western using the same
antibody (B). The immunoprecipitation was carried out using the same protocol as in ChIP except not doing
the crosslinking step. The results demonstrated the specificity of the ELF1 antibody, and verified the
expression of ELF1 protein by the cell lines. The stimulation of these cell lines with LPS or IFNγ led to an
increase in the amount of ELF1 protein (1.8-fold increase in the nuclear form in HASMC when standardized
with β-actin protein levels). Similar experiments were carried out with antibodies against ETS2 [24–26],
RUNX1 [27] and STAT5 [14] (not shown). All four TFs were expressed in all the cell lines (not shown).
Figure 1. Western blots of (A) protein lysates from three different cell lines and (B)
immunoprecipitated proteins from a macrophage cell line THP-1. (A) Three different human
cell types (macrophage, THP-1 also called TIB202; aortic endothelial, HAEC; and aortic
smooth muscle, HASMC), were grown either unstimulated (−) or stimulated (+) with LPS
or IFNγ, harvested, lysed and analyzed in Western blot using a commercially available
ChIP-validated antibody against ELF1 [23]. The lower part of the blot was incubated with
β-actin antibody to use as a loading control. The β-actin antibody produced a strong band of
the expected size (42 kDa); (B) THP-1 cells were immunoprecipitated using the ELF1
antibody and the precipitated proteins detected in a Western blot against the same ELF1
antibody. The sizes of molecular weight markers are shown in kDa. The expected sizes of
the cytoplasmic and nuclear form of ELF1 are 80 and 98 kDa, respectively.

Int. J. Mol. Sci. 2015, 16 11233
2.2. Analysis of ChIP-Chip Results from Aortic Tissue
The ChIP-chip for aortic samples (Table 2) was carried out in two pools of samples, “the AAA Pool”
(combining six AAA tissue samples) and “the Control Pool” (combining five control tissue samples),
due to the large amount of tissue required for the experiment. Each TF was analyzed in a separate
experiment. The ChIP-enriched regions (chers), in the human genome are listed in Table S1. After
identifying the chers, we identified the genes in whose promoter regions (10 kb upstream of the
transcription start site (TSS), or within the gene) the chers were located. The number of genes with chers
per TF was similar in AAA (1330 to 1513) and control (1491 to 1570) tissues, and between the different
ChIP experiments carried out with antibodies against different TFs (Table 3). There was, however,
only a small overlap of 147 to 175 genes between the AAA and control samples in different experiments
(Table 3). We examined the sequences of the chers to identify TF binding motifs, and found that
approximately 76.4% of the chers contained transcription factor binding sites (TFBSs). All identified
TFBSs are listed in Table S2.
Table 2. Donor information for aortic tissue samples.
Case ID Age (Years) Sex Diagnostic Group Cause of Death *
GHS01 67 Male AAA NA GHS03 88 Male AAA NA GHS07 65 Female AAA NA GHS13 78 Male AAA NA GHS14 75 Male AAA NA GHS15 66 Male AAA NA
ME-02-04 50 Male Control Drug Overdose ME-02-05 78 Male Control Cardiovascular ME-05-01 69 Female Control Trauma ME-05-03 54 Male Control Cardiovascular ME-10-02 53 Male Control Cardiovascular
* Cause of death is given for controls; NA, not applicable, since aortic tissue samples from AAA patients were
obtained during surgical repairs. Summary statistics for the AAA and control groups: AAA group (n = 6): mean
age = 73.2 ± 9.0; median = 71; male:female = 5:1; and control group (n = 5): mean age = 60.8 ± 12.1; median = 54;
male:female = 4:1.
After identifying the chers with motifs for the TFBSs, we determined the distance from the predicted
site to the TSS (Table S2). We used the most proximal TSS for each gene, and found 4760 known genes
that were enriched in AAA, 713 of which were differentially expressed in the previous mRNA
expression study (Table S3) [7]. In addition we sampled control aortic tissue and found chers associated
with 4985 known genes with 680 genes differentially expressed [7].
The ChIP-chip data for the stimulated cultured mononuclear cells were analyzed using same methods
as the tissue data. Overall we found fewer genes expressed in the mononuclear blood cell cultures
compared to the tissue samples. Since none of the genes were enriched in both the cell and tissue
experiments (not shown), further analyses were carried out with only the aortic tissue samples.

Int. J. Mol. Sci. 2015, 16 11234
Table 3. Number of genes with chers, genes with differential expression in AAA, and chers
with TFBSs.
Transcription
Factor
Genes with Chers * Genes with Chers in
both AAA and Control Differentially Expressed Genes † Chers with
TFBS N (%) AAA N Control N N % AAA N Control N Overlap N (%)
RUNX1 1330 1491 147 5.2 209 186 18 (4.6) 80.0
ELF1 1513 1570 166 5.4 217 216 28 (6.5) 81.3
ETS2 1448 1539 175 5.9 201 215 30 (7.2) 79.0
STAT5 1490 1557 151 5.0 221 209 23 (5.3) 79.1
* ChIP-enriched regions (cher) were identified as regions containing at least seven probes with a mean
enrichment value that exceeded the threshold (y0) and that were separated by at least 450 bp from another cher.
The threshold was defined as the top 99th quantile (top 1%) of potential chers to limit the number of false
positives included in the analysis; † The genome-wide microarray-based mRNA expression data for aneurysmal
and non-aneurysmal human infrarenal abdominal aorta can be obtained from the Gene Expression Omnibus
(GEO) database (Series# GSE7084) [28,29], and were described in detail in a previous publication [7]. For
a listing of chers and TFBS, see Tables S1 and S2, respectively. Abbreviations: AAA: abdominal aortic
aneurysm; TFBS: transcription factor binding site.
2.3. Validation of ChIP-Chip Results by qPCR
Ten genomic regions containing TFBSs predicted from ChIP-chip results and in target genes
(MTMR11, DUSP10 (two regions), ITGAM, MARCH1, HDAC8, MMP14, MAGI1, THBD and SPOCK1)
were validated using specific qPCR assays (Table 4). For all of the 10 regions, ChIP from the AAA
sample showed more binding than the control aorta in both ChIP-chip and qPCR. Based on the consensus
binding site sequences, the regions in MTMR11 (binding site for RUNX1), MAGI1 (binding site for
STAT5), THBD (binding site for ETS2) and SPOCK1 (binding site for ETS2) contain multiple potential
sites within the approximately 1 kbp qPCR product.
Table 4. List of qPCR assays used in the study.
TF Gene Chr.
ChIP-Chip Results qPCR Assay
CHER
Start
CHER
End
Max
Peak Score TFBS
SAB Catalog
Number Position Delta
RUNX1 MTMR11 1 149914894 149915698 1.82 5.51
149914981 GPH1014896 149915029 48
149914982 GPH1014896 149915029 47
149915422 GPH1014896 149915029 −393
149915646 GPH1014896 149915029 −617
ELF1 DUSP10 1 221910850 221912636 1.11 3.48 221911869 GPH1015368 221911302 −567
221911869 GPH1015369 221911004 −865
ELF1 ITGAM 16 31265046 31265641 1.77 3.85 31265104 GPH1005092 31265074 −30
ETS2 MARCH1 4 164540016 164540804 1.82 7.09 164540319 GPH1023955 164540062 −257
ETS2 HDAC8 X 71795290 71796102 1.45 3.99 71795629 GPH1027352 71795212 −417
ETS2 MMP14 14 23304660 23305370 1.52 4 23305194 GPH1003823 23304254 −940

Int. J. Mol. Sci. 2015, 16 11235
Table 4. Cont.
TF Gene Chr.
ChIP-Chip Results qPCR Assay
CHER
Start
CHER
End
Max
Peak Score TFBS
SAB Catalog
Number Position Delta
STAT5 MAGI1 3 66027042 66027848 2.14 6.17
66027092 GPH1023100 66026742 −350
66027435 GPH1023100 66026742 −693
66027447 GPH1023100 66026742 −705
66027779 GPH1023100 66026742 −1037
66027791 GPH1023100 66026742 −1049
ETS2 THBD 20 23032992 23033730 1.48 4.9
23033025 GPH1022015 23032818 −207
23033065 GPH1022015 23032818 −247
23033114 GPH1022015 23032818 −296
23033328 GPH1022015 23032818 −510
ETS2 SPOCK1 5 136837910 136838620 1.2 3.02 136838118 GPH1024386 136837303 −815
136838136 GPH1024386 136837303 −833
TF, transcription factor; Chr, chromosomal location of the gene; TFBS, location of the transcription factor
binding site; CHER Start, location of the start of the ChIP-enriched region; CHER End, location of the end of
the ChIP-enriched region. All qPCR assays are commercially available from SABiosciences [30] with the
provided catalog numbers. Each qPCR primer pair amplifies a product of about 1 kbp. Delta, difference in bp
between the predicted TFBS and the SAB assay location (middle point of the PCR product).
2.4. Functional Classification of TF Target Genes
The target genes of the TFs identified in the ChIP-chip experiments were annotated using the Gene
Ontology (GO) biological function categories (Tables 5–9 and S4–S8). All GO biological function
categories can be found in Figures 2–5. To provide a balance between general and specific features,
we discuss here the GO categories from the 6th level of hierarchy from all the analyses (Tables 5–9).
A significant enrichment of genes belonging to several GO categories was found (Tables 5–9;
Figures 2–5). In the AAA samples most significantly enriched biological function categories were
“leukocyte migration” (FDR = 3.09 × 10−05), and “intracellular protein kinase cascade” (FDR = 6.48 × 10−05)
(Table 5; Figure 2). In the control aorta, the most significant GO categories differed from those in the
AAA samples and included “cytoskeleton organization” (FDR = 1.24 × 10−06), and “small GTPase
mediated signal transduction” (FDR = 1.24 × 10−06) (Table 6; Figure 3). The GO category “positive
regulation of signal transduction” was enriched in both AAA and control aorta (Tables 5 and 6,
Figures 2 and 3).
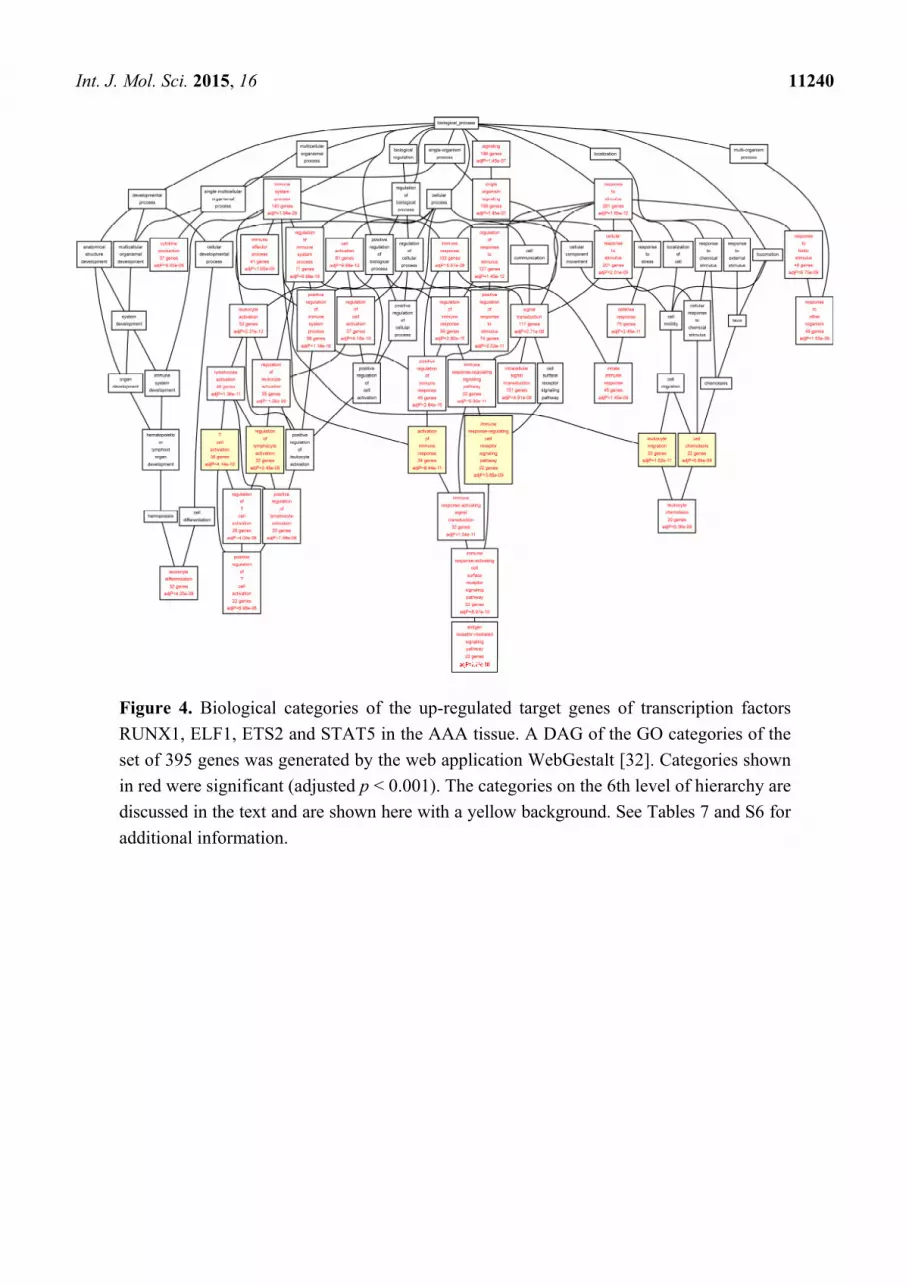
When we analyzed the target genes separately based on their mRNA levels in the AAA tissue,
genes up-regulated in AAA tissue [7] showed a highly significant enrichment for GO categories
“leukocyte migration” (FDR = 1.62 × 10⁻¹¹), “activation of immune response” (FDR = 8.44 × 10⁻¹¹),
“T cell activation” (FDR = 4.14 × 10⁻¹⁰), and “regulation of lymphocyte activation” (FDR = 2.45 × 10−09)
(Table 7; Figure 4). The genes down-regulated in AAA were enriched in completely different
GO categories including “cytoskeleton organization” (FDR = 7.84 × 10−05), “muscle cell development”
(FDR = 1.00 × 10−04), “organ morphogenesis” (FDR = 3.00 × 10−04), and “cell junction assembly”
(FDR = 3.00 × 10−04) (Table 8, Figure 5).

Int. J. Mol. Sci. 2015, 16 11236
We noticed that there was substantial overlap in GO categories for the individual TFs for all but
ETS2. We therefore performed a GO analysis in which the target genes of ETS2 were omitted and
only the target genes for RUNX1, STAT5 and ELF1 were included. The most significantly enriched
categories were “leukocyte migration” (FDR = 9.60 × 10−05), “positive regulation of leukocyte
proliferation”, “T cell activation”, “cell chemotaxis” and “intracellular protein kinases cascade” (all with
FDR = 8.00 × 10−04) (Table 9). The results were very similar to that obtained with all the TFs (Table 5),
suggesting that RUNX1, STAT5 and ELF1 contribute most to the cellular immune response (T cell
activation, lymphocyte and leukocyte activation and proliferation) in the AAA tissue.
Table 5. Enriched Gene Ontology (GO) biological process categories for the target genes
identified in AAA ChIP-chip with transcription factors RUNX1, ELF1, ETS2 and STAT5.
GO Biological Process Category GO ID Number of Genes
p FDR Reference Set Aorta Set Expected
Leukocyte migration 0050900 248 30 3 1.21 × 10−07 3.09 × 10−05
Intracellular protein kinase cascade 0007243 867 67 34 4.17 × 10−07 6.48 × 10−05
Positive regulation of signal transduction 0009967 708 57 29 8.99 × 10−07 1.00 × 10−04
Positive regulation of leukocyte activation 0002696 230 26 9 3.04 × 10−06 2.00 × 10−04
Regulation of lymphocyte activation 0051249 287 30 12 2.75 × 10−06 2.00 × 10−04
T cell activation 0042110 332 33 2 2.68 × 10−06 2.00 × 10−04
The gene set enriched in the ChIP-chip experiments and differentially expressed based on mRNA expression
profiles of the AAA [7] was compared to the reference gene set in the human genome annotated to at least one
GO category. The analysis was carried out using a set of differentially expressed target genes with chers in the
AAA sample pool. The analyses presented here were carried out using the combined set of all target genes for
all four transcription factors. All of the categories listed here are from the 6th level of hierarchy. Size of the
category (number of genes) and the number of genes overlapping with the list of genes are given. The analysis
was carried out using the Webgestalt tool [31,32]. p values were calculated using a hypergeometric test and
adjustment for multiple hypothesis testing (FDR) was performed using Benjamini-Hochberg correction [33].
See Figure 2 for a DAG image of the categories, and Table S4 for a list of the genes in the aorta set in each category.
Table 6. Enriched GO biological process categories for the target genes identified in control
aorta ChIP-chip with transcription factors RUNX1, ELF1, ETS2 and STAT5.
GO Biological Process Category GO ID Number of Genes
p FDR Reference Set Aorta Set Expected
Cytoskeleton organization 0007010 792 66 31 7.57 × 10−09 1.24 × 10−06
Small GTPase mediated signal transduction 0007264 604 55 24 7.27 × 10−09 1.24 × 10−06
Positive regulation of signal transduction 0009967 708 57 28 2.77 × 10−07 3.36 × 10−05
Regulation of cell migration 0030334 395 38 16 4.33 × 10−07 4.84 × 10−05
Actin-filament-based process 0030029 463 41 18 1.34 × 10−06 1.00 × 10−04
See footnote to Table 5 for description of approach and tools used. See Figure 3 for a DAG image of the
categories, and Table S5 for a list of the genes in the aorta set in each category.

Int. J. Mol. Sci. 2015, 16 11237
Table 7. Enriched GO biological process categories for the up-regulated target genes
identified in AAA ChIP-chip with transcription factors RUNX1, ELF1, ETS2 and STAT5.
GO Biological Process Category GO ID Number of Genes
p FDR Reference Set Aorta Set Expected
Leucocyte migration 0050900 248 33 7 9.09 × 10⁻¹⁴ 1.62 × 10⁻¹¹
Activation of immune response 0002253 281 34 8 6.18 × 10⁻¹³ 8.44 × 10⁻¹¹
T cell activation 0042110 332 36 9 3.39 × 10⁻¹² 4.14 × 10⁻¹⁰
Regulation of lymphocyte activation 0051249 287 32 8 2.74 × 10⁻¹¹ 2.45 × 10−09
Immune response-regulating cell
surface receptor signaling pathway 0002768 139 22 6 4.40 × 10⁻¹¹ 3.65 × 10−09
Cell chemotaxis 0060326 143 22 4 7.80 × 10⁻¹¹ 5.84 × 10−09
See footnote to Table 5 for description of approach and tools used. See Figure 4 for a DAG image of the
categories, and Table S6 for a list of the genes in the aorta set in each category.
Table 8. Enriched GO biological process categories for the down-regulated target genes
identified in AAA ChIP-chip with transcription factors RUNX1, ELF1, ETS2 and STAT5.
GO Biological Process Category GO ID Number of Genes
p FDR Reference Set Aorta Set Expected
Cytoskeleton organization 0007010 792 60 30 3.31 × 10−07 7.84 × 10−05
Muscle cell development 0055001 145 20 6 6.94 × 10−07 1.00 × 10−04
Organ morphogenesis 0009887 802 58 31 2.35 × 10−06 3.00 × 10−04
Cell junction assembly 0034329 170 21 7 2.30 × 10−06 3.00 × 10−04
Cardiovascular system development 0072358 754 55 29 3.37 × 10−06 4.00 × 10−04
Regulation of cell migration 0030334 395 34 15 9.72 × 10−06 8.00 × 10−04
Striated muscle cell differentiation 0051146 204 22 8 1.24 × 10−05 1.00 × 10−03
Muscle organ development 0007517 340 30 13 2.03 × 10−05 1.40 × 10−03
See footnote to Table 5 for description of approach and tools used. See Figure 5 for a DAG image of the
categories, and Table S7 for a list of the genes in the aorta set in each category.
Table 9. Enriched GO biological process categories for the target genes identified in AAA
ChIP-chip with a combined analysis of transcription factors RUNX1, STAT5 and ELF1.
GO Biological Process Category GO ID Number of Genes
p FDR Reference Set Aorta Set Expected
Leukocyte migration 0050900 248 26 8.3 2.44 × 10−07 9.60 × 10−05
Positive regulation of leukocyte proliferation 0070665 102 14 3.4 7.05 × 10−06 8.00 × 10−04
Cell chemotaxis 0060326 143 17 4.8 5.59 × 10−06 8.00 × 10−04
T cell activation 0042110 332 28 11 6.66 × 10−06 8.00 × 10−04
Intracellular protein kinase cascade 0007243 867 54 29 6.51 × 10−06 8.00 × 10−04
Positive regulation of signal transduction 0009967 708 46 24 1.14 × 10−05 1.00 × 10−03
Regulation of lymphocyte activation 0051249 287 25 9.6 1.20 × 10−05 1.00 × 10−03
The analysis was as described in the footnote to Table 5 except that the combined set of all target genes for the
three transcription factors RUNX1, STAT5 and ELF1 were used. See Table S8 for a list of the genes in the
aorta set in each category.

Int. J. Mol. Sci. 2015, 16 11238
Figure 2. Biological categories of the differentially expressed target genes of transcription
factors RUNX1, ELF1, ETS2 and STAT5 in the AAA tissue. A DAG of the GO categories
of the set of 711 genes containing at least one cher in AAA tissue was generated by the web
application WebGestalt [32]. Categories shown in red were significant (adjusted p < 0.001).
The categories on the 6th level of hierarchy are discussed in the text and are shown here with
a yellow background. See Tables 5 and S4 for additional information.

Int. J. Mol. Sci. 2015, 16 11239
Figure 3. Biological categories of the differentially expressed target genes of transcription factors
RUNX1, ELF1, ETS2 and STAT5 in the control aorta. A DAG of the GO categories of the set of
679 genes containing at least one cher in control tissue was generated by the web application
WebGestalt [32]. Categories shown in red were significant (adjusted p < 0.001). The categories on
the 6th level of hierarchy are discussed in the text and are shown here with a yellow background.
See Tables 6 and S5 for additional information.
Int. J. Mol. Sci. 2015, 16 11240
Figure 4. Biological categories of the up-regulated target genes of transcription factors
RUNX1, ELF1, ETS2 and STAT5 in the AAA tissue. A DAG of the GO categories of the
set of 395 genes was generated by the web application WebGestalt [32]. Categories shown
in red were significant (adjusted p < 0.001). The categories on the 6th level of hierarchy are
discussed in the text and are shown here with a yellow background. See Tables 7 and S6 for
additional information.

Int. J. Mol. Sci. 2015, 16 11241
Figure 5. Biological categories of the down-regulated target genes of transcription factors RUNX1, ELF1, ETS2 and STAT5 in the AAA tissue.
A DAG of the GO categories of the set of 551 genes was generated by the web application WebGestalt [32]. Categories shown in red were
significant (adjusted p < 0.001). The categories on the 6th level of hierarchy are discussed in the text and are shown here with a yellow
background. See Tables 8 and S7 for additional information.

Int. J. Mol. Sci. 2015, 16 11242
The differentially expressed TF target genes were also mapped to KEGG pathways (Tables 10 and 11).
In the AAA samples, the most enriched pathways were “primary immunodeficiency”, “amoebiasis”,
“hematopoietic cell lineage”, and “B cell receptor signaling pathway” (Table 10), whereas in the control
aorta “Fc γ R-mediated phagocytosis”, “bacterial invasion of epithelial cells”, “viral myocarditis” and
“arrhythmogenic right ventricular cardiomyopathy” were the top pathways (Table 11).
Table 10. Enriched KEGG pathways for the target genes identified in ChIP-chip with human
AAA tissue and transcription factors RUNX1, ELF1, ETS2 and STAT5.
KEGG ID n Expected N p-Value Pathway Name
hsa05340 9 1.89 35 0.00001 Primary immunodeficiency hsa05146 14 5.74 106 0.00052 Amoebiasis hsa04640 12 4.76 88 0.00081 Hematopoietic cell lineage hsa04662 10 4.06 75 0.0021 B cell receptor signaling pathway hsa05414 11 4.87 90 0.0031 Dilated cardiomyopathy hsa05410 10 4.49 83 0.0048 Hypertrophic cardiomyopathy (HCM) hsa04510 19 10.82 200 0.005 Focal adhesion hsa05150 7 3.03 56 0.010 Staphylococcus aureus infection hsa05142 11 5.63 104 0.010 Chagas disease (American trypanosomiasis) hsa04614 3 0.92 17 0.011 Renin-angiotensin system hsa04330 6 2.54 47 0.012 Notch signaling pathway hsa04666 10 5.14 95 0.013 Fc γ R-mediated phagocytosis hsa05222 9 4.60 85 0.016 Small cell lung cancer hsa04520 8 3.95 73 0.016 Adherens junction hsa05220 8 3.95 73 0.016 Chronic myeloid leukemia hsa00740 2 0.60 11 0.019 Riboflavin metabolism hsa04380 12 6.93 128 0.020 Osteoclast differentiation hsa04810 18 11.58 214 0.022 Regulation of actin cytoskeleton hsa05214 7 3.52 65 0.023 Glioma hsa04670 11 6.33 117 0.024 Leukocyte transendothelial migration hsa04960 5 2.27 42 0.024 Aldosterone-regulated sodium reabsorption hsa01040 3 1.14 21 0.024 Biosynthesis of unsaturated fatty acids hsa04664 8 4.28 79 0.026 Fc epsilon RI signaling pathway hsa00524 1 0.27 5 0.026 Butirosin and neomycin biosynthesis hsa04142 11 6.55 121 0.030 Lysosome hsa04660 10 5.85 108 0.031 T cell receptor signaling pathway hsa04514 12 7.36 136 0.032 Cell adhesion molecules (CAMs) hsa05221 6 3.14 58 0.036 Acute myeloid leukemia hsa05100 7 3.84 71 0.037 Bacterial invasion of epithelial cells hsa00061 1 0.32 6 0.038 Fatty acid biosynthesis hsa04512 8 4.60 85 0.039 ECM-receptor interaction hsa04722 11 6.87 127 0.041 Neurotrophin signaling pathway hsa05140 7 3.95 73 0.042 Leishmaniasis hsa04012 8 4.71 87 0.045 ErbB signaling pathway hsa05412 7 4.01 74 0.045 Arrhythmogenic right ventricular cardiomyopathy (ARVC) hsa05200 24 17.70 327 0.049 Pathways in cancer

Int. J. Mol. Sci. 2015, 16 11243
Table 10. Cont.
KEGG ID n Expected N p-Value Pathway Name
hsa05131 6 3.36 62 0.049 Shigellosis hsa00534 3 1.41 26 0.049 Glycosaminoglycan biosynthesis—Heparan sulfate hsa04062 15 10.23 189 0.049 Chemokine signaling pathway
A total of 319 target genes identified in ChIP-chip with human AAA tissue had KEGG categories. n, number
of genes in the experimental gene list belonging to the KEGG pathway; N, all genes in this KEGG pathway.
Table 11. Enriched KEGG pathways for the target genes identified in ChIP-chip with human
non-aneurysmal infrarenal aorta and transcription factors RUNX1, ELF1, ETS2 and STAT5.
KEGG ID n Expected N p-Value Pathway Name
hsa04666 13 5.29 95 0.00070 Fc γ R-mediated phagocytosis hsa05100 10 3.95 71 0.00170 Bacterial invasion of epithelial cells hsa05416 9 4.01 72 0.0061 Viral myocarditis hsa05412 9 4.12 74 0.0074 Arrhythmogenic right ventricular cardiomyopathy (ARVC) hsa00640 5 1.78 32 0.0075 Propanoate metabolism hsa04810 20 11.91 214 0.0076 Regulation of actin cytoskeleton hsa04662 9 4.17 75 0.0081 B cell receptor signaling pathway hsa05340 5 1.95 35 0.012 Primary immunodeficiency hsa04510 18 11.13 200 0.015 Focal adhesion hsa05410 9 4.62 83 0.016 Hypertrophic cardiomyopathy (HCM) hsa04520 8 4.06 73 0.019 Adherens junction hsa05414 9 5.01 90 0.027 Dilated cardiomyopathy hsa00524 1 0.28 5 0.028 Butirosin and neomycin biosynthesis hsa05110 6 3.01 54 0.029 Vibrio cholerae infection hsa05120 7 3.78 68 0.034 Epithelial cell signaling in Helicobacter pylori infection hsa00061 1 0.33 6 0.040 Fatty acid biosynthesis
A total of 328 target genes identified in ChIP-chip with human control aorta tissue had KEGG categories.
n, number of genes in the experimental gene list belonging to the KEGG pathway; N, all genes in this
KEGG pathway.
We used the IPA® tool to elucidate the interactions between the target genes of the four TFs to
investigate how these genes may contribute to the biological mechanisms of AAA. The IPA’s Core
Analysis generated 25 networks (Table S9), the top five of which were (1) “cellular function
and maintenance, hematological system development and function, hematopoiesis” (score: 41);
(2) “respiratory system development and function, tissue morphology, cardiovascular system
development and function” (score: 41); (3) “cell morphology, cell-to-cell signaling and interaction,
developmental disorder” (score: 39); (4) “embryonic development, cellular function and maintenance,
hematological system development and function” (score: 36); and (5) “cellular function and maintenance,
cell death and survival, cardiovascular disease” (score: 34). We then merged the networks into a single
interaction figure indicating the genes with significantly elevated or decreased expression levels
according to our prior microarray-based mRNA expression study (Figure 6) [7].

Int. J. Mol. Sci. 2015, 16 11244
Figure 6. Network of interactions of the transcription factor target genes. Qiagen’s Ingenuity
Pathway Analysis® tool was used to analyze the genes with chers based on the current study
using ChIP-chip. This analysis yielded 25 networks, which were then merged. Green
molecules showed decreased and red increased mRNA expression in AAA in our previous
microarray expression analysis [7]. Molecules are represented as nodes, and the biological
relationship between two nodes is represented as a line. Solid lines represent direct
interactions and dashed lines indirect interactions. All lines are supported by at least one
literature citation or from canonical information stored in the Ingenuity Pathways
Knowledge Base. Nodes are displayed using various shapes that represent the functional
class of the gene product. See Table S9 for listing of networks.

Int. J. Mol. Sci. 2015, 16 11245
We carried out additional functional analyses with the IPA® tool. The top canonical pathways were:
(1) “p70S6K signaling” (p = 2.52 × 10−06); (2) “CCR5 signaling in macrophages” (p = 4.88 × 10−06);
(3) “protein kinase A signaling” (p = 5.15 × 10−06); (4) “hepatic fibrosis/hepatic stellate cell activation”
(p = 5.18 × 10−06); and (5) “RhoA signaling” (p = 1.37 × 10−05). The five most significant “molecular
and cellular functions” were: (1) “cellular development” (378 molecules); (2) “cellular growth and
proliferation” (406 molecules); (3) “cell morphology” (319 molecules); (4) “cellular movement”
(266 molecules) and (5) “cellular function and maintenance” (380 molecules).
We also used the IPA tool to demonstrate the downstream interactions of TFs to genes with
experimental evidence that their transcription is regulated directly by one of the TFs studied here. There
were a total of 20 genes regulated directly by RUNX1, 7 with ETS2, 5 with STAT5 and 2 with ELF1
(Figure 7). We then added to these interaction graphs shown in Figure 7 the genes MTMR11, DUSP10,
ITGAM, MARCH1, HDAC8, MMP14, MAGI1, THBD and SPOCK1 (shown with yellow background in
Figure 7) identified as target genes for these TFs in the human aorta in the current study using ChIP-chip and
q-PCR. Eight of the previously known target genes (gray symbols) were also identified in the current
ChIP-chip dataset. Two of the target genes shown in Figure 7 (SYK and PMAIP1) had significantly
different mRNA levels between AAA and control aorta [7].
RUNX1, ELF1, ETS2, and STAT5 are important regulators of immune cell proliferation,
differentiation, and activation [14,34–36]. Further investigation on the pattern of RUNX1, ETS2,
and STAT5 expression early in AAA pathogenesis may clarify these roles. RUNX1, STAT5, and ELF1
may play crucial roles in the immune response seen in AAA.
Several intriguing observations of genes with associated specific chip enriched regions may have
relevance to AAA pathogenesis. Two RUNX1 and one ETS2 chromatin enriched regions were
associated with CD59, a suppressor of the complement response, in control samples. Only one RUNX1
chip-enriched region was present in the AAA (Table S1). Inhibition of CD59 attenuates aneurysm
formation in the angiotensin mouse model of AAA [37]. DUSP10 up-regulated in AAA had both ETS2
and ELF1 binding sites (Table 4; Table S1). DUSP10 (Dual specificity protein phosphatase 10) regulates
magnitude of p38 activity in response to oxidative stress in HEK 293-T cells [38]. ETS2 was enriched
near the MMP14 locus (Table 4; Table S1). Previously ETS protein inhibitors were suggested to reduce
MMP expression [39]. Further investigation may determine if this pattern represents a cell type specific
transcription factor binding pattern or if it represents combinatorial control of gene expression.
Other genes found in our ChIP-chip analysis are involved in immune activation and apoptosis; however
a complete discussion on the relevance of these genes to AAA is outside the scope of our analysis
(Figures 2 and 8).

Int. J. Mol. Sci. 2015, 16 11246
Figure 7. Experimentally validated direct interactions of transcription factors (A) RUNX1,
(B) STAT5 and (C) ELF1, ETS2 with their target genes. Qiagen’s Ingenuity Pathway
Analysis® tool was used to demonstrate the downstream interactions of TFs to genes with
experimental evidence that their transcription is regulated directly by one of the TFs studied
here. In addition, the genes MTMR11, DUSP10, ITGAM, MARCH1, HDAC8, MMP14,
MAGI1, THBD and SPOCK1 identified as target genes for these TFs in human aorta in the
current study using ChIP-chip and q-PCR were also included (yellow symbols). Eight of the
previously known target genes (gray symbols) were also identified in the current ChIP-chip
dataset. Two of the target genes shown in this figure (SYK and PMAIP1) had significantly
different mRNA levels between AAA and control aorta [7].

Int. J. Mol. Sci. 2015, 16 11247
Figure 8. Biological categories of the target genes of transcription factors RUNX1, ELF1, ETS2 and STAT5 that were also differentially
expressed in the AAA neck region. The gene list was obtained from a previously published study on RNA samples isolated from the neck
regions of AAAs [40]. A DAG of the GO categories of the set of 282 genes was generated by the web application WebGestalt [32]. Categories
shown in red were significant (adjusted p < 0.001). The categories on the 6th level of hierarchy are discussed in the text and are shown here with
a yellow background. See Tables 12 and S11 for additional information.

Int. J. Mol. Sci. 2015, 16 11248
2.5. Analysis of mRNA Expression Data from the Neck Region of AAA
Biros et al. [40] studied gene expression in the aneurysmal neck and identified 1047 differentially
expressed genes (≥2-fold difference and FDR < 0.05) in comparison with juxtarenal aortic tissue samples
obtained from age-and sex-matched kidney donors. These authors hypothesized that by using the non-dilated
neck region of AAA, they would be able to study biological processes involved in early stages of AAA
development [40]. Overall, there were only 88 genes that were common in the differentially expressed
gene lists of Lenk et al. [7] and Biros et al. [40]. We also analyzed the list of 1047 genes from the
Biros et al. [40] study and found 446 genes with chers for TFs RUNX1, STAT5, ELF1 or ETS2
(Table S10). The most enriched GO categories included “regulation of apoptosis” (FDR = 1.50 × 10−03),
“positive regulation of macromolecule metabolic process” (FDR = 2.10 × 10−03), “cardiovascular system
development” (FDR = 3.50 × 10−03) and “negative regulation of programmed cell death” (FDR =
9.00 × 10−03) (Table 12, Figure 8 and Table S11). It is noteworthy that these functional categories were
different than the ones described above with the aneurysmal sac samples. These results suggest that
apoptosis is an earlier event than inflammation in the AAA development.
Table 12. Enriched GO biological process categories for the target genes differentially
expressed in the AAA neck and found to have binding sites for transcription factors RUNX1,
ELF1, ETS2 and STAT5 based on the current ChIP-chip analyses.
GO Biological Process Category GO ID Number of Genes
p FDR Reference Set AAA Neck Set Expected
Regulation of apoptotic process 0042981 1150 30 13 5.72 × 10−06 1.50 × 10−03
Positive regulation of macromolecule
metabolic process 0010604 1842 40 20 1.10 × 10−05 2.10 × 10−03
Cardiovascular system development 0072358 754 22 8.2 2.25 × 10−05 3.50 × 10−03
Negative regulation of
programmed cell death 0043069 580 17 6.3 2.00 × 10−04 9.00 × 10−03
Signal transduction in
response to DNA damage 0042770 116 7 1.2 3.00 × 10−04 1.21 × 10−02
Leukocyte migration 0050900 248 10 2.7 4.00 × 10−04 1.43 × 10−02
The gene list was obtained from a previously published study on RNA samples isolated from the neck regions
of AAAs [40]. From this list, genes enriched in the ChIP-chip experiments identified in the current study were
identified. This gene set (see Table S9) was then compared to the reference gene set in the human genome
annotated to at least one GO category. The analysis was carried out using a set of chers in the AAA sample
pool. The analyses presented here were carried out using the combined set of all target genes for all four
transcription factors. All of the categories listed here are from the 6th level of hierarchy. Size of the category
(number of genes) and the number of genes overlapping with the list of genes are given. The analysis was
carried out using the Webgestalt tool [31,32]. p values were calculated using a hypergeometric test and
adjustment for multiple hypothesis testing (FDR) was performed using Benjamini-Hochberg correction [33].
See Figure 8 for a DAG image of the categories, and Table S11 for a list of the genes in the aorta set in
each category.

Int. J. Mol. Sci. 2015, 16 11249
2.6. Limitations of the Study
We realize that experimental cataloging of the target genes of each TF is only the first step in the
process of understanding transcriptional regulation contributing to human diseases [10,41]. The binding of
TFs to their target sequences can be influenced by many factors including the specificity of the binding
site sequence, differences in the chromatin structure, and availability of co-factors, including co-activators
and repressors increasing the complexity of the transcriptional control [42]. The chromatin structure
can be influenced by post-translational histone modifications and DNA methylation [42]. According
to previous studies, members of the ETS and STAT protein families often bind to relatively weak
binding sites because they are part of protein complexes, which relaxes the requirement for a strong
TFBS [13,43]. ELF1, although a member of the ETS TF family, is an exception in that it has stricter
core binding motif requirements [13,44]. RUNX1 is known to form a complex with CBFB (core-binding
factor, beta subunit), which does not, however, bind directly to the DNA and primarily stabilizes
RUNX1 binding [45].
As pointed out by Todeschini et al. [46] in a recent review article, the “footprints of TF binding”
(as they called them) need to be combined with dynamic information to distinguish specific functional
binding of TFs with a direct consequence in gene expression from non-functional binding, either specific
or non-specific, without influencing the transcriptional control. ChIP-chip results show where TFs bind,
but provide no kinetic information on the binding. They are influenced by experimental details such as
how long the chromatin was exposed to the fixative as well as bioinformatics tools and algorithms used
to detect the peaks [46].
In the current study, we chose four TFs for the ChIP-chip based on our previous in silico analyses [8].
It is, however, likely that many additional TFs are important in the transcriptional regulation of human
AAA. Some of these TFs are yet to be discovered as TFs [9]. In addition, performing ChIP-seq, in which
the ChIP is followed by whole genome sequencing would allow cataloging of all TFBSs and not limiting
to those present on the microarray used for hybridization [47].
The results discussed here are based on experiments with human aortic tissue samples from patients
affected with AAA in the infrarenal aorta and age- and sex-matched controls without AAA. We considered
it important to use the aortic tissue, since large differences have been reported in the number of putative
binding sites for different TFs and cell types [42]. We acknowledge the limitations of the study due to
limited availability of human aortic tissue from AAA patients and that samples can only be obtained at
the end-stage of the disease when the AAA is large enough to warrant a surgical repair. At this stage it
is difficult to collect samples from the different layers (intima, media and adventitia) of the aortic wall
in large enough quantities for the type of experiments described here, due to extensive degradation
and remodeling of the aorta. Nevertheless, the results provide intriguing preliminary results on the
transcriptional control of gene expression in the human AAA. By combining the ChIP-chip results with
the available mRNA expression profiles for AAA and control aorta we were able to generate more
meaningful results related to the transcriptional control of gene expression in human AAA [48].

Int. J. Mol. Sci. 2015, 16 11250
3. Experimental Section
3.1. Human Aortic Samples
Full thickness aortic wall tissue specimens were collected from patients undergoing AAA repair
operations (n = 6) at the Geisinger Medical Center, Danville, PA, USA (Table 2). Non-aneurysmal aortic
samples (n = 5) of the infrarenal aorta were collected at autopsies at Wayne State University School of
Medicine, Detroit, MI, USA (Table 2). Tissue samples for ChIP were snap-frozen in liquid nitrogen
and stored at −80 °C. The same autopsy samples have been used in our previous studies and have
shown comparable performance in mRNA and protein analyses to samples taken from AAA
operations [14,49–52]. The investigation conformed to the principals outlined in the Declaration of
Helsinki. AAA patients gave written informed consent for the use of their aortic tissue samples for
research. The collection of the human tissues and their use for research was approved by the Institutional
Review Boards of Geisinger Health System, Danville, PA, USA, and the Wayne State University School
of Medicine, Detroit, MI, USA.
3.2. Cell Culture Experiments
Human aortic smooth muscle cells (HASMC; catalog number 6110, ScienCell Research Laboratories,
Carlsbad, CA, USA), human aortic endothelial cells (HAEC; catalog number 6100, ScienCell),
and monocyte/macrophage cells (THP-1 cell line; catalog #TIB-202, American Type Culture
Collection, Manassas, VA, USA) [53] were cultured in appropriate medium according to suppliers’
recommendations [14,50]. HASMCs and HAECs were stimulated for 18 h using 50 ng/mL IFN-γ;
(PeproTech Inc., Rocky Hill, NJ, USA) as reported previously [21]. THP-1 cells [53] were stimulated
for 18 h using 50% serum, 100 ng/mL lipopolysaccharide LPS (serotype 055: B5, Sigma-Aldrich,
St. Louis, MO, USA), and 20 ng/mL IFN-γ (PeproTech) [22]. This stimulation protocol has been used
previously [14,22] and was considered relevant to AAA, since mice lacking IFN-γ are resistant to AAA
formation in the CaCl2 model [54] and IFN-γ-producing T-cells are present in the blood and aortic wall of
most AAA patients [55].
3.3. Chromatin Immunoprecipitation Followed by Microarray Hybridization (ChIP-Chip)
ChIP was performed using EZ-ChIP Kit (Millipore, Billerica, MA, USA). In cultured TPH-1 cells
DNA-protein complexes were cross-linked and then sheared to 200–1000 bp using a micro-tip equipped
Sonicator 3000 (Misonix Inc., Farmingdale, NY, USA).
For aortic samples (Table 2) two pools, “AAA Pool” and “Control Pool”, were formed. A total of 65 g
of frozen tissue from control (n = 5) or AAA (n = 6) samples (approximate equal weight of each) was
combined and cut into 1–3 mm pieces. One mL of phosphate buffered saline (PBS) with CompleteMini
Protease inhibitors (Roche, Mannheim, Germany) was added for each 100 mg of tissue. Crosslinking
was performed by adding 37% formaldehyde to a final concentration of 1.5%. Samples were incubated
at room temperature with rotation for 15 min. Cross-linking was stopped by adding glycine to a final
concentration of 0.125 M. Samples were centrifuged and washed with ice-cold PBS and suspended in
100 μL of PBS with CompleteMini Protease inhibitors for each 100 mg of tissue. The tissue suspension

Int. J. Mol. Sci. 2015, 16 11251
was placed into a 50 μm disposable polyethylene chamber containing an immobile stainless steel screen
with approximately 100 hexagonal holes, each with 6 microblades designed for efficient cutting of hard
tissues (Medicon from BD Biosciences, San Jose, CA, USA). The Medicon was then inserted into an
automated, mechanical disaggregation machine (Medimachine from BD Biosciences) for two min and
finally filtered using a 50 μm disposable filter devise (Cup Filcon from BD Biosciences). The resulting
cell suspension was centrifuged for 10 min, supernatant was removed and cell pellet was suspended in
500 μL lysis buffer (50 mM Tris-HCl, pH 8.1, 10 mM EDTA, 1% SDS). Sheared crosslinked chromatin was
generated by sonicating cell lysates using a micro-tip equipped Sonicator 3000 (Misonix Inc.). The sonicated
sample was centrifuged for 10 min at 10,000× g, and supernatant stored at −80 °C in 100 μL aliquots.
Immunoprecipitation of crosslinked chromatin and purification of DNA was performed using the
EZ-ChIP Kit (Millipore). Briefly, specific antibodies or control antibodies (anti-RNA polymerase or
normal mouse IgG) were added to diluted agarose G precleared aliquots and incubated overnight.
Agarose G was added and the antibody-antigen-DNA complex was collected by centrifugation. Pellets
were washed with a series of wash buffers and protein-DNA complexes eluted with elution buffer.
Crosslinks of the eluted protein-DNA were reversed and the sample was first treated with RNase and
then proteinase K. DNA was purified using spin columns.
The following experimental antibodies were used for immunoprecipitations: (1) purified mouse
STAT5 antibody (catalog #610191; BD Transduction Laboratories, San Jose, CA, USA) [14]; (2) rabbit
polyclonal ELF1 antibody (C-20X; sc-631, Santa Cruz Biotechnology, Inc., Santa Cruz, CA, USA) [8,23];
(3) rabbit polyclonal ETS2 antibody (C-20X; sc-351; Santa Cruz Biotechnology) [24–26]; and (4) purified
rabbit polyclonal AML1 (also known as RUNX1) antibody (catalog #PC284; Calbiochem, Darmstadt,
Germany) [27]. The literature citations indicate other studies that have used exactly the same antibodies.
Purified DNA was first amplified using GenomePlex® Complete Whole Genome Amplification
(WGA) Kit (Sigma-Aldrich, St. Louis, MO, USA). GenomePlex® WGA Reamplification Kit
(Sigma-Aldrich) was used in instances when a second amplification was warranted.
Amplified input and chromatin-immunoprecipitated DNA samples were used in hybridizations with
promoter arrays (HG18 Deluxe Promoter HX1 arrays, Roche NimbleGen, Inc., Indianapolis, IN, USA).
These arrays contain 2.1 million probes of 50–75 mer in size and tile the promoter regions of all known
genes covering a genomic region of approximately −7 to +3 kbp for each gene. Labeling, hybridization,
washing, and scanning were performed by NimbleGen. Signal intensity data were extracted from
scanned images using NimbleScan software. For each probe on the array, log2 ratios of the Cy5-labeled
IP sample vs. the Cy3-labeled input DNA sample were calculated.
3.4. Analysis of Chip Data from Chromatin Immunoprecipitation
The raw ChIP-chip data (.pair) and reporter probe IDs were loaded into statistical program R using the
Ringo package [56]. The pos file provided by NimbleGen contained genomic mapping of the reporters to
the hg18 version of the human genome. The ndf file contained the reporter sequences which were used to
realign the reporter probe target locations to the hg19 version of the human genome using the alignment
tool Exonerate [57,58]. Several methods part of the Ringo package [56] were used to assess the quality of
the microarray data. The data passed these quality control steps.

Int. J. Mol. Sci. 2015, 16 11252
The NimbleGen reporter annotation field contained 2,125,410 reporter targets for the hg18 version
of the human genome. The reporters mapped to 2,190,504 (65,094 or 3.1% more) genomic locations
when remapped to the hg19 version of the genome. We removed all non-specific reporters (101,622
non-unique probes; 4.6%) to control error introduced by them, leaving 2,088,882 unique reporters.
A total of 31,522 (1.5%) unique probes were removed from the original set of 2,125,410 probes.
We normalized the data according to the NimbleGen recommendation by using the Tukey-biweight
scale normalization, which gives a robust average that reduces the effect of outliers. We smoothed
the probe intensities as suggested by Ringo to account for parameters that influence genomic DNA
hybridization to the microarray such as probe GC content, melting temperature, and secondary structure
that can cause variation in individual probe-genomic fragment hybridization [56]. The reporter
intensities were smoothed by calculating a running median using a 900-bp sliding window and a
minimum of seven probes [59].
Chers were identified as regions containing at least seven probes with a mean enrichment value that
exceeded the threshold (y0) and that were separated by at least 450 bp from another cher. The threshold
was defined as the top 99th quantile (top 1%) of potential chers to limit the number of false positives
included in the analysis.
3.5. Transcription Factor Binding Site (TFBS) Analysis
We analyzed the sequences of the chers to identify potential TFBS and support the evidence of TF
binding from the ChIP-chip analysis. The program Ringo was used to generate a score which is the sum
of the log-fold changes minus the threshold. We used the R package Biostrings to query the genomic
dataset (hg19) for the sequences of chers and export them in a fasta file. The Match™ tool [60] of
Transfac® (Wolfenbuettel, Germany) was used to compare this dataset with a truncated version of the
minFP_best (cut-off to minimize false positive matches) and minSum_best (cut-off to minimize the sum
of both false positive and false negative matches) profiles containing only the TFs ELF1, ETS2, RUNX1
and STAT5.
3.6. Calculating Distance between Chip-Enriched Region (cher) and TFBS
After identifying the chers containing motifs for the TFBSs, we determined the distance from the
predicted site to the TSS. We used the most proximal TSS for each gene. The distance between the TSS
and TFBS was calculated as “(TSS − Cherstart + TFBS) × Strand”.
3.7. Gene Expression Analysis
Previously our laboratory generated genome-wide microarray-based mRNA expression profiles for both
aneurysmal and non-aneurysmal human infrarenal abdominal aorta [7]. The microarray data can be obtained
at the Gene Expression Omnibus (GEO) database (Series# GSE7084) [28,29]. We used this data set here
for the target gene analysis (see below).
Another expressed gene list was obtained from a previously published study on RNA samples isolated
from the neck regions of AAAs [40]. The authors generated this gene list by comparing the mRNA
expression of aortic neck samples from AAA patients (n = 14) and control aortic specimens (n = 8)

Int. J. Mol. Sci. 2015, 16 11253
obtained from organ donors. The microarray platform was HumanHT-12 v4 Expression BeadChip
(Illumina). Genes with 2-fold difference in expression between AAA and control groups and
FDR < 0.05 were considered differentially expressed. A total of 1047 differentially expressed genes
were identified [40].
3.8. Functional Classification and Network Analysis of Target Genes
Functional classification of the target genes was carried out with GO analysis using WebGestalt to
create a hierarchy of the GO annotations of the predicted targets [31,32]. For this procedure, a list of the
Entrez IDs for target genes that contained chers and were known to be differentially expressed based on
our previous study [7] or that of Biros et al. [40] was uploaded to the web application WebGestalt Gene
Set Analysis Toolkit Version 2 [32]. The analyses were carried out for each TF separately. Combined
analyses with all differentially expressed target genes in either the AAA or control aorta were also
performed, as well as with target genes of different combinations of the TFs. Directed acyclic graphs
(DAGs) were generated representing a hierarchical categorization of the significant GO annotations.
KEGG pathway [61] analysis was carried out to identify enriched pathways for the combined set of
target genes in AAA and control as well as for the AAA and control target genes separately using the R
package KEGG.db [62].
Potential target gene interactions were analyzed via networks generated using Ingenuity Pathway
Analysis® (IPA) tool version 9.0 (Qiagen’s Ingenuity Systems, Redwood City, CA, USA).
3.9. Quantitative PCR (qPCR) Validation of Selected TFBSs
Predesigned ChIP-qPCR assays and RT2 SYBR Green/Rox qPCR Master Mix available from
SABiosciences (Qiagen, Frederick, MD, USA) were used to validate selected ChIP-chip results. The
assay IDs and their relationship with the chers identified in ChIP-chip are shown in Table 4. Positive
[GPH10001C(+)01A] and negative (IGX1A) control assays available from SABiosciences were also
included. All assays were run according to manufacturer’s recommendations.
4. Conclusions
The ChIP-chip-based transcriptional profiling of human aortic tissues demonstrated large differences
between the aneurysmal (AAA) and non-aneurysmal infrarenal human aorta. Most likely the TFs are not
acting alone, but changes in DNA architecture including histone modifications, invoke different
transcriptional responses [63,64]. In addition, TFs often bind in a combinatorial fashion, as revealed by
the ENCODE project [63], and it will, therefore, be important to consider co-operative binding of TFs
in future experiments. Furthermore, it is plausible to speculate that TFBSs harboring sequence variations
in humans could provide mechanisms in disease pathogenesis as has been shown for the sequence variant
located on chromosome 9p21 and associated with multiple forms of vascular diseases [64].
Supplementary Materials
Supplementary materials can be found at http://www.mdpi.com/1422-0067/16/05/11229/s1.

Int. J. Mol. Sci. 2015, 16 11254
Acknowledgments
This project was funded in part by a grant from the National Heart, Lung, and Blood Institute
(HL064310 to Helena Kuivaniemi), National Institutes of Health (NIH), and by Geisinger Health
System. John H. Lillvis. was a recipient of a Predoctoral Fellowship (AG030900) from the National
Institute on Aging, NIH.
Author Contributions
Conceived and designed the experiments: Matthew C. Pahl, Robert Erdman, Helena Kuivaniemi
and Gerard Tromp. Performed experiments: Matthew C. Pahl, Robert Erdman and Gerard Tromp.
Analyzed data: Matthew C. Pahl, Helena Kuivaniemi and Gerard Tromp. Contributed tissue samples:
John H. Lillvis and James R. Elmore. Wrote the manuscript: Matthew C. Pahl, Robert Erdman,
Helena Kuivaniemi, John H. Lillvis and James R. Elmore and Gerard Tromp.
Conflicts of Interest
The authors declare no conflict of interest.
References
1. Boddy, A.M.; Lenk, G.M.; Lillvis, J.H.; Nischan, J.; Kyo, Y.; Kuivaniemi, H. Basic research studies
to understand aneurysm disease. Drug News Perspect. 2008, 21, 142–148.
2. Kuivaniemi, H.; Tromp, G.; Carey, D.J.; Elmore, J.R. The molecular biology and genetics of
aneurysms. In Molecular and Translational Vascular Medicine; Homeister, J.W., Willis, M.S.,
Eds.; Springer Science + Business Media: New York, NY, USA, 2012; pp. 3–33.
3. Nischan, J.; Lenk, G.M.; Boddy, A.M.; Lillvis, J.H.; Tromp, G.; Kuivaniemi, H. Abdominal aortic
aneurysms—A complex genetic disease. In Aneurysms: Types, Risks, Formation and Treatment,
Laurent, A., Morel, E., Eds.; Nova Science Publishers, Inc.: Hauppage, NY, USA, 2010; pp. 35–93.
4. Weintraub, N.L. Understanding abdominal aortic aneurysm. N. Engl. J. Med. 2009, 361, 1114–1116.
5. Sakalihasan, N.; Limet, R.; Defawe, O.D. Abdominal aortic aneurysm. Lancet 2005, 365, 1577–1589.
6. Golledge, J.; Norman, P.E. Current status of medical management for abdominal aortic aneurysm.
Atherosclerosis 2011, 217, 57–63.
7. Lenk, G.M.; Tromp, G.; Weinsheimer, S.; Gatalica, Z.; Berguer, R.; Kuivaniemi, H. Whole genome
expression profiling reveals a significant role for immune function in human abdominal aortic
aneurysms. BMC Genomics 2007, 8, 237.
8. Nischan, J.; Gatalica, Z.; Curtis, M.; Lenk, G.M.; Tromp, G.; Kuivaniemi, H. Binding sites for ETS
family of transcription factors dominate the promoter regions of differentially expressed genes in
abdominal aortic aneurysms. Circ. Cardiovasc. Genet. 2009, 2, 565–572.
9. Vaquerizas, J.M.; Kummerfeld, S.K.; Teichmann, S.A.; Luscombe, N.M. A census of human
transcription factors: Function, expression and evolution. Nat. Rev. Genet. 2009, 10, 252–263.
10. Jolma, A.; Yan, J.; Whitington, T.; Toivonen, J.; Nitta, K.R.; Rastas, P.; Morgunova, E.; Enge, M.;
Taipale, M.; Wei, G.; et al. DNA-binding specificities of human transcription factors. Cell 2013,
152, 327–339.

Int. J. Mol. Sci. 2015, 16 11255
11. Levo, M.; Segal, E. In pursuit of design principles of regulatory sequences. Nat. Rev. Genet. 2014,
15, 453–468.
12. Degnan, B.M.; Degnan, S.M.; Naganuma, T.; Morse, D.E. The ets multigene family is conserved
throughout the Metazoa. Nucleic Acids Res. 1993, 21, 3479–3484.
13. Crepieux, P.; Coll, J.; Stehelin, D. The Ets family of proteins: weak modulators of gene expression
in quest for transcriptional partners. Crit. Rev. Oncog. 1994, 5, 615–638.
14. Hinterseher, I.; Erdman, R.; Donoso, L.A.; Vrabec, T.R.; Schworer, C.M.; Lillvis, J.H.; Boddy, A.M.;
Derr, K.; Golden, A.; Bowen, W.D.; et al. Role of complement cascade in abdominal aortic
aneurysms. Arterioscler. Thromb. Vasc. Biol. 2011, 31, 1653–1660.
15. Collins, A.; Littman, D.R.; Taniuchi, I. RUNX proteins in transcription factor networks that regulate
T-cell lineage choice. Nat. Rev. Immunol. 2009, 9, 106–115.
16. Lam, K.; Zhang, D.E. RUNX1 and RUNX1-ETO: Roles in hematopoiesis and leukemogenesis.
Front. Biosci. 2012, 17, 1120–1139.
17. Rhoades, K.L.; Hetherington, C.J.; Harakawa, N.; Yergeau, D.A.; Zhou, L.; Liu, L.Q.; Little, M.T.;
Tenen, D.G.; Zhang, D.E. Analysis of the role of AML1-ETO in leukemogenesis, using an inducible
transgenic mouse model. Blood 2000, 96, 2108–2115.
18. Yergeau, D.A.; Hetherington, C.J.; Wang, Q.; Zhang, P.; Sharpe, A.H.; Binder, M.; Marin-Padilla, M.;
Tenen, D.G.; Speck, N.A.; Zhang, D.E. Embryonic lethality and impairment of haematopoiesis in
mice heterozygous for an AML1-ETO fusion gene. Nat. Genet. 1997, 15, 303–306.
19. Falbo, K.B.; Shen, X. Function of the INO80 chromatin remodeling complex in DNA replication.
Front. Biosci. 2012, 17, 970–975.
20. Hennighausen, L.; Robinson, G.W. Interpretation of cytokine signaling through the transcription
factors STAT5A and STAT5B. Genes Dev. 2008, 22, 711–721.
21. Gerber, S.A.; Yatsula, B.; Maier, C.L.; Sadler, T.J.; Whittaker, L.W.; Pober, J.S. Interferon-γ
induces prolyl hydroxylase (PHD)3 through a STAT1-dependent mechanism in human endothelial
cells. Arterioscler. Thromb. Vasc. Biol. 2009, 29, 1363–1369.
22. Martinez, F.O.; Gordon, S.; Locati, M.; Mantovani, A. Transcriptional profiling of the human
monocyte-to-macrophage differentiation and polarization: new molecules and patterns of gene
expression. J. Immunol. 2006, 177, 7303–7311.
23. Hollenhorst, P.C.; Shah, A.A.; Hopkins, C.; Graves, B.J. Genome-wide analyses reveal properties
of redundant and specific promoter occupancy within the ETS gene family. Genes Dev. 2007, 21,
1882–1894.
24. Landry, J.R.; Kinston, S.; Knezevic, K.; Donaldson, I.J.; Green, A.R.; Gottgens, B. Fli1, Elf1,
and Ets1 regulate the proximal promoter of the LMO2 gene in endothelial cells. Blood 2005, 106,
2680–2687.
25. Birsoy, K.; Berry, R.; Wang, T.; Ceyhan, O.; Tavazoie, S.; Friedman, J.M.; Rodeheffer, M.S.
Analysis of gene networks in white adipose tissue development reveals a role for ETS2 in
adipogenesis. Development 2011, 138, 4709–4719.
26. Do, P.M.; Varanasi, L.; Fan, S.; Li, C.; Kubacka, I.; Newman, V.; Chauhan, K.; Daniels, S.R.;
Boccetta, M.; Garrett, M.R.; et al. Mutant p53 cooperates with ETS2 to promote etoposide
resistance. Genes Dev. 2012, 26, 830–845.

Int. J. Mol. Sci. 2015, 16 11256
27. Gefen, N.; Binder, V.; Zaliova, M.; Linka, Y.; Morrow, M.; Novosel, A.; Edry, L.; Hertzberg, L.;
Shomron, N.; Williams, O.; et al. Hsa-mir-125b-2 is highly expressed in childhood ETV6/RUNX1
(TEL/AML1) leukemias and confers survival advantage to growth inhibitory signals independent
of p53. Leukemia 2010, 24, 89–96.
28. Barrett, T.; Troup, D.B.; Wilhite, S.E.; Ledoux, P.; Rudnev, D.; Evangelista, C.; Kim, I.F.;
Soboleva, A.; Tomashevsky, M.; Edgar, R. NCBI GEO: Mining tens of millions of expression
profiles—Database and tools update. Nucleic Acids Res. 2007, 35, D760–D765.
29. National Center for Bioinformatics. Gene Expression Omnibus. Available online:
http://www.ncbi.nlm.nih.gov/geo/ (accessed on 15 May 2014).
30. SABiosciences Inc. SABiosciences, Subsidiary of QIAGEN Inc. Available online:
http://sabiosciences.com/RT2PCR.php (accessed on 20 June 2014).
31. Zhang, B. WebGestalt: Gene Set Analysis Toolkit. Available online:
http://bioinfo.vanderbilt.edu/webgestalt/ (accessed on 18 September 2014).
32. Duncan, D.T.; Prodduturi, N.; Zhang, B. WebGestalt2: An updated and expanded version of the
Web-based Gene Set Analysis Toolkit. BMC Bioinform. 2010, 11, P10.
33. Benjamini, Y.; Hochberg, J. Controlling the false discovery rate: a practical and powerful approach
to multiple testing. J. R. Stat. Soc. B 1995, 57, 289–300.
34. Gallant, S.; Gilkeson, G. ETS transcription factors and regulation of immunity. Arch. Immunol.
Ther. Exp. (Warsz) 2006, 54, 149–163.
35. Nottingham, W.T.; Jarratt, A.; Burgess, M.; Speck, C.L.; Cheng, J.F.; Prabhakar, S.; Rubin, E.M.;
Li, P.S.; Sloane-Stanley, J.; Kong, A.S.J.; et al. Runx1-mediated hematopoietic stem-cell
emergence is controlled by a Gata/Ets/SCL-regulated enhancer. Blood 2007, 110, 4188–4197.
36. Mahmud, S.A.; Manlove, L.S.; Farrar, M.A. Interleukin-2 and STAT5 in regulatory T cell
development and function. JAKSTAT 2013, 2, e23154.
37. Wu, G.; Chen, T.; Shahsafaei, A.; Hu, W.; Bronson, R.T.; Shi, G.P.; Halperin, J.A.; Aktas, H.; Qin, X.
Complement regulator CD59 protects against angiotensin II-induced abdominal aortic aneurysms
in mice. Circulation 2010, 121, 1338–1346.
38. Teng, C.H.; Huang, W.N.; Meng, T.C. Several dual specificity phosphatases coordinate to control
the magnitude and duration of JNK activation in signaling response to oxidative stress. J. Biol. Chem.
2007, 282, 28395–28407.
39. Miwa, K.; Nakashima, H.; Aoki, M.; Miyake, T.; Kawasaki, T.; Iwai, M.; Oishi, M.; Kataoka, K.;
Ohgi, S.; Ogihara, T.; et al. Inhibition of ets, an essential transcription factor for angiogenesis, to prevent
the development of abdominal aortic aneurysm in a rat model. Gene Ther. 2005, 12, 1109–1118.
40. Biros, E.; Moran, C.S.; Rush, C.M.; Gabel, G.; Schreurs, C.; Lindeman, J.H.; Walker, P.J.;
Nataatmadja, M.; West, M.; Holdt, L.M.; et al. Differential gene expression in the proximal neck
of human abdominal aortic aneurysm. Atherosclerosis 2014, 233, 211–218.
41. Smale, S.T. Transcriptional regulation in the immune system: A status report. Trends Immunol.
2014, 35, 190–194.
42. Handstad, T.; Rye, M.; Mocnik, R.; Drablos, F.; Saetrom, P. Cell-type specificity of ChIP-predicted
transcription factor binding sites. BMC Genomics 2012, 13, 372.

Int. J. Mol. Sci. 2015, 16 11257
43. Ehret, G.B.; Reichenbach, P.; Schindler, U.; Horvath, C.M.; Fritz, S.; Nabholz, M.; Bucher, P. DNA
binding specificity of different STAT proteins. Comparison of in vitro specificity with natural target
sites. J. Biol. Chem. 2001, 276, 6675–6688.
44. Wang, C.Y.; Petryniak, B.; Ho, I.C.; Thompson, C.B.; Leiden, J.M. Evolutionarily conserved Ets
family members display distinct DNA binding specificities. J. Exp. Med. 1992, 175, 1391–1399.
45. Bartfeld, D.; Shimon, L.; Couture, G.C.; Rabinovich, D.; Frolow, F.; Levanon, D.; Groner, Y.;
Shakked, Z. DNA recognition by the RUNX1 transcription factor is mediated by an allosteric
transition in the RUNT domain and by DNA bending. Structure 2002, 10, 1395–1407.
46. Todeschini, A.L.; Georges, A.; Veitia, R.A. Transcription factors: Specific DNA binding and
specific gene regulation. Trends Genet. 2014, 30, 211–219.
47. Savic, D.; Gertz, J.; Jain, P.; Cooper, G.M.; Myers, R.M. Mapping genome-wide transcription factor
binding sites in frozen tissues. Epigenet. Chromatin 2013, 6, 30.
48. Wu, G.; Yustein, J.T.; McCall, M.N.; Zilliox, M.; Irizarry, R.A.; Zeller, K.; Dang, C.V.; Ji, H.
ChIP-PED enhances the analysis of ChIP-seq and ChIP-chip data. Bioinformatics 2013, 29, 1182–1189.
49. Hinterseher, I.; Erdman, R.; Elmore, J.R.; Stahl, E.; Pahl, M.C.; Derr, K.; Golden, A.; Lillvis, J.H.;
Cindric, M.C.; Jackson, K.; et al. Novel pathways in the pathobiology of human abdominal aortic
aneurysms. Pathobiology 2013, 80, 1–10.
50. Lillvis, J.H.; Erdman, R.; Schworer, C.M.; Golden, A.; Derr, K.; Gatalica, Z.; Cox, L.A.; Shen, J.;
Vander Heide, R.S.; Lenk, G.M.; et al. Regional expression of HOXA4 along the aorta and its
potential role in human abdominal aortic aneurysms. BMC Physiol. 2011, 11, 9.
51. Pahl, M.C.; Derr, K.; Gäbel, G.; Hinterseher, I.; Elmore, J.R.; Schworer, C.M.; Peeler, T.C.;
Franklin, D.P.; Gray, J.L.; Carey, D.J.; et al. MicroRNA expression signature in human abdominal
aortic aneurysms. BMC Med. Genomics 2012, 5, 25.
52. Lillvis, J.H.; Kyo, Y.; Tromp, G.; Lenk, G.M.; Li, M.; Lu, Q.; Igo, R.P., Jr.; Sakalihasan, N.;
Ferrell, R.E.; Schworer, C.M.; et al. Analysis of positional candidate genes in the AAA1 susceptibility
locus for abdominal aortic aneurysms on chromosome 19. BMC Med. Genet. 2011, 12, 14.
53. Schroecksnadel, S.; Jenny, M.; Kurz, K.; Klein, A.; Ledochowski, M.; Uberall, F.; Fuchs, D.
LPS-induced NF-κB expression in THP-1Blue cells correlates with neopterin production and
activity of indoleamine 2,3-dioxygenase. Biochem. Biophys. Res. Commun. 2010, 399, 642–646.
54. Xiong, W.; Zhao, Y.; Prall, A.; Greiner, T.C.; Baxter, B.T. Key roles of CD4+ T cells and
IFN-γ in the development of abdominal aortic aneurysms in a murine model. J. Immunol. 2004,
172, 2607–2612.
55. Duftner, C.; Seiler, R.; Klein-Weigel, P.; Gobel, H.; Goldberger, C.; Ihling, C.; Fraedrich, G.;
Schirmer, M. High prevalence of circulating CD4+CD28− T-cells in patients with small abdominal
aortic aneurysms. Arterioscler. Thromb. Vasc. Biol. 2005, 25, 1347–1352.
56. Toedling, J.; Skylar, O.; Krueger, T.; Fischer, J.J.; Sperling, S.; Huber, W. Ringo—An
R/Bioconductor package for analyzing ChIP-chip readouts. BMC Bioinform. 2007, 8, 221.
57. Slater, G.S.; Birney, E. Automated generation of heuristics for biological sequence comparison.
BMC Bioinform. 2005, 6, 31.
58. Slater, G.S.; Birney, E. Exonerate, a Generic Tool for Sequence Alignment. Available online:
http://www.ebi.ac.uk/~guy/exonerate (accessed on 26 September 2014).

Int. J. Mol. Sci. 2015, 16 11258
59. Toedling, J.; Huber, W. Analyzing ChIP-chip data using bioconductor. PLoS Comput. Biol. 2008,
4, e1000227.
60. Kel, A.E.; Gossling, E.; Reuter, I.; Cheremushkin, E.; Kel-Margoulis, O.V.; Wingender, E.
MATCH: A tool for searching transcription factor binding sites in DNA sequences. Nucleic Acids Res.
2003, 31, 3576–3579.
61. Kanehisa, M.; Goto, S. KEGG: Kyoto encyclopedia of genes and genomes. Nucleic Acids Res. 2000,
28, 27–30.
62. R Development Core Team. R: A Language and Enviroment for Statistical Computing;
R Foundation for Statistical Computing: Vienna, Austria, 2010.
63. Gerstein, M.B.; Kundaje, A.; Hariharan, M.; Landt, S.G.; Yan, K.K.; Cheng, C.; Mu, X.J.; Khurana, E.;
Rozowsky, J.; Alexander, R.; et al. Architecture of the human regulatory network derived from
ENCODE data. Nature 2012, 489, 91–100.
64. Harismendy, O.; Notani, D.; Song, X.; Rahim, N.G.; Tanasa, B.; Heintzman, N.; Ren, B.; Fu, X.D.;
Topol, E.J.; Rosenfeld, M.G.; et al. 9p21 DNA variants associated with coronary artery disease
impair interferon-γ signalling response. Nature 2011, 470, 264–268.
© 2015 by the authors; licensee MDPI, Basel, Switzerland. This article is an open access article
distributed under the terms and conditions of the Creative Commons Attribution license
(http://creativecommons.org/licenses/by/4.0/).