tongue surface displacement during bilabial stops
TRANSCRIPT
Tongue surface displacement during bilabial stopsMario A. Svirsky,a) Kenneth N. Stevens, Melanie L. Matthies, Joyce Manzella,Joseph S. Perkell, and Reiner Wilhelms-TricaricoSpeech Communication Group, Research Laboratory of Electronics, Massachusetts Institute of Technology,Cambridge, Massachusetts 02139
~Received 21 November 1995; accepted for publication 20 March 1997!
The goals of this study were to characterize tongue surface displacement during production ofbilabial stops and to refine current estimates of vocal-tract wall impedance using directmeasurements of displacement in the vocal tract during closure. In addition, evidence was obtainedto test the competing claims of passive and active enlargement of the vocal tract during voicing.Tongue displacement was measured and tongue compliance was estimated in four subjects duringproduction of /aba/ and /apa/. All subjects showed more tongue displacement during /aba/ thanduring /apa/, even though peak intraoral pressure is lower for /aba/. In consequence, complianceestimates were much higher for /aba/, ranging from 5.1 to 8.531025 cm3/dyn. Compliance valuesfor /apa/ ranged from 0.8 to 2.331025 cm3/dyn for the tongue body, and 0.5231025 for the singletongue tip point that was measured. From combined analyses of tongue displacement and intraoralpressure waveforms for one subject, it was concluded that smaller tongue displacements for /p/ thanfor /b/ may be due to active stiffening of the tongue during /p/, or to intentional relaxation of tonguemuscles during /b/~in conjunction with active tongue displacement during /b/!. © 1997 AcousticalSociety of America.@S0001-4966~97!03407-3#
PACS numbers: 43.70.Aj, 43.70.Bk@AL #
eet ouricntd
rs
ayha
tivoeta
ottislsuae
a-ncyare
hes inescles
overa-of
es ofl
allses-
the
tospe-hised-lace-eofingf an
-er
INTRODUCTION
What happens inside the vocal tract when an obstrustop consonant is produced? Initially there is an increasintraoral pressure, which can result in outward movementhe vocal-tract walls. All stop sounds require this pressbuildup to achieve a burst when they are released, but voand unvoiced stops require different articulatory adjustmeIn particular, voiced stops require a transglottal pressureference to sustain glottal vibration~although it may not al-ways be sustained throughout closure!. Two main mecha-nisms have been proposed that may be used by speakemaintain this pressure difference: it may be done withactiveenlargement of the supraglottal vocal tract~Rothenberg,1968; Kent and Moll, 1969; McGowanet al., 1995!, and/orwith a relaxed state of supraglottal muscles~which results inpassivedeformation of the vocal tract; cf. Perkell, 1969!.Bell-Berti ~1974! proposed that pharyngeal cavity size mbe controlled with predominantly passive or active mecnisms by different speakers. Westbury~1983! pointed outthat while there was good reason to believe in an accomponent to facilitate voicing during a stop, the issueactive and passive contributions to vocal-tract enlargemwould be difficult to settle on the basis of kinematic daalone.
At the end of a vowel preceding an unvoiced stop, gltal vibration may be stopped quickly by spreading the glotperhaps in combination with stiffening the vocal-tract walFollowing release of the consonant, the intraoral pressdecreases and the walls are hypothesized to move inwwith a time constant that depends on their physical prop
a!Currently at the Department of Otolaryngology—Head and Neck SurgIndiana University School of Medicine, Indianapolis, IN 46202-5200.
562 J. Acoust. Soc. Am. 102 (1), July 1997 0001-4966/97/102(
ntinfeeds.if-
to
-
efnt
-,.rerdr-
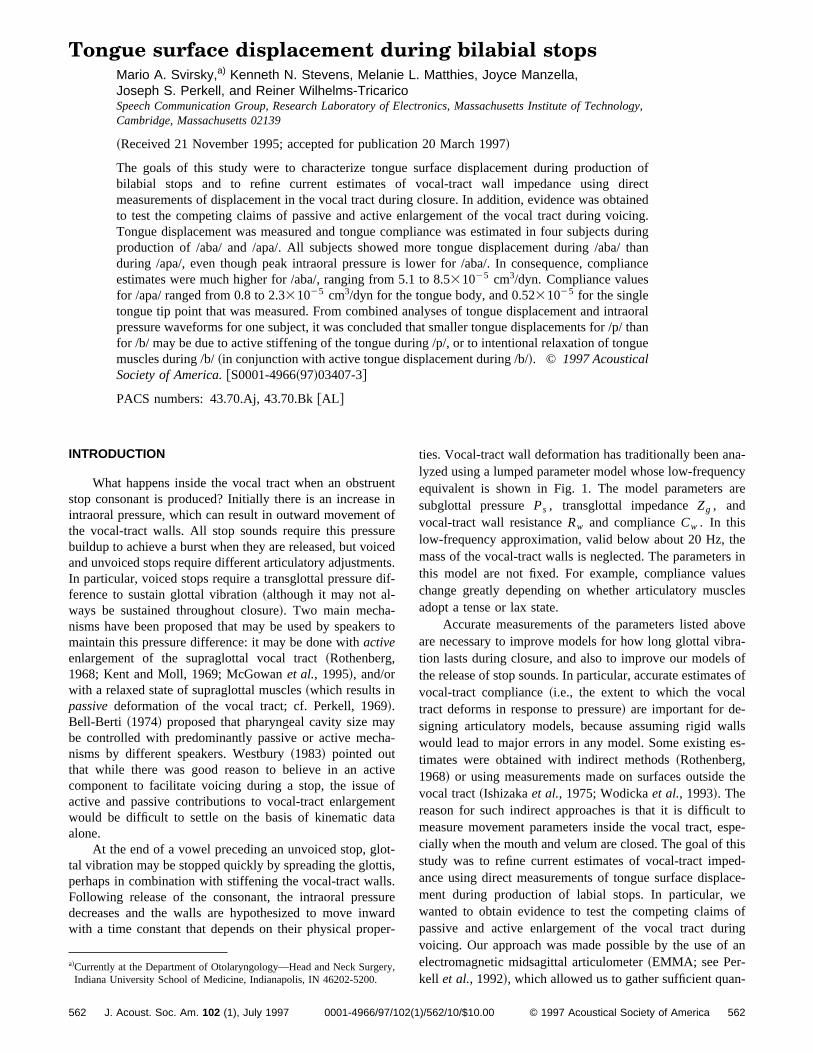
ties. Vocal-tract wall deformation has traditionally been anlyzed using a lumped parameter model whose low-frequeequivalent is shown in Fig. 1. The model parameterssubglottal pressurePs , transglottal impedanceZg , andvocal-tract wall resistanceRw and complianceCw . In thislow-frequency approximation, valid below about 20 Hz, tmass of the vocal-tract walls is neglected. The parameterthis model are not fixed. For example, compliance valuchange greatly depending on whether articulatory musadopt a tense or lax state.
Accurate measurements of the parameters listed abare necessary to improve models for how long glottal vibtion lasts during closure, and also to improve our modelsthe release of stop sounds. In particular, accurate estimatvocal-tract compliance~i.e., the extent to which the vocatract deforms in response to pressure! are important for de-signing articulatory models, because assuming rigid wwould lead to major errors in any model. Some existingtimates were obtained with indirect methods~Rothenberg,1968! or using measurements made on surfaces outsidevocal tract~Ishizakaet al., 1975; Wodickaet al., 1993!. Thereason for such indirect approaches is that it is difficultmeasure movement parameters inside the vocal tract, ecially when the mouth and velum are closed. The goal of tstudy was to refine current estimates of vocal-tract impance using direct measurements of tongue surface dispment during production of labial stops. In particular, wwanted to obtain evidence to test the competing claimspassive and active enlargement of the vocal tract durvoicing. Our approach was made possible by the use oelectromagnetic midsagittal articulometer~EMMA; see Per-kell et al., 1992!, which allowed us to gather sufficient quan
y,
5621)/562/10/$10.00 © 1997 Acoustical Society of America
bi
emndnaresexttea/
e-trhartr
m
t-tehomed
la
sao
mav
nt 1
ntove-ers
-
sedan
/a/,nala
lign-
ofithThence:icsts-gh-iod;str,theh
ablyaseves
alowasusal
re.gueeenre,lanesti-res-ringlnyat
bleiesos-oftion
g
e
tities of kinematic data from vocal-tract structures duringlabial closure.
I. METHODS
The subjects were four young adult males. Two of th~S1 and S2! were native speakers of American English athe other two~S3 and S4! were native speakers of Ewe, aAfrican language. Both English and Ewe voiced stopstypically produced with glottal vibration, at least at the bginning of the segment, when they are in intervocalic potion. The productions from these four subjects were noception, and the /b/ segments frequently showed glovibration throughout the entire closure. Subjects read at lten repetitions each of three utterances: /apa/ and /aba~inwhich we were primarily interested!, and /ama/~included asa control condition!. We expected to find minimal pressurinduced tongue surface displacement in the /ama/ concondition, because during the production of /m/ the velopryngeal port is open so intraoral pressure remains low, pcluding any passive tongue deformation. We used an elecmagnetic midsagittal articulometer~EMMA: cf. Perkellet al., 1992! to measure displacement of the tongue dorsuA small transducer coil~4 mm by 4 mm base, 2.5 mmheight! was fixed to the tongue surface~between 4 and 6 cmfrom the tongue tip! with a biocompatible cement. Alternaing magnetic fields generated by a three-transmitter sysinduce an alternating voltage in the transducer coil. Ttransduced voltages from the tongue coil, as well as frtwo other coils placed on the upper incisors and the bridgthe nose for fixed reference points, were low-pass filtere100 Hz and digitized at 312.5 samples per s,~sps!. SubjectS4 had an additional transducer attached to the tongue bapproximately 1 cm from the tip.
With subject S2, a Glottal Enterprises differential presure transducer was used to simultaneously measure intrpressure~re: atmospheric pressure!. The transducer wascoupled to the oral cavity via a plastic~polyethylene! probetube approximately 10 cm in length and with an inner diaeter of 0.2 cm. The pressure measurements were calibrusing a U-tube manometer and were found to be linear othe pressure range of interest~0–24 cm H2O!.
The acoustic signal was recorded through a directiomicrophone, low-pass filtered at 4.8 kHz and sampled akHz. After digitizing the acoustic, movement, and~in S2’s
FIG. 1. Lumped parameter circuit model of the supraglottal cavity durinstop consonant.Zg represents transglottal resistance;Ps is subglottal pres-sure;Rw andCw are vocal-tract wall resistance and compliance; andUw
represents airflow. Vocal-tract wall mass is neglected at very low frequcies. Release of the stop is represented by the closure of the switch.
563 J. Acoust. Soc. Am., Vol. 102, No. 1, July 1997
-
e-i--alst
ol-e-o-
.
me
ofat
de,
-ral
-teder
al0
case! pressure data, the signals were demultiplexed iseparate, time-aligned signal streams. The digitized moment data were then low-pass filtered with 71-tap FIR filt~cutoff frequency about 150 Hz!, and converted tox,y coor-dinates with reference to anx axis which lies in the midsagittal plane, and is parallel to the subject’s occlusal plane.
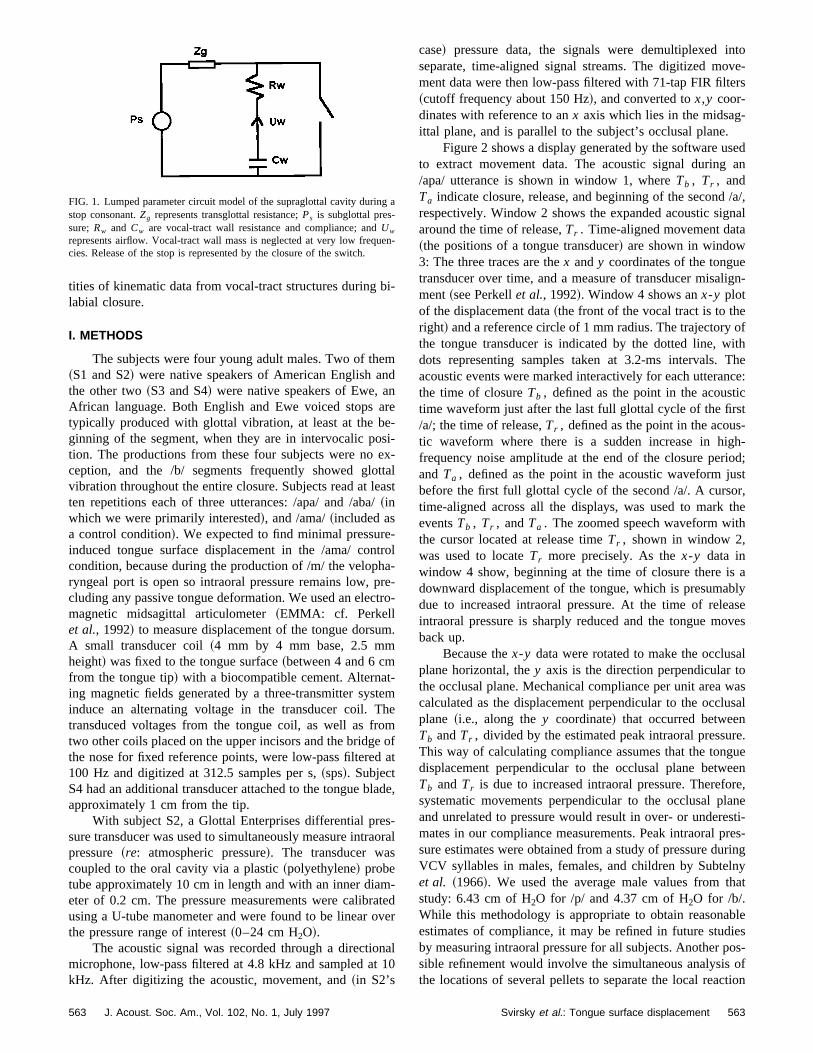
Figure 2 shows a display generated by the software uto extract movement data. The acoustic signal during/apa/ utterance is shown in window 1, whereTb , Tr , andTa indicate closure, release, and beginning of the secondrespectively. Window 2 shows the expanded acoustic sigaround the time of release,Tr . Time-aligned movement dat~the positions of a tongue transducer! are shown in window3: The three traces are thex andy coordinates of the tonguetransducer over time, and a measure of transducer misament~see Perkellet al., 1992!. Window 4 shows anx-y plotof the displacement data~the front of the vocal tract is to theright! and a reference circle of 1 mm radius. The trajectorythe tongue transducer is indicated by the dotted line, wdots representing samples taken at 3.2-ms intervals.acoustic events were marked interactively for each utterathe time of closureTb , defined as the point in the acousttime waveform just after the last full glottal cycle of the fir/a/; the time of release,Tr , defined as the point in the acoutic waveform where there is a sudden increase in hifrequency noise amplitude at the end of the closure perandTa , defined as the point in the acoustic waveform jubefore the first full glottal cycle of the second /a/. A cursotime-aligned across all the displays, was used to markeventsTb , Tr , andTa . The zoomed speech waveform witthe cursor located at release timeTr , shown in window 2,was used to locateTr more precisely. As thex-y data inwindow 4 show, beginning at the time of closure there isdownward displacement of the tongue, which is presumadue to increased intraoral pressure. At the time of releintraoral pressure is sharply reduced and the tongue moback up.
Because thex-y data were rotated to make the occlusplane horizontal, they axis is the direction perpendicular tthe occlusal plane. Mechanical compliance per unit areacalculated as the displacement perpendicular to the occlplane ~i.e., along they coordinate! that occurred betweenTb andTr , divided by the estimated peak intraoral pressuThis way of calculating compliance assumes that the tondisplacement perpendicular to the occlusal plane betwTb andTr is due to increased intraoral pressure. Therefosystematic movements perpendicular to the occlusal pand unrelated to pressure would result in over- or underemates in our compliance measurements. Peak intraoral psure estimates were obtained from a study of pressure duVCV syllables in males, females, and children by Subteet al. ~1966!. We used the average male values from thstudy: 6.43 cm of H2O for /p/ and 4.37 cm of H2O for /b/.While this methodology is appropriate to obtain reasonaestimates of compliance, it may be refined in future studby measuring intraoral pressure for all subjects. Another psible refinement would involve the simultaneous analysisthe locations of several pellets to separate the local reac
a
n-
563Svirsky et al.: Tongue surface displacement
icc
uncedarts.
FIG. 2. Display used to extract movement data. Window 1 shows the speech signal for one /aba/ token. Three points are marked:Tb , the beginning of closure,defined as the point in the acoustic time waveform just after the last full glottal cycle of the first /a/; the time of release,Tr , defined as the point in the acoustwaveform where there is a sudden increase in high-frequency noise amplitude at the end of the closure period; andTa defined as the point in the acoustiwaveform just before the first full glottal cycle of the second /a/. Window 2 shows the expanded acoustic signal aroundTr . Time axis values are in s. Notethe weak periodicity beforeTr and the release noise immediately followingTr . Time-aligned movement data are shown in window 3:x andy coordinatesof the tongue transducer~in dm!, and a measure of transducer misalignment correction~see Perkellet al., 1992!. Window 4 shows anx-y plot of the samedata, with the occlusal plane being parallel to thex axis and the front of the vocal tract placed to the right. The tongue surface starts a more pronodownward displacement at closure timeTb , it reverses its movement direction at release timeTr , and remains relatively steady after the second vowel stat Ta . A 1-mm circle is displayed as a reference, and the two horizontal lines to the right of thex-y data indicate measured displacement for this token
ne
uguthtelselceb
ayho
endh
nref t
oc
s,tion
ofdure
theond-angnear
hes ac--
Eq.
rtlyq.
to pressure on the tongue surface from the global compoof tongue deformation.
The pressure and movement signals obtained from sject S2 were used to assess the validity of a passive tondisplacement model. If tongue displacements during closwere mostly passive and driven by intraoral pressure,displacement trace should lag pressure by a small time inval ~determined by the impedance of the vocal-tract wal!.On the other hand, if vocal-tract expansion was activdriven, displacement and pressure signals would not nesarily be time synchronized. We assessed the synchronytween pressure and displacement waveforms in two wFirst, we found the time difference corresponding to tmaximum of the correlation function between each pairpressure and displacement signals~holding one signal fixedand applying variable time shifts to the other signal!. Second,we determined the relative positions of the most prominpeak in the~smoothed! first derivatives of each pressure andisplacement signal. These peaks indicate the instants weach signal is changing at a maximum rate.
We also assessed the pressure-displacement relatioapplying two kinds of mathematical models to the pressudisplacement data. First we used a second-order model oform
Pressure5md2y
dt21b
dy
dt1ky, ~1!
wherey is vocal-tract displacement perpendicular to the
564 J. Acoust. Soc. Am., Vol. 102, No. 1, July 1997
nt
b-uereer-
ys-e-s.ef
t
en
by-he
-
clusal plane andm, b, andk are constants representing masdamping, and stiffness per unit area, respectively. Equa~1! can be discretized and rewritten as:
Pressure~n!5a0y~n!1a1y~n21!1a2y~n22! ~2!
for the purpose of fitting discrete-time signals. For eachthe ten /aba/ and ten /apa/ tokens, a least-squares procewas applied to obtain values ofa1 , that minimized the dif-ference between predicted and actual displacement. Toextent that tongue displacement is passive and the secorder model in Eq.~2! is accurate, this model should givegood prediction of displacement as a function of the drivipressure. The other model that we used incorporated a litrend, in addition to the parameters of the first model:
Pressure~n!1a3n1a45a0y~n!1a1y~n21!
1a2y~n22!. ~3!
The left side of the equation now includes, in addition to tmeasured intraoral pressure, a linear term that representtive expansion of the vocal tract~i.e., downward tongue displacement!. If vocal-tract expansion was passive, Eq.~2!would give good predictions of tongue displacement, and~3! would not yield substantially better fits than Eq.~2!. Onthe other hand, if vocal-tract expansion was at least paactive, Eq.~3! should provide better fits to the data than E~2! and the estimated values ofa3 should be positive, indi-cating that downward~rather than upward! displacement of
564Svirsky et al.: Tongue surface displacement
t
an
t/
aifiis
ce-ec-isra-isesisttalttalonsba/rp,/ orure.ss-t foringms.edaba/a
rsthiss inim-dis-andForise
re-
ed2.1c-entced
ract
odic-tteddelthetheictsnd,eer-
dis-the
gothan
fo
coe
the vocal tract is taking place and that this displacemenunrelated to intraoral pressure.
II. RESULTS
A. Tongue displacement and estimated compliance
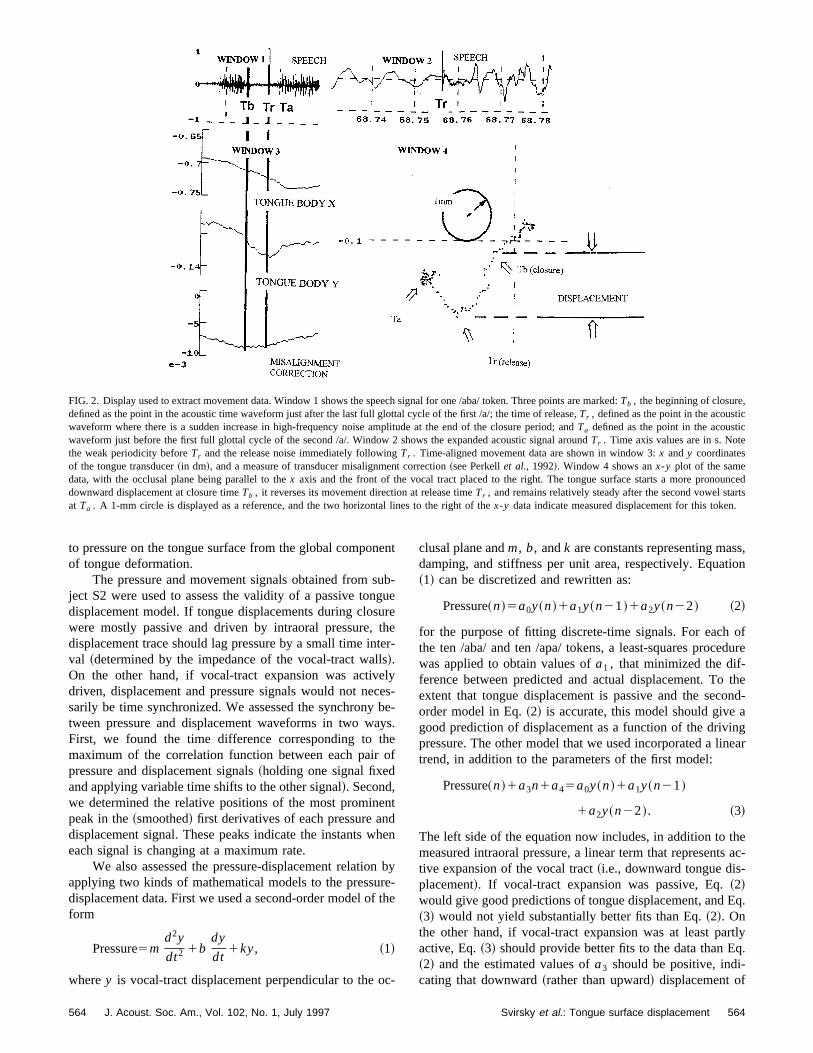
Figure 3 shows plots of mean tongue displacementstandard error values for each token, subject, and~in S4’scase! each tongue transducer. A series oft-tests revealed thain all cases, the magnitude of peak displacement for /aba~inthe direction perpendicular to the occlusal plane! was signifi-cantly higher than for /apa/, and significantly higher for /apthan for /ama/. Displacements during /ama/ were not signcantly different from zero. Table I shows average peak dplacements and the compliances associated with them.
FIG. 3. Mean tongue displacement and standard errors for each catesubject, and~in S4’s case! each tongue transducer. Transducers are intongue body for all subjects and, in S4’s case, there is an additional trducer near the tongue tip.
TABLE I. Average displacement perpendicular to the occlusal planeeach subject, token type and~for subject S4! transducer location. All num-bers are the mean from ten measurements. The two bottom rows listpliance values calculated based on the displacements that appear in ththree rows.
S1 S2 S3S4
~tongue body!S4
~tongue tip!
ama 0.13 20.07 0.01 0.39 20.32displacement~mm! apa 0.95 1.30 0.52 1.48 0.33
aba 2.89 2.20 2.53 3.64 2.53
Compliance apa 1.51 2.06 0.82 2.35 0.52(cm3/dyn)~all numbers are31025!
aba 6.74 5.13 5.90 8.49 5.90
565 J. Acoust. Soc. Am., Vol. 102, No. 1, July 1997
is
d
/--
B. Synchrony between intraoral pressure and tonguedisplacement
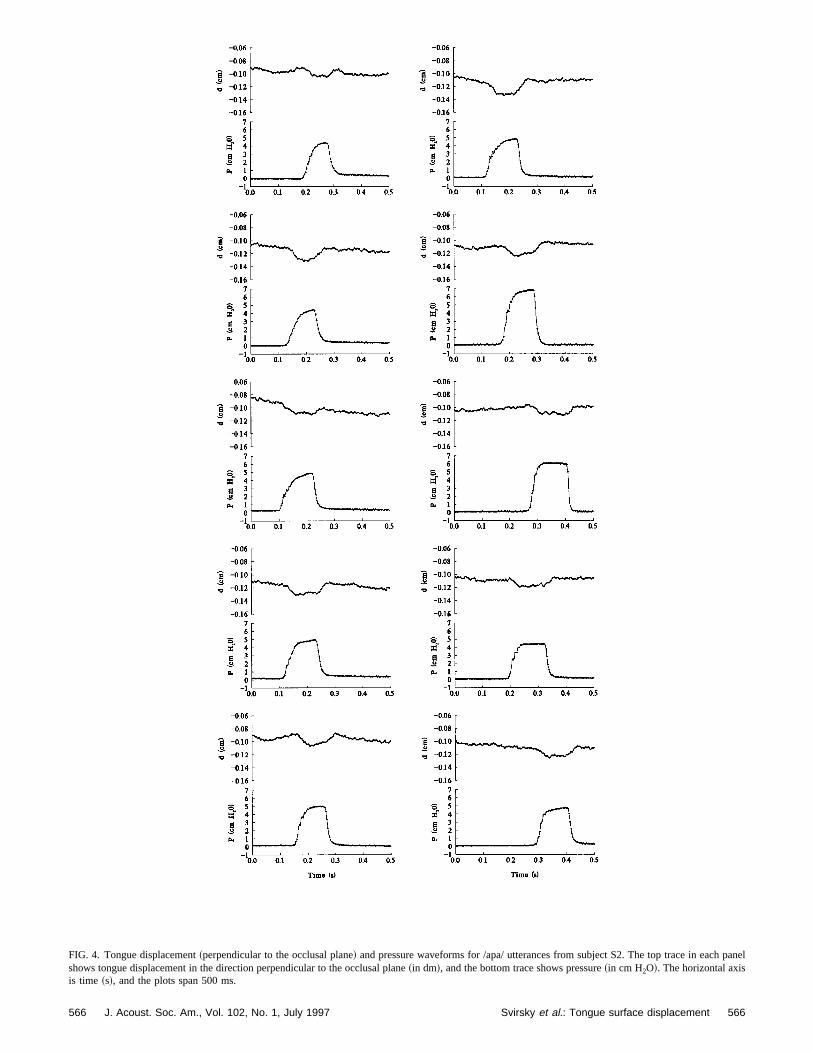
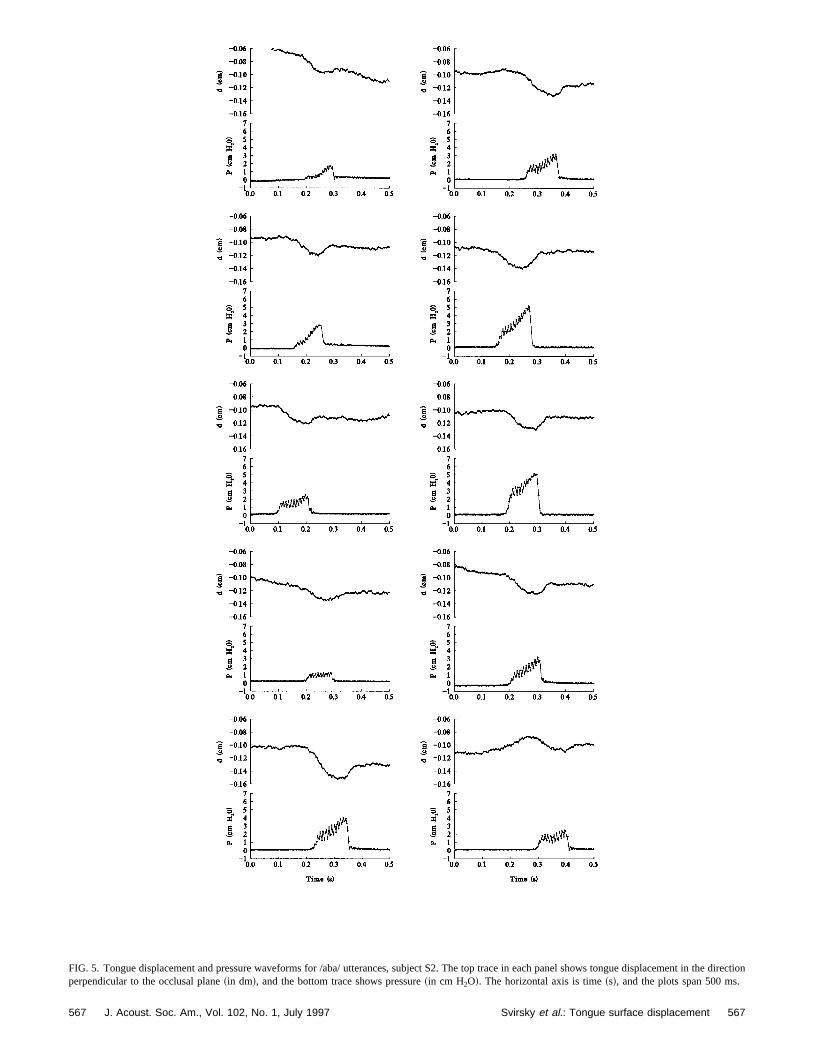
Figures 4 and 5 show intraoral pressure and displament over time for S2, for /apa/ and /aba/ tokens, resptively. Intraoral pressure rises rapidly during /apa/, whichconsistent with oral closure and the open glottal configution necessary to stop voicing. Pressure during /aba/ rmore slowly, with lower values at the time of release. Thresult is consistent with the need to maintain a transglopressure difference that is compatible with continued glovibration ~the pressure traces do indeed show fluctuatidue to glottal vibration almost through the end of most /atokens!. It is interesting to observe that the relatively shafast downward tongue dorsum displacements during /apa/aba/ were generally close to the rise in intraoral pressConsistent with this observation, maxima of the crocorrelation functions between pressure and displacemenall /apa/ tokens were obtained, with displacement laggpressure by a mean of 1.3 ms and a standard error of 1.0In other words, the cross-correlation function is maximizwhen pressure is delayed by about 1.3 ms. Results for /were qualitatively similar, with a mean lag of 5.4 ms andstandard error of 1.9 ms.
We also compared the timing of the peaks of the fiderivative for the pressure and displacement traces. Tcomparison indicates the timing between rapid changethe two signals. The comparison was made both for the ting between pressure increase and downward tongueplacement, and for the timing between pressure releasethe concomitant upward displacement of the tongue./apa/, the maximum of the first derivative of the pressure rpreceded the one for displacement by 10.0 ms~standard er-ror: 1.2 ms! and the maximum for the pressure decrease pceded the one for displacement by 8.2 ms~standard error: 0.9ms!. First derivative maxima for displacement traces showlonger lags for /aba/: 18.2 ms for the pressure rise and 1ms for the release~standard errors of 1.4 and 2.7 ms, respetively!. Longer lags for /aba/ than for /apa/ are consistwith the greater compliance measured during the voistop, since~according to the model depicted in Fig. 1! thedisplacement time constants are the product of vocal-twall resistance and compliance.
C. Modeling tongue displacement
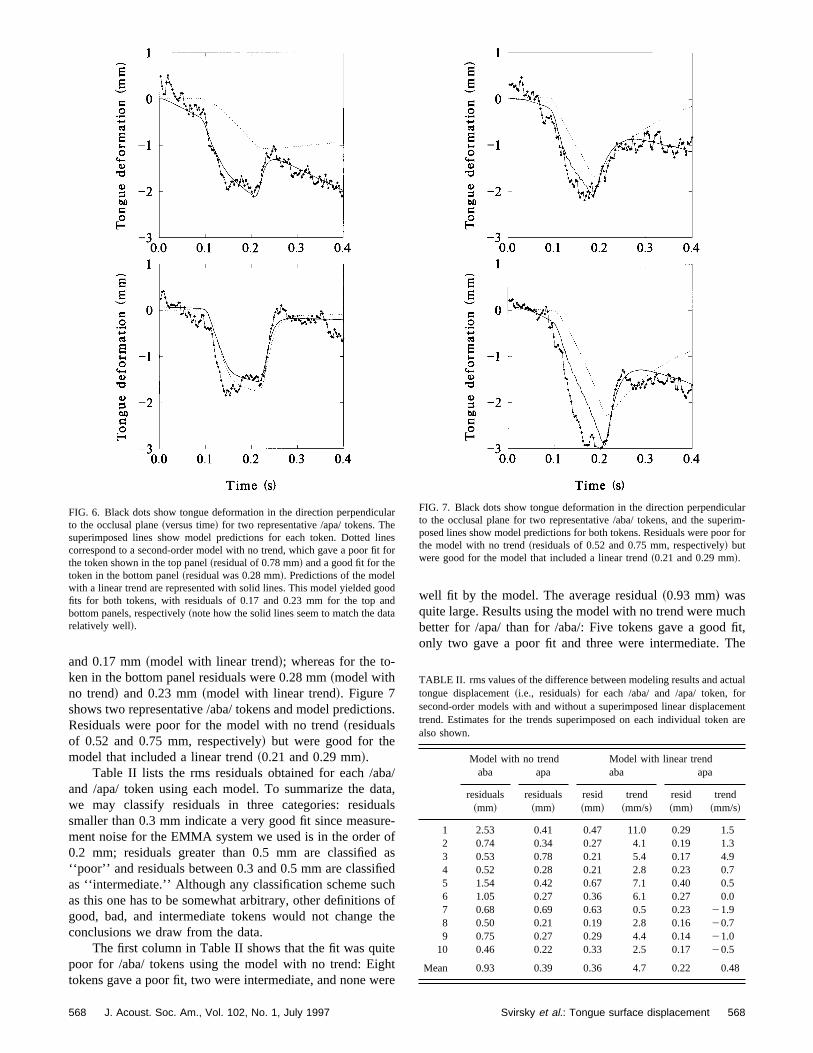
Figure 6 shows vertical tongue displacement for twrepresentative /apa/ tokens, as well as the two model pretions for each token. Connected dots show actual data; dolines are the predictions made by the second-order mowith no trend, and the solid lines are predictions made bymodel that includes a linear trend. Visual examination oftop panel reveals that the model with a linear trend preddisplacement much better than the model with no trewhile both models provide similarly good predictions for thtoken in the bottom panel. One way to quantify this obsvation is to calculate the rms of the residuals~i.e., the rms ofthe difference between model predictions and actualplacement! for each token and each model. Residuals fortoken in the top panel were 0.78 mm~model with no trend!
ry,es-
r
m-first
565Svirsky et al.: Tongue surface displacement
panel
FIG. 4. Tongue displacement~perpendicular to the occlusal plane! and pressure waveforms for /apa/ utterances from subject S2. The top trace in eachshows tongue displacement in the direction perpendicular to the occlusal plane~in dm!, and the bottom trace shows pressure~in cm H2O!. The horizontal axisis time ~s!, and the plots span 500 ms.566 566J. Acoust. Soc. Am., Vol. 102, No. 1, July 1997 Svirsky et al.: Tongue surface displacement
the direction
FIG. 5. Tongue displacement and pressure waveforms for /aba/ utterances, subject S2. The top trace in each panel shows tongue displacement inperpendicular to the occlusal plane~in dm!, and the bottom trace shows pressure~in cm H2O!. The horizontal axis is time~s!, and the plots span 500 ms.567 567J. Acoust. Soc. Am., Vol. 102, No. 1, July 1997 Svirsky et al.: Tongue surface displacement
on
baaaro
ecsth
itehe
uchfit,he
ulaelint f
loonta
ularerim-r for
tualrmentare
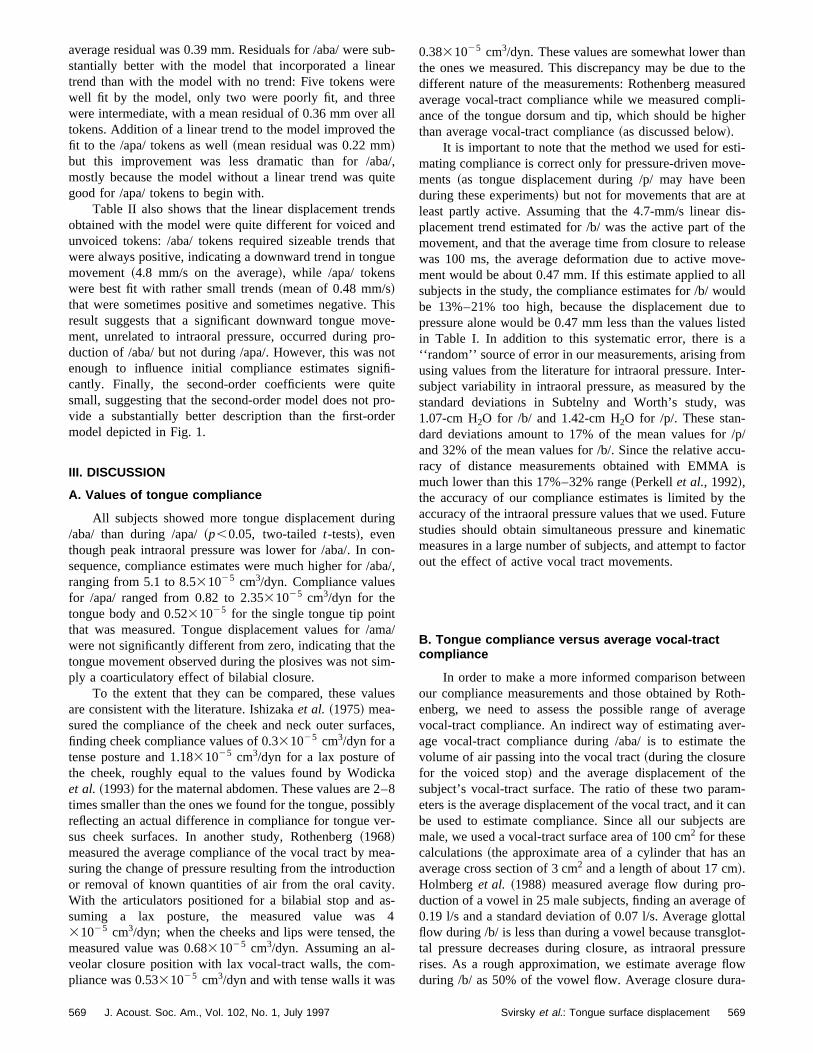
and 0.17 mm~model with linear trend!; whereas for the to-ken in the bottom panel residuals were 0.28 mm~model withno trend! and 0.23 mm~model with linear trend!. Figure 7shows two representative /aba/ tokens and model predictiResiduals were poor for the model with no trend~residualsof 0.52 and 0.75 mm, respectively! but were good for themodel that included a linear trend~0.21 and 0.29 mm!.
Table II lists the rms residuals obtained for each /aand /apa/ token using each model. To summarize the dwe may classify residuals in three categories: residusmaller than 0.3 mm indicate a very good fit since measument noise for the EMMA system we used is in the order0.2 mm; residuals greater than 0.5 mm are classified‘‘poor’’ and residuals between 0.3 and 0.5 mm are classifias ‘‘intermediate.’’ Although any classification scheme suas this one has to be somewhat arbitrary, other definitiongood, bad, and intermediate tokens would not changeconclusions we draw from the data.
The first column in Table II shows that the fit was qupoor for /aba/ tokens using the model with no trend: Eigtokens gave a poor fit, two were intermediate, and none w
FIG. 6. Black dots show tongue deformation in the direction perpendicto the occlusal plane~versus time! for two representative /apa/ tokens. Thsuperimposed lines show model predictions for each token. Dottedcorrespond to a second-order model with no trend, which gave a poor fithe token shown in the top panel~residual of 0.78 mm! and a good fit for thetoken in the bottom panel~residual was 0.28 mm!. Predictions of the modewith a linear trend are represented with solid lines. This model yielded gfits for both tokens, with residuals of 0.17 and 0.23 mm for the top abottom panels, respectively~note how the solid lines seem to match the darelatively well!.
568 J. Acoust. Soc. Am., Vol. 102, No. 1, July 1997
s.
/ta,lse-fasdhofe
tre
well fit by the model. The average residual~0.93 mm! wasquite large. Results using the model with no trend were mbetter for /apa/ than for /aba/: Five tokens gave a goodonly two gave a poor fit and three were intermediate. T
r
esor
dd
FIG. 7. Black dots show tongue deformation in the direction perpendicto the occlusal plane for two representative /aba/ tokens, and the supposed lines show model predictions for both tokens. Residuals were poothe model with no trend~residuals of 0.52 and 0.75 mm, respectively! butwere good for the model that included a linear trend~0.21 and 0.29 mm!.
TABLE II. rms values of the difference between modeling results and actongue displacement~i.e., residuals! for each /aba/ and /apa/ token, fosecond-order models with and without a superimposed linear displacetrend. Estimates for the trends superimposed on each individual tokenalso shown.
Model with no trend Model with linear trendaba apa aba apa
residuals~mm!
residuals~mm!
resid~mm!
trend~mm/s!
resid~mm!
trend~mm/s!
1 2.53 0.41 0.47 11.0 0.29 1.52 0.74 0.34 0.27 4.1 0.19 1.33 0.53 0.78 0.21 5.4 0.17 4.94 0.52 0.28 0.21 2.8 0.23 0.75 1.54 0.42 0.67 7.1 0.40 0.56 1.05 0.27 0.36 6.1 0.27 0.07 0.68 0.69 0.63 0.5 0.23 21.98 0.50 0.21 0.19 2.8 0.16 20.79 0.75 0.27 0.29 4.4 0.14 21.010 0.46 0.22 0.33 2.5 0.17 20.5
Mean 0.93 0.39 0.36 4.7 0.22 0.48
568Svirsky et al.: Tongue surface displacement
suareeahe
aui
ndndthu
Thvrnoifiitpde
in
onb
tmesim
lu
c
k–iber
etioy.s
th
s
antheuredpli-her
ti-ve-entis-theaseve-allulde tostedamer-theas
/p/cu-is
thetureaticctor
enoth-rager-the
hem-canare
an
-ofttallot-sureowra-
average residual was 0.39 mm. Residuals for /aba/ werestantially better with the model that incorporated a linetrend than with the model with no trend: Five tokens wewell fit by the model, only two were poorly fit, and threwere intermediate, with a mean residual of 0.36 mm overtokens. Addition of a linear trend to the model improved tfit to the /apa/ tokens as well~mean residual was 0.22 mm!but this improvement was less dramatic than for /abmostly because the model without a linear trend was qgood for /apa/ tokens to begin with.
Table II also shows that the linear displacement treobtained with the model were quite different for voiced aunvoiced tokens: /aba/ tokens required sizeable trendswere always positive, indicating a downward trend in tongmovement~4.8 mm/s on the average!, while /apa/ tokenswere best fit with rather small trends~mean of 0.48 mm/s!that were sometimes positive and sometimes negative.result suggests that a significant downward tongue moment, unrelated to intraoral pressure, occurred during pduction of /aba/ but not during /apa/. However, this wasenough to influence initial compliance estimates signcantly. Finally, the second-order coefficients were qusmall, suggesting that the second-order model does notvide a substantially better description than the first-ormodel depicted in Fig. 1.
III. DISCUSSION
A. Values of tongue compliance
All subjects showed more tongue displacement dur/aba/ than during /apa/~p,0.05, two-tailedt-tests!, eventhough peak intraoral pressure was lower for /aba/. In csequence, compliance estimates were much higher for /aranging from 5.1 to 8.531025 cm3/dyn. Compliance valuesfor /apa/ ranged from 0.82 to 2.3531025 cm3/dyn for thetongue body and 0.5231025 for the single tongue tip pointhat was measured. Tongue displacement values for /awere not significantly different from zero, indicating that thtongue movement observed during the plosives was notply a coarticulatory effect of bilabial closure.
To the extent that they can be compared, these vaare consistent with the literature. Ishizakaet al. ~1975! mea-sured the compliance of the cheek and neck outer surfafinding cheek compliance values of 0.331025 cm3/dyn for atense posture and 1.1831025 cm3/dyn for a lax posture ofthe cheek, roughly equal to the values found by Wodicet al. ~1993! for the maternal abdomen. These values are 2times smaller than the ones we found for the tongue, possreflecting an actual difference in compliance for tongue vsus cheek surfaces. In another study, Rothenberg~1968!measured the average compliance of the vocal tract by msuring the change of pressure resulting from the introducor removal of known quantities of air from the oral cavitWith the articulators positioned for a bilabial stop and asuming a lax posture, the measured value was31025 cm3/dyn; when the cheeks and lips were tensed,measured value was 0.6831025 cm3/dyn. Assuming an al-veolar closure position with lax vocal-tract walls, the compliance was 0.5331025 cm3/dyn and with tense walls it wa
569 J. Acoust. Soc. Am., Vol. 102, No. 1, July 1997
b-r
ll
/,te
s
ate
ise-o-t-ero-r
g
-a/,
a/
-
es
es,
a8ly-
a-n
-4e
-
0.3831025 cm3/dyn. These values are somewhat lower ththe ones we measured. This discrepancy may be due todifferent nature of the measurements: Rothenberg measaverage vocal-tract compliance while we measured comance of the tongue dorsum and tip, which should be higthan average vocal-tract compliance~as discussed below!.
It is important to note that the method we used for esmating compliance is correct only for pressure-driven moments ~as tongue displacement during /p/ may have beduring these experiments! but not for movements that are aleast partly active. Assuming that the 4.7-mm/s linear dplacement trend estimated for /b/ was the active part ofmovement, and that the average time from closure to relewas 100 ms, the average deformation due to active moment would be about 0.47 mm. If this estimate applied tosubjects in the study, the compliance estimates for /b/ wobe 13%–21% too high, because the displacement dupressure alone would be 0.47 mm less than the values liin Table I. In addition to this systematic error, there is‘‘random’’ source of error in our measurements, arising frousing values from the literature for intraoral pressure. Intsubject variability in intraoral pressure, as measured bystandard deviations in Subtelny and Worth’s study, w1.07-cm H2O for /b/ and 1.42-cm H2O for /p/. These stan-dard deviations amount to 17% of the mean values forand 32% of the mean values for /b/. Since the relative acracy of distance measurements obtained with EMMAmuch lower than this 17%–32% range~Perkellet al., 1992!,the accuracy of our compliance estimates is limited byaccuracy of the intraoral pressure values that we used. Fustudies should obtain simultaneous pressure and kinemmeasures in a large number of subjects, and attempt to faout the effect of active vocal tract movements.
B. Tongue compliance versus average vocal-tractcompliance
In order to make a more informed comparison betweour compliance measurements and those obtained by Renberg, we need to assess the possible range of avevocal-tract compliance. An indirect way of estimating aveage vocal-tract compliance during /aba/ is to estimatevolume of air passing into the vocal tract~during the closurefor the voiced stop! and the average displacement of tsubject’s vocal-tract surface. The ratio of these two paraeters is the average displacement of the vocal tract, and itbe used to estimate compliance. Since all our subjectsmale, we used a vocal-tract surface area of 100 cm2 for thesecalculations~the approximate area of a cylinder that hasaverage cross section of 3 cm2 and a length of about 17 cm!.Holmberget al. ~1988! measured average flow during production of a vowel in 25 male subjects, finding an average0.19 l/s and a standard deviation of 0.07 l/s. Average gloflow during /b/ is less than during a vowel because transgtal pressure decreases during closure, as intraoral presrises. As a rough approximation, we estimate average flduring /b/ as 50% of the vowel flow. Average closure du
569Svirsky et al.: Tongue surface displacement
. Idu
a-
4ndn
4foo
ope
sing
suexr
e
inhecu
eees
in
rohise
d
mo
taesrd
tentbuttoin-
hemthesyn-t isa/n aare
m/s.son-n aareragetan-res-ilarentde-er-ingleofbi-oredpli-
ithedcal-ce-ofof
re
li-
s.
d
rs in
nal
tion during /b/ was approximately 100 ms for our subjectsconsequence, the amount of air entering the vocal tracting /b/ is estimated as
volume50.19 l/s30.530.1 s50.0095 l59.5 cm3.
In a vocal tract with 100-cm2 surface, the average deformtion would be 9.5 cm3/100 cm250.095 cm50.95 mm.
Assuming a peak pressure of 5-cm H2O for /b/, the re-sulting average compliance during /b/ is 1.931025 cm3/dyn, consistent with Rothenberg’s values abetween 2.6 and 4.4 times lower than our tongue compliavalues. Even if we use very conservative values~0.3 l/s, thehighest flow measured by Holmberget al. among 25 sub-jects; /b/ duration of 150 instead of 100 ms!, the resultingestimate of average vocal-tract compliance would be31025 cm3/dyn, lower than any of our measured valuesthe tongue. We conclude that compliance of the tongue dsum ~at least during production of /b/! is quite probablyhigher than for the rest of the vocal tract.
C. Passive displacement or active expansion?
Cineradiographic studies have found that voiced stare produced with a larger supraglottal volume than thvoiceless cognates~Kent and Moll, 1969; Perkell, 1969!.Perkell proposed that this difference may be due to pasexpansion permitted by more lax vocal-tract walls duriproduction of the voiced consonant~at least for alveolars!.Kent and Moll preferred the explanation that the largerpraglottal volume during voiced stops was due to activepansion of the vocal tract. In a study that modeled the aedynamic data obtained by Lo¨fqvist et al. ~1995!, McGowanet al. ~1995! found support for the hypothesis of active uppvocal-tract volume control. Rothenberg~1968! estimated that‘‘in bilabial and retroflexed closures the@supraglottal# cavitycan be used to absorb the glottal air flow to maintain voicduring a reasonably long articulatory closure,’’ butthought this explanation was less plausible for some ocrences of voiced alveolar stops. Bell-Berti~1974! found thatspeakers use different mechanisms to allow pharyngealpansion during utterance-medial voiced stops. It is inddifficult to select one of the two explanations without acceto appropriate experimental data. Westbury~1993! correctlyindicated that ‘‘it is at least difficult, if not impossible@...# todifferentiate changes in vocal-tract dimensions resultfrom vocal-tract expansion and cavity enlargement’’~i.e.,passive or active expansion! using only kinematic data.
However, we believe our combined kinematic and aedynamic data from subject S2 may help shed light on tissue, suggesting that tongue deformation may be pasand pressure driven for /apa/ and that active vocal-tractpansion is superimposed on the passive, pressure drivenformation for /aba/. The present data confirm that theremore vocal-tract expansion during /b/ than during /p/, butnot support the active expansion hypothesis as thesoleex-planation. Active expansion could conceivably start anytiaround the beginning of the voiced stop. However, studythe synchrony between pressure and displacement dasubject S2~see Figs. 4 and 5! shows that pressure increasare always followed a few milliseconds later by downwa
570 J. Acoust. Soc. Am., Vol. 102, No. 1, July 1997
nr-
ce
.6rr-
sir
ve
--o-
r
g
r-
x-ds
g
-sivex-de-iso
efin
tongue displacements. This close synchrony is consiswith passive, pressure driven increase of supraglottal sizenot with solely active expansion, unless we are willingpostulate that active tongue movements and pressurecreases are synchronized so well that the lag between thas a standard deviation of 1–2 ms, a time interval aboutsame length as a single action potential. Thus the closechrony favors a passive component. An active componenindicated by the modeling of tongue deformation for /abtokens, which shows reasonably good results only whelinear trend is included in the model. The fitted slopespositive ~i.e., downward tongue displacement! for all ten/aba/ tokens and are quite substantial, averaging 4.7 mOn the other hand, modeling /apa/ tokens shows that reaably good fits can be obtained without a linear trend. Whelinear trend is included in the voiceless data, the slopessometimes positive, sometimes negative, and they aveonly 0.48 mm/s. In summary, a presumably active, substial, consistent linear displacement is superimposed on psure driven tongue displacement during /aba/ but a simcase may not be made for /apa/, where tongue displacemcan be reasonably explained by passive, pressure drivenformation only. However, these conclusions cannot be ovgeneralized because they are based on few data: a sfleshpoint of a single talker. The relative contributionpressure driven deformation and active movement duringlabial stops remains an open question that should be explin future studies, to refine the estimates of tongue comance.
IV. SUMMARY
We conclude that our kinematic data are consistent wthe physical description provided in the Introduction, bason a simple lumped parameter model that includes votract resistance and compliance. Smaller tongue displaments for /p/ than for /b/ may be due to active stiffeningthe tongue during /p/, and/or to intentional relaxationtongue muscles during /b/~in conjunction with active tonguedisplacement during /b/!, in order to accommodate airflowinto the oral cavity while maintaining a transglottal pressudifferential that will allow vocal fold vibration. Finally, thesedata allow us to refine estimates of vocal-tract wall compance obtained with indirect methods.
ACKNOWLEDGMENTS
This research was supported by NIDCD Grant NoDC00075, DC01925, and DC00423.
Bell-Berti, F. ~1975!. ‘‘Control of pharyngeal cavity size for English voiceand voiceless stops,’’ J. Acoust. Soc. Am.57, 456–461.
Holmberg, E., Hillman, R., and Perkell, J.~1988!. ‘‘Glottal airflow andtransglottal air pressure measurements for male and female speakesoft, normal and loud voice,’’ J. Acoust. Soc. Am.84, 511–529.
Ishizaka, K., French, J. C., and Flanagan, J. L.~1975!. ‘‘Direct determina-tion of vocal tract wall impedance,’’ IEEE Trans. Acoust. Speech SigProcess.4, 370–373.
Kent, R. D., and Moll, K. L.~1969!. ‘‘Vocal tract characteristics of the stopcognates,’’ J. Acoust. Soc. Am.46, 1549–1555.
570Svirsky et al.: Tongue surface displacement
.
li-ap
I.r
’ J.
d-
n
Lofqvist, A., Koenig, L. L., and McGowan, R. S.~1995!. ‘‘Vocal tractaerodynamics in /aCa/ utterances: Measurements,’’ Speech Commun16,49–66.
McGowan, R. S., Koenig, L. L., and Lo¨fqvist, A. ~1995!. ‘‘Vocal tractaerodynamics in /aCa/ utterances: Simulations,’’ Speech Commun.16,67–88.
Perkell, J. S.~1969!. ‘‘Physiology of speech production: Results and impcations of a quantitative cineradiographic study,’’ Research MonogrNo. 53 ~MIT, Cambridge, MA!.
Perkell, J. S., Cohen, M. H., Svirsky, M. A., Matthies, M. L., Garabieta,and Jackson, M. T. T.~1992!. ‘‘Electro-magnetic midsagittal articulomete
571 J. Acoust. Soc. Am., Vol. 102, No. 1, July 1997
h
,
~EMMA ! systems for transducing speech articulatory movements,’Acoust. Soc. Am.92, 3078–3096.
Rothenberg, M.~1968!. ‘‘The breath-stream dynamics of simple-releaseplosive production,’’Bibliotheca Phonetica, No. 6 ~Karger, Basel!.
Subtelny, J. D., Worth, J. H., and Sakuda, M.~1966!. ‘‘Intraoral pressureand rate of flow during speech,’’ J. Speech Hear. Res.9, 498–518.
Westbury, J.~1983!. ‘‘Enlargement of the supraglottal cavity and its relatioto stop consonant voicing,’’ J. Acoust. Soc. Am.73, 1322–1336.
Wodicka, G. R., Lam, A. M., Bhargava, V., and Sunkel, D.~1993!. ‘‘Acous-tic impedance of the maternal abdomen,’’ J. Acoust. Soc. Am.94,13–18.
571Svirsky et al.: Tongue surface displacement