tmem16a drives renal cyst growth by augmenting ca
TRANSCRIPT
ORIGINAL ARTICLE
TMEM16A drives renal cyst growth by augmenting Ca2+ signalingin M1 cells
Ines Cabrita1 & Björn Buchholz2 & Rainer Schreiber1 & Karl Kunzelmann1
Received: 17 June 2019 /Revised: 27 February 2020 /Accepted: 2 March 2020 /Published online: 18 March 2020#
AbstractPolycystic kidney disease (PKD) leads to continuous decline of renal function by growth of renal cysts. Enhanced proliferationand transepithelial chloride secretion through cystic fibrosis transmembrane conductance regulator (CFTR) and Ca2+-activatedTMEM16ACl− channels is thought to cause an increase in cyst volume. Recent work shows the pro-proliferative role of the Ca2+
activated Cl− channel TMEM16A (anoctamin 1), and demonstrates the essential contribution of TMEM16A to CFTR-dependentCl− secretion. The present data demonstrate an increase in intracellular Ca2+ ([Ca2+]i) signals and Cl− secretion by TMEM16A, inrenal collecting duct principle cells from dog (MDCK) and mouse (M1) as well as primary tubular epithelial cells from PKD1−/−knockout mice. M1 organoids proliferated, increased expression of TMEM16A, and secreted Cl− upon knockdown of endog-enous polycystin 1 or 2 (PKD1,2), by retroviral transfection with shPKD1 and shPKD2, respectively. Knockdown of PKD1 orPKD2 increased basal intracellular Ca2+ levels and enhanced purinergic Ca2+ release from endoplasmic reticulum. In contrast,ryanodine receptors were found not to be expressed in mouse renal epithelial cells and caffeine had no effects on [Ca2+]i. Ca2+
signals, proliferation, and Cl− secretion were largely reduced by knockdown or blockade of TMEM16A. TMEM16A maybe therefore important for enhanced Ca2+ release from IP3-sensitive Ca
2+ stores in polycystic kidney disease.
Key messages• ADPKD leads to continuous decline of renal function by growth of renal cysts.• Knockdown of PKD1 or PKD2 increases TMEM16A expression.• TMEM16A enhanced intracellular Ca2+ signals, Cl− secretion, and proliferation.• TMEM16A contributes to cyst growth in ADPKD.
Keywords ADPKD . Renal cysts . TMEM16A . Anoctamin 1 . Ca2+-activated Cl− channel
Introduction
Frequent autosomal dominant polycystic kidney disease(ADPKD) accounts for 5–10% of end-stage renal disease [1].ADPKD is characterized by continuous cyst enlargement overtime, leading to compression of adjacent healthy parenchyma[2]. ADPKD is caused by mutations in PKD1 (polycystin 1) orPKD2 (polycystin 2), but the underlying complex molecularevents leading to continuous cyst growth are still poorly under-stood [3]. In normal renal epithelial cells, PKD1 and PKD2appear to be located in the primary cilium, a single antenna-like protrusion of the plasma membrane, where they form acomplex of receptor and Ca2+ influx channel [4]. Ca2+ ionsare more concentrated within the primary cilium compared to
Rainer Schreiber and Karl Kunzelmann share last authorship.
Electronic supplementary material The online version of this article(https://doi.org/10.1007/s00109-020-01894-y) contains supplementarymaterial, which is available to authorized users.
* Karl [email protected]
1 Institut für Physiologie, Universität Regensburg, Universitätsstraße31, 93053 Regensburg, Germany
2 Department of Nephrology and Hypertension, University ofErlangen-Nuremberg, Erlangen, Germany
Journal of Molecular Medicine (2020) 98:659–671https://doi.org/10.1007/s00109-020-01894-y
The Author(s) 2020
the cytoplasm; however, Ca2+ signals generated within the cil-ium may occur independent of cytoplasmic Ca2+ signaling [5].Loss of the primary cilium or loss of PKD1/PKD2 functionleads to relocation of the polycystins to plasma membraneand endoplasmic reticulum, with the consequence of disturbedintracellular Ca2+ signaling [6].
We reported earlier an upregulation of the Ca2+ activatedchloride channel TMEM16A (anoctamin 1) in polycystic kid-ney disease. TMEM16A enables calcium-activated chloridesecretion that supports expansion of renal cysts and probablyproliferation of the cyst-forming epithelium [7]. Remarkably,primary cilia present in terminally differentiated naïve cells orin non-proliferating cells in culture, contain TMEM16A aswell as the paralogous proteins TMEM16F and TMEM16K[8–10]. Loss of expression of TMEM16Awas shown to com-promise ciliary genesis and decreased length of the primarycilium and of motile cilia [8, 11, 12].
In the presence of TMEM16A, basal and agonist-inducedCa2+ levels are increased [13, 14]. TMEM16A was shown tocouple to inositol 1,4,5-trisphosphate (IP3) receptors [13, 14]and different TRP Ca2+ influx channels [15]. TMEM16A en-hances ER Ca2+ store release by tethering the ER to the mem-brane localized receptor signaling complex. As a result, trans-membrane signaling, fluid secretion, or general cellular proper-ties like proliferation, migration, or volume regulation are af-fected. We examined in the present study whether TMEM16Acontributes to disturbed Ca2+ signaling observed in ADPKD.We further asked whether TMEM16A-related changes in Ca2+
signaling affect proliferation and fluid secretion. We found up-regulation of TMEM16Awith the loss of PKD1 or PKD2 ex-pression in M1 collecting duct cells. In M1 cells, TMEM16Asupported Ca2+ store release, cell proliferation, and fluid secre-tion and thereby contributed to cyst growth.
Results
TMEM16A augments fluid secretion by increasein intracellular Ca2+
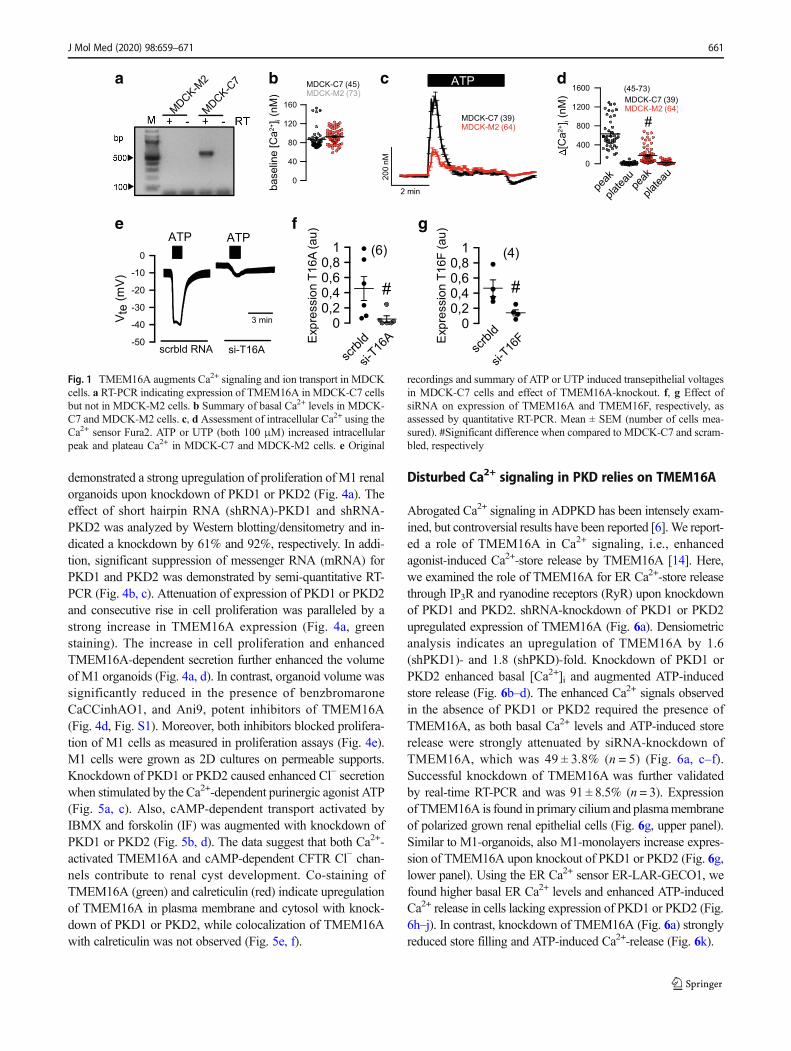
We demonstrated earlier the impact of TMEM16A on fluidsecretion and cyst growth in a MDCK cyst model and inembryonic kidney cultures [7]. MDCK cells derived fromdog principle cells exist as a MDCK-C7 clone expressingTMEM16A, and as a MDCK-M2 clone, lacking expressionof TMEM16A (Fig. 1a). The Ca2+ sensor Fura2 showed aremarkable increase in intracellular Ca2+ when MDCK-C7cells were stimulated with the purinergic agonists ATP orUTP (Fig. 1b–d). In contrast, MDCK-M2 cells lacking ex-pression of TMEM16A showed a much reduced Ca2+ re-sponse upon purinergic stimulation. In TMEM16A-expressing MDCK-C7 cells, a pronounced Cl− secretion wasactivated by ATP/UTP, which was potently inhibited by small
interfering RNA (siRNA)-knockout of TMEM16A (Fig. 1e)[7]. In contrast, Cl− secretion is largely reduced inMDCK-M2cells, as reported earlier [9]. Moreover, because siRNA-knockdown of TMEM16F did not affect Ca2+ activated Cl−
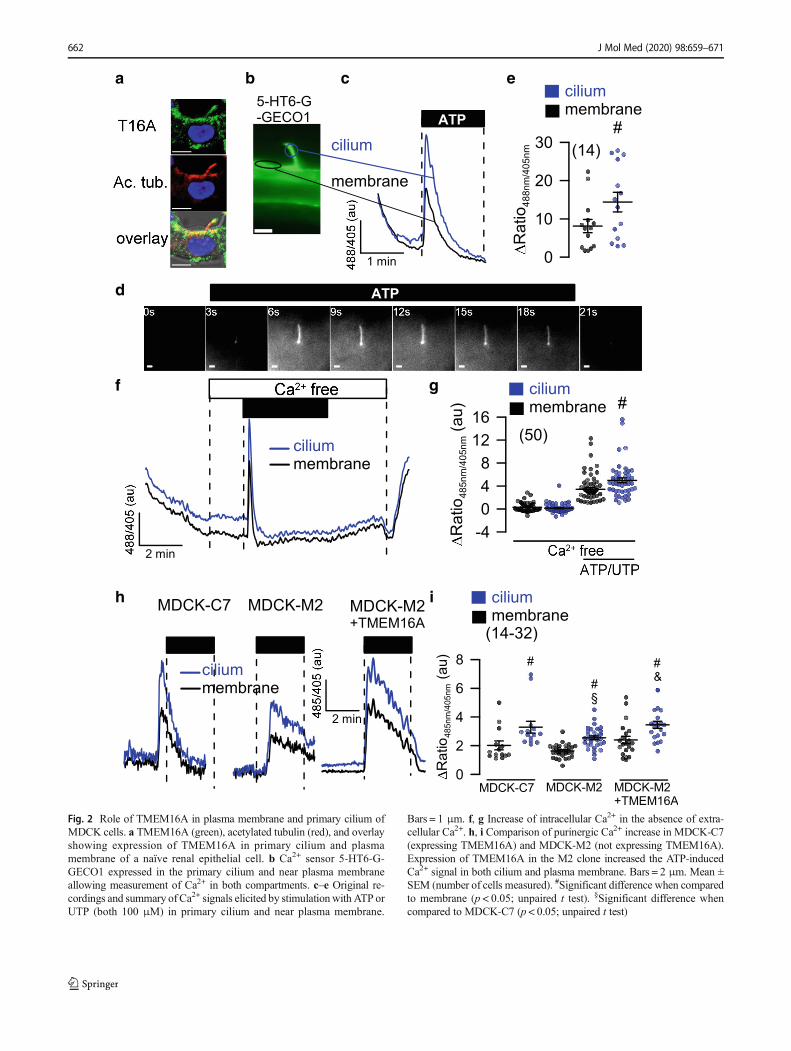
currents, the data suggest that TMEM16A is the Ca2+-activat-ed Cl− channel in MDCK-C7 cells, similar to other tissues(Fig. 1f, g) [9]. TMEM16A was found to be expressed inplasma membrane and primary cilium of MDCK and naïverenal tubular epithelial cells [8, 10] (Fig. 2a). Ca2+ changes inprimary cilium and near the plasma membrane were measuredusing 5-HT6-G-GECO1 (kindly provided by Prof. TakanariInoue, Johns Hopkins University, Baltimore, USA; Fig. 2b). ACa2+ rise in both cilium and near plasma membrane was de-tected upon purinergic stimulation with ATP or UTP (Fig. 2c–e). Importantly, peak increase in [Ca2+]i (store release) wassimilar in plasma membrane and cilium also in the absenceof extracellular Ca2+ (Fig. 2f, g). Purinergic Ca2+ rise waslarger in the primary cilium than close to the plasma mem-brane, but otherwise qualitatively similar. It was attenuated inMDCK-M2 cells lacking expression of TMEM16A (Fig.2h, i). Moreover, overexpression of TMEM16A in MDCK-M2 increased the ATP-induced Ca2+ signal in both cilium andplasma membrane. These results are in line with the previous-ly reported role of TMEM16 proteins in Ca2+ signaling [14].
Loss of PKD1 or PKD2 induces Cl− secretion in M1renal organoids
We further examined the role of TMEM16A and other PKD-associated proteins for cyst growth, cell proliferation, and Ca2+
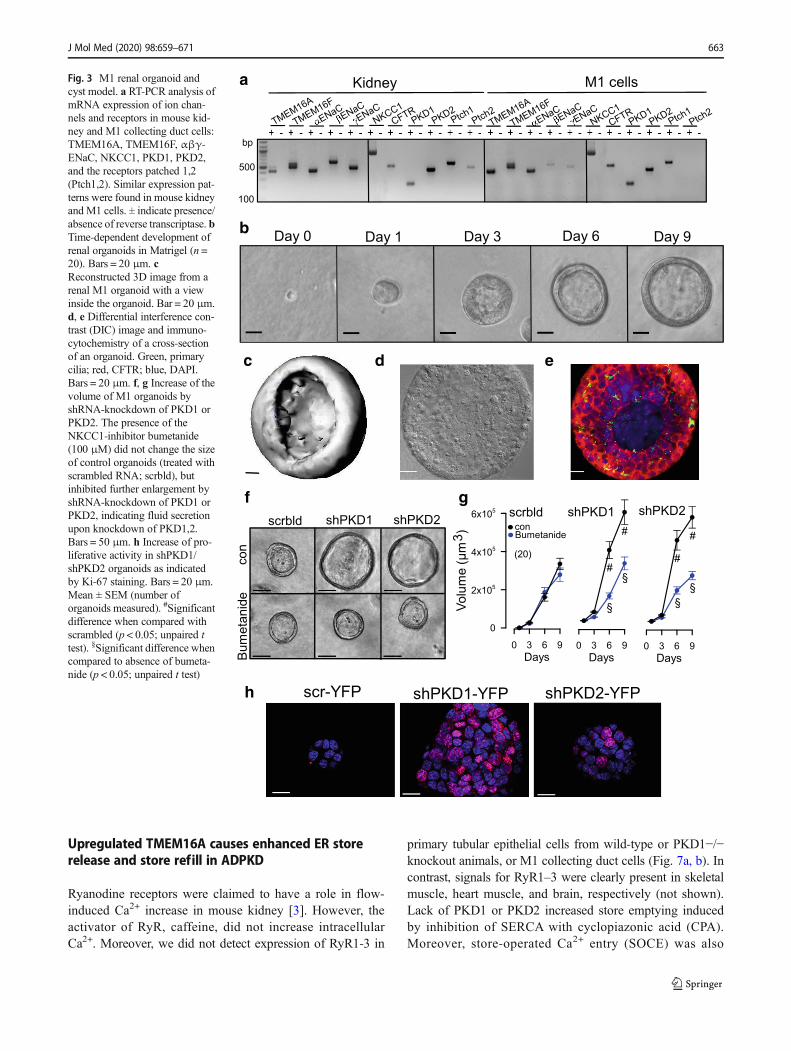
signaling using a 3D culture model. To that end, M1 mousecollecting duct cells were analyzed for expression of the rele-vant proteins polycystin (PKD1, PKD2), TMEM16A,TMEM16F, CFTR, NKCC1, and αβγ-ENaC (Fig. 3a). Cellswere grown in a collagen/Matrigel matrix and readily formedspherical renal organoids (Fig. 3b, c). The cells appeared highlydifferentiated and produced primary cilia (Fig. 3d, e).Importantly, M1 renal organoids do not seem to secrete fluid,because theNKCC1 inhibitor bumetanide did not interfere withthe formation and growth of the organoid (Fig. 3f, g). However,organoids expressed epithelial Na+ channels and increased theirvolume when grown in amiloride (not shown). Knockdown ofPKD1 or PKD2 increased the organoid volume, and this in-crease in volume was inhibited by bumetanide, indicating acti-vation of ion secretion upon knockdown of polycystins andinduction of a cystic phenotype (Figs. 3f, g and 4c).
Enhanced secretion and proliferation in PKD requiresTMEM16A
A hallmark of renal cysts is the upregulation of proliferation[16]. TMEM16A is well known to cause cell proliferation, Cl−
secretion and proliferation. The proliferation marker Ki-67
660 J Mol Med (2020) 98:659–671
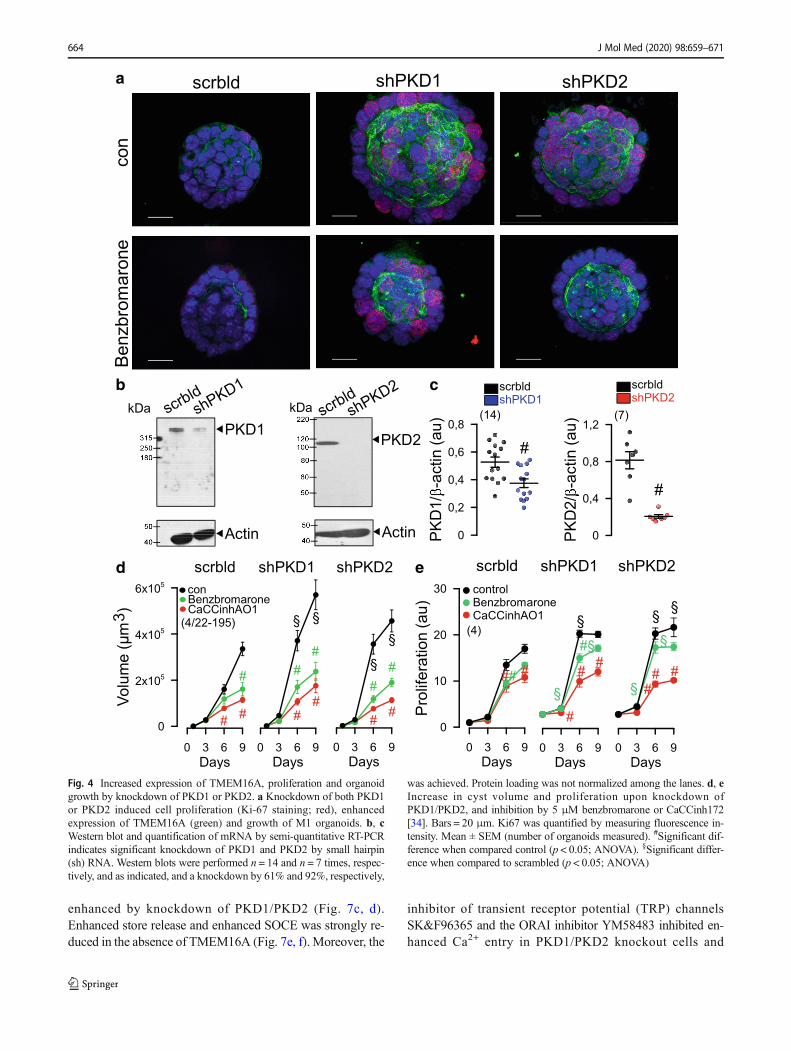
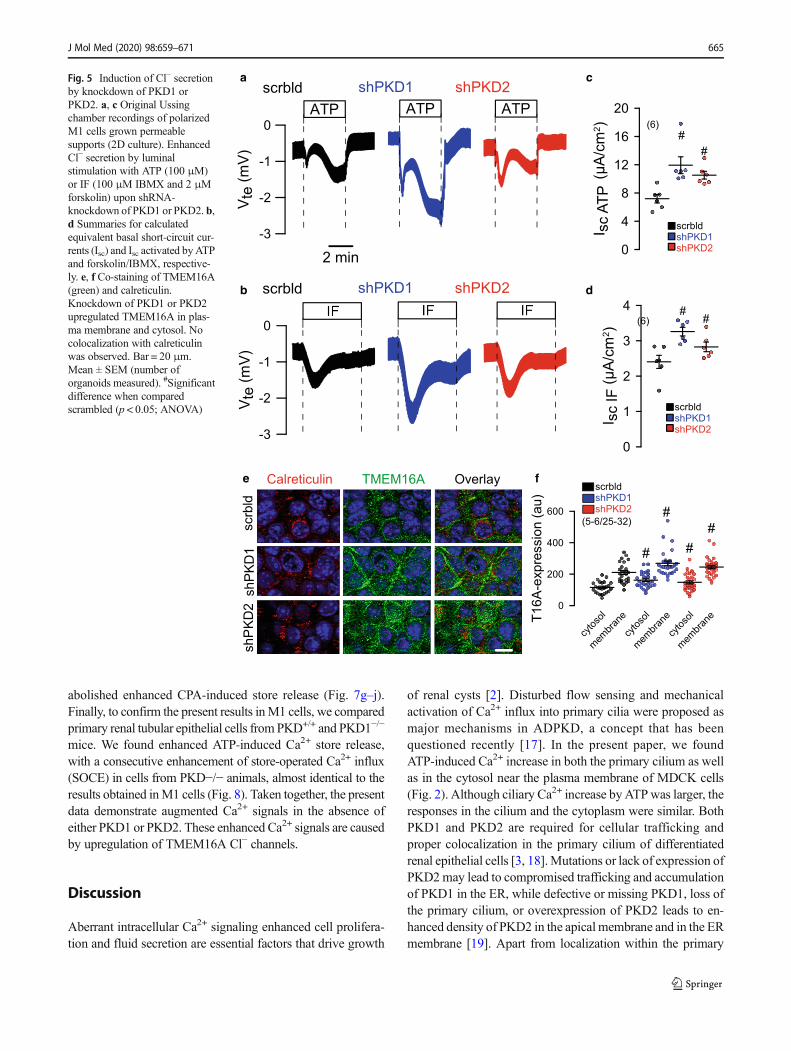
demonstrated a strong upregulation of proliferation of M1 renalorganoids upon knockdown of PKD1 or PKD2 (Fig. 4a). Theeffect of short hairpin RNA (shRNA)-PKD1 and shRNA-PKD2 was analyzed by Western blotting/densitometry and in-dicated a knockdown by 61% and 92%, respectively. In addi-tion, significant suppression of messenger RNA (mRNA) forPKD1 and PKD2 was demonstrated by semi-quantitative RT-PCR (Fig. 4b, c). Attenuation of expression of PKD1 or PKD2and consecutive rise in cell proliferation was paralleled by astrong increase in TMEM16A expression (Fig. 4a, greenstaining). The increase in cell proliferation and enhancedTMEM16A-dependent secretion further enhanced the volumeof M1 organoids (Fig. 4a, d). In contrast, organoid volume wassignificantly reduced in the presence of benzbromaroneCaCCinhAO1, and Ani9, potent inhibitors of TMEM16A(Fig. 4d, Fig. S1). Moreover, both inhibitors blocked prolifera-tion of M1 cells as measured in proliferation assays (Fig. 4e).M1 cells were grown as 2D cultures on permeable supports.Knockdown of PKD1 or PKD2 caused enhanced Cl− secretionwhen stimulated by the Ca2+-dependent purinergic agonist ATP(Fig. 5a, c). Also, cAMP-dependent transport activated byIBMX and forskolin (IF) was augmented with knockdown ofPKD1 or PKD2 (Fig. 5b, d). The data suggest that both Ca2+-activated TMEM16A and cAMP-dependent CFTR Cl− chan-nels contribute to renal cyst development. Co-staining ofTMEM16A (green) and calreticulin (red) indicate upregulationof TMEM16A in plasma membrane and cytosol with knock-down of PKD1 or PKD2, while colocalization of TMEM16Awith calreticulin was not observed (Fig. 5e, f).
Disturbed Ca2+ signaling in PKD relies on TMEM16A
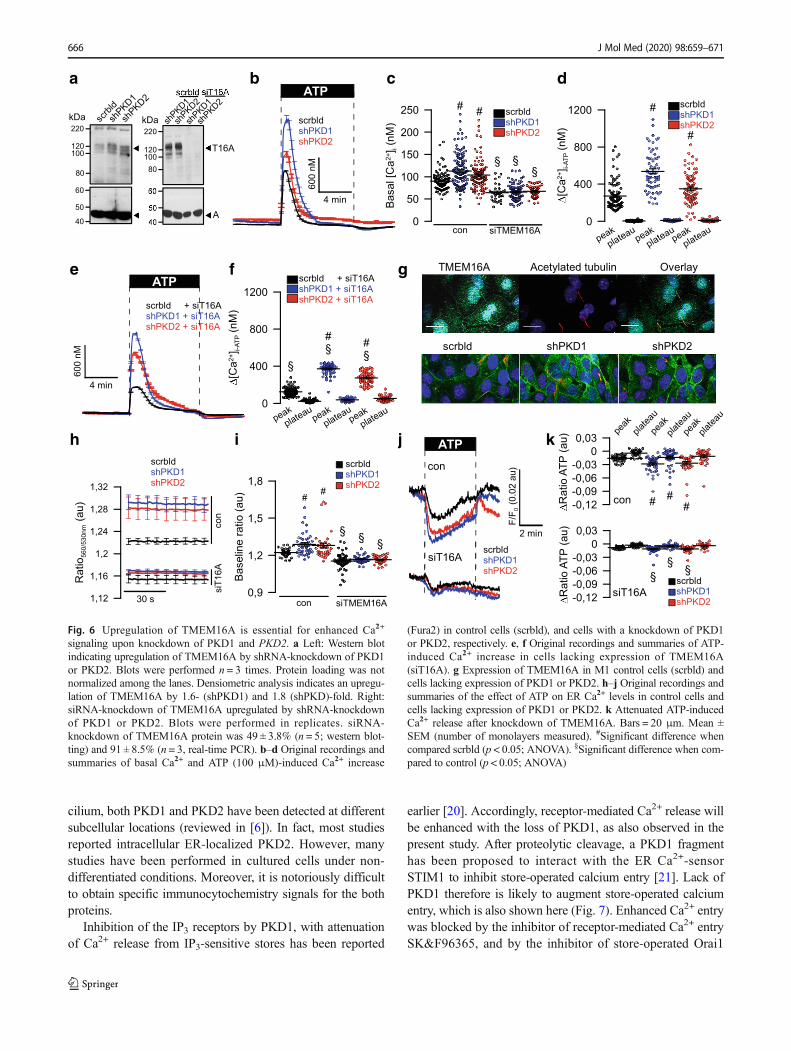
Abrogated Ca2+ signaling in ADPKD has been intensely exam-ined, but controversial results have been reported [6].We report-ed a role of TMEM16A in Ca2+ signaling, i.e., enhancedagonist-induced Ca2+-store release by TMEM16A [14]. Here,we examined the role of TMEM16A for ER Ca2+-store releasethrough IP3R and ryanodine receptors (RyR) upon knockdownof PKD1 and PKD2. shRNA-knockdown of PKD1 or PKD2upregulated expression of TMEM16A (Fig. 6a). Densiometricanalysis indicates an upregulation of TMEM16A by 1.6(shPKD1)- and 1.8 (shPKD)-fold. Knockdown of PKD1 orPKD2 enhanced basal [Ca2+]i and augmented ATP-inducedstore release (Fig. 6b–d). The enhanced Ca2+ signals observedin the absence of PKD1 or PKD2 required the presence ofTMEM16A, as both basal Ca2+ levels and ATP-induced storerelease were strongly attenuated by siRNA-knockdown ofTMEM16A, which was 49 ± 3.8% (n = 5) (Fig. 6a, c–f).Successful knockdown of TMEM16A was further validatedby real-time RT-PCR and was 91 ± 8.5% (n = 3). Expressionof TMEM16A is found in primary cilium and plasmamembraneof polarized grown renal epithelial cells (Fig. 6g, upper panel).Similar to M1-organoids, also M1-monolayers increase expres-sion of TMEM16A upon knockout of PKD1 or PKD2 (Fig. 6g,lower panel). Using the ER Ca2+ sensor ER-LAR-GECO1, wefound higher basal ER Ca2+ levels and enhanced ATP-inducedCa2+ release in cells lacking expression of PKD1 or PKD2 (Fig.6h–j). In contrast, knockdown of TMEM16A (Fig. 6a) stronglyreduced store filling and ATP-induced Ca2+-release (Fig. 6k).
a
e f g
b c d
Fig. 1 TMEM16A augments Ca2+ signaling and ion transport in MDCKcells. a RT-PCR indicating expression of TMEM16A in MDCK-C7 cellsbut not in MDCK-M2 cells. b Summary of basal Ca2+ levels in MDCK-C7 and MDCK-M2 cells. c, d Assessment of intracellular Ca2+ using theCa2+ sensor Fura2. ATP or UTP (both 100 μM) increased intracellularpeak and plateau Ca2+ in MDCK-C7 and MDCK-M2 cells. e Original
recordings and summary of ATP or UTP induced transepithelial voltagesin MDCK-C7 cells and effect of TMEM16A-knockout. f, g Effect ofsiRNA on expression of TMEM16A and TMEM16F, respectively, asassessed by quantitative RT-PCR. Mean ± SEM (number of cells mea-sured). #Significant difference when compared to MDCK-C7 and scram-bled, respectively
J Mol Med (2020) 98:659–671 661
a b c e
d
f g
h i
Fig. 2 Role of TMEM16A in plasma membrane and primary cilium ofMDCK cells. a TMEM16A (green), acetylated tubulin (red), and overlayshowing expression of TMEM16A in primary cilium and plasmamembrane of a naïve renal epithelial cell. b Ca2+ sensor 5-HT6-G-GECO1 expressed in the primary cilium and near plasma membraneallowing measurement of Ca2+ in both compartments. c–e Original re-cordings and summary of Ca2+ signals elicited by stimulation with ATP orUTP (both 100 μM) in primary cilium and near plasma membrane.
Bars = 1 μm. f, g Increase of intracellular Ca2+ in the absence of extra-cellular Ca2+. h, i Comparison of purinergic Ca2+ increase in MDCK-C7(expressing TMEM16A) and MDCK-M2 (not expressing TMEM16A).Expression of TMEM16A in the M2 clone increased the ATP-inducedCa2+ signal in both cilium and plasma membrane. Bars = 2 μm. Mean ±SEM (number of cells measured). #Significant difference when comparedto membrane (p < 0.05; unpaired t test). §Significant difference whencompared to MDCK-C7 (p < 0.05; unpaired t test)
662 J Mol Med (2020) 98:659–671
Upregulated TMEM16A causes enhanced ER storerelease and store refill in ADPKD
Ryanodine receptors were claimed to have a role in flow-induced Ca2+ increase in mouse kidney [3]. However, theactivator of RyR, caffeine, did not increase intracellularCa2+. Moreover, we did not detect expression of RyR1-3 in
primary tubular epithelial cells from wild-type or PKD1−/−knockout animals, or M1 collecting duct cells (Fig. 7a, b). Incontrast, signals for RyR1–3 were clearly present in skeletalmuscle, heart muscle, and brain, respectively (not shown).Lack of PKD1 or PKD2 increased store emptying inducedby inhibition of SERCA with cyclopiazonic acid (CPA).Moreover, store-operated Ca2+ entry (SOCE) was also
a
b
c d e
f g
h
Fig. 3 M1 renal organoid andcyst model. a RT-PCR analysis ofmRNA expression of ion chan-nels and receptors in mouse kid-ney and M1 collecting duct cells:TMEM16A, TMEM16F, αβγ-ENaC, NKCC1, PKD1, PKD2,and the receptors patched 1,2(Ptch1,2). Similar expression pat-terns were found in mouse kidneyand M1 cells. ± indicate presence/absence of reverse transcriptase. bTime-dependent development ofrenal organoids in Matrigel (n =20). Bars = 20 μm. cReconstructed 3D image from arenal M1 organoid with a viewinside the organoid. Bar = 20 μm.d, e Differential interference con-trast (DIC) image and immuno-cytochemistry of a cross-sectionof an organoid. Green, primarycilia; red, CFTR; blue, DAPI.Bars = 20 μm. f, g Increase of thevolume of M1 organoids byshRNA-knockdown of PKD1 orPKD2. The presence of theNKCC1-inhibitor bumetanide(100 μM) did not change the sizeof control organoids (treated withscrambled RNA; scrbld), butinhibited further enlargement byshRNA-knockdown of PKD1 orPKD2, indicating fluid secretionupon knockdown of PKD1,2.Bars = 50 μm. h Increase of pro-liferative activity in shPKD1/shPKD2 organoids as indicatedby Ki-67 staining. Bars = 20 μm.Mean ± SEM (number oforganoids measured). #Significantdifference when compared withscrambled (p < 0.05; unpaired ttest). §Significant difference whencompared to absence of bumeta-nide (p < 0.05; unpaired t test)
J Mol Med (2020) 98:659–671 663
enhanced by knockdown of PKD1/PKD2 (Fig. 7c, d).Enhanced store release and enhanced SOCE was strongly re-duced in the absence of TMEM16A (Fig. 7e, f). Moreover, the
inhibitor of transient receptor potential (TRP) channelsSK&F96365 and the ORAI inhibitor YM58483 inhibited en-hanced Ca2+ entry in PKD1/PKD2 knockout cells and
a
b c
d e
Fig. 4 Increased expression of TMEM16A, proliferation and organoidgrowth by knockdown of PKD1 or PKD2. a Knockdown of both PKD1or PKD2 induced cell proliferation (Ki-67 staining; red), enhancedexpression of TMEM16A (green) and growth of M1 organoids. b, cWestern blot and quantification of mRNA by semi-quantitative RT-PCRindicates significant knockdown of PKD1 and PKD2 by small hairpin(sh) RNA. Western blots were performed n = 14 and n = 7 times, respec-tively, and as indicated, and a knockdown by 61% and 92%, respectively,
was achieved. Protein loading was not normalized among the lanes. d, eIncrease in cyst volume and proliferation upon knockdown ofPKD1/PKD2, and inhibition by 5 μM benzbromarone or CaCCinh172[34]. Bars = 20 μm. Ki67 was quantified by measuring fluorescence in-tensity. Mean ± SEM (number of organoids measured). #Significant dif-ference when compared control (p < 0.05; ANOVA). §Significant differ-ence when compared to scrambled (p < 0.05; ANOVA)
664 J Mol Med (2020) 98:659–671
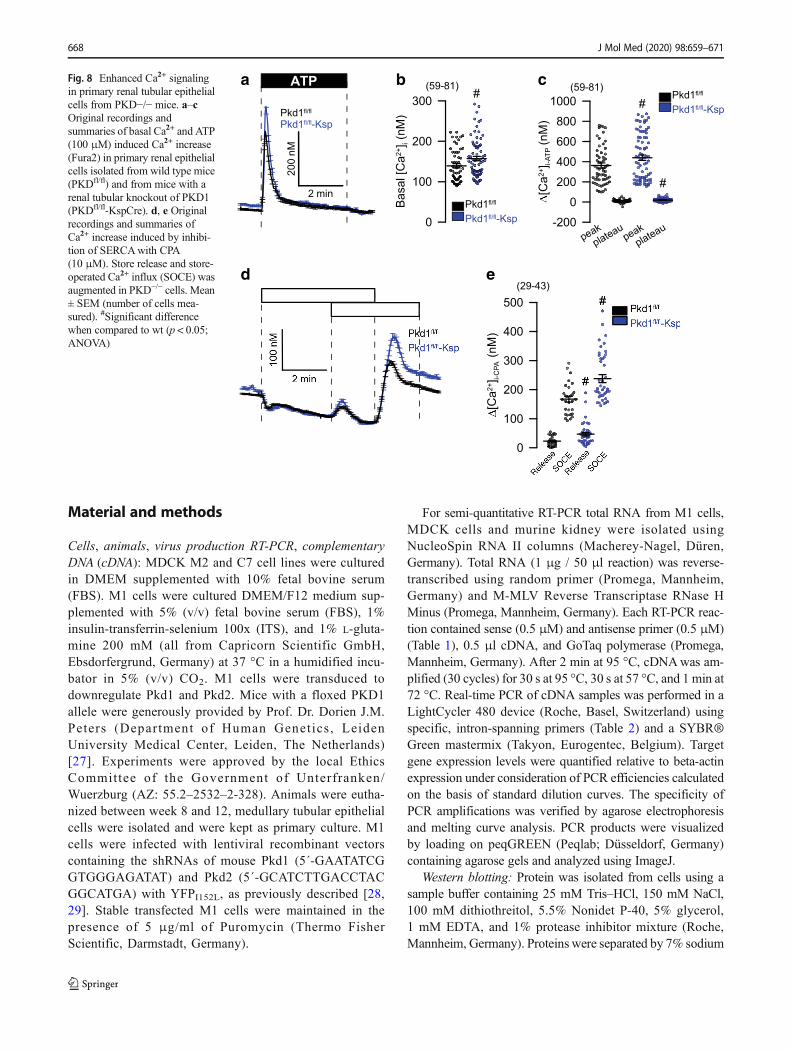
abolished enhanced CPA-induced store release (Fig. 7g–j).Finally, to confirm the present results inM1 cells, we comparedprimary renal tubular epithelial cells from PKD+/+ and PKD1−/−
mice. We found enhanced ATP-induced Ca2+ store release,with a consecutive enhancement of store-operated Ca2+ influx(SOCE) in cells from PKD−/− animals, almost identical to theresults obtained inM1 cells (Fig. 8). Taken together, the presentdata demonstrate augmented Ca2+ signals in the absence ofeither PKD1 or PKD2. These enhanced Ca2+ signals are causedby upregulation of TMEM16A Cl− channels.
Discussion
Aberrant intracellular Ca2+ signaling enhanced cell prolifera-tion and fluid secretion are essential factors that drive growth
of renal cysts [2]. Disturbed flow sensing and mechanicalactivation of Ca2+ influx into primary cilia were proposed asmajor mechanisms in ADPKD, a concept that has beenquestioned recently [17]. In the present paper, we foundATP-induced Ca2+ increase in both the primary cilium as wellas in the cytosol near the plasma membrane of MDCK cells(Fig. 2). Although ciliary Ca2+ increase byATPwas larger, theresponses in the cilium and the cytoplasm were similar. BothPKD1 and PKD2 are required for cellular trafficking andproper colocalization in the primary cilium of differentiatedrenal epithelial cells [3, 18].Mutations or lack of expression ofPKD2may lead to compromised trafficking and accumulationof PKD1 in the ER, while defective or missing PKD1, loss ofthe primary cilium, or overexpression of PKD2 leads to en-hanced density of PKD2 in the apical membrane and in the ERmembrane [19]. Apart from localization within the primary
a
b d
c
fe
Fig. 5 Induction of Cl− secretionby knockdown of PKD1 orPKD2. a, c Original Ussingchamber recordings of polarizedM1 cells grown permeablesupports (2D culture). EnhancedCl− secretion by luminalstimulation with ATP (100 μM)or IF (100 μM IBMX and 2 μMforskolin) upon shRNA-knockdown of PKD1 or PKD2. b,d Summaries for calculatedequivalent basal short-circuit cur-rents (Isc) and Isc activated byATPand forskolin/IBMX, respective-ly. e, f Co-staining of TMEM16A(green) and calreticulin.Knockdown of PKD1 or PKD2upregulated TMEM16A in plas-ma membrane and cytosol. Nocolocalization with calreticulinwas observed. Bar = 20 μm.Mean ± SEM (number oforganoids measured). #Significantdifference when comparedscrambled (p < 0.05; ANOVA)
J Mol Med (2020) 98:659–671 665
cilium, both PKD1 and PKD2 have been detected at differentsubcellular locations (reviewed in [6]). In fact, most studiesreported intracellular ER-localized PKD2. However, manystudies have been performed in cultured cells under non-differentiated conditions. Moreover, it is notoriously difficultto obtain specific immunocytochemistry signals for the bothproteins.
Inhibition of the IP3 receptors by PKD1, with attenuationof Ca2+ release from IP3-sensitive stores has been reported
earlier [20]. Accordingly, receptor-mediated Ca2+ release willbe enhanced with the loss of PKD1, as also observed in thepresent study. After proteolytic cleavage, a PKD1 fragmenthas been proposed to interact with the ER Ca2+-sensorSTIM1 to inhibit store-operated calcium entry [21]. Lack ofPKD1 therefore is likely to augment store-operated calciumentry, which is also shown here (Fig. 7). Enhanced Ca2+ entrywas blocked by the inhibitor of receptor-mediated Ca2+ entrySK&F96365, and by the inhibitor of store-operated Orai1
a b c d
e f g
h i j k
Fig. 6 Upregulation of TMEM16A is essential for enhanced Ca2+
signaling upon knockdown of PKD1 and PKD2. a Left: Western blotindicating upregulation of TMEM16A by shRNA-knockdown of PKD1or PKD2. Blots were performed n = 3 times. Protein loading was notnormalized among the lanes. Densiometric analysis indicates an upregu-lation of TMEM16A by 1.6- (shPKD1) and 1.8 (shPKD)-fold. Right:siRNA-knockdown of TMEM16A upregulated by shRNA-knockdownof PKD1 or PKD2. Blots were performed in replicates. siRNA-knockdown of TMEM16A protein was 49 ± 3.8% (n = 5; western blot-ting) and 91 ± 8.5% (n = 3, real-time PCR). b–d Original recordings andsummaries of basal Ca2+ and ATP (100 μM)-induced Ca2+ increase
(Fura2) in control cells (scrbld), and cells with a knockdown of PKD1or PKD2, respectively. e, f Original recordings and summaries of ATP-induced Ca2+ increase in cells lacking expression of TMEM16A(siT16A). g Expression of TMEM16A in M1 control cells (scrbld) andcells lacking expression of PKD1 or PKD2. h–j Original recordings andsummaries of the effect of ATP on ER Ca2+ levels in control cells andcells lacking expression of PKD1 or PKD2. k Attenuated ATP-inducedCa2+ release after knockdown of TMEM16A. Bars = 20 μm. Mean ±SEM (number of monolayers measured). #Significant difference whencompared scrbld (p < 0.05; ANOVA). §Significant difference when com-pared to control (p < 0.05; ANOVA)
666 J Mol Med (2020) 98:659–671
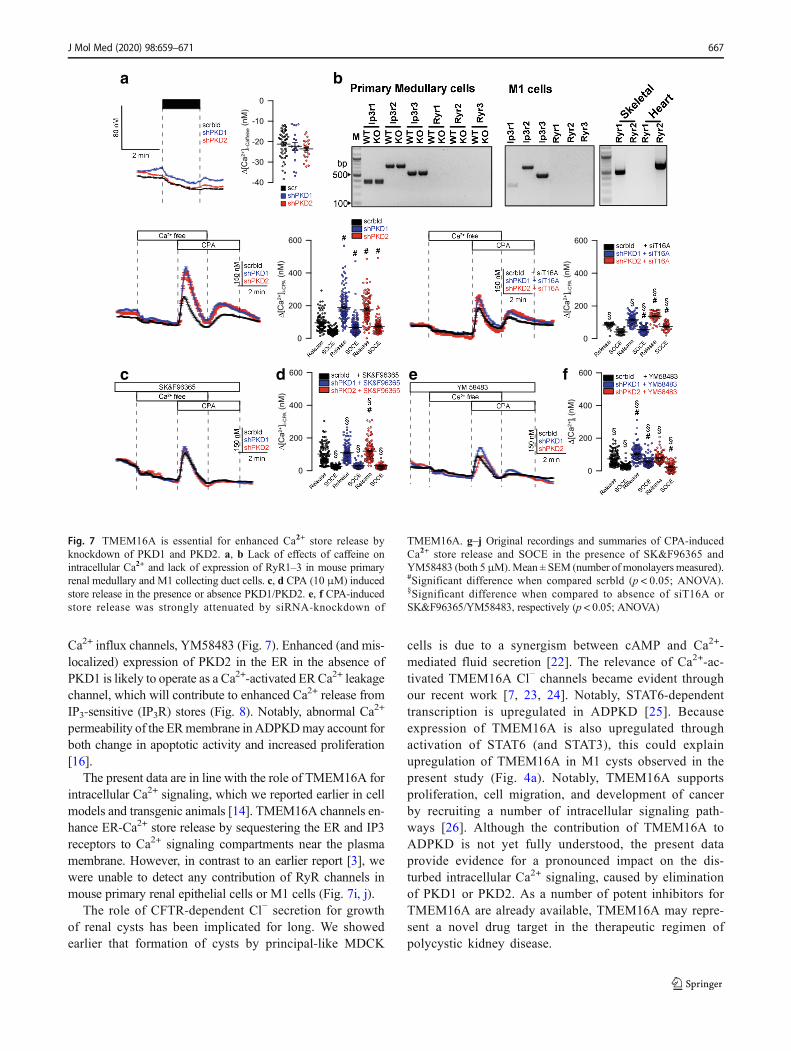
Ca2+ influx channels, YM58483 (Fig. 7). Enhanced (and mis-localized) expression of PKD2 in the ER in the absence ofPKD1 is likely to operate as a Ca2+-activated ERCa2+ leakagechannel, which will contribute to enhanced Ca2+ release fromIP3-sensitive (IP3R) stores (Fig. 8). Notably, abnormal Ca2+
permeability of the ERmembrane in ADPKDmay account forboth change in apoptotic activity and increased proliferation[16].
The present data are in line with the role of TMEM16A forintracellular Ca2+ signaling, which we reported earlier in cellmodels and transgenic animals [14]. TMEM16A channels en-hance ER-Ca2+ store release by sequestering the ER and IP3receptors to Ca2+ signaling compartments near the plasmamembrane. However, in contrast to an earlier report [3], wewere unable to detect any contribution of RyR channels inmouse primary renal epithelial cells or M1 cells (Fig. 7i, j).
The role of CFTR-dependent Cl− secretion for growthof renal cysts has been implicated for long. We showedearlier that formation of cysts by principal-like MDCK
cells is due to a synergism between cAMP and Ca2+-mediated fluid secretion [22]. The relevance of Ca2+-ac-tivated TMEM16A Cl− channels became evident throughour recent work [7, 23, 24]. Notably, STAT6-dependenttranscription is upregulated in ADPKD [25]. Becauseexpression of TMEM16A is also upregulated throughactivation of STAT6 (and STAT3), this could explainupregulation of TMEM16A in M1 cysts observed in thepresent study (Fig. 4a). Notably, TMEM16A supportsproliferation, cell migration, and development of cancerby recruiting a number of intracellular signaling path-ways [26]. Although the contribution of TMEM16A toADPKD is not yet fully understood, the present dataprovide evidence for a pronounced impact on the dis-turbed intracellular Ca2+ signaling, caused by eliminationof PKD1 or PKD2. As a number of potent inhibitors forTMEM16A are already available, TMEM16A may repre-sent a novel drug target in the therapeutic regimen ofpolycystic kidney disease.
a
c d e f
b
Fig. 7 TMEM16A is essential for enhanced Ca2+ store release byknockdown of PKD1 and PKD2. a, b Lack of effects of caffeine onintracellular Ca2+ and lack of expression of RyR1–3 in mouse primaryrenal medullary and M1 collecting duct cells. c, d CPA (10 μM) inducedstore release in the presence or absence PKD1/PKD2. e, f CPA-inducedstore release was strongly attenuated by siRNA-knockdown of
TMEM16A. g–j Original recordings and summaries of CPA-inducedCa2+ store release and SOCE in the presence of SK&F96365 andYM58483 (both 5μM).Mean ± SEM (number of monolayers measured).#Significant difference when compared scrbld (p < 0.05; ANOVA).§Significant difference when compared to absence of siT16A orSK&F96365/YM58483, respectively (p < 0.05; ANOVA)
J Mol Med (2020) 98:659–671 667
Material and methods
Cells, animals, virus production RT-PCR, complementaryDNA (cDNA): MDCK M2 and C7 cell lines were culturedin DMEM supplemented with 10% fetal bovine serum(FBS). M1 cells were cultured DMEM/F12 medium sup-plemented with 5% (v/v) fetal bovine serum (FBS), 1%insulin-transferrin-selenium 100x (ITS), and 1% L-gluta-mine 200 mM (all from Capricorn Scientific GmbH,Ebsdorfergrund, Germany) at 37 °C in a humidified incu-bator in 5% (v/v) CO2. M1 cells were transduced todownregulate Pkd1 and Pkd2. Mice with a floxed PKD1allele were generously provided by Prof. Dr. Dorien J.M.Peters (Department of Human Genet ics , LeidenUniversity Medical Center, Leiden, The Netherlands)[27]. Experiments were approved by the local EthicsCommittee of the Government of Unterfranken/Wuerzburg (AZ: 55.2–2532–2-328). Animals were eutha-nized between week 8 and 12, medullary tubular epithelialcells were isolated and were kept as primary culture. M1cells were infected with lentiviral recombinant vectorscontaining the shRNAs of mouse Pkd1 (5´-GAATATCGGTGGGAGATAT) and Pkd2 (5´-GCATCTTGACCTACGGCATGA) with YFPI152L, as previously described [28,29]. Stable transfected M1 cells were maintained in thepresence of 5 μg/ml of Puromycin (Thermo FisherScientific, Darmstadt, Germany).
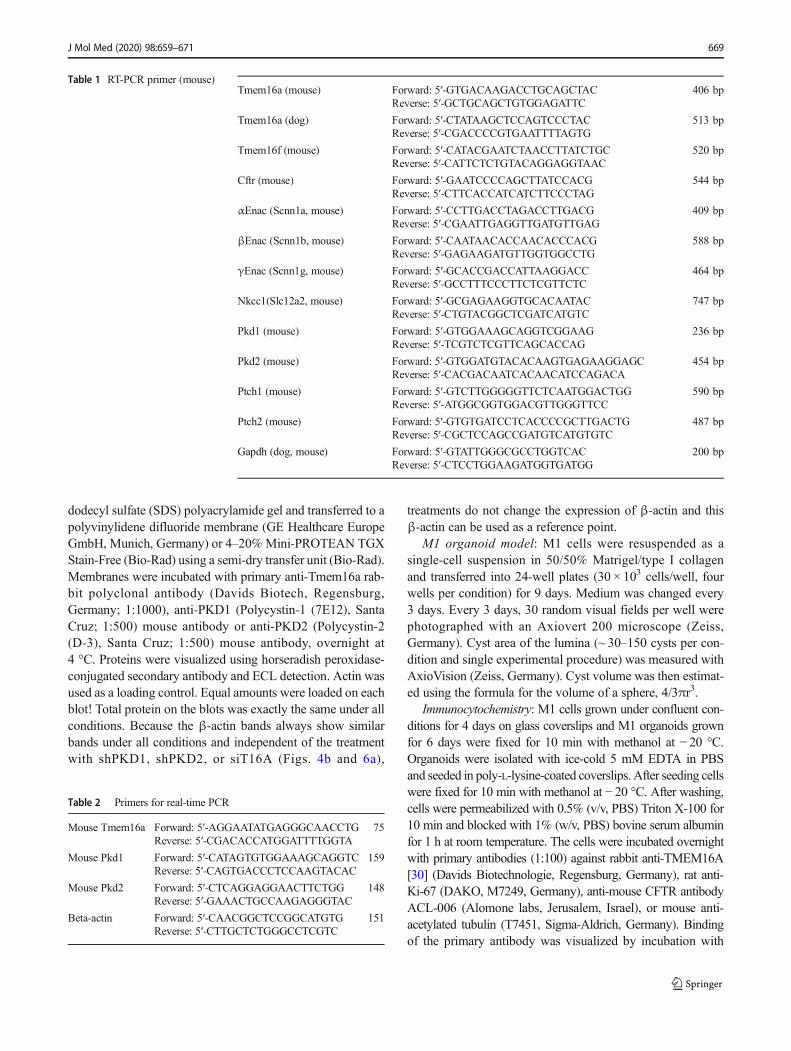
For semi-quantitative RT-PCR total RNA from M1 cells,MDCK cells and murine kidney were isolated usingNucleoSpin RNA II columns (Macherey-Nagel, Düren,Germany). Total RNA (1 μg / 50 μl reaction) was reverse-transcribed using random primer (Promega, Mannheim,Germany) and M-MLV Reverse Transcriptase RNase HMinus (Promega, Mannheim, Germany). Each RT-PCR reac-tion contained sense (0.5 μM) and antisense primer (0.5 μM)(Table 1), 0.5 μl cDNA, and GoTaq polymerase (Promega,Mannheim, Germany). After 2 min at 95 °C, cDNAwas am-plified (30 cycles) for 30 s at 95 °C, 30 s at 57 °C, and 1 min at72 °C. Real-time PCR of cDNA samples was performed in aLightCycler 480 device (Roche, Basel, Switzerland) usingspecific, intron-spanning primers (Table 2) and a SYBR®Green mastermix (Takyon, Eurogentec, Belgium). Targetgene expression levels were quantified relative to beta-actinexpression under consideration of PCR efficiencies calculatedon the basis of standard dilution curves. The specificity ofPCR amplifications was verified by agarose electrophoresisand melting curve analysis. PCR products were visualizedby loading on peqGREEN (Peqlab; Düsseldorf, Germany)containing agarose gels and analyzed using ImageJ.
Western blotting: Protein was isolated from cells using asample buffer containing 25 mM Tris–HCl, 150 mM NaCl,100 mM dithiothreitol, 5.5% Nonidet P-40, 5% glycerol,1 mM EDTA, and 1% protease inhibitor mixture (Roche,Mannheim, Germany). Proteins were separated by 7% sodium
a
d e
b cFig. 8 Enhanced Ca2+ signalingin primary renal tubular epithelialcells from PKD−/− mice. a–cOriginal recordings andsummaries of basal Ca2+ and ATP(100 μM) induced Ca2+ increase(Fura2) in primary renal epithelialcells isolated from wild type mice(PKDfl/fl) and from mice with arenal tubular knockout of PKD1(PKDfl/fl-KspCre). d, e Originalrecordings and summaries ofCa2+ increase induced by inhibi-tion of SERCAwith CPA(10 μM). Store release and store-operated Ca2+ influx (SOCE) wasaugmented in PKD−/− cells. Mean± SEM (number of cells mea-sured). #Significant differencewhen compared to wt (p < 0.05;ANOVA)
668 J Mol Med (2020) 98:659–671
dodecyl sulfate (SDS) polyacrylamide gel and transferred to apolyvinylidene difluoride membrane (GE Healthcare EuropeGmbH, Munich, Germany) or 4–20%Mini-PROTEAN TGXStain-Free (Bio-Rad) using a semi-dry transfer unit (Bio-Rad).Membranes were incubated with primary anti-Tmem16a rab-bit polyclonal antibody (Davids Biotech, Regensburg,Germany; 1:1000), anti-PKD1 (Polycystin-1 (7E12), SantaCruz; 1:500) mouse antibody or anti-PKD2 (Polycystin-2(D-3), Santa Cruz; 1:500) mouse antibody, overnight at4 °C. Proteins were visualized using horseradish peroxidase-conjugated secondary antibody and ECL detection. Actin wasused as a loading control. Equal amounts were loaded on eachblot! Total protein on the blots was exactly the same under allconditions. Because the β-actin bands always show similarbands under all conditions and independent of the treatmentwith shPKD1, shPKD2, or siT16A (Figs. 4b and 6a),
treatments do not change the expression of β-actin and thisβ-actin can be used as a reference point.
M1 organoid model: M1 cells were resuspended as asingle-cell suspension in 50/50% Matrigel/type I collagenand transferred into 24-well plates (30 × 103 cells/well, fourwells per condition) for 9 days. Medium was changed every3 days. Every 3 days, 30 random visual fields per well werephotographed with an Axiovert 200 microscope (Zeiss,Germany). Cyst area of the lumina (~ 30–150 cysts per con-dition and single experimental procedure) was measured withAxioVision (Zeiss, Germany). Cyst volume was then estimat-ed using the formula for the volume of a sphere, 4/3πr3.
Immunocytochemistry: M1 cells grown under confluent con-ditions for 4 days on glass coverslips and M1 organoids grownfor 6 days were fixed for 10 min with methanol at − 20 °C.Organoids were isolated with ice-cold 5 mM EDTA in PBSand seeded in poly-L-lysine-coated coverslips. After seeding cellswere fixed for 10 min with methanol at − 20 °C. After washing,cells were permeabilized with 0.5% (v/v, PBS) Triton X-100 for10 min and blocked with 1% (w/v, PBS) bovine serum albuminfor 1 h at room temperature. The cells were incubated overnightwith primary antibodies (1:100) against rabbit anti-TMEM16A[30] (Davids Biotechnologie, Regensburg, Germany), rat anti-Ki-67 (DAKO, M7249, Germany), anti-mouse CFTR antibodyACL-006 (Alomone labs, Jerusalem, Israel), or mouse anti-acetylated tubulin (T7451, Sigma-Aldrich, Germany). Bindingof the primary antibody was visualized by incubation with
Table 1 RT-PCR primer (mouse)Tmem16a (mouse) Forward: 5′-GTGACAAGACCTGCAGCTAC 406 bp
Reverse: 5′-GCTGCAGCTGTGGAGATTC
Tmem16a (dog) Forward: 5′-CTATAAGCTCCAGTCCCTAC 513 bpReverse: 5′-CGACCCCGTGAATTTTAGTG
Tmem16f (mouse) Forward: 5′-CATACGAATCTAACCTTATCTGC 520 bpReverse: 5′-CATTCTCTGTACAGGAGGTAAC
Cftr (mouse) Forward: 5′-GAATCCCCAGCTTATCCACG 544 bpReverse: 5′-CTTCACCATCATCTTCCCTAG
αEnac (Scnn1a, mouse) Forward: 5′-CCTTGACCTAGACCTTGACG 409 bpReverse: 5′-CGAATTGAGGTTGATGTTGAG
βEnac (Scnn1b, mouse) Forward: 5′-CAATAACACCAACACCCACG 588 bpReverse: 5′-GAGAAGATGTTGGTGGCCTG
γEnac (Scnn1g, mouse) Forward: 5′-GCACCGACCATTAAGGACC 464 bpReverse: 5′-GCCTTTCCCTTCTCGTTCTC
Nkcc1(Slc12a2, mouse) Forward: 5′-GCGAGAAGGTGCACAATAC 747 bpReverse: 5′-CTGTACGGCTCGATCATGTC
Pkd1 (mouse) Forward: 5′-GTGGAAAGCAGGTCGGAAG 236 bpReverse: 5′-TCGTCTCGTTCAGCACCAG
Pkd2 (mouse) Forward: 5′-GTGGATGTACACAAGTGAGAAGGAGC 454 bpReverse: 5′-CACGACAATCACAACATCCAGACA
Ptch1 (mouse) Forward: 5′-GTCTTGGGGGTTCTCAATGGACTGG 590 bpReverse: 5′-ATGGCGGTGGACGTTGGGTTCC
Ptch2 (mouse) Forward: 5′-GTGTGATCCTCACCCCGCTTGACTG 487 bpReverse: 5′-CGCTCCAGCCGATGTCATGTGTC
Gapdh (dog, mouse) Forward: 5′-GTATTGGGCGCCTGGTCAC 200 bpReverse: 5′-CTCCTGGAAGATGGTGATGG
Table 2 Primers for real-time PCR
Mouse Tmem16a Forward: 5′-AGGAATATGAGGGCAACCTG 75Reverse: 5′-CGACACCATGGATTTTGGTA
Mouse Pkd1 Forward: 5′-CATAGTGTGGAAAGCAGGTC 159Reverse: 5′-CAGTGACCCTCCAAGTACAC
Mouse Pkd2 Forward: 5′-CTCAGGAGGAACTTCTGG 148Reverse: 5′-GAAACTGCCAAGAGGGTAC
Beta-actin Forward: 5′-CAACGGCTCCGGCATGTG 151Reverse: 5′-CTTGCTCTGGGCCTCGTC
J Mol Med (2020) 98:659–671 669
appropriate secondary antibodies conjugated with Alexa Fluor488 or Alexa Fluor 546 (1:300, Molecular Probes, Invitrogen).Nuclei were stained with Hoe33342 (0.1 g/ml PBS, AppliChem,Darmstadt, Germany). Glass coverslips were mounted on glassslides with fluorescent mounting medium (DakoCytomation,Hamburg, Germany) and examined with an ApoTomeAxiovert 200 M fluorescence microscope (Zeiss, Germany).
Cell proliferation assay: M1 cells were plated in 96-wellplates at a density of 2 × 10³ cells per well for the time dura-tion as indicated (0, 3, 6, and 9 days). Medium was changedevery 3 days. Cells were incubated for 2 h in 100 μl of freshmedia containing 0.5 mg/ml of the tetrazolium salt MTT. Thedark blue formazan product was dissolved with DMSO andmeasured the absorbance at 595 nm.
Ussing chamber: MDCK or M1 cells were grown as polar-ized monolayers on permeable supports (Millipore MA,Germany) for 8 days. Cells were mounted into a perfusedmicro-Ussing chamber, and the luminal and basolateral sur-faces of the epithelium were perfused continuously withRinger’s solution (mmol/l: NaCl 145; KH2PO4 0.4; K2HPO4
1.6; glucose 5; MgCl2 1; Ca2+ gluconate 1.3) at a rate of 5 ml/
min (chamber volume 2 ml). Bath solutions were heated to37 °C, using a water jacket. Experiments were carried outunder open-circuit conditions. In addition, 100 μM ATP/UTP was added on the apical or basolateral side, or 100 μM3-isobutyl-1-methylxanthine and 2 μM Forskolin (I/F) wereadded on the basolateral side, or 2 μM ionomycin was addedon the apical side, as indicated in the figure. Data werecollected continuously using PowerLab (AD Instru-ments, Australia). Values for transepithelial voltages (Vte)were referred to the basolateral side of the epithelium.Transepithelial resistance (Rte) was determined by applyingshort (1 s) current pulses (ΔI = 0.5 μA). Rte and equivalentshort-circuit currents (I′SC) were calculated according toOhm’s law (Rte = ΔVte/ΔI, I′SC = Vte/Rte).
Measurement of [Ca2+]i: Primary cilium and membrane Ca2+
signals were detected after MDCK M2 and C7 cell weretransfected with 5HT6-mCherry-GECO1.0 (5HT6-GECO,Addgene, Cambridge, MA, USA [31]). Cells were grown toconfluence in glass coverslips and serum starved for 4–6 daysto induce cilium formation. Afterwards, the cells were mountedand perfused in Ringer’s solution. The mCherry fluorescence ofthe indicator was used to localize the Ca2+ sensor. Therefore,before each experiment, a photo was taken exciting the 5HT6-GECO at 560 nm, and the emissionwas recorded between 620 ±30 nm using a CCD-camera (CoolSnap HQ, Visitron Systems,Germany). To measure the ciliary Ca2+ changes, 5HT6-GECOwas excited at 485/405 nm, and the emission was recorded be-tween 535 ± 12.5 nm. The results for [Ca2+]cilium and [Ca2+]cytwere obtained at 485/405 nm changes and given in ratio.Measurement of the global cytosolic Ca2+ changes was per-formed as described recently [32]. In brief, cells were loadedwith5 μMFura-2, AM (Molecular Probes) in OptiMEM (Invitrogen)
with 0.02%pluronic (Molecular Probes) for 1 h at RTand 30minat 37 °C. Fura-2 was excited at 340/380 nm, and the emissionwas recorded between 470 and 550 nm using a CCD-camera(CoolSnap HQ, Visitron Systems, Germany). Control of experi-ment, imaging acquisition, and data analysis were done with thesoftware packageMeta-Fluor (Universal imaging, USA). [Ca2+]iwas calculated from the 340/380 nm fluorescence ratio afterbackground subtraction. The formula used to calculate [Ca2+]iwas [Ca2+]i = Kd × (R-Rmin)/(Rmax-R) × (Sf2/Sb2), where R isthe observed fluorescence ratio. The values Rmax and Rmin (max-imum and minimum ratios) and the constant Sf2/Sb2 (fluores-cence of free and Ca2+-bound Fura-2 at 380 nm) were calculatedusing 1 μmol/l ionomycin (Calbiochem), 5 μmol/l nigericin,10 μmol/l monensin (Sigma), and 5 mmol/l EGTA to equilibrateintracellular and extracellular Ca2+ in intact Fura-2-loaded cells.The dissociation constant for the Fura-2·Ca2+ complex was takenas 224 nmol/l. ERCa2+ signals were detected in Ca2+ sensor ER-LAR-GECO1 (Addgene, Cambridge, MA, USA [33],) express-ing M1 cells. Cells were excited at 560 nm and emission wasrecorded between 620 ± 30 nm.
Materials and statistical analysis: All compounds used wereof highest available grade of purity. Data are reported as mean ±SEM. Student’s t test for unpaired samples and ANOVA wereused for statistical analysis. p< 0.05 was accepted as significantdifference. We are grateful to Prof. Dr. Dorien J.M. Peters(Department of Human Genetics, Leiden University MedicalCenter, Leiden, The Netherlands) for providing us with animalswith a floxed PKD1 allele. We acknowledge the support by Ms.Ana Fonseca.
Acknowledgments Open Access funding provided by Projekt DEAL.The 5HT6-G-GECO1.0 was kindly provided by Prof. Takanari Inoue atJohns Hopkins University School of Medicine, Baltimore, USA, and wasobtained through addgene (Watertown, MA, USA). The number of ex-periments is provided for each single experiment. Statistical differencesbetween samples were examined using paired and unpaired Student’s ttests, with significance assumed when p < 0.05, after variance homoge-neity of the samples were tested by F-test. Differences between more thantwo means were tested by using one-way ANOVA with a Bonferroni-Holmmultiple comparisons test (post-hoc test) with significance assumedwhen p < 0.05.
Funding information Supported by Deutsche Forschungsgemeinschaft(DFG)—project number A3, 387509280—SFB 1350.
Compliance with ethical standards
Conflict of interest The authors declare that they have no competinginterests.
Open Access This article is licensed under a Creative CommonsAttribution 4.0 International License, which permits use, sharing,adaptation, distribution and reproduction in any medium or format, aslong as you give appropriate credit to the original author(s) and thesource, provide a link to the Creative Commons licence, and indicate ifchanges weremade. The images or other third party material in this articleare included in the article's Creative Commons licence, unless indicated
670 J Mol Med (2020) 98:659–671
J Mol Med (2020) 98:659–671 671
otherwise in a credit line to the material. If material is not included in thearticle's Creative Commons licence and your intended use is notpermitted by statutory regulation or exceeds the permitted use, you willneed to obtain permission directly from the copyright holder. To view acopy of this licence, visit http://creativecommons.org/licenses/by/4.0/.
References
1. Ma M, Gallagher AR, Somlo S (2017) Ciliary mechanisms of cystformation in polycystic kidney disease. Cold Spring Harb PerspectBiol 9(11). https://doi.org/10.1101/cshperspect.a028209
2. Harris PC, Torres VE (2009) Polycystic kidney disease. Annu RevMed 60:321–337
3. Nauli SM, Alenghat FJ, Luo Y, Williams E, Vassilev P, Li X, EliaAE, Lu W, Brown EM, Quinn SJ, Ingber DE, Zhou J (2003)Polycystins 1 and 2 mediate mechanosensation in the primary cil-ium of kidney cells. Nat Genet 33:129–137
4. Fliegauf M, Benzing T, Omran H (2007) When cilia go bad: ciliadefects and ciliopathies. Nat Rev Mol Cell Biol 8:880–893
5. DellingM, DeCaen PG, Doerner JF, Febvay S, ClaphamDE (2013)Primary cilia are specialized calcium signalling organelles. Nature504:311–314
6. Mekahli D, Parys JB, Bultynck G, Missiaen L, de Smedt H (2013)Polycystins and cellular Ca2+ signaling. Cell Mol Life Sci 70:2697–2712
7. Buchholz B, Faria D, Schley G, Schreiber R, Eckardt KU,Kunzelmann K (2014) Anoctamin 1 induces calcium-activatedchloride secretion and tissue proliferation in polycystic kidney dis-ease. Kidney Int 85:1058–1067
8. Ruppersburg CC, Hartzell HC (2014) The Ca2+−activated Cl-channel ANO1/TMEM16A regulates primary ciliogenesis. MolBiol Cell 25:1793–1807
9. Forschbach V, Goppelt-Struebe M, Kunzelmann K et al (2015)Anoctamin 6 is localized in the primary cilium of renal tubular cellsand is involved in apoptosis-dependent cyst lumen formation. CellDeath Dis 6:e1899
10. Schreiber R, Kunzelmann K (2016) Expression of anoctamins inretinal pigment epithelium (RPE). Pflugers Arch 468:1921–1929
11. He M, Ye W, Wang WJ, Sison ES, Jan YN, Jan LY (2017)Cytoplasmic Cl(−) couples membrane remodeling to epithelialmorphogenesis. Proc Natl Acad Sci U S A 114:E11161–e11169
12. Kunzelmann K, Ousingsawat J, Benedetto R et al (2019) Contributionof anoctamins to cell survival and cell death. Cancers 19:E382
13. Jin X, Shah S, Liu Y et al (2013) Activation of the Cl- channelANO1 by localized calcium signals in nociceptive sensory neuronsrequires coupling with the IP3 receptor. Sci Signal 6:ra73
14. Cabrita I, Benedetto R, Fonseca A, Wanitchakool P, Sirianant L,Skryabin BV, Schenk LK, Pavenstädt H, Schreiber R, KunzelmannK (2017) Differential effects of anoctamins on intracellular calciumsignals. FASEB J 31:2123–2134
15. Gao da Y, Zhang BL, Leung MC et al (2016) Coupling of TRPV6and TMEM16A in epithelial principal cells of the rat epididymis. JGen Physiol 148:161–182
16. Wegierski T, Steffl D, Kopp C, Tauber R, Buchholz B, Nitschke R,Kuehn EW, Walz G, Köttgen M (2009) TRPP2 channels regulateapoptosis through the Ca2+ concentration in the endoplasmic retic-ulum. EMBO J 28:490–499
17. Delling M, Indzhykulian AA, Liu X, Li Y, Xie T, Corey DP,Clapham DE (2016) Primary cilia are not calcium-responsivemechanosensors. Nature 531:656–660
18. Gainullin VG, Hopp K, Ward CJ, Hommerding CJ, Harris PC(2015) Polycystin-1 maturation requires polycystin-2 in a dose-dependent manner. J Clin Invest 125:607–620
19. Sammels E, Devogelaere B, Mekahli D, Bultynck G, Missiaen L,Parys JB, Cai Y, Somlo S, de Smedt H (2010) Polycystin-2 activa-tion by inositol 1,4,5-trisphosphate-induced Ca2+ release requiresits direct association with the inositol 1,4,5-trisphosphate receptorin a signaling microdomain. J Biol Chem 285:18794–18805
20. Li Y, Santoso NG, Yu S, Woodward OM, Qian F, Guggino WB(2009) Polycystin-1 interacts with inositol 1,4,5-trisphosphate re-ceptor to modulate intracellular Ca2+ signaling with implicationsfor polycystic kidney disease. J Biol Chem 284:36431–36441
21. Woodward OM, Li Y, Yu S et al (2010) Identification of apolycystin-1 cleavage product, P100, that regulates store operatedCa entry through interactions with STIM1. PLoS One 5:e12305
22. Buchholz B, Teschemacher B, Schley G, Schillers H, Eckardt KU(2011) Formation of cysts by principal-like MDCK cells dependson the synergy of cAMP- and ATP-mediated fluid secretion. J MolMed 89:251–261
23. Buchholz B, Schley G, Faria D, Kroening S, Willam C, SchreiberR, Klanke B, Burzlaff N, Jantsch J, Kunzelmann K, Eckardt KU(2014) Hypoxia-inducible factor-1a causes renal cyst expansionthrough calcium-activated chloride secretion. J Am Soc Nephrol25:465–474
24. Kraus A, Grampp S, Goppelt-StruebeM, Schreiber R, KunzelmannK, Peters DJ, Leipziger J, Schley G, Schödel J, Eckardt KU,Buchholz B (2016) P2Y2R is a direct target of HIF-1alpha andmediates secretion-dependent cyst growth of renal cyst-formingepithelial cells. Purinergic Signal 12:687–695
25. Low SH, Vasanth S, Larson CH, Mukherjee S, Sharma N, Kinter MT,KaneME, Obara T, Weimbs T (2006) Polycystin-1, STAT6, and P100function in a pathway that transduces ciliary mechanosensation and isactivated in polycystic kidney disease. Dev Cell 10:57–69
26. Wang H, Zou L, Ma K et al (2017) Cell-specific mechanisms ofTMEM16A Ca2+−activated chloride channel in cancer. MolCancer 16:152
27. Lantinga-van Leeuwen IS, Leonhard WN, van der Wal A, BreuningMH, de Heer E, Peters DJ (2007) Kidney-specific inactivation of thePkd1 gene induces rapid cyst formation in developing kidneys and aslow onset of disease in adult mice. Hum Mol Genet 16:3188–3196
28. Mendes F,Wakefield J, Bachhuber Tet al (2005) Establishment andcharacterization of a novel polarized MDCK epithelial cellularmodel for CFTR studies. Cell Physiol Biochem 16:281–290
29. Kappes JC, Wu X, Wakefield JK (2003) Production of trans-lentiviralvector with predictable safety. Methods Mol Med 76:449–465
30. Schreiber R, Faria D, Skryabin BV, Wanitchakool P, Rock JR,Kunzelmann K (2015) Anoctamins support calcium-dependentchloride secretion by facilitating calcium signaling in adult mouseintestine. Pflügers Arch 467:1203–1213
31. Su S, Phua SC, DeRose R, Chiba S, Narita K, Kalugin PN, KatadaT, Kontani K, Takeda S, Inoue T (2013) Genetically encoded cal-cium indicator illuminates calcium dynamics in primary cilia. NatMethods 10:1105–1107
32. Ousingsawat J, Wanitchakool P, Kmit A et al (2015) Anoctamin 6mediates effects essential for innate immunity downstream ofP2X7-receptors in macrophages. Nat Commun 6:6245
33. Wu J, Prole DL, Shen Y, Lin Z, Gnanasekaran A, Liu Y, Chen L,Zhou H, Chen SR, Usachev YM, Taylor CW, Campbell RE (2014)Red fluorescent genetically encoded Ca2+ indicators for use inmitochondria and endoplasmic reticulum. Biochem J 464:13–22
34. KunzelmannK, Ousingsawat J, Cabrita I et al (2019) TMEM16A incystic fibrosis: activating or inhibiting? Front Pharmacol 29(10):13
Publisher’s note Springer Nature remains neutral with regard to jurisdic-tional claims in published maps and institutional affiliations.