augmenting static source views in ides with dynamic metrics
TRANSCRIPT

Augmenting Static Source Views in IDEs with Dynamic Metrics
David Röthlisberger1, Marcel Härry1, Alex Villazón2, Danilo Ansaloni2,Walter Binder2, Oscar Nierstrasz1, Philippe Moret2
1Software Composition Group, University of Bern, Switzerland2University of Lugano, Switzerland
Abstract
Mainstream IDEs such as Eclipse support developersin managing software projects mainly by offering staticviews of the source code. Such a static perspective ne-glects any information about runtime behavior. However,object-oriented programs heavily rely on polymorphism andlate-binding, which makes them difficult to understand justbased on their static structure. Developers thus resort to de-buggers or profilers to study the system’s dynamics. How-ever, the information provided by these tools is volatile andhence cannot be exploited to ease the navigation of thesource space. In this paper we present an approach toaugment the static source perspective with dynamic metricssuch as precise runtime type information, or memory andobject allocation statistics. Dynamic metrics can leveragethe understanding for the behavior and structure of a sys-tem. We rely on dynamic data gathering based on aspectsto analyze running Java systems. By solving concrete usecases we illustrate how dynamic metrics directly availablein the IDE are useful. We also comprehensively report onthe efficiency of our approach to gather dynamic metrics.
Keywords: dynamic analysis, development environ-ments, aspects, program comprehension
1 Introduction
Maintaining object-oriented systems is complicated bythe fact that conceptually related code is often scattered overa large source space. The use of inheritance, interface typesand polymorphism leads to hard to understand source code,as it is unclear which concrete methods are invoked at run-time at a polymorphic call site even in statically-typed lan-guages. As IDEs typically focus on browsing static sourcecode, they provide little help to reveal the execution pathsa system actually takes at runtime. However, being ableto, for instance, reconstruct the execution flow of a systemwhile working in the IDE, can lead to a better understandingand a more focused navigation of the source space. In this
paper we claim that developers can more efficiently main-tain object-oriented code in the IDE if the static views of theIDE are augmented with dynamic information.
The importance of execution path information becomesclear when inspecting Java applications employing abstractclasses or interfaces. Source code of such applications usu-ally refers to these abstract types, while at runtime concretetypes are used. However, locating the concrete class whosemethods are executed at runtime when the source code justrefers to interface types, can be extremely cumbersome withstatic navigation, since there may be a large number of con-crete implementations of a declared type. Similarly, whenexamining source code that invokes a particular method,a large list of candidate method implementations may begenerated. Static analysis alone will not tell you how fre-quently, if at all, each of these candidates is actually in-voked. However, such information is crucial to assess theperformance impact of particular code statements.
Developers usually resort to debuggers to determine theexecution flow of an application. However, information ex-tracted in a debugging session is volatile, that is, it disap-pears at the end of the session. Furthermore such informa-tion is bound to specific executions, so it cannot be usedin general to tell which runtime types occur how often at aspecific place in source code. To analyze and improve theperformance of a system, developers typically use profilers,which suffer from the same drawbacks as debuggers: nei-ther tool feeds aggregated information back to the IDE, thusdevelopers use them only occasionally instead of benefitingfrom runtime information directly in the static IDE views.
This paper presents an approach to dynamically analyzesystems, and to augment the static perspectives of IDEswith various dynamic metrics. To prototype this approachwe implemented Senseo, an Eclipse plugin that enables de-velopers to dynamically analyze Java applications. Senseoenriches the source views of Eclipse with several dynamicmetrics such as information about which concrete methodsa particular method invokes how often at runtime, whichmethods invoke this particular method, or how many ob-jects or how much memory is allocated in particular meth-

ods. These dynamic metrics are aggregated over severalruns of the subject system; the developer decides which runsto take into account. The paper contributes the following:(i) a technique to efficiently analyze systems dynamically,(ii) useful dynamic metrics for software maintenance, (iii)means to integrate these metrics in IDEs, and (iv) an evalu-ation of the efficiency and usefulness of the entire approach.
The paper is structured as follows: In Section 2 wepresent several concrete use cases highlighting the need fordynamic metrics available directly in the IDE. Section 3 il-lustrates our approach to integrate dynamic metrics in IDEs;we introduce Senseo, our prototype to augment Eclipse withdynamic metrics. In this section we also validate the prac-tical usefulness by solving the use cases from Section 2with Senseo. Section 4 explains our approach to gather dy-namic metrics from running applications and validates thisapproach with efficiency benchmarks. Section 5 presentsrelated work in the context of gathering dynamic data andits visualization. Finally, Section 6 concludes the paper.
2 Use Cases
Senseo aims primarily at supporting two typical usecases that arise when maintaining object-oriented softwaresystems. In the first use case developers attempt to gain anunderstanding of the execution paths and runtime types ofan object-oriented system employing complex hierarchiesincluding abstract classes and interfaces. In the second usecase, developers must improve the overall speed of the sys-tem due to critical performance issues. We summarize thedifficulties arising in each use case when the developer islimited to using the plain static views of a typical IDE.
Understanding abstract class and interface hierar-chies. As a case study we take the Eclipse JDT1, a set ofplug-ins implementing the Eclipse Java IDE. JDT encom-passes interfaces and classes modeling Java source codeartifacts such as classes, methods, fields, or local vari-ables. Figure 1 shows an extract of the JDT interfacesand classes representing static artifacts of a class. Clientsof this representation usually refer to interface types suchas IJavaElement or IJavaProject, as the followingcode snippet found in JavadocHover illustrates:
IJavaElement element = elements[0];if (element.getElementType() ==
IJavaElement.FIELD) {IJavaProject javaProject = element.getJavaProject();
} else if (element. getElementType() ==IJavaElement.LOCAL_VARIABLE) {IJavaProject javaProject = element.getParent().getJavaProject();
}
1http://www.eclipse.org/jdt
There is a problem in this code: For some elements the re-sulting javaProject is wrong or undefined. The devel-oper has the impression that the if conditions are not com-prehensive or not correct at all. Another possibility is thatthe method getJavaProject is wrongly implementedfor some element types. Thus the developer has severalquestions about this code:
1. Which getJavaProject methods are invoked?
2. Which types are stored in variable element; are allrelevant cases covered with if statements?
To answer these questions purely based on static infor-mation, we can use the references and declarations searchtool of Eclipse. For the first question, we search for alldeclarations of method getJavaProject. However, theJDT declares more than 20 methods with this name, most ofwhich are not related to the representation of source code el-ements. We have to skim through this list to find out whichdeclarations are defined in subtypes of IJavaElement.After having found those declarations, we still cannot besure which are actually invoked in this code.
To address the second question, we first search for allclasses implementing IJavaElement in the list of ref-erences to this interface. This yields a list with more than2000 elements; all are false positives as IJavaElement isnot supposed to be implemented by clients. We thus searchfor all sub-interfaces of IJavaElement to see whetherthose have implementing classes. After locating two directsub-interfaces (IMember and ILocalVariable), eachof which has more than 1000 references in JDT, we giveup searching for references to indirect sub-interfaces suchas IField or IType. It is not possible to statically findall concrete implementing classes of IJavaElement, inparticular not those actually used in this code.
Thus we resort to use the debugger. We find out thatelement is of type SourceField in one scenario. How-ever, we know that debuggers focus on specific runs, thuswe still cannot know all the different types element hasin this code. To reveal all types of element and allgetJavaProject methods invoked by this polymorphicmessage send, we would have to debug many more scenar-ios, which is very time-consuming as this code is executedmany times for each system run.
For all these reasons, it is much more convenient for adeveloper if the IDE itself could collect and show runtimeinformation aggregated over several runs together with thestatic structure, that is, augmenting Eclipse’s source codeviewer to show precisely which methods are invoked atruntime and how often, optionally even displaying runtimetypes for receiver, arguments, and return values.
Assessing runtime complexity. Running this codeshows that accessing the Java-project for some types of
2

Figure 1. JDT interface and class hierarchies representing Java source elements (extract).
source elements is remarkably slow. Developers addressingthe efficiency problem need to know for which types the im-plementation of getJavaProject is slow and why, thatis, for instance, whether the inefficient implementations cre-ate many objects or repeatedly execute code.
We tackle these questions by profiling this code exam-ple. The profiler indeed gives us answers about the code’sexecution performance, but similarly to debuggers, profil-ers also focus on specific runs of a system and hence onlyshow the efficiency of getJavaProject for the partic-ular types used in a specific run. In the profiled run, allexecuted getJavaProject methods are reasonably ef-ficient. However, it turns out that for very specific runsnot reproducible while profiling, very slow implementationsof getJavaProject are executed. The runtime perfor-mance of this method obviously depends heavily on the re-ceiver of the message send.
Thus, we need to have information about runtime com-plexity aggregated over multiple runs to pinpoint specificmethod executions being slow. We claim that it is bestto have such aggregated information in the IDE, at afine-grained method level to illustrate complexity, for in-stance, based on receivers of a message send, but also at amore coarse-grained level, for instance, entire packages orclasses, to allow candidate locations in source code for per-formance issues to be quickly identified at a glance. TheIDE itself should give general evidence about possible per-formance bottlenecks.
3 Integrating Dynamic Metrics in IDEs
In this section we present an approach to augment IDEswith dynamic metrics, towards the goal of supporting theunderstanding of runtime behavior of applications. We pro-totyped this approach in Senseo, a plugin for the Eclipse
Java IDE integrating dynamic metrics in familiar Eclipsetools such as package explorer, source editor, or rulercolumns (the vertical bars next to the editor view). Wefirst present the basic architecture of Senseo and second dis-cuss dynamic metrics that can leverage runtime understand-ing directly in the IDE. Third, we illustrate several practi-cal integrations and visualizations of these dynamic metricsbrought to Eclipse by Senseo. Eventually, we solve the usecases of Section 2 to validate how useful our approach is.
3.1 Architecture
Senseo uses MAJOR, an aspect weaving tool enablingcomprehensive aspect weaving into every class loaded in aJava VM, including the standard Java class library, vendorspecific classes, and dynamically generated classes. MA-JOR is based on the standard AspectJ [10] compiler andweaver and uses advanced bytecode instrumentation tech-niques to ensure portability [3]. MAJOR provides aspectsto gather runtime information of the application under in-strumentation. The collected data is used to build callingcontext profiles containing different dynamic metrics suchas number of created objects.
The application to be analyzed is executed in a separateapplication VM where MAJOR weaves the data gatheringaspect into every loaded class, while the Eclipse IDE runsin a standard VM to avoid perturbations. While the subjectsystem is still running, we periodically transfer the gathereddynamic data from the application VM to Eclipse using asocket. We do not have to halt the application to obtainits dynamic data. Senseo receives the transfered data, pro-cesses it and stores the aggregated information in its ownstorage system which is optimized for fast access from theIDE. Figure 2 gives an overview of the setup of our ap-proach.
3

StorageApp VM Sockets Eclipse VM
SenseoMAJORDyn. data
Figure 2. Setup to gather dynamic metrics.
To analyze the application dynamically within the IDE,developers have to execute it with Senseo. Before startingthe application, developers can define which dynamic met-rics should be gathered at runtime. By default, all pack-ages and classes of the application are dynamically ana-lyzed. However, developers can restrict the analysis to spe-cific classes or even methods to reduce the analysis over-head if only specific areas need to be observed. Extend-ing the analysis to also cover the standard Java class libraryis possible too. As soon as Eclipse receives dynamic dataover the socket from MAJOR, Senseo directly displays thedynamic metrics extracted from the transfered calling con-text profiles. Section 3.2 proposes useful dynamic metricsto gather and Section 3.3 illustrates means to integrate thesemetrics in Eclipse. Usually Senseo aggregates dynamic dataover all application runs executed with it, but developers canempty the storage and start afresh.
3.2 Dynamic Metrics
To support the use cases of Section 2, we integrate thefollowing dynamic metrics into the IDE.
Message sending. In object-oriented programs, under-standing how objects send messages to each other at run-time is crucial. We therefore extract the following informa-tion about message sends:
Invoked Methods. Often invoked methods are not imple-mented in the statically defined type (i.e., class), but in itssuper- or subtypes, when inheritance, respectively dynamicbinding, are used. Having information in the IDE aboutthe methods invoked is intended to help developers betterunderstand collaborations between objects and ease naviga-tion of the runtime execution flow.
Optionally, developers can ask to gather more informa-tion about message sends when starting the application withSenseo. Such additional information includes:
• Receiver types. Often sub-types of the type imple-menting the method receive the message send at run-time. Knowing receiver types and their frequency thusfurther increases program understanding.
• Argument types. Information about actual argumenttypes and their frequency increases the understandingfor a method, i.e., how it is used at runtime.
• Return types. As return values pass results from onemethod to another, knowing their types and their fre-quency helps developers to better understand com-munication between different methods, for instance,whether a null return value is to be expected.
Number of invocations. This dynamic metric helpsthe developer quickly identify hot spots in code, that is,very frequently invoked methods or classes containing suchmethods. Furthermore, methods never invoked at runtimebecome visible, which is useful when removing dead codeor extending the test coverage of the application’s test suite.Related to this metric is the number of invocations of othermethods triggered from a particular method.
Number of created objects. By reading static sourcecode, a developer usually cannot tell how many objects arecreated at runtime in a class, in a method or in a line ofsource code. It is unclear whether a source artifact createsone or one thousand objects — or none at all. This dynamicmetric, however, is useful to assess the costs imposed bythe execution of a source artifact, to locate inefficient code,or to discover potential problems, for instance inefficientalgorithms creating enormous numbers of objects.
Allocated memory. Different objects vary in memorysize. Having many but very tiny objects might not be anissue, whereas creating a few but very huge objects couldbe a sign of an efficiency problem. Hence, we also pro-vide a dynamic metric recording memory usage of varioussource artifacts such as classes or methods. This metric canbe combined with the number of created objects metric toreveal which types of objects consume most memory andthus are candidates for optimization.
3.3 Enhancements to the IDE
All these dynamic metrics are seamlessly integratedwith the static perspective provided by the Eclipse IDE.This ensures that the dynamic metrics augment the staticview of a system. In the following we describe how theavailable dynamic metrics augment the IDE.
Source code enhancements. As a technique to comple-ment source code without impeding its readability we optedto use hovers, small windows that pop up when the mousehovers over a source element (a method name, a variable,etc.). Hovers are interactive, which means the developer canfor instance open the class of a receiver type by clicking onit. We now describe the integration of dynamic metrics withSenseo:
Method header. The hover that appears on mouse overthe method name in a method header shows (i) all sendersinvoking that particular method, (ii) all callees, that is, allmethods invoked by this method, and optionally (iii) all
4
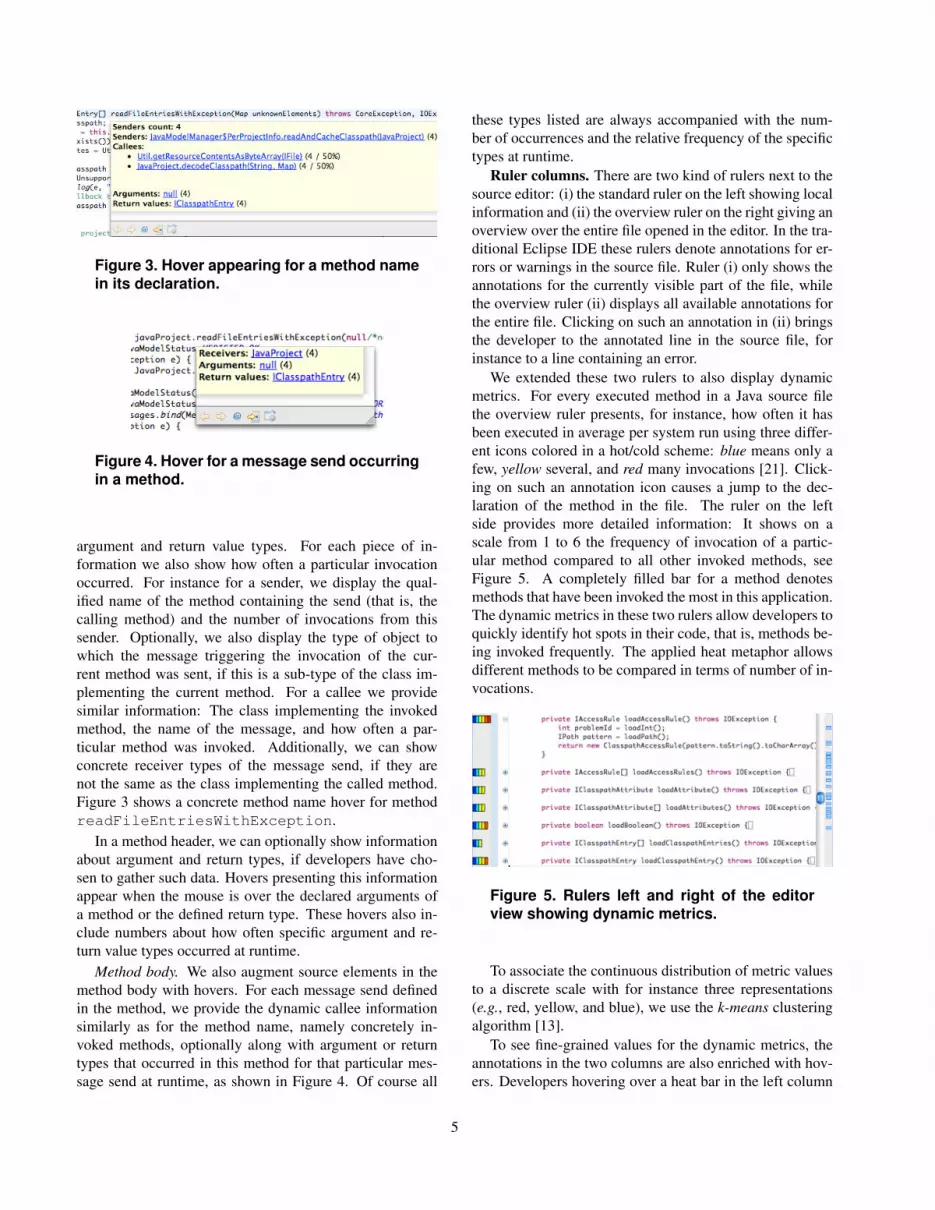
Figure 3. Hover appearing for a method namein its declaration.
Figure 4. Hover for a message send occurringin a method.
argument and return value types. For each piece of in-formation we also show how often a particular invocationoccurred. For instance for a sender, we display the qual-ified name of the method containing the send (that is, thecalling method) and the number of invocations from thissender. Optionally, we also display the type of object towhich the message triggering the invocation of the cur-rent method was sent, if this is a sub-type of the class im-plementing the current method. For a callee we providesimilar information: The class implementing the invokedmethod, the name of the message, and how often a par-ticular method was invoked. Additionally, we can showconcrete receiver types of the message send, if they arenot the same as the class implementing the called method.Figure 3 shows a concrete method name hover for methodreadFileEntriesWithException.
In a method header, we can optionally show informationabout argument and return types, if developers have cho-sen to gather such data. Hovers presenting this informationappear when the mouse is over the declared arguments ofa method or the defined return type. These hovers also in-clude numbers about how often specific argument and re-turn value types occurred at runtime.
Method body. We also augment source elements in themethod body with hovers. For each message send definedin the method, we provide the dynamic callee informationsimilarly as for the method name, namely concretely in-voked methods, optionally along with argument or returntypes that occurred in this method for that particular mes-sage send at runtime, as shown in Figure 4. Of course all
these types listed are always accompanied with the num-ber of occurrences and the relative frequency of the specifictypes at runtime.
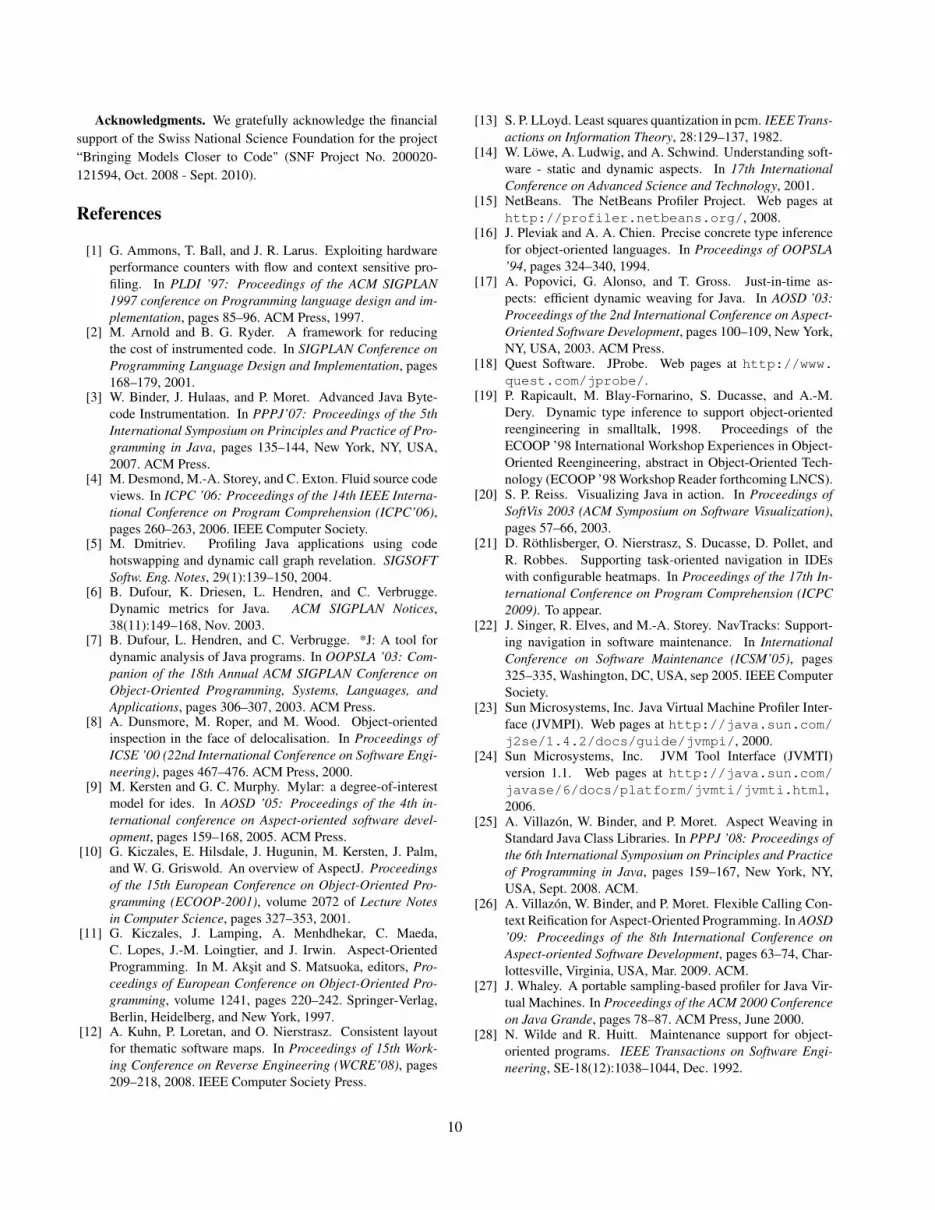
Ruler columns. There are two kind of rulers next to thesource editor: (i) the standard ruler on the left showing localinformation and (ii) the overview ruler on the right giving anoverview over the entire file opened in the editor. In the tra-ditional Eclipse IDE these rulers denote annotations for er-rors or warnings in the source file. Ruler (i) only shows theannotations for the currently visible part of the file, whilethe overview ruler (ii) displays all available annotations forthe entire file. Clicking on such an annotation in (ii) bringsthe developer to the annotated line in the source file, forinstance to a line containing an error.
We extended these two rulers to also display dynamicmetrics. For every executed method in a Java source filethe overview ruler presents, for instance, how often it hasbeen executed in average per system run using three differ-ent icons colored in a hot/cold scheme: blue means only afew, yellow several, and red many invocations [21]. Click-ing on such an annotation icon causes a jump to the dec-laration of the method in the file. The ruler on the leftside provides more detailed information: It shows on ascale from 1 to 6 the frequency of invocation of a partic-ular method compared to all other invoked methods, seeFigure 5. A completely filled bar for a method denotesmethods that have been invoked the most in this application.The dynamic metrics in these two rulers allow developers toquickly identify hot spots in their code, that is, methods be-ing invoked frequently. The applied heat metaphor allowsdifferent methods to be compared in terms of number of in-vocations.
Figure 5. Rulers left and right of the editorview showing dynamic metrics.
To associate the continuous distribution of metric valuesto a discrete scale with for instance three representations(e.g., red, yellow, and blue), we use the k-means clusteringalgorithm [13].
To see fine-grained values for the dynamic metrics, theannotations in the two columns are also enriched with hov-ers. Developers hovering over a heat bar in the left column
5

or over the annotation icon in the right bar get a hover dis-playing precise metric values, for instance exact total num-bers of invocations or even number of invocations from spe-cific methods or receiver types.
Furthermore, developers can choose between differentdynamic metrics to be visualized in the rulers. Besidesnumber of invocations of methods, we also provide metricssuch as the number of objects a method creates, the num-ber of bytecodes it executes, and the amount of memoryit allocates, either on average or in total over all executions.Such metrics allow developers to quickly assess the runtimecomplexity of specific methods and thus to locate candidatemethods for optimization. Changing the dynamic metrics tobe displayed is done in the Eclipse preferences; the chosenmetric is immediately displayed in the rulers.
Package Explorer. The package explorer is the primarytool in Eclipse to locate packages and classes of an applica-tion. Senseo augments the package explorer with dynamicinformation to guide the developer at a high level to thesource artifacts of interest, for instance to classes creatingmany objects. For that purpose, we annotate packages andclasses in the explorer tree with icons denoting the degreewith which they contribute to the selected dynamic metricsuch as amount of allocated memory. A class for instanceaggregates the metric value of all its methods, a package thevalue of all its classes. Similar to the overview ruler the met-ric values are mapped to three different package explorericons: blue, yellow, and red, representing a heat coloringscheme [21].
3.4 Evaluation
In Section 2 we raised two questions about a typical codeexample from the Eclipse JDT. We show that with Senseodevelopers can answer such questions directly in the sourceperspective of Eclipse.
First, to determine the getJavaProject methodsinvoked in the given code example, developers hold themouse over the call site written in source code to get ahover mentioning all distinct methods that have been in-voked at runtime at this call site, along with the number ofinvocations. This hover saves us from browsing the stat-ically generated list of more than 20 declarations of thismethod by showing us precisely the actually invoked meth-ods. Second, to find out which types of objects have beenstored in element, we can look at the method call togetElementType, whose statically defined receiver isthe variable element. The hover can also show the run-time receiver types of a message send, which are all typesstored in element in this case. It turns out that the typesof element are SourceField, LocalVariable, butalso SourceMethod, thus the if statements in this codehave to be extended to also cover SourceMethod ele-
ments. We were unable to statically elicit this information.To assess the efficiency of the various invoked
getJavaProject methods, we navigate to the decla-ration of each such method. The dynamic metrics in theruler columns reveal how complex an invocation of thismethod is, that is for instance how many objects an invo-cation creates in average, even depending on the receivertype. Thanks to these metrics we find out that if the receiverof getJavaProject is of type LocalVariable, thecode searches iteratively in the chain of parents of this localvariable for a defined Java-project. We can optimize this bysearching directly in the enclosing type of the local variable.
4 Dynamic Metrics Collection
In this section we first explain our approach to dynamicmetrics collection and afterwards investigate its overhead.
4.1 Aspect-based Calling Context TreeConstruction
Senseo requires support for flexibly aggregating dynamicmetrics in various ways. For instance, runtime type infor-mation is needed separately for each pair of caller and calleemethods, while memory allocation metrics need to be ag-gregated for the whole execution of a method (including theexecution of its direct and indirect callees). In order to sup-port different ways of aggregating metrics, we resort to ageneric datastructure that is able to hold different metricsfor each executed calling context. The Calling Context Tree(CCT) [1] perfectly fits this requirement. Figure 6 illus-trates a code snippet together with the corresponding CCT(showing only method invocation counts as metric).
Each CCT node stores dynamic metrics and refers to anidentifier of the target method for which the metrics havebeen collected. It also has links to the parent and childnodes for navigation in the CCT. Our CCT representationis designed for extensibility so that additional metrics canbe easily integrated.
CCT construction and collection of dynamic metricscan be implemented either with a modified Java Vir-tual Machine (JVM), or through a profiling agent imple-mented in native code using the standard JVM tool inter-face (JVMTI) [24], or with the aid of program transfor-mation respectively bytecode instrumentation techniques.For portability and compatibility reasons, we chose the lat-ter approach. However, instead of using a low-level byte-code engineering library for implementing the instrumen-tation, we rely on high-level aspect-oriented programming(AOP) [11] techniques in order to specify CCT constructionand metrics collection as an aspect. This approach not onlyresults in a compact implementation, but it ensures ease ofmaintenance and extension.
6

Calling Context Tree
}
}
h();
for(int i=1;i<=10;++i) {
void f() {
for(int j=1;j<=i;++j) {
void h() { return; }
void g(int i) {
}
h();
}
#calls = 55
#calls = 10#calls = 10
#calls = 1
h()
g(int)h()
f()
Code Sample
g(i);
Figure 6. Sample code and its correspondingCCT
Our implementation leverages MAJOR [25, 26], an as-pect weaver based on AspectJ [10] offering two distinguish-ing features. First, MAJOR allows for complete methodcoverage. That is, all methods executing in the JVM (af-ter it has completed bootstrapping) can be woven, includ-ing methods in the standard Java class library. Second,MAJOR provides efficient access to complete calling con-text information through customizable, thread-local shadowstacks. Using the new pseudo-variables thisStack andthisSP, the aspect gets access to the array holding the cur-rent thread’s shadow stack, respectively to the array index(shadow stack pointer) corresponding to the currently exe-cuting method.
Figure 7 illustrates three advices2 of our aspect forCCT construction and dynamic metrics collection. In theCCTAspect, each thread generates a separate, thread-localCCT. The shadow stack is an array of CCTNode instances,representing nodes in the thread-local CCT. A special rootnode is stored at position zero. Periodically, after a con-figurable number of profiled method calls, each thread in-tegrates its thread-local CCT into a shared CCT in a syn-chronized manner. This approach reduces contention onthe shared CCT, yielding significant overhead reduction incomparison with an alternative solution where all threadsdirectly update a shared CCT upon each method invoca-tion. Because of space limitations, the details of periodicCCT integration are not shown in Figure 7.
The first advice in Figure 7 intercepts method en-tries and pushes the CCTNode representing the invokedmethod onto the shadow stack. To this end, it getsthe caller’s CCTNode instance from the shadow stack(i.e. at position sp-1) and invokes the profileCall
2Aspects specify pointcuts to intercept certain points in the executionof programs (so-called join points), such as method calls, fields access,etc. Before, after, or around the intercepted join points specified advicesare executed. Advices are methods that have access to some contextualinformation of the join points.
before() : execution(* *(..)) {CCTNode[] ss = thisStack;int sp = thisSP;ss[sp] = ss[sp--1].profileCall(thisJoinPointStaticPart);ss[sp].storeRcvArgsRuntimeTypes(thisJoinPoint);
}
after() returning(Object o) :execution(* *(..)) {
CCTNode[] ss = thisStack;int sp = thisSP;ss[sp].storeRetRuntimeType(o);ss[sp] = null;
}
after() returning(Object o) :call(*.new(..)) {
CCTNode[] ss = thisStack;int sp = thisSP;ss[sp].storeObjAlloc(o);
}...
}
Figure 7. Simplified excerpt of the CCTAspect
method, which takes as argument an identifier of the calleemethod. We use static join points, accessed through As-pectJ’s thisJoinPointStaticPart pseudo-variable,to uniquely identify method entries; they provide infor-mation about the method signature, modifiers, etc. TheprofileCall method returns the callee’s CCTNode in-stance and increments its invocation counter; if the samecallee has not been invoked in the same calling context be-fore, a new CCTNode instance is created as child of thecaller’s node.
The second advice in Figure 7 deals with normal methodcompletion, popping the method’s entry from the shadowstack. For simplicity, here we do not show cleanup of theshadow stack in the case of abnormal method completionthrowing an exception [26].
The third advice in Figure 7 intercepts object in-stantiations to keep track of the number of created ob-jects and of allocated memory for each calling con-text. The method storeObjAlloc(Object) usesthe object size estimation functionality provided by thejava.lang.instrumentation API (which is ex-posed to the aspect) to update the memory allocation statis-tics in the corresponding CCTNode instance.
In addition to the number of method invocations andto the object allocation metrics, the CCTAspect collectsthe runtime types of receiver, arguments, and result. Forreceiver and arguments, this functionality is implementedin method storeRcvArgsRuntimeTypes used uponmethod entry. It takes a dynamic join point instance,
7

which is accessed through AspectJ’s thisJoinPointpseudo-variable in the advice. The dynamic join pointinstance provides references to the receiver and to themethod arguments. Upon method completion, thestoreRetRuntimeType method stores the runtimetype of the result. The result object is passed as contextinformation (returning(Object o)) to the advice.
During the execution, the aspect also takes care of peri-odically sending the collected metrics to the Senseo pluginin the IDE. Upon metrics transmission, thread-local CCTsof terminated threads are first integrated into the sharedCCT. Afterwards, the shared CCT is traversed to aggregatethe metrics as required by Senseo. Finally, the aggregatedmetrics are sent to the plugin through a socket. Metrics ag-gregation and serialization may proceed in parallel with theprogram threads, since they operate on thread-local CCTsmost of the time.
4.2 Performance
We evaluate our approach in two different settings. Weuse MAJOR3 version 0.5 with AspectJ4 version 1.6.2 andthe SunJDK 1.6.0_13 Hotspot Server Virtual Machine.
In the first setting, we assess the overhead caused by thecollection of dynamic metrics using the standard DaCapobenchmark suite5; we also explore the different sources ofoverhead and their contributions to the overall overhead.We focus only on the performance of MAJOR and excludethe overhead of communication with the Senseo plugin.MAJOR is configured to ensure complete method cover-age, profiling also execution within the Java class library. Inthe first setting, our measurement environment is a 16-coremachine running RedHat Enterprise Linux 5.2 (Intel Xeon,2.4GHz, 16GB RAM). We chose a high-end machine in or-der to speed up the benchmarking process, and each mea-surement represents the median of the overhead factor of 15runs within the same JVM process. In the second setting,we measure end-to-end performance of our system (i.e., in-cluding MAJOR and Senseo), as experienced by the user.In this setting, we use a typical developer machine (IntelCore 2 Duo, 2.16Ghz, 2GB RAM).
Setting 1. Figure 8 illustrates the overhead due to theCCTAspect. We explore and seggregate the overhead con-tributions of shadow stack maintenance, of CCT construc-tion, and of collecting memory allocation metrics.
The geometric mean of the overhead for all the bench-marks is factor 3.98, while the maximum overhead is fac-tor 8.75 for “xalan”. The biggest part of this overhead stemsfrom CCT creation, which is particularly expensive in thepresence of recursions. The collection of memory alloca-
3http://www.inf.unisi.ch/projects/ferrari4http://www.eclipse.org/aspectj/5http://dacapobench.org/
1.64
3.27
1.48 1.45 1.46 1.37 1.641.30 1.08 1.44 1.31
4.61
3.99
1.831.55 1.37
1.21
2.42
1.59
0.35
2.41
6.84
0.61
0.33
0.030.17
0.430.06
0.04
0.04
0.60
0.07
0.60
1
2
3
4
5
6
7
8
9
antlr bloat chart eclipse fop hsqldb jython luindexlusearch pmd xalan
OverheadFactor
Alloca;onMetrics
CCTConstruc;on
ShadowStack
Figure 8. Overhead of shadow stack creation,CCT construction, and collection of memoryallocation metrics
tion metrics causes relatively little overhead, because objectalloction is far less frequent than method invocation and thecorresponding advice can directly access the CCTNode thathas to be updated on the top of the shadow stack.
Setting 2. In order to assess end-to-end performance ofour system, we measure the overhead of running an ap-plication with Senseo. As a case study, we ran Eclipseitself as target application and analyzed the usage of theJDT core. Without Senseo, starting and terminating Eclipsetakes 53 seconds; executing the same scenario with Senseotakes 188 seconds, i.e., the overhead is 255%. This over-head includes the collection of all dynamic metrics dis-cussed in this paper within all JDT core classes, metricsaggregation, data transmission through a socket, and vi-sualization of the data in the developer’s Eclipse environ-ment. Eclipse is conveniently usable while being analyzed.Considering that the JDT is a large application consistingof more than 1000 classes and approximately 16000 meth-ods, our measurements confirm that our approach is practi-cal also for large workloads.
5 Related Work
5.1 Metrics Collection
JFluid exploits dynamic bytecode instrumentation andcode hotswapping to collect dynamic metrics [5]. JFluiduses a hard-coded, low-level instrumentation to collectgross time for a single code region and to build a Call-ing Context Tree (CCT) augmented with accumulated ex-ecution time for individual methods. In contrast, we use aflexible, high-level, aspect-based approach to specify CCTconstruction and dynamic metrics collection, which eases
8

customization and extension. In addition, JFluid relies ona customized JVM, whereas our tools are fully portableand compatible with standard JVMs. Similar to Senseo,JFluid runs the application under instrumentation in a sepa-rate JVM, which communicates with the visualization partthrough a socket and also through shared memory. JFluid isa pure profiling tool, whereas Senseo was designed to sup-port program understanding and maintenance. The JFluidtechnology is integrated into the NetBeans Profiler [15].
Dufour et al. [6] present a variety of dynamic metricsfor Java programs. They introduce a tool called *J [7] formetrics measurement. In contrast to our fully portable ap-proach, *J relies on the Java Virtual Machine Profiler Inter-face (JVMPI) [23], which is known to cause high perfor-mance overhead and requires profiler agents to be writtenin native code. Other profilers based on the JVMPI or itssuccessor, the JVM Tool Interface (JVMTI) [24], such asJProfiler 6 or JProbe [18] also suffer from platform depen-dence and from limited extensibility.
PROSE [17] provides aspect support within the JVM,which may ease the collection of certain dynamic metricswith aspects, thanks to the direct access to JVM internals.PROSE combines bytecode instrumentation and aspect sup-port at the just-in-time compiler level. It does not supportaspect weaving in the standard Java class library, a distin-guishing feature of MAJOR.
Sampling-based profiling techniques, which are oftenused for feedback-directed optimizations in dynamic com-pilers [2,27], help significantly reduce the overhead of met-rics collection. However, sampling produces incompleteand possibly inaccurate information, whereas Senseo re-quires complete and exact metrics for all executed methods.Hence, we rely on MAJOR to comprehensively weave ouraspect into all methods in the system.
Dynamic analyses based on tracing mechanisms tradi-tionally focus on capturing a call tree of message sends,but existing approaches do not bridge the gap between dy-namic behavior and the static structure of a program [8,28].Our work aims at incorporating the information obtainedthrough dynamic analyses into the IDE and thus connectingthe static structure with the dynamic behavior of the system.
With static analysis, especially with static type infer-ence [16], it is possible to gain insights into the types thatvariables assume at runtime. However, static type inferenceis a computationally expensive task and cannot always pro-vide precise results in the context of object-oriented lan-guages [19]. Furthermore, static analysis does not coverdynamically generated code, although dynamic bytecodegeneration is a common technique, for instance used in the“jython” benchmark of the DaCapo suite.
6http://www.ej-technologies.com/products/jprofiler
5.2 Augmenting IDEs
Reiss [20] visualizes the dynamics of Java programs inreal time, e.g., the number of message sends received by aclass. Löwe et al. [14] follows a similar approach by merg-ing information from static analysis with information fromdynamic analysis to generate visualizations. The visualiza-tions of these two approaches are not tightly integrated in anIDE though, but are provided by a separated tool. Thus, itis not directly possible to use these analyses while workingwith source code. We consider it as crucial to incorporateknowledge about the dynamics of programs into the IDE toease navigating within the source space.
Other approaches ease and support the navigation oflarge software systems by different means than programanalysis. For instance, NavTracks [22] keeps track of thenavigation history of software developers. Using this his-tory, NavTracks forms associations between related sourcefiles (e.g., class files) and can hence present a recommen-dation list of entities related to the current selected sourcefile, that is, source files developers browsed in the pastalong with the currently selected file. Mylar [9] computesa degree-of-interest value for each source artifact based onhistorical navigation. The relative degree-of-interest of ar-tifacts is highlighted using colors — interesting entities areassigned a “hot” color. We also use heat colors to denote thedegree of dynamic metrics such as number of invocations,but base our model on dynamic data.
6 Conclusions
In this paper we motivated the integration of dynamicinformation into IDEs such as Eclipse to ease maintain-ing object-oriented applications written in languages suchas Java. We presented Senseo, an Eclipse plugin enablingdevelopers to dynamically analyze their applications fromwithin Eclipse. Senseo uses aspect-oriented programmingtechniques to gather runtime data from the system. Senseopresents gathered dynamic metrics such as execution flowinformation, runtime type information, numbers of methodinvocations, or amount of memory executed by augmentingthe familiar static source views (package explorer, sourceeditor, etc.). For instance, Senseo integrates dynamic met-rics in hovers, in the ruler columns of the editor, or by an-notating icons in the package explorer. We evaluated ourwork by solving concrete, practical use cases with Senseoand by thoroughly conducting performance benchmarks, asefficiency is most critical when it comes to dynamic analy-sis. Senseo as a tool is described in more detail in a separatetool demonstration paper. We plan to exploit the dynamicdata gathered with Senseo by other means than augmentingthe source perspective, for instance by visualizing the datain software maps [12].
9
Acknowledgments. We gratefully acknowledge the financialsupport of the Swiss National Science Foundation for the project“Bringing Models Closer to Code" (SNF Project No. 200020-121594, Oct. 2008 - Sept. 2010).
References
[1] G. Ammons, T. Ball, and J. R. Larus. Exploiting hardwareperformance counters with flow and context sensitive pro-filing. In PLDI ’97: Proceedings of the ACM SIGPLAN1997 conference on Programming language design and im-plementation, pages 85–96. ACM Press, 1997.
[2] M. Arnold and B. G. Ryder. A framework for reducingthe cost of instrumented code. In SIGPLAN Conference onProgramming Language Design and Implementation, pages168–179, 2001.
[3] W. Binder, J. Hulaas, and P. Moret. Advanced Java Byte-code Instrumentation. In PPPJ’07: Proceedings of the 5thInternational Symposium on Principles and Practice of Pro-gramming in Java, pages 135–144, New York, NY, USA,2007. ACM Press.
[4] M. Desmond, M.-A. Storey, and C. Exton. Fluid source codeviews. In ICPC ’06: Proceedings of the 14th IEEE Interna-tional Conference on Program Comprehension (ICPC’06),pages 260–263, 2006. IEEE Computer Society.
[5] M. Dmitriev. Profiling Java applications using codehotswapping and dynamic call graph revelation. SIGSOFTSoftw. Eng. Notes, 29(1):139–150, 2004.
[6] B. Dufour, K. Driesen, L. Hendren, and C. Verbrugge.Dynamic metrics for Java. ACM SIGPLAN Notices,38(11):149–168, Nov. 2003.
[7] B. Dufour, L. Hendren, and C. Verbrugge. *J: A tool fordynamic analysis of Java programs. In OOPSLA ’03: Com-panion of the 18th Annual ACM SIGPLAN Conference onObject-Oriented Programming, Systems, Languages, andApplications, pages 306–307, 2003. ACM Press.
[8] A. Dunsmore, M. Roper, and M. Wood. Object-orientedinspection in the face of delocalisation. In Proceedings ofICSE ’00 (22nd International Conference on Software Engi-neering), pages 467–476. ACM Press, 2000.
[9] M. Kersten and G. C. Murphy. Mylar: a degree-of-interestmodel for ides. In AOSD ’05: Proceedings of the 4th in-ternational conference on Aspect-oriented software devel-opment, pages 159–168, 2005. ACM Press.
[10] G. Kiczales, E. Hilsdale, J. Hugunin, M. Kersten, J. Palm,and W. G. Griswold. An overview of AspectJ. Proceedingsof the 15th European Conference on Object-Oriented Pro-gramming (ECOOP-2001), volume 2072 of Lecture Notesin Computer Science, pages 327–353, 2001.
[11] G. Kiczales, J. Lamping, A. Menhdhekar, C. Maeda,C. Lopes, J.-M. Loingtier, and J. Irwin. Aspect-OrientedProgramming. In M. Aksit and S. Matsuoka, editors, Pro-ceedings of European Conference on Object-Oriented Pro-gramming, volume 1241, pages 220–242. Springer-Verlag,Berlin, Heidelberg, and New York, 1997.
[12] A. Kuhn, P. Loretan, and O. Nierstrasz. Consistent layoutfor thematic software maps. In Proceedings of 15th Work-ing Conference on Reverse Engineering (WCRE’08), pages209–218, 2008. IEEE Computer Society Press.
[13] S. P. LLoyd. Least squares quantization in pcm. IEEE Trans-actions on Information Theory, 28:129–137, 1982.
[14] W. Löwe, A. Ludwig, and A. Schwind. Understanding soft-ware - static and dynamic aspects. In 17th InternationalConference on Advanced Science and Technology, 2001.
[15] NetBeans. The NetBeans Profiler Project. Web pages athttp://profiler.netbeans.org/, 2008.
[16] J. Pleviak and A. A. Chien. Precise concrete type inferencefor object-oriented languages. In Proceedings of OOPSLA’94, pages 324–340, 1994.
[17] A. Popovici, G. Alonso, and T. Gross. Just-in-time as-pects: efficient dynamic weaving for Java. In AOSD ’03:Proceedings of the 2nd International Conference on Aspect-Oriented Software Development, pages 100–109, New York,NY, USA, 2003. ACM Press.
[18] Quest Software. JProbe. Web pages at http://www.quest.com/jprobe/.
[19] P. Rapicault, M. Blay-Fornarino, S. Ducasse, and A.-M.Dery. Dynamic type inference to support object-orientedreengineering in smalltalk, 1998. Proceedings of theECOOP ’98 International Workshop Experiences in Object-Oriented Reengineering, abstract in Object-Oriented Tech-nology (ECOOP ’98 Workshop Reader forthcoming LNCS).
[20] S. P. Reiss. Visualizing Java in action. In Proceedings ofSoftVis 2003 (ACM Symposium on Software Visualization),pages 57–66, 2003.
[21] D. Röthlisberger, O. Nierstrasz, S. Ducasse, D. Pollet, andR. Robbes. Supporting task-oriented navigation in IDEswith configurable heatmaps. In Proceedings of the 17th In-ternational Conference on Program Comprehension (ICPC2009). To appear.
[22] J. Singer, R. Elves, and M.-A. Storey. NavTracks: Support-ing navigation in software maintenance. In InternationalConference on Software Maintenance (ICSM’05), pages325–335, Washington, DC, USA, sep 2005. IEEE ComputerSociety.
[23] Sun Microsystems, Inc. Java Virtual Machine Profiler Inter-face (JVMPI). Web pages at http://java.sun.com/j2se/1.4.2/docs/guide/jvmpi/, 2000.
[24] Sun Microsystems, Inc. JVM Tool Interface (JVMTI)version 1.1. Web pages at http://java.sun.com/javase/6/docs/platform/jvmti/jvmti.html,2006.
[25] A. Villazón, W. Binder, and P. Moret. Aspect Weaving inStandard Java Class Libraries. In PPPJ ’08: Proceedings ofthe 6th International Symposium on Principles and Practiceof Programming in Java, pages 159–167, New York, NY,USA, Sept. 2008. ACM.
[26] A. Villazón, W. Binder, and P. Moret. Flexible Calling Con-text Reification for Aspect-Oriented Programming. In AOSD’09: Proceedings of the 8th International Conference onAspect-oriented Software Development, pages 63–74, Char-lottesville, Virginia, USA, Mar. 2009. ACM.
[27] J. Whaley. A portable sampling-based profiler for Java Vir-tual Machines. In Proceedings of the ACM 2000 Conferenceon Java Grande, pages 78–87. ACM Press, June 2000.
[28] N. Wilde and R. Huitt. Maintenance support for object-oriented programs. IEEE Transactions on Software Engi-neering, SE-18(12):1038–1044, Dec. 1992.
10