three-dimensional densitometry imaging of diatom cells using stim tomography
TRANSCRIPT
www.elsevier.com/locate/nimb
Nuclear Instruments and Methods in Physics Research B 249 (2006) 653–659
NIMBBeam Interactions
with Materials & Atoms
Three-dimensional densitometry imaging of diatom cells usingSTIM tomography
C. Habchi a,*, D.T. Nguyen a, G. Deves b, S. Incerti a, L. Lemelle c, P. Le Van Vang a,Ph. Moretto a, R. Ortega b, H. Seznec a, A. Sakellariou d, C. Sergeant b, A. Simionovici c,
M.D. Ynsa a, E. Gontier a, M. Heiss a, T. Pouthier a, A. Boudou e, F. Rebillat f
a Centre d’Etudes Nucleaires de Bordeaux Gradignan, Le Haut-Vigneau, BP 120, 33175 Gradignan Cedex, Franceb Chimie Nucleaire Analytique et Bioenvironnementale, Le Haut-Vigneau, BP 120, 33175 Gradignan Cedex, France
c Laboratoire de Sciences de la Terre, Ecole Normale Superieure de Lyon, 46 Allee d’Italie, 69007 Lyon, Franced Research School of Physical Sciences and Engineering, The Australian National University, Canberra, ACT 0200, Australia
e Laboratoire d’Ecophysiologie et d’Ecotoxicologie des Systemes Aquatiques, Station marine d’Arcachon, Place du Dr Peyneau, 33120 Arcachon, Francef Laboratoire des Composites Thermostructuraux, CNRS-Snecma-CEA-UB1, 33405 Talence Cedex, France
Available online 12 May 2006
Abstract
Scanning transmission ion microscopy tomography (STIM-T) was carried out on diatom cells with the aim of displaying their 3Dstructure and performing density measurements on their silica skeleton. Two software packages were compared for data reduction:TomoRebuild, based on a simple filtered backprojection algorithm, and DISRA, an iterative program. Silicon carbide microfibres ofknown density were also analysed as reference specimens. Similar results were obtained with both algorithms, demonstrating the abilityof STIM-T to provide density measurements at the cell level without requiring any standard calibration samples. This unique featurestresses the interest of STIM-T to accurately normalise X ray emission micro-tomography data from synchrotron radiation (SXRF: syn-chrotron radiation X-ray fluorescence) or ion beam sources (PIXE: particle induced X-ray emission). Possible enhancements of theDISRA code are discussed in order to facilitate its use for the reconstruction of future PIXE/STIM tomography data. A ‘‘nanoprobe’’coupled to a Singletron� accelerator, allowing a spatial resolution of a few tens of nanometers, is going to be built in the coming monthsat the Centre d’Etudes Nucleaires de Bordeaux Gradignan (CENBG). This new facility will bring promising applications in imaging andanalysis at the sub-cellular level.� 2006 Elsevier B.V. All rights reserved.
PACS: 07.78.+s; 87.64.�t; 87.17.�d
Keywords: Scanning transmission ion microscopy; Computed tomography; Micro-tomography; Diatom cell; 3D imaging; Non-destructive character-isation; Nuclear microprobe
1. Introduction
The observation of chemical compounds like anticancerdrugs or toxic elements in biological tissues or within cellsis a major issue of biology and medicine. Such specimens, afew tenths to a few hundreds micrometers in size, can be
0168-583X/$ - see front matter � 2006 Elsevier B.V. All rights reserved.
doi:10.1016/j.nimb.2006.03.074
* Corresponding author. Tel.: +33 5 57 12 08 98; fax: +33 5 57 12 08 01.E-mail address: [email protected] (C. Habchi).
explored in a non-destructive way using ion beam orsynchrotron radiation analysis techniques, allowing two-dimensional (2D) imaging (STIM: scanning transmissionion microscopy/synchrotron X-ray absorption) and localconcentration determination (PIXE: particle inducedX-ray emission/SXRF: synchrotron radiation X-ray fluo-rescence). However a 2D study is not always suited toapplications at the cell level: for instance some fragilespecimens like small cell aggregates cannot be sectionedwithout resin embedding; moreover the localisation of

654 C. Habchi et al. / Nucl. Instr. and Meth. in Phys. Res. B 249 (2006) 653–659
particular compounds from 2D mapping can sometimes beambiguous. An answer to these specific problems can befound in coupling these techniques to computed tomogra-phy, allowing then a complete 3D study.
A few years ago the feasibility of STIM and PIXEtomography at the cell level was demonstrated at CENBGon human cancer cells [1]. In the same years SXRF tomog-raphy was developed at ESRF (European SynchrotronRadiation Facility) [2] but has only recently been appliedto unicellular diatom samples [3]. A major issue of thesetechnical developments is the normalisation of X-ray emis-sion tomography data in order to obtain absolute elementconcentration in terms of lg/g. At the cell level, very fewtechniques are able to provide direct determination of localmass density (in g/cm3) within the probed volume withoutrequiring standard calibration samples. Recent attempts touse transmission and Compton tomography were recentlycarried out at ESRF [4]. STIM-T could constitute an alter-native and complementary technique to these.
The development of numerical codes dedicated to emis-sion/transmission micro-tomography data reduction is acrucial point in this development. We will restrict this studyto ion beams and give a quick overview of the main steps ofthis evolution. Concerning the treatment of STIM/PIXEtomography data, four algorithms have been proposed,with gradual complexity in the reconstruction scheme.The first numerical code to take into account correctionsfor X-ray emission probability, due to incident protonenergy loss, as well as X-ray attenuation on the way tothe detector was developed by Schofield et al. [5] on thebasis of the Donner reconstruction library [6], originallydesigned for SPECT (single photon emission computedtomography). Schofield et al. modified this library to recon-struct separately STIM-T and PIXE-T data, considering anhomogeneous composition of the sample for correction cal-culations. Antolak et al. [7] extended this algorithm to thecase of inhomogeneous composition, by combining thereconstruction of STIM-T and PIXE-T data at each itera-tion and incrementally correcting both tomograms. Bothalgorithms were based on similar least squares iterativemethods from the Donner library (although two differentconvergence techniques were used). This pioneer and verypromising work, referred as ion beam tomographic elemen-tal microanalysis (ITEM), remained however limited in itsapplication to point X-ray detector. This constitutes adrawback for PIXE-T, as the detector is often placed asclose as possible to the sample to maximise counting statis-tics. In these conditions the variations of X-ray attenuationin the sample, within the detection solid angle, should betaken into account, especially if the density and/or compo-sition of the specimen is very inhomogeneous.
Later on, a different approach to the PIXE-T inversionproblem was proposed on the basis of a maximum like-hood expectation minimization (MLEM) method by Liewet al. [8], bringing the advantage to perform the reconstruc-tion even in the case of limited angular views and/or smallnumber of projections. However this algorithm – also
limited to point detector – could only reconstruct minorelement distributions assuming the major element matrixcomposition could be derived by other means.
Finally, the discretised image space reconstruction algo-rithm (DISRA) developed by Sakellariou [9,10] brought asignificant improvement to the previous inversion methodsby taking into account X-ray attenuation within a largedetection solid angle. In this way, a more realistic modelof X-ray attenuation is achieved whilst keeping the mainadvantages of the previous codes (ITEM and MLEM),i.e. STIM-T and PIXE-T data are corrected incrementallyat every iteration, enabling reconstruction of major andminor elements at the same time. Moreover, the recon-struction can also be performed even if limited angularrange and/or limited projections are available.
At CENBG, we foresee DISRA as the preferred numer-ical technique to analyse biological specimens at the celllevel. With this purpose in mind, the first step was to testDISRA for STIM-T reconstruction of samples with homo-geneous composition, comparing its results with those ofTomoRebuild, a software package designed at CENBGbased on a filtered backprojection algorithm [11]. Thisstudy was performed on single diatom cells as well as on sil-icon carbide microfibres taken as a reference for densitymeasurements.
2. Material and methods
2.1. Sample preparation
Diatoms are unicellular algae well known for the specta-cular formation and design of their cell walls. The diatomcell wall (frustule) is essentially made of amorphoushydrated silica (SiO2–(H2O)n) generated by biomineraliza-tion of the cell itself [12]. Diatom cells of the Odontella sin-
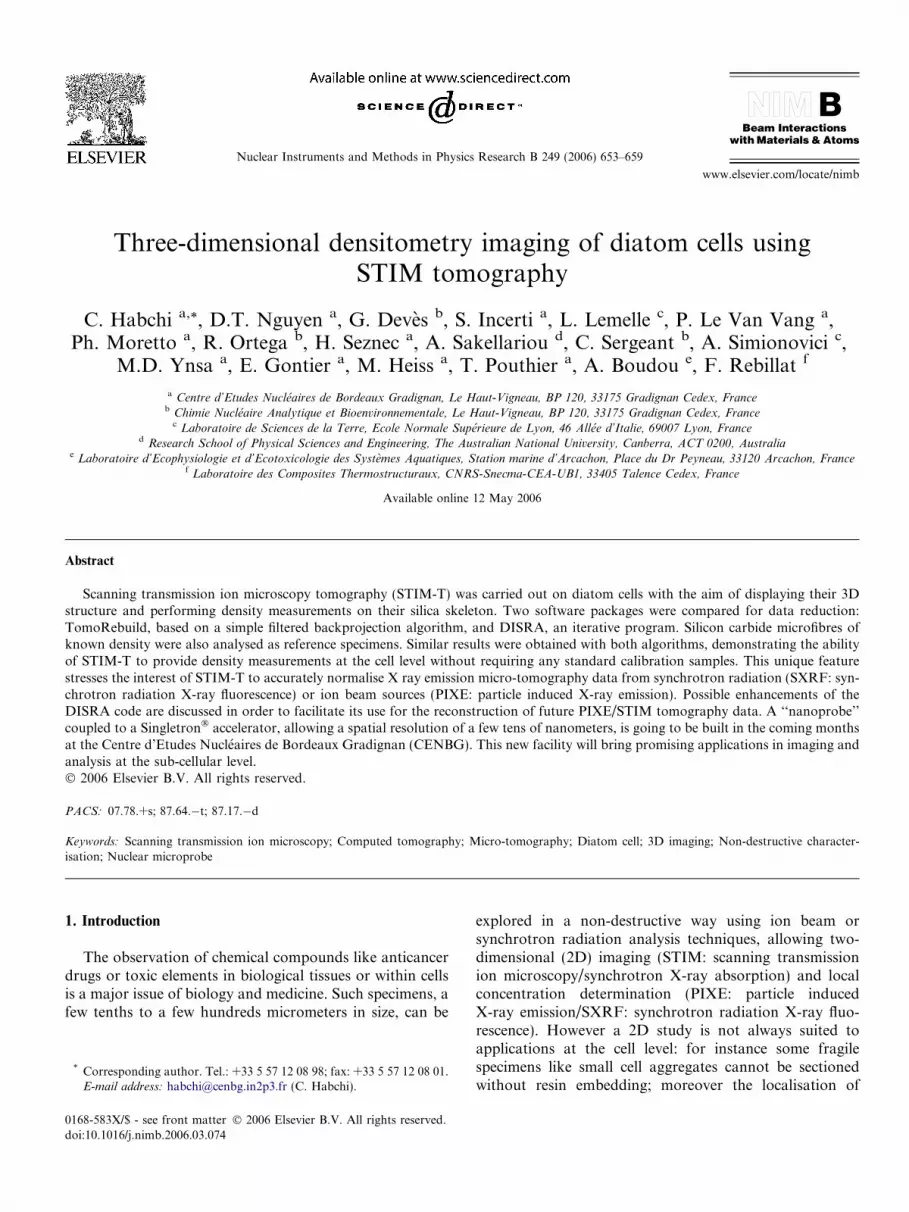
ensis species were selected from cultures that were preparedat the Laboratoire d’Ecophysiologie et d’Ecotoxicologiedes Systemes Aquatiques. Cells were rinsed in pure waterand freeze dried. In these conditions the inner organic con-tent of the cell is largely washed out and mainly remainsthe silica frustule (‘‘skeleton’’). Isolated frustules weremounted on top of a rotation axis made of a glass micro-capillary using epoxy glue. The global structure of suchspecimens is visible by optical and electron microscopy(Fig. 1) a flattened cylindrical symmetric shape terminatedon each side by two ‘‘antenna-like’’ labiate processes andtwo ocelli.
STIM-T experiments were also performed on Siliconcarbide (SiC) microfibres (Hi-Nicalon�, Nippon Carbon,Japan). These cylindric homogeneous microfibres, about14 lm in diameter, were used as reference samples to checkdensity measurements.
2.2. Experimental conditions
STIM-T was carried out at the nuclear microprobe ofCENBG using first a proton beam for all samples

Fig. 1. Optical microscopy photograph (centre) of a Odontella sinensis diatom sample, about 50 lm large and 200–300 lm long. The schematic view (left)is adapted from Tomas et al. [13]. Scanning electron microscopy view (right) of the extremity of a partly fragmented diatom cell, very similar to the onepresented in Figs. 2–4.
C. Habchi et al. / Nucl. Instr. and Meth. in Phys. Res. B 249 (2006) 653–659 655
(3 MeV for diatoms and 2.8 MeV for microfibres) and thena 2.8 MeV alpha beam for diatom samples in order toimprove energy loss contrast on so thin specimens. Thebeam was collimated by a 5 lm diameter circular apertureused as an object for the focusing system, composed of fourquadrupolar lenses mounted as a Dymnikov quadruplet[14]. The beam geometry was limited by a second circularaperture 10 lm in diameter placed 5.4 m away, just beforethe quadrupoles, in order to minimise focusing aberrations.In these conditions the final diameter of the beam in thefocal plane was (0.9 ± 0.1) lm and a very low beam inten-sity of about 1000 ions/s was achieved (<1 fA), enablingcompletely non-destructive characterisation.
For 3 D STIM-T the beam was scanned over a squarearea of 128 · 64 pixels in order to probe 64 horizontal slicesof 128 · 128 voxels (‘‘3D pixel’’) each. The spatial resolu-tion was thus twice as good in the horizontal direction asin the vertical one. A total of 100 projections were recordedwith steps of 1.8� on the [0�, 180�[ angular range. The resid-ual energy after passing through the sample was measuredin a passivated implanted planar silicon detector (CanberraPIPS detector, 100 mm2, 12 keV resolution), placed at 0�on the beam axis. The energy of transmitted ions and thecorresponding position of the beam were stored in appendmode in a binary data file in order to carry out off-line datareduction. In these conditions the total duration of a 3DSTIM-T experiment was typically 2 h.
2.3. Energy sinograms
The first step of the data reduction was performed usingthe TomoRebuild software package, developed at CENBGfor the reconstruction of STIM-T data [11]. Its userfriendly interface was designed for a fast and simple use,easily adjustable to different experimental conditions. The
median transmitted energy was calculated at every positionof the beam to produce energy sinograms associated toevery slice. In our case sinograms were thus composed ofa stack of 100 horizontal lines (one per projection) of128 pixels (one per position of the beam) (Fig. 2(b) and(c)). On every line the transmitted energy (directly relatedto local thickness) was coded on a linear grey scale to givea visual representation of the collected data. Sinusoidalpatterns appear, characteristic from the circular motionof the sample around the rotation axis. If necessary, anom-alous pixels in sinograms, i.e. pixels with aberrant energyvalue due to lack of statistics at that particular position,were corrected by comparison with their immediate neigh-bours to prevent noise in the reconstructed images.
2.4. Areal density sinograms
Sample thickness (areal density in lg/cm2) was deducedfrom transmitted energy assuming a uniform composition(SiO2 for diatom frustules, SiC for microfibres) and calcu-lating compound stopping power using Bragg’s rule fromthe stopping powers of elements tabulated by Ziegleret al. (TomoRebuild [15], DISRA [16]). By doing so, carehas to be taken to keep the residual energy above Bragg’speak (in practice above 1 MeV) in order to remain in therange of electronic energy loss processes. As TomoRebuildand DISRA were initially designed for a proton beam, onlyproton stopping powers were available in the codes. Weintroduced in both codes stopping powers for deuteronsand alphas extracted from the RUMP source code data[17], on the basis of a least squares fit (from 350 to3500 keV) of tabulated values from Andersen and Ziegler[15]. The same diatom samples were analysed usingproton and alpha beams in order to check densitycalculations.

Fig. 2. Two isolated slices (89 · 89 lm2) through a Odontella sinensis diatom sample, corresponding to the positions indicated in (a) in the 3D imagespresented in Figs. 3 and 4. The corresponding experimental sinograms (b) and (c) range from zero (white) to the maximal traversed thickness, i.e. 1.44 mg/cm2 in both cases (black). Contours of the frustule, partly fragmented, are visible in the tomographic slices, reconstructed from TomoRebuild (d), (e) andDISRA (f), (g). Density in the tomographic slices (d)–(g) was coded on a linear grey scale ranging from zero (black) to the highest reconstructed value(white), i.e. respectively 0.54; 0.84; 0.98 and 1.89 g/cm3 in (d), (e), (f) and (g).
656 C. Habchi et al. / Nucl. Instr. and Meth. in Phys. Res. B 249 (2006) 653–659
2.5. Tomographic reconstruction
Tomographic reconstruction was performed with the aimof comparing results of TomoRebuild and DISRA from thesame initial STIM-T data. In the case of low noise data suchas STIM-T, analytical inversion methods such as the filteredbackprojection algorithm implemented in TomoRebuild arewell suited and faster than other techniques. In TomoRe-build the reconstruction scheme is based on the Donnerlibrary [6] and was translated from fortran to C++ for por-tability purpose. The reconstructions presented in Figs. 2and 3 were obtained using a Hann filter (frequency cutoff0.5). TomoRebuild had been previously successfully usedfor the density determination of microcomposite samplesconstituted of light neighbouring elements [11,18], as theelectronic stopping power for such elements remains ratherconstant to within a few percents [19].
Fig. 3. Three dimensional views of the extremity of an Odontella sinensis
119 · 119 · 119 lm3. Isodensity surfaces selected at 0.12 (pale grey) and 0.55 g/cpresented (b)–(e), as obtained from the whole data set by direct volume rende
However such analytical techniques are not suited to thereconstruction of PIXE-T data. In this case an iterative algo-rithm is required, in order to take into account necessary cor-rections firstly for variations of ionisation cross sections asthe incident particles are slowing down within the sample,and secondly, for X-ray attenuation on the way to the detec-tor. The principle of DISRA is to simulate the physical pro-cesses occurring in the sample until simulated projections are‘‘sufficiently similar’’ to the experimental ones, which thenmeans that the calculated density tomogram has thenbecome reasonably close to reality. As for TomoRebuild,the reconstruction is performed slice by slice, the differentreconstructed planes being finally stacked to form a com-plete 3D image of the analysed volume.
If only STIM-T data are to be reconstructed, a prioriinformation on the composition of the sample has to beintroduced (just as in TomoRebuild). The iteration starts
diatom, as reconstructed by Tomorebuild from a probed volume ofm3 (black) are superimposed in (a). Four views at different orientations arering. Views (a) and (c) correspond to the same orientation.

Fig. 4. Three dimensional views obtained from DISRA from the samedata set and the same density selection. Isodensity surfaces (a) and directvolume rendering (b), (c). Views (b) and (c) are at the same orientation asrespectively (b) and (e) in Fig. 3.
C. Habchi et al. / Nucl. Instr. and Meth. in Phys. Res. B 249 (2006) 653–659 657
with the calculation of an ‘‘experimental reconstruction’’re. This energy tomogram (tomographic reconstruction) isobtained by a filtered backprojection of the experimentalenergy sinogram. This initial step has two purposes: firstlyto provide an initial guess q0 of the mass density distribu-tion (in g/cm3), calculated by scaling this ‘‘experimentalreconstruction’’ into an acceptable physical approximationof the density. Secondly, this energy tomogram re serves asa reference to correct simulated tomograms at order i > 0.From this first guess of the density tomogram q0, a simu-lated energy sinogram s1 is derived, which generates byfiltered backprojection the ‘‘simulated reconstruction’’(energy tomogram) at first order r1. The density tomogramat order 1 is then obtained by correcting voxels of the ‘‘sim-ulated reconstruction’’ by the ‘‘experimental’’ ones usingthe formula
q1 ¼re
r1
q0:
This process is repeated at each step of the iteration until con-vergence is reached. Thus, at every iteration, the simulateddensity becomes a more accurate representation of the sam-ple. For the diatoms samples, it took typically 6–8 iterationsto reach the convergence, i.e. to obtain less than 1% differ-ence between the experimental and simulated sinograms.
From a technical point of view, such an algorithm resem-bles the image space reconstruction algorithm (ISRA) [20]originally designed for positron emission tomography.However the important originality is that noise that accumu-lates at each iteration due to the succession of filtered back-projection steps is minimised by constraining density valuesto finite intervals, the size of which decreases as the numberof iterations increases, so that the accuracy of the approxi-mated density improves and the density distributionbecomes more and more continuous [9].
2.6. Density measurements
Density tomograms reconstructed by TomoRebuild orDISRA were transformed into a complete 128 · 128 ·128 voxels cubic data set, by numerically inserting interme-diate slices obtained from the average of the two adjacentslices (two point interpolation), in order to improve 3Drendering. Further data reduction was performed usingthe AMIRA� software package [21], allowing analysisand display of 3D maps as well as isolated slices taken atany orientation (although the best spatial resolution isobtained in horizontal slices). Density measurements wereperformed in selected regions of interest of 3D densitymaps for diatom cells and of 2D slices for SiC microfibres.
3. Results
3.1. 3D imaging of diatom cells
The 3D structure of the extremity of a diatom cell is pre-sented in Figs. 2–4 using density contrast. Labiate pro-
cesses and ocellus are easily identifiable, although onlyone ocellus is visible as the frustule was partly fragmented.As very large density variations were found between differ-ent areas, two types of 3D representation were used.
• Specific regions of interest were displayed by definingisodensity surfaces: for instance the outer surface of thediatom was obtained by selecting density values close tozero, corresponding to the limit between the sample andsurrounding vacuum (pale grey surface in Fig. 3(a)). Bytransparency higher density areas were located withinthe specimen by superimposition on the previous image,for instance labiate processes in Fig. 3(a).
• The complete 3D density map was displayed using directvolume rendering (Fig. 3(b)–(e)). In this case a transpar-ency value is associated to every voxel according to itsdensity, so that lower densities are more transparentthan higher ones.
TomoRebuild (TR) and DISRA reconstructions givebasically the same results although specific features canbe noticed. Firstly, density distribution looks more contin-uous from TR than from DISRA (Figs. 3 and 4). This isdue to the fact that TR is based on an analytical inversionmethod, i.e. on the numerical calculation of an intrinsicallycontinuous function, as opposed to DISRA.
However from a quantitative point of view, numericalresults from analytical reconstructions have to be carefullyinterpreted, as only average values are significant and notthe density at every voxel. For instance negative densitiesappear in the TR reconstruction within the vacuum sur-rounding the sample. Only the average on a few neighbour-ing voxels in this region is equal to zero. An illustration ofthis is presented in Fig. 5, showing density profilesextracted from the indicated voxel line from the slices inFigs. 2(d) and (f). The same precautions should be takenwhen dealing with the highest density values, which alsofluctuate locally around the ‘‘real’’ value. On the opposite,in iterative algorithms such as DISRA a priori knowledge

-1
3
7
11
15
19
23
27
31
35
0 10 20 30 40 50 60 70 80 90 100 110 120
Beam position
Mas
s d
ensi
ty (
10-2
g/c
m3 )
ds l1tr l1ds l1tr l1
DISRA TomoRebuild
Fig. 5. Density profiles extracted from the tomographic slices presented in Fig. 2 (d) and (f), along the central line (128 voxels) shown in white in thedensity map. Values from TomoRebuild and DISRA are compared.
Fig. 6. Regions of interest selected by density segmentation in the 3D dataset: labiate processes (a), ocellus (b) and frustule (c). These volumes arecomposed respectively of about 900, 170 and 8500 voxels.
658 C. Habchi et al. / Nucl. Instr. and Meth. in Phys. Res. B 249 (2006) 653–659
of the distribution to be calculated can be included in thereconstruction scheme to make it more realistic. Especially,density values are forced to be positive and voxels identi-fied as vacuum (i.e. corresponding to positions of the beamwhere no energy loss occurs) are set to zero. Moreover, thediscretization of density values in DISRA – with intervalsgetting smaller as the number of iterations increases – islikely to give a more accurate density value at every voxelif such a spatial precision is required [9]. This can be seenin Fig. 5, as the edges of the cell wall appear more sharplydefined from DISRA than from TR. Moreover, the use offilters to reduce high frequency noise in the filtered backprojection algorithm used in TR has to be considered.Indeed there is always a compromise in the reconstructionprocess between smoothing density fluctuations and keep-ing a good spatial resolution.
3.2. Density measurements
Density measurements were performed using theAMIRA� software in regions of interest of the diatom cellas shown in Fig. 6. Image segmentation was performed by
Table 1Average densities (in g/cm3) of the diatom sample and of a SiC microfibre, creconstruction codes
Diatom (SiO2)
2.8 MeV alphas 3 MeV protons
TR DISRA TR D
Labiate process 0.53 ± 0.23 0.61 ± 0.29 0.53 ± 0.21 0Ocellus 0.191 ± 0.057 0.27 ± 0.15 0.193 ± 0.057 0.2Frustule 0.199 ± 0.078 0.21 ± 0.11 0.214 ± 0.084 0.2
Average densities were calculated from the volumes defined in Fig. 6 for themicrofibre. The given uncertainty only corresponds to statistical fluctuations (stof density are also given for the SiC microfibre for comparison.
selecting density intervals in order to distinguish areas cor-responding respectively to the labiate processes, the ocellusand the frustule. Statistical analysis was carried out on thecorresponding voxels, extracted from the 3D data setsobtained in the following conditions.
ompared according to different experimental conditions and/or numerical
Microfibre (SiC)
2.8 MeV protons
ISRA TR DISRA
.47 ± 0.25 Slice 1 2.64 ± 0.10 2.67 ± 0.1810 ± 0.065 Slice 2 2.62 ± 0.13 2.68 ± 0.1919 ± 0.089 Slice 3 2.63 ± 0.10 2.72 ± 0.18
Average 2.63 ± 0.07 2.69 ± 0.11Reference interval 2.73–2.77
diatom cell and from three isolated slices (about 140 voxels used) for theandard deviation) measured within the regions of interest. Reference values

C. Habchi et al. / Nucl. Instr. and Meth. in Phys. Res. B 249 (2006) 653–659 659
• Sample probed using a 3 MeV proton or 2.8 MeV alphamicrobeam.
• Reconstruction performed, from the same energy sino-gram, using TR or DISRA.
Results are compared in Table 1. Density variationswere found very large between the different regions of inter-est within the diatom sample, especially labiate processesappear to be more than twice as dense as the rest of the cell(see Table 1). A good agreement was obtained between thedifferent conditions – both experimental and numerical –including for the SiC microfibre. The average densityobtained from the two reconstruction algorithms was veryclose to the reference value, which confirms the accuracy ofSTIM-T density measurements.
4. Conclusion and outlook
A good agreement was found between the resultsobtained using TomoRebuild and DISRA in differentexperimental conditions. The use of an alpha beam forSTIM-T was required for diatom samples to improveenergy loss contrast – and thus the precision of thicknessand local mass density calculations – as very fine structureswere probed. Moreover the accuracy of density measure-ments was checked by analysing reference samples madeof pure homogeneous silicon carbide. These results con-firms that densities obtained from STIM-T experimentscould be used to normalise X-ray fluorescence data fromPIXE-T or SXRF-T in order to obtain element concentra-tions within selected volumes of interest.
However concerning PIXE-T, technical and numericaldevelopment is still necessary. We plan to extend theDISRA code, which appears as the most complete inver-sion method designed so far, to answer particular needsof ion beam microtomography, especially:
• analyse isolated PIXE-T slices within a 3D STIM-Tvolume,
• allow for differences in spatial resolution (voxel size)between PIXE-T and STIM-T,
• be able to deal with X-ray spectra coming from severaldetectors in order to improve X-ray statistics withoutincreasing sample damage.
The building of a ‘‘nanoprobe’’ based on a Singletronaccelerator available end of 2005 at CENBG, allowing aspatial resolution of a few tens of nanometers, opens alarge field of research on this topic.
Acknowledgements
The authors would like to acknowledge Dr. OlegPokrovsky (Laboratoire des Mecanismes et Transferts enGeologie, CNRS/Universite Paul-Sabatier, ObservatoireMidi-Pyrenees-14, avenue Edouard Belin, 31400 Toulouse,France) for providing the diatom samples and Dr. XavierCrosta (Departement de Geologie et Oceanographie,UMR 5805, CNRS/Universite Bordeaux 1, 33405 TalenceCedex, France) for valuable discussion about diatom phys-iology. This study has been carried out in the frame of theToxNucE national research programme. The technicaldevelopment of the micro-tomography beamline has beenfinancially supported by the Region Aquitaine.
References
[1] C. Michelet, Ph. Moretto, Nucl. Instr. and Meth. B 150 (1999) 173.[2] A. Simionovici, M. Chukalina, Ch. Schroer, M. Drakopoulos, A.
Snigirev, I. Snigireva, B. Lengeler, K. Janssens, F. Adams, IEEETrans. Nucl. Sci. 47 (6) (2000) 2736.
[3] B. Golosio, A. Somogyi, A. Simionovici, P. Bleuet, L. Lemelle, Appl.Phys. Lett. 84 (2004) 2199.
[4] B. Golosio, A. Simionovici, A. Somogyi, L. Lemelle, M. Chukalina,A. Brunetti, J. Appl. Phys. 94 (2003) 145.
[5] R.M.S. Schofield, H.W. Lefevre, Nucl. Instr. and Meth. B 72 (1992)104.
[6] R.H. Huesman, G.T. Gullberg, W.L. Greenberg, T.F. Budinger,Publisher 214, Lawrence Berkeley Laboratory, 1977.
[7] A.J. Antolak, G.S. Bench, Nucl. Instr. and Meth. B 88 (1994) 297.[8] S.C. Liew, I. Orlic, S.M. Tang, Nucl. Instr. and Meth. B 104 (1995)
222.[9] A. Sakellariou, M. Cholewa, A. Saint, G.F. Legge, Meas. Sci.
Technol. 8 (1997) 746.[10] A. Sakellariou, D.N. Jamieson, G.J.F. Legge, Nucl. Instr. and Meth.
B 181 (2001) 211.[11] C. Michelet-Habchi, S. Incerti, P. Aguer, Ph. Barberet, E. Gontier, K.
Grente, Ph. Moretto, D.T. Nguyen, A. Pouthier, T. Pouthier, F.Rebillat, R.W. Smith, Nucl. Instr. and Meth. B 23 (1–4) (2005) 142.
[12] N. Kroger, M. Sumper, Protist 149 (1998) 213.[13] C.R. Tomas, Identifying Marine Phytoplankton, Academic Press,
1997, p. 385.[14] Y. Llabador, D. Bertault, J.C. Gouillaud, Ph. Moretto, Nucl. Instr.
and Meth. B 49 (1990) 435.[15] H.H. Andersen, J.F. Ziegler, Stopping Powers and Ranges in all
Elements, 3–4, Pergamon Press, New York, 1977.[16] J.F. Ziegler, J.P. Biersack, U. Littmark, The Stopping Power and
Ranges in Matter, Pergamon Press, New York, 1985.[17] L.R. Doolittle, Nucl. Instr. and Meth. B 9 (1985) 344.[18] Ph. Moretto, C. Michelet, S. Le Gallet, F. Rebillat, A. Guette, G.
Vignoles, Nucl. Instr. and Meth. B 181 (2001) 238.[19] H.W. Lefevre, R.M.S. Schofield, Scanning Microsc. 1 (1987) 879.[20] M.E. Daube-Witherspoon, G. Muehllehner, IEEE Trans. Med.
Imaging 5 (1986) 61.[21] AMIRA web site. Available from: <http://www.tgs.com>.