diatom and foraminifera relationships to water quality in the coorong, south australia, and the...
TRANSCRIPT
ORIGINAL PAPER
Diatom and foraminifera relationships to water qualityin The Coorong, South Australia, and the developmentof a diatom-based salinity transfer function
D. Haynes • R. Skinner • J. Tibby • J. Cann •
J. Fluin
Received: 3 December 2009 / Accepted: 8 February 2011 / Published online: 27 February 2011
� Springer Science+Business Media B.V. 2011
Abstract The Ramsar-listed Coorong lagoon lies at
the terminus of the Murray-Darling River system in
South Australia. Diatom and foraminifera relation-
ships with water quality were characterised in order
to develop diatom- and foraminifera-based models
with the potential to infer water column salinity.
Seventy-four samples were collected during 2007, a
year of continuing drought in the catchment, and of
no discharges at the Murray Mouth. The sample sites
had a salinity gradient of 1.8–190 g l-1 total dis-
solved solids. The diatom data set comprised 215
taxa, while there were only eight taxa in the
foraminiferal data set. Canonical correspondence
analysis of diatom species-environment relationships
showed that salinity explained the largest proportion
of diatom variance. Hence, a diatom-based salinity
transfer function with reasonable predictive power
(measured vs. diatom-inferred salinity rjack2 = 0.82;
Root Mean Squared Error of Prediction = 16 g l-1)
was developed. Application of the transfer function to
fossil diatom assemblages from The Coorong sug-
gested that pre-European salinity values were gener-
ally [50 g l-1 and that salinity declined following
settlement. These results, however, contradict the
recent history of The Coorong where there have been
substantial lagoon-wide salinity increases. The pre-
impact diatom flora has no analogue in the modern
data set, highlighting the degree of departure from
past conditions. CCA of the foraminiferal data set
identified salinity and total nitrogen as the variables
with the greatest explanatory power. However, accu-
rate predictive models could not be developed using
either variable due to low foraminiferal abundance
and species richness. These factors may have been a
consequence of diminished foraminiferal recruitment
rates over successive years, an artefact of reduced
marine water input to The Coorong. Future attempts
to generate predictive models from this region would
benefit from the inclusion of data from distant
locations, since suitable analogue sites do not exist
in close proximity. The study has generated useful
insights to the apparently broad salinity tolerances for
Electronic supplementary material The online version ofthis article (doi:10.1007/s10933-011-9508-y) containssupplementary material, which is available to authorized users.
D. Haynes (&) � R. Skinner � J. Fluin
School of Earth and Environmental Sciences, University
of Adelaide, Adelaide, SA 5005, Australia
e-mail: [email protected]
R. Skinner
e-mail: [email protected]
J. Fluin
e-mail: [email protected]
J. Tibby
Geography, Environment and Population, University
of Adelaide, Adelaide, SA 5005, Australia
e-mail: [email protected]
J. Cann
School of Natural and Built Environments, University
of South Australia, Adelaide, SA 5095, Australia
e-mail: [email protected]
123
J Paleolimnol (2011) 46:543–560
DOI 10.1007/s10933-011-9508-y
several cosmopolitan diatom and foraminifera spe-
cies, and has identified a number of diatom and
foraminifera taxa that may prove useful in the
qualitative interpretation of down-core trends in The
Coorong and the lower Murray River region.
Keywords Estuary � Diatoms � Foraminifera �Staurosirella pinnata � Transfer function � Salinity
Introduction
The ecological health of coastal wetlands worldwide
is increasingly under pressure from accelerating
settlement of the coastal zone and catchment devel-
opment (de Jonge et al. 2002; NLWRA 2002).
Catchment-wide pressures are manifest in a broad
range of end-of-system impacts. These include
reductions in discharge volumes and increased salin-
ity, nutrient, pollution and sediment loads in lakes,
lagoons and river mouths (Roy and Crawford 1984;
Larsson et al. 1985; Bourman and Barnett 1995;
Cooper et al. 2004; Kauppila et al. 2005). Such
degradation is a challenge to managers responsible
for the formulation and implementation of manage-
ment strategies, particularly those aimed at remedi-
ation (McLusky and Elliott 2004).
Successful management of coastal systems
requires a comprehensive understanding of the range
of variability prior to modifications, so that the full
extent of any human-induced impacts can be docu-
mented (Cooper 1999). In Australia, the historical
record is useful in gauging the effect of anthropo-
genic modifications to catchments and coastal sys-
tems, though continuous records are uncommon
(Tibby 2003). In order to assess temporal variation
over longer time periods, a sediment-based approach
is required.
Quantitative reconstructions of past environments
are possible utilising proxies (for example diatoms
and foraminifera), and an understanding of the
ecological tolerances of extant species (Murray
1991; Battarbee et al. 2001). In coastal regions,
diatom-based models have provided useful insights
into past sea-level, nutrient and salinity fluctuations
(for example Plater et al. 2000; Ryves et al. 2004;
Hassan et al. 2009), whereas foraminifera have been
used to infer salinity, benthic and sea-surface tem-
peratures, and primary productivity in off-shore
settings (for example Pflaumann et al. 2003; Ivanova
et al. 2003; Sejrup et al. 2004).
In Australia, coastal proxy-based models are
sparse, and the majority of diatom-based models have
been developed in non-coastal lacustrine systems, to
infer nutrient status, salinity and pH (for example Gell
1997; Tibby et al. 2003; Taukulis and John 2009).
Coastal palaeoecology in Australia has generally used
qualitative data (Taffs et al. 2008; OzCoasts 2010),
and few coastal or estuarine transfer functions have
been developed using diatoms (Saunders et al. 2007:
diatom-inferred salinity; Saunders et al. 2008: diatom-
inferred phosphate and salinity). No foraminferal
salinity transfer functions have been developed in
coastal regions of Australia. In New Zealand estuar-
ies, Hayward et al. (2004a) produced a foraminferal
transfer function to estimate past sea level that reflects
the salinity preferences of the foraminifera.
This paper aims to characterise diatom and fora-
miniferal relationships to water quality, and develop
diatom- and foraminifera-based models to infer past
conditions (particularly salinity) in The Coorong and
Lake Alexandrina. Prior to the current study, there
was no systematic investigation of the distribution of
foraminifera in The Coorong, despite observations of
foraminiferal tests in sediments of the south lagoon
(Thomlinson 1996). Similarly, the composition of
diatom assemblages in The Coorong was unknown,
although diatoms are likely to be major contributors to
biological productivity in The Coorong (Ford 2007;
Krull et al. 2009; McKirdy et al. 2010).
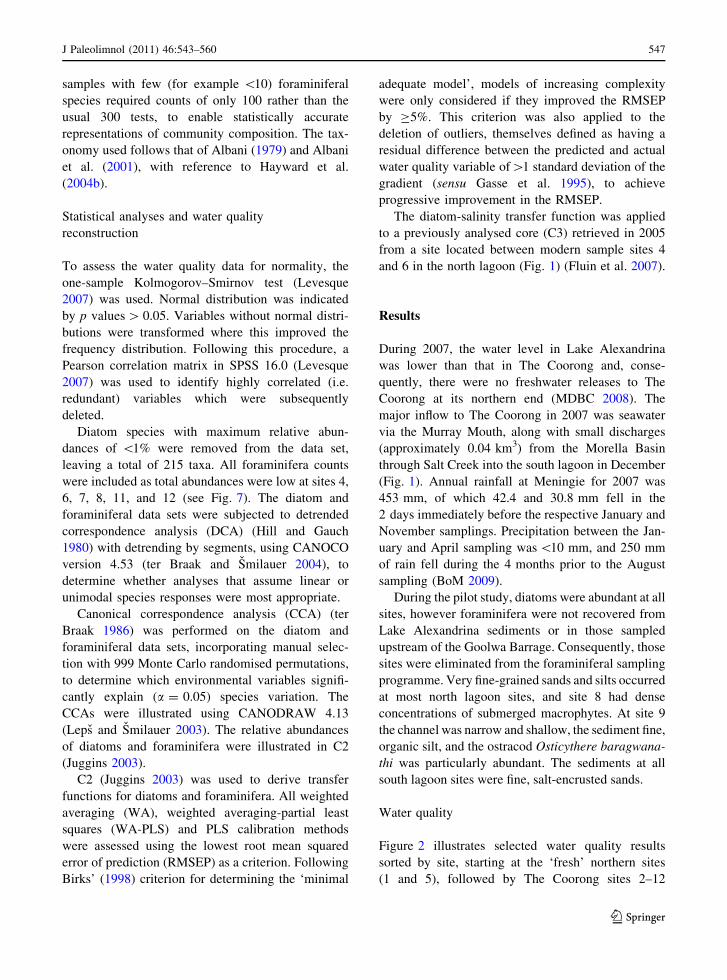
Study area
At the terminus of the Murray-Darling river system,
the back-barrier Coorong lagoon is an elongate
wetland extending 140 km from the Murray Mouth.
Constrained to the west by the Younghusband
Peninsula, a Holocene coastal dune barrier, and to
the east by last interglacial beach deposits, The
Coorong is constricted to a narrow (approximately
50 m) channel at Parnka Point (Fig. 1). This effec-
tively separates The Coorong into two portions that
are informally referred to as the north and south
lagoons (Fig. 1). At the northern end of The Coorong,
the Murray River debouches into the Indian Ocean,
maintaining an opening at the Murray Mouth, and
facilitating the ingress of sea water to the north
544 J Paleolimnol (2011) 46:543–560
123
lagoon. Surface water enters the southern extremity
of the south lagoon through Salt Creek. A shallow,
unconfined aquifer contributes to the water budget,
particularly of the south lagoon (Haese et al. 2008,
2009). The Coorong and Lakes Alexandrina and
Albert were accorded Ramsar status in 1985 (DE-
HAA 1999), in particular recognition of their impor-
tance to local and migratory bird populations.
Since European settlement, modifications of the
catchments at both ends of The Coorong have impacted
water quality in the lagoon. Water abstraction for
irrigation in the Murray-Darling Basin (Fig. 1) has
reduced discharges of freshwater by more than 75%
(Bourman et al. 2000). The construction of barrages at
the Murray Mouth reduced the Murray estuary to less
than 10% of its former extent. The decrease in river
discharges has caused flood-tide sedimentation at the
Murray Mouth, which closed completely in 1981 for
the first time since European settlement, and which
required continual dredging from 2001 to 2010 to
maintain an opening (Everingham 2007; Caica 2010).
Surface and ground water that once entered the south
lagoon is now diverted out to sea by an extensive
drainage network constructed throughout southeastern
South Australia (Everingham 2007). The extensive
hydrological modifications have resulted in reduced
water exchange and increases in salinity, particularly
in the south lagoon, where submerged macrophytes
have all but disappeared (CSIRO 2009), and the
Australian brine shrimp, Parartemia zietziana now
dominates the hypersaline water (CSIRO 2009). These
factors are thought to be the main causes underpinning
large scale reductions in fish biomass and aquatic
plants that once supported a rich and diverse avifauna
in The Coorong (Phillips and Muller 2006; CSIRO
2009).
Materials and methods
The length of The Coorong, in combination with low
regional rainfall, causes substantial evaporative
0 5 10 20 30km
Barrages
Murray Darling Basin
Sites
•
••
•
•
•••
•
•
•
••
12
3
4
5
6
7
8
9
10
11
12
12a,b
north lagoon
south lagoon
Parnka Point
Lake AlexandrinaGoolwa Channel
Murray Mouth Lake Albert
Indian Ocean
The Coorong
Younghusband Peninsula
Meningie
GM
B E
T
G GoolwaM MundooB Boundary CreekE Ewe IslandT Tauwitcherie
*C3 core site
MorellaBasin
SA
South Australia
Tauwitcherie Channel
MDB
MDBSouth AustraliaSA
Salt Creek
Australia
Study Area
N
139°E
36°S
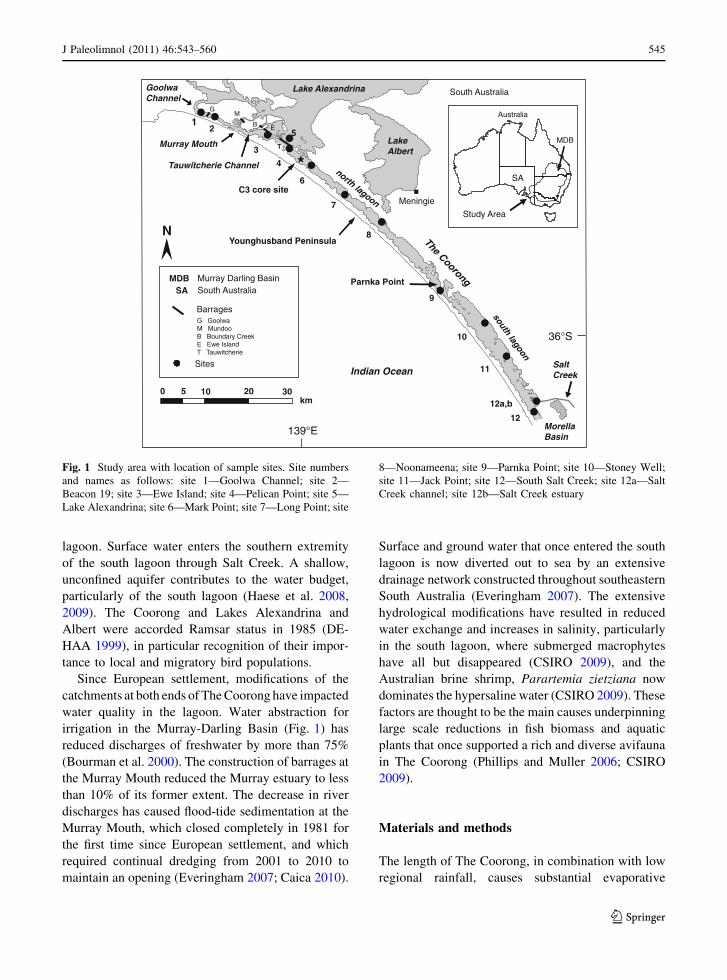
Fig. 1 Study area with location of sample sites. Site numbers
and names as follows: site 1—Goolwa Channel; site 2—
Beacon 19; site 3—Ewe Island; site 4—Pelican Point; site 5—
Lake Alexandrina; site 6—Mark Point; site 7—Long Point; site
8—Noonameena; site 9—Parnka Point; site 10—Stoney Well;
site 11—Jack Point; site 12—South Salt Creek; site 12a—Salt
Creek channel; site 12b—Salt Creek estuary
J Paleolimnol (2011) 46:543–560 545
123
concentration of salts (Phillips and Muller 2006).
The distinctiveness of this environment and the
absence of similar sites elsewhere, necessitated the
development of an ‘‘internal’’ transfer function (sensu
Mackay et al. 2003) using sites in The Coorong and
Murray Mouth. The latter was sampled to provide
relatively low salinity environments that were possi-
bly analogous to pre impact conditions. The efficacy
of internal transfer functions has been demonstrated
by Mackay et al. (2003) for Lake Baikal in Russia
and by Reavie et al. (2006) for the Great Lakes in the
United States.
Field techniques
After a pilot project conducted in November 2006, 12
sampling sites were selected between Goolwa and a
location south of Salt Creek (Fig. 1). At near shore
and off-shore locations at each site, sediment samples
for diatom and foraminifera analyses were collected
synchronously with water samples on four occasions
during 2007; in mid-summer and mid-autumn (Jan-
uary and April), late-winter and late-spring (August
and November). In early summer (December) addi-
tional diatom and water samples were collected from
Salt Creek channel and estuary following releases
from the Morella Basin (Fig. 1).
Water samples were collected in 2 9 1 l polyeth-
ylene terephthalate (PET) containers for chlorophyll
a and b analyses and 2 9 600 ml PET containers for
nitrogen, phosphorus, conductivity, pH and turbidity
analyses. The samples were refrigerated, and trans-
ported to the Australian Water Quality Centre within
24 h of collection. Water temperature was measured
in the field with an YSI 556 Multiprobe, while water
depth was measured using graduated range poles.
Surface sediments for diatom and foraminiferal
analyses were obtained using a purpose-built, 80 mm
diameter, vacuum corer. The corer was pushed at
least 30 cm into the sediment to ensure the sediment
was retained. Sediments were vertically extruded
within 2 cm of the top of the barrel and a sterile
syringe was used to collect 10 ml of the sediment–
water interface for diatom analysis. These samples
were transferred to sterile centrifuge tubes, and
preserved in 100% ethanol. The sediment was then
extruded to 1 cm above the top of the barrel and a
slicer used to remove approximately 48 cm3 of
sediment for foraminiferal analysis. These samples
were placed in screw-top pots, stained with Rose
Bengal and fixed with 100% ethanol. Selected stained
foraminiferal samples were examined in the field to
assess the presence of live specimens. All samples
were kept cold in the field, and later placed in
refrigerated storage at the University of Adelaide.
Water quality analyses
The water samples were analysed at the Australian
Water Quality Centre for the following parameters:
chlorophyll a (Chl a), chlorophyll b (Chl b), ammonia
(NH3), nitrate and nitrite (NOX), total Kjeldahl
nitrogen (TKN), filterable reactive phosphorus
(FRP), total phosphorus (TP), turbidity, pH and
electrical conductivity (EC). Total dissolved solids
(TDS) were calculated from EC, using a unique
empirical formula developed by the Australian Water
Quality Centre for Coorong samples, as described in
Thomas and Lang (2003). Chlorophyll concentrations
were extracted following the Australian Standard
3753 (1990) for ethanol analyses, and following the
equations derived by Wintermans and de Mots
(1965). APHA (1998) standard methods were
employed for all other analyses.
Biological sample preparation and counting
Diatom sample preparations followed the methods
recommended by Battarbee et al. (2001) with stan-
dard hydrochloric acid and hydrogen peroxide diges-
tion. Digested samples were deposited on coverslips
and mounted on slides with Naphrax mountant. All
samples were enumerated to a minimum of 300
valves, using a Nikon Eclipse 80i light microscope
with differential interference contrast at 1,500 times
magnification. Identification was undertaken with
reference to Desikachary (1986, 1987, 1988a, b,
1989); Krammer and Lange-Bertalot (1986, 1988,
1991a, b); Sournia (1987); Witkowski et al. (2001).
Micrographs and voucher specimens are retained at
the University of Adelaide.
Sediment samples for foraminiferal analysis were
wet sieved on 63 lm mesh, dried and stored in
airtight containers, using the method recommended
by Murray (1991). From each of the dried residues,
100 tests (when present) were counted and identified
under a Zeiss stereo zoom microscope, following the
recommendations of Buzas (1990), who found that
546 J Paleolimnol (2011) 46:543–560
123
samples with few (for example \10) foraminiferal
species required counts of only 100 rather than the
usual 300 tests, to enable statistically accurate
representations of community composition. The tax-
onomy used follows that of Albani (1979) and Albani
et al. (2001), with reference to Hayward et al.
(2004b).
Statistical analyses and water quality
reconstruction
To assess the water quality data for normality, the
one-sample Kolmogorov–Smirnov test (Levesque
2007) was used. Normal distribution was indicated
by p values [ 0.05. Variables without normal distri-
butions were transformed where this improved the
frequency distribution. Following this procedure, a
Pearson correlation matrix in SPSS 16.0 (Levesque
2007) was used to identify highly correlated (i.e.
redundant) variables which were subsequently
deleted.
Diatom species with maximum relative abun-
dances of \1% were removed from the data set,
leaving a total of 215 taxa. All foraminifera counts
were included as total abundances were low at sites 4,
6, 7, 8, 11, and 12 (see Fig. 7). The diatom and
foraminiferal data sets were subjected to detrended
correspondence analysis (DCA) (Hill and Gauch
1980) with detrending by segments, using CANOCO
version 4.53 (ter Braak and Smilauer 2004), to
determine whether analyses that assume linear or
unimodal species responses were most appropriate.
Canonical correspondence analysis (CCA) (ter
Braak 1986) was performed on the diatom and
foraminiferal data sets, incorporating manual selec-
tion with 999 Monte Carlo randomised permutations,
to determine which environmental variables signifi-
cantly explain (a = 0.05) species variation. The
CCAs were illustrated using CANODRAW 4.13
(Leps and Smilauer 2003). The relative abundances
of diatoms and foraminifera were illustrated in C2
(Juggins 2003).
C2 (Juggins 2003) was used to derive transfer
functions for diatoms and foraminifera. All weighted
averaging (WA), weighted averaging-partial least
squares (WA-PLS) and PLS calibration methods
were assessed using the lowest root mean squared
error of prediction (RMSEP) as a criterion. Following
Birks’ (1998) criterion for determining the ‘minimal
adequate model’, models of increasing complexity
were only considered if they improved the RMSEP
by C5%. This criterion was also applied to the
deletion of outliers, themselves defined as having a
residual difference between the predicted and actual
water quality variable of[1 standard deviation of the
gradient (sensu Gasse et al. 1995), to achieve
progressive improvement in the RMSEP.
The diatom-salinity transfer function was applied
to a previously analysed core (C3) retrieved in 2005
from a site located between modern sample sites 4
and 6 in the north lagoon (Fig. 1) (Fluin et al. 2007).
Results
During 2007, the water level in Lake Alexandrina
was lower than that in The Coorong and, conse-
quently, there were no freshwater releases to The
Coorong at its northern end (MDBC 2008). The
major inflow to The Coorong in 2007 was seawater
via the Murray Mouth, along with small discharges
(approximately 0.04 km3) from the Morella Basin
through Salt Creek into the south lagoon in December
(Fig. 1). Annual rainfall at Meningie for 2007 was
453 mm, of which 42.4 and 30.8 mm fell in the
2 days immediately before the respective January and
November samplings. Precipitation between the Jan-
uary and April sampling was \10 mm, and 250 mm
of rain fell during the 4 months prior to the August
sampling (BoM 2009).
During the pilot study, diatoms were abundant at all
sites, however foraminifera were not recovered from
Lake Alexandrina sediments or in those sampled
upstream of the Goolwa Barrage. Consequently, those
sites were eliminated from the foraminiferal sampling
programme. Very fine-grained sands and silts occurred
at most north lagoon sites, and site 8 had dense
concentrations of submerged macrophytes. At site 9
the channel was narrow and shallow, the sediment fine,
organic silt, and the ostracod Osticythere baragwana-
thi was particularly abundant. The sediments at all
south lagoon sites were fine, salt-encrusted sands.
Water quality
Figure 2 illustrates selected water quality results
sorted by site, starting at the ‘fresh’ northern sites
(1 and 5), followed by The Coorong sites 2–12
J Paleolimnol (2011) 46:543–560 547
123
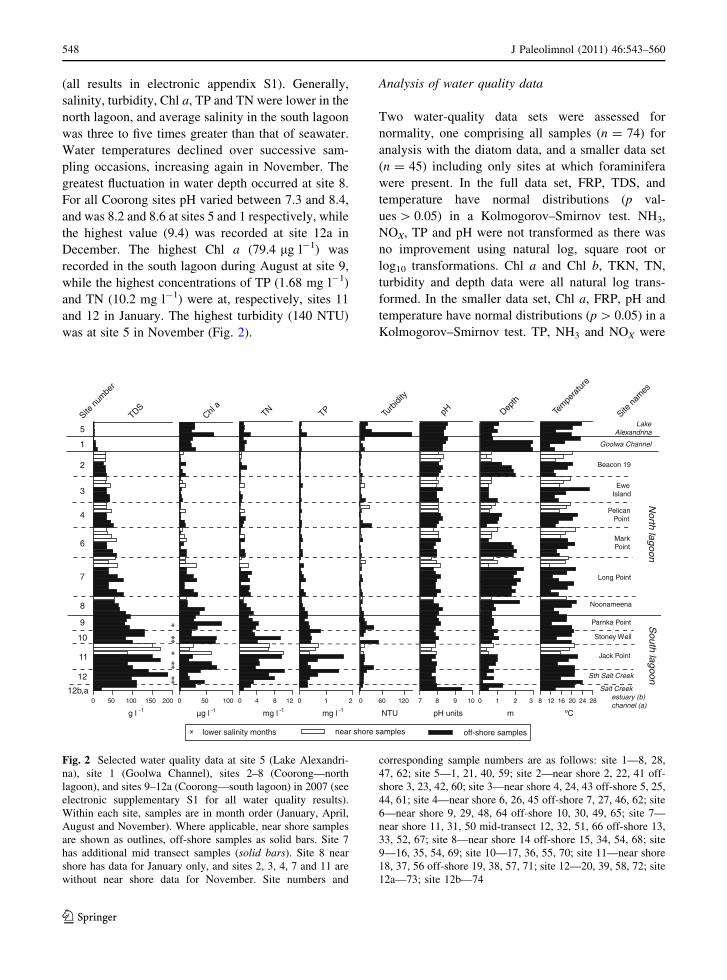
(all results in electronic appendix S1). Generally,
salinity, turbidity, Chl a, TP and TN were lower in the
north lagoon, and average salinity in the south lagoon
was three to five times greater than that of seawater.
Water temperatures declined over successive sam-
pling occasions, increasing again in November. The
greatest fluctuation in water depth occurred at site 8.
For all Coorong sites pH varied between 7.3 and 8.4,
and was 8.2 and 8.6 at sites 5 and 1 respectively, while
the highest value (9.4) was recorded at site 12a in
December. The highest Chl a (79.4 lg l-1) was
recorded in the south lagoon during August at site 9,
while the highest concentrations of TP (1.68 mg l-1)
and TN (10.2 mg l-1) were at, respectively, sites 11
and 12 in January. The highest turbidity (140 NTU)
was at site 5 in November (Fig. 2).
Analysis of water quality data
Two water-quality data sets were assessed for
normality, one comprising all samples (n = 74) for
analysis with the diatom data, and a smaller data set
(n = 45) including only sites at which foraminifera
were present. In the full data set, FRP, TDS, and
temperature have normal distributions (p val-
ues [ 0.05) in a Kolmogorov–Smirnov test. NH3,
NOX, TP and pH were not transformed as there was
no improvement using natural log, square root or
log10 transformations. Chl a and Chl b, TKN, TN,
turbidity and depth data were all natural log trans-
formed. In the smaller data set, Chl a, FRP, pH and
temperature have normal distributions (p [ 0.05) in a
Kolmogorov–Smirnov test. TP, NH3 and NOX were
0 5 0 1 0 0 1 5 0 2 0 0 0 5 0 1 0 0 0 4 8 1 2 0 1 2 0 60 1 20 7 8 9 1 0 0 1 2 3 8 1 2 1 6 2 0 2 4 2 8
Site n
umbe
r
Lake Alexandrina 5
1
2
3
4
6
7
8
9
10
11
12
12b,a
Goolwa Channel
n
o
o
g
a
l h
t r
o
N
n
o
o
g
a
l h
t u
o
S
g l µg l mg l mg l NTU pH units m ºC - 1 - 1 - 1 - 1
near shore samples off-shore samples
Beacon 19
Ewe Island
Pelican Point
Mark Point
Long Point
Noonameena
Stoney Well
Parnka Point
Jack Point
Sth Salt Creek
Salt Creek estuary (b) channel (a)
lower salinity months
TDSChl
aTN TP Tu
rbidi
ty
pH Depth
Tem
pera
ture
Site n
ames
Fig. 2 Selected water quality data at site 5 (Lake Alexandri-
na), site 1 (Goolwa Channel), sites 2–8 (Coorong—north
lagoon), and sites 9–12a (Coorong—south lagoon) in 2007 (see
electronic supplementary S1 for all water quality results).
Within each site, samples are in month order (January, April,
August and November). Where applicable, near shore samples
are shown as outlines, off-shore samples as solid bars. Site 7
has additional mid transect samples (solid bars). Site 8 near
shore has data for January only, and sites 2, 3, 4, 7 and 11 are
without near shore data for November. Site numbers and
corresponding sample numbers are as follows: site 1—8, 28,
47, 62; site 5—1, 21, 40, 59; site 2—near shore 2, 22, 41 off-
shore 3, 23, 42, 60; site 3—near shore 4, 24, 43 off-shore 5, 25,
44, 61; site 4—near shore 6, 26, 45 off-shore 7, 27, 46, 62; site
6—near shore 9, 29, 48, 64 off-shore 10, 30, 49, 65; site 7—
near shore 11, 31, 50 mid-transect 12, 32, 51, 66 off-shore 13,
33, 52, 67; site 8—near shore 14 off-shore 15, 34, 54, 68; site
9—16, 35, 54, 69; site 10—17, 36, 55, 70; site 11—near shore
18, 37, 56 off-shore 19, 38, 57, 71; site 12—20, 39, 58, 72; site
12a—73; site 12b—74
548 J Paleolimnol (2011) 46:543–560
123
not transformed as square root, natural log and log10
transformations did not improve their normality.
TDS, TKN, TN, Chl b, turbidity and depth data were
natural log transformed. In both data sets Chl b, TKN
and FRP were very highly correlated (p \ 0.005)
with six or more variables, and so were removed from
further analyses. Following removal of these vari-
ables, TP and TDS had weak correlation with other
variables, and were retained for further analyses (see
correlation matrices in electronic appendix S2).
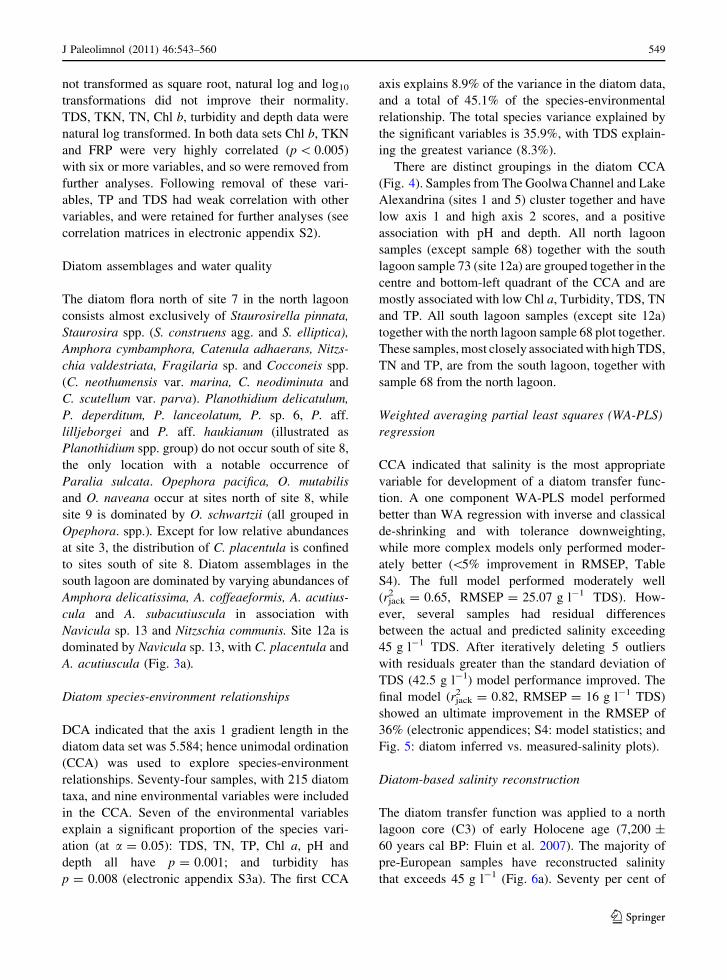
Diatom assemblages and water quality
The diatom flora north of site 7 in the north lagoon
consists almost exclusively of Staurosirella pinnata,
Staurosira spp. (S. construens agg. and S. elliptica),
Amphora cymbamphora, Catenula adhaerans, Nitzs-
chia valdestriata, Fragilaria sp. and Cocconeis spp.
(C. neothumensis var. marina, C. neodiminuta and
C. scutellum var. parva). Planothidium delicatulum,
P. deperditum, P. lanceolatum, P. sp. 6, P. aff.
lilljeborgei and P. aff. haukianum (illustrated as
Planothidium spp. group) do not occur south of site 8,
the only location with a notable occurrence of
Paralia sulcata. Opephora pacifica, O. mutabilis
and O. naveana occur at sites north of site 8, while
site 9 is dominated by O. schwartzii (all grouped in
Opephora. spp.). Except for low relative abundances
at site 3, the distribution of C. placentula is confined
to sites south of site 8. Diatom assemblages in the
south lagoon are dominated by varying abundances of
Amphora delicatissima, A. coffeaeformis, A. acutius-
cula and A. subacutiuscula in association with
Navicula sp. 13 and Nitzschia communis. Site 12a is
dominated by Navicula sp. 13, with C. placentula and
A. acutiuscula (Fig. 3a).
Diatom species-environment relationships
DCA indicated that the axis 1 gradient length in the
diatom data set was 5.584; hence unimodal ordination
(CCA) was used to explore species-environment
relationships. Seventy-four samples, with 215 diatom
taxa, and nine environmental variables were included
in the CCA. Seven of the environmental variables
explain a significant proportion of the species vari-
ation (at a = 0.05): TDS, TN, TP, Chl a, pH and
depth all have p = 0.001; and turbidity has
p = 0.008 (electronic appendix S3a). The first CCA
axis explains 8.9% of the variance in the diatom data,
and a total of 45.1% of the species-environmental
relationship. The total species variance explained by
the significant variables is 35.9%, with TDS explain-
ing the greatest variance (8.3%).
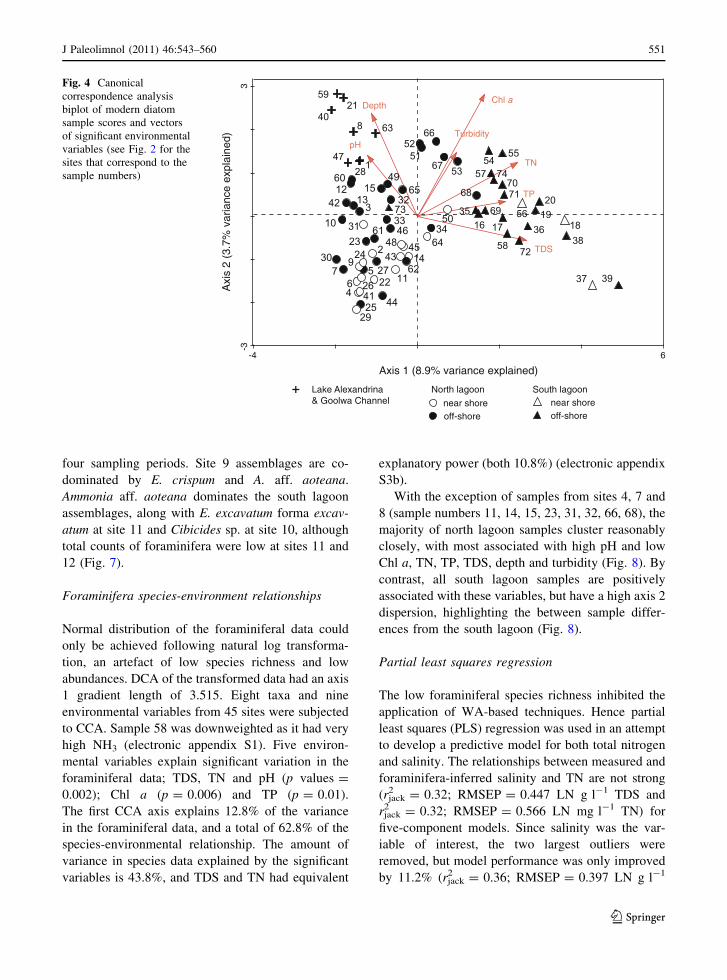
There are distinct groupings in the diatom CCA
(Fig. 4). Samples from The Goolwa Channel and Lake
Alexandrina (sites 1 and 5) cluster together and have
low axis 1 and high axis 2 scores, and a positive
association with pH and depth. All north lagoon
samples (except sample 68) together with the south
lagoon sample 73 (site 12a) are grouped together in the
centre and bottom-left quadrant of the CCA and are
mostly associated with low Chl a, Turbidity, TDS, TN
and TP. All south lagoon samples (except site 12a)
together with the north lagoon sample 68 plot together.
These samples, most closely associated with high TDS,
TN and TP, are from the south lagoon, together with
sample 68 from the north lagoon.
Weighted averaging partial least squares (WA-PLS)
regression
CCA indicated that salinity is the most appropriate
variable for development of a diatom transfer func-
tion. A one component WA-PLS model performed
better than WA regression with inverse and classical
de-shrinking and with tolerance downweighting,
while more complex models only performed moder-
ately better (\5% improvement in RMSEP, Table
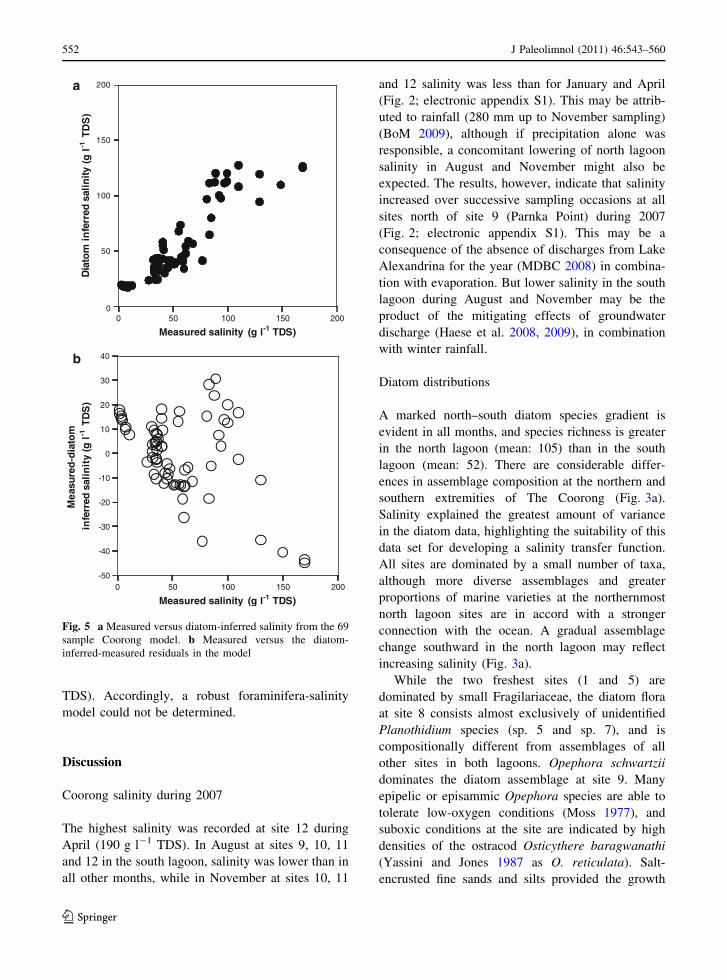
S4). The full model performed moderately well
(rjack2 = 0.65, RMSEP = 25.07 g l-1 TDS). How-
ever, several samples had residual differences
between the actual and predicted salinity exceeding
45 g l-1 TDS. After iteratively deleting 5 outliers
with residuals greater than the standard deviation of
TDS (42.5 g l-1) model performance improved. The
final model (rjack2 = 0.82, RMSEP = 16 g l-1 TDS)
showed an ultimate improvement in the RMSEP of
36% (electronic appendices; S4: model statistics; and
Fig. 5: diatom inferred vs. measured-salinity plots).
Diatom-based salinity reconstruction
The diatom transfer function was applied to a north
lagoon core (C3) of early Holocene age (7,200 ±
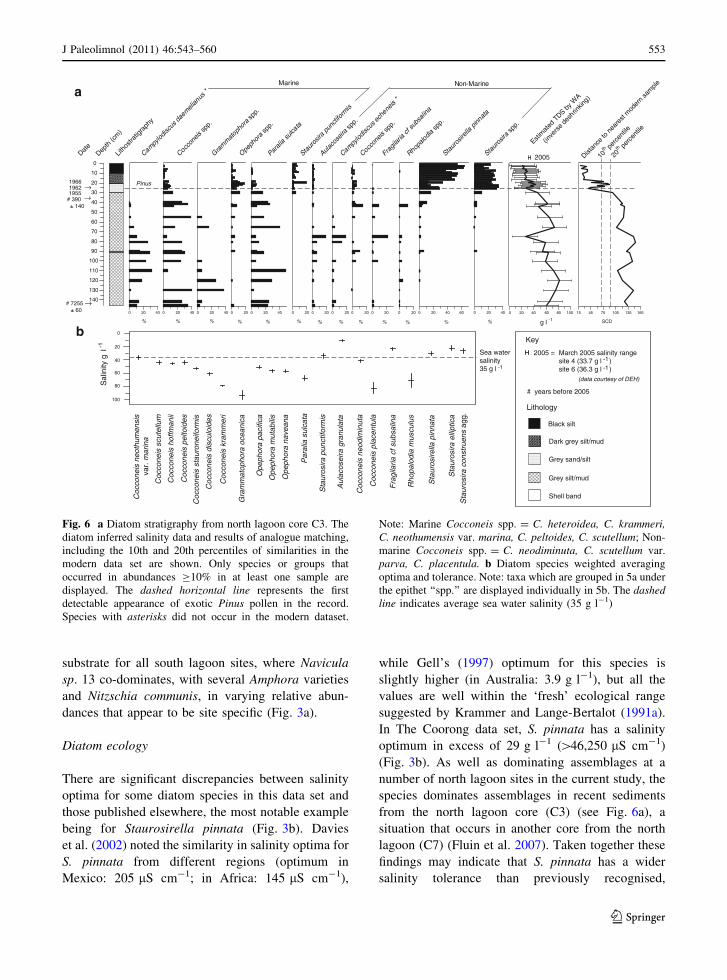
60 years cal BP: Fluin et al. 2007). The majority of
pre-European samples have reconstructed salinity
that exceeds 45 g l-1 (Fig. 6a). Seventy per cent of
J Paleolimnol (2011) 46:543–560 549
123
species in the fossil assemblages are present in the
modern diatom data set, but with the exception of
small Fragilariaceae taxa (Staurosirella pinnata and
Staurosira spp.), most have low relative abundances
(Fig. 6a, b).
Foraminiferal assemblages and water quality
Field examination of the foraminiferal samples
showed that few specimens adsorbed the Rose Bengal
stain. Given this situation, all tests that were in good
condition, showing no signs of wear or breakage were
counted, as this was taken to indicate in situ
deposition (Cann et al. 2000).
Marine taxa Trochulina dimidiata, Elphidium
crispum, Cibicides sp., together with some unilocular
and miliolid species are relatively abundant at the
northern end of the north lagoon, and the seaward
side of the Goolwa Barrage (Fig. 7). Euryhaline taxa
Ammonia aff. aoteana (Hayward et al. 2004b) and
E. excavatum forma excavatum dominate the assem-
blages at most sites in both lagoons, with the
exception of site 2, the only site at which T. dimidiata
was abundant. Sites 3 and 4 have similar assem-
blages, with A. aff. aoteana dominant over
E. excavatum forma excavatum and a few individuals
of E. crispum. A total of \10 individuals in four
sampling sessions were observed at near shore and
off-shore locations at site 6. At site 7, only off-shore
sediments yielded specimens of E. excavatum forma
excavatum over the four sampling periods. Site 8 had
only E. crispum and A. aff. aoteana in three of the
0 20 40 60
Staur
osire
lla p
innata
0 20 40
Staur
osira
spp.
0 20 40
Cocco
neis
spp.
0 20
Amph
ora
cymba
mphora
0 20
Caten
ula a
dhae
rans
0 20 40 60
Nitzsc
hia va
ldestr
iata
0 20
Frag
ilaria
sp.
0 20
Nitzsc
hia o
valis
0 20 40 60 80 100
Planot
hium
spp.
Parali
a su
lcata
0 20 40 60
Opepho
ra sp
p.
0 20 40
Cocco
neis
place
ntula
0 20 40
Amph
ora
coffe
aefo
rmis
0 20
Amph
ora
delic
atiss
ima
0 20 40
Amph
ora
suba
cutis
cuila
0 20 40
Nitzsc
hia co
mmun
is
0 20 40
Amph
ora
acuti
scula
0 20 40 60
Navicu
la sp. 1
3
TDS
* S
tau
rosi
rella
pin
na
ta
* S
tauro
sira
elli
ptic
a
* S
tauro
sira
const
ruens
agg.
* S
tauro
sira
punct
iform
is
Fra
gila
ria s
apote
nsi
s
Am
phora
cym
bam
phora
Cate
nula
adhaera
ns
Nitz
schia
vald
est
riata
* P
lan
oth
idiu
m s
p. 6
* P
lanoth
idiu
m d
elic
atu
lum
* P
lanoth
idiu
m la
nce
ola
tum
Pla
noth
idiu
m d
eperd
itum
Pla
noth
idiu
m a
ff h
auki
anu
m
Pla
noth
idiu
m a
ff li
lljeborg
ei
Pla
noth
idiu
m a
ff e
ngelb
rech
tii
Pla
no
thid
ium
sp.
5
Pla
no
thid
ium
sp.
7
* C
occ
on
eis
ne
oth
um
en
sis
va
r. m
ari
na
* C
occ
oneis
neodim
inuta
* C
occ
on
eis
scu
tellu
m
va
r. parv
a
Nitz
schia
ova
lis
Fra
gila
ria s
p.
* P
ara
lia s
ulc
ata
Opephora
kru
mbenei
Opephora
sp.
4
* O
pephora
paci
fica
Opephora
sp.
* O
pephora
muta
bili
s
* O
pephora
nav
eana
Opephora
hors
tiana
Opephora
obl
ongella
Opephora
sch
wart
zii
* C
occ
oneis
pla
centu
la
Am
phora
deilc
atis
sim
a
* A
mphora
coffe
aefo
rmis
Am
phora
acu
tiscu
ila
Am
phora
subacu
tiscu
ila
* N
avic
ula
sp.
13
* N
itzsc
hia
com
munis
2040
0
6080
120100
1
2
5
3
4
7
6
9
10
8
11
12
12b,a
No
rth la
go
on
South
lag
oo
n
Goolwa Channel
Lake Alexandrina
0 20
Site
near shoresamples
off-shore samples
0 50 100 150 200
T
DS
g l
-1
Sea water salinity 35 g l -1
b
a
Fig. 3 a Diatom assemblages at site 5 (Lake Alexandrina),
site 1 (Goolwa Channel), sites 2–8 (Coorong—north lagoon),
and sites 9–12a (Coorong—south lagoon) in 2007. Within each
site, samples are in month order (January, April, August and
November) and where applicable, with near shore samples
shown as outlines, off-shore samples shown as solid bars. Site
7 has additional mid transect samples (solid bars). Site 8 near
shore has data for January only, and sites 2, 3, 4, 7 and 11 are
without near shore data for November. Only taxa which occur
in abundances C10% in at least two samples are displayed (see
Fig. 2 for sample numbers that correspond to the sites).
b Diatom species weighted averaging salinity optima and
tolerance. Note: taxa which are grouped in 3a under the epithet
‘‘spp.’’ are displayed individually in 3b, and those species that
occur in the fossil assemblage for core C3 are indicated with
asterisks. The dashed line indicates average sea water salinity
(35 g l-1)
550 J Paleolimnol (2011) 46:543–560
123
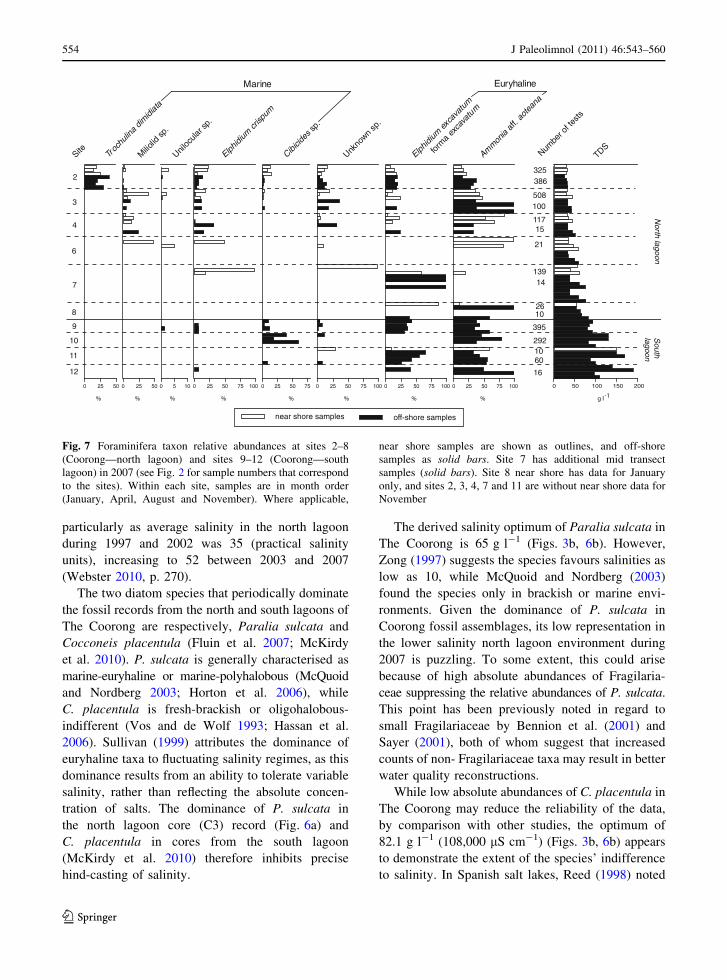
four sampling periods. Site 9 assemblages are co-
dominated by E. crispum and A. aff. aoteana.
Ammonia aff. aoteana dominates the south lagoon
assemblages, along with E. excavatum forma excav-
atum at site 11 and Cibicides sp. at site 10, although
total counts of foraminifera were low at sites 11 and
12 (Fig. 7).
Foraminifera species-environment relationships
Normal distribution of the foraminiferal data could
only be achieved following natural log transforma-
tion, an artefact of low species richness and low
abundances. DCA of the transformed data had an axis
1 gradient length of 3.515. Eight taxa and nine
environmental variables from 45 sites were subjected
to CCA. Sample 58 was downweighted as it had very
high NH3 (electronic appendix S1). Five environ-
mental variables explain significant variation in the
foraminiferal data; TDS, TN and pH (p values =
0.002); Chl a (p = 0.006) and TP (p = 0.01).
The first CCA axis explains 12.8% of the variance
in the foraminiferal data, and a total of 62.8% of the
species-environmental relationship. The amount of
variance in species data explained by the significant
variables is 43.8%, and TDS and TN had equivalent
explanatory power (both 10.8%) (electronic appendix
S3b).
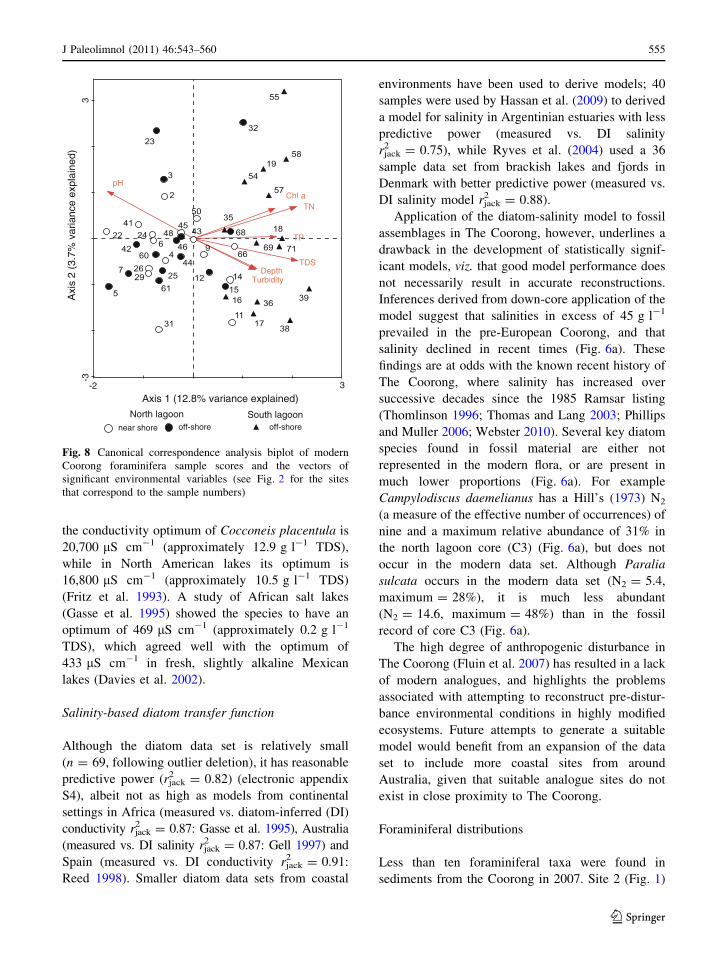
With the exception of samples from sites 4, 7 and
8 (sample numbers 11, 14, 15, 23, 31, 32, 66, 68), the
majority of north lagoon samples cluster reasonably
closely, with most associated with high pH and low
Chl a, TN, TP, TDS, depth and turbidity (Fig. 8). By
contrast, all south lagoon samples are positively
associated with these variables, but have a high axis 2
dispersion, highlighting the between sample differ-
ences from the south lagoon (Fig. 8).
Partial least squares regression
The low foraminiferal species richness inhibited the
application of WA-based techniques. Hence partial
least squares (PLS) regression was used in an attempt
to develop a predictive model for both total nitrogen
and salinity. The relationships between measured and
foraminifera-inferred salinity and TN are not strong
(rjack2 = 0.32; RMSEP = 0.447 LN g l-1 TDS and
rjack2 = 0.32; RMSEP = 0.566 LN mg l-1 TN) for
five-component models. Since salinity was the var-
iable of interest, the two largest outliers were
removed, but model performance was only improved
by 11.2% (rjack2 = 0.36; RMSEP = 0.397 LN g l-1
-4 6
-33
TDS
Chl a
TN
Turbidity
Depth
TP
pH
Lake Alexandrina& Goolwa Channel
North lagoon South lagoon
near shoreoff-shore
near shoreoff-shore
Axis 1 (8.9% variance explained)
Axi
s 2
(3.7
% v
aria
nce
expl
aine
d)
Fig. 4 Canonical
correspondence analysis
biplot of modern diatom
sample scores and vectors
of significant environmental
variables (see Fig. 2 for the
sites that correspond to the
sample numbers)
J Paleolimnol (2011) 46:543–560 551
123
TDS). Accordingly, a robust foraminifera-salinity
model could not be determined.
Discussion
Coorong salinity during 2007
The highest salinity was recorded at site 12 during
April (190 g l-1 TDS). In August at sites 9, 10, 11
and 12 in the south lagoon, salinity was lower than in
all other months, while in November at sites 10, 11
and 12 salinity was less than for January and April
(Fig. 2; electronic appendix S1). This may be attrib-
uted to rainfall (280 mm up to November sampling)
(BoM 2009), although if precipitation alone was
responsible, a concomitant lowering of north lagoon
salinity in August and November might also be
expected. The results, however, indicate that salinity
increased over successive sampling occasions at all
sites north of site 9 (Parnka Point) during 2007
(Fig. 2; electronic appendix S1). This may be a
consequence of the absence of discharges from Lake
Alexandrina for the year (MDBC 2008) in combina-
tion with evaporation. But lower salinity in the south
lagoon during August and November may be the
product of the mitigating effects of groundwater
discharge (Haese et al. 2008, 2009), in combination
with winter rainfall.
Diatom distributions
A marked north–south diatom species gradient is
evident in all months, and species richness is greater
in the north lagoon (mean: 105) than in the south
lagoon (mean: 52). There are considerable differ-
ences in assemblage composition at the northern and
southern extremities of The Coorong (Fig. 3a).
Salinity explained the greatest amount of variance
in the diatom data, highlighting the suitability of this
data set for developing a salinity transfer function.
All sites are dominated by a small number of taxa,
although more diverse assemblages and greater
proportions of marine varieties at the northernmost
north lagoon sites are in accord with a stronger
connection with the ocean. A gradual assemblage
change southward in the north lagoon may reflect
increasing salinity (Fig. 3a).
While the two freshest sites (1 and 5) are
dominated by small Fragilariaceae, the diatom flora
at site 8 consists almost exclusively of unidentified
Planothidium species (sp. 5 and sp. 7), and is
compositionally different from assemblages of all
other sites in both lagoons. Opephora schwartzii
dominates the diatom assemblage at site 9. Many
epipelic or episammic Opephora species are able to
tolerate low-oxygen conditions (Moss 1977), and
suboxic conditions at the site are indicated by high
densities of the ostracod Osticythere baragwanathi
(Yassini and Jones 1987 as O. reticulata). Salt-
encrusted fine sands and silts provided the growth
Measured salinity (g l-1 TDS)
Dia
tom
in
ferr
ed s
alin
ity (
gl-1
TD
S)
Measured salinity (g l-1 TDS)
Mea
sure
d-d
iato
min
ferr
ed s
alin
ity
(gl-1
TD
S)
0
-50
-40
-30
-20
-10
0
10
20
30
40
0 50 100 150 200
50
150
200
0 50 100 150 200
a
b
100
Fig. 5 a Measured versus diatom-inferred salinity from the 69
sample Coorong model. b Measured versus the diatom-
inferred-measured residuals in the model
552 J Paleolimnol (2011) 46:543–560
123
substrate for all south lagoon sites, where Navicula
sp. 13 co-dominates, with several Amphora varieties
and Nitzschia communis, in varying relative abun-
dances that appear to be site specific (Fig. 3a).
Diatom ecology
There are significant discrepancies between salinity
optima for some diatom species in this data set and
those published elsewhere, the most notable example
being for Staurosirella pinnata (Fig. 3b). Davies
et al. (2002) noted the similarity in salinity optima for
S. pinnata from different regions (optimum in
Mexico: 205 lS cm-1; in Africa: 145 lS cm-1),
while Gell’s (1997) optimum for this species is
slightly higher (in Australia: 3.9 g l-1), but all the
values are well within the ‘fresh’ ecological range
suggested by Krammer and Lange-Bertalot (1991a).
In The Coorong data set, S. pinnata has a salinity
optimum in excess of 29 g l-1 ([46,250 lS cm-1)
(Fig. 3b). As well as dominating assemblages at a
number of north lagoon sites in the current study, the
species dominates assemblages in recent sediments
from the north lagoon core (C3) (see Fig. 6a), a
situation that occurs in another core from the north
lagoon (C7) (Fluin et al. 2007). Taken together these
findings may indicate that S. pinnata has a wider
salinity tolerance than previously recognised,
-1 SCD
0
10
20
30
40
50
60
70
80
90
100
110
120
130
140
Litho
strat
igrap
hy
0 20 40
Campylod
iscus
daemeli
anus
*
0 20 40
Coccon
eis sp
p.
0 20 40
Gram
mato
phor
a spp
.
0 20
Opeph
ora
spp.
0 20 40
Parali
a su
lcata
0 20
Staur
osira
pun
ctifo
rmis
0 20
Aulaco
seira
spp.
0 20
Campylod
iscus
eche
neis
*
0 20
Coccon
eissp
p.
0 20
Fragil
aria
cf su
bsali
na
0 20
Rhopalo
diasp
p.
0 20 40 60
Staur
osire
llapin
nata
0 20 40
Staur
osira
spp.
Estim
ated
TDSby
WA
(inve
rse de
shrin
king)
Marine Non-Marine
Depth
(cm
)
# 7255 ± 60
# 390 ± 140
1962
20
perc
entile
th
10
perc
entile
th
Pinus
g l
(data courtesy of DEH)
% % % % % % % % % % % % %
20
40
60
80
0
Sta
uros
irella
pin
nata
Sta
uros
ira e
llipt
ica
Sta
uros
ira c
onst
ruen
s ag
g.
Sta
uros
ira p
unct
iform
is
Fra
gila
ria c
f sub
salin
a
Aul
acos
eira
gra
nula
ta
Coc
cone
is h
offm
anii
Coc
cone
is p
elto
ides
Ope
phor
a pa
cific
a
Coc
cone
is s
taur
onei
form
is
Ope
phor
a m
utab
ilis
Ope
phor
a na
vean
a
Coc
cone
is d
iscu
loid
es
Par
alia
sul
cata
Gra
mm
atop
hora
oce
anic
a
Coc
cone
is n
eoth
umen
sis
var
. mar
ina
Coc
cone
is n
eodi
min
uta
Coc
cone
is s
cute
llum
Rho
palo
dia
mus
culu
s
Coc
cone
is k
ram
mer
i
Coc
cone
is p
lace
ntul
a
2005
March 2005 salinity rangesite 4 (33.7 g l )site 6 (36.3 g l )
-1
-1
2005 =
a
b
0 20 40 60 80 100 15 45 75 105 135 165
100
Distan
ce to
nea
rest
mod
ern
sam
ple
Sal
inity
g l
-1
Sea watersalinity 35 g l -1
→
→
→
Black silt
Grey silt/mud
Shell band
Dark grey silt/mud
Grey sand/silt
Key
Lithology
Date
# years before 2005
1966
1955
Fig. 6 a Diatom stratigraphy from north lagoon core C3. The
diatom inferred salinity data and results of analogue matching,
including the 10th and 20th percentiles of similarities in the
modern data set are shown. Only species or groups that
occurred in abundances C10% in at least one sample are
displayed. The dashed horizontal line represents the first
detectable appearance of exotic Pinus pollen in the record.
Species with asterisks did not occur in the modern dataset.
Note: Marine Cocconeis spp. = C. heteroidea, C. krammeri,C. neothumensis var. marina, C. peltoides, C. scutellum; Non-
marine Cocconeis spp. = C. neodiminuta, C. scutellum var.
parva, C. placentula. b Diatom species weighted averaging
optima and tolerance. Note: taxa which are grouped in 5a under
the epithet ‘‘spp.’’ are displayed individually in 5b. The dashedline indicates average sea water salinity (35 g l-1)
J Paleolimnol (2011) 46:543–560 553
123
particularly as average salinity in the north lagoon
during 1997 and 2002 was 35 (practical salinity
units), increasing to 52 between 2003 and 2007
(Webster 2010, p. 270).
The two diatom species that periodically dominate
the fossil records from the north and south lagoons of
The Coorong are respectively, Paralia sulcata and
Cocconeis placentula (Fluin et al. 2007; McKirdy
et al. 2010). P. sulcata is generally characterised as
marine-euryhaline or marine-polyhalobous (McQuoid
and Nordberg 2003; Horton et al. 2006), while
C. placentula is fresh-brackish or oligohalobous-
indifferent (Vos and de Wolf 1993; Hassan et al.
2006). Sullivan (1999) attributes the dominance of
euryhaline taxa to fluctuating salinity regimes, as this
dominance results from an ability to tolerate variable
salinity, rather than reflecting the absolute concen-
tration of salts. The dominance of P. sulcata in
the north lagoon core (C3) record (Fig. 6a) and
C. placentula in cores from the south lagoon
(McKirdy et al. 2010) therefore inhibits precise
hind-casting of salinity.
The derived salinity optimum of Paralia sulcata in
The Coorong is 65 g l-1 (Figs. 3b, 6b). However,
Zong (1997) suggests the species favours salinities as
low as 10, while McQuoid and Nordberg (2003)
found the species only in brackish or marine envi-
ronments. Given the dominance of P. sulcata in
Coorong fossil assemblages, its low representation in
the lower salinity north lagoon environment during
2007 is puzzling. To some extent, this could arise
because of high absolute abundances of Fragilaria-
ceae suppressing the relative abundances of P. sulcata.
This point has been previously noted in regard to
small Fragilariaceae by Bennion et al. (2001) and
Sayer (2001), both of whom suggest that increased
counts of non- Fragilariaceae taxa may result in better
water quality reconstructions.
While low absolute abundances of C. placentula in
The Coorong may reduce the reliability of the data,
by comparison with other studies, the optimum of
82.1 g l-1 (108,000 lS cm-1) (Figs. 3b, 6b) appears
to demonstrate the extent of the species’ indifference
to salinity. In Spanish salt lakes, Reed (1998) noted
0 25 50 0 25 50 0 5 10 0 25 50 75 100 0 25 50 75 0 25 50 75 100 0 25 50 75 100 0 25 50 75 100
Marine Euryhaline
2
3
4
6
7
8
9
10
11
12
North lagoon
South
lagoon
Troc
hulin
a dim
idiat
a
Milio
lidsp
.
Uniloc
ular sp
.
Elphidi
um cr
ispum
Cibicid
essp
.
Unkno
wn sp
.
Elphidi
um ex
cava
tum
form
a ex
cava
tum
Amm
onia
aff.
aote
ana
TDSSite
near shore samples off-shore samples
0 50 100 150 200
Numbe
r of t
ests
325
508
117
21
139
26
395
292 10
16
386
100
15
14
10
60
Fig. 7 Foraminifera taxon relative abundances at sites 2–8
(Coorong—north lagoon) and sites 9–12 (Coorong—south
lagoon) in 2007 (see Fig. 2 for sample numbers that correspond
to the sites). Within each site, samples are in month order
(January, April, August and November). Where applicable,
near shore samples are shown as outlines, and off-shore
samples as solid bars. Site 7 has additional mid transect
samples (solid bars). Site 8 near shore has data for January
only, and sites 2, 3, 4, 7 and 11 are without near shore data for
November
554 J Paleolimnol (2011) 46:543–560
123
the conductivity optimum of Cocconeis placentula is
20,700 lS cm-1 (approximately 12.9 g l-1 TDS),
while in North American lakes its optimum is
16,800 lS cm-1 (approximately 10.5 g l-1 TDS)
(Fritz et al. 1993). A study of African salt lakes
(Gasse et al. 1995) showed the species to have an
optimum of 469 lS cm-1 (approximately 0.2 g l-1
TDS), which agreed well with the optimum of
433 lS cm-1 in fresh, slightly alkaline Mexican
lakes (Davies et al. 2002).
Salinity-based diatom transfer function
Although the diatom data set is relatively small
(n = 69, following outlier deletion), it has reasonable
predictive power (rjack2 = 0.82) (electronic appendix
S4), albeit not as high as models from continental
settings in Africa (measured vs. diatom-inferred (DI)
conductivity rjack2 = 0.87: Gasse et al. 1995), Australia
(measured vs. DI salinity rjack2 = 0.87: Gell 1997) and
Spain (measured vs. DI conductivity rjack2 = 0.91:
Reed 1998). Smaller diatom data sets from coastal
environments have been used to derive models; 40
samples were used by Hassan et al. (2009) to derived
a model for salinity in Argentinian estuaries with less
predictive power (measured vs. DI salinity
rjack2 = 0.75), while Ryves et al. (2004) used a 36
sample data set from brackish lakes and fjords in
Denmark with better predictive power (measured vs.
DI salinity model rjack2 = 0.88).
Application of the diatom-salinity model to fossil
assemblages in The Coorong, however, underlines a
drawback in the development of statistically signif-
icant models, viz. that good model performance does
not necessarily result in accurate reconstructions.
Inferences derived from down-core application of the
model suggest that salinities in excess of 45 g l-1
prevailed in the pre-European Coorong, and that
salinity declined in recent times (Fig. 6a). These
findings are at odds with the known recent history of
The Coorong, where salinity has increased over
successive decades since the 1985 Ramsar listing
(Thomlinson 1996; Thomas and Lang 2003; Phillips
and Muller 2006; Webster 2010). Several key diatom
species found in fossil material are either not
represented in the modern flora, or are present in
much lower proportions (Fig. 6a). For example
Campylodiscus daemelianus has a Hill’s (1973) N2
(a measure of the effective number of occurrences) of
nine and a maximum relative abundance of 31% in
the north lagoon core (C3) (Fig. 6a), but does not
occur in the modern data set. Although Paralia
sulcata occurs in the modern data set (N2 = 5.4,
maximum = 28%), it is much less abundant
(N2 = 14.6, maximum = 48%) than in the fossil
record of core C3 (Fig. 6a).
The high degree of anthropogenic disturbance in
The Coorong (Fluin et al. 2007) has resulted in a lack
of modern analogues, and highlights the problems
associated with attempting to reconstruct pre-distur-
bance environmental conditions in highly modified
ecosystems. Future attempts to generate a suitable
model would benefit from an expansion of the data
set to include more coastal sites from around
Australia, given that suitable analogue sites do not
exist in close proximity to The Coorong.
Foraminiferal distributions
Less than ten foraminiferal taxa were found in
sediments from the Coorong in 2007. Site 2 (Fig. 1)
-2 3
-33
Chl a
pH
TDS
TN
TurbidityDepth
TP
North lagoon South lagoonnear shore off-shore off-shore
Axis 1 (12.8% variance explained)
Axi
s 2
(3.7
% v
aria
nce
expl
aine
d)
Fig. 8 Canonical correspondence analysis biplot of modern
Coorong foraminifera sample scores and the vectors of
significant environmental variables (see Fig. 2 for the sites
that correspond to the sample numbers)
J Paleolimnol (2011) 46:543–560 555
123
was the only site to have abundances of all species
and taxon groups identified in the data set (Fig. 7).
High relative abundances of marine Trochulina sp. at
this site can be explained by the depth of the Goolwa
Channel ([2 m) and a good connection with the
ocean through the Murray Mouth. By contrast, site 4
south of the Murray Mouth (Fig. 1) had fewer
species, and few marine varieties (Fig. 7), despite
being a similar distance from the opening. Although
the Murray Mouth was maintained by dredging from
2001, movement of water southwards to the north
lagoon has been hindered by partial or complete
blockage of the connecting Tauwitcherie Channel
since complete closure in 1981 (Walker 2002)
(Fig. 1). The amount of marine water and organisms
entering The Coorong is therefore likely to have
decreased over the last 10–20 years, which may have
adversely affected foraminiferal recruitment within
the lagoons.
The dominance of euryhaline, halo-tolerant fora-
miniferal taxa (Murray 1991) reflects the present-day
enhanced salinities of The Coorong. Assemblages
south of site 4 include either E. excavatum forma
excavatum or A. aff. aoteana, or both. Except for site
7, all sites south of site 3 in the north lagoon are
dominated by A. aff. aoteana. Moreover, as signified
by the distribution of diatoms, site 8 appears to be the
transition zone wherein only E. excavatum forma
excavatum and A. aff. aoteana are present. Except at
site 10, where Cibicides sp. is abundant, these two
species co-dominate the south lagoon, and species
richness is considerably lower than in the north
lagoon (Fig. 7).
Foraminiferal ecology
In the absence of a reliable transfer function from
which to reconstruct water quality, we utilise the
foraminifera-water quality ordinations (Fig. 8) to
identify associations between species assemblages
and water quality which may be useful for future
qualitative inference of past environments.
In sites close to the Murray Mouth, the percentage of
marine species and species richness is higher. Most
assemblages at sites distant from the mouth are
dominated by two euryhaline species, A. aff. aoteana
and E. excavatum forma excavatum (Figs. 7 and 8).
Sites in the top-left quadrant of the CCA are charac-
terised by an assemblage comprising approximately
30% A. aff. aoteana, 20–40% T. dimidiata in combi-
nation with other marine species, associated with high
pH and lower salinities. The lower-left quadrant of
the ordination contains sites in the north lagoon
exclusively, and the assemblages are dominated by
A. aff. aoteana and E. crispum, exhibiting a positive
relationship with pH and, to a lesser extent, water
depth. The top-right quadrant contains exclusively
sites in the south lagoon where the assemblages are
dominated by A. aff. aoteana and E. excavatum forma
excavatum, with no marine taxa (Fig. 7 and 8). These
assemblages exhibit a strong positive relationship
with salinity, turbidity, Chl a and nutrients (Fig. 8).
Sites in the lower right-quadrant have similar species
assemblages, but slightly higher species richness. The
difference between the two groupings appears to be
related to differences in depth, turbidity, nitrogen and
salinity.
Conclusion
In 2007, the absence of discharges from Lake
Alexandrina may have caused salinity to increase
throughout the year in the north lagoon. In the south
lagoon, however, reductions in salinity during August
and November may have been the product of
groundwater discharge, in combination with rainfall.
Despite the seasonal subtleties, the evaporative
concentration of salts resulted in the characteristic
salinity gradient with increasing distance from the
Murray Mouth in The Coorong. Distinct changes in
the relative abundance of diatoms and, to a lesser
extent, foraminifera were evident along a water-
quality gradient. Canonical correspondence analysis
indicates that both diatom and foraminifera assem-
blages are strongly related to salinity. The type of
sediment differs from site to site in The Coorong, and
future studies may benefit from quantitative analysis
of sediment characteristics and its relationship to
benthic organisms. The derived salinity optima and
tolerances for several diatom species provide new
information on their ecological ranges.
A relatively robust salinity transfer function was
developed from the diatom assemblages, but not from
the suite of foraminifera. However, the down-core
application of the diatom-salinity transfer function
was not in agreement with the history of The
Coorong, a consequence of anthropogenic activities
556 J Paleolimnol (2011) 46:543–560
123
impacting The Coorong environment (see Dick et al.
this volume). Significantly heightened salinity, the
direct result of upstream regulation and excessive
water abstraction in catchments at both ends of The
Coorong, has altered the composition of its modern
biota. These impacts may have decreased foraminif-
eral abundances and contributed to a reduction in
species richness. It appears, therefore, that quantita-
tive reconstruction of salinity in The Coorong and in
Lake Alexandrina cannot be achieved through appli-
cation of the salinity-based models developed in this
study. Future models may function better with the
inclusion of species-environment data from other
coastal regions, though the paucity of research in
estuaries generally, and in Australia in particular,
may prove an impediment. Despite these limitations,
this study has provided ecological information about
diatom and foraminiferal taxa that will be useful in
the qualitative interpretation of down-core trends in
The Coorong and Lower Murray River region.
Acknowledgments This paper is a synthesis of the work
undertaken by the two lead authors for their respective PhD
projects. The project was supported by financial and in kind
contributions from the Department of Water, Land and
Biodiversity Conservation and the Department for
Environment and Heritage (South Australia), and an
Australian Research Council Linkage Grant LP0667819 to
Peter Gell, David McKirdy and John Tibby. We thank
traditional owners, the Ngarrindjeri, for permission to
undertake the work. The assistance of SA Water in accessing
some sites is appreciated. Peter Christie from the Environment
Protection Authority generously loaned the YSI 556
Multiprobe water meter for field use. Field assistance was
provided by Susan and Kathleen Haynes, Fiona Little, Patrick
Maiden, Ashley Natt, Eric Nicholson, Hossain Siddiqui, Jake
and Anne Skinner. Thanks to Ted Thurley, Geoff and Jake
Skinner for manufacturing the vacuum corer used in this
project (the Snikker), and to Eric Nicholson for assistance in its
design. Special thanks are also due to the reviewers whose
extensive suggestions resulted in substantial improvement to
the final manuscript.
References
Albani AD (1979) Recent shallow water Foraminiferida from
New South Wales. Australian Marine Sciences Associa-
tion, New South Wales
Albani AD, Hayward BW, Grenfell HR, Lombardo R (2001)
Foraminifera from the South West Pacific. Australian
biological resources study. CD-ROM—ISBN 0-7334-
1835-X
APHA (1998) American public health association, incorpo-
rating American water works associated and water envi-
ronment federation: standard methods for the examination
of water and wastewater. American Public Health Asso-
ciation, Washington
Australian Standard 3753 (1990) Recommended practice for
ethanol analysis by UV/Vis spectrophotometry
Battarbee RW, Jones VJ, Flower RJ, Cameron NG, Bennion H,
Carvalho L, Juggins S (2001) Diatoms. In: Stoermer EF,
Birks HJB, Last WM (eds) Tracking environmental
change using lake sediments. Volume 3: terrestrial, algal
and siliceous indicators. Kluwer Academic Publishers,
Dordrecht, pp 155–202
Bennion H, Appleby PG, Phillips GL (2001) Reconstructing
nutrient histories in the Norfolk Broads, UK: implications
for the role of diatom-total phosphorus transfer functions
in shallow lake management. J Paleolimnol 26:181–204
Birks HJB (1998) Numerical tools in palaeolimnology—progress,
potentialities, and problems. J Paleolimnol 20:307–332
BoM (2009) Bureau of meteorology. Online Australian climate
information. Available at: http://www.bom.gov.au/climate/
averages/tables/cw_024518.shtml. Retrieved 6 June 2009
Bourman RP, Barnett EJ (1995) Impacts of river regulation on
the terminal lakes and mouth of the River Murray, South
Australia. Aust Geog Stud 33:101–115
Bourman RP, Murray-Wallace CV, Belperio AP, Harvey N
(2000) Rapid coastal change in the River Murray estuary
of Australia. Mar Geol 170:141–168
Buzas MA (1990) Another look at confidence limits for species
proportions. J Paleont 64:842–843
Caica P (2010) End to dredging operations at Murray Mouth:
news release. Government of South Australia. Available
at: http://www.waterforgood.sa.gov.au/wp-content/uploads/
2010/12/dredging-ends-in-the-murray-mouth.pdf. Retrieved 3
Jan 2011
Cann JH, Bourman RP, Barnett EJ (2000) Holocene forama-
nifera as indicators of relative estuarine-lagoonal and
oceanic influences in estuarine sediments of the River
Murray, South Australia. Quat Res 53:378–391
Cooper SR (1999) Estuarine paleoenvironmental reconstructions
using diatoms. In: Stroemer EF, Smol JP (eds) The diatoms:
applications for the environmental and earth sciences.
Cambridge University Press, Cambridge, pp 352–373
Cooper SR, McGlothlin SM, Ritch M, Jones DL (2004)
Paleoecological evidence of human impacts on the Neuse
and Pamlico Estuaries of North Carolina, USA. Estuaries
27(4):617–633
CSIRO (2009) An ecosystem assessment framework to guide
management of The Coorong. Final report of the CLL-
AMMecology research cluster. CSIRO: Water for a
Healthy Country National Research Flagship, Canberra
Davies SJ, Metcalf SE, Caballero ME, Juggins S (2002)
Developing diatom-based transfer functions for Central
Mexican lakes. Hydrobiologia 467:199–213
de Jonge VN, Elliot M, Orive E (2002) Causes, historical
development, effects and future challenges of a common
environmental problem: eutrophication. Hydrobiologia
475–476:1–19
DEHAA (Department of Environment, Heritage and Aborigi-
nal Affairs) (1999) Coorong, Lake Alexandrina and Lake
Albert Ramsar draft management plan. DEHAA, Adelaide
J Paleolimnol (2011) 46:543–560 557
123
Desikachary TV (1986) Atlas of diatoms. Fascicle 1. Marine
fossil diatoms from India and Indian ocean region, 1st
edn. Madras Science Foundation, J.J. Maps and Publica-
tions, Madras
Desikachary TV (1987) Atlas of diatoms. Fascicle 2. Diatom
flora of Somen sediments from the Indian ocean region,
1st edn. Madras Science Foundation, J.J. Maps and Pub-
lications, Madras
Desikachary TV (1988a) Atlas of diatoms. Fascicle 3–4. Dia-
toms from the Bay of Bengal/marine diatoms from the
Arabian Sea and Indian Ocean, 1st edn. Madras Science
Foundation, J.J. Maps and Publications, Madras
Desikachary TV (1988b) Atlas of diatoms. Fascicle 5. Marine
diatoms of the Indian Ocean region, 1st edn. Madras
Science Foundation, J.J. Maps and Publications, Madras
Desikachary TV (1989) Atlas of diatoms. Fascicle 6. Marine
diatoms of the Indian Ocean region, 1st edn. Madras
Science Foundation, J.J. Maps and Publications, Madras
Dick J, Haynes D, Tibby J, Garcia A, Gell, P. A history of
aquatic plants in The Coorong, a Ramsar-listed coastal
wetland, South Australia. J Palaeolimnol (this volume)
Everingham P (2007) REFLOWS project. Background paper:
Coorong management. Use dryland salinity and flood
management program. Available at: http://www.dwlbc.sa.gov.
au/assets/files/Coorong_Management_rev_2.pdf. Retrieved
31 May 2009
Fluin J, Gell P, Haynes D, Tibby J (2007) Paleolimnological
evidence for the independent evolution of neighbouring
terminal lakes, the Murray Darling Basin, Australia.
Hydrobiologia 591:117–134
Ford PW (2007) Biogeochemistry of The Coorong. Review and
identification of future research requirements. CSIRO,
Water for a Healthy Country National Research Flagship
Fritz SC, Juggins S, Battarbee RW (1993) Diatom assemblages
and ionic characterization of lakes of the Northern Great
Plains, North America: a tool for reconstructing past
salinity and climate fluctuations. Can J Fish Aquat Sci
50:1844–1856
Gasse F, Juggins S, BenKhelifa L (1995) Diatom-based
transfer functions for inferring past hydrochemical char-
acteristics of African lakes. Palaeogeogr Palaeoclimatol
Palaeoecol 117:31–54
Gell PA (1997) The development of diatom database for
inferring lake salinity, Western Victoria, Australia:
towards a quantitative approach for reconstructing past
climates. Aust J Bot 45:389–423
Haese R, Gow L, Wallace L, Brodie RS (2008) Identifying
groundwater discharge in The Coorong (South Australia).
Ausgeo news, Issue 91, September, 2008. Geosciences
Australia. 6 p. Available at: http://www.ga.gov.au/ausgeo
news/ausgeonews200809/groundwater.jsp. Retrieved 21
Oct 2008
Haese RR, Murray EJ, Wallace L (2009) Nutrient sources,
water quality, and biogeochemical processes in The
Coorong, South Australia. Geoscience Australia record
2009/19, Commonwealth Government, Canberra, 32 pp.
Available at: http://www.ga.gov.au/image_cache/GA14722.
pdf. Retrieved 25 Nov 2010
Hassan GS, Espinosa MA, Isla FI (2006) Modern diatom
assemblages in surface sediments from estuarine systems
in the southeastern Buenos Aires Province, Argentina.
J Paleolimnol 35:39–53
Hassan GS, Espinosa MA, Isla FI (2009) Diatom-based infer-
ence model for paleosalinity reconstructions in estuaries
along the northeastern coast of Argentina. Palaeogeogr
Palaeoclimatol Palaeoecol 275:77–91
Hayward BW, Scott GH, Grenfell HR, Carter R, Lipps JH
(2004a) Techniques for estimation of tidal elevation and
confinement (salinity) histories of sheltered harbours and
estuaries using benthic foraminifera: examples from New
Zealand. Holocene 14(2):218–232
Hayward BW, Holzmann M, Grenfell HR, Pawlowski J, Triggs
CM (2004b) Morphological distinction of molecular types
in Ammonia—towards a taxonomic revision of the
world’s most commonly misidentified foraminifera. Mar
Micropaleont 50:237–271
Hill MO (1973) Diversity and evenness: a unifying notation
and its consequences. Ecology 54:427–432
Hill MO, Gauch HG (1980) Detrended correspondence anal-
ysis: an improved ordination technique. Plant Ecol
42(1):47–58
Horton BP, Corbett R, Culver SJ, Edwards RJ, Hillier C (2006)
Modern saltmarsh diatom distributions of the Outer
Banks, North Carolina, and the development of a transfer
function for high resolution reconstructions of sea level.
Estuar Coast Shelf Sci 69:381–394
Ivanova E, Schiebel R, Singh AD, Schmiedl G, Niebler H-S,
Hemleben C (2003) Primary production in the Arabian
Sea during the last 135, 000 years. Palaeogeogr Palaeo-
climatol Palaeoecol 197:61–82
Juggins S (2003) C2 User guide. Software for ecological and
palaeoecological data analysis and visualisation. Univer-
sity of Newcastle, Newcastle upon Tyne, UK, p 69
Kauppila P, Weckstrom K, Vaalgamaa S, Korhola A, Pitkanen
H, Reuss N, Drew S (2005) Tracing pollution and
recovery using sediments in an urban estuary, northern
Baltic Sea: are we far from ecological reference condi-
tions? Mar Ecol Prog Ser 290:35–53
Krammer K, Lange-Bertalot H (1986) Bacillariophyceae, 1
Teil: Naviculaceae. In: Ettl H, Gartner G, Gerloff J,
Heynig H, Mollenhauer D (eds) Subwasserflora von
Mitteleuropa, Band 2/1, Stuttgart/Jena: Gustav Fischer
Verlag, 876 pp
Krammer K, Lange-Bertalot H (1988) Bacillariophyceae, 2
Teil: Bacillariaceae, Epthimiaceae, Surirellaceae. In: Ettl
H, Gartner G, Gerloff J, Heynig H, Mollenhauer D (eds)
Subwasserflora von Mitteleuropa, Band 2/2, Stuttgart/
Jena: Gustav Fischer Verlag, 596 pp
Krammer K, Lange-Bertalot H (1991a) Bacillariophyceae, 3
Teil: Centrales, Fragilariaceae, Eunotiaceae. In: Ettl H,
Gartner G, Gerloff J, Heynig H, Mollenhauer D (eds)
Subwasserflora von Mitteleuropa, Band 2/3, Stuttgart/
New York: Gustav Fischer Verlag, 576 pp
Krammer K, Lange-Bertalot H (1991b) Bacillariophyceae, 4
Teil: Achnanthaceae, Kritische Erganzungen zo Navicula
(Lineolatae) und Gomphonema Gesamtliteraturverzeichnis
Teil 1-4. In: Ettl H, Gartner G, Gerloff J, Heynig H, Mol-
lenhauer D (eds) Subwasserflora von Mitteleuropa, Band
2/4, Stuttgart/New York: Gustav Fischer Verlag, Stuttgart,
437 pp
558 J Paleolimnol (2011) 46:543–560
123
Krull E, Haynes D, Lamontagne S, Gell P, McKirdy D, Han-
cock G, McGowan J, Smernik R (2009) Changes in the
chemistry of sedimentary organic matter within The
Coorong over space and time. Biogeochemistry 92:9–25
Larsson U, Elmgren R, Wulff F (1985) Eutrophication and the
Baltic Sea—causes and consequences. Ambio 14:9–14
Leps J, Smilauer P (2003) Multivariate analysis of ecological data
using CANOCO. Cambridge University Press, Cambridge
Levesque R (2007) SPSS programming and data management:
a guide for SPSS and SAS users, 4th edn. SPSS Inc.,
Chicago
Mackay AW, Battarbee RW, Flower RJ, Granin NG, Jewson
DH, Ryves DB, Sturm M (2003) Assessing the potential
for developing internal diatom-based transfer functions
for Lake Baikal. Limnol Oceanogr 48:1183–1192
McKirdy DM, Thorpe CS, Haynes DE, Grice K, Krull ES,
Halverson GP, Webster LJ (2010) The biogeochemical
evolution of the Coorong during the mid-to-late Holocene:
an elemental, isotopic and biomarker perspective. Org
Geochem 41:96–110
McLusky DS, Elliott M (2004) The estuarine ecosystem:
ecology, threats and management. Oxford University
Press, Oxford
McQuoid MR, Nordberg K (2003) The diatom Paralia sulcataas an environmental indicator species in coastal sedi-
ments. Estuar Coast Shelf Sci 56:339–354
MDBC (2008) Murray Darling Basin Commission annual report
2007–2008. Murray Darling Basin Commission, Canberra.
Available at: http://www.mdbc.gov.au/subs/annual_reports/
AR_2007-08/downloads.htm Retrieved 27 Apr 09
Moss B (1977) Adaptations of epipelic and epipsammic
freshwater algae. Oecologia 28:103–108
Murray J (1991) Ecology and palaeoecology of benthic
foraminifera. Longman Scientific and Technical and John
Wiley and Sons Inc, New York
NLWRA (National Land, Water Resources Audit) (2002)
Australian catchment, river and estuary assessment, vol 1.
Commonwealth of Australia, Canberra, p 196
OzCoasts (2010) Diatom species composition. Available at:
http://www.ozcoasts.org.au/indicators/diatom_species_com
position.jsp. Retrieved 30 Jan 10
Pflaumann U, Sarnthein M, Chapman M, d’Abreu L, Funnell
B, Huels M, Kiefer T, Maslin M, Schulz H, Swallow J,
van Kreveld S, Vautravers M, Vogelsang E, Weinelt M
(2003) Glacial North Atlantic: sea-surface conditions
reconstructed by GLAMAP 2000. Paleoceanography,
18:1065, 28 pp. doi:10.1029/2002PA000774
Phillips W, Muller K (2006) Ecological character of the Coo-
rong, Lakes Alexandrina and Albert Wetland of interna-
tional importance. South Australian Department for
Environment and Heritage
Plater AJ, Horton BP, Haworth EW, Appleby PG, Zong Y,
Wright MR, Rutherford MM (2000) Holocene tidal levels
and sedimentation rates using a diatom-based palaeoen-
vironmental reconstruction: the Tees estuary, northeastern
England. Holocene 10(4):441–452
Reavie ED, Axler RP, Sgro GV, Danz NP, Kingston JC, Kireta
AR, Brown TN, Hollenhorst TP, Ferguson MJ (2006)
Diatom-based weighted-averaging transfer functions for
Great Lakes coastal water quality: relationships to
watershed characteristics. J Gt Lakes Res 32:321–347
Reed JM (1998) A diatom-conductivity transfer function for
Spanish salt lakes. J Paleolimnol 19:399–416
Roy PS, Crawford EA (1984) Heavy metals in a contaminated
Australian estuary–dispersion and accumulation trend.
Estuar Coast Shelf Sci 19:341–358
Ryves DB, Clarke AL, Appleby PG, Amsinck SL, Jeppesen E,
Landkildehus F, Anderson NJ (2004) Reconstructing the
salinity and environment of the Limfjord and Vejlerne Nat-
ure Reserve, Denmark, using a diatom model for brackish
lakes and fjords. Can J Fish Aquat Sci 61:1988–2006
Saunders KM, McMinn A, Roberts D, Hodgson DA, Hejinis H
(2007) Recent human-induced salinity changes in Ram-
sar-listed Orielton Lagoon, southeast Australia. Aquat
Conserv: Mar Freshwat Ecosyst 17:51–70
Saunders KM, Hodgson DA, Harrison J, McMinn A (2008)
Palaeoecological tools for improving the management of
coastal ecosystems: a case study from Lake King (Gip-
psland Lakes) Australia. J Paleolimnol 40:33–47
Sayer CD (2001) Problems with the application of diatom-total
phosphorus transfer functions: examples from a shallow
English lake. Freshw Biol 46:743–757
Sejrup HP, Birks HJB, Kristensen DK, Madsen H (2004)
Benthonic foraminiferal distributions and quantitative
transfer functions for the northwest European continental
margin. Mar Micropaleon 53:197–226
Sournia A (ed) (1987) Alas du phytoplancton marin, Vol II:
Diatomophycees. Centre National de la Recherche Sci-
entifique, Paris
Sullivan MJ (1999) Applied diatom studies in estuaries and
shallow coastal environments. In: Stoermer EF, Smol JP
(eds) The diatoms: applications for the earth and envi-
ronmental sciences. Cambridge University Press, New
York, pp 334–351
Taffs KH, Farago LJ, Heijnis H, Jacobsen G (2008) A diatom-
based Holocene record of human impact from a coastal
environment: Tuckean Swamp, eastern Australia. J Palae-
olimnol 39:71–82
Taukulis FE, John J (2009) Development of a diatom-based
transfer function for lakes and streams severely impacted
by secondary salinity in the south-west region of Western
Australia. Hydrobiologia 626:129–143
ter Braak CJF (1986) Canonical correspondence analysis: a
new eigenvector technique for multivariate direct gradient
analysis. Ecology 67:1167–1179
ter Braak CJF, Smilauer P (2004) Canoco for Windows version
4.53. Biometris—Plant Research International Wagenin-
gen, The Netherlands
Thomas P, Lang A (2003) Water quality monitoring of Coo-
rong lagoons. A report prepared by Australian Water
Quality Centre for the Department of Environment and
Heritage. SA water report No. 2003/1
Thomlinson GW (1996) The upper south east dryland and flood
management plan. Freshwater inflows to The Coorong
South lagoon. A report prepared for the Natural Resources
Council of South Australia. Adelaide, Water Information
Unit, Water Resources Group
Tibby J (2003) Explaining lake and catchment change using
sediment derived and written histories: an Australian
perspective. Sci Total Environ 310:61–71
Tibby J, Reid MA, Fluin J, Hart BT, Kershaw AP (2003)
Assessing long-term pH change in an Australian river
J Paleolimnol (2011) 46:543–560 559
123
catchment using monitoring and palaeolimnological data.
Enviro Sci Technol 37(15):3250–3255
Vos PC, De Wolf H (1993) Diatoms as a tool for reconstructing
sedimentary environments in coastal wetlands; methodo-
logical aspects. Hydrobiologia 269(270):285–296
Walker DJ (2002) The behaviour and future of the River
Murray Mouth. Report prepared for the Murray-Darling
Basin commission. Centre for Applied Modelling in
Water Engineering, Adelaide University, p 25
Webster IT (2010) The hydrodynamics and salinity regime of a
coastal lagoon—The Coorong, Australia: Seasonal to multi-
decadal timescales. Estuar Coast Shelf Sci 90:264–274
Wintermans IF, de Mots GM (1965) Spectrophotometric
characteristics of chlorophylls a and b and their phaeo-
phytins in ethanol. Biochem Biophys Acta 109:448–453
Witkowski A, Lange-Bertalot H, Metzeltin D (2001) Diatom
flora of marine coasts 1. Iconogr diatomol, vol 7. A. R.
G. Gantner Verlag, Ruggell, p 925
Yassini I, Jones BG (1987) Ostracoda in Lake Illawarra:
environmental factors, assemblages and systematics. Aust
J Mar Freshw Res 38:795–843
Zong Y (1997) Implications of Paralia sulcata abundance in
Scottish isolation basins. Diatom Res 2(1):125–150
560 J Paleolimnol (2011) 46:543–560
123