simultaneous determination of pyrathiazine theoclate and pyridoxine hcl by tlc-densitometry in...
TRANSCRIPT
PLEASE SCROLL DOWN FOR ARTICLE
This article was downloaded by: [Indrayanto, Gunawan]On: 18 November 2008Access details: Access Details: [subscription number 905627665]Publisher Taylor & FrancisInforma Ltd Registered in England and Wales Registered Number: 1072954 Registered office: Mortimer House,37-41 Mortimer Street, London W1T 3JH, UK
Journal of Liquid Chromatography & Related TechnologiesPublication details, including instructions for authors and subscription information:http://www.informaworld.com/smpp/title~content=t713597273
Simultaneous Determination of Pyrathiazine Theoclate and Pyridoxine HCl byTLC-Densitometry in Commercial Tablets: Validation of the MethodDian Widiretnani a; Sari Indah Wahyuni a; Farina Kartinasari a; Gunawan Indrayanto b
a Analytical Development Section, Department of R&D, Bernofarm Pharmaceutical Company, Sidoarjo,Surabaya, Indonesia b Assessment Service Unit, Faculty of Pharmacy, Airlangga University, Surabaya,Indonesia
Online Publication Date: 01 January 2009
To cite this Article Widiretnani, Dian, Wahyuni, Sari Indah, Kartinasari, Farina and Indrayanto, Gunawan(2009)'SimultaneousDetermination of Pyrathiazine Theoclate and Pyridoxine HCl by TLC-Densitometry in Commercial Tablets: Validation of theMethod',Journal of Liquid Chromatography & Related Technologies,32:1,154 — 165
To link to this Article: DOI: 10.1080/10826070802548762
URL: http://dx.doi.org/10.1080/10826070802548762
Full terms and conditions of use: http://www.informaworld.com/terms-and-conditions-of-access.pdf
This article may be used for research, teaching and private study purposes. Any substantial orsystematic reproduction, re-distribution, re-selling, loan or sub-licensing, systematic supply ordistribution in any form to anyone is expressly forbidden.
The publisher does not give any warranty express or implied or make any representation that the contentswill be complete or accurate or up to date. The accuracy of any instructions, formulae and drug dosesshould be independently verified with primary sources. The publisher shall not be liable for any loss,actions, claims, proceedings, demand or costs or damages whatsoever or howsoever caused arising directlyor indirectly in connection with or arising out of the use of this material.
Simultaneous Determination of PyrathiazineTheoclate and Pyridoxine HCl by TLC-Densitometry
in Commercial Tablets: Validation of the Method
Dian Widiretnani,1 Sari Indah Wahyuni,1 Farina Kartinasari1 and
Gunawan Indrayanto2
1Analytical Development Section, Department of R&D, BernofarmPharmaceutical Company, Sidoarjo, Surabaya, Indonesia
2Assessment Service Unit, Faculty of Pharmacy, Airlangga University,Surabaya, Indonesia
Abstract: A simple and rapid densitometric method has been developed for deter-mination of pyrathiazine theoclate and pyridoxine HCl in commercial tablets.After extracting the samples four times with ethanol, the solutions were spottedon pre-coated silica gel TLC plates, which were eluted with a mixture of dichloro-methane–methanol–acetone–acetic acid (19.5:6.0:3.0:1.5, v=v). Quantitative eva-luation was performed by measuring the absorbance reflectance of the analytespots at k¼ 254 nm. The TLC-densitometric method is cheap, selective, precise,and accurate and can be used for routine analysis of pyrathiazine theoclate andpyridoxine HCl in tablet preparations at industry quality control laboratories.
Keywords: Densitometry, Parathiazine theoclate, Pyrathiazine theoclate,Pyridoxine HCl, Tablets, TLC, Validation
INTRODUCTION
A drug combination of pyrathiazine theoclate and pyridoxine HCl wasrecently marketed in Indonesia as an anti-vomiting tablet.[1] Pyrathiazine
Correspondence: Gunawan Indrayanto, Assessment Service Unit, Faculty ofPharmacy, Airlangga University, Dharmawangsa dalam, Surabaya, Indonesia.E-mail: [email protected]
Journal of Liquid Chromatography & Related Technologies1, 32: 154–165, 2009
Copyright # Taylor & Francis Group, LLC
ISSN: 1082-6076 print/1520-572X online
DOI: 10.1080/10826070802548762
Downloaded By: [Indrayanto, Gunawan] At: 00:44 18 November 2008
(synonym:parathiazine), which has chemical name 10-[2-(1-pyrrolidyl)ethyl]phenothiazine, was not yet described officially in Indonesian pharma-copoeia[2] and other Pharmacopoeias,[3–5] whilst the method of analysis ofpyridoxine HCl were reported in some common Pharmacopoeias.[2–5]
Pyrathiazine theoclate consisted of one molecule of pyrathiazinebase and theoclate (chloro-8-dimethyl-1,3 dioxo 2,6 tetrahydro-1,2,3,6purine), respectively.[6] Some TLC methods of Pyridoxine HCl wereavailable in Camag Bibliography Service data base.[7] To the best ofour knowledge, no reports were available for the simultaneous densito-metry determination of pyrathiazine theoclate and pyridoxine HCl.
The aim of this present work was to develop a simple, validated, andrapid densitometry method for routine analysis of pyrathiazine theoclateand pyridoxine HCl in tablets.
EXPERIMENTAL
Materials and Reagents
Pyrathiazine theoclate (Hy-Gro Chemicals Pharmtek, Secondarabad,India; Batch: PT-001; Assay 99.57%; Expiration date: October 2009),Pyridoxine hydrochloride (BASF South East Asia Pte. Ltd; Singapore;Batch: 0703427; Assay 99.8%;) were pharmaceutical grade substances.The substances were used as received for the standard addition method,and standard solutions. Commercial tablets (CT) which containingpyrathiazine theoclate, 40 mg and pyrodoxine HCl, 37.5 mg tablet�1
was bought in a local pharmacy at Surabaya in November 2007 (Batch:SZ6A003, Expire date November 2009).
Methanol, ethyl acetate, dichloromethane (Mallinckrodt Baker, Inc,Philipsburg, NJ, USA), acetone (J.T. Baker, Philipsburg, NJ, USA), andacetic acid anhydride, potassium hydroxide, potassium hydrogenphosphate, ammonium hydroxide, ethanol 96% (E. Merck, Darmstadt,Germany) were analytical grade solvents and reagents, and were usedwithout further purification.
Stock standard solutions were prepared by dissolving accuratelyweighed pyrathiazine theoclate (20.0, 30.0, 50.0 mg) and pyridoxineHCl (20.0, 30.0, 50.0 mg) in 25.0 mL in ethanol, 96%. Various standardsolutions were prepared from the stock solution by dilution with ethanol,96%. For basic linearity study, the solutions were prepared containing750, 1000, 1250, 1500, 1750, 2000, 2250, 2500, and 2750 mg mL�1 of bothsubstances. Of these solutions, 2 mL was spotted onto the TLC plate. Thestandard solutions were stable at least for 48 hours at room temperature(Mean�RSD (%) for pyrathiazine theoclate and pyridoxine HCl were
TLC-Densitometry in Commercial Tablets: Validation of the Method 155
Downloaded By: [Indrayanto, Gunawan] At: 00:44 18 November 2008
100.3� 1.50 and 100.8� 0.63, respectively, n¼ 3, at 24� 2�C, roomhumidity 50� 10%).
Phosphate buffer pH 6.8 was used as the dissolution media. Thedissolution experiments were performed using the paddle method(75 rpm, 900 mL; 60 min).
Sample Preparation
Twenty commercial tablets were each weighed, and their mean was deter-mined. After homogenizing the powder, an equivalent weight of a 0.4tablet (equivalent to 16.0 and 15.0 mg pyratahiazine theoclate and pyrid-oxine HCl, respectively) was transferred into a 10.0 mL volumetric flaskcontaining about 5 mL of ethanol 96%, ultrasonicated for 10 min, anddiluted to 10.0 mL with ethanol 96%. The solution was filtered through0.45 mm Durapore1, membrane filters (Milipore, Ireland) filters beforespotting on to TLC plates (2.0 mL), together with the standard.
For accuracy studies, aliquots of pyrathiazine theoclate and pyrid-oxine HCl solutions (20, 40, 60, and 80% of the label claim) were addedto powdered commercial drugs; after air dried, the powdered tablets wereextracted with ethanol 96% as describe above. Aliquots of standard solu-tions (80, 100, 120% of the label claim) were added to the dissolutionmedium (total volume was 900 mL). 2 mL of this solution, 2 mL wasspotted on the TLC plates.
For differentiating the spots of pyrathiazine base and theoclate,45 mg of pyrathiazine theoclate was dissolved in 6.0 mL of water, thandrops of NH4OH (25%) was added until pH was 10. The solution wasextracted four times using 6 mL of ethyl acetate by using a vortex mixer.The ethyl acetate fractions (F-EtOA) was collected in 25 mL volumetricflasks and diluted with ethyl acetate to volume. The 2.0 mL ethyl acetatefraction and water (F-Wt) was than spotted on the TLC plate.
Chromatography
Chromatography was performed on pre-coated silica gel F254 aluminumback sheets (E. Merck. # 1.05554, all the pre-coated plates were cut into10� 20 cm before used). The plates were used as obtained from the manu-facturer without any pretreatment; a Nanomat III (Camag, Muttenz,Switzerland) equipped with a dispenser magazine containing 2.0 and5.0 mL glass capillaries (Camag) was used for sample application (as spot-ted with diameter ca. 2 mm). The mobile phase used in this experiment isdichloromethane–methanol–acetone–acetic acid (19.5:6.0:3.0:1.5, v=v).The distance from the lower edge was 10 mm; distance from the side
156 D. Widiretnani et al.
Downloaded By: [Indrayanto, Gunawan] At: 00:44 18 November 2008
was 15 mm, and track distance was 10 mm. Ascending development wasperformed in a Camag twin-through chamber (for 20� 10 cm plates)after at least 60 min of saturation; the mobile phase migration distancein all experiments was 8.0 cm. (development time ca. 20 min at24� 2�C). The plate was air dried and than scanned in the TLC scanner.
Densitometric scanning was performed with a Camag TLC-ScannerIII. The purity and identity of the analyte spots were determined by scan-ning the absorbance-reflectance mode from 200 to 400 nm. Quantitativeevaluation was performed by measuring the absorbance reflectance ofthe analyte spots at k 254 nm. The densitometric scanning parameterswere: bandwidth 10 nm, slit width 4, slit length 6, and scanning speed4 mm s�1. Calculations for identity, purity checks (rS,M and rM,E whereS¼ start, M¼ center, E¼ end spectrum), sdv (relative standard deviation)of the linear=calibration curve, and quantification of the analyte spotswere performed by software winCATS version 1.4.2. (2006, Camag).Routine quantitative evaluations were performed via peak areas(pyrathiazine base and pyridoxine HCl) with linear regression, using 4–5points’ external calibration on each plate (80 to 120% of the targetedvalue). For quantitative evaluation, the concentration of pyrathiazinetheoclate in samples was calculated based on the peak area of pyrathiazinebase. Each of the extract aliquot samples was spotted at least in duplicate.
Validation
The method was validated for linearity, detection limit (DL), quantita-tion limit (QL), accuracy, precision, and robustness by the method[8,9]
with modification. Accuracy study was performed by the standard addi-tion method. Aliquots of standard solutions of pyrathiazine theoclateand pyridoxine HCl were added to powdered tablets and dissolutionmedium (900 mL); after air-dried the powdered tablets were extractedas described above. Design and analysis of effect of the robustness eva-luation were performed and calculated by using Unscramble 9.6TM
(2006) software from CAMO (Bangalore, India).
RESULTS AND DISCUSSION
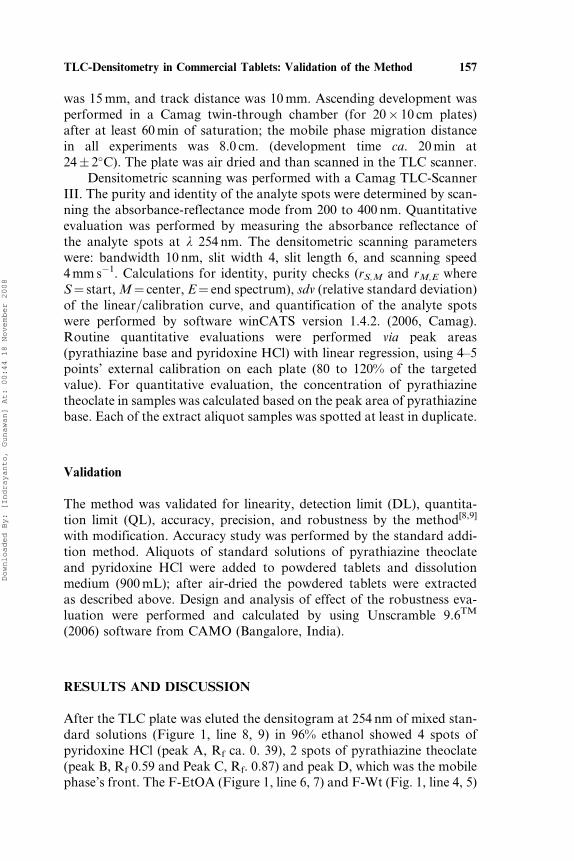
After the TLC plate was eluted the densitogram at 254 nm of mixed stan-dard solutions (Figure 1, line 8, 9) in 96% ethanol showed 4 spots ofpyridoxine HCl (peak A, Rf ca. 0. 39), 2 spots of pyrathiazine theoclate(peak B, Rf 0.59 and Peak C, Rf. 0.87) and peak D, which was the mobilephase’s front. The F-EtOA (Figure 1, line 6, 7) and F-Wt (Fig. 1, line 4, 5)
TLC-Densitometry in Commercial Tablets: Validation of the Method 157
Downloaded By: [Indrayanto, Gunawan] At: 00:44 18 November 2008
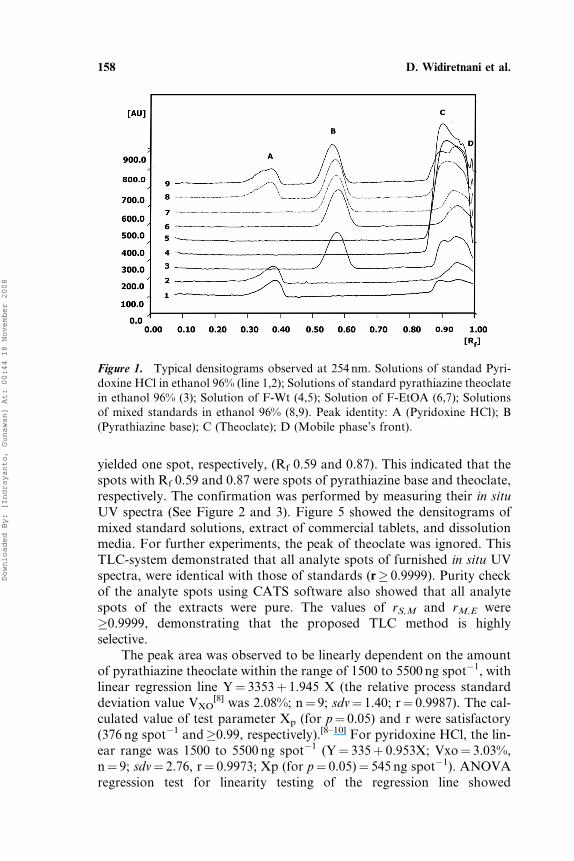
yielded one spot, respectively, (Rf 0.59 and 0.87). This indicated that thespots with Rf 0.59 and 0.87 were spots of pyrathiazine base and theoclate,respectively. The confirmation was performed by measuring their in situUV spectra (See Figure 2 and 3). Figure 5 showed the densitograms ofmixed standard solutions, extract of commercial tablets, and dissolutionmedia. For further experiments, the peak of theoclate was ignored. ThisTLC-system demonstrated that all analyte spots of furnished in situ UVspectra, were identical with those of standards (r� 0.9999). Purity checkof the analyte spots using CATS software also showed that all analytespots of the extracts were pure. The values of rS,M and rM,E were�0.9999, demonstrating that the proposed TLC method is highlyselective.
The peak area was observed to be linearly dependent on the amountof pyrathiazine theoclate within the range of 1500 to 5500 ng spot�1, withlinear regression line Y¼ 3353þ 1.945 X (the relative process standarddeviation value VXO
[8] was 2.08%; n¼ 9; sdv¼ 1.40; r¼ 0.9987). The cal-culated value of test parameter Xp (for p¼ 0.05) and r were satisfactory(376 ng spot�1 and�0.99, respectively).[8–10] For pyridoxine HCl, the lin-ear range was 1500 to 5500 ng spot�1 (Y¼ 335þ 0.953X; Vxo¼ 3.03%,n¼ 9; sdv¼ 2.76, r¼ 0.9973; Xp (for p¼ 0.05)¼ 545 ng spot�1). ANOVAregression test for linearity testing of the regression line showed
Figure 1. Typical densitograms observed at 254 nm. Solutions of standad Pyri-doxine HCl in ethanol 96% (line 1,2); Solutions of standard pyrathiazine theoclatein ethanol 96% (3); Solution of F-Wt (4,5); Solution of F-EtOA (6,7); Solutionsof mixed standards in ethanol 96% (8,9). Peak identity: A (Pyridoxine HCl); B(Pyrathiazine base); C (Theoclate); D (Mobile phase’s front).
158 D. Widiretnani et al.
Downloaded By: [Indrayanto, Gunawan] At: 00:44 18 November 2008
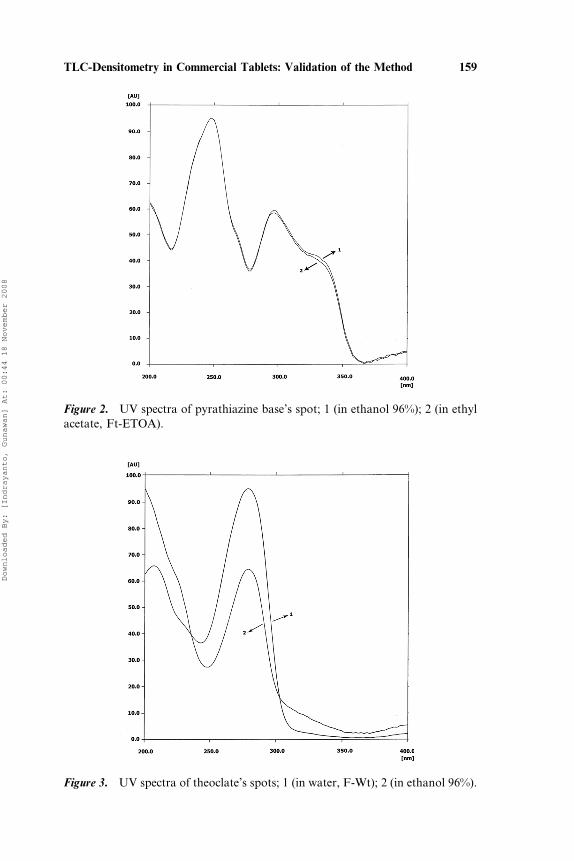
Figure 2. UV spectra of pyrathiazine base’s spot; 1 (in ethanol 96%); 2 (in ethylacetate, Ft-ETOA).
Figure 3. UV spectra of theoclate’s spots; 1 (in water, F-Wt); 2 (in ethanol 96%).
TLC-Densitometry in Commercial Tablets: Validation of the Method 159
Downloaded By: [Indrayanto, Gunawan] At: 00:44 18 November 2008
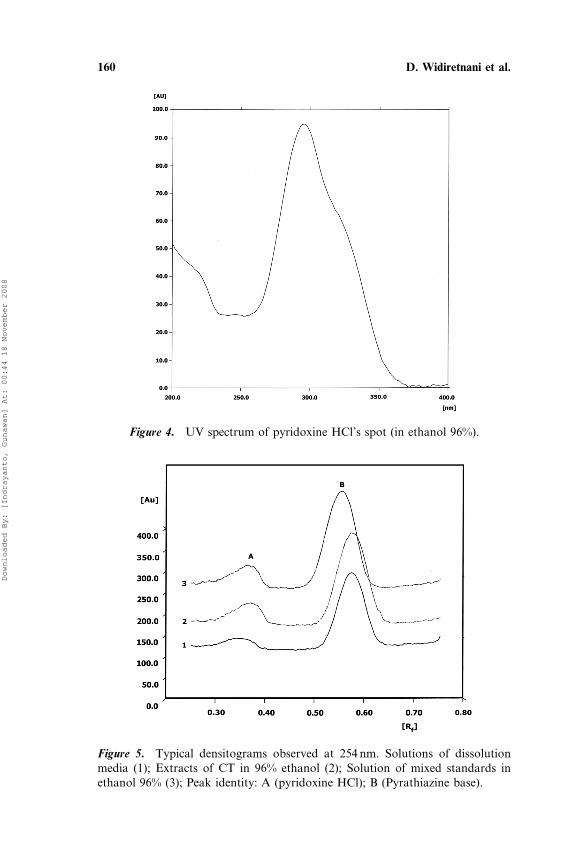
Figure 4. UV spectrum of pyridoxine HCl’s spot (in ethanol 96%).
Figure 5. Typical densitograms observed at 254 nm. Solutions of dissolutionmedia (1); Extracts of CT in 96% ethanol (2); Solution of mixed standards inethanol 96% (3); Peak identity: A (pyridoxine HCl); B (Pyrathiazine base).
160 D. Widiretnani et al.
Downloaded By: [Indrayanto, Gunawan] At: 00:44 18 November 2008
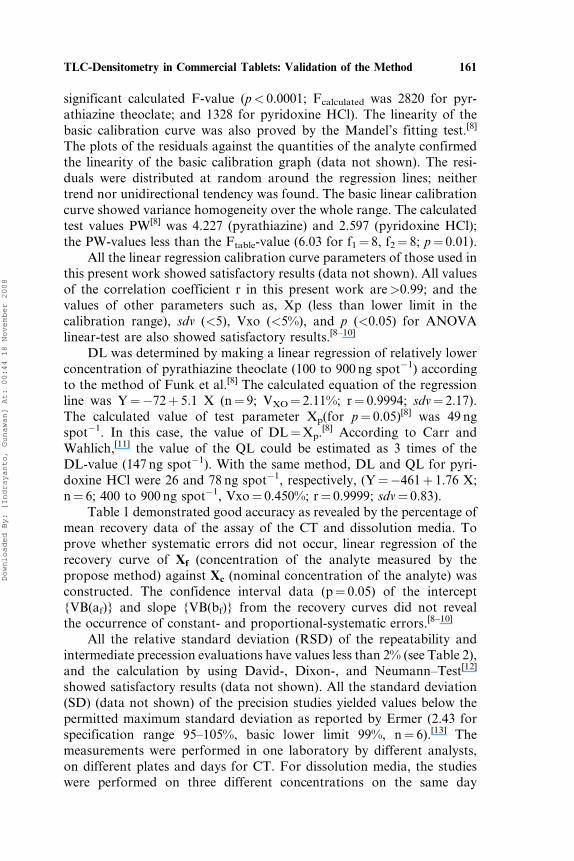
significant calculated F-value (p< 0.0001; Fcalculated was 2820 for pyr-athiazine theoclate; and 1328 for pyridoxine HCl). The linearity of thebasic calibration curve was also proved by the Mandel’s fitting test.[8]
The plots of the residuals against the quantities of the analyte confirmedthe linearity of the basic calibration graph (data not shown). The resi-duals were distributed at random around the regression lines; neithertrend nor unidirectional tendency was found. The basic linear calibrationcurve showed variance homogeneity over the whole range. The calculatedtest values PW[8] was 4.227 (pyrathiazine) and 2.597 (pyridoxine HCl);the PW-values less than the Ftable-value (6.03 for f1¼ 8, f2¼ 8; p¼ 0.01).
All the linear regression calibration curve parameters of those used inthis present work showed satisfactory results (data not shown). All valuesof the correlation coefficient r in this present work are>0.99; and thevalues of other parameters such as, Xp (less than lower limit in thecalibration range), sdv (<5), Vxo (<5%), and p (<0.05) for ANOVAlinear-test are also showed satisfactory results.[8–10]
DL was determined by making a linear regression of relatively lowerconcentration of pyrathiazine theoclate (100 to 900 ng spot�1) accordingto the method of Funk et al.[8] The calculated equation of the regressionline was Y¼�72þ 5.1 X (n¼ 9; VXO¼ 2.11%; r¼ 0.9994; sdv¼ 2.17).The calculated value of test parameter Xp(for p¼ 0.05)[8] was 49 ngspot�1. In this case, the value of DL¼Xp.[8] According to Carr andWahlich,[11] the value of the QL could be estimated as 3 times of theDL-value (147 ng spot�1). With the same method, DL and QL for pyri-doxine HCl were 26 and 78 ng spot�1, respectively, (Y¼�461þ 1.76 X;n¼ 6; 400 to 900 ng spot�1, Vxo¼ 0.450%; r¼ 0.9999; sdv¼ 0.83).
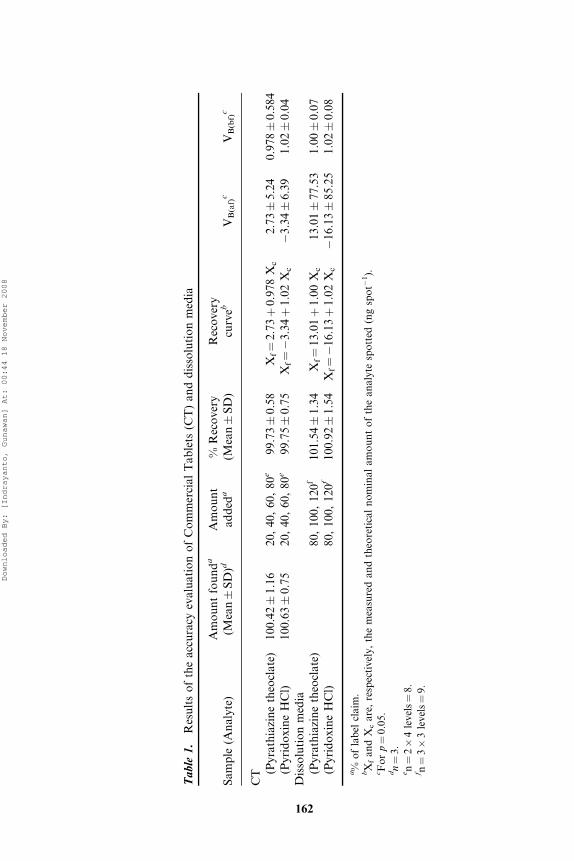
Table 1 demonstrated good accuracy as revealed by the percentage ofmean recovery data of the assay of the CT and dissolution media. Toprove whether systematic errors did not occur, linear regression of therecovery curve of Xf (concentration of the analyte measured by thepropose method) against Xc (nominal concentration of the analyte) wasconstructed. The confidence interval data (p¼ 0.05) of the intercept{VB(af)} and slope {VB(bf)} from the recovery curves did not revealthe occurrence of constant- and proportional-systematic errors.[8–10]
All the relative standard deviation (RSD) of the repeatability andintermediate precession evaluations have values less than 2% (see Table 2),and the calculation by using David-, Dixon-, and Neumann–Test[12]
showed satisfactory results (data not shown). All the standard deviation(SD) (data not shown) of the precision studies yielded values below thepermitted maximum standard deviation as reported by Ermer (2.43 forspecification range 95–105%, basic lower limit 99%, n¼ 6).[13] Themeasurements were performed in one laboratory by different analysts,on different plates and days for CT. For dissolution media, the studieswere performed on three different concentrations on the same day
TLC-Densitometry in Commercial Tablets: Validation of the Method 161
Downloaded By: [Indrayanto, Gunawan] At: 00:44 18 November 2008
Ta
ble
1.
Res
ult
so
fth
ea
ccu
racy
eva
lua
tio
no
fC
om
mer
cia
lT
ab
lets
(CT
)a
nd
dis
solu
tio
nm
edia
Sa
mp
le(A
na
lyte
)A
mo
un
tfo
un
da
(Mea
n�
SD
)dA
mo
un
ta
dd
eda
%R
eco
ver
y(M
ean�
SD
)R
eco
ver
ycu
rveb
VB
(af)
cV
B(b
f)c
CT (P
yra
thia
zin
eth
eocl
ate
)1
00
.42�
1.1
62
0,
40
,6
0,
80
e9
9.7
3�
0.5
8X
f¼
2.7
3þ
0.9
78
Xc
2.7
3�
5.2
40
.97
8�
0.5
84
(Py
rid
ox
ine
HC
l)1
00
.63�
0.7
52
0,
40
,6
0,
80
e9
9.7
5�
0.7
5X
f¼�
3.3
4þ
1.0
2X
c�
3.3
4�
6.3
91
.02�
0.0
4D
isso
luti
on
med
ia(P
yra
thia
zin
eth
eocl
ate
)8
0,
10
0,
12
0f
10
1.5
4�
1.3
4X
f¼
13
.01þ
1.0
0X
c1
3.0
1�
77
.53
1.0
0�
0.0
7(P
yri
do
xin
eH
Cl)
80
,1
00
,1
20
f1
00
.92�
1.5
4X
f¼�
16
.13þ
1.0
2X
c�
16
.13�
85
.25
1.0
2�
0.0
8
a%
of
lab
elcl
aim
.bX
fa
nd
Xc
are
,re
spec
tiv
ely
,th
em
easu
red
an
dth
eore
tica
ln
om
ina
la
mo
un
to
fth
ea
na
lyte
spo
tted
(ng
spo
t�1).
c Fo
rp¼
0.0
5.
dn¼
3.
e n¼
2�
4le
vel
s¼
8.
f n¼
3�
3le
vel
s¼
9.
162
Downloaded By: [Indrayanto, Gunawan] At: 00:44 18 November 2008
(repeatability studies). These results demonstrated that the accuracy andprecision of the proposed method were satisfactory.
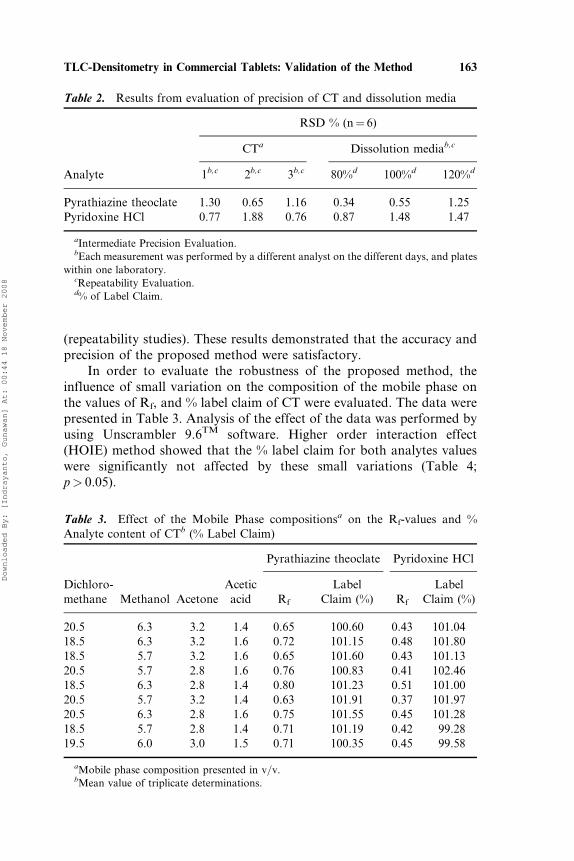
In order to evaluate the robustness of the proposed method, theinfluence of small variation on the composition of the mobile phase onthe values of Rf, and % label claim of CT were evaluated. The data werepresented in Table 3. Analysis of the effect of the data was performed byusing Unscrambler 9.6TM software. Higher order interaction effect(HOIE) method showed that the % label claim for both analytes valueswere significantly not affected by these small variations (Table 4;p> 0.05).
Table 2. Results from evaluation of precision of CT and dissolution media
RSD % (n¼ 6)
CTa Dissolution mediab,c
Analyte 1b,c 2b,c 3b,c 80%d 100%d 120%d
Pyrathiazine theoclate 1.30 0.65 1.16 0.34 0.55 1.25Pyridoxine HCl 0.77 1.88 0.76 0.87 1.48 1.47
aIntermediate Precision Evaluation.bEach measurement was performed by a different analyst on the different days, and plates
within one laboratory.cRepeatability Evaluation.d% of Label Claim.
Table 3. Effect of the Mobile Phase compositionsa on the Rf-values and %Analyte content of CTb (% Label Claim)
Pyrathiazine theoclate Pyridoxine HCl
Dichloro-methane Methanol Acetone
Aceticacid Rf
LabelClaim (%) Rf
LabelClaim (%)
20.5 6.3 3.2 1.4 0.65 100.60 0.43 101.0418.5 6.3 3.2 1.6 0.72 101.15 0.48 101.8018.5 5.7 3.2 1.6 0.65 101.60 0.43 101.1320.5 5.7 2.8 1.6 0.76 100.83 0.41 102.4618.5 6.3 2.8 1.4 0.80 101.23 0.51 101.0020.5 5.7 3.2 1.4 0.63 101.91 0.37 101.9720.5 6.3 2.8 1.6 0.75 101.55 0.45 101.2818.5 5.7 2.8 1.4 0.71 101.19 0.42 99.2819.5 6.0 3.0 1.5 0.71 100.35 0.45 99.58
aMobile phase composition presented in v=v.bMean value of triplicate determinations.
TLC-Densitometry in Commercial Tablets: Validation of the Method 163
Downloaded By: [Indrayanto, Gunawan] At: 00:44 18 November 2008
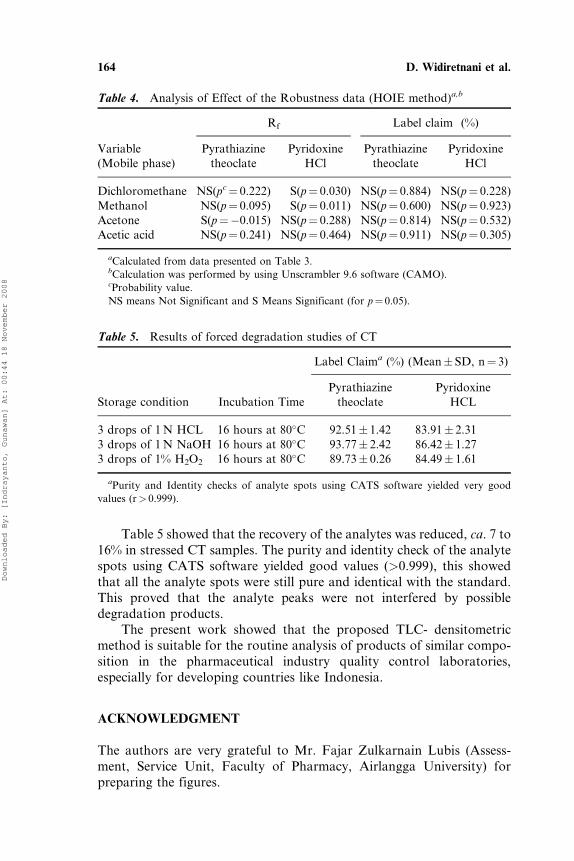
Table 5 showed that the recovery of the analytes was reduced, ca. 7 to16% in stressed CT samples. The purity and identity check of the analytespots using CATS software yielded good values (>0.999), this showedthat all the analyte spots were still pure and identical with the standard.This proved that the analyte peaks were not interfered by possibledegradation products.
The present work showed that the proposed TLC- densitometricmethod is suitable for the routine analysis of products of similar compo-sition in the pharmaceutical industry quality control laboratories,especially for developing countries like Indonesia.
ACKNOWLEDGMENT
The authors are very grateful to Mr. Fajar Zulkarnain Lubis (Assess-ment, Service Unit, Faculty of Pharmacy, Airlangga University) forpreparing the figures.
Table 5. Results of forced degradation studies of CT
Label Claima (%) (Mean� SD, n¼ 3)
Storage condition Incubation TimePyrathiazine
theoclatePyridoxine
HCL
3 drops of 1 N HCL 16 hours at 80�C 92.51� 1.42 83.91� 2.313 drops of 1 N NaOH 16 hours at 80�C 93.77� 2.42 86.42� 1.273 drops of 1% H2O2 16 hours at 80�C 89.73� 0.26 84.49� 1.61
aPurity and Identity checks of analyte spots using CATS software yielded very good
values (r> 0.999).
Table 4. Analysis of Effect of the Robustness data (HOIE method)a,b
Rf Label claim (%)
Variable(Mobile phase)
Pyrathiazinetheoclate
PyridoxineHCl
Pyrathiazinetheoclate
PyridoxineHCl
Dichloromethane NS(pc¼ 0.222) S(p¼ 0.030) NS(p¼ 0.884) NS(p¼ 0.228)Methanol NS(p¼ 0.095) S(p¼ 0.011) NS(p¼ 0.600) NS(p¼ 0.923)Acetone S(p¼�0.015) NS(p¼ 0.288) NS(p¼ 0.814) NS(p¼ 0.532)Acetic acid NS(p¼ 0.241) NS(p¼ 0.464) NS(p¼ 0.911) NS(p¼ 0.305)
aCalculated from data presented on Table 3.bCalculation was performed by using Unscrambler 9.6 software (CAMO).cProbability value.
NS means Not Significant and S Means Significant (for p¼ 0.05).
164 D. Widiretnani et al.
Downloaded By: [Indrayanto, Gunawan] At: 00:44 18 November 2008
REFERENCES
1. MIMS, Indonesia, 108th Ed.; CMP Media: Singapore, 2007; 203–208.2. Farmakope Indonesia, Edisi IV (Indonesian Pharmacopoeia IV); Departement
Kesehatan Republik Indonesia: Jakarta, Indonesia, 1995.3. The United States Pharmacopoeia 28–National Formulary 23, United States
Pharmacopoeial Convention, Rockville, MD, 2004.4. British Pharmacopoeia 2004; The Stationary Office, London, 2004.5. Pharmacopoeia of the People’s Republic of China, Vol. II, English Ed. 2000;
Chemical Industry Press: Beijing, 1997.6. http://www.hygrochemicals.com/api.html (June 4, 2008).7. CBS, CD room Version, 51-100, Camag, Muttenz, 2008.8. Funk, W.; Damman, V.; Donnervert, G. Qualitatssicherung in der Analy-
tischen Chemie; VCH: Weinheim, New York, Basel, Cambridge, 1992;12–36, 161–180.
9. Yuwono, M.; Indrayanto, G. Validation method of analysis by usingChromatography, in Profiles of Drugs Substances, Excipients and RelatedMethodology, Brittain, H. Ed.; Elsevier Academic Press: San Diego, NewYork, Boston, London, Sydney, Tokyo, Toronto, 2005; 32, 243–258.
10. Ferenczi-Fodor, K.; Vegh, Z.; Nagy-Turak, A.; Renger, B.; Zeller, M.J.Validation and Quality Assurance of Planar Chromatography Proceduresin Pharmaceutical Analysis. AOAC Inter. 2001, 84, 1265–1276.
11. Carr, G.P.; Wahlich, J.C. A practical approach to method validation inpharmaceutical analysis. J. Pharm. Biomed. Anal. 1990, 8, 613–618.
12. Kromidas, S. Validierung in der Analytik; Wiley-VCH: Weinheim, New York,Chichester, Brisbane, Singapore, Toronto, 1999; 56–85, 110–113.
13. Ermer, J. Validation in pharmaceutical analysis, Part I: An Integratedapproach. J. Pharm. Biomed. Anal. 2001, 24, 755–767.
Received June 12, 2008Accepted June 18, 2008Manuscript 6347
TLC-Densitometry in Commercial Tablets: Validation of the Method 165
Downloaded By: [Indrayanto, Gunawan] At: 00:44 18 November 2008