si–c interactions during degradation of the diatom skeletonema marinoi
TRANSCRIPT

ARTICLE IN PRESS
Deep-Sea Research II 56 (2009) 1381–1395
Contents lists available at ScienceDirect
Deep-Sea Research II
0967-06
doi:10.1
� Corr
UMR 65
Iroise, P
+33 2 98
E-m
(B. Mor
journal homepage: www.elsevier.com/locate/dsr2
Si–C interactions during degradation of the diatom Skeletonema marinoi
Brivaela Moriceau a,c,�, Madeleine Goutx b, Catherine Guigue b, Cindy Lee a, Robert Armstrong a,Marie Duflos b, Christian Tamburini b, Bruno Charriere b, Olivier Ragueneau c
a Marine Sciences Research Center, Stony Brook University, Stony Brook, NY 11794-5000, USAb Laboratoire Microbiologie, Geochimie et Ecologie Marines, UMR 6117 CNRS—INSU, Universite de la Mediterranee, Centre d’Oceanologie de Marseille,
Campus de Luminy, 13288 Marseille Cedex 9, Francec Laboratoire des Sciences de l’Environnement Marin, UMR 6539, Institut Universitaire Europeen de la Mer (IUEM), Site du Technopole Brest-Iroise, Place Nicolas Copernic, 29280
Plouzane, France
a r t i c l e i n f o
Article history:
Received 9 July 2007
Received in revised form
14 January 2008
Accepted 19 November 2008Available online 10 December 2008
Keywords:
Biogenic silica
Dissolution
Amino acids
Lipids
Degradation
Diatom
45/$ - see front matter & 2008 Elsevier Ltd. A
016/j.dsr2.2008.11.026
esponding author at: Laboratoire des Science
39, Institut Universitaire Europeen de la Me
lace Nicolas Copernic, 29280 Plouzane, Fr
49 86 56; fax: +33 2 98 49 86 45.
ail addresses: [email protected]
iceau).
a b s t r a c t
While a relationship between ballast and carbon in sedimenting particles has been well-documented,
the mechanistic basis of this interaction is still under debate. One hypothesis is that mineral ballast
protects sinking organic matter from degradation. To test this idea, we undertook a laboratory
experiment using the diatom Skeletonema marinoi to study in parallel the dissolution of one of the most
common mineral ballasts, biogenic silica (bSiO2), and the associated degradation of organic matter.
Three different models were applied to our results to help elucidate the mechanisms driving bSiO2
dissolution and organic compound degradation. Results of this modeling exercise suggest that the
diatom frustule is made up of two bSiO2 phases that dissolve simultaneously, but at different rates. In
our experiments, the first phase was more soluble (kbSiO2¼ 0:27 d�1) and made up 31% of the total
bSiO2. In this phase, bSiO2 was mainly associated with membrane lipids and the amino acids glutamic
acid, tyrosine, and leucine. The second phase was more refractory (kbSiO2¼ 0:016 d�1), and contained
more neutral lipid alcohols and glycine. Until it dissolved, the first bSiO2 phase effectively protected
much of the organic matter from degradation: particulate organic carbon (POC) degradation rate
constants increased from 0.025 to 0.082 d�1 after the total dissolution of this phase, and particulate
organic nitrogen (PON) degradation rate constants increased from 0.030 to 0.094 d�1. Similar to POC and
PON, the total hydrolyzable amino acids (THAA) degradation rate constant increased from 0.054 to
0.139 d�1 after dissolution of the first bSiO2 phase. The higher THAA degradation rate constant is
attributed to a pool of amino acids that was produced during silicification and enclosed between the
two silica phases. This pool of amino acids might come from the incorporation of silica deposition
vesicles into the diatom wall and might not be directly associated with bSiO2. In contrast, most lipid
degradation was not prevented by association with the more soluble bSiO2 phase, as the average lipid
degradation rate constant decreased from 0.048 to 0.010 d�1 after 17 d of degradation. This suggests that
most lipids were associated with rather than protected by silica, except pigments that appeared
resistant to degradation, independently from silica dissolution. When the only organic compounds
remaining were associated with the second bSiO2 phase, degradation rate constants decreased greatly;
concentrations changed only slightly after day 25.
& 2008 Elsevier Ltd. All rights reserved.
1. Introduction
Organic carbon produced in the ocean’s surface layer byphytoplankton is conveyed to depth by particle sedimentation,and fluxes of carbon and minerals (CaCO3, SiO2 and aluminosili-cates) are highly correlated in the deep water column. Based on
ll rights reserved.
s de l’Environnement Marin,
r, Site du Technopole Brest-
ance. Tel.: +33 298 498 775,
these observations, Armstrong et al. (2002) highlighted theimportance of modeling both carbon and mineral fluxes at thesame time. Mineral ballast (CaCO3 of coccolithophorids; SiO2 ofdiatoms; aluminosilicates in dust) provides excess density neededfor organic matter to sink; biogenic silica (bSiO2) and carbonatesedimentation are also linked through the ability of phytoplank-ton to aggregate and through grazing by zooplankton. Thecombination of these processes strongly increases the sedimenta-tion rate of phytoplankton (e.g., Gehlen et al., 2006; Moriceauet al., 2007).
The role of mineral ballast in carbon transport is more complexthan a simple impact on excess density (Lee et al., 2008), but weare far from fully understanding the processes involved. Lee et al.
ARTICLE IN PRESS
B. Moriceau et al. / Deep-Sea Research II 56 (2009) 1381–13951382
(2000) and Hedges et al. (2001) hypothesized that mineral ballastcould protect organic carbon from degradation; their hypothesis isconsistent with the observation of Ingalls et al. (2006) thatorganic matter was more degraded in areas where diatoms werenot the dominant bloom species when compared with sites wherediatoms were the main phytoplankton group. Engel et al. (2008)also showed that the presence of the calcite test in coccolitho-phorids lowers the particulate organic carbon (POC) degradationrate during the recycling of these cells. Continuously increasingpressure reduced rates of bSiO2 dissolution of diatom detritusrelative to rates measured under atmospheric pressure conditions(Tamburini et al., 2006). In parallel, naturally collected sinkingparticles, were also less degraded by prokaryotes when pressurewas continuously increased to simulate descent from 200 to 1500(Tamburini et al., 2008). Despite all these findings, few studies(e.g., Ingalls et al., 2003, 2006) have investigated both organicmatter degradation and biogenic mineral dissolution in naturalsettings. The work of Engel et al. (2008) investigated the role ofCaCO3 in carbon degradation, while the present study aims tobetter understand the role of Si–C interactions during diatomdegradation.
Diatoms are the dominant species in many ecosystems; theyare responsible for up to 35% of the total primary production inoligotrophic oceans and up to 75% in coastal waters and theSouthern Ocean (Nelson et al., 1995; Treguer et al., 1995). Jin et al.(2006) estimated their global contribution to net primaryproduction and to carbon export to be 15% and 40%, respectively.The high diatom contributions to primary production and carbonexport could potentially explain the empiric relation establishedby Ragueneau et al. (2002). This relation shows that Si/C ratiosdecrease with depth and follow the same pattern everywhere inthe world ocean. Is there a link between bSiO2 dissolution andPOC degradation such as the one hypothesized in the work citedabove?
The objective of the present study was to understand howbiogenic silica influences the degradation of diatom organiccarbon, and conversely the role of organic compounds in bSiO2
dissolution. With this aim, a monospecific culture of the diatomSkeletonema marinoi was incubated in the presence of a naturalcoastal bacterial community and allowed to degrade over a 102-dperiod. bSiO2 dissolution and the quantity and composition oforganic compounds, including amino acids and lipids, wereassessed throughout the incubation period and used to investigateSi–C interactions during decomposition. Three dissolution/degradation models were applied to the experimental data toelucidate the dissolution/degradation pattern of the componentsof S. marinoi. This modeling experiment yields a better under-standing of the structure of the diatom frustule in S. marinoi andof the role of Si-C interactions during diatom recycling.
2. Material and methods
2.1. Biodegradation experiment
S. marinoi (CCAP 1077/3) obtained from IFREMER (Argentonstation, France) was grown in f/2 medium (Guillard and Ryther,1962; Guillard, 1975) under 12/12 dark/light illumination. Whencells reached stationary growth phase (6.5�106 cells mL�1), theywere transferred into a 4 1C chamber and kept in the dark for 5 d.During this period, cells sank to the bottom of the flask, andprevious tests showed that diatom viability (number of living cellsversus total cells) decreased (unpublished data, method describedin Garvey et al., 2007). The supernatant was poured off, and theoverlying medium was replaced with natural seawater that hadbeen passed through a 0.7-mm GFF filter to preserve the natural
bacteria assemblage. The seawater was collected from a smallinlet (Endoume) near Marseille, France, at the end of fall, whenthe water is naturally poor in silicic acid (dSi�2.5mM). Themixture of S. marinoi and filtered sea water was then transferredto an incubation flask equipped with a magnetic stirrer and astopper through which gas exchange could occur via a 0.2-mmSwinnexs filter. The diatoms were incubated for 102 d in the darkat 20 1C. Using a peristaltic pump, samples were taken daily forthe first 21 d and then at 23, 25, 46, 50, and 102 d; triplicatesamples were taken at 0, 5, 11, 46, 50, and 102 d. The sampledsolution was well-mixed, allowing the ratio of solid matter tosolution to remain constant (Dixit et al., 2001). Ten percent of theliquid volume remained at the end of the experiment. Chemicalparameters measured were biogenic silica (bSiO2), silicic acid(dSi), particulate organic carbon and nitrogen (POC, PON),dissolved organic carbon (DOC), total particulate lipids (TLip),and total hydrolyzable amino acids (THAA). In addition totalbacterial abundances (diamidinophenylindole: DAPI counts) werecounted. Si contamination by dissolution of glassware wasmeasured by analyzing dSi in an incubation bottle with no cellsadded. We also sampled controls poisoned with 20 mg l�1 HgCl2 at4 times (0, 2, 5, and 11 d) to verify that degradation was due tobacteria and not abiotic factors.
2.2. Analytical methods
Biogenic silica was determined at the beginning and end of theexperiment using a variation of the method of Ragueneau andTreguer (1994). As no lithogenic silica was present in the algalculture, the second digestion step using HF was not necessary.Ten-milliliter samples were filtered onto 0.2-mm polycarbonatefilters. Filters were analyzed for bSiO2 and the filtrate for dSi. ForbSiO2, filters were digested in 20 mL of 0.2 N NaOH for 3 h at 95 1Cto ensure the dissolution of all bSiO2; dSi concentrations in thesolution remained far below the solubility equilibrium of bSiO2 atall times. After cooling, the solution was acidified with 5 mL of1 N HCl, centrifuged to remove remaining solids, and analyzed fordSi. The precision for triplicate measurements of bSiO2 was o5%.
Silicic acid (dSi) concentrations were determined on 10-mLfiltered samples and on digested bSiO2 samples using themolybdate blue spectrophotometric method of Mullin and Riley(1965), as adapted by Treguer and Le Corre (1975) and modified byGordon et al. (1993) for use in segmented flow colorimetry. Weused a Bran and Luebbe Technicon Autoanalyzer (o1% precision).
POC and PON concentrations were measured using a Carlo ErbaNA 2100 CN analyzer coupled to a Finnigan Delta S massspectrometer. Five-milliliter samples were filtered through 0.7-mm GFF filters. The filters were desiccated overnight in an oven at50 1C and then placed in tin capsules to be introduced into theoven of the analyzer. The precision for triplicate N analyses was71–6%, and for C analysis 71–5%.
DOC was analyzed after filtration through 0.7-mm GFF filters;10 mL of each sample was transferred into glass ampoules andsealed after addition of H3PO4 as preservative. All glassware waspre-rinsed with 1 N HCl and Milli-Q water before being combustedat 465 1C; care was taken to minimize contamination duringsampling and handling. DOC was measured by high-temperaturecatalytic oxidation using a Shimadzu TOC 5000 Analyzer(Sempere et al., 2003; Sohrin and Sempere, 2005). Samples wereacidified to pH 1 with 85% phosphoric acid and bubbled for 10 minwith CO2-free air to purge them of inorganic carbon. Three or four100mL replicates of each sample were injected into the 680 1Ccolumn. The precision of these replicates was p6%.
Total particulate lipids were analyzed after filtering 10-mLsamples onto 0.7-mm GFF glass fiber filters. Filters were extracted
ARTICLE IN PRESS
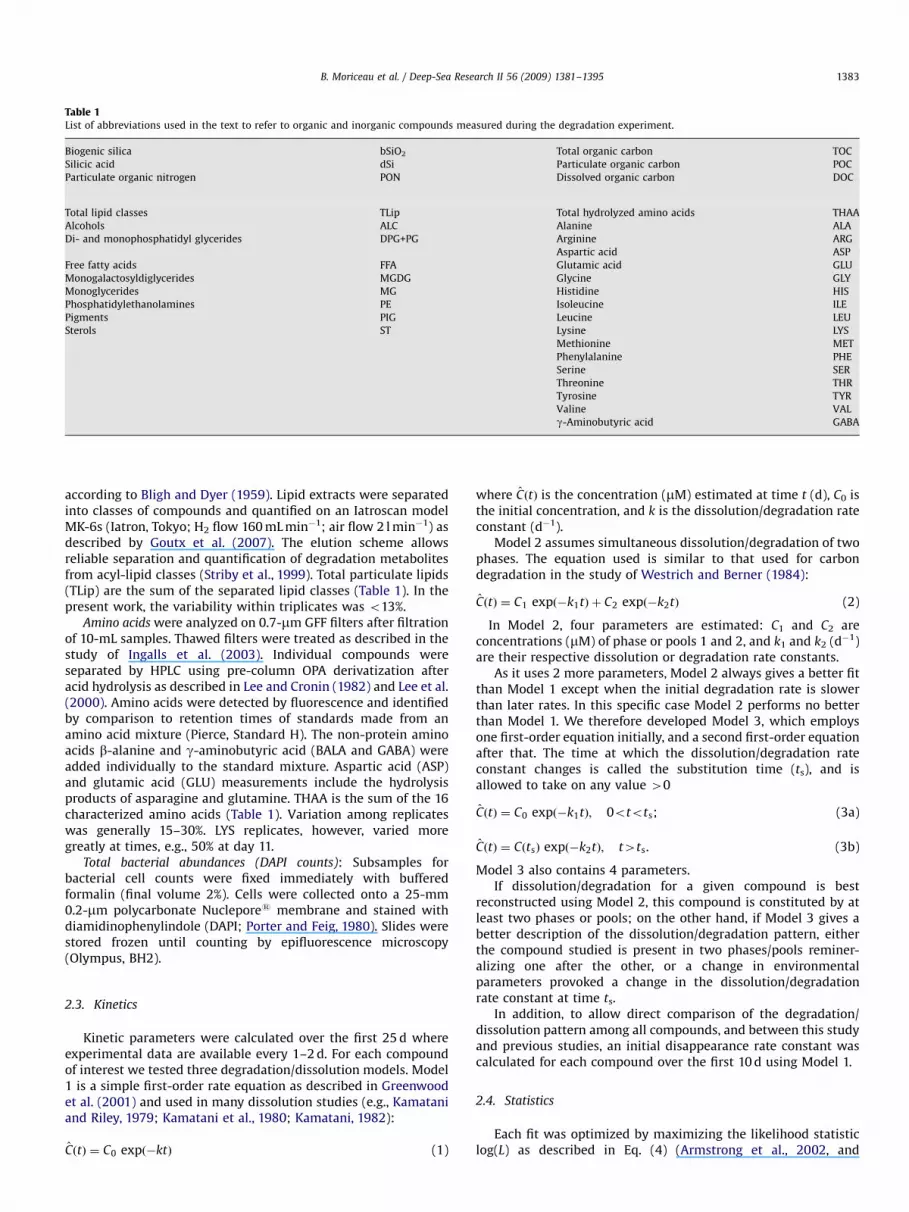
Table 1List of abbreviations used in the text to refer to organic and inorganic compounds measured during the degradation experiment.
Biogenic silica bSiO2 Total organic carbon TOC
Silicic acid dSi Particulate organic carbon POC
Particulate organic nitrogen PON Dissolved organic carbon DOC
Total lipid classes TLip Total hydrolyzed amino acids THAA
Alcohols ALC Alanine ALA
Di- and monophosphatidyl glycerides DPG+PG Arginine ARG
Aspartic acid ASP
Free fatty acids FFA Glutamic acid GLU
Monogalactosyldiglycerides MGDG Glycine GLY
Monoglycerides MG Histidine HIS
Phosphatidylethanolamines PE Isoleucine ILE
Pigments PIG Leucine LEU
Sterols ST Lysine LYS
Methionine MET
Phenylalanine PHE
Serine SER
Threonine THR
Tyrosine TYR
Valine VAL
g-Aminobutyric acid GABA
B. Moriceau et al. / Deep-Sea Research II 56 (2009) 1381–1395 1383
according to Bligh and Dyer (1959). Lipid extracts were separatedinto classes of compounds and quantified on an Iatroscan modelMK-6s (Iatron, Tokyo; H2 flow 160 mL min�1; air flow 2 l min�1) asdescribed by Goutx et al. (2007). The elution scheme allowsreliable separation and quantification of degradation metabolitesfrom acyl-lipid classes (Striby et al., 1999). Total particulate lipids(TLip) are the sum of the separated lipid classes (Table 1). In thepresent work, the variability within triplicates was o13%.
Amino acids were analyzed on 0.7-mm GFF filters after filtrationof 10-mL samples. Thawed filters were treated as described in thestudy of Ingalls et al. (2003). Individual compounds wereseparated by HPLC using pre-column OPA derivatization afteracid hydrolysis as described in Lee and Cronin (1982) and Lee et al.(2000). Amino acids were detected by fluorescence and identifiedby comparison to retention times of standards made from anamino acid mixture (Pierce, Standard H). The non-protein aminoacids b-alanine and g-aminobutyric acid (BALA and GABA) wereadded individually to the standard mixture. Aspartic acid (ASP)and glutamic acid (GLU) measurements include the hydrolysisproducts of asparagine and glutamine. THAA is the sum of the 16characterized amino acids (Table 1). Variation among replicateswas generally 15–30%. LYS replicates, however, varied moregreatly at times, e.g., 50% at day 11.
Total bacterial abundances (DAPI counts): Subsamples forbacterial cell counts were fixed immediately with bufferedformalin (final volume 2%). Cells were collected onto a 25-mm0.2-mm polycarbonate Nuclepores membrane and stained withdiamidinophenylindole (DAPI; Porter and Feig, 1980). Slides werestored frozen until counting by epifluorescence microscopy(Olympus, BH2).
2.3. Kinetics
Kinetic parameters were calculated over the first 25 d whereexperimental data are available every 1–2 d. For each compoundof interest we tested three degradation/dissolution models. Model1 is a simple first-order rate equation as described in Greenwoodet al. (2001) and used in many dissolution studies (e.g., Kamataniand Riley, 1979; Kamatani et al., 1980; Kamatani, 1982):
CðtÞ ¼ C0 expð�ktÞ (1)
where CðtÞ is the concentration (mM) estimated at time t (d), C0 isthe initial concentration, and k is the dissolution/degradation rateconstant (d�1).
Model 2 assumes simultaneous dissolution/degradation of twophases. The equation used is similar to that used for carbondegradation in the study of Westrich and Berner (1984):
CðtÞ ¼ C1 expð�k1tÞ þ C2 expð�k2tÞ (2)
In Model 2, four parameters are estimated: C1 and C2 areconcentrations (mM) of phase or pools 1 and 2, and k1 and k2 (d�1)are their respective dissolution or degradation rate constants.
As it uses 2 more parameters, Model 2 always gives a better fitthan Model 1 except when the initial degradation rate is slowerthan later rates. In this specific case Model 2 performs no betterthan Model 1. We therefore developed Model 3, which employsone first-order equation initially, and a second first-order equationafter that. The time at which the dissolution/degradation rateconstant changes is called the substitution time (ts), and isallowed to take on any value 40
CðtÞ ¼ C0 expð�k1tÞ; 0otots; (3a)
CðtÞ ¼ CðtsÞ expð�k2tÞ; t4ts. (3b)
Model 3 also contains 4 parameters.If dissolution/degradation for a given compound is best
reconstructed using Model 2, this compound is constituted by atleast two phases or pools; on the other hand, if Model 3 gives abetter description of the dissolution/degradation pattern, eitherthe compound studied is present in two phases/pools reminer-alizing one after the other, or a change in environmentalparameters provoked a change in the dissolution/degradationrate constant at time ts.
In addition, to allow direct comparison of the degradation/dissolution pattern among all compounds, and between this studyand previous studies, an initial disappearance rate constant wascalculated for each compound over the first 10 d using Model 1.
2.4. Statistics
Each fit was optimized by maximizing the likelihood statisticlog(L) as described in Eq. (4) (Armstrong et al., 2002, and

ARTICLE IN PRESS
B. Moriceau et al. / Deep-Sea Research II 56 (2009) 1381–13951384
references therein). Eq. (4) is based on a Gaussian distributionwith a constant variance on a logarithmic scale:
logðLÞ ¼ �N
2log
PðlogðCjÞ � logðCjÞÞ
2
N
!, (4)
where N is the number of data points, Cj is a measuredconcentration for data point j, and the Cj is the correspondingmodel prediction. The difference in log(L) (Dlog(L)) between fits oftwo different models to the same data gives the goodness of fit ofone model compared to the other. If one model gives a value forlog(L) that is at least two points higher per added parameter thananother model, it is considered to fit the data better (Hilborn andMangel, 1997). In the present work, the simplest model (Model 1)was considered to be the best fit unless Model 2 or Model 3yielded a log(L) more than four points better than that of Model 1.
3. Results
3.1. Change in biochemical composition of the diatom S.
marinoi over time
3.1.1. General trends
Changes in bSiO2, POC, TLip and THAA concentrations overtime are shown in Fig. 1. While bSiO2 concentrations decreasedsmoothly over the first 25 d, POC, PON and THAA concentrations
Ln (
bS
iO2,
t / b
SiO
2,0,
PO
Ct /
PO
C0,
TH
AA
t / T
HA
A0,
TLi
p t /
TLi
p 0)
-2
-1.5
-1
-0.5
0
5 10
bSiO2 POC
THAA
T
TLip
0
Fig. 1. Changes in the relative concentrations of POC (closed black diamonds), bSiO2 (op
the degradation of S. marinoi in the dark at 20 1C during the first 25 d of the experimen
0
5
10
15
20
25
30
35
0
Tim
x106
bact
eria
ml-1
1 2 4 6 8 9 11 1
Fig. 2. Change in total bacterial concentration over
decreased until about day 14, when the loss rate increased,especially for THAA. In contrast, TLip concentration decreasedrapidly at the beginning of the experiment and reached a plateauafter day 13.
Bacterial concentrations started at 0.3370.03�106 cell mL�1
and peaked at day 14 with a concentration of 3072.7�106 cellmL�1 (Fig. 2). The bacterial population increased between days 0and 14 with a rate equal to 0.015 d�1 (calculated between days 2and 14) and then generally stabilized reaching a final concentra-tion of 2074�106 cell mL�1 until the end of the experiment. Thebacterial growth efficiency (bacterial carbon increase divided byPOC decrease) between days 0 and 14 was 2%. Bacterial carbonmade up a maximum of 2.470.6% of the POC.
TOC concentrations over time showed a pattern similar tothose of POC (Fig. 3). DOC concentrations increased slightly(5.670.2 mg C L�1) but much less than POC decreased (6273 mgC L�1). The bacterial carbon (Cbact) is so low compared with thealgal organic carbon that the mineralization rate for POC algal(POC+DOC�Cbact) is the same as for the total organic carbon(Corg ¼ POC+DOC). This rate calculated as the slope of TOC changeover time (Fig. 3) was 2.68 mg C L�1 d�1 during the first 20 d of theexperiment and was equivalent to 91% of the POC loss.
3.1.2. Initial biochemical composition
At the beginning of the experiment, the Si/POC ratio was0.0970.01, which is slightly lower than the value of 0.13
15 20 25ime (d)
en diamonds), THAA (closed gray squares) and TLip (closed gray triangles) during
t. The concentrations relative to initial values are on a logarithmic scale.
e (d)
2 14 15 16 17 21 23 25 50 102
time during the 102-d degradation experiment.

ARTICLE IN PRESS
B. Moriceau et al. / Deep-Sea Research II 56 (2009) 1381–1395 1385
measured in fresh diatoms by Brzezinski (1985) but in the rangeof coastal diatoms measured by Rousseau et al. (2002). TLip madeup 1972% of S. marinoi organic carbon which is a little bit higher
Time (d)
carb
on (
mg
C l-1
)
0
20
40
60
80
100
120
0
TOC C bacterial
DOC POC
5 10 15 20 25
Fig. 3. Change in algal TOC (open circles), DOC (open diamonds), POC (closed
squares) and bacterial carbon (closed circles) with time during the degradation
experiment.
0%
5%
10%
15%
20%
25%
30%
0 5 10Time (d
Lip/
TLi
p (µ
mol
CLi
p L-1
/ µm
ol C
Lip
L-1)
FFA
MGDG
DPG+PG
PIG
0%
5%
10%
15%
20%
25%
30%
35%
40%
0 5 10
Time (
AA
/TH
AA
(m
mol
AA
L-1
/ m
mol
AA
L-1
)
ASP GLU ARG
GLY THR TYR
PHE LEU LYS
Fig. 4. Change in the concentration of (A) 6 of the 8 lipid classes in mmol C L�1 relati
mmol AA L�1 relative to THAA in units of mmol AA L�1, over time during the first 25 d of
GLY, the GLY peak in mmol AA L�1 is more visible than if using mmol C L�1.
that Lip/POC ratios measured previously for the same specie(Lavens and Sorgeloos, 1996). TLip mainly included FFA and otherdegradation metabolites (ALC and MG; see Table 1 for abbrevia-tions) (Fig. 4A). Cellular membrane phospholipids (PE, DPG+PG)and chloroplast membrane glycolipids (MGDG) accounted for1071% and 1371% of TLip, respectively. FFA were the mostabundant lipid degradation metabolites (24.870.5%) among thosepresent. PIG included both chlorophyll a and its degradationproducts (Striby et al., 1999); PIG was the largest lipidclass (initially 4175%; Fig. 4A). ST are involved in membranerigidity (Parrish, 1988); they were initially minor componentsof S. marinoi.
THAA constituted a larger portion (3679%) of total organiccarbon than the lipids, similar to the 45% found in Thalassiosira
weissflogii by Cowie and Hedges (1996) and the 25% observed indiatom-rich sediments by Ingalls et al. (2006). THAA include themonomer constituents of protein as well as adsorbed amino acidsand peptides. Sixteen amino acids were quantified. GLU, ASP andLEU (see Table 1 for abbreviations) together made up one-third ofthe THAA, each more than 1173% (Table 2). Other amino acidswere between 2.170.6% and 9.372.8% of the THAA except forMET and GABA, which were less than 0.8%. As GABA and METconcentrations were very low throughout the incubation, they are
15 20 25)
0%
10%
20%
30%
40%
50%
60%
70%
80%
90%
100%ST
MG
15 20 25
d)
PIG
/TLi
p (µ
mol
CLi
p L-1
/µm
ol C
Lip
L-1)
ve to TLip concentrations in mmol C L�1 (B) 9 of the 14 individual amino acids in
the 102-d degradation experiment. Note that due to the low number of C atoms in

ARTICLE IN PRESS
Table 2Concentration in mmol C L�1 and composition in mole% of the different pools of THAA in S. marinoi.
THAA ALA ARG ASP GLU GLY HIS ILE LEU LYS PHE SER THR TYR VAL TOT
THAA 105 223 318 379 139 59 174 317 187 260 128 136 170 174 2769
% THAA/THAAtot 4 8 11 14 5 2 6 11 7 9 5 5 6 6
Si(1)–THAA 20 31 122 143 12 12 48 92 0 63 16 29 58 45 691
% Si(1)–THAA/Si(1)–THAAtot 3 5 19 22 2 2 7 14 0 10 2 5 9 7
Si(2)–THAA 9 0 52 37 92 17 21 19 96 21 0 12 18 21 332
% Si(2)–THAA/Si(2)–THAAtot 2 0 13 9 23 4 5 5 24 5 0 3 5 5
Si(3)–THAA 20 28 51 64 72 20 26 43 53 35 29 30 26 26 523
% Si(3)–THAA/Si(3)–THAAtot 4 5 10 12 14 4 5 8 10 7 5 6 5 5
The THAA row shows the initial concentration and composition of THAA before dissolution began and does not include Si–THAA. Si(1)–THAA is the pool associated with the
first bSiO2 phase, Si(2)–THAA is the pool of THAA enclosed between the bSiO2 phases and Si(3)–THAA is the pool associated with the second bSiO2 phase.
B. Moriceau et al. / Deep-Sea Research II 56 (2009) 1381–13951386
not described in the following paragraphs. The initial mole%amino acid compositions we found for S. marinoi (Table 2) werevery similar in pattern to those of cultured diatoms reported byIngalls et al. (2003) and Cowie and Hedges (1996), with highestmole% values for ASP, GLU, and GLY. S. marinoi was higher inmole% LEU than in reports of other diatoms. THAA do not includethe amino acids incorporated inside the silica frustule, unless partof the frustule is dissolved during acid hydrolysis (see laterdiscussion). We define Si-bound amino acids as Si–THAA as inIngalls et al. (2003).
3.1.3. Change in biochemical composition during degradation
Si/POC decreased from 0.0970.01 mol of Si/mol of C to0.0670.01 mol of Si/mol of C during the first 2 d of incubationand then stabilized until day 15 of the experiment. Afterincreasing to 0.1170.01 mol of Si/mol of C between days 15 and21, the Si/POC ratio remained constant until the end of theexperiment. TLip/POC varied between 0.1370.02 mol of C/mol ofC and 0.2370.03 mol of C/mol of C during the first 50 d. Then theratio decreased to a final value of 0.0670.01 mol of C/mol of C atday 102. THAA/POC decreased regularly during the wholeexperiment from 0.3670.09 mol of C/mol of C initially to0.1070.02 mol of C/mol of C after 102 d, except for a suddenincrease between days 11 and 15 from 0.2870.7 mol of C/mol of Cto 0.3870.10 mol of C/mol of C.
Most of the change in TLip composition (Fig. 4A) occurredbetween days 0 and 25. Most compounds decreased or remainedthe same relative to TLip (mol of C/mol of C) except for PIG, whichincreased from 4175% to 8077% of the TLip over the course of theexperiment. Relative concentrations (mol of C/mol of C) of FFA, thesecond most abundant lipid class in the algae, decreased regularlyfrom 24.870.5% to 4.070.4%. MGDG initially made up 1371% ofTLip, but totally disappeared by day 4. The MG contribution wasconstant (7.070.3%) until day 14, when it was completelydegraded. The contribution of membrane lipids, the glycolipidMGDG and the phospholipids (PE and DPG+PG) to TLip was lowcompared with results from Berge et al. (1995) and d’Ippolito et al.(2004). However, lipid composition is highly dependent on cultureconditions (d’Ippolito et al., 2004), and in our case the high FFAcontent probably masked the relative contribution from mem-brane lipids.
The THAA composition was relatively constant throughout thedegradation experiment except between days 15 and 20 where weobserved a strong peak of GLY, which increased from 1372% to3378% (Fig. 4B). The relative concentrations of HIS (data notshown) and LYS also peaked slightly between days 15 and 20.Relative proportions of other amino acids especially ASPdecreased at this time in response to the increases in HIS, GLYand LYS.
3.2. Dissolution and degradation kinetics of S. marinoi constituents
3.2.1. Silica kinetics
The experiment was conducted in glass bottles to eliminatecarbon contamination. Controls showed that after 102 d, dSi dueto leaching from the glass was a maximum of 5% of the dSi due todissolution of diatom frustules. From an initial concentration of680730mmol L�1, bSiO2 decreased rapidly during the first 3–5 dof the experiment and then more slowly (Fig. 1). After 25 d, 52% ofthe initial bSiO2 was dissolved and 76% of the initial was dissolvedat the end of the experiment (102 d). The comparison between thelog(L) of the three models describing bSiO2 dissolution showedthat Model 2 is 4.3�1016 times better than Model 1(Dlog(L) ¼ 38.3) and almost 4.5�105 times better than Model 3(Dlog(L) ¼ 13). bSiO2 was the only constituent of the diatom witha dissolution pattern that was best described by Model 2 (Fig. 5A,Table 4), meaning that the frustule is most likely composed of twophases dissolving simultaneously. The first phase of bSiO2
constituted 31% of the total bSiO2 and was more soluble, with adissolution rate constant of 0.27 d�1. The second phase was morerefractory with a dissolution rate constant of 0.016 d�1 (Table 4).For direct comparison with POC and PON, the initial loss rateconstant of the total bSiO2 was calculated using Model 1 over 10 das 0.049 d�1. The three dissolution constants are within the range(0.005–1.3 d�1) given in the review by Van Cappellen et al.(2002b).
3.2.2. POC and PON kinetics
POC concentration decreased in two steps from the initialvalue of 76607150mmol L�1 (Fig. 1). Even with more para-meters Model 2 did not improve the fit to the data obtained byModel 1 (Fig. 5B); log(L) calculations for POC loss showedthat Model 3 gave the best fit (Dlog(L) ¼ 76.5). This suggeststhat either two pools of POC exist and are degraded successively,or a change in some parameter not directly linked to POCchemistry provoked an increase of the degradation rate at day10 from 0.025 to 0.082 d�1 (Table 4). PON followed the samepattern; Model 3 reproduced the data with more accuracy asshown by the Dlog(L) of 37.3 compare to Models 1 and 2.Model 3 estimated an increase in PON degradation rate at day 12from 0.03 to 0.094 d�1 (Table 4). The first POC degradation rateconstants are similar to rate constants measured in previousstudies (0.036 d�1 for POC, Lee and Fisher, 1992; 0.035 d�1 for POCand 0.047 d�1 for PON, Harvey et al., 1995). For comparisonwith bSiO2, we also applied Model 1 over 10 d to calculate theinitial loss rate of POC and PON: 0.025 d�1 for POC and 0.029 d�1
for PON.The POC degradation pattern in the Hg-poisoned controls
was similar to that in unpoisoned flasks during the first 5 d

ARTICLE IN PRESS
0
2000
4000
6000
8000
9000
0 5 10 15 20 25Time (d)
data
Model 1
Model 2
Model 3
0
100
200
300
400
500
600
700
800
0 5 10 15 20 25Time (d)
data
Model 1
Model 2
Model 3
ts
1000
7000
5000
3000
Model 2 : 1st bSiO2 phase
Model 2 : 2nd bSiO2 phase
P1 P3P2
P1 P3P2
Fig. 5. Model comparisons: (A) dissolution of bSiO2. In this experiment, bSiO2 is the only compound whose loss is best represented by Model 2. Dlog(L) between Model 2
and Model 3 is 13. Period 1 is the period of time corresponding to the dissolution of 85% of the first bSiO2 phase and 10% of the second bSiO2 phase. During period 2, the last
15% of the first bSiO2 dissolved and 10% more of the second bSiO2 phase dissolved. In Period 3 only the second bSiO2 phase dissolved as less than 1.5% of the first bSiO2
phase remained. (B) The curve depicts the loss of POC (or any organic compound) with a dissolution or degradation rate constant that increases with the ts. Model 1 fits the
curve using C0 ¼ 8297mmol C L�1 and k ¼ 0.047 d�1 with a likelihood log(L) ¼ 98.7. Model 2 fits the model with the same likelihood using the same parameters, i.e.
C1+C2 ¼ 8297mmol C L�1, k1 ¼ k2 ¼ 0.047 d�1. Model 3 give the best fit (log(L) ¼ 174.7) using C0 ¼ 7614mmol C L�1, ts ¼ 10 d, k1 ¼ 0.025 d�1 and k2 ¼ 0.082 d�1. This example
clearly shows that only Model 3 can depict accurately the loss when the rate constant increases at some point in the experiment. Moreover, Model 2 never gives a better
likelihood than Model 1 under these conditions.
B. Moriceau et al. / Deep-Sea Research II 56 (2009) 1381–1395 1387
but was lower between days 5 and 11. The degradationrate constant measured over the first 11 d using Model 1 was0.021 d�1.
3.2.3. Lipid kinetics
From an initial TLip concentration of 1400770mmol C L�1,almost half (4274%) degraded in 25 d; 7.070.3% of TLip remained

ARTICLE IN PRESS
B. Moriceau et al. / Deep-Sea Research II 56 (2009) 1381–13951388
after 102 d. The degradation of 7 of the 8 lipid classes is shown inFig. 6A. TLip degradation is better described by Models 2 and 3than by Model 1 (Dlog(L) ¼ 15.6 and 17, respectively). With only1.5 point of log(L) difference between Model 2 and 3 but the samedegree of complexity (four parameters each) we chose the best fitfrom the best likelihood which was given by Model 3 (Table 4).The degradation rate constant for TLip was 0.048 d�1 during thefirst 17 d of the experiment and then decreased to 0.01 d�1. Theinitial degradation rate constant was 0.046 d�1, slightly higherthan the 0.023 d�1 measured in the study of Harvey et al. (1995).
Using Model 1 we calculated that FFA, PIG, MG and PG+DPGhad degradation rate constants of 0.104, 0.012, 0.045 and 0.011 d�1
over 25 d, respectively. For MGDG, ST, PE, and ALC, Model 3 givesthe best fit to the data (Table 4).
MGDG turned over slowly (0.078 d�1) during the first 2 d, butthen much more quickly (0.52 d�1; Table 4) and were completelygone after only 4 d. MG were also completely lost very quickly; theinitial degradation rate constant of MG was 0.045 d�1, but theremaining MG was gone after 14 d. This pattern does not fit any ofthe models used, and suggests an association of these lipids onlywith the first bSiO2 phase, or no association at all.
MGDG, ST, and PE degradation rate constants increased by afactor of 8–10 during the experiment. They followed the samepattern as POC and PON. ALC degradation rate constant decreasedafter 19 d.
0
10
20
30
40
50
60
70
80
90
100
0Time (d)
TH
AA
(µm
ol A
A L
-1)
ASP
GLU
HIS
SER
GLY
THR
TYR
LEU
LYS
0
50
100
150
200
250
300
350
400
0
Time (d)
Lipi
ds (µ
mol
CLi
p L-1
) FFA
ST
MGMGDG
DPG+PG
PE
5 10 15 20 25
5 10 15 20 25
Fig. 6. Change in organic compound concentrations with time during the
degradation of S. marinoi. For clarity, 7 of the 8 lipid class concentrations in
mmol Clip L�1 over time are shown (5A) and only 10 of the 14 amino acids in
mmol AA L�1 over time (5B). Results depicted are only for the first 25 d. Note that
THAA concentrations are in mmol AA L�1.
3.2.4. Amino acid kinetics
From the initial THAA concentration of 30207200mmol C L�1,86717% of the THAA were degraded after 25 d; 5.070.5% of theTHAA still remained after 102 d. As for POC and PON, Model 3 wasthe best fit for THAA degradation (Dlog(L) ¼ 9.9 with both Models1 and 2). Concentrations of THAA decreased from day 1 to day 13with an average degradation rate constant of 0.054 d�1. After 13 dTHAA turned over with a faster degradation rate constant of0.139 d�1 (Table 4), before reaching a period of very low rateconstants after day 25; THAA concentrations were almostconstant until day 102. This last rate was not calculated bymodels as the modelling exercise was applied only over the first25 d. The first degradation phase of THAA was similar to thatmeasured on T. weissflogii (0.058 d�1) by Harvey et al. (1995).Initially, the degradation rate constant of the 14 individual aminoacids ranged between 0.015 and 0.070 d�1, except for ASP and SER,which turned over more slowly with constants of 0.001 and0.007 d�1, respectively (Table 4). At day 11 when on average49710% of the THAA had degraded, all concentrations except ARGand SER suddenly increased by 6–58% in 1–2 d (Fig. 6B). Thelargest releases were observed for HIS, GLY and LYS, whichincreased by 39713%, 58710% and 46712%, respectively. Forevery amino acid except TYR, degradation rate constants in-creased after this peak. For ASP and SER the increase occurredearlier at day 5, and for TYR the degradation rate constantdecreased from 0.070 to 0.012 d�1 at day 21. Except for TYR, aminoacids turned over faster during the second degradation phase, anddegradation rate constants ranged between 0.110 and 0.182 d�1.The degradation rate constant of SER increased even more thanthe other amino acids reaching 0.897 d�1 (Table 4).
3.3. Relation between bSiO2 dissolution and degradation of
individual organic compounds or compound classes
3.3.1. Lipid degradation versus bSiO2 dissolution
There was a strong linear relationship between total bSiO2 andTLip over the whole range of bSiO2 concentrations (r2
¼ 0.85,n ¼ 26) measured. There was no correlation between bSiO2 andPIG, so that the relationship between bSiO2 and TLip became evenbetter when pigments were excluded from the other lipids(r2¼ 0.94, n ¼ 26). FFA were well correlated with total bSiO2
concentrations (r2¼ 0.95, n ¼ 26); they were completely de-
graded during the dissolution of the second bSiO2 phase, whenbSiO2 concentrations eventually reached 260mmol L�1.
Relationships among individual lipid classes and bSiO2 phasesshowed three distinct periods (Fig. 7A and B), which were relatedto bSiO2 dissolution using the bSiO2 model (Fig. 5A). Period 1 (P1)is the time corresponding to dissolution of 85% of the first bSiO2
phase and 10% of the second bSiO2 phase; Period 2 (P2) is the timecorresponding to dissolution of most of the remaining bSiO2 fromthe first phase and another 10% of the second bSiO2 phase; andPeriod 3 (P3) is the time when less than 1.5% of the first phaseremained and 60% of the second phase dissolved. At the end of P320% of the bSiO2 from the second phase remained. On average,26–34% of the TLip degraded during Period 1; only 14-19% of TLipremained at the beginning of Period 3. The slow decrease ofconcentrations observed for each lipid class except PIG, during P1and P3 compared to P2 despite the fact that the three periodslasted the same time (�7 d, Fig. 5A), might show that most TLipexcept PIG degraded during P1 were associated with the firstbSiO2 phase, and most TLip except PIG degraded during P3 withthe second bSiO2 phase. These specific lipids are denoted asSi(1)–Lip and Si(2)–Lip; their composition is shown Table 3.
Of the individual classes, PE, ALC concentrations remainedalmost constant during P1. In contrast, MGDG was completely

ARTICLE IN PRESS
0%
20%
40%
60%
80%
100%
120%
140%
160%
0% 20% 40% 60% 80% 100%
% o
f Lip
ids
rem
aini
ng
ST ALC PEPIG MG FFA DPG+PG MGDG
P1P2
0%
20%
40%
60%
80%
100%
120%
140%
160%
0% 10% 20% 30% 40% 50% 60% 70% 80% 90%
% o
f Lip
ids
rem
aini
ng
P1 P2 P3
% of dissolved bSiO2 from first phase
% of dissolved bSiO2 from second phase
0 1 2 3 6 154 5 7 9
0 7 15 25 45 100
time (d)
time (d)
ST ALC PEPIG MG FFA DPG+PG MGDG
Fig. 7. Si–TLip interactions during the degradation of the S. marinoi. (A) Correlation between the concentrations of the dissolved bSiO2 from the first phase relative to its
initial concentration (estimated by the model) and each lipid class relative to its initial concentration. (B) Correlation between concentration of the dissolved bSiO2 from the
second phase relative to its initial concentration (estimated by the model) and each lipid class relative to its initial concentration. Period 1 is the period of time
corresponding to the dissolution of 85% of the first bSiO2 phase and 10% of the second bSiO2 phase. During period 2, the last 15% of the first bSiO2 dissolved, and 10% more of
the second bSiO2 phase dissolved. In Period 3 only the second bSiO2 phase dissolved as less than 1.5% of the first bSiO2 phase remained.
Table 3Concentration in mmol C L�1 and composition in mole% of the different lipid class in S. marinoi.
Lipid class ALC DPG+PG FFA MG MGDG PE PIG ST Total
Lipids 30 98 366 104 189 44 604 40 1475
Lipid class/total lipid (%) 2 7 25 7 13 3 41 3
Si(1)–Lip 0 0–36 180–201 15–25 0 1–19 NC 1–11 386–469
Si(1)–Lip/tot Si(1)–Lip (%) 0 0–8 43–47 4–5 41–49 0–4 0–2
Si(2)–Lip 0–4 40–69 3 0 0 7–13 NC 9–20 125–175
Si(2)–Lip/tot Si(2)–Lip (%) 0–2 32–39 39–55 0 0 6–7 7–11
The lipid row shows the initial concentration and composition of lipid before dissolution began and does not include Si–lipid. Si(1)–Lip is the pool associated with the first
bSiO2 phase, Si(2)–Lip is the pool of THAA associated with the second bSiO2 phase.
NC: No correlation.
B. Moriceau et al. / Deep-Sea Research II 56 (2009) 1381–1395 1389
degraded within the first 4 d, in P1. Despite the high variability inPE and ST concentration measurements, we determined that STand MG concentrations decreased only slightly in P1 (427%). Thistrend is illustrated by their low degradation constants (0.016 and0.001 d�1, respectively).
Degradation of MG, ALC, PE and ST mainly occurred in P2. PEand ST concentrations dropped in P2 and ALC degradation waseven faster; Model 3 gave a higher k1 and a longer ts for ALC thanfor PE and ST. After the precipitous drop, which corresponded tothe beginning of P3, 80% of ALC, FFA and PE and 40% of ST were
degraded. MG were completely degraded so quickly at thebeginning of P2 that the loss is more likely due to sudden releaseof MG adsorbed onto particles or dissolution (i.e. involvingchemical mechanisms) rather than degradation (i.e. biologicalmechanisms).
DPG+PG were not well correlated with bSiO2; generally therewas a 36%-degradation during P1, then a fast release of DPG+PG inP2 (40–50%), possibly when the first bSiO2 phase is completelydissolved. Due to the release in P2, 80% of the initial DPG+PGremained at the beginning of P3.

ARTICLE IN PRESS
0%
20%
40%
60%
80%
100%
120%
140%
160%
0% 20% 40% 60% 80% 100%
% o
f ind
ivid
ual a
min
o ac
id r
emai
ning
0%
20%
40%
60%
80%
100%
120%
140%
160%
0% 10% 20% 30% 40% 50% 60% 70% 80% 90%
% o
f ind
ivid
ual a
min
o ac
id r
emai
ning
ILEHIS
THR
ASP GLU
LEU LYS
TYRSER VAL
ARG GLY
PHE
ALA
% of dissolved bSiO2 from first phase
% of dissolved bSiO2 from second phase
P1 P2
P1 P2 P3
ILEHIS
THR
ASP GLU
LEU LYS
TYRSER VAL
ARG GLY
PHE
ALA
0 7 15 25 45 100
time (d)
0 1 2 3 6 154 5 7 9time (d)
Fig. 8. Si–THAA interactions during the degradation of S. marinoi. (A) Correlation between the concentration of the dissolved bSiO2 from the first phase relative to its initial
concentration (estimated by the model) and individual THAA concentrations relative to their initial concentrations. (B) Correlation between concentration of the dissolved
bSiO2 from the second phase relative to its initial concentration (estimated by the model) and individual THAA concentrations relative to their initial concentrations. The
periods shown are the same as in Fig. 7.
B. Moriceau et al. / Deep-Sea Research II 56 (2009) 1381–13951390
3.3.2. Amino acid degradation versus bSiO2 dissolution
The relationship of THAA with the two bSiO2 phases showedchanges at the same times as many of the lipid classes, so we usedthe same three periods. During Period 1, when the first bSiO2
phase was dissolving, only 3–22% of the THAA degraded. For thereason described in the previous section for lipids (3.3.1), thisportion of the THAA is referred to as Si(1)–THAA. GLY and LYS lostless than 10% of their initial concentrations; ASP and GLU lost 40%of their initial concentrations. GLU, ASP, and LEU constituted mostof the pool degrading during P1; LYS is not correlated to the firstbSiO2 phase (Table 2).
At the end of period 2, a pool of THAA was released when 95%of the first bSiO2 phase was dissolved (Fig. 8A and B). THAAconcentrations decreased by 32% compared to initial values.Measurement of THAA does not release Si-bound amino acids sothat they would not be observed until the bSiO2 dissolved;the THAA released (Si(2)–THAA) may have been trapped betweenthe 2 phases. The amount of Si(2)–THAA can be calculatedfrom the difference between the concentrations of amino acids atand before the peak maximum (Table 2). In total, THAAconcentration increased by 11–16% (in mmol C L�1); the
Si(2)–THAA were composed mainly of GLY (2378%) and LYS(2378%; see Table 2).
During P3, relative THAA concentrations declined from34% to 5% of the original THAA. The THAA lost during P3are called Si(3)–THAA, they had a composition similar to thatof total THAA, except that the contribution of GLY was higher(Table 2).
4. Discussion
4.1. Importance of bacteria in S. marinoi degradation
The very high concentration of algae, when compared to thebacterial concentrations, and the continued degradation in thepresence of HgCl2, suggest that the loss of organic matter was duenot only to biological degradation, but also to physical andchemical factors (dissolution). In the presence of HgCl2, organicmatter turned over with a low rate constant (0.02 d�1, r2
¼ 0.86,n ¼ 8), which appeared to decrease even more after day 5(0.007 d�1, n ¼ 4; 2 replicates). This could be due to initial

ARTICLE IN PRESS
B. Moriceau et al. / Deep-Sea Research II 56 (2009) 1381–1395 1391
dissolution of organic matter as the cell begins to fall apart;smaller rate constants after some time would then be due to theabsence of bacterial degradation. However, the lack of appropriatesamples makes this observation tentative. The slower increase ofDOC concentrations compared to the decrease in POC (Fig. 3)suggests that most of the POC loss may be due to bacterialdegradation despite the similar degradation rate measured inHgCl2-poisoned batches. Degradation of particulate matter in thepresence of HgCl2 has been noted before (Liu et al., 2006).
It was not clear why bacteria grew so slowly after day 14 in theunpoisoned experiment. Three factors could have contributed tothe decrease and stabilization of bacterial growth. First, O2 couldhave been a limiting factor. We did not measure O2 during theexperiment but we calculated average TOC loss, Rloss ¼ 221.6mmol L�1. Change in oxygen concentrations (CO2
) with time (t) canbe reconstructed from O2 consumption rate (Rloss) and O2
diffusion rate (Rdiff) (Eq. (5)). The latter is given by the Whitmanfilm model (Gladyshev, 2002; Eq. (6))
dCO2
dt¼ Rdiff � Rloss (5)
Rdiff ¼D
dS
VðCsO2
� CO2Þ (6)
where d is the thickness of the diffusion layer, and is stronglydependent on stirring; D is the O2 diffusion coefficient (1.83 cm2
d�1, Ploug, 2001); S is the surface of contact between air and water(415.5 cm2); V is the volume of the solution, which changedprogressively during sampling; and CsO2
is the saturationconcentration of the O2 in seawater (229.9mM). Using theseequations and parameters, we estimated the maximum d abovewhich the solution will be anoxic. Considering that the risk ofconsuming all O2 is greater for a larger volume of solution (withthe same surface area), we conservatively used the volume ofsolution at the beginning of the experiment V ¼ V0 (8100 cm3).
We seek a value of dmax, at which dCO2=dt will always be
positive when CO2approaches 0 so that the system can never go
anoxic. This condition is met when
RlosspRdiff ¼D
dS
VCSO2
(7)
or whenever
dmax ¼D
Rloss
S
V0CsO2
(8)
We calculated that when the volume is at its maximum in theflask (8100 cm3 at the beginning of the experiment), the depth ofthe diffusive layer must be less than 0.1 cm for the solution toremain oxic. The thickness of the diffusion layer is 0.27 cm with nostirring and can be as small as 0.0015 cm when the stirring isintense (Gladyshev, 2002). Since our flasks were well mixed, it isvery unlikely that O2 was a limiting factor.
A second explanation is that degradation products built up inthe flask and poisoned the bacteria (Westrich and Berner, 1984;Aller and Aller, 1998). We cannot exclude this possibility, butcalculating kinetic parameters over only 25 d should alleviatesome of this problem. This period of time is a reasonablecompromise between the need to follow the degradation ofS. marinoi as long as possible so as to better understand reactionsin the water column and the risk of accumulating inhibitingmetabolites. Finally, the bacteria might have stopped growing dueto viral lysis, grazing or a lack of labile substrate fuelling theirgrowth (Fig. 2).
4.2. Importance of Si–C interactions to bSiO2 dissolution
Previous dissolution studies have assumed that the diatomfrustule is composed of a single bSiO2 phase (see review in VanCappellen et al., 2002b). Results from our modelling exercisesuggest instead that the frustule of S. marinoi is composed of twophases of bSiO2 with different dissolution characteristics. Thisidea, previously hypothesized by Kamatani and Riley (1979) fromdissolution rate measurements and by Gallinari et al. (2002) fromsolubility equilibrium measurements, is consistent with thecomplexity of the frustule structure. During silicification, poly-amines and silaffin proteins catalyze precipitation of organo-silicon particles of different shape and structure that determinethe morphology of different diatom species (Kroger et al., 2000;Hildebrand, 2003). As a result of these interactions, diatomfrustules have a complex 3-D structure and are shaped like anelliptic or cylindrical box. Each half is composed of a valve andgirdle bands that are built at different times in the cellcycle (Hildebrand and Wetherbee, 2003). In our study wedistinguish two bSiO2 phases and calculate their dissolution rateconstants. Even though we did not determine a direct relationbetween these dissolution characteristics and the structure of thefrustule, we were able to determine the impact of two-phasedissolution on the organic matrix of the cells as discussed below(see Section 4.3).
Diatom frustules include organic layers that consist mainly ofsugars and amino acids (Hildebrand et al., 2006). The major aminoacids in this coating are GLY, THR, and SER, suggesting thatbonding with silica occurs through SER and THR, using their OHgroups (Hecky et al., 1973). GLY enrichment observed during ourstudy in the refractory (second) bSiO2 phase might suggest a moreimportant role of GLY. Si–C or Si–O–C interactions are thought toprotect silica from dissolution until the organic matrix is removedby bacteria (Hecky et al., 1973; Patrick and Holding, 1985; Bidleand Azam, 2001). The different dissolution parameters of thebSiO2 phases may be due to different associations between silicaand organic compounds in different sections of the frustule.Indeed, Abramson et al. (2008) observed changes in the distribu-tion of organic compounds inside the frustule that would supportthis argument. The very slow dissolution rate constant for thesecond bSiO2 phase could be due to protection by the organicmatrix. We suggest (1) that only a part of the bSiO2 is protected bythe organic coating, and (2) that this protection lasts for a longertime than was previously thought. Low bacterial concentrationcould also partially explain why the protection of the second bSiO2
phase lasted so long, while in previous studies the protection wasonly temporary. The linear correlation between FFA and the totalbSiO2 indicates that these compounds are associated with bothphases of bSiO2, even though all FFA were completely degradedwhile 31% of the bSiO2 still remained. Few FFA were associatedwith the intracellular pool of lipids. Because of their amphipathicproperties due to the carboxyl group bonded to the long carbonchain, FFA probably play a role in the organization of the organicmatrix involved in building the frustule (Chevallard and Guenoun,2006). The relationship between FFA degradation and dissolutionof the two bSiO2 phases, and the fact that FFA were completelydegraded before the total dissolution of the bSiO2, might alsoindicate another type of interaction, possibly adsorption of FFA onthe silica surface.
In the present study, lipid classes and individual amino acidsshowed a general correlation with bSiO2 concentration (Figs. 7and 8). The modelling experiment showed that bSiO2 and carbonpool degradation followed different patterns; they are representedin our model by different sets of equations. Moreover, in our invitro experiment, external parameters like temperature wereconstant and can not be responsible for the relation observed in

ARTICLE IN PRESS
B. Moriceau et al. / Deep-Sea Research II 56 (2009) 1381–13951392
Figs. 7 and 8. Thus, we can safely suppose that a causal correlationexists between bSiO2 dissolution and the amino acids or lipidsdegradation. The turnover of the portion of these organiccompounds that is correlated with dissolution of either the firstor second bSiO2 phase (P1 and P3) was very slow compared to thedegradation of the remaining pool of these compounds. Forexample, for the amino acids, the turnover of Si(1)–THAA andSi(3)–THAA was slow compared to the loss of THAA in general.This correlation suggests that there may exist a direct associationbetween each bSiO2 phase and the corresponding organiccompounds (Si(1)–THAA, Si(3)–THAA, Si(1)–Lip and Si(2)–Lip).Since the amounts of Si–THAA and Si–TLip related to each phasewere similar (�10–30%), differences between bSiO2 dissolutionrate constants stem mainly from the compositions of the pools.Some membrane lipids mainly MGDG were mostly associatedwith the first bSiO2 phase. DPG+PG still had high concentrationsat the end of P2 when most degradation occurred. The secondbSiO2 phase was more strongly correlated with neutral lipidalcohols (ST and ALC) but also with membrane lipids DPG+PG andPE. In the first bSiO2 phase, GLU, ASP, and LEU constituted most ofthe Si(1)–THAA pool and this phase contains no LYS at all. Incontrast in the second bSiO2 phase, Si(3)–THAA had a compositionsimilar to the diatom’s intracellular THAA, except for an increaseof the GLY composition.
It is not clear whether differences in organic carbon contentand/or different associations between bSiO2 and organic carbon ineach of the two bSiO2 phases explains the differences betweenbSiO2 dissolution rates and also between solubility equilibria. Theorganic matter that makes up part of the diatom frustule helpsstrengthen the structure, thus, increasing its resistance tomechanical forces like those from grazers (Hamm et al., 2003).The role of organic compounds in silica dissolution is, however,more difficult to determine. In addition to the bonds betweensilica and the OH moiety of SER or THR (Hecky et al., 1973), silicaparticles are linked to organic compounds by nitrogen bonds(Sumper and Kroger, 2004). Indeed, Gendron-Badou et al. (2003)noted that Si–C and Si–N bonds are present in fresh diatoms whileonly Si–O–Si and Si–O–R bonds are visible in fossilized diatoms.Different associations between silica and organic compoundsresist degradation and dissolution differently and may explain thedifferences we observed between dissolution rate constants andsolubility equilibria of the two bSiO2 phases.
The different dissolution rates of the two bSiO2 phases mightalso be due to different physico-chemical properties in the silicastructure itself. In the presence of some silafins, silica precipita-tion of porous blocks has been observed in vitro; in contrast, whensilica precipitation is catalyzed by polyamines, spherical silicaparticles are formed (Sumper and Kroger, 2004). If the first silicaphase is more porous due to the presence of organic matter or dueto the compounds that catalyzed silica formation, the dissolutionrate constant of this bSiO2 will be higher (Van Cappellen et al.,2002a). Also, when the silica structure is chemically moreorganized (in mineral form, as opposed to amorphous, like opal),dissolution rate and solubility are lower. Gendron-Badou et al.(2003) determined that the structure of bSiO2 from fossilizeddiatoms from sediments is more organized than that of freshdiatom frustules due to condensation processes that continueafter they are deposited. It is also possible that fresh diatomsalready have a more organized phase, as suggested by the lowdissolution rate (in the present study) and the low solubilityequilibrium (Gallinari et al., 2002) of the second bSiO2 phase.During dissolution, the two different rate constants will cause anincrease of the ratio of the more organized phase to theamorphous phase.
The difference between dissolution rate constants and bet-ween solubility equilibria could be due to chemical bonds
between silica and organic matter or to structural characteristicsof the bSiO2. In any case it may be closely linked to the presence oforganic compounds either inside the frustule itself or during thesilicification process. This conclusion emphasizes the need to linkstudies of carbon and silica production and recycling if we are tobetter understand both C and Si cycles. The following section willaccentuate this conclusion by showing the reverse: the impor-tance of bSiO2 to carbon degradation.
4.3. Si–C interactions and their role on carbon degradation
bSiO2 dissolution was best described by Model 2, while theturnover of each organic compound investigated here was best fitby Model 1 or 3 (Fig. 5). The use of Model 3 to describe compoundturnover means that either (1) most organic compounds werepresent as two pools of matter degrading one after the other or (2)degradation rate constants increased at some point due to achange in environmental factors. In most cases the loss rateconstant increased (POC, PON, THAA, PE, and MGDG) or decreased(other lipid classes) when the dissolution of the first bSiO2 phasewas almost complete, from which we conclude that the first bSiO2
phase must have influenced loss of organic matter.Most of the ALC, PE and ST present in the intracellular pool of
organic compounds seems to have been protected by the firstbSiO2 phase, but due to the high variability of lipid class behaviorthe pattern for TLip is less clear than the one for THAA. THAAdegradation is consistent with the idea that Si(2)–THAA isencased within diatom frustules, and is released as soon as thefirst bSiO2 phase is completely removed. While several aminoacids increased in concentration between day 11 and day 20(Fig. 6B), bacterial numbers peaked at day 13, which correspondsto the THAA maximum (Figs. 1 and 2). However, bacterial carbonaccounted for only 0.2–2.470.3% of total carbon (Fig. 3). Bacterialbiomass cannot account for the increase of THAA, but the increaseof bacterial number could be explained by this input of labileorganic carbon. Ingalls et al. (2003, 2006) measured Si–THAA(THAA bound and/or within bSiO2) obtained after completedissolution of the bSiO2 using successive treatments with 6NHCl and HF. They found that Si–THAA made up 0.7–7% of the totalTHAA in diatoms from plankton tows and sediment trap samples.In our study, Si–THAA was a larger portion of total THAA than inthe studies of Ingalls et al. (2003, 2006). We define three pools ofTHAA: Si(1)–THAA degradation is correlated to the dissolution ofthe first bSiO2 phase; Si(2)–THAA is the pool of THAA that areenclosed between the two bSiO2 phases. Both of these pools wereprotected by the first bSiO2 phase. The third pool, Si(3)–THAA, isattached to the second phase of the frustule; due to the lowdissolution rate constant of this phase, it was protected forlonger time.
The composition of Si(2)–THAA is dominated by GLY and LYS,which are major components of silaffins (Table 2). As part of thesilicification process (Hildebrand, 2003; Sumper and Kroger,2004), these proteins are present in the silica deposition vesicles(SDV) that become part of the diatom wall at the end of frustuleformation (Martin-Jezequel et al., 2000). Thus, the Si(2)–THAApool may be assembled during the silicification process, and mayresult from the integration of the SDV’s into the frustule.Similarity between most of the substitution times ts listed inTable 4 and the release time of Si(2)–THAA suggests that k2
represents the degradation rate constant of this portion ofTHAA. After being released, Si(2)–THAA turned over very fast(k2 in Table 4). Most of these amino acids were completelydissolved or degraded shortly after the total dissolution of the firstbSiO2 phase, which suggests that this pool of THAA is not directlybound to bSiO2. The high loss rate constant of Si(2)–THAA may

ARTICLE IN PRESS
Table 4Kinetic parameters and likelihood (log(L)) calculated by the 3 models.
Model 1 Model 2 Model 3 Best model fit
C0 K log(L) C1 C2 k1 k2 log(L) C0 ts k1 k2 log(L)
PON 1499 0.050 98.5 26 1473 0.051 0.051 98.5 1364 12 0.030 0.094 135.6 III
POC 8297 0.047 98.7 6884 1412 0.047 0.047 98.7 7614 10 0.025 0.082 174.7 III
bSiO2 591 0.030 70.7 209 462 0.268 0.016 109.0 658 6 0.063 0.019 97.7 II
TLip 1232 0.033 27.9 704 724 0.014 0.100 43.5 1420 17 0.048 0.010 44.9 III
ALC 44 0.080 9.2 46 5 0.122 0.001 10.1 52 19 0.099 0.001 13.5 III
FFA 297 0.104 21.8 139 207 0.068 0.214 23.1 330 15 0.125 0.077 25.0 I
MG 97 0.045 24.5 21 85 0.497 0.033 25.0 107 5 0.094 0.036 25.5 I
MGDG 199 0.145 9.0 93 107 0.145 0.145 9.0 189 2 0.078 0.520 19.6 III
PE 54 0.097 22.3 51 3 0.097 0.097 22.3 42 6 0.016 0.119 26.6 III
PG+DPG 69 0.011 17.9 55 13 0.011 0.011 17.9 65 16 0.001 0.054 19.0 I
PIG 641 0.012 29.7 32 610 0.012 0.012 29.7 627 5 0.000 0.016 30.4 I
ST 41 0.031 30.0 11 30 0.031 0.031 30.0 35 13 0.001 0.080 38.3 III
THAA 3599 0.080 32.9 1903 1696 0.080 0.080 32.9 3137 13 0.054 0.139 42.8 III
ALA 132 0.070 42.3 31 102 0.073 0.073 42.3 117 12 0.048 0.120 54.1 III
ARG 339 0.113 26.6 39 300 0.113 0.113 26.6 243 9 0.024 0.175 54.3 III
ASP 419 0.100 24.5 312 107 0.100 0.100 24.5 324 5 0.001 0.121 29.1 III
GLU 454 0.080 39.2 23 431 0.080 0.080 39.2 405 13 0.065 0.147 50.5 III
GLY 172 0.045 24.9 67 105 0.045 0.045 24.9 147 16 0.015 0.182 39.3 III
HIS 73 0.063 28.9 44 29 0.063 0.063 28.9 65 16 0.039 0.167 38.6 III
ILE 223 0.082 34.4 210 13 0.082 0.082 34.4 192 12 0.050 0.137 44.8 III
LEU 413 0.090 34.0 117 299 0.091 0.091 34.0 348 12 0.050 0.150 48.2 III
LYS 268 0.068 18.1 181 88 0.068 0.068 18.1 223 14 0.031 0.170 26.1 III
PHE 336 0.083 31.6 332 4 0.083 0.083 31.6 280 12 0.040 0.148 45.8 III
SER 162 0.075 42.6 21 140 0.075 0.075 42.6 135 5 0.007 0.090 49.7 III
THR 165 0.064 43.1 17 149 0.064 0.064 43.1 151 13 0.045 0.110 51.1 III
TYR 185 0.068 48.3 157 28 0.068 0.068 48.3 187 21 0.070 0.012 49.3 I
VAL 219 0.076 37.9 179 39 0.076 0.076 37.9 194 12 0.050 0.124 46.5 III
C0 is the initial concentration of the compound. C1 and C2 are the initial concentrations of the two phases (for bSiO2) or the two pools (organic compounds). k is the
degradation/dissolution rate constant calculated with Model 1. k1 and k2 are degradation/dissolution rate constants of C1 and C2 in Model 2, respectively, or used before and
after the substitution time ts in Model 3, respectively. The last column indicates which model has been chosen in this study to determine the degradation/dissolution rate
constant and the initial concentration of each compound. For compounds, see abbreviations table (Table 1).
B. Moriceau et al. / Deep-Sea Research II 56 (2009) 1381–1395 1393
suggest that this pool of THAA was dissolved (chemical mechan-ism) rather than degraded (biological mechanism) as soon as itwas exposed. Another possible explanation to this fast turn overrate is a change in degradation mechanism. During degradation,amino acids are released from protein by enzymatic cleavage atthe end of the proteins (exopeptidase) or in the middle of thepolypeptide chain (endopeptidase). If the proteins are opened upduring the silicification process, exopeptidases could act at bothends of the protein and degradation would be faster.
Due to their high turnover rate Si(2)–THAA may have beendissolved during the strong HCl treatment or degraded beforeanalysis in the study of Ingalls et al. (2003, 2006). Accordingly, thequantification of Si–THAA made by Ingalls et al. (2003) mighthave only targeted THAA bound to the second bSiO2 phase of thefrustule (Si(3)–THAA). The composition of Si–THAA in Ingalls et al.(2003) is similar to our Si(3)–THAA except that LYS is moreabundant in Si(3)–THAA and GLY slightly less abundant (Table 2).The low solubility of the second bSiO2 phase is consistent with theincrease in Si–THAA/THAA with depth in their study.
The bSiO2 protected from degradation the organic matter thatwas directly associated with the frustule (Si(1)–THAA, Si(3)–THAAand Si–Lip). The first bSiO2 phase also protected the lipids (someDPG+PG) and amino acids (Si(2)–THAA) trapped inside the frustulepossibly between the 2 phases, as shown by the correlation curve(Figs. 7 and 8). Moreover, the sudden increase in POC degradationrate (Fig. 1) after release of the trapped material is not associatedwith an increase in bacterial concentration (Figs. 2 and 3) but withthe end of the dissolution of the first bSiO2 phase. It is hardly acoincidence that the end of dissolution of the first bSiO2 phaseoccurred exactly when the degradation of the POC, PON and THAA
increased. The mechanisms behind this observation are not clearyet; the dissolution of this phase probably gave bacteria betteraccess to the internal carbon of the cell, possibly because theintegrity of the frustule can not be maintained without the presenceof the first bSiO2 phase. This could happen through increasing poressize as sometimes shown by pictures of diatom frustules duringdissolution, or because the box-shaped frustule opens at the end ofthe first bSiO2 phase dissolution as observed after sexual phases(Crawford, 1995), both triggering cell lysis. In any case we can safelyconclude that the first bSiO2 phase of the diatom frustule alsoprotects most of the intracellular carbon; at the end of thedissolution of the first bSiO2 phase 69% of the POC was still notdegraded. Due to the very low dissolution rate of the secondbSiO2 phase, the associated organic compounds (Si(3)–THAA andSi(2)–Lip) might be protected for a long period of time; they wouldeven be preserved in the sediment with the bSiO2.
The presence of organic compounds inside the frustule and/orduring silicification determines the solubility of the different partsof the frustule. Moreover, intracellular carbon and Si-boundorganic compounds may be protected by at least some part ofthe frustule. These reverse interactions prove that carbon andsilica production and recycling must be studied in parallel if wewant to improve our understanding of mechanisms driving bothPOC and bSiO2 sedimentation.
Acknowledgements
We are grateful to Annick Masson for her technical assistancewith POC analyses. Thanks to everyone in the LMGEM for their

ARTICLE IN PRESS
B. Moriceau et al. / Deep-Sea Research II 56 (2009) 1381–13951394
kindness and help during the experimental work. This work wasfunded by the EU, partly through the ORFOIS (EVK2-CT2001-00100) project and partly through the program Marie Curie,project CARBALIS (MOIF-CT-2006-022278). This is contribution#1081 of the IUEM and 1354 of Stony Brook University.Support was also provided by the MedFlux program of the USNSF Chemical Oceanography division, and this is MedFluxcontribution No. 15.
References
Abramson, L., Wirick, S., Lee, C., Jacobsen, C., Brandes, J.A., 2008. The use of soft X-ray spectromicroscopy to investigate the distribution and composition oforganic matter in a diatom frustule and a biomimetic analog. Deep-SeaResearch II, this volume [doi:10.1016/j.dsr2.2008.11.031].
Aller, R.C., Aller, J.Y., 1998. The effect of biogenic irrigation intensity and soluteexchange on diagenetic reaction rates in marine sediments. Journal of MarineResearch 56, 905–936.
Armstrong, R.A., Lee, C., Hedges, J.I., Honjo, S., Wakeham, S.G., 2002. A new,mechanistic model for organic carbon fluxes in the ocean based on thequantitative association of POC with ballast minerals. Deep-Sea Research II 49,219–236.
Berge, J.-P., Gouygou, J.-P., Dubacq, J.-P., Durand, P., 1995. Reassessment of lipidcomposition of the diatom, Skeletonema costatum. Phytochemistry 39 (5),1017–1021.
Bidle, K.D., Azam, F., 2001. Bacterial control of silicon regeneration from diatomdetritus: significance of bacterial ectohydrolases and species identity.Limnology and Oceanography 46, 1606–1623.
Bligh, E.G., Dyer, W.J., 1959. A rapid method for total lipid extraction andpurification. Canadian Journal of Biochemistry and Physiology 37, 911–917.
Brzezinski, M.A., 1985. The Si:C:N ratio of marine diatoms: interspecific variabilityand the effect of some environmental variables. Journal of Phycology 21,347–357.
Chevallard, C., Guenoun, P., 2006. Les materiaux biomimetiques. Bulletin de laSociete Franc-aise de Physique 155, 5–10.
Cowie, G.L., Hedges, J.I., 1996. Digestion and alteration of the biochemicalconstituents of a diatom (Thalassiosira weissflogii) ingested by an herbivoriouscopepod (Calanus pacificus). Limnology and Oceanography 41, 581–594.
Crawford, R.M., 1995. The role of sex in the sedimentation of a marine diatombloom. Limnology and Oceanography 40 (1), 200–204.
D’ippolito, G., Tucci, S., Cutignano, A., Romano, G., Cimino, G., Miralto, A., Fontana,A., 2004. The role of complex lipids in the synthesis of bioactive aldehydes ofthe marine diatom Skeletonema costatum. Biochimica et Biophysica Acta 1686,100–107.
Dixit, S., Van Cappellen, P., Van Bennekom, A.J., 2001. Processes controllingsolubility of biogenic silica and porewater build up of silicic acid in marinesediments. Marine Chemistry 73 (3–4), 333–352.
Engel, A., Abramson, L., Szlosek, J., Liu, Z., Stewart, G., Hirschberg, D., Lee, C., 2008.Investigating the effect of ballasting by CaCO3 in Emiliania huxleyi: II.Decomposition of particulate organic matter. Deep-Sea Research II, thisvolume [doi:10.1016/j.dsr2.2008.11.027].
Gallinari, M., Ragueneau, O., Corrin, L., Demaster, D.J., Treguer, P., 2002. Theimportance of water column processes on the dissolution properties ofbiogenic silica in deep sea-sediments I. Solubility. Geochimica et Cosmochi-mica Acta 66 (15), 2701–2717.
Garvey, M., Moriceau, B., Passow, U., 2007. Applicability of the FDA assay todetermine the viability of marine phytoplankton under different environ-mental conditions. Marine Ecology Progress Series 352, 17–26.
Gehlen, M., Bopp, L., Emprin, N., Aumont, O., Heinze, C., Ragueneau, O., 2006.Reconciling surface ocean productivity, export fluxes and sediment composi-tion in a global biogeochemical ocean model. Biogeosciences Discussion 3,803–836.
Gendron-Badou, A., Coradin, T., Maquet, J., Frohlich, F., Livage, J., 2003. Spectro-scopic characterization of biogenic silica. Journal of Non-Crystalline Solids 316,331–337.
Gladyshev, M.I., 2002. Biophysics of the Surface Microlayer of Aquatic Ecosystems.IWA Publishing, Cornwall, UK.
Gordon, L.I., Jennings, J.C., Ross, A.A., Krest, J.M., 1993. A suggested protocol forcontinuous flow automated analysis of seawater nutrients. Technical ReportNo. 93-1, OSU College of Oceanography Descriptive, Corvallis, pp. 1–55.
Goutx, M., Wakeham, S.G., Lee, C., Duflos, M., Guigue, C., Liu, Z., Moriceau, B.,Sempere, R., Tedetti, M., Xue, J., 2007. Composition and degradation of marineparticles with different settling velocities in the Northwestern Mediterraneansea. Limnology and Oceanography 52 (4), 1645–1664.
Greenwood, J., Truesdale, V.W., Rendell, A.R., 2001. Biogenic silica dissolution inseawater—in vitro chemical kinetics. Progress in Oceanography 48, 1–23.
Guillard, R.R.L., 1975. Culture of phytoplankton for feeding marine invertebrates.In: Smith, W.L., Chanley, M.H. (Eds.), Culture of Marine Invertebrate Animals.Plenum Press, New York, pp. 26–60.
Guillard, R.R.L., Ryther, J.H., 1962. Studies of marine planktonic diatoms. I.Cyclotella nana Hustedt and Detonula confervacae (Cleve) Gran. CanadianJournal of Microbiology 8, 229–239.
Hamm, C.E., Merkel, R., Springer, O., Jurkojc, P., Maier, C., Prechtel, K., Smetacek, V.,2003. Architecture and material properties of diatom shells provide effectivemechanical protection. Nature 421, 841–843.
Harvey, H.R., Tuttle, J.H., Bell, J.T., 1995. Kinetics of phytoplankton decay duringsimulated sedimentation: Changes in biochemical composition and microbialactivity under oxic and anoxic conditions. Geochimica et Cosmochimica Acta59 (16), 3367–3377.
Hecky, R.E., Mopper, K., Kilham, P., Degens, E.T., 1973. The amino acids and sugarcomposition of diatom cell-walls. Marine Biology 19, 323–331.
Hedges, J.I., Baldock, J.A., Gelinas, Y., Lee, C., Meterson, M., Wakeham, S.G., 2001.Evidence for non-selective preservation of organic matter in sinking marineparticles. Nature 409, 801–804.
Hilborn, R., Mangel, M., 1997. The ecological detective: confronting models withdata. In: Levin, S.A., Horn, H.S. (Eds.), Monographs in Population Biology No. 28.Princeton University Press, NJ, USA, p. 315.
Hildebrand, M., 2003. Biological processing of nanostructured silica in diatoms.Progress in Organic Coatings 47, 256–266.
Hildebrand, M., Wetherbee, R., 2003. Components and control of silicification indiatoms. In: Mueller, W.E.G. (Ed.), Silicon Biomineralization: Biology, Bio-chemestry, Molecular Biology, Biotechnology. Springer, New York, pp. 11–57.
Hildebrand, M., York, E., Kelz, J.I., Davis, A.K., Frigeri, L.G., Allison, D.P., Doktycz, M.J.,2006. Nanoscale control of silica morphology and three-dimensional structureduring diatom cell wall formation. Journal of Materials Research 21 (10),2689–2698.
Ingalls, A.E., Lee, C., Wakeham, S.G., Hedges, J.I., 2003. The role of biominerals in thesinking flux and preservation of amino acids in the Southern Ocean along1701W. Deep-Sea Research II 50, 713–738.
Ingalls, A.E., Liu, Z., Lee, C., 2006. Seasonal trends in the pigments and amino acidcompositions of sinking particles in biogenic CaCO3 and SiO2 dominatedregions of the Pacific sector of the Southern Ocean along 1701W. Deep-SeaResearch I: Oceanographic Research Papers 53 (5), 836–859.
Jin, X., Gruber, N., Dunne, J.P., Sarmiento, J.L., Armstrong, R.A., 2006. Diagnosing thecontribution of phytoplankton functional groups to the production and exportof particulate organic carbon, CaCO3, and opal from global nutrient andalkalinity distributions. Global Biogeochemical Cycles 20.
Kamatani, A., 1982. Dissolution rates of silica from diatoms decomposing at varioustemperature. Marine Biology 68, 91–96.
Kamatani, A., Riley, J.P., 1979. Rate dissolution of diatom silica walls in seawater.Marine Biology 55, 29–35.
Kamatani, A., Riley, J.P., Skirrow, G., 1980. The dissolution of opaline silica of diatomtests in seawater. Journal of the Japanese Oceanographic Society 36, 201–208.
Kroger, N., Deutzmann, R., Bergsdorf, C., Sumper, M., 2000. Species-specificpolyamines from diatoms control silica morphology. Proceedings of theNational Academy of Sciences of the United States of America 97, 14133–14138.
Lavens, P., Sorgeloos, P. (Eds.), 1996. Manual on the Production and Use of Live Foodfor Aquaculture, Rome.
Lee, B.-G., Fisher, N.S., 1992. Degradation and elemental release rates fromphytoplankton debris and their geochemical implications. Limnology andOceanography 37 (7), 1345–1360.
Lee, C., Cronin, C., 1982. The vertical flux of particulate organic nitrogen in the sea:decomposition of amino acids in the Peru upwelling area and the equatorialAtlantic. Journal of Marine Research 41, 227–251.
Lee, C., Wakeham, S.G., Hedges, J.I., 2000. Composition and flux of particulateamino acids and chloropigments in equatorial Pacific seawater and sediments.Deep-Sea Research I 47, 1535–1568.
Lee, C., Wakeham, S.G., Peterson, M.L, Cochran, J.K., Miquel, J.C., Armstrong, R.A.,Fowler, S., Hirschberg, D., Beck, A., Xue, J., 2008. Particulate matter fluxes intime-series and settling velocity sediment traps in the northwesternMediterranean Sea. Deep-Sea Research II, this volume [doi:10.1016/j.dsr2.2008.11.029].
Liu, Z., Lee, C., Wakeham, S.G., 2006. Effects of mercuric chloride and proteaseinhibitors on degradation of particulate organic matter from the diatomThalassiosira pseudonana. Organic Geochemistry 37, 1003–1018.
Martin-Jezequel, V., Hildebrand, M., Brzezinski, M.A., 2000. Silicon metabolism indiatoms: implications for growth. Journal of Phycology 36, 821–840.
Moriceau, B., Gallinari, M., Soetaert, K., Ragueneau, O., 2007. Importance of particleformation to reconstructed water column biogenic silica fluxes. GlobalBiogeochemical Cycles 21(3), in press, doi:10.1029/2006GB002814.
Mullin, J.B., Riley, J.P., 1965. The spectrophotometric determination of silicate-silicon in natural waters with special reference to seawater. Analytica ChimicaActa 46, 491–501.
Nelson, D.M., Treguer, P., Brzezinski, M.A., Leynaert, A., Queguiner, B., 1995.Production and dissolution of biogenic silica in the ocean: revised globalestimates, comparison with regional data and relationship to biogenicsedimentation. Global Biogeochemical Cycles 9 (3), 359–372.
Parrish, C.C., 1988. Dissolved and particulate marine lipid classes: a review. MarineChemistry 23, 17–40.
Patrick, S., Holding, A.J., 1985. The effect of bacteria on the solubilization of silica indiatom frustules. Journal of Applied Bacteriology 59, 7–16.
Ploug, H., 2001. Small-scale oxygen fluxes and remineralization in sinkingaggregates. Limnology and Oceanography 46 (7), 1624–1631.
Porter, K.G., Feig, Y.S., 1980. The use of DAPI for identifying and counting aquaticmicroflora. Limnology and Oceanography 25 (5), 943–948.
Ragueneau, O., Treguer, P., 1994. Determination of biogenic silica in coastal waters:applicability and limits of the alkaline digestion method. Marine Chemistry 45,43–51.
ARTICLE IN PRESS
B. Moriceau et al. / Deep-Sea Research II 56 (2009) 1381–1395 1395
Ragueneau, O., Dittert, N., Pondaven, P., Treguer, P., Corrin, L., 2002. Si/C decouplingin the world ocean: is the Southern Ocean different? Deep-Sea Research II 49,3127–3154.
Rousseau, V., Leynaert, A., Daoud, N., Lancelot, C., 2002. Diatom succession,silicification and silicic acid availability in Belgian coastal waters (SouthernNorth Sea). Marine Ecology Progress Series 236, 61–73.
Sempere, R., Dafner, E., Van Wambeke, F., Lefevre, D., Magen, C., Allegre, S., Bruyant,F., Bianchi, M., Prieur, L., 2003. Distribution and cycling of total organic carbonacross the Almeria-Oran Front in the Mediterranean Sea: implications forcarbon cycling in the western basin. Journal of Geophysical Research 108 (C11).
Sohrin, R., Sempere, R., 2005. Seasonal variation in total organic carbon inthe northeast Atlantic in 2000–2001. Journal of Geophysical Research 110(C10S90).
Striby, L., Lafont, R., Goutx, M., 1999. Improvement in the Iatroscan thin-layerchromatography-flame ionisation detection analysis of marine lipids. Separa-tion and quantitation of mono- and diacylglycerols in standards and naturalsamples. Journal of Chromatography A 849, 371–380.
Sumper, M., Kroger, N., 2004. Silica formation in diatoms: the function of long-chain polyamines and silaffins. Journal of Materials Chemistry 14, 2059–2065.
Tamburini, C., Garcin, J., Gregori, G., Leblanc, K., Rimmelin, P., Kirchman, D.L., 2006.Pressure effects on surface Mediterranean prokaryotes and biogenic silica
dissolution during a diatom sinking experiment. Aquatic Microbial Ecology 43(3), 267–276.
Tamburini, C., Goutx, M., Guigue, C., Garel, M., Lefevre, D., Charriere, B., Sempere, R.,Pepa, S., Peterson, M.L., Wakeham, S., Lee, C., 2008. Microbial alteration ofsinking fecal pellets: effects of a continuous increase in pressure that simulatesdescent in the water column. Deep-Sea Research II, this volume [doi:10.1016/j.dsr2.2008.12.035].
Treguer, P., Le Corre, P., 1975. Manuel d’analyse des sels nutritifs dans l’eau de mer:utilisation de l’auto-analyseur Technicon II. Universite de Bretagne Occiden-tale, Brest.
Treguer, P., Nelson, D.M., Bennekom, A.J.V., Demaster, D.J., Leynaert, A., Queguiner, B.,1995. The silica balance in the World Ocean: a reestimate. Science 268, 375–379.
Van Cappellen, P., Dixit, S., Gallinari, M., 2002a. Biogenic silica dissolution and themarine Si cycle: kinetics, surface chemistry and preservation. Oceanis 28 (3–4),417–454.
Van Cappellen, P., Dixit, S., Van Beusekom, J., 2002b. Biogenic silica dissolution inthe oceans: reconciling experimental and field-based dissolution rates. GlobalBiogeochemical Cycles 16 (4), 1075.
Westrich, J.T., Berner, R.A., 1984. The role of sedimentary organic matter inbacterial sulfate reduction: the G model tested. Limnology and Oceanography29 (2), 236–249.