comparison between airlift photobioreactor and bubble column for skeletonema costatum cultivation
TRANSCRIPT

Comparison between Airlift Photobioreactor and Bubble Column for Skeletonema costatum cultivation
Saranya Monkonsit
1, Sorawit Powtongsook
2,3, and Prasert Pavasant
1,*
1Department of Chemical Engineering, Faculty of Engineering, Chulalongkorn University, Bangkok
10330, Thailand
2Center of Excellence for Marine Biotechnology, Department of Marine Science, Faculty of Science,
Chulalongkorn University, Bangkok 10330, Thailand
3National Center of Genetic Engineering and Biotechnology, National Science and Technology
Development Agency, Pathumthani 12120, Thailand
E-mail: [email protected]*
Abstract. The cultivation of diatom Skeletonema costatum was achieved in airlift
photobioreactor and the system performance was compared to that of bubble column.
The standard F/2 medium (Guillard’s medium) for typical diatom cultivation could
only yield the best growth character when the silicon concentration increased 4 times
the normal value. In terms of cell growth, the airlift photobioreactor provided better
performance than the bubble column where the maximum cell concentration, specific
growth rate, and productivity in the airlift were 4.6 x 10⁶ cells mL
-1, 0.07 h
-1, and 6.4 x
104 cells s
-1 compared with 1.8 x 10
6 cells mL
-1, 0.04 h
-1, and 2.2 x 10
4 cells s
-1 in the
bubble column of the same size (3 L) and operated at the same aeration rate (superficial
velocity = 1.5 cm s-1
) and light intensity (34 μmol photons m−2
s−1
). This was because
the airlift photobioreactor allowed circulatory flow in the system which helps prevent
cell precipitation and enhance light utilization efficiency. The optimal operating
conditions in the airlift system which was found most optimal to cell growth were: the
ratio between downcomer and riser cross sectional area (Ad:Ar) of 3.27, superficial gas
velocity 1.5 cm s−1
and the light intensity 34 μmol photons m−2
s−1
. Preliminary
economical assessment on the cultivation of S. costatum in airlift system compared
with that in bubble column was carried out, whereas the analysis for nutritional values
of the obtained biomass indicated relatively high protein content.
Keywords: Diatom, microalgae, cultivation, bioreactor, aquaculture.
ENGINEERING JOURNAL Volume 15 Issue 4 Received 15 June 2011 Accepted 11 August 2011 Published 1 October 2011 Online at http://www.ej.eng.chula.ac.th/eng/ DOI:10.4186/ej.2011.15.4.53

DOI:10.4186/ej.2011.15.4.53
54 ENGINEERING JOURNAL Volume 15 Issue 4, ISSN 0125-8281 (http://www.ej.eng.chula.ac.th/eng/)
1. Introduction
Food for shrimp larvae in the first protozoea stage (zoea stage) in Thailand is generally diatoms [1] as
they contain essential nutrients, and also have proper size allowing a faster and healthier growth of the
larvae [2]. The use of natural feed like diatom also induces less water pollution compared to artificial
feed. Small diatom such as Chaetoceros gracilis and Skeletonema costatum are typically employed for
this purpose where Chaetoceros gracilis is usually used in the eastern part of Thailand and Skeletonema
costatum is usually in the south, both being equally popular, the choice of which depends on experience
of the farmers.
The cultivation of both Chaetoceros gracilis and Skeletonema costatum in Thailand is generally
performed in 3 steps: Step 1: stock culture of the diatom is cultivated as dense cell culture in a 1 L
Erlenmeyer flask for 8-12 days; Step 2: the culture is then inoculated in a bigger container such as
plastic tanks, this takes around 4-5 days; Step 3: the cells from Step 2 are being scaled up in a larger
scale tank 2-10 cubic meters in volume, typically cement tanks, this will be another 2-3 days before it is
ready to be used. However, the drawback of this method is that the cultivation in the last steps is done
in an open space which is more susceptible to contamination causing subsequent destructive diseases in
shrimp culture ponds. The design of closed system bioreactors is therefore treated as a solution to these
problems.
Airlift bioreactor (ALBR) is one of the potential alternatives for the cell cultivation [3]. Airlift
bioreactors achieve mixing and mass transfer by injecting air into the riser compartment which then
allows the fluid circulation through the downcomer compartment. The mixing in the airlift bioreactor
could be obtained without causing too much shear force in the liquid phase which could inhibit the
growth of the diatom. Our recent work has proven that, by giving it a good design and operating
conditions, the use of airlift system as a photobioreactor could drastically improve the quality of the
cultivation of Chaetoceros calcitrans [4, 5].
This work aimed to extend the applicability of the airlift system onto the cultivation of Skeletonema
costatum. The main target was to determine the optimal design configurations and operating conditions
for the growth of Skeletonema costatum.
2. Experimental
Skeletonema costatum BIMS-PP0115 was obtained from Bangsaen Institute of Marine Science,
Burapha University, Thailand. The standard F/2 medium [6] was employed as the standard medium
where the composition of this standard medium is given in Table 1.
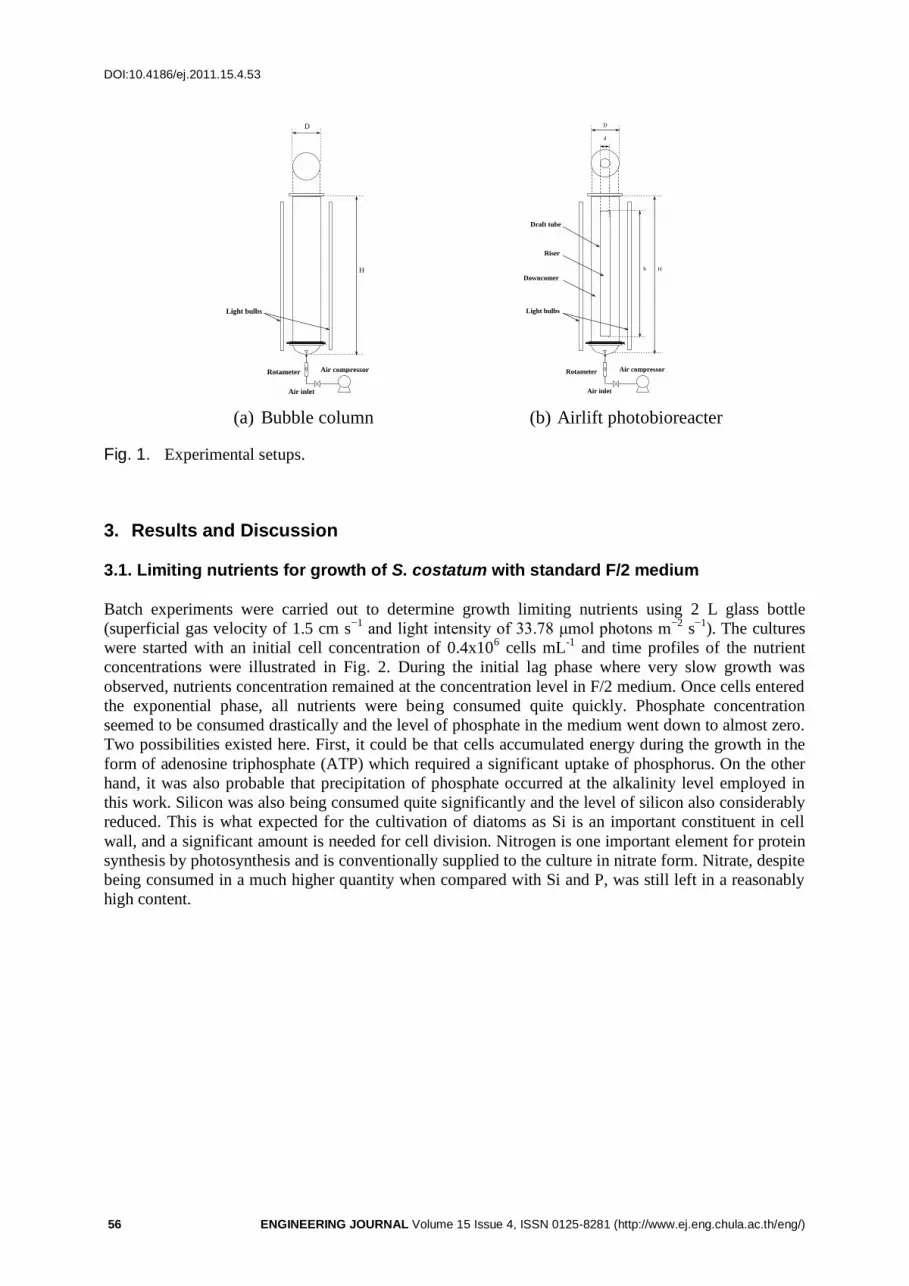
The experiments were investigated in clear acrylic plastic bubble column (Fig. 1(a)) and airlift
photobioreactor (Fig. 1(b)) with dimensions as shown in Table 2. The airlift was equipped with a draft
tube installed centrally in the column. Air from an air compressor was metered through a flowmeter,
sterilized with a 0.45 μm Gelman filter and passed into the culture at the bottom of both reactors. Light
was supplied through fluorescent lamp (18 watts) at the side along the length of the column (2 lamps for
each column), and light intensity was measured by “Digicon LX-50 lux meter” around the column, and
was then converted into µ mol photons m-2
s-1
with the conversion factor of 74. The temperature was
controlled at 25-30oC using an air conditioning unit.
Note that the analyses for silicon, nitrogen and phosphorus follow the methods as proposed by
Fanning and Pilson [7], Armstrong [8], and Fontaine [9], respectively.

DOI:10.4186/ej.2011.15.4.53
ENGINEERING JOURNAL Volume 15 Issue 4, ISSN 0125-8281 (http://www.ej.eng.chula.ac.th/eng/) 55
Table 1. Chemical composition of standard F/2 (Guillard’s) stock solution*.
Solution A: Nitrate and Phosphate stock solution (1 L)
Nutrient Amount
NaNO3
Na2HPO4H2O
FeCl36H2O
Na2EDTA2H2O
84.15 g
6.0 g
2.90 g
10.0 g
Solution B: Silicate stock solution (1 L)
Nutrient Amount
Na2SiO39H2O 33.0 g
Solution C: Trace metal stock solution (1 L)
Nutrient Amount
CuSO45H2O
ZnSO47H2O Na2MoO42H2O
MnCl24H2O
CoCl26H2O
1.96 g
4.40 g
1.26 g
36.0 g
2.0 g
Solution D: Vitamin stock solution (1 L)
Nutrients Amount
Vitamin B1
Vitamin B12
Biotin
0.4 g
0.002 mg
0.10 mg
*Remark: To prepare the culture medium for Skeletonema costatum, simply add 1 mL of solutions A, B,
C and D in 1 L of fresh sea water.
Table 2. Main dimension of the bioreactor.
Bubble column Airlift photobioreactor
Column inner diameter (D), cm 9.4 9.4
Column height (H), cm 60 60
Draft tube height (h), cm - 40
Working volume (V), L 3 3
DOI:10.4186/ej.2011.15.4.53
56 ENGINEERING JOURNAL Volume 15 Issue 4, ISSN 0125-8281 (http://www.ej.eng.chula.ac.th/eng/)
Fig. 1. Experimental setups.
3. Results and Discussion
3.1. Limiting nutrients for growth of S. costatum with standard F/2 medium
Batch experiments were carried out to determine growth limiting nutrients using 2 L glass bottle
(superficial gas velocity of 1.5 cm s−1
and light intensity of 33.78 μmol photons m−2
s−1
). The cultures
were started with an initial cell concentration of 0.4x10⁶ cells mL
-1 and time profiles of the nutrient
concentrations were illustrated in Fig. 2. During the initial lag phase where very slow growth was
observed, nutrients concentration remained at the concentration level in F/2 medium. Once cells entered
the exponential phase, all nutrients were being consumed quite quickly. Phosphate concentration
seemed to be consumed drastically and the level of phosphate in the medium went down to almost zero.
Two possibilities existed here. First, it could be that cells accumulated energy during the growth in the
form of adenosine triphosphate (ATP) which required a significant uptake of phosphorus. On the other
hand, it was also probable that precipitation of phosphate occurred at the alkalinity level employed in
this work. Silicon was also being consumed quite significantly and the level of silicon also considerably
reduced. This is what expected for the cultivation of diatoms as Si is an important constituent in cell
wall, and a significant amount is needed for cell division. Nitrogen is one important element for protein
synthesis by photosynthesis and is conventionally supplied to the culture in nitrate form. Nitrate, despite
being consumed in a much higher quantity when compared with Si and P, was still left in a reasonably
high content.
Air inlet
Rotameter Air compressor
Light bulbs
H
D
Air inlet
Rotameter Air compressor
Light bulbs
Draft tube
Riser
Downcomer
h H
D
d
(a) Bubble column (b) Airlift photobioreacter

DOI:10.4186/ej.2011.15.4.53
ENGINEERING JOURNAL Volume 15 Issue 4, ISSN 0125-8281 (http://www.ej.eng.chula.ac.th/eng/) 57
Fig. 2. Cell and nutrients concentration during batch cultivation of S. Costatum.
3.2. Effects of silicon and phosphate concentrations on cell growth
Results from the preliminary assessment in the previous section led to the conclusion that phosphate
and silicon could be rate limiting factor for the growth of S. costatum. Further investigation was then
carried out to see the effects of silicon and phosphate concentrations on the growth of the diatom and
the results are illustrated in Fig. 3 and 4.
Fig. 3 illustrates clearly that S. costatum grew better when extra quantity of silicon was added into
the standard F/2 medium. Increasing silicon from 1 to 4 fold of the standard concentration clearly
induced higher growth rate and productivity. The highest maximum cell concentration of almost
4.6x10⁶ cells mL
-1 occurred at 4 fold silicon content. However, an inhibition effect seemed to be
observed when the silicon concentration increased more than 4 folds.
0.0
0.2
0.4
0.6
0.8
1.0
1.2
1.4
1.6
1.8
2.0
Cel
l con
cen
trat
ion
(x
106 C
ell m
L-1
)
0.0
0.2
0.4
0.6
0.8
1.0
1.2
1.4
1.6
1.8
Silicon
concen
tration
(mg L
-1)
Cell concentration
Silicon concentration
0.0
0.2
0.4
0.6
0.8
1.0
1.2
1.4
1.6
1.8
2.0
Cel
l con
cen
trat
ion
(x
106 C
ell m
L-1
)
0.0
0.2
0.4
0.6
0.8
1.0
1.2
1.4
Ph
osph
ate concen
tration (m
g L-1)
Cell concentration
Phosphate concentration
0.0
0.2
0.4
0.6
0.8
1.0
1.2
1.4
1.6
1.8
2.0
0 12 24 36 48 60 72Time (h)
Cel
l co
nce
ntr
ati
on
(x
10
6 C
ell m
L-1
)
0
2
4
6
8
10
12
14
Nitra
te con
centra
tion
(m
g L
-1)
Cell concentration
Nitrate concentration
(x 1
06 c
ell
s m
L-1
) (x
10
6 c
ell
s m
L-1
) (x
10
6 c
ell
s m
L-1
)

DOI:10.4186/ej.2011.15.4.53
58 ENGINEERING JOURNAL Volume 15 Issue 4, ISSN 0125-8281 (http://www.ej.eng.chula.ac.th/eng/)
Fig. 3. Effect of silicate concentration (measured as silicon) from 1 to 6 folds of standard F/2 medium
on cell growth.
Fig. 4. Effect of phosphate concentration (measured as phosphorus) from 1 to 3 folds of standard F/2
medium on cell growth.
Phosphorus plays an important role in almost all cell metabolic activities, and it is an important
component of cell membrane. Phosphate is also an important component of the energy storage
melucules, adenosine triphosphate (ATP), Nicotinamide adenine dinucleotide phosphate (NADPH), etc.
Insufficient supply of phosphorus can, hence, reduce the cell growth [10]. For this work, the effects of
phosphorus concentration on the growth of S. costatum are demonstrated in Fig. 4. Note that this
experiments were performed with silicon content of 4-fold the standard F/2 medium. This analysis
showed that the addition of phosphorus concentration from 1x to 3x did not have significant impacts on
the maximum cell concentration and productivity, and the original concentration was concluded to be
the optimal level.
The cellular yield based on the nutrient component or YNu/X can be evaluated using the following
equation:
tX
tNuY XNu
/
//
0.0
0.5
1.0
1.5
2.0
2.5
3.0
3.5
4.0
4.5
5.0
1x 2x 3x 4x 5x 6x
Silicon concentration (mg L-1
)
Ma
xim
um
cell
co
0.00
0.02
0.04
0.06
0.08
0.10
0.12
0.14
Sp
ecific
gro
wth
ra
te (h
-1) )))
Max. cell concentration
Specific cell growth rate
Productivity
Ma
xim
um
cel
l co
nce
ntr
ati
on
(x
10
6 c
ell
mL
-1)
Ma
xim
um
cel
l co
nce
ntr
ati
on
(x
10
6 c
ell
mL
-1)
Sp
ecific g
row
th r
ate (h
-1)
Pro
du
ctivity
(x 1
06 ce
ll s-1)
Silicon concentration (mg L-1
)
(x 1
06 c
ell
s m
L-1
) (x
10
6 cells s
-1)
0.0
0.5
1.0
1.5
2.0
2.5
3.0
3.5
4.0
4.5
5.0
5.5
6.0
1x 2x 3x
Phosphorus concentration (mg L-1
)
Ma
xim
um
cell
co
ncen
tra
tio
n ( x
10
6 cell
mL
-1))
0.00
0.02
0.04
0.06
0.08
0.10
0.12
Sp
ecific
gro
wth
ra
te (h
-1) ))
Max. cell concentration
Specific cell growth rate
Productivity
Ma
xim
um
cel
l co
nce
ntr
ati
on
(x
10
6 c
ell
mL
-1)
Ma
xim
um
cel
l co
nce
ntr
ati
on
(x
10
6 c
ell
mL
-1)
Sp
ecific g
row
th r
ate (h
-1)
Pro
du
ctivity
(x 1
06 ce
ll s-1)
(x 1
06 c
ell
s m
L-1
) (x
10
6 cells s
-1)

DOI:10.4186/ej.2011.15.4.53
ENGINEERING JOURNAL Volume 15 Issue 4, ISSN 0125-8281 (http://www.ej.eng.chula.ac.th/eng/) 59
when Nu /t = specific nutrient uptake (mg L-1
s-1
)
X /t = cell production (cells mL-1
s-1
).
In this work, the cellular yield for silicon, phosphorus and nitrogen can be summarized as follows:
silicon content: YSi/X = 0.4 x 10⁻³
pg cell-1
phosphorus content: YP/X = 2.9 x 10⁻³
pg cell-1
nitrogen content: YN/X = 5.5 x 10⁻³
pg cell-1
The ratio of the three major cellular chemical compositions, N:Si:P assimilated into the cell calculated
from the ratio between these yields became 1.9:0.1:1. Literature revealed that the ratio of N:Si:P of S.
costatum cultivated in chemostats under non-limiting nutrient [11] is 10:5.4:1 which means that the
ratios between N and Si to P were much higher in the literature than those found in this work. This
implied that, although P was totally consumed, it was already present in relatively high content when
compared with other nutrients such as Si and N. On the other hand, Si seemed to be inadequately
provided in the standard F/2 medium (almost 50 times lower than the reported Si:P ratio of 5.4:1).
Nitrogen was also not being supplied sufficiently as it was not the rate limiting factor for this case. This
supports the finding that an increase in Si augmented the growth of the diatom.
Having discussed so, however, it was also possible that phosphorus was precipitated in the medium
which is likely to take place particularly at neutral or high alkalinity conditions. In this case, it might be
recommended that an intermittent or a continuous feed of phosphorus might be a more effective way of
supplying phosphorus for the algal culture.
3.3. Growth of S. costatum under different light intensities
These experiments were conducted in the 3 L airlift photobioreactor with downcomer to riser cross
sectional ratio (Ad/Ar) of 3.27, and 3 L bubble column operating at superficial velocity of 1.5 cm s-1
and
at different levels of light intensities. Fig. 5 demonstrates quite clearly that the modified F/2 medium
(with 4x silicon) outperformed the standard F/2 medium at all light intensities. The highest cell
concentration, specific growth rate and productivity obtained from the standard F/2 medium at the light
intensity around 34 μmol photons m−2
s−1
were about 1.8 x 10⁶ cells mL
-1, 0.04 h
-1 and 2.2 x 10
4 cells s
-1,
respectively, which were less than those obtained from the culture with the modified F/2 medium at 4.6
x 106 cells mL
-1, 0.07 h
-1 and 6.4 x10
4 cells s
-1, respectively.
Figure 6 illustrates the effects of light intensity on the performance of airlift photobioreactor
compared with that of bubble column. Similar correlation between light intensity and growth in both
types of reactors was observed. The best results were obtained from the airlift system at the light
intensity of 34 μmol photons m−2
s−1
. At low range of light intensity (< 34 μmol photons m−2
s−1
),
increasing the light intensity (from 20 to 34 μmol photons m−2
s−1
) helped induce photosynthesis and
therefore an increase in maximum cell concentration, specific growth rate and productivity were
observed. However, increasing light intensity above 34 μmol photons m−2
s−1
was found to have
negative impacts on the growth which could be due to the over-saturation of light that caused
photoinhibition. The performance of bubble column was, unexpectedly, better than the airlift at high
light intensity. This could be due to the effect of circulatory flow in the airlift which allowed all the
cells to be exposed to high light intensity zone, and therefore the effect of high light intensity was
distributed evenly throughout the culture.

DOI:10.4186/ej.2011.15.4.53
60 ENGINEERING JOURNAL Volume 15 Issue 4, ISSN 0125-8281 (http://www.ej.eng.chula.ac.th/eng/)
Fig. 5. Effect of light intensities on cell growth in airlift photobioreactor with standard F/2 and
modified F/2 mediums.
Fig. 6. Effect of light intensities on cell growth in airlift photobioreactor and bubble column operated
with modified F/2 medium.
3.4. Effect of aeration rate
These experiments were conducted in the 3 L airlift photobioreactor with Ad/Ar = 3.27 and 3 L bubble
column operating at the light intensity of 34 μmol photons m-2
s-1
. In the airlift system, an increase in
the aeration rate (measured in terms of superficial velocity, usg) from 1 to 1.5 cm s-1
led to a higher cell
concentration, specific growth rate and productivity. However, increasing aeration rate above 1.5 cm s-1
was found to have negative impacts on the growth. This effect is illustrated in Fig. 7 which reveals that
the airlift system still provided a better performance, but only at usg of 1.5 cm s-1
. At other usg, no
significant differences between the two types of reactors were observed.
An increase in the aeration rate from 1 to 1.5 cm s-1
induced liquid circulation rate and mass transfer
between gas and liquid phase in the system [12] which facilitated the removal of metabolic gases such
as oxygen, preventing the accumulation of such gases, avoiding potential adverse effects on the growth
rate [13]. The mixing of liquid caused a more homogeneity between the medium and cell which resulted
0.0
0.4
0.8
1.2
1.6
2.0
2.4
2.8
3.2
3.6
4.0
4.4
4.8
5.2
20 34 41 47
Light intensity (μ mol photon m-2
d-1
)
Ma
xim
um
cell
co
ncen
tra
tio
n ( x
10
6 cell
mL
-1)
0.000
0.015
0.030
0.045
0.060
0.075
0.090
0.105
0.120
0.135
0.150
Sp
ecific
gro
wth
ra
te (h
-1) ))
Pro
du
ctiv
ity (x
10
6 cells s
1) (x
10
6 c
ell
s m
L-1
)
( mol photons m-2 d-1)
Standard F/2
Modified F/2
0.0
0.4
0.8
1.2
1.6
2.0
2.4
2.8
3.2
3.6
4.0
4.4
4.8
5.2
20 34 47
Light intensity (μ mol photon m-2
d-1
)
Ma
xim
um
cell
co
ncen
tra
tio
n
( x
10
6 c
ell
mL
-1)
0.000
0.015
0.030
0.045
0.060
0.075
0.090
0.105
0.120
0.135
0.150
Sp
ecific
gro
wth
ra
te (h
-1) ))
Pro
du
ctiv
ity (x
10
6 cell s
1)
(x 1
06 c
ell
s m
L-1
)
(x 1
06 c
ells s
-1)
( mol photons m-2 d-1)
Airlift system
Bubble column

DOI:10.4186/ej.2011.15.4.53
ENGINEERING JOURNAL Volume 15 Issue 4, ISSN 0125-8281 (http://www.ej.eng.chula.ac.th/eng/) 61
in a more sufficient utilization of nutrients. This lead to a better growth performance as described earlier.
On the other hand, a much too high aeration rate (usg > 1.5 cm s-1
) led to a system with more gas
bubbles along the downcomer. These gas bubbles were somewhat undesirable as they could prevent the
passage of light to the center of the bioreactor as the light penetration ability was obstructed and
dissipated by the swarm of bubbles. Also the mass transfer rate between phases decreased as a result of
decreasing specific mass transfer area (of large bubbles).
3.5. Growth in airlift with different ratios between downcomer and riser cross section area
This section investigates the effect of design configuration of the airlift photobioreactor system, i.e. the
ratio between downcomer and riser cross sectional area (Ad/Ar) on the growth of S. costatum.
Experiment in this section was performed with the light intensity of 34 μmol photons m-2
s-1
. This
parameter could be simply altered by changing the draft tube size. The four sizes of commercially
available clear column were employed, i.e. at 3, 5, 6 and 7 cm, which gave Ad/Ar of approximately
14.87, 3.27, 1.87 and 0.98, respectively. Fig. 8 illustrates quite clearly that the optimal growth behavior
occurred at Ad/Ar of 3.27. The specific growth rate might seem to be relatively high at larger Ad/Ar, but
this only provided low cell density which also resulted in a low productivity. It was observed again here
that the aeration rate of usg = 1.5 cm s-1
(results shown in Fig. 8) provided the best performance with the
maximum cell concentration, specific growth rate and productivity of 4.6 x 10⁶ cells mL
-1, 0.07 h
-1 and
6.4 x10⁴ cells s
-1, respectively (results at other usg are not shown here).
Fig. 7. Effect of aeration rate on cell growth in airlift photobioreactor and bubble column operated
with modified F/2 mediums.
0.0
0.5
1.0
1.5
2.0
2.5
3.0
3.5
4.0
4.5
5.0
5.5
1.0 1.5 2.0
usg (cm s-1
)
Ma
xim
um
cell
co
ncen
tra
tio
n (
x 1
0 6
cell
mL
-1))
)
0.000
0.016
0.032
0.048
0.064
0.080
0.096
0.112
Sp
ecific
gro
wth
ra
te (h
-1) ))
Pro
du
ctiv
ity (x
10
6 cells s
1) (x
10
6 c
ell
s m
L-1
)
Airlift system
Bubble column

DOI:10.4186/ej.2011.15.4.53
62 ENGINEERING JOURNAL Volume 15 Issue 4, ISSN 0125-8281 (http://www.ej.eng.chula.ac.th/eng/)
Fig. 8. Growth performance in airlift systems at various Ad/Ar operated with modified F/2 medium.
3.6. Preliminary economic evaluation
Preliminary economic consideration for the production of 1 kg of S. costatum was based on the
cultivation in the airlift photobioreactor and bubble column operated in batch mode, and the results are
presented in Table 3. The differences in the performance of the bubble column and airlift required that
the total volume of sea water for the cultivation in airlift photobioreactor (1,450 L) was less than that
for bubble column (2,223 L). Besides, some other advantages of airlift photobioreactor, such as the
reducing number of time cycle for the cultivation of S. costatum allowed the airlift to be operated more
effectively, and this was reflected in the analysis as the airlift seemed to be more attractive than the
bubble column The specific operating cost for the cultivation in the airlift was approx. US$ 0.09 g-1
(3.41 THB g-1
), which was 27 % lower when compared with the cultivation in the bubble column (0.13
US$ g-1
or 4.66 THB g-1
) Note that the investment cost was not included in this preliminary evaluation
and the assessment was totally based on the laboratory scale production as employed in this work, the
economical performance of the actual scale production could be significantly different from the resulted
reported here.
Table 3. Economical analysis of the cultivation of 1 kg (dry weight) of S. costatum.
Variable Value
ALPBR BC
Effective volume (L) [A] 3 3
Cycle time (h) [B] 45 36
Maximum cell concentration (cells mL-1
) [C] 4.6 x 10⁶ 2.9 x 10
6
Cell mass concentration (kg L-1
) [D] 0.69 x 10⁻³
0.45 x 10⁻³
Total volume of sea water used (L)
(based on 1 kg) [E=1÷D] 1450 2223
Number of reactor (reactor) [F=E÷A] 484 741
Cost of water, 0.06 THB L-1
(THB) [G=0.06 x E] 87 134
Cost of nutrient, 1 THB L-1
(THB) [H=1 x E] 1450 2223
Power of air compressor (W) [I] 900 1350
Power of light source (W) [J] 13044 20000
Total electrical unit (units) [K=(I+J) x B÷1000] 628 769
Electrical cost, 3 THB per unit (THB) [L=3xK] 1883 2306
Total operating cost (THB) [M=G+H+L] 3419 4662
Total operating cost (US$) (36 THB per 1 US$ ) [N] 94 130
Total operating cost per gram (THB g-1
) [R=P÷1000] 3.41 4.66
Total operating cost per gram ( US$ g-1
) [P=Q÷1000] 0.09 0.13
ALPBR = Airlift photobioreactor; BC = Bubble column; THB = Thai Baht.
0.0
0.5
1.0
1.5
2.0
2.5
3.0
3.5
4.0
4.5
5.0
0.98 1.87 3.27 14.87
Ad/Ar
0
0.01
0.02
0.03
0.04
0.05
0.06
0.07
0.08
Max. cell conc. (x106 cells mL-1)
Specific growth rate (x10-4 h-1)
Productivity (x106 cells s-1)

DOI:10.4186/ej.2011.15.4.53
ENGINEERING JOURNAL Volume 15 Issue 4, ISSN 0125-8281 (http://www.ej.eng.chula.ac.th/eng/) 63
Table 4. Concentration of protein, carbohydrate and lipid of microalgae commonly used in
aquaculture industry.
Algal class Percentage of dry weight Source
Species Protein Carbohydrate Total fat
Bacillariophyceae
Nitzschia closterium 26 9.8 13 [15]
Chaetoceros calcitrans 31.3 16.4 22.9 [16]
Chaetoceros gracilis
(Chaetoceros muelleri) 48.2 18.9 28.9 [17]
Skeletonema costatum 25 4.6 10 [15]
Skeletonema costatum 31 21.5 1.3 this work
Cyanophyceae
Spirulina platensis 54.2 - 26.6 [18]
Spirulina sp. 67.0 25.5 30.1 [19]
Chlorophyceae
Dunaliella tertiolecta 20 12.2 15 [15]
Nannochloris atomus 30 23.0 21 [15]
Cryptophyceae
Chroomonas salina 29 9.1 12 [15]
3.7. Nutritional value of S. costatum obtained from this work
S. costatum from the experiment with the most suitable conditions determined from previous
experiments was analyzed for its nutritional constituents using the standard methods as follows:
Protein: Kjeldahl technique [14]
Lipid: AOAC method [14]
Carbohydrate was taken as the remaining mass after the subtraction of protein and lipid contents.
Expressed as percentage of dry weight, the range for the level of carbohydrate, protein and lipid are
21.5, 31.2, 1.26%, respectively. Examples of gross composition of microalgae are given in Table 4
where the general ranges of protein, lipid, and carbohydrate are 12-35%, 7.2-23%, and 4.6-23%,
respectively [15]. Protein is always the major organic constituent when the algae are consumed as feed,
Skeletonema cultivated in this work provided a reasonable amount of protein and carbohydrate but a
slightly low level of lipid when compared to S. costatum reported by Brown [15]. Exact reasons for this
were not evaluated in this work.
4. Conclusions
This work reveals that the cultivation of S. costatum in the airlift photobioreactor was superior to that in
the bubble column. The optimal culture yielded a specific growth rate of 0.046 h-1
with a maximum cell
concentration of 4.6x10⁶ cells mL
-1 and a productivity of 6.5x10
4 cells s
-1. This was due primarily to the
well defined flow pattern in the airlift photobioreactor which led to a more effective light utilization of
the algae. The circulatory flow in the airlift photobioreactor also helps minimize cell precipitation, and
hence, high cell growth could be obtained. The finding reported here is one of the first experiences in
the culture of S. costatum in the airlift photobioreactor and constitutes the initial step in the potential
mass production.

DOI:10.4186/ej.2011.15.4.53
64 ENGINEERING JOURNAL Volume 15 Issue 4, ISSN 0125-8281 (http://www.ej.eng.chula.ac.th/eng/)
Acknowledgments
Financial supports from the Graduate School, Chulalongkorn University and Thailand Research Fund
are deeply appreciated.
References
[1] T. Pechmanee, “Status of marine larviculture in Thailand”, J. of Hydrobiologia, vol. 358, pp.
41-43, 1997.
[2] C. T. Enright, G. F. Newkirk, J. S. Craigie, and J. D. Castell, “Growth of juvenile Ostrea edulis
fed Chaetoceros gracilis schutt of varied chemical composition” J. of Experimental Marine.
Biology and Ecology, vol. 96, pp. 15-26, 1986.
[3] J. C. Merchuk, A. Contreras, F. Garcia, and E. Molina. “Studies of mixing in a concentric tube
airlift bioreactor with different spargers”, Chemical Engineering J., vol. 53, pp. 709-719, 1998.
[4] S. Krichnavaruk, W. Loataweesup, S. Powtongsook, and P. Pavasant, “Optimal growth
conditions and the cultivation of Chaetoceros calcitrans in airlift photobioreactor”, Chemical
Engineering J., vol. 105, pp. 91–98, 2005.
[5] S. Krichnavaruk, S. Powtongsook, and P. Pavasant, “Enhanced productivity of Chaetoceros
calcitrans in airlift photobioreactors”, Bioresource Technology, vol. 98, pp.2123-2130, 2007.
[6] R. R. Guillard, and J. H. Ryther, “Studies of marine planktonic diatoms. I. Cyclotella nana
Hustedt, and Detonula confervacea (Cleve) Gran”, J. of Microbiology, vol. 8, pp. 229–239,
1962.
[7] K. A. Fanning, and M. E. Q. Pilson, “On the spectrophotometric determination of dissolved
silica in natural waters”, Analytical Chemistry, vol. 45, pp. 136-140, 1973.
[8] F. A. J. Armstrong, “Determination of nitrate in water by ultraviolet spectrophotometry”,
Analytical Chemistry, vol. 35, pp. 1292-1294, 1963.
[9] T. D. Fontaine, “Spectrophotometric determination of phosphorus”, Analytical Chemistry, vol.
14, pp. 77-78, 1942.
[10] J. M. Berg, J. L Tymoczko, and L. Stryer, Biochemistry, New York: W.H. Freeman, 2002.
[11] P. J. Harrison, H. L. Conway, R. W. Holmes, and C. O. Davis, “Marine diatoms grown in
chemostats under silicate or ammonium limitation: I. Cellular chemical composition and
steady-state growth kinetics of Skeletonema costatum”, J. of Marine biology, vol. 35, pp. 1432-
1793, 1976.
[12] M. Gavrilescu and R. Z. Tudose, “Modelling of liquid circulation velocity in concentric-tube
airlift reactors”, Chemical Engineering J., vol. 69, pp. 85-91, 1998.
[13] H. L. Tung, C. C. Tu, Y. Y. Chang, and W. T. Wu, “Bubble characteristics and mass transfer in
an airlift reactor with multiple net draft tubes,” J. of Bioprocess and Biosystems Engineering,
vol. 18, pp. 1615-7605, 1998.
[14] Association of Official Analytical Chemist (AOAC), Official methods of analysis of official
analytical chemists international, 16th ed. Arlington: Association of Official Analytical
Chemists, 1995.
[15] M. R. Brown, “The amino acid and sugar composition of 16 species of microalgae used in
mariculture,” J. of Aquaculture, vol. 145, pp. 79-99, 1991.
[16] P. Nakseedee, “External airlift photobioreactor for Chaetoceros calcitrans”, M.Eng. thesis,
Department of Chemical Engineering, Faculty of Engineering, Chulalongkorn University,
Bangkok, Thailand, 2008.
[17] P. Coutteau, “Manual on the production and use of live food for aquaculture,” J. of Micro Algae,
vol. 361, pp. 7-48, 1996.
[18] Z. Y. Li, S. Y. Guo and L. Li, “Bioeffect of selenite on the growth of Spirulina platensis and its
biotransformation,” J. of Bioresource Technology, vol. 89, pp. 171–176, 2003.
[19] E. Hernández and E. J. Olguín, “Biosorption of heavy metals influenced by the chemical
composition of Spirulina sp. (Arthrospira) biomass”, J. of Environmental Technology, vol. 23,
pp. 1369–1377, 2002.