thes e - international nuclear information system (inis)
TRANSCRIPT
ORSAYn° d'ordre :
UNIVERSITE DE PARIS-SU D
CENTRE D'ORSA Y
THES Eprésentée
Pour obteni r
Le 1 .I.TRE w de DOCTEUR E. SCIENCES PHYSIQUES
PAR
Francoise YEROUCHALMI - SOUSSALIN E.we .ew .wwee .ww e ee so e ..eeee wee.eo. . .e eee ..ee e.. . .wee .eaewo .oa
LA TOMOGRAPHIE D'EMISSION : ASPECTS QUANTITATIFS DANS LES ETUDE SSUJET
MÉTABOLIQUES ET PHYSIOPATHOLOGIQUE S
soutenue le 2&... .NQ.Yemb e .. .i9.81.w w devant la Commission d'exame n
MM J OURSAGET
Président
G . C HA RPA K
... .M..
DAV .I.ER v. .
.
Ç.A . ...KLLLERS.HOHN
R . DI PARLA
Ce docutTIent doit être fern s a I êtudiant d i issue de la soutenance .
mow. A`tivt.. akA,c),c-n'''''''
c-XlJCC..
um. c2
ui Y) cut ( ç
/ "),Avr nonce CIOA. e-m-. ("M('a.\ e.\
cr-
^Iv\O w‘ O.W,- K-k:t-
4,z)
c3u,u'.-L.
UNIVERSITE DE PARIS-SUD
CENTRE D'ORSA Y
THES Eprésenté e
Pour obteni r
Le .. .•N . . TRENN. .NN.N MNN de DOCTEUR .N.N..w NES . ..NNNN. .SCI ENCES PHYSIQUE STNNIw•w.wN .w.w.N•
PAR
0~. . ..~• . .NN .N....
LA TOMOGRAPHIE D' EMISSION : ASPECTS QUANTITATIFS DANS LES ETUDE SSUIET
METABOLIQUES ET PHYSIOPATHOLOGIQUES
soutenue le devant la Commission d'exame n
MM J COU RSAG.E Présiden t
G.G . CHARPA K. .. . .... . ... . .... ... . . .. . .... ... . . .. . . .. . ... . ... . .... ... . . .. . . ... .... . ... . ..
M AY. .R
C.R ... .KELLERSflOk (
G E. . . . RQ
R . DI PAOLA
Ce document doit être remis à l ' étudiant à l ' issue de la soutenance .
ORSAYn° d ' ordre :
NAME
: SOUSSALINE-YEROUCHALMI
FIRSTNAME : François e
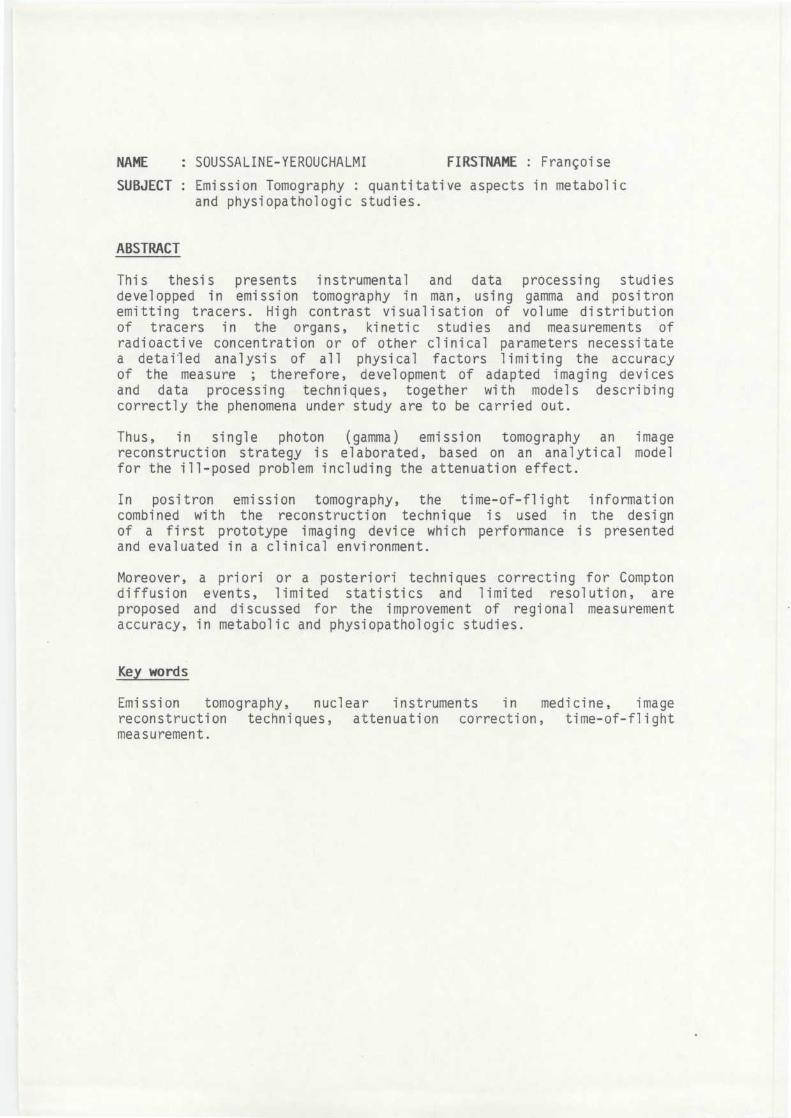
SUBJECT : Emission Tomography : quantitative aspects in metaboli cand physiopathologic studies .
ABSTRACT
This thesis presents instrumental and data processing studie sdevelopped in emission tomography in man, using gamma and positro nemitting tracers . High contrast visualisation of volume distributio nof tracers in the organs, kinetic studies and measurements o fradioactive concentration or of other clinical parameters necessitat ea detailed analysis of all physical factors limiting the accurac yof the measure ; therefore, development of adapted imaging device sand data processing techniques, together with models describin gcorrectly the phenomena under study are to be carried out .
Thus, in single photon (gamma) emission tomography an imag ereconstruction strategy is elaborated, based on an analytical mode lfor the ill-posed problem including the attenuation effect .
In positron emission tomography, the time-of-flight informatio ncombined with the reconstruction technique is used in the desig nof a first prototype imaging device which performance is presente dand evaluated in a clinical environment .
Moreover, a priori or a posteriori techniques correcting for Compto ndiffusion events, limited statistics and limited resolution, ar eproposed and discussed for the improvement of regional measuremen taccuracy, in metabolic and physiopathologic studies .
Key words
Emission
tomography,
nuclear
instruments
in
medicine,
imagereconstruction
techniques,
attenuation
correction,
time-of-fligh tmeasurement .

A mes parents,
Je tiens à exprimer ma reconnaissance à
Monsieur J . COURSAGET, Professeur de Biophysique à
l'Université de Médecine de Paris, Directeur d u
Département de Biologie du CEA sans le soutien duque l
ces études et la rédaction de ces résultats n'auraien t
pu aboutir . Je lui sais gré de l'esprit de méthode qu'i l
a toujours apporté dans la direction de ses élèves e t
de ses encouragements . Je le remercie pour l'honneu r
qu'il me fait en acceptant la présidence du Jury .
Je remercie vivement Monsieur G . CHARPAK ,
Professeur associé à l'Université de Paris-Sud, Directeu r
de Recherches au CERN, qui, malgré l'aspect margina l
de mes études par rapport à ses travaux de physicien ,
m'a toujours communiqué, tout au long de ces années ,
son enthousiasme, sa confiance et ses avis éclairé s
sur l'instrumentation en imagerie de positons .
Je remercie également Monsieur M . DAVIER ,
Professeur à l'Université de Paris-Sud pour l'intérê t
qu'il a porté à mes résultats en tomographie d'émissio n
de positons . Je lui suis reconnaissante d'avoir accepté ,
malgré ses nombreuses occupations, d'être membre d u
jury .
J'exprime ma profonde gratitude à Monsieur
C . KELLERSHOHN, Professeur de Biophysique à l'Universit é
de Médecine de Paris, qui m'a accueillie dans so n
laboratoire et m'a constamment guidée et soutenue dan s
mes recherches . Tout en me laissant une large initiative ,
il m'a fait bénéficier de sa science et de ses conseil s
dans une atmosphère de discussions fructueuses et d e
bienveillant dynamisme qui me laisse de ces hui t
passées auprès de lui un souvenir très précieux .
annees
Je tiens à exprimer mes très sincère s
remerciements à Monsieur R . DI PAOLA, Maître de Recherche s
à l'INSERM, Responsable du Groupe d'Informatique Médical e
du Service des Isotopes de l'IGR, qui m'a initiée a u
traitement numérique d'image et m'a, depuis, servi d e
modèle pour sa compétence unique, la précision de so n
jugement, son ouverture d'esprit et les rapport humain s
de qualité qu'il sait établir avec ses collaborateurs ,
collègues et amis .
Je remercie plus particulièrement Monsieu r
G . LE COQ, Chef- de Division de Mathématiques Appliquée s
au Centre d'Etudes et de Recherches de l'EDF, pou r
l'enthousiasme et l'amitié qu'il m'a toujours démontré s
grâce auxquels les concepts mathématiques, les réalité s
physiques et leur modélisation ont été éclairé s
différemment .
Enfin, je remercie les membres du Servic e
le concours qu'ils ont apporté à ce travail, soit pour
la réalisation, soit pour la publication .
TABLE DES MATIERES
CHAPITRE 1 - INTRODUCTIONVISUALISATION ET MESURE REGIONALES EN TROIS DIMENSIONS DEDISTRIBUTIONS RADIOACTIVES
1 .1 . CONTEXTE
1 .1 .1 . DONNEES INSTRUMENTALES ET NUMERIQUE S
1 .1 .2 . DONNEES MEDICALE S
1 .2 . BUT DE LA THES E
CHAPITRE 2 - MODELISATION DE LA DETECTION ET TRAITEMENT DU SIGNAL EN VUE DELA MESURE D ' UNE DISTRIBUTION RADIOACTIV E
2 .1 . QU'EST-CE QUE LA DONNEE ?
2 .2 . RADIONUCLEIDES UTILISES EN DIAGNOSTIC MEDICA L
2 .3 . DETECTEURS SENSIBLES A LA POSITION UTILISEES EN MEDECIN ENUCLEAIRE
2 .3 .1 . CHOIX DU SYSTEME DE DETECTION ADAPTE A UN PROBLEMECLINIQUE DONN E
2 .3 .2 . LES CAMERAS A SCINTILLATIONS2 .3 .3 . LIMITES DES METHODES CLASSIQUES D ' IMAGERI E
2 .4 . CARACTERISATION D ' UN INSTRUMENT EN SCINTIGRAPHI E
2 .4 .1 . LA FONCTION DE REPONSE DU SYSTEME2 .4 .2 . SPECIFICATIONS - CONTROLE DE QUA LITE
2 .5 . PROPRIETES STATISTIQUES D ' UNE DISTRIBUTION RADIOACTIV E
2 .6 . ACQUISITION, TRAITEMENT EN LIGNE ET VISUALISATION
CHAPITRE 3 - RECONSTRUCTION DES DONNEES EN TOMOGRAPHIE D'EMISSION
3 .1 . INTRODUCTION
3 .2 . CONCEPTS DE BASE ET POSITION DU PROBLEM E
3 .2 .1 . INTRODUCTION
3 .2 .2 . ASPECTS PHYSIQUES DE LA MODELISATIO N
3 .2 .3 . FORMULATION MATHEMATIQUE - LA TRANSFORMEE DE RADONATTENUEE
3 .3 . DEFINITION DES OPERATEURS TOMOGRAPHIQUE S
3 .4 . METHODES NUMERIQUES D'OBTENTION DE LA SOLUTION
3 .4 .1 . TECHNIQUES DE CONVOLUTIO N
3 .4 .2 . TECHNIQUES D'OPERATEURS INVERSES DE LA TRANSFORME E
ATTENUEE DE RADO N
3 .4 .3 . TECHNIQUES ITERATIVE S
3 .4 .4 . LA METHODE ITERATIVE REGULARISANTE (MIR )
CHAPITRE 4 - LA METHODE ITERATIVE REGULARISANTE (MIR) ; PROCEDURE DE MIS EEN OEUVRE ; RESULTATS
4 .1 . PROCEDURE NUMERIQUE DE RECONSTRUCTION
4 .2 . ETALONNAGE ET PRE-TRAITEMENT DES DONNEES DE PROJECTIO N
4 .3 . MATERIEL ET METHODE
4 .4 . RESULTATS DES ETUDES PHYSIQUES ET CLINIQUE S
CHAPITRE 5 - FACTEURS PHYSIQUES LIMITANT LA QUANTIFICATION EN TOMOGRAPHI ED'EMISSION
5 .1 . FACTEURS LIES A L'ACQUISITION DES DONNEES
5 .1 .1 . REPONSE NON-UNIFORME DANS LE PLAN DE DETECTION
5 .1 .2 . EFFETS DE L ' ECHANTILLONNAGE SPATIAL ET ANGULAIRE5 .1 .3 . REPONSE DU DETECTEUR NON-UNIFORME EN FONCTION DE SA
POSITION ANGULAIRE PAR RAPPORT A L ' OBJET5 .1 .4 . EFFET DE LA RESOLUTION LIMITEE5 .1 .5 . DIFFUSION PAR EFFET COMPTON5 .1 .6 . ATTENUATIO N
5 .2 . FACTEURS LIES A LA STATISTIQUE LIMITEE
CHAPITRE 6 - INSTRUMENTATION ET PRINCIPES DE DETECTION EN TOMOGRAPHI ED'EMISSION
6 .1 . CLASSIFICATIO N
6 .2 . TOMOGRAPHES D ' EMISSION GAMMA
6 .2 .1 . DESCRIPTION DES INSTRUMENTS DE DETECTIO N6 .2 .2 . PARAMETRES CARACTERISTIQUES DES TOMOGRAPHES D ' EMISSION
GAMMA
6 .3 . TOMOGRAPHES D ' EMISSION DE POSITON S
6 .3 .1 . PRINCIPES PHYSIQUES ET GEOMETRIE DES TOMOGRAPHE SD'EMISSION DE POSITON S
6 .3 .2 . ETUDE ET DEVELOPPEMENT D ' UN PREMIER SYSTEME DE TOMOGRAPHI E
D'EMISSION DE POSITON S
6 .3 .3 . AMELIORATION DES PERFORMANCES DES TOMOGRAPHES D ' EMISSIONDE POSITON S
6 .4 . DISCUSSION SUR L'UTILISATION DES DEUX TYPES D'INSTRUMENTS
TOMOGRAPHIQUES
CHAPITRE 7 - DEVELOPPEMENT ET CARACTERISATION D'UN SYSTEME DE TOMOGRAPHI E
D'EM 5SION DE POSITONS A TEMPS DE VO L
7 .1 . MESURE DU TEMPS DE VO L
7 .2 . REALISATION D ' UN TOMOGRAPHE POSITONS A TEMPS DE VOL (TTV 01 )
7 .3 . PARAMETRES CARACTERISTIQUES DU TOMOGRAPHE TTV O 1
CHAPITRE 8 - LISTE DES PUBLICATIONS AYANT SERVI DE BASE A CETTE THESE
1
INTRODUCTIONVISUALISATION ET MESURE REGIONALES EN TROI SDIMENSIONS DE DISTRIBUTIONS RADIOACTIVE S
1 .1 . CONTEXTE
Depuis le début de l ' utilisation des radiotraceurs en médecine, et
la visualisation de leur distribution dans l ' organisme, on a cherch é
des moyens d'accès à la troisième dimension de l'espace, pour rendr e
la représentation plus réaliste, et surtout pour obtenir des mesure s
plus précises, dans des éléments de volume de dimensions comparable s
à celles des structures intéressant le clinicien : cérébrales, cardiaques ,
hépatiques, rénales et pulmonaires .
1 .1 .1 . DONNEES INSTRUMENTALES ET NUMERIQUE S
Les problèmes majeurs qui se posent dans l'obtention de donnée s
quantitatives,dans des volumes élémentaires,sont dus à l'activit é
présente dans les régions immédiatement voisines de celle considérée ,
et aux phénomènes physiques liés à la diffusion inélastiqu e
et à l'absorption totale des photons dans l'organisme avan t
de le traverser . En effet, le terme " quantification " , dan s
ce contexte, signifie la mesure de l ' activité dans une région ,
qui peut être exprimée en MBq .l -1 , ou d ' un paramètre comm e
le volume, le débit sanguin, l ' extraction métabolique, etc ., exprimé
en valeur absolue .
Deux grandes catégories de méthodes et leurs instruments approprié s
sont développées et utilisées à ces fins :la tomographie d ' émission
gamma (TEG),et la tomographie d ' émission de positons (TEP) .
Des progrès considérables ont été réalisés dans l'instrumentatio n
mise en oeuvre dans chacune de ces catégories, soutenus, d'un e
part, par une très grande motivation d'équipes multidisciplinaire s
d'ingénieurs, de physiciens, de médecins, de chimistes, d e
CHAPITRE 1 -
2
mathématiciens, de techniciens, d ' autre part par l ' essor formidabl e
des technologies de la détection et des électroniques analogiqu e
et numérique .
Des transferts
de
technologie
et
de
traitement numérique
d'images
profitables,
dans
les
deux
sens,
entre
les deux catégories de méthodes . Cependant, les effets de s
facteurs limitant la précision des mesures, ou la qualité de s
images, subsistent partiellement et leur analyse approfondi e
seule permet de faire progresser les moyens techniques (i nstrumen -
tal es ou numériques)de les réduire . Ces facteurs concernen t
la propagation des erreurs statistiques, la fonction de répons e
du système de détection, l'atténuation, l'effet de la résolutio n
sur le contraste, et l'algorithme de formation des images .
L'influence de chacun de ces effets limitant la précisio n
doit être prise en compte et traitée séquentiellement .
1 .1 .2 . DONNÉESMEDICALES
Bien que la TEG ait été utilisée pendant quelques (dizaine) d'année s
avec des radiopharmaceutiques dont on peut disposer en routin e
dans tout département de médecine nucléaire, on peut pense r
que l'absence de radiotraceurs capables de fournir des information s
métaboliques quantifiables a quelque peu retardé le développemen t
de cette méthodologie, surtout si l'on compare à ce qui s'es t
passé parallèlement en tomographie de transmission . Cependant ,
la TEG a
permis
d ' obtenir
des
résultats
clinique s
particulièrement intéressants avec une bonne augmentation d u
contraste et de la sensibilité de la méthode, notamment dan s
les études fonctionnelles régi onal es, cérébral es et cardiaque s
(Coleman et coll ., 1982 ; Raynaud et coll ., 1983) . Des radiopharma-
ceutiques (I123) traversant librement la barrière hémato-encéphali-
que sont maintenant disponibles, et permettent d ' accéder à
la mesure du débit sanguin régional et d ' index fonctionnels
3
cérébraux (buainger, 1981 ; Kuhl et coll ., 1982) . Cependant ,
des développements et des progrès importants restent à fair e
pour répondre aux questions posées dans le contexte de la quantificatio n
en valeur absolue, telles ,
dans le cas du cerveau, par exemple :
quelles sont les valeurs du débit sanguin, du volume sanguin ,
et de l'utilisation de l'oxygène du cerveau normal et anormal ?
Comment varient le métabolisme du glucose et la distributio n
des récepteurs dopaminergiques avec l'âge ou chez des malade s
porteurs de pathologies neurologiques variées ?
Du fait de la résolution limitée des gamma caméras en rotation ,
à la distance usuellement utilisée, et de la statistique médiocr e
que l'on peut obtenir avec les radiopharmaceutiques existant (Tl 201) ,
les études cardiaques en tomographie d ' émission gamma ont été ,
pendant les premières années d'utilisation de cette technique ,
considérées comme relativement décevantes . Cependant, même si elle s
sont délicates en terme d'interprétation diagnostique, elles on t
apporté des informations appréciables dans l'identification local e
de la sévérité des maladies coronariennes, et dans les mesures de s
volumes cavitaires et de la fraction d ' éjection (Tamaki et coll ., 1981 ;
Philippe et coll ., 1981 ; Kirsch et coll ., 1983) .
Avec le développement de nouveaux traceurs se fixant dans le myocard e
(Van der Wall et coll ., 1980 ; Deutsch et coll ., 1981), il y a
un regain d'intérêt pour les études cardiaques en TEG, avec un
accent particulier sur le besoin de disposer de systèmes de détectio n
dont la résolution spatiale soit meilleure que 15 mm et la sensibilit é
permette des acquisitions inférieures à 30 minutes .
La situation est totalement distincte en tomographie d'émissio n
de positons, où depuis l ' origine de la mise en oeuvre de cette
méthode, des études du myocarde et du pool sanguin ont apport é
des informations uniques sur le métabolisme des acides gras, d u
glucose, le débit sanguin et la distribution des sites récepteur s
spécifiques (Shelbert et coll ., 1979 ; Syrota et coll ., 1984) .
4
Actuellement, la TEP est une méthode de mesure non-invasiv e
de l'évolution, à chaque instant, de la concentration en radiophar-
maceutiques dans le sang et dans des régions bien définie s
du cerveau et du myocarde . La fonction d'entrée dans un te l
modèle, pour être mesurée, nécessite des prélèvements en san g
artériel avec une résolution temporelle de l'ordre de quelque s
secondes (Phelps et coll ., 1979 ; Baron et coll ., 1982, 1984 ;
Bustany
et
coll ., 1983 ;
Frackowiak
et
coll . ,
1980, 1981 ; Shelbert et coll ., 1979 ; Huang et coll . 1980) .
Les progrès des études quantitatives en tomographie d'émissio n
sont issus d'une séquence de phases : reconnaissanc e
des problèmes, instrumentation et traitement numérique, modélisatio n
des phénomènes physiologiques et métaboliques, protocoles mi s
en oeuvre pour la mesure des paramètres d'intérêt .
1 .2 . BUT DE LA THES E
Ce travail regroupe et classe les études bibliographiques,physiques ,
instrumentales et mathématiques que nous avons conduites sur un e
période d'environ sept années pour analyser et développer deux de s
outils essentiels en tomographie d'émission : - l'instrumentation ,
qui permet d'obtenir des données directement multidimensionnelles ,sans distorsions dues à la détection physique ou à l'acquisition numérique ;ceci nécessite un échantillonnage correct dans l'espace (X, Y), dan s
le temps (t) et en énergie (Z) .
- les méthodes de formation des images,et leur analyse,qui permetten tl ' obtention des données sous-jacentes par utilisation d ' un modèl edécrivant mathématiquement le phénomène d ' intérêt, sans aplifier le bruit .

5
Ainsi, une stratégie de la reconstruction d'image est élaborée aprè s
avoir analysé, et inclu dans la méthode numérique, les phénomènes
physiques mis en jeu . Des méthodes de correction de ces principaux
phénomènes physiques sont développées et proposées . Le choix de l'instru-
ment permettant la réalisation des études tomographiques est fonctio n
de la résolution spatiale et temporelle et de la sensibilité requise s
pour répondre aux questions du clinicien dans chaque situation individuelle .
6
CHAPITRE 1 - REFERENCES
BARON J .C ., LEBRUN-GRANDIE P ., COLLARD P . Non-invasive measuremen t
of blood flow, oxygen consumption and glucose utilization in the sam e
brain regions in man by positron emission tomography . J . Nucl . Med . ,
23, 391-399 (1982) .
BARON J .C ., ROUGEMONT D ., SOUSSALINE F ., BUSTANY P ., CROUZEL C ., BOUSSE R
M .G ., COMAR D . The local interrelationships of cerebral oxygen
consumption and glucose utilization in normals and in ischemic strok e
patients : A positron tomography study . J . of Cerebral Blood Flow and
Metabolism, 4, 140-149 (1984) .
BUDINGER T .F . Revival of clinical nuclear medicine brain imaging . J .
Nucl . Med ., 22, 1094-1097 (1981) .
BUSTANY P ., HENRY J . F . , SOUSSALINE F ., COMAR D . Brain protein synthesi s
in normal and demented patients . A study by positron emission tomograph y
with 11 C-L-Methionine, in Functional Radionuclide Imaging of the Brain ,
P . Magistretti, eds, Raven Press, New York, 319-326 (1983) .
COLEMAN R .E ., DRAYER B .P ., JASCZAK R .J . Studying regional
brai n
function : A challenge for SPECT . J . Nucl . Med ., 23, 3, 266-270 (1982) .
DEUTSCH E ., BUSHONG W ., GLAVAN K .A ., ELDEL R .C ., SODD V .J ., SCHOL Z
K .L ., FORTMAN D .L ., LUKES S .J . Heart imaging with cationic comple x
of technetium . Science, 214, 85-86 (1981) .
FRACKOWIAK R .S .J ., LENZI G .L ., JONES T ., HEATHER J .D . Quantitativ e
measurement of cerebral blood flow and oxygen metabolism in man usin g
150 and positron emission tomography : theory, procedure and norma l
values . J . Comp . Ass . Tomogr ., 4, 727-736 (1980) .
FRACKOWIAK R ., POZILLI C ., LEGG N ., DUBOULAY G ., MARSHALL J ., LENZ I
G .L ., JONES T . Regional cerebral oxygen supply and utilization i n
dementia . Brain, 104, 753-778 (1981) .
7
HUANG S .C ., PHELPS M .E ., HOFFMAN E .J . Non-invasive determination of
local cerebral metabolic rate of glucose in man . Am . J . Physiol ., 238 ,
69-82 (1980) .
KIRSCH C . M . Detection of severe coronary heart disease with T1-20 1
Comparison of resting single-photon emission tomography with invasiv e
arteriography . J . Nucl . Med ., 24, 761-767 (1983) .
KUHL D .E ., BARRIO J .R ., HUANG S .C . et al . Quantifying local cerebra l
blood flow by N-isopropyl-p-1 123 11 iodoamphetamine (IMP) tomography .f
J . Nucl . Med ., 23, 196-203 (1982) .
PHELPS M .E ., HUANG S .C ., HOFFMAN E .J . Tomographic measurement of loca l
cerebral glucose metabolic rate in humans with (F18) 2-fluoro-3-deoxy-
D-glucose, validation of method . Ann . Neurol ., 6, 371-388 (1979) .
PHILIPPE L ., ITTI R . Preliminary results with dynamic gamma tomograph y
of cardiac cavities . C . R . Acad . Sc ., Paris, 292, 673-676 (1981) .
RAYNAUD C ., RANCUREL G ., KIEFFER E ., SOUSSALINE F ., RICARD S ., ASKIENAZ Y
S ., MORETTI J .L ., BOURDOISEAU M ., RAPIN J . The usefulness of brai n
SPECT with 123-I-LAMP and HIPDM, in International Symposium on Cerebra l
Blood Flow and Metabolism, Heidelberg, Sept . 1983 .
SCHELBERT H .R ., PHELPS M .E ., HOFFMAN E .J ., HUANG S .C ., SELIN C .E ., KUH L
D .E . Regional myocardial perfusion assessed by N-13 labeled ammonia and
positron emission computerized axial tomography . Am . J . Cardiol ., 43, 208-
218 (1979) .
SYROTA A ., PAILLOTIN G ., DAVY J .M . and AUMONT M .C . Kinetics of in viv o
binding of antagonist to muscarinic cholinergic receptor in the huma n
heart studied by positron emission tomography . Life Sciences, Vol .
35, 937-945 (1984) .
TAMAKI N . Clinical evaluation of Thallium-201 emission myocardia l
tomography using a rotating gamma camera : comparison with seven-pinhol e
tomography . J . Nucl . Med . 22, 849-855 (1981) .

8
DANDER WALL E .E ., HEIDENDAL G .A ., DEN HOLLANDER W ., WESTERA G ., ROOS
J .P . I-123 labeled hexadecenoic acid in comparison with thallium-20 1
for myocardial imaging in coronary heart disease . Eur . J . Nucl . Med . ,
5, 401-405 (1980) .
9
MODELISATION DE LA DETECTION ET TRAITEMENT
DU SIGNAL EN VUE DE LA MESURE D ' UN EDISTRIBUTION RADIOACTIV E
2 .1 . ACQUISITION DES DONNEES .QU'ESTCEQUELA DONNEE?
En imagerie médicale nucléaire, les photons émis par les noyau x
radioactifs émetteurs gamma,introduits dans l ' organisme sous
forme traceuse, sont collectés par un détecteur sensible à leu r
émission principale dans la gamme d ' énergie d ' environ 70 à 600
KeV . La distribution de la radioactivité in vivo donne une descrip-
tion fonctionnelle d'un certain organe . Visualiser et mesurer cett e
distribution dans un organe, ou une partie d'organe lésée, est don c
porteur d ' une information fonctionnelle d ' un intérêt clinique irrem-
plaçable . La fonction d ' un organe peut être étudiée par l ' observation
de l'accumulation et de la disparition de la radioactivité dans une
région d ' intérêt, après administration d ' un radiopharmaceutique con-
venablement choisi . La forme de la courbe d ' activité en fonctio n
du temps dans cette région est le reflet du modèle biologique d e
l ' état fonctionnel de l ' organe considéré . Les études dynamique s
procurent des informations sur la mobilité des organes ou de région s
d'organe (ex :myocarde)d'autant plus précises que les mesures, échantil-
lonnées à intervalles de temps constant ou volontairement variables ,
sont synchonisées au dit mouvement (électrocardiogramme) . Les résultat s
sont représentés soit sous forme de courbes fonctions du temps, soit sou s
forme
de séquence d ' images sur un système de visualisation vidéo .
Ainsi, la donnée est le signal issu de la conversion scintillation -
impulsion produit dans un détecteur, après q u ' un photon gamma inciden t
y a déposé son énergie . Ce photon gamma est lui-même produit pa r
la désintégration des noyaux radioactifs considérés, laquelle obéi t
à une loi de Poisson .
CHAPITRE 2 -
Actuellement, ce signal est numérique, la conversion analogique-digital e
étant faite soit au niveau des circuits électroniques d'acquisition ,
soit a posteriori par interfaçage entre le détecteur et un systèm e
de traitement numérique . On peut trouver une bonne description d u
traitement du signal analogique et/ou numérique actuellement développ é
pour un type de détecteur très répandu en imagerie nucléaire, l a
caméra à scintillations, dans les articles de Muehllehner, 1981 ,
1982 .
2 .2 . RADIONUCLEIDESUTILISESEN DIAGNOSTIC MEDICA L
En médecine, l'usage d'un isotope est conditionné par plusieurs fac -
teurs . Le premier est l'évaluation des dommages biologiques créé s
par les différents types de désintégration subis par l'élémen t
considéré . Le deuxième facteur est la capacité de l'isotope à êtr e
inclus dans une molécule d'intérêt biologique, sans affecter, pa r
sa présence, le processus naturel de celle-ci . Enfin, une troisièm e
considération concerne la capacité de détection des rayonnement s
émis . Leur énergie doit pouvoir être absorbée dans un détecteur, e t
leur période radioactive doit être grande devant les temps caractéristique s
des processus biologiques que l'on veut étudier .
Les isotopes radioactifs que l'on utilise le plus fréquemment son t
des émetteurs qui se désintègrent en laissant le noyau dans u n
état excité . Un réarrangement interne s'opère alors avec émissio n
d'un ou plusieurs photons caractéristiques . Les réactions nucléaire s
les plus utilisées pour leur obtention sont du type (n,a), (n,p) ,
(n,a), (d,p) . La majeure partie est produite dans des réacteur s
nucléaires fonctionnant selon le principe de la réaction de fissio n
en chaine autoentretenue . De nombreux isotopes peuvent être produits ,
par ailleurs, à l ' aide de cyclotrons . Ces isotopes, extrêmemen t
intéressants pour les études métaboliques et physiologiques (Soussalin e
et Comar, 1983), car ils correspondent à des éléments simples intervenan t
dans les molécules biologiques (11C , 15C , 13N, 18F),possèdent
une haute activité spécifique, mais ont une période très courte .
Aussi, l ' utilisation de ce type d ' isotopes émetteurs de positon s
ne peut se faire que dans des centres ayant à proximité un cyclotro n
à usage médical .
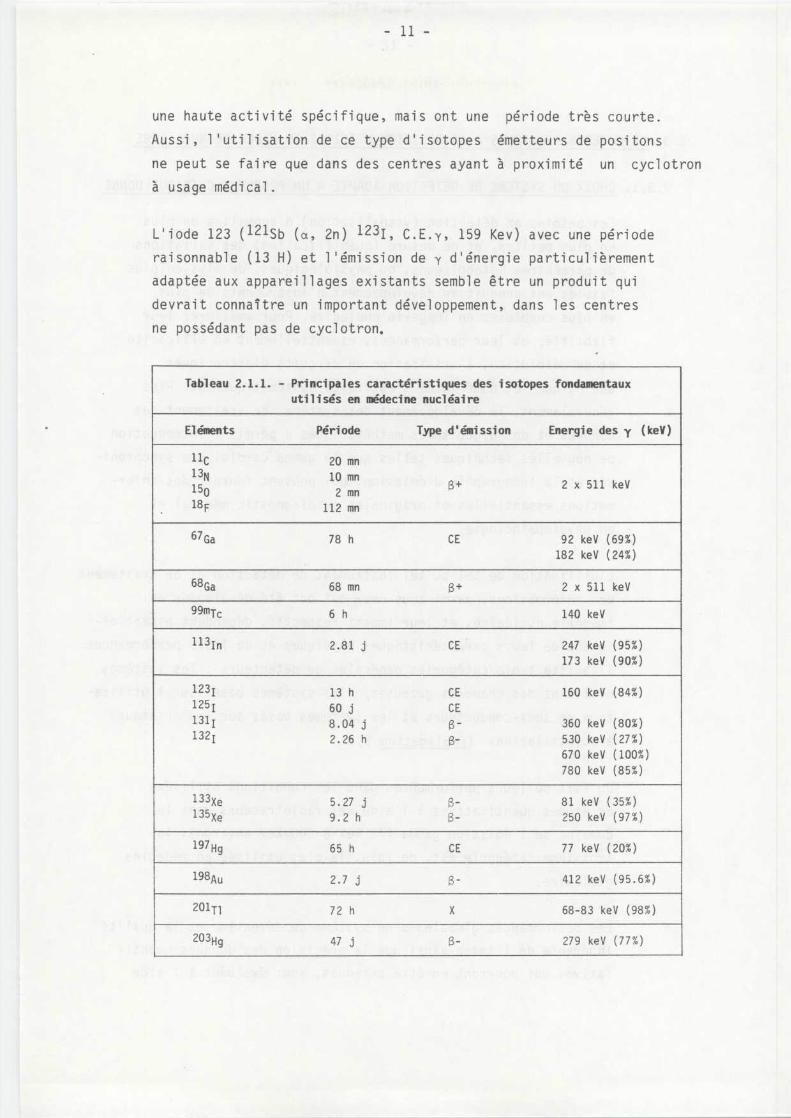
L ' iode 123 ( 121 Sb (a, 2n) 123 1, C .E . 1 , 159 Kev) avec une périod e
raisonnable (13 H) et l'émission de y d'énergie particulièremen t
adaptée aux appareillages existants semble être un produit qu i
devrait connaître un important développement, dans les centre s
ne possédant pas de cyclotron ,
Tableau 2 .1 .1 . - Principales caractéristiques des isotopes fondamentau xutilisés en médecine nucléaire
Eléments Période Type d'émission Energie des y
(keV)
11 C
13 N15018F
20 m n
10 m n
2 m n
112 mn
2 x511 ke V
67 Ga 78 h CE 92 keV (69% )182 keV (24% )
68 Ga 68 mn 2 x 511 ke V
99m Tc 6 h 140 ke V
113 In 2 .81
j CE 247
keV
(95% )173 keV (90% )
123 I125 1131 11321
13 h60 j8 .04 j2 .26 h
C ECE
160 keV (84% )
360 keV (80%)
530 keV (27% )670 keV (100% )
780 keV (85% )
133 X e135 Xe
5 .27
j9 .2
h81
keV (35% )
250 keV (97% )
197 Hg 65 h CE 77
keV (20% )
198Au 2 .7
j 412 keV
(95 .6% )
201 T1 72 h X 68-83 keV
(98% )
203 Hg 47 j $- 279
keV
(77%)
2 .3 . DETECTEURSSENSIBLESA LA POSITION UTILISES EN MEDECINENUCLEAIRE
2 .3 .1 . CHOIXDU SYSTEME DE DETECTIONADAPTEA UNPROBLEMECLINIQUEDONN E
Les besoins en détection (visualisation) d'anomalies de plu s
en plus petites, et de mesure (quantification) des variation s
de paramètres métaboliques, ou physiologiques, de plus en plu s
faibles ont conduit au développement d'instruments de plu s
en plus complexes en imagerie nucléaire . Pour améliorer leu r
fiabilité, et leur performances, essentiellement en efficacit é
et en résolution, l'utilisation de circuits électroniques ,
analogiques et numériques s'est faite systématiquement . Plu s
généralement, le développement des systèmes de traitement de s
données et des algorithmes mathématiques a permis l'introductio n
de nouvelles techniques telles que la gamma cardiologie synchroni -
sée et la tomographie d'émission, qui peuvent fournir des infor-
mations essentielles et originales en diagnostic médical e t
en physiopathologie .
L'utilisation de tel ou tel instrument de détection et de traitemen t
des informations, parmi tous ceux qui ont été développés e n
imagerie nucléaire, et leur impact respectif, dépendent essentiel -
lement de leurs caractéristiques physiques et de leurs performances .
Il existe trois catégories générales de détecteurs : les système s
utilisant des chambres gazeuses, les systèmes basés sur l'utilisa -
tion de semi-conducteurs et les systèmes basés sur les cristau x
à scintillations (Publication I) .
Du fait de leurs performances dans les conditions utilisée s
en études quantitatives à l ' aide des radiotraceurs dans l e
domaine de l'émission gamma (70 keV à 600 keV environ), l a
troisième catégorie est, de loin, la plus utilisée en médecin e
nucléaire .
Les performances globales d ' un système de détection et la qualit é
inhérente de l ' image ainsi que la précision des données quanti-
tatives qui pourront en être obtenues, sont évaluées à l ' aide
des paramètres suivants : la résolution spatiale, la résolutio n
en contraste, et la résolution temporelle . Quatre autres paramètre s
sont également essentiels pour une caractérisation complèt e
et une intercomparaison des systèmes : la résolution en énergie ,
la sensi bi l i té ,l ' uniformité, et la linéarité . Ces paramètre s
ne sont pas indépendants les uns des autres, l ' obtention d ' une
image ou d'une distribution radioactive, dans une situatio n
diagnostique donnée ou devant un certain modèle métaboliqu e
à étudier, réside dans le compromis optimisé de ces paramètres .
Par exemple, une résolution de l'ordre de quelques millimètre s
est souhaitable dans les études cérébrales de paramètres métabo-
liques, tels que la consommation des sucres, où le contraste
est élevé entre les différentes structures voisines, et l'organ e
étudié ne se déplace pas pendant le temps de l ' acquisition
(à condition de maintenir la tête du patient en position correcte) .
Par contre, une telle résolution devient moins importante s i
l'organe étudié se déplace lui-même lors de l'acquisition de
quelques centimètres, comme c'est le cas du coeur, ou du foie ,
à moins que l ' acquisition ne soit synchronisée à ce déplacement ,
par exemple à l'aide de l'électrocardiogramme ou l'amplitude
respiratoire .
La sensibilité du système de détection est également un paramètr e
essentiel, car le temps d ' acquisition minimum pour mesure r
un phénomène dynamique ou obtenir une précision statistiqu e
satisfaisante en dépend .
Les programmes d ' assurance de qualité incluent l ' étude de s
paramètres les plus significatifs dans une situation clinique
donnée, ainsi que la définition et le protocole d ' évaluatio n
de ces paramètres qui doivent être vérifiés à une fréquenc e
déterminée .
2 .3 .2 .LES CAMERAS A SCINTILLATION S
C ' est le système de détection le plus répandu en imageri e
diagnostique . La plupart des caméras à scintillation sont d u
type ANGER (Anger, 1967 ; Hine, 1974) . Au contraire des scintigra-
phes
à balayage rectilinéaire, les caméras à scintillation s
acquièrent simultanément les photons issus d'un volume d'asse z
grande dimension, à l'aide d'un cristal utilisé comme scintilla -
teur, et cylindrique (de 30 à 45 cm de diamètre) . L'épaisseu r
du cristal (Nal activé au Tl) est choisi pour absorber tou s
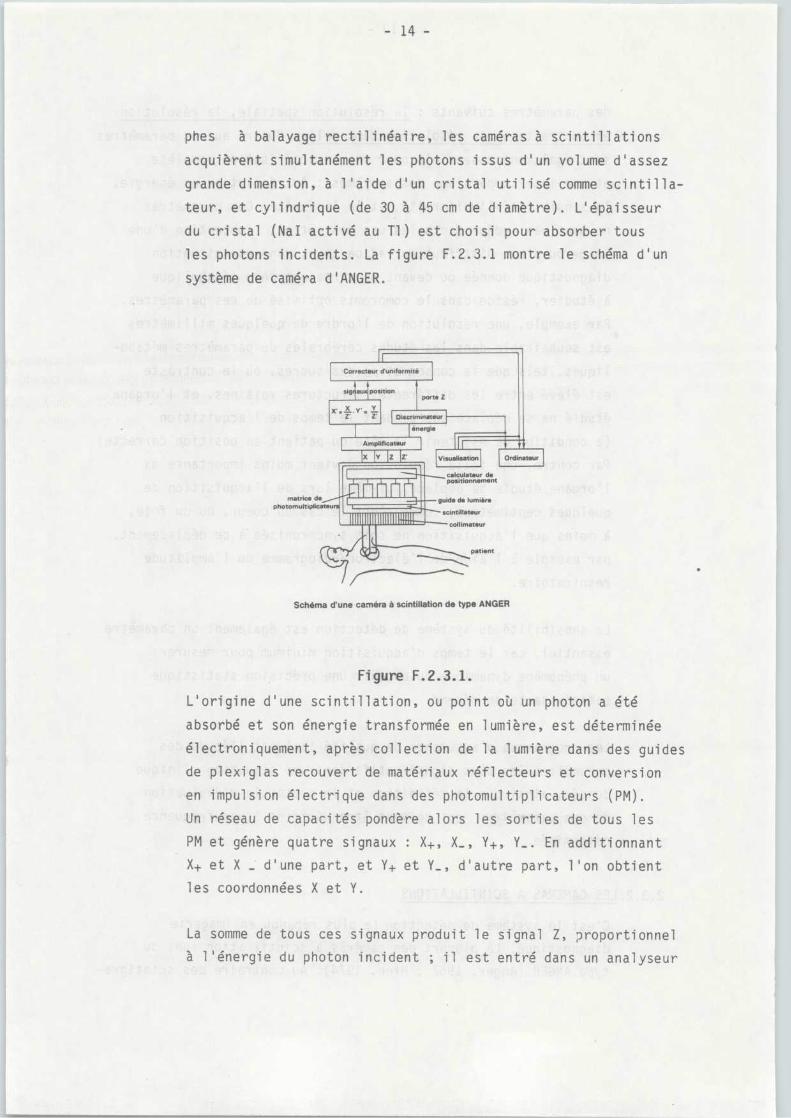
les photons incidents . La figure F .2 .3 .1 montre le schéma d'u n
système de caméra d'ANGER .
Correcteur d'uniformité
X' :X,Y' = YZ'
Z'
porte Z
Discriminateu r
signau position
énergie
Amplificateur
XIYIZIZ' Visualisation Ordinateur
Schéma d' une caméra à scintillation de type ANGE R
Figure F .2 .3 .1 .
L'origine d'une scintillation, ou point où un photon a été
absorbé et son énergie transformée en lumière, est déterminé e
électroniquement, après collection de la lumière dans des guide s
de plexiglas recouvert de matériaux réflecteurs et conversio n
en impulsion électrique dans des photomultiplicateurs (PM) .
Un réseau de capacités pondère alors les sorties de tous le s
PM et génère quatre signaux : X+, X_, Y+, Y_ . En additionnan t
X+ et X _ d ' une part, et Y+ et Y_, d ' autre part, l ' on obtien t
les coordonnées X et Y .
La somme de tous ces signaux produit le signal Z, proportionne l
à l ' énergie du photon incident ; il est entré dans un analyseu r
L
matrice de/ Iphotomultiplicateurs
s calculateur d e
rŚ
r--1 y
positionnemen t
I Ii
guide de lumière
scintillateur
IIIIIIII """` -
collimateu r
patient
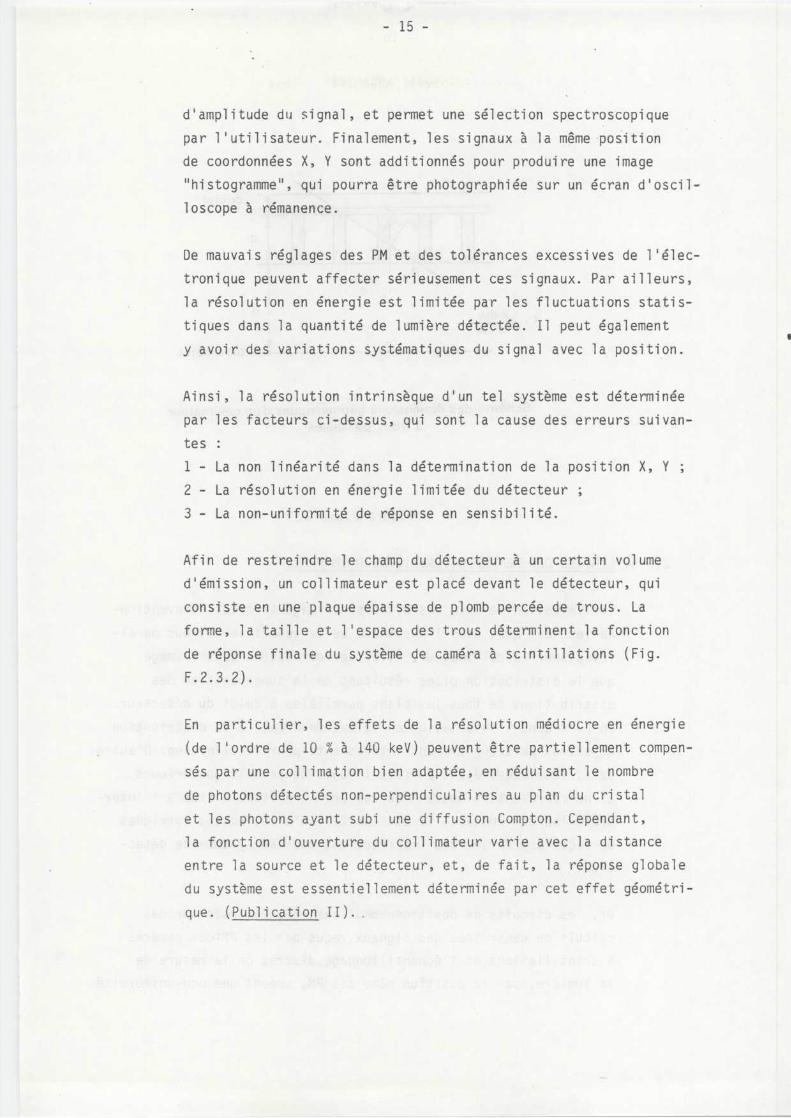
d'amplitude du signal, et permet une sélection spectroscopiqu e
par l'utilisateur . Finalement, les signaux à la même positio n
de coordonnées X, Y sont additionnés pour produire une imag e
"histogramme", qui pourra être photographiée sur un écran d'oscil -
loscope à rémanence .
De mauvais réglages des PM et des tolérances excessives de l'élec -
tronique peuvent affecter sérieusement ces signaux . Par ailleurs ,
la résolution en énergie est limitée par les fluctuations statis-
tiques dans la quantité de lumière détectée . Il peut égalemen t
y avoir des variations systématiques du signal avec la position .
Ainsi, la résolution intrinsèque d'un tel système est déterminé e
par les facteurs ci-dessus, qui sont la cause des erreurs suivan -
te s
1 - La non linéarité dans la détermination de la position X, Y ;
2 - La résolution en énergie limitée du détecteur ;
3 - La non-uniformité de réponse en sensibilité .
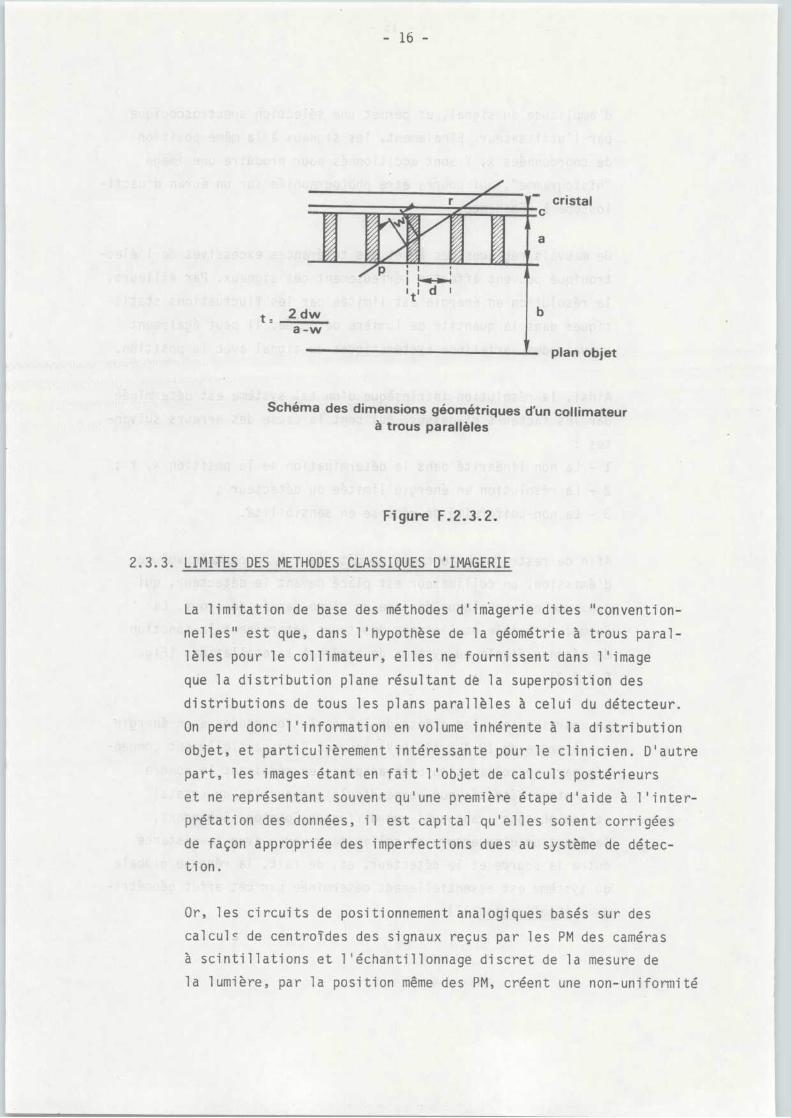
Afin de restreindre le champ du détecteur à un certain volume
d'émission, un collimateur est placé devant le détecteur, qu i
consiste en une plaque épaisse de plomb percée de trous . La
forme, la taille et l'espace des trous déterminent la fonction
de réponse finale du système de caméra à scintillations (Fig .
F .2 .3 .2) .
En particulier, les effets de la résolution médiocre en énergi e
(de l ' ordre de 10 % à 140 keV) peuvent être partiellement compen -
sés par une collimation bien adaptée, en réduisant le nombre
de photons détectés non-perpendiculaires au plan du crista l
et les photons ayant subi une diffusion Compton . Cependant ,
la fonction d ' ouverture du collimateur varie avec la distanc e
entre la source et le détecteur, et, de fait, la réponse global e
du système est essentiellement déterminée par cet effet géométri -
que . (Publication II) .a
crista l
t_ 2dw
ba-w
plan obje t
Schéma des dimensions géométriques d'un collimateu rà trous parallèles
Figure F .2 .3 .2 .
2 .3 .3 . LIMITES DES METHODES CLASSIQUES D'IMAGERI E
La limitation de base des méthodes d'imagerie dites "convention-
nelles" est que, dans l'hypothèse de la géométrie à trous paral-
lèles pour le collimateur, elles ne fournissent dans l'image
que la distribution plane résultant de la superposition de s
distributions de tous les plans parallèles à celui du détecteur .
On perd donc l'information en volume inhérente à la distributio n
objet, et particulièrement intéressante pour le clinicien . D'autre
part, les images étant en fait l'objet de calculs postérieur s
et ne représentant souvent qu'une première étape d'aide à l'inter-
prétation des données, il est capital qu'elles soient corrigée s
de façon appropriée des imperfections dues au système de détec-
tion .
Or, les circuits de positionnement analogiques basés sur de s
calcul e de centroi des des signaux reçus par les PM des caméra s
à scintillations et l'échantillonnage discret de la mesure de
la lumière, par la position même des PM, créent une non-uniformité
de réponse dans le champ d ' un détecteur plan comme la camér a
a scintillations .
Nous avons été parmi les premières équipes internationales à
étudier, de façon approfondie, les causes de cette non-uniformit é
qui sont énoncées dans la publication III, à savoir :
- les variations du spectre, c'est-à-dire de l'amplitude d u
signal énergie, avec la position X, Y ;
- les non-linéarités de réponse, ou distorsions spatiales ;
- l ' accumulation des queues de distribution non gaussiennes .
Il est, en effet, essentiel d'analyser les causes des non-unifor-
mités de réponse d'un système pour mettre en oeuvre des procédure s
adaptées de correction, soit a postériori, soit au niveau d e
l'acquisition, pour permettre les études quantitatives .
La plus ancienne méthode utilisée pour corriger de la non-unifor-
mité est celle utilisant une matrice de coeffficients de correc-
tion, calculés à partir de l'acquisition d'une source homogèn e
étendue d'énergie équivalent à celle de l'étude envisagée . L'image
à corriger est multipliée par la matrice, pixel par pixel, le s
coefficients étant inversement proportionnels à l ' intensit é
en photons acquis dans chaque pixel correspondant avec la source
uniforme (Knoll et col l . , 1982) . Cette méthode revient à un e
normalisation de l'image, et a tendance à "aplatir" les irrégula-
rités, ce qui traite le symptôme mais non la cause des non -
uniformités .
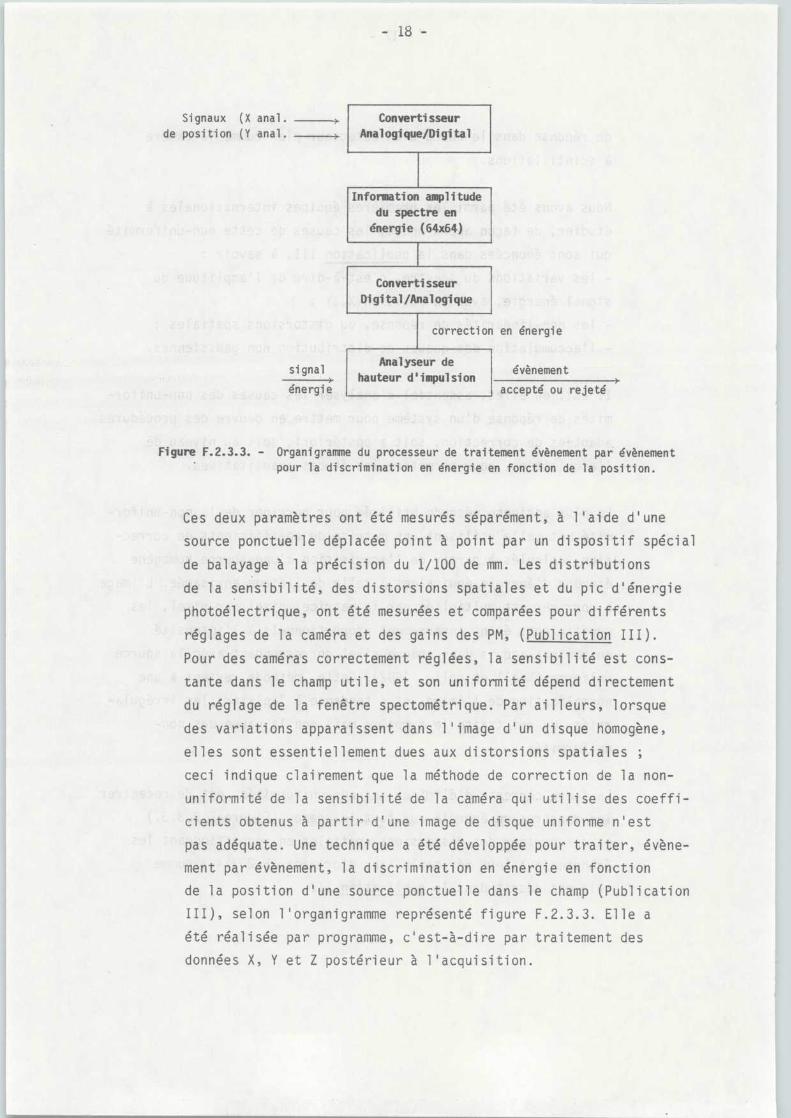
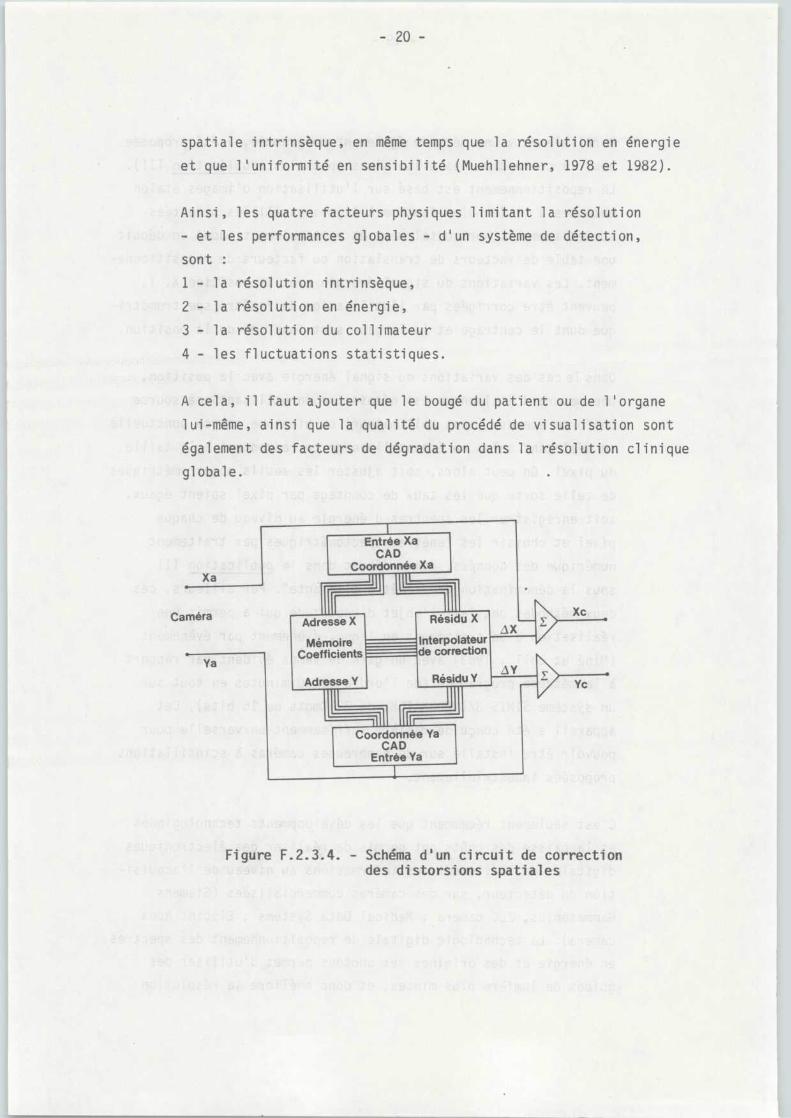
La façon correcte d ' éliminer ces non-uniformités, est de recentre r
les spectres en énergie sur tout le champ, (Figure F .2 .3 .3 . )
et de corriger des distorsions spatiales en repositionnant le s
évènements à leur véritable lieu d ' origine (F .2 .3 .4 .) comme
cela est décrit dans le publication III .
Signaux (X anal . _3 .de position (Y anal .
ConvertisseurAnalogique/Digita l
Information amplitudedu spectre e n
énergie (64x64)
ConvertisseurDigital/Analogique
correction
Analyseur dehauteur d'impulsio n
Figure F .2 .3.3. - organigramme du processeur de traitement évènement par évènemen tpour la discrimination en énergie en fonction de la position .
Ces deux paramètres ont été mesurés séparément, à l'aide d'une
source ponctuelle déplacée point à point par un dispositif spécia l
de balayage à la précision du 1/100 de mm . Les distribution s
de la sensibilité, des distorsions spatiales et du pic d'énergi e
photoélectrique, ont été mesurées et comparées pour différent s
réglages de la caméra et des gains des PM, (Publication III) .
Pour des caméras correctement réglées, la sensibilité est cons-
tante dans le champ utile, et son uniformité dépend directemen t
du réglage de la fenêtre spectométrique . Par ailleurs, lorsque
des variations apparaissent dans l'image d'un disque homogène ,
elles sont essentiellement dues aux distorsions spatiales ;
ceci indique clairement que la méthode de correction de la non -
uniformité de la sensibilité de la caméra qui utilise des coeffi-
cients obtenus à partir d ' une image de disque uniforme n ' est
pas adéquate . Une technique a été développée pour traiter, évène-
ment par évènement, la discrimination en énergie en fonctio n
de la position d ' une source ponctuelle dans le champ (Publicatio n
III), selon l'organigramme représenté figure F .2 .3 .3 . Elle a
été réalisée par programme, c'est-à-dire par traitement de s
données X, Y et Z postérieur à l ' acquisition .
en énergi e
signa l
énergie accepté ou rejeté
évènement
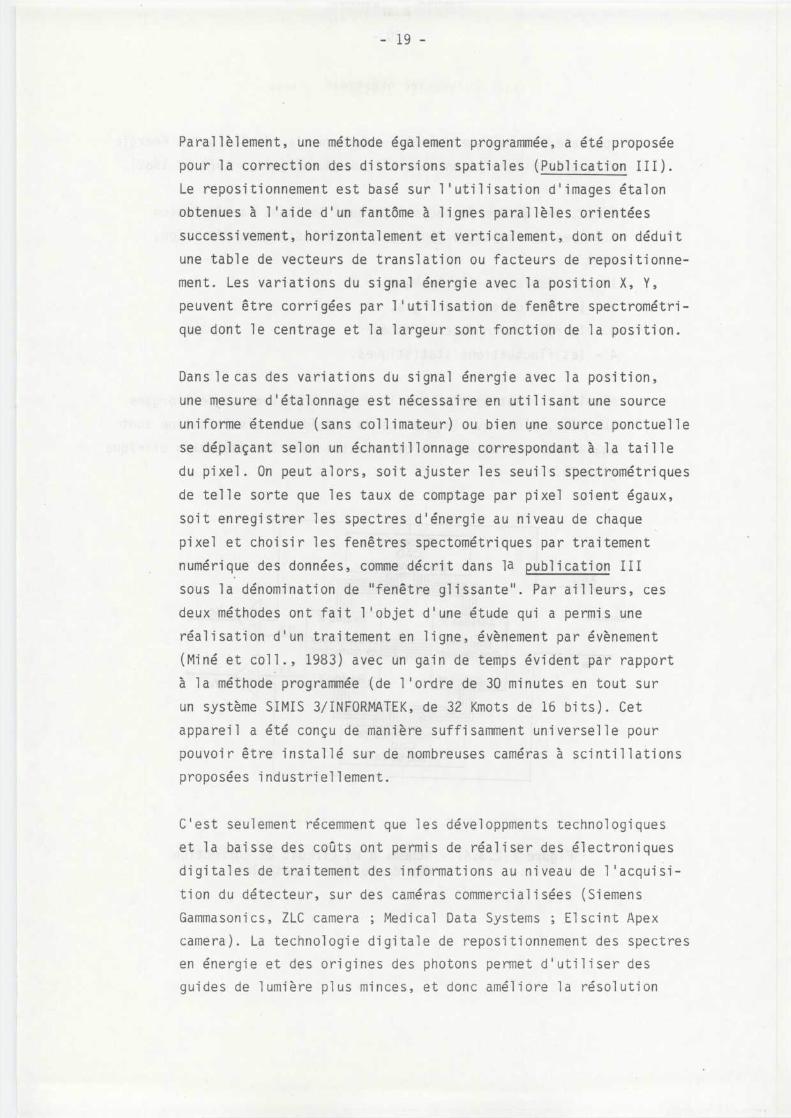
Parallèlement, une méthode également programmée, a été proposée
pour la correction des distorsions spatiales (Publication III) .
Le repositionnement est basé sur l'utilisation d'images étalo n
obtenues à l'aide d'un fantôme à lignes parallèles orientée s
successivement, horizontalement et verticalement, dont on dédui t
une table de vecteurs de translation ou facteurs de repositionne -
ment . Les variations du signal énergie avec la position X, Y ,
peuvent être corrigées par l'utilisation de fenêtre spectrométri -
que dont le centrage et la largeur sont fonction de la position .
Dans le cas des variations du signal énergie avec la position ,
une mesure d'étalonnage est nécessaire en utilisant une source
uniforme étendue (sans collimateur) ou bien une source ponctuell e
se déplaçant selon un échantillonnage correspondant à la taill e
du pixel . On peut alors, soit ajuster les seuils spectrométrique s
de telle sorte que les taux de comptage par pixel soient égaux ,
soit enregistrer les spectres d'énergie au niveau de chaqu e
pixel et choisir les fenêtres spectométriques par traitemen t
numérique des données, comme décrit dans la publication II I
sous la dénomination de "fenêtre glissante" . Par ailleurs, ce s
deux méthodes ont fait l'objet d'une étude qui a permis un e
réalisation d'un traitement en ligne, évènement par évènemen t
(Miné et coll ., 1983) avec un gain de temps évident par rappor t
à la méthode programmée (de l'ordre de 30 minutes en tout su r
un système SIMIS 3/INFORMATEK, de 32 Kmots de 16 bits) . Ce t
appareil a été conçu de manière suffisamment universelle pou r
pouvoir être installé sur de nombreuses caméras à scintillation s
proposées industriellement .
C ' est seulement récemment que les développments technologique s
et la baisse des coûts ont permis de réaliser des électronique s
digitales de traitement des informations au niveau de l ' acquisi-
tion du détecteur, sur des caméras commercialisées (Siemen s
Gammasonics, ZLC camera ; Medical Data Systems ; Elscint Ape x
camera) . La technologie digitale de repositionnement des spectre s
en énergie et des origines des photons permet d ' utiliser de s
guides de lumière plus minces, et donc améliore la résolution
Ya
111111111 1
11Coordonnée Ya
CA DEntrée Ya
1
Yc
spatiale intrinsèque, en même temps que la résolution en énergi e
et que l'uniformité en sensibilité (Muehllehner, 1978 et 1982) .
Ainsi, les quatre facteurs physiques limitant la résolution
- et les performances globales - d'un système de détection ,
sont :
1 - la résolution intrinsèque ,
2 - la résolution en énergie ,
3 - la résolution du collimateu r
4 - les fluctuations statistiques .
A cela, il faut ajouter que le bougé du patient ou de l'organe
lui-même, ainsi que la qualité du procédé de visualisation son t
également des facteurs de dégradation dans la résolution clinique
globale .
iEntrée Xa
CAD CoordonnéeXa
II I I
11111 11111Résidu XCaméra Adresse X
MémoireCoefficients
Adresse Y
AxInterpolateurde correction
Figure F .2 .3 .4 . - Schéma d'un circuit de correctiondes distorsions spatiale s
A YRésidu Y
2 .4 . CARACTERISATIOND ' UNINSTRUMENTENSCINTIGRAPHI E
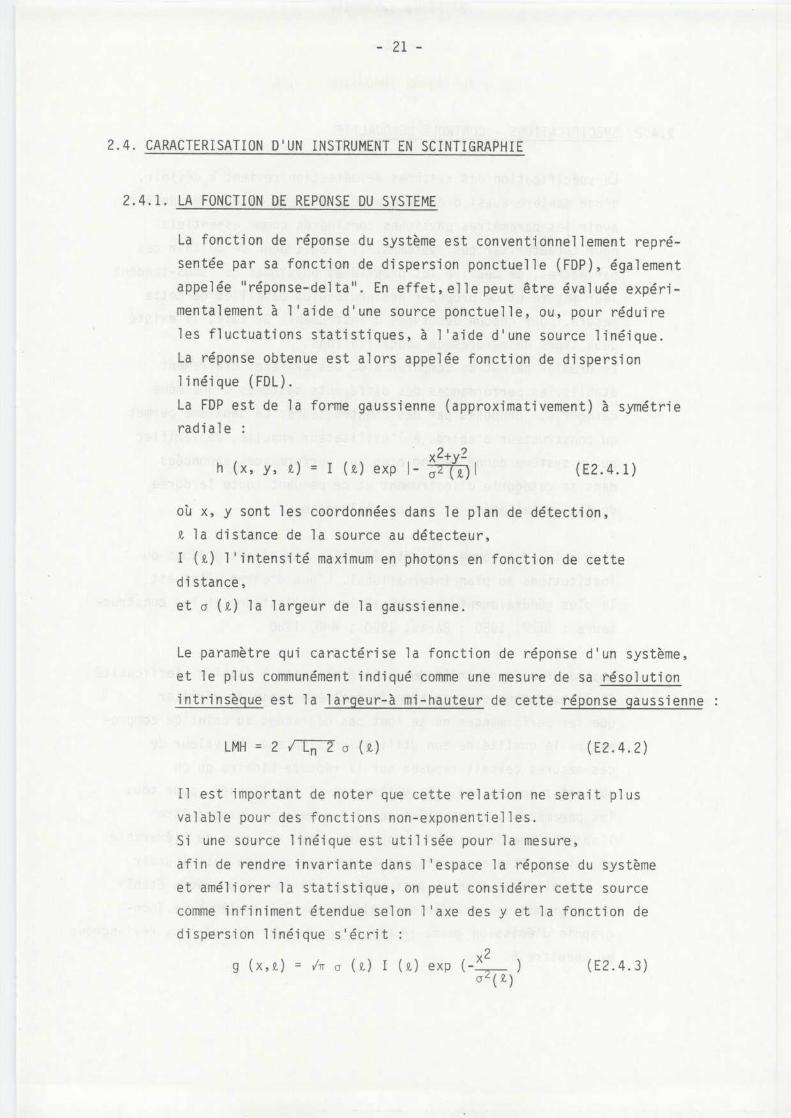
2 .4 .1 . LA FONCTION DEREPONSEDUSYSTEME
La fonction de réponse du système est conventionnellement repré -
sentée par sa fonction de dispersion ponctuelle (FDP), égalemen t
appelée " réponse-delta " . En effet, elle peut être évaluée expéri -
mentalement à l'aide d'une source ponctuelle, ou, pour réduir e
les fluctuations statistiques, à l'aide d'une source linéique .
La réponse obtenue est alors appelée fonction de dispersio n
linéique (FDL) .
La FDP est de la forme gaussienne (approximativement) à symétri e
radiale :
x2+y2(x, y, z) = I ( .) exp I- Qz~W
où x, y sont les coordonnées dans le plan de détection ,
2, la distance de la source au détecteur ,
I (Q) l'intensité maximum en photons en fonction de cett e
distance ,
et a (i) la largeur de la gaussienne .
Le paramètre qui caractérise la fonction de réponse d ' un système ,
et le plus communément indiqué comme une mesure de sa résolution
intrinsèque est la largeur-à mi-hauteur de cette réponse gaussienne :
LMH = 2 1 Ln 2 cs (R)
(E2 .4 .2 )
I l est important de noter que cette relation ne serait plu s
valable pour des fonctions non-exponentielles .
Si une source linéique est utilisée pour la mesure ,
afin de rendre invariante dans l ' espace la réponse du système
et améliorer la statistique, on peut considérer cette sourc e
comme infiniment étendue selon l ' axe des y et la fonction de
dispersion linéique s ' écrit :
g (x,) = 3rr 6 W I (z) exp
62(E2.4 .3 )
(E2 .4 .1)
- 22 -
2 .4 .2 . SPECIFICATIONS - CONTROLE DE QUALIT E
La spécification des systèmes de détection revient à définir ,
d'une manière aussi précise que possible, la valeur que doiven t
avoir les paramètres physiques considérés comme essentiel s
pour caractériser ces systèmes . Il s'agit donc de définir ce s
paramètres, de décrire les propriétés physiques qui sous-tenden t
leur mesure et de proposer des protocoles détaillés de cett e
mesure, pour chacun des types d'instrument . De fait, il existe
deux types de mesures de spécifications .
Le premier permet de comparer, avec des critères clairemen t
établis,les performances des différents systèmes d'une mêm e
catégorie, proposés par des constructeurs . Le deuxième perme t
au constructeur d'abord, à l'utilisateur ensuite, de vérifie r
qu'un système donné répond bien aux performances annoncée s
dans sa catégorie d'instrument et ce pendant toute la duré e
de son installation et de son utilisation .
Pour cela, des normes ont été établies par divers groupes o u
institutions au plan international . L'une d'entre elles es t
la plus généralementacceptée par les utilisateurs et les construc-
teurs : NEMA, 1980 ; Paras, 1980 ; WHO, 1980 .
Les mesures de contrôle de qualité consiste à établir l'efficacit é
de l'instrument sur une base journalière, afin de vérifie r
que ses performances ne se sont pas dégradées au point de compro-
mettre la qualité de son utilisation clinique . La valeur de
ces mesures devrait reposer sur la réponse binaire qu ' on
obtient : oui ou non, le système est-il fonctionnel, pour tou s
les paramètres le caractérisant ? Ces mesures doivent être
l'objet d'une définition rigoureuse, •avec un ordre de hiérarchi e
et doivent être assez simples à réaliser pour ne pas alourdi r
le travail quotidien du personnel technicien . Nous avons établ i
un programme de contrôle de qualité pour les systèmes de Tomo-
graphie d'émission gamma (Publication X), sur lequel nous reviendron s
au chapitre 5 .
4
2 .5 . PROPRIETESSTATISTIQUES D ' UNEDISTRIBUTION RADIOACTIV E
La désintégration radioactive des noyaux d ' un élément particulier es t
caractérisée parle nombre N de ces noyaux restant au temps t, sachan t
qu'au temps zéro, il y en a No :
N (t) = No exp (-xt)
(E2 .5 .1 )
où x est la constante radioactive donnée par l'équation différentielle :
d N (t) = - xN (t)
(E2 .5 .2 )d t
Cette loi exponentielle est seulement valable si le nombre d'atome s
No est suffisamment grand et les intervalles de temps petits .
Les propriétés statistiques du processus de décroissance peuven t
être décrites par une fonction densité de probabilité .
La probabilité de désintégration pendant l'intervalle de temps A t
est :
p = xot
(E2 .5 .3 )
et la probabilité pour que l ' atome ne se désintègre pas est :
q = 1-p = 1-xot
(E2 .5 .4 )
x est donc la probabilité de désintégration d'un atome radioacti f
par unité de temps .
Après un temps t (n intervalles t), la probabilité sera :
q = (1 - xot) n = (1 - X . n) n
(E2 .5 .5 )
qui, pour n tendant vers l ' infini, devient :
q = exp (-xt) et p = 1 - exp (-xt)
(E2 .5 .6 )
Le comportement statistique du processus de désintégration peut
être décrit par la fonction densité de probabilité binomiale :
NP (N) = (No) pN q No - N (E2 .5 .7)
- 24 -
qui, pour de grandes valeurs de No et des petits xt peut être approximée
par la probabilité de Poisson . :
P (N) =
N exp ( - Il)
(E2 .5 .8 )
où
N« No
u = Nowt est une valeur fixée
Pour un très grand nombre de noyaux No, on peut encore exprime r
la fonction E2 .5 .8 sous la forme d'une fonction densité de probabilit é
de variance égale à sa valeur moyenne :
1
(P-N ) 2P (N)
exp (
( E2 .5 .9 )202
où6 2
La demi-vie d'un radioélément est définie par le temps au bout duque l
le nombre de noyaux radioactifs sera résuit de moiti é
A l/2Ln
A(E2 .5 .10 )
L'activité d'une source est proportionnelle au nombre total de photon s
émis et est régie par une loi exponentielle .
On l'exprime en becquerel (Bq), 1 (Curie) Ci : 3,7 .10 10 Bq .
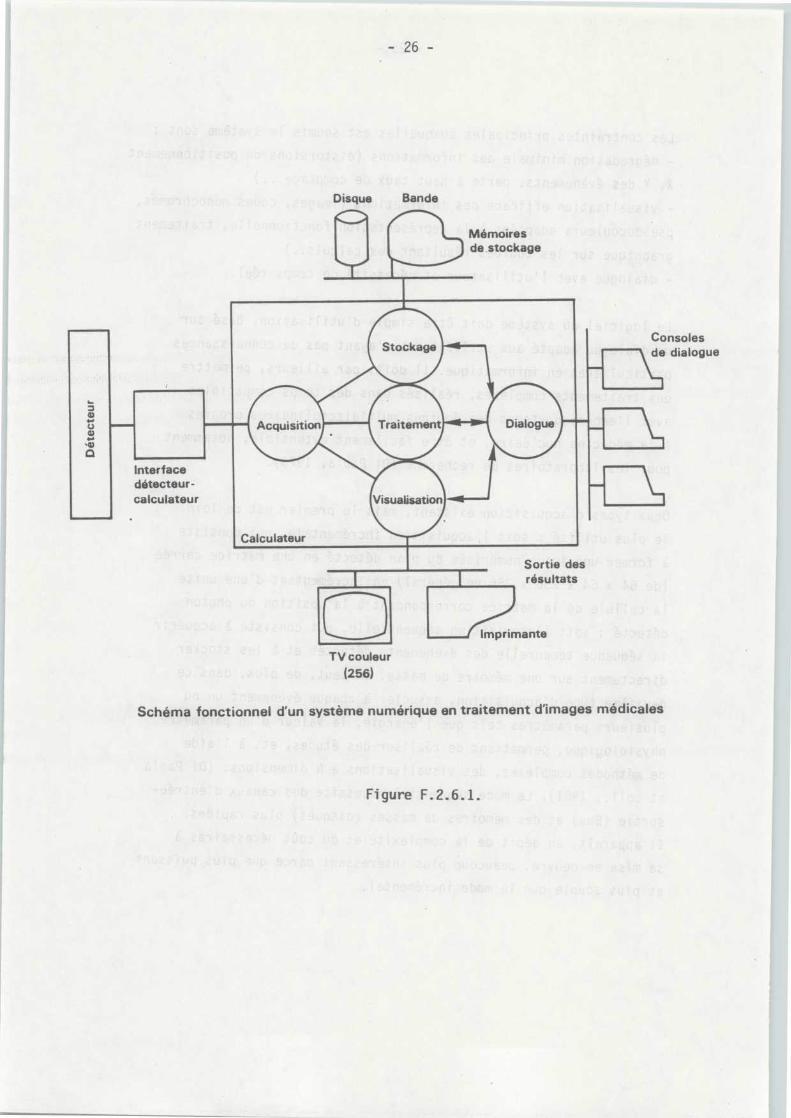
2 .6 . ACQUISITION,TRAITEMENT ENLIGNEETVISUALISATION
Un système d'acquisition et de traitement des données scintigraphique s
peut être décrit schématiquement par ses composants tels qu'ils son t
représentés sur la figure F2 .6 .1 .
Le rôle du système d ' acquisition et de traitement numérique es t
de permettre la quantification des paramètres d ' étude, et la mise
en oeuvre de traitements mathématiques impossibles à réaliser analogi -
quement .
- 25 -
Les contraintes principales auxquelles est soumis le système sont :
- dégradation minimale des informations (distorsions du positionnemen t
X, Y des évènements, perte à haut taux de comptage . . . )
- visualisation efficace des informations (images, codes monochromes ,
pseudocouleurs adaptées à la représentation fonctionnelle, traitemen t
graphique sur les courbes résultant des calculs . . )
- dialogue avec l'utilisateur et nécessité de temps réel .
Le logiciel du système doit être simple d'utilisation, basé su r
un dialogue adapté aux utilisateurs n'ayant pas de connaissance s
particulières en informatique . Il doit, par ailleurs, permettr e
des traitements complexes, réalisés dans des temps compatible s
avec l'emploi du temps des équipes multidisciplinaires propre s
à la médecine nucléaire, et être facilement extensible, notammen t
pour les laboratoires de recherche (Di Paola, 1973) .
Deux types d'acquisition existent, mais le premier est de loi n
le plus utilisé : soit l'acquisition incrémentale, qui consist e
à former une image numérisée du plan détecté en une matrice carré e
(de 64 x 64 à 256 x 256 en général) en incrémentant d'une unit é
la cellule de la matrice correspondant à la position du photon
détecté ; soit l'acquisition séquentielle, qui consiste à acquéri r
la séquence temporelle des évènements détectés et à les stocke r
directement sur une mémoire de masse . On peut, de plus, dans c e
deuxième type d'acquisition, associer à chaque évènement un o u
plusieurs paramètres tels que l'énergie, la valeur d'un paramètr e
physiologique, permettant de réaliser des études, et, à l ' aid e
de méthodes complexes, des visualisations à N dimensions . (Di Paol a
et coll ., 1981) . Le mode séquentiel nécessite des canaux d ' entrée -
sortie (Bus) et des mémoires de masses (disques) plus rapides .
Il apparaît, en dépit de la complexité et du coût nécessaires à
sa mise en oeuvre, beaucoup plus intéressant parce que plus puissan t
et plus souple que le mode incrémentai .
Mémoiresde stockage
Disque
Bande
Y
Interfacedétecteur -calculateur
Consolesde dialogu e
Sortie desrésultat s
Imprimante
TV couleur(256)
Schéma fonctionnel d'un système numérique en traitement d'images médicale s
Figure F .2 .6 .1 .
- 27 -
CHAPITRE 2 - REFERENCE S
ANGER H .O . Radioisotope cameras . G .J . Hine, J .A . Sorenson eds . ,
Instrumentation in Nuclear Medicine I, Academic Press, New York ,
485-552 (1967) .
DI PAOLA R ., BAZIN J .P ., DI PAOLA M . Improvement of gamma camer a
data processing due to sequential acquisition . In Information
Processing in Scintigraphy, IIIrd Int . Cambridge, Metz C .E ., Pize r
S .M ., eds ., USERDA CONF-730687, 115 (1973) .
DI PAOLA R ., TODD-POKROPEK A .E . New developments in techniques fo r
information processing in radionuclide imaging in Medical Radionuclid e
Imaging, IAEA - SM - 247/204, 1, 287-312 (1981) .
HINE G .J ., ERICKSON J .J . Advances in scintigrpahic instruments, G .J .
Hine, J .A . Sorenson, eds, Instrumentation in Nuclear Medicine II ,
Academic Press, New York, 1-59 (1974) .
KNOLL G .F ., SCHRADER M .E . Computer correction of gamma camera non
idealities in gamma ray imaging, IEEE Trans . NS, 29, 1272-1279 (1982) .
MINE P ., HADJERIS L ., HOANG XUAN T ., MARBOT R ., SOUSSALINE F ., JEANJEA N
J ., NGUYEN NGOC H . A gamma camera distortion corrector using a
programmable on-line microcomputer . Nucl . Inst . Meth ., 211, 561-56 4
(1983) .
MUEHLLEHNER G . The impact of digital technology on the scintillatio n
camera . J . Nucl . Med ., 22, 4, 389-391 (1982) .
MUEHLLEHNER G ., COLSHER J .G . Single photon imaging : ne w
instrumentation and techniques, in Medical Radionuclide Imaging ,
IAEA, Vienna, (1981) .
MUEHLLEHNER G ., COLSHER J .G . Scintillation camera in Radionuclid e
Imaging, D . Kuhl ed ., Pergamon Press, France, 1-25 (1982) .
PARAS P . Quality assurance in nuclear medicine . In : proc . Symp . Medica l
Radioisotope Imaging, IAEA, Vienna 1, 3-42 .(1977) .
SOUSSALINE F ., COMAR D . Positron emission tomography : applications to
the study of metabolic and pathophysiologic mechanism . Nuclear Science
Applications, 1, 601-616 (1983) .
WHO . Quality assurance in nuclear medicine . In : Proc . Symp . Heidelberg ,
Nov . 1980, R .F . Mouls ed ., in press .
MUEHLLEHNER G ., COLSHER J .G ., STOUB E .W . Correction for field non -
uniformity in scintillation cameras through removal of spatia l
distortion . J . Nucl . Med ., 19, 825-835 (1978) .
NEMA . Performance measurements of scintillation cameras, NEMA standard s
publication NU 1 (1980) .
- 29 -
RECONSTRUCTION DES DONNEE S
EN TOMOGRAPHIE D'EMISSION
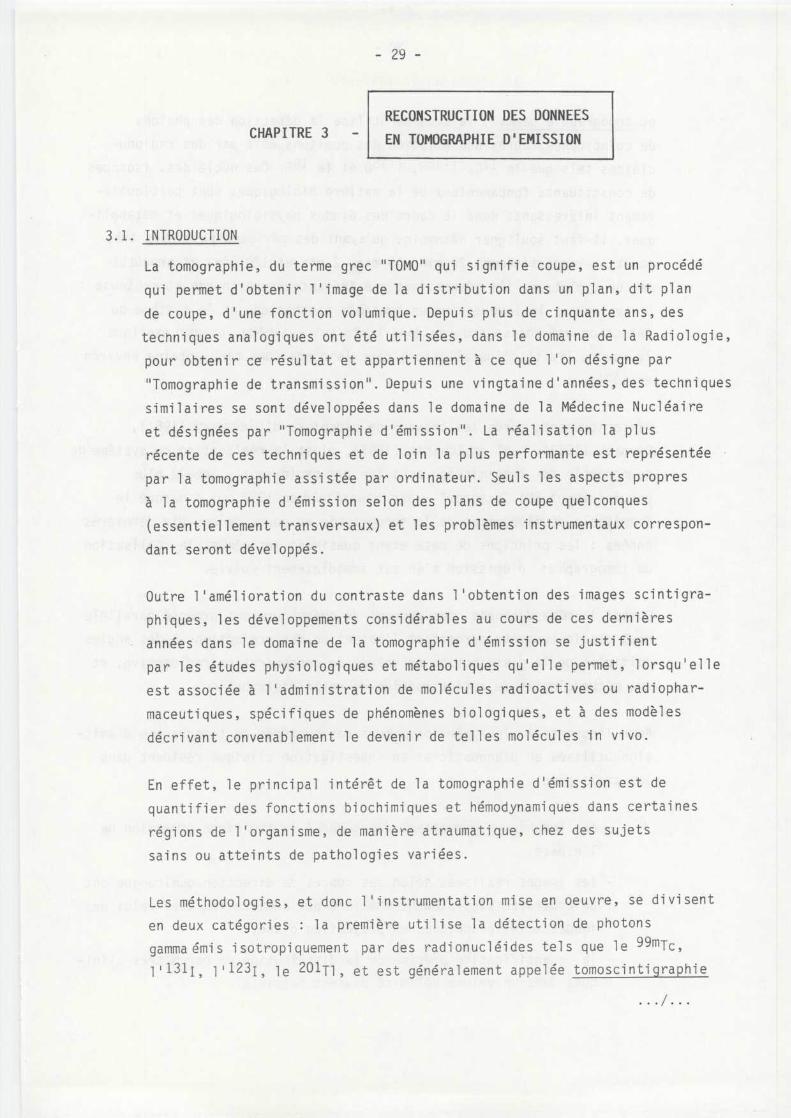
3 .1 . INTRODUCTIO N
La tomographie, du terme grec "TOMO" qui signifie coupe, est un procéd é
qui permet d ' obtenir l ' image de la distribution dans un plan, dit pla n
de coupe, d ' une fonction volumique . Depuis plus de cinquante ans, de s
techniques analogiques ont été utilisées, dans le domaine de la Radiologie ,
pour obtenir ce résultat et appartiennent à ce que l'on désigne pa r
" Tomographie de transmissio n " . Depuis une vingtaine d ' années, des technique s
similaires se sont développées dans le domaine de la Médecine Nucléair e
et désignées par "Tomographie d'émission" . La réalisation la plu s
récente de ces techniques et de loin la plus performante est représentée
par la tomographie assistée par ordinateur . Seuls les aspects propre s
à la tomographie d'émission selon des plans de coupe quelconque s
(essentiellement transversaux) et les problèmes instrumentaux correspon-
dant seront développés .
Outre l'amélioration du contraste dans l'obtention des images scintigra -
phiques, les développements considérables au cours de ces dernière s
années dans le domaine de la tomographie d ' émission se justifien t
par les études physiologiques et métaboliques qu'elle permet, lorsqu'ell e
est associée à l'administration de molécules radioactives ou radiophar-
maceutiques, spécifiques de phénomènes biologiques, et à des modèle s
décrivant convenablement le devenir de telles molécules in vivo .
En effet, le principal intérêt de la tomographie d ' émission est de
quantifier des fonctions biochimiques et hémodynamiques dans certaine s
régions de l ' organisme, de manière atraumatique, chez des sujet s
sains ou atteints de pathologies variées .
Les méthodologies, et donc l ' instrumentation mise en oeuvre, se divisen t
en deux catégories : la première utilise la détection de photon s
gamma émis isotropiquement par des radionucléides tels que le 99mTc ,
1'131 1 , 1'123I, le 201 T1, et est généralement appelée tomoscintigraphi e
CHAPITRE 3 -
- 30 -
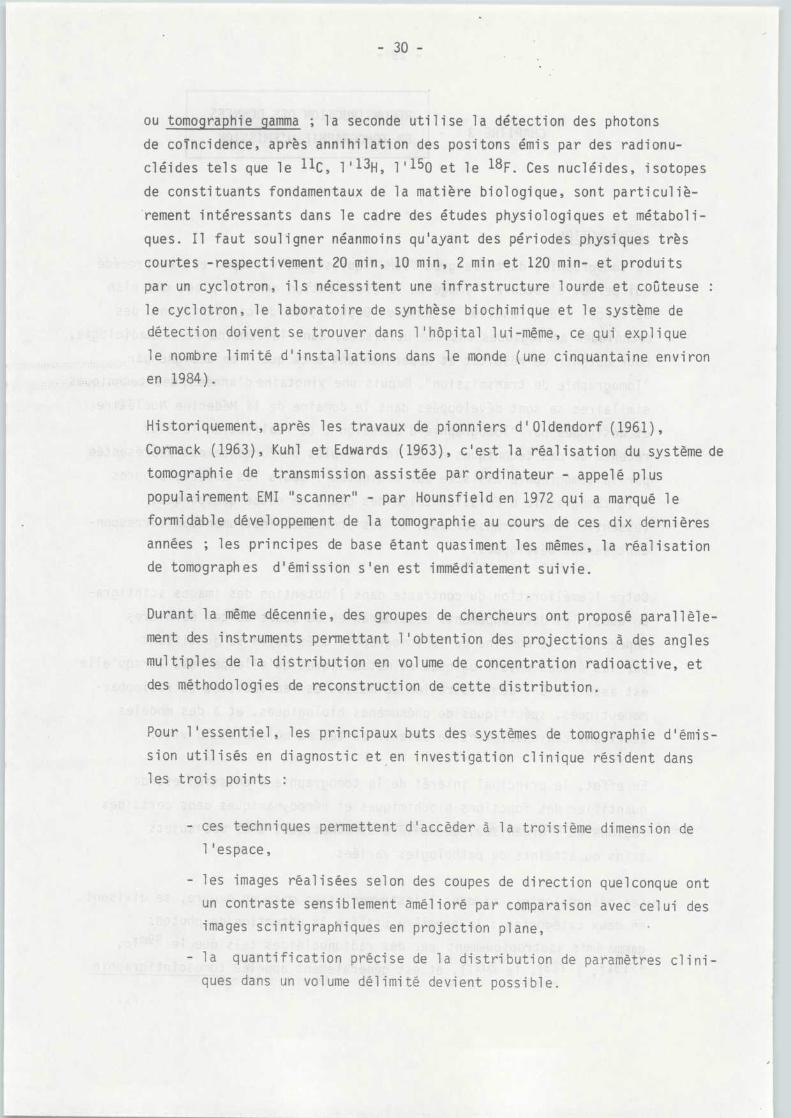
ou tomographie gamma ; la seconde utilise la détection des photon s
de coincidence, après annihilation des positons émis par des radionu-
cléides tels que le 11C, l ' 13H, 1 ' 150 et le 18 F . Ces nucléides, isotope s
de constituants fondamentaux de la matière biologique, sont pa rticuliè-
. rement intéressants dans le cadre des études physiologiques et métaboli -
ques . Il faut souligner néanmoins qu'ayant des périodes physiques trè s
courtes -respectivement 20 min, 10 min, 2 min et 120 min- et produit s
par un cyclotron, ils nécessitent une infrastructure lourde et coûteuse :
le cyclotron, le laboratoire de synthèse biochimique et le système d e
détection doivent se trouver dans l'hôpital lui-même, ce qui explique
le nombre limité d'installations dans le monde (une cinquantaine enviro n
en 1984) .
Historiquement, après les travaux de pionniers d'Oldendorf (1961) ,
Cormack (1963), Kuhl et Edwards (1963), c'est la réalisation du système d e
tomographie de transmission assistée par ordinateur - appelé plu s
populairement EMI "scanner" - par Hounsfield en 1972 qui a marqué l e
formidable développement de la tomographie au cours de ces dix dernière s
années ; les principes de base étant quasiment les mêmes, la réalisatio n
de tomograph es d'émission s'en est immédiatement suivie .
Durant la même décennie, des groupes de chercheurs ont proposé parallèle -
ment des instruments permettant l'obtention des projections à des angle s
multiples de la distribution en volume de concentration radioactive, e t
des méthodologies de reconstruction de cette distribution .
Pour l'essentiel, les principaux buts des systèmes de tomographie d'émis-
sion utilisés en diagnostic et en investigation clinique résident dan s
les trois points :
- ces techniques permettent d'accéder à la troisième dimension d e
l'espace ,
- les images réalisées selon des coupes de direction quelconque on t
un contraste sensiblement amélioré par comparaison avec celui de s
images scintigraphiques en projection plane ,
- la quantification précise de la distribution de paramètres clini-
ques dans un volume délimité devient possible .
3 .2 . CONCEPTS DE BASE ET POSITION DU PROBLEME
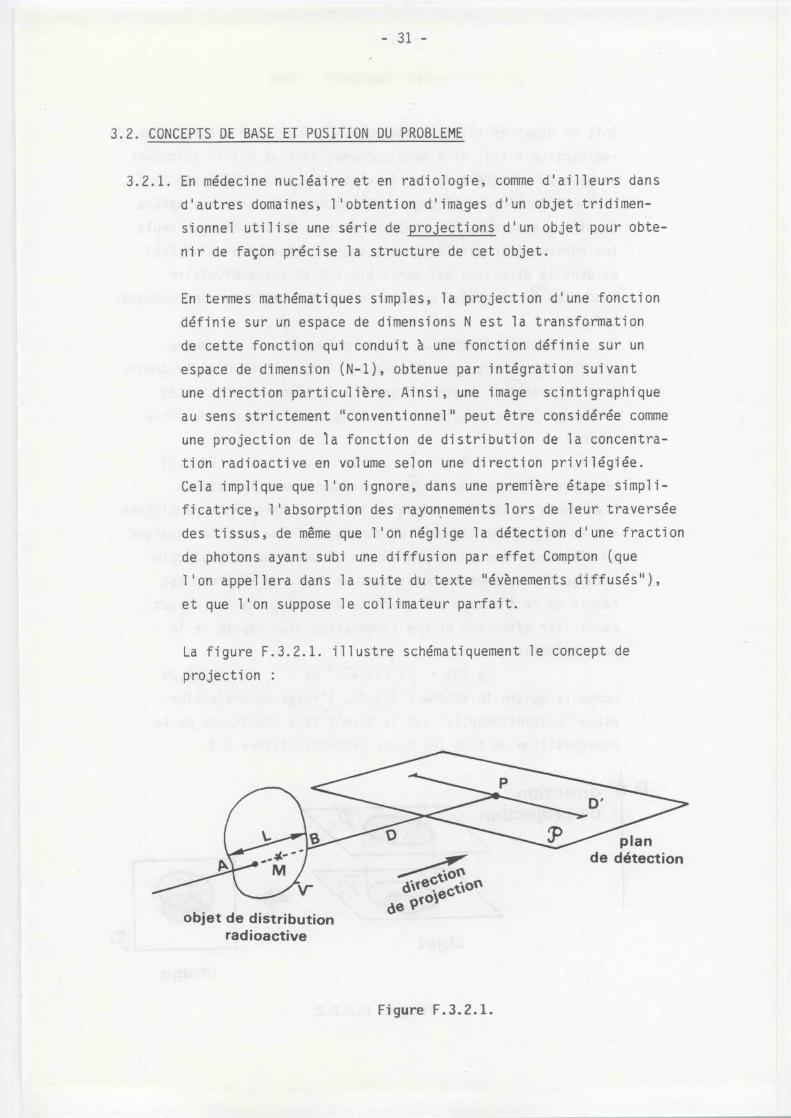
3 .2 .1 . En médecine nucléaire et en radiologie, comme d'ailleurs dan s
d ' autres domaines, l ' obtention d ' images d ' un objet tridimen-
sionnel utilise une série de projections d'un objet pour obte -
nir de façon précise la structure de cet objet .
En termes mathématiques simples, la projection d'une fonctio n
définie sur un espace de dimensions N est la transformatio n
de cette fonction qui conduit à une fonction définie sur u n
espace de dimension (N-1), obtenue par intégration suivan t
une direction particulière . Ainsi, une image scintigraphiqu e
au sens strictement "conventionnel" peut être considérée comm e
une projection de 7a fonction de distribution de la concentra -
tion radioactive en volume selon une direction privilégiée .
Cela implique que l'on ignore, dans une première étape simpli-
ficatrice, l'absorption des rayonnements lors de leur traversée
des tissus, de même que l'on néglige la détection d'une fractio n
de photons ayant subi une diffusion par effet Compton (qu e
l'on appellera dans la suite du texte "évènements diffusés") ,
et que l'on suppose le collimateur parfait .
La figure F .3 .2 .1 . illustre schématiquement le concept de
projection :
V-
objet de distributionradioactive
Figure F .3 .2 .1 .
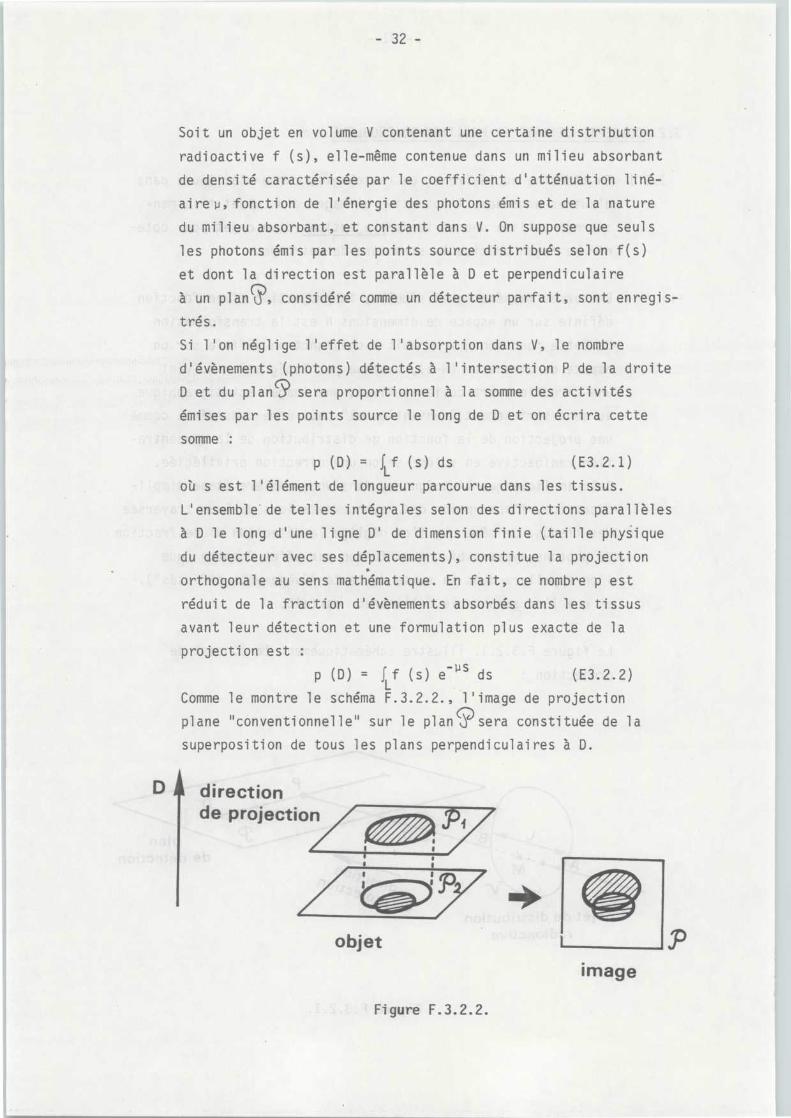
Soit un objet en volume V contenant une certaine distributio nradioactive f (s), elle-même contenue dans un milieu absorban tde densité caractérisée par le coefficient d'atténuation Und -aire u,fonction de l'énergie des photons émis et de la natur edu milieu absorbant, et constant dans V . On suppose que seul sles photons émis par les points source distribués selon f(s )et dont la direction est parallèle à D et perpendiculaireà un plan?, considéré comme un détecteur parfait, sont enregis-trés .Si l'on néglige l'effet de l'absorption dans V, le nombr ed'évènements (photons) détectés à l'intersection P de la droiteD et du plan9 sera proportionnel à la somme des activité sémises par les points source le long de D et on écrira cett esomme :
p (D) = 1 f (s) ds
(E3 .2 .1 )Loù s est l'élément de longueur parcourue dans les tissus .L'ensemble'de telles intégrales selon des directions parallèle sà D le long d'une ligne D' de dimension finie (taille physiqu edu détecteur avec ses déplacements), constitue la projectio northogonale au sens mathématique . En fait, ce nombre p es tréduit de la fraction d'évènements absorbés dans les tissu savant leur détection et une formulation plus exacte de l aprojection est :
p (D) = ff (s) e -us ds
(E3 .2 .2 )LComme le montre le schéma F .3 .2 .2 ., l'image de projectio nplane "conventionnelle" sur le P
~lan 9 sera constituée de l asuperposition de tous les plans perpendiculaires à D .
imageP
L'analyse mathématique des équations E3 .2 .1 et E3 .2 .2 est
bien connue ; cependant, il est important de remarquer qu e
même lorsque l'atténuation est négligée, la résolution rigou -
reuse de l ' équation n ' est pas simple car elle suppose connu e
et uniforme la fonction de réponse du détecteur pour tout e
la taille du volume V de l'objet . Ainsi, il est essentie l
de modéliser correctement les phénomènes physiques impliqué s
dans la procédure de détection des évènements, pour obteni r
les données de la mesure dont on extrait par calcul des para -
mètres régionaux d'intérêt clinique,
3 .2 .2 . ASPECTS PHYSIQUES DE LA MODELISATION
Il existe des différences fondamentales entre les problème s
de la reconstruction d ' une distribution d ' émetteur de photon s
gamma ou de positons, et celui de la reconstruction d ' un e
distribution de densité d ' atténuation en tomographie de trans-
mission X .
En émission, le phénomène est isotropique et il n'y a aucune
connaissance a priori sur le trajet parcouru par le photo n
entre le point d'émission et une portion du détecteur (e n
particulier en émission gamma) . Les photons émis sont atténué s
avant détection selon une loi exponentielle de la distanc e
parcourue (Figure F .3 .2 .3) . Dans le cas d'émission de positons ,
les deux photons d'annihilation du positon et d'un électro n
de la matière, émis en coincidence spatio-temporelle, subis -
sent une atténuation liée à la distance totale parcourue pou r
chaque direction particulière d'échantillonnage, que l'o n
peut assez aisément déterminer par détection du contour d e
l ' objet atténuant . Ce n ' est pas le cas en émission de photon s
gamma uniques ; de plus, la distribution volumique du coefficien t
d ' atténuation ne peut être considérée comme constante dan s
des régions de l'organisme tels que le thorax ou l'abdomen ,
où l'on trouve beaucoup de tissus différents .
Par ailleurs, la fonction de réponse du détecteur collimat é
n ' est pas invariante par rotation, mais est fonction de l'angle
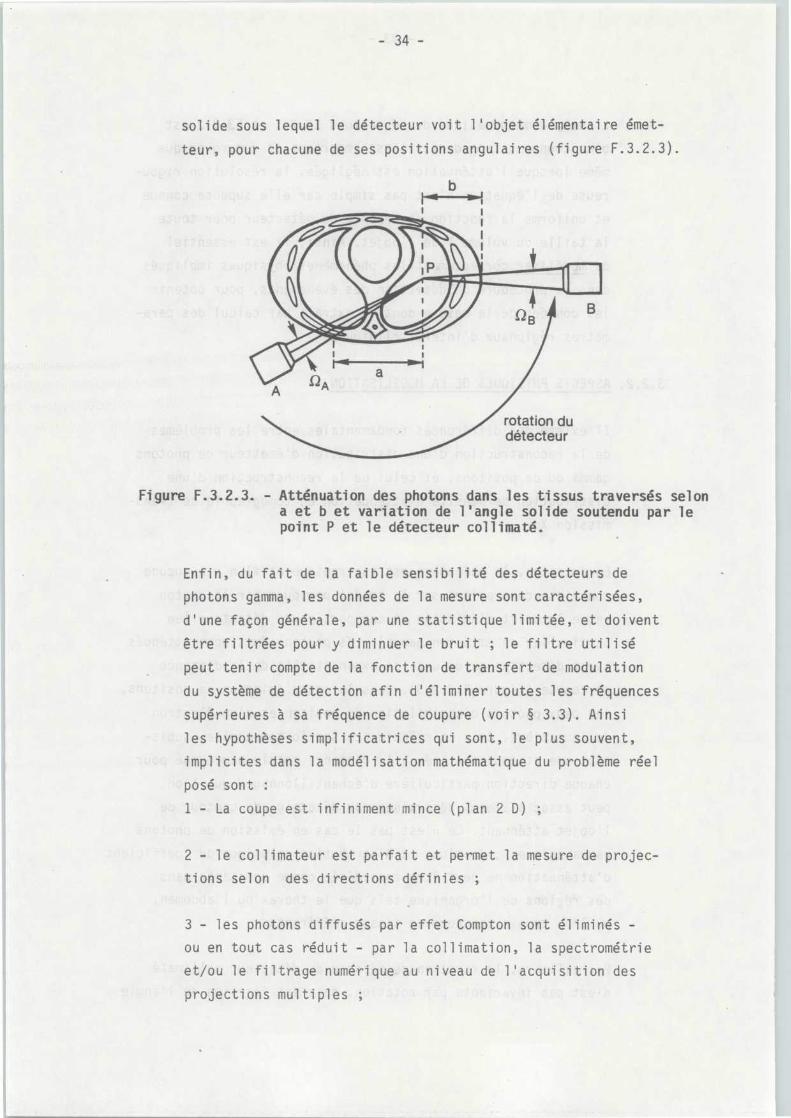
solide sous lequel le détecteur voit l'objet élémentaire émet-
teur, pour chacune de ses positions angulaires (figure F .3 .2 .3) .
b
Figure F .3.2 .3 . - Atténuation des photons dans les tissus traversés selona et b et variation de l'angle solide soutendu par l epoint P et le détecteur collimaté .
Enfin, du fait de la faible sensibilité des détecteurs de
photons gamma, les données de la mesure sont caractérisées ,
d'une façon générale, par une statistique limitée, et doivent
être filtrées pour y diminuer le bruit ; le filtre utilisé
peut tenir compte de la fonction de transfert de modulation
du système de détection afin d'éliminer toutes les fréquence s
supérieures à sa fréquence de coupure (voir § 3 .3) . Ains i
les hypothèses simplificatrices qui sont, le plus souvent ,
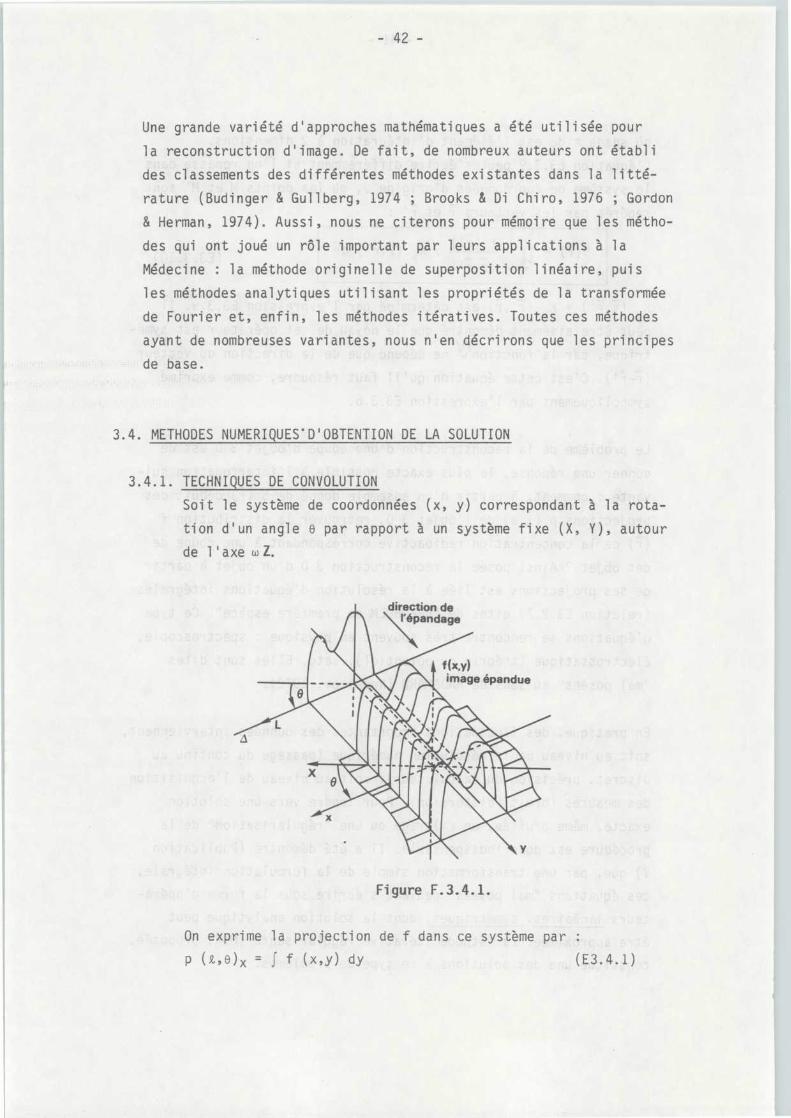
implicites dans la modélisation mathématique du problème rée l
posé sont :
1 - La coupe est infiniment mince (plan 2 D) ;
2 - le collimateur est parfait et permet la mesure de projec-
tions selon des directions définies ;
3 - les photons diffusés par effet Compton sont éliminés -
ou en tout cas réduit - par la collimation, la spectrométri e
et/ou le filtrage numérique au niveau de l'acquisition de s
projections multiples ;
4 - l'échantillonnage est suffisamment précis et complet (360 °
de l'espace) pour éviter les phénomènes de repliement fréquentie l
et d'indétermination aux coupures .
3 .2 .3 . FORMULATION MATHEMATIQUE - LA TRANSFORMEE DE RADON ATTENUE E
L'originalité de la tomographie d'émission par rapport à l a
tomographie de transmission est que les principes mêmes d e
la détection d'une distribution en volume permettent éventuel -
lement une reconstruction directe de ce volume, sans passe r
par celle des plans transverses successifs . Cependant, l a
formulation que nous donnons ici au problème est celle d e
la reconstruction dans un plan transverse, car nous avon s
développé une analyse du problème 2D par souci de simplicit é
de la modélisation et de rapidité de traitement numérique .
Le problème général de la reconstruction tridimensionnell e
(3 D) est alors ici, réduit à celui de la reconstruction suc-
cessive de plans (2 D), transversaux au grand axe de l'objet .
Le vrai volume peut être obtenu ultérieurement, par un tr i
ou réarrangement des données ainsi obtenues dans les plan s
successifs dans d'autres plans également parallèles entr e
eux, mais selon n'importe quelle direction de l'espace . Plu s
particulièrement les deux directions perpendiculaires à celle s
des plans transversaux, appelés plans sagittaux (ou coronaux )
et longitudinaux (ou frontaux) sont très utilisées en imageri e
médicale .
Comme illustré, sur la figure F .3 .2 .4 ., soit un domaine f
contenant une distribution de concentration radioactive f ,
inclus dans le domaine u, sur lequel est définie la distribu-
tion du coefficientolinéique d ' atténuation p .
Pour une origine w, la fonction recherchée est f Cf') en tout
point repérée par r dans le domaine 2f .
On l ' a vu dans le paragraphe de 3 .2 .1 . (E3 .2 .1 et E3 .2 .2),
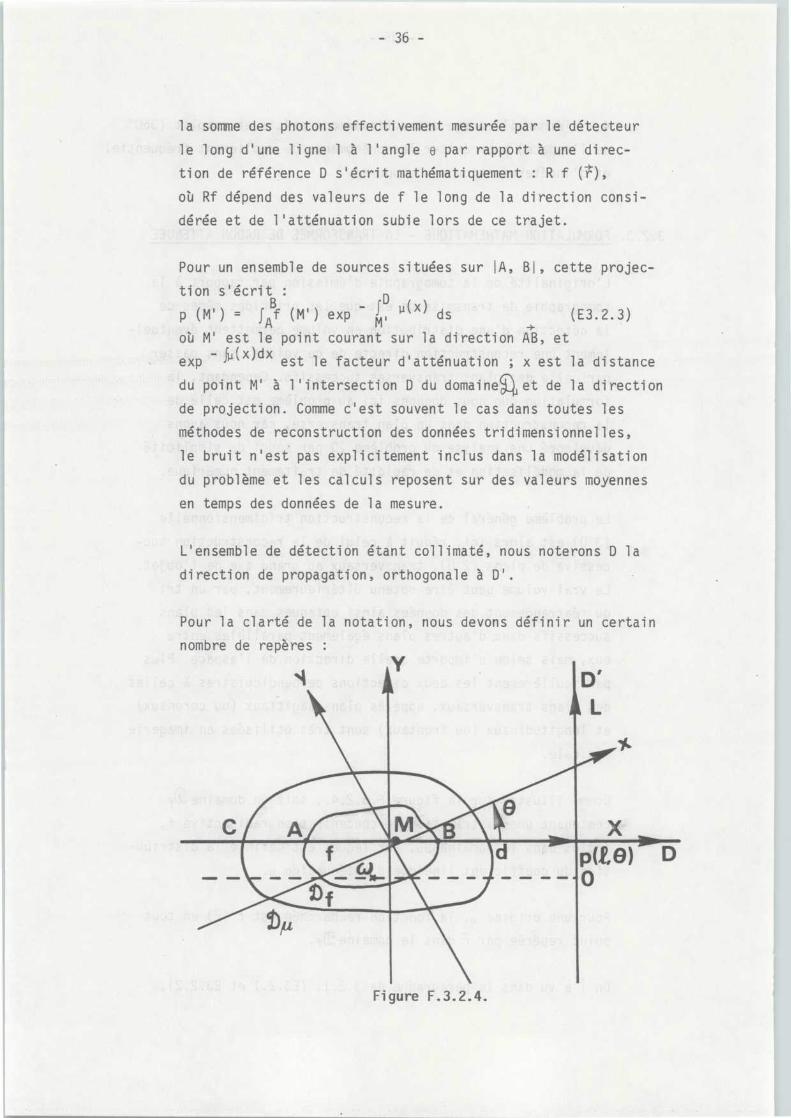
la somme des photons effectivement mesurée par le détecteu r
le long d'une ligne 1 à l'angle e par rapport à une direc-
tion de référence D s'écrit mathématiquement : R f (r} ,
où Rf dépend des valeurs de f le long de la direction consi-
dérée et de l'atténuation subie lors de ce trajet .
Pour un ensemble de sources situées sur IA, BI, cette projec-
tion s'écrit :
D -
P(x )p(M)
fAf (M') exp
ds
(E3 .2 .3 )
où M' est le point courant sur la direction AB, e t
exp - j~`(x)dx est le facteur d'atténuation ; x est la distance
du point M' à l'intersection D du domaine
et de la direction
de projection . Comme c'est souvent le cas dans toutes le s
méthodes de reconstruction des données tridimensionnelles ,
le bruit n'est pas explicitement inclus dans la modélisatio n
du problème et les calculs reposent sur des valeurs moyenne s
en temps des données de la mesure .
L'ensemble de détection étant collimaté, nous noterons D l a
direction de propagation, orthogonale à D' .
Pour la clarté de la notation, nous devons définir un certai n
nombre de repères :
Figure F .3 .2.4.
Un re ère fixe (X,Y) ou (r,e) d ' ori ine w lié au domaine2 d eP
9
reconstruction .
Un repère mobile (x, y) d'origine w lié au détecteur et e n
rotation d'angle e autour de l'axe wZ, dans le sens trigonomé-
trique .
Un repère (OL) sur la droite D' et d'origine 0, obtenu pa r
translation et changement d'origine de l'axe cox . Une absciss e
sur la droite D ' est appelée un canal deprojection . Ainsi ,
à chaque valeur d'abscisse correspond un numéro de canal de
projection .
La droite D pour ~, fixé a pour équation x = constante, ell e
dépend également de l'angle e . Elle est encore appelée rayo n
de projection d ' abcisse , .
Ces repères sont liés entre eux par les relations sui vantes :
X= x cos e- y sin e
x= X cos e+ Y sin e
Y= x sin e- y cos e
y = X sin e+ Y cos e
La formulation la plus générale du problème conduit, en explicitan t
la projection p ( .,,e) à l ' équation suivante :
p (Q,e) =
f (M') A (M') ds
(E3 .2 .4 )
où A (M ' ) modélise les divers phénomènes physiques pouvan t
avoir lieu, le plus important étant l'atténuation . Cependant ,
l ' expression mathématique exacte de l ' ensemble de ces effet s
est très complexe, et n ' a été traitée qu ' arbitrairement, e t
séquentiellement, en exprimant une fraction de l ' effet de
diffusion Compton, l'effet d'angle solide lié au collimateur ,
et l'effet d ' atténuation .
C ' est le mathématicien allemand RADON, qui en 1917, étudia
les propriétés d'une fonction somme associée en tous point s
à la fonction f(r), en utilisant l'opérateur intégral défin i
en E3 .2 .4 .
De fait, il démontra la relation suivante, liant la fonctio n
f (r) à ses projections p (z,o) :
217~r/ 2 +oo ( ~, 8) 1
f(r,(o) =
Ç12 f
dz de
(E3 .2 .5 )r sin (-o )
(à condition que les dérivées aux sens des fonctions existent) .
Cette relation intégrale allait devenir la base de la plupar t
des travaux ultérieurs et est souvent appelée "intégrale d e
Radon" ou "transformée de Radon" .
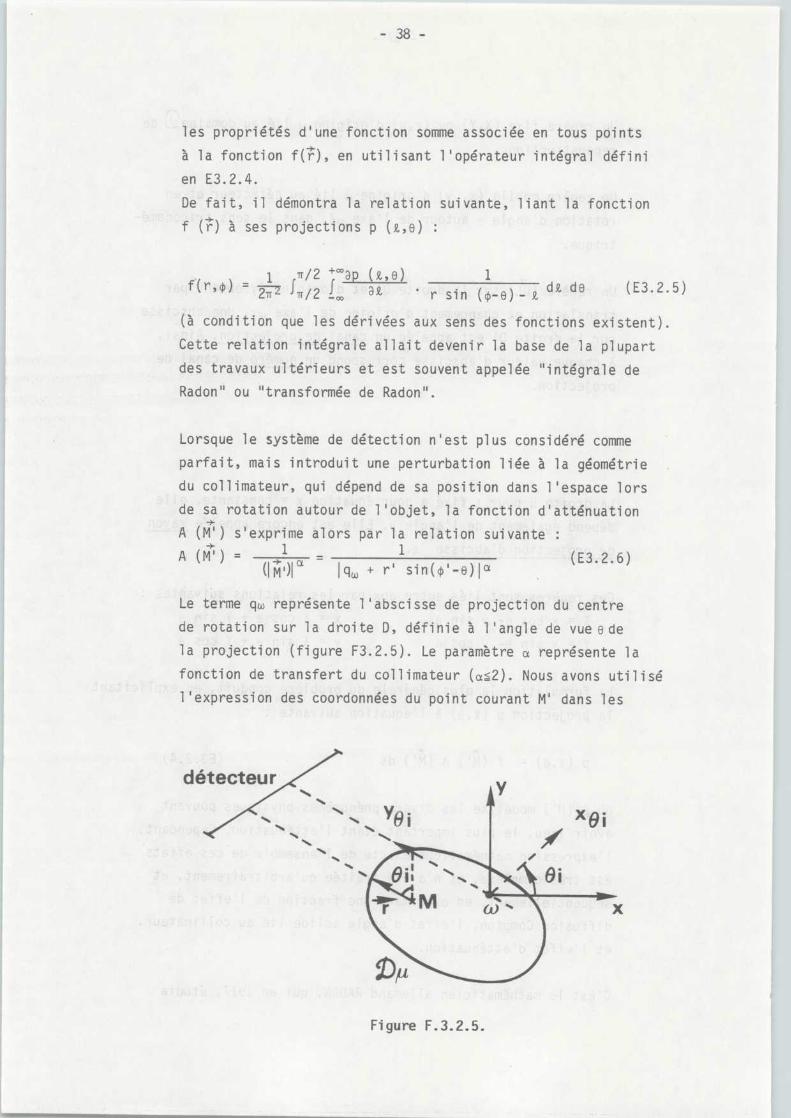
Lorsque le système de détection n'est plus considéré comme
parfait, mais introduit une perturbation liée à la géométri e
du collimateur, qui dépend de sa position dans l'espace lor s
de sa rotation autour de l ' objet, la fonction d ' atténuation
A (M') s'exprime alors par la relation suivante :}
A(M ' ) = 1
(E3 .2 .6 )(IM')I
I q~, + r' sin(
-en a
Le terme qw représente l'abscisse de projection du centre
de rotation sur la droite D, définie à 1 'angle de vue e d e
la projection (figure F3 .2 .5) . Le paramètre a représente l a
fonction de transfert du collimateur (a_2) . Nous avons utilis é
l'expression des coordonnées du point courant M' dans le s
Figure F .3 .2 .5 .
différents repères : M' (it') dans le repère lié à la droite
D, M' (r') = M' (r i , 0') dans le repère fixe (wX, wY) en coor-
données polaires .
Dans le cas le plus général, où l'on tient compte essentielle-
ment de l'effet d'atténuation, nous avons vu (E .3 .2 .3 .) que- fD u(x) d xce facteur s'exprimait ainsi : A (M') = e
M '
3 .3 . DEFINITION DES OPERATEURS TOMOGRAPHIQUE S
L'expression des projections linéaires dans le repère de coordon-
nées en (,,o) s ' écrit :
D
f M'
ex
1-jM'
(x) dxl d s p (~~e)
jB
(
)
P
(E3 .3 .l )AElle peut être réécrite sous forme symbolique :
p z,e J f (r)
(E3 .3 .2 )
où J est un opérateur intégral linéaire .
La solution du problème consiste à trouver un opérateur J- 1 te l
que :
f r = J-1 p (z ' o)
(E3 .3 .3 )
L'opérateur J-1 ne pouvant être calculé directement, un certai n
nombre de méthodes sont proposées pour transformer l'équation E3 .3 . 2
en utilisant une transformation linéaire L dont on connaît bie n
les propriétés, de sorte que :
Lp (t,e) = S (r)
(E3 .3 .4 )
Soit ,
LJf(r) = Of(r)
(E3 .3 .5 )
où 0 est un "Opérateur tomographique " .
L'équation à résoudre est maintenant :
S (r) = 0 f (r)
(E3 .3 .6 )
où S est lié à l'ensemble des données de la mesure et 0 "l'opérateu r
tomographique " qu ' on veut inverser .
Soit M un point fixe sur ZABI, dans le domaine f, représenté su r
la figure F3 .3 .1 .
Si l'on reprend l'expression E3 .3 .1 ave M comme origine, on peu t
séparer en deux parties l'intégrale p (,o)
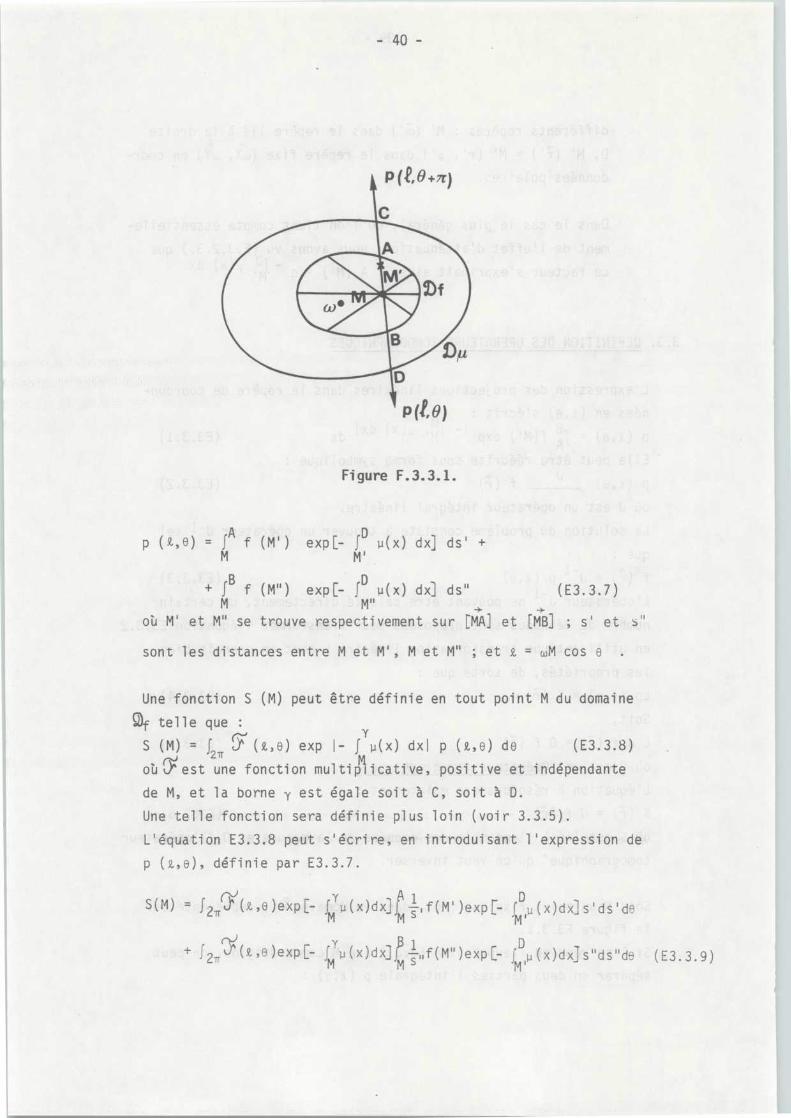
Figure F .3.3 .1 .
p (,O) = jA f (M') exp[- j' u(x) dx] ds' +M
M '
+ j g f (M") exp[- j° u(x) dx] ds"
(E3 .3 .7 )M
M" }où M ' et M " se trouve respectivement sur [MA] et [MB] ; s ' et s "
sont les distances entre M et M ' , M et M " ; et z = wM cos e .
Une fonction S (M) peut être définie en tout point M du domain e
0f telle que :
S (M) = f
(i,e) exp I- f p(x) dxl p (t,e) de
(E3 .3 .8 )(~
2T
Mou )'est une fonction multiplicative, positive et indépendante
de M, et la borne y est égale soit à c, soit à D .
Une telle fonction sera définie plus loin (voir 3 .3 .5) .
L'équation E3 .3 .8 peut s'écrire, en introduisant l'expression d e
p (z,e), définie par E3 .3 .7 .
S(M)
ui' RD
f2 (,o)expE- fM7p (x)dx] M s.f(M )ex p E- jM,u(x)dx]s ' ds ' de
(,e )exp [- f(x)dx?,,f(M")exp [- f D'p(x)dxjs "ds"de
(E3 .3 .9)
où sdsde = do est l'élément d'intégration à 2 dimensions .
L'équation E3 .3 .9 peut s'écrire différemment si l'on repasse dan s
le système de coordonnées d ' origine w, où les points M et M ' son t
repérés par les vecteurs r et r'
(E3 .3 .10 )
Ku (r,r') = K u (',) est déterminé par l'expression E3 .3 .9 . I l
peut être aisément démontré que le noyau de cet opérateur est symé -
trique, car la fonctio n rY ne dépend que de la direction du vecteu r
C'est cette équation qu'il faut résoudre, comme exprimé
symboliquement par l'expression E3 .3 .6 .
Le problème de la reconstruction d'une coupe d'objet 3 D est d e
donner une réponse, la plus exacte possible à l'interrogation sui -
vante : comment, à partir d ' un ensemble donné de S ( -rt ) déduit de s
projections p (,,e) de l'objet 3 D, retrouver la distribution f
(it) de la concentration radioactive correspondant à une coupe d e
cet objet ? Ainsi posée la reconstruction 3 D d'un objet à parti r
de ses projections est liée à la résolution d'équations intégrale s
(relation E3 .2 .7) dites de "FREDHOLM de première espèce" . Ce type
d'équations se rencontre très souvent en physique : spectroscopie ,
électrostatique (théorie du potentiel) . . .etc . Elles sont dite s
"mal posées" au sens de HADAMARD (Nedelkov, 1972) .
En pratique, des fluctuations importantes des données interviennent ,
soit au niveau de la résolution numérique (passage du continu a u
discret, précision du calculateur), soit au niveau de l'acquisitio n
des mesures (bruit, distorsion) . Pour tendre vers une solutio n
exacte, même bruitée, un filtrage ou une " régularisation " de l a
procédure est donc indispensable . Il a été démontré (Publicatio n
V) que, par une transformation simple de la formulation intégrale ,
ces équations "mal posées" peuvent s'écrire sous la forme d'opéra-
teurs linéaires, symétriques, dont la solution analytique peu t
être approximée . La méthode itérative régularisante (MIR) proposée ,
constitue une des solutions à ce type de problèmes .
= ff
.~f ir-r
(,') dr 's(r) K
Une grande variété d'approches mathématiques a été utilisée pou r
la reconstruction d'image . De fait, de nombreux auteurs ont établ i
des classements des différentes méthodes existantes dans la litté-
rature (Budinger & Gullberg, 1974 ; Brooks & Di Chiro, 1976 ; Gordon
& Herman, 1974) . Aussi, nous ne citerons pour mémoire que les métho-
des qui ont joué un rôle important par leurs applications à l a
Médecine : la méthode originelle de superposition linéaire, pui s
les méthodes analytiques utilisant les propriétés de la transformé e
de Fourier et, enfin, les méthodes itératives . Toutes ces méthode s
ayant de nombreuses variantes, nous n'en décrirons que les principe s
de base .
3 .4 . METHODES NUMERIQUES'D'OBTENTION DE LA SOLUTIO N
3 .4 .1 . TECHNIQUES DE CONVOLUTIO N
Soit le système de coordonnées (x, y) correspondant à la rota -
tion d'un angle e par rapport à un système fixe (X, Y), autour
del'axe wZ .
Figure F.3 .4 .1 .
On exprime la projection de f dans ce système pa r
p ('°)x = f f (x,y) dy
(E3 .4 .1)
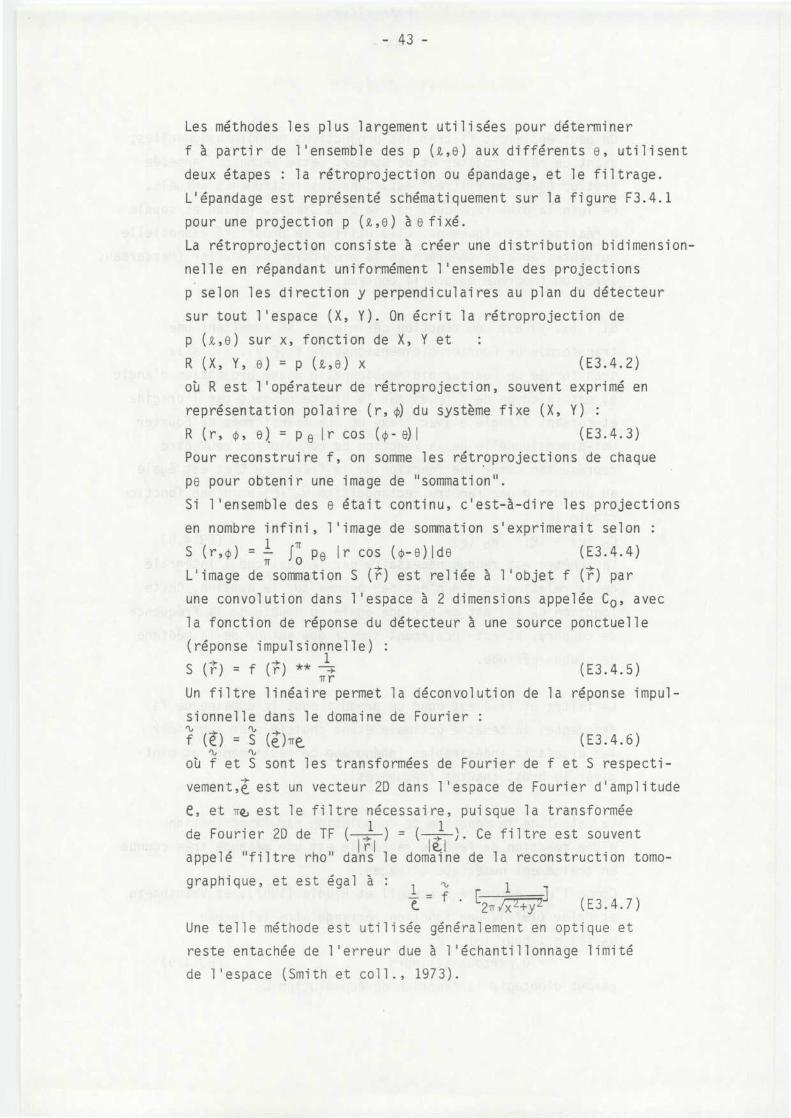
Les méthodes les plus largement utilisées pour détermine r
f à partir de l'ensemble des p (z,e) aux différents e, utilisen t
deux étapes : la rétroprojection ou épandage, et le filtrage .
L'épandage est représenté schématiquement sur la figure F3 .4 . 1
pour une projection p (,,e) à e fixé .
La rétroprojection consiste à créer une distribution bidimension -
nelle en répandant uniformément l'ensemble des projection s
p selon les direction y perpendiculaires au plan du détecteu r
sur tout l'espace (X, Y) . On écrit la rétroprojection de
p (,e) sur x, fonction de X, Y et
R (X, Y, e) = p (t,e) x
(E3 .4 .2 )
où R est l'opérateur de rétroprojection, souvent exprimé e n
représentation polaire (r, (p) du système fixe (X, Y) :
R (r, (p, e) = p e Ir cos (q -e)I
(E3 .4 .3 )
Pour reconstruire f, on somme les rétroprojections de chaqu e
pe pour obtenir une image de "sommation" .
Si l'ensemble des e était continu, c'est-à-dire les projection s
en nombre infini, l'image de sommation s'exprimerait selon :
S (r,(p) = 1
7f pe Ir cos (-e)Ide
(E3 .4 .4 )Tr
oL'image de sommation S (r) est reliée à l'objet f (r) pa r
une convolution dans l'espace à 2 dimensions appelée Co, ave c
la fonction de réponse du détecteur à une source ponctuell e
(réponse impulsionnelle )
S (r)
f (r)
}
(E3 .4 .5 )7 r
Un filtre linéaire permet la déconvolution de la réponse impul -
sionnelle dans le domaine de Fourier :
f
= S }
(re
(E3 .4 .6 )
où f et S sont les transformées de Fourier de f et S respecti-
vement, est un vecteur 2D dans l ' espace de Fourier d ' amplitude
e, et Tri, est le filtre nécessaire, puisque la transformé e
de Fourier 2D de TF 1 ) = 1 ) . Ce filtre est souven tIn I
Il iappelé "filtre rho" dans le domaine de la reconstruction tomo -
graphique, et est égal à :
1
ti 1— =f[ 1e.
2iTIx2+yl
(E3 .4 .7 )
Une telle méthode est utilisée généralement en optique e t
reste entachée de l ' erreur due à l ' échantillonnage limit é
de l'espace (Smith et coll ., 1973) .
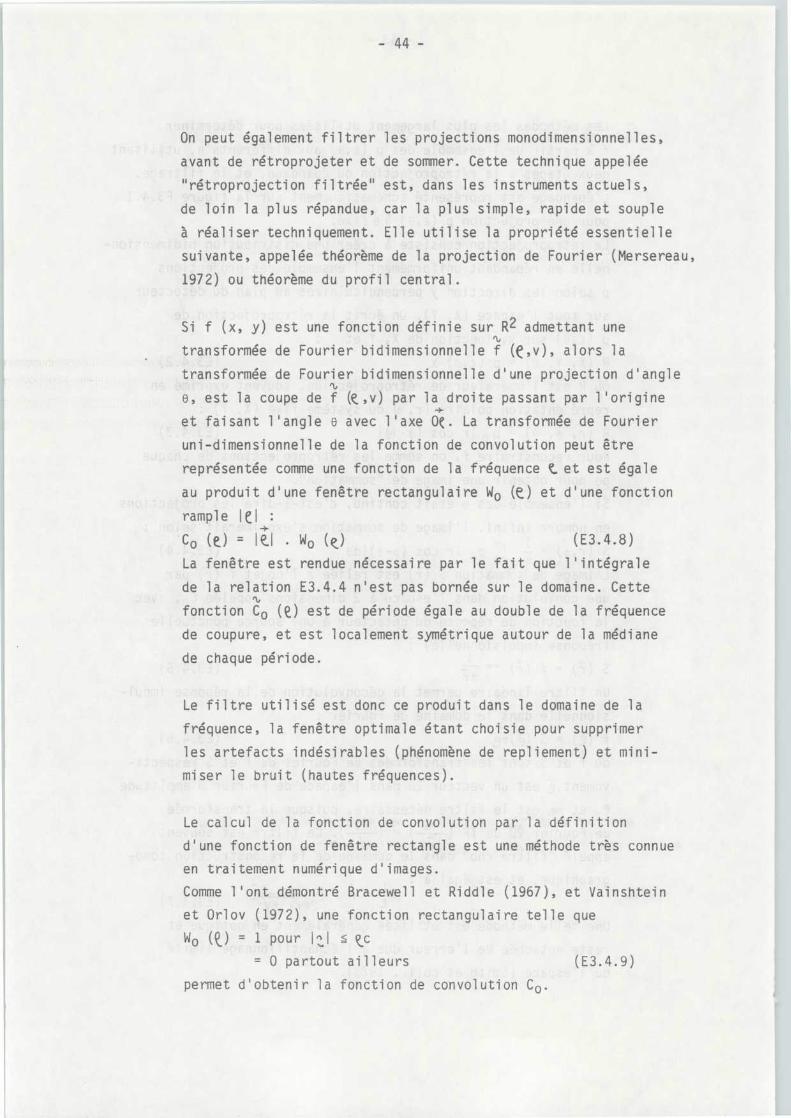
On peut également filtrer les projections monodimensionnelles ,
avant de rétroprojeter et de sommer . Cette technique appelée
"rétroprojection filtrée" est, dans les instruments actuels ,
de loin la plus répandue, car la plus simple, rapide et soupl e
à réaliser techniquement . Elle utilise la propriété essentiell e
suivante, appelée théorème de la projection de Fourier (Mersereau ,
1972) ou théorème du profil central .
Si f (x, y) est une fonction définie sur R2 admettant un e%
transformée de Fourier bidimensionnelle f (e,v), alors l a
transformée de Fourier bidimensionnelle d'une projection d'angl e%
e, est la coupe de f (e , v) par la droite passant par l'origin e9
et faisant l'angle e avec l'axe 0Q . La transformée de Fourie r
uni-dimensionnelle de la fonction de convolution peut être
représentée comme une fonction de la fréquence t et est égal e
au produit d'une fenêtre rectangulaire Wo (e) et d'une fonctio n
rample IeI :Co (e) = II . wo (e)
(E3 .4 .8 )
La fenêtre est rendue nécessaire par le fait que l'intégral e
de la relation E3 .4 .4 n'est pas bornée sur le domaine . Cette%
fonction Co (Q, ) est de période égale au double de la fréquenc e
de coupure, et est localement symétrique autour de la médian e
de chaque période .
Le filtre utilisé est donc ce produit dans le domaine de l a
fréquence, la fenêtre optimale étant choisie pour supprime r
les artefacts indésirables (phénomène de repliement) et mini -
miser le bruit (hautes fréquences) .
Le calcul de la fonction de convolution par la définition
d'une fonction de fenêtre rectangle est une méthode très connu e
en traitement numérique d'images .
Comme l ' ont démontré Bracewell et Riddle (1967), et Vainshtei n
et Orlov (1972), une fonction rectangulaire telle qu e
Wo (Q) = 1 pour 12L.I
ec
= 0 partout ailleurs
(E3 .4 .9 )
permet d ' obtenir la fonction de convolution Co .
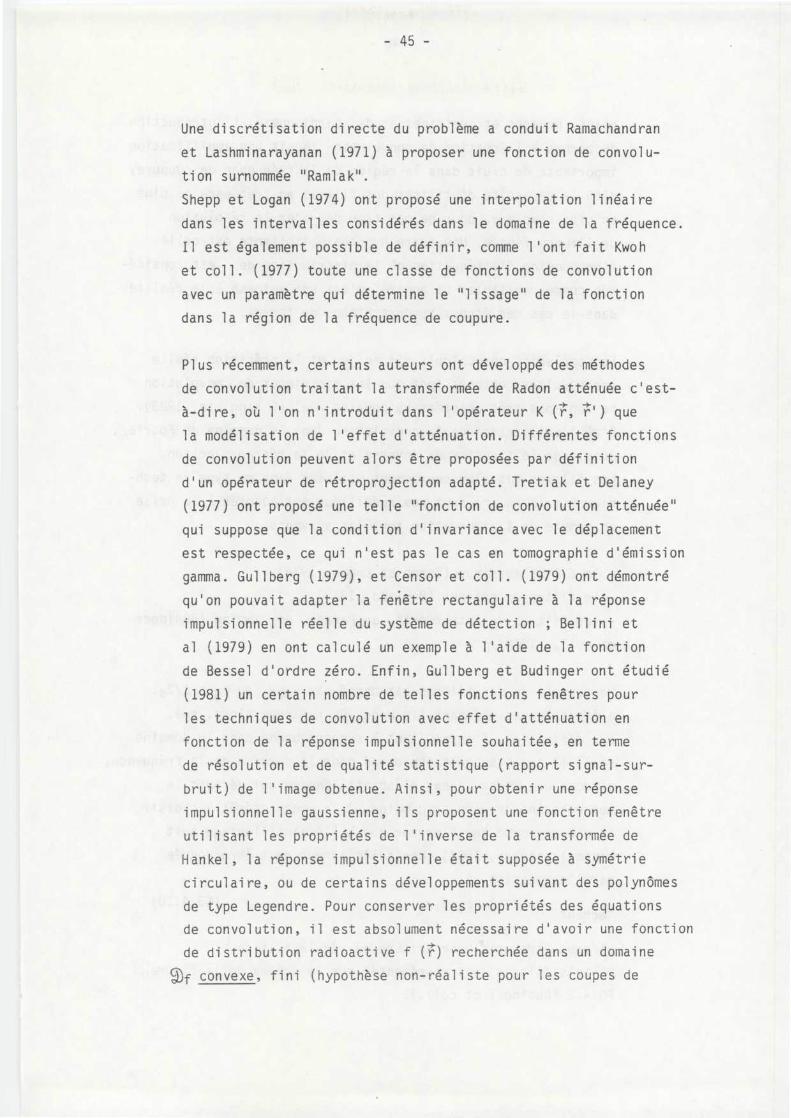
Une discrétisation directe du problème a conduit Ramachandra n
et Lashminarayanan (1971) à proposer une fonction de convolu-
tion surnommée "Ramlak" .
Shepp et Logan (1974) ont proposé une interpolation linéaire
dans les intervalles considérés dans le domaine de la fréquence .
Il est également possible de définir, comme l'ont fait Kwo h
et coll . (1977) toute une classe de fonctions de convolutio n
avec un paramètre qui détermine le "lissage" de la fonctio n
dans la région de la fréquence de coupure .
Plus récemment, certains auteurs ont développé des méthode s
de convolution traitant la transformée de Radon atténuée c'est-
à-dire, où l ' on n ' introduit dans l ' opérateur K (r, r ' ) qu e
la modélisation de l'effet d'atténuation . Différentes fonction s
de convolution peuvent alors être proposées par définitio n
d'un opérateur de rétroprojection adapté . Tretiak et Delaney
(1977) ont proposé une telle "fonction de convolution atténuée "
qui suppose que la condition d'invariance avec le déplacemen t
est respectée, ce qui n'est pas le cas en tomographie d'émissio n
gamma . Gullberg (1979), et Censor et coll . (1979) ont démontr é
qu'on pouvait adapter la fenêtre rectangulaire à la répons e
impulsionnelle réelle du système de détection ; Bellini e t
al (1979) en ont calculé un exemple à l'aide de la fonctio n
de Bessel d'ordre zéro . Enfin, Gullberg et Budinger ont étudi é
(1981) un certain nombre de telles fonctions fenêtres pou r
les techniques de convolution avec effet d ' atténuation en
fonction de la réponse impulsionnelle souhaitée, en term e
de résolution et de qualité statistique (rapport signal-sur-
bruit) de l'image obtenue . Ainsi, pour obtenir une répons e
impulsionnelle gaussienne, ils proposent une fonction fenêtre
utilisant les propriétés de l'inverse de la transformée d e
Hankel, la réponse impulsionnelle était supposée à symétri e
circulaire, ou de certains développements suivant des polynôme s
de type Legendre . Pour conserver les propriétés des équation s
de convolution, il est absolument nécessaire d'avoir une fonctio n
de distribution radioactive f (r) recherchée dans un domaine
$f convexe, fini (hypothèse non-réaliste pour les coupes de
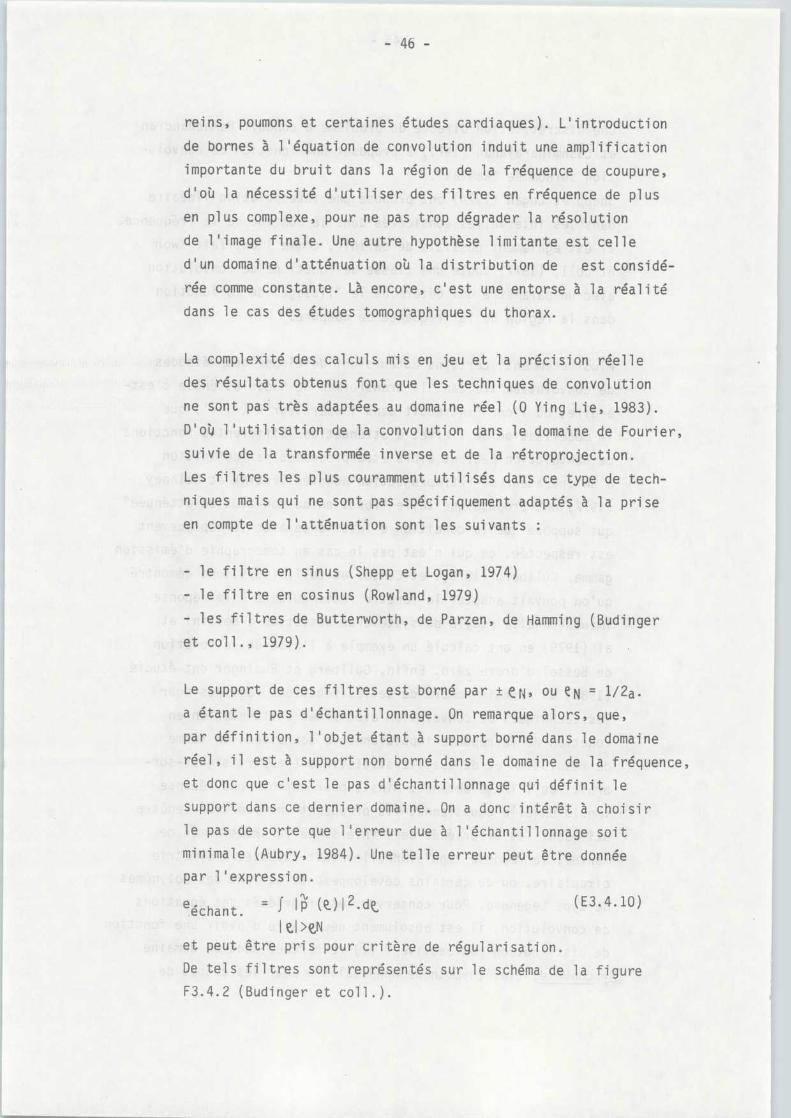
- 46 -
reins, poumons et certaines études cardiaques) . L'introductio n
de bornes à l'équation de convolution induit une amplificatio n
importante du bruit dans la région de la fréquence de coupure ,
d'où la nécessité d'utiliser des filtres en fréquence de plu s
en plus complexe, pour ne pas trop dégrader la résolutio n
de l'image finale . Une autre hypothèse limitante est cell e
d'un domaine d'atténuation où la distribution de est considé-
rée comme constante . Là encore, c'est une entorse à la réalit é
dans le cas des études tomographiques du thorax .
La complexité des calculs mis en jeu et la précision réell e
des résultats obtenus font que les techniques de convolutio n
ne sont pas très adaptées au domaine réel (0 Ying Lie, 1983) .
D'oj l'utilisation de la convolution dans le domaine de Fourier ,
suivie de la transformée inverse et de la rétroprojection .
Les filtres les plus couramment utilisés dans ce type de tech-
niques mais qui ne sont pas spécifiquement adaptés à la pris e
en compte de l'atténuation sont les suivant s
- le filtre en sinus (Shepp et Logan, 1974 )
- le filtre en cosinus (Rowland, 1979 )
- les filtres de Butterworth, de Parzen, de Hamming (Budinge r
et coll ., 1979) .
Le support de ces filtres est borné par + e r4, ou e N = 1/2a .
a étant le pas d'échantillonnage . On remarque alors, que ,
par définition, l'objet étant à support borné dans le domain e
réel, il est à support non borné dans le domaine de la fréquence ,
et donc que c'est le pas d'échantillonnage qui définit l e
support dans ce dernier domaine . On a donc intérêt à choisi r
le pas de sorte que l'erreur due à l'échantillonnage soi t
minimale (Aubry, 1984) . Une telle erreur peut être donnée
par l'expression .
ee-chant .= 1 11 (Q)1 2 .c%
LI> Net peut être pris pour critère de régularisation .
De tels filtres sont représentés sur le schéma de la figure
F3 .4 .2 (Budinger et coll .) .
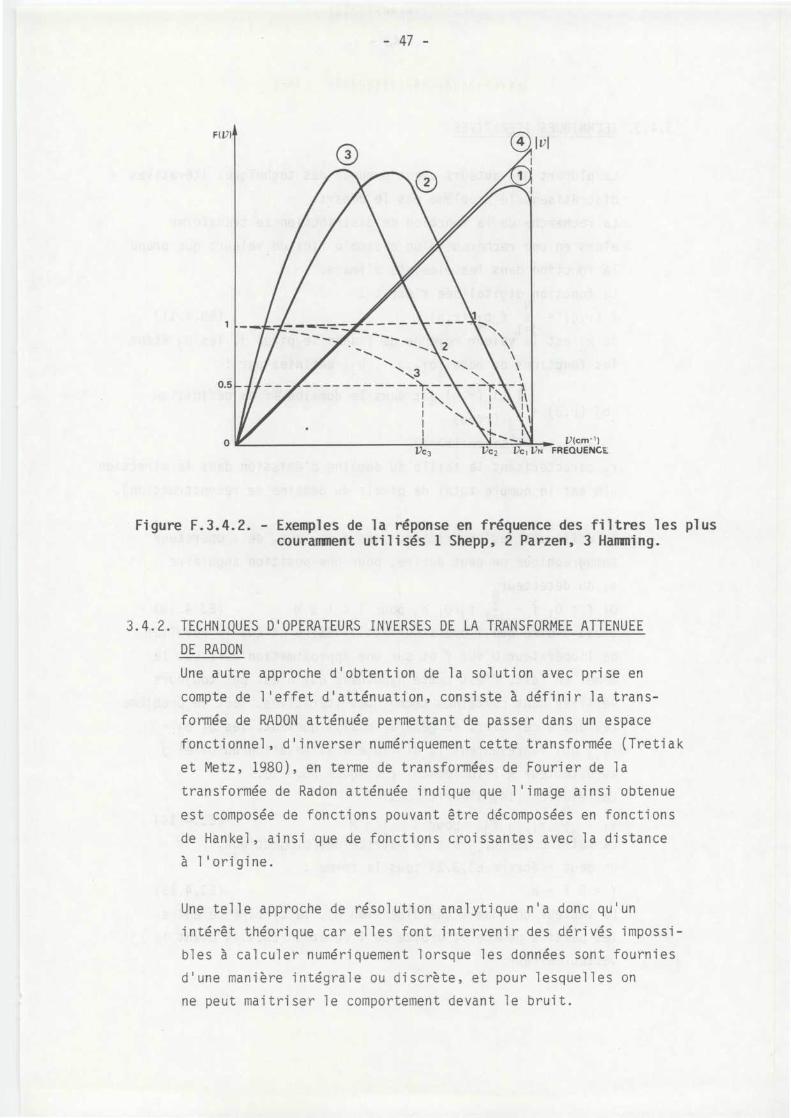
v
0.5
ocra-1Vc 2 Vc 1 VN FREQUENC EVc 3
Figure F .3 .4 .2 . - Exemples de la réponse en fréquence des filtres les plu scouramment utilisés 1 Shepp, 2 Parzen, 3 Hamming .
3 .4 .2 . TECHNIQUES D ' OPERATEURS INVERSES DE LA TRANSFORMEE ATTENUE E
DE RADON
Une autre approche d'obtention de la solution avec prise e n
compte de l ' effet d ' atténuation, consiste à définir la trans -
formée de RADON atténuée permettant de passer dans un espace
fonctionnel, d ' inverser numériquement cette transformée (Tretia k
et Metz, 1980), en terme de transformées de Fourier de l a
transformée de Radon atténuée indique que l ' image ainsi obtenue
est composée de fonctions pouvant être décomposées en fonction s
de Hankel, ainsi que de fonctions croissantes avec la distance
à l'origine .
Une telle approche de résolution analytique n'a donc qu'u n
intérêt théorique car elles font intervenir des dérivés impossi -
bles à calculer numériquement lorsque les données sont fournie s
d ' une manière intégrale ou discrète, et pour lesquelles o n
ne peut maitriser le comportement devant le bruit .
3 .4 .3 . TECHNIQUES 1TERATIVE S
La plupart des auteurs ayant propsoé des techniques itérative s
discrétisent le problème dès le départ .
La recherche de la fonction de distribution se transforme
alors en une recherche d'un ensemble fini de valeurs que pren d
la fonction dans les éléments d'image .
La fonction digitalisée s'écrit :N
f (r,e) = •~ fdbj (r,e)
(E3 .4 .11 )= 1
ou x• estJla valeur m enne de f dans le pixel
les b• étan tJ
oY
J~
J
les fonctions de base {b1, bj} définies par :
1 si (r,e) est dans le domaine Sf de définitio n
bj (r,e) = f- (r<re)
0 sinon (r>re )
re caractérisant la taille du domaine d'émission dans la direction
8(N est le nombre total de pixels du domaine de reconstruction) .
En utilisant les propriétés, vues plus haut, de l'opérateu r
tomographique on peut écrire, pour une position angulair e
ei du détecteu r
Oi f = Oi f = . E fj 0i b . pour 1
M
(E3 .4 .13 )J 1
c'est-à-dire que l'opérateur est linéaire et que le résulta t
de l'opérateur 0 sur f et sur une approximation de f est l e
même . En fait, c'est cette hypothèse qui n'est pas toujour s
vérifiée dans certaines techniques itératives . Tout le problèm e
revient à calculer, en général analytiquement, les Oi bj =
ri , j qui représentent la distance d'atténuation du pixel j
au détecteur à l ' incidence i (figure F3 .4 .3) .
La relation (14) s'écrit aussi :N
Yi =
ri,
fi
pour ïi
M
(E3 .4 .14 )-1
JLa matrice des r•,J • est la matrice des projections .r i
On peut réécrire E3 .3 .24 sous la forme :
Y = R f +e (E3.4.15 )
Le vecteur colonne e (de dimension M), la différence entre
les parties gauche et droite de l ' équation E3 .4 .14 étant l e
vecteur erreur .
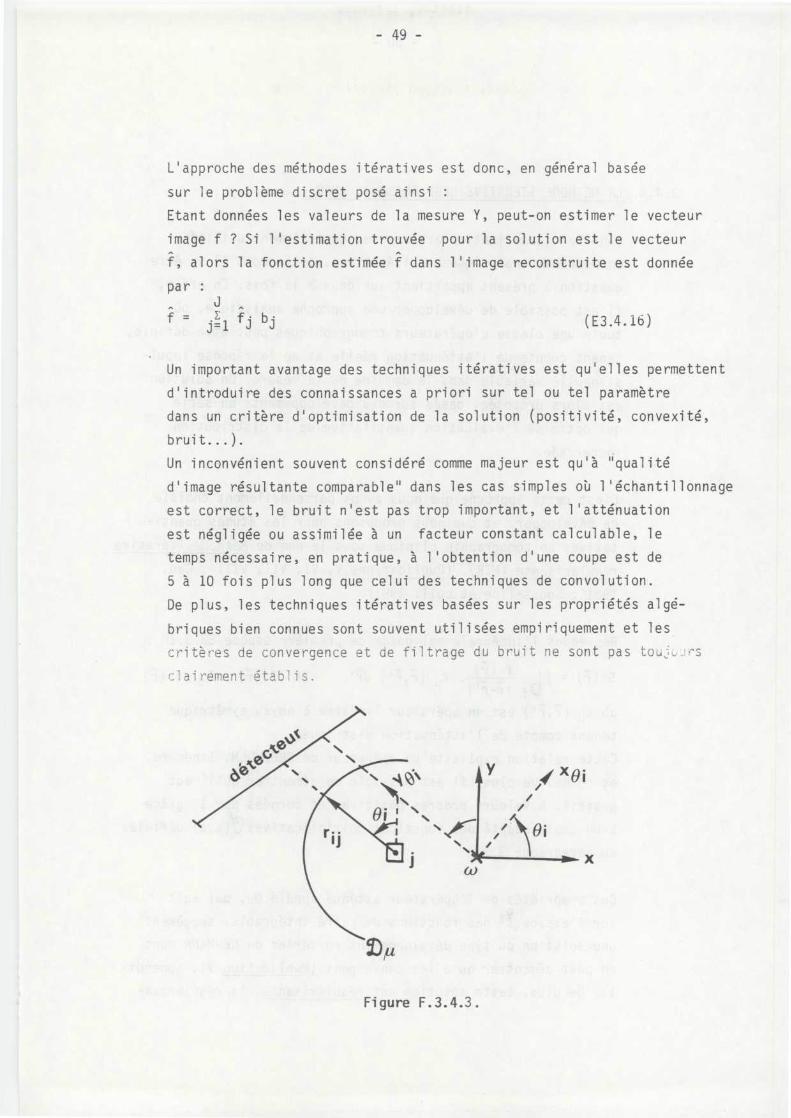
L ' approche des méthodes itératives est donc, en général basé e
sur le problème discret posé ainsi :
Etant données les valeurs de la mesure Y, peut-on estimer le vecteu r
image f ? Si l'estimation trouvée pour la solution est le vecteu r
f, alors la fonction estimée f dans l'image reconstruite est donné e
pa r
f =
E l fj b ijj
(E3 .4 .i6 )
J
Un important avantage des techniques itératives est qu'elles permetten t
d'introduire des connaissances a priori sur tel ou tel paramètre
dans un critère d'optimisation de la solution (positivité, convexité ,
bruit . . .) .
Un inconvénient souvent considéré comme majeur est qu'à "qualité
d'image résultante comparable" dans les cas simples où l'échantillonnag e
est correct, le bruit n ' est pas trop important, et l ' atténuation
est négligée ou assimilée à un facteur constant calculable, l e
temps nécessaire, en pratique, à l ' obtention d ' une coupe est de
5 à 10 fois plus long que celui des techniques de convolution .
De plus, les techniques itératives basées sur les propriétés algé-
briques bien connues sont souvent utilisées empiriquement et le s
critères de convergence et de filtrage du bruit ne sont pas tours
clairement établis .
1r
Figure F .3 .4 .3 .
- 50 =
3 .4 .4 . LA METHODE ITERATIVE REGULARISANTE (MIR )
Dans la classification arbitraire, généralement utilisée ,
en méthodes analytiques et itératives, celle dont il va êtr e
question à présent appartient aux deux à la fois . En effet ,
il est possible de développer une approche analytique, o ù
toute une classe d'opérateurs tomographiques peut être définie ,
tenant compte de l'atténuation réelle et de la réponse impul-
sionnelle variable dans le domaine de la mesure . Un solution
est alors proposée, basée sur des développements en séri e
qui optimise l ' évaluation quantitative de la distribution
recherchée .
C'est cette approche que nous avons personnellement choisi e
de développer, et que nous proposons pour les études quanti -
tatives en tomographie clinique sous le nom de Méthode itérativ e
régularisante (MIR) . (Publications V, VI, VII, VIII ; Cao ,
1981 ; Soussaline et coll . 1981) .
Reprenons l'intégrale mal posée de première espèce E3 .3 .1 O
}S (r) - ff
f(r)
-- 4-,
-rt,
ou S
= Ou f ( ) ~~
K
(r,r ) d
(r)
rI}r-rt
où Ku (jt,i) est un opérateur linéaire à noyau symétriqu e
tenant compte de l'atténuation distribuée .
Cette relation explicite un opérateur de FREDHOLM, linéaire ,
et borné . De plus, il est possible de démontrer qu'il es t
positif, à valeurs propres positives et bornées par 1 grâce
à un choix adapté des fonctions multiplicatives j(Q,e) définie s
au paragraphe 3 .3 .
Ces propriétés de l'opérateur atténué appelé Op, qui agi t
sur l ' espace 2 des fonctions de carré intégrable, suggèren t
une solution du type développement en séries de NEUMANN don t
on peut démontrer q u ' elles convergent (Publication VI, Appendi x
1) . De plus, cette solution est régularisante, la régularisa-
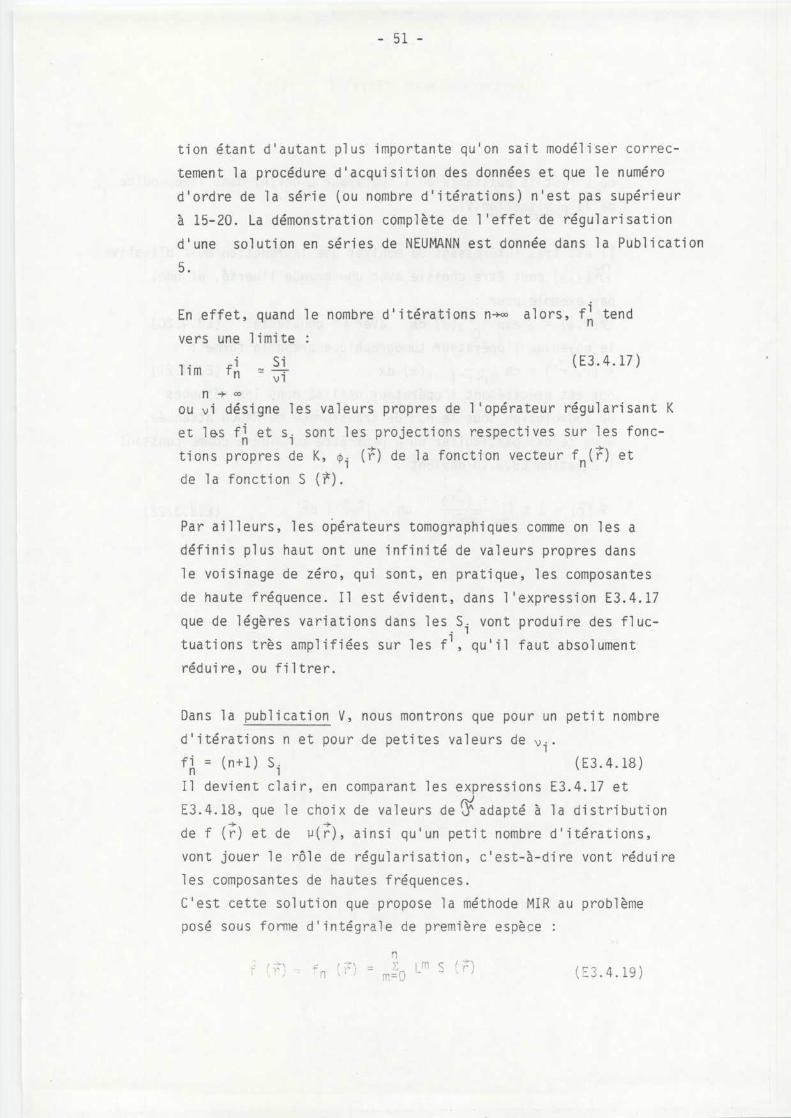
tion étant d ' autant plus importante qu ' on sait modéliser correc-
tement la procédure d'acquisition des données et que le numér o
d'ordre de la série (ou nombre d'itérations) n'est pas supérieu r
à 15-20 . La démonstration complète de l'effet de régularisation
d ' une solution en séries de NEUMANN est donnée dans la Publicatio n
5 .
En effet, quand le nombre d'itérations n-œ alors, fn ten d
vers une limite :
1
Si
(E3 .4 .17 )lim
fn = v in -}
ou vi désigne les valeurs propres de l'opérateur régularisant K
et l e.s f i et s . sont les projections respectives sur les fonc-etions propres de K, (p . (r) de la fonction vecteur f (r) e t
1
nde la fonction S (f) .
Par ailleurs, les opérateurs tomographiques comme on les a
définis plus haut ont une infinité de valeurs propres dan s
le voisinage de zéro, qui sont, en pratique, les composante s
de haute fréquence . Il est évident, dans l'expression E3 .4 .1 7
que de légères variations dans les S i vont produire des fluc -
tuations très amplifiées sur les fi , qu'il faut absolument '
réduire, ou filtrer .
Dans la publication V, nous montrons que pour un petit nombr e
d ' itérations n et pour de petites valeurs de v i .fn = (n+1) S i
(E3 .4 .18 )
I l devient clair, en comparant les expressions E3 .4 .17 e t
E3 .4 .18, que le choix de valeurs de
adapté à la distributio n~
de f (r) et de PM, ainsi qu ' un petit nombre d ' itérations ,
vont jouer le rôle de régularisation, c ' est-à-dire vont réduire
les composantes de hautes fréquences .
C'est cette solution que propose la méthode MIR au problèm e
posé sous forme d'intégrale de première espèce :
(E3 .4 .19 )n
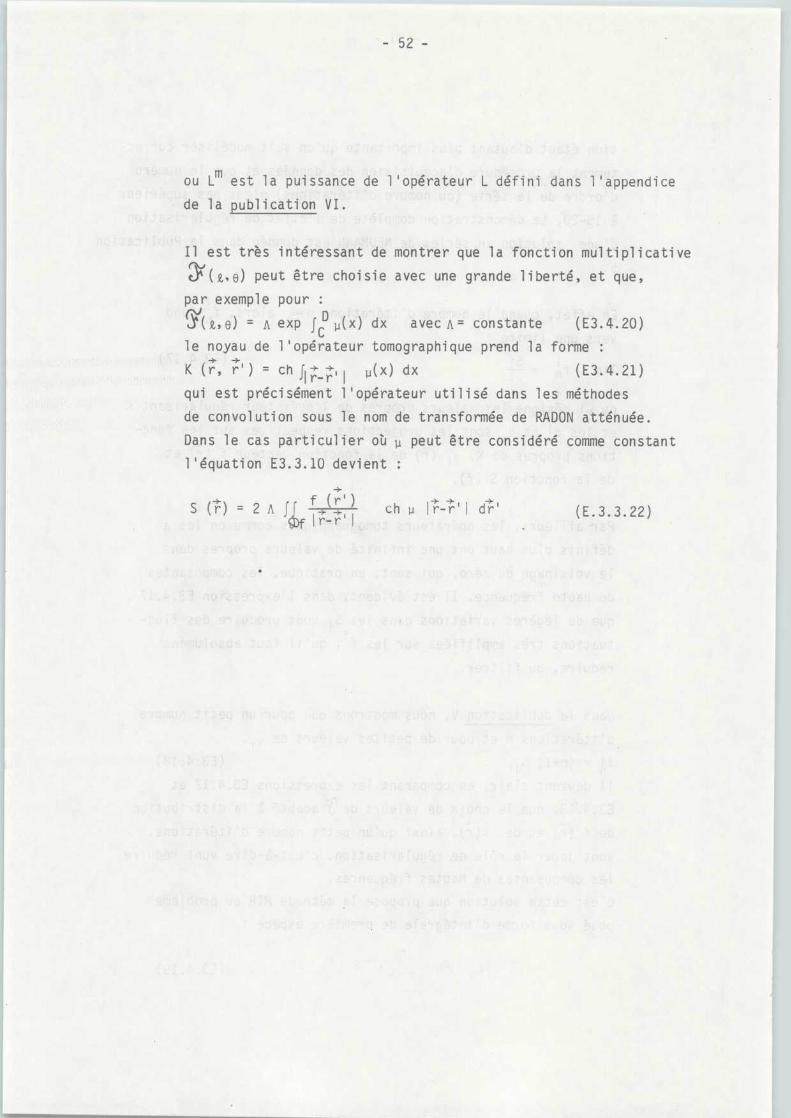
ou Lm est la puissance de l'opérateur L défini dans l'appendic e
de la publication VI .
I1 est très intéressant de montrer que la fonction multiplicative
(t,e) peut être choisie avec une grande liberté, et que ,
par exemple pou r
(AZ,e) = A exp fp(x) dx
avec A .= constante
(E3 .4 .20 )
le noyau de l'opérateur tomographique prend la forme
K (r, r' ) = chi-'
(x) dx
(E3 .4 .21 )~̀
qui est précisément l'opérateur utilisé dans les méthode s
de convolution sous le nom de transformée de RADON atténuée .
Dans le cas particulier où u peut être considéré comme constan t
l'équation E3 .3 .10 devient
(E .3 .3 .22)
- 53 -
CHAPITRE 3 - REFERENCES
AUBRY F . Mise en oeuvre d'une technique analytique régularisante e n
tomoscintigraphie, Thèse de Doctorat ès Science, Université de Paris -
Sud, 1984 .
BELLINI S, CAFFORIO C ., PIACENTINI M ., ROCCA F . Compensation of tissu e
absorption in emission tomography . IEEE-ASSP, vol . 27, N°3, 213-21 7
(1979) .
BRACEWELL
R .N .,
RIDDLE
A .C .
Inversion
of
fan-beam
scans
i n
radioastronomy, Astrophys . J ., vol . 150, 427-434 (1967) .
BROOKS R .A ., DI CHIRO G . Principles of computer assisted tomograph y
(CAT) in radiographic and radioisotopic imaging . Phys . Med . Biol . 21 ,
689-732 (1976) .
BUDINGER T .F ., GULLBERG G .T ., HUESMAN R .H . Emission computed tomography .
In image reconstruction from projections . Implementations an d
applications, G .T . Herman, ed ., Springer-Verlag, 1979, Berlin .
CAO A. Contribution au développement d'une méthode itérative
régularisante pour la correction de l'atténuation en tomographi e
d ' émission gamma, Thèse 3ème Cycle Electronique, Juillet 1981 .
CENSOR Y ., GUSTAFSON D .E ., LENT A ., TUY H . A new approach to the emissio n
computerized tomography problem : simultaneous calculation of attenuatio n
and activity coefficient, IEEE-NS, vol . 26, n°2, 2775-2779 (1979) .
CORMACK A . M . Representation of a function by its line integrals, wit h
some radiological applications, I, J . Appl . Phys ., 34, 2722-2727 (1963) .
GORDON R . A tutorial on ART (Algebraic Preconstruction Techniques )
IEEE Trans . Nucl . Sciences NS, 21, 78-93 (1974) .
GULLBERG G .T . The attenuated Radon transform, theory and applicatio n
in medicine and biology, Ph . D . Thesis, Lawrence Berkeley Laboratory ,
1979 .
GULLBERG G .T ., BUDINGER T .F . The use of fittering methods to compensate
for constant attenuation in single photon emission computed tomography ,
IEEE-BME, Vol . 28, N°2, 142-157 (1981) .
HERMAN G .T . Image reconstruction from projections . In Fundamental s
of computerized tomography, Academic Press, 1980 .
KUHL D .E .,
EDWARDS R .Q .
Image separation radioisotope scanning ,
Radiologiy, 80, 653-661 (1963) .
KWOH Y . S . , REED 1 . 5 . , TRUONG T .K . A generalized W-filter for three -
dimensional reconstruction, IEEE Trans . N .S ., VOL . 24, 1990-1998 (1977) .
MERSEREAU R .M ., OPPENHEIM A .V . Digital reconstruction of multidimensiona l
signals from their projections, Proc . IEEE, vol . 62, 1319-1338 (1972) .
MIKHLIN S .G . Completely continuous operators in mathematical physics
and advanced course . North Holland Pub . Comp ., Amsterdam, Chap . 7 ,
i970 .
NEDELKOV I .P . Improper problems in computational physics . Comp . Phys .
Commun . 4, 157-164 (1972) .
OLDENDORF W .H . IRG Transactions in Biomedical Electronics BME 8, 68 -
72 (1961) .
RADON J . Ueber die Bestimmung von Funktionen durch Ihre Integralwert e
Langs Gewisser manni gftl i gkei ten, Ber . Saech . Akad . Wis . Leipzig, Math .
Phys . VI, Vol . 69, 262-277 (1917) .
RAMACHANDRAN G .N ., LAKSHMINARAYANAN A .V . Three dimensional reconstructio n
from radiographs and electron micrographs : application of convolutio n
instead of Fourier transforms, Proc . Nat . Acad . US, vol . 68, 2236-2240
(1971) .
-55 -
ROWLAND J .W . Computer implementation of image reconstruction . In Image
reconstruction from projections . Implementations and applications ,
G .T . Herman ed ., Springer-Verlag, 197, Berlin .
SHEPP L .A ., LOGAN B .F . The Fourier reconstruction of a head section ,
IEEE Trans . N .S ., vol . 21, 21-43 (1974) .
SMITH P .R ., PETERS T .M ., BATES R .H . Image reconstruction from finite
number of projection, J . Phys . A . Math ., Nucl . Gen ., Vol . 6, 361-38 1
(1973) .
SOUSSALINE F ., CAO A ., LECOQ G ., RAYNAUD C . Attenuation correctio n
in the emission tomography reconstruction problem using a regularizin g
iterative method . In Proc . 19th Int . An . Meeting Europ . Soc . Nucl .
Med ., Berne, i yüi .
TRETIAK O .J ., DELANEY P . The exponential convolution algorithm fo r
emission computed axial tomography, A .B . Brill, R .R . Price, eds ., i n
Proc . of Information Processing in Medical Images, Vth Int . Conf . ,
266-278,,(1977) .
TRETIAK O ., METZ C . The exponential Radon transform . SIAM J . Appl .
Math ., Vol . 39, n°2, 341-354 (1980) .
TIKHONOV A ., ARSENNE V . Méthode de résolution de problèmes mal posés ,
ed . MIR, Moscou, 1976 .
VAINSHTEIN B .K ., ORLOV S .S . Theory of the recovery of functions fro m
their projections, Sov .Phys . Crysstallography, vol . 17, 213-216 (1972) .
YING-LIE O . Physical and mathematical principles of emission compute d
axial tomography, Progress Report, Univ . Hospital Utrecht, i983 .
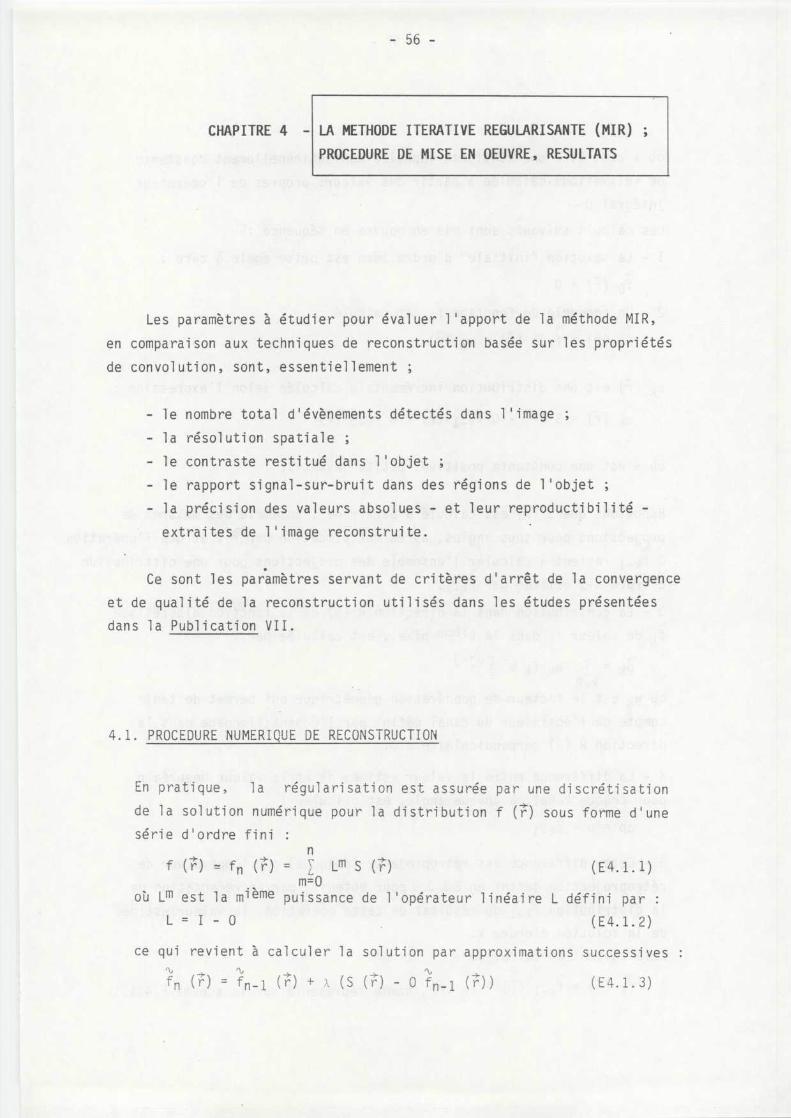
- 56 -
LA METHODE ITERATIVE REGULARISANTE (MIR) ;
PROCEDURE DE MISE EN OEUVRE, RESULTATS
Les paramètres à étudier pour évaluer l'apport de la méthode MIR ,
en comparaison aux techniques de reconstruction basée sur les propriété s
de convolution, sont, essentiellement ;
- le nombre total d'évènements détectés dans l'image ;
- la résolution spatiale ;
- le contraste restitué dans l'objet ;
- le rapport signal-sur-bruit dans des régions de l'objet ;
- la précision des valeurs absolues - et leur reproductibilité -
extraites de l'image reconstruite .
Ce sont les paramètres servant de critères d'arrêt de la convergenc e
et de qualité de la reconstruction utilisés dans les études présentée s
dans la Publication VII .
4 .1 . PROCEDURE NUMERIQUE DE RECONSTRUCTIO N
En pratique, la régularisation est assurée par une di scréti sati o n
de la solution numérique pour la distribution f {r) sous forme d ' une
série d ' ordre finin
f ( -t'-- )
fn ( -rt ) =
Lm s ut. )
(E4 .1 .1 )m= 0
où Lm est la mième puissance de l'opérateur linéaire L défini pa r
L = 1 - 0
(E4 .1 .2 )
ce qui revient à calculer la solution par approximations successive s
fn (r) =fn_1
+
(S (r) -Ofn-1 (r))
(E4 .1 .3 ){ )
CHAPITRE 4 -
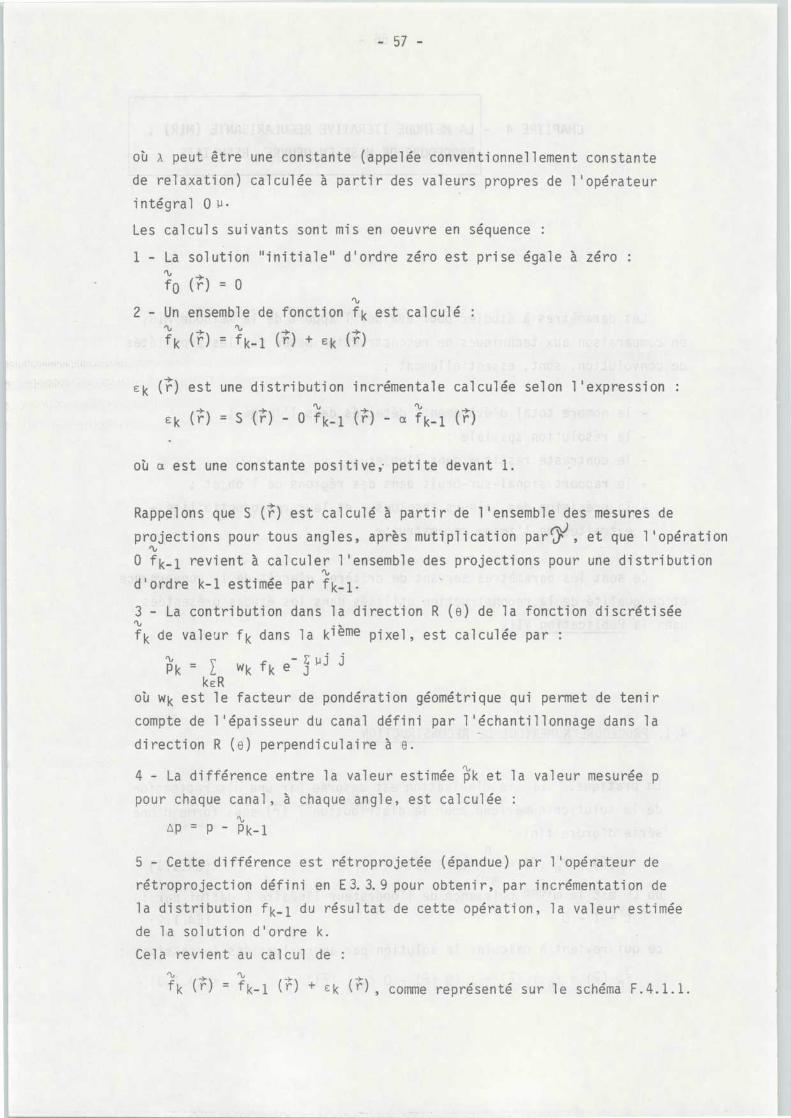
où x peut être une constante (appelée conventionnellement constant e
de relaxation) calculée à partir des valeurs propres de l'opérateu r
intégral 0 U .
Les calculs suivants sont mis en oeuvre en séquence :
1 - La solution "initiale" d'ordre zéro est prise égale à zéro :
f0 (r) = 0%
2 - Un ensemble de fonction fk est calculé :
fk (r) = fk-1 r+
(r )E ()
k
Ek (r) est une distribution incrémentale calculée selon l'expressio n
ti
Ek ( -Y) = S (r) - 0 fk_1 (r) - a fk_1 (r)
où a est une constante positive, petite devant 1 .
Rappelons que S Ci") est calculé à partir de l'ensemble des mesures d e
pour tous angles, après mutiPl i cati on P ~ar m , projections
et que l'opératio n%
0 fk_1 revient à calculer l'ensemble des projections pour une distributio n%
d'ordre k-1 estimée par f k-1 •
3 - La contribution dans la direction R (e) de la fonction discrétisé e%f k de valeur f k dans la k i eme pixel, est calculée par :
%=
wk fk e
JPk
JkER
où wk est le facteur de pondération géométrique qui permet de teni r
compte de l'épaisseur du canal défini par l'échantillonnage dans l a
direction R (e) perpendiculaire à e .
4 - La différence entre la valeur estimée pk et la valeur mesurée p
pour chaque canal, à chaque angle, est calculée :
tiip= P-Pk- 1
5 - Cette différence est rétroprojetée (épandue) par l'opérateur d e
rétropro jecti on défini en E3.3.9 pour obtenir, par incrémentation d e
la distribution fk_1 du résultat de cette opération, la valeur estimé e
de la solution d ' ordre k .
Cela revient au calcul de :
fk (r) = f k_1 (r) +Ek (r) , comme représenté sur le schéma F .4 .1 .1 .
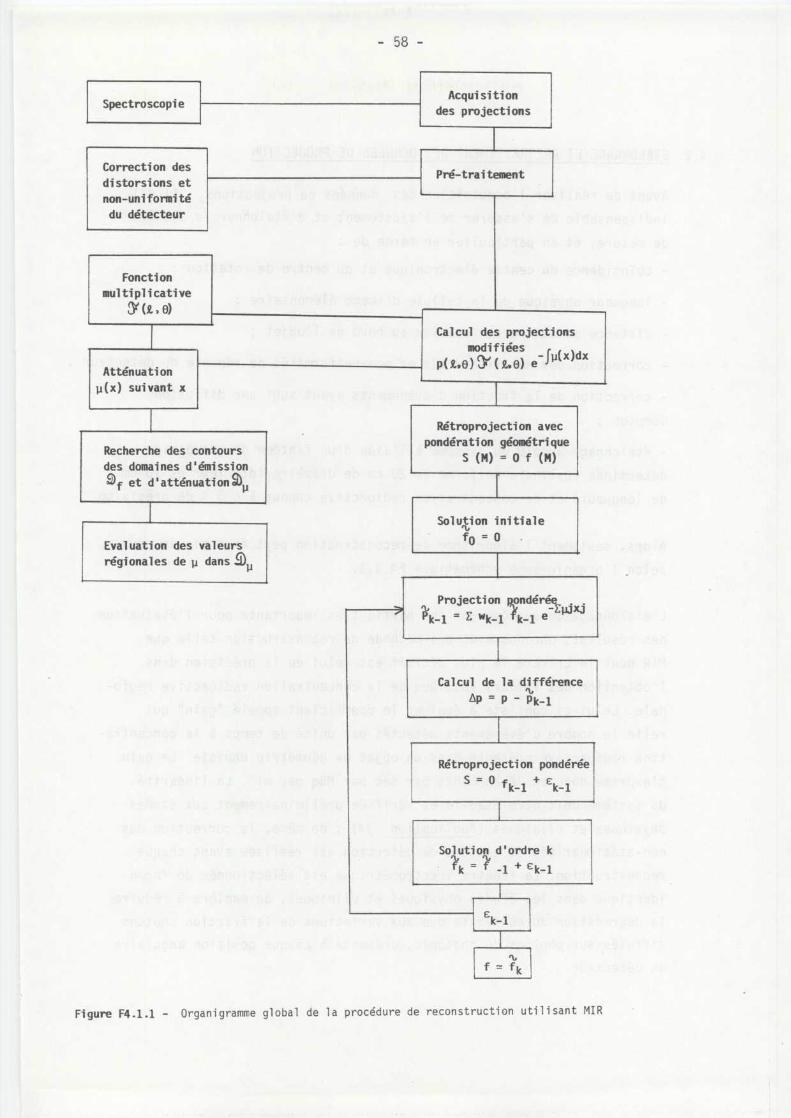
- 58 -
Spectroscopi e
Correction de s
distorsions et
non-uniformit é
du détecteur
Fonction
multiplicativ e
y (L o)
Atténuation
u(x) suivant x
Recherche des contour s
des domaines d'émissio n
af et d'atténuationk
Evaluation des valeurs
régionales de p dans @u
Acquisition
des projection s
Pré-traitemen t
Calcul des projections
modifiées
rl~,o
e- J U(x)dx
Rétroprojection ave c
pondération géométrique
S (M) = 0 f (M )
Solution initialetif0 = 0
Projection ondérée .xjk-1 = E wk-1 k-1 e
Calcul de la différenceti
AP =p- Pk- 1
Rétroprojection pondérée
S=0fk-l +ek- 1
Solution d ' ordre k
tek =f -1 +c k-1
ck-1
tifNfk
Figure F4 .1 .1 - Organigramme global de la procédure de reconstruction utilisant MIR
4 .2 . ETALONNAGE ET PRETRAITEMENT DES DONNEES DE PROJECTIO N
Avant de réaliser l'acquisition des données de projections, il est
indispensable de s'assurer de l'ajustement et d'étalonner le systèm e
de mesure, et en particulier en terme de :
- coincidence du centre électronique et du centre de rotation ;
- longueur physique de la cellule d'image élémentaire ;
- distance du centre de rotation au bord de l'objet ;
- correction des non-linéarités et non-uniformités de réponse du détecteur ;
- correction de la fraction d'évènements ayant subi une diffusio n
Compton ;
- étalonnage absolu du système à l'aide d'un fantôme de géométri e
déterminée (cylindre uniforme de 20 cm de diamètre intérieur et 10 cm
de longueur) et de concentration radioactive connue à < 3 % de précision .
Alors, seulement l'algorithme de reconstruction peut être mis en oeuvre ,
selon l'organigramme schématique F4 .1 .1 .
L'étalonnage du système est une partie très importante pour l'évaluatio n
des résultats obtenus avec une méthode de reconstruction telle qu e
MIR dont le critère le plus décisif est celui de la précision dan s
l'obtention des valeurs absolues de la concentration radioactive régio -
nale . Celui-ci consiste à évaluer le coefficient appelé "gain" qu i
relie le nombre d'évènements détectés par unité de temps à la concentra -
tion radioactive présente dans un objet de géométrie choisie . Le gai n
s'exprime donc en "évènements par sec par MBq par ml" . La linéarité
du système doit être établie et vérifiée préliminairement aux étude s
physiques et cliniques (Publication IX) ; de même, la correction de s
non-stationarités du système de détection est réalisée avant chaqu e
reconstruction . La fenêtre spectrométrique est sélectionnée de faço n
identique dans les études physiques et cliniques, de manière à réduir e
la dégradation du contraste due aux variations de la fraction photon s
diffusés sur photons du photopic, présente à chaque position angulaire
du détecteur .
4 .3 . MATERIEL ET METHODE
En pratique, les projections de la mesure sont acquises à angles équi -
distants répartis (32, 64 ou 128) sur les 360°de l'espace, ou, dan s
certains cas d'études cardiaques, seulement sur 180°, dans des matrice s
échantillonnées en 64 x 64 ou 128 x 128 .
Des simulations mathématiques permettant de modéliser des distribution s
d ' émission et d ' atténuation de géométries variées, ainsi que des simula -
tions physiques utilisant des fantômes cylindriques ou elliptique s
avec ou sans lésions de contraste et géométrie variés, ont été réalisée s
sur le système de détection et d ' acquisition des données numérique s
permettant d'obtenir les images cliniques . Il s'agit d'un système d'une
gamma-caméra tournante GE 400 T, connectée à un système Informatek SIMIS 3 ,
décrit dans la publication XII .
Les premières études mathématiques, conduites pour évaluer la solutio n
numérique elle-même, sont décrites en détail dans les publication s
VII et VIII . La plupart a été réalisée sur des géométries cylindriques ,
d'activité uniforme (de 100 évènements par cellule) simulant l a
détection de 80 000 évènements au total . Dans une première étape ,
un bruit statistique Poissonien a été additionné aux données de
projection ; l'atténuation du milieu a été supposée constante, l a
valeur du coefficient d'atténuation linéaire étant variable de
0 .10 à 0 .15 cm-1 .
Cette méthode a permis d'évaluer le comportement de la solutio n
en séries de NEUMANN d'ordre n pour une fonction multiplicative
choisie égale à
(,o) = a une constante définie par :
a = 1 2uR
2 7rR 1-exp l-2uR I
où R est le rayon du domaine d'émission . Dans le cas simple où les domaine s
d'émission et d'atténuation sont superposés, cette fonction multiplicativ e
a permis d'obtenir les meilleurs résultats, en terme de concentratio n
absolue par pixel, retrouvée dans l'image reconstruite, en un peti t
nombre d'itérations, et du bruit propagé par cellule .
Une valeur optimale de x peut être trouvée pour obtenir une régu-
larisation maximum, à la troisième itération, pour un contraste minimum ,
puisque dans le cas considéré le profil de l'image reconstruite devrai t
tendre vers l'horizontale . Cette valeur est estimée à partir de l a
borne des valeurs propres de l'opérateur symétrique .
On a également testé la sensibilité de l'algorithme aux variation s
en taille et en forme du domaine d'atténuation, relativement au domain e
d'émission . En utilisant comme critère de convergence l'intégrale de s
évènements présents dans l'image tomographique reconstruite, par compa-
raison à celle introduite dans les projections simulées, on a simul é
des erreurs dans la détection du contour du domaine d'atténuation d e
± 20 % . On a montré que l'image de la distribution pouvait tou t
de même être uniforme avec une erreur dans la concentration absolu e
par pixel correspondant à la valeur simulée,corrigée du rapport de s
surfaces (domaine réel sur domaine évalué en erreur) ; les
incertitude s
relatives par pixel étaient inférieures à 3 % .
Des études analogues ont permis d'établir la sensibilité de la méthod e
MIR aux variations de la valeur de u, par pas de 0 .01 cm- 1 , introduite s
soit au niveau de la simulation des données, soit au niveau de la pro-
cédure de reconstruction (Publication VII) . Plus l'atténuation es t
importante, avec une même valeur de la constante de relaxation À, plu s
le nombre d ' itérations nécessaires pour atteindre une solution à nivea u
signal-sur-bruit donné sera grand .
On montre cependant, par l ' ensemble de ces simulations mathématiques ,
que la méthode MIR est toujours capable de fournir une solution pou r
laquelle le nombre total d ' évènements évalué dans l ' image reconstruit e
du domaine de la distribution d ' émission est aussi proche que possible
(erreur < 7 %) de la valeur réellement introduite ; et ceci même pou r
des déviations importantes de la taille et de la forme du domaine d e
reconstruction, ou du facteur d ' atténuatton . Le nombre d ' itération s
nécessaire à la convergence est toujours inférieur à 10 .
4 .4 . RESULTATS DES ETUDES PHYSIQUES ETCLINIQUE S
De nombreuses études physiques où la présence de bruit statistiqu e
réel et surtout d'évènements Compton rend la simulation plus proche
de la réalité clinique ont été conduites pour évaluer les performance s
de la-méthode MIR, plus particulièrement en ce qui concerne l ' améliora-
tion du contraste des lésions froides, la résolution spatiale (source s
chaudes de petites dimensions) et la propagation du bruit . Nous avon s
dû introduire une valeur du coefficient d'atténuation linéaire "effective" ,
c'est-à-dire inférieure à la valeur théorique de 0 .15 cm- 1 pour 140 keV ,
pour tenir compte de l ' effet Compton, en première approximation . L à
encore, une solution satisfaisant aux critères de convergence et d e
régularisation peut toujours être trouvée avant la dixième itération .
La possibilité de prendre en compte des coefficients variables d'atténuatio n
dans le domaine ,(4 a été étudiée dans le cadre des études tomographique s
cérébrales, à l'aide d'un traceur permettant de mesurer une fonctio n
cellulaire cérébrale (123I- iodo-amphétamine, IAMP) .
La configuration géométrique de ce modèle a été simulée mathématiquemen t
par deux ellipses concentriques .
L ' ellipse interne représent e
le domaine d ' émission, dans lequel on peut placer des hétérogénéité s
circulaires, et, en même temps, un premier domaine d'atténuation équiva-
lent à l'eau ;l'espace entre ellipse externe et l'ellipse interne repré -
sente
un deuxième domaine d ' atténuation,équivalent à l ' os .
Cette étude a permis de véri fi er, dans ce cadre, l ' efficacité des critère s
d'arrêt choisis pour la mise à oeuvre de la méthode . De même, sa sensi-
bilité au choix du contour d'atténuation trouvé automatiquement au cour s
de la première itération est évaluée, ainsi que des valeurs de coefficients
d'atténuation linéaire effectifs, lors des itérations successives .
Des erreurs de l'ordre de 10 % dans la forme des contours et/ou dan s
les p effectifs entraînent une erreur de 4 à 12 % dans la valeur moyenn e
d'évènement par cellule dans le domaine d'émission (Publication VII) .
Pour évaluer la méthode sur des données cliniques, un fantôme physiqu e
reproduisant un cerveau de verre grandeur nature placé,ou pas, dan s
un crâne
a été utilisé, d'une part pour mesurer physiquement ,
à l'aide d'une étude de transmission, les coefficients d'atténuatio n
effectifs (POS = 0 .15 cm-1, Peau = 0 .12 cm- 1 ), et, d'autre part, étalonne r
le système en absolu lorsque le cerveau est rempli uniformément d e
solution radioactive (figure F4 .4 .1) . Cette étude est décrite dans l a
publication VIII .
Les études cliniques préliminaires à 1 ' 123I-IAMP qui ont été rendue s
possibles par cet étalonnage ont montré une précision accrue (inde x
de symétrie de 4 % pour les cas normaux) dans l'obtention des rapport s
(droite/gauche) de valeurs régionales des activités cellulaires cérébra -
les . L'incertitude relative dans ces régions de 6 cm3 est de 12 % pou r
300 K évènements au total . Une évaluation rigoureuse de l'apport d e
la méthode de reconstruction au sens de l'amélioration des donnée s
quantitatives absolues doit inclure une vérification avec valeurs d e
contrôle, par exemple sur un animal que l'on peut sacrifier . Un exempl e
d'une étude clinique est représenté sur les figures F4 .4.2 .
Les plus importants développements en cours pour l'évaluatio n
d'une telle méthode résident dans l'introduction effective d'une distri-
bution d'atténuation - ou au moins,dans une première étape,de région s
où le coefficient d ' atténuation a une valeur différente- au nivea u
du thorax et de l ' abdomen .
Dans ce cas, plus encore que pour celui des reconstructions de coupe s
cérébrales où le modèle à double ellipse peut suffire le plus souvent ,
il est essentiel de réduire les temps de calcul par itération, ce qu i
peut être réalisé par des calculs matriciels en parallèle à l ' aid e
de processeurs associés à l'unité centrale du système de traitement .
(Publication VIII) .
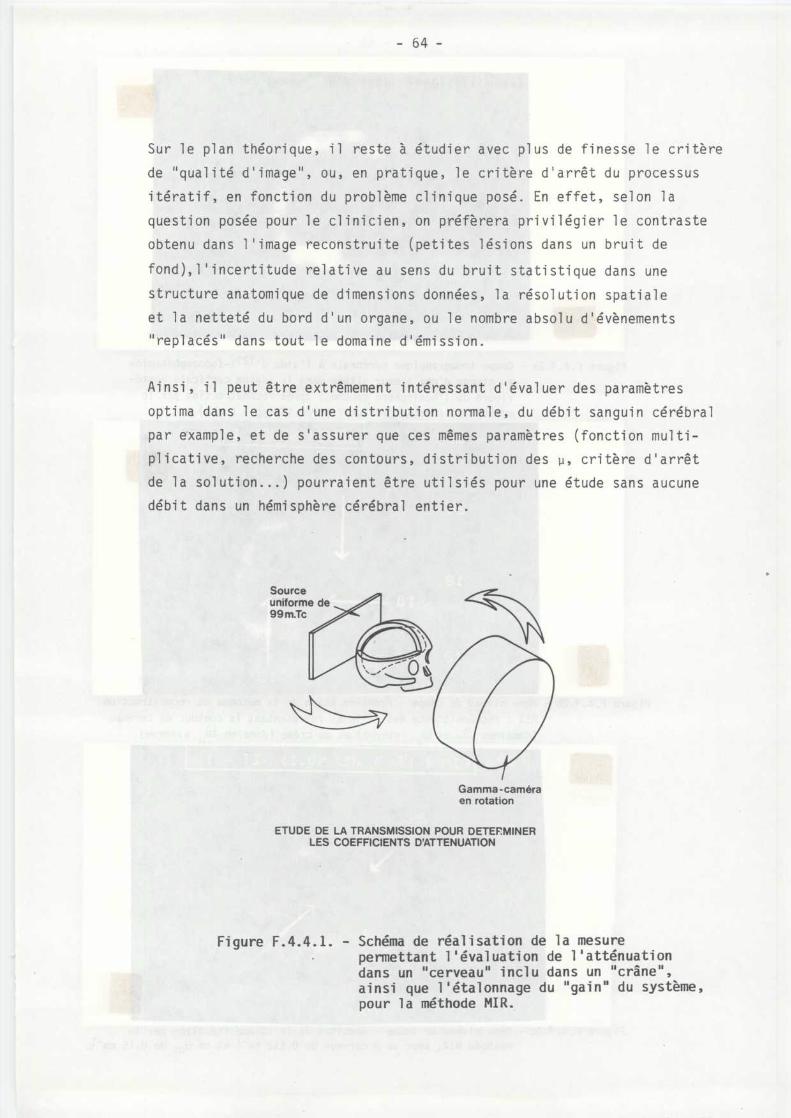
Sur le plan théorique, il reste à étudier avec plus de finesse le critèr e
de "qualité d'image", ou, en pratique, le critère d'arrêt du processu s
itératif, en fonction du problème clinique posé . En effet, selon l a
question posée pour le clinicien, on préfèrera privilégier le contrast e
obtenu dans l ' image reconstruite (petites lésions dans un bruit de
fond),l'incertitude relative au sens du bruit statistique dans un e
structure anatomique de dimensions données, la résolution spatial e
et la netteté du bord d'un organe, ou le nombre absolu d'évènement s
" replacés " dans tout le domaine d ' émission .
Ainsi, il peut être extrêmement intéressant d'évaluer des paramètre s
optima dans le cas d'une distribution normale, du débit sanguin cérébra l
par example, et de s'assurer que ces mêmes paramètres (fonction mul ti-
plicative, recherche des contours, distribution des p, critère d'arrê t
de la solution . . .) pourraient être utilsiés pour une étude sans aucune
débit dans un hémisphère cérébral entier .
Gamma-caméraen rotatio n
ETUDE DE LA TRANSMISSION POUR DETERMINE RLES COEFFICIENTS D'ATTENUATIO N
Figure F.4.4 .1 . - Schéma de réalisation de la mesurepermettant l'évaluation de l'atténuation
A
dans un " cerveau " inclu dans un " crane ,ainsi que l ' étalonnage du " gain " du système ,pour l a méthode MIR .
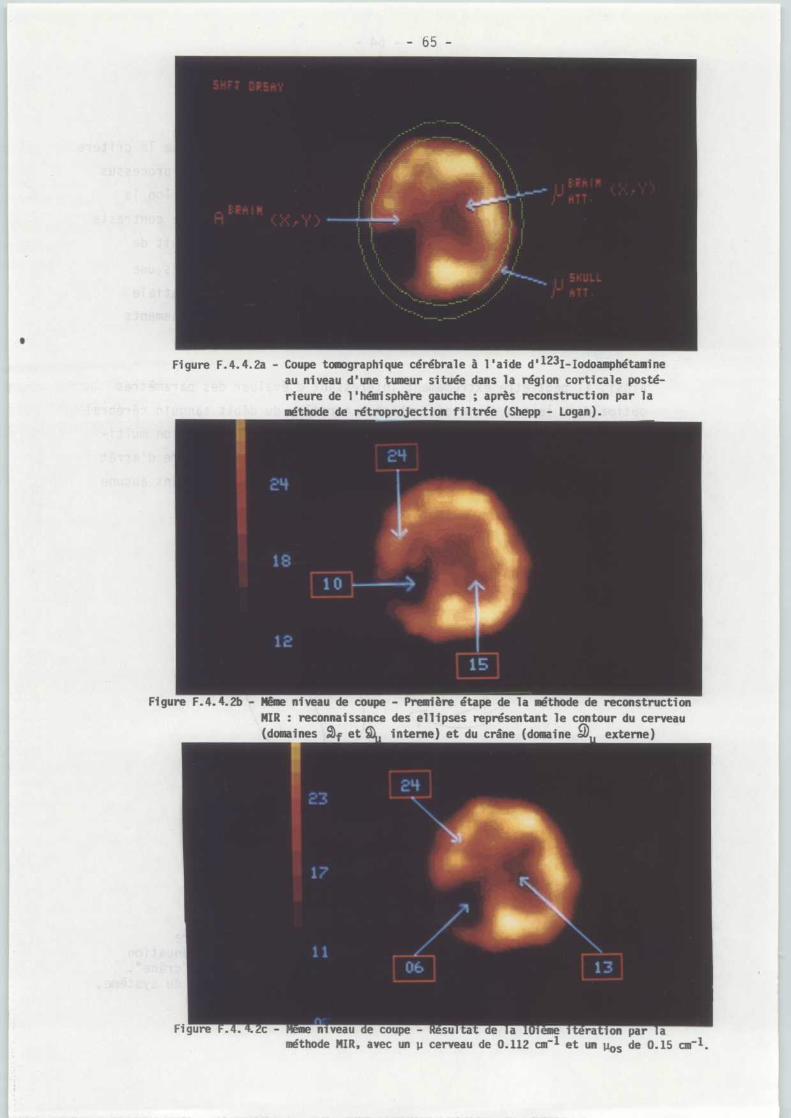
— 65 —
s
Figure F.4.4.2a - Coupe tomographique cérébrale à l'aide d ' 123I-Iodoamphétamine
au niveau d'une tumeur située dans la région corticale posté -
rieure de l'hémisphère gauche ; après reconstruction par l a
méthode de rétroprojection filtrée (Shepp - Logan) .
Figure F.4.4.2b - Même niveau de coupe - Première étape de la méthode de reconstructionMIR : reconnaissance des ellipses représentant le contour du cerveau(domaines
et
interne) et du crâne (domaine
externe )
Figure . .
c - . w • niveau ' e coupe - 'esu a ' e a S I eme iteration par améthode MIR, avec un p cerveau de 0 .112 cm-1 et un Uos de 0.15 cm-1 .
- 66 -
CHAPITRE 4 - REFERENCE S
SOUSSALINE F ., LE COQ G ., BIDAUT L ., HERMOUCHE D . A regularizing method
for ill-posed problems : Applications to quantitative reconstructio n
in single-photon emission computed tomogrphy . In Information Processin g
in Medical Imaging, Proc . of VIIIth Int . Conf ., Bruxelles, Deconninc k
F . ed ., Sept . 1983, sous presse .
SOUSSALINE F ., CAO A ., LECOQ G . Single-photon emission compute d
tomography using a regularizing iterative method for attenuatio n
correction, in Information Processing in Medical Imaging, proc . VIIth
Int . Conf ., Stanford, Gori s M . ed ., June 1981 .
FACTEURS PHYSIQUES LIMITANT LA QUANTIFICATIO N
EN TOMOGRAPHIE D'EMISSIO N
Avec l'expérience d'une dizaine d'années en traitement d'image convention-
nelle (projection plane), les caractéristiques et les causes de brui t
sont devenues familières à l'utilisateur de ces données, et les limita -
tions qu'elles imposent sont clairement comprises et généralement prise s
en compte . Cependant, l'utilisation des même critères de qualité d'image
et de causes de bruit en tomographie d'émission qu'en imagerie convention-
nelle pourrait conduire à des résultats complètement erronés .
En particulier, il peut sembler banal de penser que l'image est d'autan t
meilleure qu ' un grand nombre d ' évènements est accumulé pour la former . E n
fait, des systèmes de tomographie peuvent être conçus pour augmenter leu r
sensibilité c'est-à-dire être capables d'acquérir un grand nombre d'évè-
nements pendant un temps donné, et néanmoins produire des images de
qualité moins bonne que d'autres systèmes réputés moins sensibles, pou r
la simple raison que le système considéré plus sensible est sans dout e
moins apte à discriminer les évènements caractérisant le bruit, (diffusio n
Compton, par exemple) . Un autre moyen d ' obtenir un meilleur rapport
signal-sur-oruit
dans
une
image
tomoyraphique à l'aide
d'un système moins sensible peut être d'utiliser une i reform ti o n
supplémentaire telle que la mesure du temps de vol, ou différence e n
temps d'arrivée sur une paire de détecteurs des photons issus de l'anni-
hilation des positons dans la matière . Il est clair, en fait, que chacu n
des photons ou des "évènements " détectés comme tels ne contribue pa s
de la même façon à la qualité de l'image formée, ni à la précision ave c
laquelle on va pouvoir mesurer la concentration radioactive régionale .
Ainsi, dans le but d ' obtenir des données quantitatives, telles que de s
volumes ou des concentrations radioactives régionales en valeur absolue ,
CHAPITRE 5 -
il est nécessaire de déterminer les paramètres caractérisant un systèm e
tomographique qui contribuent à la procédure de mesure proprement dite ,
et en limitent la précision . La majorité d'entre eux sont communs au x
deux techniques de tomographie : gamma et positons . Bien que,dans l a
l i ttérature, l es auteurs (Jaszczak, 1981 ; Todd-Pokropek, 1983 ; Budinger ,
1980, Hoffman, 1976,1982) .ont pratiquement toujours traité séparémen t
ce qui est désigné sous le terme de "causes de bruit" en tomographi e
d'émission gamma (TEG) ou en tomographie d'émission de positons (TEP) ,
nous traiterons ici l'ensemble de ces paramètres en les différencian t
selon leur origine et en les abordant selon trois aspects :
- description analytique des facteurs affectant l'obtention des image s
tomographiques ;
- effet de ces facteurs sur la détectabilité des réyions lésionnelle s
et leu r - influence sur les limitations de la précision des données tomo-
graphiques quantitatives .
La Publication IX contient des exemples des conséquences sur les donnée s
quantitatives de ces paramètres .
- 69 -
5 .1 . FACTEURSLIES AL'ACQUISITIONDES DONNEE S
La première étape consiste à examiner les paramètres intervenan t
au niveau de l ' acquisition des données et qui sont donc liés à l ' instru -
mentation utilisée .
Il s'agit essentiellement :
- des non-uniformités de réponse dans le volume sensible du détecteu r
utilisé ;
- des échantillonnages spatiaux ou angulaires incomplets ;
- des variations de la fonction de réponse du système de détectio n
avec la distance entre l'objet radioactif et le plan du détecteur ;
- de l'effet des photons ayant subi une (ou plusieurs) diffusio n
par effet COMPTON ;
- de l'atténuation des photons lors de leur traversée des tissu s
eux-mêmes, avant d'être détectés .
5 .1 .1 . REPONSE NON-UNIFORMEDANSLE PLAN DE DETECTION
Dans le terme de réponse , on inclut les fonctions de réponse d u
système de détection dans les trois directions de l'espace . Dan s
la notation géométrique la plus répandue, la réponse en X représente
les projections linéaires obtenues lors de l'acquisition tomographique ,
la réponse en Y tient compte des éventuelles variations avec l a
distance entre un point source et l ' arc sur lequel on projette e n
X (profondeur tomographique), et la réponse en Z représente l a
discrétisation en coupes tomographiques successives, contigüe s
ou non, selon l'axe longitudinal du patient . Toute variatio n
systématique de la réponse du système selon ces trois direction s
sera considérablement amplifiée par l ' acquisition tomographiqu e
elle-même, et il peut en résulter d'importants artefacts dan s
dans les données obtenues .
L'importance relative de ces différents artefacts doit être étudiée
pour concevoir les instruments et les techniques numériques d e
correction des non-stationnarités résultantes ; le but ultime
étant de choisir l'instrument approprié fournissant les donnée s
les plus fidèles cliniquement, et ce pour chaque type d'étude
clinique considérée .
Nous avons vu au chapitre 3 que, dans les techniques de reconstruc-
tion, on fait l'hypothèse que la sensibilité du système d'acqui-
sition est stationnaire dans l'espace volumique auquel on s'intéresse .
En particulier, on suppose que la fonction de réponse du système
est identique le long de chaque direction orthogonale de projection .
Cette hypothèse reste effectivement tolérable pour certains ins-
truments de détection tomographique? en particulier les premier s
systèmes à très petit nombre de détecteurs individuels, ave c
translation et rotation successives . Elle est fausse dans l e
cas des systèmes basés sur des gamma-caméras en rotation, e t
aussi dans une certaine mesure, pour les systèmes spécialisés ,
pour lesquels l'uniformité dans le champ de la caméra n'est pa s
meilleure que 3 %, même pour les nouvelles générations de caméra s
digitalisées (figure 5 .1 .1 .) . Les effets de cette non-uniformit é
sur la précision des mesures et les artefacts circulaires produit s
dans les images tomographiques ont été étudiés dès 1979 à Orsa y
(Publicationx IX et X, Todd-Pokropek et coll ., 1980 ; Soussaline
et coll ., 1981 ; Larsson, 1980) . La figure F .5 .1 .1 . montre deux
images tomographiques, et leur profil selon le diamètre de l'objet ,
obtenues à travers un cylindre de 20 cm de diamètre rempli unifor-
mément de 99mTc, placé perpendiculairement à l'axe de rotation .
L'image de droite correspond à une reconstruction par rétroprojec-
tion filtrée, sans correction par un module câblé dans la caméra
de la non-uniformité de réponse de celle-ci . On observe alor s
d'importantes dépressions centrées sur l'axe de rotation rée l
de la caméra - et non pas sur le centre du cylindre radioactif -
appelés " artefacts " circulaires . Ces anneaux sont considérablement
atténués lorsqu'on corrige les évènements lors de leur acquisitio n
en temps réel, des non-uniformités de réponse de la caméra .
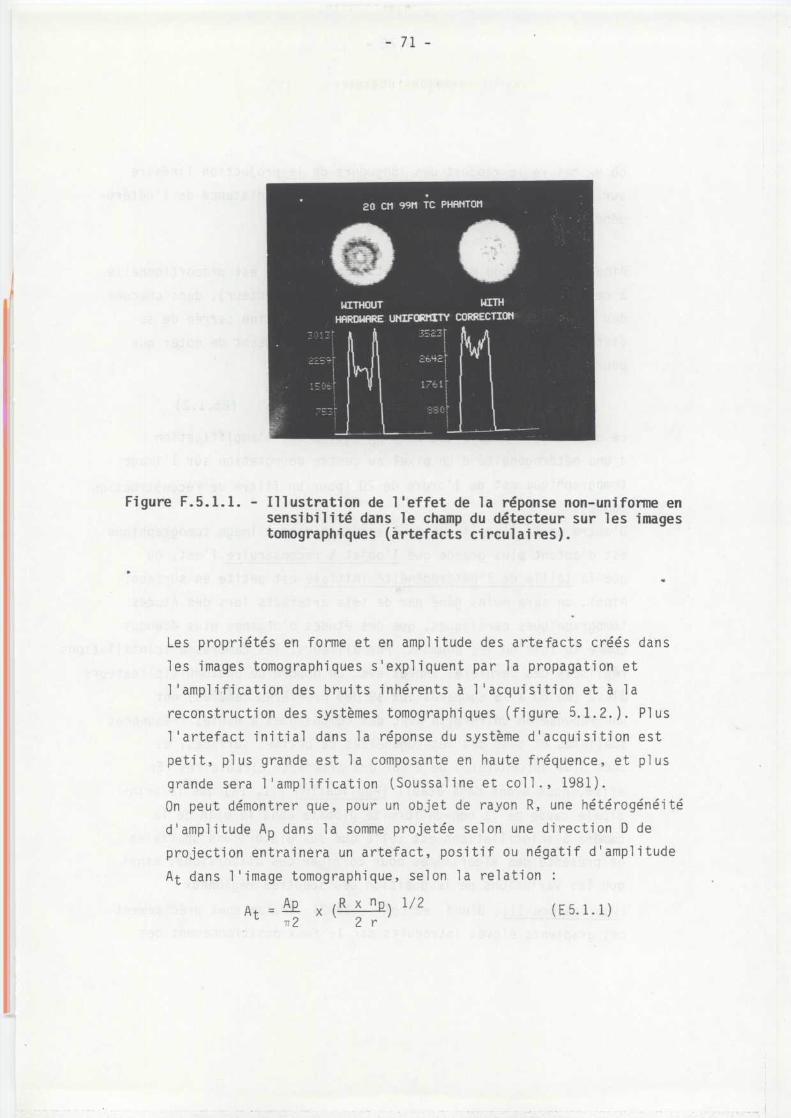
Figure F .5 .1 .1 . - Illustration de l'effet de la réponse non-uniforme e nsensibilité dans le champ du détecteur sur les image stomographiques (àrtefacts circulaires) .
Les propriétés en forme et en amplitude des artefacts créés dan s
les images tomographiques s'expliquent par la propagation e t
l ' amplification des bruits inhérents à l ' acquisition et à l a
reconstruction des systèmes tomographiques (figure 5 .1 .2 .) . Plu s
l'artefact initial dans la réponse du système d'acquisition es t
petit, plus grande est la composante en haute fréquence, et plu s
grande sera l ' amplification (Soussaline et coll ., 1981) .
On peut démontrer que, pour un objet de rayon R, une hétérogénéit é
d ' amplitude Ap dans la somme projetée selon une direction D d e
projection entrainera un artefact, positif ou négatif d ' amplitud e
At dans l ' image tomographique, selon la relation :
A t = 1\11 x ( R xn p ) 1/ 2
t
~r 2
2 r(E 5.1 .1)
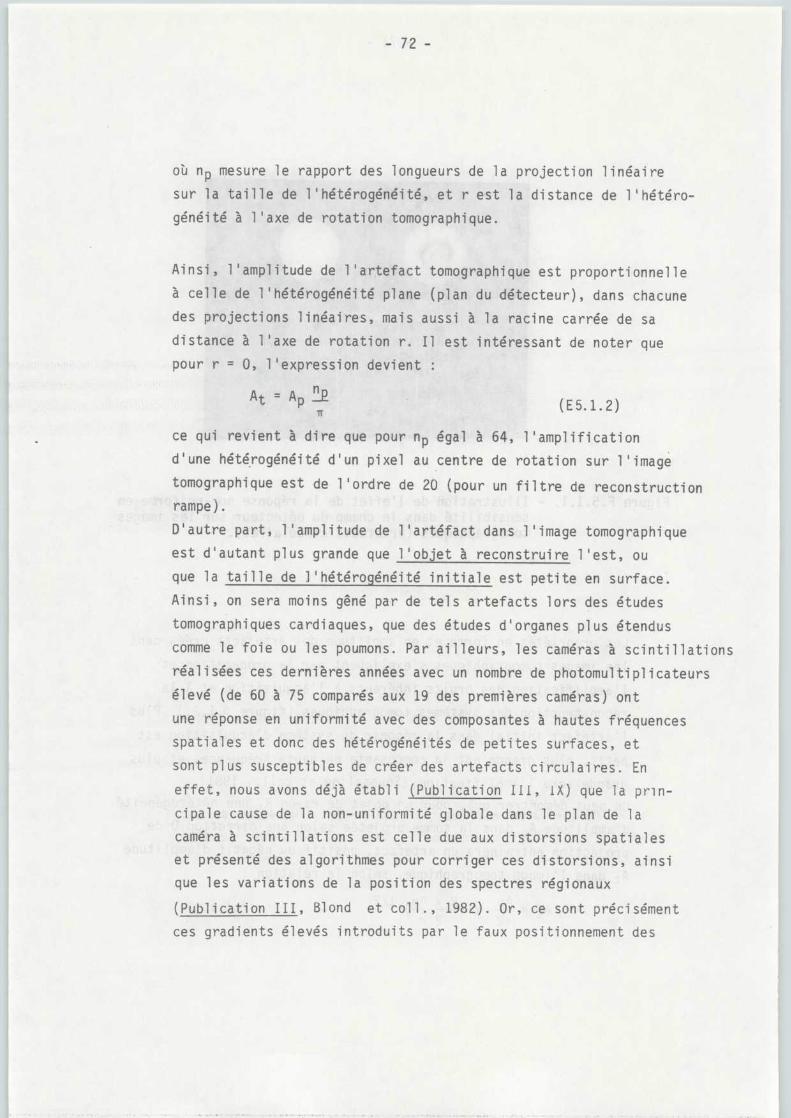
où np mesure le rapport des longueurs de la projection linéair e
sur la taille de l'hétérogénéité, et r est la distance de l'hétéro-
généité à l'axe de rotation tomographique .
Ainsi, l'amplitude de l'artefact tomographique est proportionnell e
à celle de l ' hétérogénéité plane (plan du détecteur), dans chacun e
des projections linéaires, mais aussi à la racine carrée de s a
distance à l'axe de rotation r . Il est intéressant de noter qu e
pour r = 0, l'expression devient :
(E 5 .1 .2 )
ce qui revient à dire que pour np égal à 64, l'amplificatio n
d'une hétérogénéité d'un pixel au centre de rotation sur l 'imag e
tomographique est de l'ordre de 20 (pour un filtre de reconstructio n
rampe) .
D'autre part, l'amplitude de l'artéfact dans l'image tomographiqu e
est d'autant plus grande que l'objet à reconstruire l'est, o u
que la taille de l ' hétérogénéité initiale est petite en surface .
Ainsi, on sera moins gêné par de tels artefacts lors des étude s
tomographiques cardiaques, que des études d'organes plus étendu s
comme le foie ou les poumons . Par ailleurs, les caméras à scintillation s
réalisées ces dernières années avec un nombre de photomultiplicateur s
élevé (de 60 à 75 comparés aux 19 des premières caméras) on t
une réponse en uniformité avec des composantes à hautes fréquence s
spatiales et donc des hétérogénéités de petites surfaces, e t
sont plus susceptibles de créer des artefacts circulaires . En
effet, nous avons déjà établi (Publication Ill, 1X) que la prin-
cipale cause de la non-uniformité globale dans le plan de l a
caméra à scintillations est celle due aux distorsions spatiale s
et présenté des algorithmes pour corriger ces distorsions, ains i
que les variations de la position des spectres régionau x
(Publication III, Blond et coll ., 1982) . Or, ce sont précisémen t
ces gradients élevés introduits par le faux positionnement des
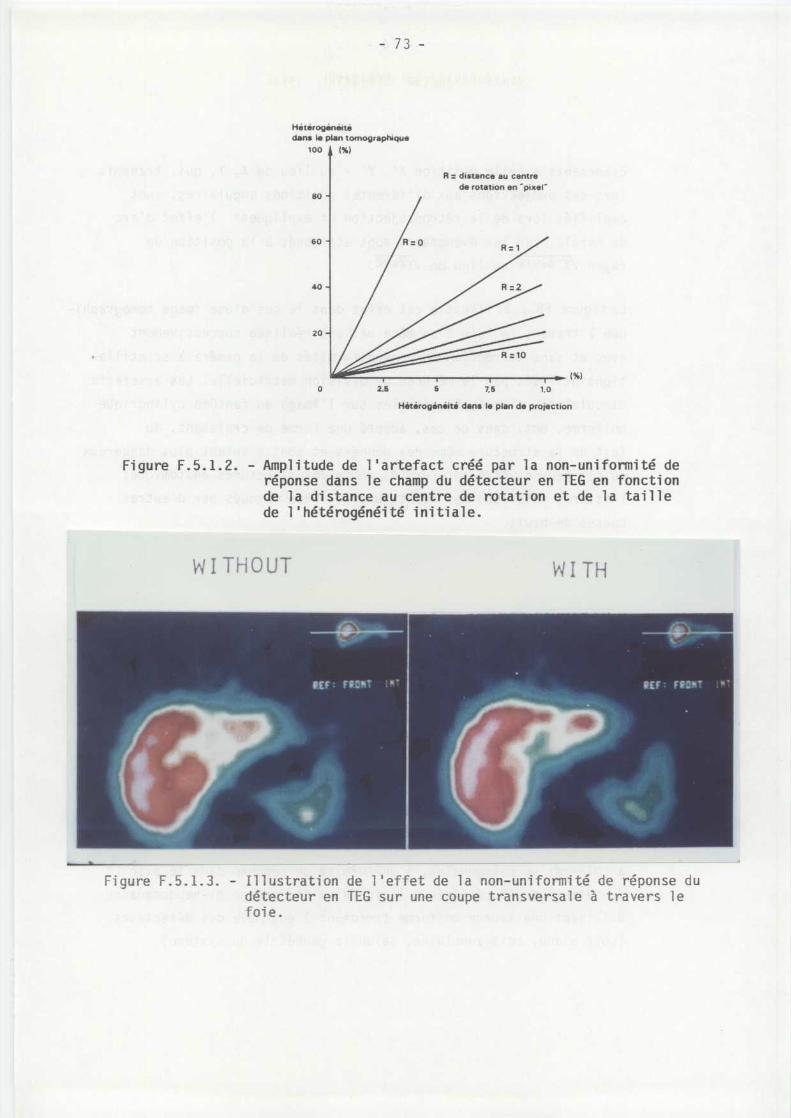
-73 -
Hétérogénéitédans le plan tomographiqu e
100
(%)
R . distance au centr e
de rotation en "pixel"
(% )
o
2,5
5
7,5
1, 0
Hétérogénéité dans le pian de projection
Figure F .5 .1 .2 . - Amplitude de l'artefact créé par la non-uniformité d eréponse dans le champ du détecteur en TEG en fonctio nde la distance au centre de rotation et de la taill ede l'hétérogénéité initiale .
WITHOUT
WIT H
Figure F . 5 .1 .3 . - Illustration de l ' effet de la non-uniformité de réponse d udétecteur en TEG sur une coupe transversale A travers l efoie .
évènements à telle position X', Y' - au lieu de X, Y, qui, transmi s
lors des projections aux différentes positions angulaires, son t
amplifiés lors de la rétroprojection et expliquent l'effet d'ar c
de cercle, car les évènements sont attribués à la position d e
rayon Jx'2~y'2 au lieu de 1X2+Y 2 ,
La figure F5 .1 .3 . illustre cet effet dans le cas d'une image tomographi -
que à travers le foie d'un même patient réalisée successivemen t
avec et sans correction des non-uniformités de la caméra à scintilla -
tions utilisés par la méthode de division matricielle . Les artefacts
circulaires, clairement visibles sur l'image du fantôme cylindriqu e
uniforme, ont, dans ce cas, adopté une forme de croissant, d u
fait de la structure même des données et sont d'autant plus dangereu x
qu'ils peuvent être interprétés comme des . structures anatomique s
(cissures interlobaires hépatiques) ou bien masqués par d'autre s
causes de bruit .
Aussi, il est extrêmement important de procéder à de's contrôle s
de qualité du système tomographique d ' acquisition pour les réduire
le plus possible avant l'obtention des projections . Il est égalemen t
possible de les réduire par filtrage passe-haut en angle et passe -
bas en fréquence spatiale au niveau des matrices de projection .
En tomographie d'émission de positons, l'uniformité de répons e
du détecteur est également indispensable . Pour les systèmes utilisan t
des détecteurs plans, le problème est le même q u ' en TEG avec
une caméra en rotation . Dans le cas, beaucoup plus répandu,d e
systèmes de TEP à multiples détecteurs disposés selon des géométrie s
annulaires ou polygonales, l ' uniformité de réponse dans le pla n
de détection est réalisée à l ' aide d ' un étalonnage bi-hebdomadaire
utilisant une source uniforme irradiant l ' ensemble des détecteur s
(soit plane, soit annulaire, selon la géométrie du système) .
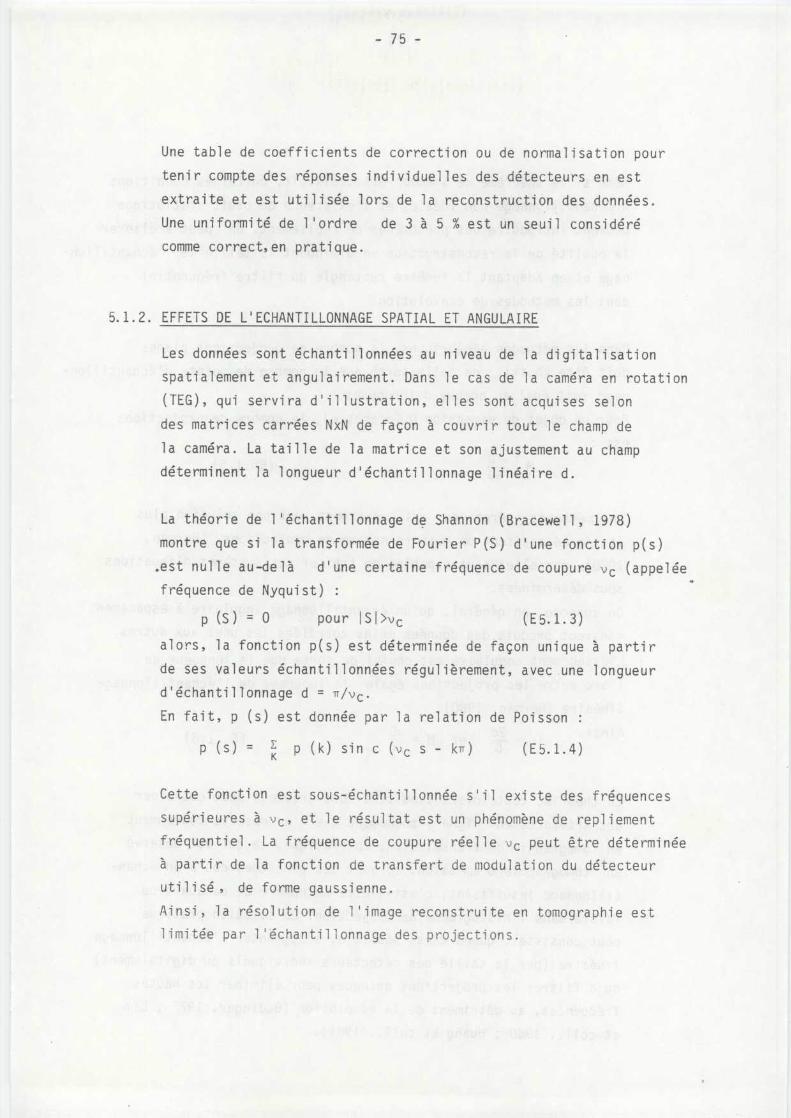
Une table de coefficients de correction ou de normalisation pou r
tenir compte des réponses individuelles des détecteurs en es t
extraite et est utilisée lors de la reconstruction des données .
Une uniformité de l'ordre
de 3 à 5 % est un seuil considér é
comme correct,en pratique .
5.1 .2 . EFFETSDE L'ECHANTILLONNAGE SPATIAL ETANGULAIRE
Les données sont échantillonnées au niveau de la digitalisation
spatialement et angulairement . Dans le cas de la caméra en rotatio n
(TEG), qui servira d'illustration, elles sont acquises selo n
des matrices carrées NxN de façon à couvrir tout le champ d e
la caméra . La taille de la matrice et son ajustement au cham p
déterminent la longueur d'échantillonnage linéaire d .
La théorie de l'échantillonnage de Shannon (Bracewell, 1978 )
montre que si la transformée de Fourier P(S) d'une fonction p(s )
,est nulle au-delà
d ' une certaine fréquence de coupure vc (appelée
fréquence de Nyquist) :
p (S) = 0
pour I5I>c
(E5.1 .3 )
alors, la fonction p(s) est déterminée de façon unique à parti r
de ses valeurs échantillonnées régulièrement, avec ,une longueu r
d ' échantillonnage d = 7/vc .
En fait, p (s) est donnée par la relation de Poisso n
p (s) =
K p (k) sin c (vc s - kir)
(E 5 .1 .4 )
Cette fonction est sous-échantillonnée s ' il existe des fréquence s
supérieures à vc, et le résultat est un phénomène de repliemen t
fréquentiel . La fréquence de coupure réelle vc peut être déterminé e
à partir de la fonction de transfert de modulation du détecteu r
utilisé, de forme gaussienne .
Ainsi, la résolution de l ' image reconstruite en tomographie es t
limitée par l ' échantillonnage des projections .
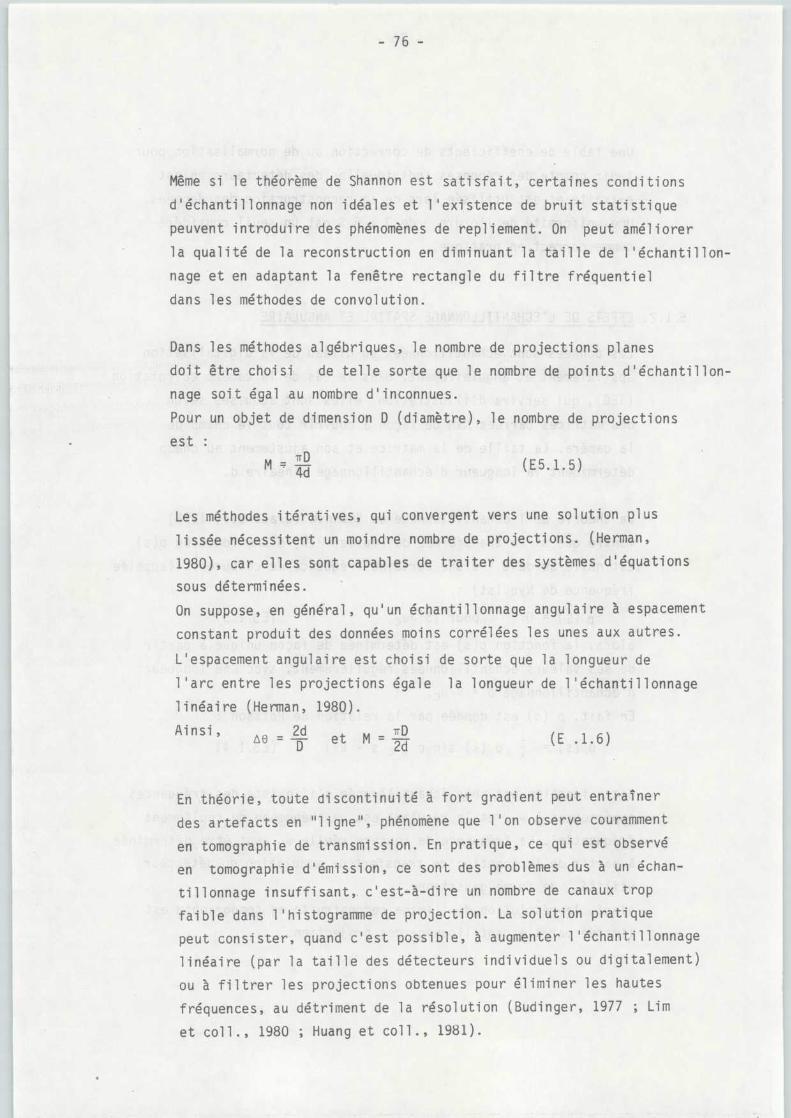
Même si le théorème de Shannon est satisfait, certaines condition s
d'échantillonnage non idéales et l'existence de bruit statistiqu e
peuvent introduire des phénomènes de repliement . On peut améliore r
la qualité de la reconstruction en diminuant la taille de l'échantillon -
nage et en adaptant la fenêtre rectangle du filtre fréquentie l
dans les méthodes de convolution .
Dans les méthodes algébriques, le nombre de projections plane s
doit être choisi
de telle sorte que le nombre de points d'échantillon -
nage soit égal au nombre d'inconnues .
Pour un objet de dimension D (diamètre), le nombre de projection s
est
M7 D
4d
Les méthodes itératives, qui convergent vers une solution plu s
lissée nécessitent un moindre nombre de projections . (Herman ,
1980), car elles sont capables de traiter des systèmes d'équation s
sous déterminées .
On suppose, en général, qu'un échantillonnage angulaire à espacemen t
constant produit des données moins corrélées les unes aux autres .
L'espacement angulaire est choisi de sorte que la longueur d e
l'arc entre les projections égale la longueur de l'échantillonnag e
linéaire (Herman, 1980) .
Ainsi,
oe =2d
et M =7D
D
2d
En théorie, toute discontinuité à fort gradient peut entraîne r
des artefacts en " ligne " , phénoméne que l ' on observe courammen t
en tomographie de transmission . En pratique, ce qui est observé
en tomographie d'émission, ce sont des problèmes dus à un échan -
tillonnage insuffisant, c'est-à-dire un nombre de canaux tro p
faible dans l'histogramme de projection . La solution pratiqu e
peut consister, quand c'est possible, à augmenter l'échantillonnage
linéaire (par la taille des détecteurs individuels ou digitalement )
ou à filtrer les projections obtenues pour éliminer les haute s
fréquences, au détriment de la résolution (Budinger, 1977 ; Li m
et coll ., 1980 ; Huang et coll ., 1981) .
(E .1 .6)
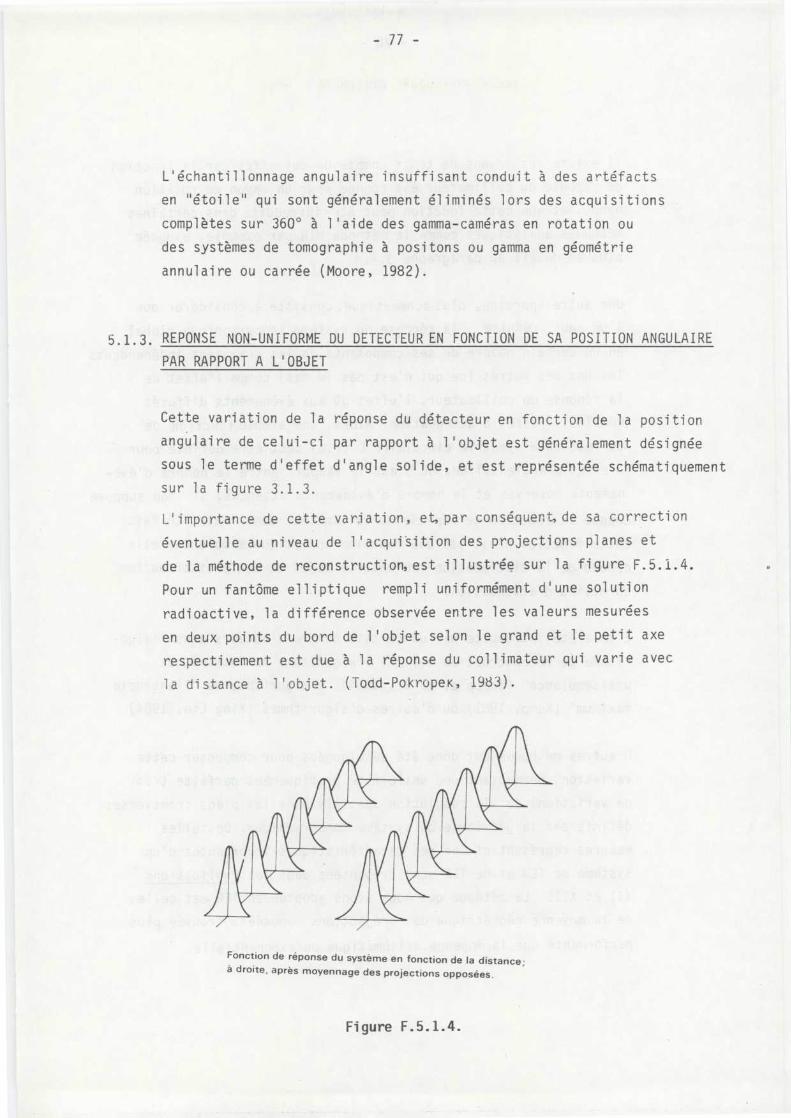
L ' échantillonnage angulaire insuffisant conduit à des artéfact s
en "étoile" qui sont généralement éliminés lors des acquisition s
complètes sur 360° à l'aide des gamma-caméras en rotation o u
des systèmes de tomographie à positons ou gamma en géométri e
annulaire ou carrée (Moore, 1982) .
5 .1 .3 . REPONSE NON-UNIFORME DU DETECTEUR ENFONCTIONDE SA POSITIONANGULAIR E
PAR RAPPORT AL ' OBJET
Cette variation de la réponse du détecteur en fonction de la positio n
angulaire de celui-ci par rapport à l ' objet est généralement désigné e
sous le terme d'effet d'angle solide, et est représentée schématiquemen t
sur la figure 3 .1 .3 .
L ' importance de cette variation, et, par conséquent,de sa correctio n
éventuelle au niveau de l'acquisition des projections planes et
de la méthode de reconstruction, est illustrée sur la figure F .5,1 .4 .
Pour un fantôme elliptique rempli uniformément d'une solutio n
radioactive, la différence observée entre les valeurs mesurée s
en deux points du bord de l'objet selon le grand et le petit axe
respectivement est due à la réponse du collimateur qui varie ave c
la distance à l ' objet . (Toad-PokropeK, 1983) .
Fonction de réponse du système en fonction de la distance ;à droite, après moyennage des projections opposées .
Figure F .5 .1 .4 .
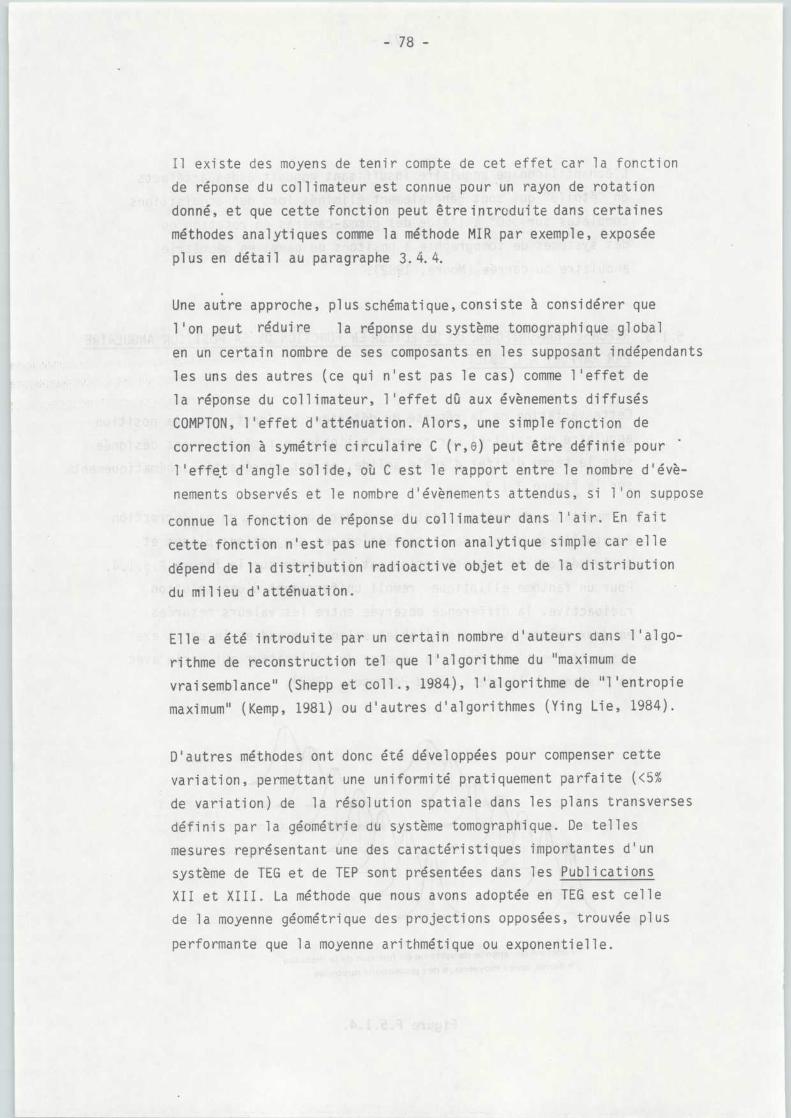
Il existe des moyens de tenir compte de cet effet car la fonctio n
de réponse du collimateur est connue pour-un rayon de rotatio n
donné, et que cette fonction peut être introduite dans certaine s
méthodes analytiques comme la méthode MIR par exemple, exposé e
plus en détail au paragraphe 3 .4.4.
Une autre approche, plus schématique, consiste à considérer qu e
l'on peut réduire
la réponse du système tomographique globa l
en un certain nombre de ses composants en les supposant indépendant s
les uns des autres (ce qui n'est pas le cas) comme l'effet d e
la réponse du collimateur, l'effet dû aux évènements diffusé s
COMPTON, l'effet d'atténuation . Alors, une simple fonction d e
correction à symétrie circulaire C (r,e) peut être définie pou r
l'effet d'angle solide, où C est le rapport entre le nombre d'évè-
nements observés et le nombre d'évènements attendus, si l'on suppos e
connue la fonction de réponse du collimateur dans l'air . En fai t
cette fonction n'est pas une fonction analytique simple car ell e
dépend de la distribution radioactive objet et de la distributio n
du milieu d'atténuation .
Elle a été introduite par un certain nombre d'auteurs dans l'algo -
rithme de reconstruction tel que l'algorithme du "maximum d e
vraisemblance " (Shepp et coll ., 1984), l'algorithme de "l'entropi e
maximum" (Kemp, 1981) ou d'autres d'algorithmes (Ying Lie, 1984) .
D'autres méthodes ont donc été développées pour compenser cett e
variation, permettant une uniformité pratiquement parfaite (<5%
de variation) de la résolution spatiale dans les plans transverse s
définis par la géométrie du système tomographique . De telle s
mesures représentant une des caractéristiques importantes d'u n
système de TEG et de TEP sont présentées dans les Publication s
XII et XIII . La méthode que nous avons adoptée en TEG est cell e
de la moyenne géométrique des projections opposées, trouvée plu s
performante que la moyenne arithmétique ou exponentielle .
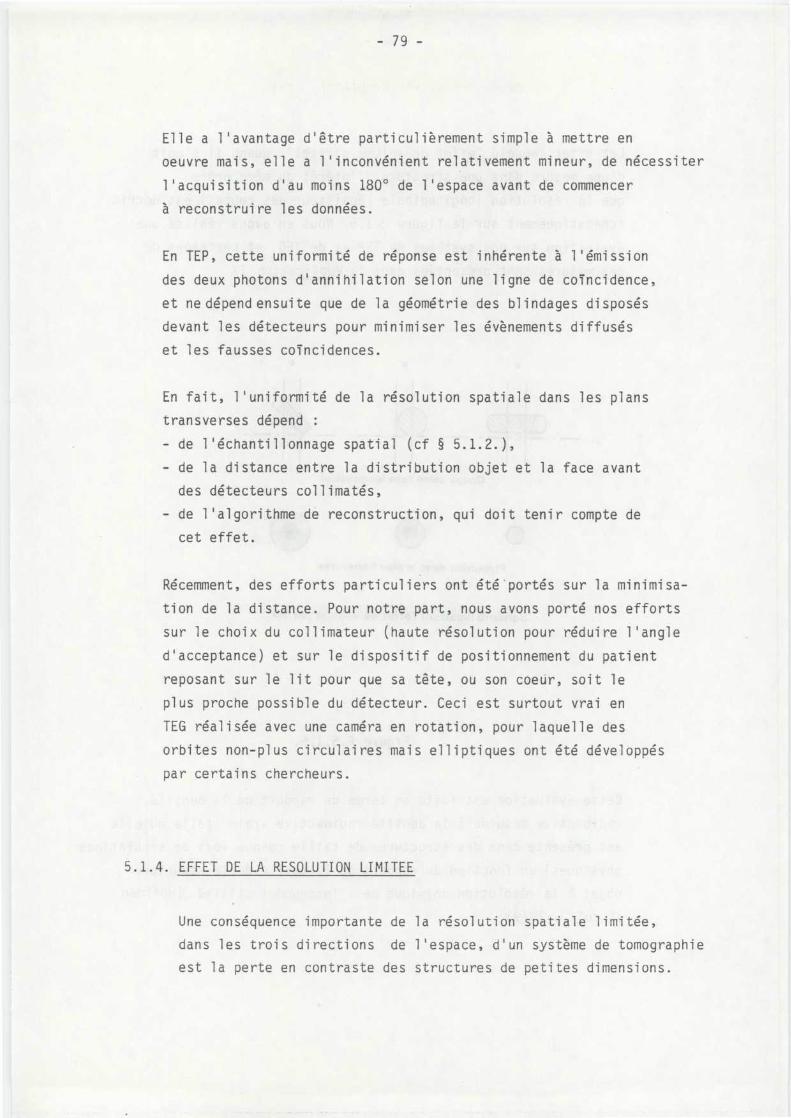
Elle a l'avantage d'être particulièrement simple à mettre e n
oeuvre mais, elle a l'inconvénient relativement mineur, de nécessite r
l'acquisition d'au moins 180° de l'espace avant de commence r
à reconstruire les données .
En TEP, cette uniformité de réponse est inhérente à l'émissio n
des deux photons d ' annihilation selon une ligne de coincidence ,
et ne dépend ensuite que de la géométrie des blindages disposé s
devant les détecteurs pour minimiser les évènements diffusé s
et les fausses coincidences .
En fait, l'uniformité de la résolution spatiale dans les plan s
transverses dépend :
- de l'échantillonnage spatial (cf § 5 .1 .2 .) ,
- de la distance entre la distribution objet et la face avan t
des détecteurs collimatés ,
- de l'algorithme de reconstruction, qui doit tenir compte d e
cet effet .
Récemment, des efforts particuliers ont été'portés sur la minimisa-
tion de la distance . Pour notre part, nous avons porté nos effort s
sur le choix du collimateur (haute résolution pour réduire l'angl e
d'acceptance) et sur le dispositif de positionnement du patien t
reposant sur le lit pour que sa tête, ou son coeur, soit l e
plus proche possible du détecteur . Ceci est surtout vrai e n
TEG réalisée avec une caméra en rotation, pour laquelle de s
orbites non-plus circulaires mais elliptiques ont été développé s
par certains chercheurs .
5 .1 .4 . EFFETDE LA RESOLUTION LIMITE E
Une conséquence importante de la résolution spatiale limitée ,
dans les trois directions de l ' espace, d ' un système de tomographi e
est la perte en contraste des structures de petites dimensions .
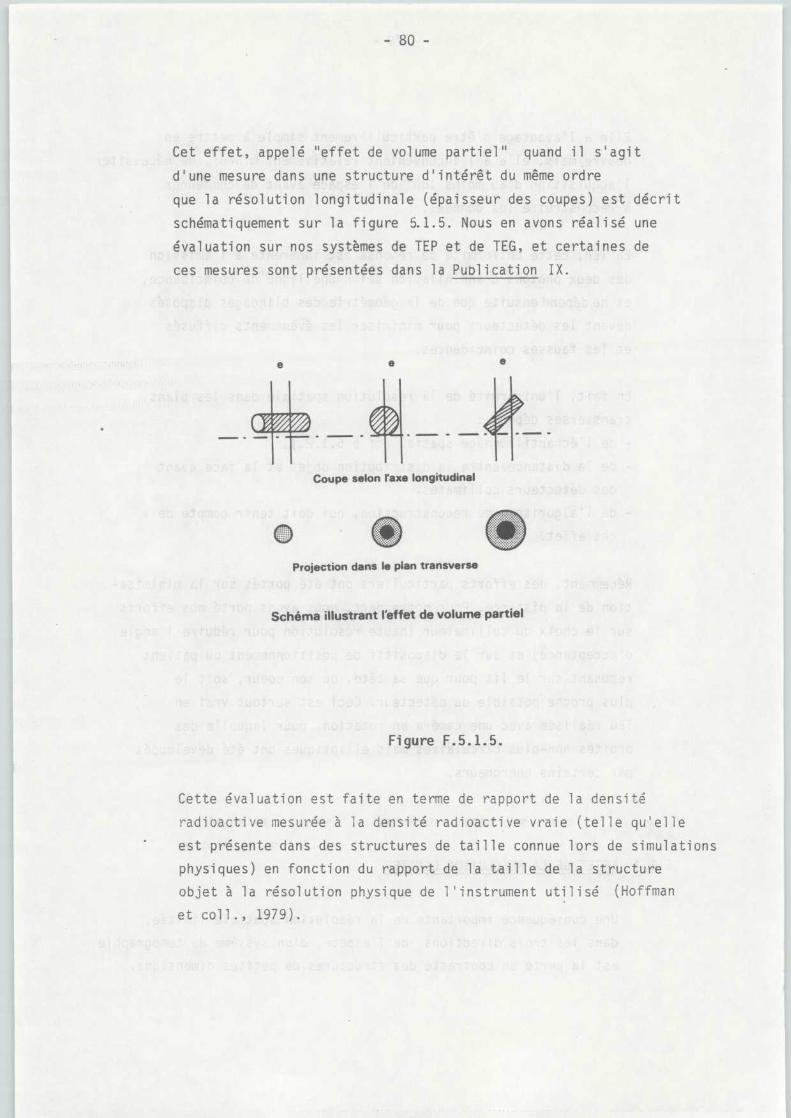
Cet effet, appelé "effet de volume partiel" quand il s'agi t
d'une mesure dans une structure d'intérêt du même ordr e
que la résolution longitudinale (épaisseur des coupes) est décri t
schématiquement sur la figure 5.1 .5 . Nous en avons réalisé un e
évaluation sur nos systèmes de TEP et de TEG, et certaines d e
ces mesures sont présentées dans la Publication IX .
e
e
e
Coupe selon l'axe longitudina l
D QQProjection dans le plan transverse
Schéma illustrant l'effet de volume partiel
Figure F .5 .1 .5 .
Cette évaluation est faite en terme de rapport de la densit é
radioactive mesurée à la densité radioactive vraie (telle qu'ell e
est présente dans des structures de taille connue lors de simulation s
physiques) en fonction du rapport de la taille de la structure
objet à la résolution physique de l ' instrument utilisé (Hoffma n
et coll ., 1979) .
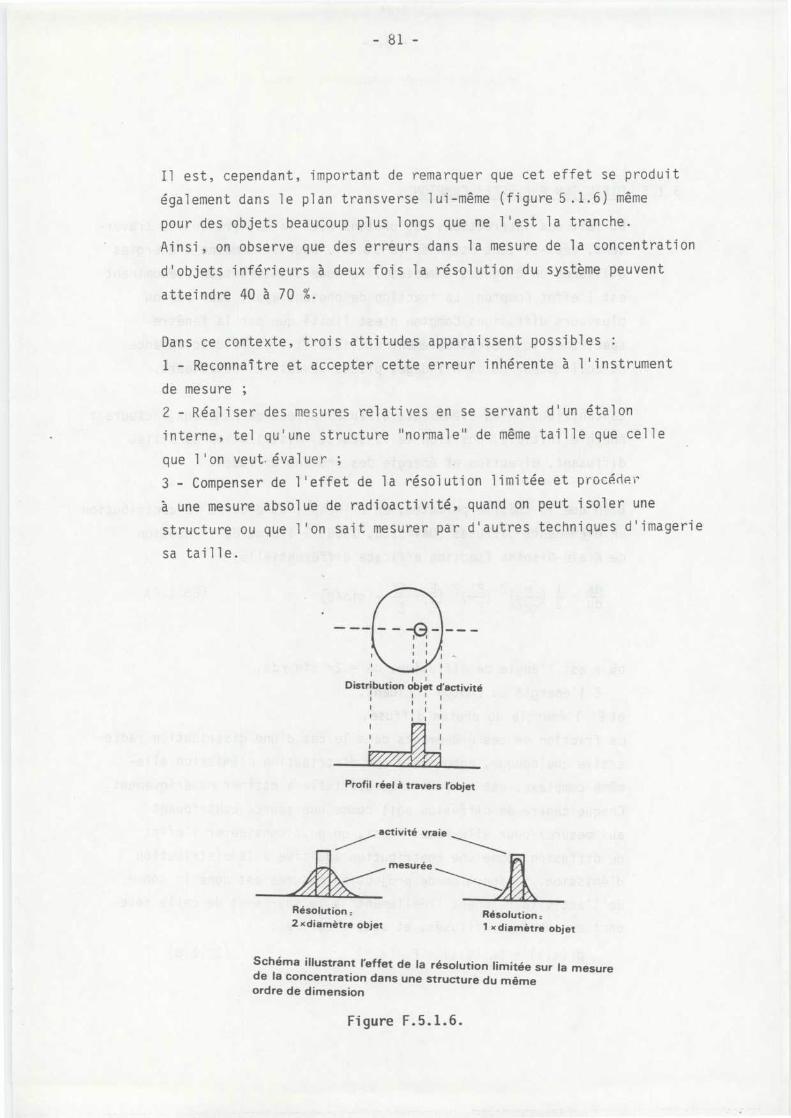
Il est, cependant, important de remarquer que cet effet se produi t
également dans le plan transverse lui-même (figure 5 .1 .6) mêm e
pour des objets beaucoup plus longs que ne l'est la tranche .
Ainsi, on observe que des erreurs dans la mesure de la concentratio n
d'objets inférieurs à deux fois la résolution du système peuven t
atteindre 40 à 70 % .
Dans ce contexte, trois attitudes apparaissent possible s
1 - Reconnaître et accepter cette erreur inhérente à l'instrumen t
de mesure ;
2 - Réaliser des mesures relatives en se servant d ' un étalo n
interne, tel qu'une structure "normale" de même taille que cell e
que l ' on veut . évaluer ;
3 - Compenser de l'effet de la résolution limitée et procéde r
à une mesure absolue de radioactivité, quand on peut isoler une
structure ou que l ' on sait mesurer par d ' autres techniques d ' imageri e
sa taille .
Distribution objet d'activité
~
~
I
I
Profil réel à travers l 'objet
activité vrai e
mesuré e
Résolution :2 xdiamètre objet
Résolution .1 x diamètre objet
Schéma illustrant l'effet de la résolution limitée sur la mesurede la concentration dans une structure du mêm eordre de dimension
Figure F .5 .1 .6 .
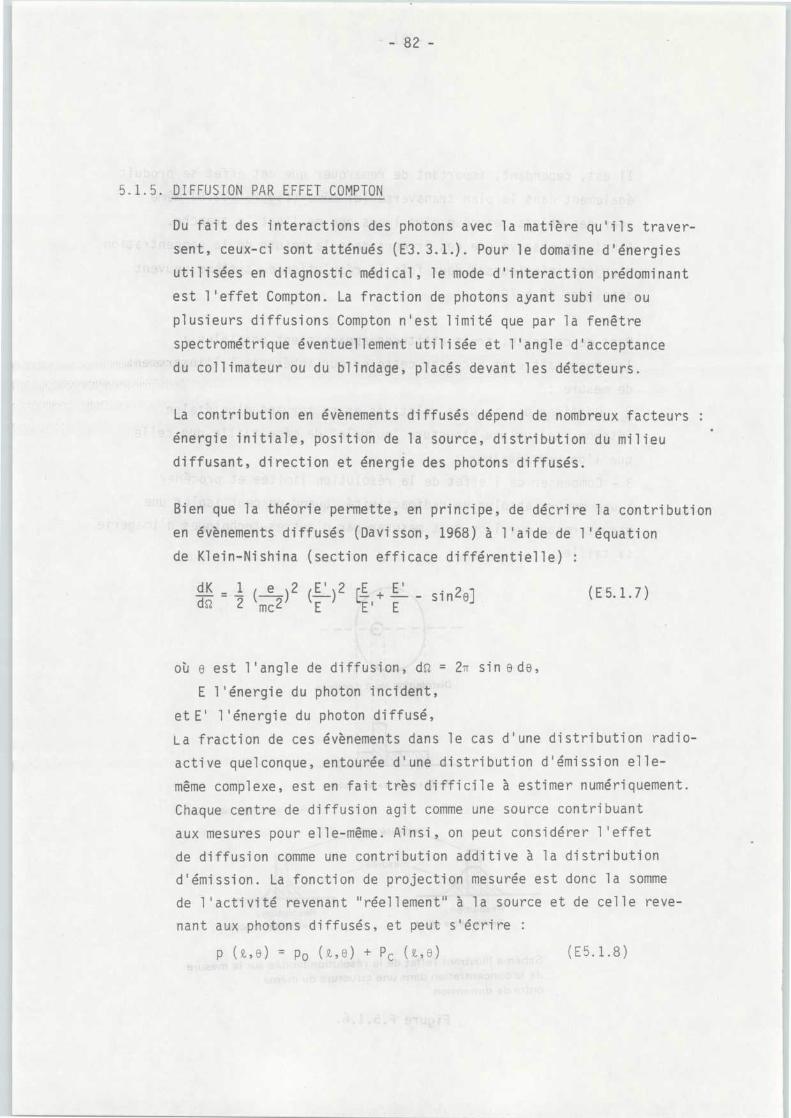
5 .1 .5 . DIFFUSION PAREFFETCOMPTON
Du fait des interactions des photons avec la matière qu'ils traver-
sent, ceux-ci sont atténués (E3 .3 .1 .) . Pour le domaine d'énergie s
utilisées en diagnostic médical, le mode d'interaction prédominan t
est l'effet Compton . La fraction de photons ayant subi une o u
plusieurs diffusions Compton n'est limité que par la fenêtr e
spectrométrique éventuellement utilisée et l'angle d'acceptanc e
du collimateur ou du blindage, placés devant les détecteurs .
La contribution en évènements diffusés dépend de nombreux facteurs :
énergie initiale, position de la source, distribution du milie u
diffusant, direction et énergie des photons diffusés .
Bien que la théorie permette, en principe, de décrire la contributio n
en évènements diffusés (Davisson, 1968) à l'aide de l'équatio n
de Klein-Nishina (section efficace différentielle) :
dK
e 2 E' 2 E
E 'd2
2 ~mc2) ~ E )
E '
E
sin g
oü e est 1 'angle de diffusion, de = 27 sin e de ,
E l'énergie du photon incident ,
et E' l'énergie du photon diffusé ,
La fraction de ces évènements dans le cas d'une distribution radio-
active quelconque, entourée d'une distribution d'émission elle -
même complexe, est en fait très difficile à estimer numériquement .
Chaque centre de diffusion agit comme une source contribuan t
aux mesures pour elle-même . Ainsi, on peut considérer l ' effe t
de diffusion comme une contribution additive à la distributio n
d ' émission . La fonction de projection mesurée est donc la somm e
de l'activité revenant "réellement" à la source et de celle reve-
nant aux photons diffusés, et peut s ' écrire :
p (Q,,e) = Po (z,e) + Pc (,e)
(E5 .1 .8 )
(E 5.1 .7)
où po (z,e) est la projection due à la distribution de source s
d ' émission, incluant l ' effet d ' atténuation et l ' effet dû à l ' angl e
solide, et pc (9,e) est la projection due aux photons diffusé s
par effet Compton .
Du fait que l ' algorithme de reconstruction est un procédé linéaire ,
les données reconstruites sont la somme de ces deux distributions .
Cette remarque peut justifier les méthodes de correction pa r
soustraction que nous avons nous-mêmes développées . Il est, cependant ,
à remarquer que l'anisotropie et le caractére probabiliste d e
la distribution Compton rend en fait le problème de la reconstructio n
beaucoup plus compliqué .
Dans la pratique, la contribution en évènements diffusés peu t
atteindre 40% du total des évènements acquis, ce qui signifi e
qu'une véritable lésion, se trouvant en profondeur dans le myocarde ,
par exemple, aura une activité observée de l'ordre de 40% cell e
de's régions avoisinantes .
Il est évident que si l'on ne prend garde à éliminer ou à corrige r
cet effet a priori même une méthode tout à fait appropriée d e
prise en compte de l ' effet d ' atténuation aura pour conséquenc e
une surcompensation .
Actuellement, quatre approches au problème de la correction d e
la contribution des évènements diffusés peuvent ètre dégagées .
La première approche, qui utilise un coefficient linéaire d ' atténuation ,
est de fait adoptée (parfois implicitement) dans toutes les méthode s
mettant en oeuvre une correction d ' atténuation (Publication VII ;
Larsson, 1980) . Nous avons, explicitement, utilisé un coefficien t
d'atténuation "effectif" égal à 0,11 à 0,13 cm-1 dans la méthode
MIR dans le cas du cerveau où p peut être considéré comme constant .
Ceci a pour effet de remplacer une partie des photons primaire s
perdus par atténuation par des photons diffusés, détectés à leu r
place . Il est clair, cependant, que cette correction n'est qu'appro-
ximative car elle ne traite pas le problème de la perte de contrast e
et de netteté des bords de l'objet d'émission due à l'effet Compton .
La seconde approche utilise la simulation numérique, en généra l
par des techniques de Monte-Carlo, d'une image de la distributio n
diffusée, après modélisation de la distribution d'émission e t
du processus de détection . L'image d'évènements diffusés ains i
obtenue (Egbert et coll ., 1980 ; Beck, 1981, 1982) est alors soustrait e
de celle détectée initialement . La différence obtenue, représentan t
la composante en photons primaires peut alors être corrigée d e
l'atténuation en utilisant une valeur de u plus proche de la valeu r
théorique . Cette approche souffre de la complexité des simulation s
à mettre en oeuvre et des moyens de calcul importants qui son t
nécessaires .
La troisième approche utilise la déconvolution des données initiale s
par une fonction de réponse du détecteur comprenant une composant e
de diffusion, mesurée ou évaluée (Ying Lie, 1984 ; Axelsson e t
coll ., 1984) . On fait l'hypothèse que la fraction de diffusé s
brouille l'image selon une loi qui peut être prédite ou mesurée
à l'aide d'une source linéaire déplacée dans un milieu diffusant ,
équivalent au muscle . La déconvolution directe des données détectée s
au niveau des régions par cette fonction de réponse du système
contient le risque d'augmenter le bruit dans les images résultantes .
Pour notre part, nous développons sur un système de TEP avec mesur e
du temps de vol une technique de correction du Compton basée su r
l'hypothèse additive et utilisant une modification du filtre utilisé
lors du traitement des données pour tenir compte du temps de vo l
et des effets géométriques .
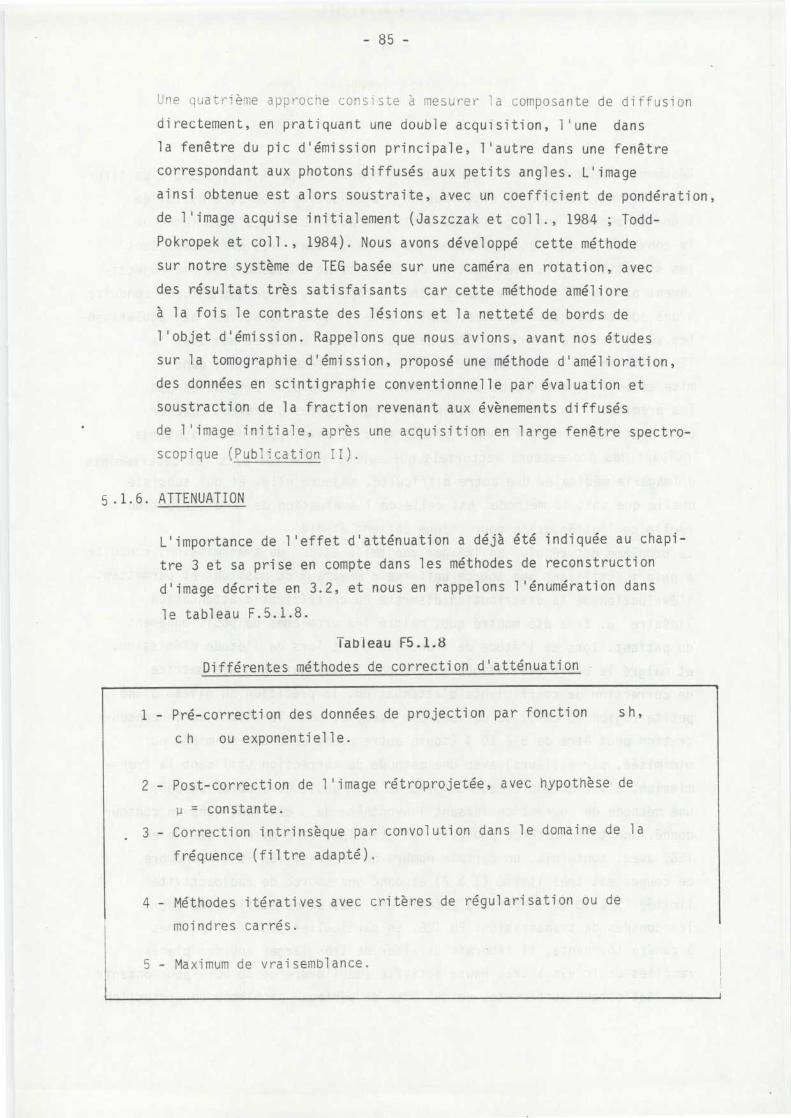
- 85 -
Une quatrième approche consiste à mesurer la composante de diffusio n
directement, en pratiquant une double acquisition, l ' une dan s
la fenêtre du pic d ' émission principale, l ' autre dans une fenêtre
correspondant aux photons diffusés aux petits angles . L ' image
ainsi obtenue est alors soustraite, avec un coefficient de pondération ,
de l'image acquise initialement (Jaszczak et coll ., 1984 ; Todd-
Pokropek et coll ., 1984) . Nous avons développé cette méthod e
sur notre système de TEG basée sur une caméra en rotation, ave c
des résultats très satisfaisants car cette méthode amélior e
à la fois le contraste des lésions et la netteté de bords d e
l'objet d'émission . Rappelons que nous avions, avant nos étude s
sur la tomographie d'émission, proposé une méthode d'amélioration ,
des données en scintigraphie conventionnelle par évaluation e t
soustraction de la fraction revenant aux évènements diffusé s
de l ' image initiale, après une acquisition en large fenêtre spectro-
scopique (Publication II) .
5 .1 .6 . ATTENUATION
L'importance de l'effet d'atténuation a déjà été indiquée au chapi -
tre 3 et sa prise en compte dans les méthodes de reconstructio n
d ' image décrite en 3 .2, et nous en rappelons l ' énumération dan s
le tableau F .5 .1 .8 .
Tableau F5 .1 . 8
Différentes méthodesde correctiond ' atténuation
1 - Pré-correction des données de projection par fonction
sh ,
ch
ou exponentielle .
2 - Post-correction de l'image rétroprojetée, avec hypothèse d e
u = constante .
3 - Correction intrinsèque par convolution dans le domaine de l a
fréquence (filtre adapté) .
4 - Méthodes itératives avec critères de régularisation ou d e
moindres carrés .
5 - Maximum de vraisemblance .
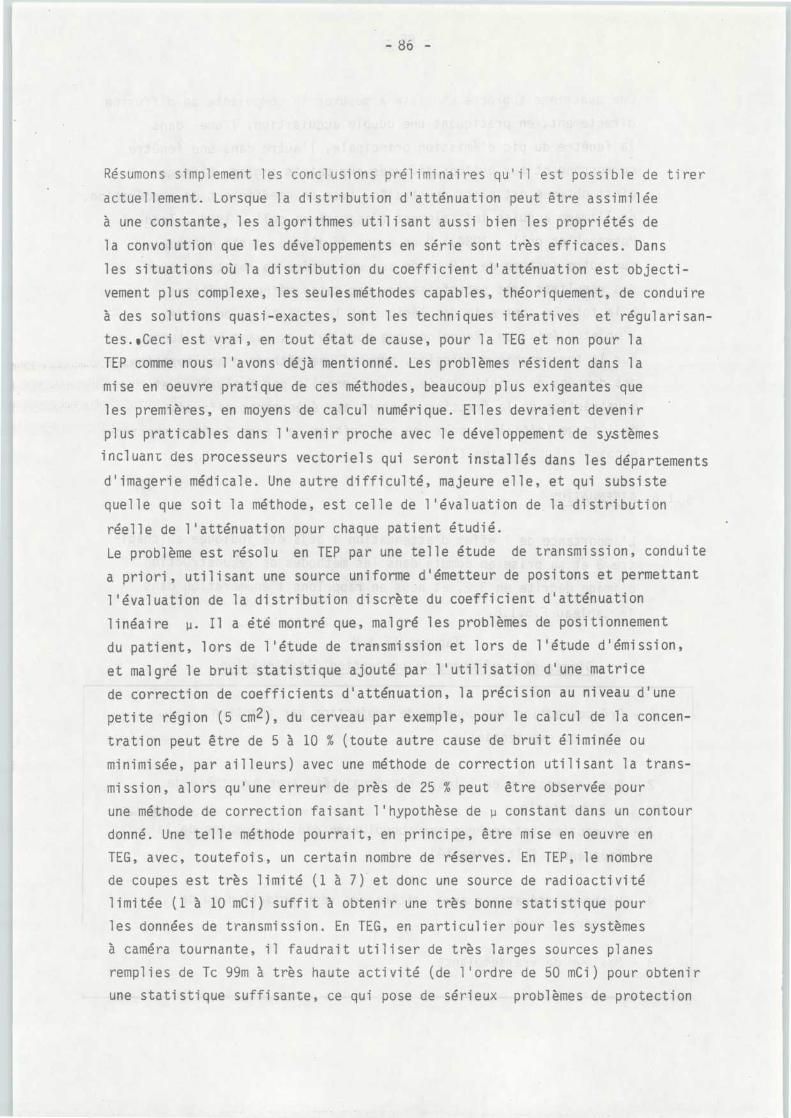
Résumons simplement les conclusions préliminaires q u ' il est possible de tire r
actuellement . Lorsque la distribution d'atténuation peut être assimilé e
à une constante, les algorithmes utilisant aussi bien les propriétés d e
la convolution que les développements en série sont très efficaces . Dan s
les situations où la distribution du coefficient d'atténuation est objecti-
vement plus complexe, les seulesméthodes capables, théoriquement, de conduir e
à des solutions quasi-exactes, sont les techniques itératives et régularisan-
tes .,Ceci est vrai, en tout état de cause, pour la TEG et non pour l a
TEP comme nous l'avons déjà mentionné . Les problèmes résident dans l a
mise en oeuvre pratique de ces méthodes, beaucoup plus exigeantes qu e
les premières, en moyens de calcul numérique . Elles devraient deveni r
plus praticables dans l'avenir proche avec le développement de système s
incluant des processeurs vectoriels qui seront installés dans les département s
d'imagerie médicale . Une autre difficulté, majeure elle, et qui subsist e
quelle que soit la méthode, est celle de l'évaluation de la distributio n
réelle de l'atténuation pour chaque patient étudié .
Le problème est résolu en TEP par une telle étude de transmission, conduite
a priori, utilisant une source uniforme d'émetteur de positons et permettan t
l'évaluation de la distribution discrète du coefficient d'atténuation
linéaire p . Il a été montré que, malgré les problèmes de positionnemen t
du patient, lors de l'étude de transmission et lors de l'étude d'émission ,
et malgré le bruit statistique ajouté par l'utilisation d'une matric e
de correction de coefficients d'atténuation, la précision au niveau d'un e
petite région (5 cm 2 ), du cerveau par exemple, pour le calcul de la concen-
tration peut être de 5 à 10 % (toute autre cause de bruit éliminée o u
minimisée, par ailleurs) avec une méthode de correction utilisant la trans -
mission, alors qu'une erreur de près de 25 % peut être observée pou r
une méthode de correction faisant l ' hypothèse de t constant dans un contou r
donné . Une telle méthode pourrait, en principe, être mise en oeuvre e n
TEG, avec, toutefois, un certain nombre de réserves . En TEP, le nombre
de coupes est très limité (1 à 7) et donc une source de radioactivit é
limitée (1 à 10 mCi) suffit à obtenir une très bonne statistique pou r
les données de transmission . En TEG, en particulier pour les système s
à caméra tournante, il faudrait utiliser de très larges sources plane s
remplies de Tc 99m à très haute activité (de l'ordre de 50 mCi) pour obteni r
une statistique suffisante, ce qui pose de sérieux problèmes de protection
des patients et du personnel . De plus, les études d ' émission y sont déj à
plus longues, et ces études préliminaires les prolongeraient encore plus ,
alors que les patients sont déjà, souvent dans une position relativemen t
inconfortable . Des problèmes de superposition spatiale des structure s
sont donc à éviter .
Il reste encore à évaluer l'apport véritable, en TEG comme cela a ét é
fait en TEP, de la mesure de la distribution d'atténuation, en comparaison
avec une estimation des valeurs de p dans certaines régions à géométri e
simple .
5 .2 . FACTEURSLIES A LASTATISTIQUELIMITEE
La détection significative d ' une lésion dans une image bruitée nécessit e
un certain seuil du rapport signal-sur-bruit, qu ' on estime usuellemen t
entre 2 et 5 pour les images de médecine nucléaire, en fonction d u
nombre de pixels de l'image .
On peut faire une analyse détaillée de ce rapport S/B, en tomographi e
d'émission en fonction des paramètres essentiels concernés : l e
nombre fini d'évènements détectés, le nombre de vues de projection ,
le nombre de pixels présents dans l ' objet d ' émission . L ' équipe
de Berkeley (Huesman, 1977) a été parmi les première sà faire une telle analyse et a proposé la relation empirique suivante :
h1 %
(NT) 1/ 2Q
= K (NP )3/4
(E 5 .2 .1 )
où S/B est l ' incertitude relative, c ' est-à-dire la moyenne rapporté e
à l ' écart-type par pixel ,
NT est le nombre total d ' évènements détecté s
Np est le nombre de pixel s
et K est le facteur multiplicatif dépendant du filtre utilisé dan s
l'algorithme de reconstruction .
S/B =
Nous avons, pour notre part, redémontré cette relation en calculan t
le noyau K de l'opérateur utilisé dans la reconstruction d'imag e
de chacundes systèmes de tomographie dont nous disposons (Publication
XI) . Il est ainsi très utile de pouvoir prédire l'incertitude statistique
au niveau de l'élément d'image pour une étude à nombre d'évènement s
limités . A l'inverse, il peut être intéressant d'estimer le nombre
total d'évènements acquis dans un temps donné pour un choix de qualité
statistique d'image .
En fait, ces considérations doivent tenir compte, pour être plu s
réalistes, du fait que la concentration radioactive n'est présent e
que dans une petite partie de l'image transverse, en général d e
l'ordre de 15 à 25 % du nombre total de pixels reconstruits .
Ainsi, la relation E5 .2 .1 doit être transformée, pour le nombr e
de pixels concernées en E4 .2 .2 :
(6)°= K
(NT) 1 / 2
(Nc
Nb)-3/4
(E5 .2 .2 )c
où Nc est le nombre de pixels dans la structure d'intérêt ,
Nb est le nombre de pixels dans le bruit de fond ,
et c le contraste de la structure .
L'exemple donné initialement par Budinger et coll ., (1982) de l a
figure F5 .2 .1 . montre un schéma de deux distributions radioactive s
au niveau du coeur .
L'une est obtenue à l'aide de Tl 201 et permet de mesurer la perfusio n
dans le myocarde, l'autre est obtenue à l'aide de globules rouge s
marqués au Tc 99 m et visualise les cavités cardiaques . On constat e
que le rapport des incertitudes relatives est de 28 entre les deu x
cas, et il s ' explique par le plus petit nombre de pixels concerné s
et le plus grand nombre d ' évènements détectés dans le deuxièm e
cas (car on peut administrer beaucoup plus de Tc 99 m ou d ' I123
que de Tl 201) . Cet exemple illustre, de plus, l ' importance d u
choix du radiopharmaceutique pour obtenir un meilleur contrast e
et un rapport signal-sur-bruit concentré dans une plus petite parti e
de l ' image .
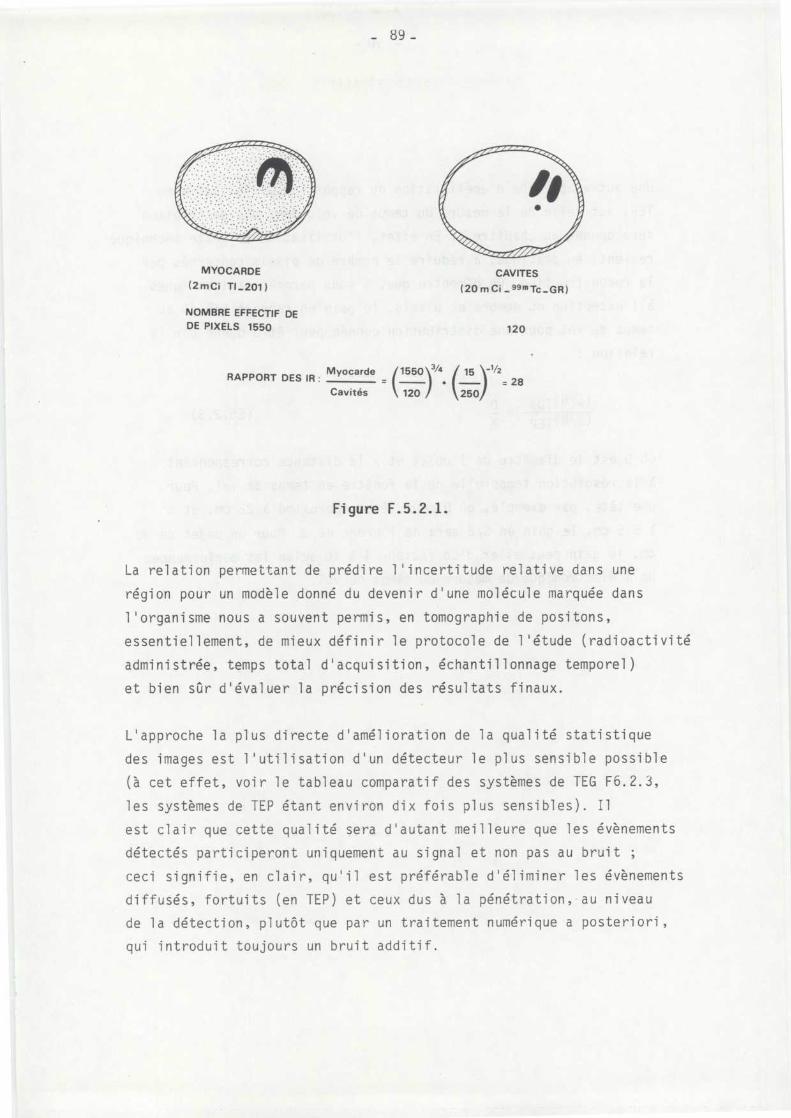
MYOCARD E(2mCi TI_201 )
NOMBRE EFFECTIF D EDE PIXELS 1550
CAVITE S
(20 mCi _ 99m Tc_GR )
120
RAPPORT DES IR : Myocarde (1550)3/4
15 ) h /'2
•
= 2 8Cavités
120
250
Figure F .5 .2 .1 .
La relation permettant de prédire l ' incertitude relative dans un e
région pour un modèle donné du devenir d ' une molécule marquée dan s
l'organisme nous a souvent permis, en tomographie de positons ,
essentiellement, de mieux définir le protocole de l ' étude (radioactivité
administrée, temps total d'acquisition, échantillonnage temporel )
et bien sûr d'évaluer la précision des résultats finaux .
L ' approche la plus directe d ' amélioration de la qualité statistique
des images est l ' utilisation d ' un détecteur le plus sensible possibl e
(à cet effet, voir le tableau comparatif des systèmes de TEG F6 .2 .3 ,
les systèmes de TEP étant environ dix fois plus sensibles) . I l
est clair que cette qualité sera d ' autant meilleure que les évènement s
détectés participeront uniquement au signal et non pas au bruit ;
ceci signifie, en clair, qu'il est préférable d'éliminer les évènement s
diffusés, fortuits (en TEP) et ceux dus à la pénétration, .au nivea u
de la détection, plutôt que par un traitement numérique a posteriori ,
qui introduit toujours un bruit additif .
Une autre approche d ' amélioration du rapport S/B, réalisable e n
TEP, est celle de la mesure du temps de vol, dont une descriptio n
sera donnée au chapitre . En effet, l'utilisation de cette techniqu e
revient, en pratique, à réduire le nombre de pixels concernés pa r
la reconstruction . On démontre que, à tous paramètres identique s
à l'exception du nombre de pixels, le gain en rapport S/B dû a u
temps de vol pour une distribution donnée peut être donné par l a
relation :
où D est le diamètre de l'objet et x la distance correspondan t
à la résolution temporelle de la fenêtre en temps de vol . Pou r
une tête, par exemple, où D peut être approximé à 22 cm, et x
à 5 .5 cm, le gain en S/B sera de l'ordre de 3 . Pour un objet de 30
cm, le gain peut aller d'un facteur 4 à 10 selon les performance s
de l'électronique de mesure du temps de vol .
- 91 -
CHAPITRE 5 - REFERENCES
AXELSSON B ., MSAKI P ., ISRAELSSON A . Subtraction of Compton - Scattere d
photons in single photon emission computerized tomography . J . Nucl .
Med . 25, 490-494 (1984) .
BCK J .W . Analysis of a camera based single photon emission compute d
tomography (SPECT) systems, Ph . D . Thesis, Duke Univ ., Durham, 1981 .
BECK J .W ., JASZCZAK R .I ., COLEMAN R .E ., STARMER C .F ., NOLTE L .W . Analysi s
of SPECT including scatter and attenuation using sophistiçated Monte -
Carlo modeling method, IEEE Trans . NS, 29, 506-511 (1982) .
BLOND M .T ., AUBERT B ., DI PAOLA R. Computer corrections of imag e
intensifier camera response . In Information Processing in Medical Imaging ,
Proc . of VIth Int . Conf ., Di Paola R ., Kahn E ., eds ., Les Editions d e
l ' INSERM, Paris 88, 1980, 173 .
BRACEWELL R .N . The Fourier transform and its applications, Mc Graw Hill ,
1978 .
BUDINGER T .F . Physical attributes of single-photon tomography . J . Nucl .
Med ., 21, 579-592 (1980) .
BUDINGER T .F . Single-photon emission tomography, In Proc . of the IIIr d
World Congress of the Federation of Nuclear Medicine and Biology, C .
Raynaud ed ., Pergamon Press, Paris, 1982 .
BUDINGER T .F ., DERENZO S .E ., GULLBERG G .T ., GREENBERG W .L . and HUESMAN
R .N . Emission computer assisted tomography with single-photon and positro n
annihilation photon emitters . J . Comput . Assist . Tomogr . 1, 131-145 (1977) .
DAVISSON C .M . Interaction of gamma radiation with matter, K . Siegbahn
ed ., Alpha, Beta, and Gamma Ray Spectroscopy, vol .1, 37-78, North-Hollan d
Publ . Comp ., Amsterdam, 1968 .
EGBERT S .D ., MAY R .S . An integral transport method for Compton scatte r
correction in emission computed tomography, IEEE NS, 27, 543-547 (1980) .
HERMAN G .T . Image reconstruction from projections . In fundamentals o f
Computerized Tomography, Academic Press, 1980 .
HOFFMAN E .J . The positron tomograph : Basic principles of the instrumen t
and its image in principles of radionuclide emission imaging . D . Kuhl ,
ed ., Pergamon Press, Paris, 201-226 (1984) .
HOFFMAN E .J ., HUANG S .C ., PHELPS M .E . Quantitation in positron emissio n
computed tomography : 1 - Effect of object size . J . Comput . Assist .
Tomogr . 3, 299 (1979) .
HOFFMAN E .J ., PHELPS M .E . An analysis of some of the physical aspects
of positron transaxial tomography, Comput . Biol . Med . 6, 345 (1976) .
HUANG S .C ., HOFFMAN E .J ., PHELPS M .E ., KUHL D . E . Quantitation in positron
emission computed tomography : 3 - Effect of sampling . J . Comput . Assist .
Tomogr ., 10 (1981) .
HUESMAN R . The effects of a finite number of projection angles and finit e
lateral sampling of projections on the propagation of statistical error s
in transverse section reconstruction . Phys . Med . Biol ., 22, 3, 511-52 1
(1977) .
JASZCZAK R .J ., COLEMAN R .E ., WHITEHEAD F .R . Physical factors affectin g
quantitative measurements using camera-based single photon emissio n
computed tomography (SPECT) . IEEE Trans . Nucl . Sci ., NS 28, 69-80 (1981) .
JASZCZAK R .J ., GREER K .L ., FLOYD C .E ., HARRIS C .C ., COLEMAN R .E . Improve d
SPECT quantitation using compensation for scattered photons . J . Nucl .
Med . 25, 893-900 (1984) .
KEMP M .C . Maximum entropy reconstructions in emission tomography, I n
Medical Radionuclide Imaging 1, Proc . Symp . Heidelberg, IAEA, Vienna ,
1, 313-323 (1981) .
LARSSON S .A . Gamma camera emission tomography, Acta Radiol . Suppl . 363 ,
1980 .
LIM C . B . , CHANG LT ., JASZCZAK R .J . Performance analysis of three camer a
configurations for single photon emission computed tomography, IEE E
Trans . NS, 27, 559-568 (1980) .
MOORE S .C ., PARKER J .A ., ZIMMERMAN R .E ., BUDINGER T .F ., HOLMAN B .L .
The effect of angular sampling on image quality of the harvard multi -
detector ECT brain scanner . In Proc . of the Third World Congress of
Federation of Nuclear Medicine and Biology, C . Raynaud ed ., Pergamo n
Press, Paris, 531-534 (1982) .
PANG S .C ., GENNA S . The effect of Compton scattered photons on emissio n
computerized transaxial tomography . IEEE, NS, 26, 2772-2774 (1979) .
SHEPP L .A ., VARDI Y ., RA J .B ., HILAL S .K ., CHO Z .H . Maximum likelihood
PET with real data, IEEE Trans . on Nuclear Sciences, NS 31, 2, 910-91 3
(1984) .
SOUSSALINE F ., TODD-POKROPEK A .E . The need for a quality control program
in emission tomography, in Proc . of 19th Meeting of the Society of Nuclea r
medicine, Europ ., Berne CH, Sept . 1981 .
SOUSSALINE F ., TODD-POKROPEK A .E ., HUFFER E ., RAYNAUD C . Physica l
characteristics of a SPT system using a rotating conventional gamm a
camera in Emission Computed Tomography : The single photon approach ,
BRH, Paras P ., Eikman E .A . eds ., Washington HHS Publication FDA, 8171 -
8177 (1981) .
TANAKA E ., IINUMA T .A . Correction functions and statistical noises i n
transverse section picture reconstruction . Comp . Biol . Med ., 6, 295 -
306 (1976) .
TODD-POKROPEK A .E . Image processing with special reference to ECT, i n
Applications of physics to medicine and biology, Alberi G ., Bajzer Z . ,
Baxa P ., eds, World Scientific Press, Singapour, 391-428 (1983) .
TODD-POKROPEK A .E ., MARSH R ., GILARDI M .C ., GERUNDINI P ., FAZIO F . An
object independent attenuation correction in SPECT : eliminating the
effects of scatter and collimator PSF . J . Nucl . Med ., 25, 5, P14 (1984) .
TODD-POKROPEK A .E ., ZUROWSKI S ., SOUSSALINE F . Non-uniformity and artefac t
creation in emission tomography . J . Nucl . Med . 21, 38 (1980) .
YING LIE O . A single photon ECAT reconstruction procedure based on a PSF
model . Ph . D . Thesis, Deft University Press, 1984 .
INSTRUMENTATION ET PRINCIPES DE DETECTION
EN TOMOGRAPHIE D ' EMISSIO N
6 .1 . L'introduction de l'imagerie scintigraphique tridimensionnelle à
partir de projections multiples a certainement représenté la contri -
bution la plus importante à la recherche d ' une méthode à haut contraste .
Historiquement, le concept de détecteur tomographique et de rétro -
projection fut introduit par Kuhl et son groupe dès 1963 qui propo-
sèrent un détecteur barreau à balayage rectilinéaire et rotation
angulaire autour du crâne d'un patient, constitué de cristaux indivi -
duels de Nal (TI) côllimatés .
En 1979, Budinger dénombrait 18 types de dispositifs allant de l a
simple sonde à scintillations à multiples positions angulaires ,
à un cylindre de centaines de paires de détecteurs entourant c e
dernier . A ce jour, les centaines sont devenues des milliers, en
tomographie d ' émission de positons .
Des assemblages de détecteurs ont été développés pour permettre ,
par mouvements de translation, rotation et de rotation linéaire
(ou brimbalement), un échantillonnage adéquat linéaire et angulaire
de l ' espace d ' intérêt .
Il est d ' usage de classer ces appareils ou systèmes de tomographi e
axiale transverse par émission en quatre grandes catégorie s
(Publication IV) ; Budinger et coll ., 1977 ; Goodwin, 1980
Patton ,
1980 ; Jaszczak, 1980 ; Phelps, 1977) .
CHAPITRE 6 -
1 - Les systèmes de tomographie d'émission gamma constitués de détec-
teurs disposés linéairement, susceptibles d'effectuer une rotatio n
autour de l'organisme et permettant l'obtention de coupes à deu x
dimensions, uniques, ou en petit nombre (3) .
2 - Les systèmes de tomographie d'émission gamma où le détecteu r
sensible est disposé suivant un plan qui, par rotation autou r
de l'organisme, permet la réalisation simultanée d'un gran d
nombre de coupes adjacentes, et par tri des données lors de l a
reconstruction, l'obtention de données en trois dimensions .
3 - Les systèmes de tomographie d'émission à positons, à dispositio n
polygonale (hexagone, octogone . . .) ou circulaire de détecteurs
individuels appropriés, constitués de une à plusieurs couronne s
ainsi disposées et permettant la réalisation d'autant de coupe s
à deux dimensions . '
4 - Les systèmes de tomographie d'émission à positons à structur e
de détection plane, de grande dimension, permettant la réalisa -
tion simultanée de multiples coupes, le plus souvent parallèle s
à l'axe de l'organisme, et, par reconstruction, d'obtenir de s
données en trois dimensions .
Une dernière catégorie, très peu utilisée en pratique clinique ,
mais dont les concepts, généralement issus du domaine de l'optique ,
ont pu sembler intéressants, est celle des systèmes à ouverture s
de codage (Barrett, 1972 ; Brunol et Fonrojet, 1978), ouverture s
codées en temps (Koral et coll ., 1975), trous d'épingles multiple s
(Myers et coll ., 1973 ; Mathieu et Budinger, 1974 ; Vogel et coll . ,
1979) .
Cependant, les problèmes liés à l'échantillonnage angulaire limit é
et, par conséquent, aux artefacts produits par l'activité extern e
au plan longitudinal reconstruit, ainsi qu ' à l ' impossibilité de
quantification à l ' intérieur de tels plans, sont probablement à
l ' origine de l ' intérêt limité pour cette dernière catégorie de systèmes .
97
Ces systèmes ne représentent pas seulement une évolution historique
dans les concepts des réalisateurs, physiciens et ingénieurs, mai s
représentent aussi le compromis, proposé par ceux-ci, choisi pou r
des instruments capables d'obtenir des coupes multiples en des temp s
relativement longs et ceux fournissant une coupe transverse uniqu e
mais à temps d'acquisition bref .
Ils diffèrent, essentiellement, dans la manière d'obtention de s
projections initiales, au sens défini au § 3 .2 . La plupart des auteur s
utilisent une classification "conventionnelle", bien qu'empreint e
de quelque ambiguité (Publication IV), basée sur la géométrie de s
images tomographiques obtenues comme résultat .
Les systèmes d'imagerie sont appelés "longitudinaux" si la techniqu e
de reconstruction primitive est réalisée pour des plans parallèle s
au grand axe du corps, et "transversaux" si elle est réalisée pou r
des plans perpendiculaires à cet axe . Dans ce dernier cas, il
y a trè s
peu d 'interaction entre les informations appartenant aux plans image s
successifs et les données peuvent être réorganisées par calcul pou r
obtenir l'ensemble des plans parallèles à n'importe quelle direction ,
en particulier celle du grand axe du corps (plans coronaux et sagit-
taux) ou quelconque (oblique, parallèle aux axes d'un organe d'intérêt ,
comme le coeur, par exemple) . Pour illustrer cette classification, s e
reporter au tableau 1 de la Publication IV, en ce qui concerne les
systèmes de tomographie d'émission gamma des catégories 1 et 2 . Dan s
le cas des systèmes de tomographie à positons, cette classificatio n
recoupe celle des catégories 3 (systèmes de tomographie dit "transver-
saux") et 4 ("longitudinaux") .
Comme on l'a déjà remarqué, en introduction, en dépit de l'intérê t
exceptionnel des données cliniques
que l'on peut obtenir en tomogra-
phie d'émission à positons, cette méthodologie pose à l'heure actuell e
encore de sérieux problèmes de coûts, et se trouve donc développé e
dans un nombre relativement restreint de centres (une soixantaine e n
Europe, aux Etats-Unis et au Japon ; un seul en france, celu i
du SHFJ au CEA) .
- 98 -
Aussi, les avantages potentiels, également considérables, de l a
tomographie d'émission gamma :
- l'accès à la représentation d ' une distribution volumique ,
- l'augmentation sensible du contraste des images ,
- la meilleure uniformité de la résolution spatiale ,
- la quantification absolue de la concentration radioactiv e
régionale ,
à l'aide de radioéléments largement utilisés dans les département s
de Médecine Nucléaire, expliquent le grand développement de système s
instrumentaux et de techniques de traitement de ces sept dernière s
années .
6 .2 . TOMOGRAPHES D'EMISSION GAMMA
6 .2 .1 . DESCRIPTION DES INSTRUMENTS DE DETECTIO N
Un des concepts essentiels dans le développement instrumenta l
en tomographie d'émission gamma comme en positons est celu i
d ' échantillonnage angulaire complet, c ' est-à-dire des 360°
de l'espace, permettant d'isoler parfaitement des plans d'activit é
perpendiculaires au grand axe de l'objet radioactif . Dan s
ce contexte, les travaux de pionniers de D . Kuhl et ses collabora-
teurs ont permis l'obtention de coupes transversales à hau t
contraste d'une distribution radioactive en volume . Le princip e
de ce type d'instrument, décrit en détail dans de nombreuse s
publications sous le nom de MARK I à IV (Kuhl et coll ., 1964 ,
1970, 1974, 1976) est indiqué dans le schéma de la figure
F .6 .2 .1 . Il est d'ailleurs très analogue à celui utilisé dan s
les premiers tomographes à transmission X, et, également ,
a inspiré tous les concepteurs des systèmes de la catégori e
I (terminologie anglo-saxonne : Scanner - based SPECT systems )
tels que Todd-Pokropek, 1972, Myers et col l . , 1973 ; Keye s
et coll ., 1977 ; Kirsch et coll ., 1981 ; Lassen et coll . ,
1981 ; Stoddart et coll ., 1979 ; Zimmerman et coll ., 1980 :
Bonte et Stokely, 1981 ; Kanno et coll ., 1981 ; Genna et coll ., 1976) .
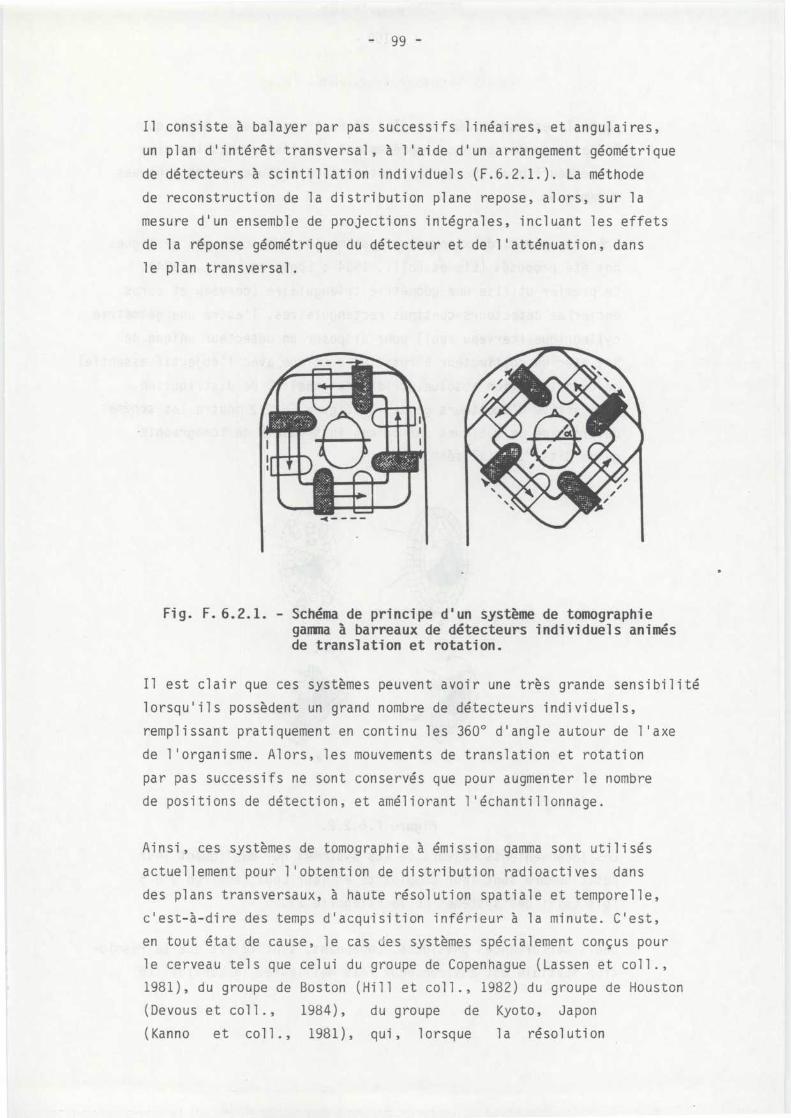
Il consiste à balayer par pas successifs linéaires, et angulaires ,
un plan d'intérêt transversal, à l'aide d'un arrangement géométriqu e
de détecteurs à scintillation individuels (F .6 .2 .1 .) . La méthod e
de reconstruction de la distribution plane repose, alors, sur l a
mesure d ' un ensemble de projections intégrales, incluant les effet s
de la réponse géométrique du détecteur et de l'atténuation, dan s
le plan transversal .
Fig . F .6 .2 .1 . - Schéma de principe d'un système de tomographi egamma à barreaux de détecteurs individuels animé sde translation et rotation .
Il est clair que ces systèmes peuvent avoir une très grande sensibilit é
lorsqu'ils possèdent un grand nombre de détecteurs individuels ,
remplissant pratiquement en continu les 360° d'angle autour de l'ax e
de l'organisme . Alors, les mouvements de translation et rotatio n
par pas successifs ne sont conservés que pour augmenter le nombr e
de positions de détection, et améliorant l'échantillonnage .
Ainsi, ces systèmes de tomographie à émission gamma sont utilisé s
actuellement pour l ' obtention de distribution radioactives dan s
des plans transversaux, à haute résolution spatiale et temporelle ,
c'est-à-dire des temps d'acquisition inférieur à la minute . C'est ,
en tout état de cause, le cas des systèmes spécialement conçus pou r
le cerveau tels que celui du groupe de Copenhague (Lassen et coll . ,
1981), du groupe de Boston (Hill et coll ., 1982) du groupe de Housto n
(Devous et coll .,
1984),
du groupe
de Kyoto, Japo n
(Kanno
et col l . ,
1981), qui, lorsque
la résolution
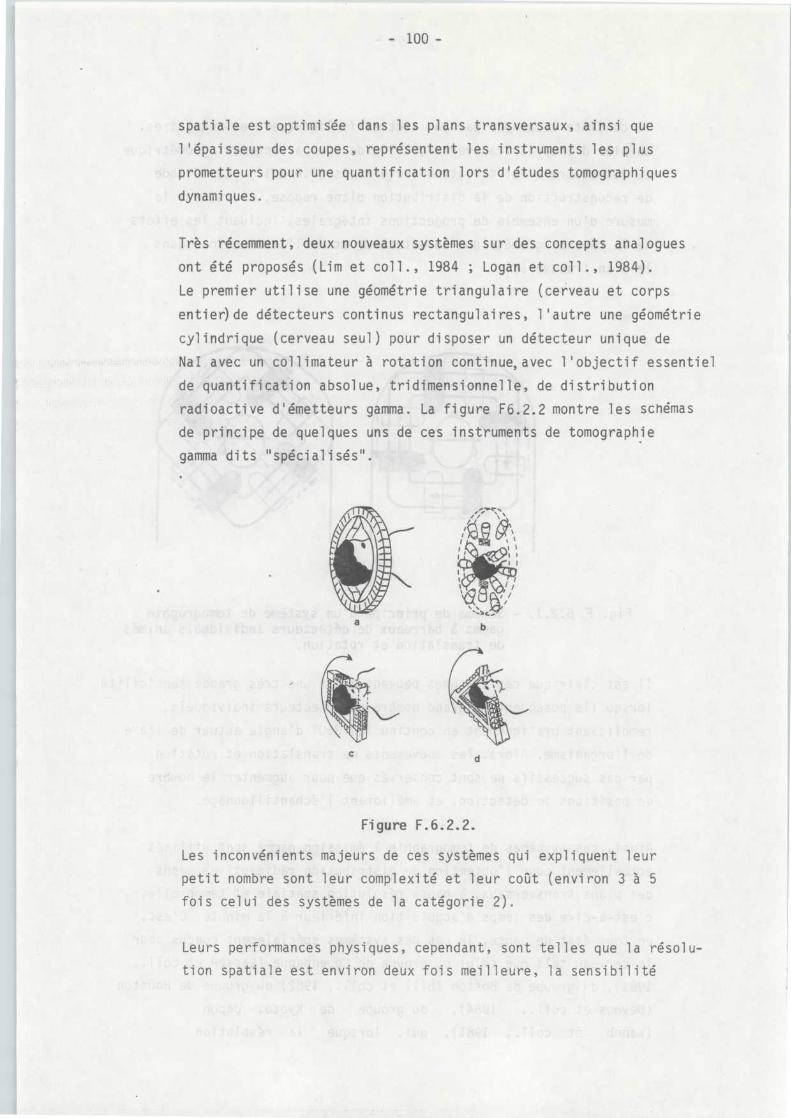
spatiale est optimisée dans les plans transversaux, ainsi qu e
l'épaisseur des coupes, représentent les instruments les plu s
prometteurs pour une quantification lors d'études tomographique s
dynamiques .
Très récemment, deux nouveaux systèmes sur des concepts analogues .
ont été proposés (Lim et coll ., 1984 ; Logan et coll ., 1984) .
Le premier utilise une géométrie triangulaire (cerveau et corp s
entier)de détecteurs continus rectangulaires, l'autre une géométri e
cylindrique (cerveau seul) pour disposer un détecteur unique de
Nal avec un collimateur à rotation continue,avec l'objectif essentie l
de quantification absolue, tridimensionnelle, de distributio n
radioactive d'émetteurs gamma . La figure F6 .2 .2 montre les schéma s
de principe de quelques uns de ces instruments de tomographi e
gamma dits "spécialisés" .
b
c
d
Figure F .6 .2 .2 .
Les inconvénients majeurs de ces systèmes qui expliquent leu r
petit nombre sont leur complexité et leur coût (environ 3 à 5
fois celui des systèmes de la catégorie 2) .
Leurs performances physiques, cependant, sont telles que la résolu-
tion spatiale est environ deux fois meilleure, la sensibilité
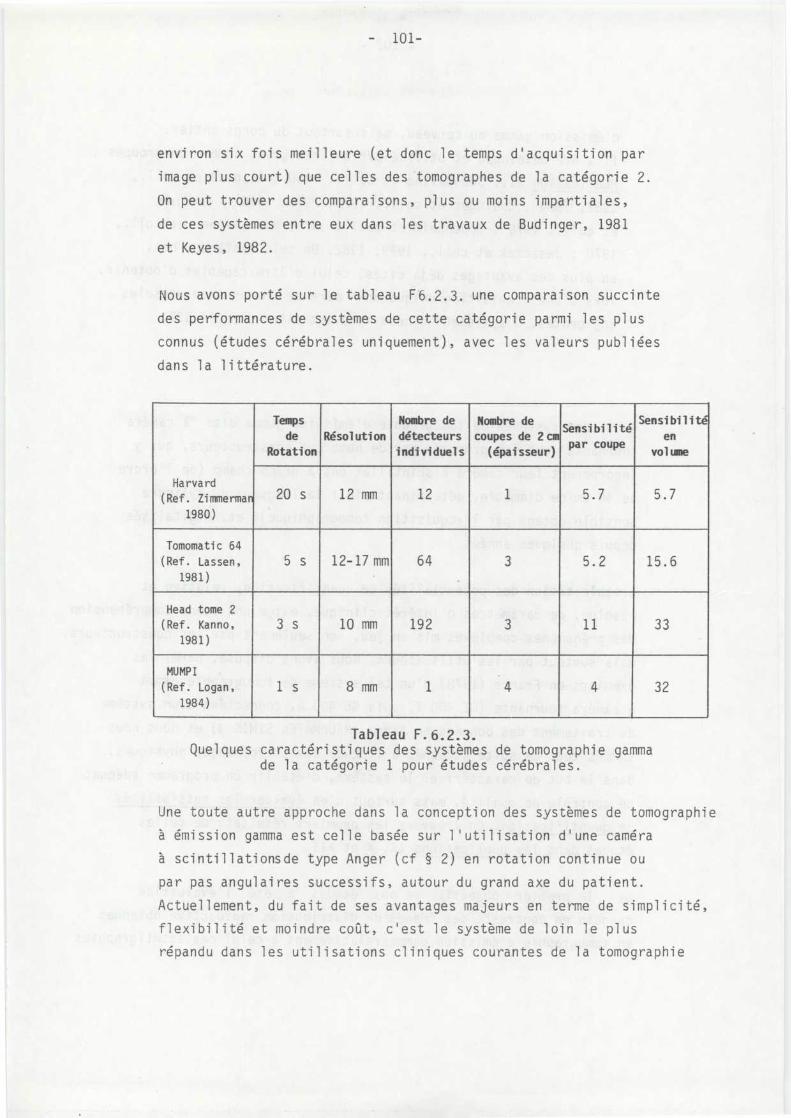
environ six fois meilleure (et donc le temps d ' acquisition pa r
image plus court) que celles des tomographes de la catégorie 2 .
On peut trouver des comparaisons, plus ou moins impartiales ,
de ces systèmes entre eux dans les travaux de Budinger, 198 1
et Keyes, 1982 .
Nous avons porté sur le tableau F6 .2 .3 . une comparaison succint e
des performances de systèmes de cette catégorie parmi les plu s
connus (études cérébrales uniquement), avec les valeurs publiée s
dans la littérature .
Temp sde
RotationRésolution
Nombre dedétecteursindividuels
Nombre decoupes de 2 cm
(épaisseur)
Sens~bilitepar coupe
Sensibilitéen
volume
Harvar d(Ref . Zimmerma n
1980 )
20 s 12 mm 12 1 5 .7 5 . 7
Tomomatic 6 4(Ref .
Lassen ,1981)
5
s 12-17 mm 64 3 5 .2 15 . 6
Head tome 2(Ref .
Kanno ,1981)
3 s 10 mm 192 3 11 33
MUMP I(Ref .
Logan ,1984)
1
s 8 mm 1 4 4 32
Tableau F .6 .2 .3 .Quelques caractéristiques des systèmes de tomographie gamma
de la catégorie 1 pour études cérébrales .
Une toute autre approche dans la conception des systèmes de tomographi e
à émission gamma est celle basée sur l'utilisation d'une camér a
à scintillationsde type Anger (cf § 2) en rotation continue o u
par pas angulaires successifs, autour du grand axe du patient .
Actuellement, du fait de ses avantages majeurs en terme de simplicité ,
flexibilité et moindre coût, c ' est le système de loin le plu s
répandu dans les utilisations cliniques courantes de la tomographi e
- 102 -
d'émission gamma du cerveau, mais surtout du corps entier .
Il a été développé et utilisé par un très grand nombre de groupes ;
Publication XII, Soussaline et coll ., 1980 ; Raynaud et coll .,
1982, 1984 ; Budinger et coll ., 1974, 1978, 1980 ; Burdin e
et coll ., 1979 ; Oppenheim et coll ., 1976, Muehllehner et coll . ,
1970 ; Jaszczak et coll ., 1979, 1982 . De tels systèmes, ont ,
en plus des avantages déjà cités, celui d'être capables d'obtenir ,
lors d'une acquisition unique un nombre de coupes transversale s
adjacentes, d'épaisseur connue, pouvant aller jusqu'à 128 .
Aussi des systèmes de tomographie d'émission gamma dits "à camér a
tournante" ont été proposés par de nombreux constructeurs, qui y
incorporent leur caméra à scintillations à grand champ (de l'ordr e
de 40 cm de diamètre, déterminant ainsi la longueur du cylindr e
sensible obtenu par l'acquisition tomographique), et, digitalisé e
depuis quelques années .
L'exploitation des potentialités de quantification, relative et
absolue, de paramètres d'intérêt clinique, exige une bonne compréhensio n
des phénomènes complexes mis en jeu, non seulement par les constructeurs ,
mais surtout par les utilisateurs . Nous avons disposé, parmi le s
premiers en France (1978) d'un tel système de tomographie gamma
à caméra tournante (GE 400 T, puis GE 400 A, connectées à un système
de traitement des données en ligne INFORMATEK SIMIS 3) et nous nou s
sommes tout de suite attachés à l'étude des performances physiques ,
dans le but de caractériser le système, d'établir un programme adéquat
de contrôle de qualité, mais surtout d ' en évaluer les possibilité s
de quantification .On trouvera les premiers résultats de telle s
études dans les publications IX, X et XII .
Si
le premier objectif de nos études a été l'évaluatio n
du gain en contraste des images de distribution radioactive obtenue s
en tomographie d'émission gamma relativement à celui des scintigraphies
en projection conventionnelle, notre véritable but était l'analys e
des paramètres intervenant dans la mesure absolue de volumes, (Taux e
et coll ., 1983) et de concentrations radioactives régionales dans les étude s
physiopathologiques . Guidés par ces objectifs, nous avons analys é
chacune des étapes permettant l'obtention de données régionales :
de la collection des photons par le système de détection, entaché e
de la fonction de réponse de celui-ci, à la diffusion Compto n
et à l'autoatténuation, jusqu'à la représentation modélisée d'un e
distribution d'intérêt, en passant par la méthode de reconstructio n
des plans images successifs . Ces aspects ont été analysés en détail s
dans le chapitre 5 .
6 .2 .2 . PARAMETRES CARACTERISTIQUES DES TOMOGRAPHES D'EMISSION GAMMA
La Publication XII présente la définition des paramètres caracté -
risant un système de tomographie d'émission gamma, et leu r
protocole de mesure, valables pour l'ensemble de tels système s
commercialisés . Dans ce contexte, nous avons participé au x
travaux des groupes de chercheurs qui, au plan international ,
proposent des programmes d'assurance de qualité, comprenan t
les tests d'acceptance et tests de spécificiations (Internationa l
Commission on Radiation Protection, Publication 34 : " Patien t
protection in Nuclear Medicine " , et International Commission
on Radiation Unit) .
Il a été ainsi établi une liste des paramètres permettant de caracté -
riser complètement un système de tomographie d'émission gamma :
1 - La résolution spatiale dans le plan transversal ,
2 - La résolution selon l'axe longitudinal, ou épaisseu r
de la coupe ,
3 - L'uniformité de la fonction de réponse du système dans l e
plan transversal ,
4 - La taille du volume de détection ,
5 - La sensibilité globale, ou par coupe individuelle ,
6 - La linéarité de la réponse du système à haut taux de comptage .
La figure F .6 .2 .5, présente une photographie de cet exempl e
étudié et utilisé au SHFJ qui consiste essentiellement en une
caméra General Electric (400 A) montée sur un anneau de rotation ,
un lit réglable pour que le patient soit allongé selon un axe
parallèle et très proche de l'axe de rotation et un système
de traitement des données SOPHA MEDICAL (SIMIS III) de 64 K/16
bits .
Les protocoles précis de mesure de ces paramètres font également parti e
de ces travaux pour parvenir à une meilleure uniformisatio n
des méthodes .
Les conditions de mesure revêtent une importance particulière en tomo -
graphie d'émission, car le système,s'il augmente considérablement
le contraste des signaux ' obtenus, amplifie également les distorsion s
inhérentes à l'instrument et aux méthodes de traitement des données .
Même si
on limite la discussion à la seule obtention de coupe s
transversales multiples à l'aide d'un système basé sur une camér a
en rotation, il n'en reste pas moins que de tels instruments son t
complexes et exigent un étalonnage et un contrôle de leurs perfor-
mances à chacune de leur utilisation à but quantitatif .
Les erreurs d'alignement mécanique ou électronique peuvent provoque r
de graves artefacts dans les images structurées, une perte e n
résolution et augmenter le niveau du bruit, même si - et cel a
a été montré avec précision (Todd-Pokropek, 1983, Jaszczak, 1983) -
ces effets sont plus aisément reconnus et mesurés sur des étude s
de simulation physique que sur des études cliniques . Il est reconn u
q u ' un déplacement aussi petit que 1 à 3 mm des données de projectio n
par rapport au véritable centre de rotation peut entrainer une
dégradation très importante de l ' image tomographique .
Un paramètre extrêmement important dans l ' étalonnage et le contrôl e
de qualité d ' un système basé sur une caméra en rotation est celu i
de l ' uniformité de la sensibilité dans le champ de détection .
Il est traité au paragraphe 6 .l .l .
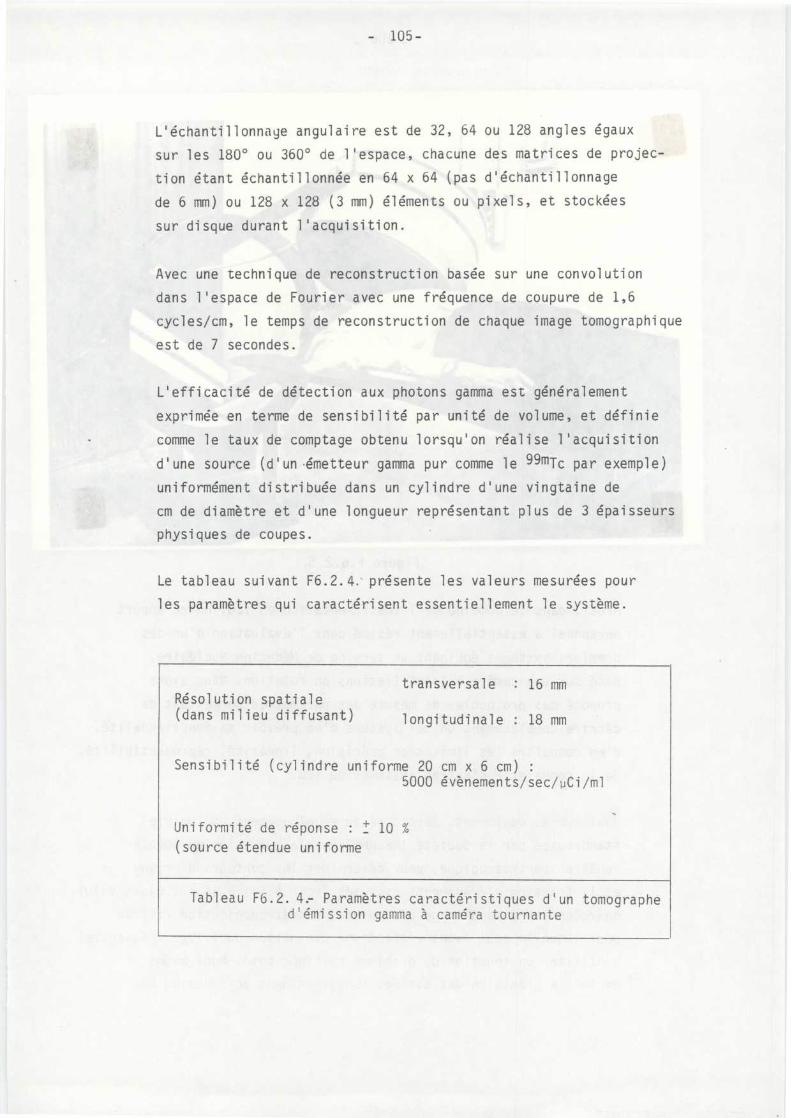
L'échantillonnage angulaire est de 32, 64 ou 128 angles égau x
sur les 180° ou 360° de l'espace, chacune des matrices de projec-
tion étant échantillonnée en 64 x 64 (pas d'échantillonnage
de 6 mm) ou 128 x 128 (3 mm) éléments ou pixels, et stockée s
sur disque durant l'acquisition .
Avec une technique de reconstruction basée sur une convolutio n
dans l'espace de Fourier avec une fréquence de coupure de 1, 6
cycles/cm, le temps de reconstruction de chaque image tomographiqu e
est de 7 secondes .
L'efficacité de détection aux photons gamma est généralemen t
exprimée en terme de sensibilité par unité de volume, et défini e
comme le taux de comptage obtenu lorsqu'on réalise l'acquisition
d'une source (d'un émetteur gamma pur comme le 99mTc par exemple )
uniformément distribuée dans un cylindre d'une vingtaine d e
cm de diamètre et d ' une longueur représentant plus de 3 épaisseur s
physiques de coupes .
Le tableau suivant F6 .2 .4 : présente les valeurs mesurées pou r
les paramètres qui caractérisent essentiellement le système .
Résolution spatial e
(dans milieu diffusant)
transversale : 16 mm
longitudinale : 18 mm
Sensibilité (cylindre uniforme 20 cm x 6 cm )5000 évènements/sec/uCi/m l
Uniformité de réponse : ± 10 %
(source étendue uniforme
Tableau F6 .2 . 4 .- Paramètres caractéristiques d ' un tomograph ed ' émission gamma à caméra tournante
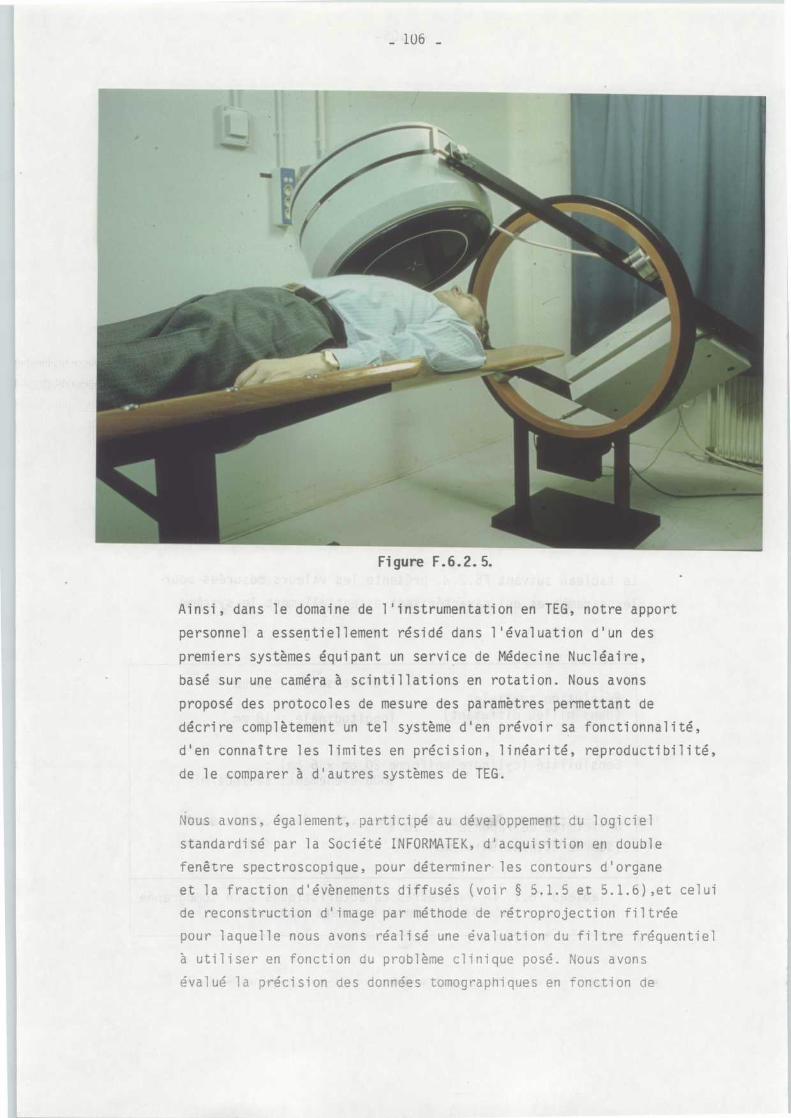
_106 _
Figure F .6 .2 .5.
Ainsi, dans le domaine de l'instrumentation en TEG, notre appor t
personnel a essentiellement résidé dans l'évaluation d'un de s
premiers systèmes équipant un service de Médecine Nucléaire ,
basé sur une caméra à scintillations en rotation . Nous avon s
proposé des protocoles de mesure des paramètres permettant d e
décrire complètement un tel système d'en prévoir sa fonctionnalité ,
d ' en connaître les limites en précision, linéarité, reproductibilité ,
de le comparer à d'autres systèmes de TEG .
Nous avons, également, participé au développement du logicie l
standardisé par la Société INFORMATEK, d ' acquisition en doubl e
fenêtre spectroscopique, pour déterminer les contours d ' organe
et la fraction d ' évènements diffusés (voir § 5,1 .5 et 5 .1 .6),et celu i
de reconstruction d'image par méthode de rétropro jecti on filtrée
pour laquelle nous avons réalisé une évaluation du filtre fréquentie l
â utiliser en fonction du problème clinique posé . Nous avon s
évalué la précision des données tomographiques en fonction de
- 107 -
l'échantillonnage spatial (64 ou 128 canaux) et angulaire (6 4
ou 128 angles sur 180° ou 360°) ; les résultats sont donné s
dans la Publication XII . Nous avons mis en oeuvre une méthode
de mesure des coefficients linéaires d'atténuation à l'aide
d'une source plane de transmission remplie d'une solution uniforme
de 99mTc (Publication VIII), dont les potentiels et limite s
sont discutés au paragraphe 5 .1 .6 .
Des algorithmes d'estimation de volumes d'organe ont été développé s
au SHFJ (Tauxe et coll ., 1982, 1983) basés sur l'analyse de s
multiples coupes individuelles, obtenues en TEG à l'aide d u
système à caméra tournante . A l'aide de fantômes simulant de s
situations cliniques - coupes au niveau du coeur et des reins -
il a été établi qu'un seuil de 46 % du maximum d'activité dan s
les images successives permet d'évaluer le volume de l'obje t
émetteur, si celui-ci est supérieur à un litre .
Pour des objets de volume inférieur à un litre, un seuil d e
45 % est plus adapté (erreur < 1 %), ce seuil étant indépendan t
de la position de la coupe selon l'axe Z et de la distributio n
de milieu diffusant . Une telle mesure de volume peut avoir u n
intérêt diagnostique et thérapeutique, et peut améliorer l a
précision des mesures d'activité absolue dans un organe .
Enfin, un point de technique peu discuté dans la littérature ,
mais qui pourtant intervient de façon majeure dans la qualit é
finale et la précision des données, est celui du positionnemen t
du patient . Ce positionnement doit se faire de telle sorte qu e
les plans de coupes transversaux soient perpendiculaires a u
grand axe du patient pour les études du thorax et de l'abdomen ,
et soient parallèles à l'axe orbito-meatal pour les études d u
cerveau, axe vonventionnellement adopté en tomographie par trans-
mission X . Il est obtenu à l ' aide de 2 à 3 secteurs en lumièr e
laser, que l'on superpose à des repères anatomiques externe s
(sur la peau du patient) .
De plus, il est essentiel étant donné la durée moyenne de s
acquisitions (de 20 minutes à 60 minutes) de s ' assurer de ce
positionnement en permanence . Le même dispositif est encore
utilisé lorsqu'un deuxième examen du même patient doit êtr e
effectué à quelques heures ou semaines d'intervalle . On trouvera
une photographie du positionnement de la tête d'un patient à
l'aide d'un dispositif à trois axes de référence laser, dan s
le prochain paragraphe, en instrumentation par tomographie d'émis -
sion de positons .
6 .3 . TOMOGRAPHES D'EMISSION DE POSITONS
6 .3 .1 . PRINCIPESPHYSIQUES ET GEOMETRIE DES TOMOGRAPHES D'EMISSIO N
DEPOSITONS
La détection de paires de photons émis en coïncidence selo n
des trajets repérés par les axes des scintillateurs individuel s
simplifie sensiblement l'expression mathématique de la reconstruc -
tion avec correction de l'effet d'atténuation . Celle-ci est
généralement réalisée à l'aide des données de projection obtenue s
lors d'une étude par transmission d'une source uniforme émettric e
fO- à travers l'objet, avant l'étude par émission . Les erreur s
dans les études quantitatives relèvent, en TEP comme en TEG ,
des limitations physiques, comme le nombre limité d'évènement s
acquis au total pour former les images, la résolution limitée ,
spatiale et temporelle, les évènements en coïncidences fortuite s
et les évènements diffusés par effet Compton . Nous avons discuté
en détail de ces effets dans le chapitre 5 .
Le principe de la détection simultanée des deux photons de 510
KeV, émis après annihilation du positon avec un électron, es t
représenté sur le schéma F6 .3 .1 . Les deux gammas sont émis e n
même temps et si l'on néglige dans une première étape le temp s
de parcours du photon entre son lieu d ' émission et sa détectio n
dans le cristal, on admet que les photons seront reçus en
coincidence temporelle . La prise en compte de ces évènement s
limite l'angle solide de détection des photons, réalisan t
ce que l'on appelle une "collimation électronique" . En fait ,
l ' utilisation de cette propriété ne permet pas de supprimer
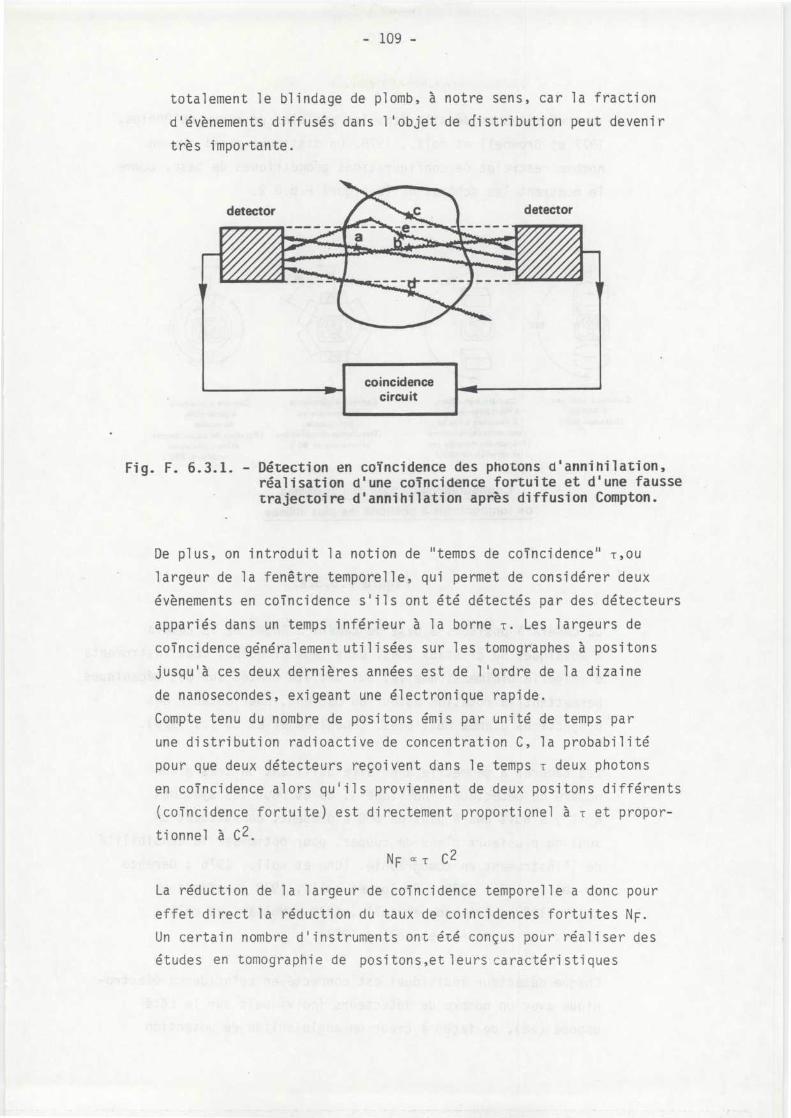
- 109 -
totalement le blindage de plomb, à notre sens, car la fractio n
d'évènements diffusés dans l'objet de distribution peut deveni r
très importante .
coincidence
circuit
Fig . F. 6 .3 .1 . - Détection en coïncidence des photons d'annihilation ,réalisation d'une coincidence fortuite et d'une faussetrajectoire d'annihilation après diffusion Compton .
De plus, on introduit la notion de "tem p s de coincidence" T,o u
largeur de la fenêtre temporelle, qui permet de considérer deu x
évènements en coincidence s'ils ont été détectés par des détecteur s
appariés dans un temps inférieur à la borne T . Les largeurs d e
coincidence généralement utilisées sur les tomographes à positon s
jusqu'à ces deux dernières années est de l'ordre de la dizain e
de nanosecondes, exigeant une électronique rapide .
Compte tenu du nombre de positons émis par unité de temps pa r
une distribution radioactive de concentration C, la probabilité
pour que deux détecteurs reçoivent dans le temps T deux photon s
en coincidence alors q u ' ils proviennent de deux positons différent s
(coincidence fortuite) est directement proportionel à T et propor-
tionnel à C 2 .
NF OT C 2
La réduction de la largeur de coincidence temporelle a donc pou r
effet direct la réduction du taux de coincidences fortuites NF .
Un certain nombre d ' instruments ont été conçus pour réaliser de s
études en tomographie de positons,etleurs caractéristiques
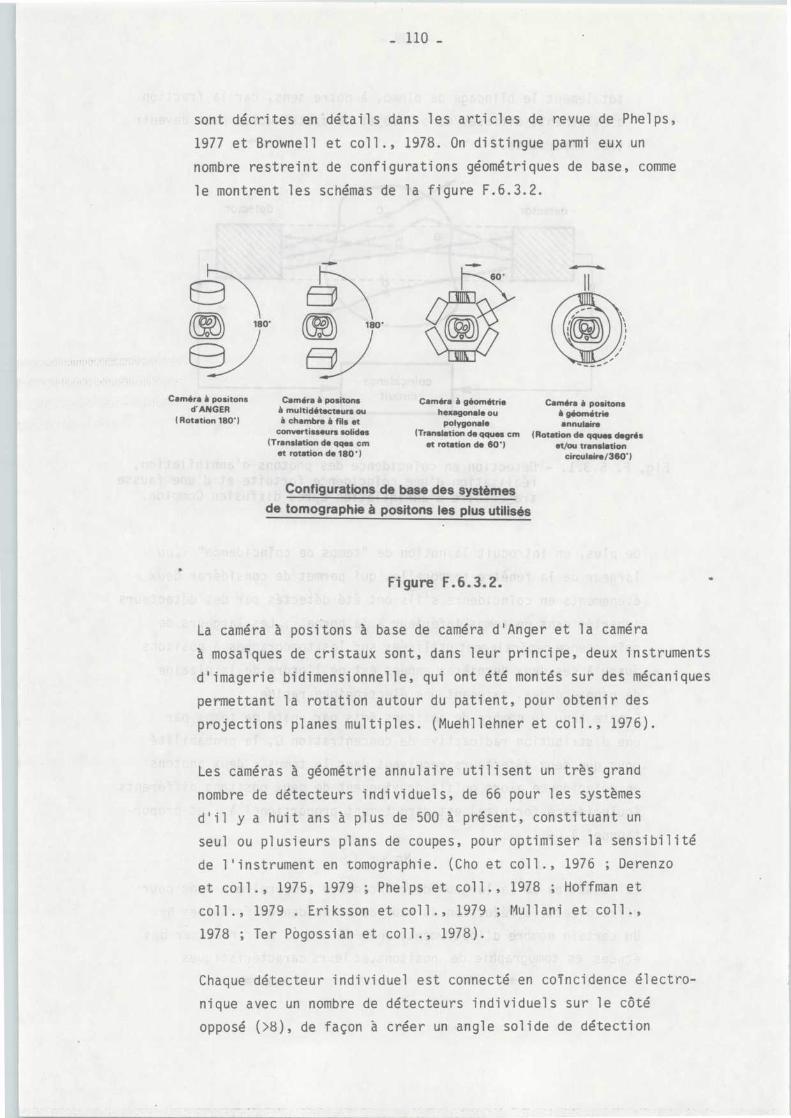
sont décrites en détails dans les articles de revue de Phelps ,
1977 et Brownell et coll ., 1978 . On distingue parmi eux u n
nombre restreint de configurations géométriques de base, comm e
le montrent les schémas de la figure F .6 .3 .2 .
180' 180'
Caméra à positons
Caméra à positonsd' ANGER
à multidétecteurs ouRotation 180')
à chambre à fils etconvertisseurs solides
(Translation de qqes c met rotation de 180'
Caméra à géométrie
Caméra à positon shexagonale ou
à géométriepolygonale
annulaire(Translation de qques cm (Rotation de qques degré s
et rotation de 601
et/ou translationcirculaire/360 ' )
Configurations de base des systèmesde tomographie à positons les plusutilisés
Figure F .6 .3 .2.
La caméra à positons à base de caméra d' An ge r et la camér a
à mosaiques de cristaux sont, dans leur principe, deux instruments
d'imagerie bidimensionnelle, qui ont été montés sur des mécanique s
permettant la rotation autour du patient, pour obtenir de s
projections planes multiples . (Muehllehner et coll ., 1976) .
Les caméras à géométrie annulaire utilisent un très gran d
nombre de détecteurs individuels, de 66 pour les système s
d'il y a huit ans à plus de 500 à présent, constituant u n
seul ou plusieurs plans de coupes, pour optimiser la sensibilité
de l'instrument en tomographie . (Cho et coll ., 1976 ; Derenz o
et coll ., 1975, 1979 ; Phelps et coll ., 1978 ; Hoffman et
coll ., 1979 . Eriksson et coll ., 1979 ; Mullani et coll . ,
1978 ; Ter Pôgossian et coll ., 1978) .
Chaque détecteur individuel est connecté en coincidence électro -
nique avec un nombre de détecteurs individuels sur le côté
opposé (>8), de façon â créer un angle solide de détection
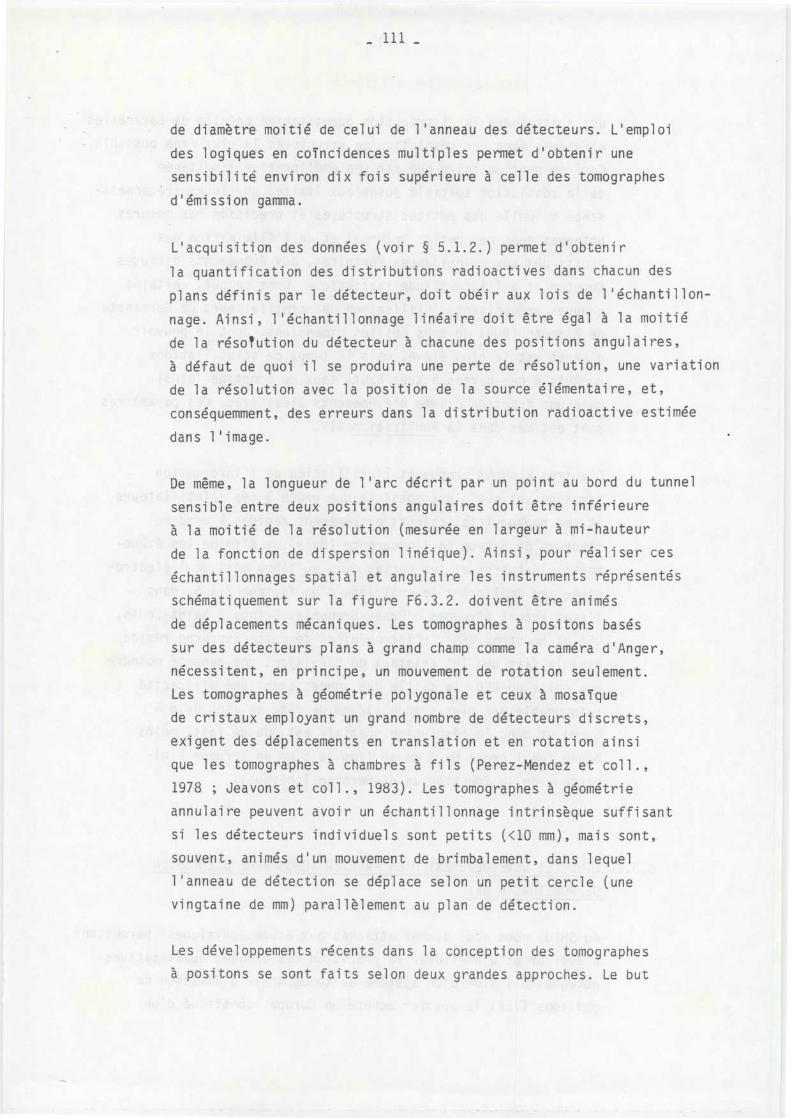
de diamètre moitié de celui de l'anneau des détecteurs . L'emplo i
des logiques en coïncidences multiples permet d'obtenir un e
sensibilité environ dix fois supérieure à celle des tomographe s
d'émission gamma .
L'acquisition des données (voir § 5 .1 .2 .) permet d'obteni r
la quantification des distributions radioactives dans chacun de s
plans définis par le détecteur, doit obéir aux lois de l ' échantillon -
nage . Ainsi, l'échantillonnage linéaire doit être égal à la moiti é
de la résolution du détecteur à chacune des positions angulaires ,
à défaut de quoi il se produira une perte de résolution, une variatio n
de la résolution avec la position de la source élémentaire, et ,
conséquemment, des erreurs dans la distribution radioactive estimée
dans l'image .
De même, la longueur de l'arc décrit par un point au bord du tunne l
sensible entre deux positions angulaires doit être inférieure
à la moitié de la résolution (mesurée en largeur à mi-hauteur
de la fonction de dispersion linéique) . Ainsi, pour réaliser ce s
échantillonnages spatial et angulaire les instruments réprésenté s
schématiquement sur la figure F6 .3 .2 . doivent être animé s
de déplacements mécaniques . Les tomographes à positons basé s
sur des détecteurs plans à grand champ comme la caméra d'Anger ,
nécessitent, en principe, un mouvement de rotation seulement .
Les tomographes à géométrie polygonale et ceux à mosaiqu e
de cristaux employant un grand nombre de détecteurs discrets ,
exigent des déplacements en translation et en rotation ains i
que les tomographes à chambres à fils (Perez-Mendez et coll . ,
1978 ; Jeavons et coll ., 1983) . Les tomographes à géométri e
annulaire peuvent avoir un échantillonnage intrinsèque suffisan t
si les détecteurs individuels sont petits (<10 mm), mais sont ,
souvent, animés d'un mouvement de brimbalement, dans leque l
l'anneau de détection se déplace selon un petit cercle (un e
vingtaine de mm) parallèlement au plan de détection .
Les développements récents dans la conception des tomographe s
à positons se sont faits selon deux grandes approches . Le but
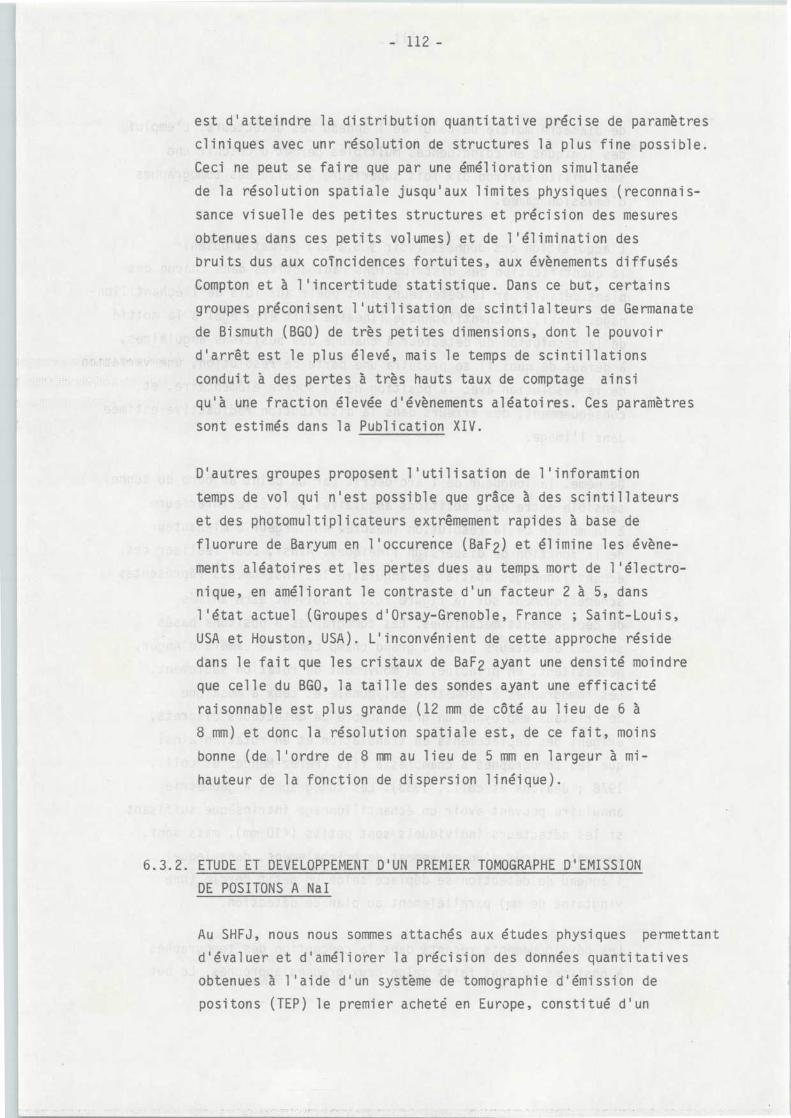
- 112 -
est d'atteindre la distribution quantitative précise de paramètre s
cliniques avec un r résolution de structures la plus fine possible .
Ceci ne peut se faire que par une émélioration simultané e
de la résolution spatiale jusqu'aux limites physiques (reconnais-
sance visuelle des petites structures et précision des mesure s
obtenues dans ces petits volumes) et de l'élimination de s
bruits dus aux coincidences fortuites, aux évènements diffusé s
Compton et à l'incertitude statistique . Dans ce but, certain s
groupes préconisent l'utilisation de scintilalteurs de Germanate
de Bismuth (BGO) de très petites dimensions, dont le pouvoi r
d'arrêt est le plus élevé, mais le temps de scintillation s
conduit à des pertes à très hauts taux de comptage ains i
qu'à une fraction élevée d' évènements aléatoires . Ces paramètre s
sont estimés dans la Publication XIV .
D'autres groupes proposent l'utilisation de l'inforamtion
temps de vol qui n'est possible que grâce à des scintillateur s
et des photomultiplicateurs extrêmement rapides à base de
fluorure de Baryum en l'occurence (BaF2) et élimine les évène-
ments aléatoires et les pertes dues au temps mort de l'électro-
nique, en améliorant le contraste d'un facteur 2 à 5, dan s
l'état actuel (Groupes d'Orsay-Grenoble, France ; Saint-Louis ,
USA et Houston, USA) . L'inconvénient de cette approche résid e
dans le fait que les cristaux de BaF2 ayant une densité moindre
que celle du BGO, la taille des sondes ayant une efficacit é
raisonnable est plus grande (12 mm de côté au lieu de 6 à
8 mm) et donc la résolution spatiale est, de ce fait, moin s
bonne (de l'ordre de 8 mm au lieu de 5 mm en largeur à mi -
hauteur de la fonction de dispersion linéique) .
6 .3 .2 . ETUDE ET DEVELOPPEMENTD'UNPREMIER TOMOGRAPHE D ' EMISSION
DEPOSITONSA Na l
Au SHFJ, nous nous sommes attachés aux études physiques permettan t
d'évaluer et d'améliorer la précision des données quantitative s
obtenues à l'aide d'un système de tomographie d'émission d e
positons (TEP) le premier acheté en Europe, constitué d'un
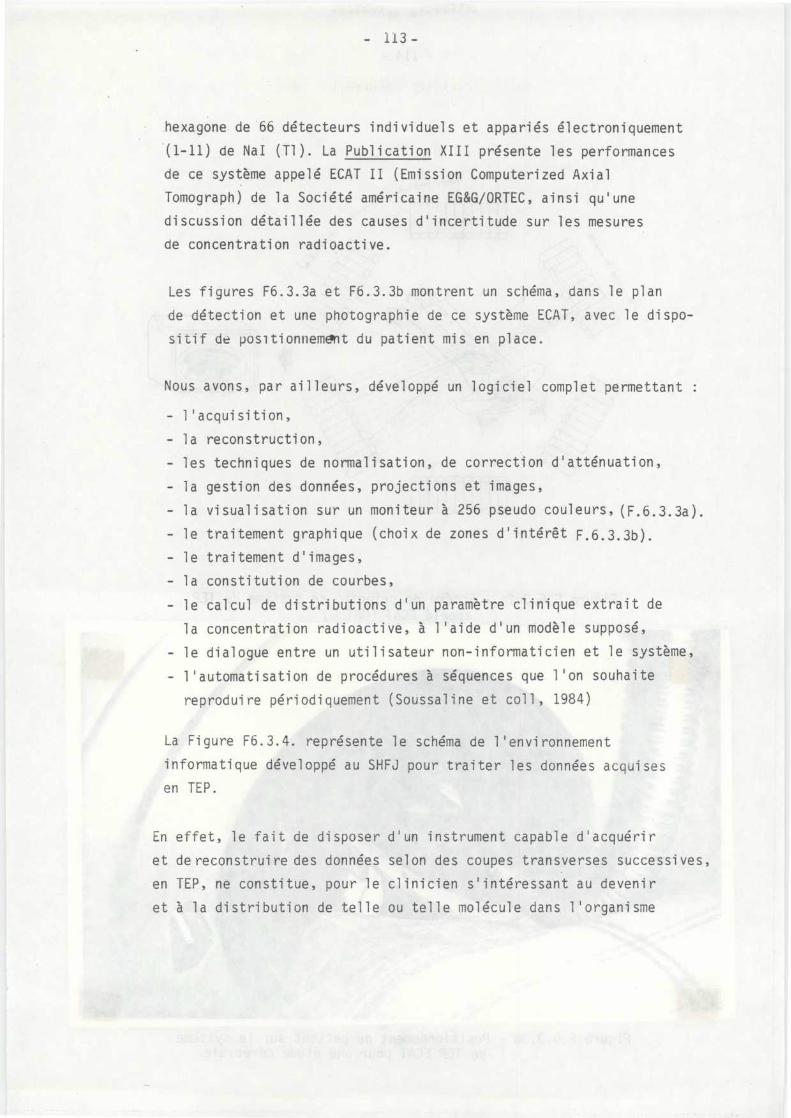
hexagone de 66 détecteurs individuels et appariés électroniquemen t
(1-11) de Nal (Tl) . La Publication XIII présente les performance s
de ce système appelé ECAT II (Emission Computerized Axia l
Tomograph) de la Société américaine EG&G/ORTEC, ainsi qu'un e
discussion détaillée des causes d'incertitude sur les mesure s
de concentration radioactive .
Les figures F6 .3 .3a et F6 .3 .3b montrent un schéma, dans le pla n
de détection et une photographie de ce système ECAT, avec le dispo-
sitif de positionnement du patient mis en place .
Nous avons, par ailleurs, développé un logiciel complet permettant :
- l'acquisition ,
- la reconstruction ,
- les techniques de normalisation, de correction d'atténuation ,
- la gestion des données, projections et images ,
- la visualisation sur un moniteur à 256 pseudo couleurs, (F .6 .3 .3a) .
- le traitement graphique (choix de zones d'intérêt F .6 .3 .3b) .
- le traitement d'images ,
- la constitution de courbes ,
- le calcul de distributions d'un paramètre clinique extrait d e
la concentration radioactive, à l'aide d'un modèle supposé ,
- le dialogue entre un utilisateur non-informaticien et le système ,
- l'automatisation de procédures à séquences que l'on souhait e
reproduire périodiquement (Soussaline et coil, 1984 )
La Figure F6 .3 .4 . représente le schéma de l'environnemen t
informatique développé au SHFJ pour traiter les données acquise s
en TEP .
En effet, le fait de disposer d ' un instrument capable d ' acquéri r
et de reconstruire des données selon des coupes transverses successives ,
en TEP, ne constitue, pour le clinicien s'intéressant au deveni r
et à la distribution de telle ou telle molécule dans l'organisme
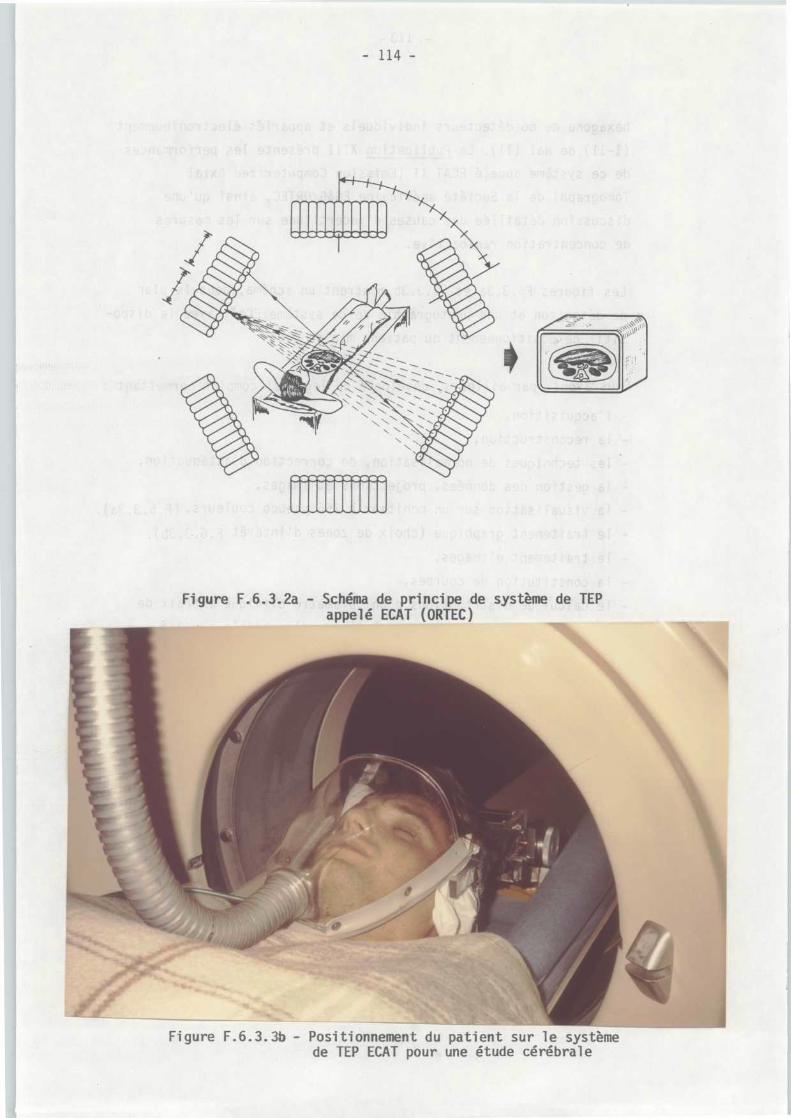
Figure F .6 .3 . 3b - Positionnement du patient sur le systèm ede TEP ECAT pour une étude cérébral e
Figure F .6 .3.2a - Schéma de principe de système de TEPappelé ECAT (ORTEC)
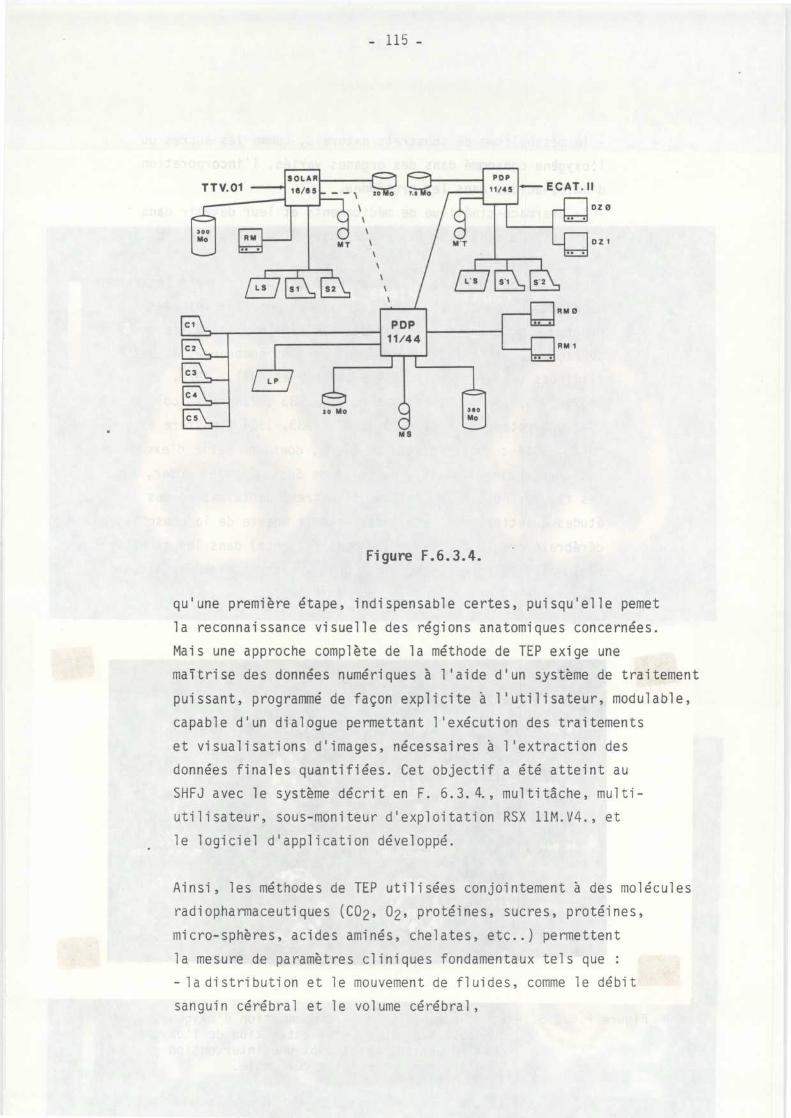
SOLA R
16/65
PD P
11/4 5TTV.01 ECAT . I I
1 DZ 0
130 0Mo M
MT
11 M'T DZ 1
S2L' S S' 2
RM 0P D P
11/4 4C 2
C3LP
RM 1
Fns\„_
8
30 0M o
M S
20 Mo
Figure F .6 .3 .4 .
qu'une première étape, indispensable certes, puisqu'elle peme t
la reconnaissance visuelle des régions anatomiques concernées .
Mais une approche complète de la méthode de TEP exige un e
maîtrise des données numériques à l ' aide d ' un système de traitemen t
puissant, programmé de façon explicite à l'utilisateur, modulable ,
capable d'un dialogue permettant l'exécution des traitement s
et visualisations d'images, nécessaires à l'extraction de s
données finales quantifiées . Cet objectif a été atteint a u
SHFJ avec le système décrit en F . 6 .3 .4., multitâche, multi -
utilisateur, sous-moniteur d ' exploitation RSX 11M .V4 ., e t
le logiciel d'application développé .
Ainsi, les méthodes de TEP utilisées conjointement à des molécule s
radiopharmaceutiques (CO2, 02, protéines, sucres, protéines ,
micro-sphères, acides aminés, chelates, etc . .) permetten t
la mesure de paramètres cliniques fondamentaux tels qu e
- la distribution et le mouvement de fluides, comme le débi t
sanguin cérébral et le volume cérébral,
- le métabolisme de substrats naturels, comme les sucres ou
- 118 -
6 .3 .3 . AMELIORATION DES PERFORMANCES DES TOMOGRAPHES D'EMISSION
DEPOSITONS
Personnellement, nous avons participé aux travaux de développemen t
d'un système de TEP utilisant l'information temps de vol ,
réalisé au LETI (CEN-CEA, Grenoble) à partir de 1980 et install é
au SHFJ en 1983 . Les résultats des études réalisées à ce jour
sur ce système appelé TTV 01, ainsi qu'une discussion de s
perspectives sont décrits en détails au chapitre 7 .
6 .4 . DISCUSSIONSUR L'UTILISATIONDESDEUXTYPESD'INSTRUMENTSTOMOGRAPHIQUE S
Les paramètres physiques déterminant le potentiel des systèmes d e
tomographie à émission gamma sont essentiellement l a . sensibilité
et les exigences de la qualité statistique des images, la résolutio n
spatiale et son uniformité, le degré de correction des effets d ' atténuation
et de diffusion Compton, et, également, les possibilités d ' obtention
de coupes multiples et simultanées .
Bien que les systèmes de tomographie par émission de positons aien t
été utilisés intensivement
pour la
mesure des quantités d e
traceurs radioactifs par unité de volume, les systèmes de tomographi e
gamma ne l'ont été que très récemment et, dans un nombre de centre s
limité,
du
fait
de la sensibilité environ cent fois supérieure
des premiers systèmes (TEP) sur les seconds (TEG), et aussi des difficulté s
inhérentes aux seconds à corriger avec exactitude
l'effet d'atténuation
et les autres effets non-stationnaires .
Cependant, on peut constater que,si l'on compare les sensibilité s
des différents systèmes de TEG, normalisées à leur valeur par centi-
mètre cube d'élément de résolution, les systèmes ,spécialisés pou r
la tête,à multiples détecteurs (sur le principe de celui propos é
par Kuhl et col l . , dès 1964) ont des sensibilités de l ' ordre de la moiti é
de celle des systèmes de TEP, qui permettent de réaliser des étude s
dynamiques . Or, l ' apport de l ' information temps est crucial et représente
Pour cette raison, il nous semble que pour atteindre cet objectif ,
les développements en instrumentation, conjointement aux technique s
de traitement du signal et de reconstruction, doivent toujours privi-
légier l'amélioration de la sensibilité globale et du rapport signal-
sur-bruit dans les données obtenues en projection . Un tel but est ,
en
général,
atteint
par
le
choix
ae
géométrie s
optimisant le coefficient de remplissage des 360° de l'espace, l a
conception du collimateur et du blindage, la densité du cristal à
scintillations et sa réponse en énergie, la qualité de la digitalisatio n
et de l ' échantillonnage, l ' algorithme de reconstruction et l ' utilisation
de l'information temps de vol, ou bien du filtre adapté à la qualit é
statistique désiré . Ces arguments expliquent en partie l ' énorme avantage
que l'on donne actuellement aux systèmes de TEP . Cependant, on assist e
depuis peu
à un regain d ' intérêt pour la TEG, dans la mesur e
où de nouveaux radioéléments traversant la barrière hémato-encéphaliqu e
ou se fixant sur le myocarde (marqués au Tc-99m ou à l'I 123) son t
disponibles et où des techniques de correction des principales cause s
de bruit sont développées .
CHAPITRE 6 - REFERENCE S
BARON J .C ., BOUSSER M .G ., COMAR D ., DUQUESNOY N ., SASTRE J ., CASTAIGNE
P . Crossed cerebellar diaschisis : a remote functional depressio n
secondary to supratentorial infarction of man . J . of Cerebral Blood
Flow and Metabolism, 1 (1981) .
BARON J .C ., BOUSSER M .G ., •COMAR D ., ROUGEMONT D ., LEBRUN-GRANDIE P . ,
CASTAIGNE P . Apport de la tomographie par émission de positons dan s
l'étude physiopathologique de l'ischémie cérébrale chez l'homme . La
Presse Médicale, 12, 48 (1983) .
BARON J .C ., COMAR D ., BOUSSER M .G ., SOUSSALINE F ., CROUZEL C ., KELLERSHOHN
C . Etude tomographique chez l'homme, du débit sanguin et de l a
consommation d'oxygène du cerveau par inhalation continue d'oxygène
15 . Revue Neurol ., 134, 10, 545-556 (1978) .
BARON J .C ., LEBRUN-GRANDIE P ., COLLARD P . Non-invasive measurement o f
blood flow, oxygen consumption and glucose utilization in the same brai n
regions in man by positron emission tomography . J . Nucl . Med ., 23, 391 -
399 (1982) .
BARON J .C ., LEBRUN-GRANDIE P ., SOUSSALINE F ., LOCH C ., SASTRE J ., BOUSSE R
M .G . Coupling between regional blood flow and oxygen utilization i n
the normal human brain . Archives of Neurology, 40, 230-236 (1983) .
BARON J .C ., ROUGEMONT D ., SOUSSALINE F ., BUSTANY P ., CROUZEL C ., BOUSSE R
M .G ., COMAR D . The local interrelationships of cerebral oxygen consumptio n
and glucose utilization in normals and in ischemic stroke patients :
a positron tomography study . J . of Cerebral Blood Flow and Metabolism ,
4, 140-149 (1984) .
BARRETT H .H . Fresnel zone plate imaging . J . Nucl . Med ., 13, 382-385
(1972) .
BONTE F .J ., STOCKELY E .M . Single photon tomographic study of regiona l
cerebral blood flow after stroke : Concise communication . J . Nucl . -Med . ,
22, 1049-1053 (1981) .
BROWNELL G .L ., CORREIA J .A ., ZAMENHOF R .G . Positron instrumentation ,
in recent advances in Nuclear Medicine (Eds) J .H . Lawrence, T .F . Budinger ,
1-49 (1978) .
BRUNOL J ., FONROGET J . Sequential method for high 3D resolution imagin g
in Nuclear Medicine . Opt . Comm ., vol . 25, 35-42 (1978) .
BUDINGER T .F . Physical attributes of single-photon tomography . J . Nucl .
Medicine, 21, 579-592 (1980) .
BUDINGER T .F ., DERENZO S .E ., GREENBERG W .L ., MUESMAN R .H . Quantitative
potentials of dynamic emission computed tomography . J . Nucl . Medicine ,
19, 309-315 (1978) .
BUDINGER T .F ., DERENZO S .E ., GULLBERG G .T ., GREENBERG W .L . and HUESMAN
R .H . Emission computed assisted tomography with single photon and positro n
annihilation photon emitters . J . Comput . Assist . Tomogr ., 1, 131-145
(1978) .
BUDINGER T .F . and GULLBERG G .T . Three dimensional reconstruction i n
nuclear medicine emission imaging, IEEE Trans . Nucl . Sci ., NS-21, 2-
20 (197 4) .
BURDINE J .A ., MURPHY R .M., DEPUEY E .G . Radionuclide computed tomograph y
of the body using routine radiopharmaceuticals . II . Clinical applications .
J . Nucl . Medicine, 20, 108-114 (1979) .
CHO Z .H ., CHAN J .K ., ERIKSSON L . Circular ring transverse axial positron
camera for 3 dimensional reconstruction of radionuclides distribution ,
IEEE . Trans . Nucl . Sci . 1, 613-622 (1976) .
DERENZO S .E ., BUDINGER T .F ., CAHOON J .L ., GREENBERG W .L ., HUESMAN R .H . ,
VULEVICH T . The donner 280-crystals high resolution positron tomograph .
IEEE Trans . Nucl . Sci ., NS-26, 2790 (1979) .
-
1 .22 -
DERENZO
S .E .,
ZAKLAD
H .,
BUDINGER T .F .
Analytical
study of a
high-resolution
positron
ring
detector
system
for
transaxia l
reconstruction tomography . J . Nucl . Med ., 16, 1166-1173 (1975) .
DEVOUS M .D ., RUSH A .J ., SCHLESSER M .A ., DEBUS J ., RAESE J .D ., CHEHAB I
H .H ., BONTE F .J . Single photon tomographic determination of regiona l
cerebral blood flow in psychiatric disorders, J . Nucl . Medicine, vol .
25, n°5, 1984, P57 .
ERIKSSON L ., BOHM C ., BERGSTROM M ., ERICKSON K ., GREITA J ., LITTON J . ,
WIDEN L . One year experience with a high resolution ring detector positro n
camera system : present status and future plans . in Proc . of IEEE Nuclea r
Sciences Symposium, Oct . 17-19, San Francisco, CA, 1979 .
GENNA S ., PANG S .C ., BURROWS B .A . Analysis of an arcuate gamma camera
design for transaxial reconstruction . In : proc . of Int . Symp . in Medica l
Radionuclide Imaging, vol . 1, IAEA, Vienna,323-339 (1976) .
GOODWIN P .N . Recent developments in instrumentation for emission compute d
tomography . Seminars in Nuclear Medicine, vol . 10, n°4, 322-334 (1980) .
GREER K .L ., JASZCZAK R .J ., COLEMAN R .E . An overview of a camera-based
SPECT system . Med . Phys . 9, 455-463 (1982) .
HILL T .C ., HOLMAN B .L ., LOVETT R ., O ' LEAVY D .H . et al . Initial experience
with SPECT of the brain using n-isopropyl-I-123-p-iodo-amphetamine .
J . Nucl . Medicine, 23, 191-195 (1982) .
HOFFMAN E .J ., PHELPS M .E ., RICCI A .R ., HUANG S .C ., KUHL D .E . Optimizatio n
of system design parameters for emission computed tomography . IEEE/EMBS ,
79 CH 1440-7, 363 (1979) .
JARRITT P ., ELL P .J ., MYERS M .J . A new transverse section brain image r
for single gamma emitters . J . Nucl . Med ., 20, 319-327 (1979) .
JASZCZAK R .J . Physical characteristics of SPECT systems . J . Comput .
Assist . Tomogr . vol . 6, n°6, 1205-1215 (1982) .
JASZCZAK R .J . SPECT : Single photon emission computed tomography, IEEE
Transactions on Nuclear Sciences, N527, 3 (1980) .
JASCZAK R .J ., CHANG L .T ., STEIN N .A ., MOORE F .A . Whole-body single photon
emission computed tomography using dual, large-field-of-view scintillatio n
cameras . Phys . Med . Biol ., 24, 1123-1143 (1979) .
JASZCZAK R .J ., GREER K., COLEMAN R .E . SPECT system misalignment :
comparison of a phantom and patient images, in Emission Compute d
Tomography ; Soc . of Nucl . Med ., NY, 57-70 (1983) .
JEAVONS A ., HOOD K., HERLIN G ., PARKMAN C . The high density avalanche
chamber for positron emission tomography . IEEE Trans . on Nucl . Science .
Vol . NS-30, 1, 640-645 (1983) .
KANNO I ., YEMURA K ., MIURA S ., MIURA Y . Headtome : A hybrid emission
tomograph for single photon and positron emission imaging of the brain .
J . Comput . Assist . Tomogr . 5, 216-226 (1981) .
KEYES J . Perspective on Tomography . J . Nucl . Med . 23, 633-640, (1982) .
KEYES J .W ., ORLANDEA N ., HEETDERKS W .J ., LEONARD P .F ., ROGERS W .L . The
Humongstron - A scintillation camera tansaxial tomograph . J . Nucl . Med . ,
18, 381-387 (1977) .
KIRSCH C .M ., MOORE S .C ., ZIMMERMAN R .E ., ENGLISH R .J ., HOLMAN B .L .
Characteristics of a scanning, multidetector, single photon ECT body
imager . J . Nucl . Med ., 22, 726-731 (1981) .
KORAL K .F ., ROGERS W .L ., KNOLL G .F . Digital tomographic imaging wit h
time-modulated pseudo-random coded aperture and an Auger camera . J .
Nucl . Med ., 16, 402-413 (1975) .
KUHL D .E . and EDWARDS R .Q . Cylindrical and section radioisotope scannin g
of the liver and brain . Radiology, 83, 926-936 (1964) .
- 124 -
KUHL D .E . and EDWARDS R .Q . : The MARK III scanner : a compact device
for multiple view and section scanning of the brain . Radiology, 96 ,
563-570 (1970) .
KUHL D .E ., EDWARDS R .Q ., RICCI A .R . Transverse section scanner at the
University of Pennsylvania . In : Tomographic imaging in nuclear medicine ,
G .S . Freedman, ed ., NY, Soc . of Nuclear Medicine, 19-27 (1974) .
KUHL D .E ., EDWARDS R .Q ., RICCI A .R ., YACOB R .J ., MICH T .J ., ALAVI A .
The MARK IV system for radionuclide computed tomography of the brain .
Radiology, 121, 405-413 (1976) .
LASSEN N .A ., HENRIKSEN L ., PAULSON O . Regional cerebral blood flow i n
stroke by 133-Xenon inhalation and emission tomography . Stroke . 12 ,
284-288 (1981) .
LIM C ., GOTTSHALK S ., SCHREINER R ., WALKER R ., VALENTINO F . et al .
Triangular SPECT system for brain and body organ 3D imaging : Design
concept and preliminary imaging result . J . Nucl . Medicine, vol . 25 ,
n° 5, P6 (1984) .s
LOGAN K .W ., HOLMES R .A . Missouri University multiplane imager (MUMPI) :
a high sensitivity rapid dynamic ECT brain imager . J . Nucl . Medicine ,
vol . 25, n° 5, P105 (1984) .
MATHIEU L ., BUDINGER T .F . Pinhole digital tomography . In : Proc . of
the 1st World Congress of Nuclear Medicine, 1264-1266 (1974) .
MAZIERE B ., LOCH C ., HANTRAYE P ., GUILLON R ., DUQUESNOY N ., SOUSSALIN E
F ., NAQUET R ., COMAR D ., MAZIERE M . 75 Br-Bromospiperidol : A new too l
for quantitative in-vivo imaging of neuroleptic receptors . Life Sciences .
35, 1349-1356 (1984) .
MOORE S .C ., BRUNELLE J .A ., KIRSCH C .M . Quantitative multidetector emission
computerized tomography using iterative attenuation compensation . J .
Nucl . Med . 23, 706-714 (1982) .
MUELLEHNER G . Rotating collimator tomography . J . Nucl . Medicine . 11 ,
347 (1970) .
- 125 -
MUELLEHNER G ., BUCHIN M .P ., DUDEK J .M. Performance parameters of a
positron imaging camera, IEEE, Trans . Nucl . Sci ., 1, 528-537 (1976) .
MULLANI N .A ., HIGGINS C .S ., HOOD J .T ., CURRIE C .M . PETT IV : design
analysis and performance characteristics IEEE Trans . Nucl . Sci . 1, 180-
183 (1978) .
MYERS M .J ., KEYES W .I ., MAILLARD J .R . An analysis of tomographic scannin g
systems . In : Medical Radioisotope Scintigraphy . Vol . 1, Vienna, IAEA ,
SM-164/48, 331-345 (197 3) .
OPPENHEIM B .E ., HOFFER P .B ., GOTTSCHALK A . Nuclear imaging : A new
dimension . Radiology, 118, 491-494 (1976) .
PASCAL O ., SYROTA A ., SOUSSALINE F ., GRANDORDY B ., HUCHON G .J . Pulmonary
uptake of 11C amines evaluated ' by positron emission tomography in norma l
subjects and in patients with sarcoidosis or emphysema . American review
of respiratory diseases, 1984 sous presse .
PATTON J .A . Tomography, in : Imaging for Medicine, vol . 1, Nuclea r
Medicine, Ultrasonics and Thermography, eds . by S . Nudelman and D .D .
Dalton, Plenum Press, NY and London, 165-181 .
PEREZ-MENDEZ V ., LIM C .B ., ORTENDAHL D ., SEMPER R ., CHENG A ., CHU D . ,
MATTNER R ., KAUFMAN L ., PRINCE D .C . Two detector MWPC positron camer a
with honeycomb lead converters for medical imaging : performance an d
developments . Nucl . Inst . Meth . 156, 33-40 (1978) .
PHELPS M .E . Emission computed tomography . Seminars in Nuclear Medicine ,
Vol . 7, n°4, 337365 (1977) .
PHELPS M .E ., HOFFMAN E .J ., HUANG S .C ., KUHL D .E . ECAT : A new computerized
tomographic imaging system for positron emitting radiopharmaceuticals .
J . Nucl . Med . 6, 635-647 (1978) .
RAYNAUD C . Applying single photon emission computed tomography . In :
Radionuclide imaging, D . Kuhl, ed ., Pergamon Press, Paris, 185-200 (1982) .
RAYNAUD C ., RANCUREL G ., KIEFFER E ., SOUSSALINE F ., RICARD S ., ASKIENAZ Y
S ., MORETTI J .L ., BOURDOISEAU M ., RAPIN J . The usefulness of brain SPEC T
with 123-I-IAMP and HIPDM, in International Symposium on Cerebral Bloo d
Flow and Metabolism, Heidelbourg, Sept . 1983 .
RAYNAUD C ., RANCUREL G ., SAMSON Y ., KIEFFER E ., BARON J .C . et coll .
Measurement of oxygen metabolism, 123 1-IMP distribution and rCBF-Xe
in patients with ischemic vascular disease . J . Nucl . Medicine, 25, 5 ,
9 (1984) .
RAYNAUD C ., SOUSSALINE F ., TODD-POKROPEK A .E ., ZUROWSKI S ., KELLERSHOHN
C . Preliminary results with gamma tomography using a rotating gamm a
camera . In Emission Computed Tomography : The Single Photon Approach ,
HHS Publication FDA 81-8177 (P . Paras, E .A . Eikman, eds), 156-165 (1981) .
SAMSON Y ., HANTRAYE P ., BARON J .C ., SOUSSALINE F ., COMAR D ., MAZIERE
M . Kinetics and displacement of 11C-RO 15-1788, a benzodiazepin e
antagonist, studied inhuman brain in vivo by positron tomography . Eur .
J . of Pharmacology, sous presse .
SOUSSALINE F ., CAMPAGNOLO R ., VERREY B ., BENDRIEM B ., BOUVIER A ., LECOMTE
J .L ., COMAR D . Physical characterization of a time-of-flight positro n
emission tomography system for whole-body quantitative studies . J . Nucl .
Medicine, 25, 5, 46 (1984) .
SOUSSALINE
F .,
COLLARD P .,
WAINBERG P .,
PLUMMER D .
Analyse e t
représentation d ' images fonctionnelles en tomographie d ' émission d e
. positons
in
Proc .
Premier Colloque
Image,
Traitement,
Synthèse ,
Technologie et Applications, Biarritz, 1984 .
SOUSSALINE F . and COMAR D . Positron emission tomography : application s
to the study of metabolic and pathophysiologic mechanisms . Nuclea r
Sciences Applications vol . 1, 601-616 (1983) .
SOUSSALINE F ., TODD-POKROPEK A .E ., HUFFER E ., RAYNAUD C . Physica l
characteristics of a SPT system using a rotating conventional gamm a
camera in Emission Computed Tomography : The single photon approac h
(P . Paras, E . Eikman, eds .), HHS Publication, n° FDA 81-8177, Bur . Rad . ,
Health, 1980 .
SOUSSALINE F ., VERREY B ., COMAR D ., CAMPAGNOLO R ., BOUVIER A ., LECOMTE
Caractéristiques et résultats préliminaires d'un système de tomographi e
à émission de positons avec temps de vol pour études quantitatives .
In : Sympo . Int . sur les isotopes radioactifs en clinique et recherche ,
Bad Gadstein, Autriche, 1984 .
STODDART M .F ., STODDART H .A . A new development in single gamma transaxia l
tomography union carbide focused collimator scanner . IEEE Trans . Nucl .
Sci ., NS 27, 2710-2712 (1979) .
STOKELY E .M ., SVEINSDOTTIR E ., LASSEN N ., ROMMER P . A single photon
dynamic computer assister tomograph (DCAT) for imaging brain functio n
in multiple cross sections . J . of Comp . Assist . Tomogr ., 4, 2, 230-240
(1980) .
SYROTA A ., CASTAING M . ; ROUGEMONT D ., BERRIDGE M ., BARON J .C ., BOUSSER
M .G ., POCIDALO J .J . Tissue acid base balance and oxygen metabolism i n
human cerebral infarction studied with PET . Ann . Neurol . 14, 419-428
(1983) .
SYROTA A ., COMAR D ., CERF M ., PLUMBER D ., MAZIERE M ., KELLERSHOHN C .
11C-Methionine pancreatic scanning with positron emission compute d
tomography . J . of Nucl . Med . 20, 7, 778 (1979) .
SYROTA A ., PAILLOTIN G ., DAVY J .M ., AUMONT M .C . Kinetics of in vivo
binding of antagonist to muscarinic cholinergic receptor in the human
heart studied by positron emission tomography . Life Sciences, 35, 937 -
945 (1984) .
SYROTA A ., VERRET J .M ., COLLARD P ., SOUSSALINE F ., MAZIERE B ., STULZAFT
O ., CROUZEL M . Mesure en tomographie par émission de positons d e
l ' absorption du liquide céphalo-rachidien grâce au principe d ' occupation .
J . Neuroradiology, 9, 261-270 (1982) .
TAUXE W .N ., SOUSSALINE F .,TODD-POKROPEK A ., CAO A ., COLLARD P ., RICHARD
S ., RAYNAUD C ., ITTI R . Determination of organ volume by single photon
emission tomography . J . Nucl . Med ., 23, 984-987 (1982) .
TAUXE W .N ., TODD-POKROPEK A ., SOUSSALINE F ., RAYNAUD C ., KELLERSHOH N
C . Estimates of kidney volume by single photon emission tomography :
a preliminary report . Eur . J . Nucl . Med . 8, 72-74 (1983) .
TER-POGOSSIAN M .M., MULLANI N .A ., HOOD J .T ., HIGGINSS C ., FICKE D .C .
Design considerations for a positron emission transverse tomograph (PETT
V) for imaging the brain . J . Comp . Ass . Tomo ., 2, 539-544 (1978) .
TODD-POKROPEK A .E . Image processing with special reference to ECT, i n
Applications of Physics its Medicine and Biology, Alberi G ., Bajze r
Z ., Baxa P . eds, World Scientific Press, Singapour, 391-428 (1983) .
TODD-POKROPEK A .E . The formation and display of section scans . In :
Proc . of Symp . of American Society of Radiology, Amsterdam, Excerpt a
Medica, 545 (1972) .
VOGEL R .A ., KIRCH D ., LEFREE M ., STEELE P . A new method of multiplana r
emission tomography using a seven pinhole collimator and an Auge r
scintillation camera . J . Nucl . Med ., 19, 648-654 (1979) .
ZIMMERMAN R .E ., KIRSCH C .M ., LOVETT R ., HILL T .C . Single photon emission
computed tomography with short focal length detectors . In : Single photon
emission computed tomography and other selected topics, Sorenson J .A . ,
ed .,
NY,
Soc .
of
Nuclear
Medicine,
147-157
(1980) .
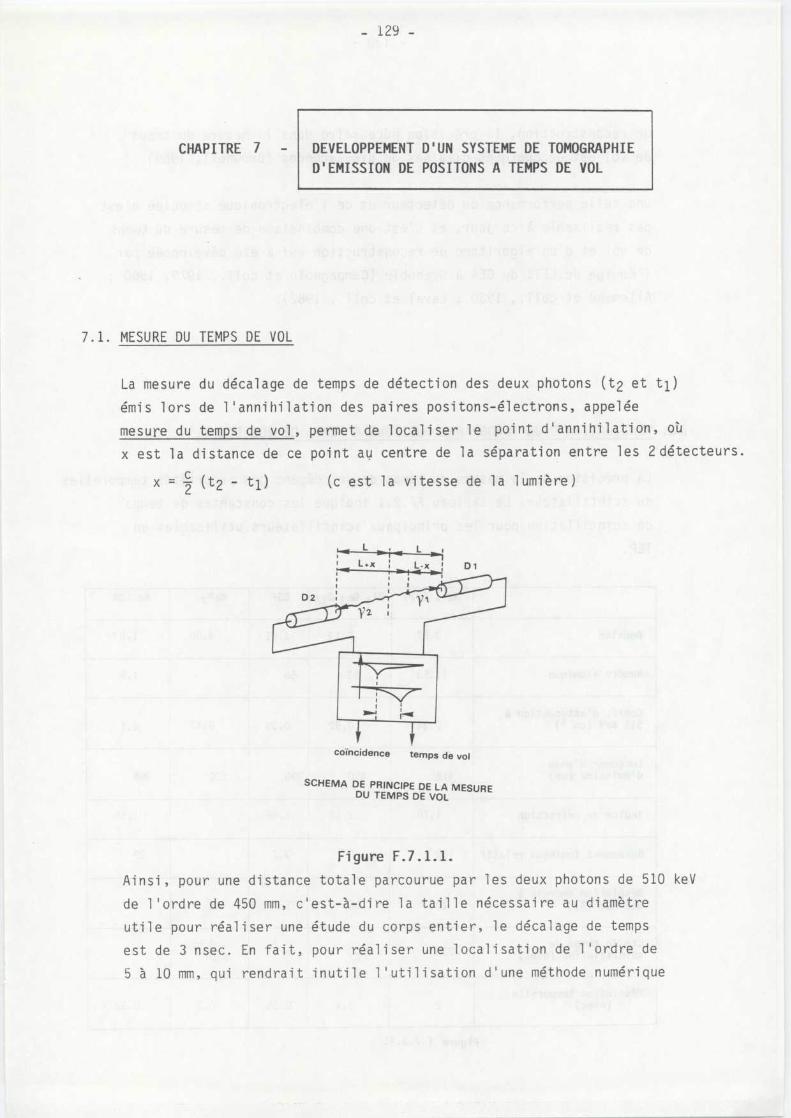
CHAPITRE 7 -
DEVELOPPEMENT D ' UN SYSTEME DE TOMOGRAPHI E
D ' EMISSION DE POSITONS A TEMPS DE VO L
7 .1 . MESUREDU TEMPS DEVO L
La mesure du décalage de temps de détection des deux photons (t2 et tl )
émis lors de l'annihilation des paires positons-électrons, appelé e
mesuredu temps devol, permet de localiser le point d'annihilation, où
x est la distance de ce point au centre de la séparation entre les 2 détecteurs .
x = 2 (t2 - 4)
(c est la vitesse de la lumière )
L
L
1L+x
L-x
D 1
1
D2
1
i
coïncidence
temps de vo l
SCHEMA DE PRINCIPE DE LA MESUR EDU TEMPS DE VOL
Figure F .7 .1 .1 .
Ainsi, pour une distance totale parcourue par les deux photons de 510 ke V
de l'ordre de 450 mm, c ' est-à-dire la taille nécessaire au diamètr e
utile pour réaliser une étude du corps entier, le décalage de temp s
est de 3 nsec . En fait, pour réaliser une localisation de l'ordre d e
5 à 10 mm, qui rendrait inutile l'utilisation d'une méthode numérique
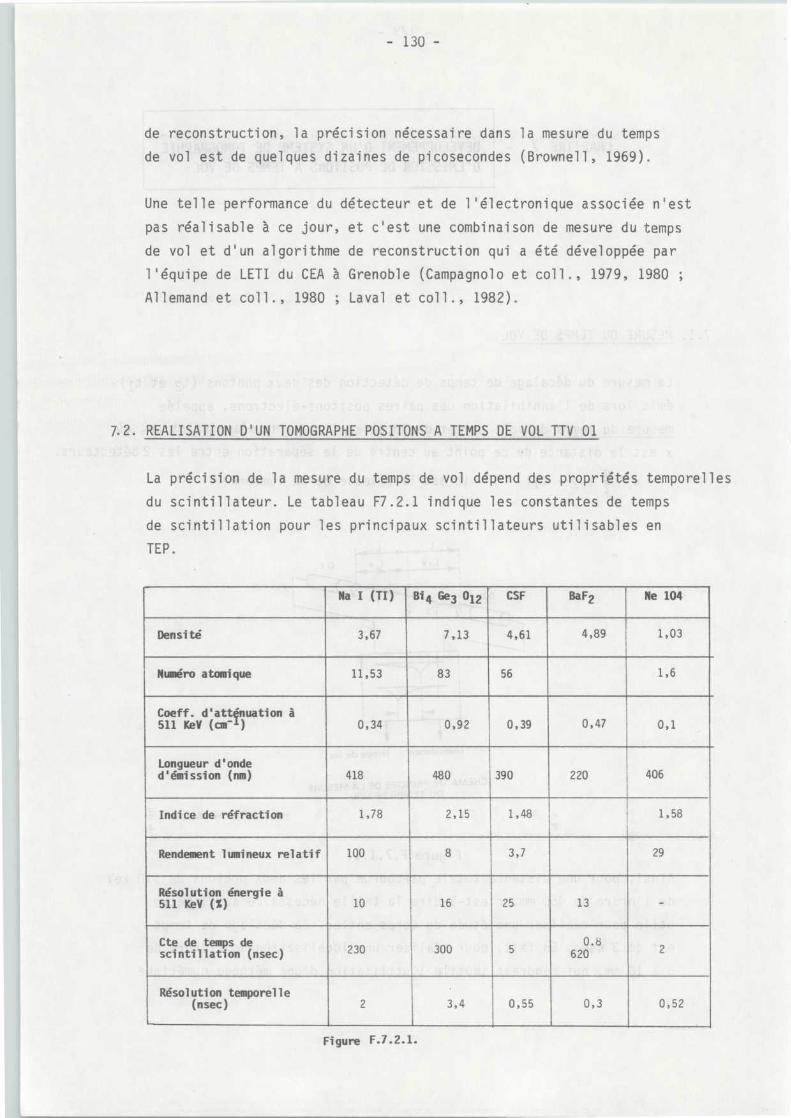
de reconstruction, la précision nécessaire dans la mesure du temp s
de vol est de quelques dizaines de picosecondes (Brownell, 1969) .
Une telle performance du détecteur et de l'électronique associée n'es t
pas réalisable à ce jour, et c'est une combinaison de mesure du temp s
de vol et d'un algorithme de reconstruction qui a été développée pa r
l'équipe de LETI du CEA à Grenoble (Campagnolo et coll ., 1979, 1980 ;
Allemand et coll ., 1980 ; Laval et coll ., 1982) .
7 .2 . REALISATIOND'UNTOMOGRAPHEPOSITONSA TEMPS DEVOLTTV 01
La précision de la mesure du temps de vol dépend des propriétés temporelle s
du scintillateur . Le tableau F7 .2 .1 indique les constantes de temps
de scintillation pour les principaux scintillateurs utilisables en
TEP .
Na I (TI) Bio Ge3 012 ' CSF BaF2 Ne 104
Densité 3,67 7,13 4,61 4,89 1,0 3
Numéro atomique 11,53 83 56 1, 6
Coeff . d'atténuation à
511 KeY (cie l ) 0,34 0,92 0,39 0,47 0, 1
Longueur d'onded'émission (nm) 418 480 390 220 40 6
Indice de réfraction 1,78 2,15 1,48 1,58
Rendement lumineux relatif 100 8 3,7 2 9
Résolution énergie à511 KeV (%) 10 16 25 13 -
Cte de temps de0 . 6scintillation (nsec) 230 300 5 620 2
Résolution temporell e(nsec) 2 3,4 0,55 0,3 0,52
Figure F-7.2 .1 -
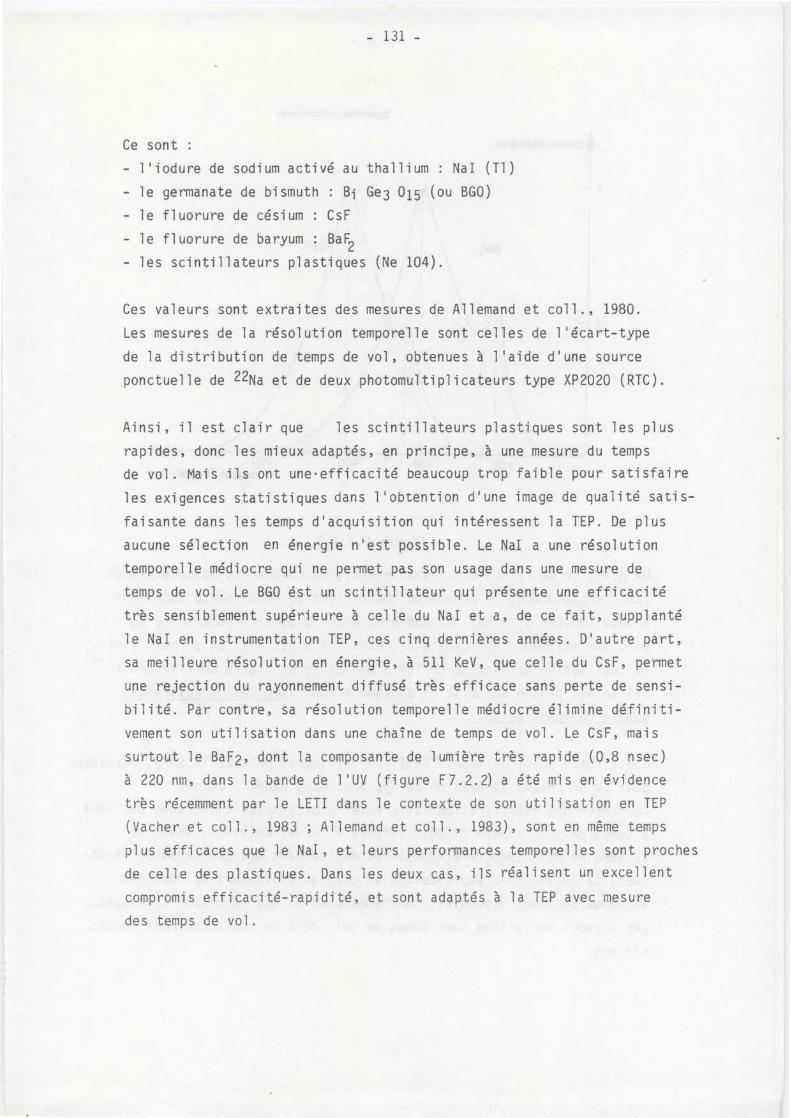
Ce sont :
- l ' iodure de sodium activé au thallium : Nal (Tl )
- le germanate de bismuth : Bi Ge3 015 (ou BGO )
- le fluorure de césium : Cs F
- le fluorure de baryum : BaF2
- les scintillateurs plastiques (Ne 104) .
Ces valeurs sont extraites des mesures de Allemand et coll ., 1980 .
Les mesures de la résolution temporelle sont celles de l'écart-type
de la distribution de temps de vol, obtenues à l'aide d'une sourc e
ponctuelle de 22Na et de deux photomultiplicateurs type XP2020 (RTC) .
Ainsi, il est clair que
les scintillateurs plastiques sont les plu s
rapides, donc les mieux adaptés, en principe, à une mesure du temp s
de vol . Mais ils ont une . efficacité beaucoup trop faible pour satisfaire
les exigences statistiques dans l'obtention d'une image de qualité satis-
faisante dans les temps d'acquisition qui intéressent la TEP . De plu s
aucune sélection en énergie n'est possible . Le Nal a une résolutio n
temporelle médiocre qui ne permet pas son usage dans une mesure de
temps de vol . Le BGO ést un scintillateur qui présente une efficacit é
très sensiblement supérieure à celle du Nal et a, de ce fait, supplant é
le NaI en instrumentation TEP, ces cinq dernières années . D ' autre part ,
sa meilleure résolution en énergie, à 511 KeV, que celle du CsF, perme t
une rejection du rayonnement diffusé très efficace sans perte de sensi-
bilité . Par contre, sa résolution temporelle médiocre élimine définiti-
vement son utilisation dans une chaîne de temps de vol . Le CsF, mai s
surtout le BaF2, dont la composante de lumière très rapide (0,8 nsec )
à 220 nm, dans la bande de l ' UV (figure F7 .2 .2) a été mis en évidenc e
très récemment par le LETI dans le contexte de son utilisation en TE P
(Vacher et coll ., 1983 ; Allemand et coll ., 1983), sont en même temp s
plus efficaces que le Nal, et leurs performances temporelles sont proche s
de celle des plastiques . Dans les deux cas, ils réalisent un excellen t
compromis efficacité-rapidité, et sont adaptés à la TEP avec mesur e
des temps de vol .
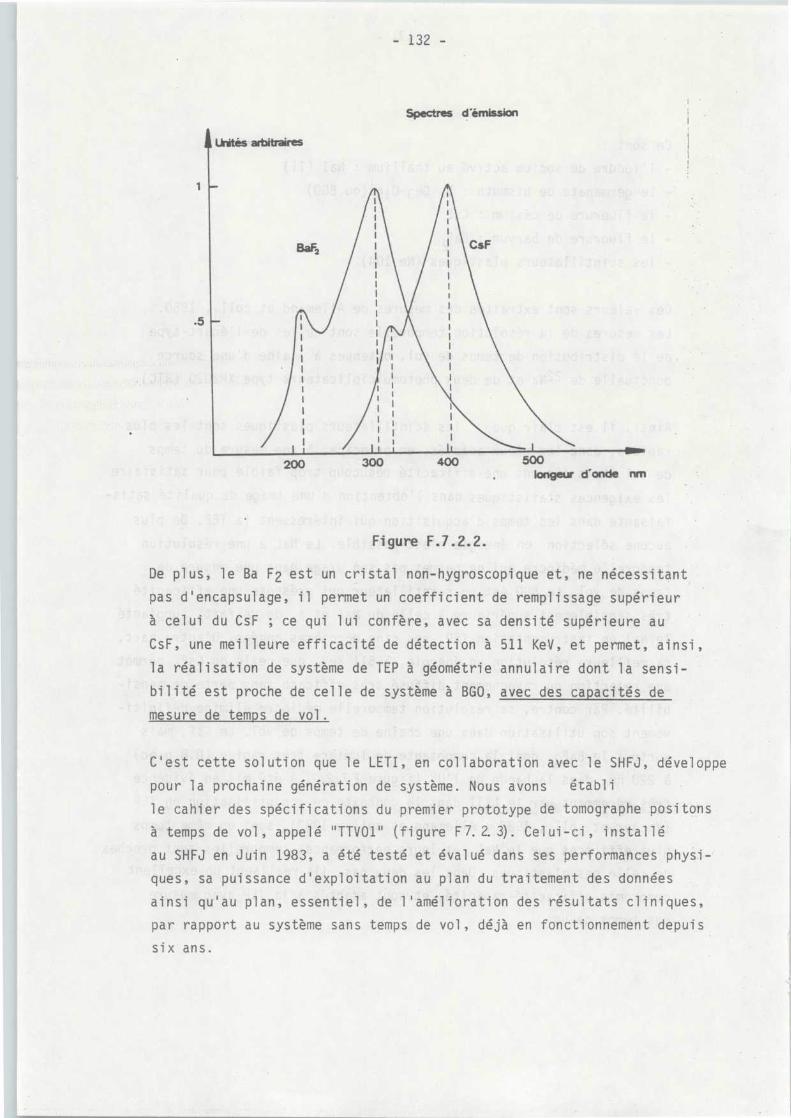
- 132 -
Spectres d 'émission
1 CsF
mu.400
500longeur d'onde nm
Figure F.7 .2 .2 .
De plus, le Ba F2 est un cristal non-hygroscopique et, ne nécessitan t
pas d' encapsul age, il permet un coefficient de remplissage supérieu r
à celui du CsF ; ce qui lui confère, avec sa densité supérieure a u
CsF, une meilleure efficacité de détection à 511 KeV, et permet, ainsi ,
la réalisation de système de TEP à géométrie annulaire dont la sensi-
bilité est proche de celle de système à BGO, avec des capacités de
mesure de temps de vol .
C'est cette solution que le LETI, en collaboration avec le SHFJ, développ e
pour la prochaine génération de système . Nous avons
établ i
le cahier des spécifications du premier prototype de tomographe positon s
à temps de vol, appelé "TTV01" (figure F7 .2.3) . Celui-ci, install é
au SHFJ en Juin 1983, a été testé et évalué dans ses performances physi -
ques, sa puissance d ' exploitation au plan du traitement des donnée s
ainsi q u ' au plan, essentiel, de l ' amélioration des résultats cliniques ,
par rapport au système sans temps de vol, déjà en fonctionnement depui s
six ans .
L Unités arbitraires
1
.5
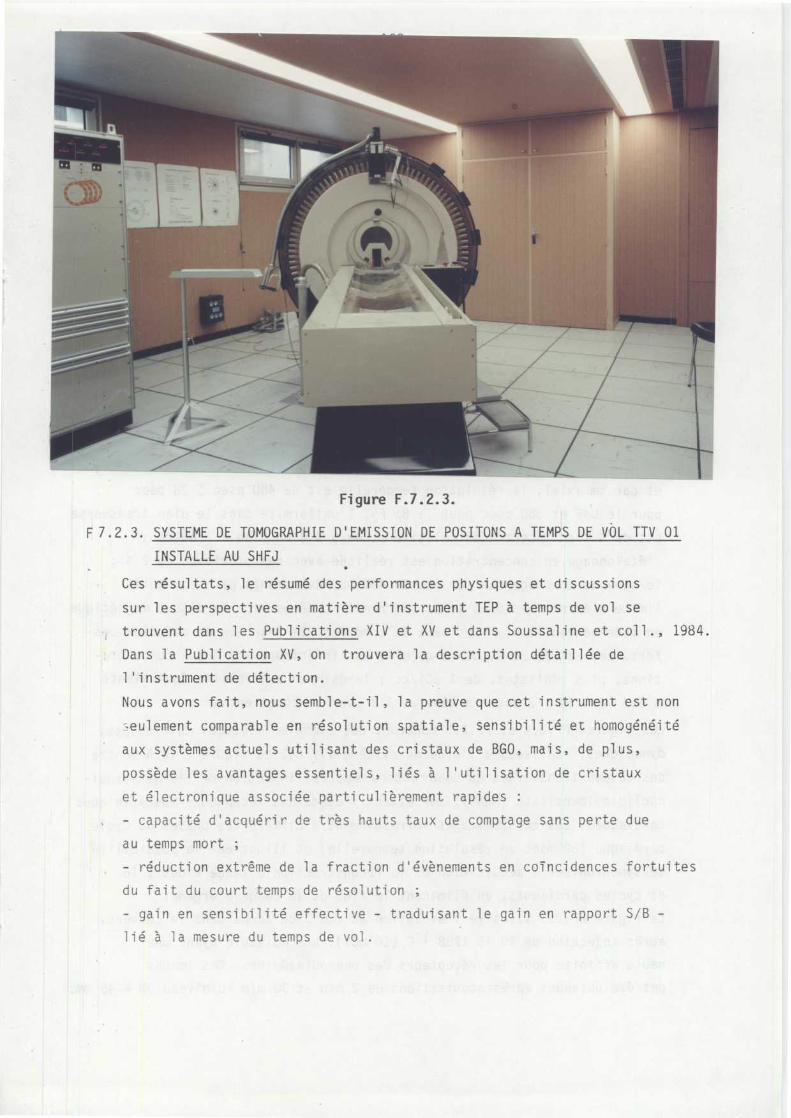
Figure F .7 .2 .3 .
F7 .2 .3 . SYSTEME DE TOMOGRAPHIE D'EMISSION DE POSITONS A TEMPS DE VOL TTV 0 1
INSTALLE AU SHFJ
Ces résultats, le résumé des performances physiques et discussion s
sur les perspectives en matière d ' instrument TEP à temps de vol s e
trouvent dans les Publications XIV et XV et dans Soussaline et coll ., 1984 .
Dans la Publication XV, on trouvera la description détaillée d e
l ' instrument de détection .
Nous avons fait, nous semble-t-il, la preuve que cet instrument est no n
eulement comparable en résolution spatiale, sensibilité et homogénéit é
aux systèmes actuels utilisant des cristaux de BGO, mais, de plus ,
possède les avantages essentiels, liés à l'utilisation de cristau x
et électronique associée particulièrement rapide s
- capacité d ' acquérir de très hauts taux de comptage sans perte due
au temps mort ;
- réduction extrême de la fraction d ' évènements en coïncidences fortuite s
du fait du court temps de résolution ;
- gain en sensibilité effective - traduisant le gain en rapport S/B -
lié à la mesure du temps de vol .
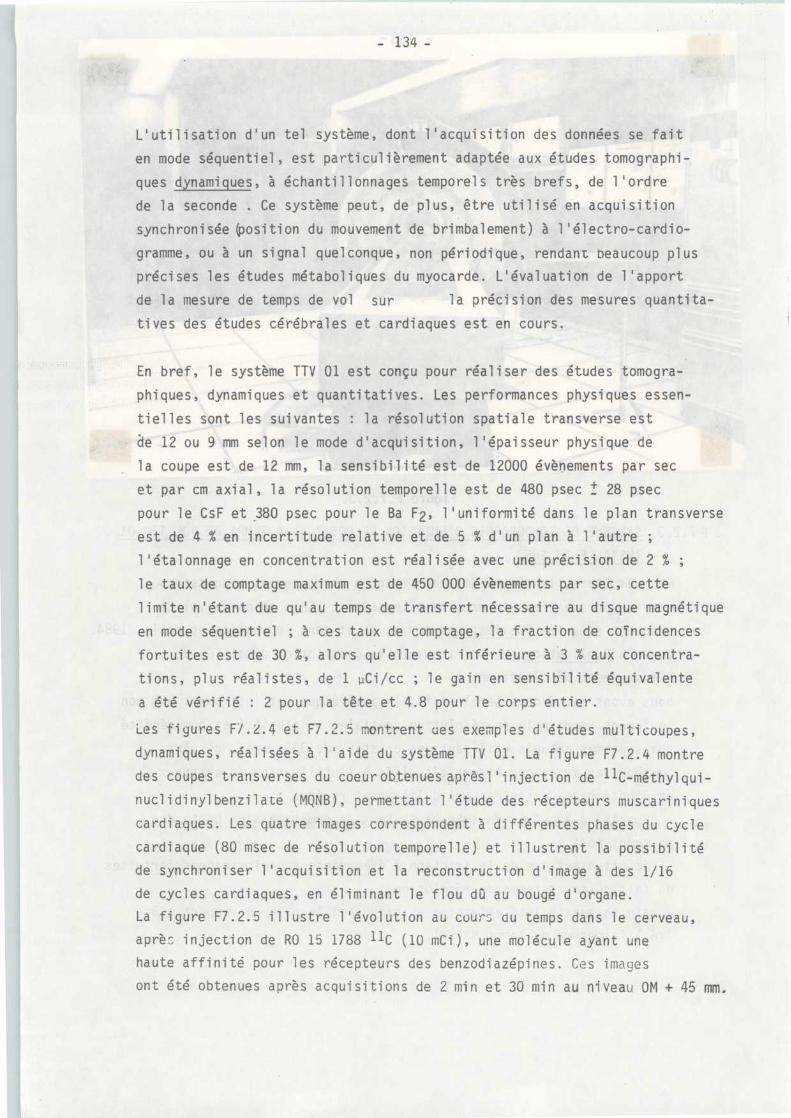
- 134 -
L'utilisation d'un tel système, dont l'acquisition des données se fai t
en mode séquentiel, est particulièrement adaptée aux études tomographi-
ques dynamiques, à échantillonnages temporels très brefs, de l'ordr e
de la seconde . Ce système peut, de plus, être utilisé en acquisition
synchronisée (position du mouvement de brimbalement) à 1'électro-cardio -
gramme, ou à un signal quelconque, non périodique, rendant beaucoup plu s
précises les études métaboliques du myocarde . L'évaluation de l'apport
de la mesure de temps de vol sur
la précision des mesures quantita-
tives des études cérébrales et cardiaques est en cours .
En bref, le système TTV 01 est conçu pour réaliser des études tomogra-
phiques, dynamiques et quantitatives . Les performances physiques essen-
tielles sont les suivantes : la résolution spatiale transverse es t
de 12 ou 9 mm selon le mode d'acquisition, l'épaisseur physique d e
la coupe est de 12 mm, la sensibilité est de 12000 évènements par se c
et par cm axial, la résolution temporelle est de 480 psec ± 28 pse c
pour le CsF et ,380 psec pour le Ba F2, l'uniformité dans le plan transvers e
est de 4 % en incertitude relative et de 5 % d'un plan à l'autre ;
l'étalonnage en concentration est réalisée avec une précision de 2 % ;
le taux de comptage maximum est de 450 000 évènements par sec, cett e
limite n'étant due qu'au temps de transfert nécessaire au disque magnétiqu e
en mode séquentiel ; à ces taux de comptage, la fraction de coincidence s
fortuites est de 30 %, alors qu'elle est inférieure à .3 % aux concentra -
tions, plus réalistes, de 1 uCi/cc ; le gain en sensibilité équivalent e
a été vérifié : 2 pour la tête et 4 .8 pour le corps entier .
Les figures F/ .2 .4 et F7 .2 .5 montrent ues exemples d'études multicoupes ,
dynamiques, réalisées à l'aide du système TTV 01 . La figure F7 .2 .4 montre
des coupes transverses du coeur obtenues a-près l ' injection de 11C-méthylqui -
nuclidinylbenzilaté (MQNB), permettant l ' étude des récepteurs muscarinique s
cardiaques . Les quatre images correspondent à différentes phases du cycl e
cardiaque (80 msec de résolution temporelle) et illustrent la possibilit é
de synchroniser l ' acquisition et la reconstruction d ' image à des 1/1 6
de cycles cardiaques, en éliminant le flou dû au bougé d'organe .
La figure F7 .2 .5 illustre l ' évolution au cours du temps dans le cerveau ,
après injection de RO 15 1788 11C (10 mCi), une molécule ayant un e
haute affinité pour les récepteurs des benzodiazépines . Ces image s
ont été obtenues après acquisitions de 2 min et 30 min au niveau 0M + 45 mm .
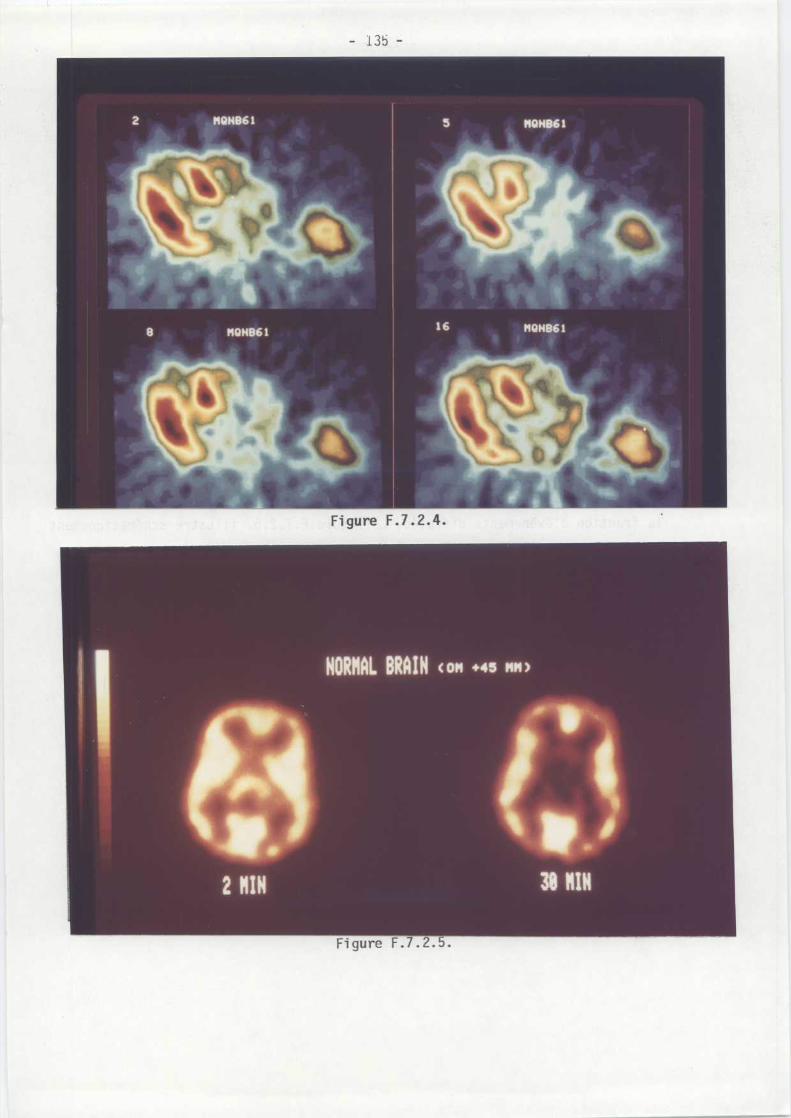
- 135 -
Figure F .7 .2 .4.
Les développements instrumentaux du proche avenir vont dans le sen s
de l'amélioration simultanée de la résolution spatiale et de la sensibilité ,
tout en conservant tous les avantages liés à l'utilisation de détecteur s
extrêmement rapides . Ceci sera obtenu par la réalisation d'anneau x
de détecteurs de très petites dimensions (Ba F2 de l'ordre de 10 mm
de côté) couplés à des photo-multiplicateurs très rapides (Hamamats u
du type 1 pouce 1/8) . Une attention particulière est apportée a u
confort du patient, donc à la conception du dispositif de positionnemen t
(table ou fauteuil), ainsi qu'à la possibilité de basculement d e
tout l'ensemble mécanique de ± 30° pour l'obtention de plan oblique
par rapport à l ' axe longitudinal .
Une autre potentialité très intéressante d'un système de TEP à acquisi -
tion séquentielle et mesure du temps de vol est sa capacité à réduir e
la fraction d'évènements diffusés . La figure F .7 .2 .6 . illustre schématiquemen t
la rejection partielle due à la méthode de reconstruction qui ne
replace les évènements suivant les traces que sur une "longueur "
de 7 cm autour du point source réel .
Une méthode de correction des évènements diffusés est en cours d'évalua-
tion au SHFJ . Elle est basée sur l'estimation de la réponse impulsionnell e
du système pour des sources linéiques placées dans des milieux diffusants
de taille croissante (20, 30 cm . . .) .
Les queues
des réponses impulsionnelles sont considérés comme
dues à la seule diffusion et introduits dans le filtre de reconstruction .
La figure 7 .2 .7 illustre l'importance de la fraction d'évènements diffusé s
en terme de contraste du
à travers l'objet
l'obje t(minimummaximum
profil
) pou r
suivant : un cylindre de 30 cm de diamètre rempli conformément d ' un e
solution de 68GA au centre duquel on a placé un cylindre de 6 cm, rempl i
d ' eau
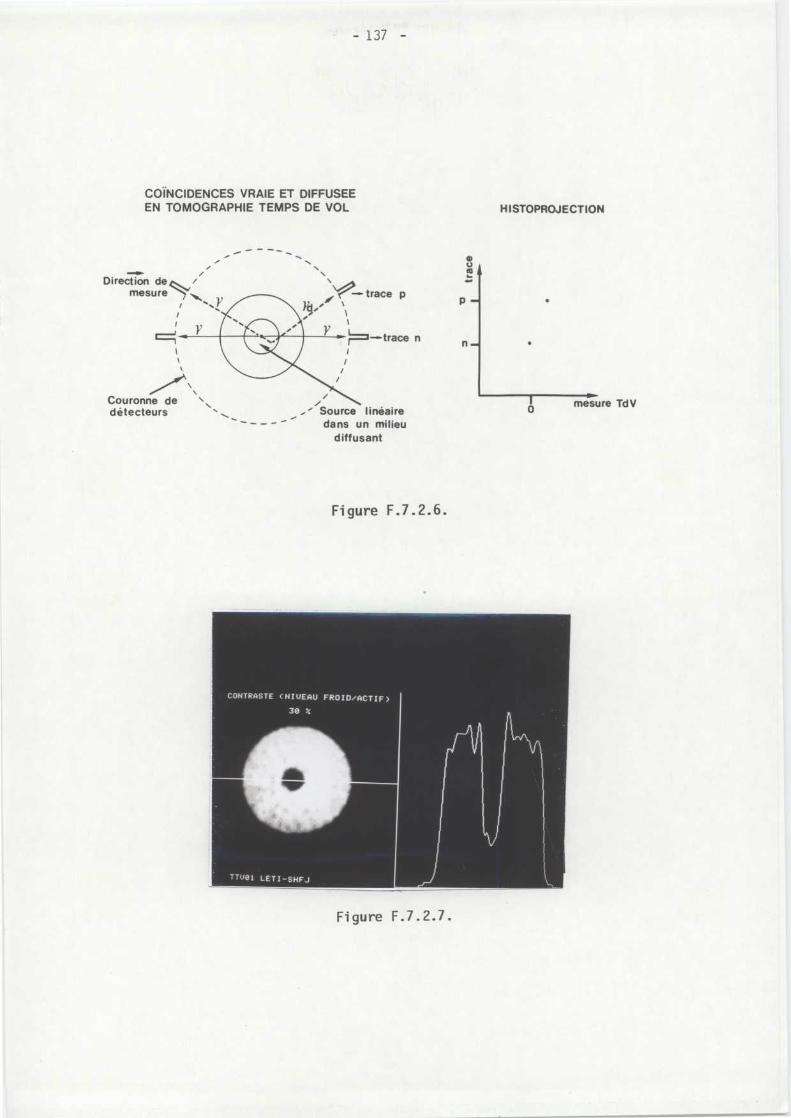
COÏNCIDENCES VRAIE ET DIFFUSE EEN TOMOGRAPHIE TEMPS DE VOL HISTOPROJECTION
Figure F .7 .2 .6 .
Direction d emesure)
P —~
Couronne de
\détecteurs
1
n
Source linéaire
0
mesure TdV
dans un milie udiffusant
CONTRASTE (NIVEAU FROID/ACTIF )
38 X
TTU01 LETI-SHFJ
Figure F .7 .2 .7 .
CHAPITRE 7 - REFERENCES
ALLEMAND R ., GRESSET C ., VACHER J . Potential advantages of a cesiu m
fluoride scintillator for a time-of-flight positron camera . J . Nucl .Med . 21, 153-155 (1980) .
ALLEMAND R ., CORMORECHE E ., GARIOD R ., LAVAL M ., MOSZYNSKI M ., ODRU R . ,
TOURNIER E ., VACHER J ., COMAR D ., BARDY A ., BOURDOISEAU J . Nouvelles perspective s
pectives technologiques pour la tomographie à positons par temps de vol .
In : Fondements des Nouveautés Techniques en Médecine . 2ème Symposiu m
Int ., Liège, Belgique, 1983 .
BROWNELL G .L ., BURNHAM C .A ., WILENSKY S ., ARONOW S ., KAZEMI H ., STRIEDE R
D . New developments in positron scintigraphy and the application o f
cyclotron produced positron emitters . In : Medical Radioisotope
Scintigraphy, vol . 1, IAEA, Vienna, 163-176 (1969) .
CAMPAGNOLO R . Utilisation de la technique de temps de vol pou r
l'amélioration de l'imagerie en tomographie par positons . Thèse docteur-
.ingénieur, Grenoble, INPG, 1980 .
CAMPAGNOLO R ., GARDERET P ., VACHER J . Tomographie par émetteurs de
positrons avec mesure de temps de vol . In : Proc . Colloque Internationa l
sur le traitement du signal, Nice, France, 1979 .
CAMPAGNOLO R ., LAVAL M ., MOSZYNSKI M ., SOUSSALINE F . Contribution o f
the time-of-fligh- information to the positron tomographic imaging -
Prix Von Hevezy 1982, Third World Congress of Nuclear Medicine an d
Biology, C . Raynaud ed ., Pergamon Press, Paris, 1982 .
LAVAL M ., ALLEMAND R ., BOUVIER A ., CAMPAGNOLO R . et al . Design an d
performance of a new positron computed tomograph (PCT) using the time-
of-flight (T .O .F .) information ; in Proc . Third World Congress of Nuclea r
Medicine and Biology, C . Raynaud ed ., Pergamon Press, Paris, 1982 .
LAVAL M ., MOSZYNSKI M ., ALLEMAND R ., CORMORECHE E ., GUINET P ., ODRU
R ., VACHER J . Baryum fluoride inorganic scintillator for subnanosecon d
timing, Nucl . Inst . and Meth ., 206, 169-176 (1983) .
SOUSSALINE F ., CAMPAGNOLO R ., VERREY B ., BENDRIEM B ., BOUVIER A ., LECOMT E
J .L ., COMAR D . Physical characterization of a time-of-flight positron
emission tomography system for wholebody quantitative studies . J . Nucl .
Med ., 25, 5, P46 (1984) .
VACHER R ., ALLEMAND M ., LAVAL M . et al . New development on detection
and fast timing on the time-of-flight LETI device, IEEE COmputer Society
Press, 143-146 (1982) .
- 140 -
PUBLICATIONS AYANT SERV I
DE BASE A CETTE THESE
I
- SOUSSALINE F .
Use of position sensitive detectors in medicine in positron-sensitiv e
detection thermal neutrons, Convert P ., Forsyth J .B . eds, Academi c
press, London, 1983, 231-243 .
II - SOUSSALINE F ., TODD-POKROPEK A .E ., RAYNAUD C .
The use of energy information in scintigraphy . Techniques fo r
the correction of scattering effects in multichannel images .
In : Medical Radionuclide Imaging, vol . I, IAEA, Vienna, SM-210/153 ,
1977, 357-368 .
III - SOUSSALINE F ., TODD-POKROPEK A .E ., RAYNAUD C .
Quantitative studies with the gamma camera : correction for spatia l
and energy distortion . In : Proc . of Inf . Proc . in Med . Imaging ,
Fifth International Conference, Nashville, ORNL-BCTIC-2, 1977 ,
360-375 .
IV - SOUSSALINE F .
The single photon tomograph . In Radionuclide Imaging, Kuhl D .
ed ., Pergamon Press, France, 1982, 153-184 .
V
- LE COQ G ., SOUSSALINE F .
Le problème de la reconstruction d ' image à partir des projections .
Revue des méthodes de résolution et présentation de la méthod e
itérative régularisante (MIR) . Rapport CENS/SERMA n° 257/S Rapport
DB/SHFJ/001 1975 .
VI - SOUSSALINE F ., LE COQ G .
A regularizing method for quantitative SPECT reconstruction .
IEEE Trans . on Med . Imaging,TMI 2, n°1, 1983, 24-30 .
CHAPITRE 8 -
VII - SOUSSALINE F .P ., CAO A ., LECOQ G .,RAYNAUD C ., KELLERSHOHN C .
An analytical approach to single photon emission computed tomo-
graphy with the attenuation effect . Eur . J . of Nucl . Med . 7 ,
1982, 487-493 .
VIII - SOUSSALINE F ., LECOQ G ., RAYNAUD C ., KELLERSHOHN C .
SPET reconstruction with a non-uniform attenuation coefficien t
using an analytical regularizing iterative method . In : Proc .
of Third World Congress of Nuclear Medicine and Biology, C . Raynau d
ed ., Pergamon Press, Paris, 1982, 1034-1037 .
IX - SOUSSALINE F ., TODD-POKROPEK A .E ., COMAR D ., RAYNAUD C ., KELLERSHOHN C .
Potential and limits of quantitative studies in emission tomography .
In : Medical Radionuclide Imaging, 1, IAEA, Vienna, IAEA-SM-247/139 ,
1981, 231-241 .
X
- TODD-POKROPEK A ., SOUSSALINE F .
Quality control of SPECT systems : removal of artefacts . In Proc .
Third World Congress of Nuclear Medicine & Biology, C . Raynaud ,
ed ., Pergamon Press, Paris, 1982? 1082-1021 .
XI - SOUSSALINE F ., HOULE S ., PLUMMER D ., TODD-POKROPEK A .
Potentials of quantitative methods in positron emission tomography .
In : Information processing in medical imaging . Vth Int . Conf . ,
R . Di Paola, E . Kahn, eds . Les colloques de l ' INSERM, Vol . 38 ,
Paris, 1979, 215-242 .
XII
SOUSSALINE F .P ., TODD-POKROPEK A .E ., ZUROWSKI S ., HUFFER E . ,
RAYNAUD C .E ., KELLERSHOHN C .L .
A rotating conventional gamma camera single-photon tomographi c
system : Physical characterization . J . Comput . Ass . Tomogr ., 5 ( 4 ) ,1981, 551-556 .
XIII - SOUSSALINE F ., TODD-POKROPEK A .E ., PLUMMER D ., COMAR D ., LOC' H
C ., HOULE S ., KELLERSHOHN C .
The physical performances of a singleslice positron tomographi c
system and preliminary results in a clinical environment . Eur .
J . Nucl . Med . . 4, 1979, 237-249 .
XIV - SOUSSALINE F ., COMAR D ., ALLEMAND R ., CAMPAGNOLO R ., LAVAL M . ,
VACHER J .
New developments in PET instrumentation using the time-of-fligh t
information . In : The Metabolism of the human brain using PET ,
L . Widen ed ., Raven Press, N .Y ., 1983, sous presse .
XV - SOUSSALINE F . , VERREY B ., COMAR D ., CAMPAGNOLO R ., BOUVIER A . ,
LECOMTE J .L .
Physical characterization and pre 'iminary results of a PET
system using time-of-flight for quantitative studies . In :
Symp . on Radioactive Isotope in clinic and Research, Bad-Gastein ,
Janvier 1984 .

PUBLICATION
I
PUBLICATION I
USE OF POSITION SENSITIVE-DETECTORS IN MEDICINE
F . Soussaline
Service Hospitalier Frédéric Joliot
CEA, Départment de Biologie
91406 Orsay France
1. INTRODUCTIO N
The field of medical imaging provides an opportunity for advances in physics, en -
gineering and other basic sciences to be applied directly to diagnosis and treatmen t
of human disease . The needs for the detection of ever smaller lesions and th e
evaluation of pathologic mechanisms where variations of the physiologic or metaboli c
parameter are very small, result in increasing complexity in radiographic ,
ultrasonic and nuclear medicine instrumentation .
For sake of reliability and increased efficiency, digital circuitry is widel y
used : .more generally, the introduction of digital computers and the developmen t
of mathematical aiogorithms has led to new imaging techniques and extended old ones ,
such as transmission and emission computed tomography, digital and real-tim e
ultra-sound, gated nuclear medicine cardiology, digital radiology and nuclea r
magnetic resonance . Such methodologies have tremendously expanded the possibilitie s
of medical imaging but, for reasons of limited space, this paper will only presen t
some concepts and current results in computed tomography and in positron- an d
gamma-emitter tomography . This will allow a brief discussion of imaging devices
making use of PSDs for measurements of anatomical and physiological processes .
2. IMPACT OF PSDs IN MEDICINE
The use of a whole variety of PSDs in medicine and their respective impacts i s
essentially dependent on their characteristic performance parameters .
Position-Sensitive Detection & Thermal Neutrons
Copyright Ce 1983 by Academic Press LondonISBN 0 . 12 . 186180. 5
All rights of reproduction in any form reserved
(CONVERT P ., FORSYTH J .B ., eds .)
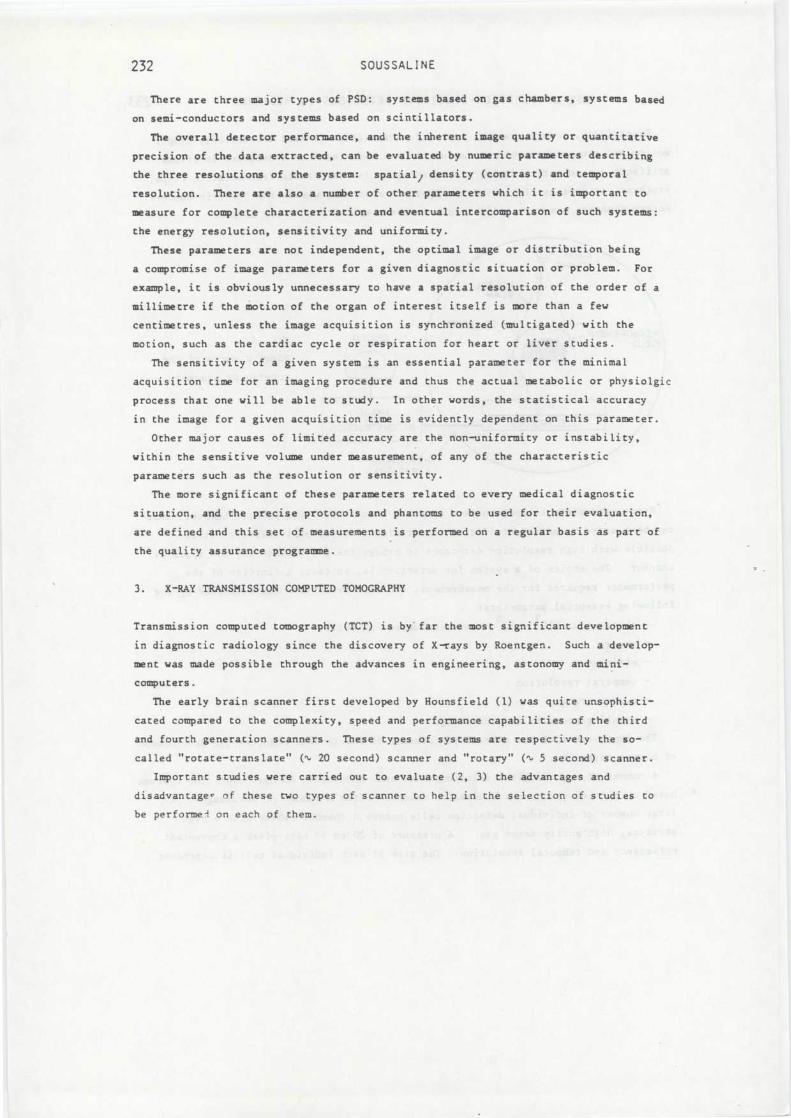
232 SOUSSALIN E
There are three major types of PSD : systems based on gas chambers, systems base d
on semi-conductors and systems based on scintillators .
The overall detector performance, and the inherent image quality or quantitativ e
precision of the data extracted, can be evaluated by numeric parameters describin g
the three resolutions of the system : spatial/ density (contrast) and tempora l
resolution . There are also a number of other parameters which it is important t o
measure for complete characterization and eventual intercomparison of such systems :
the energy resolution, sensitivity and uniformity .
These parameters are not independent, the optimal image or distribution bein g
a compromise of image parameters for a given diagnostic situation or problem . Fo r
example, it is obviously unnecessary to have a spatial resolution of the order of a
millimetre if the motion of the organ of interest itself is more than a few
centimetres, unless the image acquisition is synchronized (multigated) with th e
motion, such as the cardiac cycle or respiration for heart or liver studies .
The sensitivity of a given system is an essential parameter for the minima l
acquisition time for an imaging procedure and thus the actual metabolic or physiolgi c
process that one will be able to study . In other words, the statistical accuracy
in the image for a given acquisition time is evidently dependent on this parameter .
Other major causes of limited accuracy are the non-uniformity or instability ,
within the sensitive volume under measurement, of any of the characteristi c
parameters such as the resolution or sensitivity .
The more significant of these parameters related to every medical diagnosti c
situation, and the precise protocols and phantoms to be used for their evaluation ,
are defined and this set of measurements is performed on a regular basis as part o f
the quality assurance programme .
3 . X-RAY TRANSMISSION COMPUTED TOMOGRAPHY
Transmission computed tomography (TCT) is by'far the most significant developmen t
in diagnostic radiology since the discovery of X-rays by Roentgen . Such a develop -
ment was made possible through the advances in engineering, astonomy and mini -
computers .
The early brain scanner first developed by Hounsfield (1) was quite unsophist i-
cated compared to the complexity, speed and performance capabilities of the thir d
and fourth generation scanners . These types of systems are respectively the so -
called " rotate-translate " (ti 20 second) scanner and " rotary " (ti 5 second) scanner .
Important studies were carried out to evaluate (2, 3) the advantages an d
disadvantage of these two types of scanner to help in the selection of studies t o
be performe-i on each of them .
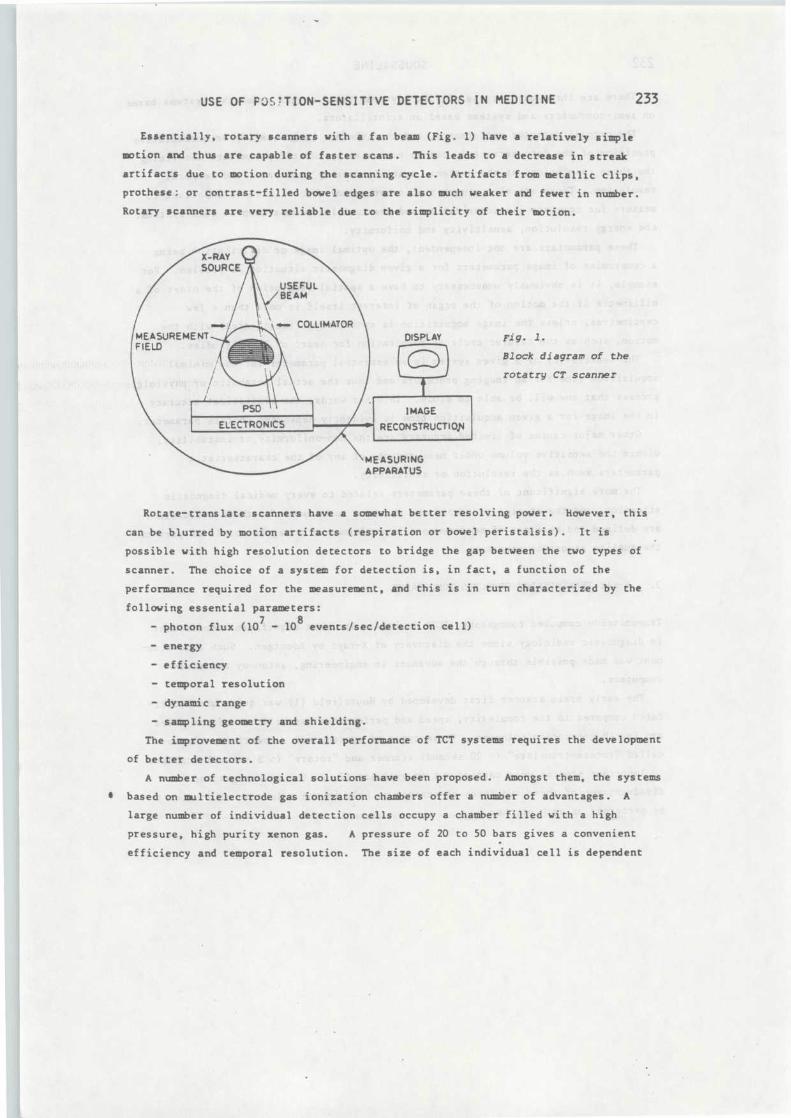
USE OF FOS'TION—SENSITIVE DETECTORS IN MEDICINE
233
Essentially, rotary scanners with a fan beam (Fig . 1) have a relatively simpl e
motion and thus are capable of faster scans . This leads to a decrease in streak
artifacts due to motion during the scanning cycle . Artifacts from metallic clips ,
protheses or contrast-filled bowel edges are also much weaker and fewer in number .
Rotary scanners are very reliable due to the simplicity of their `motion .
ELECTRONICS
DISPLAY
Fig. 1 .
Block diagram of the
. rotatry CT scanner
IMAGE
RECONSTRUCTION
MEASURINGAPPARATU S
Rotate-translate scanners have a somewhat better resolving power . However, thi s
can be blurred by motion artifacts (respiration or bowel peristalsis) . It is
possible with high resolution detectors to bridge the gap between the two types o f
scanner . The choice of a system for detection is, in fact, a function of th e
performance required for the measurement, and this is in turn characterized by th e
following essential parameters :
- photon flux (10 ' - 108 events/sec/detection cell )
- energy
- efficiency
- temporal resolution
- dynamic rang e
- sampling geometry and shielding .
The improvement of the overall performance of TCT systems requires the developmen t
of better detectors .
A number of technological solutions have been proposed . Amongst them, the systems
based on multielectrode gas ionization chambers offer a number of advantages . A
large number of individual detection cells occupy a chamber filled with a high
pressure, high purity xenon gas .
A pressure of 20 to 50 bars gives a convenien t
efficiency and temporal resolution . The size of each individual cell is dependen t
1
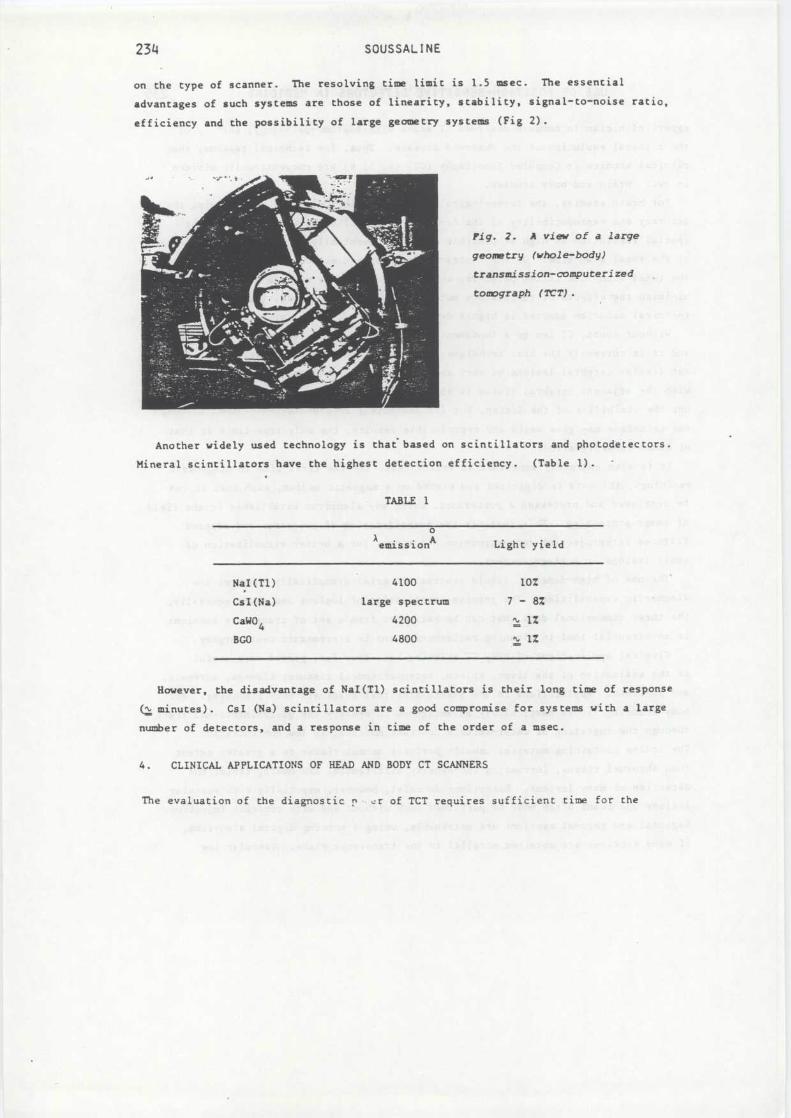
234 SOUSSAL I N E
on the type of scanner . The resolving time limit is 1 .5 msec . The essentia l
advantages of such systems are those of linearity, stability, signal-to-noise ratio ,
efficiency and the possibility of large geometry systems (Fig 2) .
Fig . 2 . A view of a large
geometry (whole-body )
transmission-computerize d
tomograph (TCT) .
Another widely used technology is that based on scintillators and photodetectors .
Mineral scintillators have the highest detection efficiency . (Table 1) . '
TABLE 1
o
À emissionA Light yiel d
NaI(T1) 4100 10Z
CsI(Na) large spectrum 7 - 8%
CaW04 4200 ffi 1 Z
BGO 4800 = lZ
However, the disadvantage of NaI(T1) scintillators is their long time of respons e
Cl minutes) . CsI (Na) scintillators are a good compromise for systems with a larg e
number of detectors, and a response in time of the order of a msec .
4 . CLINICAL APPLICATIONS OF HEAD AND BODY CT SCANNER S
The evaluation of the diagnostic nor of TCT requires sufficient time for th e
USE OF POSITION-SENSITIVE DETECTORS IN MEDICINE
235
expert clinician to compare observed CT scans with anatomo-pathology, sur ; or
the clinical evolution of the observed disease . Thus, for technical reasons, th e
clinical studies in Computed Tomography (CT) (4, 5, 6) are conventionally divide d
in two : brain and body studies .
For brain studies, the technological effort is mainly directed to improving th e
accuracy and reproducibility of the density (contrast) value whilst keeping th e
spatial resolution as high as possible . This is eventually obtained at the expens e
of the total scan time . On the contrary, for body and especially for lung studies ,
the total scan time is the parameter which is shortened as much as possible t o
minimise the effects of respiratory motion and abdominal peristaltism . Thus, the
technical solution adopted is highly dependent on the clinical problem to be solved .
Without doubt, CT led to a fundamentally new approach in radiological diagnosi s
and it is currently the best technique for a number of nosological problems . CT
can display cerebral lesions of very small size as soon as the density differenc e
with the adjacent cerebral tissue is above a certain level . The main difficulty i s
not the visibility of the lesion, but its anatomical interpretation . Thus, althoug h
the technique may give valid and reproducible results, the only true limit is tha t
of human interpretation .
It is also extremely important to notice that, for the first time in diagnosti c
radiology, the data is digitized and stored on a magnetic medium, such that it ca n
be retrieved and processed a posteriori, using any algorithm established in the fiel d
of image processing . This includes the quantification of processes and adapte d
filtered backprcjection reconstruction algorithms for a better vizualization o f
small lesions in a given context .
The use of high-density, liquid contrast material dramatically enhances th e
diagnostic capabilities . The precise localisation of lesions and, more generally ,
the three dimensional data that can be extracted from a set of transverse section s
is an essential tool in planning radiotherapy and in stereotaxic neurosurgery .
Clinical applications of body CT scanning has, thus far, proved very usefu l
in the evaluation of the liver, spleen, retroperitoneal tissues, kidneys, adrenals ,
and pancreas . Applicr tions in the gastrointestinal tract are very promising . For
body scanning, it Is particularly advantageous to opacify the gastrointestinal trac t
through the ingestion of water-soluble contrast material in low concentration .
The iodine containing material usually perfuses normal tissue to a greater exten t
than abnormal tissue, increasing the density differential and making easier th e
detection of many lesions . Exceptions do exist, however, especially with vascula r
lesions and scans often must be performed both without and with contrast injection .
Sagittal and coronal sections are obtainable, using a sorting digital algorithm ,
if many sections are obtained parallel to the transverse plane . Vascular low
236 '
SOUSSALIN E
density liver metastasis can sometimes be rendered visible after injection o f
contrast material . It can also be useful in identifying normal, as well a s
abnormally large vessels throughout the body, particularly in the diagnosis o f
aneurysms, vascular malformation, etc . In the chest, CT scanning is most valuabl e
in showing pleural and sub-pleural abnormalities like metastases or asbesto s
deposits . It also detects substernal nodules and other lesions around the spine .
CT scanning has also been shown to be useful in both the diagnosis and assessmen t
of the extent of lesions involving bone and soft tissues . A great promise of CT o f
bone lies in making it possible to evaluate demineralization of bone and to quantif y
it . Heart scanning with ECG gating, a method by which a short segment of the sca n
is repeated several times at tre same phase as triggered by the ECG, gives
information about cardiac motion . When contrast material is also injected, CT scan s
depict the relative outlines of the cardiac chambers in various phases of cardia c
contraction . The walls of the chambers and tte septum are seen . Scans of 2 .4 s
duration, obtained by only 180 0 arc of the rotary scanner, give information abou t
perfusion of the heart muscle even without gating . With faster cardiac scanners, CT
becomes an important non-invasive diagnostic procedure in evaluating cardia c
perfusion .
5 .
SCINTILLATION CAMERAS FOR GAMMA-RAY IMAGIN G
The practice of nuclear medicine and the ability to visualize the uptake within th e
body of radiolabelled pharmaceuticals underwent a tremendous expansion with th e
invention in 1956 of the scintillation camera by H Anger (7) . This was essential fo r
dynamic studies and reduced considerably the imaging times for static studies .
The Anger camera has been continually refined . Although a large number of othe r
systems were developed using different technologies which eventually compete d
favourably in some aspects with the Anger camera, none offer any superiority as a
general purpose imaging system . Perhaps the essential characteristic of the Ange r
camera is its ubiquitous versatility . It can be used for very fast dynamic studie s
(T
10 msec) as well as for high quality static images (8) . Two cameras can be
used in geometric opposition to form a positron camera (8, 9) . Moving the detector
head over the patient following its longitudinal axis has proved to be very usefu l
for whole body scanning in bone lesions and metastases studies . Alternatively ,
rotating the camera head around the patient long axis can generate, by use of a
computer reconstruction algorithm, a large number of high-contrast section s
simultaneously (10), from which quantitative data can be extracted .
Detailed reviews of such instrumentation designs can be found in the literatur e
(11) .
USE OF POSITION—SENSITIVE DETECTORS IN MEDICINE
237
A list of the gamma camera technology for med ;, .1 imaging would include :
- NaI(T1) crystals and collimators for Anger camera s
- Image intensifier systems
- Cameras using semi-conductor s
- Multiwire proportional chamber s
- Cameras using light scintillation in liquid xeno n
- Systems without multichannel collimators such as ones with coded apertures, an d
the Compton scattering and positron (tomographic and non-tomographic) cameras .
With its current performance (energy resolution : 10%, efficiency : 60Z, spatia l
resolution : 4 mm, size of the field of view: 400 mm) the Nal crystal (1/2 inch
thickness) Anger camera with its array of photomultiplier tubes for scintillatio n
localization, is the most extensively used device and is also the most cos t
effective .
6 . AN EXAMPLE OF THE ANGER CAMERA IN CLINICAL US E
Cardiovascular function (12 )
Another key event in molding gamma camera technology was the introduction in 1964 o f
the radioisotope technetium 99m (half life : 6 h, 140 keV gamma emission) . Camera s
specifically designed for that energy can use thinner light guides and achieve
better resolution .
The heart may be compared to a pump and the analysis of heart function results i n
physical parameters such as volume, ejection fraction, pressure and time derivative s
(contraction, relaxation velocities) .
However, a description of the heart function by global parameters only may b e
insufficient and yield false negative results . Thus regional wall motion abnormalitie s
must also be analysed using both studies of the heart function and imaging of regiona l
wall motion (13), which involve the exact localization (x, y, z) of each myocardia l
region as a function of time during the heart cycle .
The approach of nuclear cardiology is based on the assumption that the cycli c
motion of each region can be described as a set of time dependent count-rates, for -
ming a representative time-activity curve, corresponding to the time-volume curve o f
the region . The ensemble of time-activity curves for all regions contains all dat a
concerning myocardial motion . One important pre-requisite for accurate analysis o f
these curves is realibility (statistics in the order of 600 counts/pixel x frame
assuming 16 frames of 32 x 32 per cycle) . The variation of cycle length, in th e
range of 10% in normals and more than 50% in patients with heart diseases, makes i t
necessary to correct the curves to take into account the true measurement time fo r
each frame of the cycle . Processing of the set of data is then possible and results
238 SOUSSALIN E
in a "parametric" image, where various essential features of the regional curves ar e
displayed in a matrix format .
A multiplicity of parameters has been proposed and studied during the last fe w
years for heart function imaging, describing the extent of nyocardial contraction ,
the coordination of myocardial motion, or abnormalities of wall motion .
The parameter "amplitude" of the base frequency of the pixel curve after Fourie r
analysis describes more exactly the extent of regional motion (14) . The coordination
of myocardial motion is reflected by the "phase" parameter after Wiener filtering o f
the pixel curves for "endsystolic time" scans . Motion abnormalities, as assessed by
parameters usually not detectable by angiography, can be visualized by parameter s
such as "maximal contraction velocit y " and "maximal relaxation velocit y" , these being
the time derivatives calculated at the inflection points of the pixel curves . Al l
these parametric scans should provide both the requirements of clinical relevanc e
and reliability .
The present predominance of Fourier analysis in parametric heart imaging is base d
on two facts :
— the data processing time is short, for only the base frequency (sine and cosin e
coefficients) is used .
— the calculated amplitude corresponds to the spatial dimension (x, y, z) o f
cardiac moticn, and the calculated phase to the temporal relationships .
This is the solution of the main diagnostic problem by only one algorithm applie d
to the set of data .
Gated blood pool procedures are usually performed with an Anger camera connecte d
to a computer system . The limited maximal activity (20 mCi99mTc)
and restricte d
study time (exercise : 2— 3 min, rest : 4—20 min) require a high sensitivity collimato r
which leads to a ' reduced resolution of about 18 mm. Time intervals (32 x 32 frames )
of 20 msec describe myocardial motion with sufficient accuracy .
Moreover, true three dimensional imaging of myocardial function by emissio n
computed tomography, as described in the next section, represents a more complet e
representation of the myocardial positron . Another very interesting future
development is the combination of myocardial function imaging with perfursion an d
metabolism imaging obtained by . positron emission tomography .
Special equipment, such as adapted collimator (slant hole), may improve th e
separation of atria and ventricles .
7 . EMISSION COMPUTED TOMOGRAPHY (15, 16 )
The realization of the special potentialities of nuclear medicine i s
progress in the labelling of new molecules, but advance is also linked to parallel
USE OF POSITION-SENSITIVE DETECTORS IN MEDICINE
239
progress in gamma imaging techniques, especially quantitative and three dimensiona l
ones .
Emission computerized tomography (ECT), including the use of single photon gamm a
emitters (SPECT) and of positron emitters (PET), is an alternative approach to non -
invasive medical imaging methodology, its essential goals being enhancement of th e
image detectability and the extraction of quantitative data from a true thre e
dimensional distribution . The new generations of images in nuclear medicine no t
only represent regional concentrations of radioactivity or uptake, but are true
functional or "biochemical " images based on the solution of mathematical models tha t
yield information such as the level of glucose metabolism or that of an essentia l
aminoacid in an organ .
Basically, SPECT involves collimation, unlike positron computed tomography (PCT )
which involves electronic collimation . The latter has several advantages ,
particularly in whole body imaging, which will be presented 'ater .
Most authors have utilized a conventional classification based on the geometry
of the tomographic images obtained :
- longitudinal imaging systems if the primary reconstruction is performed o n
planes parallel to the long axis of the body ;
- transverse sectional imaging systems if it is performed for planes perpendicular
to that axis . In this case, there is no interaction between the planes and the dat a
can be organized to obtain a set of longitudinal or oblique sections .
In all cases, SPECT and PCT imaging systems require sophisticated and well adapte d
designs in terms of detector geometry, collimation, software and hardware systems .
A specific aspect of ECT is its ability to provide quantitative functional images .
Although it is rather arbitrary, the volume element dimension generally considere d
is of the order of 1 cm 3 , the accuracy of *the measurement being in the range o f
1-20Z . When a convenient model, specifically referred to a given molecule, can b e
considered as a basic for a large scale of patient reference values, then it can b e
correlated with diseases .
7.1 Single photon emission computed tomography clinical application
SPECT offers, at least in theory, three advantages over conventional scintigraph y
(17) : higher image contrast images in all three dimensions and the possibility o f
quantifying the results .
The applications of SPECT include brain tumors studies, cerebral infarction ,
liver metastases, liver volume, lung, kidney and myocardium studies .
An important current investigation is that of quantitative regional distributio n
of N-isopropyl-p 1231-iodoamphetamine (IIF) . This molecule was used for the
240
SOUSSALIN E
measurement of cerebral blood flow (18), in conjunction with a SPECT quantitativ e
model . The results showed perfusion deficits and, more generally, revealed cerebra l
blood flaw patterns, when the imaging was performed less than I hour after injection .
These first results with a radiopharmaceutical agent which crosses the blood-brai n
barrier are extremely encouraging. However, correction for autoabsorption i s
indispensable for quantitative studies and accurate, fast methods are required fo r
the reconstruction procedure (19) .
Liver volume can be measured by SPECT . Total liver volume is the sum of th e
slice volumes, identified by means of an automatic edge-finding algorithm . Result s
obtained correlate well with the data in the literature .
When tomographic acquisition is performed with a gating technique synchronou s
with the electro-cardiogram, after labelling of the blood pool with 99mTC albumi n
or erythrocytes, a better evaluation of volume of the heart cavities is obtaine d
as compared to that in conventional scintigraphy .
7 .2 Positron emission computed tomography clinical data (20, 21 )
One of the major objectives of positron computed tomography is the regiona l
quantification of physiological variables, non invasively in man . The term
"physiological tomography " has been used to distinguish this technique from th e
morphological tomographic techniques such as X-ray CT and ultrasound . Applications
of PCT to an organ such as brain alone cover glucose and oxygen metabolism ,
measurement of blood flow and volume, protein synthesis, receptor activity, tissu e
proliferation and lipid synthesis .
Methods for the measurement of metabolic processes have also been developed fo r
myocardial studies and for the non-respiratory physiological functions of the lung .
Constant infusion of the short-lived gas C 1502
(22) is used to deliver a15
.diffusible tracer (C
1502 converted to H2 0 in the lungs) to the tissue, which has a
rapid radioactive decay to maintain a low concentration of the tracer in the tissue .
This has been shown to provide very useful measurements of cerebral blood flow . The
inhalation of molecular radioactive oxygen leads to the labelling of bloo d
oxyhemoglobin, also distributed to the brain according to its blood flow . In
contrast, radioactive oxygen 1502is extracted by the brain cells proportionally t o
their metabolic rate . The images successively registered at the same level of the
brain will represent both the cerebral blood-flow (C 1502 picture) and the oxyge n
metabolism ( 1502
picture) .
Another important example is that of the brain regional uptake and protei n
synthesis (23) . The main parameter' L.overning cerebral protein synthesis i n
pathological states where abnormal amino acid metabolism is suspected can be
USE OF POSITION-SENSITIVE DETECTORS IN MEDICINE •
241
..easured by PCT, using 11C-L methionine as a tracer in a three compartment w)del .
Extremely interesting studies were carried out in normals (21) involving
sensory stimulation : they demonstrated the potential of the glucose metabolis m
method using PCT and 18FDG in understanding the functional organization an d
stimulus response capacity of the human brain . Once these approaches are wel l
characterized in controlled studies in normal subjects, they can be more generall y
applied to patients with a variety of behaviour and sensory alterations .
8 .
DISCUSSION AND SUMMARY
Amongst the wide range of clinical applications of position-sensitive detectors i n
man, three (arbitrarity chosen) domains were briefly presented : X-ray transmission
computed tomography digital cardiovascular function, single photon emissio n
computed tomography and positron emission computed tomography .
In CT scanning, dynamic studies (time interval in the order of a second or less )
will be of particular significance in the brain, heart, kidneys and segmenta l
parts of the gastrointestinal tract, where it can be extremely useful to determin e
the relative blood supply to small areas .
Nuclear magnetic resonance is one of the newer modalities that appear on th e
horizon and which results in imaging . ?SMR can image soft tissues without interferenc e
from gas or bone . It does not use ionizing radiation but, by relating a radio-wave ' s
energy to the magnetic field, information is obtained that can result in thre e
dimensional spatial resolution with millimetric resolution . Actual results ar e
extremely promising .
Over the last few years, important progress has been made in SPECT . Particula r
developments are likely to be made in the large scale use of rotating gamma camer a
SPECT devices with a better understanding of the physical factors involve d
(sensitivity, attenuation, scatter), as well as in data analysis to enable-functiona l
regional studies .
Together with the development of new gamma-emitting radiopharmaceuticals and
adequate models, artefact free SPECT data will permit non-invasive regiona l
measurement of physiopathological parameters .
Positron-emitting radionuclides are ideal, since their fundamental physica l
properties allow them to be detected quantitatively and accurately using tomographic
devices . Those of biological interest (carbon 11, nitrogen 13, oxygen 15 an d
fluorine 18) are short-lived radionuclides and thus deliver low radiation doses i n
man . However, this implies that the means of producing and incorporating them int o
radiopharmaceuticals should be at the same site (hospital environment) as th e
in vivo measurement . Also, only short term studies are possible . Thus, with
242
SOUSSALIN E
continuous efforts to optimize the different techniques involved and decreas e
operational costs, PCT could be a new and efficient means for the study of metaboli c
pathways in vivo .
ACKNOWLEDGEMENT S
The author wishes to acknowledge R . Allemand, J .C . Baron, M . Bourguignon and
P . Bustany for helpful discussions during the preparation of this manuscript, an d
N . De Blecker for the typing of the manuscript .
REFERENCES
1.
Hounsfield, G .N. (1973) . "Computerized transverse axial scanning (tomography) "
Description of system . British Journal of Radiology, 46, 1016-1022 .
2.
Boyd, D ., Margulis, A.R ., Korobikin, M . (1977) . " Comparison of translate-rotat e
and pure rotary body scanners " . SPIE, Opt . Instrumentation in Medicine VI .
127-280 .
3.
Brasch, R .C ., Boyd, D .P., Gooding, C.A. (1978) . "Computed tomographic scannin g
in children : comparison of radiation dose and resolving power of commercia l
CT scanners " . AJR . July .
4.
"International Symposium and course on computed tomograph y" Las Vegas, Nevad a
(1980) . J. Computed Assisted Tomography, 4 (5), 700-717, Oct, Raven Press ,
New York .
5. Young, S .W ., Noon, M .A., Nassi, M. and Castellino, R :A_ (1980) . "Dynamic com-
puted tomography body scanning " . J. Computed Assisted Tomography . 4 (2), 168 -
173, Raven Press .
6.
Krel, L. and Steiner, R .E . (1980) . Medical Imaging . Ed . HM+M . Publisher s
Aylesbury-Buchs .
7.
Anger, H .O . (1958) . Scintillation camera . Rev. Sci . Instr in . 29 (1), 27-33 .
8.
Kenny, P.J . (1971) . Spatial resolution and count rate capacity of a positro n
camera : some experimental and theoretical consideration . Int . J . of" Appi .
adiat. Isot . 22, 21-28 .
9.
Muehllehner,G. (1975) . Positron camera with extended counting rate capability .
J. Nuc'. . filed . 16, 653-657 .
10.
Jaszczak, R .J., Huard, D ., Murphy, P .H . et al . (1976) . Radionuclide emissio n
computed tomography with a scintillation camera . J. Nucl. Med. 17, 551 .
11.
McKeighen, R .E. (1981) . A review of gamma camera technology fnr medical ima -
ging. In : chap . 4, 119-163 .

USE OF POSITION-SENSITIVE DE L(TORS IN MEDICINE
243
12.
Adam, W .E. and Bitter F . (1981) . Advances in heart imaging . In : Medical Radio -
nuclide Imaging, IAEA, Vienna .
13.
Geffers, H ., Adam, W .E ., Bitter, F . et al . (1977) . Data processing and functio-
nal imaging in radionuclide ventriculography . In Proc . of 4th Int . Conferenc e
on Data Processing in Medical Imaging, Nashville, p 322 .
14. Bossuyt, A ., Deconinck, F ., Lepoudre, R .L. et al . (1979) . The temporal Fourier
transform applied to functional isotopic imaging . In Proc . of 6th Int . Confe-
rence on Information Processing in Medical Imaging, INSERM, Paris .
15.
Phelps, M.E . (1977) . Emission Computed Tomography . In Seminars in Nuclea r
Medicine, Vol 7, 4, 337-65 .
16.
Budinger, T .F., Gullberg, G .T . and Huesman, R .H . (1979) . Emission computed
tomography . In Topics in Applied Physics, Vol .32, G.T . Herman ed . Berlin ,
Springer Verlag, pp .147-246 .
17.
Raynaud, C . (1982) . Applying Single Photon Emission Computed Tomography, In
Principles of Radionuclide Imaging, ed . D .E . Kuhl, Pergamon Press, pp .185-200 .
18. Kuhl, D .E., Barrio, J.R ., Huang, S .C. et al . (1982) . Quantifying local cerebra l
blood flow by N-isopropyl-p- E 1231 1 iodoamphetamine (IMP) tomography . J. NucZ .
Med . 23 : 196-203 .
19.
Soussaline, F. (1982) . The single photon tomograph . In Principles of Radionu-
clide Emission Imaging, ed . D .E . Kuhl, Pergamon Press, pp . 153-184 .
20.
Phelps, M.E ., Hoffman, E .J ., Kuhl, D .E . (1977) . Physiologic tomography : a new
approach to in vivo measure of metabolism and physiologic function . In Medica l
Radionuclide Imaging, Vienna Internation Atomic Energy Association, Vol . 1 ,
pp . 233-53 .
21.
Phelps, M .E., Huang, S .C., Mazziotta, J .C. et al . (1982) . Physiologic measu-
rements with positron computed tomography . In Principles of Radionuclid e
Emission Imaging, ed . D .E. Kuhl, Pergamon Press, pp . 227-259 .
22.
Baron, J .C ., Lebrun-Grandié, P ., Collard, P . et al . (1982) . Non invasive measu -
rement of blood flow oxygen consumption and glucose utilization in the same
brain locus in man by positron emission tomography . J. Nucl. Med . in press .

PUBLICATION
II

PUBLICATION I I
Reprint from
"MEDICAL RADIONUCLIDE IMAGING"
VOL.!
INTERNATIONAL ATOMIC ENERGY AGENCY
VIENNA, 1977
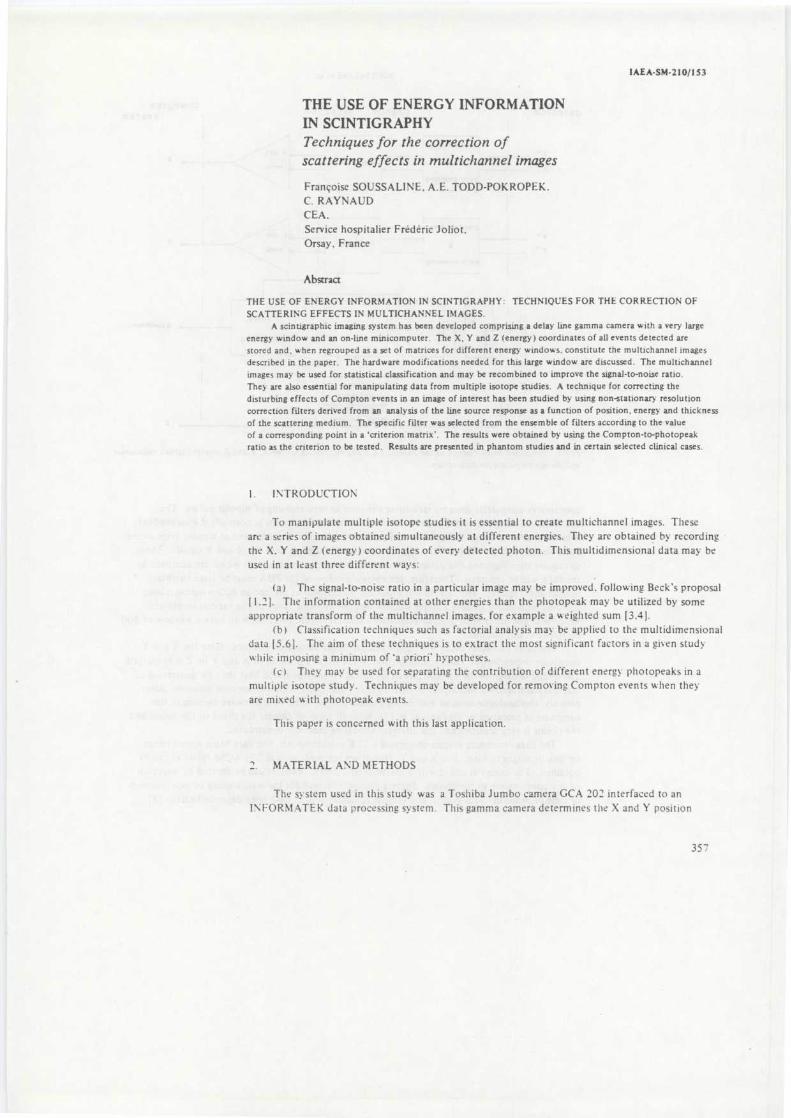
IAEA-SM-210/15 3
THE USE OF ENERGY INFORMATIO N
IN SCINTIGRAPH Y
Techniques for the correction ofscattering effects in multichannel images
Françoise SOUSSALINE, A .E . TODD-POKROPEK ,C . RAYNAU DCEA ,Service hospitalier Frédéric Joliot ,Orsay, France
Abstract
THE USE OF ENERGY INFORMATION IN SCINTIGRAPHY : TECHNIQUES FOR THE CORRECTION O F
SCATTERING EFFECTS IN MULTICHANNEL IMAGES .
A scintigraphic imaging system has been developed comprising a delay line gamma camera with a very larg e
energy window and an on-line minicomputer . The X, Y and Z (energy) coordinates of all events detected ar e
stored and . when regrouped as a set of matrices for different energy windows . constitute the multichannel image s
described in the paper . The hardware modifications needed for this large window are discussed . The multichanne l
images may be used for statistical classification and may be recombined to improve the signal-to-noise ratio .
They are also essential for manipulating data from multiple isotope studies . A technique for correcting th e
disturbing effects of Compton events in an image of interest has been studied by using non-stationary resolutio n
correction filters derived from an analysis of the line source response as a function of position, energy and thickness
of the scattering medium . The specific filter was selected from the ensemble of filters according to the valu e
of a corresponding point in a `criterion matrix ' . The results were obtained by using the Compton-to-photopea k
ratio as the criterion to be tested . Results are presented in phantom studies and in certain selected clinical cases .
1 . INTRODUCTIO N
To manipulate multiple isotope studies it is essential to create multichannel images . Thes eare a series of images obtained simultaneously at different energies . They are obtained by recordin gthe X . Y and Z (energy) coordinates of every detected photon . This multidimensional data may b eused in at least three different ways :
(a) The signal-to-noise ratio in a particular image may be improved . following Beck ' s proposa l[ 1 .2 ] . The information contained at other energies than the photopeak may be utilized by som eappropriate transform of the multichannel images. for example a weighted sum [3 .4] .
(b) Classification techniques such as factorial analysis may be applied to the multidimensiona ldata [5 .6] . The aim of these techniques is to extract the most significant factors in a given stud ywhile imposing a minimum of 'a priori ' hypotheses .
(c) They may be used for separating the contribution of different energy photopeaks in amultiple isotope study . Techniques may be developed for removing Compton events when the yare mixed with photopeak events.
This paper is concerned with this last application.
2 . MATERIAL AND METHOD S
The system used in this study was a Toshiba Jumbo camera GCA 202 interfaced to a nINFORMATEK data processing system . This gamma camera determines the X and Y position
357
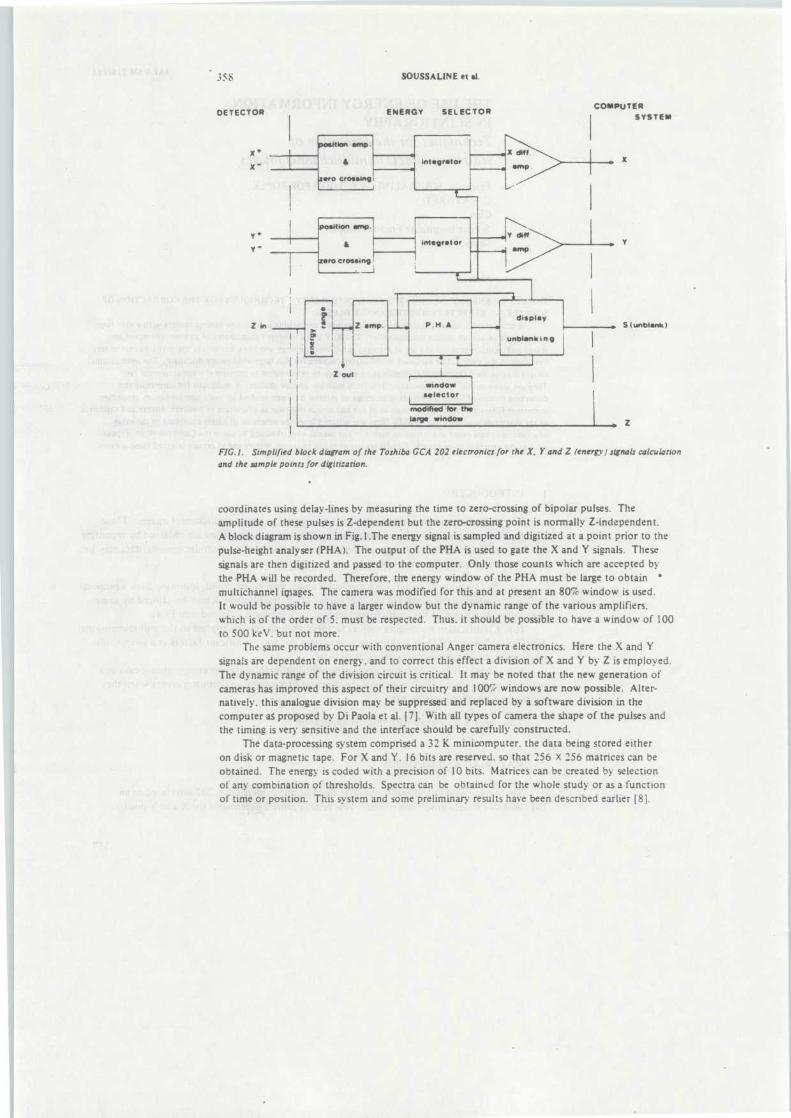
35S
SOUSSALINE et al.
X dUt .
amp .
Y diff .integrator
amp .
DETECTOR
ENERGY
SELECTO R
position amp .
a
Integrator
zero crossing
position amp . I
i
zero crossing
COMPUTE RSYSTE M
. Y
a fa displa y
P .M . Azin z amp . . S (unblank )
unbiank i n g
liZ out
modified for thelarge window
windo wselector
FIG . I . Simplified block diagram of the Toshiba GCA 202 electronics for the X, Y and Z (energy) signals calculatio nand the sample points for digitization .
coordinates using delay-lines by measuring the time to zero-crossing of bipolar pulses . Th eamplitude of these pulses is Z-dependent but the zero-crossing point is normally Z-independent .A block diagram is shown in Fig. l .The energy signal is sampled and digitized at a point prior to th epulse-height analyser (PHA) . The output of the PHA is used to gate the X and Y signals. Thes e
signals are then digitized and passed to the computer . Only those counts which are accepted b ythe PHA will be recorded . Therefore, tire energy window of the PHA must be large to obtain 'multichannel images. The camera was modified for this and at present an 80îo window is used .It would be possible to have a larger window but the dynamic range of the various amplifiers ,which is of the order of 5 . must be respected . Thus . it should be possible to have a window of 10 0to 500 ke y . but not more .
The same problems occur with conventional Anger camera electronics. Here the X and Ysignals are dependent on energy . and to correct this effect a division of X and Y by Z is employed .The dynamic range of the division circuit is critical . It may be noted that the new generation o fcameras has improved this aspect of their circuitry and 100% windows are now possible . Alter-natively, this analogue division may be suppressed and replaced by a software division in th ecomputer as proposed by Di Paola et al . [7] . With all types of camera the shape of the pulses an dthe timing is very sensitive and the interface should be carefully constructed .
The data-processing system comprised a 32 K minicomputer . the data being stored eithe ron disk or magnetic tape . For X and Y . 16 bits are reserved . so that 256 X 256 matrices can beobtained . The energy is coded with a precision of 10 bits . Matrices can be created by selectio nof any combination of thresholds . Spectra can be obtained for the whole study or as a functio nof time or position . This system and some preliminary' results have been described earlier [8] .
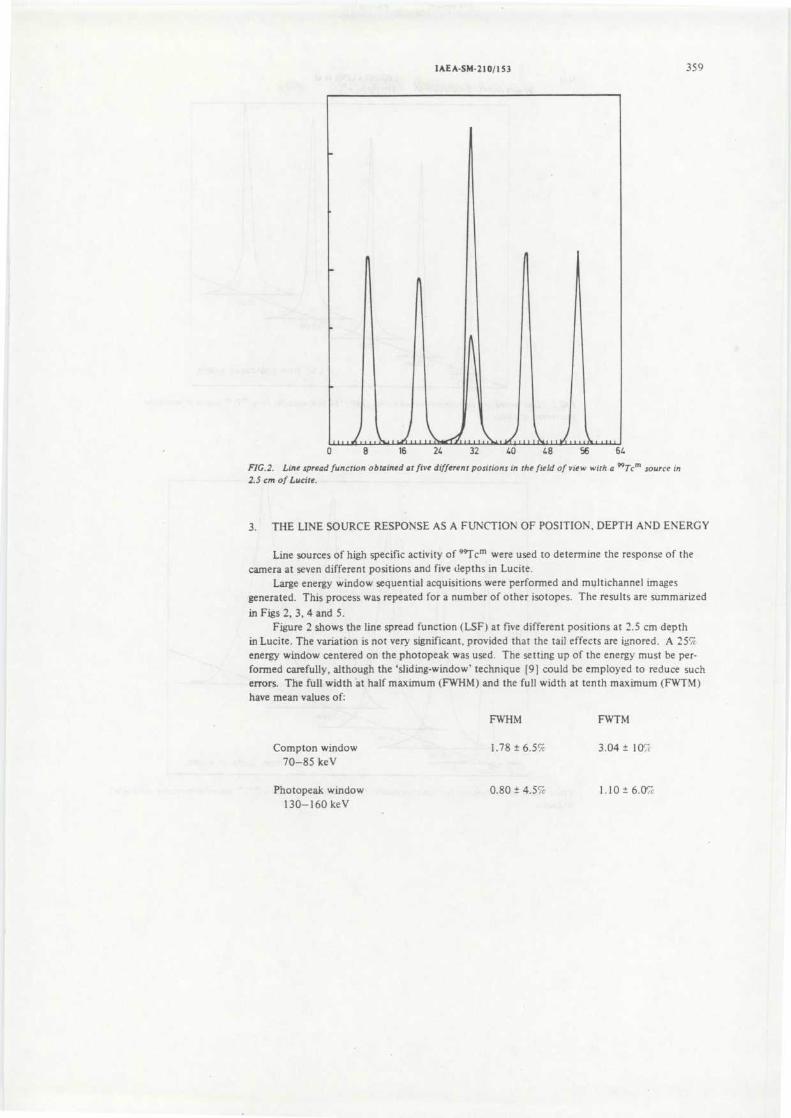
IAEA-SM-210/153
35 9
4
lflli
i
Ah L1 , . uIl'N 111„t ► 11t)IIINIt,,,, t0
8
16
24
32
40
48
56
6 4
FIG.2. Line spread function obtained at five different positions in the field of view with a 99Tem source in
2.5 cm of Lucite .
3 . THE LINE SOURCE RESPONSE AS A FUNCTION OF POSITION, DEPTH AND ENERG Y
Line sources of high specific activity of 99Tcm were used to determine the response of th ecamera at seven different positions and five depths in Lucite .
Large energy window sequential acquisitions were performed and multichannel image sgenerated . This process was repeated for a number of other isotopes . The results are summarize d
in Figs 2, 3, 4 and 5 .Figure 2 shows the line spread function (LSF) at five different positions at 2 .5 cm dept h
in Lucite . The variation is not very significant, provided that the tail effects are ignored . A 25 %energy window centered on the photopeak was used . The setting up of the energy must be per -formed carefully, although the `sliding-window' technique [9] could be employed to reduce suc herrors . The full width at half maximum (FWHM) and the full width at tenth maximum (FWTM )have mean values of:
FWHM
FWT M
Compton window
1 .78 ± 6 .5%
3 .04 ± 10 î'c70—85 ke V
Photopeak window
0 .80 ± 4 .5î"c.
1 .10 ± 6 .0%130—160 keV
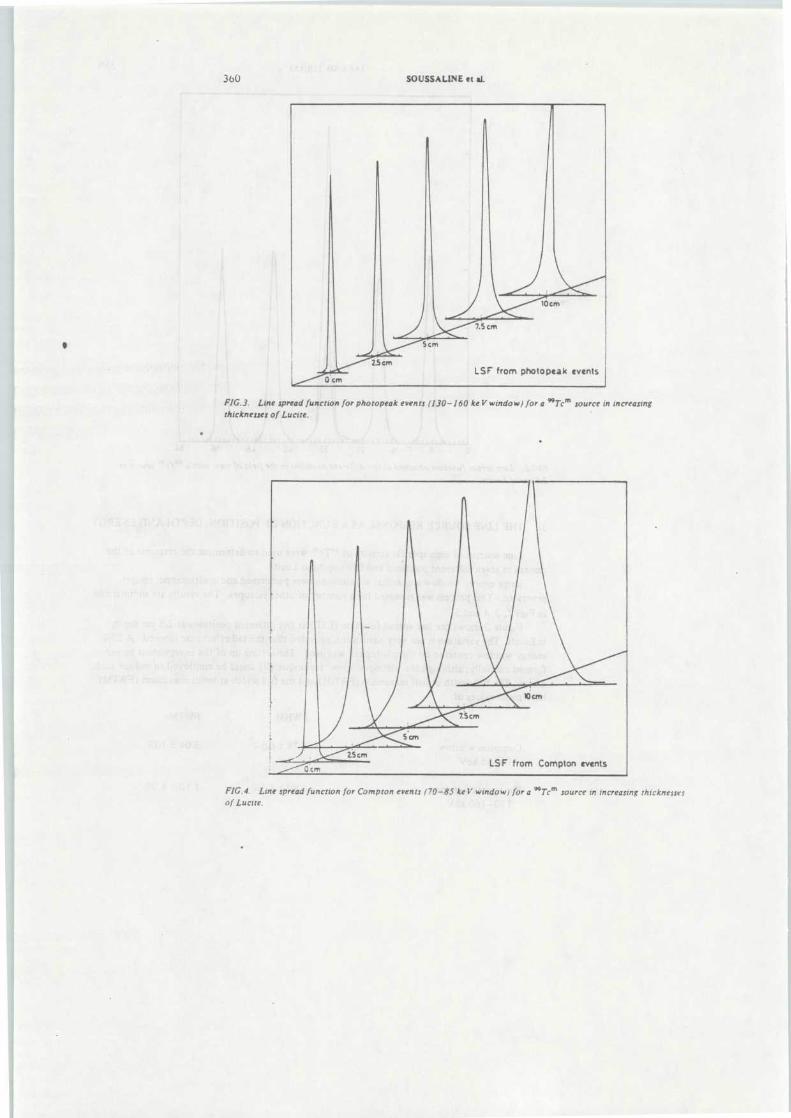
LSF from photopeak event s
FIG.3. Line spread function for photopeak events (130—160 keV window) for a "Tc m source in increasin g
thicknesses of Lucite .
LSF from Compton event s
FIG .4 . Line spread function for Compton events (70—85 keV window) for a "Tcm source in increasing thicknessesof Lucite.
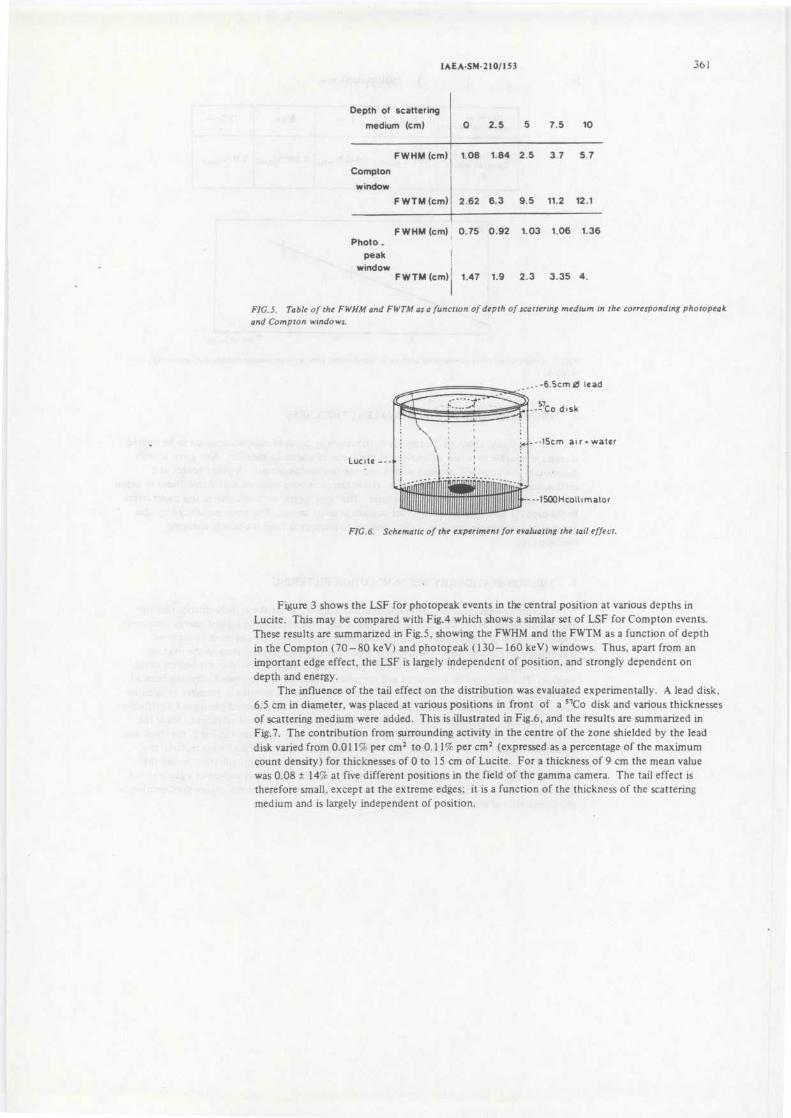
Depth of scattering
medium (cm)
IAEA - SM -210/I5 3
0
2 .5 5 7 .5
36 1
1 0
FWHM (cm 1 .08
1 .84 2 .5 3 .7 5 . 7
Compto n
window
FWTM (cm) 2 .62
6 .3 9 .5 11 .2 12 . 1
F W HM (cm) 0 .75
0 .92 1 .03 1 .06 1 .36Photo ..
pea kwindow
FWTM (cm)
1 .47
1 .9 2 .3 3 .35 4 .
FIGS . Table of the FWHM and FWTM as a function of depth of scattering medium in the corresponding photopea k
and Compton windows.
-15cm a i r . wate r
----1500Hcoltimato r
FIG.6. Schematic of the experiment for evaluating the tail effect.
Figure 3 shows the LSF for photopeak events in the central position at various depths i nLucite . This may be compared with Fig .4 which shows a similar set of LSF for Compton events .These results are summarized in Fig .5, showing the FWHM and the FWTM as a function of dept hin the Compton (70—80 keV) and photopeak (130—160 keV) windows. Thus, apart from a nimportant edge effect, the LSF is largely independent of position . and strongly dependent o ndepth and energy .
The influence of the tail effect on the distribution was evaluated experimentally . A lead disk ,
6 .5 cm in diameter, was placed at various positions in front of a "Co disk and various thicknesse sof scattering medium were added . This is illustrated in Fig .6, and the results are summarized inFig.7 . The contribution from surrounding activity in the centre of the zone shielded by the lea ddisk varied from 0 .011 % per cm 2 to 0 .11% per cm 2 (expressed as a percentage of the maximu mcount density) for thicknesses of 0 to 15 cm of Lucite . For a thickness of 9 cm the mean valu ewas 0 .08 ± 14% at five different positions in the field of the gamma camera . The tail effect istherefore small . except at the extreme edges ; it is a function of the thickness of the scatterin gmedium and is largely independent of position .
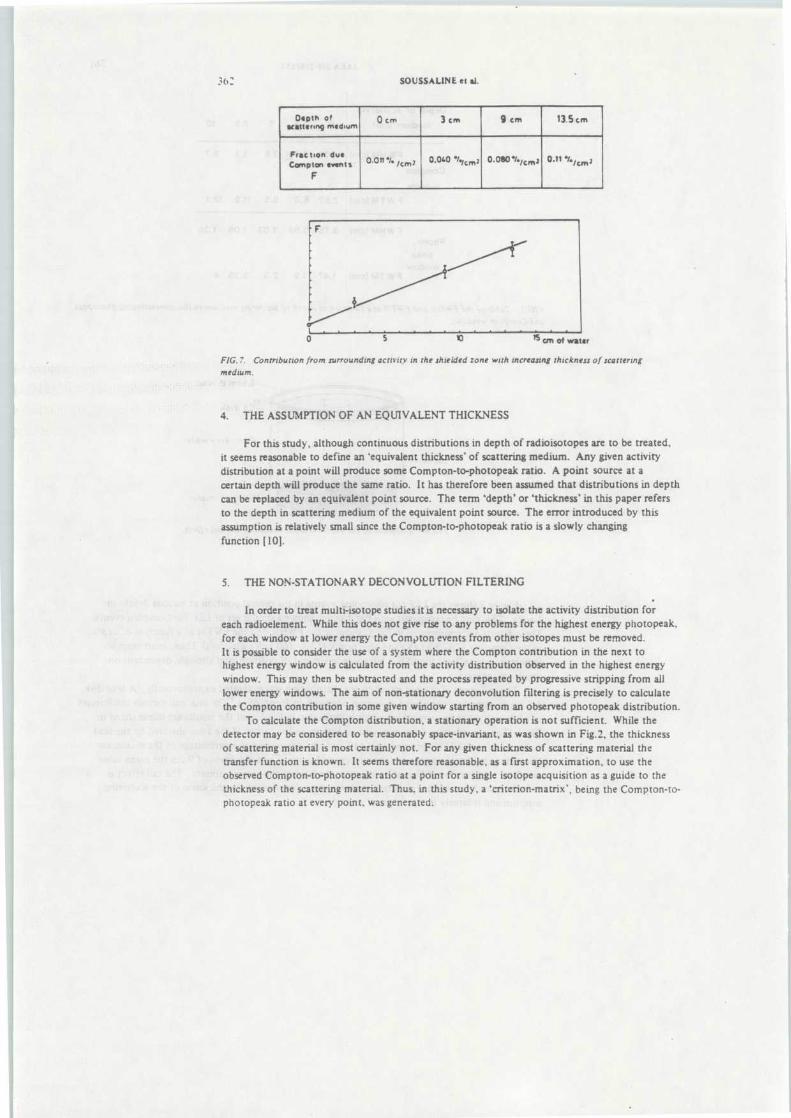
SOUSSALINE et al.
Oepth of 0 cm 3 cm 9 cm 13.5 c m'uttering medium
Fraction du eCompton event s
F
0.011 1'4 /c,,2 0.0 4 0 '//cm 2 O.OaO'/•/cmc 0 .11'/ /cm 2
FIG. 7. Contribution from surrounding activity in the shielded zone with increasing thickness of scattering
medium .
4. THE ASSUMPTION OF AN EQUIVALENT THICKNES S
For this study, although continuous distributions in depth of radioisotopes are to be treated ,it seems reasonable to define an 'equivalent thickness' of scattering medium . Any given activitydistribution at a point will produce some Compton-to-photopeak ratio. A point source at acertain depth will produce the same ratio . It has therefore been assumed that distributions in dept hcan be replaced by an equivalent point source . The term `depth' or `thickness' in this paper refer sto the depth in scattering medium of the equivalent point source . The error introduced by thisassumption is relatively small since the Compton-to-photopeak ratio is a slowly changin gfunction [ 10] .
5. THE NON-STATIONARY DECONVOLUTION FILTERING
In order to treat multi-isotope studies it is necessary to isolate the activity distribution fo reach radioelement. While this does not give rise to any problems for the highest energy photopeak ,for each window at lower energy the Compton events from other isotopes must be removed .It is possible to consider the use of a system where the Compton contribution in the next t ohighest energy window is calculated from the activity distribution observed in the highest energ ywindow. This may then be subtracted and the process repeated by progressive stripping from al llower energy windows . The aim of non-stationary deconvolution filtering is precisely to calculatethe Compton contribution in some given window starting from an observed photopeak distribution .
To calculate the Compton distribution, a stationary operation is not sufficient . While th edetector may be considered to be reasonably space-invariant, as was shown in Fig .2, the thicknes sof scattering material is most certainly not . For any given thickness of scattering material th etransfer function is known . It seems therefore reasonable, as a first approximation, to use th eobserved Compton-to-photopeak ratio at a point for a single isotope acquisition as a guide to th ethickness of the scattering material . Thus, in this study, a 'criterion-matrix ' , being the Compton-to-photopeak ratio at every point, was generated .
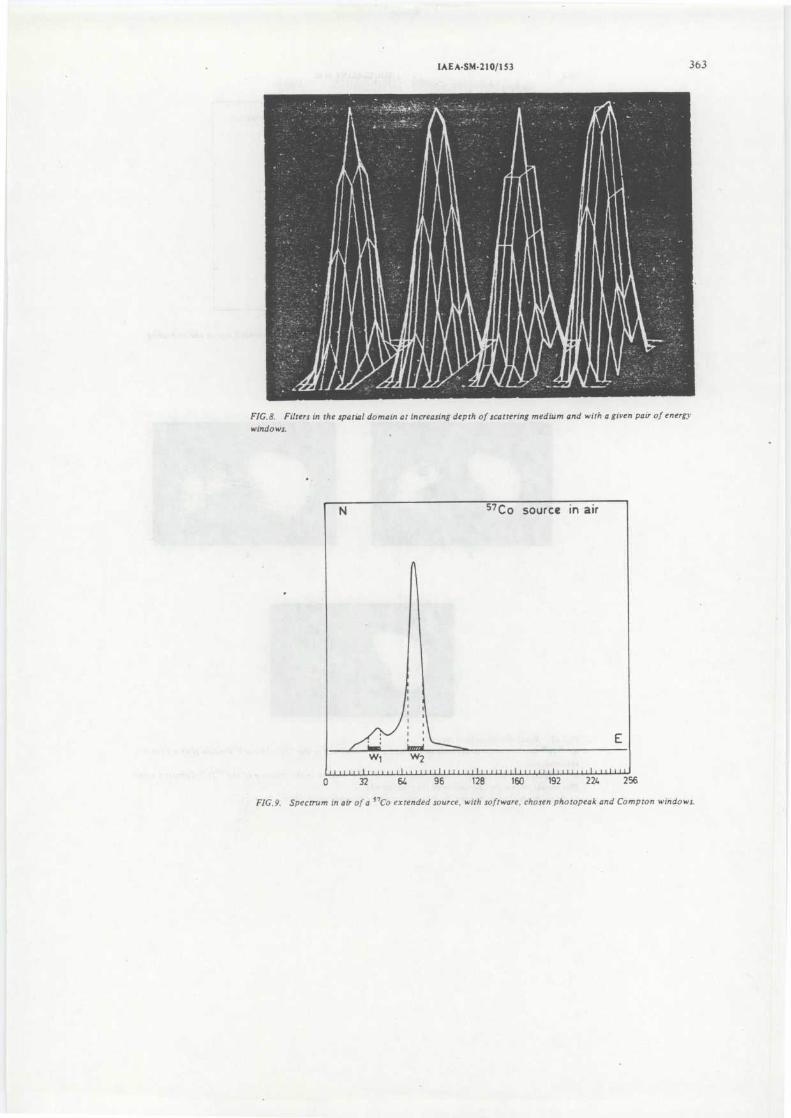
IAEA-SM-210/153 36 3
FIG .8 . Filters in the spatial domain at increasing depth of scattering medium and with a given pair of energy
windows.
0
32
6G
96
128
160
192
224
256
FIG.9 . Spectrum in air of a "Co extended source, with software, chosen photopeak and Compton windows .
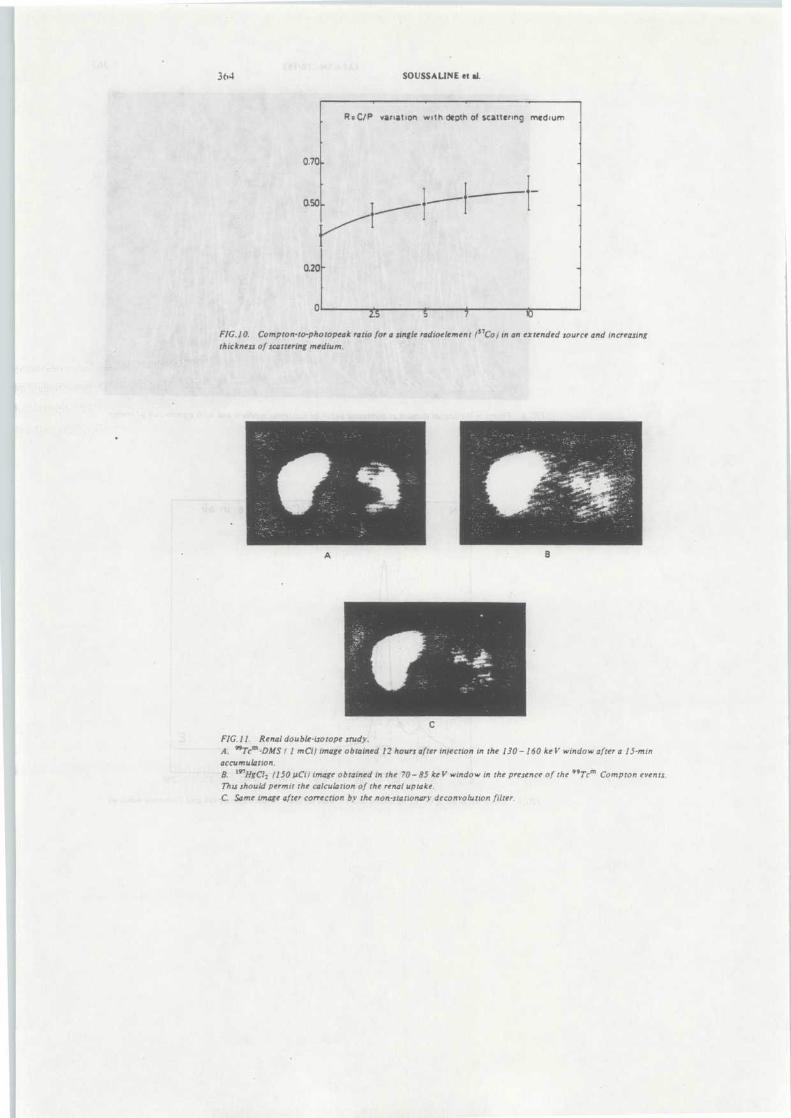
3 64
SOUSSALINE et el .
R :CIP variation with depth of scattering mediu m
0 .70
0.20
. 5
FIG.10. Compton-to-photopeak ratio for a single radioelement ("Co) in an extended source and increasin gthickness of scattering medium .
A
B
FIG.11 . Renal double-isotope study .
A. 99Tcm-DMS (1 mCi) image obtained 12 hours after injection in the 1 .10–160 keV window after a 15-min
accumulation.
B. 197HgCl, (150 µCil image obtained in the 70–85 keV window in the presence of the 99Tc m Compton events .This should permit the calculation of the renal uptake.
C. Same image after correction by the non-stationary' deconvolution filter .
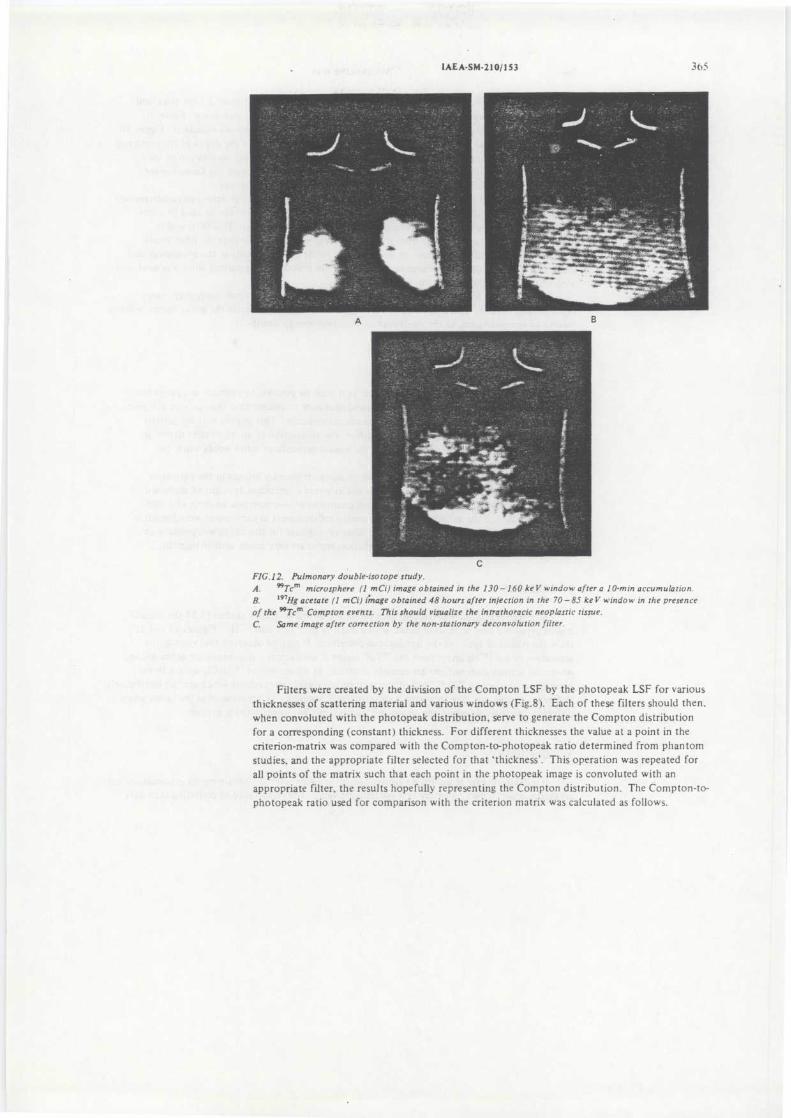
IAEA-SM-210/153 36 5
A B
CFIG .12. Pulmonary double-isotope study .
A. "Tc' microsphere (1 mCi) image obtained in the 130–160 keV window after a 10-min accumulation .
B. 197Hg acetate (1 mCi) image obtained 48 hours after injection in the 70–85 keV window in the presenc e
of the 99 Tc m Compton events . This should visualize the intrathoracic neoplastic tissue .
C. Same image after correction by the non-stationary deconvolution filter .
Filters were created by the division of the Compton LSF by the photopeak LSF for variou sthicknesses of scattering material and various windows (Fig .8) . Each of these filters should then .when convoluted with the photopeak distribution, serve to generate the Compton distributio nfor a corresponding (constant) thickness . For different thicknesses the value at a point in th ecriterion-matrix was compared with the Compton-to-photopeak ratio determined from phanto mstudies. and the appropriate filter selected for that `thickness ' . This operation was repeated fo rall points of the matrix such that each point in the photopeak image is convoluted with a nappropriate filter. the results hopefully representing the Compton distribution . The Compton-to-photopeak ratio used for comparison with the criterion matrix was calculated as follows .
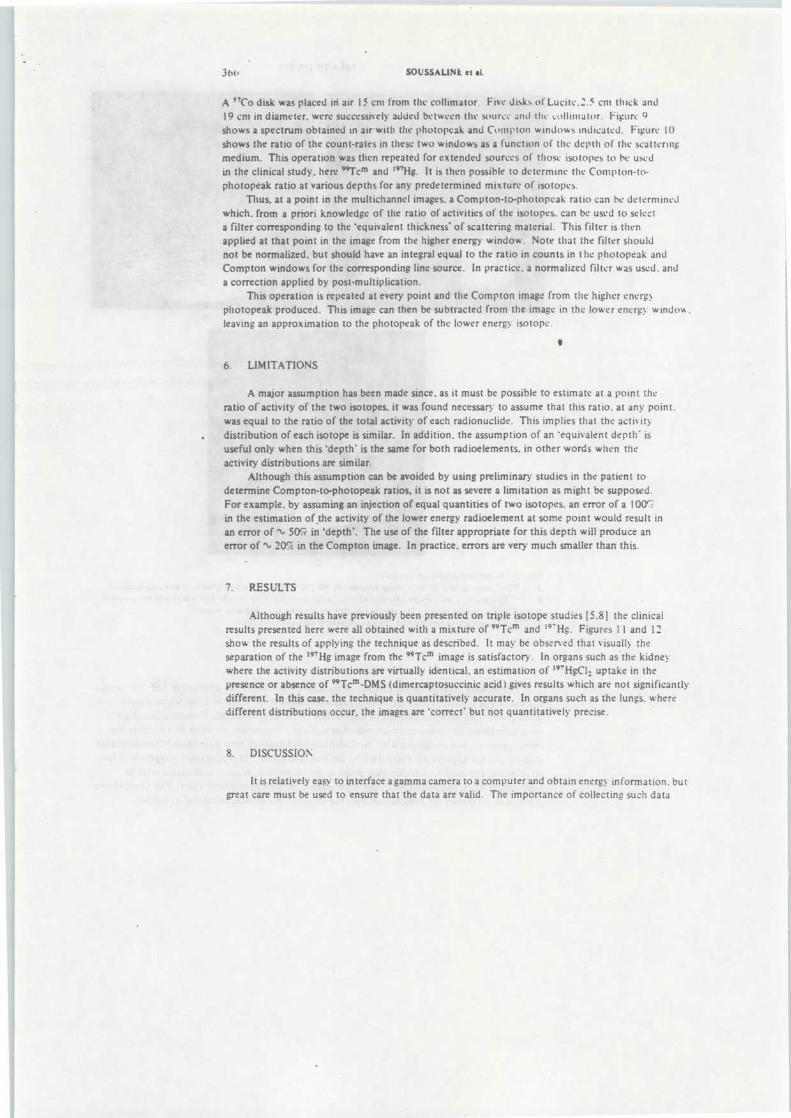
3()t~ SOUSSALINI et at .
A "Co disk was placed iii air 15 cm from the collimator . Five disks of Lucite .2 .5 cm thick an d19 cm in diameter, were successively added between the source and the collimator . Figure U
shows a spectrum obtained in air . with the photopeak and Compton windows indicated . Figure 1 0shows the ratio of the count-rates in these two windows as a function of the depth of the scatterin gmedium. This operation was then repeated for extended sources of those isotopes to he use din the clinical study, here "Tem and 19THg . It is then possible to determine the Compton-to-photopeak ratio at various depths for any predetermined mixture of isotopes .
Thus, at a point in the multichannel images . a Compton-to-photopeak ratio can be determine dwhich . from a priori knowledge of the ratio of activities of the isotopes . can be used to selec ta filter corresponding to the 'equivalent thickness ' of scattering material . This filter is the napplied at that point in the image from the higher energy window . Note that the filter shoul dnot be normalized . but should have an integral equal to the ratio in counts in t he photopeak an dCompton windows for the corresponding line source . In practice, a normalized filter was used . an da correction applied by post-multiplication .
This operation is repeated at every point and the Compton image from the higher energ yphotopeak produced . This image can then be subtracted from the image in the lower energy windovn .leaving an approximation to the photopeak of the lower energy isotope .
A major assumption has been made since, as it must be possible to estimate at a point th eratio of'activity of the two isotopes, it was found necessary to assume that this ratio . at any point .was equal to the ratio of the total activity of each radionuclide . This implies that the activitydistribution of each isotope is similar . In addition, the assumption of an 'equivalent depth' i suseful only when this 'depth' is the same for both radioelements. in other words when th eactivity distributions are similar .
Although this assumption can be avoided by using preliminary studies in the patient t odetermine Compton-to-photopeak ratios, it is not as severe a limitation as might be supposed .For example, by assuming an injection of equal quantities of two isotopes . an error of a 100rlin the estimation of the activity of the lower energy radioelement at some point would result i nan error of ti 50% in 'depth' . The use of the filter appropriate for this depth will produce a nerror of ti 20% in the Compton image . In practice, errors are very much smaller than this .
7. RESULTS
Although results have previously been presented on triple isotope studies [5 .8] the clinica lresults presented here were all obtained with a mixture of 99 Tc m and 19' Hg . Figures 1 1 and I 2show the results of applying the technique as described . It may be observed that visually th eseparation of the 197 Hg image from the 99 Tc m image is satisfactory . In organs such as the kidne ywhere the activity distributions are virtually identical, an estimation of 197 HgC1 2 uptake in th epresence or absence of 99 Tc m -DMS (dimercaptosuccinic acid) gives results which are not significantl ydifferent . In this case . the technique is quantitatively accurate . In organs such as the lungs . wheredifferent distributions occur, the images are 'correct' but not quantitatively precise .
8. DISCUSSIO N
It is relatively easy to interface a gamma camera to a computer and obtain energy information . bu tgreat care must be used to ensure that the data are valid . The importance of collecting such data
IAEA-SM-210/153
36 7
is not simply the elimination of the need for a second pulse-height-analyser in the camera but tha tmultichannel images . a four-dimensional matrix of X position, Y position, energy and time, can b eobtained and are available for manipulation .
This Pandora's box must be opened with caution . The essential problem is that the spectraobtained from a single isotope vary considerably as a function of the thickness of the scatterin gmaterial . To separate multichannel images requires a knowledge of these variations . As previousl ystated, this may be obtained by preliminary investigation, or from the study itself . at the expenseof certain assumptions . Even in view of this . it has been demonstrated that clinically usefu lresults can be obtained .
The assumption of stationarity is much less severe than the assumption of similarity in th e
activity distributions . The effect of spatial variations in the LSF is small . Uniformity correctio nis not applied . This seemed both unnecessary [10] and even dangerous . Because of the non-stationarity of the scattering medium a non-stationary filter had to be used . The processing timerequired for treating such a multi-isotope study is nevertheless less than 3 min .
9 . SUMMARY
Multichannel images can be obtained by interfacing a gamma camera to a on-line minicompute rand recording the energy information . The images may be used, in particular . for handling multi-isotope studies .
The Compton-to-photopeak ratio at various depths may be determined for any known mixtur eof isotopes. Observation of this ratio in an unknown image results in an estimate of the `equivalen tthickness' of the scattering material at that point . From the knowledge of the LSF ' s at variou senergies and depths, filters can be calculated to generate the Compton image from an observe dphotopeak image . This implies a process of non-stationary filtering . Multichannel images canthus be separated by progressive stripping of such calculated Compton contributions .
Some clinical results have been presented .
ACKNOWLEDGEMENT S
The authors would like to thank M . Crouzel and S . Ricard for their great help and technica lassistance .
REFERENCE S
[ 1 ] BECK, R .N ., ZIMMER, L.T ., CHARLESTON, D .B ., HARPER, P .V ., HOFFER, P .B ., "Advances in funda-mental aspects of imaging systems and techniques", Medical Radioisotope Scintigraphy 1972 (Proc . Symp .Monte Carlo, 1972) 1, IAEA, Vienna (1973) 3 .
[2] HOFFER, P .B ., BECK, R .N ., "Effect of minimizing scatter using Ge(Li) detectors of phantom model sand patients", Semi-conductors in the Future of Nuclear Medicine (HOFFER, P .B ., BECK, R .N . ,GOTTSHALK, A ., Eds), SNM Inc ., New York (1971) 131 .
[3] GENNA, A ., TEAGER, M .M ., SMORE, M .H ., BURROWS, B .A ., Application of multi-window spectralanalysis to dual radio-nuclide scintiscanning, J . Nuci. Med . 13 (1972) 431 .
[4] BLOCH, P ., SANDERS, T ., Reduction of the effects of scattered radiation on a sodium iodide imagingsystem, J . Nucl. Med . 14 (1973) 67 .
[5] SOUSSALINE, F ., TODD-POKROPEK, A .E ., DI PAOLA, R ., BAZIN, J .P ., "Techniques for combiningisotopic images obtained at different energies " , Information Processing in Scintigraphy (Proc . 4th Int . Conf.Orsay, 1975), CEA, Orsay, France (1976) 17 .
30,
SOUSSALINE et al.
(6J DI PAOLA, R ., PENEL, C ., BAZIN, J .P ., BERCHE, C ., "Factor analysis and scintigraphy " , InformationProcessing in Scintigraphy (Proc . 4th Int . Conf . Orsay . 1975), CEA, Orsay, France (1976) 91 .
(7J DI PAOLA, R . . BAZIN, J .P ., DI PAOLA, M ., "Improvement of gamma camera data processing due t osequential acquisition " , Proc . Symp . 3rd Int . Conf. on Data Handling and Image Processing in Scintigraphy ,
Boston (1973) 115 .[8] SOUSSALINE, F ., TODD-POKROPEK . A .E ., RAYNAUD, C ., KACPEREK , A ., SAUCE, M ., ZAJDE, C . ,
KELLERSHOHN, C ., "Double and triple isotope gamma camera studies with energy selection after dat acollection " , Proc. 1st World Congress of Nuclear Medicine, Tokyo (1974) 3 .
[9] TODD-POKROPEK, A .E ., ERBSMANN, F ., SOUSSALINE, F ., "The non-uniformity of imaging device sand its impact in quantitative studies " , these Proceedings . Vol . 1 .
[10] KACPEREK . A ., SPYROU, N .M ., KELLERSHOHN . C., " Méthode spectrométrique de mesure de la profondeu rrénale ", Proc . Ile Coll . sur la fixation rénale du mercure et du DMSA, Paris (1975) 73 .
DISCUSSIO N
R .N . BECK : At how many points do you determine the correction factor for scatter ?Françoise SOUSSALI4E : The correction factor is determined at each point of th e
64 X 64 matrix but in fact only five filters are used for convolution at each point because of the slow -varying-function shape of the Compton-to-photopeak ratio which has been chosen as a criterion .
G . van HERK : I am curious to know how you managed to have sufficient statistics to perfor myour Compton background correction and the Compton-to-peak ratio application to correct fo rattenuation effect in all 4096 image elements.
We used the same procedure for the 81 Rb-to- 81 Kr m ratio method but we had to confin eourselves to target regions of interest because the precision of the final result is dramaticall ydegraded by the successive correction procedures .
Françoise SOUSSALINE : We agree that statistical accuracy presents problems. However ,our results seem to be reasonable when the objects scanned are not too large .

PUBLICATION
III
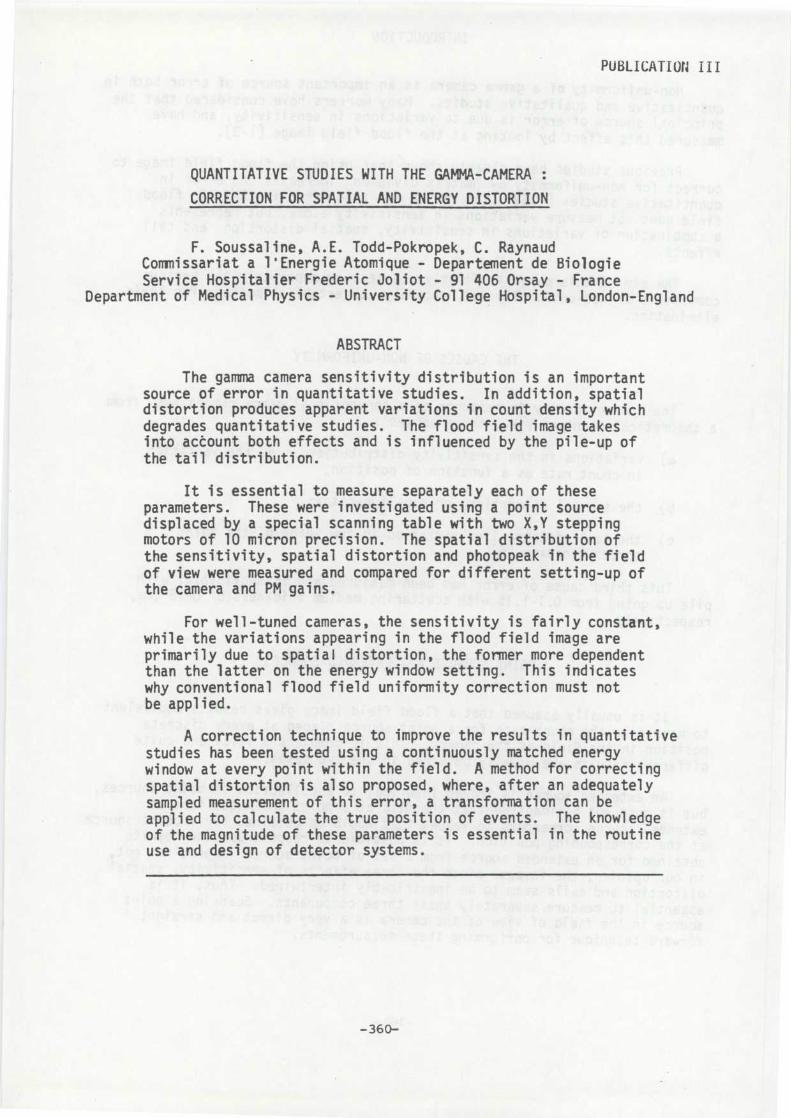
PUBLICATION II I
QUANTITATIVE STUDIES WITH THE GAMMA-CAMERA :
CORRECTION FOR SPATIAL AND ENERGY DISTORTIO N
F . Soussaline, A .E . Todd-Pokropek, C . RaynaudCommissariat a 1'Energie Atomique - Departement de Biologi eService Hospitalier Frederic Joliot - 91 406 Orsay - France
Department of Medical Physics - University College Hospital, London-Englan d
ABSTRACT
The gamma camera sensitivity distribution is an importan tsource of error in quantitative studies . In addition, spatia ldistortion produces apparent variations in count density whic hdegrades quantitative studies . The flood field image takesinto account both effects and is influenced by the pile-up o fthe tail distribution .
It is essential to measure separately each of thes eparameters . These were investigated using a point sourc edisplaced by a special scanning table with two X,Y steppin gmotors of 10 micron precision . The spatial distribution o fthe sensitivity, spatial distortion and photopeak in the fiel dof view were measured and compared for different setting-up ofthe camera and PM gains .
For well-tuned cameras, the sensitivity is fairly constant ,while the variations appearing in the flood field image areprimarily due to spatial distortion, the former more dependen tthan the latter on the energy window setting . This indicateswhy conventional flood field uniformity correction must no tbe applied .
A correction technique to improve the results in quantitativ estudies has been tested using a continuously matched energ ywindow at every point within the field . A method for correctingspatial distortion is also proposed, where, after an adequatel ysampled measurement of this error, a transformation can beapplied to calculate the true position of events . The knowledge
of the magnitude of these parameters is essential in the routin euse and design of detector systems .
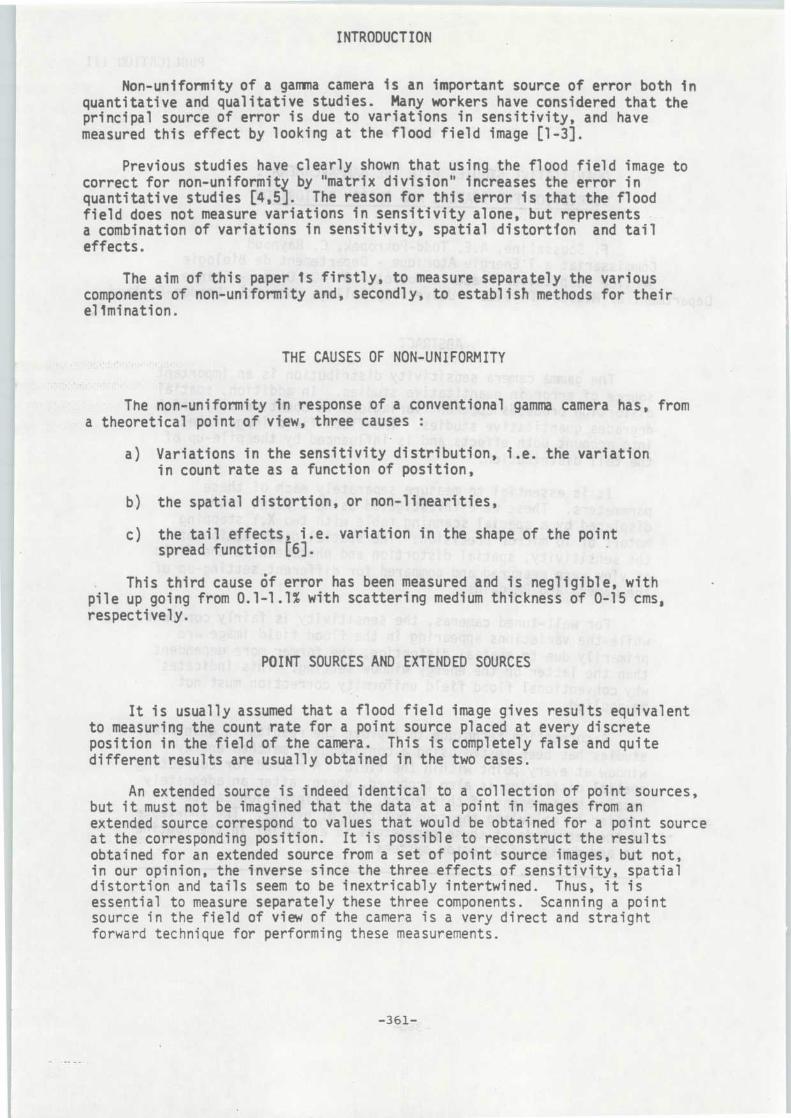
INTRODUCTION
Non-uniformity of a gamma camera is an important source of error both i nquantitative and qualitative studies . Many workers have considered that th eprincipal source of error is due to variations in sensitivity, and hav emeasured this effect by looking at the flood field image [1-3] .
Previous studies have clearly shown that using the flood field image tocorrect for non-uniformity by "matrix division" increases the error i nquantitative studies [4,5] . The reason for this error is that the floo dfield does not measure variations in sensitivity alone, but representsa combination of variations in sensitivity, spatial distortion and tai leffects .
The aim of this paper Is firstly, to measure separately the variou scomponents of non-uniformity and, secondly, to establish methods for thei relimination .
THE CAUSES OF NON-UNIFORMITY
The non-uniformity in response of a conventional gamma camera has, fro ma theoretical point of view, three causes :
a) Variations in the sensitivity distribution, i .e . the variatio nin count rate as a function of position ,
b) the spatial distortion, or non-1 i neari ties ,
c) the tail effects, i .e . variation in the shape of the pointspread function [6] .
This third cause 6f error has been measured and is negligible, wit hpile up going from 0 .1-1 .1% with scattering medium thickness of 0-15 cms ,respectively.
POINT SOURCES AND EXTENDED SOURCES
It is usually assumed that a flood field image gives results equivalentto measuring the count rate for a point source placed at every discret eposition in the field of the camera . This is completely false and quit edifferent results are usually obtained in the two cases .
An extended source is indeed identical to a collection of point sources ,but it must not be imagined that the data at a point in images from a nextended source correspond to values that would be obtained for a point sourc eat the corresponding position . It is possible to reconstruct the resultsobtained for an extended source from a set of point source images, but not ,in our opinion, the inverse since the three effects of sensitivity, spatia ldistortion and tails seem to be inextricably intertwined . Thus, it i sessential to measure separately these three components . Scanning a poin tsource in the field of view of the camera is a very direct and straigh tforward technique for performing these measurements .
-361-
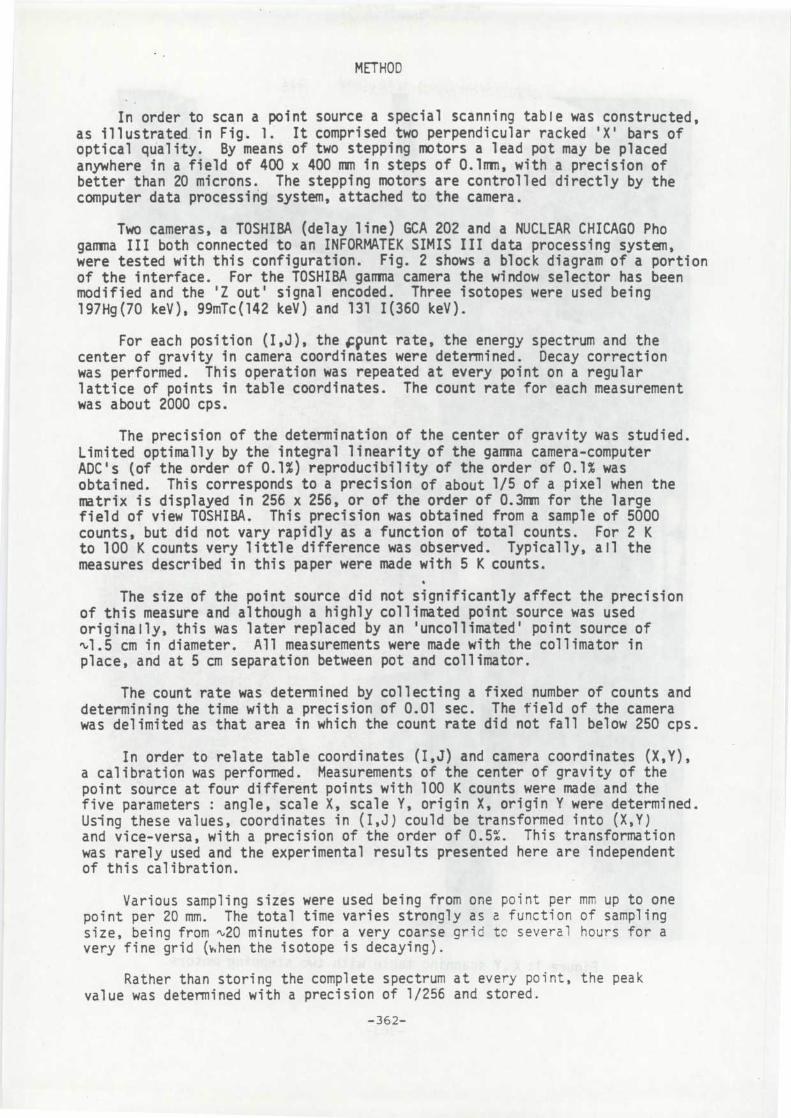
METHOD
In order to scan a point source a special scanning table was constructed ,as illustrated, in Fig . 1 . It comprised two perpendicular racked ' X' bars ofoptical quality . By means of two stepping motors a lead pot may be placedanywhere in a field of 400 x 400 mm in steps of O .lmm, with a precision o fbetter than 20 microns . The stepping motors are controlled directly by th ecomputer data processing system, attached to the camera .
Two cameras, a TOSHIBA (delay line) GCA 202 and a NUCLEAR CHICAGO Ph ogamma III both connected to an INFORMATEK SIMIS III data processing system ,were tested with this configuration . Fig . 2 shows a block diagram of a portio nof the interface . For the TOSHIBA gamma camera the window selector has beenmodified and the ' Z out ' signal encoded . Three isotopes were used being197Hg (10 keV), 99mTc(142 keV) and 131 1(360 keV) .
For each position (I,J), the ippunt rate, the energy spectrum and th ecenter of gravity in camera coordinates were determined . Decay correctio nwas performed . This operation was repeated at every point on a regula rlattice of points in table coordinates . The count rate for each measuremen twas about 2000 cps .
The precision of the determination of the center of gravity was studied .Limited optimally by the integral linearity of the gamma camera-compute rADC ' s (of the order of 0 .1%) reproducibility of the order of 0 .1% wa sobtained . This corresponds to a precision of about 1/5 of a pixel when th ematrix is displayed in 256 x 256, or of the order of 0 .3mm for the largefield of view TOSHIBA . This precision was obtained from a sample of 500 0counts, but did not vary rapidly as a function of total counts . For 2 Kto 100 K counts very little difference was observed . Typically, all themeasures described in this paper were made with 5 K counts .
The size of the point source did not significantly affect the precisio nof this measure and although a highly collimated point source was use doriginally, this was later replaced by an ' uncollimated ' point source o f'l .5 cm in diameter . All measurements were made with the collimator i nplace, and at 5 cm separation between pot and collimator .
The count rate was determined by collecting a fixed number of counts anddetermining the time with a precision of 0 .01 sec . The field of the camer awas delimited as that area in which the count rate did not fall below 250 cps .
In order to relate table coordinates (I,J) and camera coordinates (X,Y) ,a calibration was performed . Measurements of the center of gravity of thepoint source at four different points with 100 K counts were made and th efive parameters : angle, scale X, scale Y, origin X, origin Y were determined .Using these values, coordinates in (I,J) could be transformed into (X,Y )and vice-versa, with a precision of the order of 0 .5% . This transformationwas rarely used and the experimental results presented here are independen tof this calibration .
Various sampling sizes were used being from one point per mm up to on epoint per 20 mm. The total time varies strongly as a function of samplin gsize, being from "2O minutes for a very coarse grid tc several hours for avery fine grid ( .hen the isotope is decaying) .
Rather than storing the complete spectrum at every point, the pea kvalue was determined with a precision of 1/256 and stored .
-362-
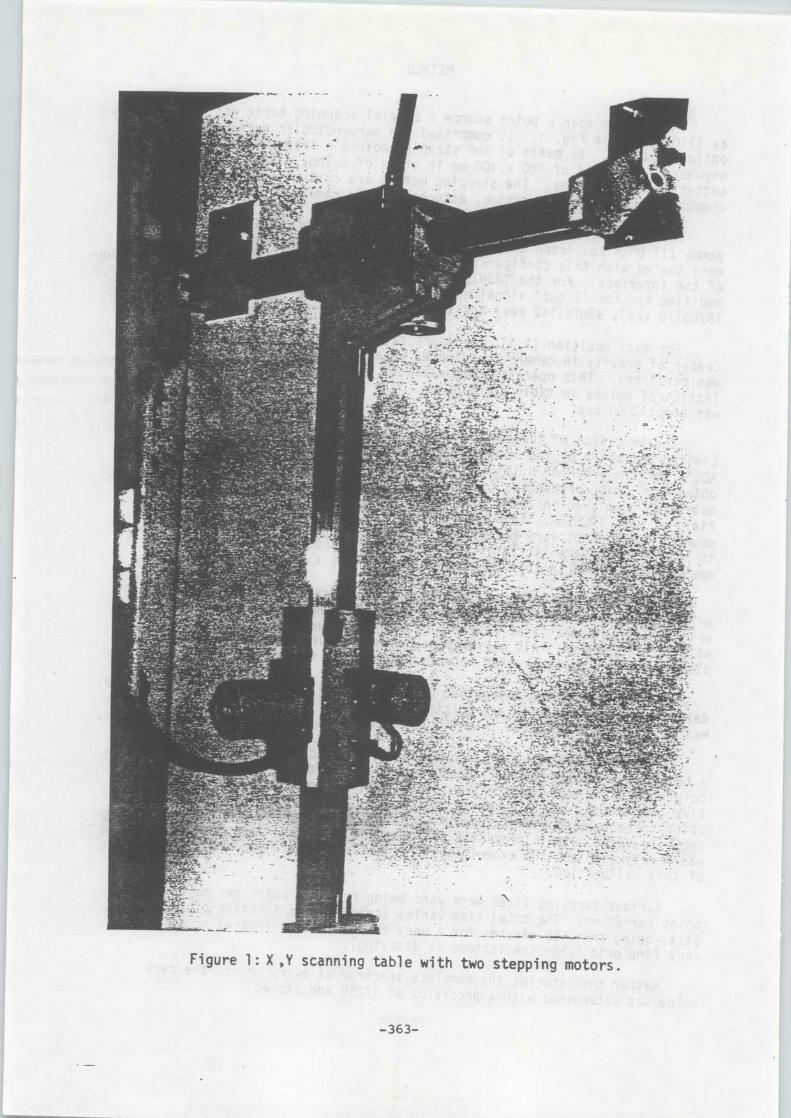
.."
'
1
.
.
4
'.'.
'6fi.,li
,
'.
,
$;yl
.'
..!
0
L.
.;e,
..
;..
.
,%,
:
.y
, ,
—h,
:
.
'r-.'v)t
Itt
''t,
ltl
tJ'L
.Ili.
,14
, '
.,
L.
iy
.
".
•4,
,
,,
31,
A
f'„!tem
..;i
.',,,
j
(
(..'
'
.
',li
y
."
'.
.
'yiN
:rt
,':,.
o,
."
,,
,
"
1,1‘
t:9.il
..,;;r
t.,
'
.'.
'
?
''vik
:,,
,f tht: .,
.
,.t,
;
6,`r-
.f'
'y
...,
„-',l'
4.
...'A
L,.
:
'6,
,•
,
,$
4
to.
.
31:4
.
.
.
,
.,
,.",,
.;..
..;
'
'
.
?;'
::,
..
.
-
,.;..n-
'
.1%t''
.
.
.:
k
....,mn0
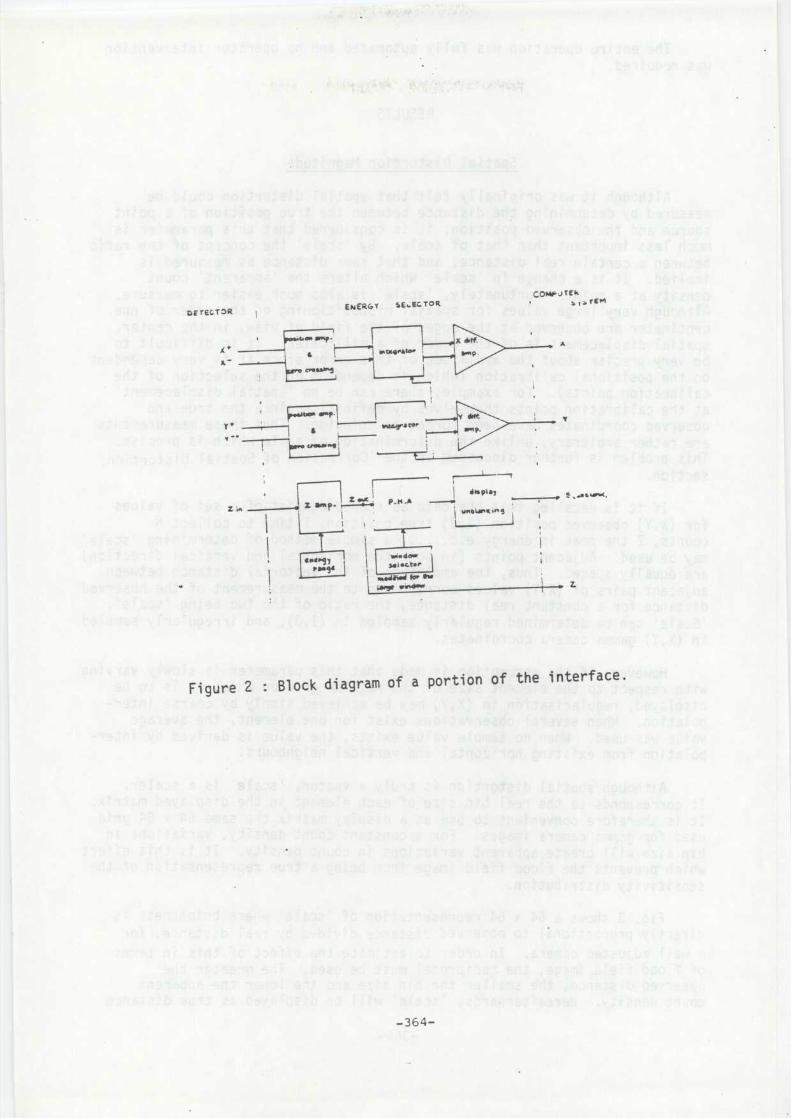
DETECTORENERGY SE,ECT OR
GOMPuTEk
tom map.
LWt..," COP
Z amp . Z wt ; p .N . A
tir:w dew/ytl acto r
.wenii ieii for Ir»
Ls.$t winaew
twt~y
L
1 displayE , ..turc ,
v++O~+K ir+ eZ in
Figure 2
Block diagram of a portion of the interface .
-364
The entire operation was fully automated and no operator interventio nwas required .
RESULTS
Spatial Distortion Magnitud e
Although it was originally felt that spatial distortion could bemeasured by determining the distance between the true position of a poin tsource and the observed position, it is considered that this parameter i smuch less important than that of scale . By 'scale' the concept of the rati obetween a certain real distance, and that same distance as measured i simplied . It is a change in 'scale' which alters the 'apparent' coun tdensity at a point . Fortunately, 'scale' is also much easier to measure .Although very large values for spatial mispositioning of the order of onecentimeter are observed at the edges of the field of view, in the center ,spatial displacement is of the order of a millimeter . It is difficult tobe very precise about the amplitude of this error since it is very dependen ton the positional calibration (which is dependent on the selection of thecalibration points) . For example, there can be no 'spatial displacement 'at the calibration points themselves by definition since the true andobserved coordinates have been forced to coincide . Thus these measurement sare rather arbitrary, unlike the determination of scale which is precise .This problem is further discussed in the ' Correction of Spatial Distortion 'section .
If it is recalled that the data as stored consist of a set of valuesfor (X,Y) observed position (I,J) true position, T time to collect Ncounts, Z the peak in energy etc a simple method of determining 'scale 'may be used . Adjacent points (in both the horizontal and vertical direction )are equally spaced . Thus, the amplitude of the vectorial distance betweenadjacent pairs of (X,Y) values corresponds to the measurement of the observeddistance for a constant real distance, the ratio of the two being 'scale' .' Scale ' can be determined regularly sampled in (I,J), and irregularly sample din (X,Y) gamma camera coordinates .
However, if the assumption is made that this parameter is slowly varyin gwith respect to the element size of the regular grid on which it is to bedisplayed, regularisation in (X,Y) may be achieved simply by coarse inter-polation . When several observations exist for one element, the averagevalue was used . When no sample value exists, the value is derived by inter-polation from existing horizontal and vertical neighbours .
Although spatial distortion is truly a vector, 'scale' is a scaler .It corresponds to the real bin size of each element in the displayed matrix .It is therefore convenient to use as a display matrix the same 64 x 64 gri dused for gamma camera images . For a constant count density, variations i nbin size will create apparent variations in count density . It is this effec twhich prevents the flood field image from being a true representation of thesensitivity distribution .
Fig . 3 shows a 64 x 64 representation of ' scale' where brightness i sdirectly proportional to observed distance divided by real distance, fo ra well adjusted camera . In order to estimate the effect of this in term sof flood field image, the reciprocal must be used . The greater th eobserved distance, the smaller the bin size and the lower the apparen tcount density . Hereafterwards, ' scale ' will be displayed as true distanc e
-365-
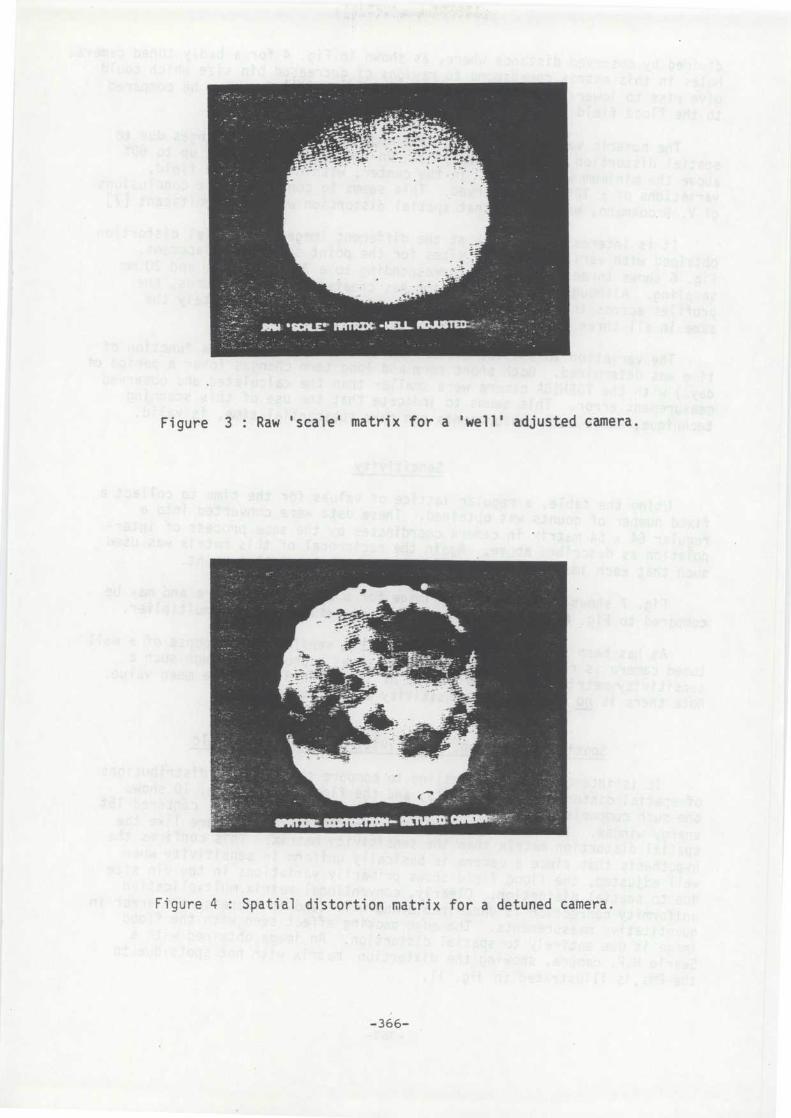
Figure 3 : Raw 'scale ' matrix for a 'well' adjusted camera .
Figure 4 : Spatial distortion matrix for a detuned camera .
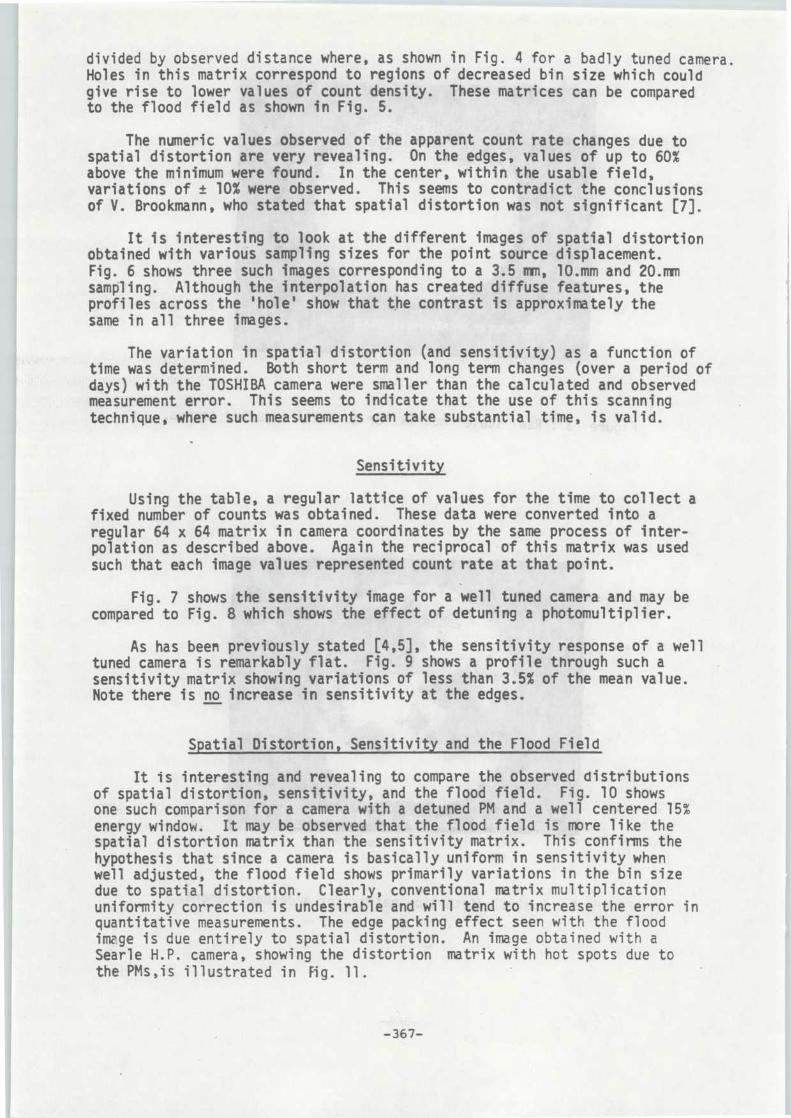
divided by observed distance where, as shown in Fig . 4 for a badly tuned camera .Holes in this matrix correspond to regions of decreased bin size which coul dgive rise to lower values of count density . These matrices can be comparedto the flood field as shown in Fig . 5 .
The numeric values observed of the apparent count rate changes due t ospatial distortion are very revealing . On the edges, values of up to 60 %above the minimum were found . In the center, within the usable field ,variations of ± 10% were observed . This seems to contradict the conclusion sof V . Brookmann, who stated that spatial distortion was not significant [7 ] .
It is interesting to look at the different images of spatial distortio nobtained with various sampling sizes for the point source displacement .Fig . 6 shows three such images corresponding to a 3 .5 mm, l0 .mm and 20 .mmsampling . Although the interpolation has created diffuse features, th eprofiles across the 'hole' show that the contrast is approximately th esame in all three images .
The variation in spatial distortion (and sensitivity) as a function o ftime was determined . Both short term and long term changes (over a period o fdays) with the TOSHIBA camera were smaller than the calculated and observe dmeasurement error . This seems to indicate that the use of this scannin gtechnique, where such measurements can take substantial time, is valid .
Sensitivity
Using the table, a regular lattice of values for the time to collect afixed number of counts was obtained . These data were converted into aregular 64 x 64 matrix in camera coordinates by the same process of inter-polation as described above . Again the reciprocal of this matrix was usedsuch that each image values represented count rate at that point .
Fig . 7 shows the sensitivity image for a well tuned camera and may b ecompared to Fig . 8 which shows the effect of detuning a photomul ti pl i er .
As has been previously stated [4,5], the sensitivity response of a wel ltuned camera is remarkably flat . Fig . 9 shows a profile through such asensitivity matrix showing variations of less than 3 .5% of the mean value .Note there is no increase in sensitivity at the edges .
Spatial Distortion, Sensitivity and the Flood Fiel d
It is interesting and revealing to compare the observed distribution sof spatial distortion, sensitivity, and the flood field . Fig . 10 showsone such comparison for a camera with a detuned PM and a well centered 15 %energy window . It may be observed that the flood field is more like th espatial distortion matrix than the sensitivity matrix . This confirms thehypothesis that since a camera is basically uniform in sensitivity whenwell adjusted, the flood field shows primarily variations in the bin siz edue to spatial distortion . Clearly, conventional matrix multiplicationuniformity correction is undesirable and will tend to increase the error i nquantitative measurements . The edge packing effect seen with the floo dimage is due entirely to spatial distortion . An image obtained with aSearle H.P . camera, showing the distortion matrix with hot spots due tothe PMs,is illustrated in fig . 11 .
-367-
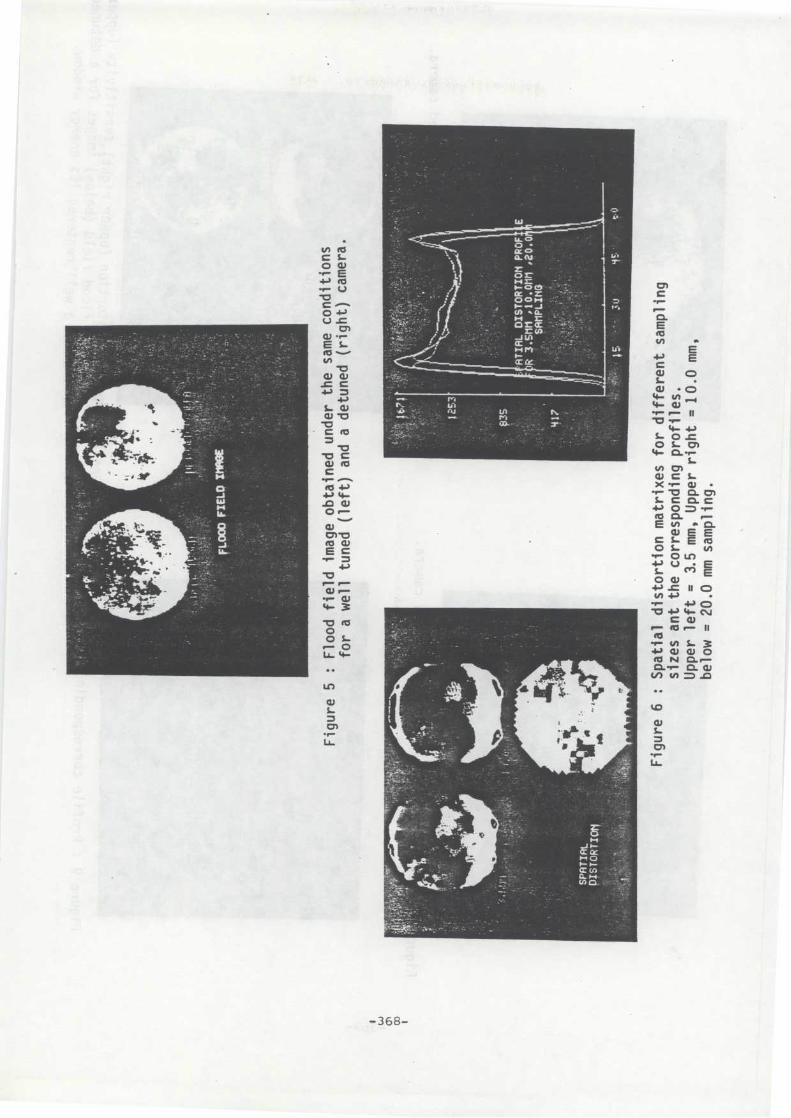
Fig
ure
5
Flo
odfield
image o
bta
ined u
nder
the s
am
e c
onditi
on
sfo
r a w
ell
tuned
(left)
and a
detu
ned
(rig
ht)
cam
era
.
1253
R 3
.SnM
,i0
.ON1
1.2
0.0
..`,
, . S
AM
PLI
NG
X35
Fig
ure
6
Spatial
dis
tort
ion
matr
ixes
for
diffe
rent
sam
plin
gsiz
es a
nt th
e c
orr
espondin
gpro
file
s.
Upp
erle
ft=
3.5
mm
, U
pper
right
= 1
0.0
mm
,belo
w =
20
.0 m
m s
ampl
ing
.
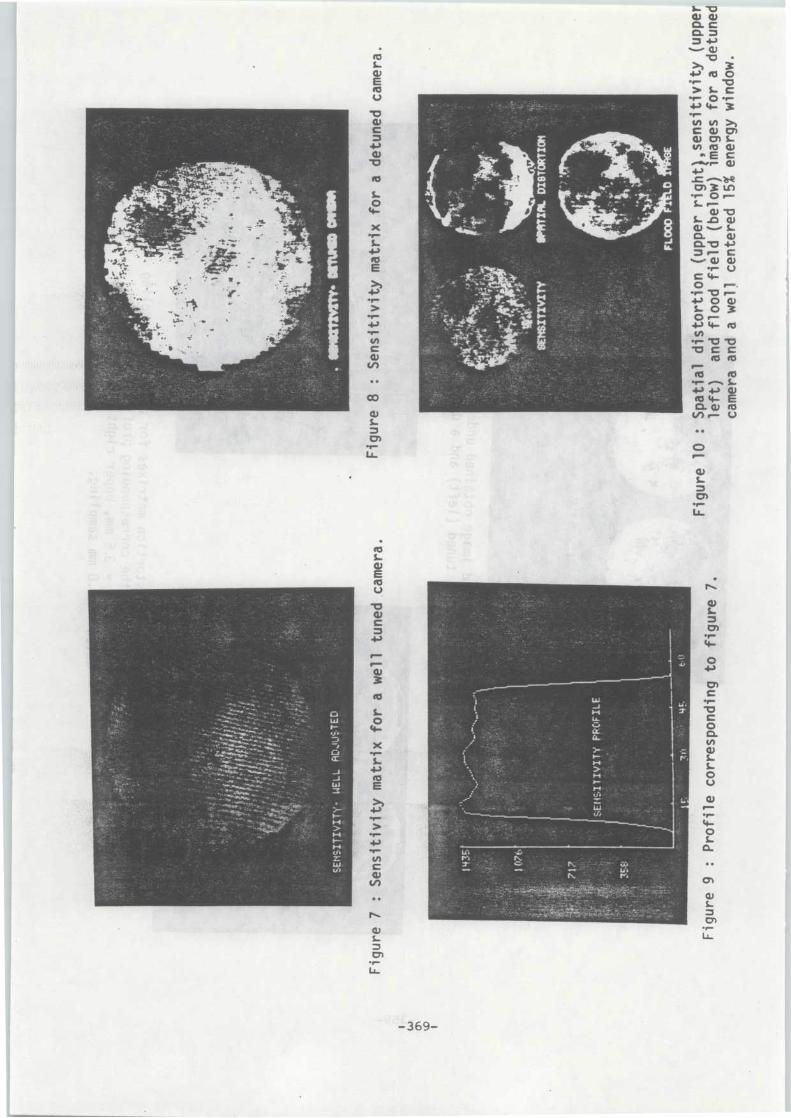
Fig
ure
7
Sensi
tivity
matr
ix f
or
a w
ell
tuned c
am
era
.
Fig
ure
8
Sensi
tivity
matr
ix f
or
a d
etu
ned c
am
era
.
Fig
ure
10 S
patia
l dis
tort
ion (
upper
right)
,sensitiv
ity
(upp
er
left
)an
d flo
odfield
(bel
ow)
imag
es fo
r a
detu
ned
cam
era
and
a w
ell c
ente
red
15%
ene
rgy
win
dow
.F
igur
e 9
Pro
file c
orr
esp
ondin
g t
o f
igure
7.
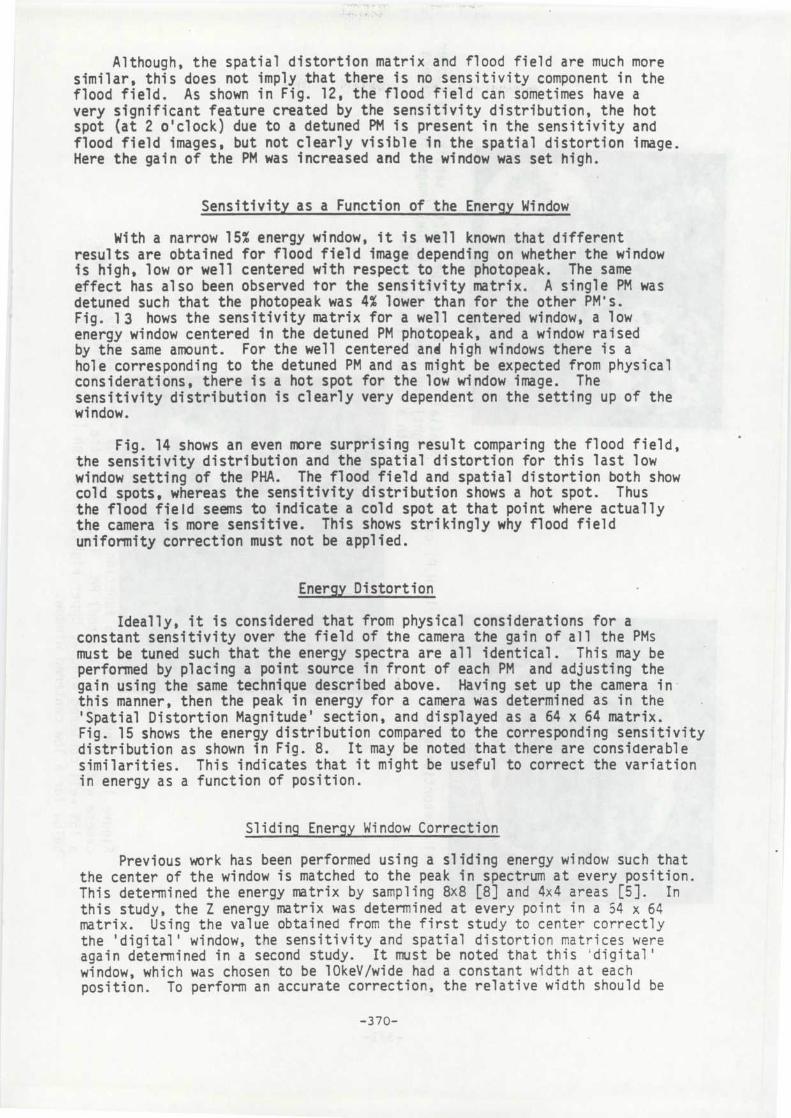
Although, the spatial distortion matrix and flood field are much mor esimilar, this does not imply that there is no sensitivity component in th eflood field . As shown in Fig . 12, the flood field can sometimes have avery significant feature created by the sensitivity distribution, the hotspot (at 2 o'clock) due to a detuned PM is present in the sensitivity an dflood field images, but not clearly visible in the spatial distortion image .Here the gain of the PM was increased and the window was set high .
Sensitivityas a Function of theEnergy Window
With a narrow 15% energy window, it is well known that differen tresults are obtained for flood field image depending on whether the windo wis high, low or well centered with respect to the photopeak . The sameeffect has also been observed for the sensitivity matrix . A single PM wa sdetuned such that the photopeak was 4% lower than for the other PM's .Fig . 13 hows the sensitivity matrix for a well centered window, a lo wenergy window centered in the detuned PM photopeak, and a window raise dby the same amount . For the well centered and high windows there is ahole corresponding to the detuned PM and as might be expected from physica lconsiderations, there is a hot spot for the low window image . Th esensitivity distribution is clearly very dependent on the setting up of th ewindow .
Fig . 14 shows an even more surprising result comparing the flood field ,the sensitivity distribution and the spatial distortion for this last lowwindow setting of the PHA. The flood field and spatial distortion both showcold spots, whereas the sensitivity distribution shows a hot spot . Thusthe flood field seems to indicate a cold spot at that point where actuall ythe camera is more sensitive . This shows strikingly why flood fiel duniformity correction must not be applied .
Energy Distortio n
Ideally, it is considered that from physical considerations for aconstant sensitivity over the field of the camera the gain of all the PM smust be tuned such that the energy spectra are all identical . This may beperformed by placing a point source in front of each PM and adjusting thegain using the same technique described above . Having set up the camera i nthis manner, then the peak in energy for a camera was determined as in the' Spatial Distortion Magnitude ' section, and displayed as a 64 x 64 matrix .Fig . 15 shows the energy distribution compared to the corresponding sensitivitydistribution as shown in Fig . 8 . It may be noted that there are considerabl esimilarities . This indicates that it might be useful to correct the variatio nin energy as a function of position .
Sliding Energy Window Correctio n
Previous work has been performed using a sliding energy window such tha tthe center of the window is matched to the peak in spectrum at every position .This determined the energy matrix by sampling 8x8 [8] and 4x4 areas [5] . I nthis study, the Z energy matrix was determined at every point in a 54 x 6 4matrix . Using the value obtained from the first study to center correctl ythe 'digital' window, the sensitivity and spatial distortion matrices wereagain determined in a second study . It must be noted that this 'digital 'window, which was chosen to be 10kev/wide had a constant width at eac hposition . To perform an accurate correction, the relative width should be
-370-
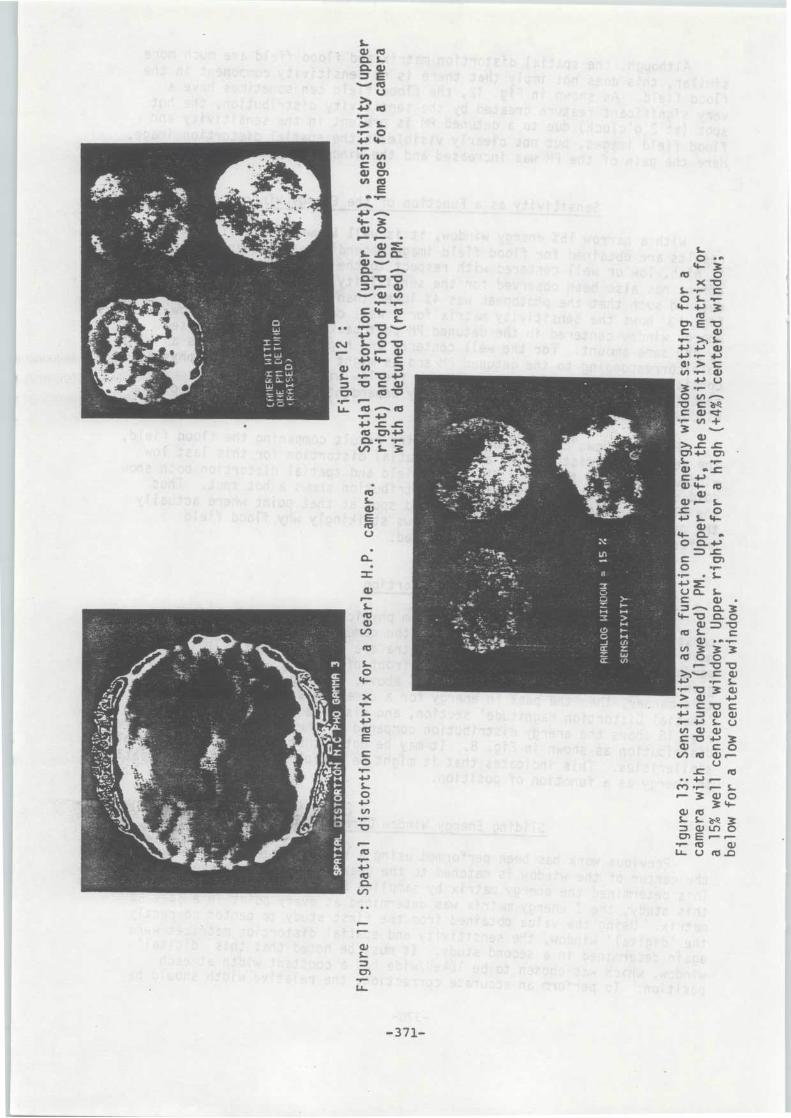
Fig
ure
12
Spatia
ldis
tort
ion
(upp
erle
ft),
sensitiv
ity
(upp
er
right)
and flo
od
field
(belo
w)
images
for
a c
am
era
with
a d
etu
ned (
rais
ed)
PM
.
Fig
ure
13
:S
ensitiv
ity
as a
function o
f th
e e
nerg
y w
indow
sett
ing f
or
aca
mera
with
a d
etu
ned (
low
ere
d)
PM
. U
pper
left,
the
sensitiv
ity
matr
ix fo
ra
15%
wel
l cen
tere
d w
indo
w; U
pper
right,
for
a h
igh (
+4
q)
cent
ered
win
dow
;belo
w for
a lo
w c
ente
red w
indow
.
Fig
ure
11
Spatia
ldis
tort
ion
matr
ix f
or
a S
earl
e H
.P. c
amer
a.
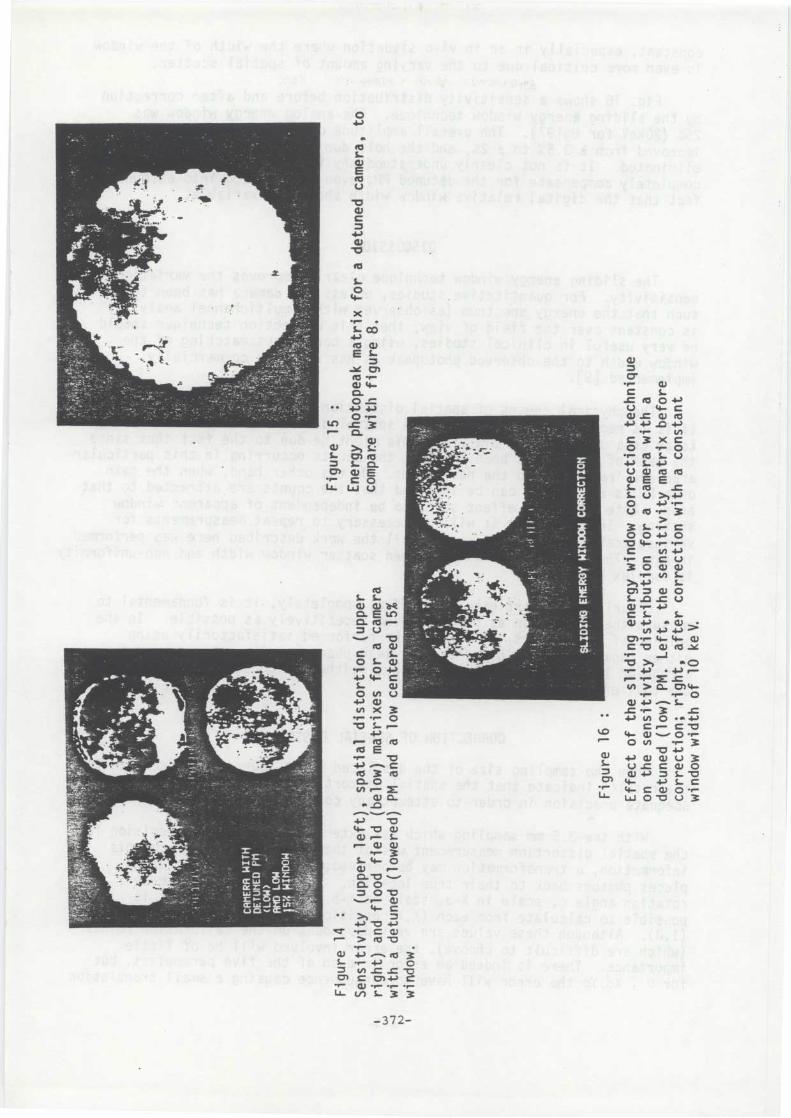
Fig
ure
15
Energ
y p
hoto
peak m
atr
ix for
a d
etu
ned c
am
era
, t o
com
pare
with
figure
8.
Fig
ure
14
Sensitiv
ity
(upper
left),
spatial
dis
tort
ion
(upp
er
right)
and f
lood
field
(belo
w)
matr
ixes
for
a ca
mer
aw
ith a
detu
ned (
low
ere
d)
PM
and a
low
cente
red 1
5%
win
dow
.
Fig
ure
16
Eff
ect
of
the
slid
ing
energ
y w
indow
corr
ection techniq
ue
on t
he
sensitiv
ity
dis
trib
ution
for
a c
am
era
with
adetu
ned (
low
) P
M.
Left,
the
sensitiv
ity
matr
ix b
efo
recorr
ection
;ri
ght,
after
corr
ection
with a
consta
nt
win
dow
wid
th o
f 10 k
e V
.
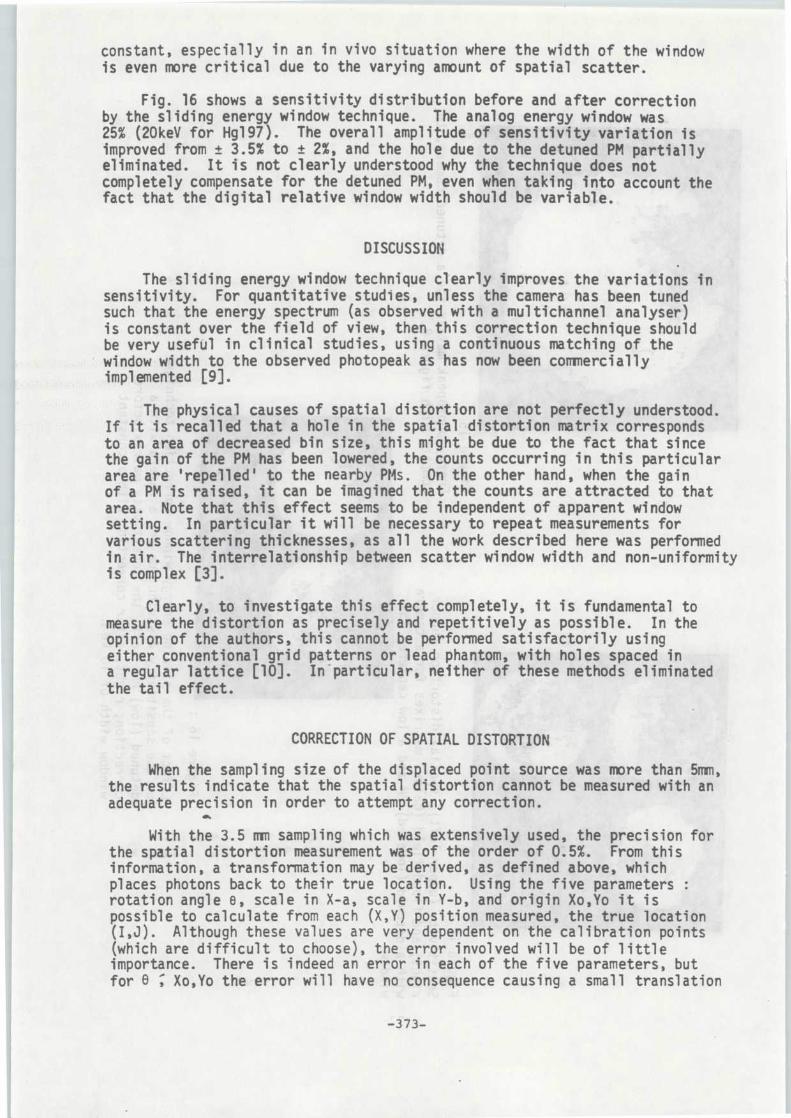
constant, especially in an in vivo situation where the width of the windo wis even more critical due to the varying amount of spatial scatter .
Fig . 16 shows a sensitivity distribution before and after correctio nby the sliding energy window technique . The analog energy window wa s25% (20keV for Hg197) . The overall amplitude of sensitivity variation i simproved from ± 3 .5% to ± 2%, and the hole due to the detuned PM partiall yeliminated . It is not clearly understood why the technique does notcompletely compensate for the detuned PM, even when taking into account thefact that the digital relative window width should be variable .
DISCUSSION
The sliding energy window technique clearly improves the variations i nsensitivity . For quantitative studies, unless the camera has been tunedsuch that the energy spectrum (as observed with a multichannel analyser )is constant over the field of view, then this correction technique shoul dbe very usefùl in clinical studies, using a continuous matching of th ewindow width to the observed photopeak as has now been commerciall yimplemented [9] .
The physical causes of spatial distortion are not perfectly understood .If it is recalled that a hole in the spatial distortion matrix correspond sto an area of decreased bin size, this might be due to the fact that sinc ethe gain of the PM has been lowered, the counts occurring in this particula rarea are 'repelled' to the nearby PMs . On the other hand, when the gai nof a PM is raised, it can be imagined that the counts are attracted to tha tarea . Note that this effect seems to be independent of apparent windowsetting . In particular it will be necessary to repeat measurements forvarious scattering thicknesses, as all the work described here was performedin air . The interrelationship between scatter window width and non-uniformityis complex [3] .
Clearly, to investigate this effect completely, it is fundamental t omeasure the distortion as precisely and repetitively as possible . In theopinion of the authors, this cannot be performed satisfactorily usingeither conventional grid patterns or lead phantom, with holes spaced i na regular lattice [10] . In'particular, neither of these methods eliminate dthe tail effect .
CORRECTION OF SPATIAL DISTORTIO N
When the sampling size of the displaced point source was more than 5mm ,the results indicate that the spatial distortion cannot be measured with anadequate precision in order to attempt any correction .
With the 3 .5 mm sampling which was extensively used, the precision fo rthe spatial distortion measurement was of the order of 0 .5% . From thi sinformation, a transformation may be derived, as defined above, whichplaces photons back to their true location . Using the five parameters :rotation angle e, scale in X-a, scale in Y-b, and origin Xo,Yo it i spossible to calculate from each (X,Y) position measured, the true location(I,J) . Although these values are very dependent on the calibration point s(which are difficult to choose), the error involved will be of littl eimportance . There is indeed an error in each of the five parameters, bu tfor e ; Xo,Yo the error will have no consequence causing a small translation
-373-
or rotation while for parameters a and b the error will just be a globa lchange of scale in the transformed image .
Thus, the only real problem being how to "place" the photons in thei rtrue location . Error due to truncation related to the variable size 6f the(X,Y) cells must be avoided . A weighted or randomized redistribution ,comparable to a 4 x 4 point filter of the 256 x 256 matrix could solvethis ' problem, but no practical results have yet been obtained . Followingthis, a correction of the sensitivity variations could be attempte dalthough it is likely to be of little value since the errors involved aresmall, and the errors involved in the correction may not improve th esituation . A full correction involves use of the information of th esensitivity matrix and of the tails of the point source response a tevery position .
CONCLUSION
The problem of correcting non-uniformities in the gamma camera i snot trivial . The work that has been presented here has enabled on emajor step forward to be made, that of measuring accurately the parameter sconcerned, rather than extracting them from other indirect observations .A whole series of questions can now be answered . It is possible toobserve the variation in spatial distortion as a function of energy ,setting up the gamma camera etc . . . which has not been possible before . I tis also possible to relate precisely the sensitivity distribution wit hthe energy and spatial resolution local variation . From this information ,methods can be proposed for the successive elimination of the major cause sof non-uniformity . Nevertheless these corrections seem less important ,since the quantitative errors are in fact small, than the now mor eattainable understanding of the physical phenomena involved and it sconsequences on routine situation behaviour, and its implementation i nthe design of camera systems .
,
REFERENCE S
1. E . Oberhausen, K .J . Neumann, W .Schiffler, Methods for adjusting the AngerCamera, Proc . Symp . 'ledical Radioisotope Scintigraphy, I .A .E.A ., Vienna1 (1969) 145 .
2. E .M . Smith, On methods for normalisin . the response of the Anger Camer aimaging system, 'roc . Symp . Quantitative Irgan
sua isation in 'uc ea r'ledicine (Kenny P .J ., Smith E .M ., eds) Univ . of Miami Press, Coral Gable sFla (1971) 261 .
3. T .N . Padikal, A . Astiare, J .G .Kereiakes, Field flooduniformity correction :benefits orpitfalls ? J . Nucl .Med . 17 (1976) 653 .
4. F .Erbsmann, J . Paternot, A . Piepsz, Sensibilité etHomogênéité,'Proc . Symp .La Fixation Rénale du Mercure et du DMSA (Raynaud C . ed) C .E .A ., Orsay ,France (1976) 28 .
5. A . Todd-Pokropek, F . Erbsmann, F . Soussaline, The non-uniformity o fimaging devicesandits impactin quantitative studies, Proc . Int . Symp .on Medical Radionuclide Imaging, Los Angeles, 1976 .
-374-
6. B .R . Pullan, Personnal Communication .
7. V.A . Brookman, Spatial distortions in gamma camera images related tocounting rate, window width, collimator and collimator orientation(Abstract), J . Nuci . Med . 14 (197 3) 383 .
8. P . George, C . Raynaud, F . Soussaline, Correction automatique de l adépendance en position de l'énergie ; Proc . Symp . La Fixation Rénal edu mercure et du DMSA, (Raynaud C ., ed .) C .E .A ., Orsay France (1976 )45 .
9. Picker Corporation, Commercial Exhibit, SNM annual conference (1977) .
10. G . Muehllehner, Radiation Imaging Device, U .S .Patent, 3, 745, 345(July 10,7 3) .

PUBLICATION
IV
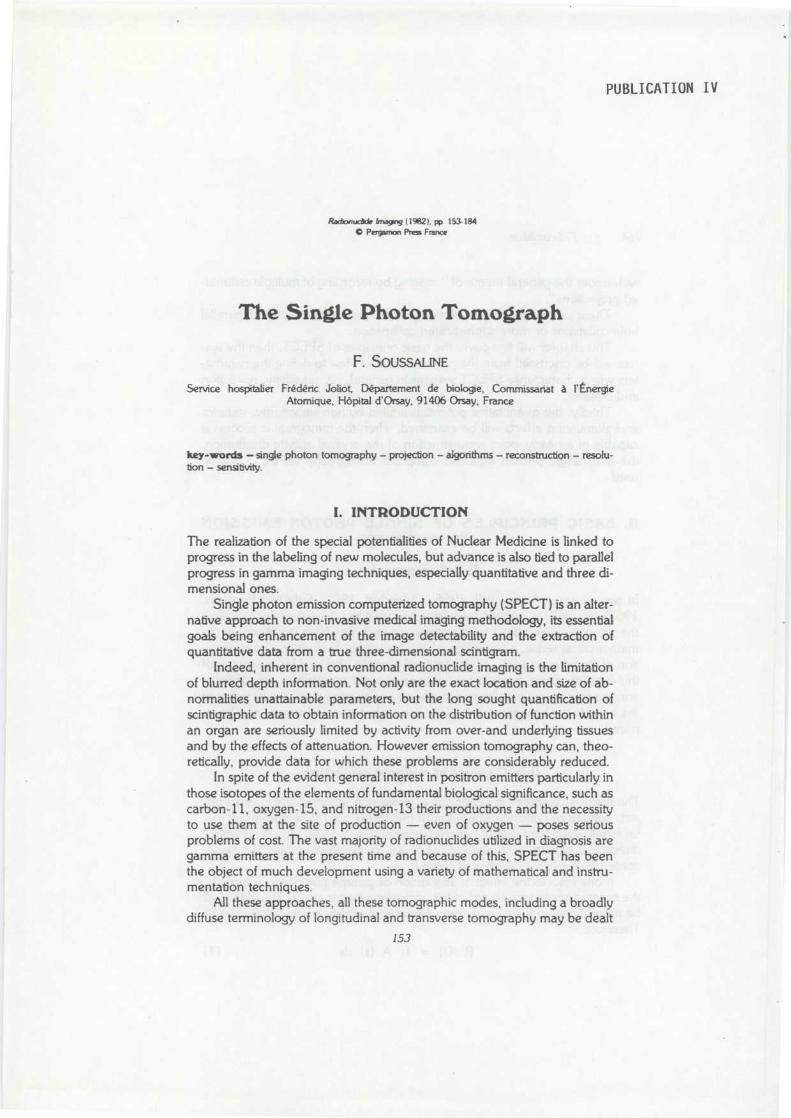
PUBLICATION I V
Radionudde Imaging ( 1982) . pp 153. 1840 Pergamar Press France
The Single Photon Tomograph
F. SOUSSALINE
Service hospitalier Frédéric Joliot, Département de biologie, Commissariat à l'Énergi eAtomique, Hôpital d'Orsay, 91406 Orsay, France
key-words — single photon tomography — projection — algorithms — reconstruction — resolu-tion — sensitivity.
1 . INTRODUCTIO N
The realization of the special potentialities of Nuclear Medicine is linked t oprogress in the labeling of new molecules, but advance is also tied to paralle lprogress in gamma imaging techniques, especially quantitative and three di-mensional ones .
Single photon emission computerized tomography (SPECT) is an alter-native approach to non-invasive medical imaging methodology, its essentia lgoals being enhancement of the image detectability and the extraction o fquantitative data from a true three-dimensional scintigram .
Indeed, inherent in conventional radionuclide imaging is the limitationof blurred depth information . Not only are the exact location and size of ab -normalities unattainable parameters, but the long sought quantification o fscintigraphic data to obtain information on the distribution of function withi nan organ are seriously limited by activity from over-and underlying tissuesand by the effects of attenuation . However emission tomography can, theo-retically, provide data for which these problems are considerably reduced .
In spite of the evident general interest in positron emitters particularly i nthose isotopes of the elements of fundamental biological significance, such a scarbon-11, oxygen-15, and nitrogen-13 their productions and the necessityto use them at the site of production — even of oxygen — poses seriou sproblems of cost. The vast majority of radionuclides utilized in diagnosis aregamma emitters at the present time and because of this, SPECT has beenthe object of much development using a variety of mathematical and instru-mentation techniques .
All these approaches, all these tomographic modes, including a broadl ydiffuse terminology of longitudinal and transverse tomography may be deal t
153
154
F Soussaline
with under the general theme of " imaging by recording of multiple collimat -ed projections ".
These projections may consist of quite conventional images with paralle lhole collimator or more sophisticated collimation .
This chapter will first cover the basic principles of SPECT, then the sys -tem will be discussed from the physical point of view to define the parame-ters which characterize SPECT systems in general, viz, sensitivity, resolutio nand contrast.
Thirdly, the quantitative potentials limited by non-stationarity, statistic sand attenuation effects will be examined, when the tomographic process iscapable of a nearly exact reconstruction of the original activity distribution ,the term single photon emission computer tomography (SPECT) will b eused.
H. BASIC PRINCIPLES OF SINGLE PHOTON EMISSIONTOMOGRAPHY
II.1 Tomography
In several areas, (Bracewell, 1956 ; Oldendorf, 1961 ; Kuhl and Edwards ,1963) especially in nuclear medicine and radiology, it is necessary to inducethe structure of an object from a series of projections from the object In th emathematical sense, a projection of N dimensional function is a transforma-tion of the latter as a (N - 1) dimensional function obtained by integration o fthis function along a particular direction . Strictly speaking, a conventionalscintigraphic image may be considered as a projection along the direction o fthe holes in the collimator, only if the tissue absorption of gamma rays be ig -nored.
11 .2 Concept of multiple projectio n
The figure 1 illustrates the concepts of projection schematically . Let an ob-ject/volume of uniform distribution of radioactivity A (s) be distributed in auniformly absorbant milieu. Let only those photons arising from A (s) whosedirection is parallel to D, and perpendicular to the plane of detection be re -corded by a perfect detector in plane P .
If one ignores the effect of absorption of gamma photons in volume V ,the number of photons recorded (ph at the intersection point of D and P, willbe proportional to the sum of the increments of activity emitted along line D .Therefore :
P (D) = fi A isl ds
(1)
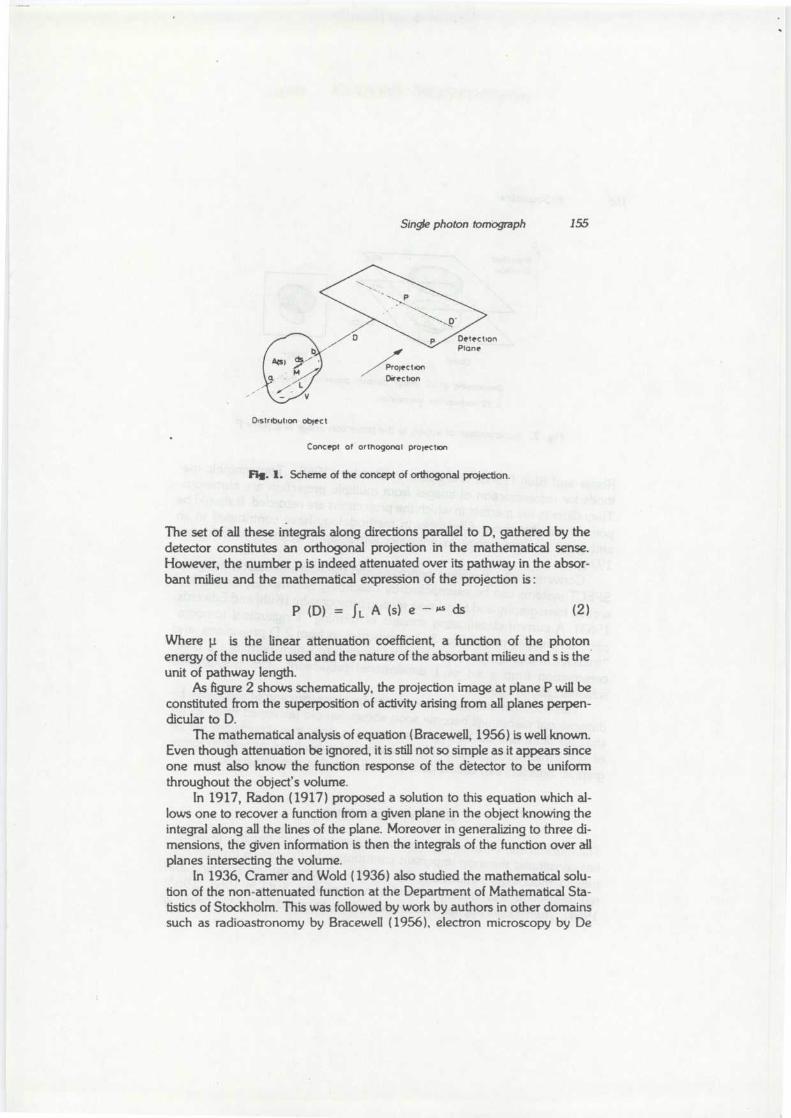
Single photon tomograph
155
Distribution objec t
Concept of orthogonal projection
Fig. 1 . Scheme of the concept of orthogonal projection .
The set of all these integrals along directions parallel to D, gathered by thedetector constitutes an orthogonal projection in the mathematical sense .However, the number p is indeed attenuated over its pathway in the absor-bant milieu and the mathematical expression of the projection is :
P (D) = fL A (s) e – *s ds
(2 )
Where p. is the linear attenuation coefficient, a function of the photo nenergy of the nuclide used and the nature of the absorbant milieu and s is th eunit of pathway length .
As figure 2 shows schematically, the projection image at plane P will beconstituted from the superposition of activity arising from all planes perpen-dicular to D .
The mathematical analysis of equation (Bracewell, 1956) is well known .Even though attenuation be ignored, it is still not so simple as it appears sinceone must also know the function response of the detector to be unifor mthroughout the object's volume .
In 1917, Radon (1917) proposed a solution to this equation which al -lows one to recover a function from a given plane in the object knowing th eintegral along all the lines of the plane . Moreover in generalizing to three di-mensions, the given information is then the integrals of the function over al lplanes intersecting the volume.
In 1936, Cramer and Wold (1936) also studied the mathematical solu-tion of the non-attenuated function at the Department of Mathematical Sta-tistics of Stockholm . This was followed by work by authors in other domain ssuch as radioastronomy by Bracewell (1956), electron microscopy by De
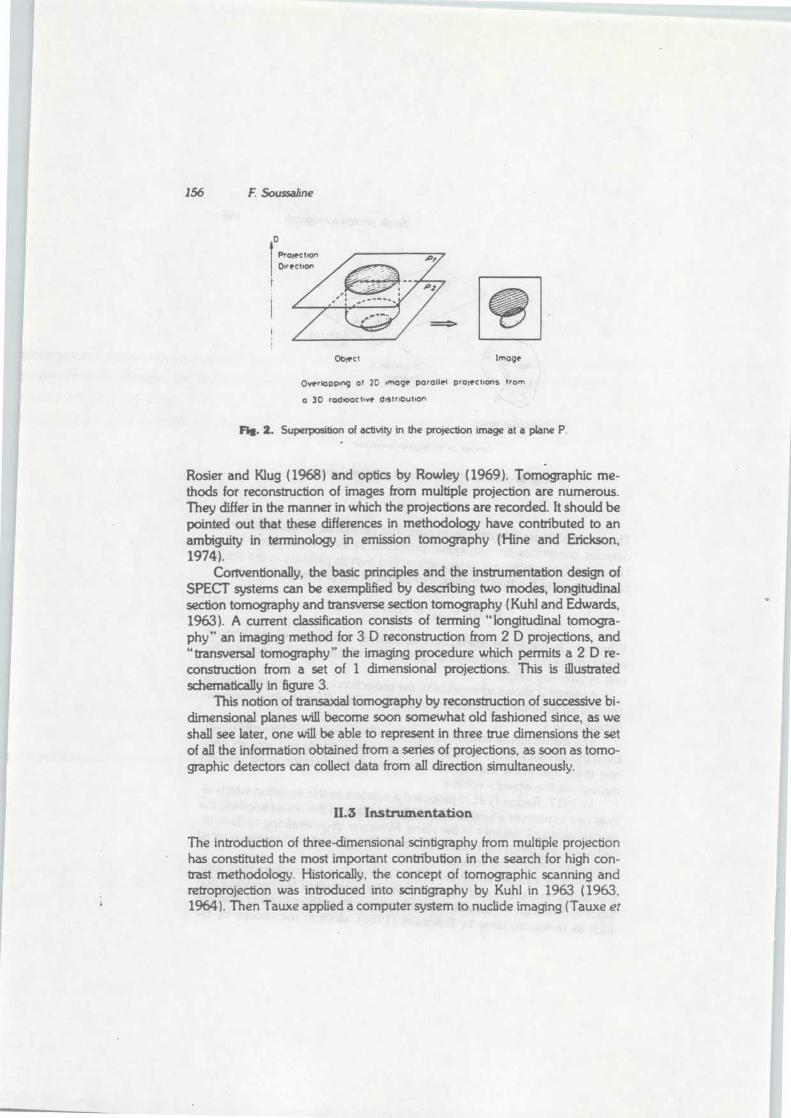
156
F Soussaline
Ob ►ec t
Image
Overlapping of 20 image parallel projections from
a 3D radioactive distribution
N. 2. Superposition of activity in the projection image at a plane P .
Rosier and Klug (1968) and optics by Rowley (1969) . Tomographic me-thods for reconstruction of images from multiple projection are numerous.They differ in the manner in which the projections are recorded . It should bepointed out that these differences in methodology have contributed to a nambiguity in terminology in emission tomography (Hine and Erickson,1974) .
Conventionally, the basic principles and the instrumentation design ofSPECT systems can be exemplified by describing two modes, longitudinalsection tomography and transverse section tomography (Kuhl and Edwards,1963). A current classification consists of terming "longitudinal tomogra-phy" an imaging method for 3 D reconstruction from 2 D projections, an d"transversal tomography " the imaging procedure which permits a 2 D re -construction from a set of 1 dimensional projections . This is illustratedschematically in figure 3 .
This notion of transaxial tomography by reconstruction of successive bi -dimensional planes will become soon somewhat old fashioned since, as weshall see later, one will be able to represent in three true dimensions the se tof all the information obtained from a series of projections, as soon as tomo -graphic detectors can collect data from all direction simultaneously.
II .3 Instrumentatio n
The introduction of three-dimensional scintigraphy from multiple projectio nhas constituted the most important contribution in the search for high con-trast methodology . Historically, the concept of tomographic scanning andretroprojection was introduced into scintigraphy by Kuhl in 1963 (1963 ,1964) . Then Tauxe applied a computer system to nuclide imaging (Tauxe et
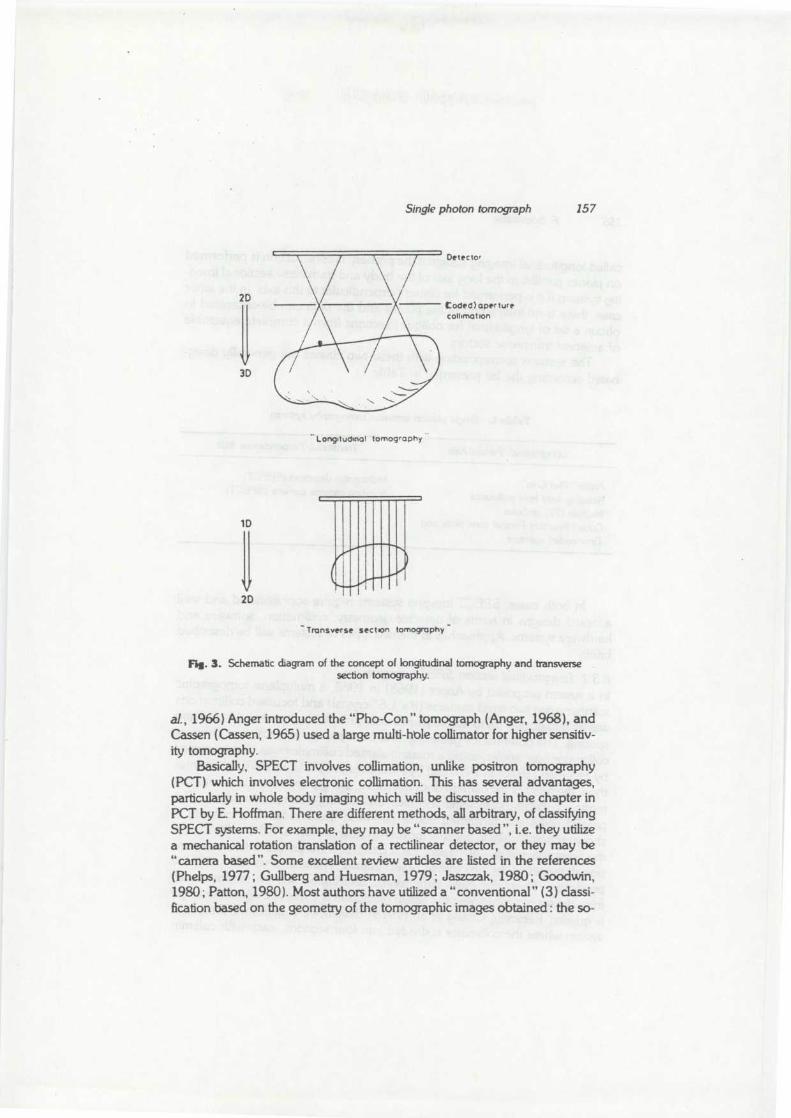
Single photon tomograph
15 7
Detecto r
Coded) aper tur cCollimation
Long+tud'nal tomography -
- Transverse section tomograph y
Fig . 3 . Schematic diagram of the concept of longitudinal tomography and transversesection tomography.
al., 1966) Anger introduced the "Pho-Con " tomograph (Anger, 1968), an dCassen (Cassen, 1965) used a large multi-hble collimator for higher sensitiv -ity tomography .
Basically, SPECT involves collimation, unlike positron tomograph y(PCT) which involves electronic collimation . This has several advantages ,particularly in whole body imaging which will be discussed in the chapter i nPCT by E. Hoffman . There are different methods, all arbitrary, of dassifyingSPECT systems . For example, they may be " scanner based ", i .e . they utilizea mechanical rotation translation of a rectilinear detector, or they may b e"camera based " . Some excellent review articles are listed in the reference s(Phelps, 1977 ; Gullberg and Huesman, 1979 ; Jaszczak, 1980 ; Goodwin ,1980 ; Patton, 1980) . Most authors have utilized a "conventional" (3) dassi-fication based on the geometry of the tomographic images obtained : the so-
2 D
V3 D
1 D
V2D
158
F. Soussaiine
called longitudinal imaging system if the primary reconstruction is performe don planes parallel to the long axis of the body and transverse sectional imag-ing systems if it is performed for planes perpendicular to this axis . In the lattercase, there is no interaction of the planes and the data can be organized t oobtain a set of longitudinal (or oblique) sections from a complete ensembl eof adjacent transverse sectors.
The systems corresponding with these two classes are generally desig-nated according the list presented in Table 1 :
Table L Single photon emission tomography systems
Longitudinal/Parallel Axis
Transaxial/Perpendicular Axi s
Anger "Pho Con "
Mulbcrystal detectors (SPECT )Rotating slant hole collimator
Rotating gamma camera (SPECT)Multiple (77) pinholesCoded Aperture Fresnel zone plate ringTime coded aperture
In both cases, SPECT imaging systems require sophisticated and welladapted designs in terms of detector geometry, collimation, software an dhardware systems. Approaches to the two types of systems will be describe dbriefly.
R3.1 Longitudinal section SPECT systemsIn a system proposed by Anger (1968) in 1968, a multiplane tomographicscanner using two small cameras (8 x 1 .5" crystal) and focussed collimationswas able to display up to twelve planes with variable thickness and interplanespacing. The potential for gathering data from parallel projection at differentcollimator hole angles, using a rotating slanted collimator was demonstrate dby Freeman (1970) in 1970 and by Muehllehner (1970) in 1970 . In this me-thod, the head of the camera does not move, but the collimator is in constan tmotion, collecting data within a conical area during a complete rotation . Theparallel holes are all slanted about 25o from the vertical. The concept isshown schematically in figure 4 for two angular positions of the collimator i nthe horizontal plane, 180° apart. Each position corresponds to two superim-posed images of the two shifted object planes. The shift is variable with th eprojection. Thus, the three dimensional distribution will be reconstructe dfrom the set of projections ; the depth resolution is improved when the angl eis greater . Recently, Chang et al. (1975) developed a quadrant slant hol esystem where the collimator is divided into four sections, each with collima-
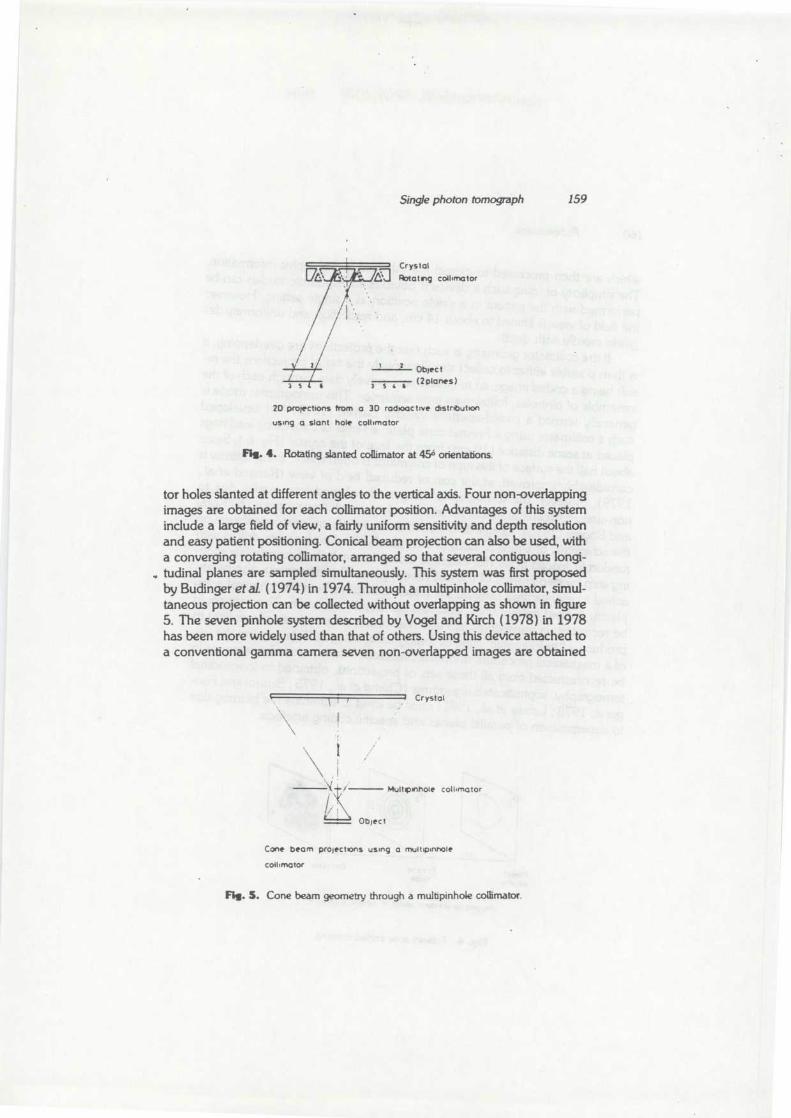
Single photon tomograph
159
Crystal
Rotating collimator
y
' Objec ts c t (2 planes )
2D protections from a 3D radioactive distribution
using a slant hole collimator
Fig . 4. Rotating slanted collimator at 456 orientations.
tor holes slanted at different angles to the vertical axis . Four non-overlappingimages are obtained for each collimator position. Advantages of this syste minclude a large field of view, a fairly uniform sensitivity and depth resolutionand easy patient positioning . Conical beam projection can also be used, witha converging rotating collimator, arranged so that several contiguous longi-tudinal planes are sampled simultaneously . This system was first proposedby Budinger et al. (1974) in 1974. Through a multipinhole collimator, simul -taneous projection can be collected without overlapping as shown in figur e5. The seven pinhole system described by Vogel and Kirch (1978) in 197 8has been more widely used than that of others . Using this device attached toa conventional gamma camera seven non-overlapped images are obtained
Crysta l
- Multipinhole collimato r
Objec t
Cone beam projections using a multipinhol e
collimator
Fig . S. Cone beam geometry through a multipinhole collimator .
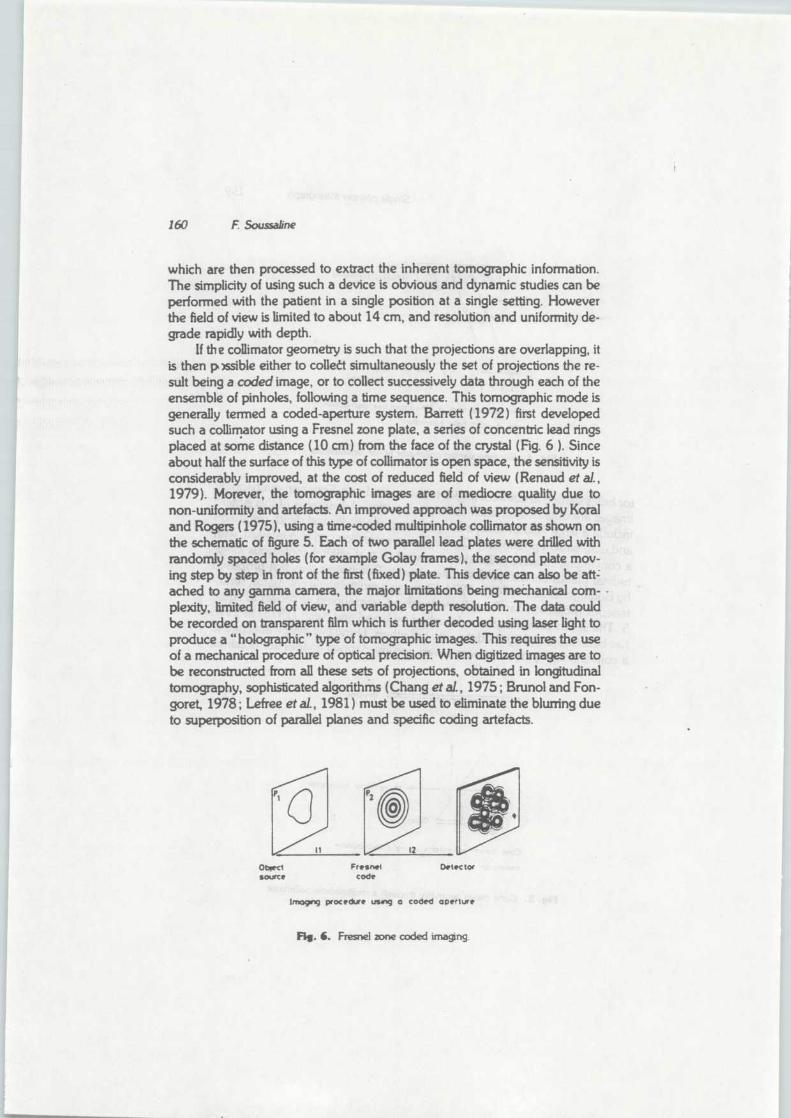
160
F. Soussaline
which are then processed to extract the inherent tomographic information .The simplicity of using such a device is obvious and dynamic studies can b eperformed with the patient in a single position at a single setting . Howeverthe field of view is limited to about 14 cm, and resolution and uniformity de -grade rapidly with depth .
If th e collimator geometry is such that the projections are overlapping, itis then p Issible either to collet simultaneously the set of projections the re-sult being a coded image, or to collect successively data through each of th eensemble of pinholes, following a time sequence . This tomographic mode i sgenerally termed a coded-aperture system . Barrett (1972) first developedsuch a collimator using a Fresnel zone plate, a series of concentric lead ring splaced at some distance (10 cm) from the face of the crystal (Fig . 6 ) . Sinceabout half the surface of this type of collimator is open space, the sensitivity i sconsiderably improved, at the cost of reduced field of view (Renaud et al. ,1979). Morever, the tomographic images are of mediocre quality due tonon-uniformity and artefacts . An improved approach was proposed by Kora land Rogers (1975), using a time-coded multipinhole collimator as shown o nthe schematic of figure 5 . Each of two parallel lead plates were drilled withrandomly spaced holes (for example Golay frames), the second plate mov-ing step by step in front of the first (fixed) plate . This device can also be att.ached to any gamma camera, the major limitations being mechanical com-plexity, limited field of view, and variable depth resolution. The data couldbe recorded on transparent film which is further decoded using laser light t oproduce a " holographic " type of tomographic images . This requires the useof a mechanical procedure of optical precision . When digitized images are tobe reconstructed from all these sets of projections, obtained in longitudinaltomography, sophisticated algorithms (Chang et al., 1975 ; Brunol and Fon -goret, 1978 ; Lefree et al., 1981 ) must be used to eliminate the blurring dueto superposition of parallel planes and specific coding artefacts .
Ob,ectsource
Fresnelcode
Detector
lmogrig procedure using a coded aperture
Fig. i. Fresnel zone coded imaging .
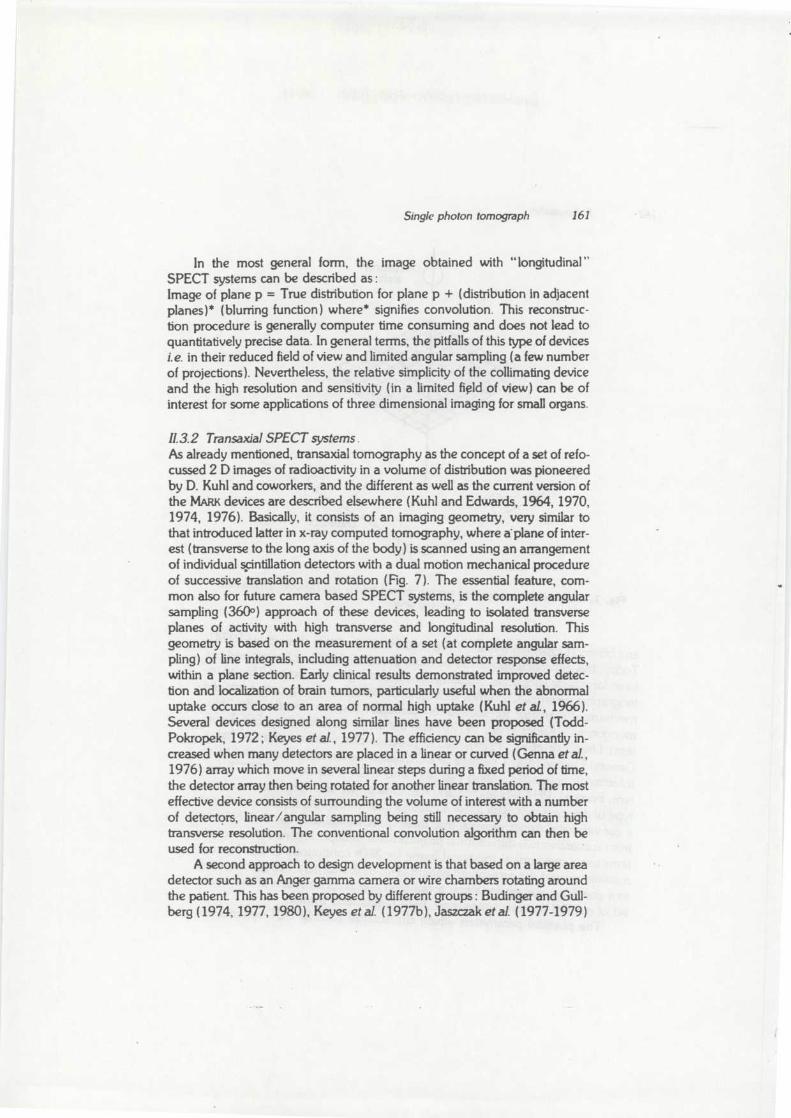
Single photon tomograph
16 1
In the most general form, the image obtained with "longitudinal "SPECT systems can be described as :Image of plane p = True distribution for plane p + (distribution in adjacentplanes)* (blurring function) where* signifies convolution . This reconstruc-tion procedure is generally computer time consuming and does not lead t oquantitatively precise data . In general terms, the pitfalls of this type of device sLe . in their reduced field of view and limited angular sampling (a few numbe rof projections) . Nevertheless, the relative simplicity of the collimating devic eand the high resolution and sensitivity (in a limited fi?ld of view) can be o finterest for some applications of three dimensional imaging for small organs .
11.3.2 Transaxial SPECT systems .As already mentioned, transaxial tomography as the concept of a set of refo -cussed 2 D images of radioactivity in a volume of distribution was pioneeredby D. Kuhl and coworkers, and the different as well as the current version o fthe MARK devices are described elsewhere (Kuhl and Edwards, 1964, 1970,1974, 1976) . Basically, it consists of an imaging geometry, very similar tothat introduced latter in x-ray computed tomography, where aplane of inter-est (transverse to the long axis of the body) is scanned using an arrangemen tof individual scintillation detectors with a dual motion mechanical procedureof successive translation and rotation (Fig . 7) . The essential feature, com-mon also for future camera based SPECT systems, is the complete angula rsampling (360°) approach of these devices, leading to isolated transverseplanes of activity with high transverse and longitudinal resolution . Thi sgeometry is based on the measurement of a set (at complete angular sam-pling) of line integrals, including attenuation and detector response effects ,within a plane section. Early clinical results demonstrated improved detec-tion and localization of brain tumors, particularly useful when the abnormaluptake occurs close to an area of normal high uptake (Kuhl et al., 1966) .Several devices designed along similar lines have been proposed (Todd-Pokropek, 1972 ; Keyes et al., 1977) . The efficiency can be significantly in-creased when many detectors are placed in a linear or curved (Genna et al. ,1976) array which move in several linear steps during a fixed period of time ,the detector array then being rotated for another linear translation. The mosteffective device consists of surrounding the volume of interest with a numbe rof detectors, linear /angular sampling being still necessary to obtain hig htransverse resolution . The conventional convolution algorithm can then beused for reconstruction.
A second approach to design development is that based on a large areadetector such as an Anger gamma camera or wire chambers rotating aroun dthe patient This has been proposed by different groups : Budinger and Gull -berg (1974, 1977, 1980), Keyes et al. (1977b), Jaszczak et al. (1977-1979)
162
F Soussahne
Fis . 7. Successive translation and rotation motion for the first (MARK) tomographi cscanning device . .
and others (Oppenheim et al. , 1976 ; Muehllehner, 1968 ; Kay et al., 1974) .Today, this approach appears to be more practical, flexible, cheaper and ha sbeen largely developed as " rotating conventional gamma camera " based to-mographic systems. Currently, a number of manufacturers propose rotatin gmechanical structure for scintillation cameras : Siemens-Searle (the " Hu-mongotron " (Keyes et al., 1977b) and the single-dual headed SPECT sys-tem) (Jaszczak et al., 1979), SELO (Societa Ellectronica Labarda, Italy) ,General Electric (400 T camera SPECT system) eventually connected to a nInformatek computer system (46, 47) and CGR (Acticamera SPECT sys-tem, France), PHILIPS and SCINTAG. One of the essential features of thistype of device is th a t , with a low additional cost for the rotational capability o fa conventional Anger camera, true three-dimensional data can be obtainedfrom successive two dimensional projections at multiple angles. All these sys -tems use a mechanical rotational frame for 3600 continuous or step by ste protation around the recumbant patient (Fig . 8) the camera being connecte dto a computer system for a line acquisition and reconstruction of the whol eset of parallel sections (transverse, then sagittal and frontal) .
The physical parameters which characterize such SPECT systems, to-
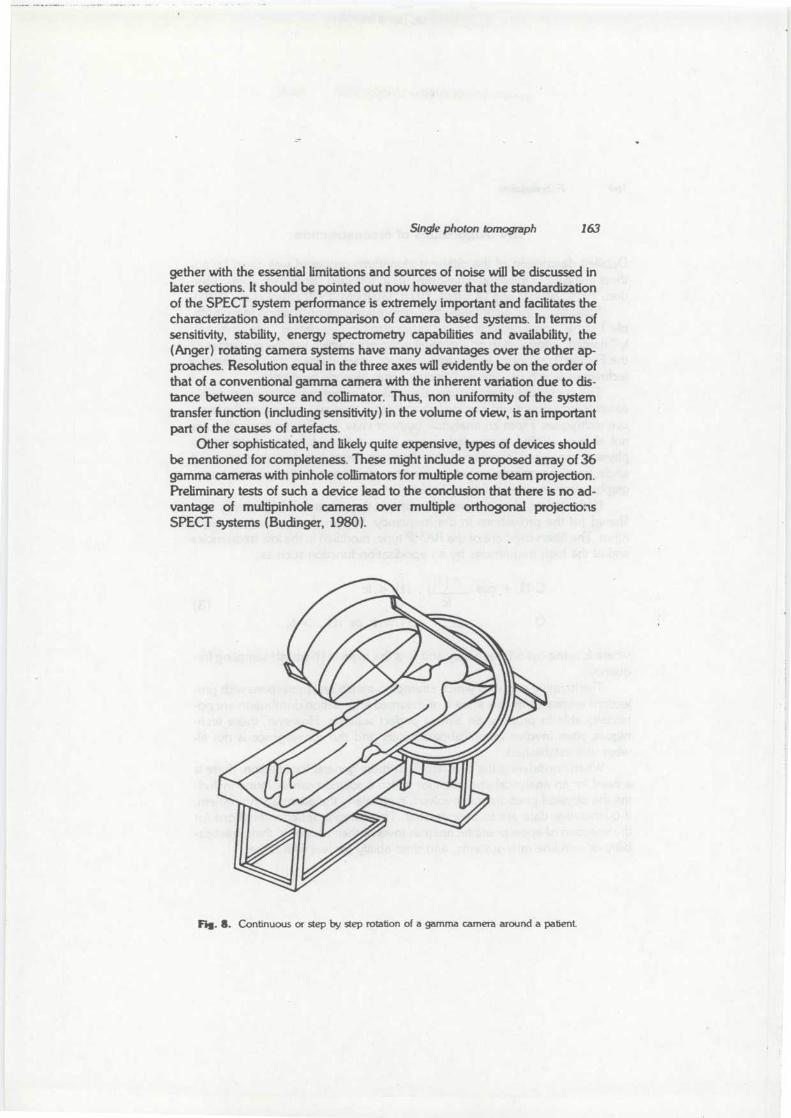
Single photon tomograph
163
gether with the essential limitations and sources of noise will be discussed i nlater sections. It should be pointed out now however that the standardizationof the SPECT system performance is extremely important and facilitates th echaracterization and intercomparison of camera based systems . In terms ofsensitivity, stability, energy spectrometry capabilities and availability, th e(Anger) rotating camera systems have many advantages over the other ap-proaches. Resolution equal in the three axes will evidently be on the order o fthat of a conventional gamma camera with the inherent variation due to dis -tance between source and collimator . Thus, non uniformity of the syste mtransfer function (including sensitivity) in the volume of view, is an importantpart of the causes of artefacts .
Other sophisticated, and likely quite expensive, types of devices shoul dbe mentioned for completeness . These might include a proposed array of 36gamma cameras with pinhole collimators for multiple come beam projection.Preliminary tests of such a device lead to the conclusion that there is no ad -vantage of multipinhole cameras over multiple orthogonal projection sSPECT systems (Budinger, 1980) .
Fag . S. Continuous or step by step rotation of a gamma camera around a patient
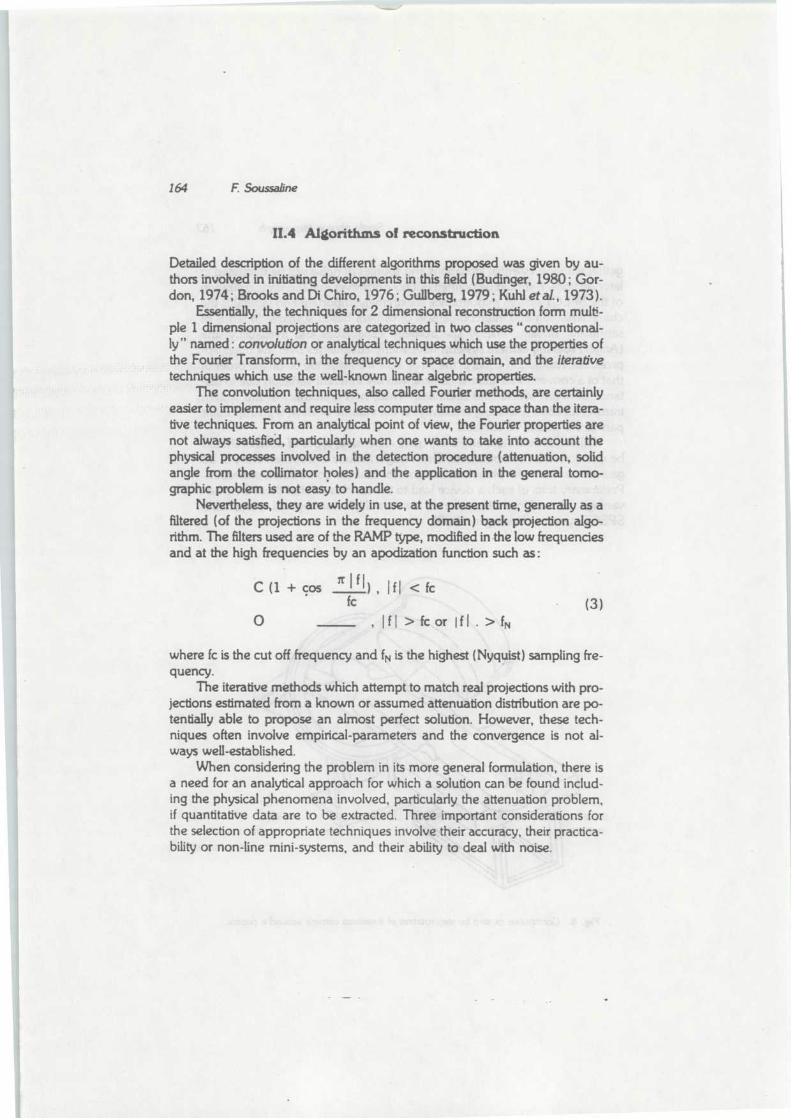
164
F. Soussalin e
II .4 Algorithms of reconstruction
Detailed description of the different algorithms proposed was given by au-thors involved in initiating developments in this field (Budinger, 1980 ; Gor-don, 1974 ; Brooks and Di Chiro, 1976 ; Gullberg, 1979 ; Kuhl et al., 1973) .
Essentially, the techniques for 2 dimensional reconstruction form mult-ple 1 dimensional projections are categorized in two classes "conventional-ly" named : convolution or analytical techniques which use the properties o fthe Fourier Transform, in the frequency or space domain, and the itera tivetechniques which use the well-known linear algebric properties .
The convolution techniques, also called Fourier methods, are certainl yeasier to implement and require less computer time and space than the itera-tive techniques. From an analytical point of view, the Fourier properties ar enot always satisfied, particularly when one wants to take into account th ephysical processes involved in the detection procedure (attenuation, soli dangle from the collimator holes) and the application in the general tomo -graphic problem is not easy to handle .
Nevertheless, they are widely in use, at the present time, generally as afiltered (of the projections in the frequency domain) back projection algo-rithm. The filters used are of the RAMP type, modified in the low frequencie sand at the high frequencies by an apodization function such as :
:.Li) , ifl < fcfc
O
fl > fc or I f I .> fN
C (1 + ços(3 )
where k is the cut off frequency and fN is the highest (Nyquist) sampling fre-quency .
The iterative methods which attempt to match real projections with pro-jections estimated from a known or assumed attenuation distribution are po-tentially able to propose an almost perfect solution . However, these tech -niques often involve empirical-parameters and the convergence is not al-ways well-established.
When considering the problem in its more general formulation, there i sa need for an analytical approach for which a solution can be found includ-ing the physical phenomena involved, particularly the attenuation problem ,if quantitative data are to be extracted. Three important considerations fo rthe selection of appropriate techniques involve their accuracy, their practica-bility or non-line mini-systems, and their ability to deal with noise .
Single photon tomograph
165
III. PHYSICAL FACTORS CHARACTERIZING
SPECT SYSTEMS
In order to standardize specification tests, acceptance tests and, in broade rsense, quality control procedures in routine situations (see chapter on qualitycontrol by A .E. Todd Pokropek in this book), one must define the physicalcharacteristics of the SPECT system and the procedures that should be usedto evaluate them . System sensitivity and spatial resolution are generally con -sidered as the major parameters that characterize an imaging "conventional "system, but they are by no means sufficient for SPECT systems . It is impor-tant to indicate that, for camera based SPECT systems most of the main pa-rameters studies for a conventional camera (resolution, sensitivity, uniformi -ty, field of view, spatial distortion, linearity, energy resolution) are adequat eto test for tomographic specification but these should be redefined an dadapted specifiquely to SPECT systems . One of the major differences lies i nthe fact that all types of "non-uniformity" in the conventional imaging devic ewill be considerably amplified by a tomographic camera system . In additionto the well recognized adverse effects that field non-uniformity has on th eoutput of conventional cameras, there are those brought about by the rota -tion of the camera head itself . Another important point, as will be describe dbelow, is the need to specify the signal to noise ratio or the emitted numbe rof photons for a figure of resolution or contrast Probably, SPECT system sbased on rotating gamma cameras will be widely developed in the near fu-ture and parameters described in detail below concern this type of system .Description and specifications of scanner based systems (specially designe dfor tomographic use) should be sought in the literature (Stoddart, 1979 ;Lassen et al., 1978) .
Essentially, a camera based SPECT system comprises a (large field ofview) camera, or two opposed heads, connected to a mini computer syste mfor controlled acquisition, reconstruction, and display of the data . , The came -ra is mounted on a rotatable gantry, or simple ring, which allows a 360° rev -olution about a recumbant patient, either continuously or step by step corre-sponding to 32, 64 or 128 equi-angular samples. The mean acquisition tim efor each individual "projection" image depends on the injected dose, an dtherefore the statistics required, and eventually any changes of the distribu-tion of the radiopharmaceutical in the patient with time . In general the totalexamination time does not exceed very much that necessary for the conven-tional 4 incident views which are, of course, included in the successive pro-jections . These projections are collected as 64 x 64 or 128 x 128 arrays an dstored on magnetic disc during acquisition . The reconstruction of up to 64contiguous transverse sections is performed using a filtered backprojection i nthe spatial and frequency domain . The filters used are generally ramp filters
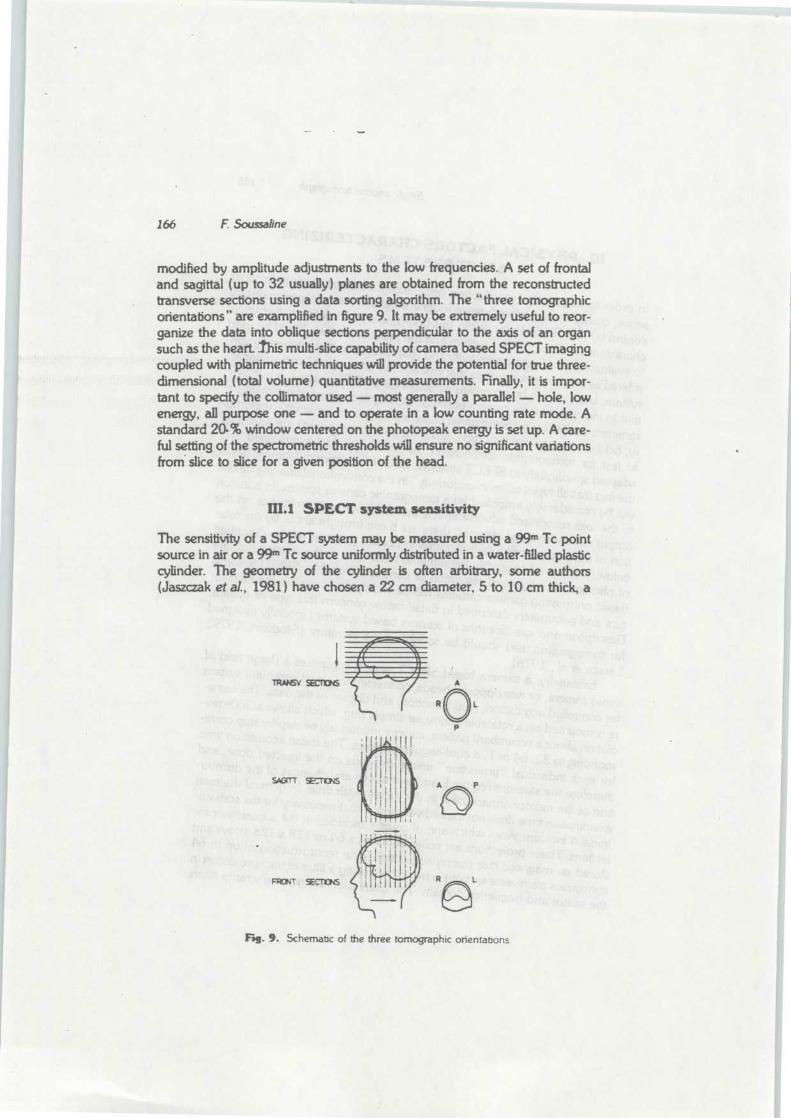
166
F Soussalin e
modified by amplitude adjustments to the low frequencies . A set of frontaland sagittal (up to 32 usually) planes are obtained from the reconstructe dtransverse sections using a data sorting algorithm. The "three tomographicorientations " are exemplified in figure 9 . It may be extremely useful to reor-ganize the data into oblique sections perpendicular to the axis of an organsuch as the heart. This multi-slice capability of camera based SPECT imagin gcoupled with planimetric techniques will provide the potential for true three -dimensional (total volume) quantitative measurements . Finally, it is impor-tant to specify the collimator used — most generally a parallel — hole, lowenergy, all purpose one — and to operate in a low counting rate mode . Astandard 20. % window centered on the photopeak energy is set up . A care-ful setting of the spectrometric thresholds will ensure no significant variation sfrom slice to slice for a given position of the head.
III .1 SPECT system sensitivity
The sensitivity of a SPECT system may be measured using a 99 m Tc pointsource in air or a 99 m Tc source uniformly distributed in a water-filled plasticcylinder. The geometry of the cylinder is often arbitrary, some authors(Jaszczak et al., 1981) have chosen a 22 cm diameter, 5 to 10 cm thick, a
TR»6V SECTIONS
WITT
CPIS
FRONT . SECTION S
F_1g . 9. Schematic of the three tomographic orientations .
Single photon tomograph
16 7
volume which approximately correspond to a large organ (liver) . It has bee nsuggested (Soussaline et al. ) that a thin plane source (no dimension in the Zaxis) should be used in placing a rectangular 13 x 7 cm uniform 9Tc distri-bution parallel to the collimator plane . In these conditions, the sensitivityranges that has generally been measured have been on the order for 5 to 1 2counts .sec- l . 1 Ci-' for extended thin sources or point sources in air (i.e., noattenuation in the medium, no scattering) and on the order of 5 .10 +3 - 7.10 +4 (counts . sec- l .) ( p Ci .cm-3 ) - 1 for extended thick cylinders dependingon source geometry, the specific collimator and whether the system is singl eor dual headed. The latter units are more realistic but assume that one take sinto account precisely the volume geometry of the distribution and the .atte-nuation effects .
The meaning of the sensitivity of the tomographic system is not that o fconventional gamma camera . For a given number of total events detected ,the signal to noise ratio is considerably lower in tomographic than in conven-tional projection images . It is now well established that the root-mean-squar e(rms) noise level in the reconstructed image is not related to the square roo tof the image counts per resolution element as would be expected accordin gto strict Poisson statistics. In practice, an empirical equation, proposed b yBudinger and coworkers (1979) and rederived and tested (Soussaline et al. ,
1979), estimates the % rms noise as a function of the number of resolutioncells n p, the total number of events detected N T and a constant K dependingon the reconstruction method, that is essentially the filter shape and cut of ffrequency :
%rms=KNT112 .np3/4
(4 )
As illustrated in figure 10, which consists of a plot of the % rms as a functio nof total number of counts for a tomographic image of 3 different sizes and aconventional image, many more counts are required in the former (Soussa-line et al., 1980) . As an extension to these calculations, the effect of large at-tenuating (inactive) medium, surrounding the radionuclide source distribu-tion may be estimated for a uniform disc source (Jaszczk et al., 1981) and ageneral equation proposed for % rms including the attenuation factor of th esurrounding medium, the so-called " effective " radius of the attenuatin gsource and a factor due to the attenuation compensation algorithm itself (th efilter factor, as well) .
The relationship between the resolution, the number of events detecte dcorrelated to the system sensitivity and the statistical uncertainty, dearly indi -cates how important it is for a given system resolution to increase, by the de -sign of the instrument itself, the sensitivity, and to reduce, by the use of a nadapted reconstructed method, the noise artefacts .
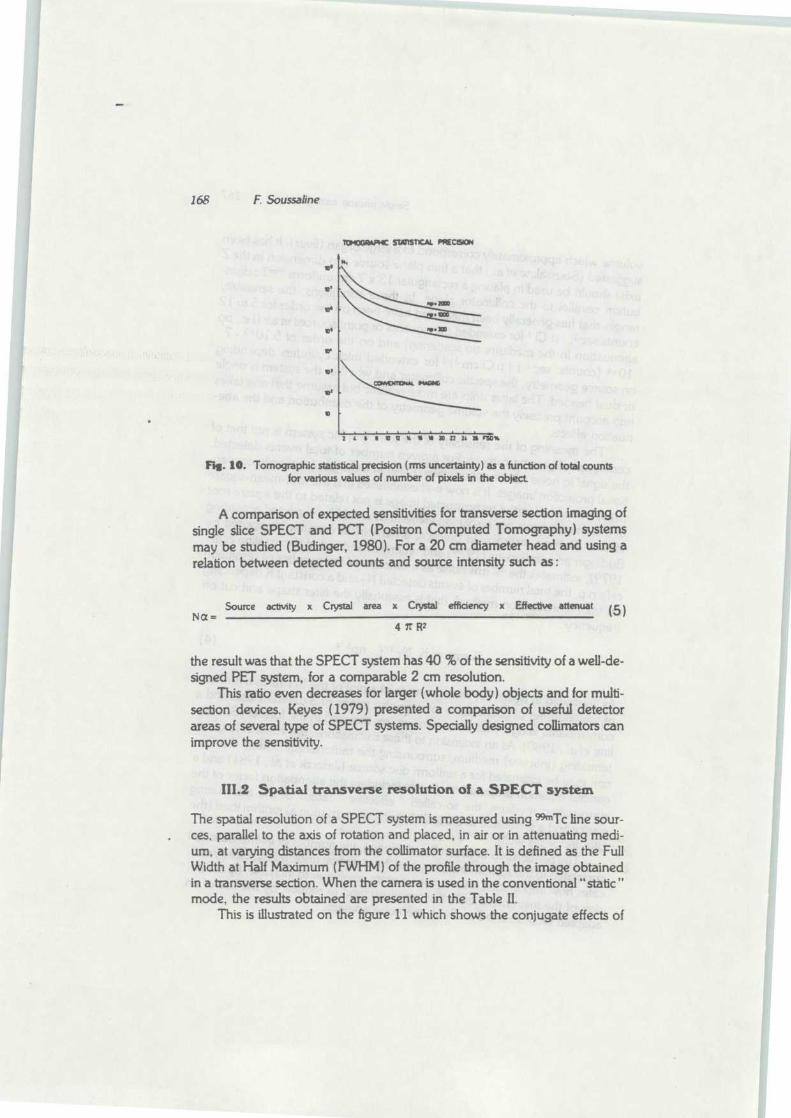
168
F Soussaline
TDP40WaAPH C SWISTICAL PRECISION
ou
e,
e'
v,
e,
i t i• o Q rt s r m n 2t a MGs
Fig . 10 . Tomographic statistical precision (rms uncertainty) as a function of total count sfor various values of number of pixels in the object .
A comparison of expected sensitivities for transverse section imaging ofsingle slice SPECT and PCT (Positron Computed Tomography) systemsmay be studied (Budinger, 1980) . For a 20 cm diameter head and using arelation between detected counts and source intensity such as :
Source activity x Crystal area x Crystal efficiency x Effective attenuat (5 )Na—
4 71' R2
the result was that the SPECT system has 40 % of the sensitivity of a well-de -signed PET system, for a comparable 2 cm resolution .
This ratio even decreases for larger (whole body) objects and for multi -section devices. Keyes (1979) presented a comparison of useful detectorareas of several type of SPECT systems . Specially designed collimators ca nimprove the sensitivity.
III .2 Spatial transverse resolution of a SPECT system
The spatial resolution of a SPECT system is measured using 'Tc line sour -ces, parallel to the axis of rotation and placed, in air or in attenuating medi-urn, at varying distances from the collimator surface . It is defined as the Ful lWidth at Half Maximum (FWHM) of the profile through the image obtaine din a transverse section . When the camera is used in the conventional "static "mode, the results obtained are presented in the Table II .
This is illustrated on the figure 1 1 which shows the conjugate effects of
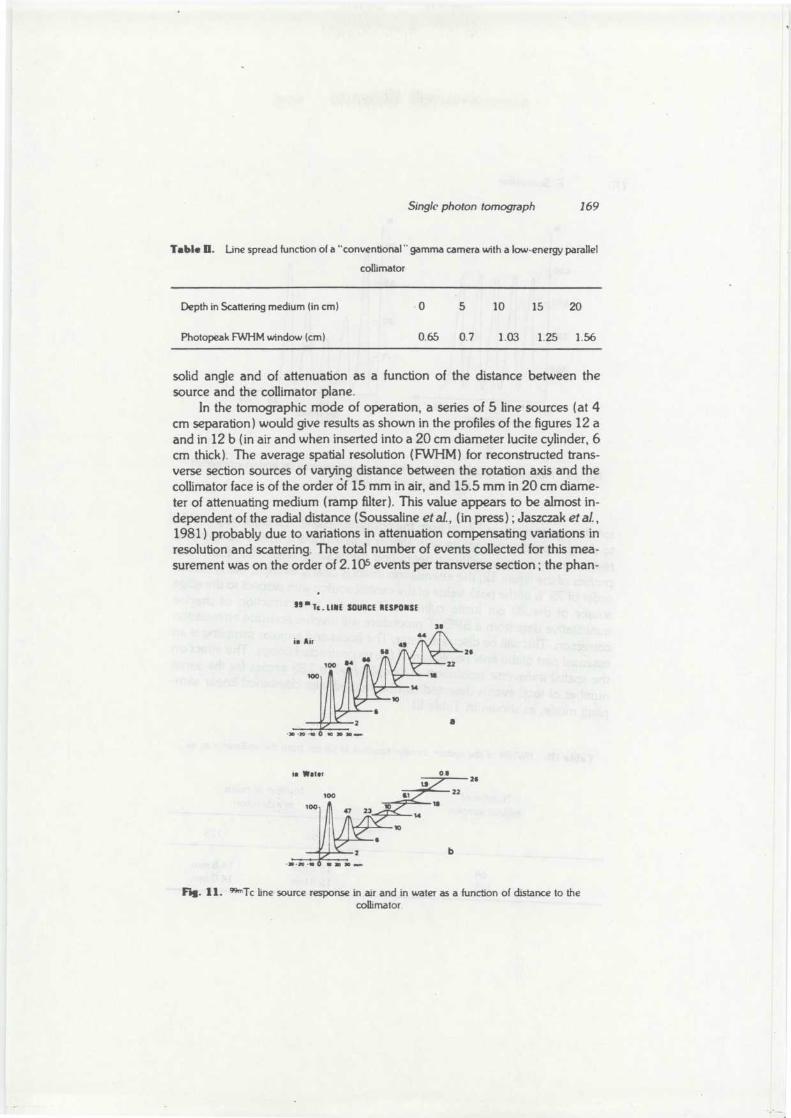
Single photon tomograph
169
Table H . Line spread function of a "conventional " gamma camera with a low-energy paralle l
collimato r
Depth in Scattering medium (in cm)
- 0
5
10
15
20
Photopeak FWHM window (cm)
0 .65
0.7
1 .03
1 .25 1 .56
solid angle and of attenuation as a function of the distance between th esource and the collimator plane .
In the tomographic mode of operation, a series of 5 line sources (at 4cm separation) would give results as shown in the profiles of the figures 12 aand in 12 b (in air and when inserted into a 20 cm diameter lucite cylinder, 6cm thick) . The average spatial resolution (FWHM) for reconstructed trans -verse section sources of varying distance between the rotation axis and thecollimator face is of the order of 15 mm in air, and 15.5 mm in 20 cm diame-ter of attenuating medium (ramp filter) . This value appears to be almost in -dependent of the radial distance (Soussaline et al., (in press) ; Jaszczak et al. ,
1981) probably due to variations in attenuation compensating variations i nresolution and scattering . The total number of events collected for this mea -surement was on the order of 2 .105 events per transverse section ; the phan-
99 . Tc . LINE SOURCE RESPONSE
3$
26
in Air
loo,00
a-2D -20 -l0 0 10 20 30' ow.
in water
0.$
Fis . 11 . QTc line source response in air and in water as a function of distance to thecollimator
26
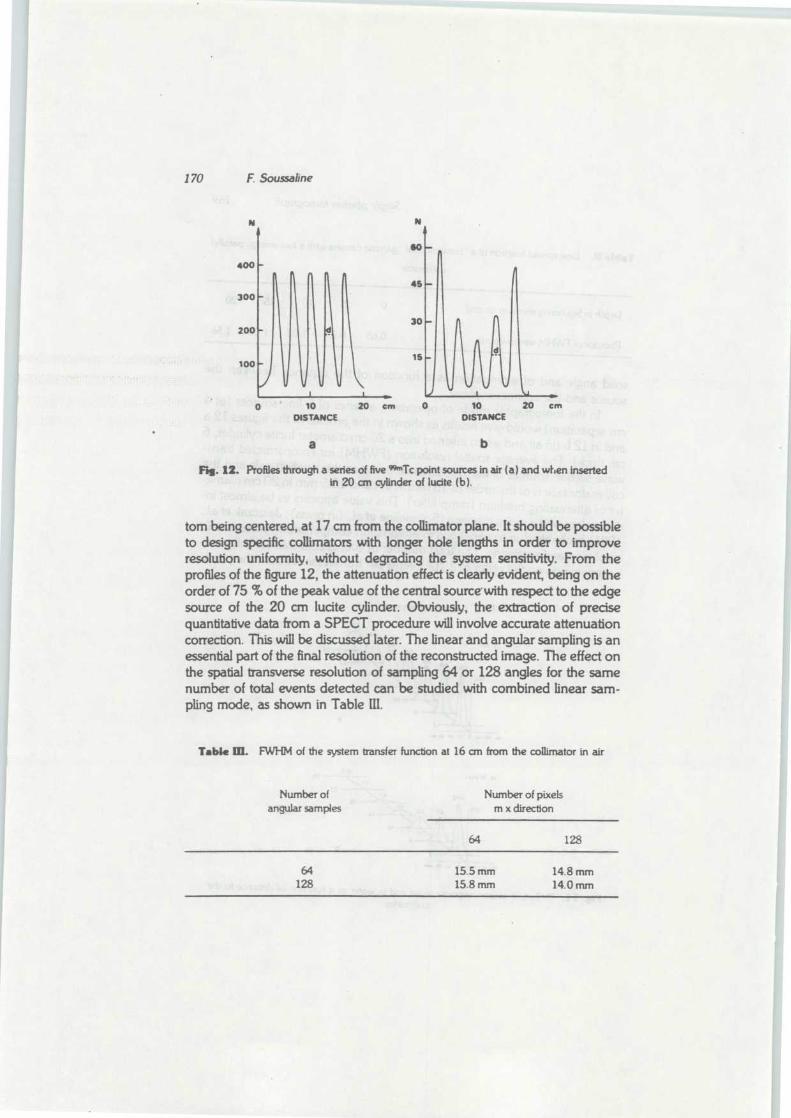
1 70
F Soussaline
Ni
N `
so
45
400
300
3 0200 d
1 5100
J0
1 0
DISTANCE
a
20 cm 1 0
DISTANC E
b
20 cm
Fÿ. 12. Profiles through a series of five "Tc point sources in air (a) and when inserte din 20 cm cylinder of lucite (b) .
tom being centered, at 17 cm from the collimator plane . It should be possibleto design specific collimators with longer hole lengths in order to improv eresolution uniformity, without degrading the system sensitivity . From theprofiles of the figure 12, the attenuation effect is clearly evident, being on theorder of 75 % of the peak value of the central source' with respect to the edgesource of the 20 cm lucite cylinder . Obviously, the extraction of precisequantitative data from a SPECT procedure will involve accurate attenuatio ncorrection. This will be discussed later . The linear and angular sampling is a nessential part of the final resolution of the reconstructed image. The effect o nthe spatial transverse resolution of sampling 64 or 128 angles for the sam enumber of total events detected can be studied with combined linear sam-pling mode, as shown in Table III .
Table M. FWHM of the system transfer function at 16 cm from the collimator in ai r
Number of
Number of pixelsangular samples
m x directio n
64
12 8
64
15 .5 mm
14 .8 mm128
15 .8mm
14.0mm
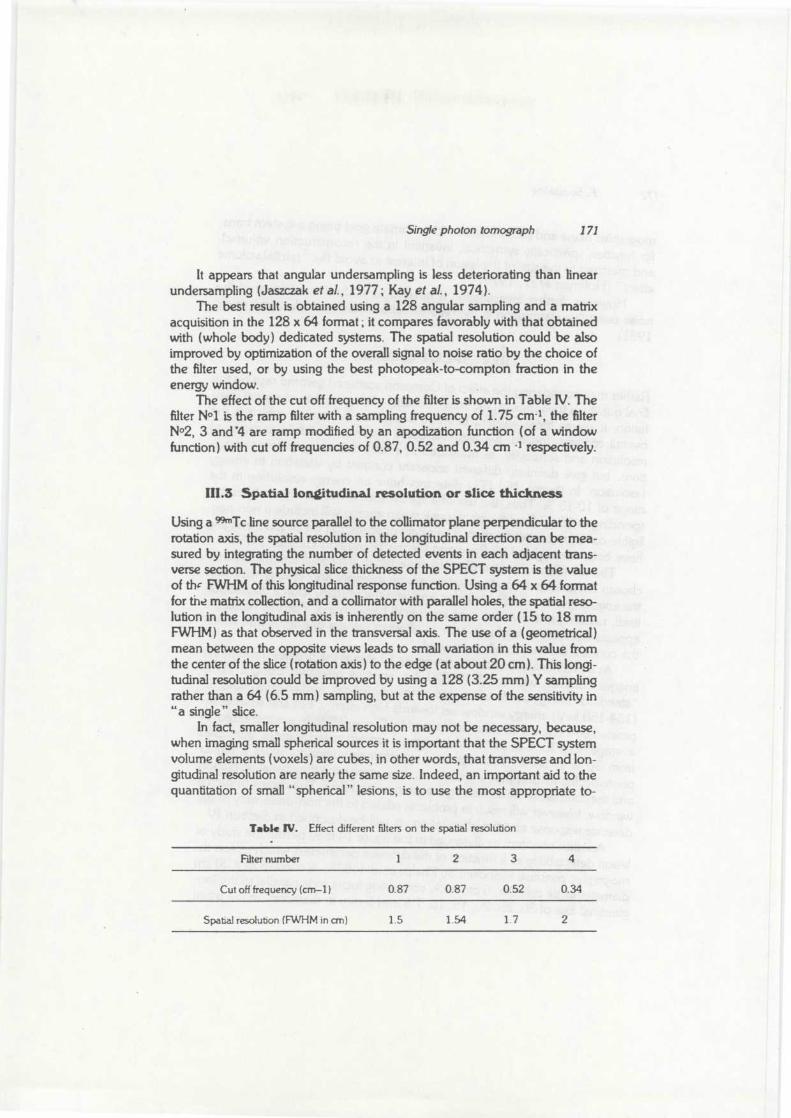
Single photon tomograph
171
It appears that angular undersampling is less deteriorating than linea rundersampling (Jaszczak et al., 1977 ; Kay et al., 1974) .
The best result is obtained using a 128 angular sampling and a matri xacquisition in the 128 x 64 format ; it compares favorably with that obtaine dwith (whole body) dedicated systems . The spatial resolution could be alsoimproved by optimization of the overall signal to noise ratio by the choice o fthe filter used, or by using the best photopeak-to-compton fraction in th eenergy window .
The effect of the cut off frequency of the filter is shown in Table IV . Thefilter N o t is the ramp filter with a sampling frequency of 1 .75 cm- 1 , the filte rNO2, 3 and '4 are ramp modified by an apodization function (of a windo wfunction) with cut off frequencies of 0 .87, 0.52 and 0 .34 cm - 1 respectively.
1II .3 Spatial longitudinal resolution or slice thickness
Using a QTc line source parallel to the collimator plane perpendicular to therotation axis, the spatial resolution in the longitudinal direction can be mea-sured by integrating the number of detected events in each adjacent trans -verse section . The physical slice thickness of the SPECT system is the valu eof the FWHM of this longitudinal response function . Using a 64 x 64 formatfor the matrix collection, and a collimator with parallel holes, the spatial reso-lution in the longitudinal axis is inherently on the same order (15 to 18 m mFWHM) as that observed in the transversal axis . The use of a (geometrical )mean between the opposite views leads to small variation in this value fro mthe center of the slice (rotation axis) to the edge (at about 20 cm) . This longi-tudinal resolution could be improved by using a 128 (3.25 mm) Y samplingrather than a 64 (6 .5 mm) sampling, but at the expense of the sensitivity in"a single " slice .
In fact, smaller longitudinal resolution may not be necessary, because ,when imaging small spherical sources it is important that the SPECT syste mvolume elements (voxels) are cubes, in other words, that transverse and lon-gitudinal resolution are nearly the same size . Indeed, an important aid to thequantitation of small " spherical " lesions, is to use the most appropriate to -
Table N . Effect different filters on the spatial resolutio n
Filter number
1
2
3
4
Cut off frequency (cm—1)
0.87
0.87
0.52
0.34
Spatial resolution (FWHM in cm)
1 .5
1 .54
1 .7
2
172
F. Soussahne
mographic plane and slice thickness, (the ultimate goal being a system trans -fer function spherically symetrical, invariant in the reconstruction volume) ,and matched to the size of the lesion of interest to avoid the "partial volum eeffect" (Hoffman et a1.,1979) .
However, further investigation is needed to study the character of th enoise using this assumption in the reconstruction technique (Jaszczak et al. ,1981) .
111.4 SPECT contrast
Rather than considering the effect of Compton scattered gamma rays on thefinal quality of the tomographic image in terms of degradation of spatial reso -lution, it seems more efficient to study a separate parameter which is th eoverall contrast Indeed, two systems could behave identically in terms o fresolution and sensitivity, as measured in strictly defined geometric condi-tions, but give definitely different apparent contrast by variation in energ yresolution. In theory, Na! (Ti ) detectors have an energy resolution in th erange of 10-15 % . Thus, the use of a spectrometric window typically corre-sponding to 15-20 % of the photopeak mean energy will include a non-neg-ligible compton scatter fraction . The effect of scattering on SPECT imagin ghave been investigated by Pang and Genna (Pang and Genna, 1979) .
The net effect of scatter photons collected in the spectrometric windowchosen is one of a secondary-source whose intensity and energy vary withthe angular position of the detector, and with the primary source distributio nitself, resulting in the addition of an overall background . For this reason, itappears desirable to evaluate such an effect in using a phantom with whichthe contrast will be actually measured .
As a preliminary illustration, the figure 13 shows the profiles through th eimages obtained with the 5 ( QTc) line sources phantom using a 20 %" standard " energy window centered on the photopeak, and an asymmetrical(134-160 keV) energy window set towards high energy . For line sources se-parated by 2 cm, the contrast, as defined by C = tPp ` vv ) ,2 , is increased, inaverage from 15 % to 21 %, and, for the 3 cm separated sources, increase dfrom 30 % to 58 %. The asymetric spectrometric window gives a higherphotoelectric-to-Compton events ratio, thus, improving the spatial resolutio nand the contrast, while increasing the attenuation effect. The choice of such awindow, however will result in problems related to the non-uniformity of th edetector response and the attenuation, as will be described in Section IV .
Another phantom as illustrated in the figure 14 may permit the study o flesion detectability as a function of the different parameters which affects to -mographic contrast Proposed by Phelps et a! (1978), it consists of a 20 cmdiameter lucite cylinder, 6 cm thick, containing lucite rods parallel to the lon -gitudinal axis of 30, 25, 20, 15, 10, 7 .5 and 5 mm in diameter . In the usual
9
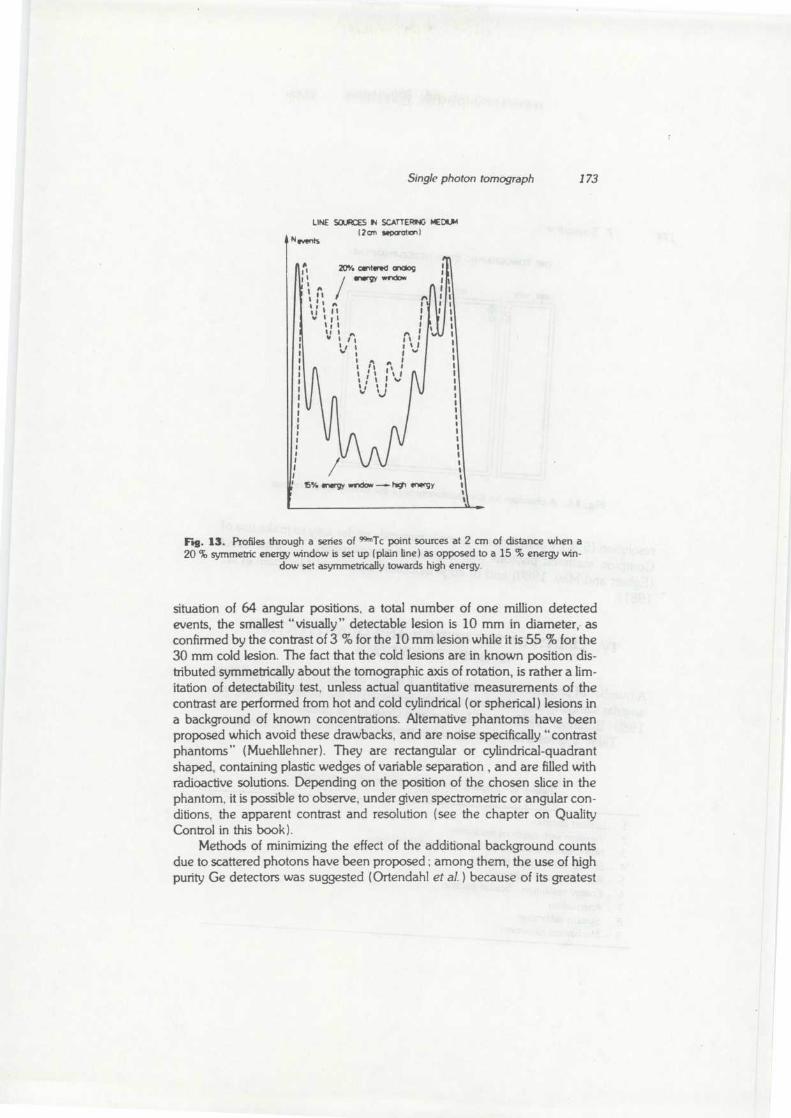
Single photon tomograph
173
LINE SOURCES N SCATTERING MEDIU M
(2 an separato )N tents
j
20% centered analog
1 1
energy window
1 ~
f11
1
1i 1 w1 1
II
1 11 I
Ill
1
1
11 1 ^
n 1V
/
1 1
1
1
.n
^
1
1
1
~i
1
1
1
1,
iv v
1
~II
f b'/. energy wrxiow
tn energ y
Fig . 13 . Profiles through a series of QTc point sources at 2 cm of distance when a20 % symmetric energy window is set up (plain line) as opposed to a 15 % energy win -
dow set asymmetrically towards high energy .
situation of 64 angular positions, a total number of one million detecte devents, the smallest "visually" detectable lesion is 10 mm in diameter,- a sconfirmed by the contrast of 3 % for the 10 mm lesion while it is 55 % for th e30 mm cold lesion . The fact that the cold lesions are in known position dis-tributed symmetrically about the tomographic axis of rotation, is rather a lim -itation of detectability test, unless actual quantitative measurements of th econtrast are performed from hot and cold cylindrical (or spherical) lesions i na background of known concentrations . Alternative phantoms have beenproposed which avoid these drawbacks, and are noise specifically " contras tphantoms" (Muehllehner) . They are rectangular or cylindrical-quadran tshaped, containing plastic wedges of variable separation , and are filled withradioactive solutions. Depending on the position of the chosen slice in th ephantom, it is possible to observe, under given spectrometric or angular con-ditions, the apparent contrast and resolution (see the chapter on QualityControl in this book) .
Methods of minimizing the effect of the additional background countsdue to scattered photons have been proposed ; among them, the use of hig hpurity Ge detectors was suggested (Ortendahl et al. ) because of its greatest
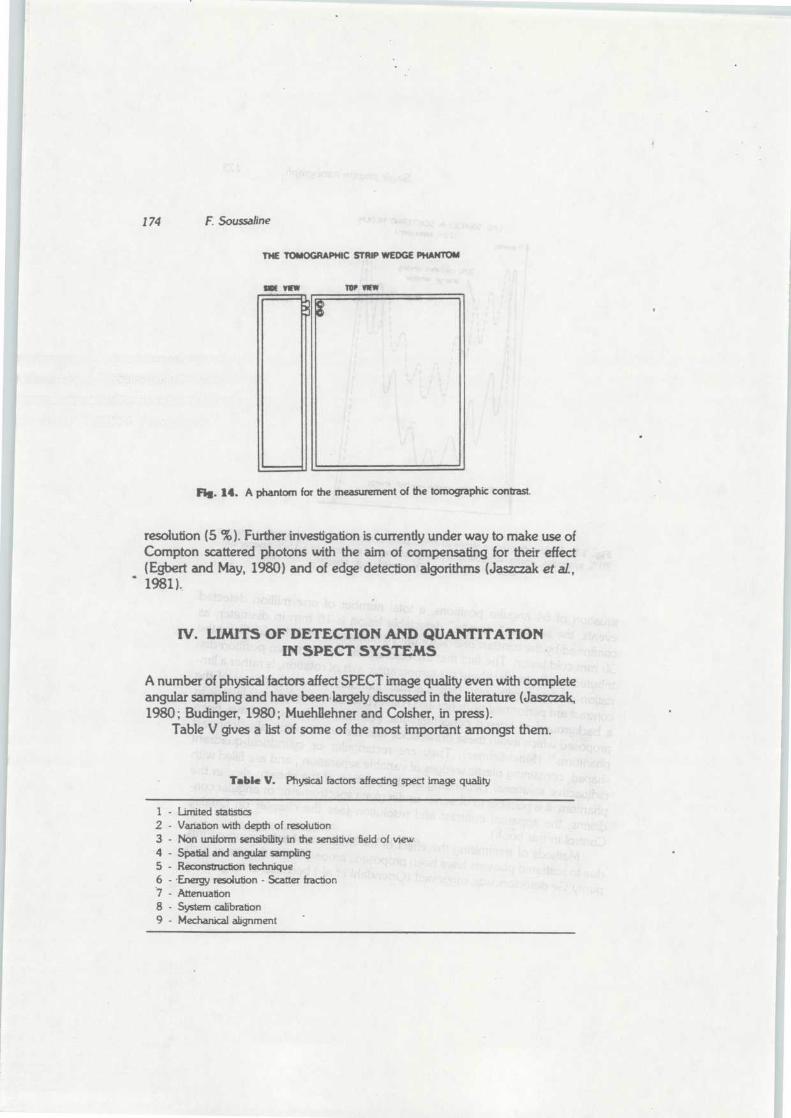
I74
F Soussalin e
THE TOMOGRAPHIC STRIP WEDGE PHANTOM
110E rlEw TOP VIEW
Fis. 14. A phantom for the measurement of the tomographic contrast .
resolution (5 % ) . Further investigation is currently under way to make use ofCompton scattered photons with the aim of compensating for their effec t(Egbert and May, 1980) and of edge detection algorithms (Jaszczak et al. ,1981) .
IV. LIMITS OF DETECTION AND QUANTITATIO NIN SPECT SYSTEMS
A number of physical factors affect SPECT image quality even with complet eangular sampling and have bee n . largely discussed in the literature (Jaszczak ,1980 ; Budinger, 1980 ; Muehllehner and Colsher, in press) .
Table V gives a list of some of the most important amongst them .
Table V. Physical factors affecting sped image quality
1 - Limited statistics2 - Variation with depth of resolution3 - Non uniform sensibibty in the sensitive field of vie w4 - Spatial and angular sampling5 - Reconstruction technique6 - .Energy resolution - Scatter fraction7 - Attenuation8 - System calibration9 - Mechanical alignment
Single photon tomograph
175
Patient motion or the physiological changes in the radioactivity distribu -tion within the acquisition time are also important causes of degradation, no nspecific to the physical phenomena involved in the detection system . Thesefactors will not be discussed in detail here . Only specific aspects related to theimprovement in detectability of low contrast structures and to the quantita-tive potential of the SPECT will be considered . To the question : does emis-sion computed tomography achieve its goal of better visualization of deep ,low contrast structures and improved contrast . The answer from preliminarystudies seems to be affirmative (Chang et al., 1975 ; Gullberg, 1979 ; Sous -saline et al., 1980) with a gain factor of 2 to 3 . However this contrast benefitand, more precisely the quantitative accuracy that could be obtained usin gSPECT should be examined very carefully . Three of the main sources of lim -itation to that goal are due to limited statistics, non-uniformity of the overal l
• response function of the detecting system and attenuation of the gamma ray sin the tissues .
By quantification it is intended that one can extract not only the exac tlocation of a lesion in space but also information such absolute volumes an dabsolute regional radioactive concentrations or any parameter of clinical in-terest related to them .
IV.l Statistical accuracy
The limited statistics obtained with SPECT methods has already been ad-dressed in Section III.1 . Significantly more counts (of the order of 5 to 1 0millions of detected events) than for a conventional image are necessary fo rthe complete (10 slices) study of an organ, because of the reconstructio nbackprojection process, as expressed by the uncertainty equation for a uni-formly filled cylinder of activity . Thus, the contrast improvement is indee dobtained in SPECT on the condition that up to 10 times more counts are col -lected . This suggests that if neither the dose to the patient nor the total imag-ing time are to be increased, the SPECT system sensitivity has to be seriouslyimproved. A high sensitivity, single section SPECT system such as a scanner -based system where the detectors are closely packed all around the 360 de-grees could not be easily extended to a multisection device because it woul drequire-important shielding between the individual sections thus reducin gthe sensitive crystal area . Looking at the problem from the other side, if con -sidering that motion of the detector from about 45 o to 180° is required, thenan SPECT system that can collect more than 100 000 events in times on th eorder of 1 min, will permit dynamic studies (Budinger, 1980) such as brain ,heart or kidney clearance with a ± 20 % accuracy . The MARK N (Kuhl etal., 1974) and the DCAT system (Stokeley et al. ) has the required sensitivity( 50 counts.sec- 1 axial cm- 1 ), for a 1 cm transverse resolution in a 2 cm
176
F. Soi'aline
slice thickness. It should be pointed out that these are "head" scanning devi-ces, part of whose high sensitivity is due to the small distance between detec-tors corresponding to opposite projections .
IV.2 Detector non-stationnarities
While detailed studies of the effect on quantitative accuracy of different pa-rameters such as sampling, scattered and accidental events, object of interes tsize, attenuation . . . have been discussed (Keyes, 1979 ; Huesman, 1976 ;Huong et aL, 1979, 1980) in PCT, for which there are analytical solutions i nmost of the cases, SPECT suffers from the need for approximations andmore difficult problems due to the inaccuracies in the physical imaging pro -cesses involved.
Longitudinal tomography has the inherent drawback of incomplete an-gular sampling which does not allow quantitative data to be obtained . Thus,only transversal tomography (SPECT) will be considered for quantification .Even then, sampling theory implies that to avoid aliasing artefacts or reduce dresolution (Hoesman, 1976), the number of angles N that should besampled for an object diameter D and a system resolution d is N = D/d,i. e. the optimum number of angles in 360° should be around 80 to 100 fo ran object of 20 cm and a final resolution of 1 cm. In SPECT systems th esampling geometry, especially when it is hexagonal and the rotation-transla-tion associated motion allows the system response function to be reasonabl yinvariant and isotropic (less than 10 % FWHM variation in the 40 cm diame-ter field) . In SPECT systems, specifically when considering the use of a rotat -ing gamma-camera, the non-uniformity of the system response in the tomo -graphic field, the non-linearities (both differential and integral) can introduc eimportant artefacts in the tomographic quality and the ability to extract quan-titative data . This has been studied in detail in terms of noise power spectr aamplification (Todd-Pokropek et al., 1980) . Figure 15 illustrates the effect ofthe non-uniform sensitivity of the camera, for a uniform disc source when re -constructing a tomographic image . The tomographic process is a high fre-quency amplifier, and, in particular, amplifies error along the axis of rotation .It can be noted, on figure 15, that important ring artefacts are created whe nuniformity correction is not performed, centered on the rotation axis, wit hamplitude increasing as the inverse of the artefact distance from the axis. Forexample, even if the camera in the static "conventional" mode is unifor mto ± 3 %, slight defects close to the axis can generate errors in the tomo -graphic image of up to ± 30 %. The actual amplification of non-uniformitywill also depend on the "character" of the noise amplified, spatial distortio nbeing amplified in the same manner than variation in sensitivity . Thus, to
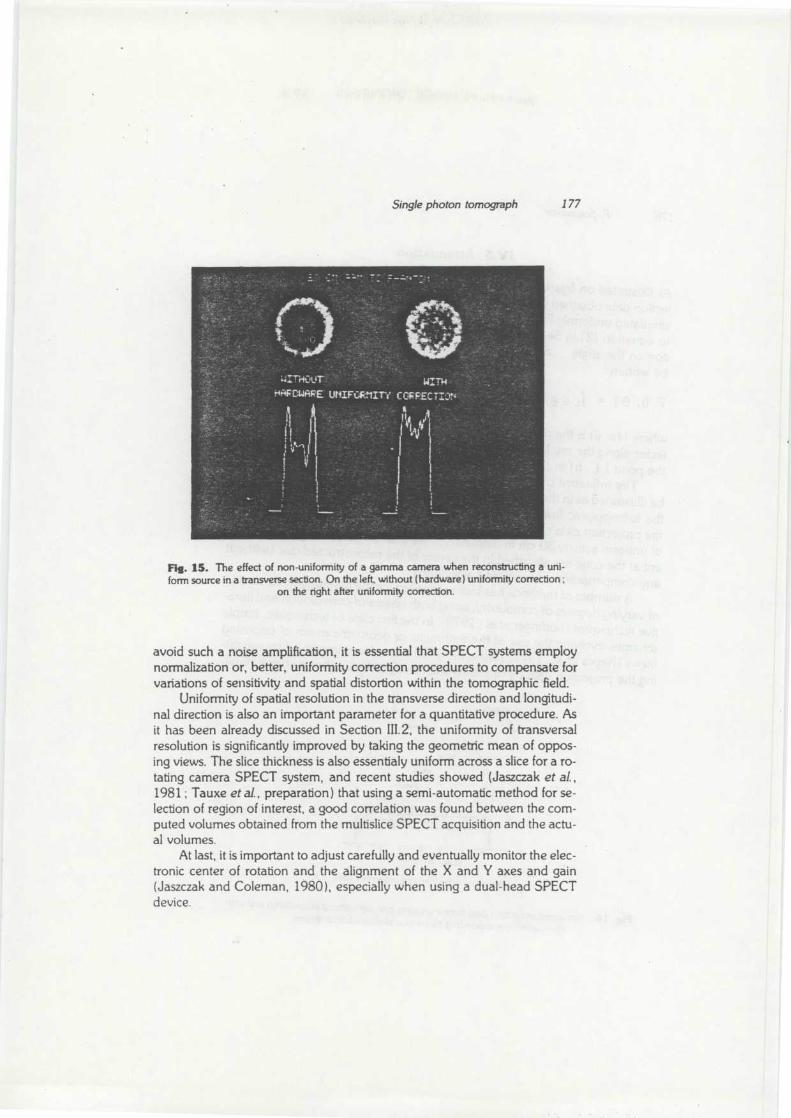
Single photon tomograph
177
Fig. 1S . The effect of non-uniformity of a gamma camera when reconstructing a uni -form source in a transverse section . On the left, without (hardware) uniformity correction ;
on the tight after uniformity correction .
avoid such a noise amplification, it is essential that SPECT systems emplo ynormalization or, better, uniformity correction procedures to compensate fo rvariations of sensitivity and spatial distortion within the tomographic field .
Uniformity of spatial resolution in the transverse direction and longitudi-nal direction is also an important parameter for a quantitative procedure . Asit has been already discussed in Section 111 .2, the uniformity of transversa lresolution is significantly improved by taking the geometric mean of oppos-ing views. The slice thickness is also essentialy uniform across a slice for a ro-tating camera SPECT system, and recent studies showed (Jaszczak et al. ,1981 ; Tauxe et al., preparation) that using a semi-automatic method for se -lection of region of interest, a good correlation was found between the corn-puted volumes obtained from the multislice SPECT acquisition and the actu-al volumes .
At last, it is important to adjust carefully and eventually monitor the elec -tronic center of rotation and the alignment of the X and Y axes and gai n(Jaszczak and Coleman, 1980), especially when using a dual-head SPEC Tdevice .
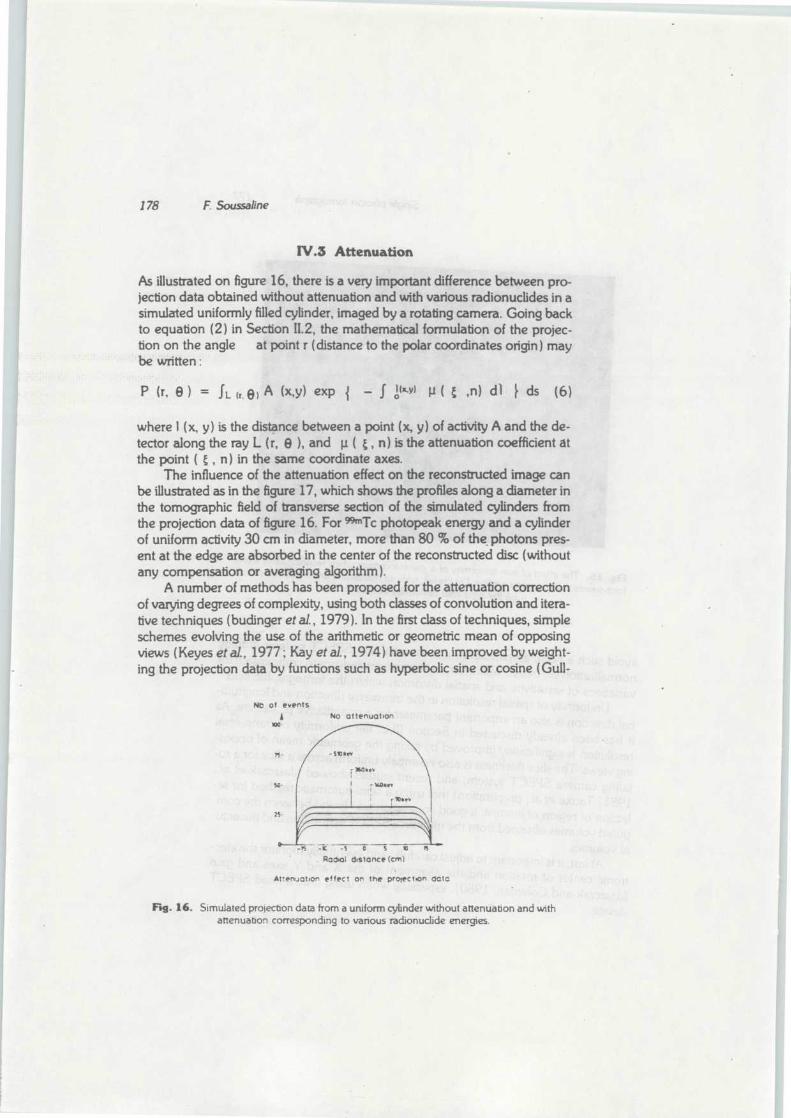
178
F Soussaline
IV.3 Attenuation
As illustrated on figure 16, there is a very important difference between pro-jection data obtained without attenuation and with various radionuclides in asimulated uniformly filled cylinder, imaged by a rotating camera . Going backto equation (2) in Section II .2, the mathematical formulation of the projec-tion on the angle at point r (distance to the polar coordinates origin) ma ybe written :
where 1 (x, y) is the distance between a point (x, y) of activity A and the de-tector along the ray L (r, 8 ), and µ ( , n) is the attenuation coefficient a tthe point ( , n) in the same coordinate axes .
The influence of the attenuation effect on the reconstructed image ca nbe illustrated as in the figure 17, which shows the profiles along a diameter i nthe tomographic field of transverse section of the simulated cylinders fro mthe projection data of figure 16 . For QTc photopeak energy and a cylinde rof uniform activity 30 cm in diameter, more than 80 % of the photons pres-ent at the edge are absorbed in the center of the reconstructed disc (withou tany compensation or averaging algorithm) .
A number of methods has been proposed for the attenuation correctio nof varying degrees of complexity, using both classes of convolution and itera -tive techniques (budinger et al. , 1979) . In the first class of techniques, simpl eschemes evolving the use of the arithmetic or geometric mean of opposin gviews (Keyes et al., 1977 ; Kay et al., 1974) have been improved by weight-ing the projection data by functions such as hyperbolic sine or cosine (Gull -
=t- -s
0
S
t
. Rod o distance (cm )
Fig . 16. Simulated projection data from a uniform cylinder without attenuation and wit hattenuation corresponding to various radionuclide energies .
15
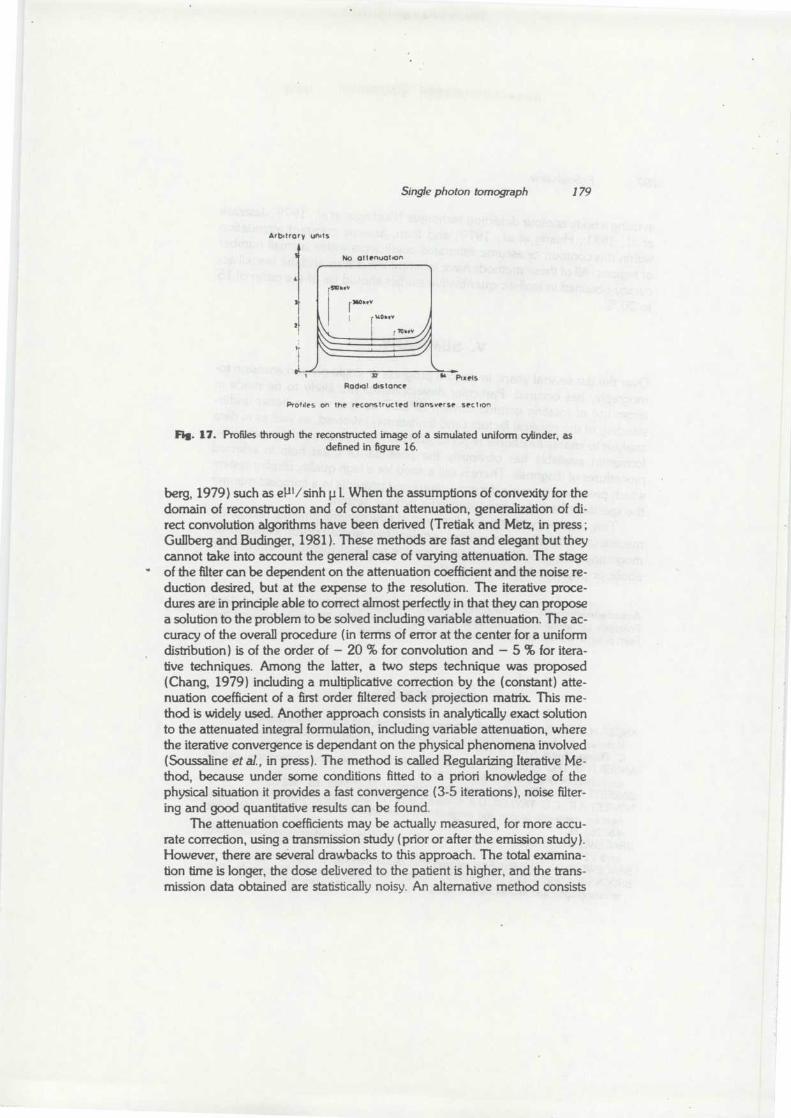
Single photon tomograph
179
Arbitrary units
No attenuatio n
Profiles on the reconstructed transverse sectio n
Fig . 17 . Profiles through the reconstructed image of a simulated uniform cylinder, a sdefined in figure 16 .
berg, 1979) such as eP' / sinh p 1. When the assumptions of convexity for th edomain of reconstruction and of constant attenuation, generalization of di -red convolution algorithms have been derived (Tretiak and Metz, in press ;Gullberg and Budinger, 1981) . These methods are fast and elegant but theycannot take into account the general case of varying attenuation. The stageof the filter can be dependent on the attenuation coefficient and the noise re -duction desired, but at the expense to the resolution . The iterative proce-dures are in principle able to correct almost perfectly in that they can proposea solution to the problem to be solved induding variable attenuation . The ac -curacy of the overall procedure (in terms of error at the center for a uniformdistribution) is of the order of — 20 % for convolution and — 5 % for itera-tive techniques . Among the latter, a two steps technique was propose d(Chang, 1979) induding a multiplicative correction by the (constant) atte-nuation coefficient of a first order filtered back projection matrix . This me-thod is widely used. Another approach consists in analytically exact solutio nto the attenuated integral formulation, including variable attenuation, wherethe iterative convergence is dependant on the physical phenomena involved(Soussaline et al., in press) . The method is called Regularizing Iterative Me-thod, because under some conditions fitted to a priori knowledge of th ephysical situation it provides a fast convergence (3-5 iterations), noise filter -ing and good quantitative results can be found .
The attenuation coefficients may be actually measured, for more accu -rate correction, using a transmission study (prior or after the emission study) .However, there are several drawbacks to this approach . The total examina-tion time is longer, the dose delivered to the patient is higher, and the trans -mission data obtained are statistically noisy. An alternative method consists
c
32
" Pixel sRadial distance
180
F Soussaline
in using a body contour detection technique (Budinger et al. , 1979 ; Jaszcza ket al., 1981 ; Huang et al., 1979) and then, assume constant attenuatio nwithin this contour, or assume estimated coefficients within a small numbe rof regions . All of these methods have inherent limitations and the overall ac -curacy obtained in realistic quantitative studies should be of the order of 1 5to 20°x .
V. SUMMARY
Over the last several years, important progress in single photon emission to-mography has occured. Particular developments are likely to be made i nlarger use of rotating gamma camera SPECT devices with a better under -standing of the physical factors (and limitations) involved, as well as in dat aanalysis to enable functional regional studies . The true three-dimensional in -formation available has obviously the potential of great help in selectedprocedures of diagnosis . There is still a need for a high quality display syste mwhich preserves the wide dynamic range and presents in a compact manne rthe specific information produced by a SPECT system .
This, together with the development of new gamma emitting radiophar-maceuticals and adequate models, artefact-free single photon emission to-mography data should permit non-invasive regional measurement of met-abolic or physiopathologic parameters.
Acknowledgements — The author gratefully acknowledges W . N . Tauxe and A E. Todd -Pokropek for helpful discussions while preparing this manuscript This work would not hav ebeen possible without the continuous help of C . Kellershohn .
REFERENCES
ANGER H .O. (1968) . "Tomographic gamma-ray scanner with simultaneous read-out of sever -al planes'', in : Fundamental Problems in Scanning, A Gottschalk & R. N . Beck eds, CharlesC . Thomas . Springfield I, p . 195 .
ANGER H .O., D.C . PRICE and P.E. YOST (1967), Transverse section tomography with th escintillation camera . J. Nuc. Med. 8 . 314-15 .
BARRETT H.H. (1972) . Fresnel zone plate imaging . J. Nucl. Med. 13, 382-85 .BOWLEY AR ., C .G . TAYLOR . D.A . CAUSER et al. (1973) . A radioisotope scanner for rectili -
near are transverse section and longitudinal section scanning. British Journal of Radiology46 . 262-71 .
BRACEWELL R . (1956a), Two dimensional aerial smoothing in radioastronomy . Aust J. Phys-ics 9 . 279-314 .
BRACEWELL R.N. (1956b), Strip integration in radioastronomy . J. Phys. 9. 198-217 .BROOKS R .A. and G. DI CHIRO (1976), Principles of Computer assisted tomography (CAT )
in radiographic and radioisotopic imaging . Phys Med. Biol. 21 . 689-732
Single photon tomograph
181
BRUNOL J . and J. FONROGET (1978), Sequential method for high 3 D resolution imaging i nNuclear Medicine, Opt Comm. 25, 35 .
BUDINGER T.F., G.T . 3ULLBERG and R.H. HUESMAN (1979), "Emission computed to-mography", in : Topics in Applied Physics, vol . 32, G .T. Herman ed ., Berlin, Sprenger-Ver-lag, pp . 147-246 .
BUDINGER T.F . and G .T. GULLBERG (1974), Three dimensional reconstruction in nuclearmedicine emission imaging . IEEE Trans. Nud. Sci. NS-21, 3, 2-2 0
BUDINGER T .F., S .E. DERENZO, G .T. GULLBERG, W .L . GREENBERG and R .H HUES -MAN (1977), Emission computer assisted tomography with single-photon and positron an-nihilation photon emitter, J. Comput Assist. Tomog . 1, 131-45.
BUDINGER T.F. (1980), Physical attributes of single-photon tomography, J Nucl Med. 21 ,579-92 .
BUDINGER T .F., G.T . GULLBERG and R .H. HUESMAN (1979), "Emission computed to-mography", in : Topics in Applied Physics, Vol . 32, G .T . Herman ed ., Berlin, Springer-Ver-lag, pp . 147-246 .
CASSEN B . (1965), Section scanning with a large solid angle collimator, J. Nucl. Med. 6, 767 .CHANG L.T., B . MAC DONALD and V . PEREZ-MENDEZ (1975), Meeting on image process -
ing for 2 D and 3 D reconstruction Standford 4-7, 8 .CHANG LT . (1979), Attenuation correction and incomplete projection in single photon emis-
sion computed tomography, IFEF, NS-26,2 . -CRAMER H . and H. WOLD (1936), Some theorems on distribution functions, J. Lond. Math.
Soc. 11 , 290-94.DE ROSIER D.J. and A. KLUG (1968), Reconstruction of three dimensional structures from
electron micrographs, Nature 217, 30-34 .EGBERT S. D . and RS. MAY (1980), An integral transport method for Compton-scatter correc-
tion in emission computed tomography, IFFF Trans. Nucl. Sci. NS-27 .FREEDMAN G.S. (1970), Gamma camera tomography, J Mid. Med. 11; 602 .GENNA S ., S .C . PANG and B.A BURROWS (1976), "Analysis of an arcuata gamma camera
design for transaxial reconstruction ", in : Int Symp. in Med Radionuclide Imaging, Vol. I ,IAEA, Vienna, pp . 323-39 .
GOODWIN P. N. T1980), "Recent Developments in Instrumentation for Emission Compute dTomography ",in : Seminars in Nuclear Medicine, Vol. 10, No 4, pp . 322-34.
GORDON R (June 1974), A tutorial on ART (Algebraic reconstruction techniques ), IFFFTrans. Nucl. Sci. NS-21, 78-93 .
GULLBERG G. (June 1979), The Attenuated Radom Transform : Theory and Application inMethane and Biology, PhD Thesis, Berkeley, University of California.
GULLBERG G .T . and T.F . BUNDINGER (1981), The use of filtering methods to compensat efor constant attenuation in single-photon emission computed tomography, IFFF Trans . onBiomedical Engineering BME-28, 2, 142-57.
HINE G .J . and J.J. ERICKSON (1974), "Advances in scintigraphic instruments", in : Instru-mentation in Nuclear Medicine, Vol. 2, G .J . Hine & J .A Sorenson eds, New York, Academi cPress, pp. 2-56 .
HOFFMAN E.J ., S . C . HUANG and M.E. PHELPS (1979), Quantitation in positron Emissio ncomputed tomography : 1 . Effect of object size, J. Comput Assist Tomogr. 3, 299 .
HUANG S ., E .J. HOFFMAN, M.E. PHELPS and D . E . KUHL (1979), Quantitation in positro nemission computed tomography : 2 . Effect of inaccurate attenuation correction, J of Corn -put Assist Tomogr, 3, 804-14.
HUANG S.C., E.J. HOFFMAN, M.E. PHELPS and D.E. KUHL (1980), Quantitation in Posi-tron Emission computed tomography : 3 . Effect of sampling. J. Comput Assist Tomog. , 819 -26 .
HUESMAN R H . (1976), "The effects of a finite number of prijection angles and finite lateralsampling of protections on the propagation of statistical errors in tranverse section reconstrun-bon ", LBL Report, 4773 .
182
F Soussahn e
JASZCZAK RJ . (June 1980), SPECT : Single photon emission computed tomography, IEEETransactions on Nuclear Science NS-27, 3 .
JASCZAK R.J ., P.H. MURPHY and I .A. BURDINE (1977), Radionuclide emission compute dtomography of the head with 99m Tc and a scintillation camera, J. Nud. Med. 4, 373-80 .
JASCZAK R .J ., LT . CHANG, N .A. STEIN and F .E. MOORE (1979), Whole-body single-phot -on emmssion computed tomography using dual, large-field-of- view scintillation cameras ,Phys. Med Biol. 24, 1123-43 .
JASCZAK R.J., R . E. COLEMAN and F .R. WHITEHEAD (Feb . 1981), Physical factors affectingquantitative measurements using camera-based single photon emission computed tomogra-phy (SPECT), IFFF Trans. on Nuclear Sciences NS-28, 1, 69-80.
JASCZAK RJ. and RE. COLEMAN (1980), "Selected processing techniques for scintillatio ncamera based on spect systems", in : Proceedings of X th Symposium on the Sharing of Com-puter Programs and Technology in Nuclear Medicine, Society of Nuclear Medicine, NewYork.
KAY D. B . Jr, J .W. KEYES and W . SIMON (1974), Radionuclide tomographic image recon-struction using Fourier transform techniques, J . Mid. Med. 1S, 981-86.
KEYES W. I . R. CHESSER and P.E . UNDRILL (1977), "Transverse section emission tomogra -phy", in : Medicallmages,G. Hay ed., Chichester, Institute of Physics. John Wilez, pp. 51-67 .
KEYES J .W., N . ORLANDEA and W .J. HEETDERKS (1977), The Humongotron – a scintilla -tion camera transaxial tomograph, J Nud. Med. 18, 381 .
KEYES W.I . (April 1979), Current status of simple photon emission computerized tomography ,IFFF Transactions on Nuclear Science NS-26, 2, 2752-55.
KORAL K.F ., W .L ROGERS and G .F. KNOLL (1975), Digital tomographic imaging with tim emodulated pseudorandom coded aperture and Anger camera, J. Nucl. Med. 16, 402-13 .
KUHL D.E. and R Q . EDWARDS (1963), Image separation in radioisotope scanning, Radiol-ogy 88, 653-62.
KUHL D.E. and R.Q. EDWARDS (1964), Cylindrical and section radioisotope scanning of th efiver and brain, Radiology 83, 926-36.
KUHL D.E, F .W. PITT, T.P. SANDERS and M.M. MISHKIN (1966), Transverse section andrectilinear brain scanning with Tc99r. pertechnetate, Radiol 86, 822 .
KUHL D.E and RQ. EDWARDS (1970), The Mark III scanner : a compact device for multiple -view and section scanning of the brain, Radiology 96, 563-70.
KUHL D .E, RQ. EDWARDS and AR RICCI (1974), "Transverse section scanner at the Uni-versity of Pennsylvania", in : Tomographic Imaging in Nuclear Medicine, G .S. Freedman ed . ,New-York, Society of Nuclear Medicine, pp . 19-27 .
KUHL D .E, RQ . EDWARDS, A.R . RICCI, RJ . YACOB, T .J. MICH and A.ALAVI (1976), TheMark IV system for radionuclide computed tomography of the brain, Radiology 121 , 405-13.
KUHL D.E, RQ. EDWARDS, AR RICCI and M. REIVICH (Apr. 1973), Quantitative sectionscanning using orthogonal tangent correction, J Mid Med 14, 196-200.
LARSSON S.A. (1980), Gamma camera emission tomography, Acta Radiologica Supplemen-turn 363, Stockholm.
LASSEN N .A., E. SVEINSDOTTIR E, L KANNO, EM . STOCKELY and P. ROMMER (1978) ,A . fast moving single photon emission tomograph for regional cerebral blood flow studies inman, J. Comp. . Assist Tornog. 2, 661-62 .
LEFREE MT., RA VOGEL, D .L. KIRCH and P.P. STEELE (1981 ), Seven-pinhole tomogra-phy. A technical description, J Nucl. Med. 22, 48-54 .
MUEHLLEHNER G . (1970), Rotating collimator tomography, J Nucl. Med. 11, 347 .MUEHLLEHNER G., Personnal communication .MUEHLEHNER G. and J. COLSHER (1980), "Single photon imaging : New instrumentation
and techniques", in : International Symposium on Medical Radionuclide Imaging, IAEA ,Vienna, in press .
MYERS M.J., W.L KEYES and J.R. MALLARD (1973), "An analysis of tomographic scannin gsystems", in : Medical Radioisotope Scintigraphy 1972. Vol. 1, Vienna, IAEA, pp . 33145.
Single photon tomograph
183
OLDENDORF W .H. (1961), IRE Transaction in Biomedical Electronics, BME 8, 68-72 .OPPENHEIM B.E., P.B . HOFFER and A. GOTTSCHALKH (1976), Nuclear imaging : A new
dimension, Radiology 118, 491-94 .ORTENDAHL D., L KAUFMAN and J . WATTS, High resolution single-photon emission corn -
puted tomography with a small germanium camera, IEEE Trans . Nud. Sci. NS 27 .PANG S .C . and S . GENNA (1979), The effect of Compton scattared photons on emissio n
computerized transaxial tomography, IFFF Trans. Nucl. Sd. NS-26, 2771-74.PATTON J. A_ (1980), "Tomography", in : Imaging for Medicine, Vol . 1, Nuclear Medicine ,
Ultrasonics and Thermography, Ed. by sol . Nudelman and Dennis D . Dalton, Plenum Press ,NY and London, pp . 165-81 .
PHELPS M .E. (October 1977), "Emission computed tomography", in : Seminars in Nuclea rMedicine, Vol 7, N o 4, pp . 337-65 .
PHELPS M .E., E .J . HOFFMAN, S .C . HUANG and D.E . KUHL (1978), ECAT : A new compu-terized tomographic imaging system for positron emitting radiopharmaceuticals, J. Nucl. Med.1, 635-47.
RADON J . (1917), Uber die Bestimmung von Funktionen durch ihre lntegralwarte lungs Ge-wisser Mannigfaltigkeiten . Ber Vertz Sacks, Akad 69, 262 .
RENAUD L, M.LG. JOY and D .L GILDAY (1979), Fourier multiaperture emission tomogra-phy (FMET), J. Nucl. Med. 20, 986-91 .
ROWLEY P . D . (1%9), Quantitative interpretation of three dimensional weakly refractive phas eobjects using holographic interferometry, J. Opt. Soc. Am. 59 , 1496-98 .
SOUSSALINE F., A.E . TODD-POKROPEK, S. ZUROWSKI, E. HUFFER, C .V . RAYNAU Dand C. KELLERSHOHN, A rotating gamma camera single-photon tomographic system :Physical characterization, J. of Comp . Ass. Tomography (in press) .
SOUSSALINE F ., S . HOULE, D . PLUMMER and A.E. TODD-POKROPEK (1979), "Poten-tials of quantitative methods in positron emission tomography", in : Proceedings of Informa -tion Processing in Medical Imaging, INSERM, Vol . 88, pp. 215-42 .
.SOUSSALINE F ., A. E. TODD-POKROPEK, C . RAYNAUD, C. KELLERSHOHN (1980), "Po -tential and limits of quantitative studies in emission tomography", in : International Symposi-um on Medical Radionuclide Imaging, IAEA, Vienna, in press .
SOUSSALINE F., A CAO and G . LECOQ (June 1981), "Single photon emission tomographyreconstruction using a regularizing iterative method (RIM) for attenuation correction", in :Proceedings of the Vllth Intemation Conference on Medical Image Processing, Stanford, inpress.
STODDART H .F . and H .A. STODDART (1979), A new development in single gamma transax-ial tomography union carbide focussed collimator canner, IEEE Trans. Nud. Sci. NS 26 ,2710-12.
STOKELEY EM., E. SVEINSDOTTIR, N .A. LASSEN et al., A single photon dynamic compu-ter assisted tomograph (DCAT) for imaging brain function in cross section, J. Comput AssistTomography.
TANAKA E, T .A. INUMA, T. TOMITANI and T. SHIMIZU (1974), Multicrystal section imagingdevice and its data processing, in : Proc. 131 Intern . Congr. of Radiology, Madrid, ExcerptaMedica, Amsterdam . pp . 314-24 .
TAUXE W.N ., D .W CHAAPEL and AC . SPRAU (1966), Contrast enhancement of scanningprocedures by high-speed computer, J. Nud. Med 7 . 647 .
TAUXE N . . F . SOUSSALINE, AE . TODD-POKROPEK, A. CAO, P. COLLARD, C . RAY-NAUD and S . RICARD, Automatic evaluation of volumes of interest from reconstructions o fsingle photon emission tomographic images (in preparation) .
TODD-POKROPEK &E. (1972), "The formation and display of section scans", in : Proc . 2^dCongo. European Assoc. of Radiology 1971, Excerpta Medica, Amsterdam, pp . 542-548 .
TODD-POKROPEK AE. S . ZUROL'JSKI and F . SOUSSALINE (1980), Artefact creation an dnon-uniformity in tomography . J. Nud Med. 21, 38
184
F. Soussalin e
TODD-POKROPEK A.E ., S . HUGGETT, M . SHORT and F . SOUSSALINE, Quality control :measurements of contrast as a funtion of noise in conventional and tomographic systems, Jof Nucl. Med. (abstract) .
TRETIAK O .J . and C . METZ, Soc. Ind. App!. Mathatics. (SIAM), in press .VOGEL R .A ., D .L . KIRCH. M .T . LEFREE et al. (1978), A new method of multiplanar emissio n
tomography using a seven pinhole collimator and an Anger scintillation camera, J . Nucl. Me d19, 648-54 .

PUBLICATION
V
PUBLICATION V
LE PROBLEME DE LA RECONSTRUCTION D ' IMAGE A PARTI R
DES PROJECTIONS .
REVUE DES MÉTHODES DE RESOLUTION ET PRESENTATION D E
LA METHODE ITERATIVE REGULARISANTE (MIR )
G . LE COQ - F . SOUSSALINE
INTRODUCTION
La reconstruction de la densité d'un objet à trois dimension sà partir de clichés est un problème dont on a donné un grand nombre de solu-tions ou plus exactement de méthodes de résolution . Celles-ci sont réperto _
rites et développées dans le numéro consacré à ce sujet, de IEEE Transactionson Nuclear Science [1] . On peut classer ces méthodes en quatre catégorie s
[2] .
. - Méthode de sommation ou tomographie .
- Méthodes utilisant la transformée de FOURIER .
- Méthodes analytiques de résolution d'une équation intégrale .
- Méthodes algébriques de résolution ART .
Ces résolutions différentes du même problème sont difficilemen t
comparables, rares sont les exemples de comparaison .
Dans la suite de cet article nous nous proposons de traiter lespoints sui vants :
- Position du problème .
- Solutions proposées par différents auteurs .
- Méthode de résolution MIR (Methode Itérative Regularisante) .
Un exemple de reconstruction d'image utilisant la méthode MI R
est donné en fin d'article .
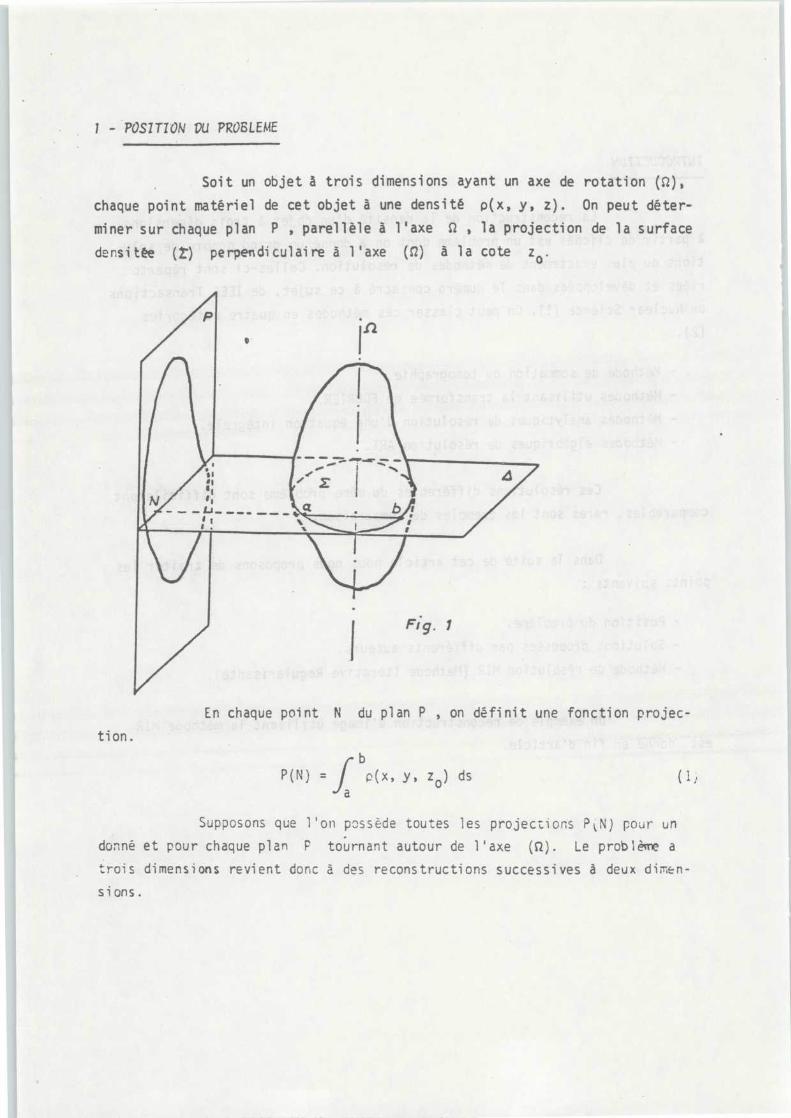
1 - POSITION DU PROBLEM E
Soit un objet à trois dimensions ayant un axe de rotation (f1) ,
chaque point matériel de cet objet à une densité p(x, y, z) . On peut déter-
miner sur chaque plan P , parellèle à l'axe S2 , la projection de la surfac e
densi tte (t') perpendiculaire à l'axe (f2) à la cote z o .
s
I
Fig. 1
En chaque point N du plan P , on définit une fonction projec -
tion .
bP(N) = f Rix, y, z o ) ds
a
Supposons que l'on possède toutes les projections P N) pour u n
donné et pour chaque plan P tournant autour de l'axe (Q) . Le problème a
trois dimensions revient donc à des reconstructions successives a deux dimen-
sions .
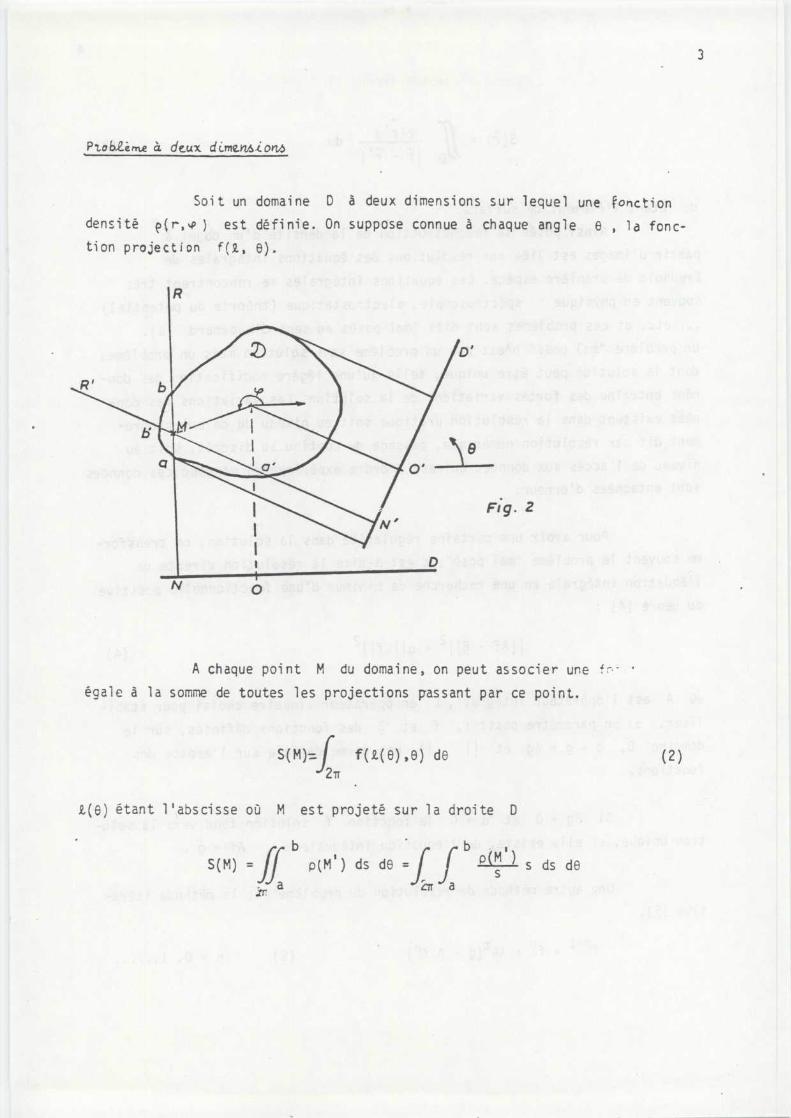
3
Ptobeèmeadeux dc:m¢. i o+vs
Soit un domaine D à deux dimensions sur lequel une fonctio n
densité e(r,,P ) est définie . On suppose connue à chaque angle e , la fonc-
tion projection f(2., e) .
Fig . 2
o
A chaque point M du domaine, on peut associer une f
égale à la somme de toutes les projections passant par ce point .
f(J(e),8) de
(2 }
étant l'abscisse où M est projeté sur la droite D
S(M) = (j b p(M) ds d8 =f
b p S~r
11 s ds d8JJ a
crr a
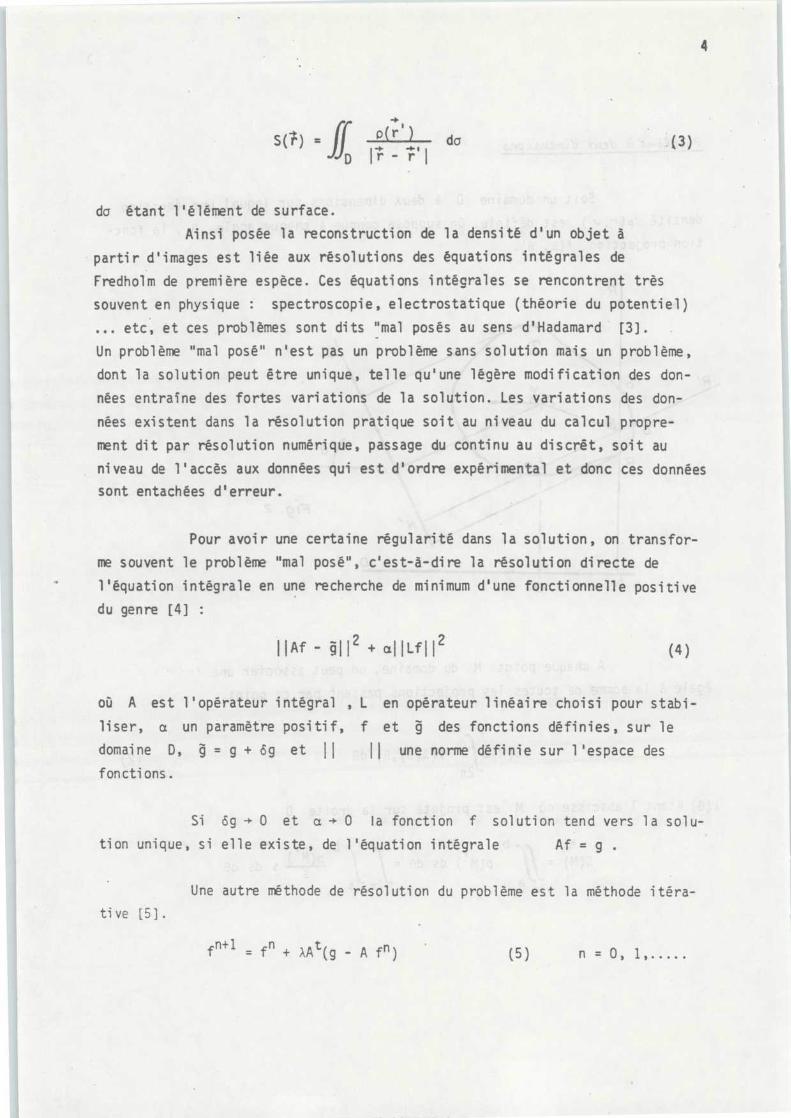
4
;)(1̂-
~
rD
I
'
da étant l'élément de surface .
Ainsi posée la reconstruction de la densité d'un objet à
partir d'images est liée aux résolutions des équations intégrales de
Fredholm de première espèce . Ces équations intégrales se rencontrent trè s
souvent en physique : spectroscopie, electrostatique (théorie du potentiel )
. . . etc, et ces problèmes sont dits "mal posés au sens d'Hadamard [3j .
.
Un problème "mal posé" n'est pas un problème sans solution mais un problème ,
dont la solution peut être unique, telle qu'une légère modification des don -
nées entraine des fortes variations de la solution . Les variations des don-
nées existent dans la résolution pratique soit au niveau du calcul propre -
ment dit par résolution numérique, passage du continu au di s crêt, soit au
niveau de l'accès aux données qui est d'ordre expérimental et donc ces donnée s
sont entachées d'erreur .
Pour avoir une certaine régularité dans la solution, on transfor-
me souvent le problème "mal posé", c ' est-à-dire la résolution directe de
l'équation intégrale en une recherche de minimum d'une fonctionnelle positive
du genre [4] :
Il Af - 4~~ 2 + a II u II 2
(4 )
où A est l'opérateur intégral , L en opérateur linéaire choisi pour stabi -
liser, a un paramètre positif, f et g des fonctions définies, sur l e
domaine D, g = g + 6g et II
II une norme définie sur l'espace des
fonctions .
Si 6g -} 0 et a -~ 0 la fonction f solution tend vers la solu-
tion unique, si elle existe, de l'équation intégrale
Af = g .
Une autre méthode de résolution du problème est la méthode i téra-
(3 )
tive [ 5 ] .
fn+l = fn + aAt (9 - A fn ) (5)
n = 0, 1,
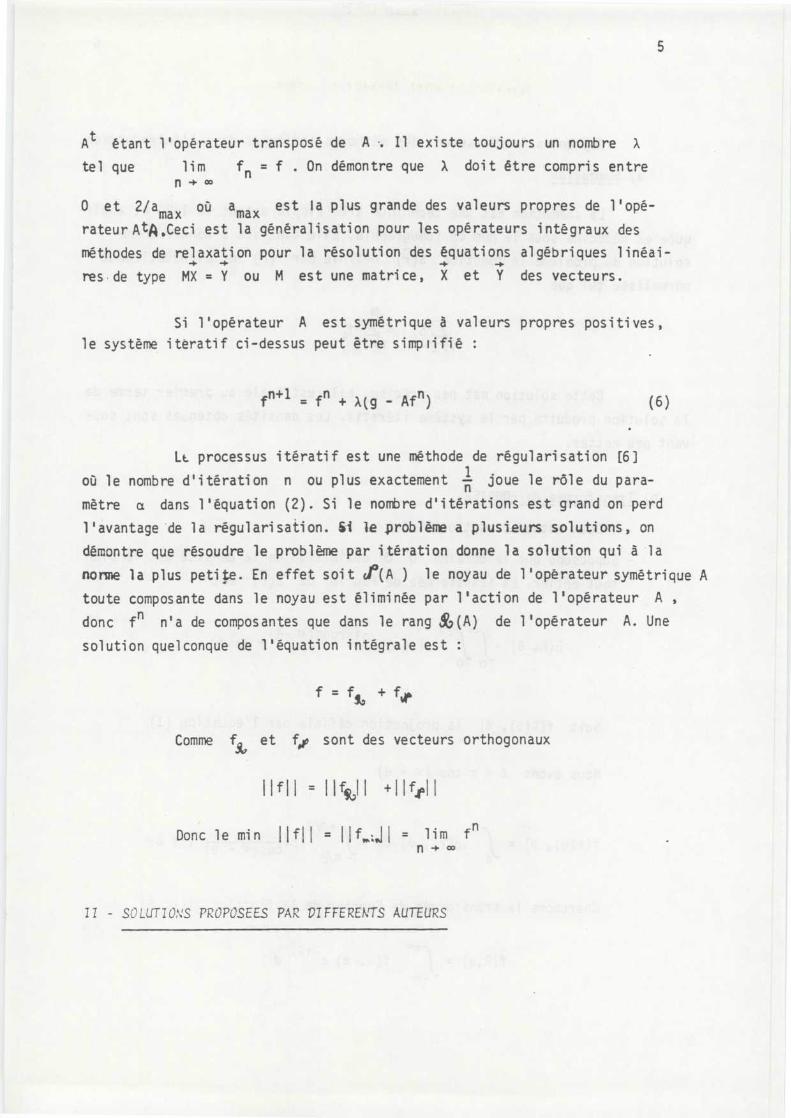
5
At étant l'opérateur transposé de A
Il existe toujours un nombre X
tel que
1 im
fn = f . On démontre que X doit être compris entr enco
0 et 2/amax où amax est la plus grande des valeurs propres de l' opé-
rateur AtA,Ceci est la généralisation pour les opérateurs intégraux de s
méthodes de relaxation pour la résolution des équations algébriques l i néai -
res , de type MX = Y ou M est une matrice, X et Y des vecteurs .
Si l'opérateur A est symétrique à valeurs propres positives ,
le système itératif ci-dessus peut être simplifié :
f
= f + X(g - Afn )
U. processus itératif est une méthode de régularisation [6 ]
où le nombre d'itération n ou plus exactement 1 joue le rôle du Para-
mètre a dans l'équation (2) . Si le nombre d'itérations est grand on perd
l'avantage 'de la régularisation . Si le problème a plusieurs solutions, on
démontre que résoudre le problème par itération donne la solution qui à l a
norme la plus petite . En effet soit f(A ) le noyau de l'opérateur symétrique A
toute composante dans le noyau est éliminée par l'action de l'opérateur A ,
donc fn n'a de composantes que dans le rang t(A) de l'opérateur A . Une
solution quelconque de l'équation intégrale est :
f = f + f
Comme
et foo sont des vecteurs orthogonau x
Ilfil = 11flI
+1 1 ft l
Donc le min
Ilfil = 11fJI = 1 i m fnn
I 1 - SOLUTIONS PROPOSEES PAR DI FFFRFWTS AUTEURS
(6)
6
Reprenons le classement des méthodes indiquées dans l'introduction .
a) Somatio n
La sommation est une technique très simple datant de 1920 et appli-
quée en médecine sous le nom de tomographie . Elle consiste à donner comme
solution du problème la fonction S(r) définie par (2) et éventuellemen t
normalisée tel que
m
Es . -E fie °) •
k .1 k
Cette solution est peu précise, elle est égale au premier terme de
la solution produite par le système itératif . Les densités obtenues sont sou -
vent peu nettes .
b) Irr2r1Q1E R
Deux méthodes sont utilisées :
- Supposons que le domaine D de définition de la densité est le pla n
tout entier . La. transformée de Fourier de p(r) est :
'p(R,6) =ff2Tr
p(r,P) e- iRrcos(‘P -8)
r dr d~
Soit f(i(9), 8) la projection définie par l'équation (1 )
Nous avons 2, = r cos ('P - e )
f(~ e ) , e)
£ b p(r , 40 ) ds =f+' 27/2
cos( ,P
8~
) d ao
Cherchons la transformée de Fourier de la fonction f(Z, e )
f R,8 =
f(K, 8 e-i R; '..00
7
r+7/2 2, 2,
7/2 0cos(4) - ej
. ~o)e-icos2('P- 8) di
d ao
f00
27 -i Rr cos(~o -e)r e
)r dr d e
f( R , 8 ) = p ( R , 8 )
Pour trouver la solution p(r,8) il faut faire une transformatio n
de Fourier à une dimension sur les projections f (L, e), puis une transforma-
tion inverse à deux dimensions du résultat . Le calcul est très long même ave c
des ordinateurs puissants /et n'élimine pas les composantes très oscillantes .
- Reprenons l ' équation (3) ; c'est une équation de convolution ,
prenons les transformées de Fourier de chacun des membres en utilisant les
théorèmes sur les convolution s
S(R,e) = (R, 8) x .57 (r' l )
La transformée de Fourier de r-1 est égale :
r-1Jo(21r RS) r dr = R- 1
ou J o est la fonction de Bessel définie par l'équation intégral e
J ~Z~= 1 f2 ~ eiz cosw dw
0
2 n 0
S(R,e) . R = p (R,e )
Donc
fa= 2n
Donc
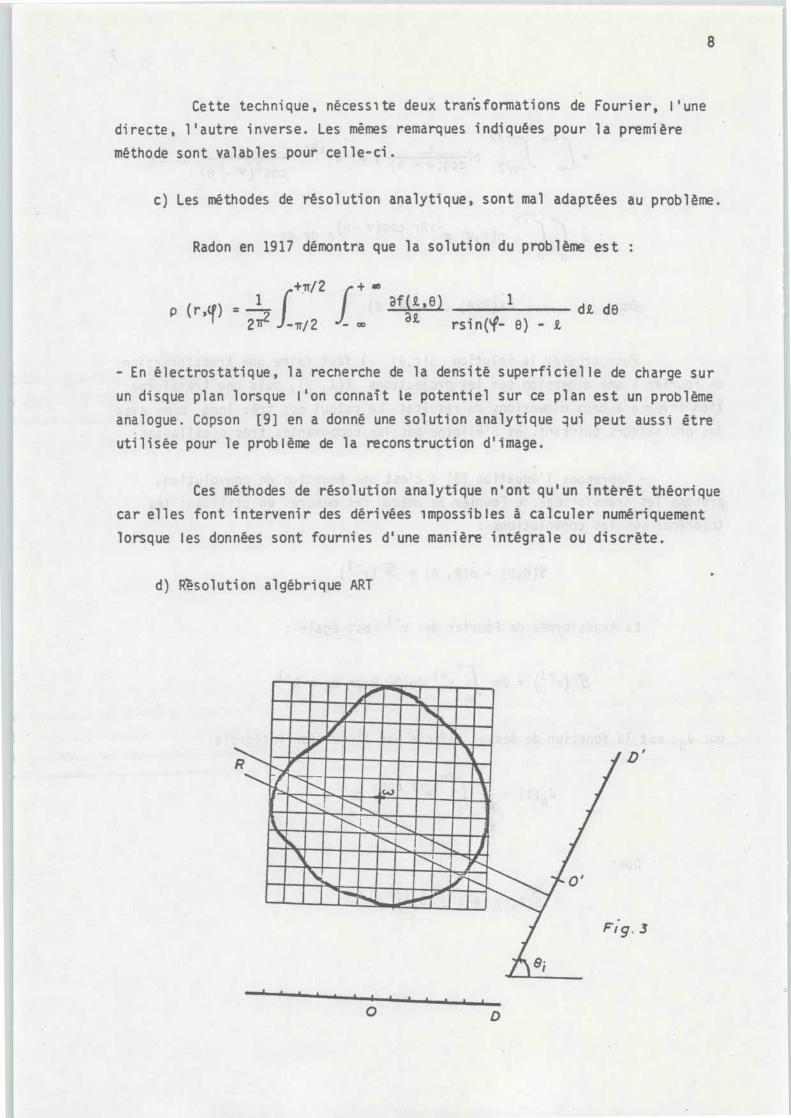
8
Cette technique, nécessite deux transformations de Fourier, l'un e
directe, l'autre inverse . Les mêmes remarques indiquées pour la première
méthode sont valables pour celle-ci .
c) Les méthodes de résolution analytique, sont mal adaptées au problème .
Radon en 1917 démontra que la solution du problème est :
+ ,7r/2
+ . e
1p (r,97)
af(t,e) , i- --
,2
-n 2
-
32, rsin - e - L
- En électrostatique, la recherche de la densité superficielle de charge su r
un disque plan lorsque l ' on connaît le potentiel sur ce plan est un problème
analogue . Copson [9] en a donné une solution analytique qui peut aussi être
utilisée pour le problème de la reconstruction d ' image .
Ces méthodes de résolution analytique n'ont qu'un intérêt théorique
car elles font intervenir des dérivées impossibles à calculer numériquement
lorsque les données sont fournies d'une manière intégrale ou discrète .
d) Résolution algébrique ART
di d e
Fig . 3
o
D
9
9
Supposons une partition du domaine D (voir fig . 3) ,
chaque détecteur D possèdent p
canaux . La projection des fonctions den-
sitées p i pi valeur moyenne de p sur un carré élémentaire est égale à
Ak p = Fk
où
re résente le vecteur de n 2 com osantes
A
l a matrice de di -p
P
P
p i ~
kmensi on n 2 x de ro 'ecti on sur une droite de direction e • et F
un vec-p
p ~
~
kteur dont les p composantessont les mesures faites dans chaque cana l
Si les mesures sont faites à m angles e, nous aurons m rel a-
tions linéaires du type de l'équation (7) .
Si l e nombre d'informations réelles es t é al à n2
nombre de9compos ants p i de p , le problème défini par les équations (4) serait peut
é tre uni que , mais ceci est rarement l .e cas , l e nombre m de di rection angu-
l ai re 8i est ~bi en inférieur à n . Le système formé des m équations ( .7 )
aura plusieurs solutions .
Gordon, Bender et Hermann [ 2 . 1 ont développé la méthode ART pour
résoudre les systèmes d'équations (i ) .Dz,,,,x al gori thmes ont été proposés pou r
cette méthode :
n+l
fk( e )- Méthode mul ti pl i cati ve p . _ ' . pni
, I pn
ije R
JER signifie que l'élément de surface j se trouve dans l e
rayon R de projection .
pi+l _ pi + tfk ~ e ~ _ ~ ~~~~ Nk ~ e ~
jeR ~
N k (e) , nombre de carrés j se trouvant dans le rayon R .
Les auteurs démontrent, au moins pour l a méthode additive que
cette méthode converge et que ~a solution obtenue par ces itérations est de
norme minimale .
- Méthode additive
10
Plusieurs variantes ont été déduites de la méthode ART, presque
toujours de manière empirique . Les principales ont été testées et comparée s
par Ganapol [7 ] .
Les méthodes ART sont très utilisées, leur expression est simpl e
et correspond bien au problème discrétisé . Mais la convergence n'est peut être
_tas toujourssatisfaite et _lecritère d'arrêt pour unesolution " correcte "
n'est pasdéfinie . Des améliorations pourraient être apportées (voir 1' a rti -
de de Gordon, réf . Cl]) celle proposée de minimiser une . fonctionnelle du type
(4) serait bien sûr excellente
J (a )= J
( p ()
P) 2 dr + a J 1()I2 dr
m
m
œ
m
p étant la densité uniforme correspondante .
1
fZ8 d2~ s
S surface du domaine
de définition .
La recherche de la solution unique p(r) qui minimise la fonction-
nelle est un problème ardu, le temps mis pour calculer cette solution, même
avec des ordinateurs puissants devrait être tel que le coût en serait prohibi-
tif .
Les méthodes utilisées jusqu ' à présent et décrites ci-dessus ten -
tent de résoudre le plus exactement possible le problème . Celui-ci étant ma l
posé au sens d' Hadamard, les solutions numériques sont souvent différentes e t
à moins d'avoir un grand nombre de clichés les reconstructions sont parfoi s
"fantaisistes" .
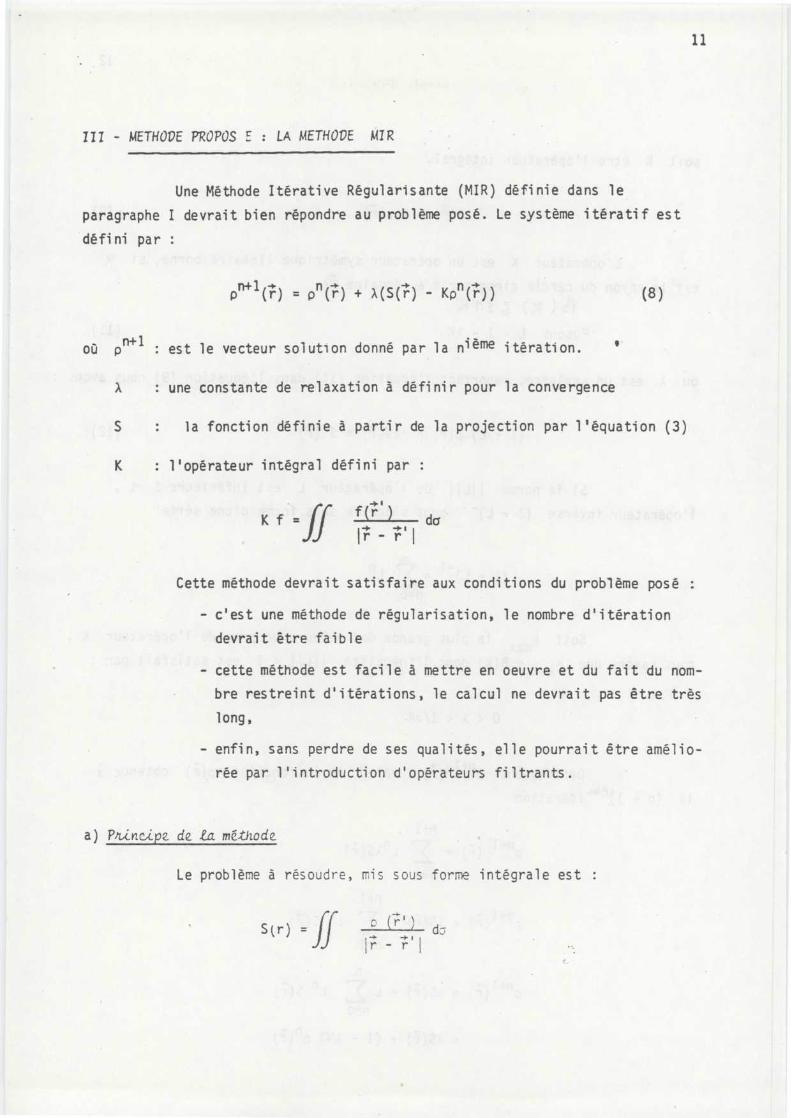
1 1
III - METHODE PROPOS E : LA METHOVE MI R
Une Méthode Itérative Régularisante (MIR) définie dans l e
paragraphe I devrait bien répondre au problème posé . Le système itératif es t
défini par :
p
(r) = p (r) + X(S(r) - Kp kr) )
où p
: est le vecteur solution donné par la n ieme itération .
a
: une constante de relaxation à définir pour la convergenc e
5
▪
la fonction définie à partir de la projection par l ' équation (3 )
K
: l'opérateur intégral défini par :
K f =
f( ' )
da
Ir - ; s i
Cette méthode devrait satisfaire aux conditions du problème pos é
- c'est une méthode de régularisation, le nombre d'itération
devrait être faibl e
- cette méthode est facile à mettre en oeuvre et du fait du nom-
bre restreint d ' itérations, le calcul ne devrait pas être trè s
long ,
- enfin, sans perdre de ses qualités, elle pourrait être amélio-
rée par l'introduction d'opérateurs filtrants .
a) Pn.incip2 deLa méthod e
Le problème à résoudre, mis sous forme intégrale est :
S(r) =ff ~ d.-y
I r - r
(8 )
9
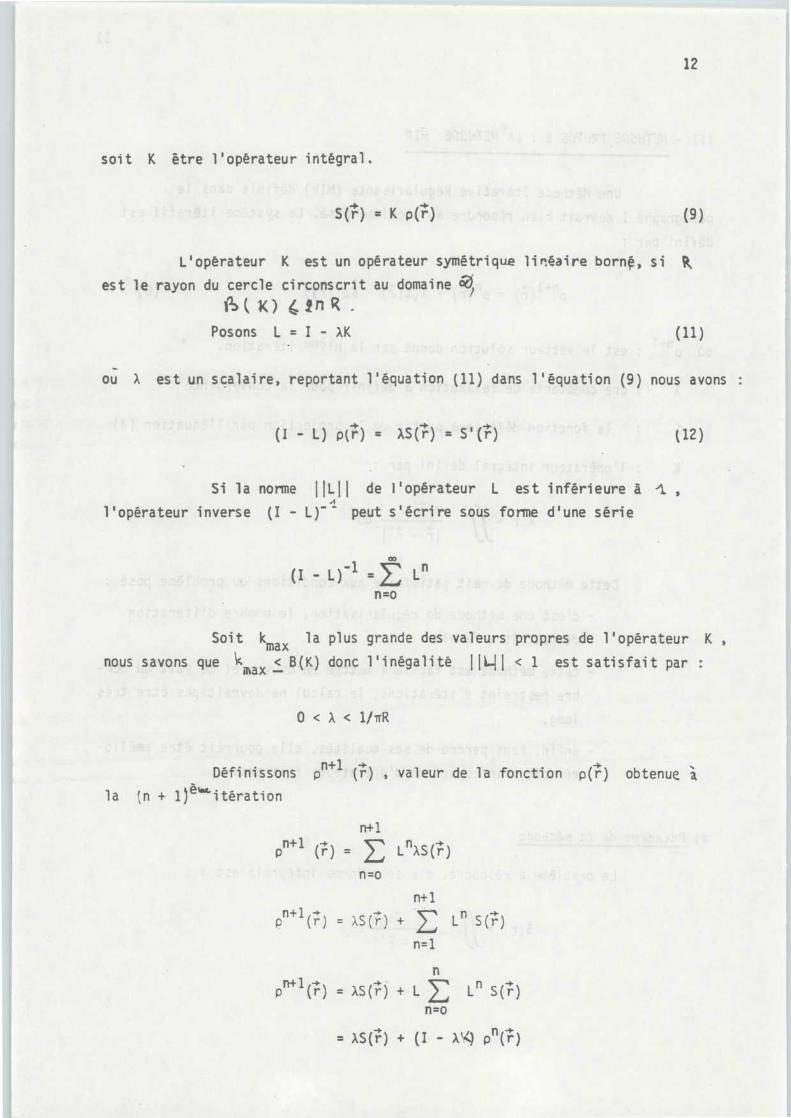
12
(9 )
soit K être l ' opérateur intégral .
S(r) = K p(r)
L ' opérateur K est un opérateur symétrique l i réai re born, si Rest le rayon du cercle circonscrit au domaine 0,
6(10 C4nR .
Posons L = I - AK
(11 )
ou X est un scalaire, reportant l'équation (11) dans l'équation (9) nous avons :
(1 - L) p(;) = XS(h = S'(;)
(12 )
Si la norme III:;1I de l ' opérateur L est inférieure â dl ,
l'opérateur inverse (I - L) - 'l peut s ' écrire sous forme d ' une séri e
œ
I-L= :E: L n
n=o
Soit kmax la plus grande des valeurs propres de l ' opérateur K ,
nous savons que
< B(K) donc l'inégalité
< 1 est satisfait par :kmax
0<a<1JnR
Définissons
n+1 (r ) , valeur de la fonction P( )r
obtenue ala
n + 1)
iteration
n+ lpn+l (r) = ~ L naS(r )
n=on+ l
,n+ '( ;) = xso,)
E
L n sot )n=1
nn+l (r) = XS(r) + L
L ~p
S(r )n=o
= as(r) + ( I - X') Pn ( r )
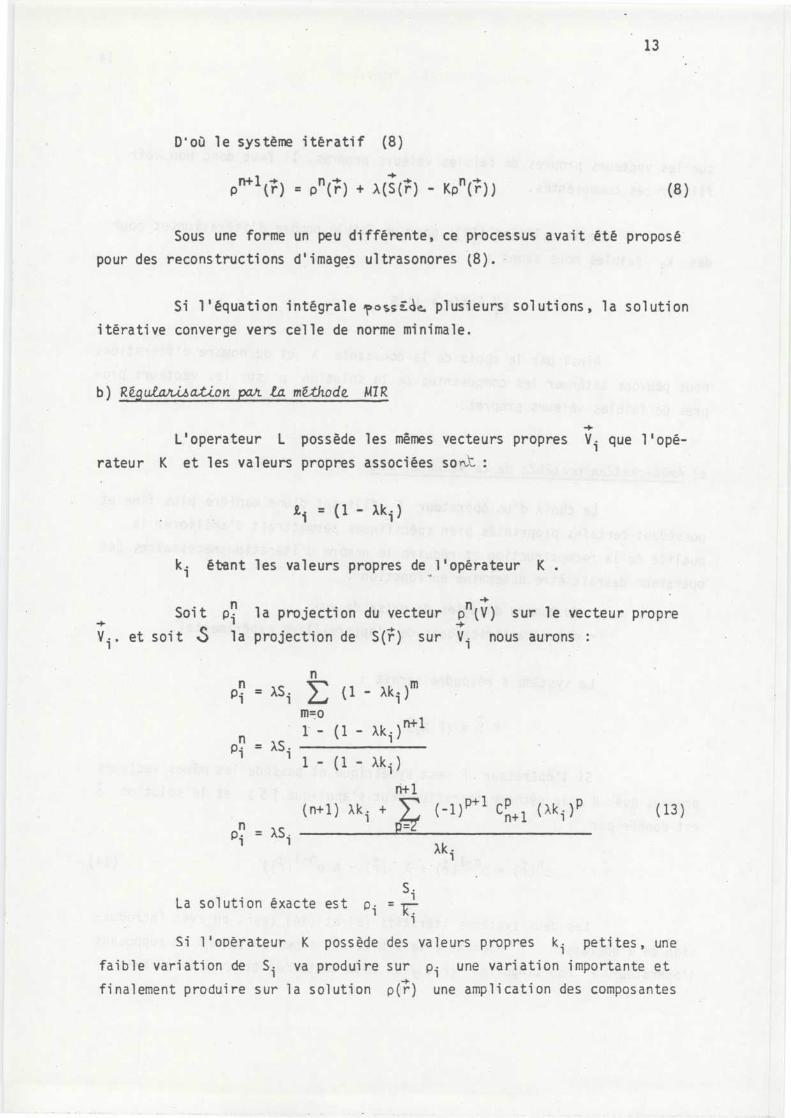
1 3
D'où le système itératif (8 )
p
(r) = p (r) + A(S(r) - Kp (r) )
Sous une forme un peu différente, ce processus avait été propos é
pour des reconstructions d'images ultrasonores (8) .
Si l ' équation intégrale 'pbss ids. plusieurs solutions, la solutio n
itérative converge vers celle de norme minimale .
b) Régu a/ti.sa on pan ta méthodeMI R
L'operateur L possède les mêmes vecteurs propres V i que l'opé-
rateur K et les valeurs propres associées so i
~i = (1 - Ak i )
k i étant les valeurs propres de l'opérateur K
Soit pin la projection du vecteur pn (V) sur le vecteur propr e
V 1• . et soit S la projection de S(r) sur V i nous aurons
n
pin = ~S •
:E:
( 1 - Xk •) m
m=o
1 - - 1- Xk•n+ l
np =AS.
1- 1 -Ak•
(8 )
n+ 1
(n+l) ak a + (1)P+lcn+l (ak i ) P
(13 )
Pi = AS 1-1 Ak i
SiLa solution éxacte est p i =
Si l'opérateur K possède des valeurs propres k i petites, un e
faible variation de S i va produire sur p i une variation importante et
finalement produire sur la solution p(r) une amplication des composantes
14
sur les vecteurs propres de faibles valeurs propres . Il faut donc pouvoi r
filtrer ces composantes .
De la relation (13), pour un faible nombre d'itérationset pour
des k i faibles nous avons :
Pin
À (n + 1 ) Si
Ainsi par le choix de la constante a et du nombre d'itérations
nous pouvons atténuer les composantes de la solution p sur les vecteurs pro-
pres de faibles valeurs propres .
c) Amétiona,i o npoa .3 .ibeedeta méthode MIR,
Le choix d'un opérateur F filtrant d'une manière plus fine et
possédant certains propriétés bien spécifiques permettrait d'améliorer l a
qualité de la reconstruction et réduire le nombre d' i térati onsnécessai reS Cet
opérateur devrait être déterminé en fonction :
- du nombre d'angles de prise de vue
- des caractéristiques de l ' appareillage expérimental .
Le système à résoudre serait :
F .S=(FK)p
Si l'opérateur F est symétrique et possède les mêmes vecteurs
propres que K , la méthode itérative peut s'applique [Si et la solution p
est donnée par
n (r) = pn-1 ~r~ + a ' .(r) - K pn- 1p
r ) )
Les deux systèmes itératifs (8) et (14) (sans ou avec introduc-
tion de l'opérateur F) donnent à la limite les mêmes solutions en supposan t
l'opérateur F non singulier (F f y 0 pour toute fonction f
0) . Mais
(14)
15
lorsque le nombre d'itérations est fini les deux systèmes ne sont pa s
équivalents .
d) Exempte deneconstActio n
Une application d la méthode MIR a été faite à la reconstruc-
„ti aa du d
' ne carré de dimension 30 x 30 dont la densité est définie pa r
l a so ro . des densités suivantes :
- pl = 5 définie sur le cercle de rayon R = 15 centré au poin t
15 - 1 5
2-
= 10 défini sur trois cercles de rayon R = 2 .5 , centré s
aux points 9-23 , 23-23 et 15-15 . .
La reconstruction a été faite en supposant quatre angles de pro-
jection 0° , .45° , 90° , 135° . La . partition du domaine
a été faite en
.900 domaines élémentaires Q~ carrés de dimension 1 x 1 . On suppose l a
fonction p(h constante sur le domaine
, ayant la valeur pi .. Les droi-
tes de projections possédaient 45 canaux de largeur 1 .
La fonction S(r) supposée constante sur 4D1. est donnée par :
si• =
w>• i~k
j
fk est la donnée contenu dans le canal de la projection k ,
la somme sur l'indice j se fait sur tout canal contenant la projection d'u n
élément At . de la surface élémentaire or,- .
Nous présentons, sur les figures 4 à 7 données en fin d'arti -
cle, le résultat obtenu en fonction du nombre d'itérations . A partir d'un
certain nombre d ' itérations il y a peu de modifications apportées à la solu-
tion . Ce cas est théorique, donc pas d'erreur sur ► es données, le filtrage n' a
pas grand sens .
16
lorsque le nombre d'itérations est fini les deux systèmes ne sont pa s
équivalents .
d) Exempte denecon. uLcti.on
Une application de la méthode MIR a été faite à la reconstruc-
tion du domine carré de dimension 30 x 30 dont la densité est définie pa r
la some des densités suivantes :
- p i = 5 définie sur le cercle de rayon R = 15 centré au poin t
15 - 1 5
2 = 10 défini sur trois cercles de rayon R = 2 .5 , centrés
aux points 9-23 , 23-23 et 15-15 .
La reconstruction a été faite en supposant quatre angles de pro-
jection 0° , 45° , 90° , 135° . La . partition du domaine Z a été faite en
900 domaines élémentaires Z i carrés de dimension 1 x 1 . On suppose l a
fonction p( )r constante sur le domaine l>• , ayant la valeur p i Les droi-
tes de projections possédaient 45 canaux de largeur 1 .
La fonction S(r) supposée constante sur 4Di est donnée par :
=Si -
E wi • fk
k
j
âfk est la donnée contenu dans le canal
de la projection k ,
la sonne sur l'indice j se fait sur tout canal contenant la projection d'un
élément ." . . de la surface élémentaire O .
Nous présentons, sur les figures 4 à 7 données en fin d'arti -
cle, le résultat obtenu en fonction du nombre d'itérations . A partir d'u n
certain nombre d'itérations il y a peu de modifications apportées à la solu-
tion . Ce cas est théorique, donc pas d'erreur sur les données, le filtrage n' a
pas grand sens .
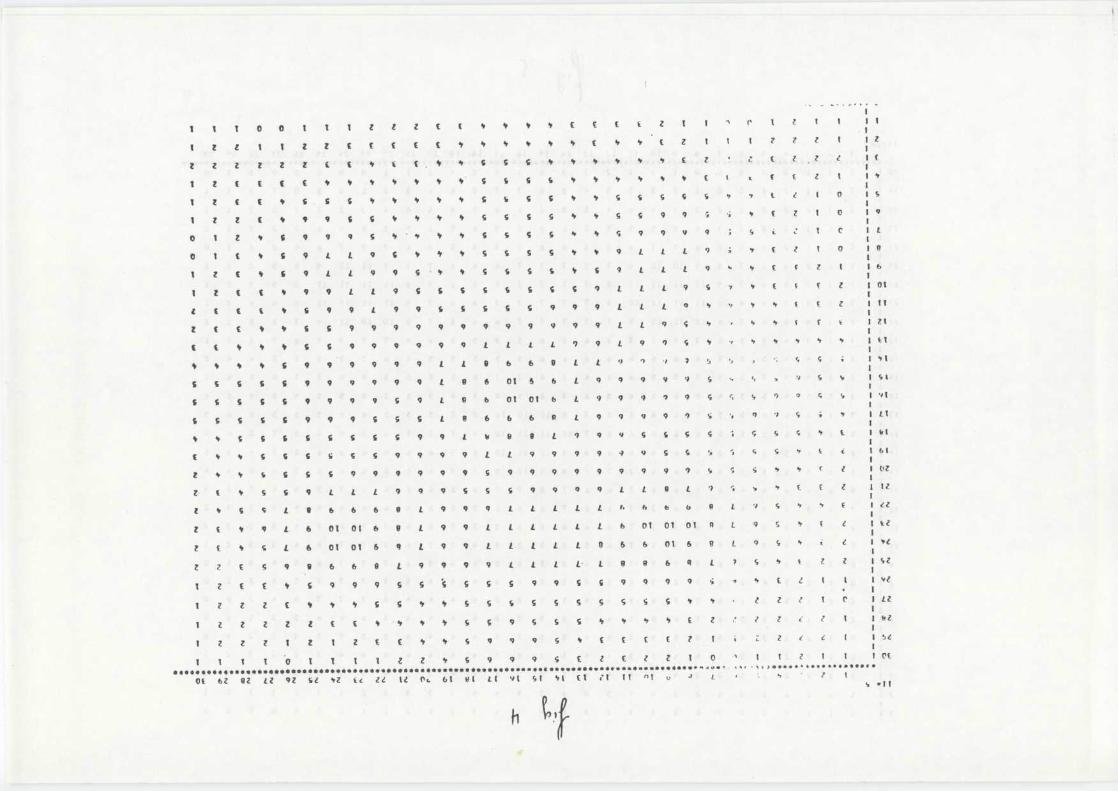
1 1 i 0 0 1 I t Z f t y 1 1 ti E E E V. Z 1
9 t` 1 Z 1 I i
l
1
I i t 1 l Z Z t f 4 E f 1 ti y 1 1 y E 4 ip [ Z 1
I 1 Z Z Z 1 I
Z1
2 Z Z Z t 2 f t 1 E E , l► S S S 1 y y 1 y y E Z Z [ Z t t I
E
I Z E t 4 E 1 1 1 4 , 1 S Si S S y 1 y 9 9 t t f E t t 1
t
1
0
2
i
1
E
Z
Z
f
t
y
i
9 9
ti
S
9
6
g
9
S
S
9
1
S
S 9
1
,
y9 1
y
ti
S
S
S
L
S
S
S
S
5
S
S
S
y
ti
ti
y
y
9
S
S
S
S
S
9
S
9
9
S
9
9
S
ti
S
9
9
'r
9
5
L
t
i
t
Z
1
1
t
0
0
C
I
S
1 9II
L
0 1 t f 9 L L 9 4 1 1 S S 5 S 1 9 L L L 9 ' f Z i 0 1 9
l 2 f S 9 L 9 9 S 1 S 4 S 4 1 S 9 L L L 9 Z I 1 6
I i t t 1 9 9 L t 9 f S S S S S S S 9 L L L 9 S
' E F f t 10 1
Z
Z
E
f
t
4
E
y
L
y
9
S
9
9
L
9
9
9
9
9
6
9
S
9
Sr
9
S
9
S
9
9
9
9
9
9
9
L
L
L
L
L
9
9
ç
y
' ►
y
1
ti
ti
ti
t [
E
t
t
1
1 1
IZ t
t t 1 1 Sï 5 9 9 9 9 9 9 L L L l 9 9 L 9 9 S 1
'r b y 1 1 ti 19 1
1 1 1 f 9 9 9 9 9 9 L 1 9 6 6 9 L L 9 , S S I9 11
S
S
S
S
Si
S
S
S
t
Iï
9
9
9
9
9
9
9
9
9
S
0
9
L
L
A
A
6
b
O l
01
6
01
6
6
L
L
9
9
9
9
9
9
9 9
9
S
S
(P S
,
9
9
o
S
9
y
S
19 1I19 1
9 9 S 0 ', S 5 '► It lS L S S f 9 9 9 5 S S L A 6 6 6 R L 9 9 9 ,
1 1 4 S 4 S 4 S S S 9 9 L d d g L 9 9 9 S S S S S 5 9 ti t 1
6 1
E y y S S S S, S S 9 9 9 9 L L 9 9 9 9 9 9 S S 5
, 4 S , t 4 1
b l
Z y y Si Sï y S 9 9 9 9 9 9 S 4 9 9 9 9 9 9 9 9 S
S S 9 9 s Z lot
Z t y S S 9! L L 9 9 9 S S S 9 9 9 L L 9 L 9 y ti [ f t 1
I l
t 1 4 C L 1 b 6 6 8 L 9 9 9 L L L L L i, h b b R
L S ti ' f Ie l
f 9 L 6 01 01 6 B L 9 9 L L L L L L h 01 01 01 R
L 9 S ti t Z t
t t
Z t 1 S L 6 01 01 6 9 L 9 9 L L L L L 0 6 6 01 6 9
L 9 S h t C + t
Z 7 E S 9 Ii 6 6 8! 9 9 9 4!! L L 9 A 6 R L S '► 4 Z Z I
S Z
1 t f t S 9 9 9 S S S S S S 9 9 ç ç 9 0 9 9 y
9 ti E 1 I 1
9 1
1 Z l 2 f 1 1 S Sï 1► y 4 S S S S S S S S S y 9 t Z ' 1 C I
L Z
1 Z t t Z Z f E 4 1 S S 9 S S S 9 h 9 E Z ' Z Z I !NZ
1 Z t t t Z 1 2 f f ti 1 S 9 9 9 S 9 f E E E Z t Z Z 1. L I I
5 Z
I t 1 t O l I 1 1 Z t 4 S 9 9 9 S E Z E Z t I 0
' I 1 Z I 1 let
•000A00000.l .•A• .i 0,000*•••
O** .* 0 0 0 * . 0 • * . . . . 10 j . 4 s 6000 * .n ,t o . +
04
6Z
A2
LZ
92
SZ
',Z
[c
ZZ
It
f
61
!!t
LI
91
SI
91
El
Zl
II
91
u
L a
Z
t
h
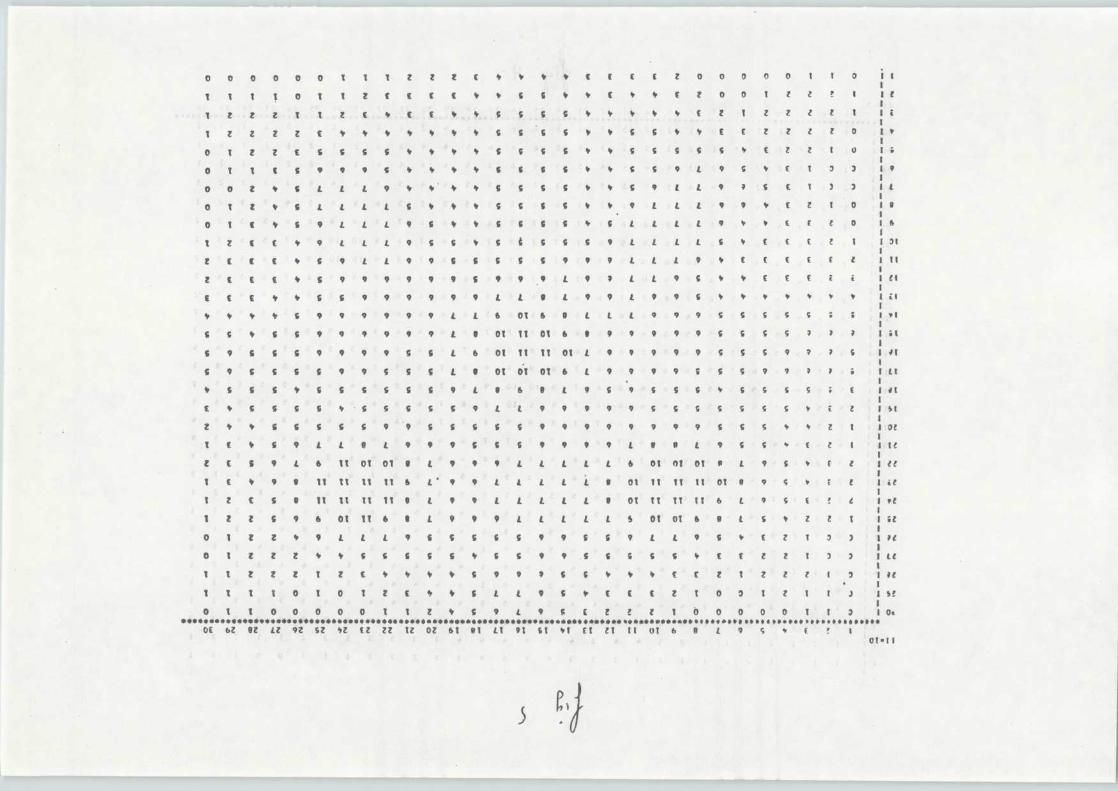
0 0 O O 0 0 t 4 t 2 i Z [ ♦ ► ♦ ♦ t E E E Z O 0 0 0 0 l I 3 1
1
l
l
1
L
1 1
Z
O
i
1
I
l
Z
Z
f
t
♦
f
f
[
f
E
♦
♦
1
♦
i G C S
♦
•
E
►
ti
1,
♦
1
E
ti f
0
2
0
1
i
Z
2
I
t
L
!
L
1
1 1
1 i Z Z Z f ♦ 1 ♦ ♦ ► 1 ti t g S S ► ♦ S L ♦ t E f i Z 0 l
O Z 2 2 f L L S L f ♦ ♦ 1 t 4 L i ♦ L G S S S ♦ f i Z t U 1
L
0 1 L t S 0 9 9 L 9 ti ti i C 6 i 9 9 t L 9 L 9 S 7 f I 3 3 1
0
0 O Z ♦ 4 L L L 9 ~ ♦ ♦ 1 4 L t t ► ♦ t 9 L L 9 S f t ) ) 1
0 t t ♦ t L L L L i ♦ ♦ • i c 0 0 t t L 0 0 ♦ E i 1 0 1
0
0 1 [ ♦ i 9 L L L 9 i ► ♦ f i i i ♦ t L L L L 9 ♦ ♦ ( E t 0 !
6
L i f f 9 L L L 9 i g 1 S g S t 9 L L t L f tt E t t 1 1
3 1
2 t t E ♦ t 9 L L 9 9 t t i ! L 0 9 0 L L L 9 ♦ E f f f f 1 1
t l
2 E E f ♦ i 9 9 9 9 9 9 S • 9 0 L 9 i L L 9 L ♦ f E E E i t
C t
E f E ♦ G i 9 9 9 9 9 9 L L 9 L 9 9 L 9 9 i ♦ ♦ ► • • 9 1E 1
1 ♦ ♦ 4 S 9 9 9 9 9 9 L L 6 Ot 6 0 L L L 9 9 9 S S S S S G 1
► I
G t ♦ f S 9 9 9 9 9 9 L • OL It Ol 6 t 9 9 9 9 9 t t S S 7 7 7 1i
5 9 G L G 9 9 9 9 S i L 6 Ot /1 It Oi L 9 9 9 9 9 S S S 9 9 7 L 1
i f
t 9 t S f C 9 9 S S L L • Ot 01 OZ 6 L 9 9 9 9 's 4 S 9 7 i i 1
L I
f f L ♦ L S S L L C 9 L t 6 A L 9 L 0 S S 6 ti G S G S E I l
E ♦ ! S S L ♦ L S L L S 9 L [ 9 9 9 9 9 S L S S S S S ► E 1
! 1
4 ♦ ! 5 f t f 9 0 L i t t S 9 9 9 9 9 9 9 9 f t S Z 1 lot
t f ~ i 9 L L 9 L 9 9 9 C L 4 9 9 9 9 L • A L 9 G S ti f L 1 I t
L C i 9 1 d Il OT 01 0 L 0 9 9 L L L L L 6 Ol Al Ot P L 9 S t f L 1
l l
L E ♦ 9 B It 1l 1l IT 6 L ' 9 9 L L L L L • 01 11 Tt ti Ot 0 9 S r e t 1
i t
t t t S • ll i[ il It t L 9 9 L L L L L / OT 1t It It 6 L 9 S E ' C r t
1 Z ! 9 6 Oi It e e L 9 9 9 L L L L L S Ot Oi s 9 L S ♦ Z t i 1
+ t
0 I Y ♦ 9 L L L 9 t S t i 5 9 9 t 6 9 L L 9 fi 1 f 2 L 3 3 !
? l
0 i Z L 4 S t ! ! f 1 i i 9 9 f i G S f ~ E E L Z 1 3 1 1
l l
1 t Z t t t E 4 ti ti 1 9 9 9 9 i G ti 9 ti f f Z I Z Z Z 1 3 1
1 e
t t t t O t O t Z E 9 9 E L L 9 i ► E E E Z t O J t Z 1 t J I S e
O t t 0 0 0 0 0 1 1 t 1 S 9 L 9 E t Z Z 1 0 0 0 0 0 t t 3 1
Ot0000000+100*00**+000,0 0 .09M.0400 .0t0t *40 *10O.O .*000 0 *6001000000*100•000s0100• 0 * * *0r000*« i .i.100rt0RfM0001 11 0 ► 0 ► 0 . ► 00 ►► 00 ►►►► 1 ►010 .
OE 6Z 9Z LZ 9Z SZ 9Z EZ ZZ tZ OZ 61 91 Lt 91 it Vt Et El It UT 6
9
L
9
S
9
E
!
I
OM I
5 q-
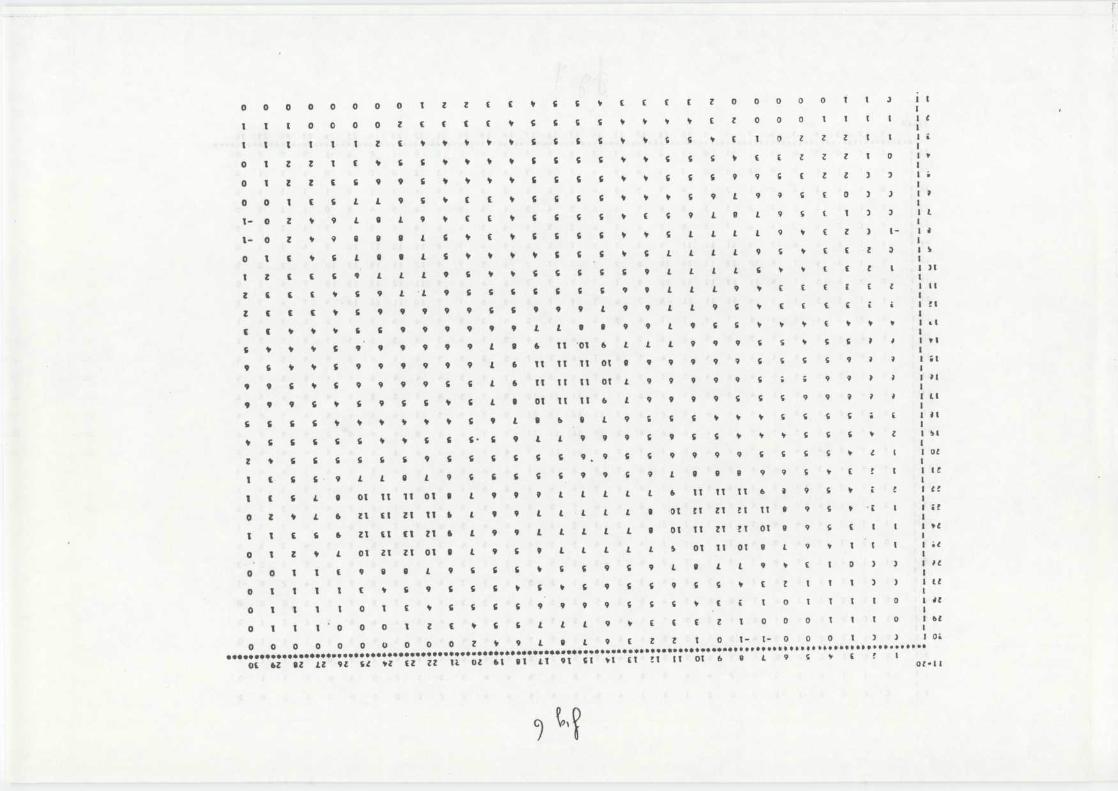
q O O O O 1 Z Z E E 4 6 6 E
f
f
E
Z
0
0
0
0
0
t
I
3
1• I
q 0 0
q O O O Z E f E E • 6 6 S S 4
4
4
E
Z
0
0
0
t
1
t
I
I tt
t
t
I
Z
E
4
y
4
y
y
ç
ç
S
S
1
y
S
ç
4
f
1
0
Z
Z
Z
I
t
1 it
t
1
1
t
q I Z Z C 4 6 ç 4 4 4 6 6 ç ç 4 S S 6
E
E
Z
Z
Z
I
0
l +t
y
ç
~,
9
9
G
E
Z
Z
3
J
L i4
ti
1
4
ç
ç
ç
çq t 2 Z C ç 9 9 6 4 6
i
E
E
4
ç
ç
ç
ç
4
4
4
ç 9
L
9
9
S
f
0
)
1 9q O t E S L 1 9 ç
I- O
Z
4
9
L
A
L
9
4
E
E
4
ç
6
S
S
4
E 9
L
B
L
9
S
E
I
3
J
1 t
ç
y
E
b
ç
ç
G
6
4
4
S L
L
L
L
9
4
E
Z
)
I-
1t- 0
Z
4
9
A
A
A
1
ç
4
1
1
4
ç
6
ç
ç
L L
L
L
9
S
4
E
E
Z
3
I Sq t C G L A 1 1
Z
C
L
L
L
9
ç
4
1
ç
S
ç
ç
ç
9
L
L !
L
ç
y
1
E
f
t
l
1 l ll
C
ç
9
9
ç
ç
6
ç
ç
ç
9
9
L
L
L
9
f
E
E
E
E
i
11 1Z
C
6
E
i
ç
9
L
L
1
ç
1
E
E
i
i9
9
9
9
ç
ç
9
9
9
L
9
9
L
L
9
E
E
t l
Z
C
C
f
4
6
9
1
E C y 4 4 6 6 9 9 9 9 9 9 L L A A 9 9 L 9 6 S 4 4 1 E 4 4 4 1 al
9
9
9
9
9
L
A
6
11 01 6
L
L
L 9
9
9
ç
S
4
ç
ç
?
>
14 1ç
4
f
6
9
9
9
9
9
9
9
L
6
It IT II O1 9
9
9
9
9
9
ç
S
S
S
9
0
0
t G l9
6
ti
4
ç
1
9
S
G
L
6
It It 11 O1 L
9
9
9
9 9
S
i
S
9
9
I 9 19 9
ç
i ç
9
9
9
9
ç
ç
•
ç
L
9
01 It II 6
L
9
9
9
9
S
6
S
9
9
9
1
i
L l9 9 9
6
6
4
ti
4
6
9
L
Y
b
p
L
9
G
S
y
4
4
S
S
5
S
i
Eç
ç
ç
ç
y
i
i
Jr y
S
ç
ç• ç
9
L
L
9
9
9
S 9
6
S
4
4
4
S
S
S
4
Z
S l1
ç
ç
6
ç
6
6
9
ç
ç
ç
ç
ç
ç
9 , 9
ç
ç 9
9
9
9
ç
6
S
S
•
1
f
10 lZ
ç
ç
6
6
6
L
9
6
ç
6
ç
6
9
9
ç
9
L
A
9
9
9
9
S
4
E
.'
t
l I tI
E
ç
ç
9
L
t
A
9
9
9
L
L
L
L
L
6
11
it It 6
i
9
6
;.
'
I t 'I
E
ç
L
9
OI Ti II 01 9
L
9
9
L
L
L
L
L
9
01
et
ZI tt
it
A
9
S
•i
t
li tq Z L 6 Zt EI Zt tt 6 L
9
9
L
L
L
L
L
A
01 11 Zt ?T 01 9
9
S
E
I
t
I ► tt
t
E
6
6
Zt Et C1 it 6
L
o
L
9
6
9
L
L
L
L
L
S 01 11 01
9
l
9
4
t
I
t
1 . tq t Z 11 01 Zt Zt O t
q O t E 9 9 L 9 6 ç ç 4 ç 6 9 ç 9 1 A
L
L
9
E
I
0
~
3
I a tt
A
6q
4 ç 9 ç 6 9 ç 6 4 E
I
t
t
)
)
l tt
t
t
t
E
4
6
9
G
6
6
ç
6
ç
ç
9
4
9
9
4
S
6 E
E
t
0
t
T
t
I
0
li eq t t 1 t 0 t E
4
ç
6
L
L
L
9
E
E E
Z
t
0
0
0
t
t
t
0
I d tq t t t 0 0 0 t Z
Z
9
L
A
L
9
E
t t
0
1- I- D
0
0
t
)
)
I O âq 0 0 0 0 0 U 0 0 0
•****0**********A** * 0 ,0* 000*** *««****«««*0**y*+*1 «Ot000$00* ► «0«w««0«•t«OP ► « ««« ► « ► « 0.t
OE 6Z At lt 9t 61 it EZ ZZ IL OZ 61 Al Lt 91 çt 41 El .t II Ot
01 . 11
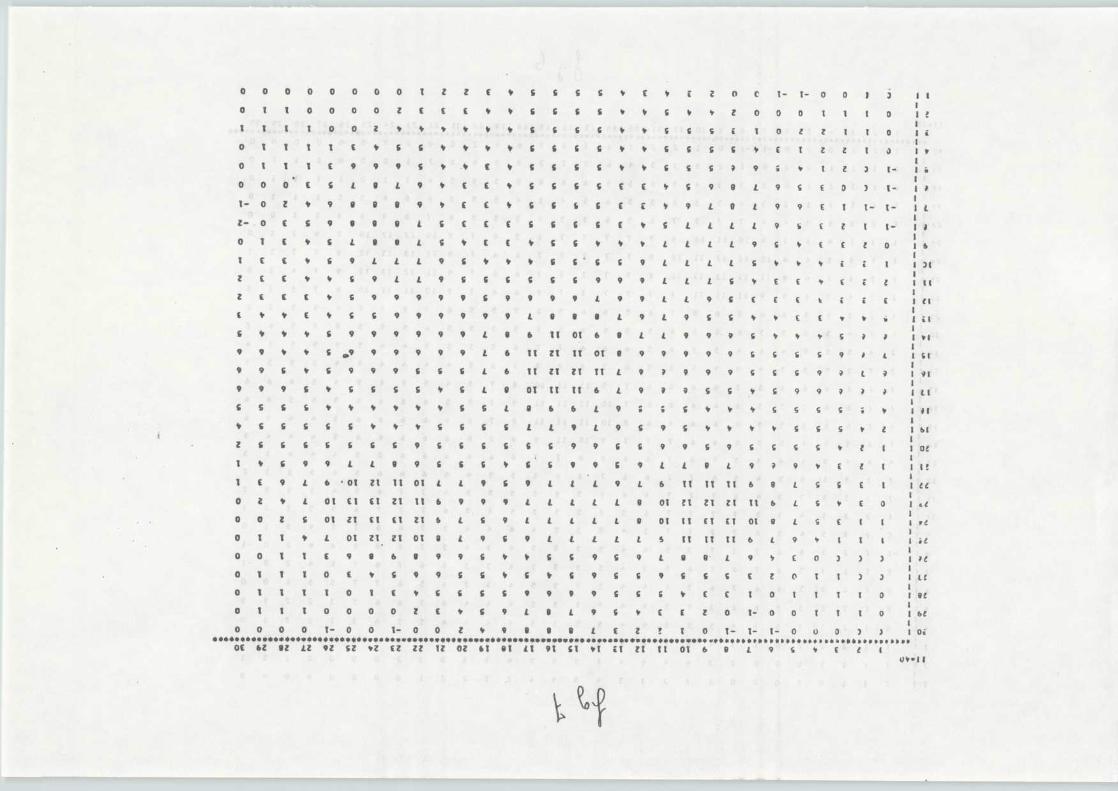
o o o o o
o o o t z z E 4 S G G G E L z o c t — T — 0 0 ! J I
t
O 1 t 0 0
0 0 Z E E E 4 4 6 G G S 4 ► 6 4 Z 0 0 0 1 i i D a.
t 1 1 1 0
0 Z 4 i 4 4 4 4 S G G G ► S G ç E t 0 t Z t t 0
0 t t t t
E 4 G S 4 4 4 4 G G G G 4 ► G G G G 4 E T Z Z I J 1
►
0 1 t t E
9 9 9 S 4 4 E 4 S S S G 4 4 G G G 9 9 ç 4 1 Z 3 t — 1 .
0 0 0 E S
L 9 L 9 ► E E 4 G S S S E E 4 S 9 9 L 9 S E 0 3 t- 1
0
1 — O Z 9
9 9 9 9 E E 4 G G G G E L 4 9 L 9 L 9 9 E 1 i — t— 1
L
Z- O E S 9
9 9 9 L G E E E G G G G L 4 S L L L L 9 ti E Z t t— I
iO l E ♦ s
L 0 • L L ♦ E E ~ G i ~ ♦ r L L L L 9 ç ~ E E t 0 I 6
t f [ ♦ i
9 L L L 9 4 4 4 4 G G G 9 L L L L G 4 4 4 E L 1 1
J t
Z E E 4 4
ç 9 L L 9 G G G G G G 9 9 9 L L L G 4 E E 4 E 'c d 1
1 1
Z E E E 4
S 9 9 9 9 9 G 9 9 9 9 L 9 9 L L 9 G E E E t L eE C 1
C l
E 4 4 E i
G G 9 9 9 9 9 9 L 9 9 9 L 9 L 9 5 G 4 ► f E r ► ,; 1t I
S 4 4 4 S
9 9 9 9 9 9 L 9 6 ti 01 6 9 L L 9 9 9 ç 4 4 4 ç 0 0 1
► I
9 9 4 9 S
o9 9 9 9 9 9 L 6 II El IT Ot 9 9 9 9 9 9 ç ç ç ç 9 L 1
S t
99546999666L6 11 Z1 Zt TT L 9 ? 9 9 9 ç ç ç 9 9 L 9 t
9 1
9 9 9 S 4
G S L S 4 G L 9 01 11 11 6 L 9 1 9 G G ç 9 9 9 1
L l
S S S 6 4
4 4 4 4 4 S S L 9 6 6 L 9 C ç G 4 4 i S S S S L 4 I
i t
G S S S
G 4 4 4 S G S S L L 9 L 9 S 9 S 4 4 4 S S S Z 1
b t
Z i S 6 S
G G G 9 6 G G G G S 9 9 G G 9 9 S 9 ç ç ç S 1 t I 0 .
1 4 S 9 9
L L 9 9 G G G 4 G G 9 9 G 9 L L 9 L 9 9 9 E Z I !
1 .
1 E 9 L 6' 01 ZT It 01 L L 9 S 9 L Z L 9 L 6 TT TT It 6 9 L S ç E i l
l l
0 Z 4 L 01
Et E1 Z1 11 6 9 9 9 L L L L L 9 01 el Zl ZI 11 6 L S E 0 1
c l
0 O Z S 01
ZT E1 El ZT 6 L 9 L L L L L 9 01 It Et ET 01 9 L S E i I t
r e
0 t 1 4 L
01 Zl Zt OT 9 L 9 G 9 L L L L L S It IT IT 6 L 9 I I 1 1
i d
0
0
0
1
1
t
1
t
E
9
0
E
9
4
6
G
9
9
9
9
9
S
G
S
4
4
4
G
G
►
G
G
9
9
6
G
9
G
L
9
9
G
9 .
G
L
G
9
E
4
t
f
0
0
T
3
I
)
)
)
J IL C
t t t 1
0 1 E 4 G G G S 9 9 9 9 G G G 4 E E I 0 T T T I 0 1V C
0 1 1 t 0
0 0 0 Z E 4 G 9 L 9 L 9 G ► E E Z 0 t — 0 0 T I I 0 16 Ct
0 0 0 0 t —
0 0 t— 0 0 Z 4 9 9 9 9 L E Z e t 0 t — t- t — 0 U 0 ) ) 0i** * iWO**0 * 0. * .000* I00000 0i 0 * 0 . . 0 ** * .0 0 *00Mi0t0**00M.O.0. 0 *. * *.'*+•***•*r* *0 0 0 *0 0 .*• * **** .*60tM661O0/010•60*0000r«66100i0*11r 0
OE 6Z 9Z LZ 9Z SZ 4Z EZ ZZ TZ OZ 61 91 LT 91 61 4t ET Zl It OT 6
9
L
9
ç
4
E
t
IU ► •1 1
REFERENCES
[1]
Special Issue on Physical and Computational Aspects of 3-Dimensional Image .
Reconstruction . IEE Transactions on Nuclear Science .
June 1974 - Vol . NS-21
I4b3 .
[2]
R . GORDON et G .T . HERMAN .
Three dimens i onnal reconstruction from projections . A review of algorithms .
Int Rev . of Cytology - A paraître .
[3]
I .P . NEDELKOV
Improper problems in computational physics .
Comp . Phys . Com .
4 - 1972 (157-464) .
[4]
D .L . PHILLIPS
A technique for the numerical solution of certain equation of the first kind
J . Ass . Comput . Mach .
1962 (84-97) .
G . RIVIER E
Régularisation d'opérateurs
Rev . Inf . Rech . Opér . 1967-5 (57-79 )
[5] O .N . STRAN D
Theory and methods related for the singular function expansion and Landweber' s
iteration for solving integral equations
SIAM J . Numer . Anal
Vol II N° 4 1974 .
[6] A .B . BAKUSAINSKI I
A general method of constructing regularizing algorithms for a linea r
incorrect equation in Hilbert space
USSR Comput . Math . and Math . Phys . 7-1967 (279-287) .
[7]
B . GANAPO L
2 .D . Image reconstruction from projection with application to tomography
1974 Rap . int . SERMA-R-193/S .

[8] J . GUY et al .
Résolution d'une équation intégrale permettant d ' atteindre la structure
d'un domaine circulaire
Communication privée .
[9] E .T . COPSON
Proc . Edim . Burgh . Math . Soc . 2-1947 (8-14) .

PUBLICATION
VI
24
PUBLICATION V I
IEEE TRANSACTIONS ON MEDICAL IMAGING, VOL . MI . 2, NO . I . MARCH 198 3
A Regularizing Method for Quantitative SPEC TReconstructio n
F . SOUSSALINE AND G . LE CO Q
Abstract–The problem of successive transverse plane reconstruction
in single photon emission computerized tomography (SPECT) is mod-eled in its more general form, which implies the definition of emissio ntomographic operators (ETO's) for which an analytical solution can be
derived . The properties of the attenuated tomographic operator (ATO )are described and discussed, including the attenuation which is distrib-uted on the reconstruction domain . For this particular operator, a
regularizing method (RIM) is proposed, for which it is demonstrate dand tested with simulation studies that a filtered, accurate solution ca nbe extracted for the tomographic images as obtained using a singl e
photon emission tomograph based on a rotating gamma camera in clini-cal use .
I . INTRODUCTION
QUANTITATIVE extraction of scintigraphic data such a srelative and absolute functional parameters can be poten-tially improved by use of single photon emission com-
puterized tomography (SPECT) . However, it is essential that areconstruction strategy be adopted where the acquisition pro-cedure is actually described bÿ a model for which an analytica lsolution can be found. In SPECT, an analysis of importan tfactors affecting the accuracy of the measurement [1] show sthat even after most of them are minimized by the instrumentaldesign and the protocol used for the overall procedure, ther estill remains the major problems of attenuation, scatter, an dthe error inherent in the reconstruction method . Assumingan ideal detector response, and neglecting the scattered photo ncontribution in the projection data formulation, a number o ftechniques have been studied including attenuation correctio neither by inverting directly the attenuated Radon integral [2] ,[3] or by iterative procedures based on error minimizatio n[4] -[7] . These methods give good results within the limits o fa number of assumptions : constant attenuation distribution ,convexity of the attenuation emission domain for the former ,and large number of iterations and computer requirements fo rthe latter .
Another analytical approach is proposed [8] , [9] wher etomographic operators, derived from the operators describin gthe attenuated Radon integral, are defined in such a manne rthat one can take advantage of their specific properties whic hwould lead to a regularized solution or filtered solution to aninitially "ill posed" problem . This technique is called a regu-larizing method (RIM) . The regularizing procedure include sthe incorporation of a priori information about the finit e
Manuscript received February 9, 1983 ; revised June 23, 1983 .The authors are with Service Hospitalier Frédéric Joliot, CEA –
Département de Biologie, 91406 Orsay, France and with the Service
d'Etudes des Réacteurs et Mathématiques Appliquées, Centre d'Etude sNucléaires de Saclay, 91190 Gif/Yvette, France .
spatial extent of both the emission and the attenuation in thetwo-dimensional domain . The analytical approach discusse dhere could carry over to the third dimension .
II . THE SPECT MODELIN G
It is essential to model correctly the actual physical phe-nomena involved and the detection procedure used to obtai nthe measured data from which the tomographic images are t obe extracted .
A. Physical Aspects
There are fundamental differences between the reconstruc-tion problem for the single photon (gamma) emission distri-bution in a given volume and the reconstruction problem o fX-ray transmission computed tomography . In the emissio ndomain, the emission phenomenon is isotropic, and there is n oa priori knowledge of the path length between a point sourc eand a given detector portion . Moreover, the detected photonsfrom this isotropic emitting volume are attenuated by thetissues themselves located between sources and the detector,following an inversely exponential relationship . The distribu-tion volume of the attenuation coefficient (a function of tissuedensity and photon energy) is by nit) means constant, especiall ywhen considering a volume located in the thorax, abdomen, orhead .
The specific detection problem of SPECT can be stated asfollows . The unknown radioactive emission distribution ismeasured at discrete sampling angles around the complete 360 °of space using a collimated detector whose response function i svariant in space . Due to usually poor sensitivity, this measure -ment data is degraded by statistical noise . Moreover, it is fil-tered by a low-pass filter, depending on the modulation transfe rfunction of the detection system (detector and collimator) ,which eliminates all frequencies above its cut-off frequency .
Thus, three types of a priori information about the object t obe reconstructed could be incorporated in practice . The firs tconcerns the known and limited domain in space where th eobject is confined . Automatic body contour techniques yiel dinformation concerning both emission and the attenuationdomains . Second, the distribution of radioactivity is known t obe nonnegative . Third, a reasonable smoothness of the solutio ncan be assumed related to the system response function, and t othe numerical sampling undertaken (both linear and angular) .
B. Mathematical Derivatio n
The problem of general three-dimensional reconstruction canbe reduced to the reconstruction of successive two-dimensiona lplanes, transverse to the long axis of the object . The true vol-ume is obtained after sorting the successive transverse paralle l
0278-0062/83/0300-0024$01 .00 © 1983 IEEE
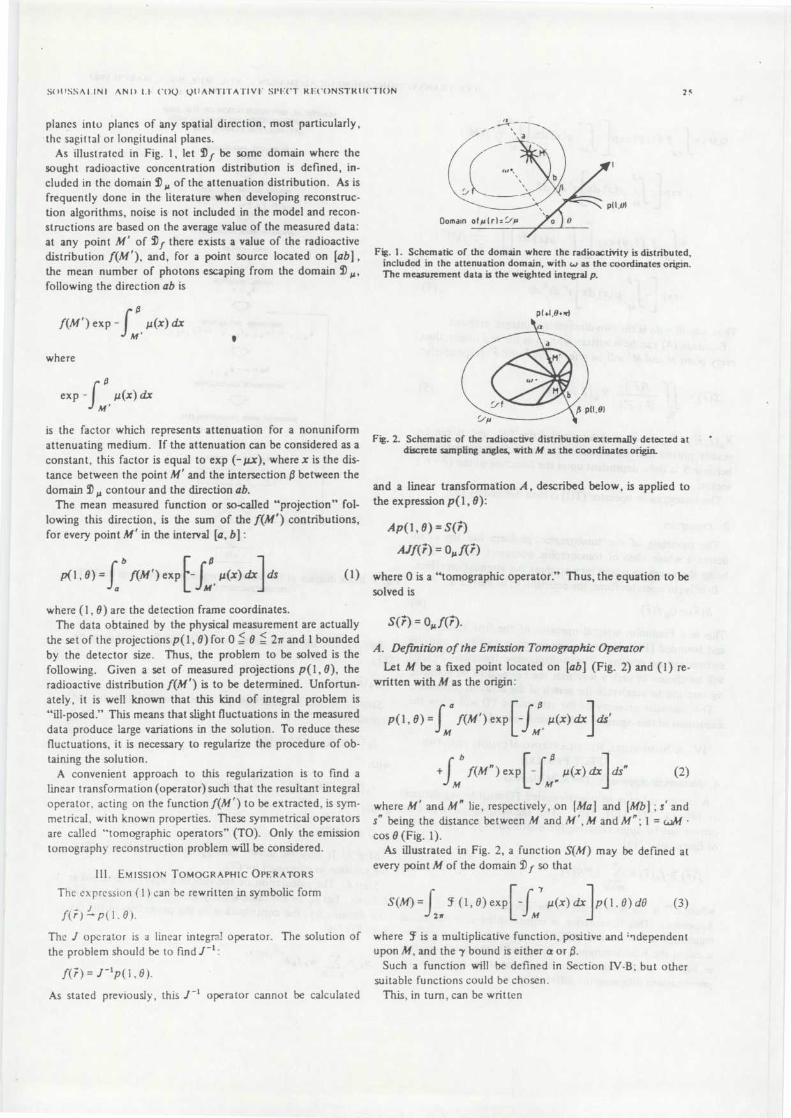
SOI ! SSAI INI ANI) 1 .1- ('OQ Q(IANTITA FIVl SPFCT RECONSTRUCTION 2 5
planes into planes of any spatial direction, most particularly ,the sagittal or longitudinal planes .
As illustrated in Fig . 1, let 9f be some domain where thesought radioactive concentration distribution is defined, in-cluded in the domain 9 µ of the attenuation distribution . As i sfrequently done in the literature when developing reconstruc-tion algorithms, noise is not included in the model and recon-structions are based on the average value of the measured data :at any point M ' of 9)f there exists a value of the radioactivedistribution f(M ' ), and, for a point source located on [ab] ,the mean number of photons escaping from the domai nfollowing the direction ab is
f(M ' )exp-
µ(x)dxM '
wher e
exp -
µ(x) dxm '
is the factor which represents attenuation for a nonuniformattenuating medium . If the attenuation can be considered as aconstant, this factor is equal to exp (-µx), where x is the dis -tance between the point M ' and the intersection between thedomain
contour and the direction ab.The mean measured function or so-called "projection " fol-
lowing this direction, is the sum of the f(M ' ) contributions ,for every point M ' in the interval [a, b] :
bp(1, 6) =
f(M ' ) exp -
µ(x) dx ds
(1 )a
m'
where (1, 9) are the detection frame coordinates .The data obtained by the physical measurement are actually
the set of the projections p(l, 8) for 0 < O 2n and 1 boundedby the detector size . Thus, the problem to be solved is th efollowing . Given a set of measured projections p(l, e), theradioactive distribution f(M ' ) is to be determined . Unfortun-ately, it is well known that this kind of integral problem i s"ill-posed" This means that slight fluctuations in the measure ddata produce large variations in the solution . To reduce thesefluctuations, it is necessary to regularize the procedure of ob-taining the solution .
A convenient approach to this regularization is to find alinear transformation (operator) such that the resultant integra loperator, acting on the function f(M ' ) to be extracted, is sym-metrical, with known properties . These symmetrical operatorsare called "tomographic operators" (TO) . Only the emissio ntomography reconstruction problem will be considered .
III . EMISSION TOMOGRAPHIC OPERATOR S
The expression (1) can be rewritten in symbolic form
f( i ) J p ( l . 8) .
The J operator is a linear integr?! operator . The solution o fthe problem should be to find J -1 :
f( r ) = J-'p( I , e ) .
As stated previously, this J - ' operator cannot be calculated
Fig .Fig . I . Schematic of the domain where the radioactivity is distributed ,included in the attenuation domain, with w as the coordinates origin .The measurement data is the weighted integral p .
pt *l,e .rl
Fig . 2 . Schematic of the radioactive distribution externally detected a tdiscrete sampling angles, with M as the coordinates origin.
and a linear transformation A, described below, is applied t othe expression p(l , O) :
Ap(1, 8) = S(i)
AJN(.) = Ouf(i. )
where 0 is a "tomographic operator" Thus, the equation to b esolved is
S(r) = 0, f(;) -( -
A . Definition of the Emission Tomographic Operator
Let M be a fixed point located on [ab] (Fig . 2) and (1) re-written with M as the origin :
a
p(l, 8) =
f(M ' ) exp -
µ(x) dx ds '
M
M '
b
+
f(M " ) exp [-T µ(z)
ds "
(2 )M
M "
where M ' and M " lie, respectively, on [Ma] and [Mb] ; s ' an ds " being the distance between M and M ' , M and M";1 = c,.)Mcos 0 (Fig. 1) .
As illustrated in Fig . 2, a function S(M) may be defined a tevery point M of the domain 5) f so tha t
7S(M) =
(l, @) exp -
µ(z) dx p(1, 0) d8M
where g is a multiplicative function, positive and 'ndependen tupon M, and the 7 bound is either a or O .
Such a function will be defined in Section IV-B ; but othe rsuitable functions could be chosen .
This, in turn, can be written
(3)
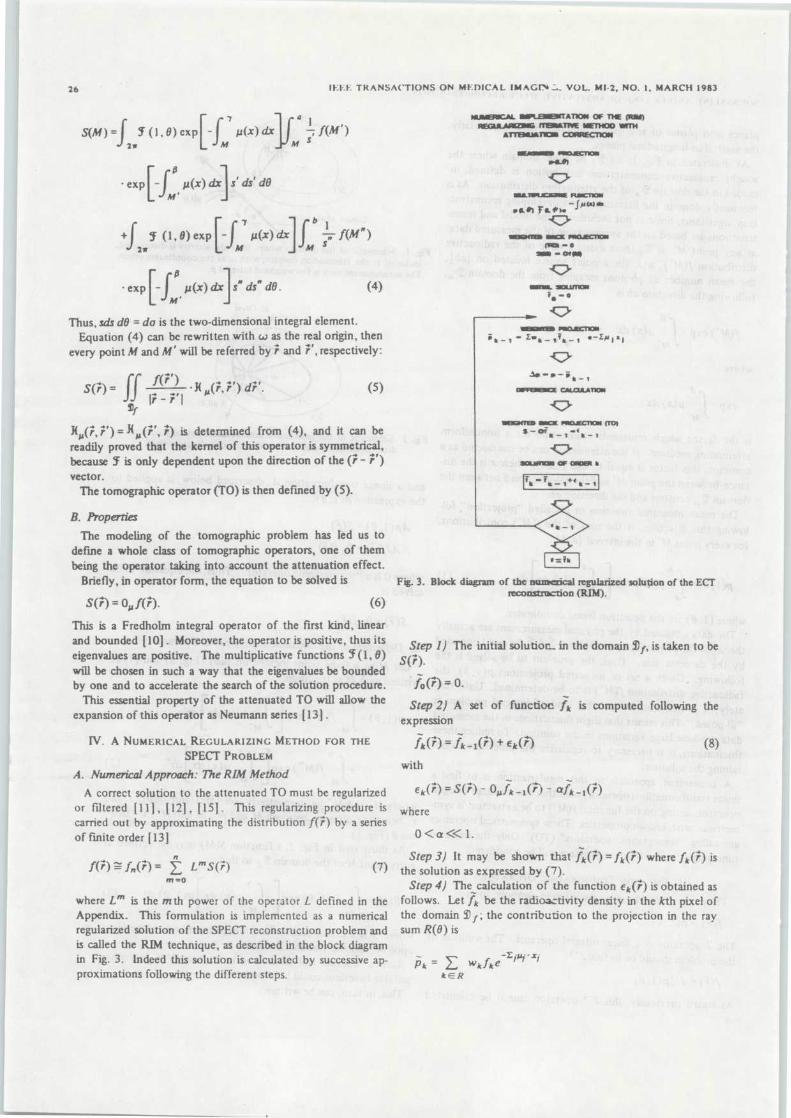
26 IEEE TRANSACTIONS ON MEDICAL IMAGrr VOL . MI-2, NO. 1, MARCH 198 3
Q
7 a
S(M ) =
(1,, B) exp -
p(x) dx
f(M' )2x
M
M s
• exp
-
P (x) dx
sr ds ' d9M '
+
g (1 , 0) exp[-fM7
µ(x) dxb
f(M" )
s2x
M
• exp
-
µ(x) dx s " ds" d8 .
(4)
Thus, sds dO = da is the two-dimensional integral element .Equation (4) can be rewritten with w as the real origin, the n
every point M and M ' will be referred by r and r r , respectively :
s(;) = f(r) ' • K (r, ; 1 ) dr r .
(5 )Ir - r I
JÇ(r, r r ) = H (r r , i) is determined from (4), and it can bereadily proved that the kernel of this operator is symmetrical ,because is only dependent upon the direction of the (r - r ' )
vector .The tomographic operator (TO) is then defined by (5) .
~
B. Properties
The modeling of the tomographic problem has led us todefine a whole class of tomographic operators, one of the mbeing the operator taking into account the attenuation effect .
Briefly, in operator form, the equation to be solved is
S(r) = ouf(r)•
(6)
This is a Fredholm integral operator of the first kind, linearand bounded [10] . Moreover, the operator is positive, thus itseigenvalues are positive . The multiplicative functions Y(1,0 )will be chosen in such a way that the eigenvalues be bounde dby one and to accelerate the search of the solution procedure .
This essential property of the attenuated TO will allow th eexpansion of this operator as Neumann series [131 .
IV . A NUMERICAL REGULARIZING METHOD FOR TH E
SPECT PROBLE M
A . Numerical Approach : The RIM Metho d
A correct solution to the attenuated TO must be regularize dor filtered [Ill, [121, [ 15] . This regularizing procedure iscarried out by approximating the distribution f(r) by a serie sof finite order [13]
R
f(r)ff(;)= E L' S(r)
(7 )m = o
where L m is the mth power of the operator L defined in th eAppendix . This formulation is implemented as a numericalregularized solution of the SPECT reconstruction problem an dis called the RIM technique, as described in the block diagra min Fig . 3 . Indeed this solution is calculated by successive ap-proximations following the different steps .
*.
C. . fil .
TATION OF THE (Rfil )REGULARIZING fT1E111/►T111E IETHOO STH
ATTTiJATCIII COARECT10N
means wmoueeno Niw-Ll1
raanIsswre FUNCTION-J N Wr. .M To. *w..
.sas ..a WON(~I - 0
# -aM
.ins waisti. - o
Fig. 3 . Block diagram of the numrxical regularized solution of the ECTr construe- ion (RIM).
Step 1) The initial solution in the domain T f , is taken to beS(r) .
fo(r) = 0 .-
Step 2) A set of functioc fk is computed following theexpressio n
fk(r) = fk -1( r) + E k(' )
( 8)
withL
11E k(r) = S(r ) - O, fk-1( r I - afk-I(r )
wher e
0<« 1 .ti
Step 3) It may be shown that fk (r) = fk(r) where fk (r) i sthe solution as expressed by (7) .
Step 4) The calculation of the function e k (r) is obtained a sfollows . Let fk be the radioactivity density in the kth pixel o fthe domain 5D f ; the contribution to the projection in the ra ysum R(8) is
Pk =
wkfkek E R
1Îk
- 1 +f t -1 l
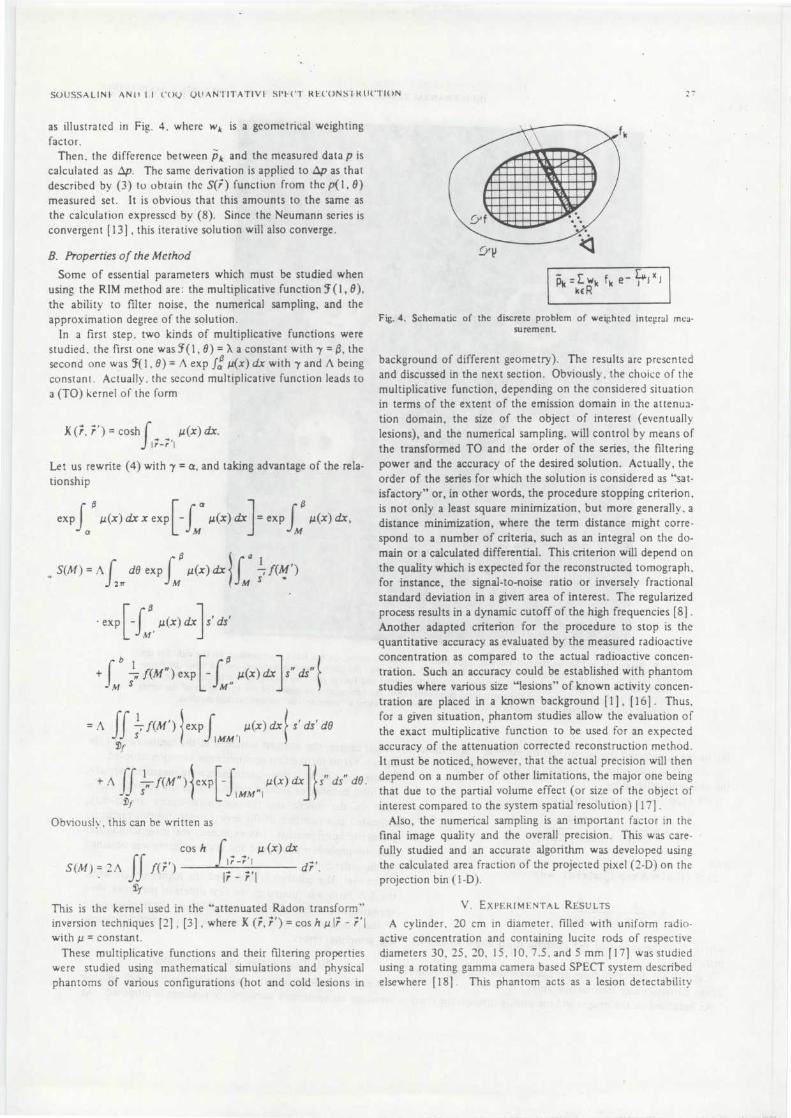
SOUSSALIN1 ANI) l I ('UQ . QUANTITATIVE SPI . ('T RECONS . 1 RUCTION
2 7
as illustrated in Fig . 4 . where w k is a geometrical weightin gfactor .
Then, the difference between pk and the measured data p i scalculated as tlp . The same derivation is applied to Zip as tha tdescribed by (3) to obtain the S(i) function from the p(1, 8 )measured set . It is obvious that this amounts to the same a sthe calculation expressed by (8) . Since the Neumann series i sconvergent [13] , this iterative solution will also converge .
B. Properties of the Method
Some of essential parameters which must be studied whe nusing the RIM method are : the multiplicative function J(1, 8) ,the ability to filter noise, the numerical sampling, and th eapproximation degree of the solution .
In a first step, two kinds of multiplicative functions wer estudied, the first one was f(l, 8) _ X a constant with y = 0, thesecond one was (1, 8) = A exp fc g(x) dx with y and A bein gconstant . Actually, the second multiplicative function leads t oa (TO) kernel of the form
K (r, r ' ) = cosh
g(x) dx.17-7' 1
Let us rewrite (4) with -y = a, and taking advantage of the rela-tionshi p
exp
g(x) dx x exp -
p(x) dx = exp
p(x) dx ,a
[JMa
M
a lS(M) = A
de exp
µ(x) dx
; f(M')2n
m
M S
•exp -
p(x)dx s ' ds 'M '
b
f(M " ) exp -
g(x) dx S dSM S
M "
= A
,Jf f(M ')expf
p(x) dx s ' ds ' d8S
I MM ' I
+ A fjln f(M " ) exp -
g(x) dx s" ds " de .S
MM" IY~1
Obviously, this can be written a s
cosh
g (x) dx
~ S(M) = 2A
f(r')1r r1
dr ' .1r-r i
4fThis is the kernel used in the "attenuated Radon transform "inversion techniques [2] , [3] , where K (r, r ' ) = cos h g 4r - r ' I
with g = constant .These multiplicative functions and their filtering propertie s
were studied using mathematical simulations and physica lphantoms of various configurations (hot and cold lesions in
PkEwk f k e-
J X Jkc R
Fig . 4 . Schemati c o f th e discrete proble m o f weighte d integra l mea-surement .
background of different geometry) . The results are presente dand discussed in the next section . Obviously, the choice of th emultiplicative function, depending on the considered situatio nin terms of the extent of the emission domain in the attenua-tion domain, the size of the object of interest (eventuall ylesions), and the numerical sampling, will control by means o fthe transformed TO and the order of the series, the filterin gpower and the accuracy of the desired solution . Actually, th eorder of the series for which the solution is considered as "sat-isfactory " or, in other words, the procedure stopping criterion ,is not only a least square minimization, but more generally, adistance minimization, where the term distance might corre-spond to a number of criteria, such as an integral on the do -main or a calculated differential . This criterion will depend o nthe quality which is expected for the reconstructed tomograph ,for instance, the signal-to-noise ratio or inversely fractiona lstandard deviation in a givers area of interest . The regularize dprocess results in a dynamic cutoff of the high frequencies [8] .Another adapted criterion for the procedure to stop is th equantitative accuracy as evaluated by the measured radioactiv econcentration as compared to the actual radioactive concen-tration . Such an accuracy could be established with phanto mstudies where various size "lesions " of known activity concen-tration are placed in a known background [1] , [16] . Thus ,for a given situation, phantom studies allow the evaluation o fthe exact multiplicative function to be used for an expecte daccuracy of the attenuation corrected reconstruction method .It must be noticed, however, that the actual precision will thendepend on a number of other limitations, the major one bein gthat due to the partial volume effect (or size of the object o finterest compared to the system spatial resolution) [17] .
Also, the numerical sampling is an important factor in th efinal image quality and the overall precision . This was care -fully studied and an accurate algorithm was developed usin gthe calculated area fraction of the projected pixel (2-D) on th eprojection bin (1-D) .
V . EXPERIMENTAL RESULT S
A cylinder, 20 cm in diameter, filled with uniform radio -active concentration and containing lucite rods of respectivediameters 30, 25, 20 . 15, 10, 7 .5, and 5 mm [17] was studie dusing a rotating gamma camera based SPECT system describedelsewhere [181 . This phantom acts as a lesion detectabilit y
./nnn0kIP nn►innn nn111'1111111nnb
.•111111111111111111M :IMEW/nnnnn nnL~nnnnnnnnnnn►1:1nnF
1111111111111111111111111 n%nnnnnnnIP~•mow-
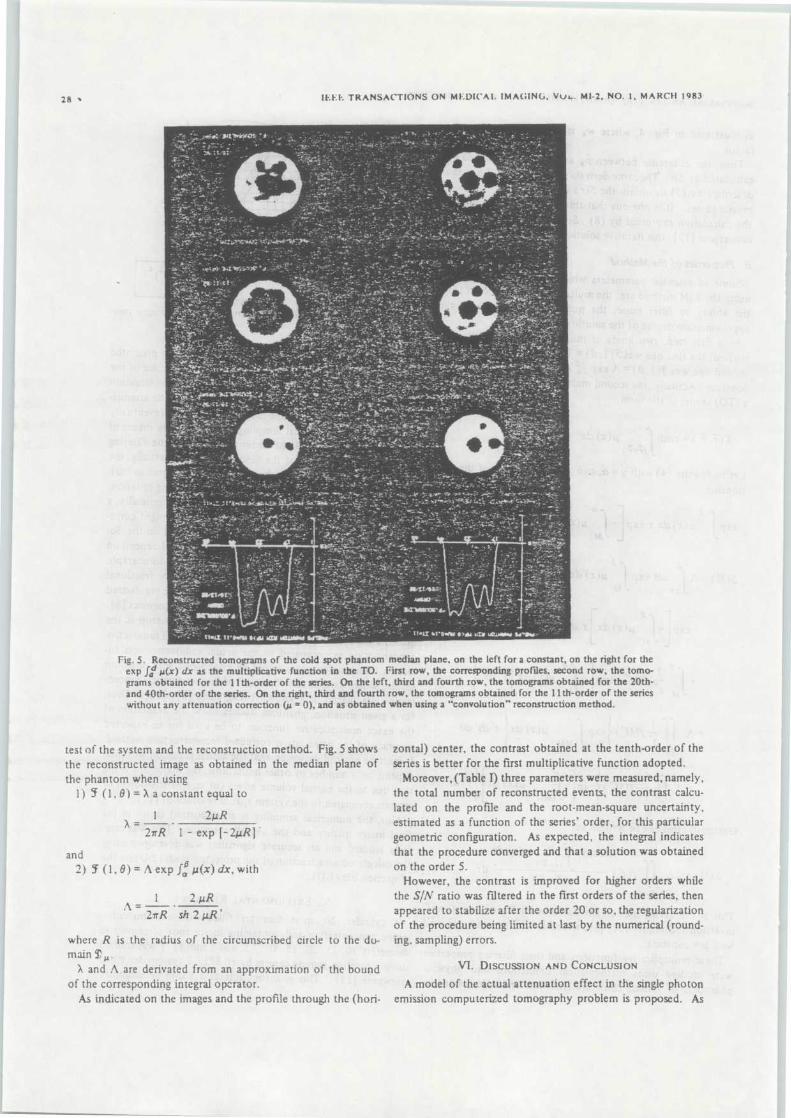
11';1":i'. TRANSACTIONS ON MI-.DICA1. IMAGING, Vu* . MI-2, NO . 1, MARCH 198 3
Fig . 5 . Reconstructed tomograms of the cold spot phantom median plane, on the left for a constant, on the right for theexp jv µ(x) dx as the multiplicative function in the TO. First row, the corresponding profiles, second row, the tomo-grams obtained for the 11th-order of the series. On the left, third and fourth row, the tomograms obtained for the 20th -and 40th-order of the series . On the right, third and fourth row, the tomograms obtained for the 11th-order of the serie swithout any attenuation correction (g = 0), and as obtained when using a "convolution" reconstruction method .
test of the system and the reconstruction method . Fig . 5 shows zontal) center, the contrast obtained at the tenth-order of th ethe reconstructed image as obtained in the median plane of series is better for the first multiplicative function adopted .the phantom when using
Moreover, (Table I) three parameters were measured, namely ,1) (1, 0) = X a constant equal to
the total number of reconstructed events, the contrast calcu -
l
2uR
lated on the profile and the root-mean-square uncertainty ,
X
estimated as a function of the series ' order, for this particula r2nR 1 - exp -2µR]
geometric configuration . As expected, the integral indicate s
and
that the procedure converged and that a solution was obtaine d
2) 5' (1, 0) = A exp fâ u(x) dx, with
on the order 5 .However, the contrast is improved for higher orders whil e
1
2µR
the S/N ratio was filtered in the first orders of the series, the n
A = 21rR ' sh 2 µR'
appeared to stabilize after the order 20 or so, the regularizatio nof the procedure being limited at last by the numerical (round -
where R is the radius of the circumscribed circle to the do- ing, sampling) errors .mai n
X and A are derivated from an approximation of the bound
~• DISCUSSION AND CONCLUSION
of the corresponding integral operator .
A model of the actual attenuation effect in the single photonAs indicated on the images and the profile through the (hori- emission computerized tomography problem is proposed . As
28
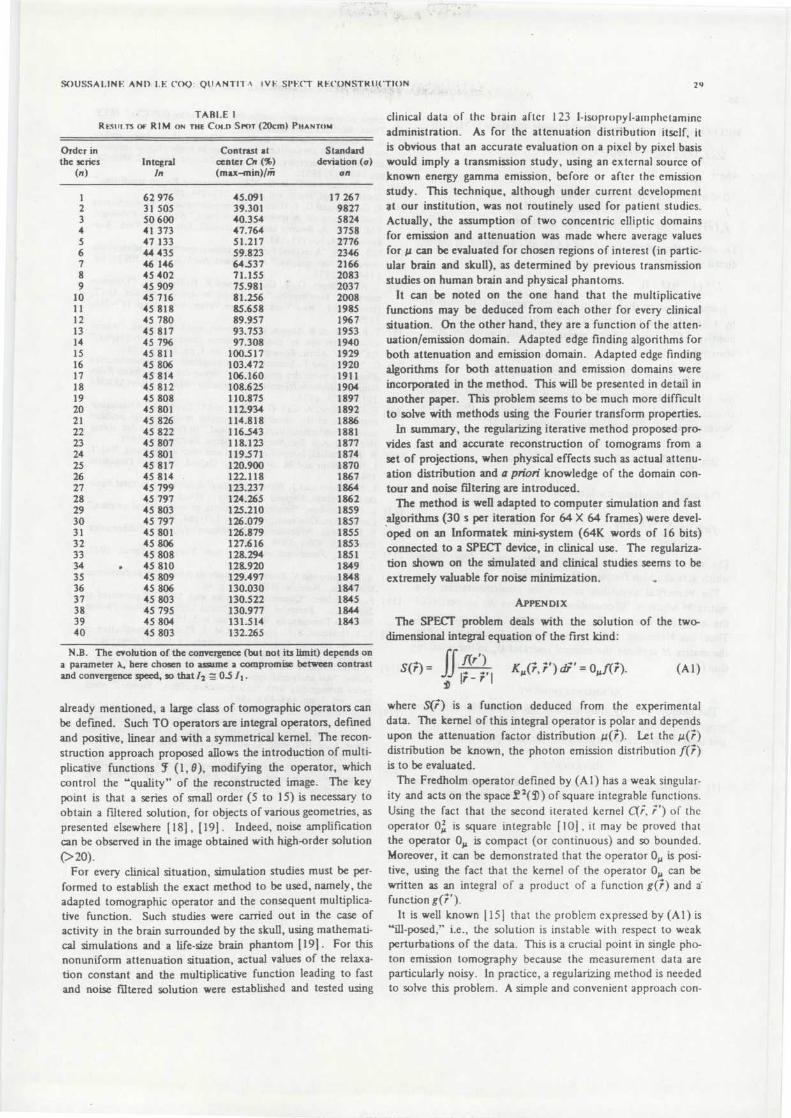
SOUSSALINE ANI) IF COQ : QIUANTIT IVH SI'ECT KICONSTKti('TION 2 9
TABLE 1
RF5III .T5 OF RIM ON THE C(H .n SPOT (20cm) PHANTOM
Order in
Contrast at
Standardthe series
Integral
center Cn (%)
deviation (o)(n)
In
(max-min)/m
o n
1 62 976 45 .091 17 26 72 31 505 39 .301 98273 50 600 40 .354 582 44 41 373 47 .764 375 85 47 133 51 .217 277 66 44 435 59 .823 23467 46 146 64 .537 216 68 45 402 71 .155 208 39 45 909 75 .981 203 7
10 45 716 81 .256 200 811 45 818 85.658 198 512 45 780 89 .957 196 713 45 817 93.753 195 314 45 796 97 .308 194 015 45 811 100.517 192 916 45 806 103.472 192 017 45 814 106.160 191 118 45 812 108 .625 190419 45 808 110.875 189 720 45 801 111934 189 221 45 826 114 .818 188622 45 822 116_543 188 123 45 807 118 .123 187 724 45 801 119 .571 187425 45 817 120 .900 187 026 45 814 122.118 186 727 45 799 123.237 186428 45 797 124.265 186 229 45 803 125.210 185 930 45 797 126 .079 185 731 45 801 126 .879 185 532 45 806 127 .616 185 333 45 808 128.294 185 134 45 810 12&920 184 935 45 809 129 .497 184 836 45 806 130 .030 184 737 45 803 130 .522 184 538 45 795 130 .977 184439 45 804 131 .514 184 340 45 803 132 .265
N .B . The evolution of the convergence (but not its limit) depends ona parameter a, here chosen to assume a compromise between contras tand convergence speed, so that 12 = 051 1J .
already mentioned, a large class of tomographic operators canbe defined . Such TO operators are integral operators, definedand positive, linear and with a symmetrical kernel . The recon-struction approach proposed allows the introduction of multi-plicative functions (1, 0), modifying the operator, whic hcontrol the "quality " of the reconstructed image . The keypoint is that a series of small order (5 to 15) is necessary t oobtain a filtered solution, for objects of various geometries, a spresented elsewhere [18], [191 . Indeed, noise amplificatio ncan be observed in the image obtained with high-order solutio n(>20) .
For every clinical situation, simulation studies must be per -formed to establish the exact method to be used, namely, th eadapted tomographic operator and the consequent multiplica-tive function . Such studies were carried out in the case ofactivity in the brain surrounded by the skull, using mathemati-cal simulations and a life-size brain phantom [191 . For thisnonuniform attenuation situation, actual values of the relaxa -tion constant and the multiplicative function leading to fastand noise filtered solution were established and tested using
clinical data of the brain after 123 I-isopropyl-amphetamin eadministration . As for the attenuation distribution itself, i tis obvious that an accurate evaluation on a pixel by pixel basi swould imply a transmission study, using an external source o fknown energy gamma emission, before or after the emissio nstudy . This technique, although under current developmen tat our institution, was not routinely used for patient studies.Actually, the assumption of two concentric elliptic domain sfor emission and attenuation was made where average valuesfor g can be evaluated for chosen regions of interest (in partic-ular brain and skull), as determined by previous transmissio nstudies on human brain and physical phantoms .
It can be noted on the one hand that the multiplicativ efunctions may be deduced from each other for every clinica lsituation . On the other hand, they are a function of the atten-uation/emission domain . Adapted edge finding algorithms fo rboth attenuation and emission domain . Adapted edge findingalgorithms for both attenuation and emission domains wer eincorporated in the method . This will be presented in detail i nanother paper . This problem seems to be much more difficul tto solve with methods using the Fourier transform properties.
In summary, the regularizing iterative method proposed pro-vides fast and accurate reconstruction of tomograms from aset of projections, when physical effects such as actual attenu-ation distribution and a priori knowledge of the domain con -tour and noise filtering are introduced .
The method is well adapted to computer simulation and fastalgorithms (30 s per iteration for 64 X 64 frames) were devel-oped on an Informatek mini-system (64K words of 16 bits )connected to a SPECT device, in clinical use . The regulariza-tion shown on the simulated and clinical studies seems to b eextremely valuable for noise minimization .
..
APPENDI X
The SPECT problem deals with the solution of the two-dimensional integral equation of the first kind :
lso) .
KM( r , r')dam,
= Ouf( r )•
(Al)
where S(r) is a function deduced from the experimenta ldata. The kernel of this integral operator is polar and depend supon the attenuation factor distribution z(r). Let the p(r )distribution be known, the photon emission distribution f(r)is to be evaluated .
The Fredholm operator defined by (Al) has a weak singular-ity and acts on the space 2 2 (5)) of square integrable functions .Using the fact that the second iterated kernel C(. r ' ) of th eoperator 0,2 is square integrable [101, it may be proved tha tthe operator 0, is compact (or continuous) and so bounded .Moreover, it can be demonstrated that the operator 0, is posi-tive, using the fact that the kernel of the operator 0u can bewritten as an integral of a product of a function g(r) and afunction g( ; ' ) .
It is well known [151 that the problem expressed by (Al) is"ill-posed," i .e ., the solution is instable with respect to wea kperturbations of the data . This is a crucial point in single pho-ton emission tomography because the measurement data areparticularly noisy . In practice, a regularizing method is neede dto solve this problem. A simple and convenient approach con -
30
IE:N:r: TRANSACTIONS ON MEUICAL IMAGING, VOL . MI .2, NO. 1, MARCH 1983
sists of using the solution of the following equation 1151, [20] :
Qafa(t) = (O + a1) fa(r) = S(r )
where
0 < a « 1 is a positive constant ,1
is the identity operator, andfa(T)
is the solution of the equation
To obtain the solution fa(r) of (A2), an operator L is intro-duced such tha t
L=(1-a)I-0 .
It may be proven that the norm of the operator L is bounde dby I : IIL II < 1 . In fact, since L is symmetric (self-adjoint) andpositive, IIL II is equal to the maximum of its eigenvalue [14] .Moreover ,
max eigenvalue L = 1 - a - min eigenvalue Ou
due to the fact that the eigenvalue of O, is bounded betwee n0 and TIOµ" < 1, 0, being a compact operator . Hence, theNeumann series of the operator L converges [13] :
lim
L" = (I - L) -1 = (Oµn= 0
The sought regularized solution is
fa(r) _
L"S(T ).n=0
The effect related to the parameter is to insert a filter facto rwhich acts as a high-frequencies cutoff [1 1 ]
The numerical algorithm implies the implementation of amatrix M which is "ill-conditioned," but has the properties o fthe analytical operator Ou , i.e ., is positive and symmetrical .Thus, the Neumann series of the operator L converges whe nthe matrix M replaces the integral operator O µ in the relation -ship (7) .
ACKNOWLEDGMEN T
The authors are very grateful to A . Cao and L. Herz for theirprogramming help, to S . Ricard for her technical assistance ,and to N . De Blecker for typing the manuscript .
REFERENCE S
[ 1 ] R. J . Jaszczak, R. E . Coleman, and F . R . Whitehead, "Physicalfactors affecting quantitative measurements acing, camera-based
single photon emission computed tomography (SPECT)," IEEETrans. Nuci. Sci ., vol NS-28, 1981 .
(2] G . T . Gullbcrg and T . F . Budinger, "The use of filtering method sto compensate for constant attenuation in single photon emissio ncomputed tomography," IEEE Trans, Biomed. Eng ., vol BME-28 ,pp. 142-157, 1981 .O. J . Trctiak and C. Metz, `The exponential Radon transform,"SIAM. J. Appt Math ., vol . 39, pp . 341-354, 1980 .R. Gordon and G . T . Herman, "Three-dimensional reconstructionfrom projections : A review of algorithms," Review of Cytology ,VoL 38, G . A . Bourne and J . F . Danielli, Eds. New York : Aca-demic 1974, pp . 111-151 .L. T . Chang, "A method for attenuation correction in radionuclid ecomputed tomography," IEEE Trans. NucL Sci., voL NS-25, pp.638-643, 1978 .
[6] T. F . Budinger, G. T. Gullberg, and R . H . Huesman, "Emissio ncomputed tomography," In Topics in Applied Physics, G. T .Herman, Ed . New York : Springer Verlag, vol 32, pp . 147-246 ,1979.T. E . Walters, W. Simon, D . A.Chesler, and J . A. Correia, "Atten-ation correction in gamma emission computed tomography, "J. Comput. Assist. Tomogr., vol 5, no. 1, pp . 89-94, 1981 .G . Le Coq and F. Soussaline, "Le problème de la reconstructio nd'images à partir des projections," Revue des Méthodes de Réso-lution et Méthode Itérative Régularisante (MIR), Rapport SERMA257/5, CEA, 1975 .F . Soussaline, A . Cao, G. Le Coq, and C. Raynaud, "Attenuatio ncorrection in the emission tomography reconstruction problemusing a regularizing iterative method," in Proc. 19th Int. AnnaMeeting Europ. Soc. NucL Med ., Berne, Switzerland, 1981 .
[10] W. Pogorzelski, Integral equations and their applications, Vol. 1 ,I. N . Snedon and M . Stark, Eds. Oxford, England : Pergamon,1966 .
[11] L . M . Delves and J . Walsh, Numerical Solution of Integral Equa-tions. Oxford, England : Clavendon, 1974, p. 175 .
[12] I. P. Nedelkov, "Improper problems in computional physics, "Comp. Phys Commun ., vol 4, pp. 157-164, 1972.
[13] B . Friedman, Principles and Techniques of Applied Mathematics .New York : Wiley, 1956, p . 36 .
[14] S . Reed, Functional Analysis. New York : Academic, 1973 ,p. 192 .
1151 A . Tilchonov and V. Arsenne, Méthode de Résolution deProblèmesMal Posés. Moscow : MIR, 1976, p . 46 .
[16] F . Soussaline, "Quantitative studies with SPECT," presented a t2nd Erick. Ferstrôm Symp. Clinical Utility of Single PhotonEmission Tomography, Malmo, June 4-5, 1982.
[17] E . J . Hoffman, S . C . Huang, and M . E . Phelps, "Quantization inpositron emission computed tomography : Effect of object size, "J. Comput. Assist. Tomogr., vol . 3, pp . 299-308, 1979 .
[18] F . Soussaline, A. Cao, G . Le Coq, C. Raynaud, and C. Keller-shohn, "An analytical approach to single photon emission corn-puted tomography with the attenuation effect," Europ. J. Nucl.Med., vol 7, pp . 487-493, 1982.
[19] F. Soussaline, G . Le Coq, C . Raynaud, and C. Kellershohn, "SPECTreconstruction with a non-uniform attenuation coefficient usingan analytical regularizing iterative method," in Proc. Third WorldCongr. Nuel. Med. Biol ., C . Raynaud, Ed. Paris : Pergamon vol I,pp . 1034-1037, 1982.
[20] S. G . Mtkhlin, Completely Continuous Operators in MathematicalPhysics and Advanced Course . Amsterdam, The Netherlands:North Holland, 1970, ch . 7, pp . 153-165 .
+ a1)- ' .
13 1
[4 ](A2)
(5 1
[ 7 1
18 1
(91

PUBLICATION
VII
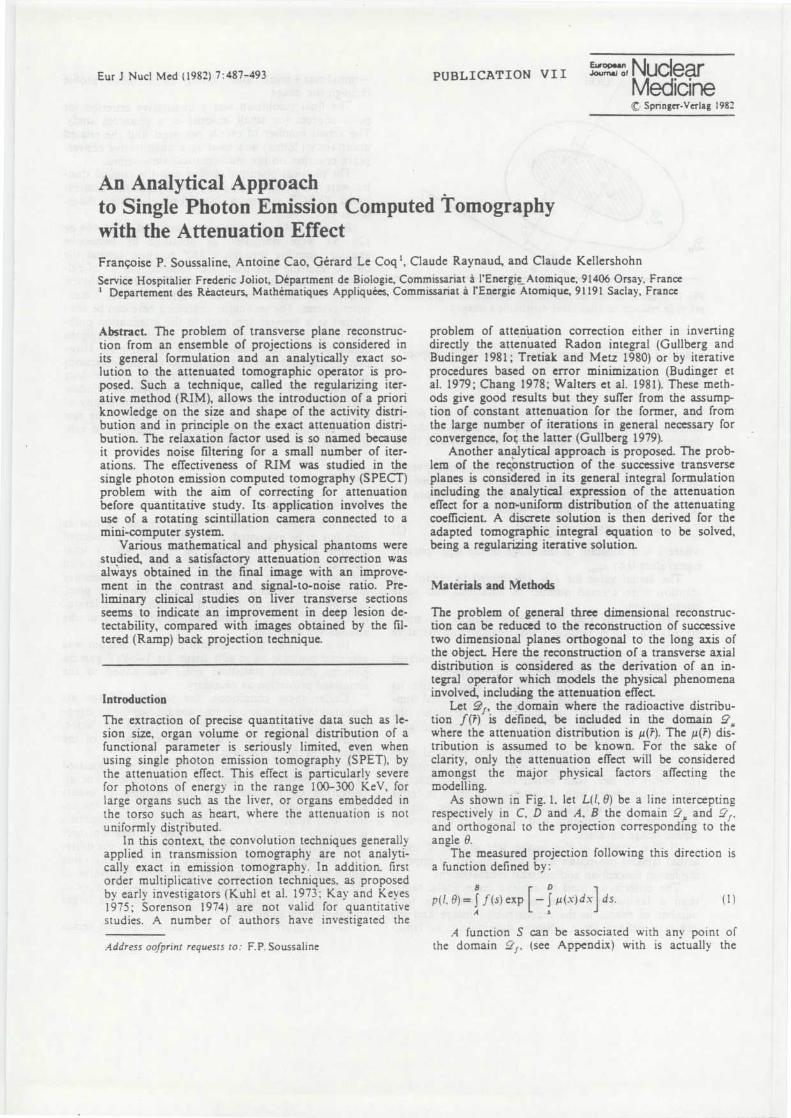
Eur J Nucl Med (1982) 7 :487-493
PUBLICATION VI I journal 0, NuclearMedicineC , Springer-Verlag 198 2
An Analytical Approachto Single Photon Emission Computed Tomograph ywith the Attenuation Effec tFrançoise P. Soussaline, Antoine Cao, Gérard Le Coq', Claude Raynaud, and Claude Kellershoh n
Service Hospitalier Frederic Joliot, Départment de Biologie, Commissariat à 1'Energie Atomique, 91406 Orsay, France' Departement des Réacteurs, Mathématiques Appliquées, Commissariat à I'Energie Atomique, 91191 Saclay, France
Abstract. The problem of transverse plane reconstruc-tion from an ensemble of projections is considered i nits general formulation and an analytically exact so-lution to the attenuated tomographic operator is pro -posed. Such a technique, called the regularizing iter-ative method (RIM), allows the introduction of a prioriknowledge on the size and shape of the activity distri-bution and in principle on the exact attenuation distri-bution . The relaxation factor used is so named becaus eit provides noise filtering for a small number of iter-ations . The effectiveness of RIM was studied in th esingle photon emission computed tomography (SPECT )problem with the aim of correcting for attenuatio nbefore quantitative study . Its application involves th euse of a rotating scintillation camera connected to amini-computer system.
Various mathematical and physical phantoms werestudied, and a satisfactory attenuation correction wasalways obtained in the final image with an improve-ment in the contrast and signal-to-noise ratio . Pre-liminary clinical studies on liver transverse section sseems to indicate an improvement in deep lesion de-tectability, compared with images obtained by the fil-tered (Ramp) back projection technique .
Introduction
The extraction of precise quantitative data such as le-sion size, organ volume or regional distribution of afunctional parameter is seriously limited, even whe nusing single photon emission tomography (SPET), b ythe attenuation effect. This effect is particularly severefor photons of energy in the range 100-300 KeV, fo rlarge organs such as the liver, or organs embedded i nthe torso such as heart, where the attenuation is no tuniformly distributed.
In this context. the convolution techniques generall yapplied in transmission tomography are not analyti-cally exact in emission tomography . In addition. firs torder multiplicative correction techniques, as propose dby early investigators (Kuhl et al . 1973 : Kay and Keyes1975 ; Sorenson 1974) are not valid for quantitativ estudies . A number of authors have itheinvestigate d
. r
Address oofprint requests to : F.P. Soussaline
problem of attenuation correction either in invertin gdirectly the attenuated Radon integral (Gullberg an dBudinger 1981 ; Tretiak and Metz 1980) or by iterativ eprocedures based on error minimization (Budinger e tal . 1979 ; Chang 1978 ; Walters et al . 1981) . These meth -ods give good results but they suffer from the assump-tion of constant attenuation for the former, and fro mthe large number of iterations in general necessary fo rconvergence, fot the latter (Gullberg 1979) .
Another analytical approach is proposed . The prob-lem of the reconstruction of the successive transvers eplanes is considered in its general integral formulatio nincluding the analytical expression of the attenuatio neffect for a non-uniform distribution of the attenuatin gcoefficient . A discrete solution is then derived for th eadapted tomographic integral equation to be solved ,being a regularizing iterative solution.
Materials and Methods
The problem of general three dimensional reconstruc-tion can be reduced to the reconstruction of successiv etwo dimensional planes orthogonal to the long axis o fthe object. Here the reconstruction of a transverse axia ldistribution is considered as the derivation of an in-tegral operator which models the physical phenomenainvolved, including the attenuation effect .
Let .2f, the :domain where the radioactive distribu-tion f(7.) is defined, be included in the domain 1 µwhere the attenuation distribution is µ( -r) . The µ( 'r) dis-tribution is assumed to be known . For the sake o fclarity, only the attenuation effect will be considere damongst the major physical factors affecting th emodelling.
As shown in Fig. 1 . let L(1,0) be a line interceptin grespectively in C, D and A, B the domain 1), and 1J .and orthogonal to the projection corresponding to th eangle O .
The measured projection following this direction i sa function defined by :
B
D
p ( l. S)_S f(s) exp — u(x)dxA
s
A function S can be associated with any point o fthe domain ç2f , (see Appendix) with is actually the
(1 )ds .
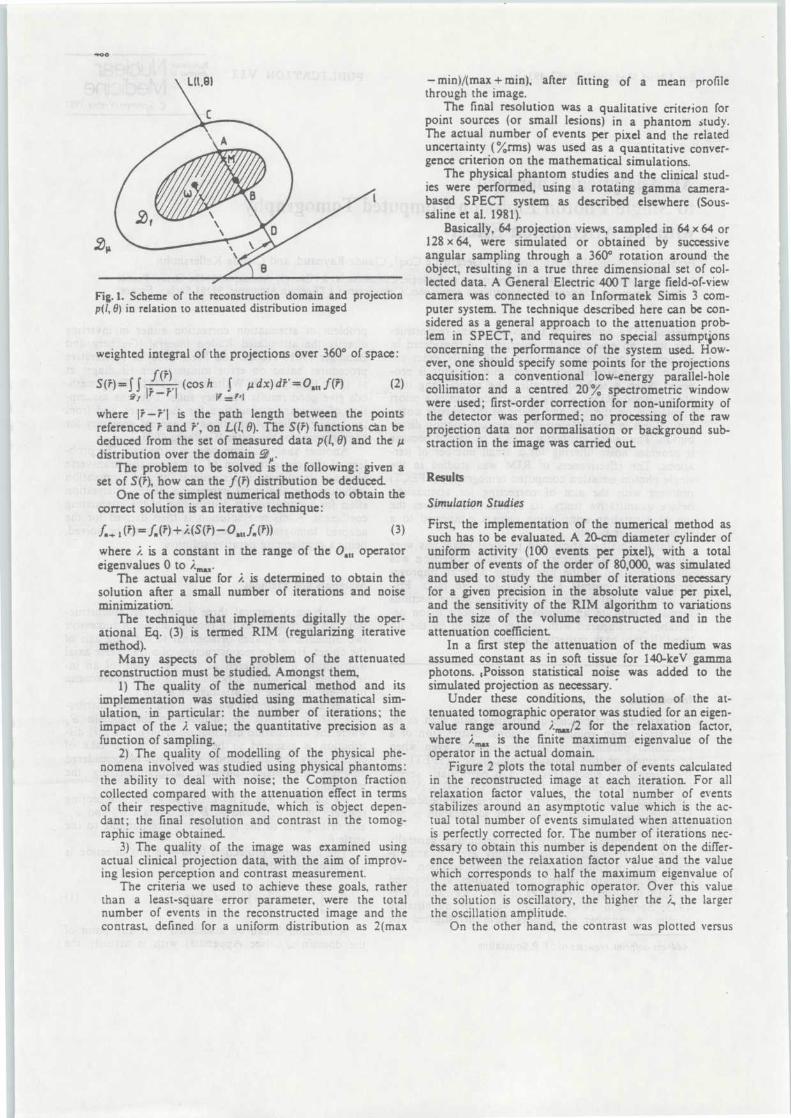
+oo
Fig.1 . Scheme of the reconstruction domain and projectio np(1, 8) in relation to attenuated distribution image d
weighted integral of the projections over 360° of space :
S(r = S S ( r) (cos h Jµdx)dr'=0 f(rr)
(2 )9f ir— r
where I r - r' I is the path length between the point sreferenced .r and V, on L(1, 0). The S(r) functions can bededuced from the set of measured data p(1, 6) and the µ
distribution over the domain 2~ .The problem to be solved is the following : given a
set of S(r), how can the f ('r) distribution be deduced.One of the simplest numerical methods to obtain the
correct solution is an iterative technique :
f~+ i (r) =f.(r)+(S(I')— 0.«fR( r ))
(3 )
where ,. is a constant in the range of the O operatoreigenvalues 0 to ï, .
The actual value for 2 is determined to obtain thesolution after a small number of iterations and noiseminimization:
The technique that implements digitally the oper-ational Eq . (3) is termed RIM (regularizing iterativ emethod) .
Many aspects of the problem of the attenuate dreconstruction must be studied. Amongst them,
1) The quality of the numerical method and it simplementation was studied using mathematical sim-ulation, • in particular : the number of iterations ; theimpact of the 2 value ; the quantitative precision as afunction of sampling .
2) The quality of modelling of the physical phe-nomena involved was studied using physical phantoms :the ability to deal with noise ; the Compton fractioncollected compared with the attenuation effect in term sof their respective magnitude, which is object depen-dant ; the final resolution and contrast in the tomog-raphic image obtained .
3) The quality of the image was examined usin gactual clinical projection data, with the aim of improv-ing lesion perception and contrast measurement .
The criteria we used to achieve these goals, rathe rthan a least-square error parameter, were the totalnumber of events in the reconstructed image and th econtrast, defined for a uniform distribution as 2(max
— min)/(max + min), after fitting of a mean profil ethrough the image .
The final resolution was a qualitative criterion fo rpoint sources (or small lesions) in a phantom study .The actual number of events per pixel and the relateduncertainty (%rms) was used as a quantitative conver-gence criterion on the mathematical simulations.
The physical phantom studies and the clinical stud-ies were performed, using a rotating gamma camera -based SPECT system as described elsewhere (Sous-saline et al. 1981) .
Basically, 64 projection views, sampled in 64 x 64 or128 x 64, were simulated or obtained by successiv eangular sampling through a 3600 rotation around theobject, resulting in a true three dimensional set of col-lected data . A General Electric 400 T large field-of-vie wcamera was connected to an Informatek Simis 3 com-puter system. The technique described here can be con-sidered as a general approach to the attenuation prob-lem in SPECT, and requires no special assumption sconcerning the performance of the system used. How -ever, one should specify some points for the projection sacquisition : a conventional low-energy parallel-hol ecollimator and a centred 20 % spectrometric windo wwere used; first-order correction for non-uniformity o fthe detector was performed ; no processing of the rawprojection data nor normalisation or background sub-straction in the image was carried out
Results
Simulation Studies
First, the implementation of the numerical method a ssuch has to be evaluated . A 20-cm diameter cylinder o funiform activity (100 events per pixel), with a totalnumber of events of the order of 80,000, was simulatedand used to study the number of iterations necessar yfor a given precision in the absolute value per pixel,and the sensitivity of the RIM algorithm to variationsin the size of the volume reconstructed and in th eattenuation coefficient.
In a first step the attenuation of the medium wasassumed constant as in soft tissue for 140-keV gamm aphotons . & Poisson statistical noise was added to th esimulated projection as necessary .
Under these conditions, the solution of the at-tenuated tomographic operator was studied for an eigen-value range around 2,/2 for the relaxation factor,where 2. is the finite maximum eigenvalue of theoperator in the actual domain.
Figure 2 plots the total number of events calculate din the reconstructed image at each iteration. For al lrelaxation factor values, the total number of event sstabilizes around an asymptotic value which is the ac-tual total number of events simulated when attenuatio nis perfectly corrected for . The number of iterations nec-essary to obtain this number is dependent on the differ-ence between the relaxation factor value and the valu ewhich corresponds to half the maximum eigenvalue o fthe attenuated tomographic operator. Over this valu ethe solution is oscillatory, the higher the L, the large rthe oscillation amplitude .
On the other hand, the contrast was plotted versus
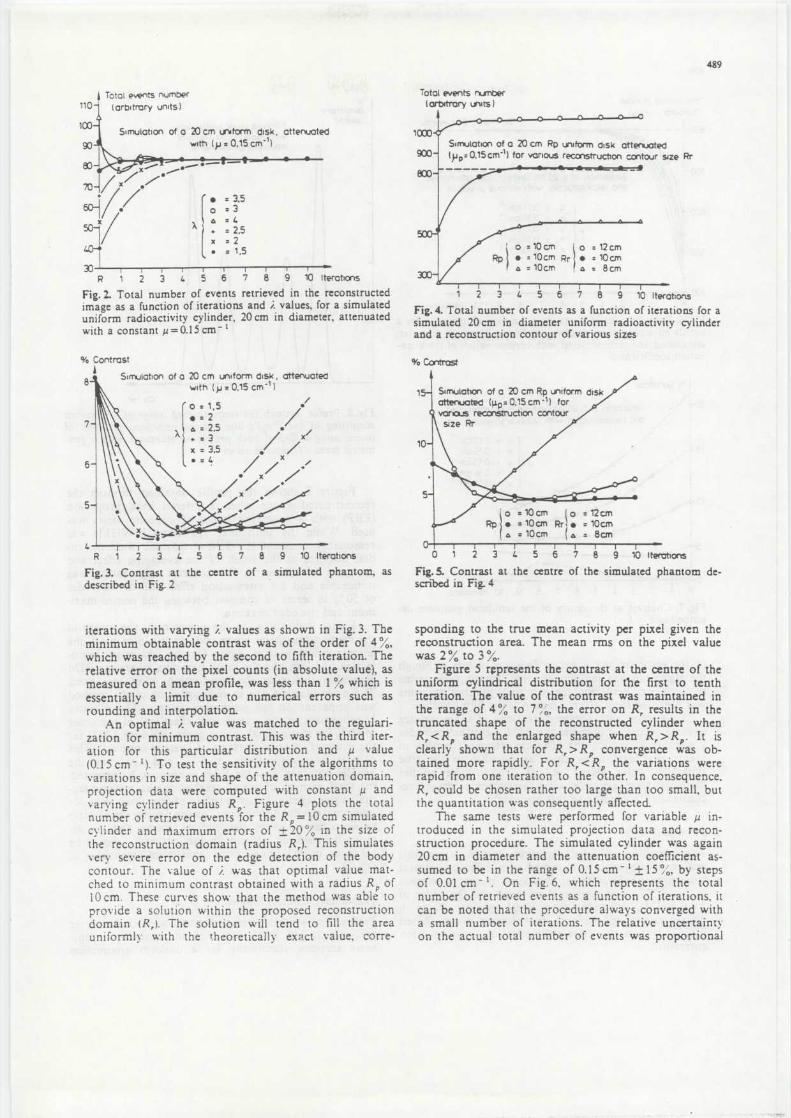
48 9
100
i Total events numbe r110-i (arbitrary units )
Simulation of a 20 cm inform disk, attenuatedwith (p =0,15cm')
30
>
>
j
I
r
I
r
T
I
r
8
1
2
3
4
5
6
7
8
9
10 Iteration s
Fig .2. Total number of events retrieved in the reconstructe d
image as a function of iterations and i. values, for a simulate duniform radioactivity cylinder, 20 cm in diameter, attenuate d
with a constant u =0.15 cm'
tota( events numberi orbrtrary units )
I
1
2
3
1.
5
6
7
8
9
10 Iterations
Fig.4. Total number of events as a function of iterations for asimulated 20 cm in diameter uniform radioactivity cylinde rand a reconstruction contour of various sizes
°Yo Contrast
Fig.5- Contrast at the centre of the simulated phantom de -scribed in Fig. 4
o
9'o Contrast
Simulation of a 20 cm uniform disk , attenuatedwith (N = 0,15 cm"I )
'o- 1, 5• 2q :2, 5
• 3x=3, 5
X
7
8
9
10 Iterations
Fig.3. Contrast at the centre of a simulated phantom, as
described in Fig. 2
Simulation of a 20 cm Rp uniform disk attenuated(p., p =0.15cm'I ) for various reccnstructton contour size Rt'
1000-<
900 -
800
Simulation of a 20 cm Rp uniform diskattenuated (µp : 0.15 cm- I ) forvarious reconstruction contoursize Rr
0 10 Iterations
0 o o 0
iterations with varying i values as shown in Fig . 3 . Th eminimum obtainable contrast was of the order of 4 % ,which was reached by the second to fifth iteration . Therelative error on the pixel counts (in absolute value), a smeasured on a mean profile, was less than 1 iô which isessentially a limit due to numerical errors such a srounding and interpolation.
An optimal ). value was matched to the regulari-zation for minimum contrast. This was the third iter-ation for this particular distribution and p value(0.15 cm-'). To test the sensitivity of the algorithms t ovariations in size and shape of the attenuation domain,projection data were computed with constant u andvarying cylinder radius R p . Figure 4 plots the tota lnumber of retrieved events for the R,=10 cm simulate dcylinder and maximum errors of +20% in the size o fthe reconstruction domain (radius R,) . This simulatesvery severe error on the edge detection of the bodycontour . The value of i. was that optimal value mat-ched to minimum contrast obtained with a radius R p of10 cm. These curves show that the method was able t oprovide a solution within the proposed reconstructio ndomain (Rd. The solution will tend to fill the areauniformly with the theoretically exact value, corre-
sponding to the true mean activity per pixel given thereconstruction area . The mean rms on the pixel valuewas 2% to 3 /0' .
Figure 5 represents the contrast at the centre of th euniform cylindrical distribution for the first to tenthiteration. The value of the contrast was maintained inthe range of 4% to 7 the error on R, results in th etruncated shape of the reconstructed cylinder whe nR, <R p and the enlarged shape when R,> R p . It isclearly shown that for R, > R p convergence was ob-tained more rapidly. For R, <R p the variations wer erapid from one iteration to the other . In consequence ,R, could be chosen rather too large than too small, bu tthe quantitation was consequently affected.
The same tests were performed for variable j in-troduced in the simulated projection data and recon-struction procedure . The simulated cylinder was again20 cm in diameter and the attenuation coefficient as-sumed to be in the range of 0.15 cm' +15%, by stepsof 0 .01 cm' . On Fig . 6, which represents the tota lnumber of retrieved events as a function of iterations, i t
can be noted that the procedure always converged wit ha small number of iterations . The relative uncertaint yon the actual total number of events was proportional
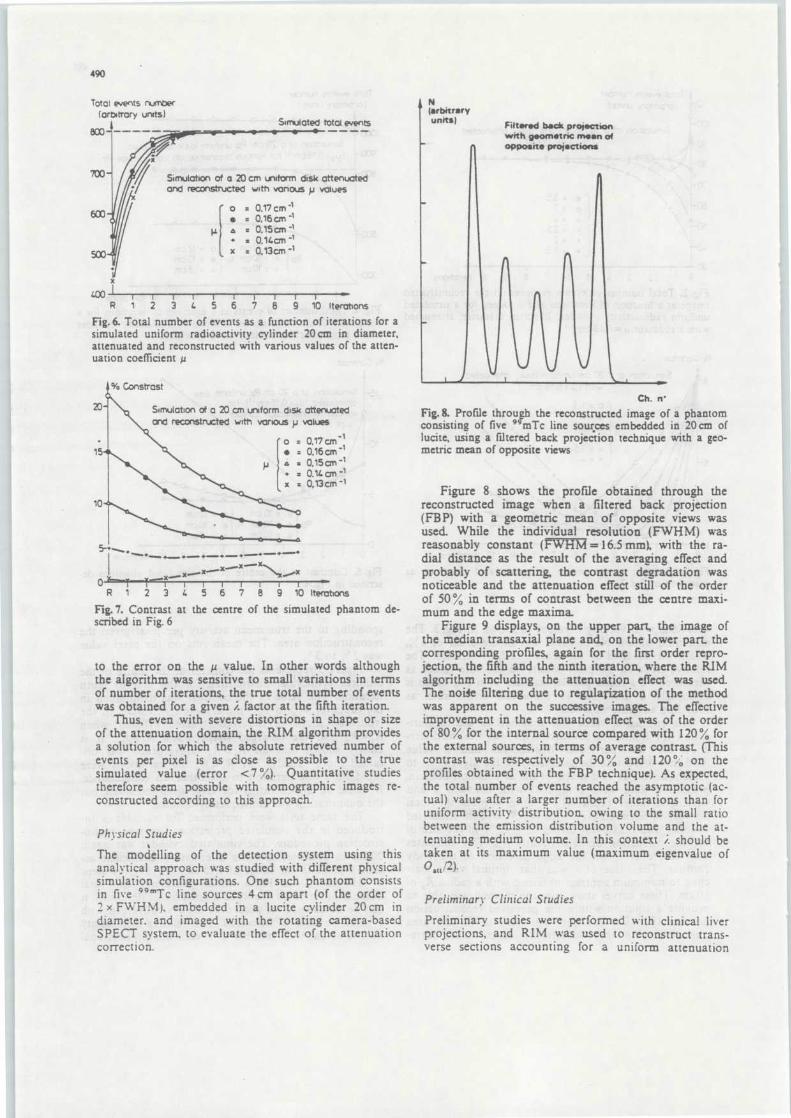
490
Tota, events cumber(arbitrary units)
Simulated total events
Simulation of a 20 cm uniform disk attenuatedand reconstructed with various p values
o s 0,17cm -1• = 0 .16cm -i
µ a = 0,15an'1• = 0.1`cmx . 0.13cm -1
N(arbitraryunits)
Filtered bade projectionwith geometric mean ofopposite projections
x
400 I
I
I
1
I
1
l
1R 1 2 3 c 5 6 7 8 9 10 aerations
Fig . 6. Total number of events as a function of iterations for asimulated uniform radioactivity cylinder 20 cm in diameter ,attenuated and reconstructed with various values of the atten-uation coefficient p
% Constrast
Fig .7. Contrast at the centre of the simulated phantom de -scribed in Fig. 6
to the error on the p value. In other words althoug hthe algorithm was sensitive to small variations in termsof number of iterations, the true total number of event swas obtained for a given i. factor at the fifth iteration .
Thus, even with severe distortions in shape or sizeof the attenuation domain, the RIM algorithm providesa solution for which the absolute retrieved number o fevents per pixel is as close as possible to the tru esimulated value (error <7%). Quantitative studie stherefore seem possible with tomographic images re -constructed according to this approach .
Physical Studies
The modelling of the detection system using thisanalytical approach was studied with different physica lsimulation configurations . One such phantom consistsin five 99mTc line sources 4 cm apart (of the order o f2 x FWHM), embedded in a lucite cylinder 20cm indiameter. and imaged with the rotating camera-base dSPECT system, to evaluate the effect of the attenuatio ncorrection .
1J
Ch . n 'Fig. 8. Profile through the reconstructed image of a phanto mconsisting of five 9 mTc line sources embedded in 20 cm oflucite, using a filtered back projection technique with a geo-metric mean of opposite view s
Figure 8 shows the profile obtained through thereconstructed image when a filtered back projection(FBP) with a geometric mean of opposite views wasused. While the individualresolution (FWHM) wasreasonably constant (FWHM =16.5 mm), with the ra-dial distance as the result of the averaging effect an dprobably of scattering, the contrast degradation wa snoticeable and the attenuation effect still of the orderof 50% in terms of contrast between the centre maxi -mum and the edge maxima.
Figure 9 displays, on the upper part, the image o fthe median transaxial plane and, on the lower part. thecorresponding prôfiles, again for the first order repro-jection, the fifth and the ninth iteration, where the RI Malgorithm including the attenuation effect was used.The noise filtering due to regularization of the metho dwas apparent on the successive images. The effectiveimprovement in the attenuation effect was of the orde rof 80% for the internal source compared with 120% fo rthe external sources, in terms of average contrast (Thi scontrast was respectively of 30 % and 120% on theprofiles obtained with the FBP technique). As expected,the total number of events reached the asymptotic (ac-tual) value after a larger number of iterations than foruniform activity distribution. owing to the small rati obetween the emission distribution volume and the at-tenuating medium volume. In this context i. should b etaken at its maximum value (maximum eigenvalue o f0,« l2) .
Preliminary Clinical Studie s
Preliminary studies were performed with clinical live rprojections, and RIM was used to reconstruct trans -verse sections accounting for a uniform attenuation
Simulation of a 20 cm uniform disk attenuatedand reconstructed with various N values
o = 0,17 cm • 1• = 0.16 anJ A
0..1154 an.
014 cm • 1
x = 0,13cm- 1
5-+
xsx
R123
5 6 7 8 9 10 Iterations
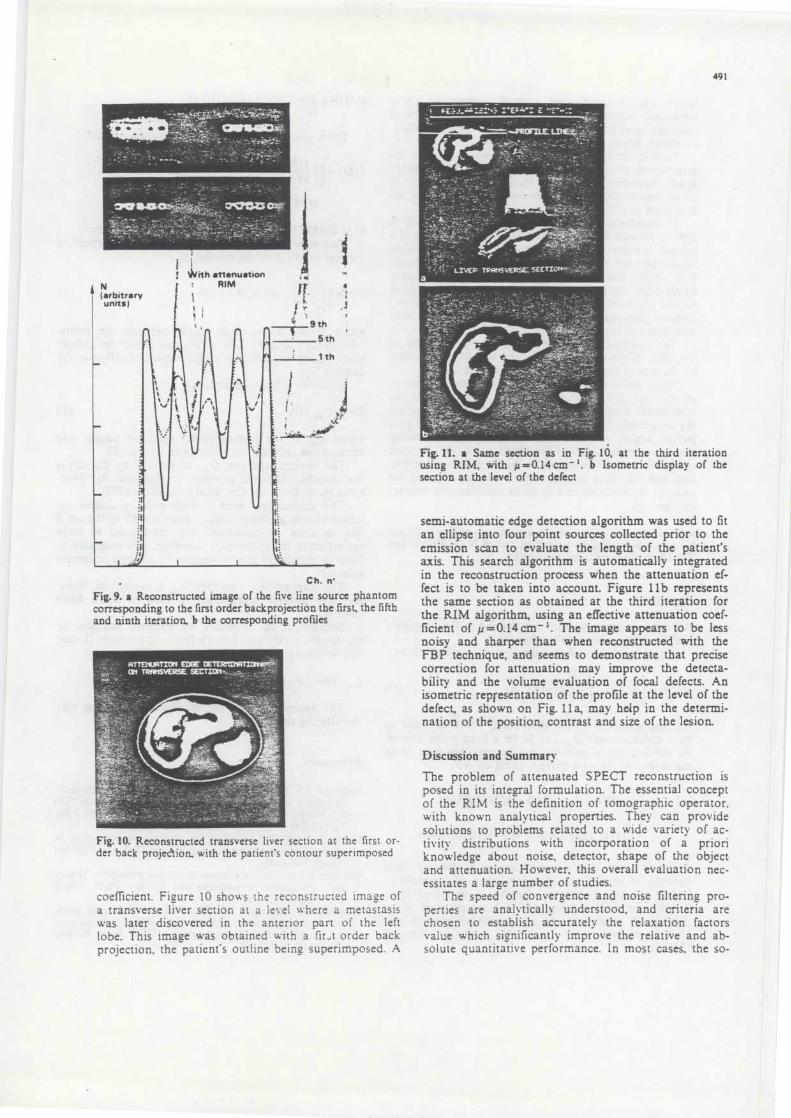
49 1
4Nith attenuationi :
RI M
~JCh. n '
Fig .9 . a Reconstructed image of the five line source phanto mcorresponding to the first order backprojection the first, the fifthand ninth iteration, b the corresponding profiles
Fig.10. Reconstructed transverse liver section at the first or -der back projection, with the patient's contour superimposed
coefficient . Figure 10 shows the reconstructed image o fa transverse liver section at a level where a metastasi swas later discovered in the anterior part of the leftlobe. This image was obtained with a fir .t order backprojection, the patient ' s outline being superimposed . A
Fig .11 . a Same section as in Fig. 10, at the third iteratio nusing RIM, with µ =0 .14 cm' . b Isometric display of th esection at the level of the defec t
semi-automatic edge detection algorithm was used to fi tan ellipse into four point sources collected prior to th eemission scan to evaluate the length of the patient' saxis. This search algorithm is automatically integratedin the reconstruction process when the attenuation ef-fect is to be taken into account . Figure 11 b represent sthe same section as obtained at the third iteration fo rthe RIM algorithm, using an effective attenuation coef-ficient of µ =0.14 cm' . The image appears to be les snoisy and sharper than when reconstructed with th eFBP technique, and seems to demonstrate that precisecorrection for attenuation may improve the detecta-bility and the volume evaluation of focal defects . Anisometric representation of the profile at the level of thedefect, as shown on Fig. 11 a, may help in the determi-nation of the position, contrast and size of the lesion.
Discussion and Summary
The problem of attenuated SPECT reconstruction i sposed in its integral formulation . The essential concep tof the RIM is the definition of tomographic operator ,with known analytical properties . They can provid esolutions to problems related to a wide variety of ac-tivity distributions with incorporation of a prior iknowledge about noise, detector, shape of the objectand attenuation. However, this overall evaluation nec-essitates a large number of studies .
The speed of convergence and noise filtering pro-perties are analytically understood, and criteria ar echosen to establish accurately the relaxation factor svalue which si gnificantly improve the relative and ab -solute quantitative performance. In most cases, the so -
N(arbitraryunits)
r
1th
lution was obtained after a small number (<10) o fiterations . Faster convergence for a larger amount o fattenuation to be corrected (p non-uniform and/or larg-er . object) is currently under evaluation.
Further investigation is also needed to reduce in-terpolation artefacts and computer time and memoryspace requirements, when a whole-body size section i sto be reconstructed using measured (pixel-by-pixel) at-tenuation distribution.
In conclusion, an algorithm is proposed, which i sable to provide fast and quantitative reconstruction of ageneral volume activity distribution from its projec-tions when the attenuation effect is taken into account .The results obtained on phantoms and preliminarywhole-body clinical data show an effective correctio nfor the attenuation effect, with improved resolution an dcontrast compared with the filtered back projectiontechniques (Ramp filter) .
The processing time (in Assembler) is currently o fthe order of 40-100s per plane and iteration dependin gon the size of the object and the µ distribution .
More accurate measurement in realistic situation sof regional concentration may be obtained if the in-strumental artefacts and the scattered photon fractio nare minimised. Currently, the minimum number of pro-jection angles, the numerical sampling and weighting ,the experimental data normalisation on an absolutescale, the actual evaluation of the attenuation distribu-tion and the value of the relaxation factor affecting th enumber of iterations in any given situation, are matter sfor research .
Acknowledgements . The authors are very grateful to S . Ricar dfor her skilled technical assistance, and to N . De Blecker an dH. Le Bigre for typing the manuscripts .
Appendix
All symbols and notations are defined in the Materialsand Methods section, following Fig . 1 .
Consider the set of measured projection defined by :
D
p(1, 9) =1 f. (s) exp [_(x)dx] ds.A
s
For the simplicity of the derivation, µ will assumed t obe a constant over 2 m . Let M be a fixed point locatedon AB and this expression can be rewritten with M asthe origin, M' being a current point on AB :
A
p(l, 0)= f (M') exp [—µ(MD—MM')] d(MM' )M
B
+ f (M') exp [—µ(MM'+MD)] d(MM' )M
where MD and MM' are the distance in absolute valuebetween M' and D, and M and M' over AB . In order t oobtain symetrical integral operator, a modified func-tion can be defined, associated with the point M of th edomain 1f, such that the corresponding operator ha sknown properties . We call this modified functio n(SUM) :
SIM) = i 1 p(1, 0) exp [p(MD)] d e2 *
Then, it is easy to derive the expression of S(M) :
S M = f (M') exp [— µ(M M')] 2 +exp [(AMM')]
( )LI' m,
M M' d (M M') d 9 is the surface integration element.This expression could be rewritten with respect t o
the real origin co of the domain 1f :
S(r)=ss coshp1r— P- ' Jd°r ''r—
rr
where I t -Pt is the path length between the pointsreferenced and F. The derivation would be simila rwhen taking into account a distribution of µ(r) over th edomain l µ .
Equation (2') can be written :
S(r) = Q ut f ( r )
( 3' )
where 0 n. « is the (tomographic) operator taking int oaccount the attenuation effect given by Eq. (2') .
The integral operator O a,,, as defined by Eq . (2) isthe so-called ill-posed problem of Hadamar for Fred -holm integrals of the first kind (Nedelkov 1972) .
This means that even if there exists a unique so-lution to this problem, slight variations bS in the set Sdue to noise or distortions will correspond to larg evariations in the solution f. Therefore, it is necessary t ofilter or regularize the procedure to attempt a correc tsolution.
The tomographic operator 0,,, is symetrical, linearand has positive eigenvalues ). bounded by a finit evalue i. .
Because of its simplicity, an iterative solution fo rthe function f ('r) to be extracted is convenient (Leco qand Soussaline 1975) :
fn+ i (r) — f,, ( I') + i (S(r) — ®aft fn (r) )
The value of À. and the number of iterations pla ythe filtering role.
References
Budinger TF, Gullberg GT, Huesman RH (1979) Emissio ncomputed tomography in Topics in applied physics . (Ed )GT Herman, Springer Verlag, Berlin Heidelberg New Yor k32 :147-246
Chang LT (1978) A method for attenuation correction i nradionuclide computed tomography . IEEE Trans Nucl SciNS-25 :638 -643
Gullberg GT (1979) The attenuation Radon transform : Theoryand application in medicine and biology . Ph .D. ThesisUniversity of Californi a
Gullberg GT, Budinger TB (1981) The use of filtering meth -ods to compensate for constant attenuation in single-pho-ton emission computed tomography . IEEE Trans Biome dEng BME 28 :142-15 7
s,
2
MM'd(MM') de
( 2' )

49 3
Ka\ DB. Keyes JW Jr (1975) First-order corrections fo rabsorption and resolution compensation in radionuclide.Fourier tomography . (Abstr.) JNM 16 :540-54 1
Kuh l DE, Edwards RQ, Ricci AR, Rcivich M (1973) Quan-titative section scanning using orthogonal tangent cor -rection . JNM 14 :196-200
Lecoq G, Soussaline F (1975) Le problème de la recon-struction d'image à partir des projections. Revue des mé-thodes de résolution et Méthode Itérative Régularisante .(MIR) Rapport SERMA 257/S
Nedelkov IP (1972) Improper problems in computationalphysics. Comp Phys Corn 4 :157-164
Sorenson JA, Cameron JR (1974) Transmission scanningtechniques. In Instrumentation in nuclear medicine, Vol
2. (Ed) GJ Hine, JA Sorenson, Academic Press, New Yor k349-384
Soussaline F, Todd-Pokropek AE, Zurowski S, Huffer E ,Raynaud C, Kellershohn C (1981) A rotating conventiona lgamma camera single-photon tomographic system : Physi-cal characterization. J Comput Assist Tomogr 5 :551-556
Tretiak OJ, Metz C (1980) The exponential radon transform .SIAM J Appl Math 39 :341-354
Walters TE, Simon W, Chesler DA, Correia JA (1981) Atten-uation correction in gamma emission computed tomog-raphy . J Comput Assist Tomogr 5 :89-94
Received April 24, 1982

PUBLICATION
VIII
PUBLICATION VII I
SPET reconstruction with a non-uniform attenuatio ncoefficient using an analytical regularizing iterative metho d
F . Soussaline, C . LeCoq, C . Raynaud, C . Kellershohn
Serv. Hosp. Frédéric Joliot - Départ. de Biologie-Commissariat à l ' Energie Atomique ORSAY, Franc e
* * SERMA, Dep. of Reactor, CEN-SACLAY91191 GIF sur YVETTE CEDEX
INTRODUCTION
Quantitative extraction of scintigraphic data such as Absolute functional pa -rameter can be potentially improved by use of Single Photon Emission Tomography(SPET) . After the main factors influencing the precision hav e . been studied(Jaszczak, 1981) and taken into account, the major problems affecting quan -titative accuracy of tomographic data remain those of attenuation and the erro rinharentin the reconstruction method . An analytical solution to the problem o fSPET reconstruction has been proposed
(Soussaline, 1981) where the actua lattenuation effect can be included in the definition of the Tomographic Operato r
involved . Such an approach provides the ability of obtaining local quantitatio n
of the tracer distribution . The aim of this study is to evaluate the potentia l
of the RIM technique when used in brain studies .
MATERIAL AND METHO D
The Regularizing Iterative Method (RIM) is described in detail elsewher e
(Soussaline, 1981 ) and its application to the reconstruction of 2 dimensional
transverse radioactive distribution in an attenuating medium, where U is se t
as a constant, was studied
(Soussaline, 1981) . The key concept of the RIM
technique is the definition of a whole class of Tomographic Operators (TO) ,
which properties are well understood and which lead to a virtually exact recon s-
tructed solution . Another important characteristic is that the mathematical fo r -
mulation of the solution is such that information could be provided,rather tha n
suppressed, by the attenuation distribution itself . The Emission TomographicOperator to be solved, is the following :
S (r)
f (r' )
-0JJ l r-r '
where U (1) is the linear attenuation coefficient in a domain D of attenuatin g
♦r -r '
U (1) dl dr '
1034
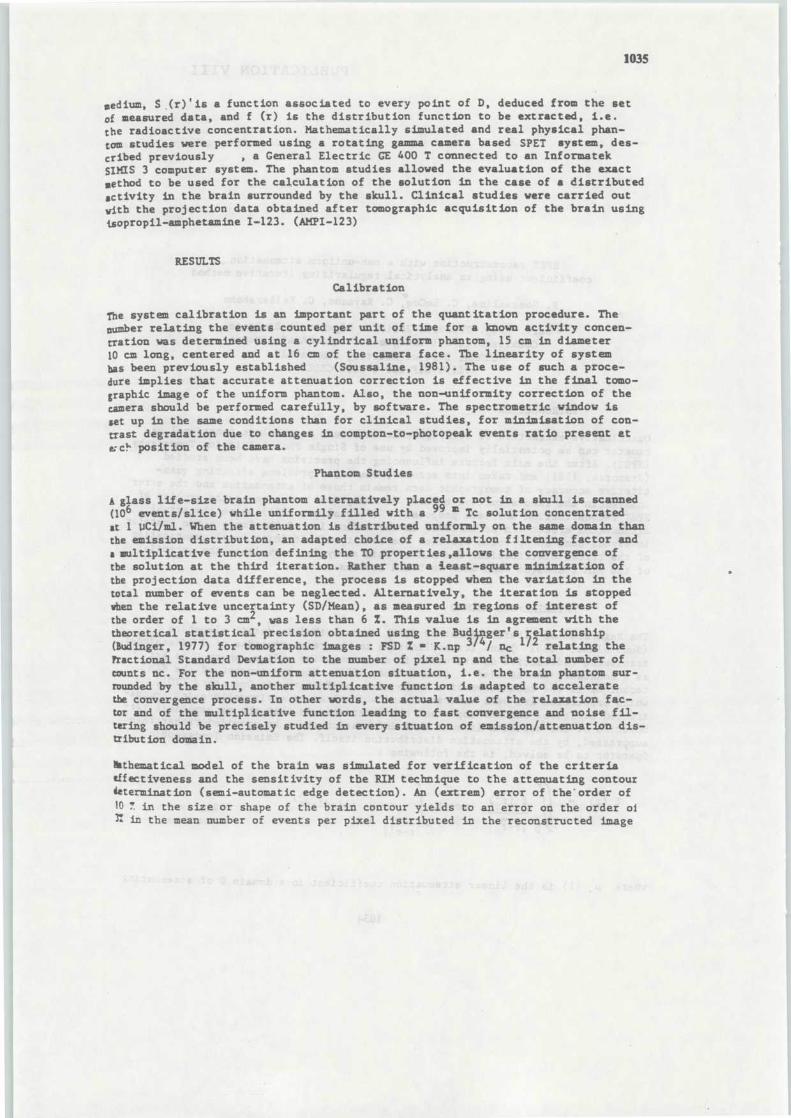
103 5
medium, S . (r) ' is a function associated to every point of D, deduced from the se tof measured data, and f (r) is the distribution function to be extracted, i .e .the radioactive concentration . Mathematically simulated and real physical phan-tom studies were performed using a rotating gamma camera based SPET system, des-cribed previously
, a General Electric GE 400 T connected to an InformatekSIMIS 3 computer system. The phantom studies allowed the evaluation of the exac tmethod to be used for the calculation of the solution in the case of a distribute dactivity in the brain surrounded by the skull . Clinical studies were carried outwith the projection data obtained after tomographic acquisition of the brain usin gtsopropil-amphetamine 1-123 . (AMPI-123)
RESULTS
Calibration
The system calibration is an important part of the quantitation procedure . Thenumber relating the events counted per unit of time for a known activity concen-tration was determined using a cylindrical uniform phantom, 15 cm in diamete r10 cm long, centered and at 16 cm of the camera face . The linearity of systembas been previously established
(Soussaline, 1981) . The use of such a proce -dure implies that accurate attenuation correction is effective in the final tomo-graphic image of the uniform phantom . Also, the non-uniformity correction of th ecamera should be performed carefully, by software . The spectrometric window i sset up in the same conditions than for clinical studies, for minimisation of con-trast degradation due to changes in compton-to-photopeak events ratio present a te;c!° position of the camera.
Phantom Studie s
A glass life-size brain phantom alternatively plac eedd or not in a skull is scanned(10 events/slice) while uniformily filled with a
Tc solution concentratedat 1 liCi/ml . When the attenuation is distributed uniformly on the same domain tha nthe emission distribution, an adapted choice of a relaxation filtering factor an da multiplicative function defining the TO properties ,alloys the convergence o fthe solution at the third iteration. Rather than a ieast-square minimization o fthe projection data difference, the process is stopped when the variation in th etotal number of events can be neglected . Alternatively, the iteration is stoppe dwhen the relative uncertainty (SD/Mean), as measured in regions of interest o fthe order of 1 to 3 cm 2, was less than 6 % . This value is in agrement with thetheoretical statistical precision obtained using the Bud4nger ' s 1 ~ 2elationship(Budinger, 1977) for tomographic images : FSD x = 'K .np 3/4 / ne
relating thetractional Standard Deviation to the number of pixel np and the total number o fcounts nc . For the non-uniform attenuation situation, i .e . the brain phantom sur -rounded by the skull, another multiplicative function is adapted to accelerat ethe convergence process . In other words, the actual value of the relaxation fac-tor and of the multiplicative function leading to fast convergence and noise fil-tering should be precisely studied in every situation of emission/attenuation dis-tribution domain .
hthematical model of the brain was simulated for verification of the criteriaeffectiveness and the sensitivity of the RIM technique to the attenuating contourieterminat ion (semi-automatic edge detection) . An (extrem) error of theorder o fto 7 in the size or shape of the brain contour yields to an error on the order o f3: in the mean number of events per pixel distributed in the reconstructed image
e
1036
at the center of the object, after the third iteration. In addition, the contras tis degraded when the reconstruction contour is smaller than the actual one .
Clinical Studies
Preliminary clinical studies are performed with brain projections, and the RIMtechnique, adapted on the phantom described, is used to reconstruct transvers esections accounting for the attenuation effect . A semi automatic edge detectionalgorithm is integrated in the reconstruction process for the determination ofthe emission-to-attenuation distribution domain . Volumes of interest (of theorder of 6 ca3 ) are selected on a brain hemisphere and reported symetrically fo rpatients with and without symptom of nervous disease . The symetrical values res-pectively founded on normal activity distribution and distribution with hypoac-tivity are compared to that obtained when a filtered Back Projection (FBP) tech -nique is used.
CONCLUSION
The analytical Regularizing Iterative Method is designed to provide fast an daccurate reconstruction of tomographic images when non-uniform attenuation is t obe accounted for .
As indicated by the phantom studies, this method improves the contrast and thesignal-to-noise ratio as compared to those obtained with FBP technique. Preliminar yresults obtained in brain studies using AMPI-123 are very encouraging in termsof quantitative regional cellular activity . However, the clinical usefulness o fthis mathematically accurate reconstruction procedure is going to be demonstrat ed,
in our Institution, in comparing quantitative data in heart or liver studies wh erecontrol values can be obtained .
ACKNOWLEDGEMENT
The authors would like to express their thanks to L. Herz and S . Zurovski fortheir skilled programming
help and S . Ricard for her technical assistance.
REFERENCES
Budinger, T.F ., S .E. Derenzo, G .T. Gullberg, W.L. Greenberg, R .H . Huesman (19 77 )"Medical radionuclide imaging " , Emission Computer Axial Tomography (TAEA SymP• )Abstract, IAEA, Vienna 1, 321 .
Jaszczak, B.J ., R.E . Coleman, F .R. Whitehead (1981) . Physical factors affect ingquantitative measurements using camera based Single Photon Emission Compute dTomography (SPECT) . IEEE Trans . on Nucl . Sci ., Vol NS-28, N°1, 69-80 .
Soussaline, F .P ., G. Lecoq (1981) RIM : Regularizing Iterative Method . I- An
analytical iterative solution to the problem of three dimensional reconstruction
in emission computed tomography . Submitted for publication to J . of Compùt .Assist . Tomogr .
Soussaline, F .P ., A. Cao, G . Lecoq, C . Raynaud, C . Kellershohn (1981) RIMRegularizing Iterative Method . II- Application to quantitative Single Photo n
Emission Computed Tomography with the attenuation effect . Submitted for pub lics 'tion to J. of Comput . Assist . Tomogr .
1037
sossaline, F.P ., A.E . Todd-Pokropek, S . Zurovsk, E . Huffer, C. Raynaud ,c . Kellershohn (1981) A rotating conventional gamma camera Single Photo nfission Computed Tomography (SPECT) . J. ofComput . Assist . Tcimogr ., Vol 5 ,$ 0 b, 551-556 .

PUBLICATION
IX
PUBLICATION I X
Reprint fro m
"MEDICAL RADIONUCLIDE IMAGING 1980"
VOL. I
INTERNATIONAL ATOMIC ENERGY AGENC YVIENNA, 1981
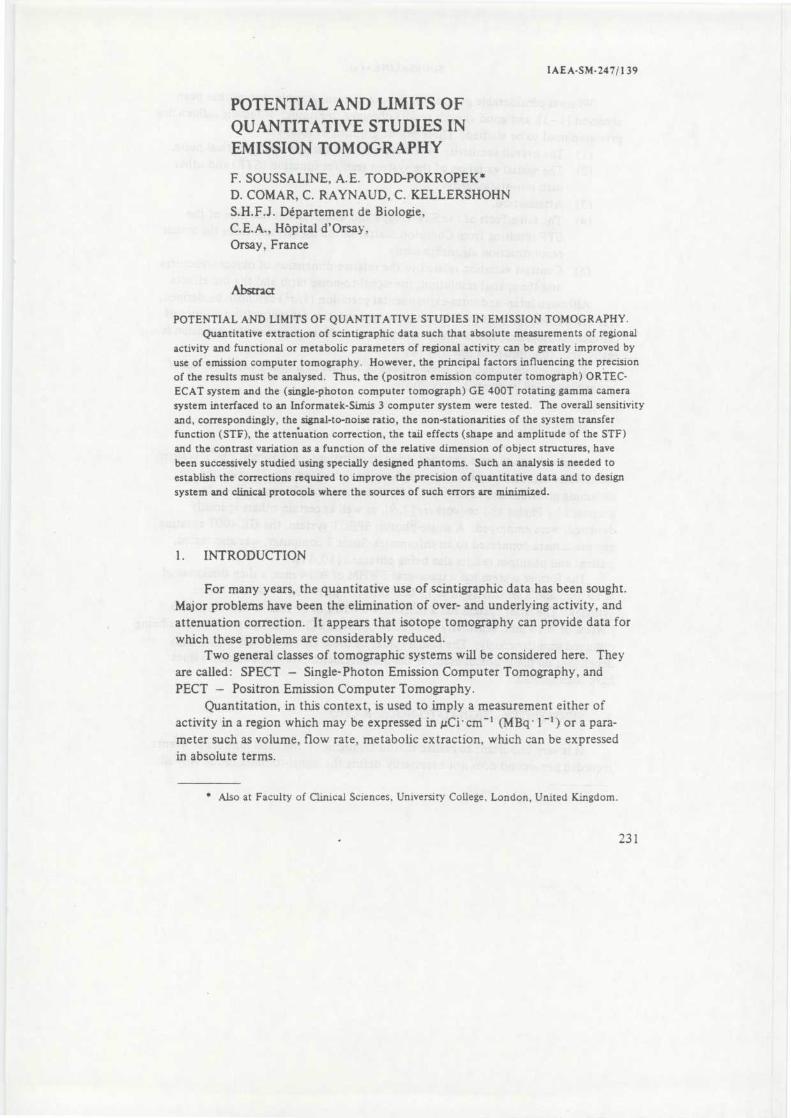
IAEA-SM-247/139
POTENTIAL AND LIMITS O F
QUANTITATIVE STUDIES INEMISSION TOMOGRAPHY
F. SOUSSALINE, A.E. TODD-POKROPEK *D. COMAR, C . RAYNAUD, C. KELLERSHOH NS.H.F.J . Département de Biologie ,
C.E.A., Hôpital d'Orsay ,
Orsay, Franc e
Abstract
POTENTIAL AND LIMITS OF QUANTITATIVE STUDIES IN EMISSION TOMOGRAPHY .Quantitative extraction of scintigraphic data such that absolute measurements of regiona l
activity and functional or metabolic parameters of regional activity can be greatly improved b yuse of emission computer tomography . However, the principal factors influencing the precisio n
of the results must be analysed . Thus, the (positron emission computer tomograph) ORTEC -ECAT system and the (single-photon computer tomograph) GE 400T rotating gamma camer asystem interfaced to an Informatek-Simis 3 computer system were tested . The overall sensitivit yand, correspondingly, the signal-to-noise ratio, the non-stationarities of the system transfe rfunction (STF), the attenuation correction, the tail effects (shape and amplitude of the STF )and the contrast variation as a function of the relative dimension of object structures, havebeen successively studied using specially designed phantoms . Such an analysis is needed t oestablish the corrections required to improve the precision of quantitative data and to designsystem and clinical protocols where the sources of such errors are minimized .
1 . INTRODUCTION
For many years, the quantitative use of scintigraphic data has been sought .Major problems have been the elimination of over- and underlying activity, an dattenuation correction . It appears that isotope tomography can provide data fo rwhich these problems are considerably reduced .
Two general classes of tomographic systems will be considered here . Theyare called: SPECT — Single-Photon Emission Computer Tomography, an dPECT — Positron Emission Computer Tomography .
Quantitation, in this context, is used to imply a measurement either o factivity in a region which may be expressed in µCi • cm -1 (MBq . 1 -1 ) or a para -meter such as volume, flow rate, metabolic extraction, which can be expresse din absolute terms .
* Also at Faculty of Clinical Sciences, University College, London, United Kingdom .
231
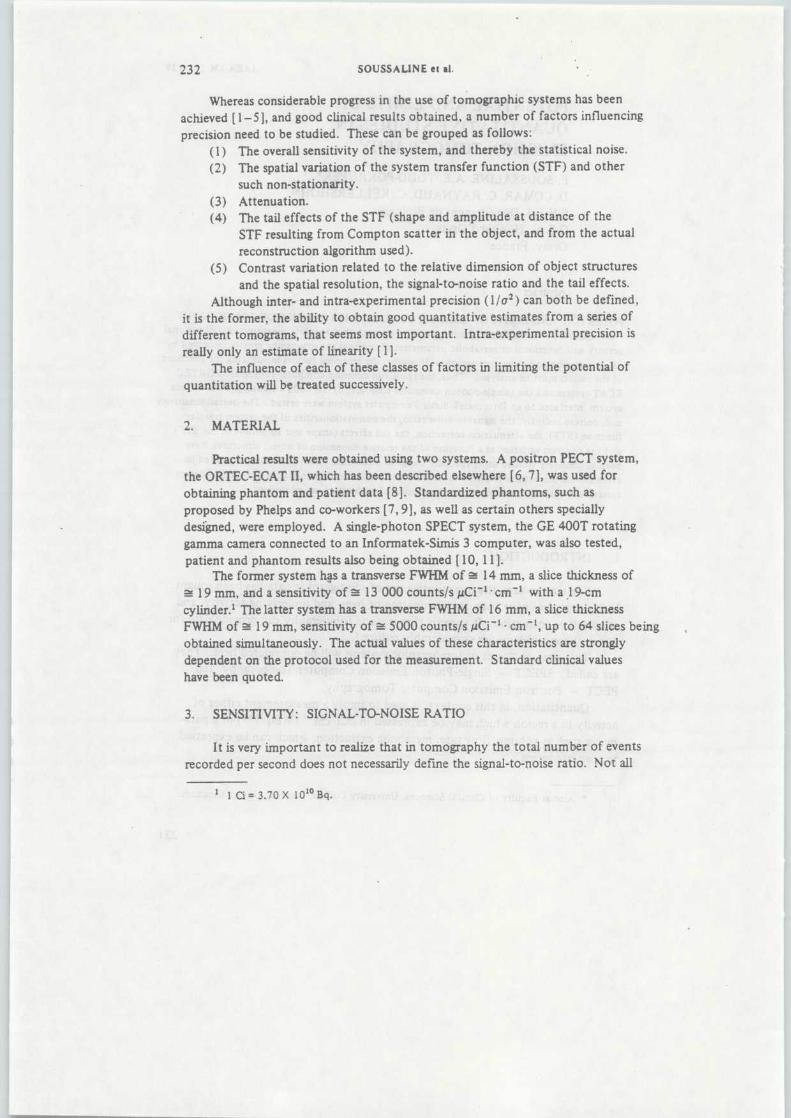
232
SOUSSALINE et al.
Whereas considerable progress in the use of tomographic systems has bee n
achieved [1-51, and good clinical results obtained, a number of factors influencing
precision need to be studied . These can be grouped as follows :
(1) The overall sensitivity of the system, and thereby the statistical noise .
(2) The spatial variation of the system transfer function (STF) and othe r
such non-stationarity .
(3) Attenuation .(4) The tail effects of the STF (shape and amplitude at distance of th e
STF resulting from Compton scatter in the object, and from the actua l
reconstruction algorithm used) .
(5) Contrast variation related to the relative dimension of object structure sand the spatial resolution, the signal-to-noise ratio and the tail effects .
Although inter- and intra-experimental precision (1 jo t ) can both be defined ,it is the former, the ability to obtain good quantitative estimates from a series o f
different tomograms, that seems most important . Intra-experimental precision i s
really only an estimate of linearity [ 1 ] .The influence of each of these classes of factors in limiting the potential o f
quantitation will be treated successively .
2. MATERIAL
Practical results were obtained using two systems. A positron PECT system ,the ORTEC-ECAT II, which has been described elsewhere [6, 7], was used fo r
obtaining phantom and patient data [8] . Standardized phantoms, such asproposed by Phelps and co-workers [7, 9], as well as certain others speciallydesigned, were employed . A single-photon SPECT system, the GE 400T rotatin ggamma camera connected to an Informatek-Simis 3 computer, was also tested ,patient and phantom results also being obtained [ 10,11 ] .
The former system has a transverse FWHM of 14 mm, a slice thickness o f
19 mm, and a sensitivity of 13 000 counts/s µCî -1 • cm" with a ,19-cmcylinder.' The latter system has a transverse FWHM of 16 mm, a slice thicknes sFWHM of 19 mm, sensitivity of 5000 counts/s µCi'' . cm', up to 64 slices bein gobtained simultaneously . The actual values of these characteristics are strongl ydependent on the protocol used for the measurement . Standard clinical valueshave been quoted .
3. SENSITIVITY : SIGNAL-TO-NOISE RATIO
It is very important to realize that in tomography the total number of event srecorded per second does not necessarily define the signal-to-noise ratio . Not al l
' 1 Ci = 3 .70 X 10 10 Bq .
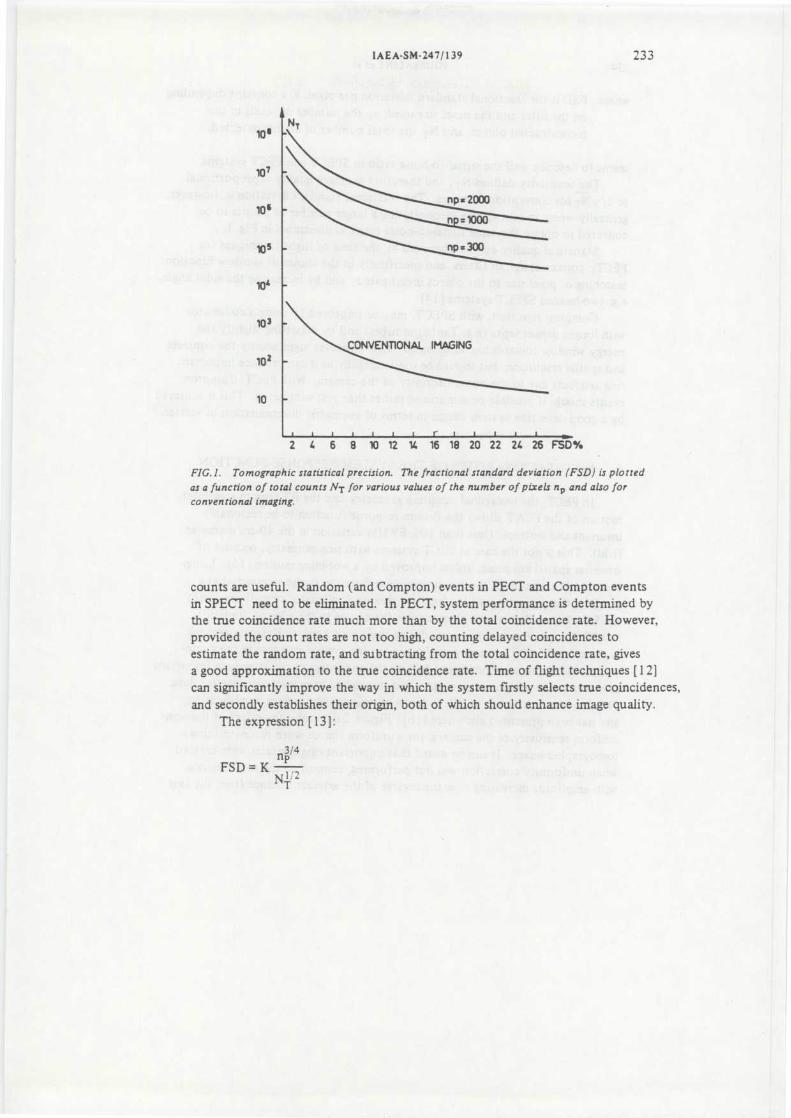
1AEA-SM-247/ 139
23 3
LN T
10 6
10 7
10 6
np= 2000
np=300
CONVENTIONAL IMAGIN G
t t t 1 t t r i t t i t a.,
4 6 8 10 12 14 16 18 20 22 24 26 FSO %
FIG.1 . Tomographic statistical precision . The fractional standard deviation (FSD) is plotte das a function of total counts NT for various values of the number of pixels np and also fo rconventional imaging.
counts are useful . Random (and Compton) events in PECT and Compton eventsin SPECT need to be eliminated . In PECT, system performance is determined b ythe true coincidence rate much more than by the total coincidence rate . However ,provided the count rates are not too high, counting delayed coincidences t oestimate the random rate, and subtracting from the total coincidence rate, give sa good approximation to the true coincidence rate . Time of flight techniques [12 ]can significantly improve the way in which the system firstly selects true coincidences ,and secondly establishes their origin, both of which should enhance image quality .
The expression [13] :
FSD = KN I/ 2
T
10 5
10 `
10 3
10 2
10
.
np/
4
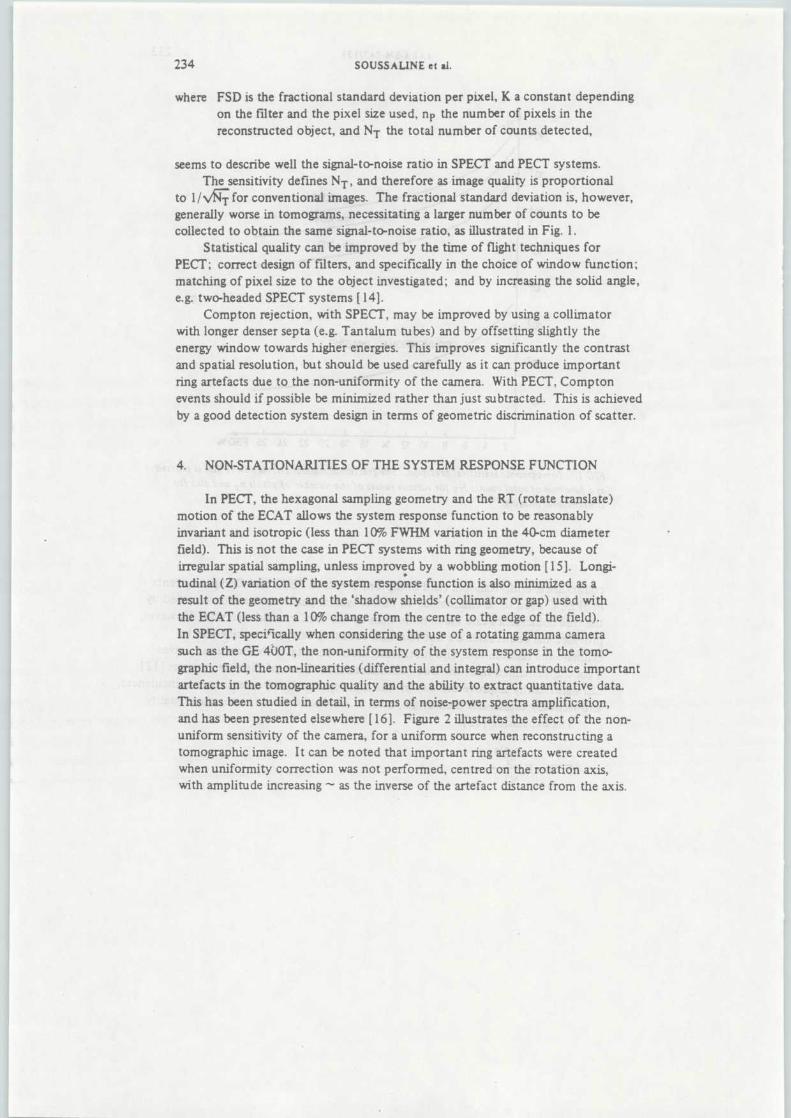
234
SOUSSALINE et ai .
where FSD is the fractional standard deviation per pixel, K a constant dependin gon the filter and the pixel size used, np the number of pixels in thereconstructed object, and NT the total number of counts detected ,
seems to describe well the signal-to-noise ratio in SPECT and PECT systems .The sensitivity defines N T , and therefore as image quality is proportional
to 1/V&-.7''r for conventional images. The fractional standard deviation is, however ,generally worse in tomograms, necessitating a larger number of counts to b ecollected to obtain the same signal-to-noise ratio, as illustrated in Fig . 1 .
Statistical quality can be improved by the time of flight techniques fo rPECT; correct design of filters, and specifically in the choice of window function ;matching of pixel size to the object investigated ; and by increasing the solid angle ,e .g. two-headed SPECT systems [14] .
Compton rejection, with SPECT, may be improved by using a collimato rwith longer denser septa (e .g. Tantalum tubes) and by offsetting slightly th eenergy window towards higher energies . This improves significantly the contrastand spatial resolution, but should be used carefully as it can produce importan tring artefacts due to the non-uniformity of the camera . With PECT, Comptonevents should if possible be minimized rather than just subtracted . This is achieve dby a good detection system design in terms of geometric discrimination of scatter .
4. NON-STATIONARITIES OF THE SYSTEM RESPONSE FUNCTIO N
In PECT, the hexagonal sampling geometry and the RT (rotate translate )motion of the ECAT allows the system response function to be reasonabl yinvariant and isotropic (less than 10% FWHM variation in the 40-cm diamete rfield) . This is not the case in PECT systems with ring geometry, because o firregular spatial sampling, unless improved by a wobbling motion [ 15] . Longi-tudinal (Z) variation of the system response function is also minimized as aresult of the geometry and the `shadow shields ' (collimator or gap) used withthe ECAT (less than a 10% change from the centre to the edge of the field) .In SPECT, speci fically when considering the use of a rotating gamma camerasuch as the GE 400T, the non-uniformity of the system response in the tomo -graphic field, the non-linearities (differential and integral) can introduce importan tartefacts in the tomographic quality and the ability to extract quantitative data .This has been studied in detail, in terms of noise-power spectra amplification ,and has been presented elsewhere [16] . Figure 2 illustrates the effect of the non-uniform sensitivity of the camera, for a uniform source when reconstructing atomographic image . I t can be noted that important ring artefacts were create dwhen uniformity correction was not performed, centred on the rotation axis ,with amplitude increasing as the inverse of the artefact distance from the axis .
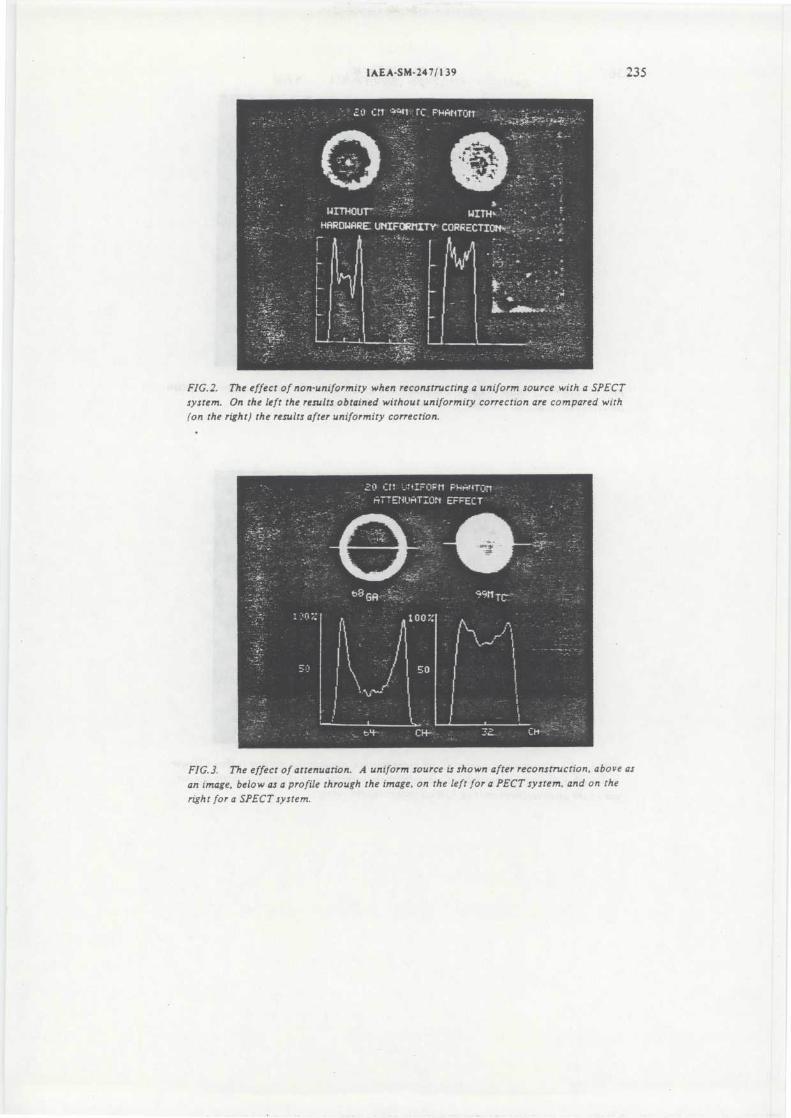
IAEA-SM-247/139 23 5
FIG .2. The effect of non-uniformity when reconstructing a uniform source with a SPEC Tsystem . On the left the results obtained without uniformity correction are compared wit h(on the right) the results after uniformity correction .
FIG.3. The effect of attenuation . A uniform source is shown after reconstruction, above a s
an image, below as a profile through the image, on the left for a PECT system, and on th e
right for a SPECT system .
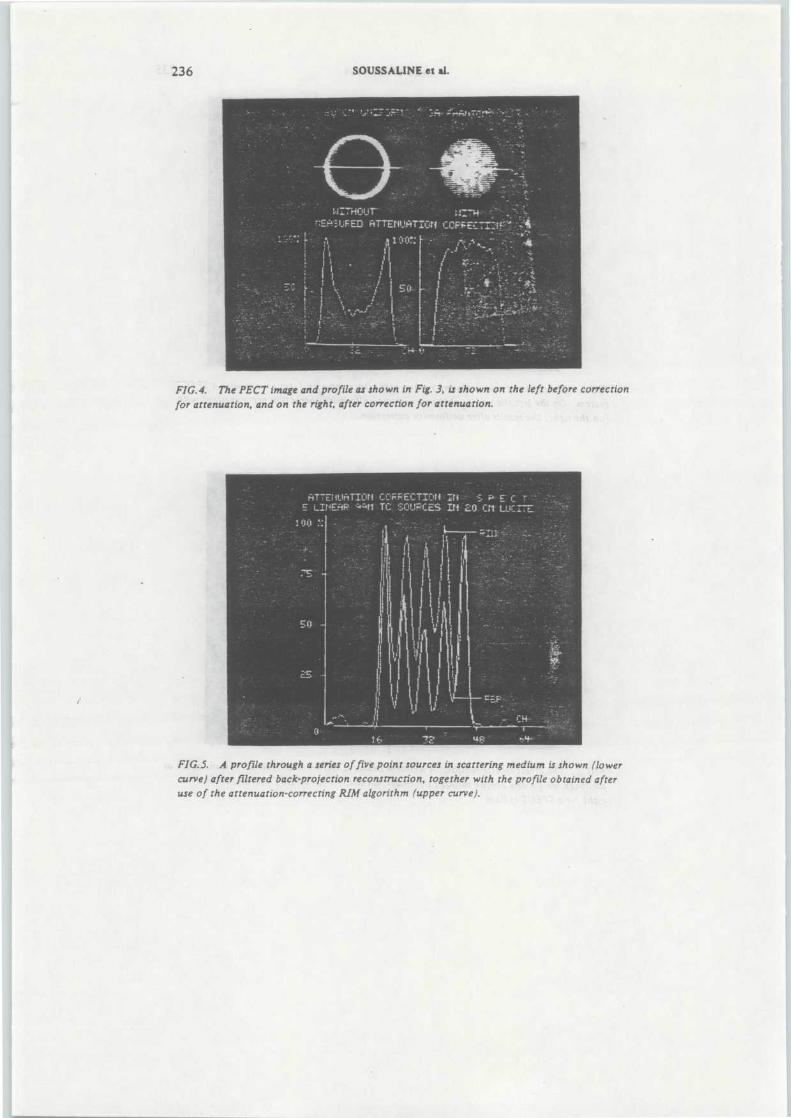
236 SOUSSALINE et al .
FIG.4. The PECT image and profile as shown in Fig. 3, is shown on the left before correctio nfor attenuation, and on the right, after correction for attenuation .
FIGS. A profile through a series of five point sources in scattering medium is shown (lowe rcurve) after filtered back-projection reconstruction, together with the profile obtained afte ruse of the attenuation-correcting RIM algorithm (upper curve) .
tiTTEii tfiTIOt4 COFRECTIOf ~~
~► E C
.E LIt4ERR
TC SOURCES Iti 20 Cit _ C
SO —
i !
t
+-Cif-
0
11
16 . r ,4s
IAEA-SM-247/139
23 7
5. ATTENUATION
The amplitude of the attenuation effect, for comparable geometry of th eradioactive distribution, and the ability to correct accurately for this effect ,introduces a definitive distinction between SPECT and PECT .
As illustrated in Fig . 3, the apparent attenuation of 140 keV single photon s( 99Tcm ) in a 20-cm diameter uniformly filled cylinder is significantly lessimportant than for 511 keV coincident photon emission ("Ga) with the sam egeometry [17] (contrary to the ratio of their attenuation coefficients) .
In PECT, attenuation correction can, in principle, be performed exactly .The problems here are essentially statistical . The line integrals of attenuatio ncorrection factors need to be defined precisely, either analytically (finding th eedge of the object and assuming values for µ), or by measurement using a nexternal source [6] . Considerable amplification of the noise can occur, and car emust be taken . For quan4itative studies, correction is performed in standardconditions using transmission data with and without the object in the field.With a `measured correction ' for a 1 M count image of an extended source afte ra transmission scan containing 4 M counts (as shown in Fig . 4), the FSD in th ereconstructed image was found to be 12% . With ` analytical ' correction, errorsin the integral over the source distribution, resulting from mismatching of eithe rthe object and the outline, or the value of µ, can be as large as 20% .
With SPECT systems, two methods have been generally employed . The firs tmethod tested was an approximate compensation using the geometric average o ftwo opposed projections weighted according to a function of ray length [18] ,followed by the conventional filtered back projection (FBP) . The second was a`regularizing iterative method ' (RIM), where a converging analytical solutio nof the attenuated projection operator exists, modified by a relaxation constant .Figure 5 shows the profiles for a phantom consisting of five linear sourcesembedded in 20 cm of lucite when reconstructed using the two methods. Nogenerally applicable method of attenuation correction in SPECT has as yet bee nfound [19] .
6. TAIL EFFECTS OF THE SYSTEM TRANSFER FUNCTION (STF)
It has been observed that tails of the STF exist with considerable power eve nat large distances from their centres . These tails originate partly from thereconstruction algorithm, and partly from the physical response of the system .In PECT systems, the effect appears to be greater than in SPECT systems, inparticular for large plane detectors [4, 20] . One effect of these tails is to creat esignificant bakground activity throughout the field of view causing quantitativ eerrors, and loss of contrast . The tail effect which seems, in this case, to be due
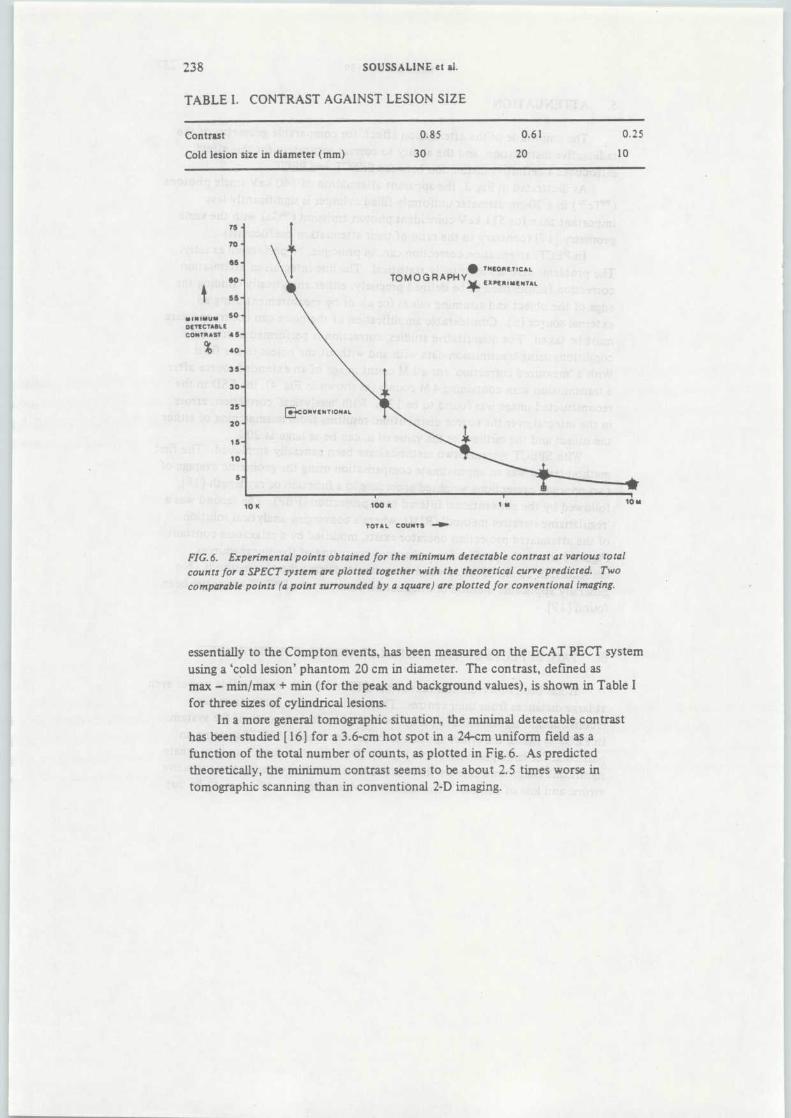
238
SOUSSALINE et al .
TABLE I . CONTRAST AGAINST LESION SIZ E
Contrast
0 .85
0 .61
0 .2 5
Cold lesion size in diameter (mm)
30
20
1 0
75
MINIMU MDETECTABL ECONTRAST 45 ..
% 40a
t
70
es .
eo -
ss -
so .
35-,30 -
25 -
20 ,15 -
10 -
5 -
TOTAL COUNTS ...Ow
FIG.6. Experimental points obtained for the minimum detectable contrast at various tota l
counts for a SPECT system are plotted together with the theoretical curve predicted . Two
comparable points (a point surrounded by a square) are plotted for conventional imaging .
essentially to the Compton events, has been measured on the ECAT PELT syste musing a ` cold lesion ' phantom 20 cm in diameter. The contrast, defined asmax — min/max + min (for the peak and background values), is shown in Table Ifor three sizes of cylindrical lesions .
In a more general tomographic situation, the minimal detectable contras thas been studied [16] for a 3 .6-cm hot spot in a 24-cm uniform field as afunction of the total number of counts, as plotted in Fig . 6 . As predicte dtheoretically, the minimum contrast seems to be about 2 .5 times worse i ntomographic scanning than in conventional 2-D imaging .
10 K 100 K10 iM
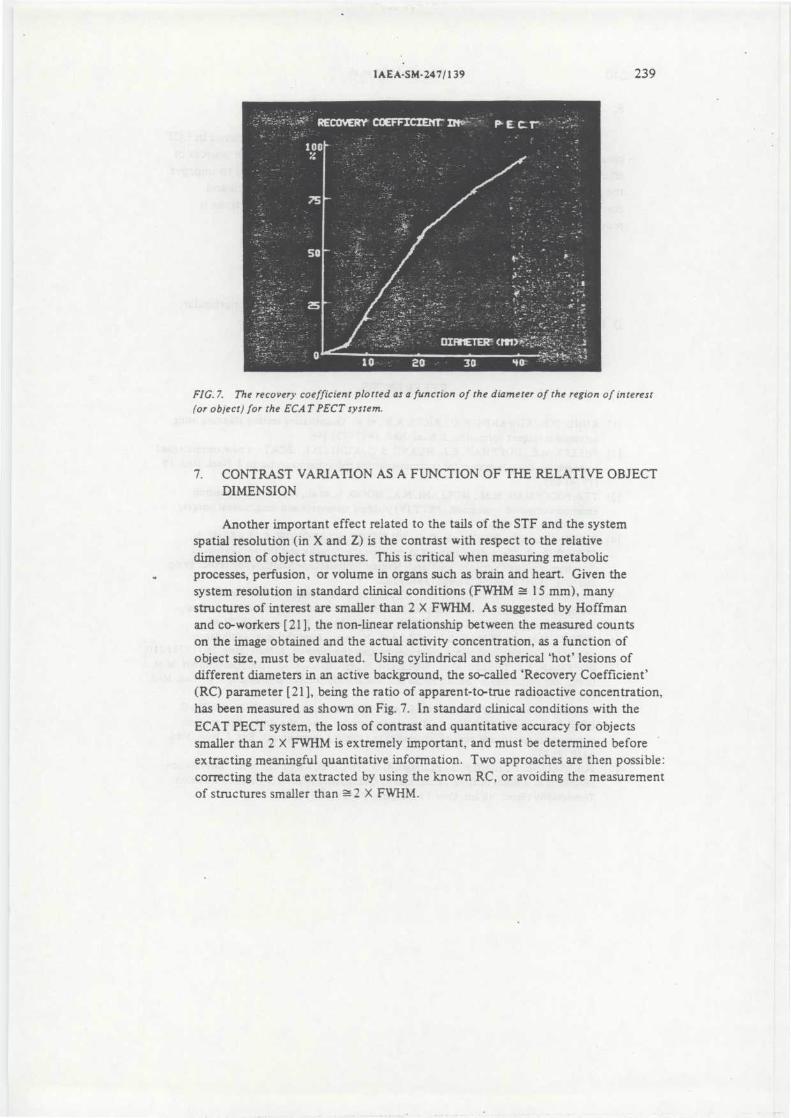
IAEA-SM-247/139 239
FIG.7. The recovery coefficient plotted as a function of the diameter of the region of interes t(or object) for the ECAT PECT system .
7. CONTRAST VARIATION AS A FUNCTION OF THE RELATIVE OBJEC TDIMENSIO N
Another important effect related to the tails of the STF and the syste mspatial resolution (in X and Z) is the contrast with respect to the relativ edimension of object structures . This is critical when measuring metaboli cprocesses, perfusion, or volume in organs such as brain and heart . Given thesystem resolution in standard clinical conditions (FWHM 15 mm), man ystructures of interest are smaller than 2 X FWHM . As suggested by Hoffmanand co-workers [21], the non-linear relationship between the measured count son the image obtained and the actual activity concentration, as a function o fobject size, must be evaluated . Using cylindrical and spherical `hot ' lesions o fdifferent diameters in an active background, the so-called `Recovery Coefficient '(RC) parameter [21], being the ratio of apparent-to-true radioactive concentration ,has been measured as shown on Fig . 7 . In standard clinical conditions with theECAT PECT system, the loss of contrast and quantitative accuracy for object ssmaller than 2 X FWHM is extremely important, and must be determined befor eextracting meaningful quantitative information . Two approaches are then possible :correcting the data extracted by using the known RC, or avoiding the measuremen tof structures smaller than =2 X FWHM .
240 SOUSSALINE et al .
Despite the very considerable clinical success that has been achieved in ECT ,great care must still be taken when extracting quantitative data . The sources o ferror must be analysed in detail and, in general, corrections obtained to improvethe precision of such results. Such an analysis also permits the design an dconstruction of systems where, it is hoped, the need for such corrections i sreduced .
The authors would like to thank their many colleagues and, in particular ,D. Plummer, Ph. Collard, A . Cao, S . Ricard, M . Crouzel and B . Loch .
REFERENCES
[1] KUHL, D . E., EDWARDS, R .Q., RICCI, A .R ., et al ., Quantitative section scanning usingorthogonal tangent correction, J . Nucl . Med . 14 (1973) 196 .
[2] PHELPS, M.E., HOFFMAN, E.J ., HUANG, S.C., KUHL, D .E ., ECAT: a new computerise dtomographic imaging system for positron-emitting radiopharmaceuticals, J . Nucl . Med. 1 9(1978) 635 .
[3] TER-POGOSSIAN, M .M ., MULLANI, N.A., HOOD, J ., et al., A multi-slice positro nemission computed tomograph (PETT IV) yielding transverse and longitudinal images ,Radiology 128 (1978) 477 .
[4] BROWNELL, G .L., BURNHAM, C.A., WILENSKY, S., ARONOW, S., KAZEMI, S. ,STRIEDER, D., "New developments in positron scintigraphy and the application o fcyclotron-produced positron emitters", Medical Radioisotope Scintigraphy (Proc . Symp .Salzburg, 1968) 1, IAEA, Vienna (1969) 163 .
[5] YAMAMOTO, Y., THOMPSON, C .J ., MEYER, et al ., Dynamic positron emissiontomography for study of cerebral hemodynamics in a cross-section of thé head usin gpositron emitting "Ga EDTA and "Kr, J . Comput. Assist . Tomogr . 1 (1977) 43 .
[6] PHELPS, M .M., HOFFMAN, E .J ., MULLANI, N., et al., Application of annihilationcoincidence detection to transaxial reconstruction tomography, J . Nucl. Med. 16 (1975) 210.
[7] HOFFMAN, E .J ., PHELPS, M .M ., MULLANI, N ., HIGGINS, C.S., TER-POGOSSIAN, M.M . ,Design and performance characteristics of a whole body transaxial tomograph, J . Nucl. Med.17 (1976) 493 .
[8] SOUSSALINE, F., TODD-POKROPEK, A.E ., PLUMIS . ,;k, D ., COMAR, D ., LOCH, C . ,HOULE, S., KELLERSHOHN, C., The physical perfoi tance of a single slice positrontomographic system and preliminary results in a clinic' : environment, Eur . J . Nucl. Med .4 (1979) 237 .
[9] SOUSSALINE, F., HOULE, S ., PLUMMER, D ., TODD-POKROPEK, A.E ., "Informatio nprocessing in medical imaging", Potentials of Quantitative Studies in Positron Emissio nTomography (Proc . 7th Int . Conf.) 88, Inserm, Paris (1980) 215 .
IAEA-SM-247/139
24 1
[10] RAYNAUD, C ., TODD-POKROPEK, A.E ., SOUSSALINE, F ., ZUROWSKI, S . ,RICARD, S ., KELLERSHOHN, C ., Preliminary results obtained in emission compute rtomography with a rotating conventional gamma-camera, J . Nucl . Med . 21 (1980) 16 .
[11] SOUSSALINE, F ., TODD-POKROPEK, A .E ., ZUROWSKI, S., HUFFER, E . ,RAYNAUD, C., "Physical characteristics of a single photon tomographic system usin ga conventional rotating camera" (Proc . 7th Int . Conf . ACNP, 1980), Clinical Utility o fSingle Photon Emission Tomography, Washington (in press) .
[12] ALLEMAND, R ., GRESSET, C ., VACKER, J ., Potential advantages of a cesium fluorid escintillator for a time of flight positron camera, J . Nucl . Med . 21 (1980) 153 .
[13] BUDINGER, T .F ., DERENZO, S .E ., GULLBERG, G .T ., GREENBERG, W .L . ,HUESMAN, R .H., "Emission computer axial tomography", Medical Radionuclid eImaging (Proc . Symp . Los Angeles, 1976) 1, IAEA, Vienna (1977) 321 (Abstract only) .
[14] JASZCAK, R .J ., SPECT : Single photon emission computed tomography, IEEE Trans.Nucl. Sci. NS-27 3 (1980) .
[15] BUDINGER, T.F., DERENZO, S.E., GULLBERG, G .T ., HUESMAN, R .H ., Trends an dprospects for circular ring positron cameras, IEEE Trans . Nucl . Sci . NS-26 (1979) .
[16] TODD-POKROPEK, A .E ., ZUROWSKI, S ., SOUSSALINE, F ., Artefact creation an dnon-uniformity in tomography, J . Nucl. Med . 21 (1980) (Abstract only) .
[17] PANG, S .C., GENNA, S ., "Clinical utility of single photon emission tomography, effect sof attenuation on emission tomography, its reconstruction non-isotropicity an dstatistics" (Proc. 7th Int . Conf . ACNP, 1980), Clinical Utility of Single Photon Emissio nTomography, Washington (in press) .
[18] SORENSON, J .A., "Instrumentation in nuclear medicine", Methods for Quantitativ eMeasurement of Radioactivity in Vivo by Whole Body Counting 2, Academic Press ,New York (1974) 311 .
[19] BUDINGER, T.F., GULLBERG, G.T., HUESMAN, R .H ., "Emission computed tomo-graphy " , Topics in Applied Physics 32, Springer Verlag, Berlin (1979) 147 .
[20] MUEHLLEHNER, G ., BUSCHIN, M .P., DUDEK, J .H ., Performance parameters of apositron imaging camera, IEEE Trans . Nucl . Sci . NS-23 (1976) 528 .
[21] HOFFMAN, E.J ., HUANG, S .C ., PHELPS, M .E ., Quantitation in positron emissio ncomputed tomography : effect of object size, J . Comput . Assist. Tomogr . 3 (1979) 299 .

PUBLICATION
X
PUBLICATION X
QUALITY CONTROL OF S .P .E .C .T . SYSTEMS : REMOVAL OF ARTEFACTS
*A. Todd—Pokropek , F . Soussaline
Service Hospitalier Frederic Joliot, Orsay Franc e* also Dept. of Medical Physics, University College London, U .K.
ABSTRACT
The sources of noise and .artefacts in single photon emission tomography .ar e
considered, a quality control procedure proposed, and some methods for removing o r
reducing artefacts suggested .
KEYWORDS
Single photon emission computerized tomography SPECT ; quality assurance/con trol ;
artefacts ; filtering; non—uniformity .
INTRODUCTION
Single photon emission computerized tomographic (SPECT) systems are such mors
sensitive with respect to setting up than conventional planar imaging systems . l a
particular adjusting a rotating gamma —camera SPECT device is very critical if g°
artefact free images are required . The reason for this is that the tomogra phic
process tends to amplify errors as a result of its error propagation propert ie.
(Todd—Pokropek 1981) . This paper considers : 1) A discussion of the source s or
error in tomography, 2) Routine quality control requirements for ECT systems, i )
Occasional quality control procedures for ECT systems, 4) Procedures for removi ng
artefacts .
THE SOURCES OF ERROR IN TOMOGRAPHY
The sources of error in tomography are various, and often ouch less obvious tha o
with conventional planar imaging . Most of the errors discussed apply to b0th
single slice and plane imaging systems . Many of the sources of noise and artef ac t
that
are
troublesome in SPECT are also found in conventional X-ra y
(Ter-Pogossian and others 1977) . Nevertheless, in general, for single slice
devices (such as x-ray CT systems) such problems are less severe, as is the ca s;
for most successful positron devices . Perhaps the implication is ' that the use °single slice SPECT systems should be re —evaluated seriously .
1018
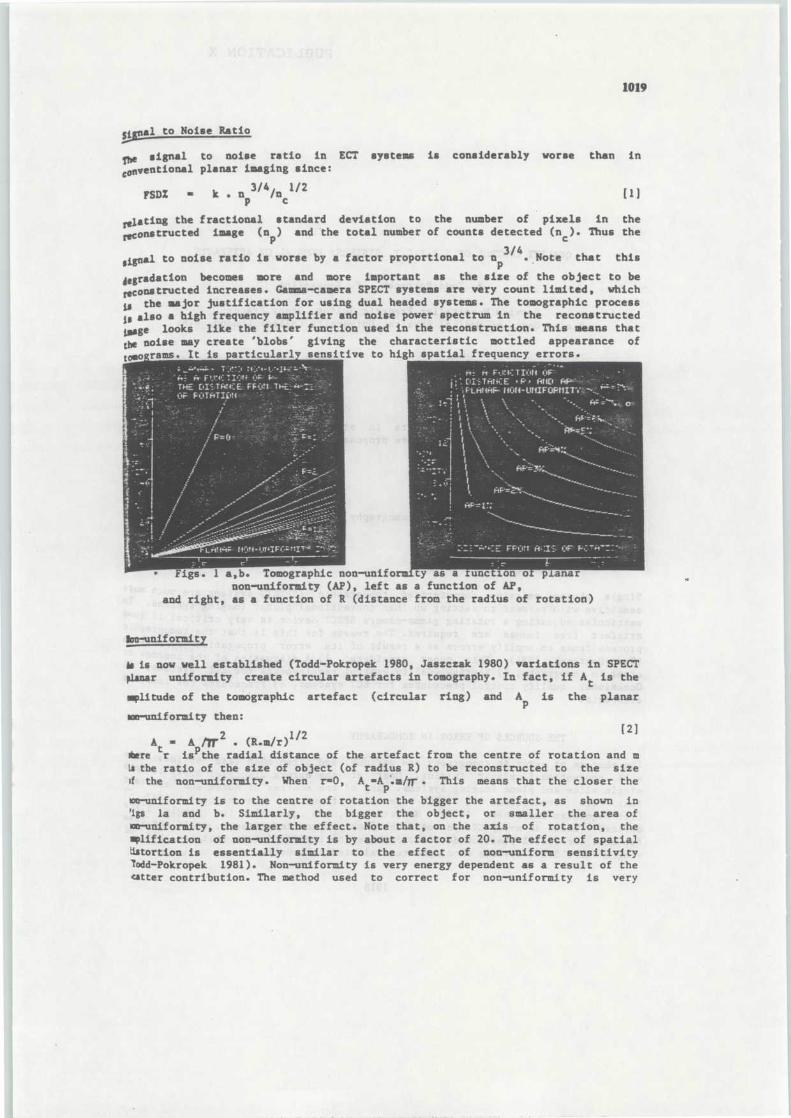
1019
sal to Noise Ratio
The signal to noise ratio in ECT systems is considerably worse than inconventional planar imaging since :
FS= = k . n 3/4/n 1/ 2p
c
dating the fractional standard deviation to the number of pixels in th e,constructed image (np) and the total number of counts detected (n c) . Thus the
to noise ratio is worse by a factor proportional to n 3/ 4 . Note that thi ssignal
Pjegradatio n becomes more and more important as the size of the object to b e
reconstruct ed increases . Gamma-camera SPECT systems are very count limited, whic his the major justification for using dual headed systems . The tomographic proces sis also a high frequency amplifier and noise power spectrum in the reconstructediyge looks like the filter function used in the reconstruction . This means that
the noise may create 'blobs ' giving the characteristic mottled appearance o ftmo :rams . It is •articularl sensitive to high spatial frequency errors .
. Figs . 1 a,b . Tomographic non-unifo ty asnon-uniformity (AP), left as a function of AP ,
and right, as a function of R (distance from the radius of rotation )
m-uniformity
iris now well established (Todd-Pokropek 1980, Jaszczak 1980) variations in SPEC Tplanar uniformity create circular artefacts in tomography . In fact, if A t is the
mplitude of the tomographic artefact (circular ring) and AP
is the planar
we-uniformity then :
At = A ,-2 . (R.m/r)1/2
Mere r ispthe radial distance of the artefact from the centre of rotation and mIs the ratio of the size of object (of radius R) to be reconstructed to the siz eif the non-uniformity . When r=0, At=Ap:m/n- . This means that the closer the
ce-uniformity is to the centre of rotation the bigger the artefact, as shown in
'igs la and b . Similarly, the bigger the object, or smaller the area o fo uniformity, the larger the effect . Note that, on the axis of rotation, theeplification of non-uniformity is by about a factor of 20 . The effect of spatia ltistortion is essentially similar to the effect of non-uniform sensitivit ylodd-Pokropek 1981) . Non-uniformity is very energy dependent as a result of th eu tter contribution . The method used to correct for non-uniformity is ver y
(1 )
a ionunc o
[2]
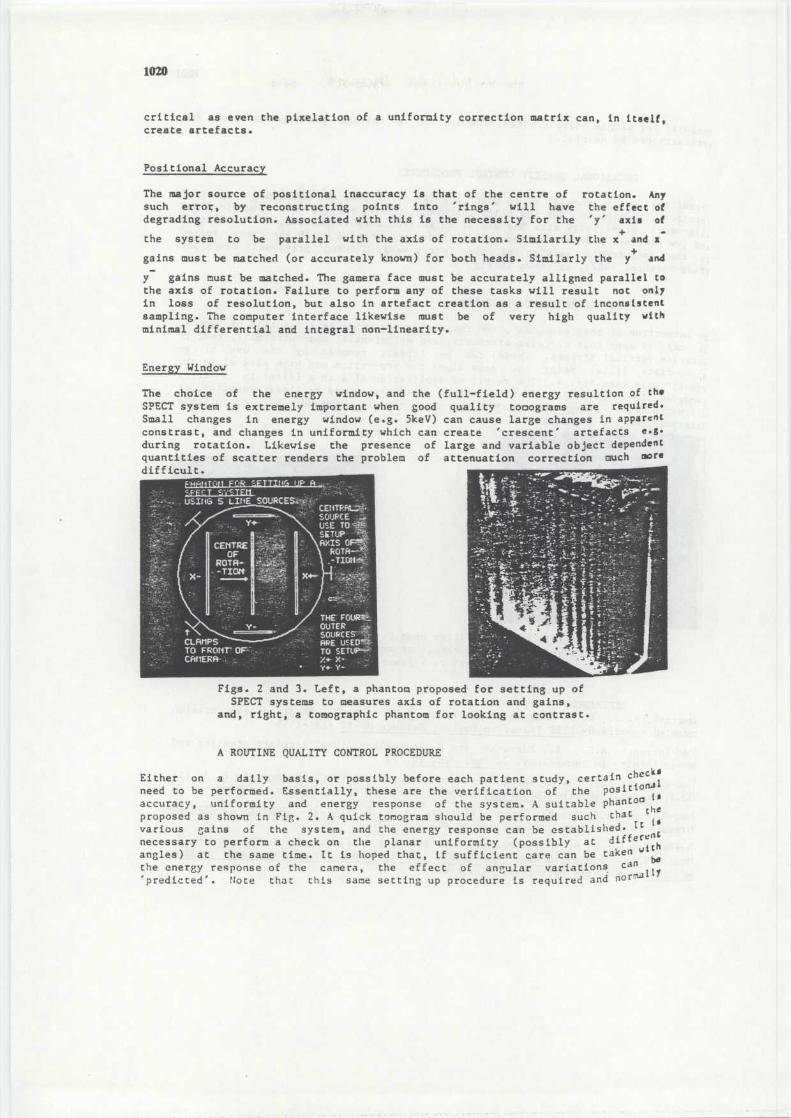
1020
critical as even the pixelation of a uniformity correction matrix can, in itself ,create artefacts .
Positional Accurac y
The major source of positional inaccuracy is that of the centre of rotation . Anysuch error, by reconstructing points into ' rings' will have the effect o fdegrading resolution . Associated with this is the necessity for the 'y' axis o f
the system to be parallel with the axis of rotation . Similarily the x and x
gains must be matched (or accurately known) for both heads . Similarly the y+ and
y gains must be matched . The gamera face must be accurately alligned parallel t othe axis of rotation . Failure to perform any of these tasks will result not onl yin loss of resolution, but also in artefact creation as a result of inconsisten tsampling . The computer interface likewise must be of very high quality wit h
minimal differential and integral non —linearity .
Energy Window
The choice of the energy window, and the (full —field) energy resultion of the
SPECT system is extremely important when good quality to pograms are required .
Small changes in energy window (e .g . 5keV) can cause large changes in appare n t
constrast, and changes in uniformity which can create ' crescent ' artefacts e .g .during rotation . Likewise the presence of large and variable object depende n t
quantities of scatter renders the problem of attenuation correction ouch mor tdifficult .
Figs . 2 and 3 . Left, a phantom proposed for setting up o fSPECT systems to measures axis of rotation and gains ,
and, right, a tomographic phantom for looking at contrast .
A ROUTINE QUALITY CONTROL PROCEDURE
Either on a daily basis, or possibly before each patient study, certain c heck '
need to be performed . Essentially, these are the verification of the posit io1 l
accuracy, uniformity and energy response of the system . A suitable phantom ~
proposed as shown in Fig . 2 . A quick tomogram should be performed such that c : 6various gains of the system, and the energy response can be established . lc ' t
necessary to perform a check on the planar uniformity (possibly at diffe r `
angles) at the same time . It is hoped that, if sufficient care can be taken wit h
the energy response of the camera, the effect of angular variations can 1 1
' predicted ' . Note that this same setting up procedure is required and normal
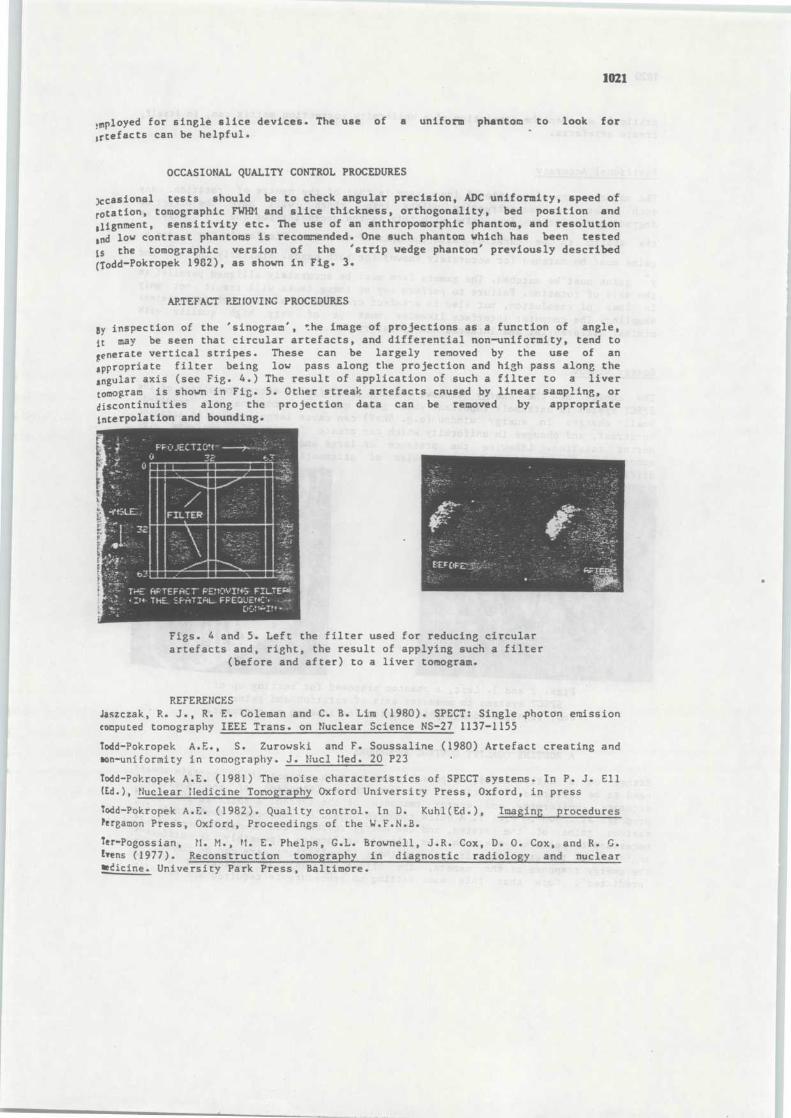
1021
,mployed for single slice devices . The use of a uniform phantom to look fo rartefac ts can be helpful .
OCCASIONAL QUALITY CONTROL PROCEDURE S
occasional tests should be to check angular precision, ADC uniformity, speed o frotation, tomographic FWHM and slice thickness, orthogonality, bed position an d,lignment, sensitivity etc . The use of an anthropomorphic phantom, and resolutio nend low contrast phantoms is recommended . One such phantom which has been teste d
is the tomographic version of the ' strip wedge phantom ' previously describe d(Todd-Pokropek 1982), as shown in Fig . 3 .
ARTEFACT REIMOVING PROCEDURE S
By inspection of the ' sinogram ' , the image of projections as a function of angle ,it may be seen that circular artefacts, and differential non-uniformity, tend t ogenerate vertical stripes . These can be largely removed by the use of a nappropriate filter being low pass along the projection and high pass along th e
angular axis (see Fig . 4 .) The result of application of such a filter to a live r
topogram is shown in Fig . 5 . Other streak artefacts caused by linear sampling, o rdiscontinuities along the projection data can be removed by appropriat einterpolation and bounding .
Figs . 4 and 5 . Left the filter used for reducing circula rartefacts and, right, the result of applying such a filte r
(before and after) to a liver tomogram .
REFERENCESJaszczak, R. J ., R. E . Coleman and C . B . Lim (1980) . SPECT: Single .photon emissio ncomputed tomography IEEE Trans . on Nuclear Science NS-27 1137-1155
Todd-Pokropek A .E., S . Zurowski and F . Soussaline (1980) Artefact creating an dion-uniformity in tomography . J . Nucl Lied . 20 P23
Todd-Pokropek A .E . (1981) The noise characteristics of SPECT systems . In P. J . El l(Ed .), Nuclear Medicine Tomography Oxford University Press, Oxford, in pres s
Todd-Pokropek A .E . (1982) . Quality control . In D . Kuhi(Ed .), Imaging procedure sPergamon Press, Oxford, Proceedings of the W .F .N .B .
Ter-Pogossian, M . M ., M . E . Phelps, G .L. Brownell, J .R . Cox, D . O . Cox, and R .bens (1977) . Reconstruction tomography in diagnostic radiology and nuclearledicine . University Park Press, Baltimore .

PUBLICATION
XI
Les Colloques de l'/NSER M
INFORMATION PROCESSING IN MEDICAL IMAGING
PUBLICATION XI1 NSERM, 1979, Vol. 88, pp. 215-242
POTENTIALS OF QUANTITATIVE METHODS IN POSITRO N
EMISSION TOMOGRAPH Y
F . SOUSSALINE, S . HOULE, D . PLUMMER, A . TODD-POKROPEK
Commissariat â 1'Energie Atomiqu e
Département de Biologie, Service Hospitalier Frédéric Joliot ,
Hôpital d'Orsay, F-91406 ORSAY, Franc e
ABSTRACT
Physical studies and mathematical simulations should giv ethe analytical knowledge needed to correct or minimize the mai nsources of error in the measurement of absolute regional activityby Positron Emission Tomography . The study was carried out usinga single slice hexagonal array positron tomograph (ORTEC) . The
'
general performance of this system is first measured and discus -sed . Then, three important aspects of quantitative reliabilit yare examined . These are : the calibration method for a giventomographic system, the contrast obtained for various target t obackground ratios, and the statistical uncertainties . For eachof these parameters the other sources of error are identified .Using this information for a given clinical study, such a sregional cerebral measurements, a protocol can be optimised an dconfidence limits placed on the values extracted .
I - INTRODUCTIO N
Emission computerized tomography offers the possibility
of retrieving an absolute regional activity distribution within
a transverse section . This ability opens up a new range of metabo -
lic and physiopathologic studies which would be impossible o r
too invasive by other means .
Ideally, the number of events in each picture element of
the reconstructed section should be linearly related to the acti-
vity concentration in the volume scanned . This linearity has bee n
215
achieved with certain systems, within a limited activity concen -
tration range and for simple objects both in single photon tomo -
graphy (SPC) / 1 / and positron emission computerized tomograph y
(PECT) / 2, 3 / .
In order to establish conficence limits for the quanti-
tative values obtained with this technique, it is necessary to
analyze the main sources of error, several of which are unique
to these measurements .
For a given tomographic system, three critical aspect s
might be considered : the detector gain, the contrast and the
statistical precision . These are not simply a function of th e
count rate and the counting statistics, but also of the objec t
itself .
The system performance and a discussion of the critica l
parameters will first be presented . Several aspects of the quan -
titative reliability of the system will then be examined and
quantified .
II - MATERIAL AND METHOD S
The physical phantoms used for the experiments and cha -
racterization measures are displayed in Figure 1 / 4, 5, 6 / .
1 - Line source phantom - a 19 cm internal diameter lucite
cylinder with a pattern of 5 cm deep by 2 mm internal diameter
holes drilled coaxially with the cylinder .
2 - Uniform phantom - a 19 cm internal diameter cylindrica l
container, 5 cm thick, uniformly filled with active solution .
3 - Cold spot phantom - a 19 cm internal diameter lucit e
cylindrical container, 5 cm thick, containing 7 lucite cylinder s
with diameters of 3 .5, 3, 2 .5, 2, 1, 0 .75 and 0 .5 cm, respecti -
vely . The body of the main cylinder is filled with a b8 Ge
solution .
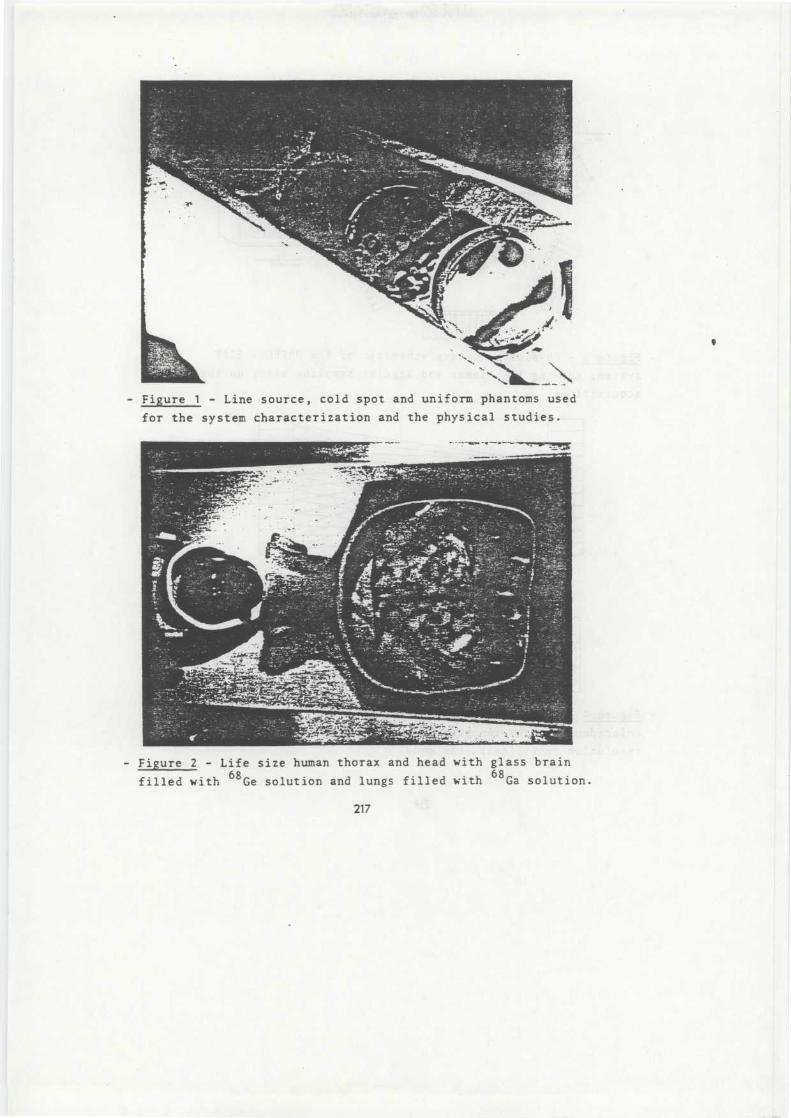
9
- Figure 1 - Line source, cold spot and uniform phantoms use d
for the system characterization and the physical studies .
- Figure 2 - Life size human thorax and head with glass brai n
filled with b8 Ge solution and lungs filled with 6$ Ga solution .
217
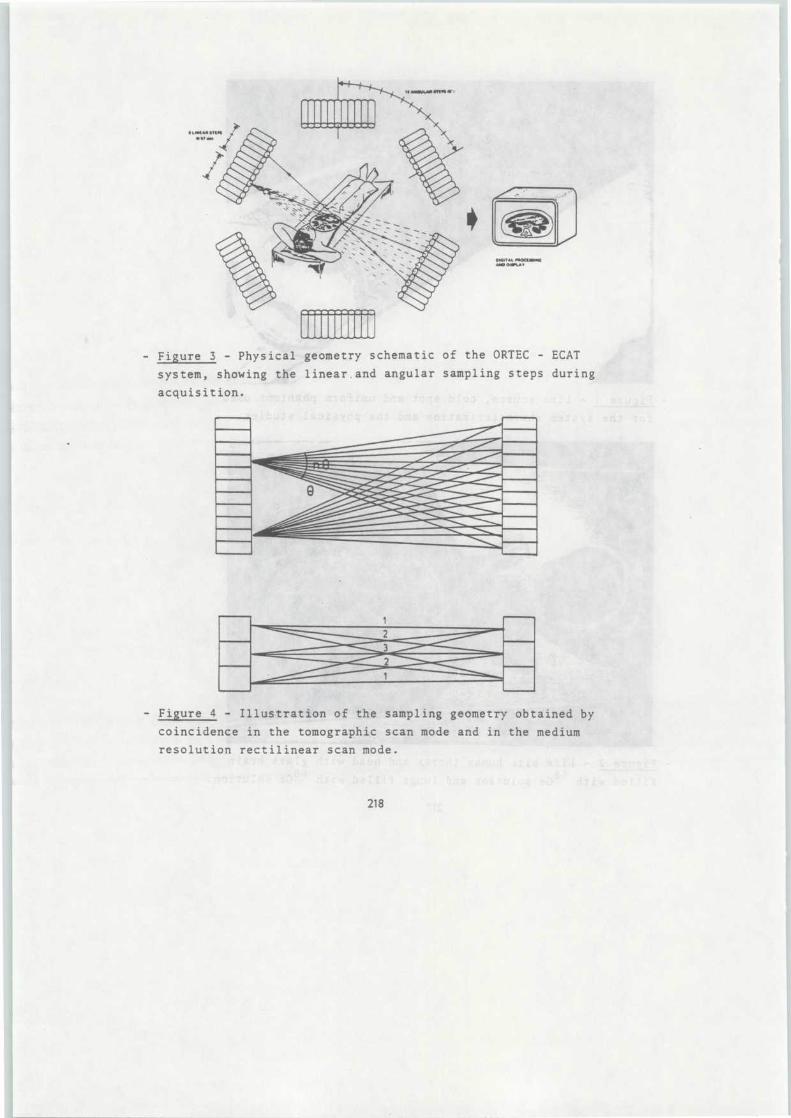
oait .L ~•oaiw cwoasu.
- Figure 3 - Physical geometry schematic of the ORTEC - ECAT
system, showing the linear .and angular sampling steps durin g
acquisition .
- Figure 4 - Illustration of the sampling geometry obtained b y
coincidence in the tomographic scan mode and in the medium
resolution rectilinear scan mode .
218
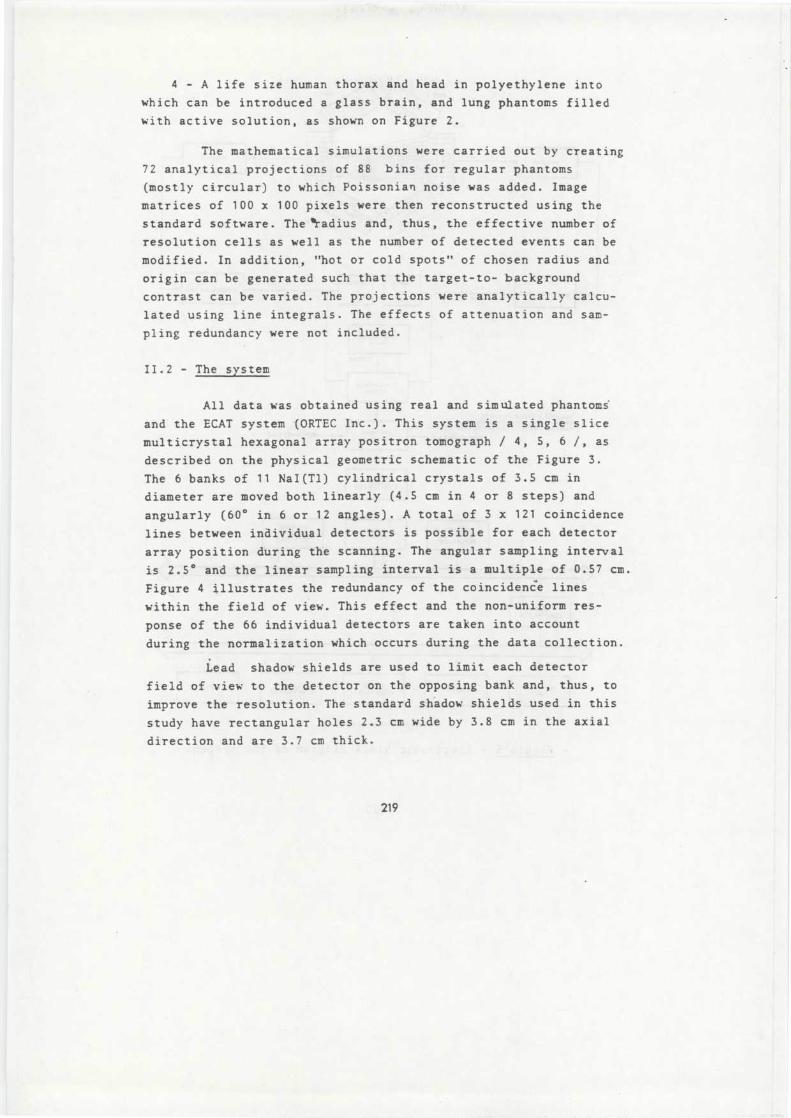
4 - A life size human thorax and head in polyethylene int o
which can be introduced a glass brain, and lung phantoms fille d
with active solution, as shown on Figure 2 .
The mathematical simulations were carried out by creatin g
72 analytical projections of 88 bins for regular phantom s
(mostly circular) to which Poissonian noise was added . Imag e
matrices of 100 x 100 pixels were then reconstructed using th e
standard software . The radius and, thus, the effective number o f
resolution cells as well as the number of detected events can b e
modified . In addition, "hot or cold spots" of chosen radius an d
origin can be generated such that the target-to- background
contrast can be varied . The projections were analytically calcu-
lated using line integrals . The effects of attenuation and sam-
pling redundancy were not included .
II .2 - The system
All data was obtained using real and simulated phantom s
and the ECAT system (ORTEC Inc .) . This system is a single slice
multicrystal hexagonal array positron tomograph / 4, 5, 6 /, as
described on the physical geometric schematic of the Figure 3 .
The 6 banks of 11 Nal (Tl) cylindrical crystals of 3 .5 cm in
diameter are moved both linearly (4 .5 cm in 4 or 8 steps) an d
angularly (60° in 6 or 12 angles) . A total of 3 x 121 coincidenc e
lines between individual detectors is possible for each detecto r
array position during the scanning . The angular sampling interva l
is 2 .5° and the linear sampling interval is a multiple of 0 .57 cm .Y
Figure 4 illustrates the redundancy of the coincidence line s
within the field of view . This effect and the non-uniform res-
ponse of the 66 individual detectors are taken into accoun t
during the normalization which occurs during the data collection .
Lead shadow shields are used to limit each detector
field of view to the detector on the opposing bank and, thus, t o
improve the resolution . The standard shadow shields used in thi s
study have rectangular holes 2 .3 cm wide by 3 .8 cm in the axial
direction and are 3 .7 cm thick .
219
PREAMP
DISCRIMINATOR11
AMPLI .
VLr
AMPLI .
V 11DISCRIMINATOR
1 1
1 COINCIDENCEGAT E
STROBE
COINCIDENC ELATCH
POSSIBLE SIGNALS TO ROUT EDATA ON BASIS OF PHYSIOLOGICA LPARAMETERS SUCH AS HEART CYCLE . ETC. -- -
FROM SIDES 2 i 5 FROM SIDES 3 3 6ENCODERMODUL E
CONTROLCONSOL E
INTERFACE
MEMOR YCONTROLLER
CAMA CMEMORY
STEPPIN GMOTOR
CONTROLS
BUS CAMAC
CRATECONTROLLER
POP 11145CPU
32K MEMORY TRIPL EFLOPPY DISK
LA 36LINE PRINTER
DISPLAY
BLOCK DIAGRAM OF ECAT SCANNE R
- Figure 5 - Electronic block diagram of the system .
220
Figure 5 shows the electronic block diagram of the sys-
tem . The hexagonal array of photomultipliers is linked to a DEC ,
PDP 11/45 computer through a CAMAC interface . The low energy
threshold of the discriminator is set at 100 Key , with the aim
of improving the overall sensitivity .
At the end of each counting interval the data from th e
coincident events detected within the resolution time of 22 nse c
is transferred from the CAMAC modules to the computer memory
and is stored on disk at the end of each slice acquisition, fo r
future processing and reconstruction .
A number of parameters can be considered as critical t o
the characterization of such a PECT system / 7 / . Of these ,
spatial resolution, sensitivity, random-to-true coincidence s
ratio and slice thickness are amongst the most important i n
practice .
11 .2 .1 - Spatial resolutio n
Using a 1 mm internal diameter needle filled with 65 Ge
(100 uCi) placed in the 19 cm lucite cylinder, the spatial reso-
lution can be measured by the FWHM of the response function o f
the system, as shown in Figure 6 (in air and in lucite) . It can
be noted that the tails do not decrease to zero rapidly as it i s
the case for conventional 2D projection detectors . On the con-
trary, their magnitude, being between 0 .3 and 0 .5 %, tends to
increase .at the edge of the field . These tails are mostly due t o
random and scattered photons in coincidence, and partly to th e
reconstruction method .
Table I, which summarizes the Fk1 values obtained unde r
optimal experimental conditions (i .e . optimized signal-to-nois e
ratio) for different radial distances with the standard shado w
shields, demonstrates the uniformity of the detector resolution .
These line source images were obtained using the high resolutio n
filter (# 1) filter . In fact, the spatial resolution in th e
resulting image is highly dependent on the filter used for th e
reconstruction . The ECAT system allows, in the standard mode ,
221
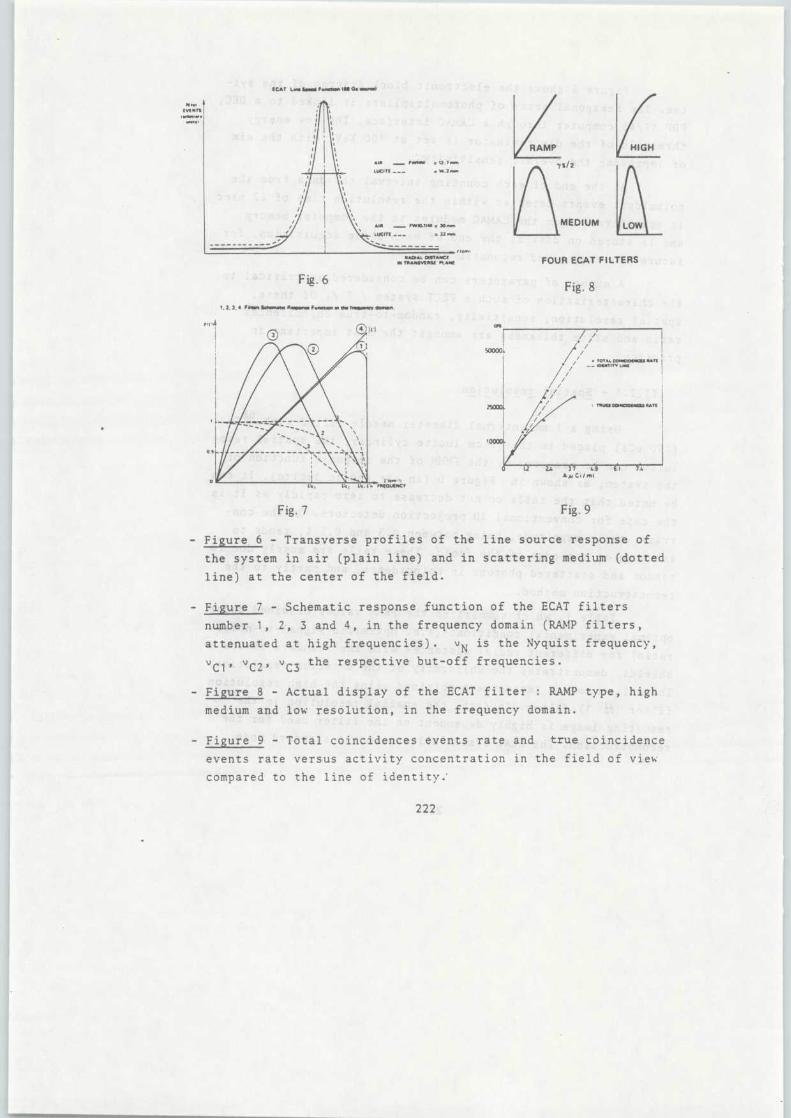
ECAT Ions Steed Fworaon IN G. wwsl
HIG H
LOW
1, 2, 3.4 Film Seinn me Raven. Fwieaon on dr hednnneT downs. .
RADIAI DISTANCEN TSANSVESSE PLANE FOUR ECAT FILTER S
Fig . 8Fig . 6
TIMES CON...LS RATE
ld
Lt
37
4.9
6 .1
7.4AMCilrni
• /
. TOTAL CDINgOENtti SATEw1ENTtTr llrlE
///
/
crt
S0000 I.
Fig . 7
Fig . 9
- Figure 6 - Transverse profiles of the line source response o f
the system in air (plain line) and in scattering medium (dotte d
line) at the center of the field .
- Figure 7 - Schematic response function of the ECAT filter s
number 1, 2, 3 and 4, in the frequency domain (RAMP filters ,
attenuated at high frequencies) . vN is the Nyquist frequency ,
v C1 , «C2' «C3 the respective but-off frequencies .
- Figure 8 - Actual display of the ECAT filter : RAMP type, high
medium and low resolution, in the frequency domain .
- Figure 9 - Total coincidences events rate and true coincidenc e
events rate versus activity concentration in the field of vie w
compared to the line of identity . '
222
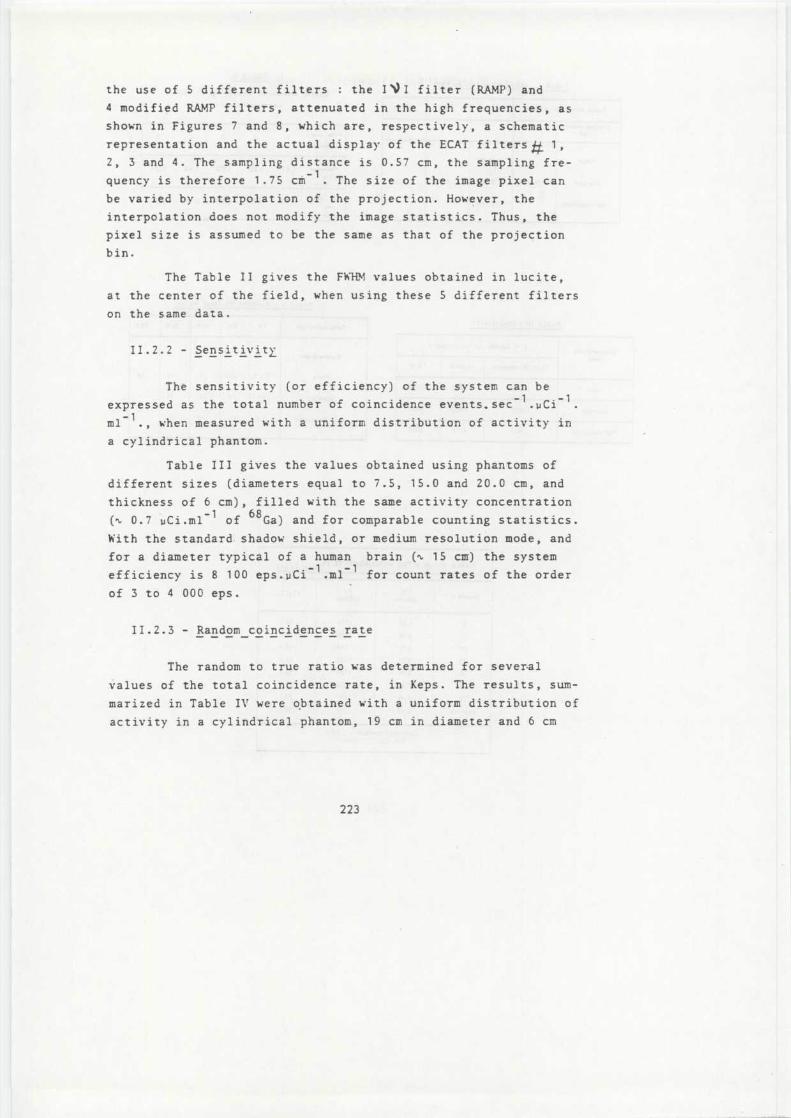
the use of 5 different filters : the 0 ) 1 filter (RAMP) and
4 modified RAMP filters, attenuated in the high frequencies, a s
shown in Figures 7 and 8, which are, respectively, a schemati c
representation and the actual display of the ECAT filters it 1 ,
2, 3 and 4 . The sampling distance is 0 .57 cm, the sampling fre-
quency is therefore 1 .75 cm . The size of the image pixel ca n
be varied by interpolation of the projection . However, the
interpolation does not modify the image statistics . Thus, the
pixel size is assumed to be the same as that of the projectio n
bin .
The Table II gives the FW 1 values obtained in lucite ,
at the center of the field, when using these S different filter s
on the same data .
11 .2 .2 - Sensitivity
The sensitivity (or efficiency) of the system can b e
expressed as the total number of coincidence events .se c -1 .pCi -1 .
m1 -1 ., when measured with a uniform distribution of activity i n
a cylindrical phantom .
Table III gives the values obtained using phantoms o f
different sizes (diameters equal to 7 .5, 15 .0 and 20 .0 cm, and
thickness of 6 cm), filled with the same activity concentratio n
(, 0 .7 iCi .ml -1 of 68 Ga) and for comparable counting statistics .
With the standard shadow shield, or medium resolution mode, an d
for a diameter typical of a human brain (' 15 cm) the syste m
efficiency is 8 100 eps .pCi -l .ml -1 for count rates of the orde r
of 3 to 4 000 eps .
II .2 .3 - Random coincidences rate
The random to true ratio was determined for severa l
values of the total coincidence rate, in Keps . The results, sum-
marized in Table IV were obtained with a uniform distribution o f
activity in a cylindrical phantom, 19 cm in diameter and 6 c m
223
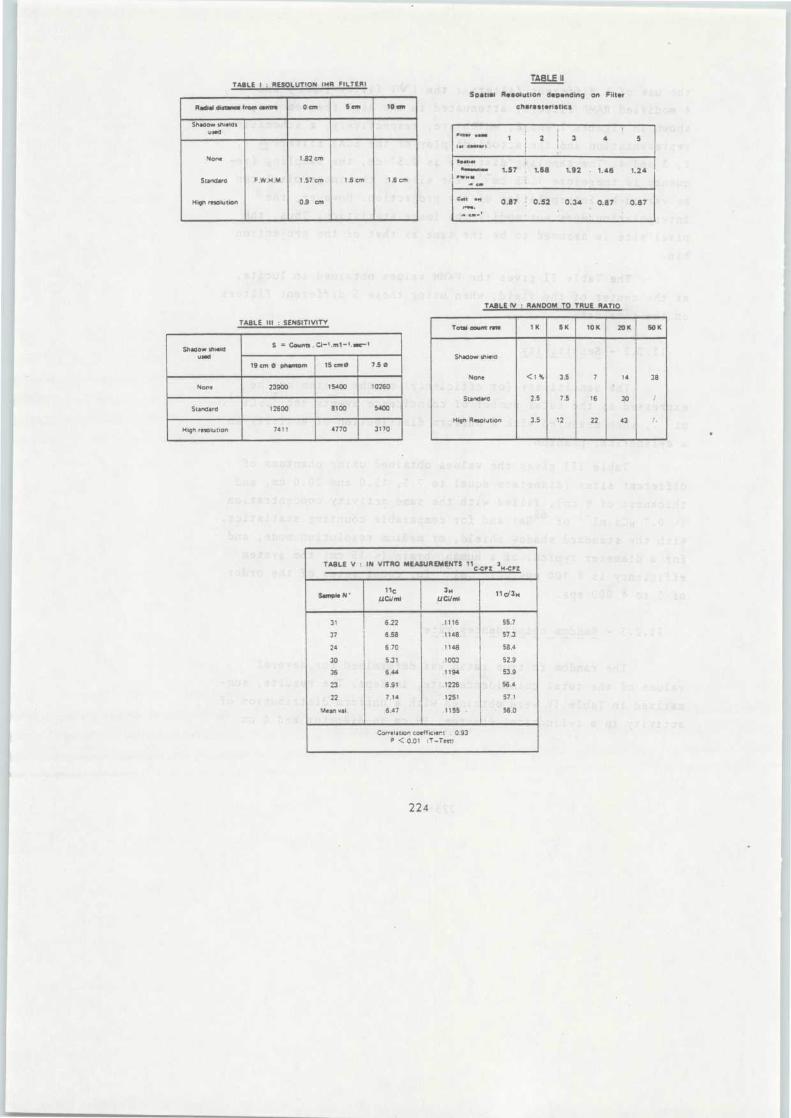
TABLE II
Spatial Resolution depending on Filter
characteristic s
Shadow shieldused
S = Counts . Ci-1 .ml-' .see- 1
19 cm 0 phantom 15 cm 0
75 0
None 23900 15400 10260
Standard 12600 8100 5400
High resolution 7411 4770 3170
Radial distance from centre 0 an 5 ern 10 a n
Shadow shseids
used
None 1 .82 c m
Standard F .W .H .M . 1 .57 cm 1 .6 cm 1 .6 cm
High resolution 0.9 cm
Total count rate 1K 5K 10K 20K 50 K
Shadow shieio
None < 1 % 3 .5 7 14 38
Standard 2 .5 7 .5 16
I
30 r
High Resolution 3 .5 12 22 43 ' .
TABLE V .. IN VITRO MEASUREMENTS 11
3C .CPZ
H•CP Z
Sample N `11C
uCilml3 N
UCilml11
3H
31 6.22 .1116 55 .7
37 6 .58 .1148 57 .3
24 6 .70 .1148 58 .4
30 5 .31 .1003 52 .9
36 6 .44 .1194 53 .9
23 6 .91 .1226 56 .4
22 7 .14 .1251 57 . 1
Mean val . 6 .47 .1155
• 56 .0
I j
Correlation coefficier.t
. 0 .93P < 0 .01
,T-Test {
thick, by delaying the signals from one of the detector banks i n
a pair and counting the resulting coincidences .
In Figure 9, the total coincidence events rate versu s
activity concentration in the field of view, for the 19 cm inter -
nal diameter phantom, is plotted together with the line of iden-
tity, and the true coincidences rate versus activity, obtaine d
after subtraction of the random events from the total counts . I t
is demonstrated that the system is fairly linear, in total numbe r
of events, up to count rates of the order of 50 Keps . However, i t
appears that the useful count rate is limited by the randoms ,
which increase quadratically at high count rates .
In practice, if an arbitrary value of 10 % is chosen a s
an upper limit for the random to true ratio, under the give n
geometrical conditions, the maximum useful total coincidence rat e
is of the order of 10 Keps, i .e . an activity concentration in th e
field of view of 1 .5 to 2 uCi .ml
.
II .2 .4 - Slice thicknes s
The resolution in the axial dimension was measured b y
planing a line source parallel to the transverse plane and
performing a series of tomographic scans at intervals closel y
spaced through the slice . The slice thickness can be specifie d
as the FWHM of the resulting axial response function . Figure 1 0
shows two profiles obtained in air, on the axis and at 170 m m
from the center . It can be seen that the response is not rectan-
gular in shape and that the "tails" of the successive adjacen t
slices due to an a priori unknown activity distribution wil l
have considerable effect on the quantitative measurements in a
given slice / 7 / .
II .3 - Methods and data analysi s
All data used in this study was collected in the sam e
scanning mode as that used in clinical studies : standard shadot•
225
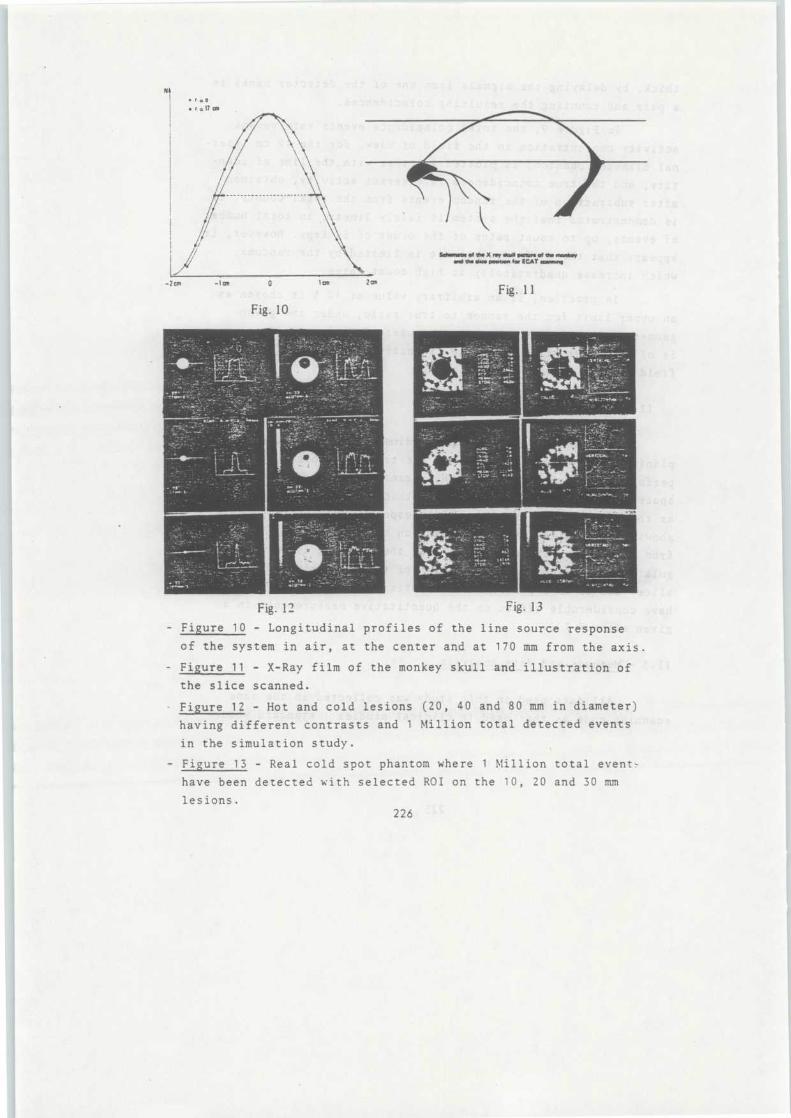
SohUnobc of the X m y fkuU morn of tho nook 'o d the shoe porion for ECAT 'croons
. r= o•
17 cm
-2 an
-Ian
0 1an Zan
Fig . 1 1
Fig . 1 0
Fig. 12 Fig . 1 3
- Figure 10 - Longitudinal profiles of the line source respons e
of the system in air, at the center and at 170 mm from the axis .
- Figure 11 - X-Ray film of the monkey skull and illustration o f
the slice scanned .
- Figure 12 - Hot and cold lesions (20, 40 and 80 mm in diameter )
having different contrasts and 1 Million total detected event s
in the simulation study .
- Figure 13 - Real cold spot phantom where 1 Million total even t
have been detected with selected ROI on the 10, 20 and 30 mm
lesions .226
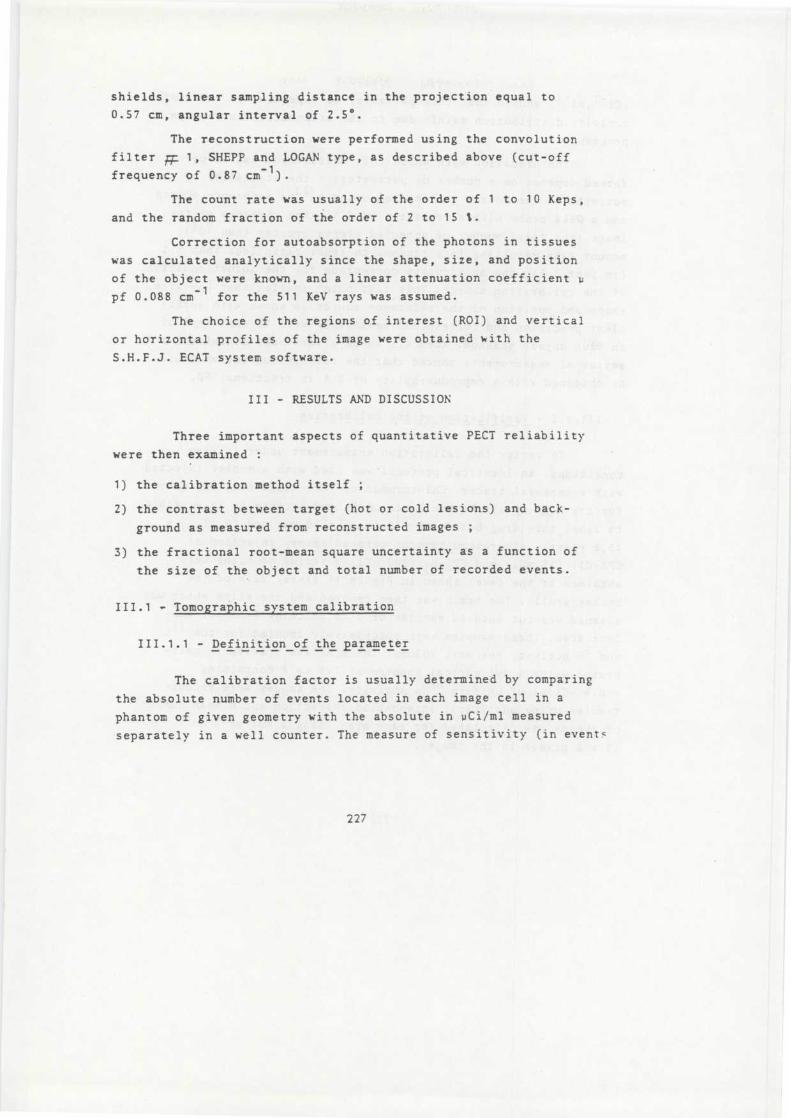
shields, linear sampling distance in the projection equal t o
0 .57 cm, angular interval of 2 .5° .
The reconstruction were performed using the convolutio n
filter ; 1, SHEPP and LOGAN type, as described above (cut-of f
frequency of 0 .87 cm-l ) .
The count rate was usually of the order of 1 to 10 Keps ,
and the random fraction of the order of 2 to 15 % .
Correction for autoabsorption of the photons in tissue s
was calculated analytically since the shape, size, and position
of the object were known, and a linear attenuation coefficient u
pf 0 .088 cm-1 for the 511 KeV rays was assumed .
The choice of the regions of interest (ROI) and vertica l
or horizontal profiles of the image were obtained with th e
S .H .F .J . ECAT system software .
III - RESULTS AND DISCUSSION
Three important aspects of quantitative PECT reliability
were then examined :
1) the calibration method itself ;
2) the contrast between target (hot or cold lesions) and back -
ground as measured from reconstructed images ;
3) the fractional root-mean square uncertainty as a function of
the size of the object and total number of recorded events .
III .1 -- Tomographic system calibratio n
I1I .1 .1 - Definition _of the paramete r
The calibration factor is usually determined by comparin g
the absolute number of events located in each image cell in a
phantom of given geometry with the absolute in uCi/ml measured
separately in a well counter . The measure of sensitivity (in event s
227
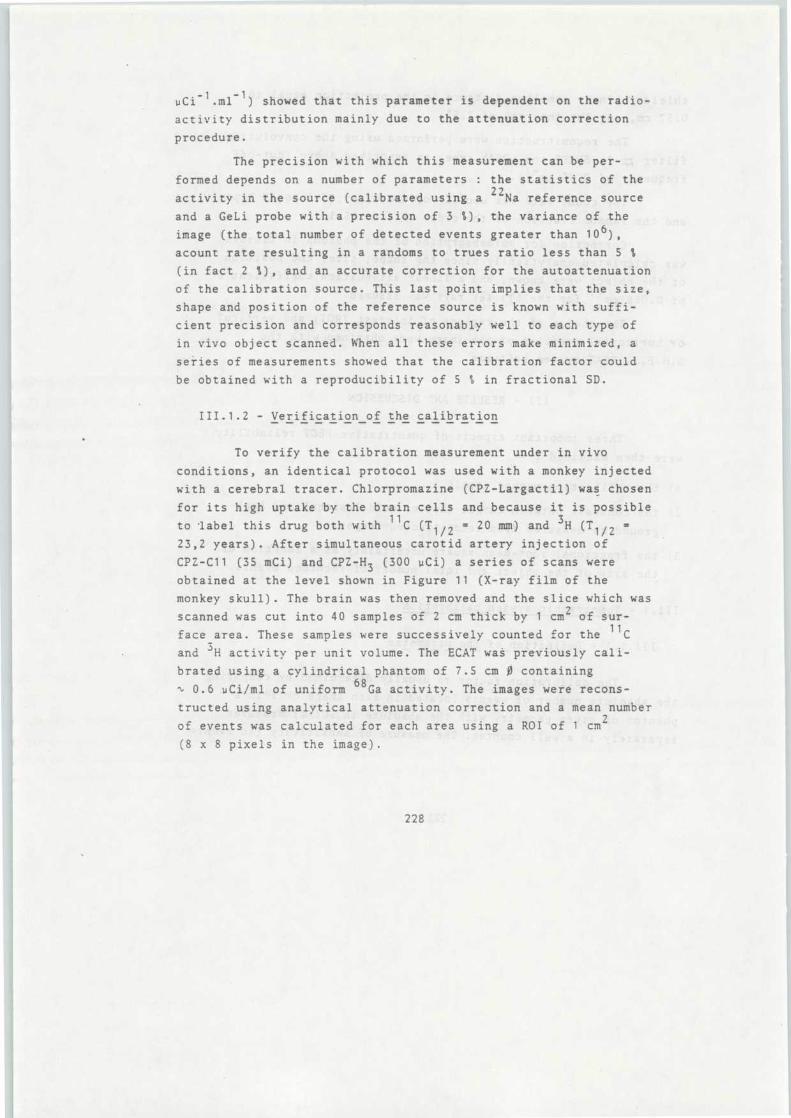
uC i -1 .m1-1 ) showed that this parameter is dependent on the radio -
activity distribution mainly due to the attenuation correctio n
procedure .
The precision with which this measurement can be per -
formed depends on a number of parameters : the statistics of th e
activity in the source (calibrated using a 22Na reference sourc e
and a GeLi probe with a precision of 3 °%), the variance of th e
image (the total number of detected events greater than 10 6) ,
acount rate resulting in a randoms to trues ratio less than 5 %
(in fact 2 %), and an accurate correction for the autoattenuatio n
of the calibration source . This last point implies that the size ,
shape and position of the reference source is known with suffi-
cient precision and corresponds reasonably well to each type o f
in vivo object scanned . When all these errors make minimized, a
series of measurements showed that the calibration factor coul d
be obtained with a reproducibility of 5 % in fractional SD .
III .1 .2 - Verification of the calibration--------------- -
To verify the calibration measurement under in viv o
conditions, an identical protocol was used with a monkey injecte d
with a cerebral tracer . Chlorpromazine (CPZ-Largactil) was chose n
for its high uptake by the brain cells and because it is possibl e
to label this drug both with 11C (T1/2 = 20 mm) and 3H (T1/2 =
23,2 years) . After simultaneous carotid artery injection o f
CPZ-C11 (35 mCi) and CPZ-H 3 (300 uCi) a series of scans wer e
obtained at the level shown in Figure 11 (X-ray film of th e
monkey skull) . The brain was then removed and the slice which wa s
scanned was cut into 40 samples of 2 cm thick by 1 cm 2 of sur -
face area . These samples were successively counted for the 11 C
and 3 H activity per unit volume . The ECAT was previously cali-
brated using a cylindrical phantom of 7 .5 cm 0 containin g
ti 0 .6 uCi/ml of uniform 68 Ga activity . The images were recons-
tructed using analytical attenuation correction and a mean numbe r
of events was calculated for each area using a ROI of 1 cm 2
(8 x 8 pixels in the image) .
228
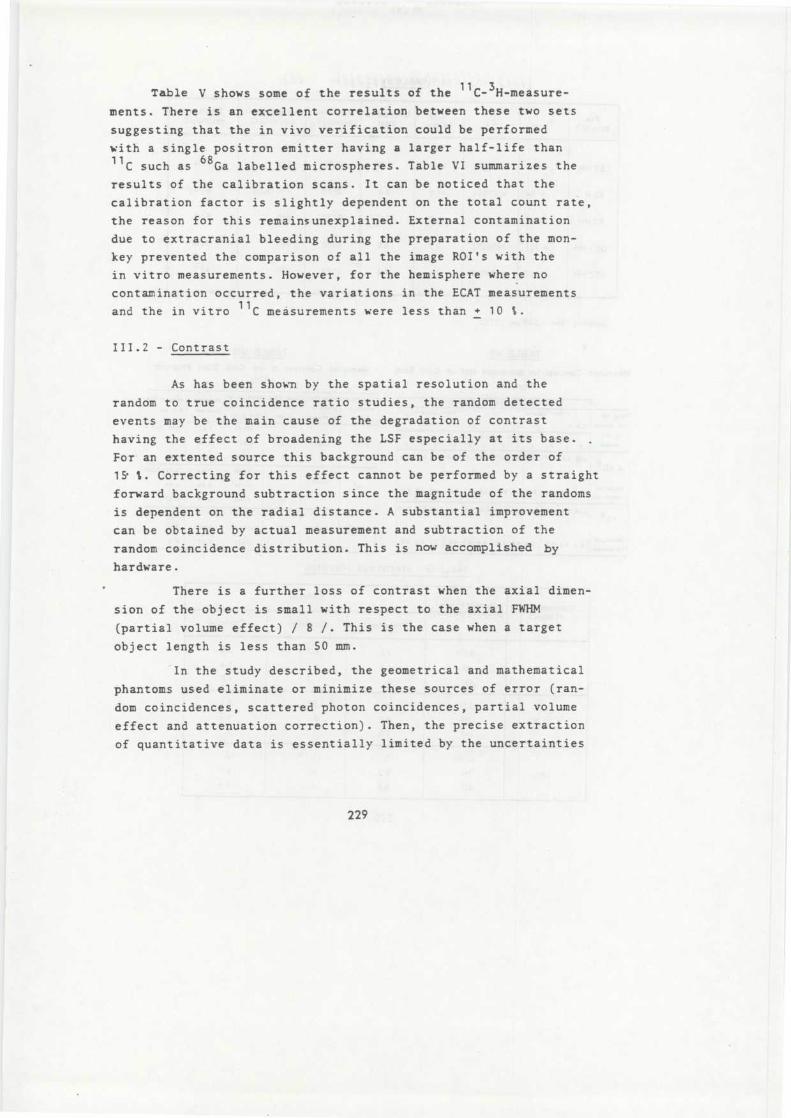
Table V shows some of the results of the 11 C- 3 H-measure-
ments . There is an excellent correlation between these two set s
suggesting that the in vivo verification could be performe d
with a single positron emitter having a larger half-life tha n
11C such as 68 Ga labelled microspheres . Table VI summarizes the
results of the calibration scans . It can be noticed that th e
calibration factor is slightly dependent on the total count rate ,
the reason for this remainsunexplained . External contaminatio n
due to extracranial bleeding during the preparation of the mon -
key prevented the comparison of all the image R0I's with th e
in vitro measurements . However, for the hemisphere where n o
contamination occurred, the variations in the ECAT measurement s
and the in vitro11C measurements were less than + 10 L .
111 .2 - Contras t
As has been shown by the spatial resolution and th e
random to true coincidence ratio studies, the random detecte d
events may be the main cause of the degradation of contras t
having the effect of broadening the LSF especially at its base .
For an extented source this background can be of the order o f
15• % . Correcting for this effect cannot be performed by a straight
forward background subtraction since the magnitude of the random s
is dependent on the radial distance . A substantial improvemen t
can be obtained by actual measurement and subtraction of th e
random coincidence distribution . This is now accomplished b y
hardware .
There is a further loss of contrast when the axial dimen -
sion of the object is small with respect to the axial FWHM
(partial volume effect) / 8 / . This is the case when a targe t
object length is less than 50 mm .
In the study described, the geometrical and mathematica l
phantoms used eliminate or minimize these sources of error (ran -
dom coincidences, scattered photon coincidences, partial volum e
effect and attenuation correction) . Then, the precise extractio n
of quantitative data is essentially limited by the uncertaintie s
229
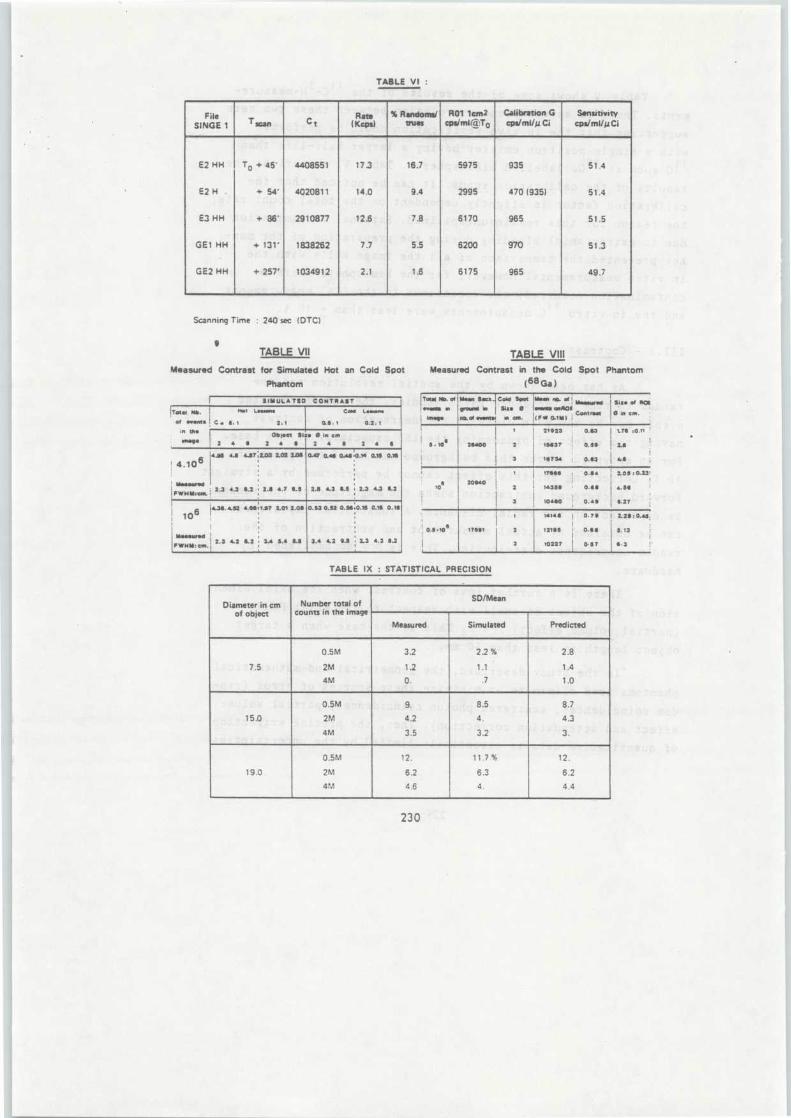
TABLE VI :
File Rate % Randoms/ R01 1cm2 Calibration G Sensitivity
SINGE 1 Tomn Ct (Kcps) trues cps/mi(aT 0 cps/ml/
Ci cps/mi/MCi
E2 HH T0 + 45' 4408551 17 .3 16 .7 5975 935 51 .4
E2 H + 54' 4020811 14 .0 9 .4 2995 470 (935) 51 . 4
E3 HH + 86' 2910877 12 .6 7 .8 6170 965 51 . 5
GE1 HH + 131' 1838262 7 .7 5 .5 6200 970 51 .3
GE2 HH + 257' 1034912 2 .1 1 .6 6175 965 49 . 7
Scanning Scanning Time : 240 sec (OTC )
TABLE VI IMeasured Contrast for Simulated Hot an Cold Spo t
Phantom
TABLE VII IMeasured Contrast in the Cold Spot Phanto m
(68 Ga )
SIMULA TED
[Total Nb .
Met Lesionsof events C • 6 1
in the Object S i
'nage
2 4 4
2 4 s
2 . 1
4 .10 6 1k i.4.e
j
' MMwndt
FwkM:a,~ + 2 .3 4.3
1064.34 .4.52
M2.3 4.2
CONTRAS T
2.8 4.3 8.5 : 2.3 4.3 8 .2
0.53 0.52 0.56 :0.15 0.16 0 .1 8
3 .44.29.8 i 2.34 .36s
. ./w7 nr. v .
events nlinage
ww~1 Vw.w .'vvw, ''.''
Measured sIZ. Or
grand in
Size e
events .AOI c.a..
nb. o events
ie ctn .
(F W 0.111 )
cm .
21923
0.83 tie :0 .
e . t04
28400
2 15437
O.59 L S
3 14734
0 .43
A e
1 17444
0 .54
205 :0 .23 '
102ot4o
2
14359
0.48
4.54s
! 3
10440
0 .49
4 .27
j
1 14148
0 .79
2.29 :0 .43 ,
0.5 . 10 e 17691 2 12195
0.44 3 .1 3
3 10227 0.37 4 .3
4.87 ;2.3 2.02 2.05
5.2 2.8 4.7 5 . 5
4.641197 2.01 2.08
8.2 : 3 .4 5.4 8.8
Cold lesson.
as :1
0.2, 1
z. einc .
2 4 8 2 4 4
OAT 0.40 OA4 : 0 .14 0.15 0:
TABLE IX : STATISTICAL PRECISIO N
Diameter in cm Number total ofSD/Mea n
of object counts in the image
Measured Simulated Predicte d
0 .5M 3 .2 2 .2 % 2 . 8
7 .5 2M 1 .2 1 .1 1 . 4
4M 0 . .7 1 . 0
0 .5M 9 . 8 .5 8 .7
15 .0 2M 4 .2 4 . 4 .3
4M 3 .5 3 .2 3 .
0.5M 12 . 11 .7 % 12 .
19 .0 2M 6 .2 6 .3 6 .2
4M 4 .6 4 . 4 .4
230
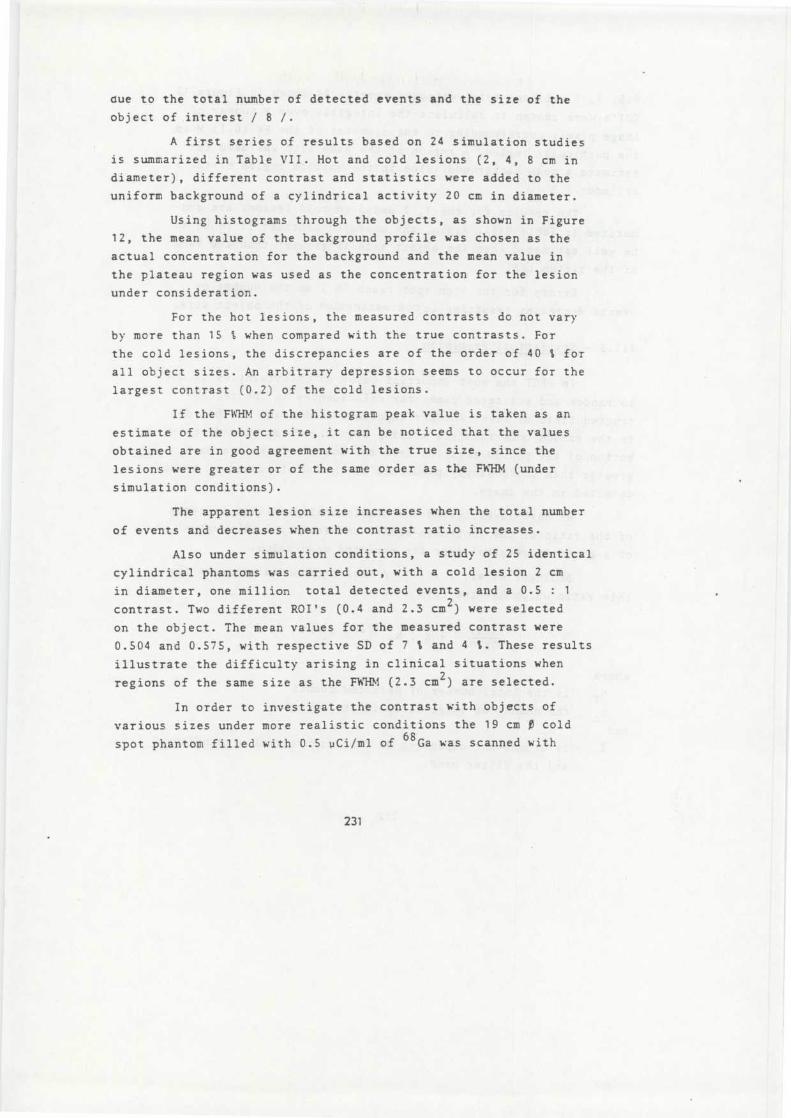
due to the total number of detected events and the size of the
object of interest / 8 / .
A first series of results based on 24 simulation studie s
is summarized in Table VII . Hot and cold lesions (2, 4, 8 cm in
diameter), different contrast and statistics were added to the
uniform background of a cylindrical activity 20 cm in diameter .
Using histograms through the objects, as shown in Figur e
12, the mean value of the background profile was chosen as th e
actual concentration for the background and the mean value i n
the plateau region was used as the concentration for the lesio n
under consideration .
For the hot lesions, the measured contrasts do not var y
by more than 15 % when compared with the true contrasts . Fo r
the cold lesions, the discrepancies are of the order of 40 % fo r
all object sizes . An arbitrary depression seems to occur for th e
largest contrast (0 .2) of the cold lesions .
If the FWHM of the histogram peak value is taken as a n
estimate of the object size, it can be noticed that the value s
obtained are in good agreement with the true size, since th e
lesions were greater or of the same order as the FkHM (unde r
simulation conditions) .
The apparent lesion size increases when the total numbe r
of events and decreases when the contrast ratio increases .
Also under simulation conditions, a study of 25 identica l
cylindrical phantoms was carried out, with a cold lesion 2 c m
in diameter, one million total detected events, and a 0 .5 : 1
contrast . Two different R0I's (0 .4 and 2 .3 cm2 ) were selecte d
on the object . The mean values for the measured contrast wer e
0 .504 and 0 .575, with respective SD of 7 % and 4 % . These result s
illustrate the difficulty arising in clinical situations whe n
regions of the same size as the FW HM (2 .3 cm 2 ) are selected .
In order to investigate the contrast with objects o f
various sizes under more realistic conditions the 19 cm 0 cold
spot phantom filled with 0 .5 uCi/ml of 68 Ga was scanned with
231
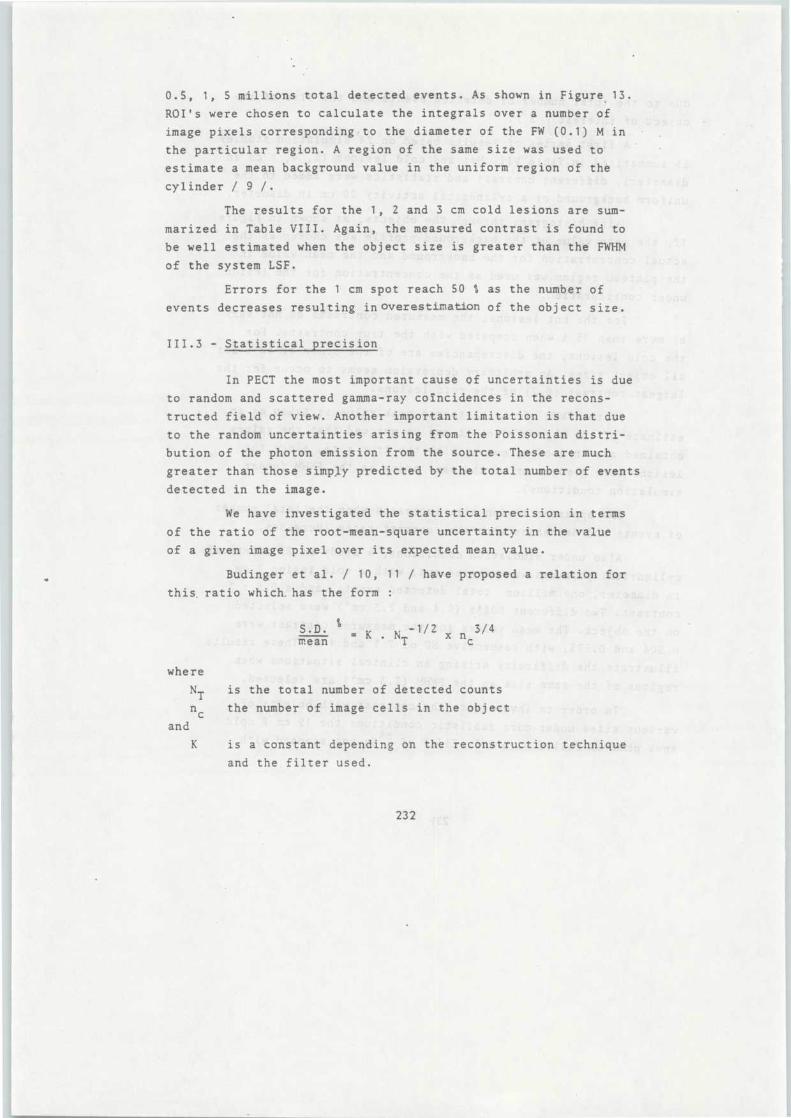
0 .5, 1, 5 millions total detected events . As shown in Figure 13 .
R0I's were chosen to calculate the integrals over a number o f
image pixels corresponding to the diameter of the FW (0 .1) M in
the particular region . A region of the same size was used t o
estimate a mean background value in the uniform region of th e
cylinder / 9 / .
The results for the 1, 2 and 3 cm cold lesions are sum-
marized in Table VIII . Again, the measured contrast is found t o
be well estimated when the object size is greater than the FWH M
of the system LSF .
Errors for the 1 cm spot reach 50 % as the number o f
events decreases resulting in overestimation of the object size .
111 .3 - Statistical precisio n
In PECT the most important cause of uncertainties is due
to random and scattered gamma-ray coincidences in the recons-
tructed field of view . Another important limitation is that du e
to the random uncertainties arising from the Poissonian distri-
bution of the photon emission from the source . These are much
greater than those simply predicted by the total number of event s
detected in the image .
We have investigated the statistical precision in term s
of the ratio of the root-mean-square uncertainty in the valu e
of a given image pixel over its expected mean value .
Budinger et al . / 10, 11 / have proposed a relation fo r
this, ratio which, has the form :
40S .D .
3/ 4
= K . NT-1/2
nmean
T-1/2
c
is the total number of detected count s
the number of image cells in the objec t
is a constant depending on the reconstruction techniqu e
and the filter used .
wher e
NT
n e
and
K
232
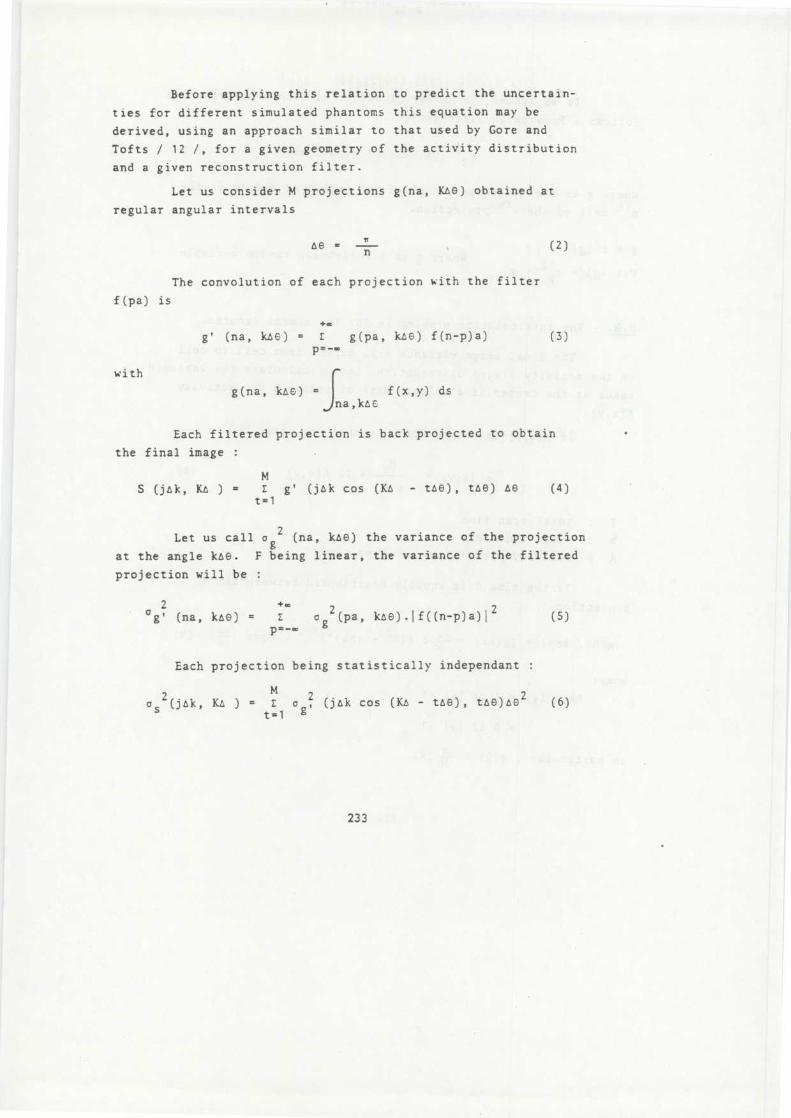
Before applying this relation to predict the uncertain -
ties for different simulated phantoms this equation may b e
derived, using an approach similar to that used by Gore an d
Tofts / 12 /, for a given geometry of the activity distributio n
and a given reconstruction filter .
Let us consider M projections g(na, Kee) obtained at
regular angular intervals
te =
(2 )n
The convolution of each projection with the filte r
+.
g' (na, kee) = z
g(pa, kee) f(n-p)a )
p= -m
g (na, kte) =
f(x,y) dsna,kt E
Each filtered projection is back projected to obtai n
the final image :
MS (jtk, Ke ) =
Z g' (jtk cos (Ke - toe), toe) te
(4 )t = 1
Let us call a 2 (na, kee) the variance of the projectiong
at the angle kte . F being linear, the variance of the filtere d
projection will be :
°g' (na, kee) =
z
o 2 (pa, kee) . I f ((n-p) a) 1 2g
Each projection being statistically independant :
Ma
s2 ()ek, Ke ) = z Q
2(jtk cos (Ke - toe), tee)00 2
(6 )t = 1 g
f (pa) is
with
(3 )
2
+(5 )
P=— ° o
233
If we assume the number of events in each projection bi n
follows a Poissonian distribution :
2Q
(na, ka0) = g (na , kWg
where g is the "expected value" of the number of events in th e
nth cell of the kth projection .
( 7 )
g = E (a )
Var (a) = a 2 = ggwhere R is a Poissonian random variable .
N .B . - The interpolation problem is for the moment ignored .
The final image variance will depend from cell to cel l
on the activity A(x,y) distribution . Let us calculate the varianc e
value at the center of a uniform disk of radius R and activit y
A(x,y) .
If p(x,y) is the number of events per image cell :
NTp (x,y) =
---~ = Tb A ( x ,y)
( 8 )n R
T : total scan tim e
b : slice thicknes s
A : activity per unit of vol . and time .
If the time T is equally distributed between all M
projection :
g (na, keo) = (g (na) = ara'M
Ra 2 (( R2 - (na) 2 ) 112 . Rect ( na)
( 9 )
where
Rect (x) = 1 if N I < 1
= 0 if Axl > 1
in particular , g (0) = pM 2R .
234
If n e is the number of elementary cells of size axa
in the object :
w R2 = n c . a
At the center of each projection, n = O .
2
a 2B
, ( 0 ) E
Q 2 ( p a ) • I f ( p a) 1 2p= _m g
g (o) E
(fpa) )+m
= E
g(pa) 1 f(pa) 1
p
p=_ m
2
(12 )and
MQ2 (0,0) = E
Q2 ( 0 , tee) 6E3 2 = ee l M .c 2 , ( 0 , 0 )S
t=1
g ' g
7r 2
2
M a
(0 )
g
that is
(13 )
I f(pa) 1 2 (14 )2
1 2o s (0) = M g(0) . Z
p= . œ
which is the variance at the image center .
From (4), we can write :
MS(0) = S(0,0) = Z
gt= 1
(o, tee) ee
and
S(0) = te .M .g' (0,0) = M .ee .g' (0)
(15 )
+ m
g' (0,0) = E
g (pa , 0) f (pa )p=
235
(16)
•
Case of the filter , 1 of the ECAT system (Shepp an d
Logan) . (High resolution) .
and
E
If(pa)1 2 = ~2
p= -~
a
tion of eq . (16) .
And the variance at the image center :
It is possible to obtain a variance distribution image b y
reconstructing an image using a filter where the coefficients hav e
been replaced by their square . Also, the a s (R, 0) to S (R, o )
ratio can be visualized by dividing the a s image by the S image .
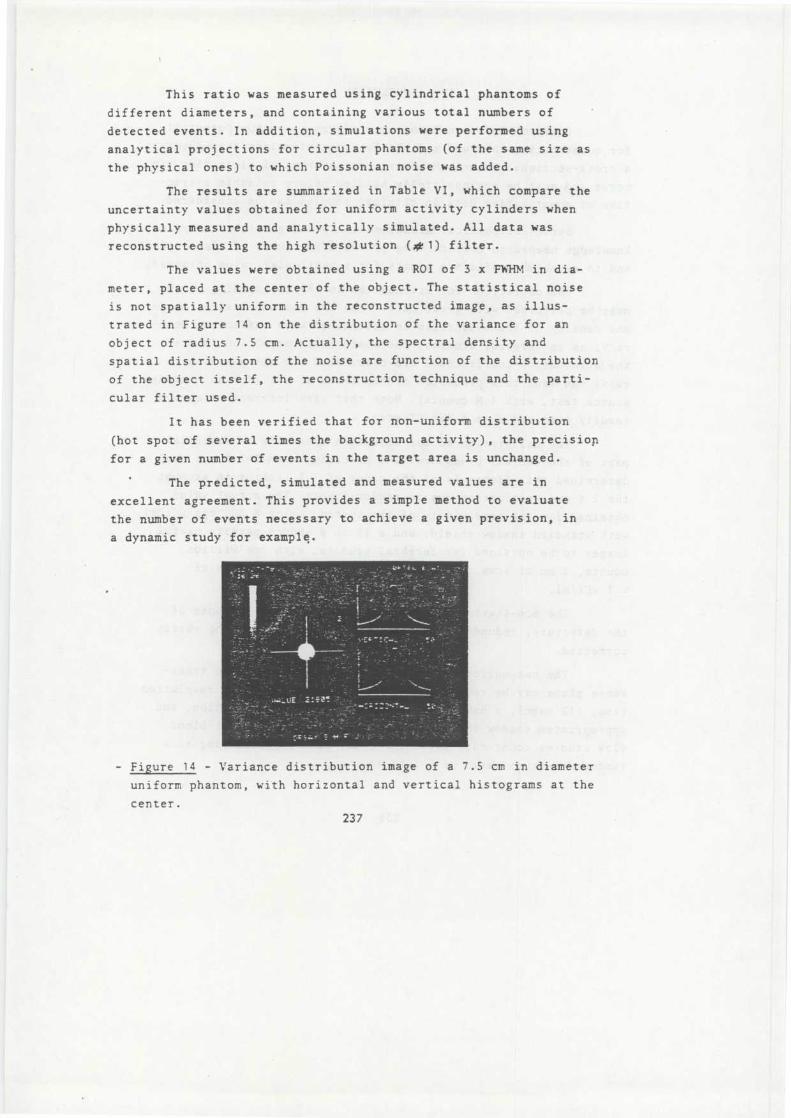
This ratio was measured using cylindrical phantoms o f
different diameters, and containing various total numbers of
detected events . In addition, simulations were performed usin g
analytical projections for circular phantoms (of the same size a s
the physical ones) to which Poissonian noise was added .
The results are summarized in Table VI, which compare th e
uncertainty values obtained for uniform activity cylinders whe n
physically measured and analytically simulated . All data wa s
reconstructed using the high resolution (4el) filter .
The values were obtained using a ROI of 3 x FW HM in dia -
meter, placed at the center of the object . The statistical nois e
is not spatially uniform in the reconstructed image, as illus-
trated in Figure 14 on the distribution of the variance for a n
object of radius 7 .5 cm . Actually, the spectral density an d
spatial distribution of the noise are function of the distribution
of the object itself, the reconstruction technique and the parti-
cular filter used .
It has been verified that for non-uniform distributio n
(hot spot of several times the background activity), the precisio n
for a given number of events in the target area is unchanged .
The predicted, simulated and measured values are i n
excellent agreement . This provides a simple method to evaluat e
the number of events necessary to achieve a given prevision, i n
a dynamic study for example .
- Figure 14 - Variance distribution image of a 7 .5 cm in diamete r
uniform phantom, with horizontal and vertical histograms at th e
center .
237
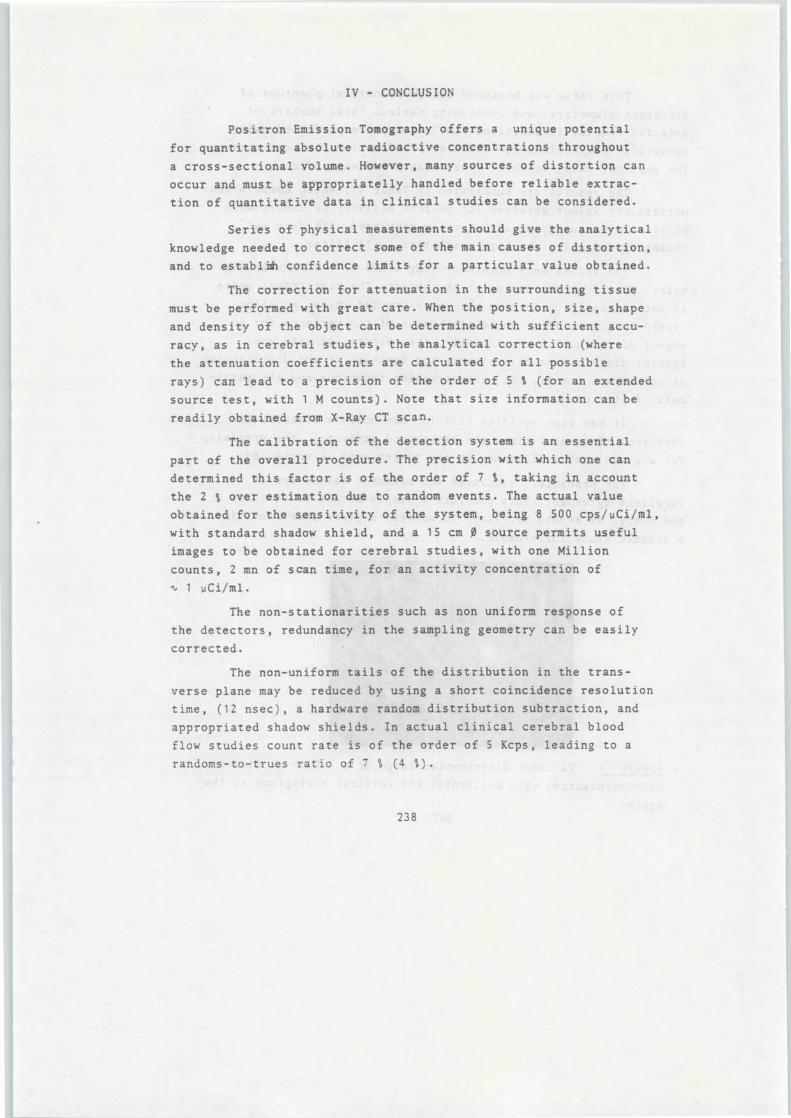
IV - CONCLUSION
Positron Emission Tomography offers a unique potentia l
for quantitating absolute radioactive concentrations throughou t
a cross-sectional volume . However, many sources of distortion ca n
occur and must be appropriatelly handled before reliable extrac-
tion of quantitative data in clinical studies can be considered .
Series of physical measurements should give the analytica l
knowledge needed to correct some of the main causes of distortion ,
and to establish confidence limits for a particular value obtained .
The correction for attenuation in the surrounding tissu e
must be performed with great care . When the position, size, shap e
and density of the object can be determined with sufficient accu -
racy, as in cerebral studies, the analytical correction (wher e
the attenuation coefficients are calculated for all possibl e
rays) can lead to a precision of the order of 5 % (for an extende d
source test, with 1 M counts) . Note that size information can b e
readily obtained from X-Ray CT scan .
The calibration of the detection system is an essentia l
part of the overall procedure . The precision with which one ca n
determined this factor is of the order of 7 %, taking in accoun t
the 2 % over estimation due to random events . The actual valu e
obtained for the sensitivity of the system, being 8 500 cps/uCi/ml ,
with standard shadow shield, and a 15 cm 0 source permits usefu l
images to be obtained for cerebral studies, with one Million
counts, 2 mn of scan time, for an activity concentration o f
ti 1 uCi/ml .
The non-stationarities such as non uniform response o f
the detectors, redundancy in the sampling geometry can be easil y
corrected .
The non-uniform tails of the distribution in the trans -
verse plane may be reduced by using a short coincidence resolutio n
time, (12 nsec), a hardware random distribution subtraction, an d
appropriated shadow shields . In actual clinical cerebral blood
flow studies count rate is of the order of 5 Kcps, leading to a
randoms-to-trues ratio of 7 % (4 %) .
238
Another important cause of error, much more difficult t o
handle is due to the out-of field activity . Specifically, for
the continuous C 15 02inhalation cerebral studies, the life siz e
phantom has been designed to measure the fraction of event s
detected in the transverse plane of the brain due to the pulmo -
nary activity . This does not exceed 3 % . However, this erro r
might be much great if one considers activity in the lower par t
of the head .
The target-tobackround concentrations contrast in th e
rCBF study is of the order of from 0 .2 : 1 to 5 : 1 . Thus, for
images with one Million detected events, the true concentratio n
could be retrieved with an accuracy'the order of 4 % to 15 % ,
depending on the selected ROI's size .
Lastly, from a statistical point of view, it can be pre-
dicted that for cerebral images with 1 Million events, using th e
Shepp and Logan type filter, the precision will be of 6 % pe r
image pixel .
Thus, for a given clinical study such as rCBF, measure s
of cerebral oxygen or glucose extraction, a protocol can be opti-
mised, using all the above techniques . Thus, after all correc-
tions have been performed, where 1 Million events have been detec t
detected, and ROI's of the order of 3 to 10 cm 2 values may be
extracted used with an optimal precision of 10 1 .
Further studies involving various shaped objects and
relative contrast and position should lead to a better estimatio n
of the limits of validity for quantitation .
ACKNOWLEDGEMENT S
We wish to thank J .C . BARON, D . COMAR, C . CROUZEL, fo r
their useful discussion and support . We aré also very gratefu l
to R . KNIPPER, C . LOCH and J . SÉJOURNE for their technica l
assistance .
239
REFERENCE S
1 . KUHL D .E ., EDWARDS R .Q ., RICCI A .R ., YACOB R .J ., MICH T .J . ,
ALAVI A . : The Mark IV system for radionuclide compute d
tomography of the brain . Radiology, 121, 405-413, 1976 .
7. EICHLING J .O ., HIGGINS C .S ., TER-PERGOSSIAN M.M . : Determi-
nation of radionuclide concentrations with positron C T
scanning (PETT) : Concise communication . J . Nucl . Med . ,
18, 845-847, 1977 .
3. BROWNELL G .L ., CORREIA J .A ., ZAMENHOT R .G . : Positron instru-
mentation . In Recent Advances in Nuclear Medicine, Vol . 5 ,
ed . by J .H . Lawrence and T .F . Budinger, New York, Grune &
Stratton, 1978, pp . 1-49 .
4. HOFFMAN E .J ., PHELPS M .E ., MULLANI N ., HIGGINS C .S . ,
TER-POGOSSIAN M .M . : Design and performance characteristic s
of a whole body transaxial tomograph . J . Nucl . Med ., 17 ,
493-502, 1976 .
5. PHELPS M .E ., HOFFMAN E .J ., MULLANI N .A ., HIGGINS C .S . ,
TER-POGOSSIAN M .M . : Design considerations for a positro n
emission transaxial tomograph (PETT III) . IEEE NS, Vd NS 3 2
n° 1, 1976 .
6. PHELPS M .E ., HOFFMAN E .J ., HUANG S .C ., KUHL D .E . : Ecat :
A new computerized tomographic imaging system for positron -
emitting radiopharmaceuticals . J . Nucl . Med ., 19, 625-647 ,
1 9 78 .
7 . SOUSSALINE F ., TODD-POKROPEK A .E ., PLUMMER D ., COMAR D . ,
LOCH C ., HOULE S ., KELLESHOHN C . : The Physical Performance s
of a Single Slice Positron Tomographic System and Preliminary
Results in a Clinical Environment . Eur . J . Nucl . Med ., 4 ,
237-249 (1979) .
240
8. HOFFMAN E .J ., HUANG S .C ., PHELPS M .E . : Quantitation i n
Positron Emission Computed Tomography : Effect of object size .
J . of Comp . Ass . Tomography, 3 (3) : 299-308, 1979 .
9. KAUFMAN L . : Personal communication .
10. HUESMAN R .H . : Analysis of statistical errors for transvers e
section reconstruction . LBL Report 4278, 1975 .
11. BUDINGER T .F ., DERENZO S .E ., GULLBERG G .T ., GREENBERG W .L . ,
HUESMAN R .H . : Emission Computed Axial Tomography . IAEA
Symposium on Medical Radionuclide Imaging . IAEA-SM-210/124 ,
Oct . 1976 .
12. GORE J .C ., TOFTS P .S . : Statistical Limitations in Compute d
Tomography .
Phys . Med . Biol ., Vol . 28, n° 6, 1176-1182, 1978 .
RESUME-•POSSIBILITES ET LIMITATIONS DES METHODES QUANTITATIVE S
EN TOMOGRAPHIE PAR EMISSION DE POSITRONS .
Des études physi ques et des simulations doivent permettr ed'analyser, pour les corriger ou les minimiser, les principale ssources d'erreur intervenant dans la mesure de l'activité régional eabsolue en tomographie par émission de positrons . L'étude présenté eici à été réalisée à l'aide d'un Tomographe (ORTEC) à positrons hexa-gonal monocoupe . Les caractéristiques générales de ce système sont ,d'abord, mesurées et discxutées . Puis, la validité des méthodes c*uan-titatives est évaluée selon trois aspects in'ortants : la calibratio nproprement dite d'une système donné, le contraste tel qu'il est mesur épour différents rapports de concentrations, et les incertitudes sta-tistiques . Pour chacun de ces paramètres, les autres sources d'erreur ,sont identifiées . A l'aide de ces données une stratégie peut 'êtr edéduite pour une étude clinique donnée, comme dans les études méta-boliques cérébrales, pour optimiser les résultats et placer de sintervalles de confiance sur ces valeurs .
241

DISCUSSIO N
TOFTS asked whether the out-of-field activity would allow for quantitative studie s
in the lungs .
SOUSSALINE said that she had done an estimation based on clinical and phantom
studies having 16 mCi of 11 C in the lungs and 1rCi/ml in the brain would only in-
troduce an error of 3% on quantitative studies in the brain . The effect of the
lower part of the head activity has not been studied . In the lungs itself the
error can reach 40% .
In response to a question by YAMAMOTO, SOUSSALINE answered that the sensisity
with regard to the uniformity of the detector is the most important component o f
the system . The non uniformity can be corrected for by a normalization procedur e
using a plane source .
242

PUBLICATION
XII
PUBLICATION XI I
Journal of Computer Assisted Tomograph y
5(4) :551-556 . Augus t
Ç\ 1981 Raven Press . New Yor k
A Rotating Conventional Gamma Camera Single-Photo nTomographic System : Physical Characterizatio n
Françoise P. Soussaline, Andrew E . Todd-Pokropek, Stanislas Zurowski ,Elisabeth Huffer, Claude E . Raynaud, and Claude L . Kellershohn
Abstract : A whole-body single-photon emission computed tomography sys-tem has been evaluated in terms of its physical performance . It consists of astandard GE 400 T maxi camera rotating on a ring stand, coupled to an Infor-matek Simis 3 computer system . In its standard mode of operation, 64 or 12 8successive views of 64 x 64 or 128 x 64 matrices are collected at regularangular samples . The reconstruction of up to 64 possible adjacent transvers esections, sorted into coronal, sagittal, and oblique sections, is obtained b yfiltered backprojection . A conventional parallel-hole collimator is used . Theuniformity of the camera field of view is corrected by the GE hardware module .The resolution in the transverse plane is typically of 15 .5 mm in a 20 cm Lucitephantom, and independent of radial distance . The physical slice thickness i s19 mm (full width at half maximum of the longitudinal response using a poin tsource) with only slight variations along the diameter of the image . The sen-sitivity is -7,000 cps mCi - ' as measured using a ssmTc thin source, enablingimages of reasonable signal-to-noise ratio to be obtained in 10 min . The ef-fect of the energy window, the number of angular samples, and the linea rsampling modes on the transverse resolution and contrast is measured an ddiscussed . Index Terms : Emission computed tomography—Radionuclides . .
Two classes of single-photon tomographic sys-tems exist . The first includes those systems specifi-cally designed for, and often restricted to, tomo -graphic applications, e .g ., using an array of spe-cially collimated detectors (1-7) . The second ,which may be termed "general purpose," includesconventional detectors such as gamma cameras ,which have been adapted to perform tomograph yadditionally (8-15) . The latter are often considere dto be more flexible and less expensive in a clinicalenvironment .
A system of the second type has been tested bymeasuring certain critical physical parameters, suc has transverse and spatial resolution, overall sen-sitivity, and physical slice thickness . The effect ofthe energy resolution and spectrometry, and, to alimited extent, the potential for quantitation of th emethod have been investigated .
From Service Hospitalier Frederic Joliot . Département d eBiologie . Commissariat a l'Energie Atomique . Hôpital d'Orsa y(F . P . Soussaline . A . E . Todd-Pokropek . S . Zurowski . C .Raynaud, and C . L . Kellershohn), and Informatek S .A . . B .P . 11 .(E . Huffer), 91406 Orsay, France . Address correspondence an dreprint requests to Dr . Soussaline .
MATERIALS AND METHOD S
The system used for this study has been pre-sented elsewhere (15) . Essentially, it is comprised o fa GE 400 T maxi camera connected to an Infor-matek Simis 3 computer system with 64K wor dmemory . The rotation of the camera head around apatient lying on a specially designed bed is per-formed by rotating 128, 64, or 32 equal angular sam -ples . The total number of angles is selected on th ecamera console, which synchronizes the acqui-sition process . Normally, 64 matrices (successiv econventional views), sampled as 64 x 64 arrays, arecollected and stored on disk during acquisition. Thestandard low energy, high resolution collimator wa sused for all the tests reported here .
The reconstruction of up to 64 adjacent trans -verse sections was normally performed by usingfiltered backprojection in the spatial and frequenc ydomains . The limits within which the sections are tobe reconstructed can be preselected on the conven-tional plane views during acquisition . Although anumber of different filters have been used, the re-sults presented were obtained with the ramp filter ,which has a v response in the frequency domain, b y
551
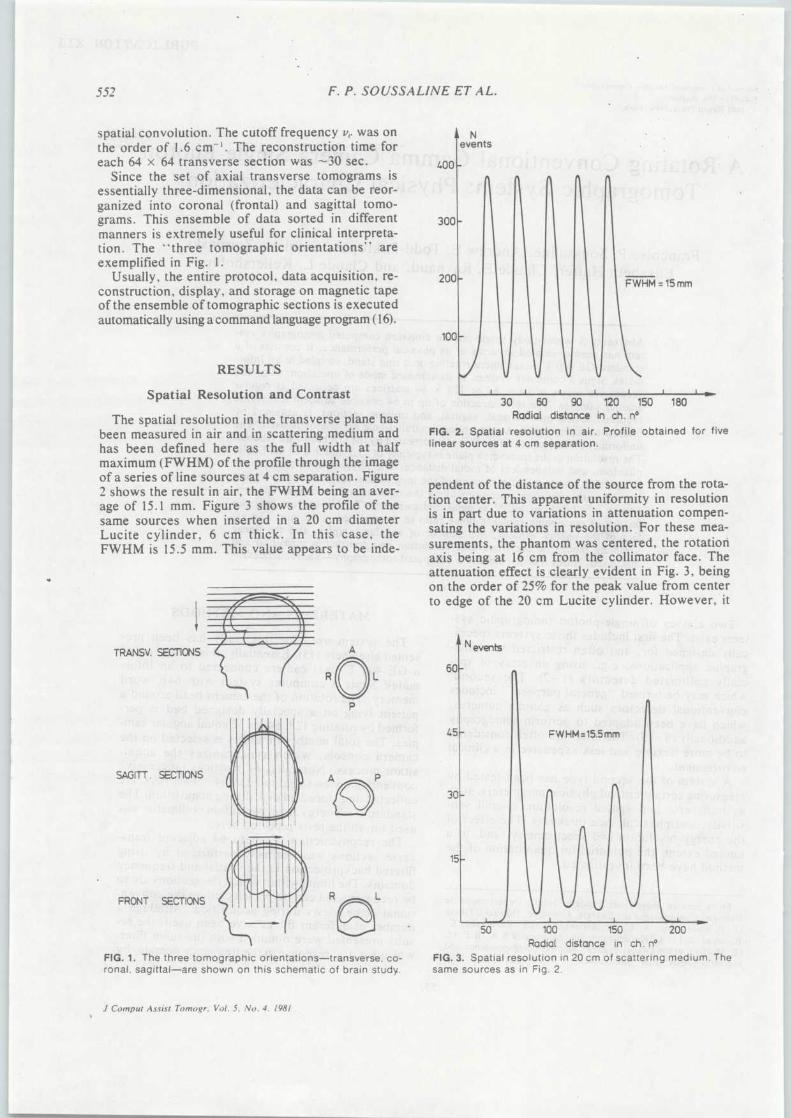
552
F. P . SOUSSALINE ET AL .
spatial convolution . The cutoff frequency v t. was onthe order of 1 .6 cm' . The reconstruction time fo reach 64 x 64 transverse section was -30 sec .
Since the set of axial transverse tomograms i sessentially three-dimensional, the data can be reor-ganized into coronal (frontal) and sagittal tomo-grams . This ensemble of data sorted in differentmanners is extremely useful for clinical interpreta-tion. The "three tomographic orientations " areexemplified in Fig . 1 .
Usually, the entire protocol, data acquisition, re -construction, display, and storage on magnetic tapeof the ensemble of tomographic sections is execute dautomatically using a command language program (16) .
100
Nevent s
100
300
200
s 1
FWHM =15 mm
RESULT S
Spatial Resolution and Contras t
The spatial resolution in the transverse plane hasbeen measured in air and in scattering medium andhas been defined here as the full width at hal fmaximum (FWHM) of the profile through the imageof a series of line sources at 4 cm separation . Figure2 shows the result in air, the FWHM being an aver-age of 15 .1 mm. Figure 3 shows the profile of th esame sources when inserted in a 20 cm diamete rLucite cylinder, 6 cm thick . In this case, theFWHM is 15 .5 mm . This value appears to be inde -
FIG . 1 . The three tomographic orientations—transverse, co -
J t I l I
30
60
90
120
150
180Radial distance in ch . n°
FIG . 2. Spatial resolution in air . Profile obtained for fivelinear sources at 4 cm separation .
pendent of the distance of the source from the rota-tion center . This apparent uniformity in resolutionis in part due to variations in attenuation compen-sating the variations in resolution. For these mea-surements, the phantom was centered, the rotatio naxis being at 16 cm from the collimator face . Theattenuation effect is clearly evident in Fig . 3, bein gon the order of 25% for the peak value from cente rto edge of the 20 cm Lucite cylinder. However, i t
N events
60 1
45 FWHM=15 .5mm
30
15
50
100
150
200Radial distance in ch . n°
FIG . 3 . Spatial resolution in 20 cm of scattering medium . Th e
TRANSV. SECTIONS
SAGITT . SECTION S
FRONT . SECTION S
ronal, sagittal—are shown on this schematic of brain study .
same sources as in Fig . 2 .
J Comput Assist Tomogr, Vol . 5, No . 4 . 1981
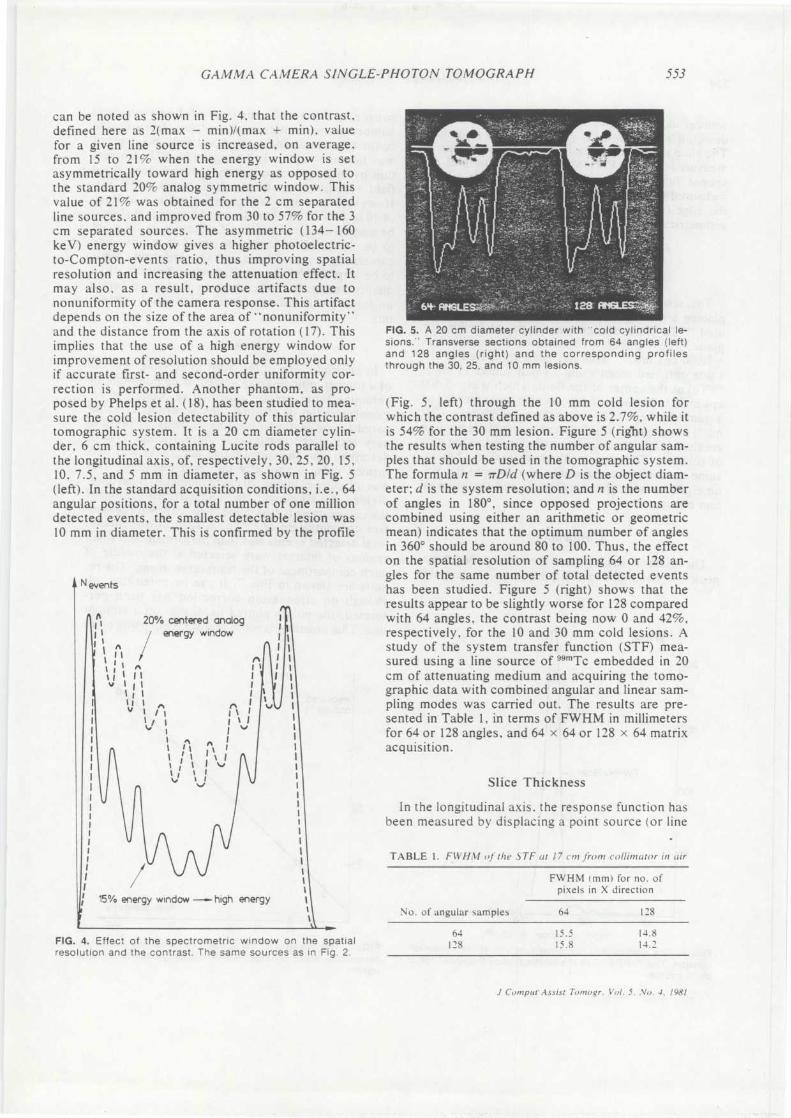
GAMMA CAMERA SINGLE-PHOTON TOMOGRAPH
553
can be noted as shown in Fig . 4, that the contrast ,defined here as 2(max — min)/(max + min), valu efor a given line source is increased, on average ,from 15 to 21% when the energy window is se tasymmetrically toward high energy as opposed t othe standard 20% analog symmetric window . Thi svalue of 21% was obtained for the 2 cm separate dline sources, and improved from 30 to 57% for the 3cm separated sources . The asymmetric (134—160keV) energy window gives a higher photoelectric-to-Compton-events ratio, thus improving spatia lresolution and increasing the attenuation effect . I tmay also, as a result, produce artifacts due t ononuniformity of the camera response . This artifac tdepends on the size of the area of "nonuniformity "and the distance from the axis of rotation (17) . Thi simplies that the use of a high energy window fo rimprovement of resolution should be employed onl yif accurate first- and second-order uniformity cor -rection is performed . Another phantom, as pro -posed by Phelps et al . (18), has been studied to mea -sure the cold lesion detectability of this particula rtomographic system . It is a 20 cm diameter cylin-der, 6 cm thick, containing Lucite rods parallel t othe longitudinal axis, of, respectively, 30, 25, 20, 15 ,10, 7 .5, and 5 mm in diameter, as shown in Fig . 5(left) . In the standard acquisition conditions, i .e ., 64angular positions, for a total number of one millio ndetected events, the smallest detectable lesion wa s10 mm in diameter . This is confirmed by the profil e
1 N event s
FIG . 4 . Effect of the spectrometric window on the spatia lresolution and the contrast . The same sources as in Fig . 2 .
FIG . 5 . A 20 cm diameter cylinder with "cold cylindrical le-sions . " Transverse sections obtained from 64 angles (left )and 128 angles (right) and the corresponding profile sthrough the 30, 25, and 10 mm lesions .
(Fig . 5, left) through the 10 mm cold lesion fo rwhich the contrast defined as above is 2 .7%, while i tis 54% for the 30 mm lesion . Figure 5 (right) show sthe results when testing the number of angular sam-ples that should be used in the tomographic system .The formula n = irD/d (where D is the object diam-eter; d is the system resolution ; and n is the numberof angles in 180°, since opposed projections ar ecombined using either an arithmetic or geometri cmean) indicates that the optimum number of angle sin 360° should be around 80 to 100 . Thus, the effecton the spatial resolution of sampling 64 or 128 an-gles for the same number of total detected eventshas been studied . Figure 5 (right) shows that th eresults appear to be slightly worse for 128 compare dwith 64 angles, the contrast being now 0 and 42% ,respectively, for the 10 and 30 mm cold lesions . Astudy of the system transfer function (STF) mea-sured using a line source of 99m Tc embedded in 20cm of attenuating medium and acquiring the tomo -graphic data with combined angular and linear sam-pling modes was carried out . The results are pre-sented in Table 1, in terms of FWHM in millimeter sfor 64 or 128 angles, and 64 x 64 or 128 x 64 matri xacquisition .
Slice Thicknes s
In the longitudinal axis, the response function ha sbeen measured by displacing a point source (or lin e
TABLE 1 . FIVHaI of the STF at 17 cm from collimator in air
FWHM (mm) for no . o fpixels in X directio n
No . of angular samples 64 12 8
64 15 .5 14 . 8128 15 .8 14 .2
15% energy window -high energ y
f
20% centered analog/ energy window
J Comput. ,-tssist To,nogr . Vol . 5 . .Vo . 4, 198 1
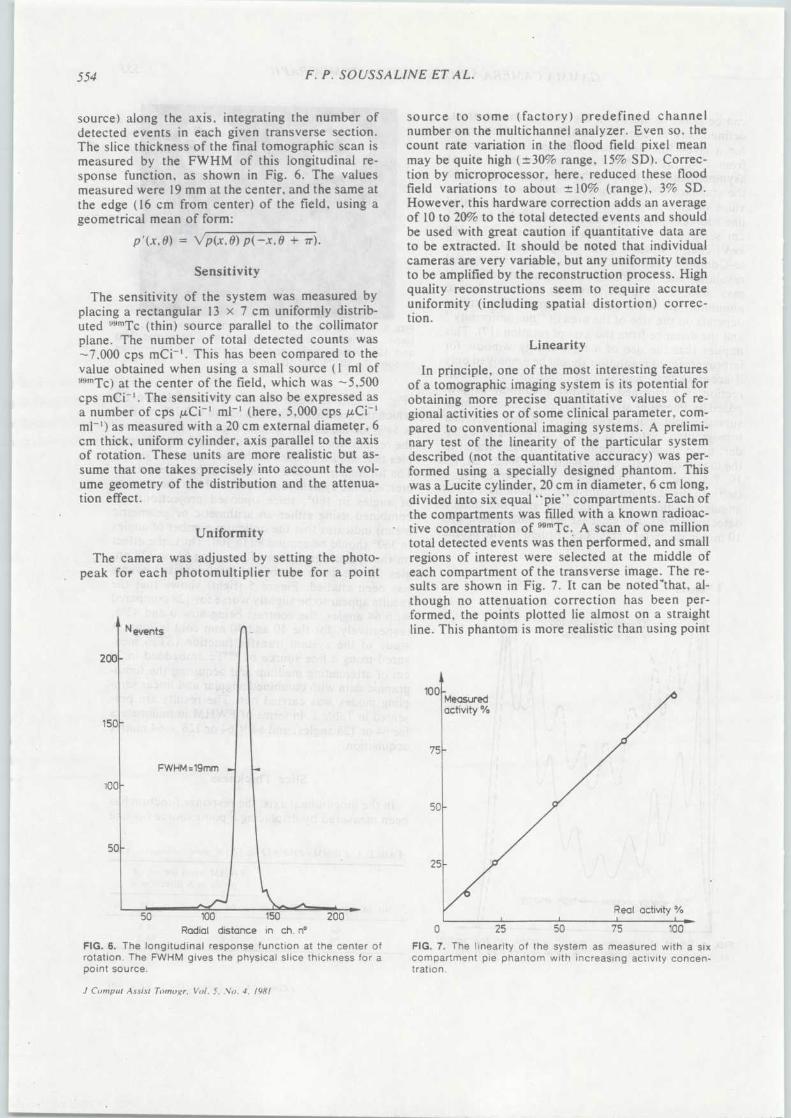
554 F. P . SOUSSALINE ET AL.
source) along the axis, integrating the number o fdetected events in each given transverse section .The slice thickness of the final tomographic scan i smeasured by the FWHM of this longitudinal re-sponse function, as shown in Fig . 6. The valuesmeasured were 19 mm at the center, and the same a tthe edge (16 cm from center) of the field, using ageometrical mean of form :
P'(x, O) = \/P(x, O) P( —x , O + jr) .
Sensitivity
The sensitivity of the system was measured byplacing a rectangular 13 x 7 cm uniformly distrib-uted 99mTc (thin) source parallel to the collimatorplane . The number of total detected counts wa s-7,000 cps mCi' . This has been compared to thevalue obtained when using a small source (1 ml o f49m Tc) at the center of the field, which was -5,50 0cps mCi' . The sensitivity can also be expressed asa number of cps µCi' ml' (here, 5,000 cps µCi'ml') as measured with a 20 cm external diameter, 6cm thick, uniform cylinder, axis parallel to the axi sof rotation. These units are more realistic but as-sume that one takes precisely into account the vol-ume geometry of the distribution and the attenua-tion effect .
Uniformity
The camera was adjusted by setting the photo -, peak for each photomultiplier tube for a poin t
50
100
150
200Radial distance in ch . n°
FIG . 6 . The longitudinal response function at the center o frotation . The FWHM gives the physical slice thickness for apoint source .
J Comput Assist Tomo ,gr . Vol . 5, .Vo . 4 . 1981
source to some (factory) predefined channe lnumber on the multichannel analyzer. Even so, thecount rate variation in the flood field pixel meanmay be quite high (±30% range, 15% SD) . Correc-tion by microprocessor, here, reduced these floodfield variations to about ± 10% (range), 3% SD .However, this hardware correction adds an averag eof 10 to 20% to thé total detected events and shoul dbe used with great caution if quantitative data ar eto be extracted . It should be noted that individua lcameras are very variable, but any uniformity tend sto be amplified by the reconstruction process . Highquality reconstructions seem to require accurat euniformity (including spatial distortion) correc-tion .
Linearit y
In principle, one of the most interesting feature sof a tomographic imaging system is its potential fo robtaining more precise quantitative values of re-gional activities or of some clinical parameter, corn-pared to conventional imaging systems . A prelimi-nary test of the linearity of the particular syste mdescribed (not the quantitative accuracy) was per -formed using a specially designed phantom . Thiswas a Lucite cylinder, 20 cm in diameter, 6 cm long ,divided into six equal "pie" compartments . Each ofthe compartments was filled with a known radioac-tive concentration of 99m Tc . A scan of one millio ntotal detected events was then performed, and smal lregions of interest were selected at the middle ofeach compartment of the transverse image . The re-sults are shown in Fig . 7 . It can be noted *that, al-though no attenuation correction has been per -formed, the points plotted lie almost on a straigh tline . This phantom is more realistic than using poin t
FIG . 7 . The linearity of the system as measured with a si xcompartment pie phantom with increasing activity concen-tration .
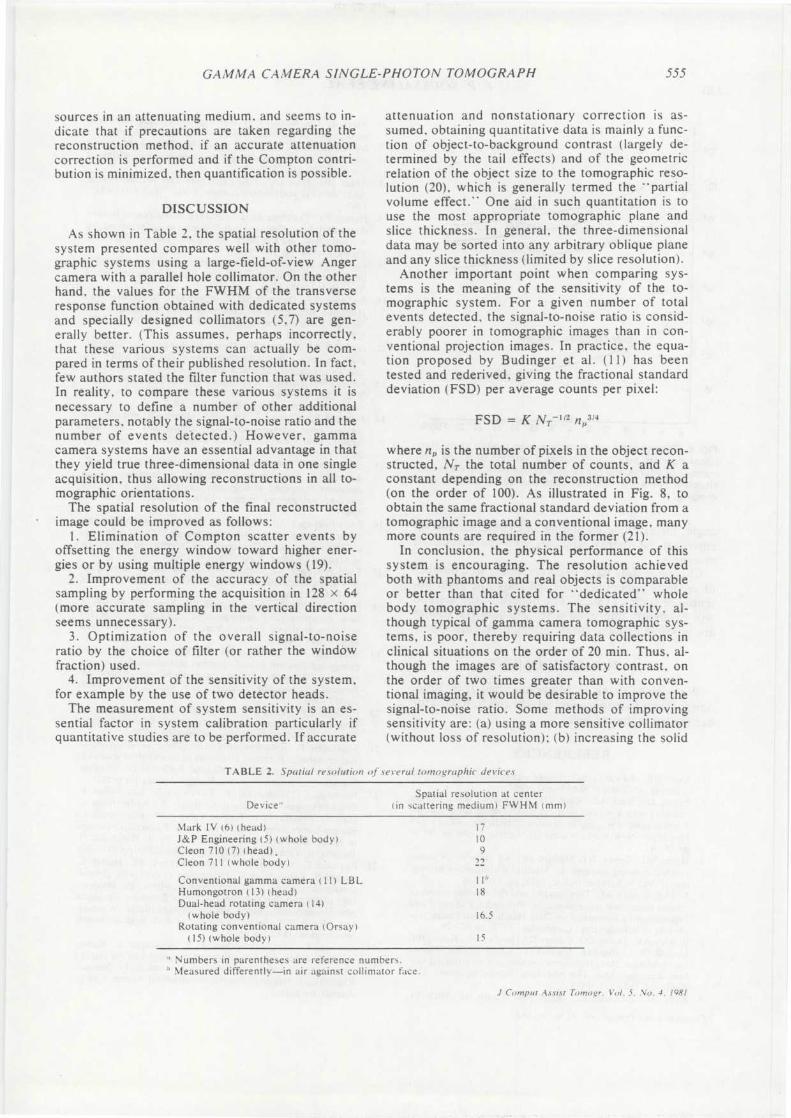
GAMMA CAMERA SINGLE-PHOTON TOMOGRAPH
555
sources in an attenuating medium, and seems to in-dicate that if precautions are taken regarding th ereconstruction method, if an accurate attenuatio ncorrection is performed and if the Compton contri-bution is minimized, then quantification is possible .
DISCUSSION
As shown in Table 2, the spatial resolution of th esystem presented compares well with other tomo-graphic systems using a large-field-of-view Ange rcamera with a parallel hole collimator . On the othe rhand, the values for the FWHM of the transvers eresponse function obtained with dedicated system sand specially designed collimators (5,7) are gen-erally better . (This assumes, perhaps incorrectly ,that these various systems can actually be com-pared in terms of their published resolution . In fact ,few authors stated the filter function that was used .In reality, to compare these various systems it i snecessary to define a number of other additiona lparameters, notably the signal-to-noise ratio and thenumber of events detected .) However, gamm acamera systems have an essential advantage in tha tthey yield true three-dimensional data in one singl eacquisition, thus allowing reconstructions in all to-mographic orientations .
The spatial resolution of the final reconstructe dimage could be improved as follows :
1. Elimination of Compton scatter events b yoffsetting the energy window toward higher ener-gies or by using multiple energy windows (19) .
2. Improvement of the accuracy of the spatia lsampling by performing the acquisition in 128 x 6 4(more accurate sampling in the vertical directio nseems unnecessary) .
3. Optimization of the overall signal-to-noiseratio by the choice of filter (or rather the windô wfraction) used .
4. Improvement of the sensitivity of the system ,for example by the use of two detector heads .
The measurement of system sensitivity is an es-sential factor in system calibration particularly i fquantitative studies are to be performed . If accurate
attenuation and nonstationary correction is as-sumed, obtaining quantitative data is mainly a func-tion of object-to-background contrast (largely de-termined by the tail effects) and of the geometri crelation of the object size to the tomographic reso-lution (20), which is generally termed the "partia lvolume effect ." One aid in such quantitation is t ouse the most appropriate tomographic plane an dslice thickness . In general, the three-dimensiona ldata may be sorted into any arbitrary oblique plan eand any slice thickness (limited by slice resolution) .
Another important point when comparing sys-tems is the meaning of the sensitivity of the to-mographic system . For a given number of tota levents detected, the signal-to-noise ratio is consid-erably poorer in tomographic images than in con-ventional projection images . In practice, the equa-tion proposed by Budinger et al . (11) has bee ntested and rederived, giving the fractional standarddeviation (FSD) per average counts per pixel :
FSD = K NT- 1 /2 nDs14
where ri p is the number of pixels in the object recon-structed, NT the total number of counts, and K aconstant depending on the reconstruction metho d(on the order of 100) . As illustrated in Fig . 8, toobtain the same fractional standard deviation from atomographic image and a conventional image, man ymore counts are required in the former (21) .
In conclusion, the physical performance of thi ssystem is encouraging . The resolution achievedboth with phantoms and real objects is comparabl eor better than that cited for "dedicated" whol ebody tomographic systems . The sensitivity, al -though typical of gamma camera tomographic sys-tems, is poor, thereby requiring data collections i nclinical situations on the order of 20 min . Thus, al -though the images are of satisfactory contrast, o nthe order of two times greater than with conven-tional imaging, it would be desirable to improve thesignal-to-noise ratio . Some methods of improvin gsensitivity are : (a) using a more sensitive collimator(without loss of resolution) ; (b) increasing the soli d
TABLE 2. Spatial resolution of several tomographic device s
Device"Spatial resolution at cente r
(in scattering medium) FWHM (mm )
Mark IV (6) (head )J&P Engineering (5) (whole body )Cleon 710 (7) (head) .Cleon 711 (whole body )
Conventional gamma camera (11) LB LHumongotron (13) (head )Dual-head rotating camera (14 )
(whole body )Rotating conventional camera (Orsay )
(15) (whole body)
1 710
92 2
1
1 8
16 . 5
15
" Numbers in parentheses are reference numbers ." Measured differently—in air against collimator face .
J Comput Assist Tomo r, Vol . 5 . .Vo . 4 . 198 1
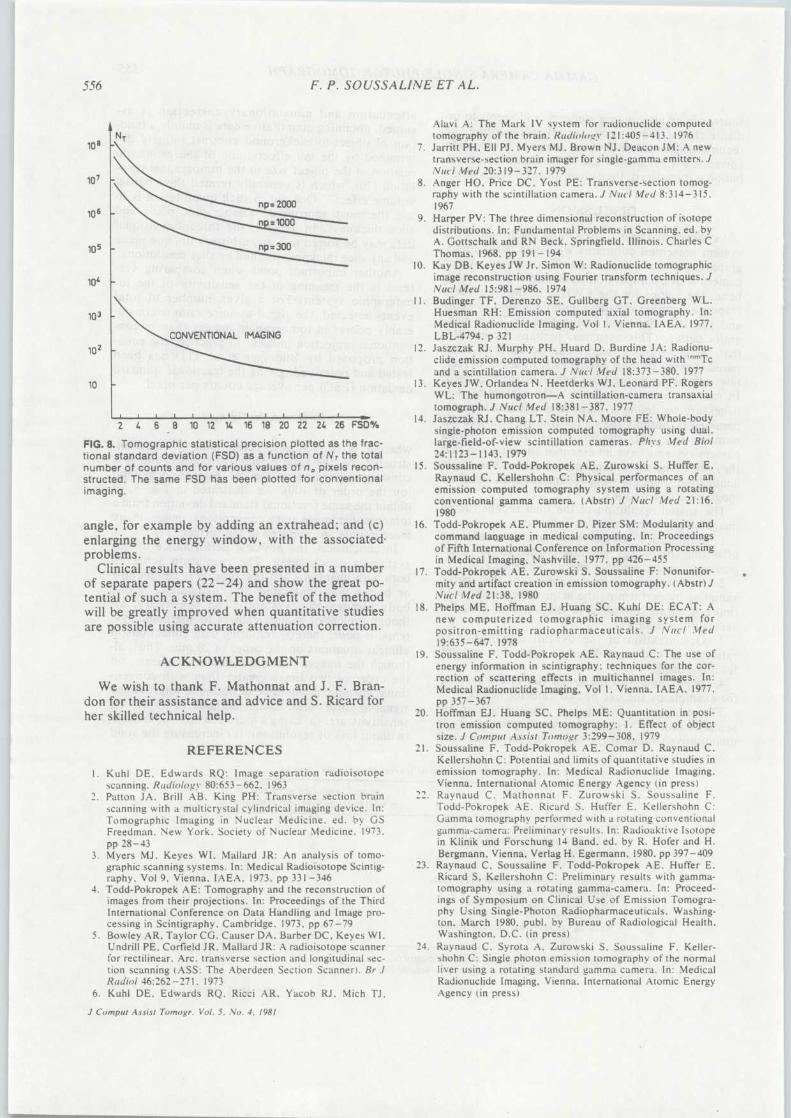
556 F. P . SOUSSALINE ET AL.
10'
10 3
CONVENTIONAL IMAGIN G
10 2
10
1 1 1 1 I I 1 1 t 1
2 4
6' 8 10 12 14 16 18 20 22 24 26 FSD %
FIG . 8. Tomographic statistical precision plotted as the frac-tional standard deviation (FSD) as a function of N T the tota lnumber of counts and for various values of n p pixels recon-structed . The same FSD has been plotted for conventiona limaging .
angle, for example by adding an extrahead ; and (c )enlarging the energy window, with the associate &problems .
Clinical results have been presented in a numberof separate papers (22–24) and show the great po-tential of such a system. The benefit of the methodwill be greatly improved when quantitative studie sare possible using accurate attenuation correction .
ACKNOWLEDGMEN T
We wish to thank F . Mathonnat and J . F. Bran -don for their assistance and advice and S . Ricard forher skilled technical help .
REFERENCE S
1 . Kuhl DE, Edwards RQ : Image separation radioisotop e
scanning . Radiology 80 :653 -662 . 196 3Patton JA . Brill AB . King PH : Transverse section brai nscanning with a multicrystal cylindrical imaging device . In :Tomographic Imaging in Nuclear Medicine, ed . by G SFreedman, New York . Society of Nuclear Medicine . 1973 .
pp 28–433. Myers MJ, Keyes WI . Mallard JR : An analysis of tomo -
graphic scanning systems . In : Medical Radioisotope Scintig -raphy, Vol 9, Vienna, IAEA, 1973, pp 331–346
4. Todd-Pokropek AE : Tomography and the reconstruction o fimages from their projections . In : Proceedings of the ThirdInternational Conference on Data Handling and Image pro-cessing in Scintigraphy . Cambridge, 1973, pp 67–79
5. Bowley AR, Taylor CG. Causer DA . Barber DC, Keyes WI .Undrill PE . Corfield JR . Mallard JR : A radioisotope scanne rfor rectilinear . Arc, transverse section and longitudinal sec -tion scanning (ASS : The Aberdeen Section Scanner) . Br JRadio/ 46 :262–271 . 197 3
6. Kuhl DE, Edwards RQ . Ricci AR. Yacob R.I . Mich TJ ,
J Comput Assist Tomogr. Vol. 5 . Vo . 4, 1981
Alavi A : The Mark IV system for radionuclide compute dtomography of the brain . Radiology 121 :405-413 . 1976
7. Jarritt PH, Ell PJ, Myers MJ . Brown NJ . Deacon JM : A ne wtransverse-section brain imager for single-gamma emitters . JNucl .Mec! 20 :319–327 . 1979
8. Anger HO, Price DC . Yost PE: Transverse-section tomog-raphy with the scintillation camera . J Nucl Med 8 :314-315 ,1967
9. Harper PV: The three dimensional reconstruction of isotopedistributions . In : Fundamental Problems in Scanning . ed . byA . Gottschalk and RN Beck . Springfield, Illinois . Charles CThomas . 1968, pp 191–194
10. Kay DB . Keyes JW Jr . Simon W : Radionuclide tomographi c
image reconstruction using Fourier transform techniques . J
Nuc! Med 15 :981–986, 197 4I1 . Budinger TF, Derenzo SE, Gullberg GT . Greenberg WL ,
Huesman RH : Emission computed axial tomography . In :Medical Radionuclide Imaging . Vol 1 . Vienna, IAEA, 1977 ,LBL-4794 . p 32 1
12. Jaszczak RJ . Murphy PH . Huard D. Burdine JA: Radionu-clide emission computed tomography of the head with '"'"'Tc
and a scintillation camera . J Nucl Med 18 :373–380, 1977
13. Keyes JW, Orlandea N . Heetderks WJ . Leonard PF . Roger s
WL: The humongotron—A scintillation-camera transaxialtomograph . J Nuc( Med 18 :381–387 . 197 7
14. Jaszczak RJ . Chang LT . Stein NA, Moore FE : Whole-bod ysingle-photon emission computed tomography using dual ,large-field-of-view scintillation cameras . Phys Med Bio l
24 :1123–1143, 197 915. Soussaline F . Todd-Pokropek AE, Zurowski S, Huffer E .
Raynaud C, Kellershohn C : Physical performances of anemission computed tomography system using a rotatin gconventional gamma camera . (Abstr) J Nucl Med 21 :16 ,
198016. Todd-Pokropek AE . Plummer D, Pizer SM : Modularity and
command language in medical computing, In : Proceedingsof Fifth International Conference on Information Processin gin Medical Imaging, Nashville . 1977, pp 426–45 5
17. Todd-Pokropek AE, Zurowski S . Soussaline F : Nonunifor-mity and artifact creation in emission tomography . (Abstr) JNucl Med 21 :38, 1980
18. Phelps ME . Hoffman EJ, Huang SC . Kuhl DE: ECAT : A
new computerized tomographic imaging system fo rpositron-emitting radiopharmaceuticals . J Nucl .Me d
19 :635–647 . 197 819. Soussaline F . Todd-Pokropek AE . Raynaud C : The use o f
energy information in scintigraphy : techniques for the cor-rection of scattering effects in multichannel images . In :
Medical Radionuclide Imaging, Vol 1, Vienna . IAEA . 1977 ,
pp 357–36720. Hoffman E.J . Huang SC. Phelps ME : Quantitation in posi-
tron emission computed tomography : 1 . Effect of objec tsize . J Comput Assist Tomogr 3 :299–308, 1979
21. Soussaline F . Todd-Pokropek AE . Comar D . Raynaud C .Kellershohn C : Potential and limits of quantitative studies i nemission tomography . In : Medical Radionuclide Imaging .Vienna, International Atomic Energy Agency (in press )
22. Raynaud C, Mathonnat F . Zurowski S . Soussaline F .Todd-Pokropek AE . Ricard S, Huffer E . Kellershohn C :Gamma tomography performed with a rotating conventiona l
gamma-camera: Preliminary results . In : Radioaktive Isotop ein Klinik and Forschung 14 Band . ed . by R. Hofer and H .Bergmann, Vienna, Verlag H . Egermann, 1980, pp 397–40 9
23. Raynaud C, Soussaline F, Todd-Pokropek AE. Huffer E .Ricard S, Kellershohn C : Preliminary results with gamma -tomography using a rotating gamma-camera . In : Proceed-ings of Symposium on Clinical Use of Emission Tomogra-phy Using Single-Photon Radiopharmaceuticals . Washing -ton, March 1980, publ . by Bureau of Radiological Health .Washington, D .C . (in press )
24. Raynaud C, Syrota A, Zurowski S, Soussaline F . Keller-shohn C : Single photon emission tomography of the norma lliver using a rotating standard gamma camera . In : MedicalRadionuclide Imaging, Vienna. International Atomic Energ yAgency (in press )
b

PUBLICATION
XIII
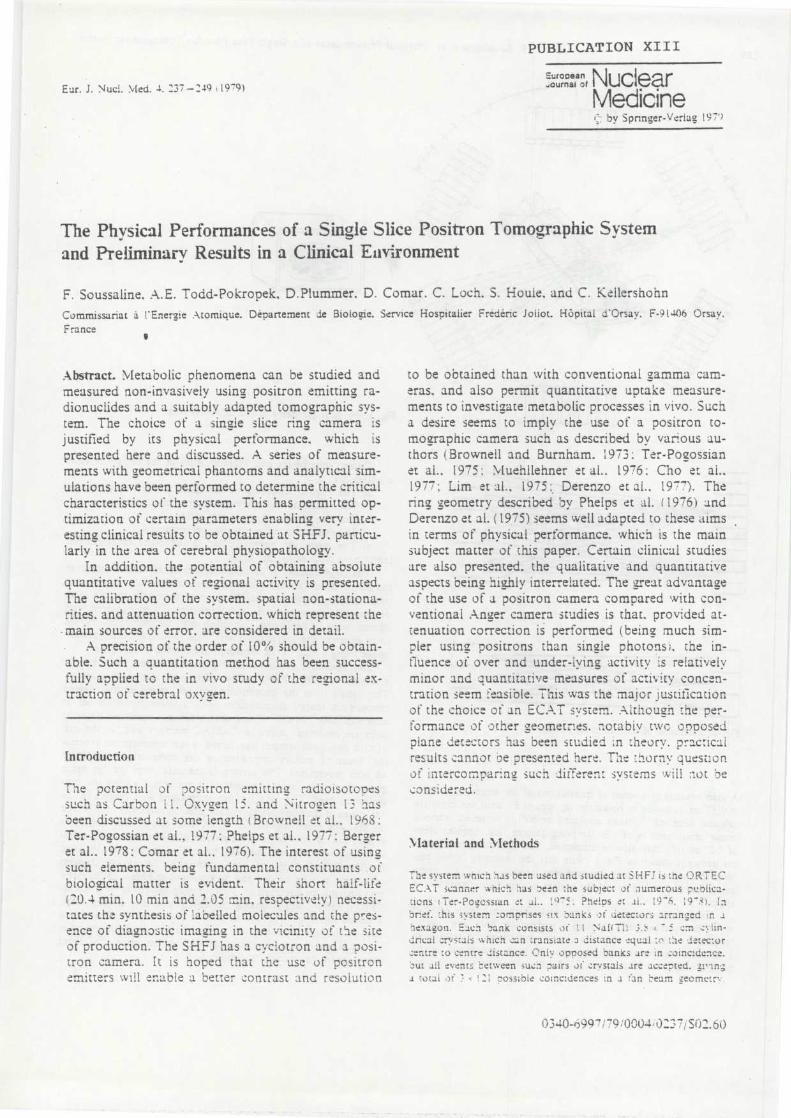
PUBLICATION XII I
Eur. J . Nuel. Med . 4. 237—249 19 79) ournala on
f NudearMedicine
by Spnnger - Veriag 197 9
The Physical Performances of a Single Slice Positron Tomographic Syste mand Preliminary Results in a Clinical Eavironmen t
F . Soussaline . A.E. Todd-Pokropek, D .Plummer, D . Comar. C . Loch, S . Houle, and C. Kellershohn
Commissariat à l'amie Atomique . Département de Biologie. Service Hospitalier Frédéric Joliot . Hôpital d'Orsay . F-91406 Orsay ,
France
Abstract . Metabolic phenomena can be studied andmeasured non-invasively using positron emitting ra-dionuclides and a suitably adapted tomographic sys-tem. The choice of a single slice ring camera i sjustified by its physical performance, which i spresented here and discussed . A series of measure-ments with geometrical phantoms and analytical sim-ulations have been performed to determine the critica lcharacteristics of the system . This has permitted op-timization of certain parameters enabling very inter-esting clinical results to be obtained at SHFJ, particu-larly in the area of cerebral physiopathology .
In addition . the potential of obtaining absolut equantitative values of regional activity is presented .The calibration of the system. spatial non-stationa-rities . and attenuation correction . which represent themain sources of error . are considered in detail .
A precision of the order of 10%ô should be obtain -able. Such a Quantitation method has been success -fully applied to the in vivo study of the regional ex -traction of cerebral oxygen .
Introductio n
The potential of positron emitting radioisotope ssuch as Carbon i 1 . Oxygen 15 . and Nitrogen hasbeen discussed at some length ( Brownell et al . . 1968 :Ter-Pogossian et al ., 1977 : Phelps et al ., 1977 : Bergeret al . . 1978 : Comar et al ., 1976) . The interest of usin gysuch elements . being fundamental constituants o fbiological matter is evident . Their short half-life(20.4 min . 10 min and 2 .05 min, respectively) necessi-tates the synthesis of labelled molecules and the pres-ence of diagnostic imaging in the vicinity of the sit eof production. The SHFJ has a cyclotron and a posi-tron camera . It is hoped that the use of positro nemitters well enable a better contrast and resolution
to be obtained than with conventional gamma cam-eras, and also permit quantitative uptake measure-ments to investigate metabolic processes in vivo . Sucha desire seems to imply the use of a positron to-mographic camera such as described by various au-thors (Brownell and Burnham . 1973 : Ter-Pogossia net ai ., 1975 ; Muehllehner et al . . 1976 : Cho et ai . .1977 : Lim et al ., 1975 :, Derenzo et al ., 1977) . Thering geometry described by Phelps et al . (1976) andDerenzo et al . (1975) seems well adapted to these aim sin terms of physical performance. which is the mainsubject matter of this paper . Certain clinical studie sare also presented . the qualitative and quantitativeaspects being highly interrelated . The great advantag eof the use of a positron camera compared with con-ventional Anger camera studies is that, provided at-tenuation correction is performed (being much sim -pler using positrons than single photons), the in -fluence of over and under-lying activity is relativel yminor and quantitative measures of activity concen-trationtration seem feasible .
was the major justificatio nof the choice of an ECAT system. Although the per-formance of other geometries . notably two opposedplane detectors has been studied in theory . practica lresults cannot be presented here . Tele :horny questio nof intercompartng such different systems will of h econsidered .
Material and Methods
The system which has been used and studied at S H F? is the 0 BTE CECAT scanner which blas been the subject of .numerous publica -tions tTer•P o g crsslan et al . . 10 75; Phelps et ai . . 1 9 - 6 . 1 9 - ) . 1 abrief. :his systerl co m prises six banks of detectors arranged i ri ahexagon . Each bank consists o Il Nair i i ; 3 . < cin c lin-dncai crvstais which c,:n :ransiate distance equal tc' t .Li detecto rcentre to centre distance . Only opposed banks are in coincidence .but ail events between such pairs of crustals are acc e p ted .a total of i 121 possible coincidences in a ran beam, ?ecmetr y
0340-6997179/0004 i.0237 S016- 0
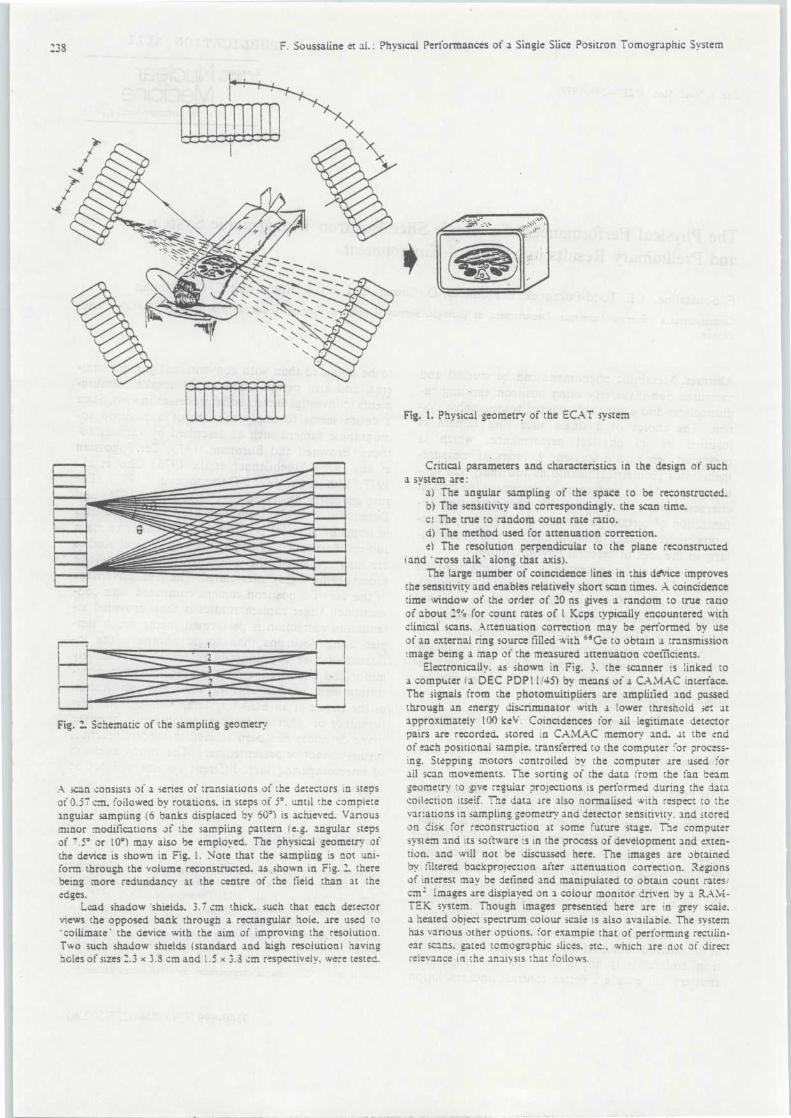
238
F . Soussaline et al. : Physical Performances of a Single Slice Positron Tomographic Syste m
Fig. 1 . Physical geometry of the ECAT syste m
Fig . :. Schematic of the sampling geometry
A scan consists of a series of translations of the detectors in step s
of 0 .57 cm, followed by rotations, in steps of .5°, until the complet e
angular sampling (6 banks displaced by 60°) is achieved. Vanou s
minor modifications of the sampling pattern (e .g. angular step s
of 7 .5° or 10°) may aiso be employed . The physical geometry of
the device is shown in Fig . 1 . Note that the sampling is not uni -
form through the volume reconstructed. as . shown in Fig. there
being more redundancy at the centre of the field than at the
edges .Lmd shadow 'shields. 3 .7 cm thick. such that each detecto r
views the opposed bank through a rectangular hole, are used t o
'collimate' the device with the aim of improving the resolution .
Two such shadow shields (standard and high resolution) havin g
holes of sizes 2 .3 x 3 .8 cm and 1 .5 x 3 .3 cm respectively, were tested .
Critical parameters and characteristics in the design of suc h
a system are :
a) The angular sampling of the space to be reconstructed .
b) The sensitivity and correspondingly . the scan time.
c) The true to random count rate ratio .
d) The method used for attenuation correction .
e) The resolution perpendicular to the plane reconstructe d(and 'cross talk' along that axis) .
The large number of coincidence lines in this device improve sthe sensitivity and enables relatively short scan times. . coincidenc e
time window of the order of 20 ns gives a random to true rati o
of about 2% for count rates of 1 Kcps typically encountered wit h
clinical scans . Attenuation correction may be performed by us e
of an external ring source tilled with "Ge to obtain a transmissio n
;mage being a map of the measured attenuation coefficients .
Electronically . as shown in Fig . 3, the scanner is linked t o
a computer (a DEC PDP11!45) by means of a CAMAC interface .
The signals from the photomultipliers are amplified and passe dthrough an energy discriminator with a lower threshold se: a tapproximately 100 keV . Coincidences for all legitimate detecto rpairs are recorded. stored in CAMAC memory and. at the end
of each positional sample. transferred to the computer for process-ing . Stepping motors controlled by the computer are used fo rall scan movements. The sorting of the data from the fan beamgeometry to give regular projections is performed during the datacollection itself.The data are also normalised with respect to th evariations in sampling geometry and detector sensitivity . and store don disk for reconstruction at some future stage. ne compute rsystem and its software is in the process of development and exten-
tion, and will not be discussed here . The images are obtaine dby filtered backprojection after attenuation correction. Regionsof interest may be defined and manipulated to obtain count ratescm = Images are displayed on a colour monitor driven by a RAM -
TEK system. Though images presented here are in grey scale.
a heated object spectrum colour scale is also available . The syste mhas various other options . for example that of performing rectilin-ear scans . gated tomographic slices. etc . . which are not of direc trelevance in the analysis that follows .
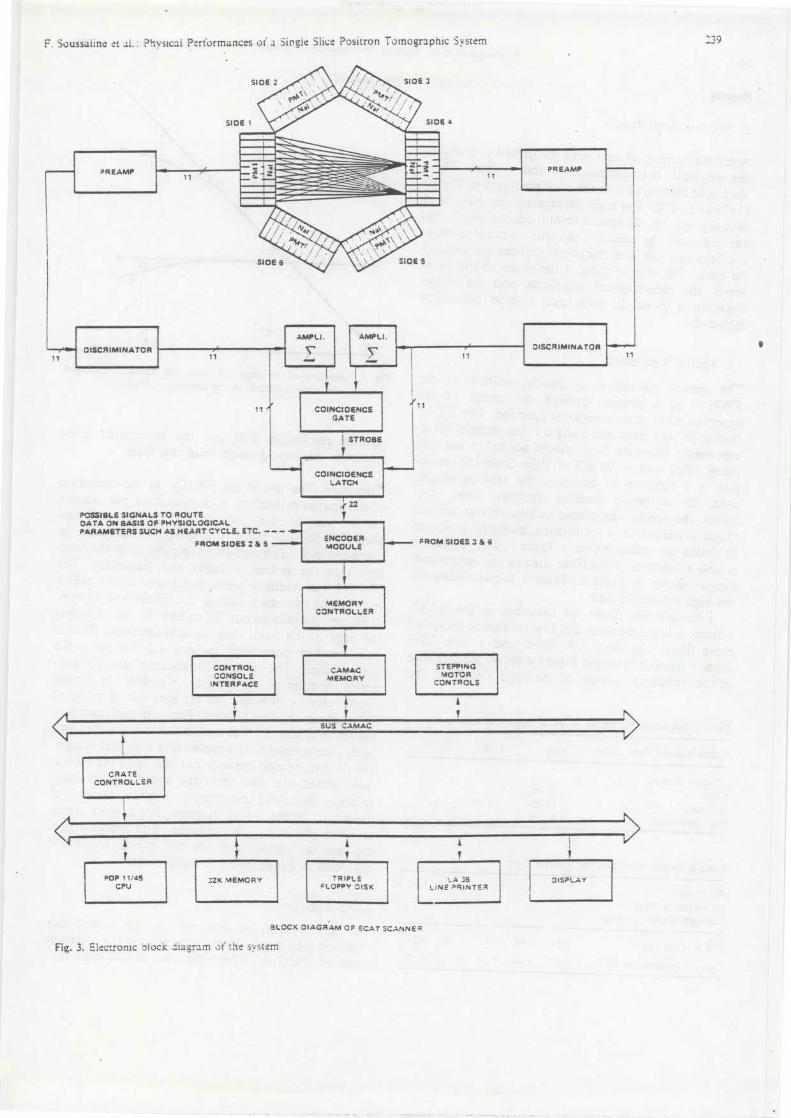
F . Soussaline et al . : Physical Performances of a Single Slice Positron Tomographic System
:3 9
SIOE 2
i ;
S10E 3
SIDE 4SLOE 1
PREAMP 11PREAM P
SIOE 6
DISCRIMINATOR11
AMPLI .
VAMPLI .
11DISCRIMINATOR
r
r
COINCIDENCEGAT E
STROBE
tCOINCIDENCE
LATCH
POSSIBLE SIGNALS TO ROUT EDATA ON BASIS OF PHYSIOLOGICA LPARAMETERS SUCH AS HEART CYCLE . ETC . -- - -e.
FROM SIOES 2 & 5 _,,"
CONTRO LCONSOL E
INTERFACE
k22
ENCODE RMODULE
MEMOR YCONTROLLE R
CAMA CMEMORY
FROM Si0ES3 & 6
STEPPIN GMOTO R
CONTROL S
A
r r3US CAMAC
CRAT ECONTROLLER
32K MEMORY
rTRIPL E
FLOPPY DISK
r
DISPLA Y.A 3 6LINE PRINTE R
i
POP 11/4 5CPU
3LOCK DIAGRAM OF ECAT SCANNE R
Fig . 3 . Electronic block diagram of the system
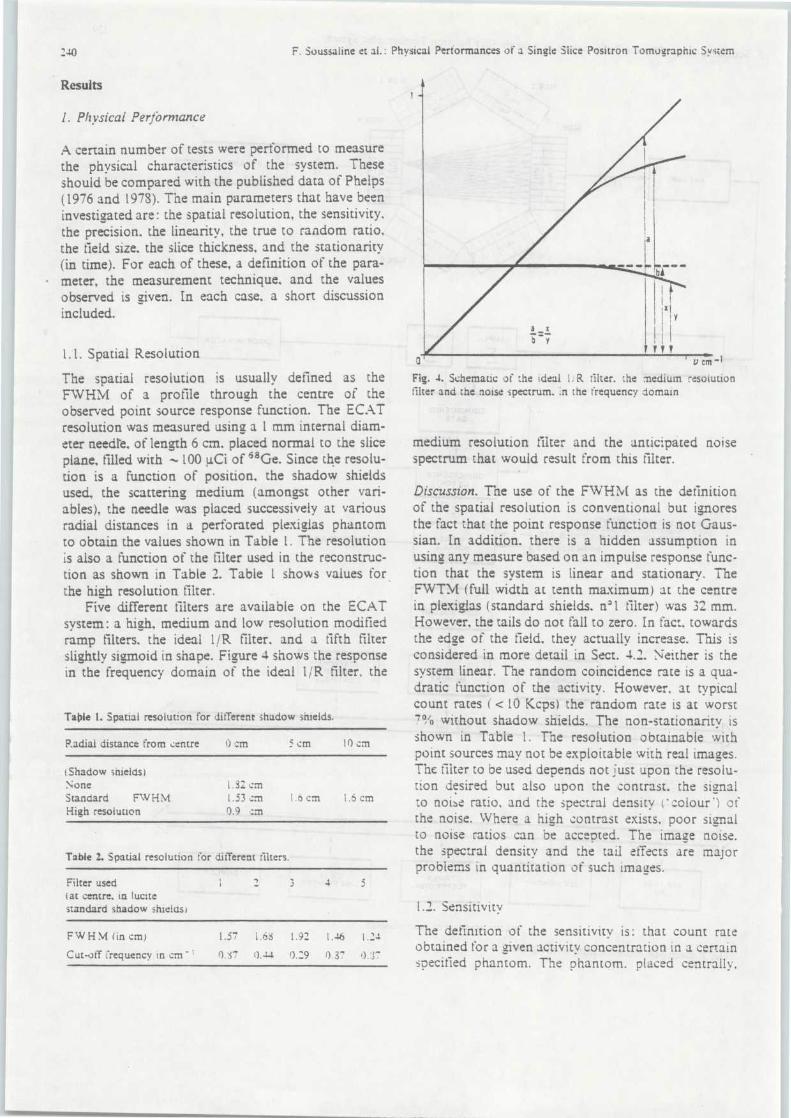
F. Soussaline et al . : Physical Performances of a Single Slice Positron Tomographic System
1 J
240
Results
1 . Physical Performanc e
A certain number of tests were performed to measur e
the physical characteristics of the system . Theseshould be compared with the published data of Phelp s
(1976 and 1978). The main parameters that have beeninvestigated are : the spatial resolution, the sensitivity ,
the precision . the linearity, the true to random ratio .the field size. the slice thickness, and the stationarit y
(in time) . For each of these, a definition of the para -meter, the measurement technique . and the values
observed is given . In each case, a short discussio n
included .
1 .1 . Spatial Resolutio n
The spatial resolution is usually defined as theFWHM of a profile through the centre of theobserved point source response function . The ECATresolution was measured using a l mm internal diam-eter needle, of length 6 cm. placed normal to the slic eplane, filled with -100 uCi of 68Ge. Since the resolu-tion is a function of position. the shadow shield sused, the scattering medium (amongst other vari-ables), the needle was placed successively at variou sradial distances in a perforated plexiglas phantomto obtain the values shown in Table 1 . The resolutionis also a function of the filter used in the reconstruc-tion as shown in Table 2. Table 1 shows values fo r
the high resolution filter .Five different filters are available on the ECA T
system : a high, medium and low resolution modifie dramp filters . the ideal 1/R filter . and a fifth filte rslightly sigmoid in shape . Figure 4 shows the responsein the frequency domain of the ideal l/R filter, the
Taxie 1 . Spatial resolution for ditTerent shadow shields.
Radial distance from centre 00 cm 5 cm 10 cm
(Shadow 3hieids )one 1 .32 c m
Standard
FWHM 1 .53 cm 1 .6 cm 1 .6 c mHigh resolution 0 .9
cm
Table Z. Spatial resolution for different filters .
Filter used ' 3 4 5(at centre, in lucit estandard shadow shields )
FW H M (in cm) 1 .57 1 .68 1 .92 1 .46 1 .2-tCut-off frequency in cm' 0 .s7 0 .-i4 0 .29 0 .37 1) .3 '
medium resolution filter and the anticipated nois espectrum that would result from this filter .
Discussion . The use of the FWHM as the definitio nof the spatial resolution is conventional but ignore sthe fact that the point response function is not Gaus-sian. In addition. there is a hidden assumption i nusing any measure based on an impulse response func -tion that the system is linear and stationary . TheFWTM (full width at tenth maximum) at the centr ein plexiglas (standard shields . n'l filter) was 32 mm .However, the tails do not fall to zero . In fact, towardsthe edge of the field, they actually increase. This isconsidered in more detail in Sect . 4 .2. Neither is th esystem linear . The random coincidence rate is a qua-dratic function of the activity. However, at typica lcount rates ( < 10 Kcps) the random rate is at wors t7° ô without shadow shields . The non-stationarity i sshown in Table 1 . The resolution obtainable wit hpoint sources may not be exploitable with real images .The filter to be used depends not just upon the resolu-tion desired but also u pon the contrast . the si gna lupon
yto noise ratio, and the spectral density ('colour') o fthe noise. Where a high contrast exists, poor signa lto noise ratios can be accepted. The image noise .the spectral density and the tail effects are majorproblems in quantitation of such images .
1 .2 . Sensitivity
The definition of the sensitivity is : that count rateobtained for a given activity concentration in a certai nspecified phantom . The phantom. placed centrally .
lx '
11fi0
u cm - 1
Fig. 4. Schematic of the ideal 1 ; R filter . the medium resoiutio nfilter and the noise spectrum . in the frequency domai n
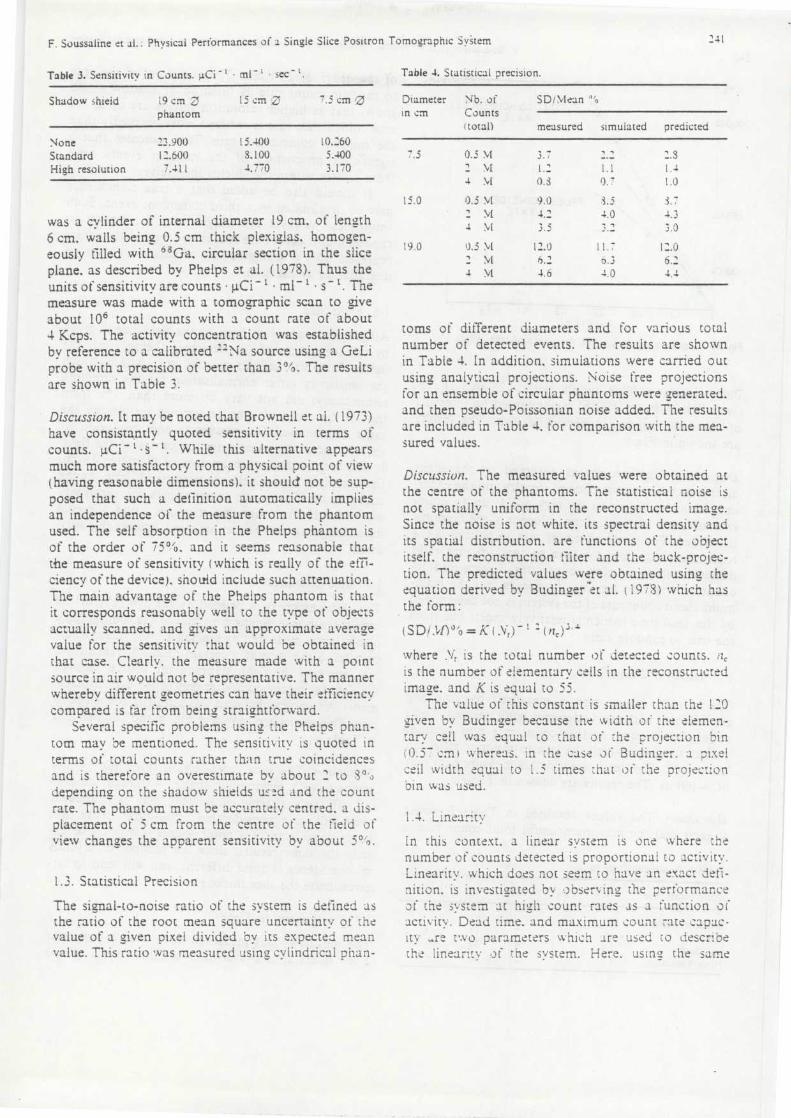
F . Soussaline et al . : Physical Performances of a Single Slice Positron Tomographic Sy s- tern
24 1
Table 3 . Sensitivity in Counts . uCi - ` • ml " ` • sec' .
Shadow shield
19 cm 23
15 cm 0
7 .5 cm 0phanto m
None
:1900
15 .400
10 .26 0
Standard
12 .600
3,100
5 .400
High resolution
7 .411
4 .770
3 .17 0
was a cylinder of internal diameter 19 cm, of lengt h6 cm. walls being 0 .5 cm thick plexiglas, homogen-eously filled with 68Ga, circular section in the slic eplane, as described by Phelps et al . (1978) . Thus theunits of sensitivity are counts • µCi - i • ml" ' • s' t . Themeasure was made with a tomographic scan to giv eabout 10 6 total counts with a count rate of abou t4 Kcps. The activity concentration was establishe dby reference to a calibrated "Na source using a GeL iprobe with a precision of better than 3% . The result sare shown in Table 3 .
Discussion . It may be noted that Brownell et al . (1973)have consistently quoted sensitivity in terms ofcounts . uCi' t • s" I . While this alternative appear smuch more satisfactory from a physical point of vie w(having reasonable dimensions) . it should not be sup-posed that such a definition automatically impliesan independence of the measure from the phanto mused. The self absorption in the Phelps phantom i sof the order of 75%, and it seems reasonable tha tthe measure of sensitivity (which is really of the eii-ciency of the device) . should include such attenuation .The main advantage of the Phelps phantom is tha tit corresponds reasonably well to the type of object sactually scanned, and gives an approximate averagevalue for the sensitivity that would be obtained i nthat case . Clearly . the measure made with a poin tsource in air would not be representative . The manne rwhereby different geometries can have their efficienc y
I
V
compared is far from being straightforward .Several specific problems using the Phelps phan-
tom may be mentioned. The sensitivity is quoted i nterms of total counts rather than true coincidence sand is therefore an overestimate by about 2 to 3 ° ' )depending on the shadow shields u :._d and the countrate. The phantom must be accurately centred, a dis -placement of 5 cm from the centre of the field o fview changes the apparent sensitivity by about 5% .
1 .3 . Statistical Precisio n
The signal-to-noise ratio of the system is defined a sthe ratio of the root mean square uncertainty of th evalue of a given pixel divided by its expected mea nvalue . This ratio was measured using cylindrical phan -
Table 4. Statistical precision .
Diameter
Nb . of
SD/Mea n
in cm
Count s
(total)
measured
simulated
predicted
7 ..
0 .5 M
3 .7
~ . 8
2
M
1 .2
1 .1
1 . 4
4 M
0 .3
O .7
1 . 0
15 .0
0 .5 M
9 .0
3 .5
3 . 7
M
4 .2
4 .0
4 . 3
4 M
3 .5
3 .2
3 . 0
19 .0
0 .5 M
12.0
11 .7
12 . 0
2 M
6 .2
6 .3
6 . 2
4 M
4 .6
4.0
4 . 4
toms of different diameters and for various tota lnumber of detected events . The results are shownin Table 4. In addition, simulations were carried ou tusing analytical projections . Noise free projection sfor an ensemble of circular phantoms were generated .and then pseudo-Poissonian noise added . The result sare included in Table 4 . for comparison with the mea-sured values .
Discussion . The measured values were obtained a tthe centre of the phantoms . The statistical noise isnot spatially uniform in the reconstructed image .Since the noise is not white . its spectral density an dits spatial distribution . are functions of the objec titself. the reconstruction filter and the back-projec-tion. The predicted values were obtained using theequation derived by Budinger et al . 1978) which hasthe Corm :
(SD/ .'fl =K ( .y"O' :(nc) ;, l
where V is the total number of detected counts . a cis the number of elementary cells in the reconstructe dimage. and K is equal to 55 .
The value of this constant is smaller than the 12 0given by Budinger because the width of the elemen-tary cell was equal to that of the projection bi n(0.57 cm) whereas . in the case of Budinger. a pixelceil width equal to 1 .5 times that of the projectio nbin was used .
1 .4 . Linearity
In this context . a linear system is one where th enumber of counts detected is proportional to activity .Linearity . which does not seem to have an exact defi-nition. is investigated by observing the performanceof the system at high count rates as a function o factivity . Dead time . and maximum count rate capac-ity gare two parameters which are used co describethe linearity of the system . Here. using the same
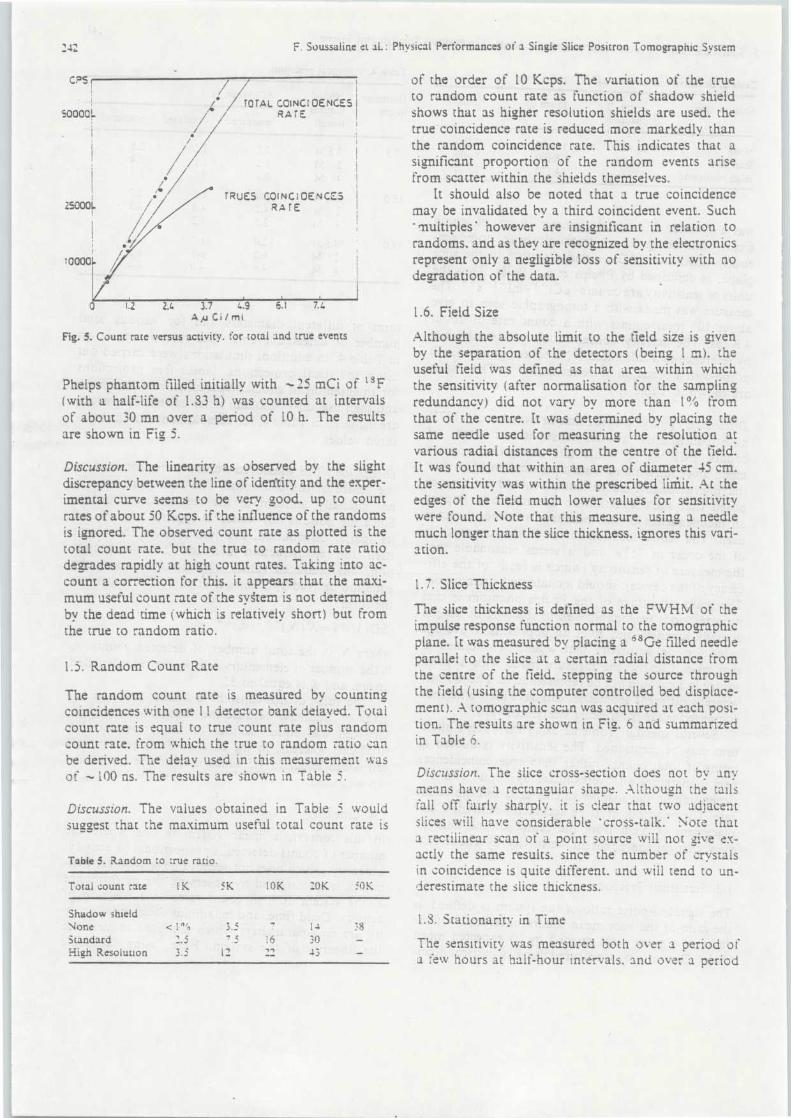
F. Soussaline et al . : Physical Performances of a Single Slice Positron Tomographic System4
CP S
eo0oo !
t
i
25000
i
0
1 .2
2.1
3 .7
1. . 9A,u Ci / m t
Fig, 5 . Count rate versus activity . for total and true event s
Phelps phantom tilled initially with 25 mCi of ` s F(with a half-life of 1 .33 h) was counted at intervalsof about 30 mn over a period of 10 h . The resultsare shown in Fig 5.
Discussion . The linearity as observed by the sligh tdiscrepancy between the line of identity and the exper-imental curve seems to be very good, up to coun trates of about 50 Kcps . if the influence of the randomsis ignored. The observed count rate as plotted is th etotal count rate . but the true to random rate ratiodegrades rapidly at high count rates . Taking into ac-count a correction for this . it appears that the maxi -mum useful count gate of the system is not determine d.by the dead time (. which is relatively short) but fro mthe true to random ratio .
1 .5 . Random Count Rate
The random count rate is measured by countingcoincidences with one 11 detector bank delayed . Tota lcount rate is equal to true count rate plus rando mcount rate, from which the true to random ratio ca nbe derived. The delay used in this measurement wa sof --100 ns . The results are shown in Table 5 .
Discussion . The values obtained in Table 5 woul dsuggest that the maximum useful total count rate i s
Table 5 . Random to true ratio .
Total count rate 1K 5K 10K 20K :O K
Shadow shiel dMone
< 1", 3 .5 14 : 8Standard 3.3 ,c 16 3 0High Resolution 3 .5 l? 22 43
of the order of 10 Kcps . The variation of the trueto random count rate as function of shadow shiel dshows that as higher resolution shields are used, thetrue coincidence rate is reduced more markedly tha nthe random coincidence rate. This indicates that asignificant proportion of the random events aris efrom scatter within the shields themselves .
It should also be noted that a true coincidenc emay be invalidated by a third coincident event. Such'multiples' however are insignificant in relation t orandoms . and as they are recognized by the electronic srepresent only a negligible loss of sensitivity with n odegradation of the data.v
1 .6 . Field Size
Although the absolute limit to the geld size is give nby the separation of the detectors (being l m) . theuseful Field was defined as that area within whic hthe sensitivity (after normalisation for the samplin gredundancy) did not vary by more than 1% fro mthat of the centre . It was determined by placing thesame needle used for measuring the resolution a tvarious radial distances from the centre of the field .It was found that within an area of diameter 45 cm.the sensitivity was within the prescribed limit . At theedges of the field much lower values for sensitivitywere found. Vote that this measure, using a needl emuch longer than the slice thickness . ignores this vari-ation .
1
Slice Thickness
The slice thickness is defined as the FwH : t of theimpulse response function normal to the tomographi cplane . It was measured by placing a "Ge filled needl eparallel to the slice at a certain radial distance fro mthe centre of the field, stepping the source throug hthe field (using the computer controlled bed displace -ment) . A tomographic scan was acquired at each posi-tion . The results are shown in Fig . 6 and summarize din Table 6 .
Discussion . The slice cross-section does not by anymeans have a rectangular shape . _Although the tail sfall off fairly sharply . it is clear that two adjacen tslices will have considerable 'cross-talk .' Note tha ta rectilinear scan of a point source will not give ex-actly the same results . since the number of crystal sin coincidence is quite different . and will tend to un-derestimate the slice thickness .
1 .3 . Stationarity in Time
The sensitivity was measured both over a period o fa few hours at half-hour intervals . and over a period
TRuES COINCIOENCE SRAT E
TOTAL COINCIDENCES IRAT E
0000
f t6 .1
7. 4
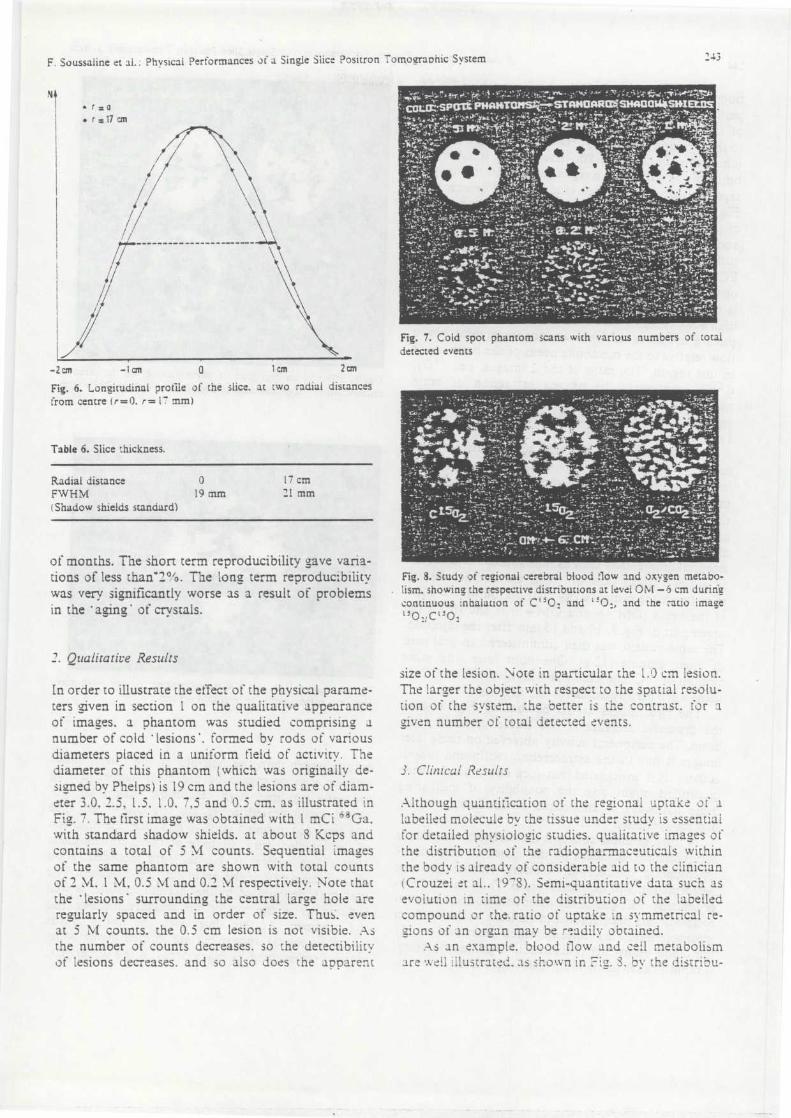
F . Soussaline et al . : Physical Performances of a Single Slice Positron Tomoeraohic System
243
Fig. 7. Cold spot phantom scans with various numbers of tota l
detected event s
• r
. r 11 cm
-2cm
_1cm
0
1cm
2cm
Fig . 6. Longitudinal profile of the slice. at two radial distances
from centre (r=0. r= 17 mm )
Table 6 . Slice thickness.
Radial distance 0 17 c m
FWHM 19 mm 221 m m
(Shadow shields standard)
of months . The short term reproducibility gave varia -tions of less than'2 °'o . The long term reproducibilit ywas very significantly worse as a result of problem sin the 'aging' of crystals .
Fig. S. Study of regional cerebral blood ;low and oxygen metabo -
, lism, showing the respective distributions at level OM -6 cm duringcontinuous inhalation of C' 5 0 2 and `'O ., and the ratio image
'5o2IC`502
-
-
2. Qualitative Results
In order to illustrate the effect of the physical parame -ters given in section 1 on the qualitative appearanc eof images, a phantom was studied comprising anumber of cold 'lesions', formed by rods of variou sdiameters placed in a uniform field of activity . Thediameter of this phantom (which was originally de -signed by Phelps) is 19 cm and the lesions are of diam -eter 3 .0, 2 .5, 1 .5, 1 .0, 7,5 and 0.5 cm, as illustrated i nFig . 7 . The first image was obtained with 1 mCi o"Ga ,with standard shadow shields . at about 8 Kcps an dcontains a total of 5 M counts . Sequential image sof the same phantom are shown with total count sof 2 M. I M, 0 .5 M and 0 .2 M respectively . Note tha tthe 'lesions' surrounding the central large hole ar eregularly spaced and in order of size. Thus' . evenat 5 M counts. the 0 .5 cm lesion is not visibie . As
the number of counts decreases . so the detectibiiit yof lesions decreases . and so also does the apparent
size of the lesion . Note in particular the 1 .0 cm lesion .The larger the object with respect to the spatial resolu-tion of the system, the better is the contrast . for agiven number of total detected events .
3 . Clinical Result s
Although quantification of the regional uptake of alabelled molecule by the tissue under study is essentia lfor detailed physiologic studies . qualitative images o fthe distribution of the radiopharmaceuticals withi nthe body is already of considerable aid to the clinicia n(Crouzel et al . . l9^8) . Semi-quantitative data such a sevolution in time of the distribution of the labelle dcompound or the, ratio of uptake in symmetrical re-gions of an organ may be readily obtained .
As an example. blood flow and cell metabolismare % veil illustrated . as shown in Fig . S . by the distribu-
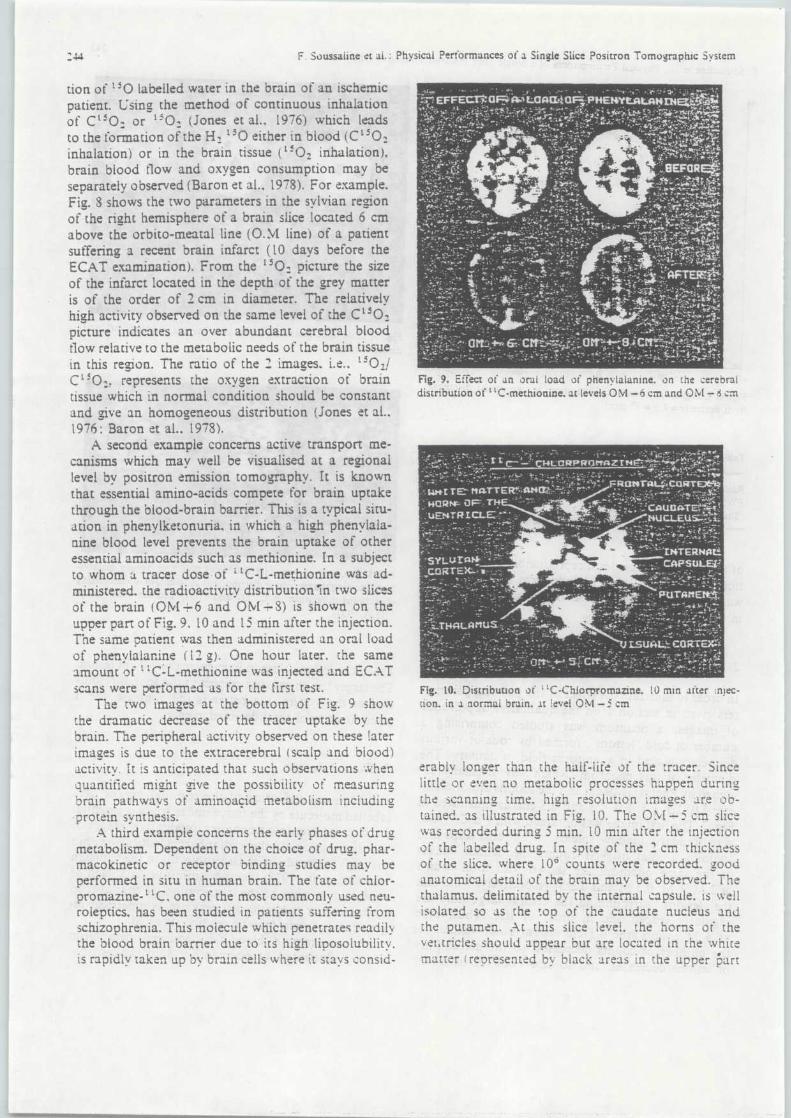
:44
F . Soussaline et ai . : Physical Performances of a Single Slice Positron Tomo graphic System
tion of 150 labelled water in the brain of an ischemi cpatient. Using the method of continuous inhalation
of C 1 5 0î or l '0î (Jones et al . . 1976) which leadsto the formation of the Hz 15 0 either in blood (C 150 2inhalation) or in the brain tissue ( 15 02 inhalation) ,brain blood flow and oxygen consumption may b eseparately observed (Baron et al ., 1978) . For example.
Fig. 8 shows the two parameters in the sylvian regio nof the right hemisphere of a brain slice located 6 cmabove the orbito-meatal line (O . M line) of a patien tsuffering a recent brain infarct (10 days before theECAT examination) . From the l50î picture the sizeof the infarct located in the depth of the grey matte ris of the order of 2 cm in diameter . The relativel yhigh activity observed on the same level of the C150 2
picture indicates an over abundant cerebral bloodflow relative to the metabolic needs of the brain tissuein this region. The ratio of the 2 images . i .e ., 1 5 O 2 1C 15 0 : . represents the oxygen extraction of braintissue which in normal condition should be constan tand give an homogeneous distribution (Jones et al . ,1976 : Baron et al . . 1978) .
A second example concerns active transport me-canisms which may well be visualised at a regionallevel by positron emission tomography . It is knownthat essential amino-acids compete for brain uptak ethrough the blood-brain barrier . This is a typical situ-ation in phenylketonuria . in which a high phenylala-nine blood level prevents the brain uptake of othe ressential aminoacids such as methionine. In a subjectto whom a tracer dose of i 1 C-L-methionine was ad-ministered. the radioactivity distribution in two slice sof the brain (OM +6 and ONI 8) is shown on theupper part of Fig . 9 . 10 and 15 min after the injection .The same patient was then administered an oral loadof phenylalanine (12 g) . One hour later . the sam eamount of 1 : C-L-methionine was infected and ECA Tscans were performed as for the first test .
The two images at the bottom of Fig. 9 sho wthe dramatic decrease of the tracer uptake by thebrain . The peripheral activity observed on these late rimages is due to the extracerebral (scalp and blood )activity . It is anticipated that such observations whe nquantified might give the possibility of measurin gbrain pathways of aminoaçid metabolism inciudingprotein synthesis .
A third example concerns the early phases of dru gmetabolism. Dependent on the choice of drug. phar-macokinetic or receptor binding studies may b eperformed in situ in human brain . The rate of chlor-promazine-"C, one of the most commonly used neu-roleptics, has been studied in patients suffering fromschizophrenia . This molecule which penetrates readil ythe blood brain barrier due to its high liposolubility .is rapidly taken up by brain cells where it stays consid -
Fig. 9 . Effect of an oral load of phenylalanine. on the cerebra l
distribution of `C-methionine. at levels 0M —.6 cm and 0M — s ca ,
Fig . 10 . Distribution of "C-Chlorpromazine. 10 min alter injec-
tion. in a normal brain . lc level 0M -5 cm
erably longer than the half-life of the tracer . Since
little or even no metabolic processes happe :1 durin g
the scanning time. high resolution images are ob-
tained . as illustrated in Fig . 10. The 01MI 5 cm slic e
was recorded during 5 min. 10 min after the injectio n
of the labelled drug . In spite of the ? cm thickness
of the slice . where 10° counts were recorded . good
anatomical detail of the brain may be observed. The
thalamus. delimitated by the internal capsule . is wel l
isolated so as the top of the caudate nucleus an d
the putamen. At this slice level . the horns of the
vei,tricles should appear but are located in the whit e
matter (represented by black areas in the upper part
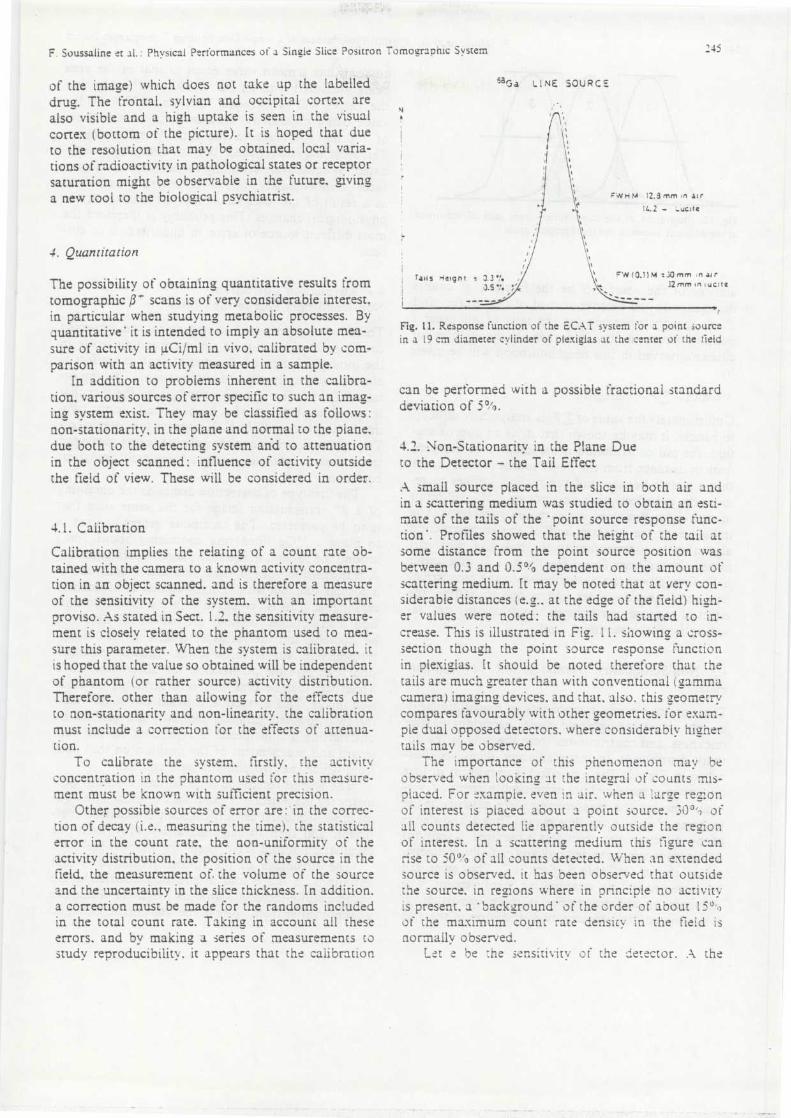
24 5F. Soussaline et al . : Physical Performances of a Single Slice Positron Tomographic Syste m
of the image) which does not take up the labelle d
drug. The frontal. sylvian and occipital cortex arealso visible and a high uptake is seen in the visual
~+
cortex (bottom of the picture) . It is hoped that dueto the resolution that may be obtained, local varia -tions of radioactivity in pathological states or recepto rsaturation might be observable in the future, givin ga new tool to the biological psychiatrist .
sa Ga LINE SOURCE
FWP4M 12 .3 mm n ri ai r
14.2 — ,.ucit e
4 . Quantitatio n
The possibility of obtaining quantitative results fro mtomographic jr scans is of very considerable interest .in particular when studying metabolic processes . Byquantitative' it is intended to imply an absolute mea -sure of activity in .tCi/ml in vivo, calibrated by com-parison with an activity measured in a sample .
In addition to problems inherent in the calibra -tion, various sources of error specific to such an imag-ing system exist . They may be classified as follows :non-stationarity, in the plane and normal to the plane .due both to the detecting system and to attenuationin the object scanned : influence of activity outsidethe field of view . These will be considered in order .
4 .1 . Calibratio n
Calibration implies the relating of a count rate ob-tained with the camera to a known activity concentra-tion in an object scanned. and is therefore a measureof the sensitivity of the system, with an importan tproviso . As stated in Sect . 1 .2, the sensitivity measure -ment is closely related to the phantom used to mea -sure this parameter . When the system is calibrated. i t
is hoped that the value so obtained will be independen tof phantom or rather source) activity distribution .Therefore. other than allowing for the effects du eto non-stationarity and non-linearity, the calibrationmust include a correction for the effects of attenua-tion .
To calibrate the system. firstly, the activityconcentration in the phantom used (or this measure -ment must be known with sufficient precision .
Other possible sources of error are : . in the correc -tion of decay (i .e ., measuring the time), the statistica lerror in the count rate, the non-uniformity of theactivity distribution, the position of the source in th efield. the measurement of. the volume of the sourceand the uncertainty in the slice thickness . In addition .a correction must be made for the randoms include din the total count rate . Taking in account all thes eerrors, and by making a series of measurements t ostudy reproducibility . it appears that the calibration
.'W (0 .1)M : .iomm nai r32mm i n,ucit e
D
Fig . 11 . Response function of the ECAT system for a point sourc e
in a 19 cm diameter cylinder of plexi g las at the center of the fiel d
can be performed with a possible fractional standar ddeviation of 5°' .
4 .2 . Non-Stationarity in the Plane Du eto the Detector – the Tail EtTect
A small source placed in the slice in both air an din a scattering medium was studied to obtain an esti-mate of the tails of the 'point source response func-tion' . Profiles showed that the height of the tail a tsome distance from the point source position wa sbetween 0 .3 and 0 .5% ô dependent on the amount o fscattering medium. It may be noted that at very con-siderable distances (e.g., at the edge of the field) high -er values were noted : the tails had started to in -crease . This is illustrated in Fig . 11 . showing a cross-section
showin gsection though the point source response functio nin plexiglas . It should be noted therefore that th etails are much greater than with conventional (gammacamera) imaging devices, and that, also . this geometrycompares favourably with other geometries, for exam -pie dual opposed detectors, where considerably highe rtails may be observed .
The importance of this phenomenon may b eobserved when looking at the integral of counts mis -placed. For example, even in air . when a large regio nof interest is placed about a point source . 30 0 '1 ofall counts detected lie apparently outside the regio nof interest . In a scattering medium this fca nscattering
figurerise to 50'o of all counts detected . When an extendedsource is observed. it has been observed that outsidethe source . in regions where in principle no activit yis present, a 'background' of the order of about 15''i )of the maximum count rate density in the field i snormally observed .
Let e be trie sensitivity of the detector . A the
Tails Height : J.3" ..J.s ".
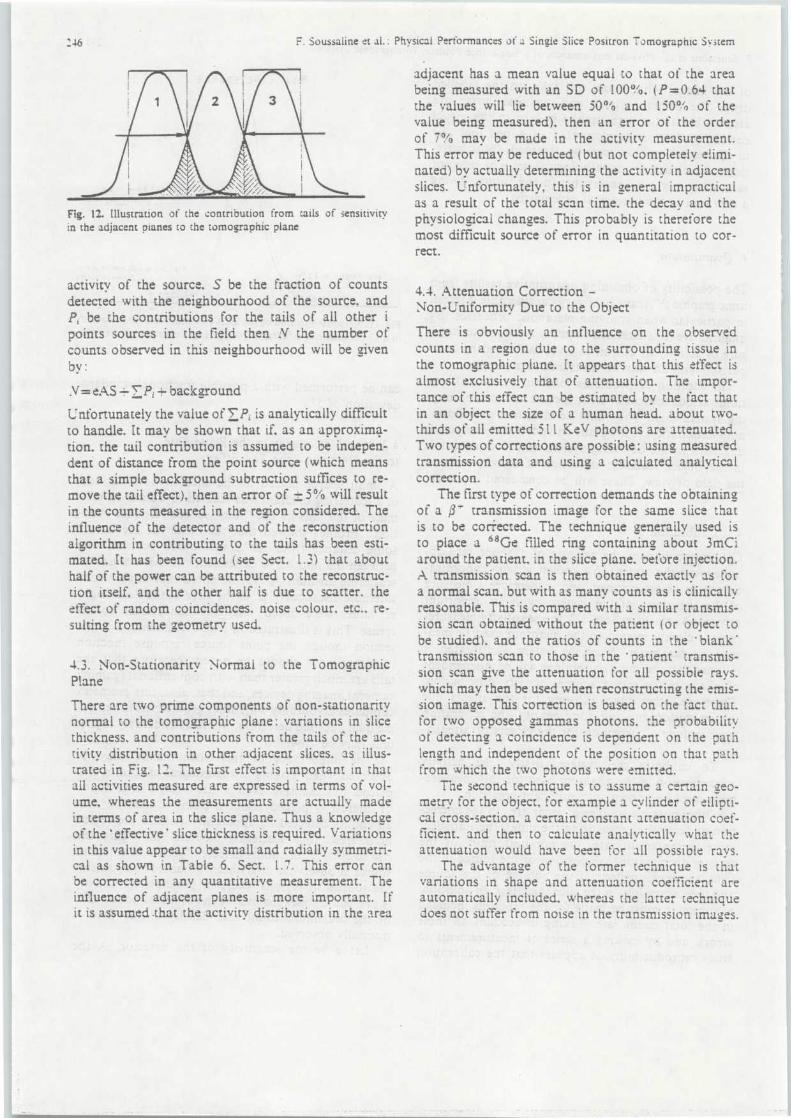
46
F . Soussaline et al . : Physical Performances of a Single Slice Positron Tomographic Syste m
Fig . 12 . Illustration of the contribution from tails of sensitivit y
in the adjacent dianes to the tomographic plan e
activity of the source, S be the fraction of countsdetected with the neighbourhood of the source, an dP i be the contributions for the tails of all other ipoints sources in the field then N the number o fcounts observed in this neighbourhood will be givenby :
.V=eAS ~ çPi + background
Unfortunately the value of SP1 is analytically difficul tto handle. It may be shown that if, as an approxima-tion. the tail contribution is assumed to be indepen-dent of distance from the point source (which mean sthat a simple background subtraction suffices to re -move the tail effect), then an error of _ 5% will resul tin the counts measured in the region considered. Theinfluence of the detector and of the reconstructio nalgorithm in contributing to the tails has been esti-mated. It has been found (see Sect . 1 .3) that abouthalf of the power can be attributed to the reconstruc-tion itself, and the other half is due to scatter, th eeffect of random coincidences. noise colour. etc . . re-sulting from the geometry used .
4 .3 . Non-Stationarity Normal to the TomographicPlane
There are two prime components of non-stationarit ynormal to the tomographic plane : variations in slic ethickness . and contributions from the tails of the ac-tivity distribution in other adjacent slices. as illus-trated in Fig . 12. The first effect is important in thatall activities measured are expressed in terms of vol-ume, whereas the measurements are actually madein terms of area in the slice plane . Thus a knowledgeof the `effective' slice thickness is required . Variation sin this value appear to be small and radially symmetri-cal as shown in Table 6, Sect . 1 .7. This error canbe corrected in any quantitative measurement . Theinfluence of adjacent planes is more important . I fit is assumed .that the activity distribution in the area
adjacent has a mean value equal to that of the are abeing measured with an SD of 100%, (P=0 .64 tha tthe values will lie between 50% and 150% of thevalue being measured), then an error of the orde rof 7% may be made in the activity measurement .This error may be reduced (but not completely elimi-nated) by actually determining the activity in adjacen tslices . Unfortunately, this is in general impractica las a result of the total scan time, the decay and th ephysiological changes . This probably is therefore th emost difficult source of error in quantitation to cor -rect .
4 .4 . Attenuation Correction —Non-Uniformity Due to the Objec t
There is obviously an influence on the observe dcounts in a region due to the surrounding tissue i nthe tomographic plane. It appears that this effect i salmost exclusively that of attenuation. The impor-tance of this effect can be estimated by the fact tha ta
in an object the size of a human head . about two-thirds of all emitted 511 Kev photons are attenuated .Two types of corrections are possible : using measuredtransmission data and using a calculated analytica lcorrection .
The first type of correction demands the obtainin gof a /3 * transmission image for the same slice tha tis to be corrected . The technique generaily used i sto place a 68Ge tilled ring containing about 3mC iaround the patient, in the slice plane . before injection .A transmission scan is then obtained exactly as fo ra normal scan, but with as many counts as is clinicall yreasonable. This is compared with a similar transmis-sion scan obtained without the patient (or object t obe studied) . and the ratios of counts in the ° blank 'transmission scan to those in the 'patient' transmis-sion scan give the attenuation for all possible rays .which may then be used when reconstructin g the emis-sio n sion im age. This correction is based on the fact that .for two opposed gammas photons, the probabilit yof detecting a coincidence is dependent on the pat hlength and independent of the position on that pat hfrom which the two photons were emitted .
The second technique is to assume a certain geo -metry for the object, for example a cylinder of ellipti -cal cross-section, a certain constant attenuation coef -ficient . and then to calculate analytically what th eattenuation would have been for all possible rays .
The advantage of the former technique is tha tvariations in shape and attenuation coefficient areautomatically included . whereas the latter techniquedoes not suffer from noise in the transmission ima ges .
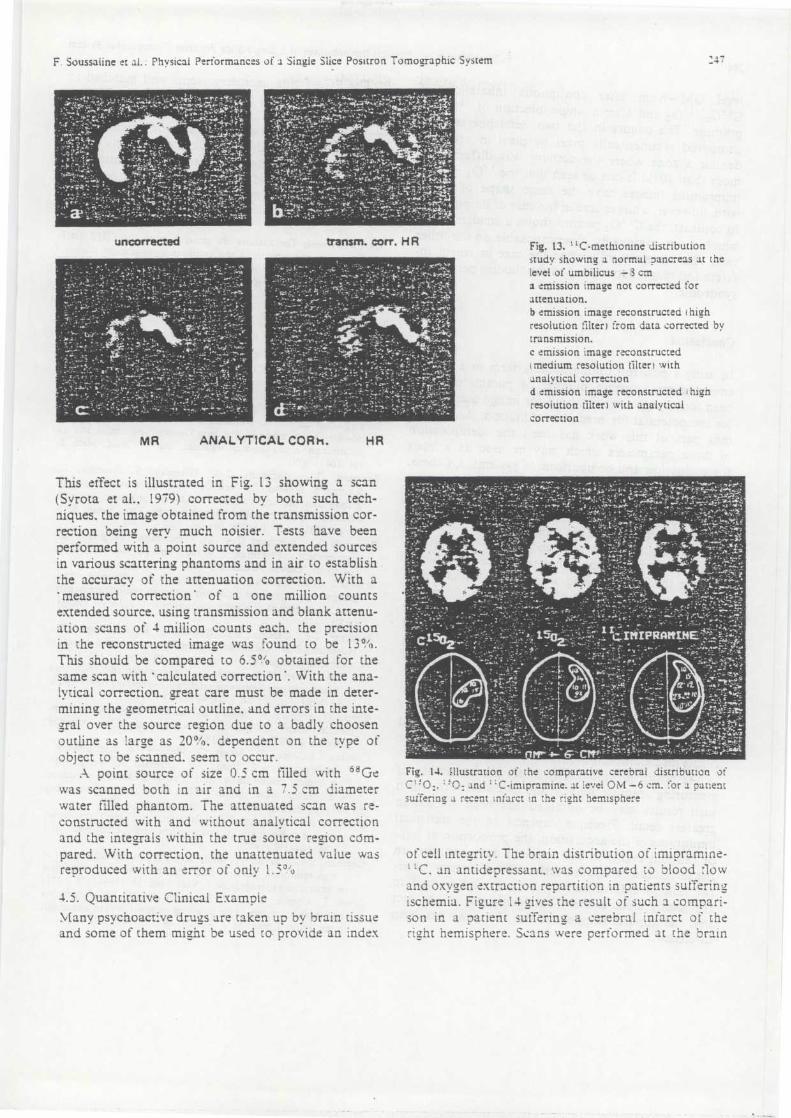
_4 'F . Soussaline et al . : Physical Performances of a Single Slice Positron Tomographic System
uncorrected transm . corr . H R
ANALYTICAL CORK .
Fig. 13 . "C-methionine distributio n
study showing a normal pancreas at th e
level of umbilicus
cm
a emission image not corrected fo r
attenuation.
b emission image reconstructed (high
resolution filter) from data corrected b y
transmission .
c emission image reconstructed
(medium resolution filter) wit h
analytical correctio n
d emission image reconstructed t hig h
resolution filter) with analytica l
correctio n
MR HR
This effect is illustrated in Fig . 13 showing a scan(Syrota et al ., 1979) corrected by both such tech-niques. the image obtained from the transmission cor -rection being very much noisier . Tests have been
v
performed with a point source and extended sourcesin various scattering phantoms and in air to establis hthe accuracy of the attenuation correction . With a'measured correction' of a one million count sextended source, using transmission and blank attenu-ation scans of 4 million counts each . the precisionin the reconstructed ima ge was round to be 13% .V
This should be compared to 6 .5% â obtained for thesame scan with 'calculated correction' . With the ana-lytical correction . great care must be made in deter -mining
.,the geometrical outline, and errors in the inte -
gral over the source region due to a badly choose noutline as large as 20%, dependent on the type o fobject to be scanned . seem to occur .
A point source of size 0 .5 cm tilled with "Gewas scanned both in air and in a 7 .5 cm diameterwater Filled phantom . The attenuated scan was re -constructed with and without analytical correctio nand the inte grals within the true source re gion cdm -V
pared. With correction, the unattenuated value wa sreproduced with an error of only 1 .5 %
4.5. Quantitative Clinical Exampl e
Many psychoactive drugs are taken up by brain tissu eand some of them might be used to provide an index
Fig . 14 . Illustration of the comparative cerebral distribution of
C' ''0 and "C•imipramine . at le vel OM -6 cm. for a p atien t
suffering a recent infarct in the right hemispher e
of cell integrity . The brain distribution of imipramine -.` `C . an antidepressant, was compared to blood Clo wand oxygen extraction repartition in patients sufferin gischemia . Figure 14 Jives the result of such a compari-son in a patient suffering a cerebral infarct of th eright hemisphere . Scans were performed at the brain
.48
F . Soussaline et al. : Physical Performances of a Single Slice Positron Tomographic Syste m
level OM -;,-. 6 cm after continuous inhalation o f
C''02, "02 and after a single injection of "C-imi-pramine. The counts in the two hemispheres werecompared symmetrically pixel by pixel in 'order todelimit a zone where the activity was different b ymore than 10%. It can be seen that the ' 5 02 et "C-imipramine images have the same shape of defec twith, however, a larger area in the case of imipramine .
In contrast. the C''0 2 picture shows a smaller defec t
which is . not completely superimposable on the othe r
two. This observation is often the case in recent in-farcts and might correspond to the ' luxury perfusion '
syndrome .
Conclusio n
In using a positron tomographic system in a clinica lenvironment a certain number of parameters havebeen found to be critical, both for image quality andfor the potential for precise quantitation . An impor-tant part of this work has been the identificatio nof those parameters which may be used as a basi sfor evaluation and comparison of systems . Of these ,detection efficiency, contrast and statistical precisio nare clearly amongst the most important in practice .They can be measured comparatively easily . givenan agreed definition of the terms .
The sensitivity for a given type of Nal crysta ldepends on the number of coincidence lines which
traverse the object during a scan . The actual value
obtained (of the order of 12,500 cps - `•µCi - '•ml us-ing standard shadow shields and a 19 cm diamete r
us-ingsource) is reasonable and permits useful images t obe obtained with about one million counts in 2 mi nof scan time for an activity in the field of view o f1 uCilml .
The contrast obtained depends on the intrinsi cresolution of the acquisition which is a function o fthe sampling geometry, on the reconstruction methodand on the noise due to related random coincidenceevents and Compton events .
As positron tomography otTers the possibility o fmeasuring absolute . activity . the precision with whichsuch results may be obtained has been studied i ngreatest . detail . Precision depends on the statistica llimitations of the acquisition, the proportion of falseor random events in the acquired data and also o nthe technique of reconstruction . These sources of er-ror lead to tails of activity both in and normal t othe tomographic plane. The significance of the fac tthat the impulse response is not Gaussian has beendiscussed .
The ECAT ring geometry seems well matched t oour current objectives in clinical research. In its firs tyear of use, about 1 50 different studies have beenperformed yielding new informations on human meta-bolism and physiopathology . Detailed analysis of th eequilibrium "0 studies indicate that quantitative re-sults may be obtained with a precision of the orde rof 15% . and eventually of 10% ô if additional precau-tions are taken.
Acknowledgments The authors are grateful to all the SHFJ staff
members who participated in the emission tomographic studies .
with particular thanks to M . Crouzel . N. Duquesnoy . C . Sejourn é
and R . Knipper, for skilled technical assistance.
References
Baron . J .C. . Comar, D . . Bousser. M.G .. Soussaline. F . . Crouzel .
C . . Kellershohn . C . . Castaigne. P . : Etude tomographique chez
l'homme . du débit sanguin et de la consommation d'oxygene
du cerveau par inhalation continue d'oxygene 1 Rev . Neuro( .
(Paris) 134. 545–556 (1978 )
Berger, G . . Maziére. M . . Marazano . C . . Comar . D . : Carbon 1 1
labelling of the psychoactive drug 0-methyl-bufornine and its
distribution in the animal organism . Eur. J . Nucl . Med. 3 .
101–104. i 191 8 )
Brownell . G.L .. Burnham. C.A . . Wilensky, S . . Aronow. S . .
Kazemi . S .. Strieder. D . : New Developments in positron scinti-
graphy and the application of cyclotron produced positron
emitters. Medical radioisotope scintigraphy, Proc. Symp. Salz-
burg (1968) 1 . pp . 163–176 . Vienna : LAEA 196 8
Brownell . G .L . . Burnham. C .A . : In : Tomographic imaging in nu -
clear medicine. Friedman. G.S . (ed) . pp 154–164. New York :
Society of Nuclear Medicine 1973
Brownell . G.L . . Burnham . C.A . . Hoop . B.Jr .. : Positron scinti -
graphy with short-lived cyclotron produced radiopharmaceuti -
cals . In : Medical radioisotope scintigraphy . 1 .313–330 . Vienna :
LAEA 197 3
Budinger. T .F . . Derenzo . S .E .. Greenberg, W . . Guilbert . G .T . .
Huesman . R .H . : Quantitative potentials of dynamic emissio n
computed tomography. J . Nucl . Med . . 19 . 309–315 119 7S )
Cho . Z.H., Cohen . M .B . . Singh . M. : Performance and evaluatio n
of the circular ring transverse axial positron camera ; CRTAPC) .
IEEE Nucl. Sci . NS ?4.530-543 (19 7 7)
Comar . D . . Maziére . M . . Berger. G . . Mesteian . G . : Queiques exem-
pies de i'intérèt des molecules marquees au ` : C en recherch e
médicale. BEST 220. 19–26 (1976 )
Crouzel . C . . Comar . D . . Berger. G . . Maziére . M . . Soussaline. F . .
Todd-Pokropek, A .E . . Baron . J .C . . Guenard. cL . Verhas . M . .First clinical results using short lived radioisotopes produce d
by a medical cyclotron. In : VIII` t' Int . Conf. on Cyclotron s
and their medical applications. Bloomington : 19 7 8
Derenzo . S .E . . Budinger. T.F . . Camoon, 1 .L. : High resolutio n
computed tomography of positron emitters . IEEE Nuel . Sci .
NS 24 .544-358 (197 1 )
Derenzo . S .E . . Zaklad . H . . Budinger, T .F . : Analytical study o f
a high resolution positron ring detector system for transaxia l
reconstruction tomography . J . Nucl . Med . 16 . 1166–11 ,3 119 7 5 )
Jones . T . . Chester . D .A . . Ter-Pogossian . M.M . : The continuou s
inhalation of oxygen 15 for assessing regionai oxygen extractio n
in the brain of man . Br . J . Radiol . .49 . 339–343 (1976)
F . Soussaline et al . : Physical Performances of a Single Slice Positron Tomographic System
34 9
Lim. C.K., Chu. D . . Kaufman. L . : initiai charactenzation of a
multiwire proportional chamber ,positron camera. IEEE Nucl .
Sci . NS 22. 383—394 (1975 )
Muehllehner . G . . Buchin . N .P. . Dubek. G.H . : Performance para -
meters of the positron imaging camera. IEEE Nucl. Sci . NS
23 . 523—537 (1976 )
Phelps, M .E . . Hoffman . E .J . . Kuhl . D .E . : Physiologic tomogra-
phy : A new approach to in vivo measure of metabolism an d
physiological function . In : Medical radionuclide imaging; 1 ,
333—351 Vienna : IAEA 1977
Phelps. M.E . . Hoffman, E .J . . Mullani . N ., : Design and perfor-
mance characteristics of a whole body transaxial tomograph .
(PETT Ia) . IEEE Nucl . Sci . 23, 516—522 (1976 )
Phelps. M.E . . Hoffman. E .J ., Mullani, N . : Design and perfor-
mance characteristics of a whole body transaxial tomograph .
J . Nuci . Med . 17.493—503 (1976 )
Phelps . M.E . . Hoffman, E .J .. Huang, S .C., Kuhl, D .E . : ECA T
a new computerized tomographic imaging system for positron-
(1973
) positron-
emittin g radiopharmaceuticais . J . Nuel. Med. 19 . 635--64 7emittin g
Shepp . L .A . . Logan . B . F . : Some insights into the Fourier recon-
struction of a head section . IEEE Nucl . Sci . NS 21 . 31—4 3
(1974 )Syrota. A . . Comar . D . . Cerf. M . . Plummer. D . . Mazière . M . . Kcl-
lershohn. C . : "C-Methionine pancreatic scanning with posi-
tron emission computed tomography . J . Nucl . Med. in press )
(1979 )
Ter-Pogossian. M.M . . Phelps . M .E ., Brownell . G .L . : Reconstruc-
tion tomography in diagnostic radioiogy and nuclear medicine .
Baltimore : University Park Press 197 7
Ter-Pogossian. M.M., Phelps . M .E . . Hoffman, E .J . : A positro n
emission transaxial tomograph for nuclear medicine ima g in g
(PETT) . Radiology 114 . 39—98 11975 )
Received March 1 . 1979

PUBLICATION
XIV
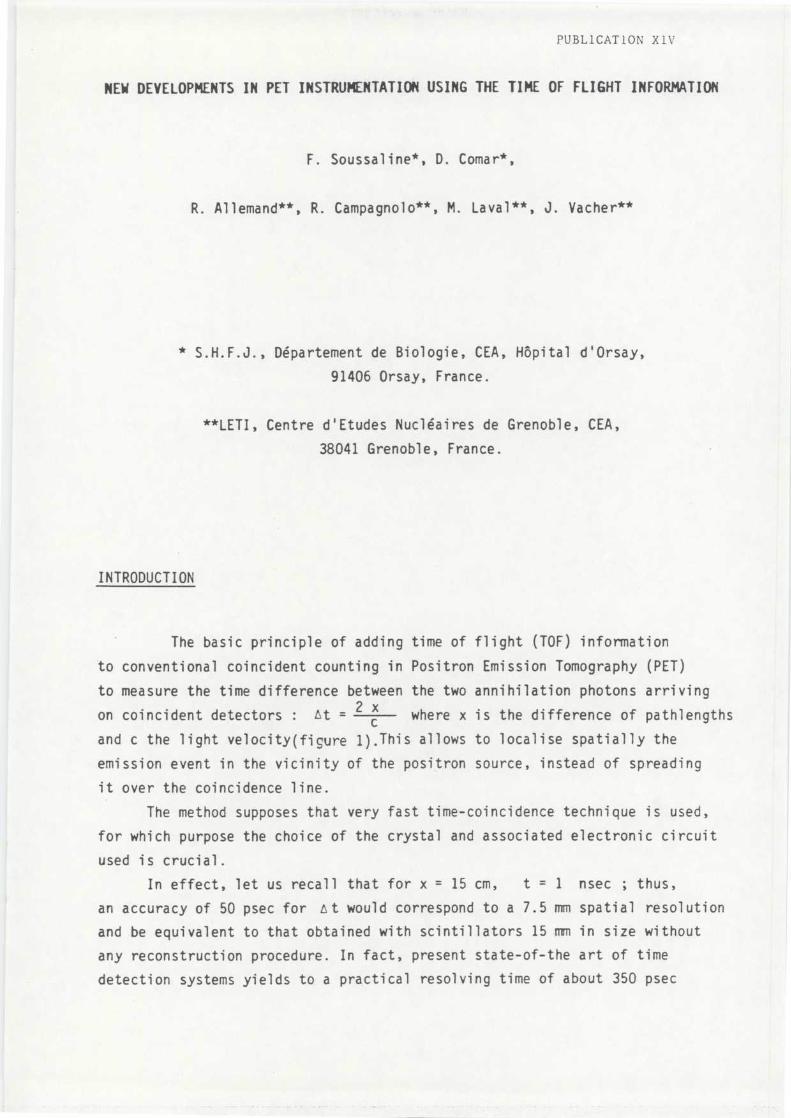
PUBLICATION X1 V
NEW DEVELOPMENTS IN PET INSTRUMENTATION USING THE TIME OF FLIGHT INFORMATION
F . Soussaline *, D . Comar* ,
R . Allemand**, R . Campagnolo**, M . Laval**, J . Vacher* *
* S .H .F .J ., Département de Biologie, CEA, Hôpital d ' Orsay ,
91406 Orsay, France .
**LETI, Centre d'Etudes Nucléaires de Grenoble, CEA ,
38041 Grenoble, France .
INTRODUCTIO N
The basic principle of adding time of flight (TOE) informatio n
to conventional coincident counting in Positron Emission Tomography (PET )
to measure the time difference between the two annihilation photons arrivin g
on coincident detectors : At =2
x
where x is the difference of pathlength sc
and c the light velocity(fiçure 1) .This allows to localise spatially th e
emission event in the vicinity of the positron source, instead of spreadin g
it over the coincidence line .
The method supposes that very fast time-coincidence technique is used ,
for which purpose the choice of the crystal and associated electronic circui t
used is crucial .
In effect, let us recall that for x = 15 cm,
t = 1 nsec ; thus ,
an accuracy of 50 psec for Lt would correspond to a 7 .5 mm spatial resolutio n
and be equivalent to that obtained with scintillators 15 mm in size withou t
any reconstruction procedure . In fact, present state-of-the art of tim e
detection systems yields to a practical resolving time of about 350 psec
(FWHM) . After a brief review of current performance of a TOF
first generation PET
system, a comparative study of such a system with conventional PET system s
will be introduced and some of the recent progress and technical perspective s
due to the use of Ba F2 crystals will be discussed .
HISTORICAL REMARK S
The use of time of flight measurement of two coincident photons, fo r
brain tumor localization, was described by WRENN in 1951 . ANGER mentione d
in 1966 the idea for his dual planar detector system . The concept of a
PET system with the use of time-of -flight was discussed in 1968 by BROWNEL L
and his colleagues . Measurements of time-localization were performed by
DUNN in 1975, using plastic scintillators, but their low efficiency renders then
unsuitable
for PET purpose . Predictions for the use of TOF for a 'Dynami c
Imaging Device in Transverse Sections' were made in 1977 by BUDINGER .
In 1979, the LETI group of the French AEC suggested the use of a fas t
and efficient mineral scintillator, the cesium fluoride (CsF) combined to
a tomographic reconstruction technique with TOF, ALLEMAND et al . 1979, 1980 .
Since then, the advantages of PET plus TOF were discussed by a numbe r
of researchers (TER POGOSSIAN 1980, MULLANI 1982, TOMITANI 1982 . .), whil e
the first operating systems were completed by groups at WASHINGTON UNIVERSIT Y
in St Louis, USA and at LETI in GRENOBLE, FRANCE .
CURRENT PERFORMANCE OF THE TOFPE T
Traditionnally, Bismuth Germanate (BGO) has been widely used for PE T
imaging but, still highly convenient for conventional PET because of it s
much higher detection efficiency (Table 1)
it is not for TOF
due its long light decay time (resolving time of the order of 10-20 nsec) .
The CsF has a fast scintillation time constant at 2 .5 nsec, and time resolutio n
on the order of 450 psec can be currently obtained with 40O .CsF probes
. As developped later,this can substantially improve the signal-to-nois e
ratio of the tomographic images obtained . However, the lower intrinsic efficiency ,
and the fact that,being hygroscopic, CsF crystal has to be carefully packed ,
yield to a lower overall sensitivity as compared to BGO . Moreover, th e
resolution is limited by the detector size due to the lack of commerciall y
available very small photomultiplier tubes (PM s) with good timing capabilities .
Baryum Fluoride (Ba F2), another crystal also proposed by the LET I
group in 1982 (VACHER 1983) wio measured a very fast light component i n
the UV domain (Table I ) ' at 220 nm, 300 psec . This non-hygroscopic scintillato r
with a detection efficiency slightly higher than that of CsF, could be th e
answer to most of the shortcomings previously listed for CsF .
Therefore, a first generation time of flight PET system named TDV 1
was designed and built by the LETI for the ORSAY group where it is currentl y
installed (figure 2) and the preliminary results confirm the TOF capabilities .
This system
comprised essentially three rings of 96 CsF probes and a fourt h
ring of 96 Ba F2 probes . On Table 2 are listed the general characteristic s
of the TDV 1 system, an instrument for whole-body dynamic 3 D acquisition .
Let us recall the essential advantages of time of flight informatio n
when used in PET :
1 - As a consequence of the very short scintillation time delivered by fas t
crystals, a TOF system is able to handle very high counting rates withou t
pile-up effect, and, thus,enables fast dynamic studies .
2 - The short range of gray time of flight (on the order of 2 nsec for a
30 cm object) enables a good elimination of random events .
3 - Approximate localization of the source position results in an improvemen t
of the signal-to-noise (S/N) ratio, which provides an effective sensitivity
gain . This gain could be defined as the number of counts producing the sam e
S/N ratio without and with TOF information .
Another inherent consequence in the TOF use is the limited propagatio n
of noise artefacts due to backprojection and to some extent, a fractio n
of events scattered within the object rejected outside the reconstructio n
field .
COUNT RATE CAPABILITIES9
With CsF or Ba F2 scintillators and associated fast electronics, coun t
rates up to a million counts per sec for each detector are feasible, withou t
loss due to pile up .
Actually, with the TDV 1 system designed, the maximum count rate capabilit y
is 450 000 eps, due to the transfert time to magnetic disc in list mode .
This is an interesting feature of the system for images can be reconstructe d
for any a posteriori selected time interval such as 1-10 sec . It shoul d
be reminded that 500 000 eps corresponds to a 30 uCi/ml uniform activit y
concentration in a 20 cm in diameter cylinder, 14 cm long .
In fact, the other important feature that should be pointed out a t
these count rates is the relatively low fraction of random events (namel y
1 05 for 3 .5 x 10 5 true coincidences per sec), due to the very short resolvin g
time as compared to PET system without use of time of flight .
RANDOM COINCIDENCE RATE WITH TO F
It is obvious that high random rates introduce dramatic image contras t
degradation and, even if they are correctly evaluated and substracted, th e
additional noise could increase quantitative uncertainty . Figure 3 illustrate s
the count rates in terms of total number of events, random events, and tru e
coincidence, as a function of activity concentration, for the TDV 1 syste m
(resolving time 470 psec ± 28 psec for CsF and 370 psec It. 28 psec for Ba F2 )
as physically measured . If one compares, then, the random-to-total events
fraction for two PET systems for which identical geometry and detectio n
efficiency are assumed, this ratio ranges from 10 % up to 55 % (Ba F2 an d
BGO scintillators) for 1 u Ci/ml uniformly distributed in a 20 cm objec t
and from 40 % up to 90 % for 5 u Ci/ml, which correspond s
to actual concentrations present in the brain for dynamic studies . In fact ,
for a system equiped with higher density scintillator, the square of th e
individual efficiency should be taken into account .
Another advantage of the high randoms rejection is that one can use mor e
active transmission sources and, therefore, reduce the acquisition tim e
necessary for accurate attenuation correction in the quantitative studies .
SENSITIVITY
Time-of-flight can substantially improve the signal-to-noise rati o
of the tomographic images obtained . Figure 4 qualitatively illustrate s
this S/N improvement as compared to that obtained with a PET conventiona l
back-projection procedure . . In the latter case, the point spread function
ction is on the form 1 whe re r is the distance to the
sourc e(PSF) section
poin t
in the former case, the PSF is a gaussian function where the section G(r )
i
Gr =1 x 1 e r2/2, 2
s
) —
Q
being the standard deviation of the gaussian function . The information
is much more concentrated in the vicinity of the point source in the TO F
technique than in the conventional memthod for the information is backprojecte d
only on a fraction of the object . In practice, this can be translated by
a substantial decrease in the number of pixels concerned in the reconstruction
procedure . Let us recall that the propagation of errors in reconstructio n
tomography is given by (EUDINGER et al 1978) :
S/N = k
n wherene is the number of pixels in the object ,
2¶Q
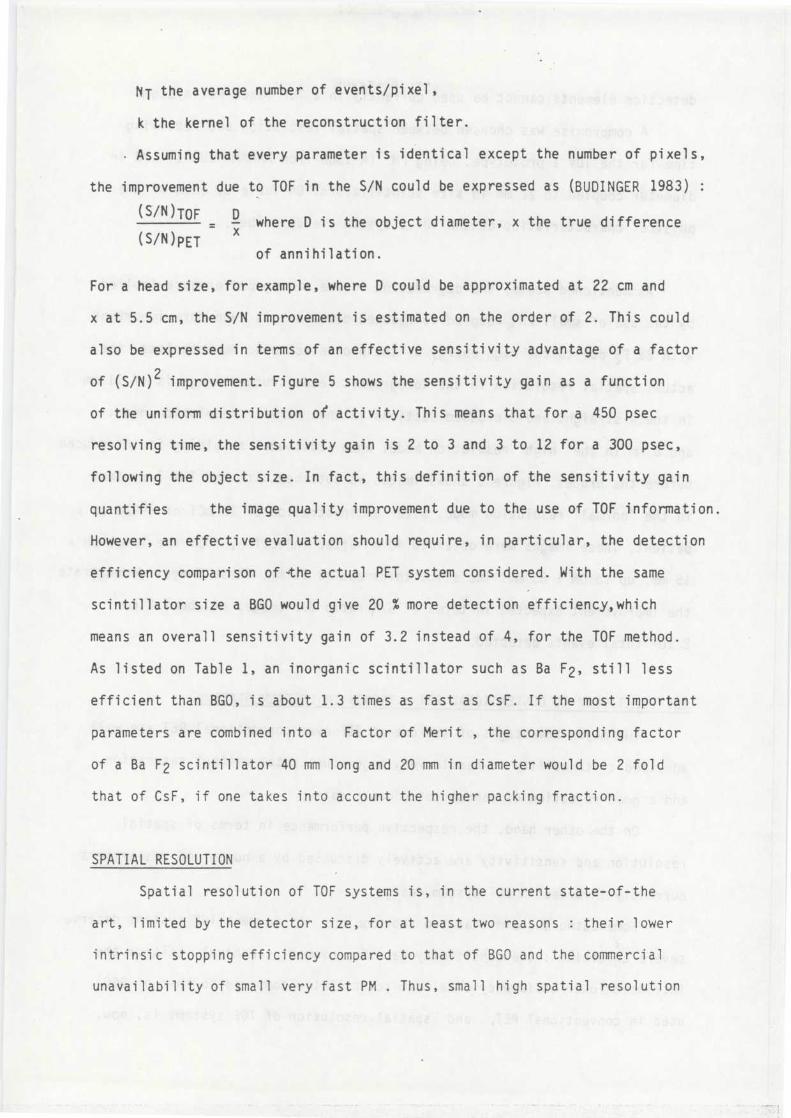
NT the average number of events/pixel ,
k the kernel of the reconstruction filter .
Assuming that every parameter is identical except the number of pixels ,
the improvement due to TOF in the S/N could be expressed as (BUDINGER 1983) :
(S/N)TOF
P. where D is the object diameter, x the true differenc e( S/N )PET
x
For a head size, for example, where D could be approximated at 22 cm an d
x at 5 .5 cm, the S/N improvement is estimated on the order of 2 . This coul d
also be expressed in terms of an effective sensitivity advantage of a facto r
of (S/N) 2 imProvement . Figure 5 shows the sensitivity gain as a functio n
of the uniform distribution of activity . This means that for a 450 pse c
resolving time, the sensitivity gain is 2 to 3 and 3 to 12 for a 300 psec ,
following the object size . In fact, this definition of the sensitivity gai n
quantifies
the image quality improvement due to the use of TOF information .
However, an effective evaluation should require, in particular, the detection
efficiency comparison of the actual PET system considered . With the same
scintillator size a BGO would give 20 % more detection efficiency,whic h
means an overall sensitivity gain of 3 .2 instead of 4, for the TOF method .
As listed on Table 1, an inorganic scintillator such as Ba F2, still les s
efficient than BGO, is about 1 .3 times as fast as CsF . If the most importan t
parameters are combined into a Factor of Merit , the corresponding facto r
of a Ba F2 scintillator 40 mm long and 20 mm in diameter would be 2 fol d
that of CsF, if one takes into account the higher packing fraction .
SPATIAL RESOLUTIO N
Spatial resolution of TOF systems is, in the current state-of-th e
art, limited by the detector size, for at least two reasons : their lowe r
intrinsic stopping efficiency compared to that of BGO and the commercia l
unavailability of small very fast PM . Thus, small high spatial resolution
of annihilation .
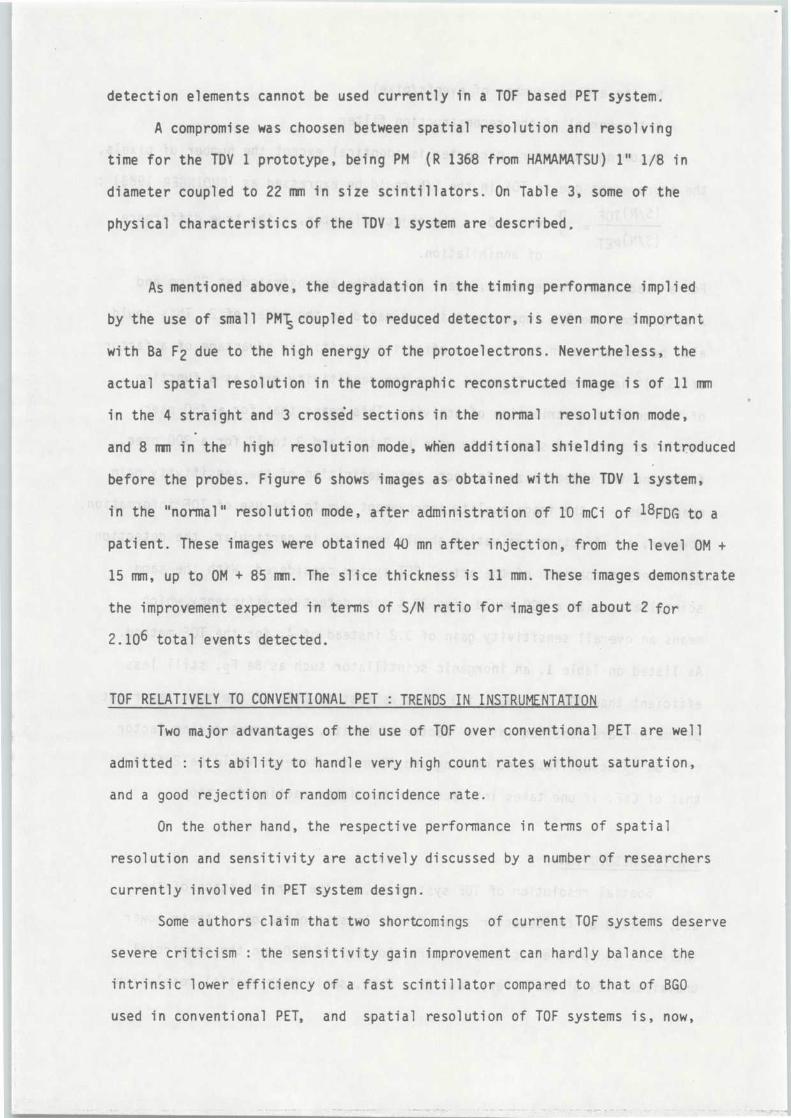
detection elements cannot be used currently in a TOF based PET system .
A compromise was choosen between spatial resolution and resolvin g
time for the TDV 1 prototype, being PM (R 1368 from HAMAMATSU) 1" 1/8 i n
diameter coupled to 22 mm in size scintillators . On Table 3, some of th e
physical characteristics of the TDV 1 system are described ,
As mentioned above, the degradation in the timing performance implie d
by the use of small PMTS coupled to reduced detector, is even more importan t
with Ba F2 due to the high energy of the protoelectrons . Nevertheless, th e
actual spatial resolution in the tomographic reconstructed image is of 11 mm
in the 4 straight and 3 crossed sections in the normal resolution mode ,
and 8 mm in the high resolution mode, when additional shielding is introduced
before the probes . Figure 6 shows images as obtained with the TDV 1 system ,
in the " normal " resolution mode, after administration of 10 mCi of 18FDG to a
patient . These images were obtained 40 mn after injection, from the level OM +
15 mm, up to OM + 85 mm . The slice thickness is 11 mm . These images demonstrat e
the improvement expected in terms of S/N ratio for images of about 2 for
2 .106 total events detected .
TOF RELATIVELY TO CONVENTIONAL PET: TRENDS IN INSTRUMENTATIO N
Two major advantages of the use of TOF over conventional PET are wel l
admitted : its ability to handle very high count rates without saturation ,
and a good rejection of random coincidence rate .
On the other hand, the respective performance in terms of spatia l
resolution and sensitivity are actively discussed by a number of researcher s
currently involved in PET system design .
Some authors claim that two shortcomings of current TOF systems deserv e
severe criticism : the sensitivity gain improvement can hardly balance the
intrinsic lower efficiency of a fast scintillator compared to that of BGO
used in conventional PET, and spatial resolution of TOF systems is, now,
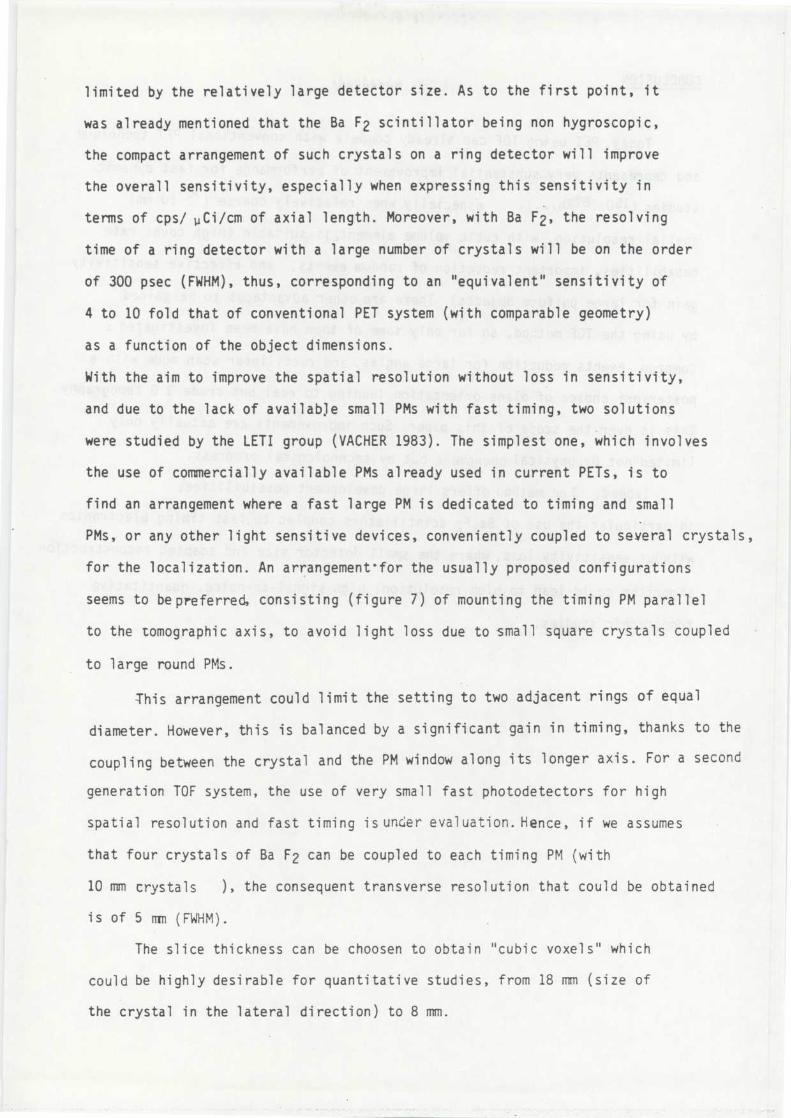
limited by the relatively large detector size . As to the first point, i t
was already mentioned that the Ba F2 scintillator being non hygroscopic ,
the compact arrangement of such crystals on a ring detector will improve
the overall sensitivity, especially when expressing this sensitivity i n
terms of cps/ uCi/cm of axial length . Moreover, with Ba F2, the resolvin g
time of a ring detector with a large number of crystals will be on the orde r
of 300 psec (FWHM), thus, corresponding to an "equivalent " sensitivity o f
4 to 10 fold that of conventional PET system (with comparable geometry )
as a function of the object dimensions .
With the aim to improve the spatial resolution without loss in sensitivity ,
and due to the lack of available small PMs with fast timing, two solution s
were studied by the LETI group (VACHER 1983) . The simplest one, which involve s
the use of commercially available PMs already used in current PETs, is to
find an arrangement where a fast large PM is dedicated to timing and smal l
PMs, or any other light sensitive devices, conveniently coupled to several crystals ,
for the localization . An arrangement for the usually proposed configuration s
seems to be preferred, consisting (figure 7) of mounting the timing PM paralle l
to the tomographic axis, to avoid light loss due to small square crystals coupled
to large round PMs .
This arrangement could limit the setting to two adjacent rings of equa l
diameter . However, this is balanced by a significant gain in timing, thanks to th e
coupling between the crystal and the PM window along its longer axis . For a second
generation TOF system, the use of very small fast photodetectors for high
spatial resolution and fast timing is under evaluation . Hence, if we assume s
that four crystals of Ba F2 can be coupled to each timing PM (wit h
10 mm crystals
), the consequent transverse resolution that could be obtained
is of 5 mm (FWHM) .
The slice thickness can be choosen to obtain " cubic voxels " whic h
could be highly desirable for quantitative studies, from 18 mm (size o f
the crystal in the lateral direction) to 8 mm .
CONCLUSIO N
Today, PET using TOF can already compete,with conventional PET techniqu e
and represents very substantial improvement of performance for fast dynami c
studies (15 0, 82Rb . . .),
especially when relatively coarse ( ti 10 mm )
spatial resolution, with cubic volume element,is suitable (high count rate
capabilities, important reduction of random events, and effective sensitivity
gain for large uniform objects) . There are other advantages to be gaine d
by using the TOF method, so far only some of them have been investigated
Compton events reduction for large angles, and rectilinear scan mode with a
posteriori choice of plane orientation leading to real but crude 3 D tomograph y
This is over the scope of this paper . Such improvements are actually onl y
limited not by physical phenomena but by technological progress .
Indeed, The method offers large development possibilities ,
in particular the use of Ba F2 scintillators coupled to fast timing electronics
without sensitivity loss, where the small detector size and adapted reconstructio n
algorithm could lead to high resolution, high signal-to-noise, quantitative
tomographic studies .
REFERENCES
1. Allemand, R ., Gresset, C ., Vacher, J . (1980) : Potential advantage s
of a cesium fluoride scintillator for a time-of-flight positron camera .
J . Nucl . Med ., 21 : 153-155 .
2. Anger, N .O . (1966) : Survey of radioisotope cameras . Trans . ISA ,
5 : 311-334 .
3. Brownell, G .L ., Burnham, C .A ., Wilenski, S . et al . (1969) : New develop-
ments in positron scintigraphy and the application of cyclotron-produced
positron emitters . In : Medical Radioisotopescintigraphy, Vol . 1 ,
Vienna, IAEA, 163 Dunn W .L ., 1975 : Time-of-flight localization of
positron emitting isotopes . Thesis in Physics, Vanderbitt University ,
Nashville, TN .
4. Budinger, T .F . (1977) : Instrumentation trends in nuclear medicine .
Seminars in Nuclear Medicine, Vol . 7, n°4 : 285-297 .
5
Budinger, T .F ., Derenzo, S .E ., Greenberg, W .L . et al . (1978) : Quantitativ e
potentials of dynamic emission computed tomography . J . Nucl . Med . ,
19 : 309-315 .
6. Budinger, T .F . (1983) : Time-of-flight positron emission tomography :
status relative to conventional PET . J . Nucl . Med . 24, N°1 : 73-78 .
7. Campagnolo, R ., Garderet, Ph ., Vacher, J . (1979) : Tomographie pa r
émetteurs de positrons avec mesure de temps de vol . In : Proc . of
ColloqueInternational surle traitementdusignal, Nice, France .
8.
Mullani, N ., Wong, Q ., Hartz, R . et al . (1982) : Sensitivity improvemen t
of TOFPET by the utilization of the interslice coincidences . IEEE
Trans . Nucl . Sci .NS-29 (1) : 479-483 .
9.
Ter-Pogossian,M .M ., Mullani, N .A ., Ficke, D .C . (1981) : Photon time-
of-flight assisted positron emission tomography . J.Comput .Assist .
Tomogr . 5 : 227-239 .
10.
Tomitani, T . (1981) : Image reconstruction and noise evaluation i n
photon time-of-flight assisted positron emission tomography . IEE E
Trans . Nucl . Sci . NS-2 8(6) : 4582-4589 .
11.
Vacher, J ., Allemand, R ., Cormoreche, E . et al . (1983) : Improvemen t
of sensitivity and spatial resolution of time-of-flight positron emission
tomgoraphy, submitted to J . Nucl . Med :, Feb . 24, 1983 .
12 .
Wrenn, F .Q ., Good, M .L . , , Handler, P . (1951) : Science, 113 : 525 .
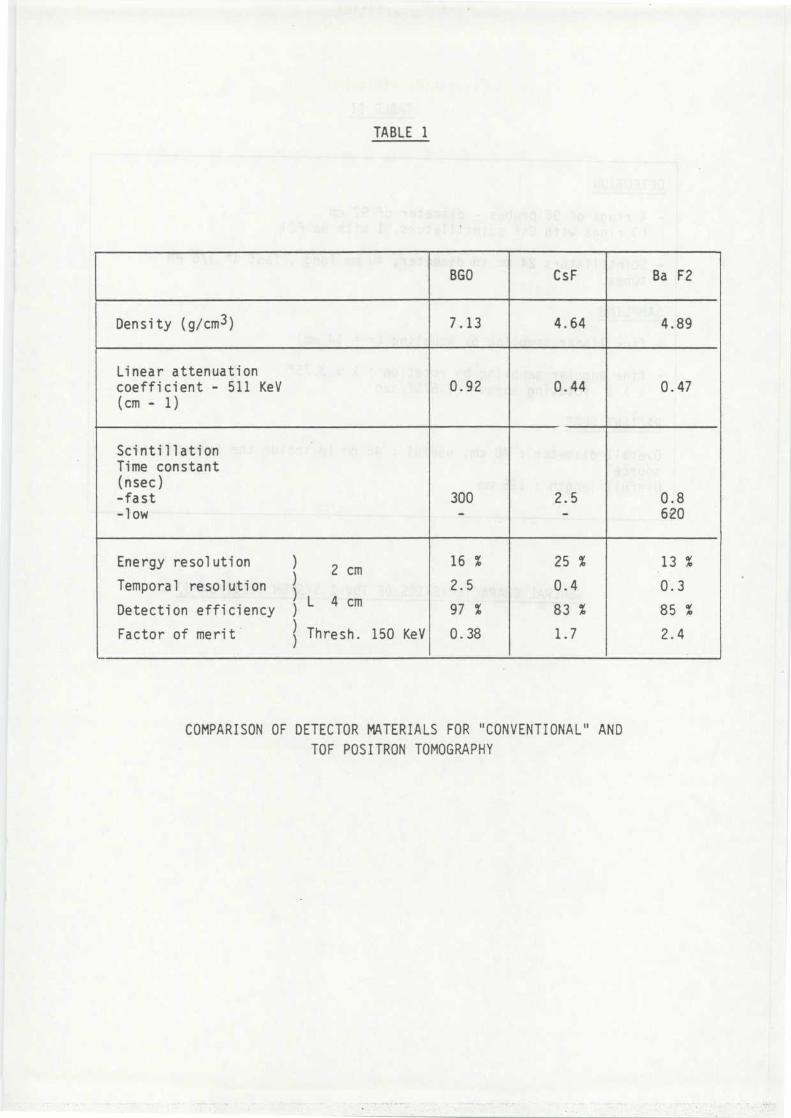
TABLE1
BGO CsF Ba F2
Density (g/cm 3 ) 7 .13 4 .64 4 .89
Linear attenuatio ncoefficient - 511 Ke V(cm -
1)0 .92 0 .44 0 .47
ScintillationTime constant(nsec )-fas t-low
300 2 . 5-
0 . 8620
Energy resolution
)
2 cmTemporal
resolution
))
Detection efficiency
)
L
4 cm
'
)
Thresh .Factor of merit
)
150 Ke
16 %
2 . 5
97 %
0 . 38
25 %
0 . 4
83 %
1 .7
13 Z
0 . 3
85 %
2 .4
COMPARISON OF DETECTOR MATERIALS FOR "CONVENTIONAL" AN D
TOF POSITRON TOMOGRAPH Y
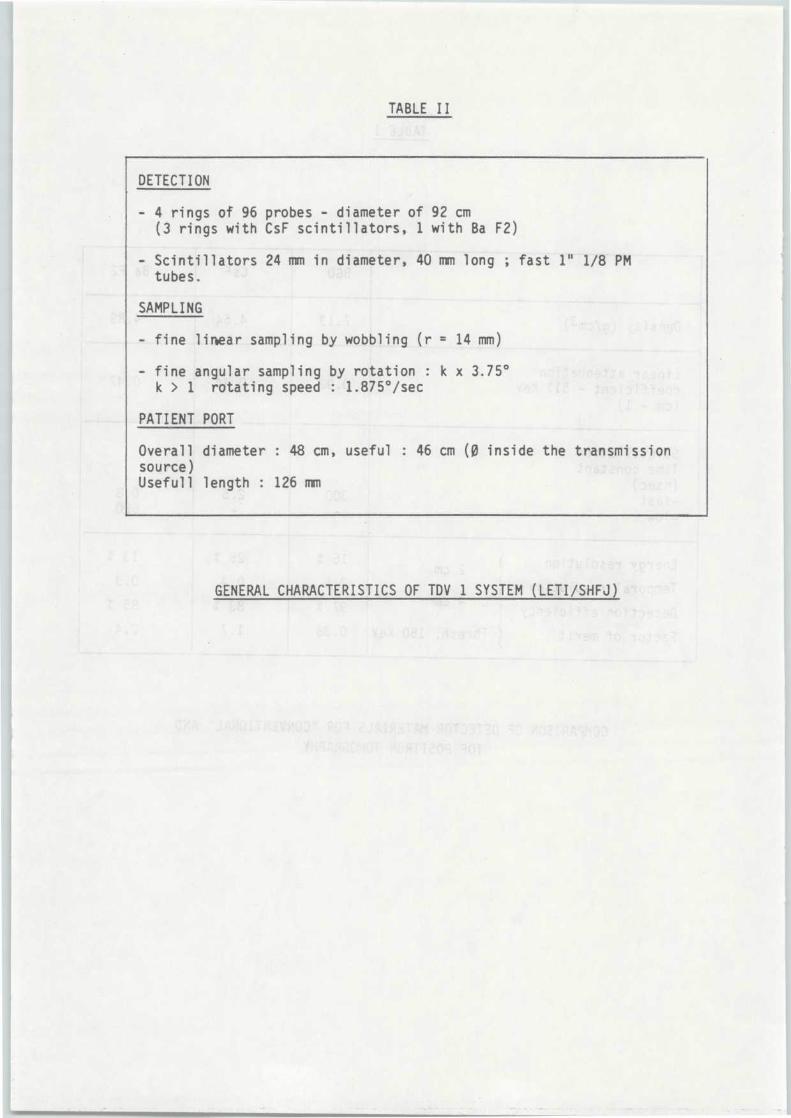
TABLEI I
DETECTIO N
- 4 rings of 96 probes - diameter of 92 c m(3 rings with CsF scintillators, 1 with Ba F2 )
Scintillators 24 mm in diameter, 40 mm long ; fast 1" 1/8 PMtubes .
SAMPLING
- fine linear sampling by wobbling (r = 14 mm )
- fine angular sampling by rotation : k x 3 .75°k > 1 rotating speed : 1 .875°/sec
PATIENT POR T
Overall diameter : 48 cm, useful : 46 cm (0 inside the transmissio nsource )Useful] length : 126 mm
GENERAL CHARACTERISTICS OF TDV 1 SYSTEM (LETI/SHFJ)
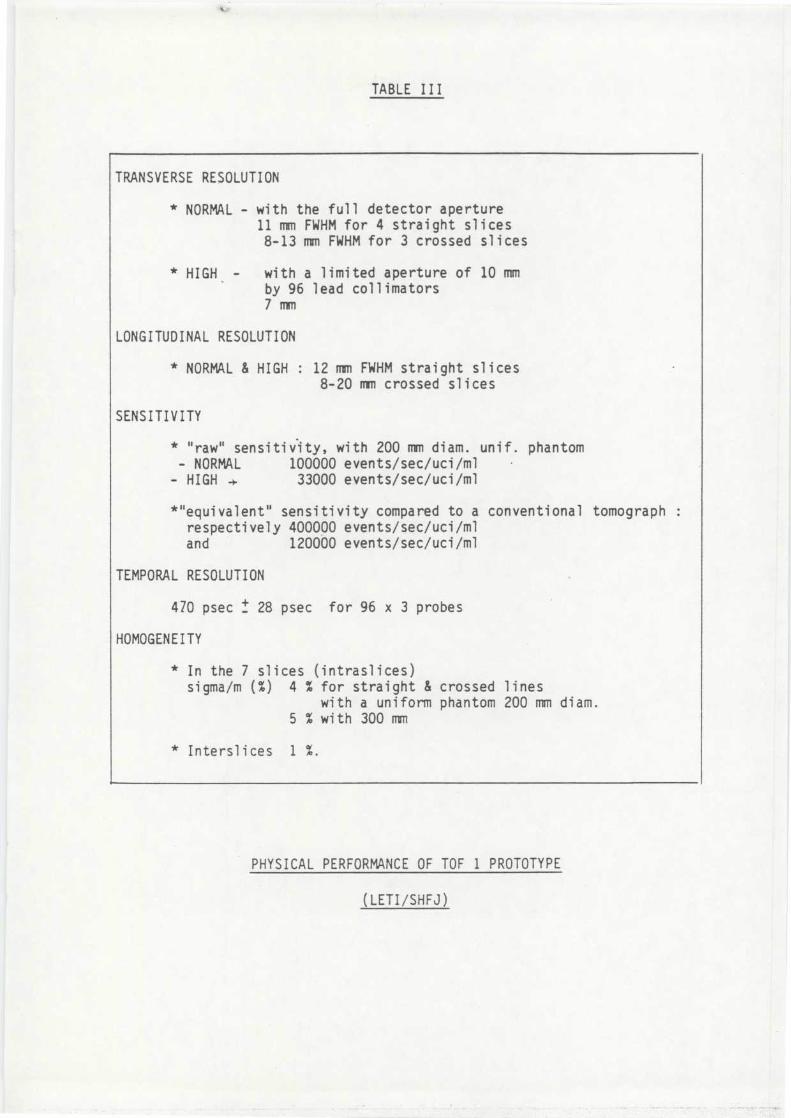
TABLEII I
PHYSICAL PERFORMANCE OF TOF 1 PROTOTYP E
TRANSVERSE RESOLUTIO N
*
NORMAL - with the full detector aperture11n FWHM for 4 straight slice s8-13 mm FWHM for 3 crossed slice s
*
HIGH - with a limited aperture of 10 m mby 96 lead collimators7mm
LONGITUDINAL RESOLUTION
*
NORMAL & HIGH : 12 mm FWHM straight slice s8-20 mm crossed slice s
SENSITIVIT Y
* "raw" sensitivity, with 200 mm diam . unif . phantom
- NORMAL
100000 events/sec/uci/ml
- HIGH -+
33000 events/sec/uci/ml
*"equivalent" sensitivity compared to a conventional tomographrespectively 400000 events/sec/uci/mland
120000 events/sec/uci/ml
TEMPORAL RESOLUTIO N
470 psec ± 28 psec for 96 x 3 probe s
HOMOGENEIT Y
* In the 7 slices (intraslices )sigma/m (%) 4 % for straight & crossed line s
with a uniform phantom 200 mm diam .5 % with 300 mm
* Intersl i ces 1 % .
(LETI/SHFJ) ,

PUBLICATION
XV
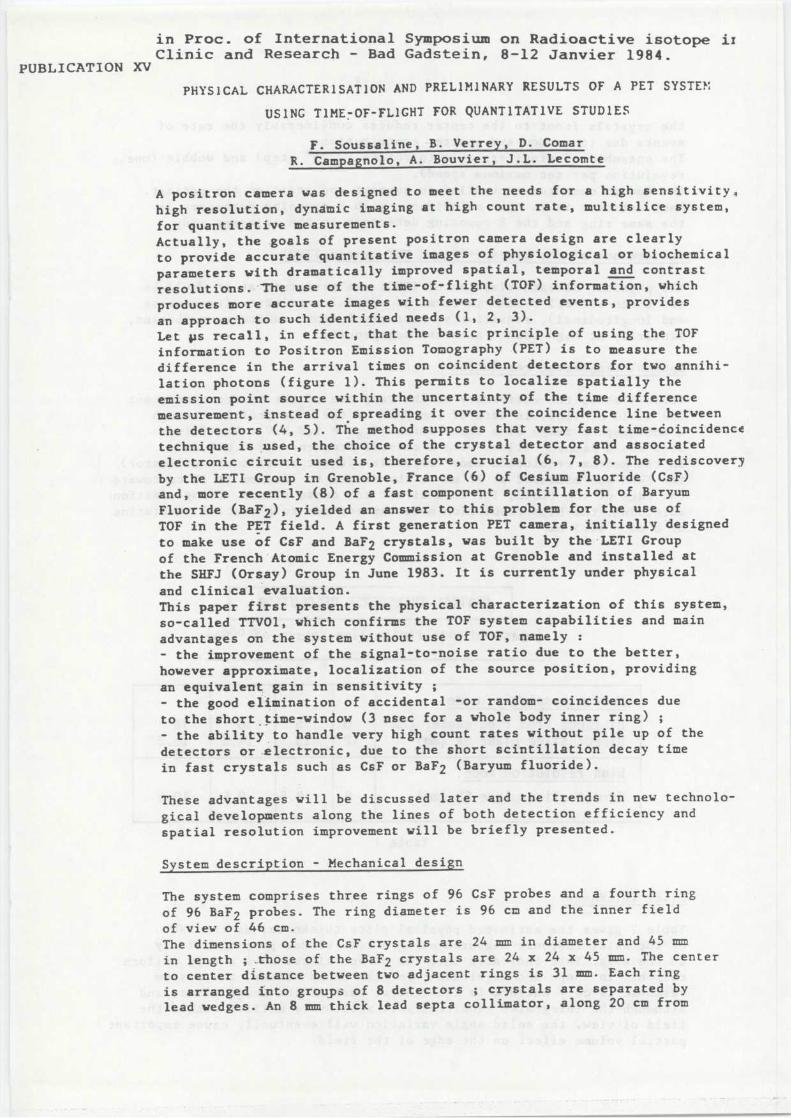
in Proc . of International Symposium on Radioactive isotope itClinic and Research - Bad Gadstein, 8-12 Janvier 1984 .
PUBLICATION XV
PHYSICAL CHARACTERISATION AND PRELIMINARY RESULTS OF A PET SYSTE M
USING T1ME7OF-FLIGHT FOR QUANTITATIVE STUDIE S
F .Soussaline, B . Verrey, D . Comar
R . Campagnolo, A . Bouvier, J .L . Lecomt e
A positron camera was designed to meet the needs for a high sensitivity ,high resolution, dynamic imaging at high count rate, multislice system ,
for quantitative measurements .Actually, the goals of present positron camera design are clearl yto provide accurate quantitative images of physiological or biochemica lparameters with dramatically improved spatial, temporal and contras t
resolutions . The use of the time-of-flight (TOF) information, whic h
produces more accurate images with fewer detected events, provide s
an approach to such identified needs (1, 2, 3) .Let ps recall, in effect, that the basic principle of using the TOFinformation to Positron Emission Tomography (PET) is to measure th edifference in the arrival times on coincident detectors for two annihi -lation photons (figure 1) . This permits to localize spatially theemission point source within the uncertainty of the time differenc emeasurement, instead of . spreading it over the coincidence line betwee nthe detectors (4, 5) . The method supposes that very fast time-doincidenc e
technique is _used, the choice of the crystal detector and associate delectronic circuit used is, therefore, crucial (6, 7, 8) . The rediscover yby the LETI Group in Grenoble, France (6) of Cesium Fluoride (CsF )and, more recently (8) of a fast component scintillation of Baryum
Fluoride (BaF2), yielded an answer to this problem for the use ofTOF in the PET field . A first generation PET camera, initially designe dto make use of CsF and BaF2 crystals, was built by the . LETI Group
of the French - Atomic Energy Commission at Grenoble and installed a tthe SHFJ (Orsay) Group in June 1983 . It is currently under physica l
and clinical evaluation .This paper first presents the physical characterization of this system ,so-called TTVO1, which confirms the TOF system capabilities and mai n
advantages on the system without use of TOF, namely :
- the improvement of the signal-to-noise ratio due to the better ,however approximate, localization of the source position, providin gan equivalent gain in sensitivity ;
- the good elimination of accidental or random- coincidences du eto the short time-window (3 nsec for a whole body inner ring) ;
- the ability to handle very high count rates without pile up of the
detectors or _electronic, due to the short scintillation decay tim e
in fast crystals such as CsF or BaF2 (Baryum fluoride) .
These advantages will be discussed later and the trends in new technolo-
gical developments along the lines of both detection efficiency and
spatial resolution improvement will be briefly presented .
System description - Mechanicaldesign
The system comprises three rings of 96 CsF probes and a fourth rin g
of 96 BaF2 probes . The ring diameter is 96 cm and the inner fiel d
of view of 46 cm .The dimensions of the CsF crystals are 24 mm in diameter and 45 m m
in length ; ..those of the BaF2 crystals are 24 x 24 x 45 mm . The cente r
to center distance between two adjacent rings is 31 mm . Each ring
is arranged into groups of 8 detectors ; crystals are separated by
lead wedges . An 8 mm thick lead septa collimator, along 20 cm from
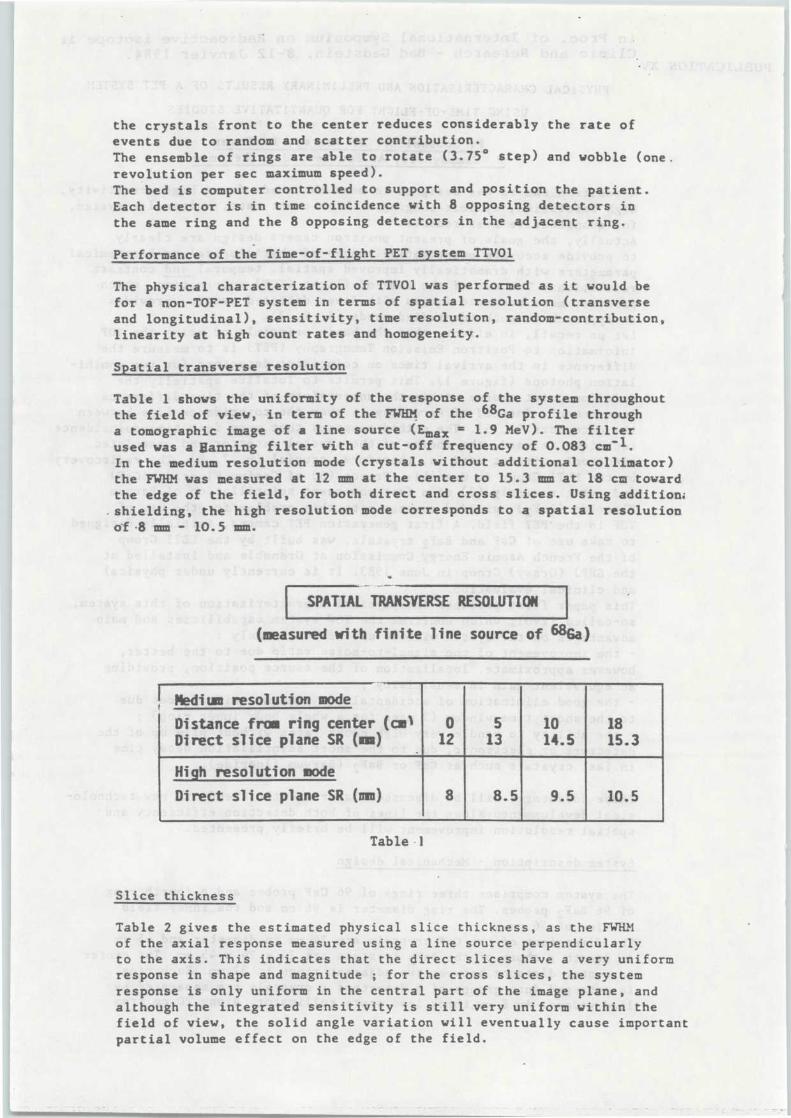
the crystals front to the center reduces considerably the rate o fevents due to random and scatter contribution .The ensemble of rings are able to rotate (3 .75° step) and wobble (one .revolution per sec maximum speed) .The bed is computer controlled to support and position the patient .Each detector is . in time coincidence with 8 opposing detectors i nthe same ring and the 8 opposing detectors in the adjacent ring .
Performance of the Time-of-flight PET system TTV0 1
The physical characterization of TTV01 was performed as it would b efor a non-TOF-PET system in terms of spatial resolution (transvers eand longitudinal), sensitivity, time resolution, random-contribution ,linearity at high count rates and homogeneity .
Spatial transverse resolution ,
Table 1 shows the uniformity of the response of the system throughou tthe field of view, in term of the FWHM of the 68Ga profile througha tomographic image of a line source (Emax = 1 .9 MeV) . The filte rused was a Hanning filter with a cut-off frequency of 0 .083 cm-1 .In the medium resolution mode (crystals without additional collimator )the FWHM was measured at 12 mm at the center to 15 .3 mm at 18 cm towardthe edge of the field, for both direct and cross slices . Using addition ;
.shielding, the high resolution mode corresponds to a spatial resolutio nof8mm- 10 .5 mm.
SPATIAL TRANSVERSE RESOLUTION
(measured with finite line source of 686a )
Medius resolution erode
012
513
1014.5
1815. 3
Distance from ring center (c&Direct slice plane SR (ia)
High resolution code
8 8.5 9 .5 10. 5Direct slice plane SR (nia)
Table d
Slice thicknes s
Table 2 gives the estimated physical slice thickness, as the FWHANof the axial response measured using a line source perpendicularl yto the axis . This indicates that the direct slices have a very uniformresponse in shape and magnitude ; for the cross slices, the systemresponse is only uniform in the central part of the image plane, andalthough the integrated sensitivity is still very uniform within the
field of view, the solid angle variation will eventually cause importan tpartial volume effect on the edge of the field .
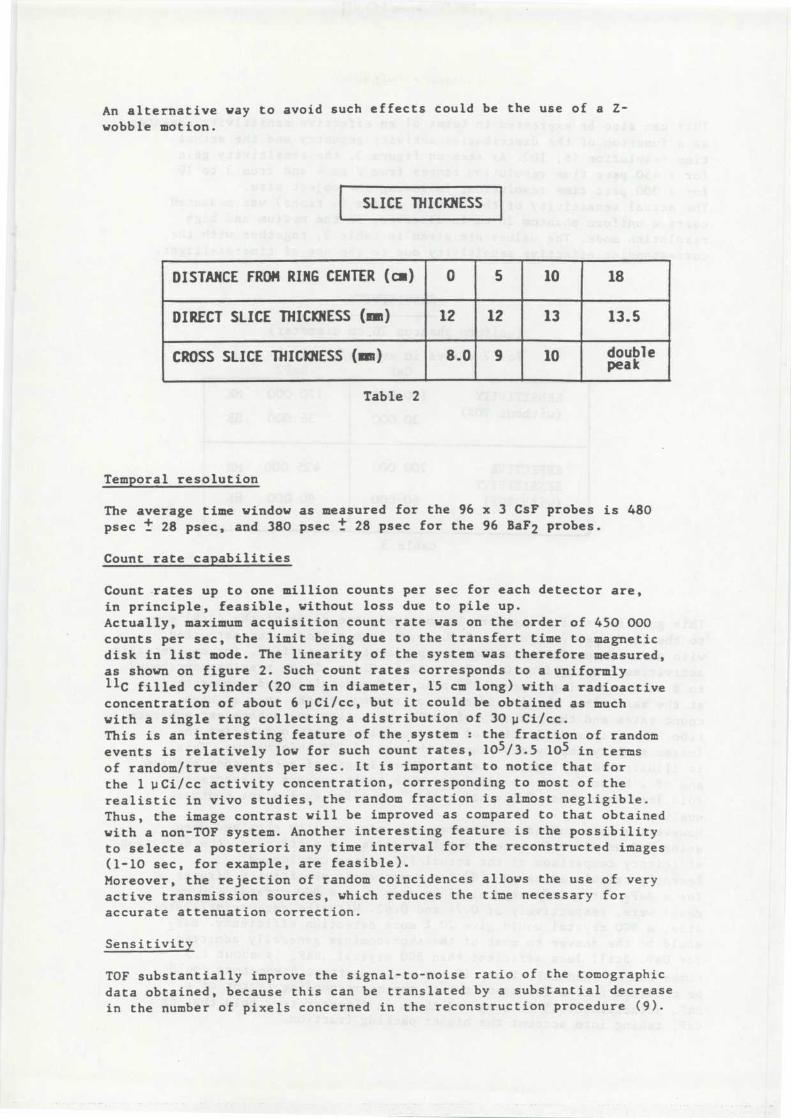
An alternative way to avoid such effects could be the use of a Z -
wobble motion .
SLICE THICKNES S
DISTANCE FROM RIN6 CENTER (ca) 0 5 10 18
OIRECT SLICE THICgiESS (mm) 12 12 13 13. 5
CROSS SLICE THICKNESS (aa) 8 .0 9 10 ~âkleTable 2
Temporal resolutio n
The average time window as measured for the 96 x 3 CsF probes is 48 0psec ± 28 psec, and 380 psec ± 28 psec for the 96 BaF2 probes .
Count rate capabilitie s
Count rates up to one million counts per sec for each detector are ,in principle, feasible, without loss due to pile up .Actually, maximum acquisition count rate was on the order of 450 00 0counts per sec, the limit being due to the transfert time to magneti cdisk in list mode . The linearity of the system was therefore measured ,as shown on figure 2 . Such count rates corresponds to a uniformly11C filled cylinder (20 cm in diameter, 15 cm long) with a radioactiveconcentration of about 6 uCi/cc, but it could be obtained as muc hwith a single ring collecting a distribution of 30 uCi/cc .This is an interesting feature of the system : the fraction of randomevents is relatively low for such count rates, 10 5 /3 .5 105 in termsof random/true events per sec . It is important to notice that forthe 1 uCi/cc activity concentration, corresponding to most of th erealistic in vivo studies, the random fraction is almost negligible .Thus, the image contrast will be improved as compared to that obtaine dwith a non-TOF system . Another interesting feature is the possibilit yto selecte a posteriori any time interval for the reconstructed image s(1-10 sec, for example, are feasible) .Moreover, the rejection of random coincidences allows the use of ver yactive transmission sources, which reduces the time necessary fo raccurate attenuation correction .
Sensitivity
TOF substantially improve the signal-to-noise ratio of the tomographi c
data obtained, because this can be translated by a substantial decreas ein the number of pixels concerned in the reconstruction procedure (9) .
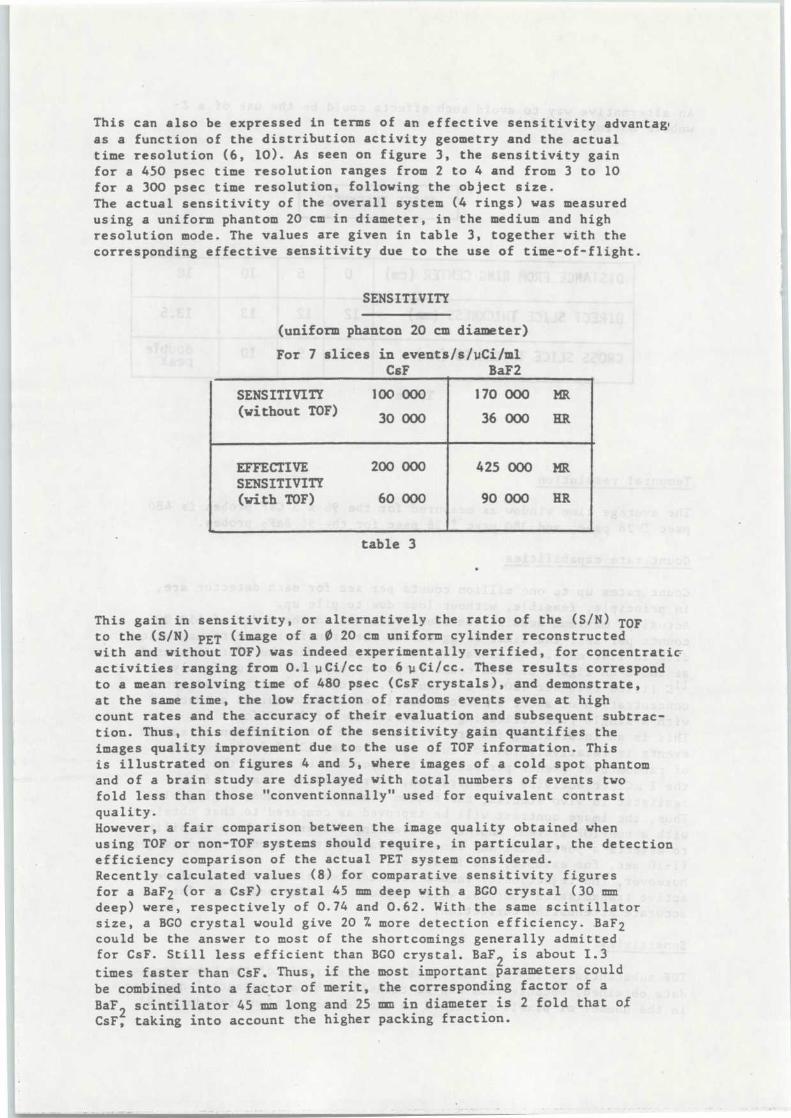
This can also be expressed in terms of an effective sensitivity advanta g 'as a function of the distribution activity geometry and the actua ltime resolution (6, 10) . As seen on figure 3, the sensitivity gainfor a 450 psec time resolution ranges from 2 to 4 and from 3 to 1 0for a 300 psec time resolution, following the object size .The actual sensitivity of the overall system (4 rings) was measuredusing a uniform phantom 20 cm in diameter, in the medium and hig hresolution mode . The values are given in table 3, together with thecorresponding effective sensitivity due to the use of time-of-flight .
SENSITIVITY
(uniform phanton 20 cm diameter )
For 7 slices in events/s/uCi/mlCsF
BaF2
SENSITIVITY 100 000 170 000 Int(without TOF)
30 000 36 000 HR
EFFECTIVESENSITIVITY
200 000 425 000 Int
(with TOF) 60 000 90 000 HR
table 3
This gain in sensitivity, or alternatively the ratio of the (S/N) TO Fto the (S/N) pET (image of a 0 20 cm uniform cylinder reconstructedwith and without TOF) was indeed experimentally verified, for concentratic-activities ranging from 0 .1 uCi/cc to 6 uCi/cc . These results correspondto a mean resolving time of 480 psec (CsF crystals), and demonstrate ,at the same time, the low fraction of randoms events even at highcount rates and the accuracy of their evaluation and subsequent subtrac -tion . Thus, this definition of the sensitivity gain quantifies theimages quality improvement due to the use of TOF information . Thisis illustrated on figures 4 and 5, where images of a cold spot phantomand of a brain study are displayed with total numbers of events twofold less than those "conventionnally" used for equivalent contras tquality .However, a fair comparison between the image quality obtained whe nusing TOF or non-TOF systems should require, in particular, the detectionefficiency comparison of the actual PET system considered .Recently calculated values (8) for comparative sensitivity figure sfor a BaF2 (or a CsF) crystal 45 mm deep with a BGO crystal (30 m mdeep) were, respectively of 0 .74 and 0 .62 . With the same scintillatorsize, a BGO crystal would give 20 7 more detection efficiency . .BaF2could be the answer to most of the shortcomings generally admitte dfor CsF . Still less efficient than BGO crystal . BaF2 is about 1 . 3
times faster than CsF . Thus, if the most important parameters couldbe combined into a factor of merit, the corresponding factor of a
BaF scintillator 45 mm long and 25
mm
in diameter is 2 fold that o f
CsF, taking into account the higher packing fraction .
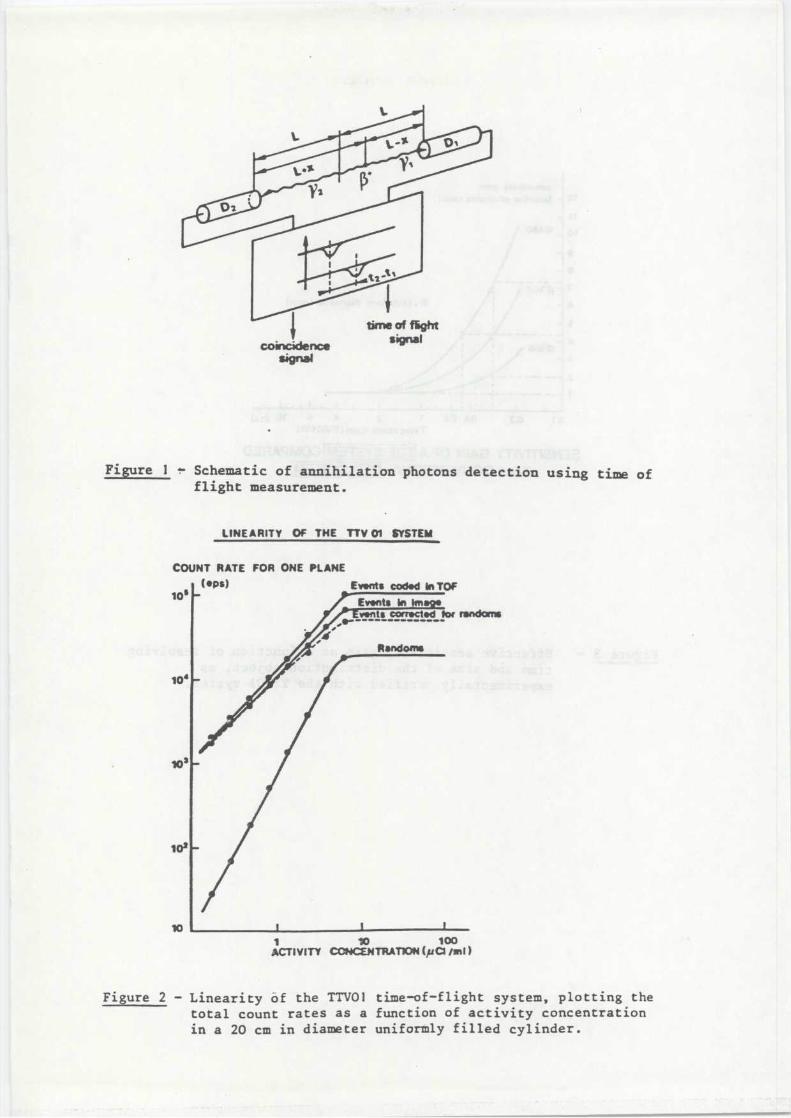
Figure 1
Schematic of annihilation photons detection using time o fflight measurement .
LINEARITY OF THE TTV 01 SYSTE M
COUNT RATE FOR ONE PLAN E
(•Ps)
Events coded in TOF10
s
Rondonia
10'
10 ~
10!
10 I1
~0
100ACTIVITY CONCENTRATION (pa )
Figure 2 - Linearity ôf the TTVOI time-of-flight system, plotting thetotal count rates as a function of activity concentrationin a 20 cm in diameter uniformly filled cylinder .
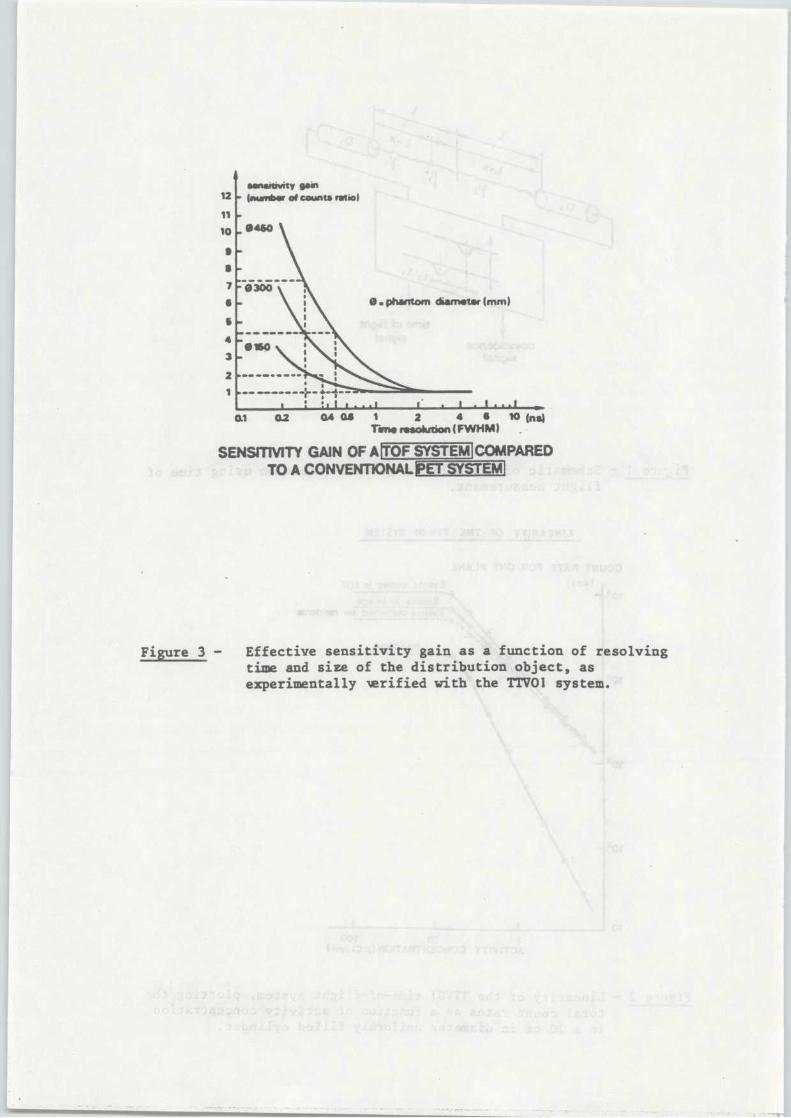
L
s
4
3
2
1
sensitivity girl(number of counts ratio )
1
l n 1 i . .!I 1 • 1 I I l l .1 sm.0.1
02
a 0$ 1
2
4 i 10 fins)Time resolution (FWHPA )
SENSITIVITY GAIN OF A tTOF SYSTEM~ COMPAREDTO A CONVENTIONAL SET SYSTEM ]
Figure 3 — Effective sensitivity gain as a function of resolvingtime and size of the distribution object, a sexperimentally verified with the TTVOI system .
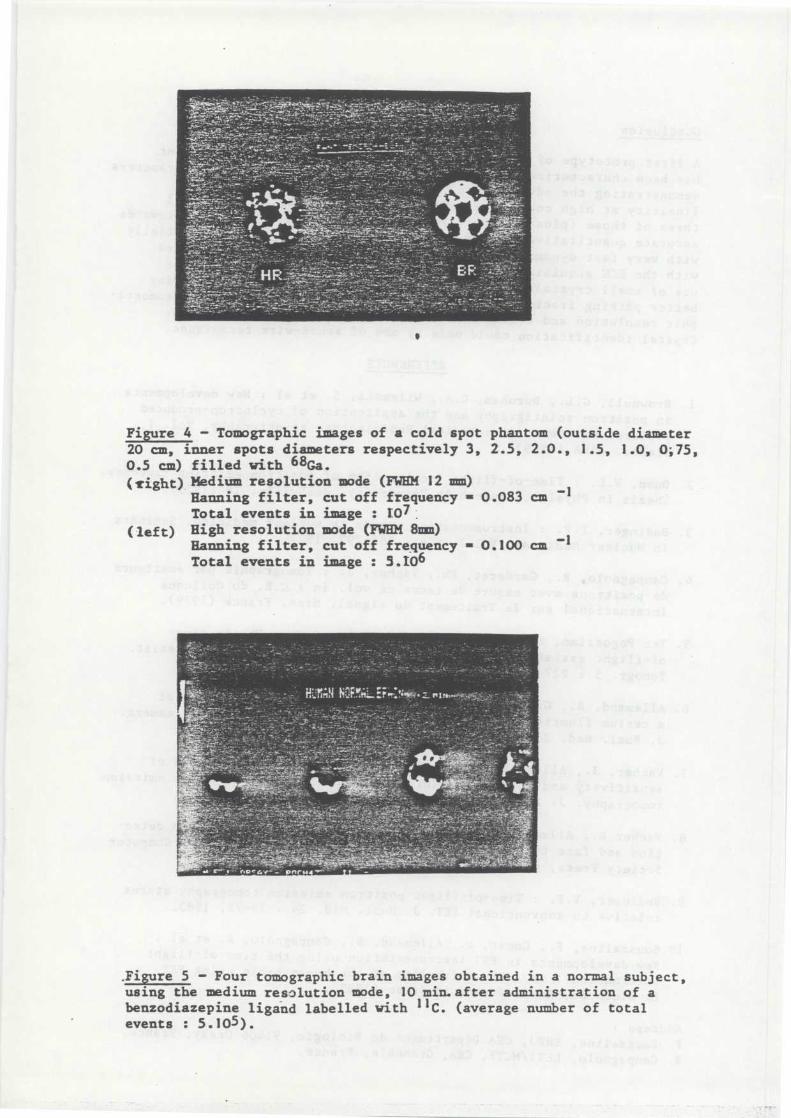
Figure 4 , - Tomographic images of a cold spot phantom (outside diamete r20 cm, inner spots diameters respectively 3, 2 .5, 2 .0 ., 1 .5, 1 .0, 0 ;75 ,0 .5 cm) filled with 68Ga .(tight) Medium resolution mode (FWHM 12 mm )
Banning filter, cut off frequency = 0 .083 cm -1
Total events in image : 1:07 :(left) High resolution mode (FWHri 8mm)
Banning filter, cut off frequency = 0 .100 cm - 1Total events in image : 9 .106
Figure 5 , - Four tomographic brain images obtained in a normal subject ,using the medium resolution mode, 10 min. of ter administration of abenzodiazepine ligand labelled with 11 C . (average number of tota levents : 5 .105) .
Conclusion
A first prototype of TOF system installed in a clinical environmen thas been characterized, with special attention directed to the parameter sdemonstrating the advantages of TOF : effective sensitivity gain ,linearity at high count rates and random fraction elimination . Al lthree of those (plus the cubic volume element used) are directed toward saccurate quantitative studies . The evaluation is continued, essentiall ywith very fast dynamic studies of the brain, and of the heart gate dwith the ECG acquisition . For future generation of TOF system, th euse of small crystals (11 mm x 25 mm) of BaF2 is recommanded, givingbetter packing fraction and therefore higher sensitivity, better tomogra -phic resolution and timing resolution together with a lower price .Crystal identification could made by use of sense-wire techniques .
REFERENCES
1. Brownell, G .L ., Burnham, C .A ., Wilenski, S . et al : New development sin positron scintigraphy and the application of cyclotron-produce dpositron emitters . In : Medical Radioisotope scintigraphy, Vol . 1 ,Vienna, IAEA (1969) .
2. Dunn, W.L . : Time-of-flight localization of positron emitting isotopes .Thesis in Physics, Vanderbilt University, Nashville, TN (1975) .
3. -Budinger, T .F . : Instrumentation trends in nuclear medicine . Seminarsin Nuclear Medicine, Vol 7, N°4 : 285-297, 1977 .
4. Campagnolo, R ., Garderet, Ph ., Vacher, J . :, Tomographie par émetteur sde positrons avec mesure de temps de vol . In : C .R. du ColloqueInternational sur le Traitement du signal, Nice, France (1979) .
5. Ter Pogossian, M.M ., Mullani, N .A., Ficke, D .C . : Photon time-of-flight assisted positron emission tomography . J . Comput . Assist .Tomogr . 5 : 227-239, 1981 .
6. Allemand, R ., Gresset, C ., Vacher, .; . : Potential advantages o fa cesium fluoride scintillator for a time-of-flight positron camera .J . Nucl . Med . 21 : 153-155, 1980 .
7. Vacher, J ., Allemand, R ., Cormoresche, E . et al : Improvement o fsensitivity and spatial resolution of time-of-flight positron emissio ntomography . J . Nucl . Med . in press . (1983) .
8. Vacher R., Allemand, R ., Laval, M . et al : New development on detec -tion and fast timing on the time-of-flight LETI device . IEEE Compute rSociety Press, pp 143-146, 1982 .
9. Budinger, T .F . : Time-of-flight positron emission tomography statusrelative to conventional PET . J . Nùcl . Med . 24 : 73-78, 1983 .
IO .Soussaline, F ., Comar, Is ., Allemand, R ., Campagnolo, R . et al :New developments in PET instrumentation using the time-of-fligh tinformation . In : The metabolism of the human brain using PET .L. Widen Ed, Raven Press, in press (1983) .
Address :F . Soussaline, SHFJ, CEA Département de Biologie, 91406 Orsay, France .R . Campagnolo, LETI/MCTE, CEA, Grenoble, France .
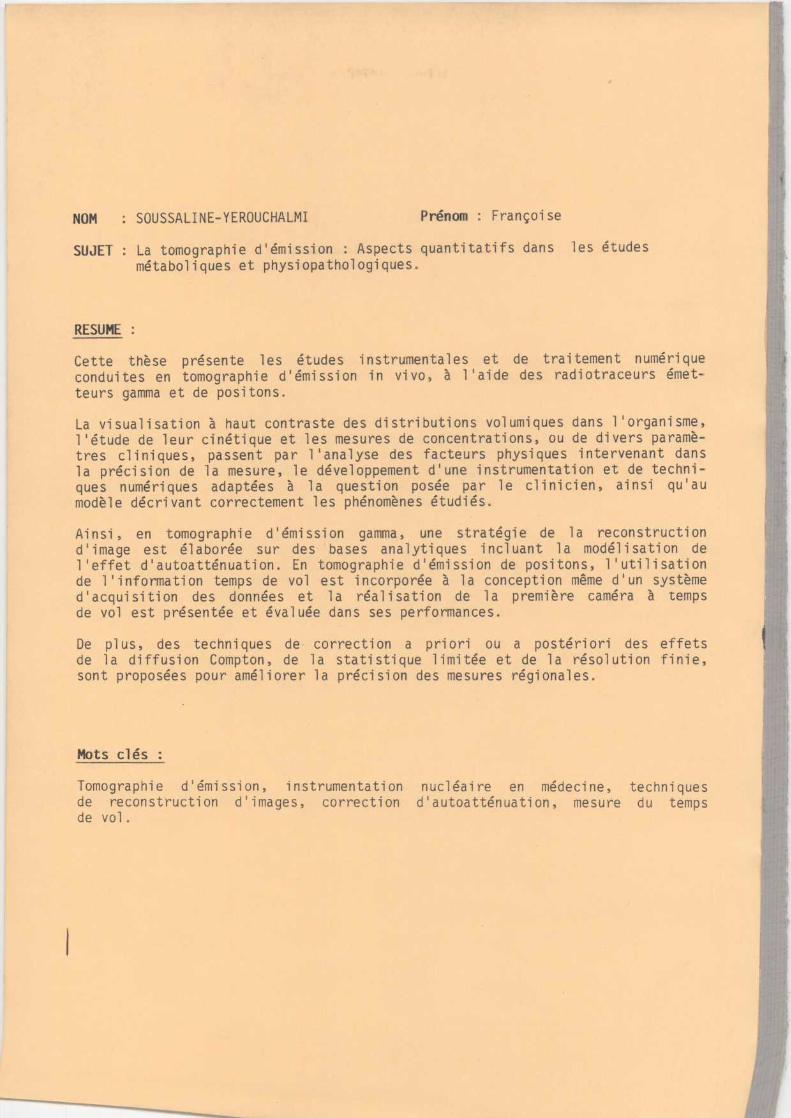
NOM
: SOUSSALINE-YEROUCHALMI
Prénom
François e
SUJET
La tomographie d'émission : Aspects quantitatifs dans les étude s
métaboliques et physiopathologiques .
RESUM E
Cette thèse présente les études instrumentales et de traitement numériqu econduites en tomographie d'émission in vivo, à l'aide des radiotraceurs émet-
teurs gamma et de positons .
La visualisation à haut contraste des distributions volumiques dans l'organisme ,l'étude de leur cinétique et les mesures de concentrations, ou de divers paramè-tres cliniques, passent par l'analyse des facteurs physiques intervenant dan sla précision de la mesure, le développement d'une instrumentation et de techni -
ques numériques adaptées à la question posée par le clinicien, ainsi qu'a umodèle décrivant correctement les phénomènes étudiés °
Ainsi, en tomographie d'émission gamma, une stratégie de la reconstructio nd'image est élaborée sur des bases analytiques incluant la modélisation d el'effet d'autoatténuation . En tomographie d'émission de positons, l'utilisationde l'information temps de vol est incorporée à la conception même d'un systèm ed'acquisition des données et la réalisation de la première caméra à temp sde vol est présentée et évaluée dans ses performances .
De plus, des techniques de correction a priori ou a postériori des effet sde la diffusion Compton, de la statistique limitée et de la résolution finie ,sont proposées pour améliorer la précision des mesures régionales .
Mots clé s
Tomographie d ' émission, instrumentation nucléaire en médecine, technique sde reconstruction d ' images, correction d ' autoatténuation, mesure du temp sde vol .